compliance with gluten free diet is associated with better
TRANSCRIPT
�����������������
Citation: Enaud, R.; Tetard, C.;
Dupuis, R.; Laharie, D.; Lamireau, T.;
Zerbib, F.; Rivière, P.; Shili-Mismoudi,
S.; Poullenot, F. Compliance with
Gluten Free Diet Is Associated with
Better Quality of Life in Celiac
Disease. Nutrients 2022, 14, 1210.
https://doi.org/10.3390/
nu14061210
Academic Editor: Luis Rodrigo
Received: 17 February 2022
Accepted: 9 March 2022
Published: 12 March 2022
Publisher’s Note: MDPI stays neutral
with regard to jurisdictional claims in
published maps and institutional affil-
iations.
Copyright: © 2022 by the authors.
Licensee MDPI, Basel, Switzerland.
This article is an open access article
distributed under the terms and
conditions of the Creative Commons
Attribution (CC BY) license (https://
creativecommons.org/licenses/by/
4.0/).
nutrients
Article
Compliance with Gluten Free Diet Is Associated with BetterQuality of Life in Celiac DiseaseRaphaël Enaud 1,† , Candice Tetard 1,2,†, Raphaël Dupuis 2, David Laharie 2, Thierry Lamireau 1 , Frank Zerbib 2,Pauline Rivière 2, Sarah Shili-Mismoudi 2 and Florian Poullenot 2,*,‡
1 CHU de Bordeaux, Hôpital des Enfants, Service d’Hépato-Gastroentérologie Pédiatriques,33000 Bordeaux, France; [email protected] (R.E.); [email protected] (C.T.);[email protected] (T.L.)
2 CHU de Bordeaux, Centre Médico-chirurgical Magellan, Hôpital Haut-Lévêque, GastroenterologyDepartment, Université de Bordeaux, INSERM CIC 1401, 33000 Bordeaux, France;[email protected] (R.D.); [email protected] (D.L.); [email protected] (F.Z.);[email protected] (P.R.); [email protected] (S.S.-M.)
* Correspondence: [email protected]† These authors contributed equally to this work.‡ Current address: Service d’Hépato-Gastroentérologie, CMC Magellan, Hôpital Haut-Lévêque, Avenue de
Magellan, 33604 Pessac, France.
Abstract: The quality of life (QOL) of patients with celiac disease (CD) can be altered by bothsymptoms of the disease and by the restrictions of the gluten-free diet (GFD). The objective wasto determine the factors associated with better QOL in a large cohort of CD patients. A link toan online survey was sent to the members of the French Association of Gluten Intolerant People(AFDIAG). The French-Celiac Disease Questionnaire (F-CDQ), scoring from 0 to 100, was used tomeasure the QOL. Other data collected were sociodemographic characteristics, information on CD,purchasing and consumption habits of gluten-free products, and a self-assessment scale (rangingfrom 0 to 10) to determine the compliance with the GFD. Among the 907 CD patients who returnedthe questionnaire, 787 were analyzed (638 women (81%); median age: 49 years; 71% with self-assessedGFD compliance > 8). Their median F-CDQ was 73 (range: 59–82). In multivariate analysis, the mainfactors associated with a better quality of life were the long duration of the GFD, good compliancewith the GFD, and the number of follow-up visits. Compliance with and duration of the GFD areassociated with a better quality of life in patients with CD. Taking this into consideration would offsetits restrictive aspect and improve its adherence.
Keywords: celiac disease; gluten free diet; compliance; quality of life
1. Introduction
Celiac disease (CD) is an immune-mediated systemic disorder with chronic inflamma-tion of the small intestinal mucosa due to the ingestion of gluten proteins in geneticallypredisposed patients. CD prevalence is approximately 1% in the United States and inEurope [1,2]. The diagnosis is usually suspected in the presence of intestinal and extra-intestinal symptoms, such as abdominal pain, diarrhea or constipation, chronic fatigue,anemia, joint pain, skin rash, or headache [2]. To reduce the symptoms and complications,the only current treatment available for CD is a strict long-life gluten-free diet (GFD),which is restrictive, socially limiting, and costly [3,4]. Quality of life (QOL) is determinedby the interaction of physical wellbeing, mental state, degree of family and social support,effects of treatment, and the presence of disease complications [5]. In recent years, QOL hasbecome one of the main objectives to be considered in the management of patients [6,7].Previous studies showed that CD itself, as well as a GFD, could significantly alter thequality of life of these patients [8–11]. However, the determinants of altered QOL in CD
Nutrients 2022, 14, 1210. https://doi.org/10.3390/nu14061210 https://www.mdpi.com/journal/nutrients

Nutrients 2022, 14, 1210 2 of 10
patients remain largely unknown and may be influenced by cultural factors [12]. The mainobjective in the present study was to determine the disease and clinical factors associatedwith better QOL in a large cohort of French CD patients.
2. Materials and Methods2.1. Study Design and Patients
This was a cross-sectional survey conducted from January to March 2016 in CD pa-tients aged 15 years or older who self-reported having an established diagnosis of CD(serologically and/or histologically). Information about the study and an online ques-tionnaire link were sent to the French Association of Gluten Intolerant People (AFDIAG)members via email to reach the largest number of patients. The online questionnaireincluded demographic and clinical data, the French version of the “Celiac Disease Ques-tionnaire” (F-CDQ) [13,14], and information on gluten-free purchasing and consumptionhabits. In this context, according to the current legislation in France, the approval of anethics committee was not required.
2.2. Questionnaires
The demographic data recorded were gender, age, lifestyle (urban or rural), andsocio-professional category. The clinical data collected were age at diagnosis, mode ofdiagnosis, family history of CD, time since diagnosis, and modalities of medical follow-up. GFD compliance over the past 6 months was self-assessed by the patients using avisual analog scale ranging from 0 to 10. Patients’ QOL was assessed using the F-CDQ,a specific validated instrument measuring the health-related QOL of CD patients thatincludes 28 items and explores 4 health dimensions (each with 7 items): “Emotions”,“Social”, “Worries”, and “Gastrointestinal Symptoms” [13,14]. The time frame addressedby the questionnaire was the previous two weeks. The answers were provided on ordinal7-point Likert scales assessing frequency or severity, depending on the item. A score wascalculated for each dimension as the sum of the corresponding items ranging from 7 (theworst score) to 49 (the best score) for each subscale, and a global F-CDQ score as the sum ofthe four subscales. To facilitate interpretation, the four dimensions and the global F-CDQscores were normalized to 0 (the worst score)–100 (the best score) range [13,14]. Finally,we added questions focusing on the purchasing and consumption habits of gluten-freeproducts. Only patients with a (declarative) confirmed diagnosis were included (serologyand/or biopsy).
2.3. Analysis
Quantitative variables were described using mean and standard deviation (SD) ormedian and interquartile range (IQR), and categorical variables using frequencies andproportions. In bivariate comparisons, we compared the F-CDQ scores in the categories ofcategorical variables using the Student’s t-test and one-way analysis of variance (ANOVA)or non-parametric tests (Mann–Whitney and Kruskal–Wallis tests). Correlations betweenthe F-CDQ scores and quantitative variables were assessed by Pearson or Spearman cor-relation coefficient. To identify the factors associated with QOL, a regression model wasperformed. All of the candidate covariates were included in a Least Absolute Shrinkageand Selection Operation (LASSO) penalized regression model, reputed as a very sen-sitive machine learning method for increasing the quality of predictions by shrinkingregression coefficients [15]. Statistical analysis was performed using the R studio program(version 1.1.463 for WindowsTM; Boston, MA 02210, USA). A p-value < 0.05 was consideredindicative of statistical significance. Figures were done using Prism software® (version 5.1;Greenwood Village CO, 80111, USA).
Nutrients 2022, 14, 1210 3 of 10
3. Results3.1. Patient Characteristics and QOL
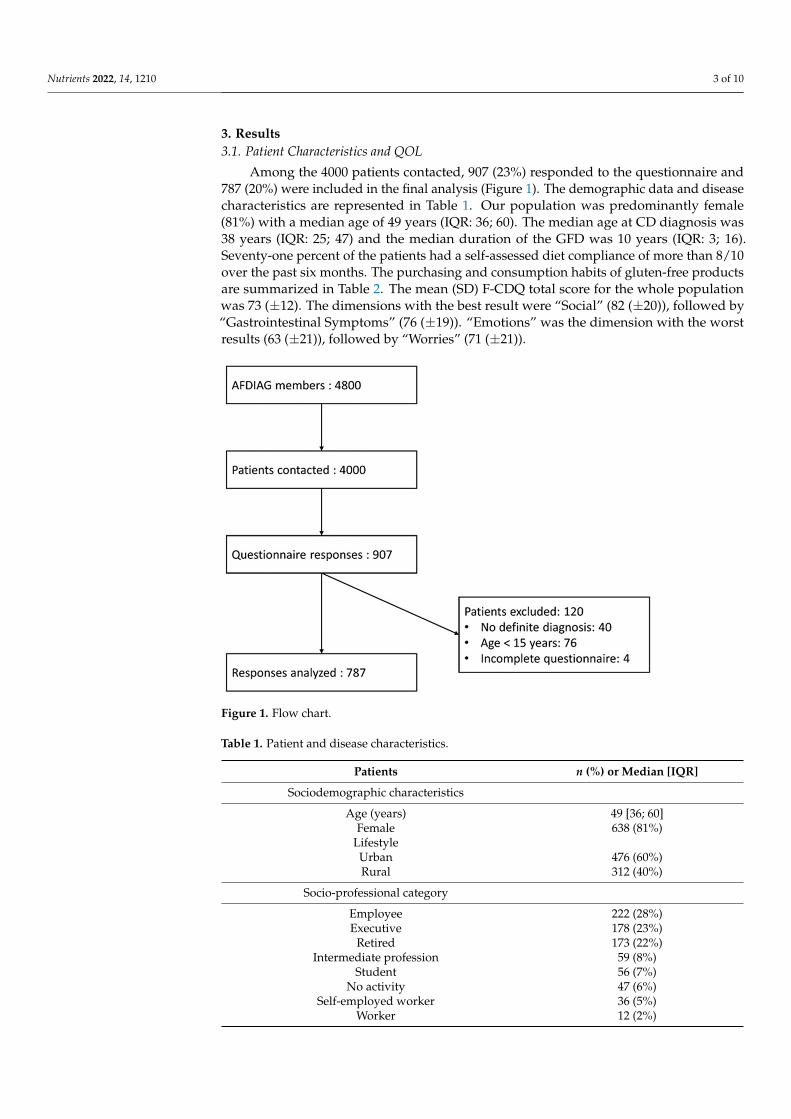
Among the 4000 patients contacted, 907 (23%) responded to the questionnaire and787 (20%) were included in the final analysis (Figure 1). The demographic data and diseasecharacteristics are represented in Table 1. Our population was predominantly female(81%) with a median age of 49 years (IQR: 36; 60). The median age at CD diagnosis was38 years (IQR: 25; 47) and the median duration of the GFD was 10 years (IQR: 3; 16).Seventy-one percent of the patients had a self-assessed diet compliance of more than 8/10over the past six months. The purchasing and consumption habits of gluten-free productsare summarized in Table 2. The mean (SD) F-CDQ total score for the whole populationwas 73 (±12). The dimensions with the best result were “Social” (82 (±20)), followed by“Gastrointestinal Symptoms” (76 (±19)). “Emotions” was the dimension with the worstresults (63 (±21)), followed by “Worries” (71 (±21)).
Nutrients 2022, 14, x FOR PEER REVIEW 3 of 11
Among the 4000 patients contacted, 907 (23%) responded to the questionnaire and 787 (20%) were included in the final analysis (Figure 1). The demographic data and disease characteristics are represented in Table 1. Our population was predominantly female (81%) with a median age of 49 years (IQR: 36; 60). The median age at CD diagnosis was 38 years (IQR: 25; 47) and the median duration of the GFD was 10 years (IQR: 3; 16). Seventy-one percent of the patients had a self-assessed diet compliance of more than 8/10 over the past six months. The purchasing and consumption habits of gluten-free products are sum-marized in Table 2. The mean (SD) F-CDQ total score for the whole population was 73 (±12). The dimensions with the best result were “Social” (82 (±20)), followed by “Gastro-intestinal Symptoms” (76 (±19)). “Emotions” was the dimension with the worst results (63 (±21)), followed by “Worries” (71 (±21)).
Figure 1. Flow chart.
Table 1. Patient and disease characteristics.
Patients n (%) or Median [IQR] Sociodemographic characteristics
Age (years) 49 [36; 60] Female 638 (81%)
Lifestyle Urban 476 (60%)
Rural 312 (40%) Socio-professional category
Employee 222 (28%) Executive 178 (23%)
Retired 173 (22%) Intermediate profession 59 (8%)
Student 56 (7%)
Figure 1. Flow chart.
Table 1. Patient and disease characteristics.
Patients n (%) or Median [IQR]
Sociodemographic characteristics
Age (years) 49 [36; 60]Female 638 (81%)
LifestyleUrban 476 (60%)Rural 312 (40%)
Socio-professional category
Employee 222 (28%)Executive 178 (23%)
Retired 173 (22%)Intermediate profession 59 (8%)
Student 56 (7%)No activity 47 (6%)
Self-employed worker 36 (5%)Worker 12 (2%)
Nutrients 2022, 14, 1210 4 of 10
Table 1. Cont.
Patients n (%) or Median [IQR]
Farmer 4 (1%)
Characteristics related to celiac disease
Age at diagnosis (years) 38 [25; 47]Mode of diagnosis
Biopsies 236 (30%)Antibodies 34 (4%)
Both 517 (66%)Family history of celiac disease 127 (16%)
Frequency of follow-up>1 visit per year 164 (21%)1 visit per year 333 (42%)
<1 visit per year 217 (28%)Never 73 (9%)
Duration of the gluten-free diet (years) 10 [3; 16]
Gluten-free diet compliance in the past 6 months
VAS ≤ 5/10 37 (5%)6 ≤ VAS ≤ 8/10 194 (25%)
VAS ≥ 9/10 556 (71%)VAS: visual analog scale. IQR: interquartile range.
Table 2. Purchasing and consumption habits of gluten-free products.
n (%)
Purchase of specifically labeled gluten-free products 716 (91%)Purchase of gluten-free products on the internet 229 (29%)
Purchase of gluten-free products in organic stores 584 (74%)Purchase of gluten-free products at the supermarket 632 (80%)
Gluten-free substitutes likedYes 330 (42%)
Moderately 419 (53%)No 38 (5%)
Use of restaurants/bakeries that offer only gluten-free products 200 (25%)Trust in restaurants offering gluten-free and gluten-containing products 478 (61%)
Trust in bakeries offering gluten-free and gluten-containing products 140 (18%)
3.2. Correlation between Patient and Disease Characteristics and Total F-CDQ Score
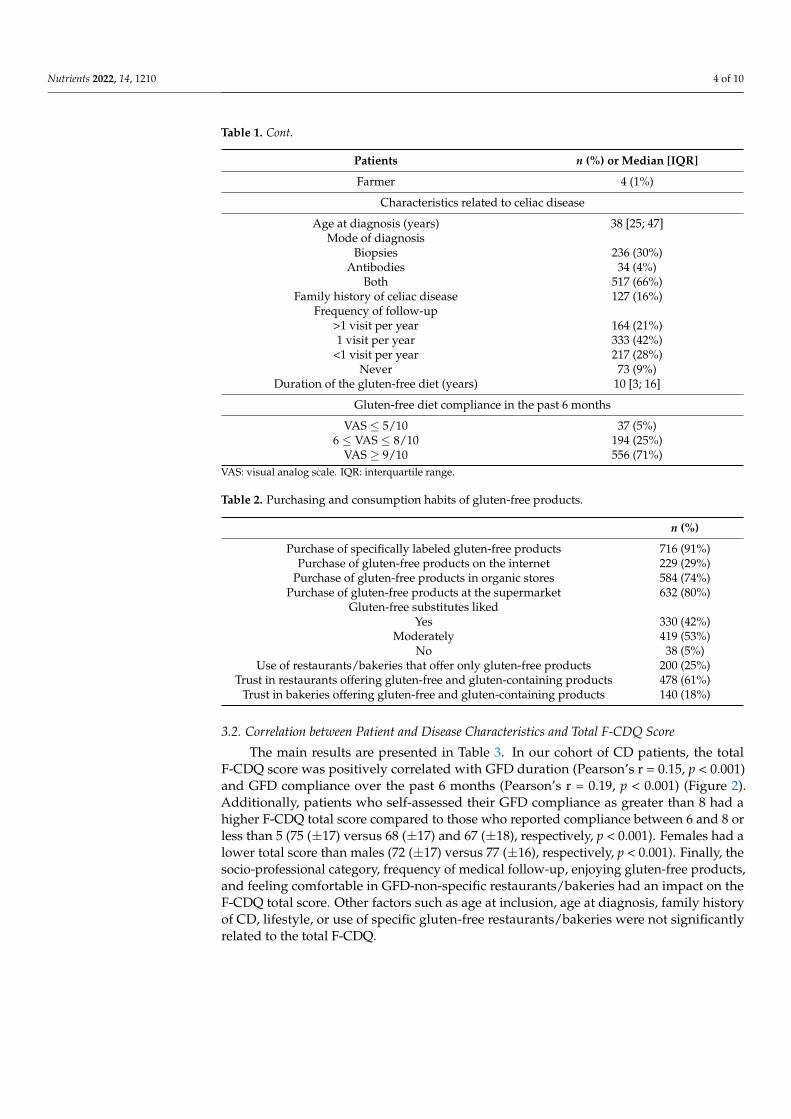
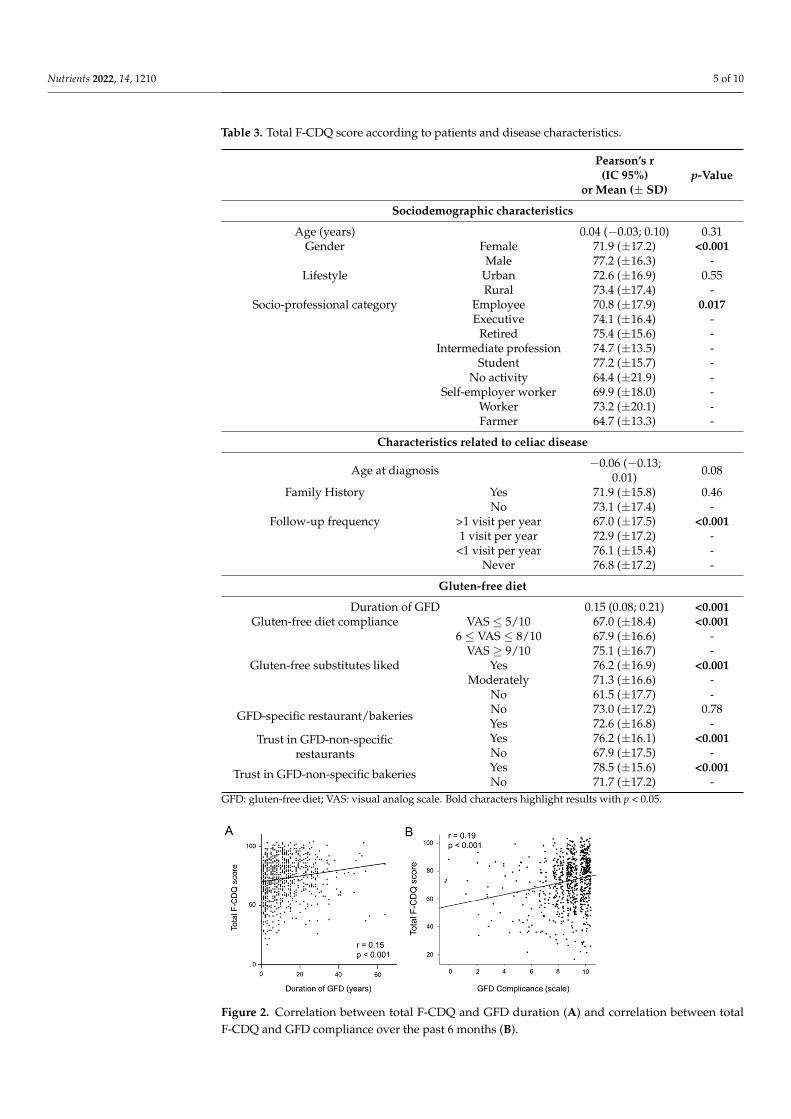
The main results are presented in Table 3. In our cohort of CD patients, the totalF-CDQ score was positively correlated with GFD duration (Pearson’s r = 0.15, p < 0.001)and GFD compliance over the past 6 months (Pearson’s r = 0.19, p < 0.001) (Figure 2).Additionally, patients who self-assessed their GFD compliance as greater than 8 had ahigher F-CDQ total score compared to those who reported compliance between 6 and 8 orless than 5 (75 (±17) versus 68 (±17) and 67 (±18), respectively, p < 0.001). Females had alower total score than males (72 (±17) versus 77 (±16), respectively, p < 0.001). Finally, thesocio-professional category, frequency of medical follow-up, enjoying gluten-free products,and feeling comfortable in GFD-non-specific restaurants/bakeries had an impact on theF-CDQ total score. Other factors such as age at inclusion, age at diagnosis, family historyof CD, lifestyle, or use of specific gluten-free restaurants/bakeries were not significantlyrelated to the total F-CDQ.
Nutrients 2022, 14, 1210 5 of 10
Table 3. Total F-CDQ score according to patients and disease characteristics.
Pearson’s r(IC 95%)
or Mean (± SD)p-Value
Sociodemographic characteristics
Age (years) 0.04 (−0.03; 0.10) 0.31Gender Female 71.9 (±17.2) <0.001
Male 77.2 (±16.3) -Lifestyle Urban 72.6 (±16.9) 0.55
Rural 73.4 (±17.4) -Socio-professional category Employee 70.8 (±17.9) 0.017
Executive 74.1 (±16.4) -Retired 75.4 (±15.6) -
Intermediate profession 74.7 (±13.5) -Student 77.2 (±15.7) -
No activity 64.4 (±21.9) -Self-employer worker 69.9 (±18.0) -
Worker 73.2 (±20.1) -Farmer 64.7 (±13.3) -
Characteristics related to celiac disease
Age at diagnosis −0.06 (−0.13;0.01) 0.08
Family History Yes 71.9 (±15.8) 0.46No 73.1 (±17.4) -
Follow-up frequency >1 visit per year 67.0 (±17.5) <0.0011 visit per year 72.9 (±17.2) -
<1 visit per year 76.1 (±15.4) -Never 76.8 (±17.2) -
Gluten-free diet
Duration of GFD 0.15 (0.08; 0.21) <0.001Gluten-free diet compliance VAS ≤ 5/10 67.0 (±18.4) <0.001
6 ≤ VAS ≤ 8/10 67.9 (±16.6) -VAS ≥ 9/10 75.1 (±16.7) -
Gluten-free substitutes liked Yes 76.2 (±16.9) <0.001Moderately 71.3 (±16.6) -
No 61.5 (±17.7) -
GFD-specific restaurant/bakeries No 73.0 (±17.2) 0.78Yes 72.6 (±16.8) -
Trust in GFD-non-specificrestaurants
Yes 76.2 (±16.1) <0.001No 67.9 (±17.5) -
Trust in GFD-non-specific bakeries Yes 78.5 (±15.6) <0.001No 71.7 (±17.2) -
GFD: gluten-free diet; VAS: visual analog scale. Bold characters highlight results with p < 0.05.
Nutrients 2022, 14, x FOR PEER REVIEW 5 of 11
Figure 2. Correlation between total F-CDQ and GFD duration (A) and correlation between total F-CDQ and GFD compliance over the past 6 months (B).
Table 3. Total F-CDQ score according to patients and disease characteristics.
Pearson’s r (IC 95%)
or Mean (± SD) p-Value
Sociodemographic characteristics Age (years) 0.04 (−0.03; 0.10) 0.31
Gender Female 71.9 (±17.2) <0.001 Male 77.2 (±16.3) -
Lifestyle Urban 72.6 (±16.9) 0.55 Rural 73.4 (±17.4) -
Socio-professional category Employee 70.8 (±17.9) 0.017 Executive 74.1 (±16.4) - Retired 75.4 (±15.6) - Intermediate profession 74.7 (±13.5) - Student 77.2 (±15.7) - No activity 64.4 (±21.9) - Self-employer worker 69.9 (±18.0) - Worker 73.2 (±20.1) - Farmer 64.7 (±13.3) -
Characteristics related to celiac disease Age at diagnosis −0.06 (−0.13; 0.01) 0.08
Family History Yes 71.9 (±15.8) 0.46 No 73.1 (±17.4) -
Follow-up frequency >1 visit per year 67.0 (±17.5) <0.001 1 visit per year 72.9 (±17.2) - <1 visit per year 76.1 (±15.4) - Never 76.8 (±17.2) -
Gluten-free diet Duration of GFD 0.15 (0.08; 0.21) <0.001
Gluten-free diet compliance VAS ≤ 5/10 67.0 (±18.4) <0.001 6 ≤ VAS ≤ 8/10 67.9 (±16.6) - VAS ≥ 9/10 75.1 (±16.7) -
Gluten-free substitutes liked Yes 76.2 (±16.9) <0.001 Moderately 71.3 (±16.6) - No 61.5 (±17.7) -
GFD-specific restaurant/bakeries No 73.0 (±17.2) 0.78 Yes 72.6 (±16.8) -
Figure 2. Correlation between total F-CDQ and GFD duration (A) and correlation between totalF-CDQ and GFD compliance over the past 6 months (B).

Nutrients 2022, 14, 1210 6 of 10
3.3. Correlation between Patient or Disease Characteristics and Subdomains of F-CDQ Score
The F-CDQ score covers four subdomains that could impact the QOL of patients withCD: “Gastrointestinal Symptoms”, “Worries”, “Emotions”, and “Social”. Table 4 summa-rizes the significant associations between the subdomains of the F-CDQ score and patient ordisease characteristics. Age was negatively correlated to the “Gastrointestinal Symptoms”subdomain and positively correlated to the “Social” and “Worries” subdomains, but notwith “Emotions”. Females had significantly lower “Gastrointestinal Symptoms”, “Emo-tions”, and “Worries” subdomains scores. Scores in all four subdomains were positivelycorrelated to the GFD compliance, were better in patients enjoying gluten-free productsand feeling comfortable in GFD-non-specific restaurants/bakeries, and were related tosocio-professional category and the frequency of follow-up visits. Age at diagnosis wasnegatively correlated to the “Gastrointestinal Symptoms” subdomain scores, whereasGFD duration was positively correlated to the “Social” and “Worries” subdomain scores(Table 4).
Table 4. Significant correlations between subdomains of the F-CDQ score and patients ordisease characteristics.
GastrointestinalSymptoms
p-Value Social p-
Value Emotions p-Value Worries p-
Value
Age (years) −0.09 (−0.16;−0.02) <0.01 0.11 (0.04; 0.18) <0.01 0.02 (−0.05;
0.09) 0.57 0.07 (0.004;0.14) 0.037
Gender Female 75.2 (±19.7) 0.016 81.2 (±20.4) 0.069 61.3 (±21.3) <0.001 69.9 (±21.4) 0.021Male 79.3 (±18.2) - 84.5 (±20.1) - 70.6 (±20.5) - 74.3 (±20.2) -
Socio-professionalcategory Employee 74.1 (±20.2) <0.01 79.6 (±21.4) <0.01 60.8 (±22.0) 0.019 68.9 (±20.7) <0.01
Executive 79.1 (±19.1) - 82.0 (±20.1) - 64.1 (±20.8) - 71.1 (±21.2) -Retired 73.6 (±19.1) - 87.6 (±15.9) - 66.6 (±21.0) - 73.9 (±20.9) -
Intermediateprofession 82.0 (±15.9) - 81.7 (±18.3) - 62.0 (±20.2) - 73.1 (±16.4) -
Student 79.6 (±18.4) - 85.1 (±17.1) - 68.1 (±19.6) - 76.0 (±19.4) -No activity 69.5 (±22.6) - 71.4 (±26.7) - 54.4 (±24.1) - 62.3 (±25.4) -
Self-employerworker 74.7 (±17.5) - 78.7 (±23.1) - 61.3 (±19.2) - 65.0 (±25.2) -
Worker 80.6 (±17.6) - 76.9 (±27.7) - 59.4 (±26.5) - 75.8 (±21.3) -Farmer 83.1 (±22.1) - 66.9 (±17.1) - 56.2 (±17.9) - 52.5 (±12.4) -
Age at diagnosis −0.09 (−0.16;−0.02) 0.01 −0.02 (−0.09;
0.04) 0.48 −0.04(−0.11;0.03) 0.3 −0.06 (−0.13;
0.01) 0.10
Follow-up frequency >1 visit per year 70.6 (±21.8) <0.001 75.9 (±21.3) <0.001 56.7 (±20.9) <0.001 64.9 (±21.0) <0.0011 visit per year 76.2 (±19.0) - 81.6 (±20.7) - 63.4 (±22.2) - 70.3 (±20.7) -
<1 visit per year 78.5 (±18.0) - 85.3 (±17.8) - 66.3 (±19.8) - 74.2 (±20.9) -Never 79.8 (±17.8) - 86.0 (±21.2) - 66.0 (±21.4) - 75.7 (±22.4) -
Duration of GFD −0.003 (−0.07;0.07) 0.91 0.20 (0.14; 0.27) <0.001 0.09 (0.02; 0.16) 0.15 0.57 (0.52; 0.61) <0.001
GFD compliance (+0.1) 0.18 (0.11; 0.25) <0.001 0.11 (0.04; 0.18) <0.001 0.21 (0.14; 0.28) <0.001 0.13 (0.06; 0.20) <0.001Gluten-free substitutes
liked Yes 78.0 (±19.8) <0.01 85.4 (±19.4) <0.001 66.3 (±21.4) <0.001 75.3 (±20.6) <0.001
Moderately 75.3 (±18.8) - 80.2 (±20.0) - 61.3 (±20.8) - 68.5 (±20.7) -No 67.2 (±21.9) - 68.4 (±24.8) - 53.8 (±23.7) - 56.6 (±22.4) -
Trust in GFD-non-specificrestaurants
Yes 78.1 (±18.7) <0.001 85.9 (±18.8) <0.001 66.1 (±20.8) <0.001 74.5 (±19.7) <0.001No 72.7 (±20.2) - 75.5 (±21.1) - 58.3 (±21.5) - 65.0 (±22.2) -
Trust in GFD-non-specificbakeries
Yes 80.0 (±19.2) <0.001 89.3 (±16.8) <0.001 68.2 (±20.2) <0.001 76.6 (±19.4) <0.001No 75.1 (±19.5) - 80.2 (±20.7) - 61.9 (±21.6) - 69.5 (±21.4) -
Data are presented as Pearson’s r (IC 95%) or Mean (± SD). GFD: gluten-free diet. Bold characters highlightresults with p < 0.05.
Other factors such as family history of CD, lifestyle, or frequentation of GFD-specificrestaurants/bakeries were not significantly related to the F-CDQ subdomains scores.
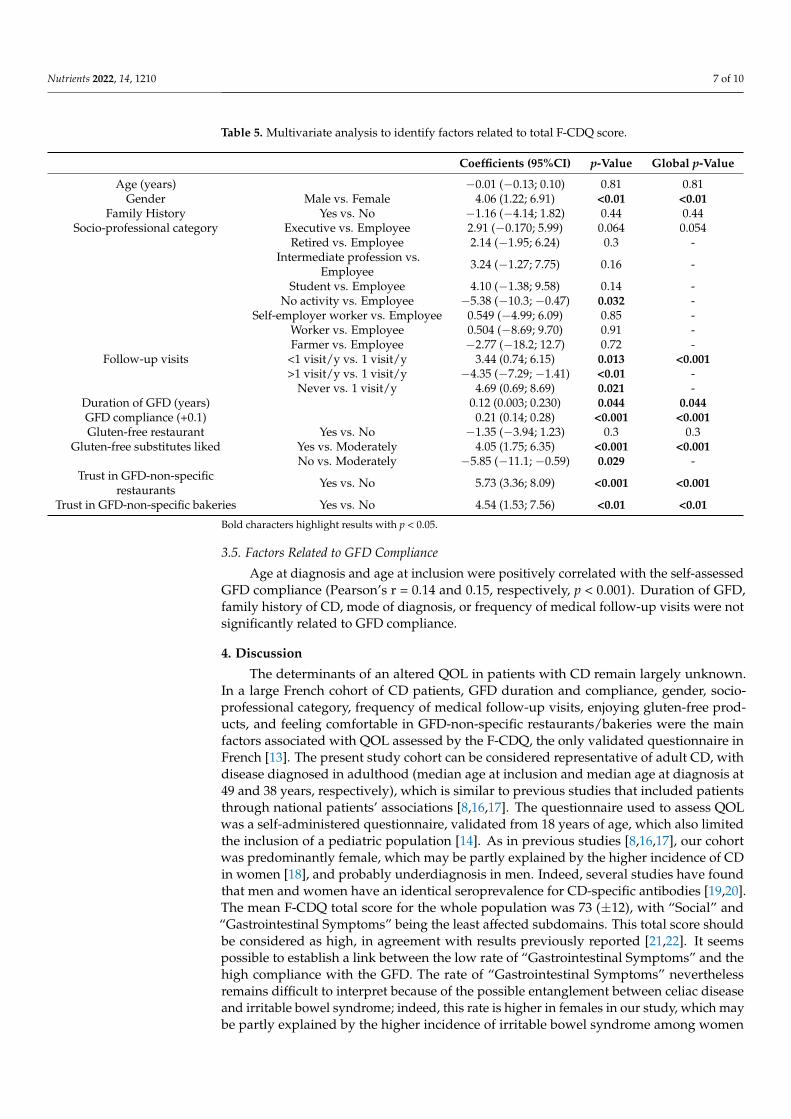
3.4. Multivariate Analysis of Factors Associated with QOL of CD Patients
In the multivariate linear regression analysis, a long duration and high compliancewith a GFD, male gender, and an infrequent (or absent) medical follow-up are associatedwith better F-CDQ scores. Socio-professional category and enjoying gluten-free prod-ucts, as with feeling comfortable in GFD-non-specific restaurants/bakeries, also remainedsignificantly associated with the total F-CDQ score (Table 5).
Nutrients 2022, 14, 1210 7 of 10
Table 5. Multivariate analysis to identify factors related to total F-CDQ score.
Coefficients (95%CI) p-Value Global p-Value
Age (years) −0.01 (−0.13; 0.10) 0.81 0.81Gender Male vs. Female 4.06 (1.22; 6.91) <0.01 <0.01
Family History Yes vs. No −1.16 (−4.14; 1.82) 0.44 0.44Socio-professional category Executive vs. Employee 2.91 (−0.170; 5.99) 0.064 0.054
Retired vs. Employee 2.14 (−1.95; 6.24) 0.3 -Intermediate profession vs.
Employee 3.24 (−1.27; 7.75) 0.16 -
Student vs. Employee 4.10 (−1.38; 9.58) 0.14 -No activity vs. Employee −5.38 (−10.3; −0.47) 0.032 -
Self-employer worker vs. Employee 0.549 (−4.99; 6.09) 0.85 -Worker vs. Employee 0.504 (−8.69; 9.70) 0.91 -Farmer vs. Employee −2.77 (−18.2; 12.7) 0.72 -
Follow-up visits <1 visit/y vs. 1 visit/y 3.44 (0.74; 6.15) 0.013 <0.001>1 visit/y vs. 1 visit/y −4.35 (−7.29; −1.41) <0.01 -
Never vs. 1 visit/y 4.69 (0.69; 8.69) 0.021 -Duration of GFD (years) 0.12 (0.003; 0.230) 0.044 0.044GFD compliance (+0.1) 0.21 (0.14; 0.28) <0.001 <0.001Gluten-free restaurant Yes vs. No −1.35 (−3.94; 1.23) 0.3 0.3
Gluten-free substitutes liked Yes vs. Moderately 4.05 (1.75; 6.35) <0.001 <0.001No vs. Moderately −5.85 (−11.1; −0.59) 0.029 -
Trust in GFD-non-specificrestaurants Yes vs. No 5.73 (3.36; 8.09) <0.001 <0.001
Trust in GFD-non-specific bakeries Yes vs. No 4.54 (1.53; 7.56) <0.01 <0.01
Bold characters highlight results with p < 0.05.
3.5. Factors Related to GFD Compliance
Age at diagnosis and age at inclusion were positively correlated with the self-assessedGFD compliance (Pearson’s r = 0.14 and 0.15, respectively, p < 0.001). Duration of GFD,family history of CD, mode of diagnosis, or frequency of medical follow-up visits were notsignificantly related to GFD compliance.
4. Discussion
The determinants of an altered QOL in patients with CD remain largely unknown.In a large French cohort of CD patients, GFD duration and compliance, gender, socio-professional category, frequency of medical follow-up visits, enjoying gluten-free prod-ucts, and feeling comfortable in GFD-non-specific restaurants/bakeries were the mainfactors associated with QOL assessed by the F-CDQ, the only validated questionnaire inFrench [13]. The present study cohort can be considered representative of adult CD, withdisease diagnosed in adulthood (median age at inclusion and median age at diagnosis at49 and 38 years, respectively), which is similar to previous studies that included patientsthrough national patients’ associations [8,16,17]. The questionnaire used to assess QOLwas a self-administered questionnaire, validated from 18 years of age, which also limitedthe inclusion of a pediatric population [14]. As in previous studies [8,16,17], our cohortwas predominantly female, which may be partly explained by the higher incidence of CDin women [18], and probably underdiagnosis in men. Indeed, several studies have foundthat men and women have an identical seroprevalence for CD-specific antibodies [19,20].The mean F-CDQ total score for the whole population was 73 (±12), with “Social” and“Gastrointestinal Symptoms” being the least affected subdomains. This total score shouldbe considered as high, in agreement with results previously reported [21,22]. It seemspossible to establish a link between the low rate of “Gastrointestinal Symptoms” and thehigh compliance with the GFD. The rate of “Gastrointestinal Symptoms” neverthelessremains difficult to interpret because of the possible entanglement between celiac diseaseand irritable bowel syndrome; indeed, this rate is higher in females in our study, which maybe partly explained by the higher incidence of irritable bowel syndrome among women
Nutrients 2022, 14, 1210 8 of 10
in the general population [23]. Of note, the impact on social life was low, while the dietis—by definition—associated with social constraints; to be used to the GFD associatedwith an absence of symptoms might explain this low reported social impact in our co-hort. The most-affected QOL subdomains in our cohort were “Emotions” and “Worries”.Psychological disturbances can be associated with CD and impact on QOL [24,25]. Theiridentification and management therefore remain essential, and this study further confirmsthe importance of maintaining vigilance for emotional concerns in CD patients.
In line with the present data obtained in a large French cohort, almost all studiesshow a positive effect of the GFD on the QOL of CD patients [8,26–32]. Scandinavianstudies have shown that the QOL of CD patients strictly adherent to the GFD for 10 yearswith histological and serological remission is similar to the general population [9,28]. Inaddition, patients with suboptimal GFDs who persist in consuming gluten are at increasedrisk of developing autoimmune, neurological, or allergic disorders, which may also impacton QOL [33–36]. We found a significant improvement in QOL per additional year ofdiet, before and after adjustment. Patients probably grew accustomed to managing thisrestrictive diet over time. Not only the duration of, but compliance with the GFD is crucial,since it was significantly associated with an improvement in the F-CDQ total score and inthe four QOL subdomains, consistent with other studies [8,17,32]. Interestingly, we foundthat compliance with the GFD was associated with age at inclusion and age at diagnosis, butnot with duration of GFD, family history of CD, mode of diagnosis, or frequency of follow-up visits, as could be expected. Diet compliance is an independent factor improving CDpatients’ QOL, and finding the tools to facilitate this adherence remains a challenge. Severalstudies suggest that educational interventions can improve the management of CD andperceived QOL [21,26]. As far as demographic factors are concerned, women had a lowerQOL than men, consistent with previous studies [21,28,37,38]. However, studies in thegeneral population of Western countries have reported a lower QOL in women than in men,so this difference may not be related to the impact of CD on QOL [9]. The socio-professionalcategory also seems to impact the QOL, in agreement with previous studies [39]. It wassuggested in a previous study that an affluent background and a university educationpromote greater GFD adherence [39]. We can assume that socio-professional category mayalso influence access to GF products.
Interestingly, we observed that trust in GFD-non-specific restaurants/bakeries posi-tively influences QOL. This can be conditioned by local policies, such as the presence ofallergens on menus or the training of restaurant professionals, but also by the fact thatthe absence of “mistrust” is generally associated with a better QOL. Of note, patients whotrust in GFD-non-specific restaurants and/or bakeries, theoretically at greater risk of glutencontamination, had a higher “Gastrointestinal Symptoms” subdomain score.
The main bias of our study is a selection bias. We proposed the questionnaire topatients who were part of the AFDIAG association to obtain a large cohort of patients, butwe cannot affirm the representativeness of our cohort. For example, there were very fewpatients with a diagnosis in early childhood. Moreover, the self-assessment of the GFDcompliance can be considered subjective. To verify compliance in our population, it wouldhave been necessary to carry out a dietary survey or a verification of the negativity of theserological tests, which was not possible in an observational study. However, as alreadymentioned, despite these biases, our results in this French cohort were consistent withmany results from previous studies in other patient populations.
5. Conclusions
This large French cohort showed that the duration of and compliance with a GFDare major factors influencing the QOL of patients with CD. Taking this into considerationwould offset its restrictive aspect and improve its adherence, and could improve themanagement of CD. As the frequency of follow-up visits is not associated with bettercompliance, educational interventions could be proposed as a tool to improve adherence tothe diet; however, improved training of general practitioners, specialists, and dieticians
Nutrients 2022, 14, 1210 9 of 10
could also help to increase the adherence to the GFD and, thus, improve the QOL of patientswith CD.
Author Contributions: R.D. was involved in designing the study, data acquisition, and analysis.S.S.-M. was involved in statistical analysis. C.T. and R.E. were involved in statistical analysis anddrafting the manuscript. D.L., F.Z., P.R. and T.L. helped in study coordination. F.P. was involved indesigning the study, data handling, critical revision of the manuscript, and study supervision. Allauthors have read and agreed to the published version of the manuscript.
Funding: This research received no external funding.
Informed Consent Statement: Informed consent was obtained from all subjects involved in the study.
Data Availability Statement: Data supporting reported results can be found at CHU de Bordeaux,Centre Médico-chirurgical Magellan, Hôpital Haut-Lévêque, Gastroenterology Department, Univer-sité de Bordeaux, INSERM CIC 1401, 33000 Bordeaux, France.
Acknowledgments: The authors would like to thank AFDIAG (French Association of Gluten Intoler-ant People) for helping us recruit patients for this study.
Conflicts of Interest: The authors declare no conflict of interest.
References1. James, S.P. National Institutes of Health Consensus Development Conference Statement on Celiac Disease, June 28–30, 2004.
Gastroenterology 2005, 128, S1–S9. [CrossRef] [PubMed]2. Lebwohl, B.; Rubio-Tapia, A. Epidemiology, Presentation, and Diagnosis of Celiac Disease. Gastroenterology 2021, 160, 63–75.
[CrossRef] [PubMed]3. Aziz, I.; Evans, K.E.; Papageorgiou, V.; Sanders, D.S. Are patients with coeliac disease seeking alternative therapies to a gluten-free
diet? J. Gastrointest. Liver Dis. 2011, 20, 27–31. [CrossRef]4. Shah, S.; Akbari, M.; Vanga, R.; Kelly, C.P.; Hansen, J.; Theethira, T.; Tariq, S.; Dennis, M.; Leffler, D.A. Patient perception of
treatment burden is high in celiac disease compared with other common conditions. Am. J. Gastroenterol. 2014, 109, 1304–1311.[CrossRef] [PubMed]
5. Felce, D.; Perry, J. Quality of life: Its definition and measurement. Res. Dev. Disabil. 1995, 16, 51–74. [CrossRef]6. Eisen, G.M.; Locke, G.R.; Provenzale, D. Health-related quality of life: A primer for gastroenterologists. Am. J. Gastroenterol. 1999,
94, 2017–2021. [CrossRef]7. Al-Toma, A.; Volta, U.; Auricchio, R.; Castillejo, G.; Sanders, D.S.; Cellier, C.; Mulder, C.J.; Lundin, K.E. European Society for the
Study of Coeliac Disease (ESsCD) guideline for coeliac disease and other gluten-related disorders. United Eur. Gastroenterol. J.2019, 7, 583–613. [CrossRef] [PubMed]
8. Häuser, W.; Gold, J.; Stein, J.; Caspary, W.F.; Stallmach, A. Health-related quality of life in adult coeliac disease in Germany:Results of a national survey. Eur. J. Gastroenterol. Hepatol. 2006, 18, 747–754. [CrossRef] [PubMed]
9. Häuser, W.; Stallmach, A.; Caspary, W.F.; Stein, J. Predictors of reduced health-related quality of life in adults with coeliac disease.Aliment. Pharmacol. Ther. 2007, 25, 569–578. [CrossRef]
10. Van de Water, J.M.W.; Mulder, C.J.J. Celiac disease: Assessment of quality of life. Nat. Rev. Gastroenterol. Hepatol. 2009, 6, 204–205.[CrossRef] [PubMed]
11. Kurppa, K.; Collin, P.; Mäki, M.; Kaukinen, K. Celiac disease and health-related quality of life. Expert Rev. Gastroenterol. Hepatol.2011, 5, 83–90. [CrossRef] [PubMed]
12. Jenaro, C.; Verdugo, M.A.; Caballo, C.; Balboni, G.; Lachapelle, Y.; Otrebski, W.; Schalock, R.L. Cross-cultural study of person-centred quality of life domains and indicators: A replication. J. Intellect. Disabil. Res. 2005, 49, 734–739. [CrossRef] [PubMed]
13. Pouchot, J.; Despujol, C.; Malamut, G.; Ecosse, E.; Coste, J.; Cellier, C. Validation of a French Version of the Quality of Life “CeliacDisease Questionnaire”. PLoS ONE 2014, 9, e96346. [CrossRef] [PubMed]
14. Häuser, W.; Gold, J.; Stallmach, A.; Caspary, W.F.; Stein, J. Development and validation of the Celiac Disease Questionnaire(CDQ), a disease-specific health-related quality of life measure for adult patients with celiac disease. J. Clin. Gastroenterol. 2007,41, 157–166. [CrossRef] [PubMed]
15. Tibshirani, R. Regression Shrinkage and Selection via the Lasso. J. R. Stat. Soc. Ser. B (Methodol.) 1996, 58, 267–288. [CrossRef]16. Violato, M.; Gray, A. The impact of diagnosis on health-related quality of life in people with coeliac disease: A UK population-
based longitudinal perspective. BMC Gastroenterol. 2019, 19, 68. [CrossRef] [PubMed]17. Marsilio, I.; Canova, C.; D’Odorico, A.; Ghisa, M.; Zingone, L.; Lorenzon, G.; Savarino, E.V.; Zingone, F. Quality-of-Life Evaluation
in Coeliac Patients on a Gluten-Free Diet. Nutrients 2020, 12, 2981. [CrossRef] [PubMed]18. King, J.A.; Jeong, J.; Underwood, F.E.; Quan, J.; Panaccione, N.; Windsor, J.W.; Coward, S.; deBruyn, J.; Ronksley, P.E.;
Shaheen, A.A.; et al. Incidence of Celiac Disease Is Increasing Over Time: A Systematic Review and Meta-analysis. Am. J.Gastroenterol. 2020, 115, 507–525. [CrossRef] [PubMed]
Nutrients 2022, 14, 1210 10 of 10
19. Katz, K.D.; Rashtak, S.; Lahr, B.D.; Melton, L.J., III; Krause, P.K.; Maggi, K.; Talley, N.J.; Murray, J.A. Screening for celiac disease ina North American population: Sequential serology and gastrointestinal symptoms. Am. J. Gastroenterol. 2011, 106, 1333–1339.[CrossRef] [PubMed]
20. Lebwohl, B.; Tennyson, C.A.; Holub, J.L.; Lieberman, D.A.; Neugut, A.I.; Green, P.H. Sex and racial disparities in duodenal biopsyto evaluate for celiac disease. Gastrointest. Endosc. 2012, 76, 779–785. [CrossRef] [PubMed]
21. Selleski, N.; Zandonadi, R.P.; Milde, L.B.; Gandolfi, L.; Pratesi, R.; Häuser, W.; Uenishi, R.H.; Nakano, E.Y.; Pratesi, C.B. Evaluationof Quality of Life of Adult Patients with Celiac Disease in Argentina: From Questionnaire Validation to Assessment. Int. J.Environ. Res. Public Health 2020, 17, 7051. [CrossRef]
22. Harnett, J.E.; Myers, S.P. Quality of life in people with ongoing symptoms of coeliac disease despite adherence to a strictgluten-free diet. Sci. Rep. 2020, 10, 1144. [CrossRef]
23. Oka, P.; Parr, H.; Barberio, B.; Black, C.J.; Savarino, E.V.; Ford, A.C. Global prevalence of irritable bowel syndrome according toRome III or IV criteria: A systematic review and meta-analysis. Lancet Gastroenterol. Hepatol. 2020, 5, 908–917. [CrossRef]
24. Cossu, G.; Carta, M.G.; Contu, F.; Mela, Q.; Demelia, L.; Elli, L.; Dell’Osso, B. Coeliac disease and psychiatric comorbidity:Epidemiology, pathophysiological mechanisms, quality-of-life, and gluten-free diet effects. Int. Rev. Psychiatry 2017, 29, 489–503.[CrossRef]
25. Fera, T.; Cascio, B.; Angelini, G.; Martini, S.; Guidetti, C.S. Affective disorders and quality of life in adult coeliac disease patientson a gluten-free diet. Eur. J. Gastroenterol. Hepatol. 2003, 15, 1287–1292. [CrossRef] [PubMed]
26. Zarkadas, M.; Cranney, A.; Case, S.; Molloy, M.; Switzer, C.; Graham, I.D.; Butzner, J.D.; Rashid, M.; Warren, R.E.; Burrows, V.The impact of a gluten-free diet on adults with coeliac disease: Results of a national survey. J. Hum. Nutr. Diet 2006, 19, 41–49.[CrossRef] [PubMed]
27. Cranney, A.; Zarkadas, M.; Graham, I.D.; Butzner, J.D.; Rashid, M.; Warren, R.; Molloy, M.; Case, S.; Burrows, V.; Switzer, C. TheCanadian Celiac Health Survey. Dig. Dis. Sci. 2007, 52, 1087–1095. [CrossRef]
28. Roos, S.; Kärner, A.; Hallert, C. Psychological well-being of adult coeliac patients treated for 10 years. Dig. Liver Dis. 2006, 38,177–180. [CrossRef]
29. Tontini, G.E.; Rondonotti, E.; Saladino, V.; Saibeni, S.; De Franchis, R.; Vecchi, M. Impact of gluten withdrawal on health-relatedquality of life in celiac subjects: An observational case-control study. Digestion 2010, 82, 221–228. [CrossRef]
30. Nachman, F.; del Campo, M.P.; González, A.; Corzo, L.; Vázquez, H.; Sfoggia, C.; Smecuol, E.; Sánchez, M.I.; Niveloni, S.;Sugai, E.; et al. Long-term deterioration of quality of life in adult patients with celiac disease is associated with treatmentnoncompliance. Dig. Liver Dis. 2010, 42, 685–691. [CrossRef]
31. Borghini, R.; Di Tola, M.; Salvi, E.; Isonne, C.; Puzzono, M.; Marino, M.; Donato, G.; Picarelli, A. Impact of gluten-free diet onquality of life in celiac patients. Acta Gastroenterol. Belg. 2016, 79, 447–453. [PubMed]
32. Wagner, G.; Berger, G.; Sinnreich, U.; Grylli, V.; Schober, E.; Huber, W.D.; Karwautz, A. Quality of life in adolescents with treatedcoeliac disease: Influence of compliance and age at diagnosis. J. Pediatr. Gastroenterol. Nutr. 2008, 47, 555–561. [CrossRef][PubMed]
33. Zauli, D.; Grassi, A.; Granito, A.; Foderaro, S.; De Franceschi, L.; Ballardini, G.; Bianchi, F.B.; Volta, U. Prevalence of silent coeliacdisease in atopics. Dig. Liver Dis. 2000, 32, 775–779. [CrossRef]
34. Cervio, E.; Volta, U.; Verri, M.; Boschi, F.; Pastoris, O.; Granito, A.; Barbara, G.; Parisi, C.; Felicani, C.; Tonini, M.; et al. Sera ofpatients with celiac disease and neurologic disorders evoke a mitochondrial-dependent apoptosis in vitro. Gastroenterology 2007,133, 195–206. [CrossRef] [PubMed]
35. Volta, U.; De Giorgio, R.; Granito, A.; Stanghellini, V.; Barbara, G.; Avoni, P.; Liguori, R.; Petrolini, N.; Fiorini, E.; Montagna, P.; et al.Anti-ganglioside antibodies in coeliac disease with neurological disorders. Dig. Liver Dis. 2006, 38, 183–187. [CrossRef] [PubMed]
36. Pengiran Tengah, D.S.N.A.; Wills, A.J.; Holmes, G.K.T. Neurological complications of coeliac disease. Postgrad. Med. J. 2002, 78,393–398. [CrossRef] [PubMed]
37. Casellas, F.; Rodrigo, L.; Vivancos, J.L.; Riestra, S.; Pantiga, C.; Baudet, J.S.; Junquera, F.; Diví, V.P.; Abadia, C.; Papo, M.; et al.Factors that impact health-related quality of life in adults with celiac disease: A multicenter study. World J. Gastroenterol. 2008, 14,46–52. [CrossRef] [PubMed]
38. Hallert, C.; Sandlund, O.; Broqvist, M. Perceptions of health-related quality of life of men and women living with coeliac disease.Scand J. Caring Sci. 2003, 17, 301–307. [CrossRef] [PubMed]
39. Barratt, S.M.; Leeds, J.S.; Sanders, D.S. Quality of life in Coeliac Disease is determined by perceived degree of difficulty adheringto a gluten-free diet, not the level of dietary adherence ultimately achieved. J. Gastrointest. Liver Dis. 2011, 20, 241–245.