comparison of progressive addition lenses by direct measurement of surface shape
TRANSCRIPT

Comparison of Progressive Addition Lensesby Direct Measurement of Surface Shape
Ching-Yao Huang*, Thomas W. Raasch†, Allen Y. Yi*, and Mark A. Bullimore‡
ABSTRACTPurpose. To compare the optical properties of five state-of-the-art progressive addition lenses (PALs) by direct physicalmeasurement of surface shape.Methods. Five contemporary freeform PALs (Varilux Comfort Enhanced, Varilux Physio Enhanced, Hoya Lifestyle, ShamirAutograph, and Zeiss Individual) with plano distance power and a +2.00-diopter add were measured with a coordinatemeasuring machine. The front and back surface heights were physically measured, and the optical properties of each surface,and their combination, were calculated with custom MATLAB routines. Surface shape was described as the sum of Zernikepolynomials. Progressive addition lenses were represented as contour plots of spherical equivalent power, cylindrical power,and higher order aberrations (HOAs). Maximum power rate, minimum 1.00-DC corridor width, percentage of lens area withless than 1.00 DC, and root mean square of HOAs were also compared.Results. Comfort Enhanced and Physio Enhanced have freeform front surfaces, Shamir Autograph and Zeiss Individual havefreeform back surfaces, and Hoya Lifestyle has freeform properties on both surfaces. However, the overall optical propertiesare similar, regardless of the lens design. The maximum power rate is between 0.08 and 0.12 diopters per millimeter andthe minimum corridor width is between 8 and 11 mm. For a 40-mm lens diameter, the percentage of lens area with less than1.00 DC is between 64 and 76%. The third-order Zernike terms are the dominant high-order terms in HOAs (78 to 93% ofoverall shape variance). Higher order aberrations are higher along the corridor area and around the near zone. The maximumroot mean square of HOAs based on a 4.5-mm pupil size around the corridor area is between 0.05 and 0.06 Hm.Conclusions. This nonoptical method using a coordinate measuring machine can be used to evaluate a PAL by surfaceheight measurements, with the optical properties directly related to its front and back surface designs.(Optom Vis Sci 2013;90:565Y575)
Key Words: progressive addition lenses, coordinate measuring machine, Zernike polynomials, freeform surface,wavefront aberrations
The optical characteristics of progressive addition lenses(PALs) are often measured by a conventional lensometer1Y4
in the clinic, dispensary, or optical laboratory, which conve-niently and quickly gives information about distance power, nearpower, and thus add power. However, other characteristics ofPALs affect clinical performance, such as the unwanted astigma-tism and aberrations that arise from the freeform surfaces. In thiscontext, ‘‘freeform’’ is used to describe any surface that deviatesfrom a spherocylindrical shape. Moire interferometry,5Y9 wavefront
sensing,10Y13 and point diffraction interferometers14 have beenused to yield information about the distance power, near power,related add power, and higher order aberrations (HOAs) acrossthe whole lens. These measurement methods are all based onoptical measurements.
With advanced freeform manufacturing technology, PALsmay now be fabricated to have complex surfaces on the front,back, or both. Moreover, there are various lens designs from dif-ferent manufacturers, and clinicians could benefit from a betterunderstanding of the underlying design principles. The overalloptical characteristics can be easily and accurately evaluated bythe aforementioned optical measurements. However, with theintroduction of increasingly complex lens designs, it is impor-tant to evaluate the variation in shape for each individual lenssurface. For example, it is possible that imparting different sur-face features to the axially separate front and back surfaces of a
1040-5488/13/9006-0565/0 VOL. 90, NO. 6, PP. 565Y575
OPTOMETRY AND VISION SCIENCE
Copyright * 2013 American Academy of Optometry
ORIGINAL ARTICLE
Optometry and Vision Science, Vol. 90, No. 6, June 2013
*PhD†OD, PhD, FAAO‡MCOptom, PhD, FAAO
Department of Optometry, Shu Zen Junior College of Medicine and Man-
agement, Kaohsiung, Taiwan (C-YH); Colleges of Optometry (TWR) and En-
gineering (AYY), The Ohio State University, Columbus, Ohio; and College of
Optometry, The University of Houston, Houston, Texas (MAB).
Copyright © American Academy of Optometry. Unauthorized reproduction of this article is prohibited.
PAL may influence high-order aberrations, as has been shown forintraocular lenses.15 One way to reveal individual surface proper-ties of PALs is profilometry.
Optical properties of PALs have previously been derived fromdirect measurement of the physical dimensions of the PAL sur-faces.16Y19 Mazuet18 used a coordinate measuring machine (CMM)to measure both surfaces of two PALs and mentioned that, byknowing the lenses refractive index, the wearer power and astig-matism maps can be generated. Recently, Raasch et al.19 used aCMM to characterize and compare three PAL surfaces in termsof the Zernike polynomials. They performed surface height mea-surements on the freeform front surface only based on the assump-tion that the back surface does not contribute to the progressivepower because of a constant contribution to the second-order(sphere and cylinder) terms. They also point out that if bothsurfaces were freeform, measurement of both surfaces would beneeded, with careful registration of the measured regions of bothsurfaces. Of course, the optical properties of the lens would bethe combined effect of the two surfaces.
In a recent article,20 we compared PAL properties derived usingthe CMM method with those from a Hartmann-Shack wave-front sensor and a Rotlex Class Plus lens analyzer operating as amoire interferometer. The three measurement methods were com-parable for measuring spherical and cylindrical power across PALs.In this study, direct physical measurements of both front andback surfaces of five contemporary PALs were performed usingthe CMM method and analyzed to derive the optical character-istics of each surface and the overall properties of these PALswith the expectation of revealing interesting data and insightsinto these five different lens designs. The primary goal was tocompare and contrast the front and back surface optical prop-erties among the five PALs.
METHODS
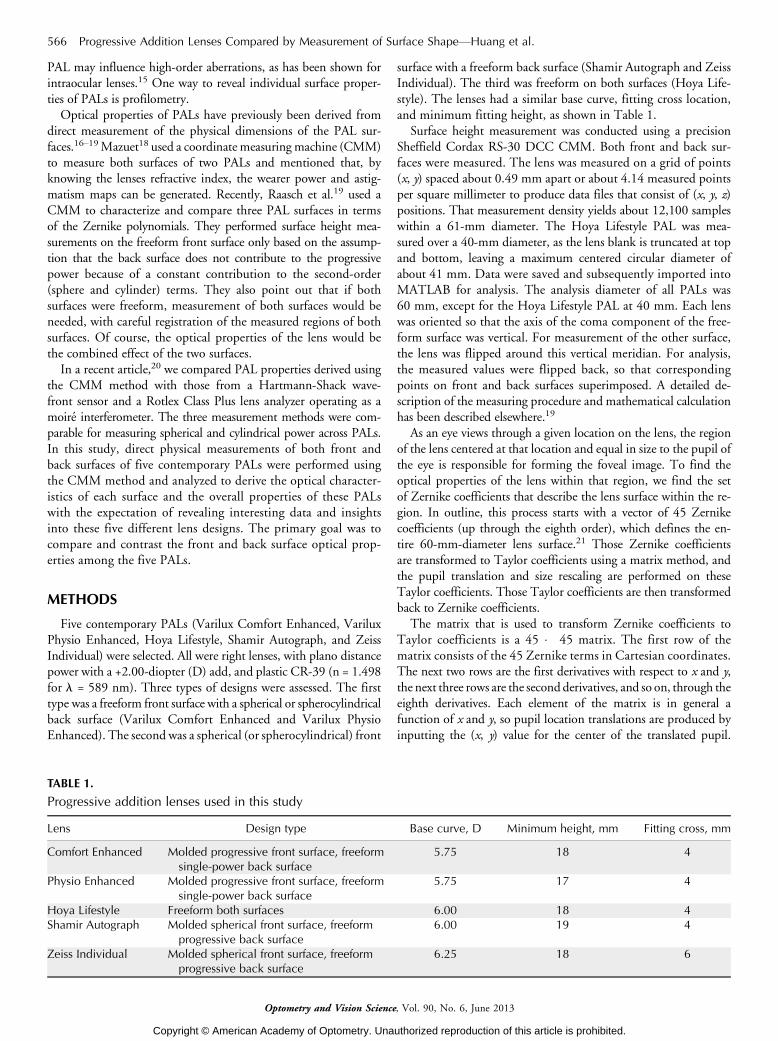
Five contemporary PALs (Varilux Comfort Enhanced, VariluxPhysio Enhanced, Hoya Lifestyle, Shamir Autograph, and ZeissIndividual) were selected. All were right lenses, with plano distancepower with a +2.00-diopter (D) add, and plastic CR-39 (n = 1.498for L = 589 nm). Three types of designs were assessed. The firsttype was a freeform front surface with a spherical or spherocylindricalback surface (Varilux Comfort Enhanced and Varilux PhysioEnhanced). The second was a spherical (or spherocylindrical) front
surface with a freeform back surface (Shamir Autograph and ZeissIndividual). The third was freeform on both surfaces (Hoya Life-style). The lenses had a similar base curve, fitting cross location,and minimum fitting height, as shown in Table 1.
Surface height measurement was conducted using a precisionSheffield Cordax RS-30 DCC CMM. Both front and back sur-faces were measured. The lens was measured on a grid of points(x, y) spaced about 0.49 mm apart or about 4.14 measured pointsper square millimeter to produce data files that consist of (x, y, z)positions. That measurement density yields about 12,100 sampleswithin a 61-mm diameter. The Hoya Lifestyle PAL was mea-sured over a 40-mm diameter, as the lens blank is truncated at topand bottom, leaving a maximum centered circular diameter ofabout 41 mm. Data were saved and subsequently imported intoMATLAB for analysis. The analysis diameter of all PALs was60 mm, except for the Hoya Lifestyle PAL at 40 mm. Each lenswas oriented so that the axis of the coma component of the free-form surface was vertical. For measurement of the other surface,the lens was flipped around this vertical meridian. For analysis,the measured values were flipped back, so that correspondingpoints on front and back surfaces superimposed. A detailed de-scription of the measuring procedure and mathematical calculationhas been described elsewhere.19
As an eye views through a given location on the lens, the regionof the lens centered at that location and equal in size to the pupil ofthe eye is responsible for forming the foveal image. To find theoptical properties of the lens within that region, we find the setof Zernike coefficients that describe the lens surface within the re-gion. In outline, this process starts with a vector of 45 Zernikecoefficients (up through the eighth order), which defines the en-tire 60-mm-diameter lens surface.21 Those Zernike coefficientsare transformed to Taylor coefficients using a matrix method, andthe pupil translation and size rescaling are performed on theseTaylor coefficients. Those Taylor coefficients are then transformedback to Zernike coefficients.
The matrix that is used to transform Zernike coefficients toTaylor coefficients is a 45 � 45 matrix. The first row of thematrix consists of the 45 Zernike terms in Cartesian coordinates.The next two rows are the first derivatives with respect to x and y,the next three rows are the second derivatives, and so on, through theeighth derivatives. Each element of the matrix is in general afunction of x and y, so pupil location translations are produced byinputting the (x, y) value for the center of the translated pupil.
TABLE 1.
Progressive addition lenses used in this study
Lens Design type Base curve, D Minimum height, mm Fitting cross, mm
Comfort Enhanced Molded progressive front surface, freeformsingle-power back surface
5.75 18 4
Physio Enhanced Molded progressive front surface, freeformsingle-power back surface
5.75 17 4
Hoya Lifestyle Freeform both surfaces 6.00 18 4Shamir Autograph Molded spherical front surface, freeform
progressive back surface6.00 19 4
Zeiss Individual Molded spherical front surface, freeformprogressive back surface
6.25 18 6
566 Progressive Addition Lenses Compared by Measurement of Surface ShapeVHuang et al.
Optometry and Vision Science, Vol. 90, No. 6, June 2013
Copyright © American Academy of Optometry. Unauthorized reproduction of this article is prohibited.

Rescaling to a smaller pupil size is done by raising the propor-tional change in aperture diameter to a power equal to the orderof each Taylor term. We now have a vector of translated and re-scaled Taylor coefficients. Translating these back to Zernike coef-ficients is done with another 45 � 45 matrix, which is the inverseof the Zernike-to-Taylor matrix. This matrix, multiplied by thevector of Taylor coefficients, yields a vector of Zernike coefficientsfor the rescaled pupil translated to the given (x, y) lens location.
Optical properties of the lens are derived from the Zernike co-efficients for subapertures arrayed across the lens surface. Sphericalequivalent (M ), J0, and J45 are derived from the second-orderZernike terms,22 and the HOA root mean square (RMS) error isderived from the higher order Zernike terms.
Progressive addition lenses characteristics were represented ascontour plots of spherical equivalent power, cylindrical power,and HOAs. Maximum power rate change along the corridor,minimum 1.00-DC corridor width, and percentage of lens areawith less than 1.00 DC were also compared.
RESULTS
Fig. 1 illustrates the front and back surface height profilescaused by the higher order terms. In addition, the thickness pro-files resulting from the combination of the two surface heightsare shown. These height profiles are generated from the higherorder terms only. The spherocylindrical (second-order) termsare essentially irrelevant to the progressive power of the lens be-cause they contribute a constant value to the sphere and cylinderpower. Because we are interested here in the variation in lenspower (and in astigmatism and aberrations) across the lens sur-face, we can ignore the constant spherocylindrical terms. Thiswas done by simply setting the second-order coefficients to zero.
It is apparent that the first two lenses have a freeform frontsurface and a spherocylindrical back surface. The last two lensesare spherocylindrical on the front and freeform on the back. Thethird lens is freeform on both surfaces. The third column repre-sents lens thickness from the combination of the two surfaces. Thelenses are similar in that they all have relatively concave upperportions (for distance vision) and relatively convex portions below(for near vision).
Fig. 2 shows contour plots of the spherical equivalent power (M )of these five PALs on the front, back, and combined. The negativesphere values in the upper portion of the lens is a result of thesetting the second-order coefficients to zero, thus making the aver-age power of the lens close to plano. The surface power profilesalong the vertical midline on the front, back, and combined surfacein the five PALs are shown in Fig. 3. These two figures clearlyshow that Comfort Enhanced and Physio Enhanced have pro-gressive front surface designs, Shamir Autograph and Zeiss Indi-vidual have progressive back surface designs, and Hoya Lifestylehas a freeform design on both surfaces, consistent with the manu-facturers’ descriptions.
Astigmatism is shown in Fig. 4. The results show that the un-wanted astigmatism from the freeform surface generally increaseslaterally, away from the vertical midline. The contour plots ofunwanted astigmatism on the combined surface for the five lensesare similar, which shows less astigmatism along the progressivecorridor, which increases laterally away from the vertical midline.
Note that, for the Hoya lens, the diameter represented here is40 mm rather than 60 mm.
Table 2 shows a comparison of the maximum power ratechange, percentage of lens area (within a 40-mm diameter) withless than 1.00 DC, and minimum 1.00-DC corridor width. Itshows that the Comfort Enhanced, Physio Enhanced, and HoyaLifestyle have progressive power changes on the front surface,whereas the Shamir Autograph and Zeiss Individual have pro-gressive power changes on the back surface. The maximum powerchange rates along the vertical midline of the combined surfaceare between 0.08 and 0.12 D/mm, and the minimum 1.00-DCcorridor widths are between 8 and 11 mm. The Hoya Life-style distributes unwanted astigmatism across both surfacesbecause both are freeform. Nonetheless, all five PALs show a similarpercentage of lens area with less than 1.00 DC, between 64and 76%.
Table 3 compares the surface shapes, in terms of shape variance(in square micrometers). These variance values come from theZernike coefficients that define the shape of the central 40-mmdiameter of each surface. Values are given for front, back, andcombined surfaces. Furthermore, shape variance values are givenfor the third-order terms, that is, coma and trefoil. These are thedominant high-order terms in the freeform surfaces responsiblefor 78 to 93% of surface height variance.
Fig. 5 shows contour plots of the higher order RMS through a4.5-mm pupil for the front, back, and both surfaces combined.It is apparent that the freeform surface of each lens is responsiblefor the HOAs, whereas the spherocylindrical surfaces show a lowlevel of HOA, as expected. The contour plots show that the RMSof HOAs tends to be higher in the progressive corridor area andthe area surrounding the near power zone in all five PALs. The max-imum RMS of HOAs around the corridor area is between 0.05and 0.06 Km for a 4.5-mm pupil.
DISCUSSION
There are three types of PAL designs assessed in this study. Thefirst is a freeform front surface with a spherocylindrical back sur-face. This is similar to the traditional approach to PAL manu-facture. The second is a spherocylindrical front surface with afreeform progressive back surface. The third is freeform on bothsurfaces. According to the CMM surface height measurementsof the front and back PAL surfaces, the surface power profilealong the vertical midline in Fig. 2 and the maximum powerrate in Table 2 demonstrate that Comfort Enhanced and PhysioEnhanced belong to the first design, Shamir Autograph and ZeissIndividual belong to the second design, and Hoya Lifestyle be-longs to the third design, consistent with the manufacturers’descriptions. Obviously, the most intriguing design is the HoyaLifestyle, which uses sophisticated surfaces on the front and theback. Table 3 and Fig. 1 demonstrate that trefoil is the dominanthigh-order aberration on the freeform back surface.
The lens specifications were plano distance power with a+2.00-D add. The method used here produces different sphericalequivalent powers (M ) than plano at distance and +2.00 D at near.This difference is caused by the second-order Zernike term(defocus) being initially set to zero in the calculation of surfaceheight. As a result, contour plots in Fig. 2 have a distance portion
Progressive Addition Lenses Compared by Measurement of Surface ShapeVHuang et al. 567
Optometry and Vision Science, Vol. 90, No. 6, June 2013
Copyright © American Academy of Optometry. Unauthorized reproduction of this article is prohibited.
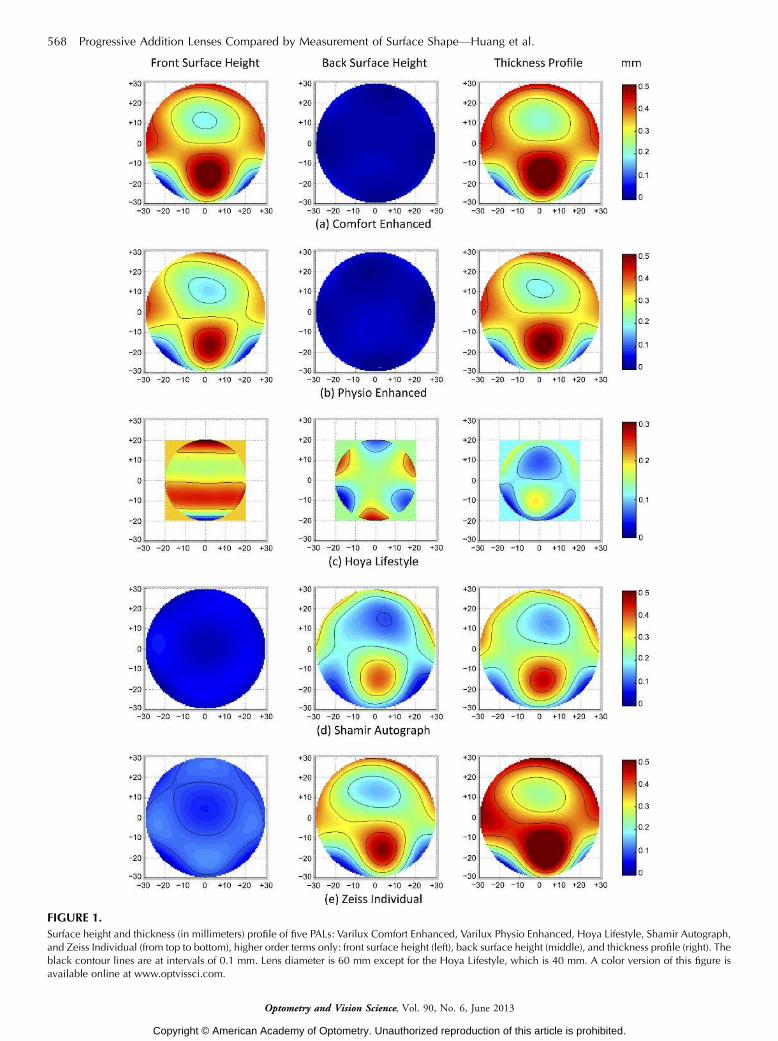
FIGURE 1.Surface height and thickness (in millimeters) profile of five PALs: Varilux Comfort Enhanced, Varilux Physio Enhanced, Hoya Lifestyle, Shamir Autograph,and Zeiss Individual (from top to bottom), higher order terms only: front surface height (left), back surface height (middle), and thickness profile (right). Theblack contour lines are at intervals of 0.1 mm. Lens diameter is 60 mm except for the Hoya Lifestyle, which is 40 mm. A color version of this figure isavailable online at www.optvissci.com.
568 Progressive Addition Lenses Compared by Measurement of Surface ShapeVHuang et al.
Optometry and Vision Science, Vol. 90, No. 6, June 2013
Copyright © American Academy of Optometry. Unauthorized reproduction of this article is prohibited.

FIGURE 2.Variation in spherical equivalent power (in diopters) of five PALs, Varilux Comfort Enhanced, Varilux Physio Enhanced, Hoya Lifestyle, Shamir Autograph,and Zeiss Individual (from top to bottom), for the front surface (left), back surface (middle), and combined surfaces (right). The black contour lines are atintervals of 0.50 D. Lens diameter is 60 mm except for the Hoya Lifestyle, which is 40 mm. A color version of this figure is available online atwww.optvissci.com.
Progressive Addition Lenses Compared by Measurement of Surface ShapeVHuang et al. 569
Optometry and Vision Science, Vol. 90, No. 6, June 2013
Copyright © American Academy of Optometry. Unauthorized reproduction of this article is prohibited.
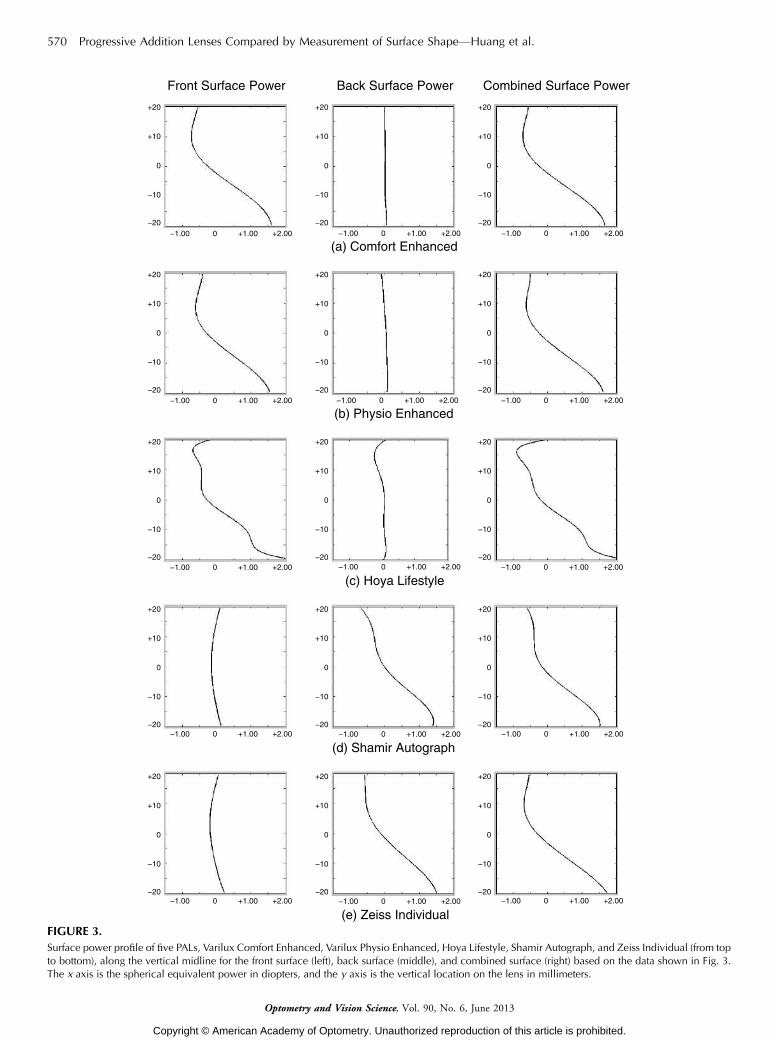
FIGURE 3.Surface power profile of five PALs, Varilux Comfort Enhanced, Varilux Physio Enhanced, Hoya Lifestyle, Shamir Autograph, and Zeiss Individual (from topto bottom), along the vertical midline for the front surface (left), back surface (middle), and combined surface (right) based on the data shown in Fig. 3.The x axis is the spherical equivalent power in diopters, and the y axis is the vertical location on the lens in millimeters.
570 Progressive Addition Lenses Compared by Measurement of Surface ShapeVHuang et al.
Optometry and Vision Science, Vol. 90, No. 6, June 2013
Copyright © American Academy of Optometry. Unauthorized reproduction of this article is prohibited.

FIGURE 4.Contour plots of the cross-cylindrical power (J ) of five PALs, Varilux Comfort Enhanced, Varilux Physio Enhanced, Hoya Lifestyle, Shamir Autograph, andZeiss Individual (from top to bottom), for the front surface (left), back surface (middle), and combined surface (right). J is the Pythagorean sum of J0 and J45and half the magnitude of the total cylinder (in diopters). Lens diameter is 60 mm except for the Hoya Lifestyle, which is 40 mm. A color version of thisfigure is available online at www.optvissci.com.
Progressive Addition Lenses Compared by Measurement of Surface ShapeVHuang et al. 571
Optometry and Vision Science, Vol. 90, No. 6, June 2013
Copyright © American Academy of Optometry. Unauthorized reproduction of this article is prohibited.

that is negative and a near add that is positive, with a difference ofabout 2.00 D.
A comparison of these lenses shows some similarities and somedifferences. Which lens may perform optimally for any given user,however, certainly must depend on a wide range of factors. Al-though the lens characteristics described here are certainly im-portant properties of a lens, they also certainly do not providesufficient information to predict with certainty which lens will per-form best for a given user and purpose. The values of spherical power,astigmatism, and HOAs were derived from surface measures, andno adjustment was made for variations in vertex distance andoblique incidence associated with a wearer’s eye rotating behindthe lens. Likewise, the present study only evaluated lenses withplano distance power, a single add power, and a single material.Caution should therefore be exercised before generalizing theseresults to other distance and add powers, along with higher indexmaterials. Different manufacturers may use a variety of strategieswhen manipulating surface geometry to account for these vari-ables. However, modest changes in refractive index (from n1 to n2)
will result in predictable changes to optical properties, propor-tional to (n2 j 1)/(n1 j 1). That is, a change in index from 1.5 to1.55 will result in power and aberration increases by a factor of0.55/0.5 = 1.1�.
The present study demonstrates that coma and trefoil are thedominant high-order terms present in PAL designs regardless ofthe design, with these third-order terms accounting for 78 to 93%of the higher order shape variance. One cannot have a progressivesurface without high-order terms because they are responsible forthe variation in power across the lens. The amount of HOAsvaries with design (Table 3). In their excellent review, Meister andFisher23 state that ‘‘coma is directly proportional to the rate ofchange in mean addition power.’’ It is interesting to note that thePALs with the highest overall levels of high-order aberrationsVVarilux Comfort and Zeiss IndividualVhave relatively short cor-ridors based on their maximum power rates (Table 2). Conversely,the Physio Enhanced and Hoya Lifestyle have lower levels of high-order aberrations (Table 3) and relatively long corridors (Table 2).The Shamir Autograph is the exception, with a short corridor but
TABLE 2.
Comparison of the maximum power rate, percent of lens area, and minimum corridor width in five PALs for a lens diameterof 40 mm
Maximum power rate, D/mm Percent of lens area e1.00 DC
PALsFrontsurface
Backsurface
Combinedsurface
Frontsurface
Backsurface
Combinedsurface
Minimum 1.00-DCcorridor width, mm
Comfort Enhanced 0.124 0.004 0.118 64.3 100 64.2 9.0Physio Enhanced 0.116 0.007 0.095 66.5 100 65.9 9.4Hoya Lifestyle 0.090 0.039 0.085 49.0 50.7 76.2 10.7Shamir Autograph 0.015 0.108 0.117 100 72.2 70.1 10.9Zeiss Individual 0.021 0.105 0.115 100 66.1 63.7 8.0
TABLE 3.
Comparison of the whole-surface shape variance (in square micrometers) of HOAs in five PALs measured by the CMMmethod for a lens diameter of 40 mm
PALsComfortEnhanced
PhysioEnhanced
HoyaLifestyle
ShamirAutograph
ZeissIndividual
Front Surface HOAs 1600 1319 2006 54.7 118.4Third order(% of total HOA)
1335 (83%) 1043 (79%) 1933 (96%) 6.9 (13%) 5.2 (4%)
Coma 971 672 981 1.2 0.9
Trefoil 364 371 952 5.7 4.3
Back Surface HOAs 9.9 10.3 2101 1033 1375Third order(% of total HOA)
2.9 (29%) 3.7 (36%) 1969 (94%) 857 (83%) 1113 (81%)
Coma 0.3 3.3 7 553 745
Trefoil 2.6 0.4 1962 304 368
Combined Surface HOAs 1542 1128 1188 1017 1523Third order(% of total HOA)
1303 (84%) 896 (80%) 1102 (93%) 812 (80%) 1195 (78%)
Coma 924 553 883 542 828Trefoil 379 343 219 270 367
Values are given for front, back, and combined surfaces. Shape variance values are given for all HOAs, third order, coma, and trefoil.The proportion of HOAs accounted for by third-order aberrations is also shown.
572 Progressive Addition Lenses Compared by Measurement of Surface ShapeVHuang et al.
Optometry and Vision Science, Vol. 90, No. 6, June 2013
Copyright © American Academy of Optometry. Unauthorized reproduction of this article is prohibited.

FIGURE 5.Contour plots of the RMS (in micrometers) of HOAs of five PALs, Varilux Comfort Enhanced, Varilux Physio Enhanced, Hoya Lifestyle, Shamir Autograph,and Zeiss Individual (from top to bottom), for the front surface (left), back surface (middle), and combined surface (right). Lens diameter is 60 mm exceptfor the Hoya Lifestyle, which is 40 mm. A color version of this figure is available online at www.optvissci.com.
Progressive Addition Lenses Compared by Measurement of Surface ShapeVHuang et al. 573
Optometry and Vision Science, Vol. 90, No. 6, June 2013
Copyright © American Academy of Optometry. Unauthorized reproduction of this article is prohibited.

relatively low high-order aberrations. Thus, although high-orderaberrations in a PAL may be strongly influenced by the corridorlength, nuances in the surface designs may also play a role. Finally,it does not seem possible to say that any of the designsVfrontsurface, back surface, or bothVare better at controlling HOAs.
The high-order terms that determine the progressive powernature of these lenses are also responsible for high-order aberra-tions within any small pupil-sized aperture positioned anywhereon the lens. Coma and trefoil tend to be highest around thetransition corridor and near zone, and coma can be expected tohave a somewhat greater impact than trefoil on image quality.24
The extent to which these aberrations may be troublesome tothe patient depends to a large extent on pupil size. Higher orderaberrations and their impact increase with pupil size, so patientswith smaller pupils will be more resistant to their impact. Forexample, decreasing pupil size from 4 to 3 mm, a 25% reduction,will reduce the magnitude of the third-order terms coma andtrefoil by a factor of 0.753 or 0.422. Even with a relatively largepupil, however, the magnitude of these HOAs is modest com-pared with the astigmatism found in the periphery of all PALs.A comparison of the RMS levels caused by unwanted astigma-tism and by HOA shows that the RMS caused by astigmatismis much larger. For example, with a 4.5-mm pupil and the Com-fort Enhanced lens, across the lens surface, the RMS caused byastigmatism was, on average, more than 16 times larger than theRMS caused by HOA. The RMS caused by HOA approachedthe level of astigmatic RMS only in regions of the lens with verylow levels of unwanted astigmatism.
A limitation of the present study is that measurements weremade by lateral translation of the CMM probe across a fixedmounted lens. Thus, the results may not accurately represent theeffective power as worn by the patient when the eye rotates behindthe lens. This may be important as some lenses have their pro-gressive surface on the front, some on the back, and one has twofreeform surfaces. For example, our analysis treats both surfacesequally, but when worn, the back surface is closer to the eye anda unit distance will subtend a larger angle than the equivalentdistance on the front surface. Because the two surfaces are slightlydifferent distances from the eye, there will also be very small effec-tivity differences for the two surfaces. Our approach, however, doesillustrate the relationship between surface shape geometry andpower gradients and aberrations across that lens surface. For ex-ample, in the case of the Hoya lens, the freeform nature of bothsurfaces is revealed by the method used. In addition, this directmeasurement of surface height provides an accurate and completequantification of surface shape in (x, y, z) coordinates. From thoseraw height values, surface shape descriptors and optical propertiesresulting from that shape can then be derived, as we have donehere, by describing the shape of the lens surfaces with Zernikepolynomials.
The results of this method compare reasonably well with othermeasurement methods, for example, Hartmann-Shack wavefrontsensing.20 Differences between the results from various measure-ment methods can result from a range of issues, such as alignment/positioning variability during measurement, assumptions aboutrefractive indices, lens thickness, and so on. Nevertheless, this non-optical physical measurement of surface shape can be used to an-alyze PALs, with optical properties derived directly from those
surface shapes and provides information not accessible by othermethods. This approach is potentially useful for characterizing anddesigning PALs, and this article represents the first attempt todocument the front and back surface characteristics of a series ofcontemporary PALs. Our data confirmed that the manufacturers’descriptions are valid with regard to the nature of the front andback surfaces. Understanding the properties of both surfaces mayallow clinicians to better appreciate the underlying optical designbut may not be extrapolated to patient performance and accep-tance. An interesting next step would be to compare optical mea-sures with clinical measures of vision, specific vision tests, andsubjective preferences.25
Received July 11, 2012; accepted February 26, 2013.
REFERENCES
1. Atchison DA. Optical performance of progressive power lenses. Clin
Exp Optom 1987;70:149Y55.
2. Fowler CW, Sullivan CM. Automatic measurement of varifocal
spectacle lenses. Ophthalmic Physiol Opt 1990;10:86Y9.
3. Sheedy JE, Buri M, Bailey IL, Azus J, Borish IM. Optics of pro-
gressive addition lenses. Am J Optom Physiol Opt 1987;64:90Y9.
4. Simonet P, Papineau Y, Lapointe R. Peripheral power variations in
progressive addition lenses. Am J Optom Physiol Opt 1986;63:
873Y80.
5. Sheedy J, Hardy RF, Hayes JR. Progressive addition lensesVmeasurements and ratings. Optometry 2006;77:23Y39.
6. Sheedy JE. Progressive addition lensesVmatching the specific lens to
patient needs. Optometry 2004;75:83Y102.
7. Sheedy JE. Correlation analysis of the optics of progressive addition
lenses. Optom Vis Sci 2004;81:350Y61.
8. Sheedy JE, Campbell C, King-Smith E, Hayes JR. Progressive
powered lenses: the Minkwitz theorem. Optom Vis Sci 2005;82:
916Y22.
9. Sheedy JE, Hardy RF. The optics of occupational progressive lenses.
Optometry 2005;76:432Y41.
10. Villegas EA, Artal P. Spatially resolved wavefront aberrations of
ophthalmic progressive-power lenses in normal viewing conditions.
Optom Vis Sci 2003;80:106Y14.
11. Villegas EA, Artal P. Comparison of aberrations in different types of
progressive power lenses. Ophthalmic Physiol Opt 2004;24:419Y26.
12. Villegas EA, Artal P. Visual acuity and optical parameters in
progressive-power lenses. Optom Vis Sci 2006;83:672Y81.
13. Zhou C, Wang W, Yang K, Chai X, Ren Q. Measurement and
comparison of the optical performance of an ophthalmic lens based
on a Hartmann-Shack wavefront sensor in real viewing conditions.
Appl Opt 2008;47:6434Y41.
14. Chamadoira S, Blendowske R, Acosta E. Progressive addition lens
measurement by point diffraction interferometry. Optom Vis Sci
2012;89:1532Y42.
15. Atchison DA. Design of aspheric intraocular lenses. Ophthalmic
Physiol Opt 1991;11:137Y46.
16. Hadaway JB, Chipman RA, Drewes J, Hargrove T. The spectacle
lenses image quality mapper. In: OSA Technical Digest Series: Vi-
sion Science and Its Applications. Washington, DC: Optical Society
of America; 1999:206Y9.
17. Herman H. How to control your freeform process comparison of
3 measurement methods. MAFO 2010;2:26Y8.
574 Progressive Addition Lenses Compared by Measurement of Surface ShapeVHuang et al.
Optometry and Vision Science, Vol. 90, No. 6, June 2013
Copyright © American Academy of Optometry. Unauthorized reproduction of this article is prohibited.

18. Mazuet D. Progressive addition lenses and commercial instruments
limitations. In: OSA Technical Digest Series: Vision Science and Its
Applications. Washington, DC: Optical Society of America; 2001:
179Y82.
19. Raasch TW, Su L, Yi A. Whole-surface characterization of pro-
gressive addition lenses. Optom Vis Sci 2011;88:217Y26.
20. Huang CY, Raasch TW, Yi AY, Sheedy JE, Andre B, Bullimore MA.
Comparison of three techniques in measuring progressive addition
lenses. Optom Vis Sci 2012;89:1564Y73.
21. Raasch T. Aberrations and spherocylindrical powers within sub-
apertures of freeform surfaces. J Opt Soc Am (A) 2011;28:2642Y6.
22. Thibos LN, Hong X, Bradley A, Applegate RA. Accuracy and pre-
cision of objective refraction from wavefront aberrations. J Vis
2004;4:329Y51.
23. Meister DJ, Fisher SW. Progress in the spectacle correction ofpresbyopia. Part 2. Modern progressive lens technologies. Clin ExpOptom 2008;91:251Y64.
24. Cheng X, Bradley A, Ravikumar S, Thibos LN. Visual impact ofZernike and Seidel forms of monochromatic aberrations. Optom Vis
Sci 2010;87:300Y12.
25. Han SC, Graham AD, Lin MC. Clinical assessment of a customizedfree-form progressive add lens spectacle. Optom Vis Sci 2011;88:234Y43.
Mark A. Bullimore356 Ridgeview LaneBoulder, CO 80302
e-mail: [email protected]
Progressive Addition Lenses Compared by Measurement of Surface ShapeVHuang et al. 575
Optometry and Vision Science, Vol. 90, No. 6, June 2013
Copyright © American Academy of Optometry. Unauthorized reproduction of this article is prohibited.