comparing two versions of professional development for teachers using formative assessment in...
TRANSCRIPT

This article was downloaded by: [University of Illinois Chicago]On: 22 January 2015, At: 09:53Publisher: RoutledgeInforma Ltd Registered in England and Wales Registered Number: 1072954 Registeredoffice: Mortimer House, 37-41 Mortimer Street, London W1T 3JH, UK
Click for updates
Journal of Research on Technology inEducationPublication details, including instructions for authors andsubscription information:http://www.tandfonline.com/loi/ujrt20
Comparing Two Versions of ProfessionalDevelopment for Teachers UsingFormative Assessment in NetworkedMathematics ClassroomsYue Yina, Judith Olsonb, Melfried Olsonb, Hannah Solvinb & Paul R.Brandonb
a University of Illinois at Chicagob University of HawaiiPublished online: 08 Jan 2015.
To cite this article: Yue Yin, Judith Olson, Melfried Olson, Hannah Solvin & Paul R. Brandon (2015)Comparing Two Versions of Professional Development for Teachers Using Formative Assessment inNetworked Mathematics Classrooms, Journal of Research on Technology in Education, 47:1, 41-70,DOI: 10.1080/15391523.2015.967560
To link to this article: http://dx.doi.org/10.1080/15391523.2015.967560
PLEASE SCROLL DOWN FOR ARTICLE
Taylor & Francis makes every effort to ensure the accuracy of all the information (the“Content”) contained in the publications on our platform. However, Taylor & Francis,our agents, and our licensors make no representations or warranties whatsoever as tothe accuracy, completeness, or suitability for any purpose of the Content. Any opinionsand views expressed in this publication are the opinions and views of the authors,and are not the views of or endorsed by Taylor & Francis. The accuracy of the Contentshould not be relied upon and should be independently verified with primary sourcesof information. Taylor and Francis shall not be liable for any losses, actions, claims,proceedings, demands, costs, expenses, damages, and other liabilities whatsoever orhowsoever caused arising directly or indirectly in connection with, in relation to or arisingout of the use of the Content.
This article may be used for research, teaching, and private study purposes. Anysubstantial or systematic reproduction, redistribution, reselling, loan, sub-licensing,systematic supply, or distribution in any form to anyone is expressly forbidden. Terms &

Conditions of access and use can be found at http://www.tandfonline.com/page/terms-and-conditions
Dow
nloa
ded
by [
Uni
vers
ity o
f Il
linoi
s C
hica
go]
at 0
9:53
22
Janu
ary
2015

Comparing Two Versions of Professional Development forTeachers Using Formative Assessment in Networked
Mathematics Classrooms
Yue YinUniversity of Illinois at Chicago
Judith Olson, Melfried Olson, Hannah Solvin, & Paul R. BrandonUniversity of Hawaii
Abstract
This study compared two versions of professional development (PD) designed for teachers usingformative assessment (FA) in mathematics classrooms that were networked with TexasInstruments Navigator (NAV) technology. Thirty-two middle school mathematics teachers wererandomly assigned to one of the two groups: FA-then-NAV group and FA-and-NAV group. TheFA-then-NAV group received PD in formative student assessment in the first year and PD inusing networked classroom technology for formative assessment in the second year. The FA-and-NAV group received PD in using networked technology to implement formative assessment intwo consecutive years. We examined the change of teachers’ self-reported knowledge of formativeassessment, self-efficacy in formative assessment, and attitudes toward the use of technology, aswell as their evaluations of the two PD versions, by surveying the teachers at pretest, after Year 1training, after Year 2 training, and after Year 3 (without training). We found significant growth inknowledge about general assessment, knowledge about formative assessment, self-efficacy informative assessment, value of technology, and confidence in classroom technology for eachversion. While no significant differences were found between the two versions on the measuredconstructs at the end, different growth trajectories were observed in each group over the threeyears. The majority of the teachers reported that they preferred the FA-and-NAV PD version.(Keywords: formative assessment, networked mathematics classroom, professional development)
In a networked mathematics classroom, students use handheld graphing calculators that commu-nicate wirelessly with their teacher’s computer, which is connected to a shared display screen. Ina connected classroom, what students know and can do is easily assessed and anonymously dis-
played. Students enter and send their responses to the teacher’s computer through their calculators.Similarly, teachers easily send questions, and receive, organize, and display students’ answers, sothat the interaction between the teacher and students and among students is greatly facilitated.
With these characteristics, networked classrooms have the potential to help teachers implementformative assessments in classrooms. However, this practice can be challenging for teachers,because it requires teachers not only to master formative assessment strategies but also to use theappropriate features of technology to implement formative assessment.
Researchers have suggested that successful implementation of innovative programs requirespractitioners to receive coordinated training, coaching, and frequent performance assessments(e.g., Fixsen, Naoom, Blase, Friedman, & Wallace, 2005; Yin, 2005). For teachers to successfullyimplement new teaching strategies such as formative assessment using networked technology,
Color versions of one or more of the figures in the article can be found online at www.tandfonline.com/UJRT.
Volume 47 Number 1 l Journal of Research on Technology in Education l 41
JRTE | Vol. 47, No. 1, pp. 41–70 | � 2015 ISTE | iste.org/jrteDOI: 10.1080/15391523.2015.967560
Dow
nloa
ded
by [
Uni
vers
ity o
f Il
linoi
s C
hica
go]
at 0
9:53
22
Janu
ary
2015

well-designed teacher professional development (PD) is needed. This study was conducted to comparethe effects of two versions of PD for teachers to use formative assessment in networked middle schoolmathematics classrooms. In particular, the study was designed to answer three research questions:
1. To what extent did each of the two versions of PD improve teachers’ knowledge about assess-ment, self-efficacy about formative assessment, perceived value of technology, interest in tech-nology, self-efficacy with general technology, and self-confidence in classroom technology overthree years?
2. To what extent did the participation in the two PD versions differentially affect teachers’ knowl-edge about assessment, perceived value of technology, interest in technology, self-efficacy withgeneral technology, and self-confidence in classroom technology over three years?
3. What were the teacher participants’ evaluations of the two PD versions?
Using Technology to Facilitate Formative AssessmentSubstantial evidence has shown that formative assessment, if appropriately implemented in teach-ing, can produce significant learning gains for students at different ages and across different subjects(Black, Harrison, Lee, Marshall, & Wiliam, 2004; Black & Wiliam, 1998a, 1998b). While there arevariations in teachers’ use and implementation of formative assessment (Shavelson et al., 2008),common steps are explicitly or implicitly involved: (a) determining achievement goals that studentsare expected to reach—the expected level; (b) collecting information about what students know andcan do—the actual level; (c) identifying the gap between the actual level and expected level; and(d) taking action to close the gap (Sadler, 1989).
As straightforward as it may sound, in practice, formative assessment has proven difficult to con-duct (Furtak et al., 2008; Yin et al., 2008). First, it is time-consuming for teachers to collect andassess responses from all students and provide specific feedback on each student’s work in a timelymanner. Second, some students may not feel comfortable with sharing their knowledge in front oftheir classmates. Third, creating high-quality formative assessment questions requires teachers tohave adequate knowledge of the curriculum and assessment.
Technology may provide a solution to the problems encountered when using formative assess-ment. In How People Learn (Bransford, Brown, & Cocking, 2000), classroom networks were sug-gested as one of the most promising technology-based innovations for transforming the classroomenvironment. Instructional decisions based on formative assessment are contingent on what studentshave learned, which can be identified through the use of technology. With technology, it is possibleto overcome the major hurdle to using formative classroom assessment: the collection, management,and analysis of assessment data. While feedback loops in the regular classroom are very slow, class-room networking technology has the capability to provide rapid cycles of feedback to improveongoing activity in real time (Roschelle, Penuel, & Abrahamson, 2004).
The TI-Navigator System is one of the most developed connected classroom systems for teach-ing mathematics, with features specifically for facilitating formative assessment (e.g., Owens et al.,2008; Sinclair & Wideman, 2009). TI-Navigator is a networking system developed by Texas Instru-ments that wirelessly connects each student’s graphing calculator to the classroom teacher’s com-puter. TI-Navigator can bring several benefits to a classroom. First, teachers can easily distributeassessment questions and receive, organize, and display students’ answers, so that knowledge ofstudents’ knowledge and skills is immediately available to the teacher, and so that teachers can pro-vide timely and specific feedback. Second, the students’ responses to each question can be dis-played anonymously, which is helpful if some students are concerned about making mistakes inpublic. Third, teachers can share and store well-designed formative assessment questions in the TI-Navigator software and use them when appropriate. All these features can address the challengesthat teachers have when implementing formative assessment.
Four functions of TI-Navigator are particularly helpful for formative assessment implementation:(a) Quick Poll—allowing teachers to immediately collect and display all students’ responses to a
Yue et al.
42 l Journal of Research on Technology in Education l Volume 47 Number 1
Dow
nloa
ded
by [
Uni
vers
ity o
f Il
linoi
s C
hica
go]
at 0
9:53
22
Janu
ary
2015

single question and have the class discuss different responses; (b) Screen Capture—allowing teach-ers to view the graphing calculator screens of all students, so that the teacher can monitor individualstudents’ progress at any time or choose to display any screens for classroom discussion and for stu-dents to view each other’s work; (c) Learn Check—allowing teachers to administer quick and fre-quent formative assessment questions, with students’ responses viewed via slideshows to providetimely feedback for both teachers and students; and (d) Activity Center—allowing students to workcollaboratively to contribute individual data to a class activity, thus serving as a public space forinvestigating and discussing mathematical concepts. Appendix A presents a detailed description ofeach TI-Navigator function, the alignment between each function and formative assessment needs,and the advantages of the function when it is used to implement formative assessment. In additionto the advantages indicated in Appendix A, the fundamental functions of the graphing calculatormake it a learning tool to investigate mathematical concepts.
TI-Navigator can help teachers implement formative assessment in classrooms, but the potentialfor its effects can be fully realized only if teachers master both the TI-Navigator and formativeassessment. Especially, teachers should be able to implement formative assessments in a manneramenable to the use of TI-Navigator. However, little research has been conducted to explore the PDthat is necessary for teachers to use formative assessment effectively in a networked classroom.
Professional DevelopmentConsiderable research on the features of effective PD has been conducted. Based on the studiessince the 1980s, Desimone (2009) identified core features that are crucial for changes in teacherknowledge, skills, and beliefs, including content focus, active learning, coherence, duration, andcollective participation. Among them, the first four are applicable to our study. Content focus refersto the knowledge and skills addressed in the PD, including pedagogical content knowledge andassumptions about student learning; active learning has to do with teachers learning in the mannerproposed for students; coherence has to do with the extent to which the PD is consistent with stand-ards; and duration is the length of the PD—recommended as at least 20 contact hours.
For this study, we designed two PDs that varied in sequence and timing, each of which addressedthe four core features described by Desimone (2009). The first was “formative assessment-then-TI-Navigator” (FA-then-NAV), in which teachers were given intensive summer PD in formative assess-ment, then practiced and became familiar with implementing formative assessment, and finally weregiven a second round of intensive PD on using TI-Navigator to facilitate their implementation offormative assessments. The second model was the “formative assessment-and-TI-Navigator” (FA-and-NAV) version: The teachers received intensive PD in using the TI Navigator to implement for-mative assessment, then practiced the strategies in their classrooms, and finally received a secondround of intensive PD reinforcing how to use the TI Navigator to implement formative assessment.Both versions were designed to have a strong content focus, used active learning methods in thePD, were consistent with specifications for high-quality formative assessment, and greatly exceededthe recommended minimum duration.
The rationale for the first version was that it reduced the cognitive load of each PD by teachingteachers the two important components of the PD in sequential steps. It might be easier for teachersto become proficient in formative assessment strategies before having to use and manage new tech-nology than to become proficient managing two new strategies simultaneously. In addition, usingTI-Navigator alone might not be sufficient. Owens, Demana, Abrahamson, Meagher, and Herman(2004) found that teachers in TI-Navigator classes did not necessarily change their instructional pro-cedures based on the information obtained by using the TI-Navigator, even though they were per-ceived to be more responsive to individual learners’ needs, focused on knowledge building andassessment, and community centered. Teachers are more likely to change technology implementa-tion than instructional methods such as using formative assessment strategies (Owens et al., 2008,July). By devoting the first year of PD to formative assessment, teachers might be better at usinginformation collected by the TI-Navigator.
Formative Assessment
Volume 47 Number 1 l Journal of Research on Technology in Education l 43
Dow
nloa
ded
by [
Uni
vers
ity o
f Il
linoi
s C
hica
go]
at 0
9:53
22
Janu
ary
2015

The rationale for the second model was that teachers had the opportunity to learn strategies forformative assessment in the context of using TI-Navigator from the very beginning, with the secondyear of PD enhancing the teachers’ previous learning and giving them the opportunity to becomemore efficient at implementing formative assessment in the networked classroom. In addition, bycombining formative assessment and TI-Navigator training in PD, teachers might be able to learnhow to use the two strategies seamlessly.
In addition to the intensive PDs for each group, we included on-site coaching in each PD version.Previous research has shown that (a) intensive PD is insufficient for teachers to fully grasp newteaching strategies and (b) authentic classroom practice with formative support is needed to helpteachers to truly implement designed treatment (Yin, 2005). Therefore, after the intensive summerPD meetings and between follow-up PDs, the PD developers visited the teachers’ classrooms to pro-vide them with feedback, technical assistance, and pedagogical suggestions to ensure that they hadthe necessary tools to use formative assessment and networked technology with acceptable quality.
Teacher Knowledge and AttitudesWe expected that seven teacher-related constructs could be improved through our PD. Of these con-structs, three are about assessment or formative assessment: knowledge about general assessment,knowledge about formative assessment, and self-efficacy in formative assessment; the other four areabout technology: the perceived value of technology, interest in technology, self-efficacy with gen-eral technology, and confidence in classroom technology.
Heritage (2007) suggested that knowledge of assessment is one of the most important elementsto successfully use formative assessment in the classroom. In addition, Brookhart (2011) proposedthat teachers need to improve formative assessment knowledge and skills. Therefore, in our PD weprimarily emphasized assessment knowledge (e.g., how to select and use assessment tasks), espe-cially formative assessment knowledge (e.g., how to prompt and respond to students’ responses toimprove student learning).
We hypothesized that self-efficacy of using formative assessment would be influenced by the PDas well. According to Bandura’s social learning theory, “Self-efficacy is the belief in one’s capabili-ties to organize and execute the sources of action required to manage prospective situations” (Ban-dura, 1997, p. 2). Dellinger, Bobbett, Olivier, and Ellett (2008) defined teacher self-efficacy as “ateacher’s individual beliefs in their capabilities to perform specific teaching tasks at a specified levelof quality in a specified situation” (p. 752). We suspected teachers with strong teacher self-efficacyin using formative assessment would be more likely to incorporate it in their classrooms. Weexpected that teachers would increase their self-efficacy in using formative assessment as a result ofparticipating in PD activities and seeing the results of using formative assessment.
Besides knowledge and efficacy related to assessment and formative assessment, we also exam-ined teachers’ attitudes toward technology. Researchers have found that attitudes influence teachers’uses of technology in classrooms (Boone & Gabel, 1994; Drijvers, Doorman, Boon, Reed, &Gravemeijer, 2010; Inan & Lowther, 2010; Levine & Donitsa-Schmidt, 1998; Pierce & Ball, 2009).Attitudes influence not only teachers’ adoption but also their future use of technology (Selwyn,1997).
In our study, we particularly focused on four technology constructs:
1. Perceived value of technology. Ropp (1999) suggested that if teachers perceive technology to beuseless in their classrooms, they may be unwilling to teach with technology even if they arefamiliar with it. On the other hand, if teachers believe in the utility of technology in teaching,they may persevere through the challenges that face new technology users.
2. Interest in technology. Researchers consider that interest plays an important role in learning andcan influence teachers’ behavior of integrating technology in teaching (Niederhauser & Perk-men, 2008). The more a teacher is interested in technology, the more likely the teacher is to learnand integrate new technology in his/her classroom.
44 l Journal of Research on Technology in Education l Volume 47 Number 1
Yue et al.
Dow
nloa
ded
by [
Uni
vers
ity o
f Il
linoi
s C
hica
go]
at 0
9:53
22
Janu
ary
2015

3. Self-efficacy with general technology. Like the role played by self-efficacy in other skills,researchers have suggested that teachers must feel efficacious about using technology to usetechnology in their teaching (Dupagne & Krendl, 1992; Ertmer, Evenbeck, Cennarno, & Leh-man, 1994).
4. Self-confidence in classroom technology. This construct is similar but not identical to self-effi-cacy in technology. Self-efficacy with general technology emphasizes teachers’ beliefs abouttheir potential of using “unspecified” technology in teaching, for example, computers in general.Self-confidence in classroom technology emphasizes teachers’ confidence about their currentskills of using the technology involved with the TI-Navigator use, for example, PowerPoint,projector, and graphing calculator. Due to its closer relationship to PD, we suspected that thisconstruct is more likely to be impacted by PD than the self-efficacy with general technology.
Teachers’ Evaluations of PDsWolf (1978) suggested that if researchers aim to achieve socially valuable ends, society should vali-date the work on three levels: (a) the social significance of the study’s goal (are the goals what soci-ety wants?); (b) the social appropriateness of the procedure (do the recipients consider theprocedure’s ethics, cost, and practicality acceptable?); and (c) the social importance of the effects(are the recipients satisfied with the results?). The answers to these questions can be used to judgesocial validity. Wolf emphasized the importance of getting feedback from study participants,because “if the participants don’t like the treatment then they may avoid it, or run away, or complainloudly. And thus, society will be less likely to use our technology, no matter how potentially effec-tive and efficient it might be” (p. 206). In particular, this study addresses the third level of socialvalidity by asking teachers to evaluate the PD—that is, whether recipients are satisfied with theresults (e.g., the degree to which the teachers were satisfied with the PD, the degree to which theywere satisfied with what they learned from the PD, and the version that they preferred). We hypothe-sized that if teachers believed PD was beneficial for their teaching, they would be more likely toengage in PD and use the strategies introduced in PD.
Operationalizing the Research QuestionsWe conducted a randomized block with repeated measures experiment to compare the effects of twoPD models for using formative assessment in a networked classroom. We asked three research ques-tions: First, to what extent did each of the two PD versions improve teachers’ knowledge aboutassessment, self-efficacy about formative assessment, perceived value of technology, interest intechnology, self-efficacy with general technology, and self-confidence in classroom technologyover three years? To answer this question, we tracked the changes in the teachers’ responses to thesurvey questions about the seven constructs within each PD group over the three years, controllingfor their pretest scores.
Second, to what extent did the participation in the PD versions differentially affect the teachers’knowledge about assessment, self-efficacy about formative assessment, perceived value of technol-ogy, interest in technology, self-efficacy with general technology, and self-confidence in classroomtechnology? We compared the two groups on the seven constructs at three time points after control-ling for their pretest scores: after Year 1 PD, after Year 2 PD, and at delayed posttest in Year 3(the year after the second year’s treatment was completed).
Third, what are the evaluations of the teacher participants about the two PD versions? To answerthis question, we surveyed teachers at Year 3 posttest, after the teachers finished the PD and had anadditional year to use the strategies in their teaching.
Method
ParticipantsThirty-two seventh grade mathematics teachers from 15 schools throughout the state of Hawaii andtheir students were recruited to participate in the study. We planned to recruit pairs of teachers from
Volume 47 Number 1 l Journal of Research on Technology in Education l 45
Formative Assessment
Dow
nloa
ded
by [
Uni
vers
ity o
f Il
linoi
s C
hica
go]
at 0
9:53
22
Janu
ary
2015

the same school, so that we would have a blocking variable in which teachers in the same schoolcould be randomly assigned to each of the two conditions to help us control for extraneous varia-bles, such as student background and school context (e.g., teachers’ work load, curriculum, andcommunity support). Due to the availability of schools and teachers, our final sample includedtwo teachers from each of nine schools, one teacher from each of four schools, four teachers (twopairs) from one school, and six teachers (three pairs) from one school. We randomly assignedteachers to the two PD versions in the schools with two, four, or six participants. For thefour schools with only one participant, we matched the schools in pairs on school demographicsand student achievement before we randomly assigned the teacher participants to the two PDversions.
During the study, two teachers unexpectedly dropped from the FA-then-NAV group due tochanges in their school’s teaching assignments. While we allowed their schools to replace the twoteachers with new ones, the data from the new teachers are not included in our analysis becausethey were not involved in the project for the first-year training. In addition, due to the longitudinalfeature, one teacher failed to finish the questionnaires at pretest, and four teachers failed to finishthe posttest 3. Therefore, the sample size varies from 26 to 30 in the analysis. The reduction in thenumber of teachers was unlikely to decrease statistical power substantially.
Fourteen teachers (7 females) in the FA-then-NAV group and 16 teachers (10 females) in theFA-and-NAV group completed the study. Of the 30 teachers, 6 were age 20-–29 years, 12 were age30–39, 5 were age 40–49, 4 were age 50–59, and 3 were age 60 or older. On average, the teachersin the FA-and-NAV group were slightly older than the teachers in the FA-then-NAV group, but thedifference was not statistically significant. Thirteen teachers had bachelor’s degrees, 16 teachershad master’s degrees, and one teacher had a doctoral degree. On average, the teachers in theFA-and-NAV group were more highly educated, but again the difference was not statisticallysignificant.
Design and ProceduresThe study was a three-year experiment (see Table 1). The FA-then-NAV group received PD focus-ing on strategies for formative assessment in Year 1 and received PD on implementing formativeassessment using TI-Navigator in Year 2. In contrast, the FA-and-NAV received PD on strategiesfor implementing formative assessment using TI-Navigator in both Years 1 and 2. To measure theeffects of the two PD versions, we collected questionnaire data at four time points: (a) a pretest atthe beginning of the first year PD, to provide baseline information; (b) Posttest 1 at the end of thefirst school year PD and classroom practice to examine the effect of Year 1 PD; (c) Posttest 2 at theend of the second school year PD and classroom practice to examine the effect of Year 2 PD and theaccumulative effect of the two-year PD; and (d) Delayed Posttest 3 at the end of the third schoolyear to examine whether the effect of PDs was maintained after the PD was concluded.
As part of the treatment, we provided all the teachers with laptop computers, liquid crystal display(LCD) projectors, document cameras, and a classroom set of TI-73 calculators. The teachers in theFA-and-NAV group received their calculators during the first summer training, and the teachers inthe FA-then-NAV group received their calculators during the late fall of the first year. The FA-and-NAV group received the TI-Navigator system during Year 1 summer PD, and the FA-then-NAVgroup received the system during the Year 2 summer PD. Each version of PD in both years includedan intensive summer workshop and five follow-up sessions during the school year, along with in-school coaching. The summer PD for both groups was five days in Year 1 and three days in Year 2.
Table 1. Research Design
Pretest Year 1 PD Post1 Year 2 PD Post2 Post3 (Delayed Posttest)
FA-then-NAV O XFA O XNAV O O
FA-and-NAV O XFA-NAV O XFA-NAV O O
46 l Journal of Research on Technology in Education l Volume 47 Number 1
Yue et al.
Dow
nloa
ded
by [
Uni
vers
ity o
f Il
linoi
s C
hica
go]
at 0
9:53
22
Janu
ary
2015

Professional DevelopmentBefore selecting a formative assessment model, project staff examined research related to forma-tive assessment. Of primary importance was a model that would allow teachers to formativelyassess in real time with networked technology. The model had to also be something with whichteachers could work and feel comfortable and not overwhelming with respect to time to learn anduse (Black & Wiliam, 1998a). Both PDs were comprised of formative assessment models (Ayala& Brandon, 2008; Stiggins, Arter, Chappuis, & Chappuis, 2004), questioning strategies, andmathematics activities primarily for teaching algebra and connected classroom technology,although the actual delivery and focus varied between treatments. The Year 1 PD summer insti-tutes both began by introducing activities intended to highlight distinctions between formativeassessment and other types. The institute facilitators presented a simplified formative assessmentmodel highlighted by three essential questions teachers should ask when implementing formativeassessment practices: (a) Where am I going? (b) Where am I now? (c) How can I get there? (Stig-gins et al., 2004). The PD components were designed to address these questions by focusing onthe knowledge and experiences teachers need to use formative assessments effectively: (a) know-ing the mathematics content, (b) designing the formative assessment tools, (c) using the formativeassessment tools, (d) interpreting the results of the gathered responses, and (e) taking action basedon the results (Ayala & Brandon, 2008). Particular attention was paid to the type of tasks used forformative assessment, questioning and discourse strategies, developing students’ awareness ofassessments, and helping students use information to become reflective of their own progress(Black & Wiliam, 1998a). In Appendix B, we present detailed information about the formativeassessment model.
During the summer PD, the teachers explored the characteristics of “worthwhile mathematicaltasks” (National Council of Teachers of Mathematics [NCTM], 1991) using a task analysis schemeadapted from Stein, Smith, Henningsen, and Silver (2000) on how the cognitive demands of tasksdiffer. Questioning and discourse components of the professional development emphasized formu-lating questions that provide information about students’ thinking and understanding. Rich ques-tioning not only provides teachers with evidence about what their students can do but also suggestswhat to do to broaden or deepen understanding. Following suggestions in the literature (Wiliam,Lee, Harrison, & Black, 2004), the PD provided time for teachers to work with their own curriculato plan formative assessments for teaching the targeted algebra concepts.
The PD for both groups followed parallel models to the extent possible, with the difference beingthat the FA-and-NAV group received the formative assessment model, questioning strategies, andmathematics activities through the use of TI-Navigator in both years. Since the teachers in eachgroup were to learn how to use the technology, significant time for hands-on experiences with thefeatures of TI-Navigator was provided. The hands-on experiences of the technology reduced thetime available for in-depth discussion of formative assessment in Year 1 for the FA-and-NAV groupand in Year 2 for the FA-then-NAV group. The PDs included adaptation of PD materials developedby Texas Instruments and the project team. Five team members delivered the PD in each group. Themembers were researchers and experienced teachers who were familiar with formative assessment,networked technology, and mathematics teaching. In addition, two instructors, certified as TeachersTeaching with Technology by Texas Instruments, participated in planning and delivering the PD,follow-ups, and coaching sessions to address any technical issues.
The entire PD Project team developed the two versions of PD collaboratively; however, two dif-ferent PD teams conducted the summer PD for each group in Year 1. They met with each group indifferent locations during a single time period to limit the interaction between the two groups ofteachers. The follow-up sessions in Year 1 were conducted in a similar manner. The summer PD forboth groups in Year 2 was held in the same location, again conducted by different PD providers dur-ing a single time period, with a few activities presented to both groups by the same PD providers.The same PD providers that delivered the PD in Year 1 conducted the classroom visits and coachingsessions. There were five follow-up sessions in Year 1 and another five in Year 2; each was 4 hours.The coaches followed a similar protocol for the visit, although these were adapted to the needs of
Volume 47 Number 1 l Journal of Research on Technology in Education l 47
Formative Assessment
Dow
nloa
ded
by [
Uni
vers
ity o
f Il
linoi
s C
hica
go]
at 0
9:53
22
Janu
ary
2015

the individual teachers and depended on whether they were using TI-Navigator at the time of thevisit. Appendix C presents the detailed information about the PD training in the two years.
InstrumentsWe developed four instruments to collect survey data from teachers: (a) the School EnvironmentSurvey (Appendix D), which included two constructs about teacher collaboration and four aboutteacher support; (b) the Assessment Survey (Appendix E), which included three constructs onknowledge about assessment in general, knowledge about formative assessment, and self-efficacyin using formative assessment; (c) the Technology Survey (Appendix F), which included four con-structs about teachers’ beliefs about using technology; and (d) the Teacher Evaluation Survey(Appendix G), which included constructs about satisfaction with the PD, using TI-Navigator for for-mative assessment, and the preferred PD version. Five-point Likert-scale items were used for mostperception/belief/evaluation questions, with a few open-ended questions included for furtherclarification.
The initial surveys were developed based on a previous research project in which two authors ofthis article participated (Brandon et al., 2008; Yin et al., 2008) and existing questionnaires fromOwens et al. (2008), specifically used in research on networked mathematics classrooms, as well asother teacher questionnaires such as those used in TIMSS. The initial questionnaires were evaluatedby experts and pilot-tested with 50 non-participating teachers who also taught mathematics. Weimproved the questionnaires based on the feedback from the pilot study before using the question-naires to collect data in this study.
In Table 2, we present a description of when each survey was administered, as well as reliabilitystatistics. Because the school environment was not expected to change as a result of the treatments,the School Environment Survey was only given to the teachers at the first two time points. TheAssessment Survey and the Technology Survey were given to the teachers at all the four time pointsto track the effect of the PD, except for the confidence in classroom technology. This construct wasnot administered at Posttest 3 as planned due to a planning error. The Teacher Evaluation Surveywas given to the teachers only at the end of Year 3, after both PDs and an additional year of practice.
As shown in Table 2, the instruments addressed six constructs about school environment, threeabout teachers’ beliefs about assessment, four about teachers’ attitude toward technology, and threeabout teachers’ evaluation of the PD. We identified and deleted the items with low item-total
Table 2. Alpha Coefficient of Each Construct (N D 30–31)
Construct Number of Items Pretest Posttest 1 Posttest 2 Posttest 3
(a) School environment
Frequency of collaboration 4 .83 .72
Effect of teacher collaboration 3 .88 .93
School support 9 .80 .87
Parent support 5 .69 .72
Student motivation 8 .92 .91
Overall support 8 .84 .83
(b) Assessment-related construct
Knowledge about assessment in general 6 .69 .82 .72 .83
Knowledge about formative assessment 3 .82 .80 .87 .90
Self-efficacy in formative assessment 11 .88 .84 .94 .94
(c) Attitude toward technology
Value of technology 9 .91 .93 .90 .92
Interest in technology 4 .86 .91 .91 .91
Self-efficacy in technology 4 .81 .85 .85 .88
Confidence in using technology 10 .83 .75 .76
(d) Teacher evaluation
Satisfaction of using TI-NAV for FA 3 .97
Satisfaction of the PD 7 .82
Confidence in using TI-NAV for FA 7 .76
48 l Journal of Research on Technology in Education l Volume 47 Number 1
Yue et al.
Dow
nloa
ded
by [
Uni
vers
ity o
f Il
linoi
s C
hica
go]
at 0
9:53
22
Janu
ary
2015

correlations based on all the administrations of the instruments and kept the remaining items. (Theappendices include the final items included in the analysis.) In the final survey, each construct had 3to 10 items, and the alpha coefficients are at the acceptable level, ranging from .69 to .97, all closeto or greater than .70. We used the average score for each construct in the analysis.
ResultsIn this section, we present the results of assumption tests, examine the initial equivalence of the twogroups by comparing their pretest scores, and report the answer to each of the three researchquestions.
Assumption TestsIn most analyses, we used mean comparison techniques, such as t test and analysis of variance(ANOVA) techniques. We tested the assumptions of normality and homogeneity; the assumptionswere met for most dependent variables, that is, the Posttest 1, Posttest 2, and Posttest 3 measures.ANOVA techniques are rather robust to the violation of the two assumptions when cell sizes wereclose. The two treatment groups were randomly assigned and did not have interaction within andacross groups when taking the surveys; therefore, the participants kept their independence. Fromthe independence, normality, and homogeneity results, we considered it appropriate to use paramet-ric mean comparison techniques, such as the t test and ANOVA.
In addition, repeated-measure ANOVAs were conducted to examine the score change in eachgroup over time. In each repeated-measure ANOVA, the constructs measured at different timeswere dependent variables with time as the within-subject factor. We tested the sphericity assumptionfor split-plot ANOVA and found that the assumption was met for all the analyses of the constructs.
Initial Equivalence of the Two Groups: School Environment and PretestsAs suggested earlier, the project was not expected to affect school environment. The results of amultivariate analysis of variance, using the environment scores as dependent variables and group asindependent variable, showed no significant differences between groups on either the pretest orPosttest 1, which supported the validity of the design (i.e., the results of teachers’ random assign-ment to groups). According to the t test results, the two groups did not differ significantly on eachof the six environment pretest scores either, which further confirmed the initial equivalence of thetwo groups. However, multivariate analysis of covariance (MANCOVA) and analysis of covariance(ANCOVA) were still used in the comparison of two groups to statistically adjust any initial differ-ences between the two groups.
Research Question 1
To what extent did each of the two PD versions improve teachers’ knowledge about assessment,self-efficacy about formative assessment, perceived value of technology, interest in technology,self-efficacy with general technology, and self-confidence in classroom technology over threeyears?
Table 3 presents descriptive statistics for the assessment and technology constructs at the fouradministrations for each group and the two groups combined. In the following, we examine first thechanges over time in the assessment constructs, then the technology constructs. The analysis wasconducted for each PD group separately. Due to the small sample size, we use an alpha level of .10as the criterion for hypothesis testing.
Assessment-related constructs. Figures 1a to 1c show the plots of the mean scores of eachgroup on the assessment constructs across the test administrations displayed in Table 3. The FA-then-NAV group kept increasing its mean scores on each of the assessment measures across thefour time points. The FA-and-NAV group also increased its mean score on each of the assessment
Volume 47 Number 1 l Journal of Research on Technology in Education l 49
Formative Assessment
Dow
nloa
ded
by [
Uni
vers
ity o
f Il
linoi
s C
hica
go]
at 0
9:53
22
Janu
ary
2015

measures across four time points except for a drop in the knowledge of general assessment fromPosttest 2 to Posttest 3.
To examine the significance of the changes in mean scores over time, we conducted a series ofrepeated-measure ANOVAs for each PD group, with each construct at different time points as therepeated measures (dependent variables). The within-subject factor, time, included four levels: pre-test, Posttest 1, Posttest 2, and Posttest 3. Table 4 presents the results of the repeated measures foreach group. Overall, time is a significant factor for all the assessment measures in each group. Thatis, the results for the assessment measures changed significantly over time for each group.
Post hoc comparisons were further conducted to examine the changes over time in more detailfor each group. As shown in Table 5, the p value less than the criterion alpha of .10 indicates a sig-nificant difference between two specified years. For the FA-then-NAV group, a significant increaseoccurred from the pretest to Posttest 1 on all the three assessment measures. The increases on theassessment measures after Year 1 PD were expected because this group received intensive trainingon formative assessment in Year 1 PD. Although not statistically significant, further increases oneach assessment construct from Posttest 1 to Posttest 2 and from Posttest 2 to Posttest 3 in Figure 2suggest that the Year 2 PD and the practice in the following year helped teachers gain more forma-tive assessment knowledge and higher self-efficacy in formative assessment. This pattern is consis-tent with what is emphasized by Black and Wiliam (1998b): It takes time for teachers to find theirown way of implementing formative assessment effectively in their classroom.
In contrast, the FA-and-NAV group only significantly increased their knowledge about assessmentin general from the pretest to Posttest 1. They did, however, significantly increase their knowledgeabout formative assessment and self-efficacy in formative assessment from Posttest 1 to Posttest 2(Figure 1 and Table 4). This pattern is not surprising, because in Year 1 PD the FA-and-NAV groupwas learning about both formative assessment and how to use the features of TI-Navigator
Table 3. Descriptive Statistics of the Outcome Variables
Group
Knowledge
about
General
Assessment
Knowledge
About FA
FA
Self-Efficacy
Value of
Technology
Interest in
Technology
Self-efficacy of
General
Technology
Confidence in
Classroom
Technology
Pretest
FA-then-NAV M 3.73 3.41 3.70 4.08 4.82 4.46 3.45
n D 13 SD .42 .36 .33 .47 .33 .42 .97
FA-and-NAV M 3.68 3.57 3.80 4.05 4.80 4.17 3.24
n D 16 SD .37 .59 .55 .57 .38 .47 .79
Total M 3.70 3.49 3.75 4.06 4.81 4.30 3.33
n D 29 SD .38 .49 .45 .51 .35 .46 .86
Posttest 1
FA-then-NAV M 4.08 3.86 3.97 4.62 4.95 4.43 3.63
n D 14 SD .50 .48 .35 .43 .14 .59 .56
FA-and-NAV M 3.97 3.67 3.94 4.14 4.41 4.13 3.57
n D 15 SD .36 .52 .39 .55 .59 .63 .74
Total M 4.02 3.76 3.95 4.38 4.68 4.28 3.59
n D 29 SD .43 .50 .37 .54 .50 .62 .64
Posttest 2
FA-then-NAV M 4.21 4.11 4.09 4.47 4.66 4.41 4.13
n D 14 SD .34 .43 .46 .46 .46 .52 .48
FA-and-NAV M 4.17 4.10 4.20 4.46 4.59 4.30 3.90
n D 16 SD .27 .59 .41 .56 .61 .65 .68
Total M 4.19 4.11 4.15 4.46 4.63 4.35 4.00
n D 30 SD .30 .47 .53 .50 .54 .58 .59
Posttest 3
FA-then-NAV M 4.22 4.23 4.17 4.50 4.58 4.50
n D 13 SD .50 .42 .55 .41 .48 .50
FA-and-NAV M 4.03 4.18 4.25 4.48 4.37 4.37
n D 13 SD .29 .48 .50 .51 .56 .56
Total M 4.13 4.21 4.21 4.49 4.47 4.43
n D 26 SD .41 .52 .47 .46 .53 .53
50 l Journal of Research on Technology in Education l Volume 47 Number 1
Yue et al.
Dow
nloa
ded
by [
Uni
vers
ity o
f Il
linoi
s C
hica
go]
at 0
9:53
22
Janu
ary
2015

simultaneously. It took time for the FA-and-NAV group members to increase their knowledge andself-efficacy about formative assessment due to the smaller dosage of formative assessment trainingin Year 1 PD. However, the knowledge about general assessment might be easier to gain than theknowledge about formative assessment and self-efficacy in formative assessment.
From Posttest 2 to Posttest 3, no significant changes occurred for either group on any assessmentmeasures. This result suggests that the effects on all assessment measures of the PD were
(a)
(b)
(c)
3
3.5
4
4.5
5
Pretest Posttest 1 Posttest 2 Posttest 3
Kn
ow
led
ge
abo
ut
Gen
eral
Ass
essm
ent
FA-then-NAV
FA-and-NAV
3
3.5
4
4.5
5
Pretest Posttest 1 Posttest 2 Posttest 3Kn
ow
led
ge
abo
ut
Fo
rmat
ive
Ass
essm
ent
FA-then-NAV
FA-and-NAV
3
3.5
4
4.5
5
Pretest Posttest 1 Posttest 2 Posttest 3
Sel
f-E
ffic
acy
of
FA
FA-then-NAV
FA-and-NAV
Figure 1. Mean plots of assessment related constructs for the two groups over time.
Volume 47 Number 1 l Journal of Research on Technology in Education l 51
Formative Assessment
Dow
nloa
ded
by [
Uni
vers
ity o
f Il
linoi
s C
hica
go]
at 0
9:53
22
Janu
ary
2015

maintained even after the PD was concluded. As shown in Table 4, in the comparison of the Posttest3 and pretest scores, both groups significantly improved their scores on both formative assessmentmeasures; however, the FA-then-NAV group members improved their scores on these measures at ahigher magnitude.
Technology-related constructs. Figures 2a–2c show the plots of the mean scores of each groupon the technology constructs across the test administrations displayed in Table 3, except for confi-dence in classroom technology, which was not measured in Posttest 3. As shown in Figures 2a–2c,the pattern in score changes on the technology constructs across time was not as consistent onassessment measures. Different groups and different constructs have different change patternsacross time. To examine the significance of the changes, repeated-measure ANOVAs and corre-sponding post hoc comparisons were conducted with the constructs at different time points as therepeated measures.
As shown in Table 4, for the FA-then-NAV group, time was a significant factor for all the meas-ures except for self-efficacy in technology. Post hoc comparisons further showed that for theFA-then-NAV group, from the pretest to Posttest 1 the value of technology increased significantly.From Posttest 1 to Posttest 2 (after the introduction to the new technology), the interest in technol-ogy significantly dropped, while the confidence in class technology significantly increased. Becausethe FA-then-NAV group started the TI-Navigator technology training in Year 2 PD, a significantincrease on confidence in classroom technology was expected from Posttest 1 to Posttest 2. How-ever, unexpectedly, this group significantly decreased its interest in technology after receiving theTI-Navigator technology PD in Year 2. This pattern suggests that this group might have had a highexpected value of technology before it was given this technology, but the group interest in technol-ogy might have been dampened by the introduction of new and more challenging technology that
Table 4. Repeated-Measures Analysis Results on Each Construct for Each Group
Construct Group Time
Post 1 vs.
Pre
Post2 vs.
Post1
Post3 vs.
Post2
Last Post
vs. Pre
Knowledge about general assessment FA-then-NAV 6.04** 7.98*" 0.79 0.32 15.34**"FA-and-NAV 4.91* 4.91*" 2.24 1.49 4.25C"
Knowledge about FA FA-then-NAV 9.97** 6.48*" 2.47 0.51 35.20**"FA-and-NAV 4.19* .18 3.69C" 0.50 5.90*"
Self-efficacy in FA FA-then-NAV 4.93** 3.67C" 2.26 0.35 12.57**"FA-and-NAV 3.62* 0.69 4.94C" 0.03 3.37C"
Value of technology FA-then-NAV 4.84** 16.51**" 1.84 0.00 4.90*"FA-and-NAV 5.30** 1.43 3.88C" 0.69 8.44*"
Interest in technology FA-then-NAV 3.10* 1.94 5.50*# 0.10 5.01*#FA-and-NAV 2.16 1.09 4.38C" 8.26*# 2.33
Self-efficacy with general technology FA-then-NAV 0.16 0.29 0.00 0.53 0.14
FA-and-NAV 1.48 0.01 2.95 0.64 1.71
Confidence in class technology FA-then-NAV 8.39** 1.56 14.26**" 10.79**"FA-and-NAV 6.09** 1.19 17.84**" 21.14**"
Note. All the statistics in the table are F test; " represents a significant increase, # represents a significant decrease.**p < .01; *p < .05; Cp < .10.
Table 5. Teachers’ Perception of PD and TI-NAV
Construct Group Mean SD Cohen’s d
Confidence in using TI-NAV FA-then-NAV 4.01 0.59 –0.47
FA-and-NAV 4.28 0.55
Satisfaction with PD FA-then-NAV 4.15 0.32 –0.18
FA-and-NAV 4.23 0.56
Satisfaction with TI-NAV for FA FA-then-NAV 3.82 1.24 –0.48
FA-and-NAV 4.31 0.73
Note. Cohen’s d is calculated as the FA-then-NAV group minus the FA-and-NAV group.
52 l Journal of Research on Technology in Education l Volume 47 Number 1
Yue et al.
Dow
nloa
ded
by [
Uni
vers
ity o
f Il
linoi
s C
hica
go]
at 0
9:53
22
Janu
ary
2015

required another shift in classroom practice on top of a shift in formative assessment practice imple-mented in the first year. During the first year, the technology that the teachers in the FA-then-NAVgroup received and most widely used included a computer, a visualizer, and a projector. Each ofthese was relatively easy to set up and use as part of instruction; meanwhile, they could bring conve-nience to teaching right away. Therefore, this might have led to a higher interest in technology of theFA-then-NAV group at the end of first year. However, the new technology introduced in the second
(a)
(b)
(c)
3
3.5
4
4.5
5
Pretest Posttest 1 Posttest 2 Posttest 3
Val
ue
of
Tec
hn
olo
gy
FA-then-NAV
FA-and-NAV
3
3.5
4
4.5
5
Pretest Posttest 1 Posttest 2 Posttest 3
Inte
rest
in
Tec
hn
olo
gy
FA-then-NAV
FA-and-NAV
3
3.5
4
4.5
5
Pretest Posttest 1 Posttest 2 Posttest 3
Sel
f-ef
fica
cy i
n T
ech
no
log
y
FA-then-NAV
FA-and-NAV
Figure 2. Mean plots of technology related constructs for the two groups over time.
Volume 47 Number 1 l Journal of Research on Technology in Education l 53
Formative Assessment
Dow
nloa
ded
by [
Uni
vers
ity o
f Il
linoi
s C
hica
go]
at 0
9:53
22
Janu
ary
2015

year required a big shift in classroom technology practice as well as a shift in formative assessmentpractice implemented in the first year, which might have dampened teachers’ interest in technology.
For the FA-and-NAV group, time made a significant difference in the value of technology and theconfidence in class technology. In particular, the FA-and-NAV group significantly increased itsvalue of technology and confidence in classroom technology from Posttest 1 to Posttest 2 (after theirYear 2 PD). The fact that the FA-and-NAV group did not significantly increase any technologymeasures from the pretest to Posttest 1 (after Year 1 PD), when it was introduced to the TI-Naviga-tor along with other technology in Year 1 PD, suggests that learning a lot of new technology mightbe challenging for teachers. Consequently, its members might not have appreciated the value oftechnology, showed increases in their interest, or showed increases in their confidence soon afterthey receive the TI-Navigator technology training. The delayed increase on these technology con-structs indicates that it may take time for teachers to get used to and benefit from this technology.
Confidence in classroom technology should be correlated with self-efficacy in technology. How-ever, overall self-efficacy with general technology did not change significantly for either group overtime, while both groups significantly increased their confidence in classroom technology after PD.A reason for the discrepancy might be that the confidence in classroom technology measure isclosely related to the technology needed by the TI-Navigator, which is more sensitive to the PDthan is general technology.
After the PD was concluded, no scores on the technology measures changed significantly fromPosttest 2 to Posttest 3. Again, the pattern shows that the effect of PD was maintained in the delayedposttest. Overall, comparing Posttest 3 with the pretest (Table 4), both groups significantlyincreased their value of technology, but the FA-then-NAV group significantly decreased its interestin technology. The data on confidence in classroom technology was not collected at Posttest 3, butup to Posttest 2, both groups significantly increased their confidence in classroom technology.
Research Question 2
To what extent did the participation in the two PD versions differentially affect teachers’ knowl-edge about assessment, perceived value of technology, interest in technology, self-efficacy withgeneral technology, and self-confidence in classroom technology over three years?
Assessment-related constructs. To examine the differences between the two groups’ results onthe assessment scales, we used a series of MANCOVAs with each posttest as the dependent varia-bles, with PD version as the between-subject factor, and with the corresponding pretests as covari-ates. The MANCOVA results show that the teachers in the two PD conditions did not differ on thecombined assessment constructs on any posttest after controlling for their scores on the assessmentconstructs at pretest.
The results of ANCOVAwith each posttest as dependent variable and the corresponding pretestas covariate and group as between-subject factor showed that the FA-then-NAV group scored signif-icantly higher than the FA-and-NAV group on the knowledge of formative assessment at Posttest 1after controlling for their pretest knowledge of formative assessment, F(1, 25) D 3.94, p D .059, h2
D .15, as shown in Figure 1b. This pattern was expected, because the knowledge about formativeassessment was the primary focus of the Year 1 PD, the follow-ups, and coaching sessions for theFA-then-NAV group in Year 1, while the PD for the FA-and-NAV group spent substantial time andeffort on learning how to use the TI-Navigator in addition to how to implement formative assess-ment strategies. However, besides knowledge of formative assessment at posttest 1, the two groupsdid not differ significantly on any assessment-related measures at any time after controlling for thecorresponding pretest score.
Technology-related constructs. A series of MANCOVAs was conducted with the technologyconstructs on each posttest as dependent variables, with the technology constructs on the pretest ascovariate and group as the between-subject factor. The results for the three technology constructs
54 l Journal of Research on Technology in Education l Volume 47 Number 1
Yue et al.
Dow
nloa
ded
by [
Uni
vers
ity o
f Il
linoi
s C
hica
go]
at 0
9:53
22
Janu
ary
2015

show that the two PD groups only differ significantly at Posttest 1 after controlling for pretestscores, Wilks’s lambda D .60, F (3, 18) D 4.07, p D .023, h2 D .40.
Univariate ANCOVAs with each Posttest 1 score as the dependent variables, group as thebetween-subject factor, and the pretest as a covariate further showed that the FA-then-NAV groupscored significantly higher than the FA-and-NAV group on perceived value of technology, F(1, 22)D 9.53, p D .005, h2 D .30, as well as interest in technology, F(1, 23) D 11.34, p D .003, h2 D .38.Interestingly, even though the FA-and-NAV group teachers received more technology training inYear 1 PD, their mean on the perceived value of technology and interest in technology was lowerthan those of the FA-then-NAV group at Posttest 1. As discussed earlier, the drop or delayedincrease on technology measures for the FA-and-NAV at the end of Year 1 PD might be due to thechallenge from the new TI-Navigator technology.
The two groups did not differ significantly at Posttest 2 or Posttest 3. The two groups did not dif-fer significantly on self-efficacy in technology or confidence in classroom technology at any timeeither.
In sum, the FA-then-NAV group scored significantly higher than the FA-and-NAV group onknowledge about formative assessment (Figure 2b), value of technology at Posttest 1 (Figure 2a),and interest in technology (Figure 2b) at Posttest 1 after controlling for pretest scores. However, thetwo groups reached the same level at Posttest 2 and Posttest 3. Thus, the cumulative effects of twoPD versions after two years were the same, and the results showed no statistical differences betweengroups.
Research Question 3
What were the teacher participants’ evaluations of the two versions of PD?
We measured teachers’ evaluation of the two PDs at the end of Year 3. Table 5 presents the meanand standard deviation of each measure as well as Cohen’s d of the mean comparison. The maxi-mum score on the evaluation scale is 5 (strongly agree); any score at 4 or higher shows agreement.As most average scores were higher than 4, we conclude that overall, the teachers in both groupswere satisfied with the PD, felt confident about using TI-Navigator to implement formative assess-ment, and appreciated the function of TI-Navigator in implementing formative assessment. On aver-age, the FA-and-NAV group scored consistently higher than the FA-then-NAV group on all theconstructs. However, both a MANOVA and two independent sample t tests showed that the differ-ence was not statistically significant.
We also asked each teacher to vote for their preferred PD version: FA-then-NAV, NAV-then-FA,FA-and-NAV, and others. As shown in Table 6, FA-and-NAV got the most votes, as 56% of partici-pants preferred it. FA-then-NAV and NAV-then-FA got equal votes: 19% of participant preferredeach respectively.
Teachers were asked why they preferred the version they chose. The majority of teachers pre-ferred FA-and-NAV for one or more of three reasons: (a) the combination of formative assessmentand TI-Navigator was effective in improving their teaching; (b) it took more time and effort to usethe calculators and Navigator system than to master formative assessment; or (c) it was helpful toget assistance with the Navigator for longer time.
Table 6. Teachers’ Preference of PD Models
Model FA-then-NAV FA-and-NAV Total
FA-then-NAV 3 2 5
NAV-then-FA 1 4 5
FA-and-NAV 9 6 15
Other 1 1 2
Total 14 13 27
Volume 47 Number 1 l Journal of Research on Technology in Education l 55
Formative Assessment
Dow
nloa
ded
by [
Uni
vers
ity o
f Il
linoi
s C
hica
go]
at 0
9:53
22
Janu
ary
2015

Thirty-eight percent of teachers preferred having PD on a single focus first, followed by asecond focus. Those who preferred the FA-then-NAV version felt that learning about formativeassessment before using the TI-Navigator can give more insight on how to use the TI-Navigator forformative assessment more effectively. Some teachers indicated that they would have preferredthe NAV-then-FA version, even though this was not a version used in the study. The reasons givenby these teachers, however, are similar to those who preferred FA-then-NAV. They explained that ittakes time to get used to the new technology and that, once acquainted with using and learningnew technology, using it for formative assessments would be easier to create and implement.The reasons given indicate that learning one component first, whether TI-Navigator or formativeassessment, would provide them with knowledge to better accommodate learning the secondcomponent later.
Even though teachers indicated different preferences for the PD versions, overall the teachersseemed to agree that TI-Navigator is more challenging than formative assessment strategies. Mostteachers preferred to have more time learning about TI-Navigator either before, during, or after theylearn formative assessment strategies. Implementing formative assessment strategies may providea great context for teachers to learn TI-Navigator. That might be why the majority of teacherspreferred FA-and-NAV, which allows them to learn both strategies simultaneously and withextended time.
Discussion
Key FindingsIn this study, we tracked and compared two groups’ change on assessment and technology-relatedconstructs over three years. At the end of the study, both groups significantly increased their scoreson knowledge about general assessment, knowledge about formative assessment, self-efficacy informative assessment, value of technology, and confidence in classroom technology. However, thetwo groups followed different trajectories. The FA-then-NAV significantly increased scores on fourof seven measures after Year 1 PD, while the FA-and-NAV significantly increased scores on five ofseven measures from Post 1 to Post 2, after Year 2 PD. Specifically, the FA-then-NAV group signifi-cantly increased its scores on all the assessment related measures and value of technology after Year1 PD. In contrast, while the FA-and-NAV group only significantly increased its knowledge aboutgeneral assessment after Year 1 PD; members significantly increased their knowledge about forma-tive assessment, self-efficacy in formative assessment, value of technology, interest in technology,and confidence in classroom technology from Post 1 to Post 2, after Year 2 PD.
Overall, both versions were effective in increasing the two groups’ scores on most measures. Inaddition, both groups continued to increase their scores on some constructs after Year 2 PD, indicat-ing the importance of Year 2 PD. Finally, after the two-year PD ended, except that FA-and-NAVteachers’ interest in technology dropped significantly from Post 2 to Post 3, no significant changewas found on any construct. That is, overall, the improvement on those constructs was maintainedafter the two-year PD ended.
The FA-then-NAV group, which received more FA training in Year 1 than the FA-and-NAVgroup, scored significantly higher on knowledge of formative assessment after Year 1. By contrast,the FA-and-NAV group, which used more technology than the FA-then-NAV group in Year 1, didnot score higher on the technology-related constructs than the FA-then-NAV group after Year 1. Infact, when both groups were first introduced to the TI-Navigator (FA-and-NAV group in Year 1 andFA-then-NAV group in Year 2), their interest in technology dropped. However, the FA-and-NAVgroup increased their interest in technology from Year 1 to Year 2. During this time they had onemore year to integrate the technology into their teaching. The FA- then-NAV group might haveincreased their interest in technology after receiving more training to integrate the technology intotheir teaching. We suspect that due to the challenges of learning the features of the TI-Navigatorand changing their classroom practice to integrate the technology, teachers need more time to getcomfortable using formative assessment in a connected classroom.
56 l Journal of Research on Technology in Education l Volume 47 Number 1
Yue et al.
Dow
nloa
ded
by [
Uni
vers
ity o
f Il
linoi
s C
hica
go]
at 0
9:53
22
Janu
ary
2015

The results highlight the importance of Year 2 PD. The Year 2 PDs significantly improved FA-and-NAV teachers’ knowledge about and self-efficacy in formative assessment, value in technology, andconfidence in technology. In addition, the Year 2 PD helped the FA-and-NAV group regain their interestin technology, which might have been dampened in Year 1 due to the challenges FA-and-NAV teachershad with learning the new technology and changing their classroom practices accordingly. The Year 2PDs also significantly increased the FA-then-NVA group’s confidence in classroom technology.
On average, teachers in the FA-and-NAV group reported higher satisfaction than the teachers inthe FA-then-NAV group, although the difference was not statistically significant. Overall, the major-ity of the teachers in both groups indicated that they preferred the FA-and-NAV PD, partiallybecause they considered implementing the required technology more challenging than formativeassessment and more demanding of time and effort.
Implications for Theory, Method, and PracticeThe results of our study have several implications for theory, method, and practice. We discuss theseimplications here in light of some observations and insights that we gained during the course of theproject.
Theoretical contribution. This study helps the field better understand in-service teachers’learning processes. During our study, research on the framework of Technological PedagogicalContent Knowledge (TPACK) in K–12 classrooms (Koehler & Mishra, 2009; Mishra & Koehler,2006) was in its initial stages. Much of the early TPACK work, as well as other research conductedat the same time as our study, focused on preservice teachers’ general use of technology in theirteacher preparation courses (Abbitt, 2011; Niess, 2005; Schmidt et al., 2009) or online (Archam-bault & Barnett, 2010). Our study increased our knowledge about in-service teachers integratingtechnology into the teaching of mathematics.
In particular, this study highlights the challenges facing teachers when they use a new technologythat requires changes in their classroom practice. We found that it took more time and effort forteachers to increase their scores on the technology measures than the assessment measures. Theresearch literature suggests that the integration of technology into mathematics teaching should beviewed as an evolution rather than a revolution and that teachers are learners moving toward deeperunderstanding of what it means to use mathematics technology effectively with students (Drijverset al., 2010; Zbiek & Hollebrands, 2008). That might explain why the majority of the teachers pre-ferred the FA-and-NAV version of the PD, a choice that allowed opportunities to learn and practicethe new technology over a longer period of time.
In addition, we found that after teachers see the results of implementing the PD strategies in theirteaching practice, they are more likely to appreciate the PD strategies and continue with learningand using the strategies. As a teacher commented:
I would have thought technology [would] be difficult to learn, being one more thing to beexposed to, but they’ve [the students] embraced it and used it as a tool to help their learning.When I see their excitement to learn math through this mode, it makes me more excited toadvance my knowledge.
Methodological contribution. Abbitt (2011) noted that valid and reliable tools are needed forassessing teacher knowledge of technology in teaching and learning. In our study, instruments weregenerated and validated to systematically measure the critical constructs about teachers’ learningabout formative assessment and technology; these can be used in future studies. In addition, the dif-ference in trajectories found between the two PD versions shows the value of longitudinal data col-lection when studying PD programs.
Practical contribution. The findings of the study provide several important results about thedevelopment of PD, especially when teachers need to learn new teaching strategies assisted by newtechnology. First, our study highlights the importance of sustained, classroom-situated PD. As
Volume 47 Number 1 l Journal of Research on Technology in Education l 57
Formative Assessment
Dow
nloa
ded
by [
Uni
vers
ity o
f Il
linoi
s C
hica
go]
at 0
9:53
22
Janu
ary
2015

teachers observed that their students embraced the technology and were more engaged in learningwith the technology, they were more motivated to learn from the Year 2 PD. The two-year PD alsomade teachers recognize that it takes time and practice to learn new instructional strategies assistedwith technology. As suggested by a teacher, “It was helpful to get assistance with the navigator twoyears in a row . . . how to use the system effectively for formative assessment takes time.” Teachersmade further improvement on several measures through Year 2 PD, maintained gains one year afterproject completion, and showed satisfaction with the two-year PD overall.
Second, on-site coaching in our study was critical in helping teachers master the new strategies.The opportunities for “hands-on” work linked to teachers’ experiences produce a sense of efficacy(Blank & de las Alas, 2009; Garet, Porter, Desimone, Birman, & Yoon, 2001). In particular, ourcoaching was participatory rather than evaluative. Coaches provided support and assistance whenteachers implemented a new feature of the technology or strategy for formative assessment. Thiswas particularly helpful for teachers who were uncomfortable using technology in general andfound implementing TI-Navigator for formative assessment challenging. Typically, we discussedwith teachers prior to their teaching a lesson about their plans for how to use formative assessmentstrategies and/or TI-Navigator to improve their lessons. We also talked with the teachers to helpthem reflect on their strength, weakness, and difficulties in efficiently using TI-Navigator for forma-tive assessment so that we could help them solve the problems in a timely manner.
Finally, it seemed important for teachers to share and discuss their classroom practices duringPD. Teachers in our study valued opportunities to collaborate with and learn from each other. Thefollow-ups during the academic year provided opportunities for teacher-to-teacher discussions aboutimplementing new instructional strategies and for hearing how other teachers were implementingTI-Navigator for formative assessment. Collaboration among teachers helped them greatly to placethe PD in the context of classroom practice where teachers could try strategies, decide how newideas would enhance their teaching practice, and solve problems entered in using the strategies. Asone teacher wrote in our survey:
The opportunity to discuss ideas and strategies with other exceptional teachers across the statewas brilliant. Every session has given me a chance to understand more about the pedagogy ofteaching math, intellectually stimulated my own understanding of math concepts and moti-vated me to initiate conversations with more math teachers.
Limitations of the Study and Recommendations for Future ResearchIn this study, we only compared the two versions of PD on teachers’ self-reported beliefs and evalu-ations of the PD. While teachers’ teaching behavior was recorded in our informal coaching notesand case-study observations (Slovin, Olson, & Olson, 2011, 2012), these data were not collectedand recorded for a systematic comparison of the two PD versions. Future research should comparedifferent PD versions by examining teachers’ behavior measures—for example, how teachersimplement the learned teaching strategy in their networked classrooms. In addition, as one of themost important goals of educational research, student achievement data should be comparedbetween PD versions as another indicator for the effectiveness of two PDs—a topic we haveaddressed elsewhere (Olson et al., 2010).
In this study, we only explored the technology used to facilitate the implementation of formativeassessment in mathematics classrooms. Technology can be used to facilitate many other instruc-tional strategies and in other content areas as well. Other PD versions should be explored for otheruse of technology in classrooms. No matter how promising an innovation is, it cannot benefit teach-ers and consequently their students until the teachers can master the innovation skillfully. Therefore,it is critical to design and provide effective PD, with sufficient time to learn new technologies, forhelping teachers learn before they can help students learn.
Received: 7/10/12Initial decision: 11/14/13
Revised manuscript accepted: 12/17/13
58 l Journal of Research on Technology in Education l Volume 47 Number 1
Yue et al.
Dow
nloa
ded
by [
Uni
vers
ity o
f Il
linoi
s C
hica
go]
at 0
9:53
22
Janu
ary
2015

Acknowledgments. The authors thank Thuy La and Brian Lawton for their assistance in collect-ing and entering data. The authors also owe thanks for valuable comments and suggestions from theeditor and anonymous referees of Journal of Research on Technology in Education. All viewsexpressed and any remaining errors, however, are the authors’ alone.
Declaration of Conflicting Interests. We declare no potential conflicts of interest with respectto the research, authorship, and/or publication of this article.
Funding. The research reported in this article was supported by a grant from the National Sci-ence Foundation (DRL–0723953). The content is solely the responsibility of the authors and doesnot necessarily represent the official views of the National Science Foundation.
Author NotesYue Yin is an associate professor in the Department of Educational Psychology at the University ofIllinois at Chicago. Her research interests focus on student assessments used in science, mathemat-ics, and statistics education. Her recent research involves concept mapping assessment, formativeassessment, and concept inventory. Please address correspondence regarding this article to Yue Yin,College of Education, University of Illinois at Chicago, 1040 Harrison Street, Chicago, IL 60607,USA. E-mail: [email protected].
Judith Olson is a senior researcher in the Curriculum Research & Development Group at the Uni-versity of Hawaii at Manoa. Her research interests focus on integration of technology into the teach-ing and learning of mathematics, formative assessment, professional development, and equity ofopportunities for all students to learn mathematics.
Melfried Olson is an associate professor of Mathematics Education in the Curriculum Research &Development Group at the University of Hawaii at Manoa. His research interests focus on formativeassessment, curriculum development, and mathematical problem solving, thinking, and reasoning.
Hannah Slovin is an associate professor of mathematics education in the Curriculum Research &Development Group at the University of Hawaii at Manoa. Her research interests focus on mathe-matics curriculum and learning, formative assessment, and professional development for teachers.
Paul R. Brandon is a professor in the Curriculum Research & Development Group at the Universityof Hawaii at Manoa. His research interests are validity in educational research and program evalua-tion, research on evaluation, and fidelity of implementation.
ReferencesAbbitt, J. C. (2011). A case study investigation of student use of technology tools in a collaborative learning project. Journal
of Technology Integration in the Classroom, 2(1), 5–14.Archambault, L. M., & Barnett, J. H. (2010). Revisiting technological pedagogical content knowledge: Exploring the TPACK
framework. Computers & Education, 55(4), 1656–1662.Ayala, C. C., & Brandon, P. R. (2008). Building evaluation recommendations for improvement: Insights from student forma-
tive assessments. In N. L. Smith & P. R. Brandon (Eds.), Fundamental issues in evaluation (pp. 159–166). New York, NY:Guilford.
Bandura, A. (1997). Self-efficacy: The exercise of control. New York, NY: Freeman.Black, P., Harrison, C., Lee, C., Marshall, B., & Wiliam, D. (2004). Working inside the black box: Assessment for learning in
the classroom. Phi Delta Kappan, 86(1), 8–21.Black, P., & Wiliam, D. (1998a). Assessment and classroom learning. Assessment in Education, 5(1), 7–74.Black, P., & Wiliam, D. (1998b). Inside the black box: Raising standards through classroom assessment. Phi Delta Kappan,
80(2), 139–148.Blank, R. K., & de las Alas, N. (2009). Effects of teacher professional development on gains in student achievement: How
meta analysis provides evidence useful to education leaders. Washington, DC: Council of Chief State School Officers.Boone, W., & Gabel, D. (1994). Computers and preservice elementary science teacher education. Journal of Computers in
Mathematics and Science Teaching, 13(1), 17–42.Brandon, P., Young, D. B., Shavelson, R. J., Jones, R., Ayala, C. C., Ruiz-Primo, M. A., . . . Furtak, E. M. (2008). Lessons
learned from the process of curriculum developers’ and assessment developers’ collaboration on the development ofembedded formative assessments. Applied Measurement in Education, 21(4), 390–402.
Volume 47 Number 1 l Journal of Research on Technology in Education l 59
Formative Assessment
Dow
nloa
ded
by [
Uni
vers
ity o
f Il
linoi
s C
hica
go]
at 0
9:53
22
Janu
ary
2015

Bransford, J. D., Brown, A. L., & Cocking, R. R. (Eds.). (2000). How people learn: Brain, mind, experience, and school.Washington, DC: National Academy Press.
Brookhart, S. M. (2011). Educational assessment knowledge and skills for teachers. Educational Measurement: Issues andPractice, 30(1), 3–12.
Dellinger, A. B., Bobbett, J. J., Olivier, D. F., & Ellett, C. D. (2008). Measuring teachers’ self efficacy beliefs: Developmentand the use of the TEBS-Self. Teaching and Teacher Education, 24, 751–766.
Desimone, L. (2009). Improving impact studies of teachers’ professional development: Toward better conceptualizations andmeasures. Educational Researcher, 38(3), 181–199.
Drijvers, P., Doorman, M., Boon, P., Reed, H., & Gravemeijer, K. (2010). The teacher and the tool: Instrumental orchestra-tions in the technology-rich mathematics classroom. Educational Studies in Mathematics, 75, 213–234.
Dupagne, M., & Krendl, K. A. (1992). Teachers’ attitudes toward computers: A review of the literature. Journal for Researchon Computing in Education, 24(3), 420–429.
Ertmer, P. A., Evenbeck, E., Cennarno, K. S., & Lehman, J. D. (1994). Enhancing self-efficacy for computer technologiesthrough the use of positive classroom experiences. Education Technology Research Development, 42(3), 45–62.
Fixsen, D. L., Naoom, S. F., Blase, K. A., Friedman, R. M., & Wallace, F. (2005). Implementation research: A synthesis of theliterature. Tampa, FL: University of South Florida, Louis de la Parte Florida Mental Health Institute, The National Imple-mentation Research Network.
Furtak, E. M., Ruiz-Primo, M. A., Shemwell, J. S., Ayala, C. C., Brandon, P., Shavelson, R. J., & Yin, Y. (2008). On the fidel-ity of implementing embedded formative assessments and its relation to student learning. Applied Measurement in Educa-tion, 21(4), 360–389.
Garet, M. S., Porter, A. C., Desimone, L., Birman, B. F., & Yoon, K. S. (2001). What makes professional development effec-tive? Results from a national sample of teachers. American Educational Research Journal, 38(4), 915–945.
Heritage, M. (2007). Formative assessment: What do teachers need to know and do? Phi Delta Kappan, 89(2), 140–145.Inan, F. A., & Lowther, D. L. (2010). Factors affecting technoloty integration in K–12 classrooms: A path model. Education
Technology Research Development, 58, 137–154.Koehler, M. J., & Mishra, P. (2009). What is technological pedagogical content knowledge? Contemporary Issues in Technol-
ogy and Teacher Education, 9(1), 60–70.Levine, T., & Donitsa-Schmidt, S. (1998). Computer use, confidence, attitudes, and knowledge: A causal analysis. Computers
in Human Behavior, 14, 125–146.Mishra, P., & Koehler, M. J. (2006). Technological pedagogical content knowledge: A framework for integrating technology
in teacher knowledge. Teachers College Record, 108(6), 1017–1054.National Council of Teachers of Mathematics. (1991). Professional standards for school mathematics. Reston, VA: National
Council of Teachers of Mathematics.Niederhauser, D. S., & Perkmen, S. (2008). Validation of the intrapersonal technology integration scale: Assessing the influ-
ence of intrapersonal factors that influence technology integration. Computers in the Schools, 25(1/2), 98–111.Niess, M. L. (2005). Preparing teachers to teach science and mathematics with technology: Developing a technology peda-
gogical content knowledge. Teaching and Teacher Education, 21(5), 509–523.Olson, J., Im, S., Slovin, H., Olson, M., Gilbert, M., Brandon, P., & Yin, Y. (2010, October). Effects of two different models
of professional development on students’ understanding of algebraic concepts. Paper presented at the annual conference ofthe North American Chapter of the International Group for the Psychology of Mathematics Education, Columbus, OH.
Owens, D. T., Demana, F., Abrahamson, A. L., Meagher, M., & Herman, M. (2004). Developing pedagogy for wireless cal-culator networks and researching teacher professional development. Washington, DC: ERIC.
Owens, D. T., Pape, S. L., Irving, K. E., Sanalan, V., Boscardin, C. K., & Abrahamson, L. (2008, July). The connected alge-bra classroom: A randomized control trial. Paper presented at the Eleventh International Congress on Mathematics Educa-tion, Monterrey, Mexico.
Pierce, R., & Ball, L. (2009). Perceptions that may affect teachers’ intention to use technology in secondary mathematics clas-ses. Educational Studies in Mathematics, 71, 299–317.
Ropp, M. M. (1999). Exploring individual characteristics associated with learning to use computers in preservice teacherpreparation. Journal of Research on Computing in Education, 31, 402–419.
Roschelle, J., Penuel, W. R., & Abrahamson, L. (2004). The networked classroom. Educational Leadership, 61(5), 50–54.Sadler, R. (1989). Formative assessment and the design of instructional systems. Instructional Science, 18, 119–144.Schmidt, D. A., Baran, E., Thompson, A. D., Mishra, P., Koehler, M. J., & Shin, T. S. (2009). Technological pedagogical con-
tent knowledge (TPACK): The development and validation of an assessment instrument for preservice teachers. Journal ofResearch on Technology in Education, 42(2), 123–149.
Selwyn, N. (1997). Students’ attitudes toward computers: Validation of a computer attitude scale for 16–19 education. Com-puters Education, 28(1), 35–41.
Shavelson, R. J., Yin, Y., Furtak, E. M., Ruiz-Primo, M. A., Ayala, C. C., Young, D. B.,. .. Pottenger, F. (2008). On the roleand impact of formative assessment on science inquiry teaching and learning. In J. E. Coffey, R. Douglas, & C. Sterns(Eds.), Science assessment: Research and practical approaches (pp. 21–36). Washington, DC: National Science TeachersAssociation Press.
60 l Journal of Research on Technology in Education l Volume 47 Number 1
Yue et al.
Dow
nloa
ded
by [
Uni
vers
ity o
f Il
linoi
s C
hica
go]
at 0
9:53
22
Janu
ary
2015

Sinclair, M., & Wideman, H. H. (2009, April). Use of TI-Navigator in early secondary mathematics: Challenge and opportu-nity. Paper presented at the National Council of Teachers of Mathematics 2009 Annual Meeting and Exposition, Washing-ton, DC.
Slovin, H., Olson, J., & Olson, M. (2011, October). How teachers’ beliefs about teaching and learning impact implementationof formative assessment in connected classrooms. Paper presented at the 33rd Annual Meeting of the North AmericanChapter of the International Group for the Psychology of Mathematics Education, Reno, NV: University of Nevada, Reno.
Slovin, H., Olson, J., & Olson, M. (2012, March). Teachers’ classroom practices using technology for formative assessment:The connection to knowledge and perceptions of mathematics, learning, and teaching. Paper presented at the 39th AnnualMeeting of the Research Council of Mathematics Learning, Charlotte, NC.
Stein, M. K., Smith, M. S., Henningsen, M. A., & Silver, E. A. (2000). Implementing standards-based mathematics instruc-tion: A casebook for professional development. New York, NY: Teachers College Press.
Stiggins, R. J., Arter, J., Chappuis, J., & Chappuis, S. (2004). Classroom assessment for student learning: Doing it right—Using it well. Portland, OR: Assessment Training Institute.
Wiliam, D., Lee, C., Harrison, C., & Black, P. (2004). Teachers developing assessment for learning: Impact on studentachievement. Assessment in Education, 11(1), 49–65.
Wolf, M. M. (1978). Social validity: The case for subjective measurement or how applied behavior analysis is finding itsheart. Journal of Applied Behavior Analysis, 11, 203–214.
Yin, Y. (2005). The influence of formative assessments on student motivation, achievement, and conceptual change. Doctoraldissertation, Stanford University, Stanford, CA.
Yin, Y., Shavelson, R. J., Ayala, C. C., Ruiz-Primo, M. A., Brandon, P. R., Furtak, E. M., . . . Young, D. B. (2008). On theimpact of formative assessment on students’ motivation, achievement, and conceptual change. Applied Measurement inEducation, 21(4), 335–359.
Zbiek, R. M., & Hollebrands, K. (2008). A research-informed view of the process of incorporating mathematics technologyinto classroom practice by in-service and prospective teachers. In G. W. Blume & M. K. Heid (Eds.), Research on technol-ogy and the teaching and learning of mathematics (Vol. 1, pp. 287–344). Charlotte, NC: Information Age Publisher.
Volume 47 Number 1 l Journal of Research on Technology in Education l 61
Formative Assessment
Dow
nloa
ded
by [
Uni
vers
ity o
f Il
linoi
s C
hica
go]
at 0
9:53
22
Janu
ary
2015

Appendix
A:FourFunctionsofTI-NavigatorSystem
andTheirConnectionsWithForm
ativeAssessment
Navigator
Function
FunctionDescription
Form
ativeAssessmentNeedsa
AdvantageofUsing
TI-Navigator
QuickPoll
Theteacherasksaquestion(canbeon-the-flyor
planned-for-interaction);allthestudents
respond
via
calculators;theteacherviewsanddisplaysall
studentresponsesim
mediately.Variousanswers
are
presentedasabargraph,sothatcommon
misconceptionscanbeidentifiedandaddressed
immediately.
�Givesstudents
achoice
amongdifferentpossible
answers
andaskingthem
to
vote
ontheoptions.
�Increasedwaitingtime:Slowthinkers
willnotbeinterruptedbythe
“spokenout”answers
offast
thinkers.
�Increaseswaitingtimeafter
questioningto
encourage
thoughtfulreflection.
�Engagingall:Classroom
willnotbe
dominatedbythevocalo
nes.Shy
students
willhavethesame
opportunitiesto
share
their
opinions.
�Engagesallthestudents.
�Efficient:Ittakesasecondto
count
anddisplaythevotes.Teachers
do
notneedto
taketimeto
count
handsortally.
�Anonymous:Students
willnotfeel
embarrassediftheiranswers
are
wrong.
�Confidential:Students
willnotand
cannotfollowthosehighachievers
inorderto
be“safe.”
ScreenCapture
Theteachercancapture
whatisoneachstudent’s
calculatorscreenthroughtheteacher’scomputerat
anytime,sothattheteachercanmonitorstudents’
progressbyidentifying(a)whoisnotonthetask,
(b)whoishavingdifficultieswithcalculatorusageor
concepts,(c)whoismakingcarelessmistakes,and
(d)whoisontherighttrack.
�Takea“snapshot”ofeach
calculatorscreenand
inspectthevariousscreens
tomakehypothesesabout
whatthestudents
are
thinking,diagnoseerrors,
andfosterclassdiscussion.
�Efficient:Withoutcirculatingaround
theclassroom,theteachercanview
every
student’swork
progressin
realtim
eandidentify
whoneeds
help.
�Easyforsharing:Theteachercan
share
anindividualstudent’s
answerwiththewhole
classwhen
necessary.Theanswercanbea
commonmistakeorexemplary
work.
�Anonymous:Whenanindividual
student’swork
issharedthrough
screencapture,theownerofthe
work
willnotbeembarrassed.
(continued)
62 l Journal of Research on Technology in Education l Volume 47 Number 1
Yue et al.
Dow
nloa
ded
by [
Uni
vers
ity o
f Il
linoi
s C
hica
go]
at 0
9:53
22
Janu
ary
2015

Navigator
Function
FunctionDescription
Form
ativeAssessmentNeedsa
AdvantageofUsing
TI-Navigator
Learn
Check
Teachers
cansendinform
ationorquestionsto
all
students
atonetime.Students
respondthrough
theircalculators.Students’a
nswers
canberelayed
instantlyanddisplayedanonymously.
�Hasstudents
complete
afew
problemsorquestionsat
theendofinstructionand
checksanswers.
�Convenient:Questionsand
assessments
canbeprestoredin
theteacher’scomputerandsentto
students
attheappropriate
time.
There
isnoneedto
copy,distribute,
andcollectpapers.
�Allowsteachers
towork
with
others
andoutsidesources
tocollectgoodtestitems.
�Efficient:Dueto
automaticgrading,
teachers
donotneedto
spendtime
gradingstudents’q
uizzes.
Meanwhile,students
canget
feedbackim
mediatelyandlearning
gapscanbeclosedsoonafterthey
are
identified.
�Usesportfolio
orcollections
ofstudentwork
form
atively.
�Easyto
share
highquality
assessment:Assessmentitemsare
indigitalform
at.Highquality
assessmentitemscanbecreated
collectivelybyteachers
and
assessmentexpertsandsharedby
teachers
easily.
�Easyto
keeprecord:Eachstudent’s
responsesandcorrectanswers
to
theassessments
canbesavedand
retrievedeasily.Hard
copiescanbe
printedforstudents
aspossible
portfolio
entry.
ActivityCenter
Students
cancontribute
toasharedworkspacethatis
projectedto
theclassin
realtim
e,e.g.,contributing
adata
point(x,y),anequation,oradata
listforan
algebra
topic.Students
canwork
collaborativelyin
pairsorgroups,discussing,self-assessing,and
peerassessingtheirownwork.
�Encouragesstudents
touse
self-assessmentandpeer-
assessment.
�Flexible:Students
canwork
individually,in
pairs,orin
groups
whentheycontribute
theirideasto
theclassactivity.
�Promotesmore
dynamic
classdiscourse.
�Anonymousbutidentifiable:Student
contributionsto
theclassdata
are
anonymous.However,each
student/pair/groupcanchooseits
owncolorto
showontheprojected
screenoftheclass’sresponses,so
thatstudents
canbemore
engaged
whendiscussingconflictingdata.
aTheform
ativeassessmentneedsare
citedfrom
thearticleswrittenbyBlack,Wiliam,andtheircolleagues(Blacketal.,2004;Black&Wiliam,1998a,1998b).
Volume 47 Number 1 l Journal of Research on Technology in Education l 63
Formative Assessment
Dow
nloa
ded
by [
Uni
vers
ity o
f Il
linoi
s C
hica
go]
at 0
9:53
22
Janu
ary
2015

Appendix B: Formative Assessment Model Used in the PD
Essential
Questions
FA-then-NAV FA-and-NAV
Where am I going? � Studying related state standards � Studying related state standards
Understanding the
content
� Learning progressions �Creating and choosing meaningful tasks:
examining resources for NAV
� Creating and choosing meaningful
tasks
�Integrating TI-Navigator and TI-73 into
instruction and FA
�Good tasks using Activity Center
Where am I now? �Making knowledge public: creating an
assessment conversation
� Features of TI-Navigator best suited for
FA
Designing tools � Asking questions to probe student
understanding
�Quick Poll
� Creating an open learning
environment
-Screen Capture
�Using Learn Check to write questions
How can I get
there?
� Identifying the known (strengths) and
the unknown (the gap)
� Using Learn Check and Class Analysis to
provide feedback
Interpreting results
and taking
action
� Giving feedback � Taking action on FA feedback via NAV:
creating next steps
�Making instructional decisions
� The students’ role in FA practices
Appendix C: Content of Two-Year PD for Each Group
Time FA-then-NAV FA-and-NAV
Year 1 summer
(5 days)—
preassessments
Conducted by PD Team 1 in Location 1 Conducted by PD Team 2 in Location 2
Focused on worthwhile mathematics tasks
(NCTM), and task analysis (Stein) along with
questioning, discourse, and students’
understanding and thinking. Worked with
teachers’ own curriculum to plan for formative
assessment.
Focused on worthwhile mathematics tasks
(NCTM), and task analysis (Stein) along with
questioning, discourse, and students’
understanding and thinking. Hands-on
experience with TI-Navigator features for
formative assessment and viewed classroom
clips of implementation. Worked with teachers’
own curriculum to plan for formative
assessment using technology.
Year 1 follow-ups (5
sessions)
Conducted by PD Team 1 in Location 1 Conducted by PD Team 2 in Location 2
Followed a general agenda: (1) Warm Up, a
mathematical problem for the teachers to solve
illustrating a rich task in which there were
opportunities for formative assessment; (2)
Teacher Sharing, a time for teachers to bring
examples of tasks and FA practices they had
implemented in their classrooms; (3)
Discussion of Issues, questions and challenges
raised by the teachers; and (4) Work Time,
planning for the implementation of a particular
task or FA practice to be shared at the next
follow-up session.
Followed a general agenda: (1) Sharing within
schools and across schools on celebrations,
challenges, classroom management,
troubleshooting tips; (2) Writing prompt for
teachers to provide formative assessment
feedback to PD Team on how implementation is
progressing; (3) Engage participants in
mathematical lesson activity using TI-Navigator
for FA; (4) Review or introduce additional uses
of TI-Navigator for FA; (4) Classroom video of
ULS or participants classrooms; (5) Work in
groups to develop/adapt activities for upcoming
mathematical topics.
Postassessments during May Follow-up. Postassessments during May follow-up.
(continued)
64 l Journal of Research on Technology in Education l Volume 47 Number 1
Yue et al.
Dow
nloa
ded
by [
Uni
vers
ity o
f Il
linoi
s C
hica
go]
at 0
9:53
22
Janu
ary
2015

Time FA-then-NAV FA-and-NAV
Year 1 coaching Conducted by PD Team 1 and adapted to needs of
individual teachers and uses of FA using pre-
observation when possible, observation of one
or more lessons, and post-observation
debriefing when possible. Coaches provided
guidance on using FA in lessons and
suggestions for future use of FA strategies and
responding to students’ misunderstandings.
Conducted by PD Team 2 and adapted to
individual needs of teachers and uses of TI-
Navigator for FA using pre-observation when
possible, observation of one or more lessons,
and post-observation debriefing when possible.
Provided assistance with technical issues and
uses of TI-Navigator features according to
comfort level of teachers. Coaches provided
guidance on using TI-Navigator for FA and
suggestions on alternative and future uses.
Captured video implementation in select
classrooms to share in follow-up sessions.
Year 2 summer—
3 days
Conducted Primarily by PD Team 1 and one of the
T^3 Instructors involved in Year 1 summer PD
for FA and Nav. Some activities conducted by
PD Team 2. Applied FA model used in Year 1 to
TI-Navigator. Provided hands-on experience
with TI-Navigator features for formative
assessment and worked with teachers’ own
curriculum to plan for formative assessment
using technology.
Conducted by PD Team 2 with some activities
conducted by PD Team 1. Primarily focused on
FA strategies and questioning, particularly
formulating rich questions for Quick Polls and
Learn Checks. The use of Activity Center for
patterns and functional relationships in
instruction and for FA was emphasized. Work
time for teachers’ to use their own curriculum to
plan for FA using TI-Navigator.
Year 2 follow-ups (5
Sessions)
Met jointly with FA and NAV in Location 2 and
conducted by PD Team 1 and Team 2.
With both novice and experienced users of TI-
Navigator for FA, rich mathematics activities
were developed that focused on students’
thinking and understanding and could use
various features of TI-Navigator. Teachers
were encouraged to branch out in using TI-
Navigator for FA and creating more
opportunities to probe students’ understanding.
Met jointly with FA then NAV in Location 2 and
conducted by PD Team 2 and Team 1. With
both novice and experienced users of TI-
Navigator for FA, rich mathematics activities
were developed that focused on students’
thinking and understanding and could use
various features of TI-Navigator. Teachers
were encouraged to branch out in using TI-
Navigator for FA and creating more
opportunities to probe students’ understanding.
Postassessments during May follow-up. Postassessments during May follow-up.
Year 2 coaching Conducted primarily by PD Team 1 with some
observations and technical assistance from PD
Team 2. Provided assistance with technical
issues and use of TI-Navigator features.
Addressed different levels of comfort with
technology and focused on teachers’ uses of
FA strategies.
Conducted primarily by PD Team 2 with some
observations by PD Team 1. Provided ongoing
assistance with technical issues and use of TI-
Navigator features. Built on Year 1 coaching
experiences and different levels of teachers’
uses of FA and comfort with technology.
Appendix D: School Environment
Frequency of collaboration
1. How often do you have the following types of interactions with other teachers?
Never or
almost
never
Once a
month
2 to 3 times
per month
Once a
week
More than
once a
week
1) Discussing about how to teach a
particular concept and a curriculum unit
1 2 3 4 5
2) Discussing about how to use technology
in instruction
1 2 3 4 5
3) Discussing about students’ behavior and
classroom management strategies
1 2 3 4 5
4) Working together to prepare
instructional materials, homework
assignments, and/or exams
1 2 3 4 5
Volume 47 Number 1 l Journal of Research on Technology in Education l 65
Formative Assessment
Dow
nloa
ded
by [
Uni
vers
ity o
f Il
linoi
s C
hica
go]
at 0
9:53
22
Janu
ary
2015

Effect of teacher collaboration
2. Indicate how much you agree or disagree with each of the following statements about the effect of
teacher collaboration.
Not
Applicable
Strongly
disagree Disagree Neutral Agree
Strongly
agree
1) Collaborating with fellow
teachers at my school gives
me access to new ideas
and knowledge.
0 1 2 3 4 5
2) The collaboration I have with
fellow teachers at my
school improves my
students’ learning.
0 1 2 3 4 5
3) The collaboration I have with
fellow teachers at my
school improves my
teaching.
0 1 2 3 4 5
School support
3. Indicate how much you agree or disagree with each of the following statements about school support.
Strongly
disagree Disagree Neutral Agree
Strongly
agree
1) My school greatly supports
teachers to use instructional
technology.
1 2 3 4 5
2) My school greatly
encourages teachers to
implement new teaching
strategies.
1 2 3 4 5
3) My school provides sufficient
funding for purchasing
equipment and instructional
supplies.
1 2 3 4 5
4) My school greatly
encourages teachers to
work with each other.
1 2 3 4 5
5) My school provides sufficient
professional development
opportunities for teachers.
1 2 3 4 5
6) My school makes sufficient
time for teachers to work
with each other.
1 2 3 4 5
7) My school makes sufficient
time for teachers to
participate in professional
development.
1 2 3 4 5
8) My workload in school
allows me to have sufficient
time to plan and prepare
lessons.
1 2 3 4 5
9) My school greatly
encourages teachers to
observe exemplary
mathematics teachers.
1 2 3 4 5
66 l Journal of Research on Technology in Education l Volume 47 Number 1
Yue et al.
Dow
nloa
ded
by [
Uni
vers
ity o
f Il
linoi
s C
hica
go]
at 0
9:53
22
Janu
ary
2015

Parent support
4. How many of your students’ parents do each of the following activities?
None Less than 1/2 About 1/2 More than 1/2 Almost all
1) Volunteer to assist with school
activities.
1 2 3 4 5
2) Help their children with
mathematics homework
assignments.
1 2 3 4 5
3) Attend school activities such as
PTA meetings.
1 2 3 4 5
4) Voice concerns on their
children’s education.
1 2 3 4 5
5) Contact teachers to check their
children’s progress in school.
1 2 3 4 5
Student motivation
5. How many of your students are like each of the following statements?
None Less than 1/2 About 1/2 More than 1/2 Almost all
1) Desire to do well in school 1 2 3 4 5
2) Are motivated to do well in
school
1 2 3 4 5
3) Have high expectations for their
achievement
1 2 3 4 5
4) Are willing to work hard 1 2 3 4 5
5) Value education 1 2 3 4 5
6) Are interested in learning
mathematics
1 2 3 4 5
7) Are well prepared to learn
middle school mathematics
academically
1 2 3 4 5
8) Follow class and school rules
well
1 2 3 4 5
Overall support
6. Indicate how much you agree or disagree with each of the following statements about your overall evaluation of school support,
parental support, and students.
Strongly
disagree Disagree Neutral Agree
Strongly
agree
1) In general, my school’s support
to teachers is satisfactory.
1 2 3 4 5
2) In general, parental support in
my school is satisfactory.
1 2 3 4 5
3) In general, parental involvement
in school activities in my school
is satisfactory.
1 2 3 4 5
4) In general, students’ motivation
to learn in my school is
satisfactory.
1 2 3 4 5
5) In general, students’
performance in mathematics in
my school is satisfactory.
1 2 3 4 5
6) I am satisfied with the amount of
teachers’ collaboration in my
school.
1 2 3 4 5
7) I am satisfied with the
effectiveness of teachers’
collaboration in my school.
1 2 3 4 5
8) In general, teachers’ job
satisfaction in my school is high.
1 2 3 4 5
Volume 47 Number 1 l Journal of Research on Technology in Education l 67
Formative Assessment
Dow
nloa
ded
by [
Uni
vers
ity o
f Il
linoi
s C
hica
go]
at 0
9:53
22
Janu
ary
2015

Appendix E: Assessment Survey
How strongly do you agree or disagree with each of the following statements aboutassessment?
A. Knowledge about assessment in general
Strongly
disagree Disagree Neutral Agree
Strongly
agree
1) I know how to design effective tasks to
assess student learning.
1 2 3 4 5
2) I can tell which assessment items will
effectively assess student learning.
1 2 3 4 5
3) I can choose appropriate assessment tasks
based on the purpose of the assessment.
1 2 3 4 5
4) I know whether an assessment item is
aligned with a given standard.
1 2 3 4 5
5) I know what concept or skill an assessment
item is testing.
1 2 3 4 5
6) I know how to improve existing
assessments.
1 2 3 4 5
B. Knowledge about formative assessment
Strongly
disagree Disagree Neutral Agree
Strongly
agree
1) I am familiar with formative assessment
strategies.
1 2 3 4 5
2) I know how to use formative assessment in
teaching.
1 2 3 4 5
3) I have sufficient knowledge about formative
assessment.
1 2 3 4 5
C. Self-efficacy in assessment
2. How strongly do you agree or disagree with
each of the following statements about
using formative assessment?
Strongly
disagree Disagree Neutral Agree
Strongly
agree
1) I can effectively implement formative
assessment in my teaching.
1 2 3 4 5
2) I can use formative assessment to improve
my student learning.
1 2 3 4 5
3) I can engage students in learning by using
formative assessment.
1 2 3 4 5
4) I can use formative assessment to identify
the gap between students’ current
understanding and the learning goals.
1 2 3 4 5
5) I am able to use formative assessment to
figure out what students know and can do.
1 2 3 4 5
6) I can interpret the information from formative
assessment.
1 2 3 4 5
7) I can figure out students’ learning needs by
using formative assessment.
1 2 3 4 5
8) I can use information collected from
formative assessment to guide my
teaching.
1 2 3 4 5
9) I can take appropriate action to help
students close the learning gap.
1 2 3 4 5
10) I can match my instruction to the learning
gap identified by formative assessment.
1 2 3 4 5
11) I can provide effective feedback to students
when using formative assessment.
1 2 3 4 5
68 l Journal of Research on Technology in Education l Volume 47 Number 1
Yue et al.
Dow
nloa
ded
by [
Uni
vers
ity o
f Il
linoi
s C
hica
go]
at 0
9:53
22
Janu
ary
2015
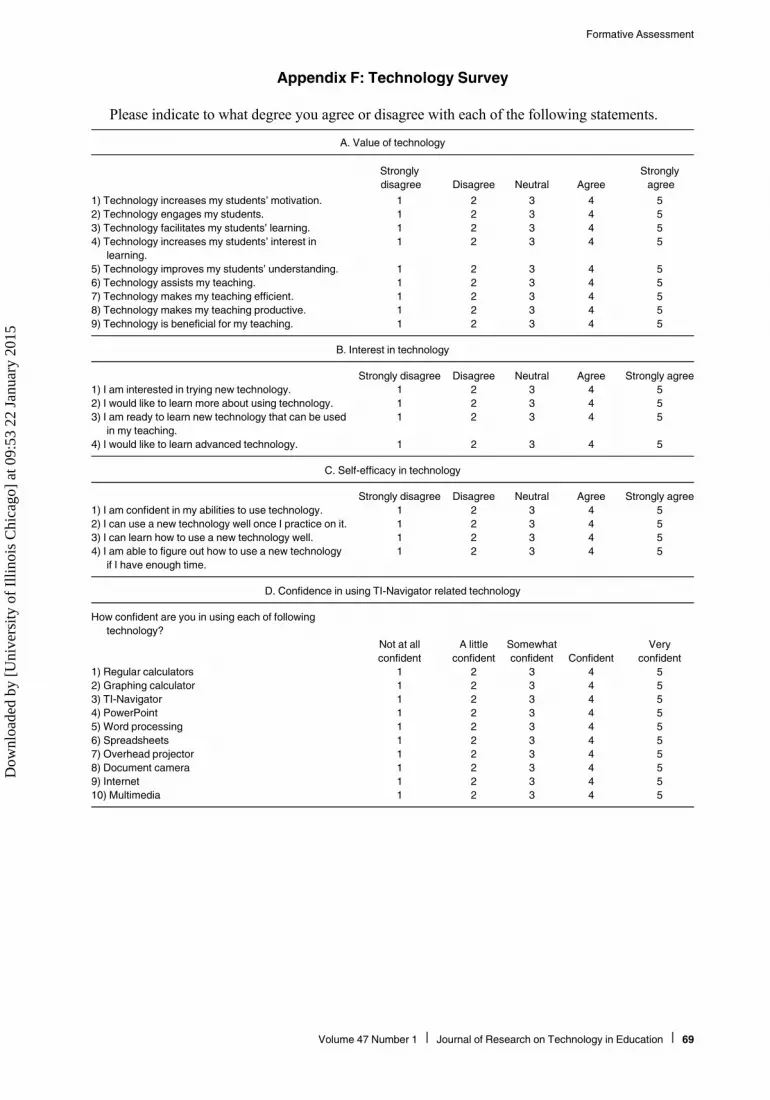
Appendix F: Technology Survey
Please indicate to what degree you agree or disagree with each of the following statements.
A. Value of technology
Strongly
disagree Disagree Neutral Agree
Strongly
agree
1) Technology increases my students’ motivation. 1 2 3 4 5
2) Technology engages my students. 1 2 3 4 5
3) Technology facilitates my students’ learning. 1 2 3 4 5
4) Technology increases my students’ interest in
learning.
1 2 3 4 5
5) Technology improves my students’ understanding. 1 2 3 4 5
6) Technology assists my teaching. 1 2 3 4 5
7) Technology makes my teaching efficient. 1 2 3 4 5
8) Technology makes my teaching productive. 1 2 3 4 5
9) Technology is beneficial for my teaching. 1 2 3 4 5
B. Interest in technology
Strongly disagree Disagree Neutral Agree Strongly agree
1) I am interested in trying new technology. 1 2 3 4 5
2) I would like to learn more about using technology. 1 2 3 4 5
3) I am ready to learn new technology that can be used
in my teaching.
1 2 3 4 5
4) I would like to learn advanced technology. 1 2 3 4 5
C. Self-efficacy in technology
Strongly disagree Disagree Neutral Agree Strongly agree
1) I am confident in my abilities to use technology. 1 2 3 4 5
2) I can use a new technology well once I practice on it. 1 2 3 4 5
3) I can learn how to use a new technology well. 1 2 3 4 5
4) I am able to figure out how to use a new technology
if I have enough time.
1 2 3 4 5
D. Confidence in using TI-Navigator related technology
How confident are you in using each of following
technology?
Not at all
confident
A little
confident
Somewhat
confident Confident
Very
confident
1) Regular calculators 1 2 3 4 5
2) Graphing calculator 1 2 3 4 5
3) TI-Navigator 1 2 3 4 5
4) PowerPoint 1 2 3 4 5
5) Word processing 1 2 3 4 5
6) Spreadsheets 1 2 3 4 5
7) Overhead projector 1 2 3 4 5
8) Document camera 1 2 3 4 5
9) Internet 1 2 3 4 5
10) Multimedia 1 2 3 4 5
Volume 47 Number 1 l Journal of Research on Technology in Education l 69
Formative Assessment
Dow
nloa
ded
by [
Uni
vers
ity o
f Il
linoi
s C
hica
go]
at 0
9:53
22
Janu
ary
2015

Appendix G: Teacher Evaluation of the Professional Development
Satisfaction of using TI-NAV for FA
Strongly
disagree Disagree Neutral Agree
Strongly
agree
1) TI-Navigator can help me implement formative assessment
effectively.
1 2 3 4 5
2) It is very helpful to use TI-Navigator to implement formative
assessment.
1 2 3 4 5
3) I plan to continue to use TI-Navigator to implement formative
assessment in the future.
1 2 3 4 5
Satisfaction of the PD
Strongly
disagree Disagree Neutral Agree
Strongly
agree
1) The five-day summer professional development sessions in
YEAR 1 greatly helped me implement formative
assessment.
1 2 3 4 5
2) The five follow-up professional development sessions in
Year 1 greatly helped me implement formative assessment.
1 2 3 4 5
3) The classroom coaching visits by project staff in YEAR 1
greatly helped me implement formative assessment.
1 2 3 4 5
4) The three-day summer professional development sessions
in YEAR 2 greatly helped me implement formative
assessment.
1 2 3 4 5
5) The five follow-up professional development sessions in
Year 2 greatly helped me implement formative assessment.
1 2 3 4 5
6) The classroom coaching visits by project staff in YEAR 2
greatly helped me implement formative assessment.
1 2 3 4 5
7) Overall FANC training in the two years greatly helped me to
use TI-Navigator to implement formative assessment.
1 2 3 4 5
Confidence in using TI-NAV for FA
How confident are you in using each of following TI-Navigator
features?
Not at all
confident
A little
confident
Somewhat
confident Confident
Very
confident
1) Quick Poll 1 2 3 4 5
2) Screen Capture 1 2 3 4 5
3) Activity Center 1 2 3 4 5
4) Learn Check 1 2 3 4 5
5) Elmo 1 2 3 4 5
6) TI-73 calculator (by itself) 1 2 3 4 5
7) Using any TI-Navigator feature to implement formative
assessment
1 2 3 4 5
Overall Preference
If you were allowed to choose or even design professional development in how to use TI-Navigator to implement formative assessment, what professional development model wouldyou prefer?
A. Formative assessment training in Year 1, TI-Navigator training in Year 2.
B. TI-Navigator training in Year 1, formative assessment training in Year 2.
C. Formative assessment combined with the TI-Navigator training for two years.
D. Other: Please specify.
70 l Journal of Research on Technology in Education l Volume 47 Number 1
Yue et al.
Dow
nloa
ded
by [
Uni
vers
ity o
f Il
linoi
s C
hica
go]
at 0
9:53
22
Janu
ary
2015