comparative structural and compositional analyses of cow
TRANSCRIPT

foods
Article
Comparative Structural and Compositional Analyses of Cow,Buffalo, Goat and Sheep Cream
Valeria D. Felice 1, Rebecca A. Owens 2, Deirdre Kennedy 3, Sean A. Hogan 3 and Jonathan A. Lane 1,*
�����������������
Citation: Felice, V.D.; Owens, R.A.;
Kennedy, D.; Hogan, S.A.; Lane, J.A.
Comparative Structural and
Compositional Analyses of Cow,
Buffalo, Goat and Sheep Cream. Foods
2021, 10, 2643. https://doi.org/
10.3390/foods10112643
Academic Editor: Vito Verardo
Received: 15 September 2021
Accepted: 22 October 2021
Published: 1 November 2021
Publisher’s Note: MDPI stays neutral
with regard to jurisdictional claims in
published maps and institutional affil-
iations.
Copyright: © 2021 by the authors.
Licensee MDPI, Basel, Switzerland.
This article is an open access article
distributed under the terms and
conditions of the Creative Commons
Attribution (CC BY) license (https://
creativecommons.org/licenses/by/
4.0/).
1 H&H Group, Global Research and Technology Centre, P61 C996 Cork, Ireland; [email protected] Department of Biology, Maynooth University, W23 F2H6 Maynooth, Ireland; [email protected] Teagasc Food Research Centre, Moorepark, Fermoy, Co., P61 C996 Cork, Ireland;
[email protected] (D.K.); [email protected] (S.A.H.)* Correspondence: [email protected]
Abstract: Factors affecting milk and milk fraction composition, such as cream, are poorly understood,with most research and human health application associated with cow cream. In this study, proteomicand lipidomic analyses were performed on cow, goat, sheep and Bubalus bubalis (from now onreferred to as buffalo), bulk milk cream samples. Confocal laser scanning microscopy was used todetermine the composition, including protein, lipid and their glycoconjugates, and the structureof the milk fat globules. BLAST2GO was used to annotate functional indicators of cream protein.Functional annotation of protein highlighted a broad level of similarity between species. However,investigation of specific biological process terms revealed distinct differences in antigen processingand presentation, activation, and production of molecular mediators of the immune response. Lipidanalyses revealed that saturated fatty acids were lowest in sheep cream and similar in the creamof the other species. Palmitic acid was highest in cow and lowest in sheep cream. Cow and sheepmilk fat globules were associated with thick patches of protein on the surface, while buffalo andgoat milk fat globules were associated with larger areas of aggregated protein and significant surfaceadsorbed protein, respectively. This study highlights the differences between cow, goat, sheep, andbuffalo milk cream, which can be used to support their potential application in functional foods suchas infant milk formula.
Keywords: cow; goat; sheep; buffalo; cream; milk fat globules
1. Introduction
The use of domestic animal milk and milk fractions for human nutrition for all lifestages is well established [1]. Although significant technological advances associatedwith the characterisation of milk composition have been achieved, there remains limiteddetailed information on the composition, and change in composition over lactation, ofmilk and milk fractions from certain mammals. Furthermore, factors influencing milkand milk fraction composition are yet to be understood. As reported by the Food andAgriculture Organization of the United Nations (FAOSTAT data, 2016), milk is producedand consumed in all the world’s countries with milk production predominantly associatedwith cow (82.7%), buffalo (13.3%), goat (2.3%), sheep (1.3%) and camel (0.4%). Milk anddairy products account for nearly 14% of the global agricultural trade, with a preferencefor whole milk powder and skimmed milk powder.
The most investigated milk source in terms of production, composition and associ-ated function is cow milk. A factor driving these investigations is the common use ofcow milk for infant milk formula. Most recently, O’Callaghan and colleagues [2,3], havedemonstrated the impact of feeding systems, predominantly indoor feeding using totalmixed-ration diets and pasture-feeding, on milk composition, processing, and end-product.Indeed, research has clearly demonstrated that feeding systems influence milk fat, protein,mineral, vitamin, amino acid, and fatty acid composition [4]. Furthermore, research is now
Foods 2021, 10, 2643. https://doi.org/10.3390/foods10112643 https://www.mdpi.com/journal/foods

Foods 2021, 10, 2643 2 of 21
accumulating on the impact of the feeding system on the taste of milk and milk-based prod-ucts such as butter. For example, pasture-feeding produces milk perceived to have a grassy,cowy, mothball and/or barny flavour, which corresponds with the presence of higherconcentrations of p-cresol in the headspace of pasture milk [5]. Cow milk, its fractionsand isolated milk components have been associated with numerous health benefits. Wheyproteins such as osteopontin, lactoferrin, α-lactalbumin and immunoglobulin G have beenlinked with anti-microbial, anti-viral, immunomodulatory, metabolic and anti-carcinogenicproperties [6].
Although buffalo, goat and sheep milk have been an important part of human nutri-tion for millennia, detailed knowledge of the composition and function of these types ofmilk is limited when compared with cow milk. Goat milk and milk fractions have beenstudied for their digestive properties. Interestingly, notable differences have been reportedfor cow and goat milk [7–9]. Indeed, Hodgkinson and colleagues have reported differentdigestive behaviours in an in vitro digestion model between goat and cow milk with goatcasein tending to be more efficiently digested, when compared to cow casein, with overallpeptides profiles from goat and cow milk, post digestion, being distinctly different [8,9]. Itis important to note that others have observed both similar and conflicting results [10,11].Thus, further studies in this area appear to be warranted. Sheep milk has been predomi-nantly used to produce cheese and yogurt; however, increased production and availabilityof sheep milk has positioned it as a potential source of health-promoting milk fractions. Asreported by Claeys and colleagues [12], sheep milk is an abundant source of protein withmolecular forms and amino acid compositions that support its digestibility and nutritionalvalue. Functional research on sheep milk remains limited. Similarly, to sheep milk, buffalomilk research has mainly focused on its safety, production, and processing with a corefocus on the quality of end products such as cheese and yogurt. Hence, there is a need tofurther understand these milk and milk fractions to fully unlock their potential as sourcesof health-promoting ingredients.
In this study, we aimed to perform comparative analyses of the structure, composition,and potential function of cow, goat, sheep and buffalo cream. Our focus on the milk fatfraction was associated with the fact that the cow Milk Fat Globule Membrane (MFGM),enriched in cow cream, has gained industrial interest due to pre-clinical and clinicalevidence associated with the development of the infant immune and gastrointestinalsystem, cognitive function, protection from infection, and cardiovascular and muscularhealth [13]. Thus, we aim to understand if cow, buffalo, goat and sheep cream sources couldhave similar structural, compositional, and therefore, functional profiles and to identifytheir potential for inclusion in functional foods.
2. Materials and Methods2.1. Sample Collection
All domestic animal milks were collected from bulk tanks from commercial dairyfarms under controlled conditions. Cow, sheep, goat and buffalo milks were sourcedfrom Isigny Sainte Mere (France) (Breeds, Holstein > Normandy > Jersey > Others), Beech-mount Farm—Sheep Milk Ireland (Ireland) (Breeds, East Friesian and Lacaune), Ardsallagh(Ireland) (Breed, Saanen) and Macroom Bubalus bubalis Cheese (Ireland) (Breed, Mediter-ranean Italian), respectively. Cream was separated from raw, unpasteurised milk through aone-step centrifugation process using a disc-bowl centrifuge (Armfield Ltd., Ringwood,England) (37 ◦C, 6000 rpm), except for cow milk which was separated industrially. Sepa-rated samples were stored and shipped at 4 ◦C and analysed within 48 h except for creamsamples used for proteomic analysis, which were lyophilized and stored at −20 ◦C priorto analysis.

Foods 2021, 10, 2643 3 of 21
2.2. Cream Composition Analysis2.2.1. Total Protein Content
Total protein quantification was determined using the Kjeldahl method and a nitrogen-to-milk protein conversion factor of 6.38. This method was based on the Internationalstandard ISO 8968-3:2004/IDF 20-3:2004.
2.2.2. Phospholipid Profiling
Quantitative 31P-NMR spectroscopy was performed on a Bruker Avance III 600 MHz withan automatic sample changer and BBO cryoprobe at Spectral Service (Cologne, Germany).
2.2.3. Fatty Acid Profiling
The extraction of crude fat from cream for full fatty acid characterisation and determi-nation of the composition of fatty acids in the 2-position of the triglyceride molecules wasperformed by ITERG (Canéjan, France).
2.3. Proteomics2.3.1. Protein Preparation
Protein samples were prepared by dissolving cream powder in SDS buffer (4% (w/v)SDS, 0.1 M Tris-HCl pH 7.4) at a final concentration of 100 mg/mL and incubated at 95 ◦C,10 min. Samples were centrifuged at 14,000 rcf for 15 min and the soluble protein fractionwas isolated. Samples in SDS buffer were mixed (4:1) with 5X sample buffer (50% (v/v)glycerol, 1% (w/v) SDS, 30 mM Tris-HCl, 2.5% (v/v) β-mercaptoethanol, 0.006% (w/v) bro-mophenol blue), incubated at 95 ◦C for 5 min and loaded onto 12% acrylamide/methylenebisacrylamide gels [14] for SDS-polyacrylamide gel electrophoresis (SDS-PAGE). Elec-trophoresis proceeded until the samples had entered the top 1 cm of the resolving gel(for protein digestion), or on separate gels until the dye front had reached the end ofthe resolving gel (for visualisation of protein bands). Gels were stained with CoomassieBlue and de-stained to remove background. Condensed protein bands were excisedfrom the top 1 cm of the resolving gel and in-gel digestion was performed according toShevchenko et al. [15]. Sample clean-up was performed using Zip Tips with C18 resin(Millipore) and dried peptide mixtures were stored at −70 ◦C.
2.3.2. Sample Clean-Up and Q-Exactive Analysis
Peptide extracts were re-suspended in 0.05% (v/v) trifluoroacetic acid, 2% acetoni-trile and were analysed by LC-MS/MS using the Thermo Q-Exactive mass spectrometercoupled to a Dionex Ultimate 3000 RSLCnano [16]. Peptides were separated in-line onan EasySpray PepMap C18 column (500 mm × 75 µm with 2 µm particles) on a 14 to35% B gradient as outlined in Morrin et al. [17]. The data-dependent acquisition wasused with a Top15 method for MS/MS scans. MaxQuant (v 1.6.2.10) was used for proteinidentification [18,19]. Raw files from cream samples were searched against a combinedprotein database consisting of the Bos taurus (cow), Ovis aries (sheep), Capra hircus (goat) (alldownloaded from Uniprot, 05 September 2019) or Bubalus bubalis (water buffalo) database(downloaded from NCBI 06 November 2019). A modified contaminants database was alsoused, excluding B. taurus entries. The false discovery rate (FDR) was set to 1% for bothpeptides and proteins. Data organisation and analysis were performed using Perseus (v1.6.6.0) [19]. Protein groups were filtered to exclude those matching a decoy or proteincontaminants database, or those identified by only a single peptide.
2.4. Confocal Laser Scanning Microscopy
The confocal methods carried out, were based on [20,21] with minor modifications.Confocal laser scanning microscopy (CLSM) analysis of MFGs was performed using aconfocal laser scanning microscope (LeicaSP5, Leica Microsystems CMS GmbH, Wetzlar,Germany). Experiments used an argon laser with a 488 nm excitation wavelength, a diodelaser with a 561 nm excitation and a helium neon red laser line (excitation 633 nm).
Foods 2021, 10, 2643 4 of 21
2.4.1. Protein/Fat Labelling
Neutral lipids were stained with Nile Red 0.10 g/L in polyethylene glycol 200 (SigmaAldrich, Wicklow, Ireland) with emission collected in the range 500–530 nm. Protein waslabelled using Fast Green (0.01 g/L in water) fluorescent dye (Sigma Aldrich) with emissioncollected between 650–700 nm. 50 µL of a 3:1 mixture of Nile Red: Fast Green was addedto 1 mL of cream/solution, which was then vortexed and 20 µL deposited on a glassslide before imaging. A 63x oil immersion objective was used to acquire images taken at1024 × 1024 pixels.
2.4.2. Phospholipid and Carbohydrate Labelling
The fluorescent dye 1,2-dioleoyl-sn-glycero-3-phosphoethanolamine-N-(lissaminerhodamine B sulfonyl) (Rh-PE, Avanti Polar lipids Inc., Birmingham, UK) was made upto 1 mg/mL in chloroform and used to label the phospholipids by adding 50 µL of thesolution to 1 mL of cream. Emission was collected in the range 570–625 nm.
Wheat Germ Agglutinin Alexa Fluor 488 (WGA, Cergy Pontoise, France) was madeup to 1 mg/mL in low salt TBS (20 mM Tris-HCl, 100 mM NaCl, 1 mM CaCl2, 1 mM MgCl2,pH 7.2) and used to label and locate carbohydrate moieties. Fifty µL of solution was addedto 1 mL of cream. Emission was collected in the range 490–550 nm. For samples singleand dual stained with Rh-PE and WGA, samples were kept at room temperature in thedark for a minimum of 6 h before analysis. 0.5% (w/w) low melting point agarose (held at45 ◦C until required) (Thermofisher Scientific, Waltham, MA USA) was added to all singleand dual stained samples before imaging 10 µL of sample and 20 µL of the agarose weredeposited onto slides and mixed gently before a coverslip was added. A 63x oil immersionobjective was used to acquire images taken at 1024 × 1024 pixels.
3. Results and Discussion3.1. Total Protein Content in Cow, Buffalo, Goat and Sheep Cream Samples
The total protein content for domestic animal milks is well established. For example,it has been reported that the natural total protein content in mature cow, goat, sheep andbuffalo milk is 3%, 2.75%, 6.36% and 4.27%, respectively [22–25]. The total protein contentrecorded in milk and, indeed, the cream is influenced by numerous factors, including ani-mal species, lactation period, breed, feed, and laboratory methodology and practise [24,25].In this study, the total protein content of the cream samples analysed, was determined as5.47, 6.03, 3.68 and 5.12% for cow, sheep, buffalo and goat, respectively (n = 1; Table 1). Toour knowledge, this is the first study investigating the protein content in the cream of goat,sheep and buffalo milks.
Table 1. Percentage of proteins in cream samples from cow, buffalo goat and sheep samples.
Species Cow Sheep Buffalo Goat
% Protein 5.47 6.03 3.68 5.12
3.2. Proteomic Analyses of Cream Samples from Four Species
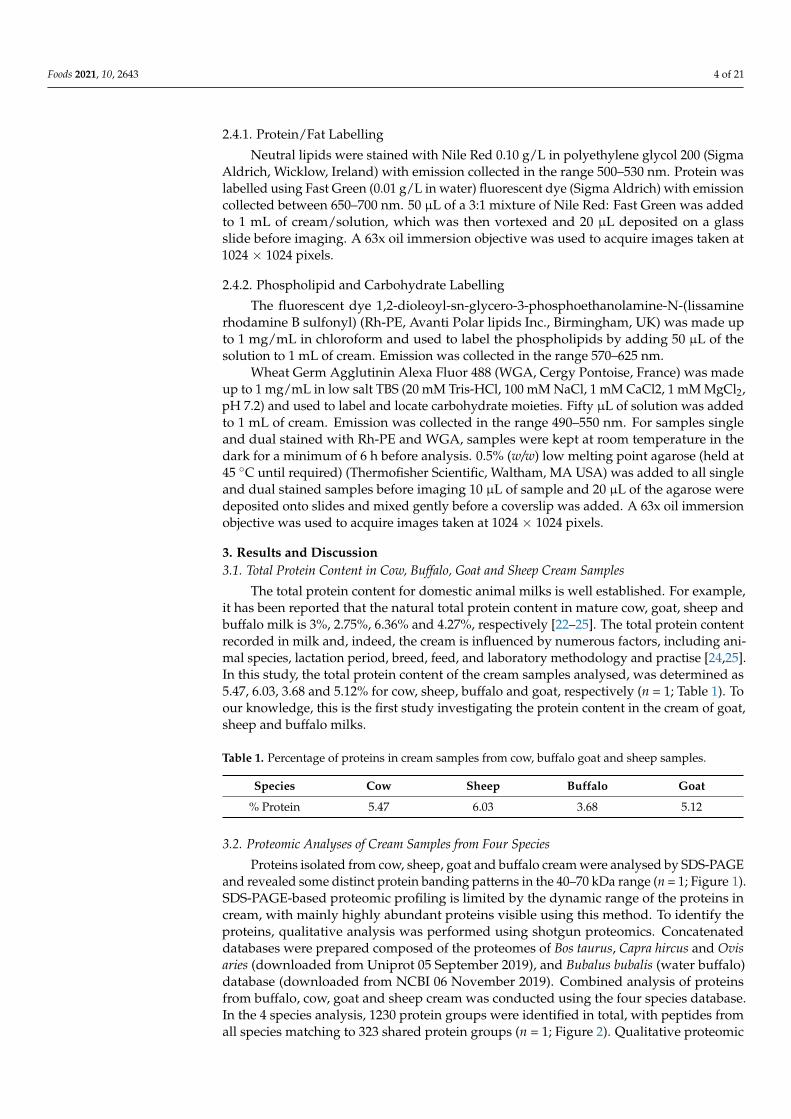
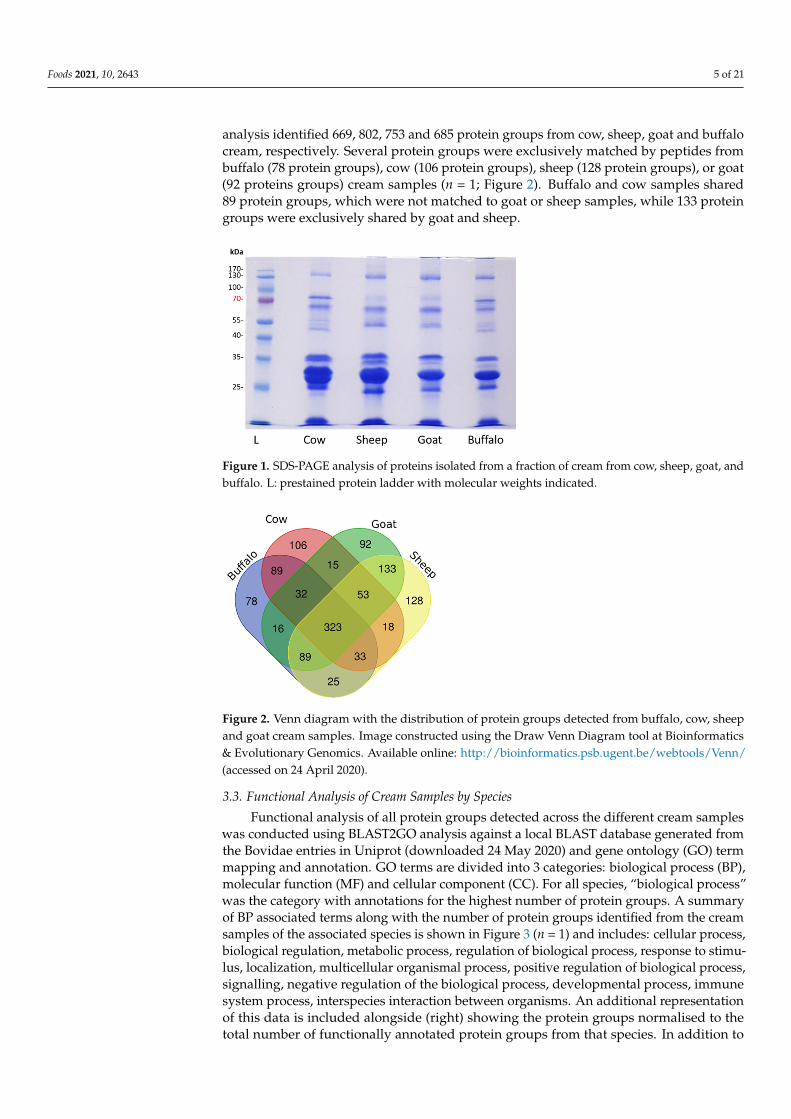
Proteins isolated from cow, sheep, goat and buffalo cream were analysed by SDS-PAGEand revealed some distinct protein banding patterns in the 40–70 kDa range (n = 1; Figure 1).SDS-PAGE-based proteomic profiling is limited by the dynamic range of the proteins incream, with mainly highly abundant proteins visible using this method. To identify theproteins, qualitative analysis was performed using shotgun proteomics. Concatenateddatabases were prepared composed of the proteomes of Bos taurus, Capra hircus and Ovisaries (downloaded from Uniprot 05 September 2019), and Bubalus bubalis (water buffalo)database (downloaded from NCBI 06 November 2019). Combined analysis of proteinsfrom buffalo, cow, goat and sheep cream was conducted using the four species database.In the 4 species analysis, 1230 protein groups were identified in total, with peptides fromall species matching to 323 shared protein groups (n = 1; Figure 2). Qualitative proteomic
Foods 2021, 10, 2643 5 of 21
analysis identified 669, 802, 753 and 685 protein groups from cow, sheep, goat and buffalocream, respectively. Several protein groups were exclusively matched by peptides frombuffalo (78 protein groups), cow (106 protein groups), sheep (128 protein groups), or goat(92 proteins groups) cream samples (n = 1; Figure 2). Buffalo and cow samples shared89 protein groups, which were not matched to goat or sheep samples, while 133 proteingroups were exclusively shared by goat and sheep.
Foods 2021, 10, x FOR PEER REVIEW 5 of 24
and Ovis aries (downloaded from Uniprot 05 September 2019), and Bubalus bubalis (water buffalo) database (downloaded from NCBI 06 November 2019). Combined analysis of proteins from buffalo, cow, goat and sheep cream was conducted using the four species database. In the 4 species analysis, 1230 protein groups were identified in total, with pep-tides from all species matching to 323 shared protein groups (n = 1; Figure 2). Qualitative proteomic analysis identified 669, 802, 753 and 685 protein groups from cow, sheep, goat and buffalo cream, respectively. Several protein groups were exclusively matched by pep-tides from buffalo (78 protein groups), cow (106 protein groups), sheep (128 protein groups), or goat (92 proteins groups) cream samples (n = 1; Figure 2). Buffalo and cow samples shared 89 protein groups, which were not matched to goat or sheep samples, while 133 protein groups were exclusively shared by goat and sheep.
Figure 1. SDS-PAGE analysis of proteins isolated from a fraction of cream from cow, sheep, goat, and buffalo. L: prestained protein ladder with molecular weights indicated.
Figure 2. Venn diagram with the distribution of protein groups detected from buffalo, cow, sheep and goat cream samples. Image constructed using the Draw Venn Diagram tool at Bioinformatics & Evolutionary Genomics. Available online: http://bioinformatics.psb.ugent.be/webtools/Venn/ (ac-cessed on 24 April 2020).
3.3. Functional Analysis of Cream Samples by Species Functional analysis of all protein groups detected across the different cream samples
was conducted using BLAST2GO analysis against a local BLAST database generated from the Bovidae entries in Uniprot (downloaded 24 May 2020) and gene ontology (GO) term mapping and annotation. GO terms are divided into 3 categories: biological process (BP), molecular function (MF) and cellular component (CC). For all species, “biological process” was the category with annotations for the highest number of protein groups. A summary of BP associated terms along with the number of protein groups identified from the cream
Figure 1. SDS-PAGE analysis of proteins isolated from a fraction of cream from cow, sheep, goat, andbuffalo. L: prestained protein ladder with molecular weights indicated.
Foods 2021, 10, x FOR PEER REVIEW 5 of 24
and Ovis aries (downloaded from Uniprot 05 September 2019), and Bubalus bubalis (water buffalo) database (downloaded from NCBI 06 November 2019). Combined analysis of proteins from buffalo, cow, goat and sheep cream was conducted using the four species database. In the 4 species analysis, 1230 protein groups were identified in total, with pep-tides from all species matching to 323 shared protein groups (n = 1; Figure 2). Qualitative proteomic analysis identified 669, 802, 753 and 685 protein groups from cow, sheep, goat and buffalo cream, respectively. Several protein groups were exclusively matched by pep-tides from buffalo (78 protein groups), cow (106 protein groups), sheep (128 protein groups), or goat (92 proteins groups) cream samples (n = 1; Figure 2). Buffalo and cow samples shared 89 protein groups, which were not matched to goat or sheep samples, while 133 protein groups were exclusively shared by goat and sheep.
Figure 1. SDS-PAGE analysis of proteins isolated from a fraction of cream from cow, sheep, goat, and buffalo. L: prestained protein ladder with molecular weights indicated.
Figure 2. Venn diagram with the distribution of protein groups detected from buffalo, cow, sheep and goat cream samples. Image constructed using the Draw Venn Diagram tool at Bioinformatics & Evolutionary Genomics. Available online: http://bioinformatics.psb.ugent.be/webtools/Venn/ (ac-cessed on 24 April 2020).
3.3. Functional Analysis of Cream Samples by Species Functional analysis of all protein groups detected across the different cream samples
was conducted using BLAST2GO analysis against a local BLAST database generated from the Bovidae entries in Uniprot (downloaded 24 May 2020) and gene ontology (GO) term mapping and annotation. GO terms are divided into 3 categories: biological process (BP), molecular function (MF) and cellular component (CC). For all species, “biological process” was the category with annotations for the highest number of protein groups. A summary of BP associated terms along with the number of protein groups identified from the cream
Figure 2. Venn diagram with the distribution of protein groups detected from buffalo, cow, sheepand goat cream samples. Image constructed using the Draw Venn Diagram tool at Bioinformatics& Evolutionary Genomics. Available online: http://bioinformatics.psb.ugent.be/webtools/Venn/(accessed on 24 April 2020).
3.3. Functional Analysis of Cream Samples by Species
Functional analysis of all protein groups detected across the different cream sampleswas conducted using BLAST2GO analysis against a local BLAST database generated fromthe Bovidae entries in Uniprot (downloaded 24 May 2020) and gene ontology (GO) termmapping and annotation. GO terms are divided into 3 categories: biological process (BP),molecular function (MF) and cellular component (CC). For all species, “biological process”was the category with annotations for the highest number of protein groups. A summaryof BP associated terms along with the number of protein groups identified from the creamsamples of the associated species is shown in Figure 3 (n = 1) and includes: cellular process,biological regulation, metabolic process, regulation of biological process, response to stimu-lus, localization, multicellular organismal process, positive regulation of biological process,signalling, negative regulation of the biological process, developmental process, immunesystem process, interspecies interaction between organisms. An additional representationof this data is included alongside (right) showing the protein groups normalised to thetotal number of functionally annotated protein groups from that species. In addition to

Foods 2021, 10, 2643 6 of 21
biological processes, GO molecular function (n = 1; Figure S1) and cellular component(n = 1; Figure S2) are shown for the four species comparisons, with absolute numbers ofdetected proteins (left) and the data normalised to the number of proteins with associatedGO category terms (right) for each figure. There were higher numbers of detected proteinsassociated with developmental process, multicellular organismal process, response tostimulus and regulation of the biological process in the goat and sheep samples comparedto buffalo and cow samples. Following normalisation, most terms showed similar levelsacross each of the species analysed. However, these data were limited to high-level broadBP terms; thus, to distinguish more subtle differences, further investigation of more specificBP terms and individual protein groups was undertaken.
Foods 2021, 10, x FOR PEER REVIEW 6 of 24
samples of the associated species is shown in Figure 3 (n = 1) and includes: cellular process, biological regulation, metabolic process, regulation of biological process, response to stim-ulus, localization, multicellular organismal process, positive regulation of biological pro-cess, signalling, negative regulation of the biological process, developmental process, im-mune system process, interspecies interaction between organisms. An additional repre-sentation of this data is included alongside (right) showing the protein groups normalised to the total number of functionally annotated protein groups from that species. In addition to biological processes, GO molecular function (n = 1; Figure S1) and cellular component (n = 1; Figure S2) are shown for the four species comparisons, with absolute numbers of detected proteins (left) and the data normalised to the number of proteins with associated GO category terms (right) for each figure. There were higher numbers of detected proteins associated with developmental process, multicellular organismal process, response to stimulus and regulation of the biological process in the goat and sheep samples compared to buffalo and cow samples. Following normalisation, most terms showed similar levels across each of the species analysed. However, these data were limited to high-level broad BP terms; thus, to distinguish more subtle differences, further investigation of more spe-cific BP terms and individual protein groups was undertaken.
Figure 3. Summary of Biological Process (BP) terms of protein groups from analysis of cream from four species, with absolute numbers (left) and normalised to the total number of annotated proteins (right).
Protein components of cream like those within the milk far globule membrane (MFGM) have been associated with several health benefits, including and predominantly immune function [26]. Hence, we have further focused our analysis on immune system-related terms. A summary of immune system-related terms is shown in Figure 4 (n = 1) and includes regulation of immune system process, immune effector process, activation of immune response, immune system development, antigen processing and presentation, leukocyte migration, and myeloid cell homeostasis. A certain level of variability was ob-
0 20 40 60 80 100
% of Total Proteins BP terms
Normalised BP
Sheep Goat Buffalo Cow
0 200 400 600 800
cellular processbiological regulation
metabolic processregulation of biological process
response to stimuluslocalization
multicellular organismal processpositive regulation of biological process
signalingnegative regulation of biological process
developmental processimmune system process
interspecies interaction between organismslocomotion
biological adhesionreproduction
reproductive processgrowth
multi-organism processdetoxification
behaviorbiomineralizationrhythmic process
pigmentationintraspecies interaction between organisms
biological phase
Proteins with BP terms
GO Biological Processes
Sheep Goat Buffalo Cow
Figure 3. Summary of Biological Process (BP) terms of protein groups from analysis of creamfrom four species, with absolute numbers (left) and normalised to the total number of annotatedproteins (right).
Protein components of cream like those within the milk far globule membrane (MFGM)have been associated with several health benefits, including and predominantly immunefunction [26]. Hence, we have further focused our analysis on immune system-relatedterms. A summary of immune system-related terms is shown in Figure 4 (n = 1) andincludes regulation of immune system process, immune effector process, activation ofimmune response, immune system development, antigen processing and presentation,leukocyte migration, and myeloid cell homeostasis. A certain level of variability wasobserved in the GO terms among the species. Among those, we focused on antigenprocessing and presentation, activation of immune response and production of molecularmediator of immune response.

Foods 2021, 10, 2643 7 of 21
Foods 2021, 10, x FOR PEER REVIEW 7 of 24
served in the GO terms among the species. Among those, we focused on antigen pro-cessing and presentation, activation of immune response and production of molecular mediator of immune response.
Figure 4. Summary of Biological Process immune system-related terms.
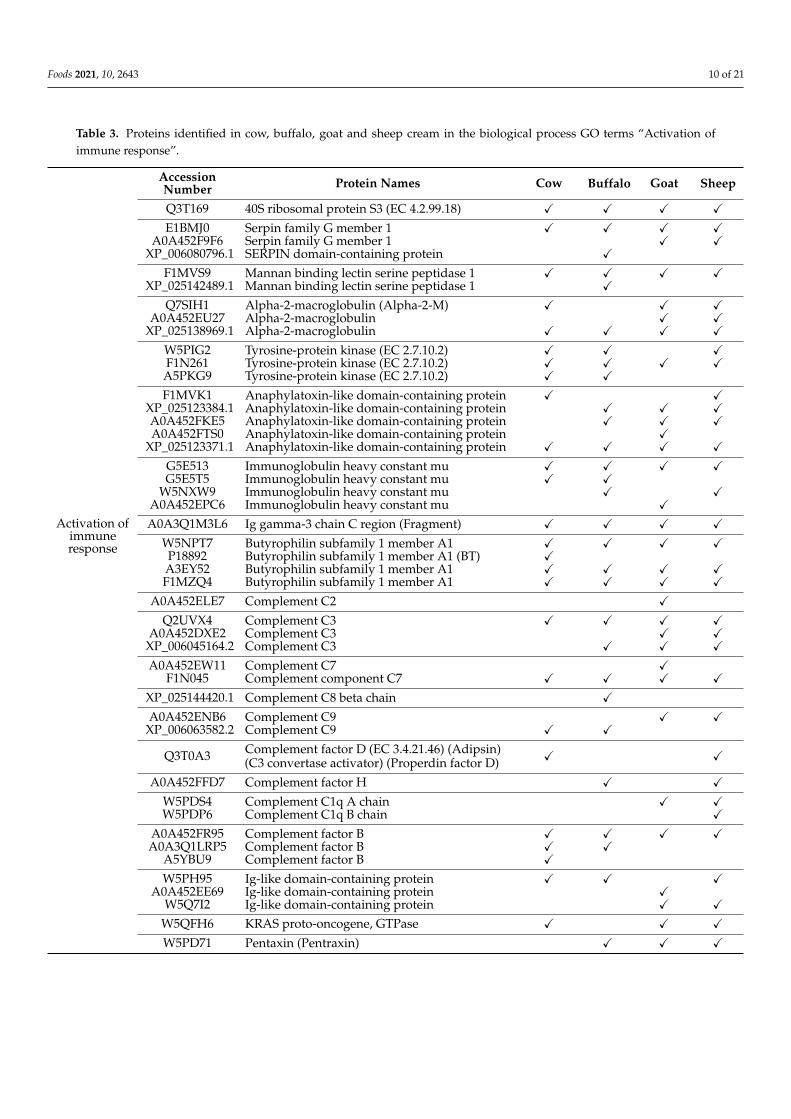
The antigen process and presentation was associated with 21 protein groups for cow, 23 for buffalo, 19 for goat and 23 for sheep cream (n = 1; Figure 4). When the proteins associated with this GO term were analysed, we observed several members of the RAS family (n = 15; Table 2). Of these proteins, eight were present in all species; two were pre-sent in cow, goat and sheep but not in buffalo; two were present in buffalo and goat and three proteins were specific for either buffalo, goat or sheep. Members of the RAS family have also been previously detected in human skim milk [27] as well as in the MFGM frac-tion of buffalo milk [28]. Several Ig-like domain-containing proteins were also detected across all species (Table 2). The proteasome activator complex subunit 1 was only detected in buffalo and sheep while the protein prosaposin was only detected in cow and sheep (Table 2). Prosaposin is the precursor protein for four lysosomal activator proteins, saposins A-D, which act as sphingolipid activator proteins that facilitate the hydrolysis of sphingolipids via lysosomal hydrolases [29]. In addition to this function, the full-length protein can also be secreted into several secretory fluids, including milk [30], where it acts as neurotrophic factor, promoting cell survival, neurite outgrowth and differentiation in a cholinergic cell line [31,32]. Prosaposin has been shown to be present in human milk as well as in milk of other species including cow and goat [30,33]. However, in our study, this protein was only detected in cow and sheep cream but not in buffalo or goat cream. This could either indicate that it is present at concentrations below the limit of detection or that levels could differ in cream versus milk.
Table 2. Proteins identified in cow, buffalo, goat and sheep cream in the biological process GO terms “Antigen process and presentation”.
0 20 40 60 80 100 120 140
immune response
regulation of immune system process
immune effector process
positive regulation of immune system process
leukocyte activation
activation of immune response
immune system development
negative regulation of immune system process
production of molecular mediator of immune response
antigen processing and presentation
leukocyte migration
myeloid cell homeostasis
leukocyte homeostasis
tolerance induction
T cell selection
lymphocyte costimulation
Immune system process-related terms
Sheep Goat Buffalo Bovine
Figure 4. Summary of Biological Process immune system-related terms.
The antigen process and presentation was associated with 21 protein groups for cow,23 for buffalo, 19 for goat and 23 for sheep cream (n = 1; Figure 4). When the proteinsassociated with this GO term were analysed, we observed several members of the RASfamily (n = 15; Table 2). Of these proteins, eight were present in all species; two were presentin cow, goat and sheep but not in buffalo; two were present in buffalo and goat and threeproteins were specific for either buffalo, goat or sheep. Members of the RAS family havealso been previously detected in human skim milk [27] as well as in the MFGM fraction ofbuffalo milk [28]. Several Ig-like domain-containing proteins were also detected across allspecies (Table 2). The proteasome activator complex subunit 1 was only detected in buffaloand sheep while the protein prosaposin was only detected in cow and sheep (Table 2).Prosaposin is the precursor protein for four lysosomal activator proteins, saposins A-D,which act as sphingolipid activator proteins that facilitate the hydrolysis of sphingolipidsvia lysosomal hydrolases [29]. In addition to this function, the full-length protein can alsobe secreted into several secretory fluids, including milk [30], where it acts as neurotrophicfactor, promoting cell survival, neurite outgrowth and differentiation in a cholinergic cellline [31,32]. Prosaposin has been shown to be present in human milk as well as in milkof other species including cow and goat [30,33]. However, in our study, this protein wasonly detected in cow and sheep cream but not in buffalo or goat cream. This could eitherindicate that it is present at concentrations below the limit of detection or that levels coulddiffer in cream versus milk.
Foods 2021, 10, 2643 8 of 21
Table 2. Proteins identified in cow, buffalo, goat and sheep cream in the biological process GO terms “Antigen processand presentation”.
Antigenprocessing
andpresentation
AccessionNumber Protein Names Cow Buffalo Goat Sheep
I1VE56 RAS oncogene protein X X X XW5QAY5 Ras-related protein Rab-10 X X X XW5QBQ8 Ras-related protein Rab-5C X X X X
C0IZ95 RAB27A (RAB27A, member RAS oncogenefamily) X X X
W5PDR1 RAB6A, member RAS oncogene family X X X XF1MNI4 RAB5B, member RAS oncogene family X X X X
A0A452FMD4 Ras-related protein Rab-13 X X XW5Q2D9 Ras-related protein Rab-5A-RAB5A X X X X
A0A452G9U0 RAB35, member RAS oncogene family X X X XA0A452EMT1 RAB3D, member RAS oncogene family X X X X
A6QR46 Ras-related protein Rab-6B XW5P4F5 RAB27B, member RAS oncogene family X
XP_006058006.1 Ras-related protein Rab-3A (Fragment) X XXP_006080000.1 Ras-related protein Rab-8B X XXP_006072022.1 Ras-related protein Rab-5A (Fragment) X
Q6QAT4 Beta-2-microglobulin X X X XP01888 Beta-2-microglobulin (Lactollin) X
A0A452DYV8 Alpha-2-glycoprotein 1, zinc-binding X X X X
Q3ZCH5 Zinc-alpha-2-glycoprotein (Zn-alpha-2-GP)(Zn-alpha-2-glycoprotein) X X
XP_006053677.1 Alpha-2-glycoprotein 1, zinc-binding X
A0A452F1W3 Thrombospondin 1 X X X X
G5E513 Immunoglobulin heavy constant mu X X X XW5NXW9 Immunoglobulin heavy constant mu X X
G5E5T5 Immunoglobulin heavy constant mu X XA0A452EPC6 Immunoglobulin heavy constant mu X
A0A452DRV9 Prosaposin X X
A0A3Q1MAG5 Proteasome activator complex subunit 1 X X
W5PXC6 Ig-like domain-containing protein XW5PI17 Ig-like domain-containing protein X
XP_006052357.2 Ig-like domain-containing protein X X XXP_025116417.1 Ig-like domain-containing protein X X
XP_006041616.1 Calreticulin X X X X
W5Q8S5 Aminopeptidase (EC 3.4.11.-) X
Within the GO term activation of the immune response, 35 proteins were detectedfor cow, 36 for buffalo, 41 for goat, and 43 for sheep (n = 1; Figure 4). From this group,several members of the complement family were detected across all species, with fewuniquely detected in some species (Table 3). The complement system includes plasmaproteins that coat extracellular pathogens, facilitating their removal by phagocytes ordirect killing. MFGM-related proteins associated with activation of the immune response,such as butyrophilin subfamily 1 member A1 and tyrosine-protein kinase, were alsoidentified across all species (Table 3). An interesting protein that was observed in allspecies except cow is pentraxin (Table 3). This protein family includes the short pentraxinsserum amyloid P component, C-reactive protein, and the prototypic long pentraxin PTX3.Pentraxins are part of the pattern recognition receptors (PRRs), which are specializedin recognition of highly conserved motifs expressed by microbes. These receptors areclassified based on their localization and include (1) endocytic PRRs, (2) signaling PRRsand (3) soluble PRRs, which include pentraxins, collectins and ficolins. These proteinscan bind selected microbes and facilitate their disposal by phagocytes [34]. PTX3 hasbeen shown to be present in human breast milk, potentially contributing to the protectionof infants against infections [35]. Interestingly, Mudaliar and colleagues have shownupregulation of PTX3 in an experimental model of cow mastitis [36]. This protein is

Foods 2021, 10, 2643 9 of 21
indeed produced at sites of infection and inflammation by both somatic and immunecells, and its glycosylation has been implicated in modulating protein functions, includingthe modulation of the complement system through the interaction with the complementcomponent C1q (reviewed by [37]). Interestingly, our analysis has identified complementC1q A chain and B chain in goat and sheep, and in sheep, respectively, while neither weredetected in cow and buffalo (Table 3). This could again either indicate that these proteinsare present at concentrations below the limit of detection.
Another protein that was detected in all species, except cow, is the major prionprotein (PrP) (Table 3). This protein has received considerable attention due to its role inthe pathogenesis of prion disease or spongiform encephalopathies (TSEs), affecting bothhumans and animals. The normal PrP (PrPC) is apparently benign. However, it is capableof post-translational misfolding into an abnormal and infectious isoform (PrPSc) [38]. Thenormal PrPc has been detected, with differences in expression, in the mammary glandof domestic ruminants such as cow, sheep and goat [39–41], as well as in humans, cow,sheep and goat milk [42,43]. In contrast to these findings, Didier and colleagues [40], didnot detect PrPC in any of the cow milk fractions analysed in their study, including cream,which is consistent with what we have observed in our study. However, this is probablydue to the methodology used in Franscini’s study, which leads to a higher concentration ofthe prion content. Interestingly, PrPC was easily detected in sheep and goat milk fractions,with the highest levels observed in the cream fraction [40]. This evidence suggests thatPrP may be present in our cow cream sample but below the limits of detection, while thehigher levels present in goat and sheep cream allowed for its detection. No evidence hasbeen shown to date for the presence of PrP in buffalo milk.
Alpha-2-macrogobulin (A2M) is a plasma protein involved in the inhibition of a widerange of serum proteases. While we have only detected this protein in goat and sheepcream (Table 3), in a previous study, A2M was detected in cow milk, with the highestconcentration in the first milking [44]. This could be related to the capacity of A2M toinhibit the protease, hence preventing the degradation of biologically active proteins (i.e.,immunoglobulins) in the intestine of the newborn. Furthermore, A2M plays a key roleas a humoral defence barrier against pathogens, binding host or foreign peptides andparticles [45]. Interestingly, higher concentrations of A2M have been detected in mastiticcow’s milk compared to normal milk and this was related to the degree of mastitis [44].
Toll-like receptor 4 (TLR4) was detected only in buffalo under the GO terms activa-tion of immune response and production of molecular mediator of the immune system(Tables 3 and 4). As with pentraxins, Toll-like receptors are PRRs. TLR4 recognises bacte-rial lipopolysaccharide (LPS), which leads to the activation of the intracellular signallingpathway, NF-κB and the subsequent production of inflammatory cytokine, activating theinnate immune system [46]. The presence of TLR4 has been previously investigated inbreast milk (MFGM and skimmed fraction) by Cattaneo and colleagues [47]. In this study,TLR4 was not detected in the samples analysed; however, the group concluded that thisresult cannot assure the total absence of this receptor in milk but could also be due tothe limit of detection of the instrument or the methodology used. Interestingly, Cao andcolleagues [48], detected this receptor in both colostrum and mature milk MFGM withhigher levels found in the latter. TLR4 was also detected in the sheep milk whey proteinfraction [49], while to our knowledge, there is no evidence of the presence of TLR4 in milkor milk fractions in cow, goat, and buffalo.
Foods 2021, 10, 2643 10 of 21
Table 3. Proteins identified in cow, buffalo, goat and sheep cream in the biological process GO terms “Activation ofimmune response”.
Activation ofimmuneresponse
AccessionNumber Protein Names Cow Buffalo Goat Sheep
Q3T169 40S ribosomal protein S3 (EC 4.2.99.18) X X X X
E1BMJ0 Serpin family G member 1 X X X XA0A452F9F6 Serpin family G member 1 X X
XP_006080796.1 SERPIN domain-containing protein X
F1MVS9 Mannan binding lectin serine peptidase 1 X X X XXP_025142489.1 Mannan binding lectin serine peptidase 1 X
Q7SIH1 Alpha-2-macroglobulin (Alpha-2-M) X X XA0A452EU27 Alpha-2-macroglobulin X X
XP_025138969.1 Alpha-2-macroglobulin X X X X
W5PIG2 Tyrosine-protein kinase (EC 2.7.10.2) X X XF1N261 Tyrosine-protein kinase (EC 2.7.10.2) X X X XA5PKG9 Tyrosine-protein kinase (EC 2.7.10.2) X X
F1MVK1 Anaphylatoxin-like domain-containing protein X XXP_025123384.1 Anaphylatoxin-like domain-containing protein X X XA0A452FKE5 Anaphylatoxin-like domain-containing protein X X XA0A452FTS0 Anaphylatoxin-like domain-containing protein X
XP_025123371.1 Anaphylatoxin-like domain-containing protein X X X X
G5E513 Immunoglobulin heavy constant mu X X X XG5E5T5 Immunoglobulin heavy constant mu X X
W5NXW9 Immunoglobulin heavy constant mu X XA0A452EPC6 Immunoglobulin heavy constant mu X
A0A3Q1M3L6 Ig gamma-3 chain C region (Fragment) X X X X
W5NPT7 Butyrophilin subfamily 1 member A1 X X X XP18892 Butyrophilin subfamily 1 member A1 (BT) XA3EY52 Butyrophilin subfamily 1 member A1 X X X XF1MZQ4 Butyrophilin subfamily 1 member A1 X X X X
A0A452ELE7 Complement C2 X
Q2UVX4 Complement C3 X X X XA0A452DXE2 Complement C3 X X
XP_006045164.2 Complement C3 X X X
A0A452EW11 Complement C7 XF1N045 Complement component C7 X X X X
XP_025144420.1 Complement C8 beta chain X
A0A452ENB6 Complement C9 X XXP_006063582.2 Complement C9 X X
Q3T0A3 Complement factor D (EC 3.4.21.46) (Adipsin)(C3 convertase activator) (Properdin factor D) X X
A0A452FFD7 Complement factor H X X
W5PDS4 Complement C1q A chain X XW5PDP6 Complement C1q B chain X
A0A452FR95 Complement factor B X X X XA0A3Q1LRP5 Complement factor B X X
A5YBU9 Complement factor B X
W5PH95 Ig-like domain-containing protein X X XA0A452EE69 Ig-like domain-containing protein X
W5Q7I2 Ig-like domain-containing protein X X
W5QFH6 KRAS proto-oncogene, GTPase X X X
W5PD71 Pentaxin (Pentraxin) X X X
Foods 2021, 10, 2643 11 of 21
Table 3. Cont.
AccessionNumber Protein Names Cow Buffalo Goat Sheep
P23907 Major prion protein (PrP) (CD antigen CD230) X X X
A0A452F2C6 Ezrin X X X XP31976 Ezrin (Cytovillin) (Villin-2) (p81) X
W5NXJ3 TED_complement domain-containing protein X X
A0A452E5L3 Protein tyrosine phosphatase receptor type J XXP_025121828.1 Peptidylprolyl isomerase X X X X
W5NRI1 A2M_N_2 domain-containing protein X XW5NU00 A2M domain-containing protein X
W5PGT9 Ig epsilon chain C region (Fragment) XG3N342 Ig epsilon chain C region (Fragment) X
W5P5T4 NTR domain-containing protein X
XP_006064867.1 NRAS proto-oncogene, GTPase X X X X
XP_006057277.2 Toll-like receptor 4 X
W5NQC1 Presenilin (EC 3.4.23.-) X X
P50448 Factor XIIa inhibitor (XIIaINH) X
A0A3Q1LPG0 Uncharacterized protein X XA0A3Q1N3I9 Uncharacterized protein XA0A452F0Q6 Uncharacterized protein X X XA0A452F0Q1 Uncharacterized protein X
Under the GO term production of molecular mediator of the immune system, 26 proteinswere detected for cow, 19 for buffalo, 24 for goat and 21 for sheep (n = 1; Figure 4). MFGMrelated proteins such as platelet glycoprotein 4/CD36, Toll-like receptor 2, apolipoprotein A1have been identified across all species as well as several Ig-like domain-containing proteins(Table 4).
An interesting protein that was detected in cow, goat and sheep cream but not inbuffalo is the transforming growth factor beta-2 proprotein (Table 4). The protein intensities,however, were low in these three species; thus, it could be the case that even lowerlevels were present in buffalo that went undetected as opposed to this protein beingabsent. The transforming growth factor beta-2 proprotein is the precursor of the latency-associated peptide (LAP) and transforming growth factor beta-2 (TGF-β2) chains, whichconstitute the regulatory and active subunit of TGF-β2, respectively. TGF-β, is the mostabundant cytokine in breast milk, and includes TGF-β1 and TGF-β2, with the latter beingpredominant [50,51]. Breast milk TGF-β has gained increasing interest as it is involved inmaintaining intestinal homeostasis, regulating inflammatory responses and promoting thedevelopment of neonatal oral tolerance [52,53]. Breast milk TGFβ2 has also been shown tobe associated with the neonatal gut microbial composition and increased richness, evenness,and diversity [54]. The relationship between TGFβ and allergies prevention is controversial.An initial systematic review showed that high concentrations of TGF-β1 or TGF-β2 inhuman milk, were positively associated with a reduction in immunological outcomes ofallergies in seven of 12 studies included [55]. However, the result of a recent systemic reviewwas in contrast with this conclusion, not finding strong evidence of associations betweenany isoform of human milk TGF-β and allergic outcomes [56]. Both TGF-β isoforms havealso been identified in cow milk with TGF-β2 being again the most abundant [57]. In cowmilk both TGF-β2 and TGF-β1 levels has been shown to increase during mastitis inducedby E. coli [58]. To our knowledge this is the first time that TGF-β2 has been shown in goatand sheep cream.

Foods 2021, 10, 2643 12 of 21
Table 4. Proteins identified in cow, buffalo, goat and sheep cream in the biological process GO terms “Production ofmolecular mediator of immune response”.
Productionof
molecularmediator
of immuneresponse
AccessionNumber Protein Names Cow Buffalo Goat Sheep
W5QHZ5 Ig kappa chain C region X XF1MZ96 Ig kappa chain C region X
A0A452F4S4 Ig-like domain-containing protein X X XF1MLW8 Ig-like domain-containing protein X XF1N160 Ig-like domain-containing protein X X
W5PSQ7 Ig-like domain-containing protein X X X XA0A3Q1LWV8 Ig-like domain-containing protein X X XA0A3Q1MSF6 Ig-like domain-containing protein X X X XA0A452EVZ5 Ig-like domain-containing protein XA0A452E8D3 Ig-like domain-containing protein X X X X
A0A3Q1NI92 Semaphorin 7A XXP_006046407.2 Semaphorin 7A (John Milton Hagen blood group) XA0A452G0Z2 Semaphorin 7A (John Milton Hagen blood group) X X
W5QAB1 Hemopexin X XQ3SZV7 Hemopexin X X X X
XP_006042170.1 Hemopexin X X
P26201Platelet glycoprotein 4 (Glycoprotein IIIb) (GPIIIB)(PAS IV) (PAS-4) (Platelet glycoprotein IV) (GPIV)(CD antigen CD36)
X X
A0A452G1U2 CD36 molecule X X X XW5Q6I2 CD36 molecule XW5Q6N3 CD36 molecule X X X
Q0GC71 Toll-like receptor 2 (EC 3.2.2.6) (CD antigen CD282) X X X XQ95LA9 Toll-like receptor 2 (EC 3.2.2.6) (CD antigen CD282) X X X X
A0A452G4X3 Toll-like receptor 2 X XW5Q0A3 Toll-like receptor 2 XF1N720 Toll-like receptor 2 X
XP_006057277.2 Toll-like receptor 4 X
A0A452FI14 Apolipoprotein A1 X X X XXP_025122634.1 Apolipoprotein A1 X X
A0A3Q1MAA6 Growth arrest specific 6 X
P21214
Transforming growth factor beta-2 proprotein(Milk growth factor) (MGF) [Cleaved into:Latency-associated peptide (LAP); Transforminggrowth factor beta-2 (TGF-beta-2)]
X X X
XP_006050765.1 DnaJ heat shock protein family (Hsp40)member B9 X X X X
G3MZ88 J domain-containing protein X
P81644
Apolipoprotein A-II (Apo-AII) (ApoA-II)(Antimicrobial peptide BAMP-1) (ApolipoproteinA2) [Cleaved into: Proapolipoprotein A-II(ProapoA-II); Truncated apolipoprotein A-II(Apolipoprotein A-II(1-76))]
X X X
Q6QAT4 Beta-2-microglobulin X X X XP01888 Beta-2-microglobulin (Lactollin) X
Q1ZZU7
Macrophage migration inhibitory factor (MIF) (EC5.3.2.1) (L-dopachrome isomerase) (L-dopachrometautomerase) (EC 5.3.3.12)(Phenylpyruvate tautomerase)
X X X
W5PAG0 Lysine–tRNA ligase (EC 6.1.1.6)(Lysyl-tRNA synthetase) X X
A0A452FWT3 Sphingosine kinase 2 X
Another cytokine that was detected in cow, goat and sheep but not in buffalo isthe macrophage migration inhibitory factor (MIF) (Table 4). This cytokine is released inresponse to proinflammatory stimuli and inhibits the migration of macrophages, enhancing

Foods 2021, 10, 2643 13 of 21
their phagocytic activity. The presence of MIF in human milk was identified for the firsttime by Magi and colleagues [59], in the milk aqueous phase and inside milk fat globules.This was further confirmed by Vigh and colleagues [60], who detected a high concentrationof MIF in breast milk, especially during the first month of lactation. No studies to datehave shown the presence of MIF in the milk of any of the species subject of this study.
3.4. Lipid Analysis of Cream Samples from Four Species
Milk fat contains several thousand lipid species and is the most complex material innature in terms of lipid composition. The fatty acid (FA) composition of milk fat triglyc-erides (which account for approximately 98% of total milk lipids) are affected by severalfactors, including species, breed, diet, and seasonality [61]. The milk fat of domesticatedanimals is composed primarily of two major fractions: long-chain (50–70%) and short-chainFAs (30–50%).
Long-chain FAs (C18-24) are typically derived from the diet, whereas short-chain FAs(C4 to C14 and some C16), are synthesized de novo by the mammary gland. Saturated FAsin ruminant milk accounts for approximately 60 to 70% of the total.
In the present study, total fat (n = 1; Table 5) and fatty acid content of all cream sampleswere determined. The levels of saturated fatty acids (SFA) were lowest in sheep cream andbroadly similar in the cream of the other species examined (n = 1; Table 6). MacGibbonand Taylor [62] and Markiewicz-Keszycka et al. [63] also reported lower total SFA in sheepmilk compared to cow and goat. In terms of short-chain FAs, buffalo cream contained thehighest levels of butyric acid (C4:0), whereas the levels of caprylic (C8:0) and capric (C10:0)acids were much higher in sheep and goat milk fat than that of cow and buffalo. Caproic,caprylic and capric acids are so termed because of their high proportions in goat milk.Variations in de novo synthesis of short-chain FAs are controlled by several genes expressedin the mammary gland [64], and may account for the differences observed between species.Palmitic acid (C16:0) was highest in cow cream (32.2%) and was, with the exception ofsheep milk fat (19.7% w/w), the most abundant of all FAs. Castro-Gomez et al. [65] reportedgreater similarities in C16:0 between cow, sheep and goat milks with values of 32, 29 and28%, respectively. Palmitic acid, along with a number of other high-melting-point FAs, is themain contributor to hardness in milk fat products as it remains solid at room temperature.
Table 5. Fat content (g/100g) in cream samples from cow, buffalo, goat and sheep cream samples.
Cow (g/100g) Sheep (g/100g) Goat (g/100g) Buffalo (g/100g)
Fat Content 84.4 87.4 86.6 91.2
Oleic acid (C18:1), the most abundant monounsaturated FA (MUFA) in mammalianmilk fat, was highest in sheep milk and was very similar in the other three species. Incontrast with C16:0, it is a low-melting FA and thus, contributes to the liquid phase insemi-crystalline dairy products, thereby contributing to softness and spreadability. OtherMUFAs in ruminant milk include myristoleic acid (C14:1), which was much lower insheep and goat cream compared to that of cow or bubalus bubalis; palmitoleic (C16:1),lowest in goat milk, and vaccenic acid (C18:1 trans), a naturally occurring trans FA withcholesterol-lowering functionality.
Generally speaking, milk fat of non-ruminants has a higher level of polyunsaturatedFAs (PUFA) than that of ruminants, due predominantly to direct absorption from thediet [62]. Sheep milk fat had higher levels of PUFA than the other species examined, afinding supported by previous reports [62,66,67]. This difference is attributable, in the main,to the high levels of linoleic acids (C18:2), a diverse group of FA isomers, which includesα-linoleic acid (C18:2 n-6, cis), one of two essential FAs, and a number of conjugatedlinoleic acid isomers (CLA), a group of FAs associated with a range of health benefits.Serra et al. [67] reported that feeding with linseed oil significantly increased levels oflinolenic (C18:3) and rumenic acid (C18:2 CLA) in sheep milk, with both of these also

Foods 2021, 10, 2643 14 of 21
present in higher quantities at the sn-2 (middle) position of the triglyceride molecule.Markiewicz-Keszycka et al. [63] reported that sheep and goat milks are usually richer inCLA than cow milk and that the concentration of CLA in the milk fat of sheep milk isgreater than that in goat milk, with this effect due to differences in the mRNA of theirmammary adipocytes. The level of C18:3, the other fatty acid essential to human nutritionalneeds, was significantly lower in goat cream, compared to the other species. Arachidonicacid (C20:4, n-6) was approximately twice as high in sheep cream as cow, goat and buffalomilk fat.
Table 6. Fatty acid composition in the sn-2 position of the triglyceride molecules in cream samples from cow, buffalo, goatand sheep cream samples.
FattyAcids Triglycerides
Répartition %
Sn2 Sn1+3
Cow Sheep Goat Buffalo Cow Sheep Goat Buffalo Cow Sheep Goat Buffalo
C4:0 3.5 3.6 3 4.6 2.6 2.7 2.6 3 97.4 97.3 97.4 97
C6:0 2 2.7 2.5 2.5 2.8 4.6 3.7 4.5 97.2 95.4 96.3 95.5
C8:0 1.1 2.7 2.6 1.4 17.4 23.2 21 28.4 82.6 76.8 79 75.2
C10:0 2.6 7.9 8.9 2.8 21.6 26.4 25.3 27.9 78.4 73.6 74.7 72.1
C12:0 3 4.3 4.2 3.3 37.9 37.3 42.3 40.1 62.1 62.7 57.7 59.9
C13:0 0.2 0.2 0.2 0.1 37.2 36.2 38.6 41.6 62.8 63.8 61.4 58.4
C14:0 11.2 9.1 10.2 12.4 51.6 43.6 55 47.1 48.4 56.4 45 52.9
C14:1 0.9 0.1 0.2 0.8 37.6 46.1 43.6 45.1 62.4 53.9 56.4 54.9
C15:0 2.4 2 1.6 1.9 46.3 42.8 46.7 43.8 53.7 57.2 53.3 56.2
C16:0 32.2 19.7 27.2 27.8 41.5 29.5 35.3 34.3 58.5 70.5 64.7 65.7
C16:1 1.7 1.6 1.1 2.1 51.5 42.8 49.6 42.8 48.5 57.2 50.4 51.8
C17:0 1.8 1.5 1.6 1.1 33.1 33.8 33 38.4 66.9 66.2 67 61.6
C17:1 0.3 0.2 0.3 0.2 55.1 55.3 58.1 58.8 44.9 44.7 41.9 41.2
C18:0 10.1 9.9 8.9 9.7 16.7 29 22.3 24.8 83.3 71 77.7 75.2
C18:1 22.6 26.6 23.1 23.6 27 39.2 32.7 34.8 73 60.8 67.3 65.2
C18:2 2.9 6.2 3.6 4.4 31.3 42.9 39.9 34.9 68.7 57.1 60.1 65.1
C18:3 (n-3) 1 1.1 0.4 0.9 24.9 29.6 32.2 27.5 75.1 70.4 67.8 72.5
C20:0 0.2 0.1 0.2 0.1 - 63.8 53.6 19.7 - 36.2 46.4 80.3
C20:1 0.1 <0.05 <0.05 0.1 - - - - - - - -
C20:3 (n-6) <0.05 <0.05 <0.05 <0.05 - - - - - - - -
C20:4 (n-6) 0.1 0.1 0.2 <0.05 25.7 49.1 29.5 - 74.3 50.9 70.5 -
C20:5 (n-3) 0.1 0.1 0.1 20.8 44.2 - 79.2 55.8 -
C22:0 0.1 0.1 <0.05 0.1 - 83.9 - - - 16.1 - -
C22:1 <0.05 <0.05 <0.05 <0.05 - - - - - - - -
C22:5 (n-3) 0.2 0.1 0.1 89.2 - 52.1 10.8 - 47.9
C22:6 (n-3) <0.05 0.1 <0.05 <0.05 - 90.6 - - - 9.4 - -
C24:0 <0.05 <0.05 <0.05 <0.05 - - - - - - - -
C24:1 <0.05 <0.05 <0.05 <0.05 - - - - - - - -
In general, the FA profiles of cow and buffalo milk fat were, with the exception ofbutyric, palmitic and linoleic acids, similar in composition. Pegolo et al. [68] reportedthat buffalo and cow species have comparable average milk FA although others have

Foods 2021, 10, 2643 15 of 21
reported greater variations [69,70]. The lipid composition of milk responds to changes indiet in a more pronounced way compared to other macro-constituents such as proteins,which are determined largely by genetics. FA profile can be manipulated through directaddition (supplementation) of FAs in the diet, alteration of rumen conditions, or viabiotransformation, in the rumen, of dietary FAs to other (long-chain) FA species. Pasturefeeding increases the concentration of certain milk FAs, mainly C18:0 C18:1 C18:3 and CLA,and decreases saturated FAs from C10:0 to C16:0 [46,54]. Mixed-ration (concentrated) feedshave been reported to yield higher levels of C16:0 and lower levels of nutritionally beneficialFAs [5]. The health implications of milk fat consumption have, for many years, generatedmuch controversy and confusion, resulting in commonly held negative perceptions. Morerecently, meta-analytical studies have redressed this imbalance and have contributed to agradual shift in scientific opinion that considers the contribution of SFAs to human healthto be less detrimental than previously thought. This topic has been the subject of recentreviews by Mohan et al. [61] and Lordan and Zabetakis [71].
3.4.1. Fatty Acid Positional Distribution
During digestion, fats undergo enzymatic hydrolysis by pancreatic lipases, whichcleave FAs preferentially from the sn-1 and sn-3 positions, i.e., the outer positions of thetriglyceride molecule, leaving the central sn-2 FA attached to the glycerol molecule. Thesesn-2 monoglycerides are freely absorbed regardless of the remaining FA type. The rateof absorption of free FAs (FFAs) emanating from the sn-1 and sn-3 positions depends onFA chain length with longer chain FAs (C12:0 to C18:0) less readily absorbed than shorterchain FAs (C6:0 to C10:0). As such positional esterification of FAs is important in termsof nutrition and energy provision to the neonate. Human milk has an unusually highproportion of C16:0 at the sn-2 position (60% or more), which facilitates absorption anddigestion, and has led to recent interest in the provision of infant formulae (IF) with thistriglyceride structure.
Vegetable oils, traditionally used in IF, have much lower levels of palmitic acid atsn-2. Comparison of the sn-2 content of the milk fats examined in this study (n = 1; Table 7)demonstrate that cow cream had the highest level of palmitic acid (41.5%) with sheepthe lowest at 29.5%. Others have reported similar values [72,73] for cow milk fat withrather less data available for other species [67,74,75]. Blasi et al. [76] reported % sn-2 valuesfor C16:0 of 44.1, 35.7, 27.2 and 40.9 for cow, goat, sheep and buffalo milk, respectively.Although comparatively lower than human milk with respect to sn-2 C16:0 levels cow milkstill represents a valuable source and is a promising substrate for lipase-induced structuralmodification of milk fat triglycerides for inclusion into IF products. In the case of sn-1and sn-3 FA positioning, the results of the present study are similar to those publishedby Blasi et al. [76] and summarised by MacGibbon and Taylor [62] and Mohan et al. [61].Studies suggest that the regiospecific binding of FA is likely to be genetically based [77]. Theinfluence of the positional distribution of FAs on both nutrition and functional properties(melting and crystallisation) of lipid triglycerides remains poorly understood.
3.4.2. Phospholipids
The polar lipids of milk are the main constituents of the MFGM; the tri-layer filmthat stabilises milk fat globules against coalescence. The composition of the MFGM rangeswidely, with polar lipids accounting for 30–75% and proteins making up 25–75% [78]. Polarlipids make up only 0.4–1% of total milk lipids. Phospholipids (PL) are a sub-class of polarlipids comprised of glycerophospholipids and sphingolipids, which have well-establishednutraceutical properties [79]. The main polar lipids of milk are phosphatidylcholine (PC),phosphatidylethanolamine (PE), phosphatidylinositol (PI), phosphatidylserine (PS) andsphingomyelin (SM). In the present study, goat milk fat had the highest total % weightof PL, with buffalo the lowest (n = 1; Table 7). The average fat globule size is generallylower in small ruminant species, compared to cow (goat < sheep < cow), and has a greaterproportion of PL (as seen in the content of goat milk fat), a requirement for the stabilisation
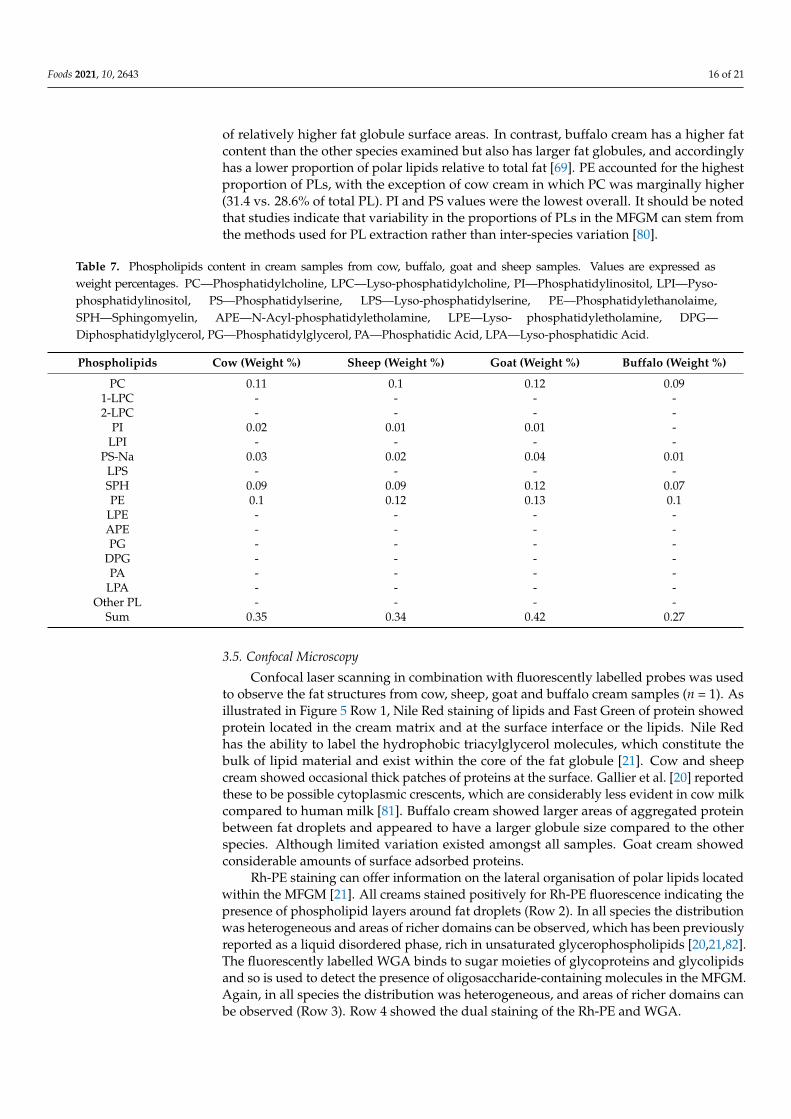
Foods 2021, 10, 2643 16 of 21
of relatively higher fat globule surface areas. In contrast, buffalo cream has a higher fatcontent than the other species examined but also has larger fat globules, and accordinglyhas a lower proportion of polar lipids relative to total fat [69]. PE accounted for the highestproportion of PLs, with the exception of cow cream in which PC was marginally higher(31.4 vs. 28.6% of total PL). PI and PS values were the lowest overall. It should be notedthat studies indicate that variability in the proportions of PLs in the MFGM can stem fromthe methods used for PL extraction rather than inter-species variation [80].
Table 7. Phospholipids content in cream samples from cow, buffalo, goat and sheep samples. Values are expressed asweight percentages. PC—Phosphatidylcholine, LPC—Lyso-phosphatidylcholine, PI—Phosphatidylinositol, LPI—Pyso-phosphatidylinositol, PS—Phosphatidylserine, LPS—Lyso-phosphatidylserine, PE—Phosphatidylethanolaime,SPH—Sphingomyelin, APE—N-Acyl-phosphatidyletholamine, LPE—Lyso- phosphatidyletholamine, DPG—Diphosphatidylglycerol, PG—Phosphatidylglycerol, PA—Phosphatidic Acid, LPA—Lyso-phosphatidic Acid.
Phospholipids Cow (Weight %) Sheep (Weight %) Goat (Weight %) Buffalo (Weight %)
PC 0.11 0.1 0.12 0.091-LPC - - - -2-LPC - - - -
PI 0.02 0.01 0.01 -LPI - - - -
PS-Na 0.03 0.02 0.04 0.01LPS - - - -SPH 0.09 0.09 0.12 0.07PE 0.1 0.12 0.13 0.1
LPE - - - -APE - - - -PG - - - -
DPG - - - -PA - - - -
LPA - - - -Other PL - - - -
Sum 0.35 0.34 0.42 0.27
3.5. Confocal Microscopy
Confocal laser scanning in combination with fluorescently labelled probes was usedto observe the fat structures from cow, sheep, goat and buffalo cream samples (n = 1). Asillustrated in Figure 5 Row 1, Nile Red staining of lipids and Fast Green of protein showedprotein located in the cream matrix and at the surface interface or the lipids. Nile Redhas the ability to label the hydrophobic triacylglycerol molecules, which constitute thebulk of lipid material and exist within the core of the fat globule [21]. Cow and sheepcream showed occasional thick patches of proteins at the surface. Gallier et al. [20] reportedthese to be possible cytoplasmic crescents, which are considerably less evident in cow milkcompared to human milk [81]. Buffalo cream showed larger areas of aggregated proteinbetween fat droplets and appeared to have a larger globule size compared to the otherspecies. Although limited variation existed amongst all samples. Goat cream showedconsiderable amounts of surface adsorbed proteins.
Rh-PE staining can offer information on the lateral organisation of polar lipids locatedwithin the MFGM [21]. All creams stained positively for Rh-PE fluorescence indicating thepresence of phospholipid layers around fat droplets (Row 2). In all species the distributionwas heterogeneous and areas of richer domains can be observed, which has been previouslyreported as a liquid disordered phase, rich in unsaturated glycerophospholipids [20,21,82].The fluorescently labelled WGA binds to sugar moieties of glycoproteins and glycolipidsand so is used to detect the presence of oligosaccharide-containing molecules in the MFGM.Again, in all species the distribution was heterogeneous, and areas of richer domains canbe observed (Row 3). Row 4 showed the dual staining of the Rh-PE and WGA.

Foods 2021, 10, 2643 17 of 21
Foods 2021, 10, x FOR PEER REVIEW 19 of 24
generally lower in small ruminant species, compared to cow (goat < sheep < cow), and has a greater proportion of PL (as seen in the content of goat milk fat), a requirement for the stabilisation of relatively higher fat globule surface areas. In contrast, buffalo cream has a higher fat content than the other species examined but also has larger fat globules, and accordingly has a lower proportion of polar lipids relative to total fat [69]. PE accounted for the highest proportion of PLs, with the exception of cow cream in which PC was mar-ginally higher (31.4 vs. 28.6% of total PL). PI and PS values were the lowest overall. It should be noted that studies indicate that variability in the proportions of PLs in the MFGM can stem from the methods used for PL extraction rather than inter-species varia-tion [80].
3.5. Confocal Microscopy Confocal laser scanning in combination with fluorescently labelled probes was used
to observe the fat structures from cow, sheep, goat and buffalo cream samples (n = 1). As illustrated in Figure 5 Row 1, Nile Red staining of lipids and Fast Green of protein showed protein located in the cream matrix and at the surface interface or the lipids. Nile Red has the ability to label the hydrophobic triacylglycerol molecules, which constitute the bulk of lipid material and exist within the core of the fat globule [21]. Cow and sheep cream showed occasional thick patches of proteins at the surface. Gallier et al. [20] reported these to be possible cytoplasmic crescents, which are considerably less evident in cow milk com-pared to human milk [81]. Buffalo cream showed larger areas of aggregated protein be-tween fat droplets and appeared to have a larger globule size compared to the other spe-cies. Although limited variation existed amongst all samples. Goat cream showed consid-erable amounts of surface adsorbed proteins.
Figure 5. Row 1: Confocal micrographs showing milk fat globules stained with Nile Red (Green) and Fast Green FCF (red). The triacylglycerol core of the fat droplets is stained with Nile Red (green spheres) and the red indicates interfacial proteins. Row 2: Emission fluorescence of Rh-PE dye (green). The surface of fat droplets stained with Rh-PE indicating phospholipid coatings in the sam-ples. Row 3. Emission fluorescence of WGA Alexa Fluor 488. Glycosylated molecules such as sugar residues from glycoproteins and glycolipids are shown by staining with WGA (red). Row 4. Confo-cal micrographs showing fluorescence emission of both the fluorescently labelled phospholipid Rh-PE (green) and lectin wheat germ agglutinin (red). Scale for all images = 10 µm. Column A = Cow cream, Column B = Buffalo cream, Column = Goat cream and Column D = Sheep cream.
Figure 5. Row 1: Confocal micrographs showing milk fat globules stained with Nile Red (Green)and Fast Green FCF (red). The triacylglycerol core of the fat droplets is stained with Nile Red (greenspheres) and the red indicates interfacial proteins. Row 2: Emission fluorescence of Rh-PE dye(green). The surface of fat droplets stained with Rh-PE indicating phospholipid coatings in thesamples. Row 3. Emission fluorescence of WGA Alexa Fluor 488. Glycosylated molecules such assugar residues from glycoproteins and glycolipids are shown by staining with WGA (red). Row 4.Confocal micrographs showing fluorescence emission of both the fluorescently labelled phospholipidRh-PE (green) and lectin wheat germ agglutinin (red). Scale for all images = 10 µm. Column A = Cowcream, Column B = Buffalo cream, Column = Goat cream and Column D = Sheep cream.
4. Conclusions
In this study, the similarities and distinct differences in the MFG structure, proteinand lipid composition of cow, buffalo, goat and sheep cream were reported. Althoughbulk mature milk representing the totality of commercial dairy herds was used to producecream samples for investigation, it is important to recognize the need for a follow-up studythat investigates the impact of feed, lactation stage and other factors on milk composition.Overall, the nutritional and functional value of all cream types was demonstrated. Fur-thermore, comparative analyses have revealed that buffalo, goat and sheep cream couldhave the potential to replicate the functional outcomes associated with the consumptionof the cow milk fat globule membrane, including the support of the development of theinfant immune and gastrointestinal system, cognitive function, protection from infection,and cardiovascular and muscular health. Further studies are warranted to confirm allhealth-promoting properties of the creams and to attribute these benefits to the MFGM.
Supplementary Materials: The following are available online at https://www.mdpi.com/article/10.3390/foods10112643/s1. Figure S1: Summary of MF terms of protein groups from analysis of creamfrom four species, with absolute numbers (left) and normalised to the total number of annotatedproteins (right) (n = 1). Figure S2: Summary of CC terms of protein groups from analysis of creamfrom four species, with absolute numbers (left) and normalised to total number of annotated proteins(right) (n = 1).
Author Contributions: Conceptualization, J.A.L.; investigation, V.D.F., J.A.L., R.A.O., and D.K.;resources, J.A.L.; data curation, V.D.F., R.A.O.; writing—original draft preparation, V.D.F., J.A.L.,R.A.O., S.A.H., and D.K.; writing—review and editing, V.D.F., J.A.L., R.A.O., S.A.H., and D.K.;

Foods 2021, 10, 2643 18 of 21
supervision, J.A.L.; project administration, J.A.L., V.D.F.; All authors have read and agreed to thepublished version of the manuscript.
Funding: The work was financially supported by Health and Happiness Group. Mass spectrometryequipment for proteomics was funded by a competitive infrastructure award from Science FoundationIreland (SFI) (12/RI/2346 (3)).
Conflicts of Interest: R.A.O. has received costs for mass spectrometry services from Health and Hap-piness Group. D.K. has received costs for confocal microscopy services from Health and HappinessGroup. J.A.L and V.D.F. are employees of Health and Happiness Group.
References1. Magan, J.B.; O′Callaghan, T.F.; Kelly, A.L.; McCarthy, N.A. Compositional and functional properties of milk and dairy products
derived from cows fed pasture or concentrate-based diets. Compr. Rev. Food Sci. Food Saf. 2021, 20, 2769–2800. [CrossRef]2. O’Callaghan, T.F.; Hennessy, D.; McAuliffe, S.; Kilcawley, K.N.; O’Donovan, M.; Dillon, P.; Ross, R.P.; Stanton, C. Corrigendum to
“Effect of pasture versus indoor feeding systems on raw milk composition and quality over an entire lactation”. J. Dairy Sci. 2018,101, 8615. [CrossRef] [PubMed]
3. O’Callaghan, T.F.; Hennessy, D.; McAuliffe, S.; Kilcawley, K.N.; O’Donovan, M.; Dillon, P.; Ross, R.P.; Stanton, C. Effect of pastureversus indoor feeding systems on raw milk composition and quality over an entire lactation. J. Dairy Sci. 2016, 99, 9424–9440.[CrossRef] [PubMed]
4. Schönfeldt, H.C.; Hall, N.G.; Smit, L.E. The need for country specific composition data on milk. Food Res. Int. 2012, 47, 207–209.[CrossRef]
5. Alothman, M.; Hogan, S.A.; Hennessy, D.; Dillon, P.; Kilcawley, K.N.; O’Donovan, M.; Tobin, J.; Fenelon, M.A.; O’Callaghan, T.F.The “grass-fed” milk story: Understanding the impact of pasture feeding on the composition and quality of bovine milk. Foods2019, 8, 350. [CrossRef] [PubMed]
6. Madureira, A.R.; Pereira, C.I.; Gomes, A.M.P.; Pintado, M.E.; Xavier Malcata, F. Bovine whey proteins–Overview on their mainbiological properties. Food Res. Int. 2007, 40, 1197–1211. [CrossRef]
7. Maathuis, A.; Havenaar, R.; He, T.; Bellmann, S. Protein Digestion and Quality of Goat and Cow Milk Infant Formula and HumanMilk under Simulated Infant Conditions. J. Pediatr. Gastroenterol. Nutr. 2017, 65, 661. [CrossRef]
8. Hodgkinson, A.J.; Wallace, O.A.M.; Boggs, I.; Broadhurst, M.; Prosser, C.G. Gastric digestion of cow and goat milk: Impact ofinfant and young child in vitro digestion conditions. Food Chem. 2018, 245, 275–281. [CrossRef] [PubMed]
9. Hodgkinson, A.J.; Wallace, O.A.M.; Smolenski, G.; Prosser, C.G. Gastric digestion of cow and goat milk: Peptides derived fromsimulated conditions of infant digestion. Food Chem. 2019, 276, 619–625. [CrossRef]
10. Almaas, H.; Cases, A.L.; Devold, T.G.; Holm, H.; Langsrud, T.; Aabakken, L.; Aadnoey, T.; Vegarud, G.E. In vitro digestion ofbovine and caprine milk by human gastric and duodenal enzymes. Int. Dairy J. 2006, 16, 961–968. [CrossRef]
11. Inglingstad, R.A.; Devold, T.G.; Eriksen, E.K.; Holm, H.; Jacobsen, M.; Liland, K.H.; Rukke, E.O.; Vegarud, G.E. Comparison ofthe digestion of caseins and whey proteins in equine, bovine, caprine and human milks by human gastrointestinal enzymes.Dairy Sci. Technol. 2010, 90, 549–563. [CrossRef]
12. Claeys, W.L.; Verraes, C.; Cardoen, S.; De Block, J.; Huyghebaert, A.; Raes, K.; Dewettinck, K.; Herman, L. Consumption of raw orheated milk from different species: An evaluation of the nutritional and potential health benefits. Food Control 2014, 42, 188–201.[CrossRef]
13. Fontecha, J.; Brink, L.; Wu, S.; Pouliot, Y.; Visioli, F.; Jiménez-Flores, R. Sources, production, and clinical treatments of milk fatglobule membrane for infant nutrition and well-being. Nutrients 2020, 12, 1607. [CrossRef]
14. Laemmli, U.K. Cleavage of structural proteins during the assembly of the head of bacteriophage T4. Nature 1970, 227, 680–685.[CrossRef] [PubMed]
15. Shevchenko, A.; Tomas, H.; Havliš, J.; Olsen, J.V.; Mann, M. In-gel digestion for mass spectrometric characterization of proteinsand proteomes. Nat. Protoc. 2007, 1, 2856–2860. [CrossRef]
16. Collins, C.; Hurley, R.; Almutlaqah, N.; O’Keeffe, G.; Keane, T.; Fitzpatrick, D.; Owens, R. Proteomic Characterization of Armillariamellea Reveals Oxidative Stress Response Mechanisms and Altered Secondary Metabolism Profiles. Microorganisms 2017, 5, 60.[CrossRef] [PubMed]
17. Morrin, S.T.; Owens, R.A.; Le Berre, M.; Gerlach, J.Q.; Joshi, L.; Bode, L.; Irwin, J.A.; Hickey, R.M. Interrogation of Milk-DrivenChanges to the Proteome of Intestinal Epithelial Cells by Integrated Proteomics and Glycomics. J. Agric. Food Chem. 2019, 67,1902–1917. [CrossRef] [PubMed]
18. Cox, J.; Mann, M. MaxQuant enables high peptide identification rates, individualized p.p.b.-range mass accuracies and proteome-wide protein quantification. Nat. Biotechnol. 2008, 26, 1367–1372. [CrossRef]
19. Tyanova, S.; Temu, T.; Cox, J. The MaxQuant computational platform for mass spectrometry-based shotgun proteomics. Nat.Protoc. 2016, 11, 2301–2319. [CrossRef] [PubMed]
20. Gallier, S.; Vocking, K.; Post, J.A.; Van De Heijning, B.; Acton, D.; Van Der Beek, E.M.; Van Baalen, T. A novel infant milk formulaconcept: Mimicking the human milk fat globule structure. Colloids Surf. B Biointerfaces 2015, 136, 329–339. [CrossRef]

Foods 2021, 10, 2643 19 of 21
21. Lopez, C.; Madec, M.N.; Jimenez-Flores, R. Lipid rafts in the bovine milk fat globule membrane revealed by the lateral segregationof phospholipids and heterogeneous distribution of glycoproteins. Food Chem. 2010, 120, 22–33. [CrossRef]
22. Bär, C.; Mathis, D.; Neuhaus, P.; Dürr, D.; Bisig, W.; Egger, L.; Portmann, R. Protein profile of dairy products: Simultaneousquantification of twenty bovine milk proteins. Int. Dairy J. 2019, 97, 167–175. [CrossRef]
23. Ceballos, L.S.; Morales, E.R.; de la Torre Adarve, G.; Castro, J.D.; Martínez, L.P.; Sampelayo, M.R.S. Composition of goat andcow milk produced under similar conditions and analyzed by identical methodology. J. Food Compos. Anal. 2009, 22, 322–329.[CrossRef]
24. Aspilcueta-Borquis, R.R.; Araujo Neto, F.R.; Baldi, F.; Bignardi, A.B.; Albuquerque, L.G.; Tonhati, H. Genetic parameters forbuffalo milk yield and milk quality traits using Bayesian inference. J. Dairy Sci. 2010, 93, 2195–2201. [CrossRef] [PubMed]
25. Hejtmánková, A.; Pivec, V.; Trnková, E.; Dragounová, H. Differences in the composition of total and whey proteins in goat andewe milk and their changes throughout the lactation period. Czech J. Anim. Sci. 2012, 57, 323–331. [CrossRef]
26. Lee, H.; Padhi, E.; Hasegawa, Y.; Larke, J.; Parenti, M.; Wang, A.; Hernell, O.; Lönnerdal, B.; Slupsky, C. Compositional dynamicsof the milk fat globule and its role in infant development. Front. Pediatr. 2018, 6, 313. [CrossRef] [PubMed]
27. Molinari, C.E.; Casadio, Y.S.; Hartmann, B.T.; Livk, A.; Bringans, S.; Arthur, P.G.; Hartmann, P.E. Proteome mapping of humanskim milk proteins in term and preterm milk. J. Proteome Res. 2012, 11, 1696–1714. [CrossRef]
28. D’Ambrosio, C.; Arena, S.; Salzano, A.M.; Renzone, G.; Ledda, L.; Scaloni, A. A proteomic characterization of water buffalo milkfractions describing PTM of major species and the identification of minor components involved in nutrient delivery and defenseagainst pathogens. Proteomics 2008, 8, 3657–3666. [CrossRef]
29. Kishimoto, Y.; Hiraiwa, M.; O’Brien, J.S. Saposins: Structure, function, distribution, and molecular genetics. J. Lipid Res. 1992, 33,1255–1267.
30. Hineno, T.; Sano, A.; Kondoh, K.; Ueno, S.; Kakimoto, Y.; Yoshida, K.I. Secretion of sphingolipid hydrolase activator precursor,prosaposin. Biochem. Biophys. Res. Commun. 1991, 176, 668–674. [CrossRef]
31. O’Brien, J.S.; Carson, G.S.; Seo, H.C.; Hiraiwa, M.; Kishimoto, Y. Identification of prosaposin as a neurotrophic factor. Proc. Natl.Acad. Sci. USA 1994, 91, 9593–9596. [CrossRef]
32. O’Brien, J.S.; Carson, G.S.; Seo, H.; Hiraiwa, M.; Weiler, S.; Tomich, J.M.; Barranger, J.A.; Kahn, M.; Azuma, N.; Kishimoto, Y.Identification of the neurotrophic factor sequence of prosaposin. FASEB J. 1995, 9, 681–685. [CrossRef] [PubMed]
33. Patton, S.; Carson, G.S.; Hiraiwa, M.; O’Brien, J.S.; Sano, A. Prosaposin, a Neurotrophic Factor: Presence and Properties in Milk. J.Dairy Sci. 1997, 80, 264–272. [CrossRef]
34. Jeannin, P.; Jaillon, S.; Delneste, Y. Pattern recognition receptors in the immune response against dying cells. Curr. Opin. Immunol.2008, 20, 530–537. [CrossRef]
35. Jaillon, S.; Mancuso, G.; Hamon, Y.; Beauvillain, C.; Cotici, V.; Midiri, A.; Bottazzi, B.; Nebuloni, M.; Garlanda, C.; Frémaux, I.;et al. Prototypic Long Pentraxin PTX3 Is Present in Breast Milk, Spreads in Tissues, and Protects Neonate Mice from Pseudomonasaeruginosa Lung Infection. J. Immunol. 2013, 191, 1873–1882. [CrossRef]
36. Mudaliar, M.; Tassi, R.; Thomas, F.C.; McNeilly, T.N.; Weidt, S.K.; McLaughlin, M.; Wilson, D.; Burchmore, R.; Herzyk, P.;Eckersall, P.D.; et al. Mastitomics, the integrated omics of bovine milk in an experimental model of: Streptococcus uberis mastitis:2. Label-free relative quantitative proteomics. Mol. Biosyst. 2016, 12, 2748–2761. [CrossRef] [PubMed]
37. Inforzato, A.; Reading, P.C.; Barbati, E.; Bottazzi, B.; Garlanda, C.; Mantovani, A. The “sweet” side of a long pentraxin: Howglycosylation affects PTX3 functions in innate immunity and inflammation. Front. Immunol. 2013, 3, 1–12. [CrossRef] [PubMed]
38. Prusiner, S.B. Prions. Proc. Natl. Acad. Sci. USA 1998, 95, 13363–13383. [CrossRef]39. Didier, A.; Dietrich, R.; Steffl, M.; Gareis, M.; Groschup, M.H.; Müller-Hellwig, S.; Märtlbauer, E.; Amselgruber, W.M. Cellular
prion protein in the bovine mammary gland is selectively expressed in active lactocytes. J. Histochem. Cytochem. 2006, 54,1255–1261. [CrossRef]
40. Didier, A.; Gebert, R.; Dietrich, R.; Schweiger, M.; Gareis, M.; Märtlbauer, E.; Amselgruber, W.M. Cellular prion protein inmammary gland and milk fractions of domestic ruminants. Biochem. Biophys. Res. Commun. 2008, 369, 841–844. [CrossRef]
41. Horiuchi, M.; Yamazaki, N.; Ikeda, T.; Ishiguro, N.; Shinagawa, M. A cellular form of prion protein (PrP(C)) exists in manynon-neuronal tissues of sheep. J. Gen. Virol. 1995, 76, 2583–2587. [CrossRef]
42. Maddison, B.C.; Whitelam, G.C.; Gough, K.C. Cellular prion protein in ovine milk. Biochem. Biophys. Res. Commun. 2007, 353,195–199. [CrossRef]
43. Franscini, N.; El Gedaily, A.; Matthey, U.; Franitza, S.; Sy, M.S.; Bürkle, A.; Groschup, M.; Braun, U.; Zahn, R. Prion protein inmilk. PLoS ONE 2006, 1, e71. [CrossRef]
44. Perez, M.D.; Sanchez, L.; Aranda, P.; Sala, F.J.; Calvo, M. Time-course levels of alpha 2-macroglobulin and albumin in cowcolostrum and milk and alpha 2-macroglobulin levels in mastitic cow milk. Ann. Rech. Vet. 1989, 20, 251–258. [PubMed]
45. Borth, W. α2 “Macroglobulin, a multifunctional binding protein with targeting characteristics. FASEB J. 1992, 6, 3345–3353.[CrossRef]
46. Janssens, S.; Beyaert, R. Role of Toll-like receptors in pathogen recognition. Clin. Microbiol. Rev. 2003, 16, 637–646. [CrossRef][PubMed]
47. Cattaneo, C.; Caramaschi, A.; Uga, E.; Braghin, M.; Cosi, G.; Peila, C.; Strozzi, M.C.; Sabatini, M.; Gazzolo, D.; Manfredi, M.; et al.Analysis of Toll-Like Receptors in Human Milk: Detection of Membrane-Bound and Soluble Forms. J. Immunol. Res. 2019, 2019,1–12. [CrossRef]

Foods 2021, 10, 2643 20 of 21
48. Cao, X.; Kang, S.; Yang, M.; Li, W.; Wu, S.; Han, H.; Meng, L.; Wu, R.; Yue, X. Quantitative: N -glycoproteomics of milk fat globulemembrane in human colostrum and mature milk reveals changes in protein glycosylation during lactation. Food Funct. 2018, 9,1163–1172. [CrossRef] [PubMed]
49. Ha, M.; Sabherwal, M.; Duncan, E.; Stevens, S.; Stockwell, P.; McConnell, M.; El-Din Bekhit, A.; Carne, A. In-depth characterizationof sheep (Ovis aries) milk whey proteome and comparison with cow (Bos taurus). PLoS ONE 2015, 10, e0139774. [CrossRef]
50. Kalliomäki, M.; Ouwehand, A.; Arvilommi, H.; Kero, P.; Isolauri, E. Transforming growth factor-β in breast milk: A potentialregulator of atopic disease at an early age. J. Allergy Clin. Immunol. 1999, 104, 1251–1257. [CrossRef]
51. Saito, S.; Yoshida, M.; Ichijo, M.; Ishizaka, S.; Tsujii, T. Transforming growth factor-beta (TGF-β) in human milk. Clin. Exp.Immunol. 1993, 94, 220–224. [CrossRef] [PubMed]
52. Dawod, B.; Marshall, J.S. Cytokines and soluble receptors in breast milk as enhancers of oral tolerance development. Front.Immunol. 2019, 10, 1–9. [CrossRef] [PubMed]
53. Penttila, I.A. Milk-Derived Transforming Growth Factor-β and the Infant Immune Response. J. Pediatr. 2010, 156, S21–S25.[CrossRef]
54. Sitarik, A.R.; Bobbitt, K.R.; Havstad, S.L.; Fujimura, K.E.; Levin, A.M.; Zoratti, E.M.; Kim, H.; Woodcroft, K.J.; Wegienka, G.;Ownby, D.R.; et al. Breast milk TGFβ is associated with neonatal gut microbial composition HHS Public Access. J PediatrGastroenterol Nutr 2017, 65, 60–67. [CrossRef] [PubMed]
55. Oddy, W.H.; Rosales, F. A systematic review of the importance of milk TGF-β on immunological outcomes in the infant andyoung child. Pediatr. Allergy Immunol. 2010, 21, 47–59. [CrossRef] [PubMed]
56. Khaleva, E.; Gridneva, Z.; Geddes, D.T.; Oddy, W.H.; Colicino, S.; Blyuss, O.; Boyle, R.J.; Warner, J.O.; Munblit, D. Transforminggrowth factor beta in human milk and allergic outcomes in children: A systematic review. Clin. Exp. Allergy 2019, 49, 1201–1213.[CrossRef]
57. Jin, Y.; Cox, D.A.; Knecht, R.; Raschdorf, F.; Cerletti, N. Separation, purification, and sequence identification of TGF-β1 andTGF-β2 from bovine milk. J. Protein Chem. 1991, 10, 565–575. [CrossRef] [PubMed]
58. Chockalingam, A.; Paape, M.J.; Bannerman, D.D. Increased milk levels of transforming growth factor-α, β1, and β2 duringEscherichia coli-induced mastitis. J. Dairy Sci. 2005, 88, 1986–1993. [CrossRef]
59. Magi, B.; Ietta, F.; Romagnoli, R.; Liberatori, S.; Pallini, V.; Bini, L.; Tripodi, S.A.; Cintorino, M.; Chellini, F.; Arcuri, F.; et al.Presence of macrophage migration inhibitory factor in human milk: Evidence in the aqueous phase and milk fat globules. Pediatr.Res. 2002, 51, 619–624. [CrossRef] [PubMed]
60. Vigh, É.; Bódis, J.; Garai, J. Longitudinal changes in macrophage migration inhibitory factor in breast milk during the first threemonths of lactation. J. Reprod. Immunol. 2011, 89, 92–94. [CrossRef] [PubMed]
61. Mohan, M.S.; O’Callaghan, T.F.; Kelly, P.; Hogan, S.A. Milk fat: Opportunities, challenges and innovation. Crit. Rev. Food Sci. Nutr.2020, 61, 2411–2443. [CrossRef]
62. MacGibbon, A.K.H. Composition and Structure of Bovine Milk Lipids. In Advanced Dairy Chemistry, Volume 2; Springer: Boston,MA, USA, 2020.
63. Markiewicz-Keszycka, M.; Czyzak-Runowska, G.; Lipinska, P.; Wójtowski, J. Fatty acid profile of milk–A review. Bull. Vet. Inst.Pulawy 2013, 57, 135–139. [CrossRef]
64. Knutsen, T.M.; Olsen, H.G.; Tafintseva, V.; Svendsen, M.; Kohler, A.; Kent, M.P.; Lien, S. Unravelling genetic variation underlyingde novo-synthesis of bovine milk fatty acids. Sci. Rep. 2018, 8, 2179. [CrossRef] [PubMed]
65. Castro-Gómez, M.P.; Rodriguez-Alcalá, L.M.; Calvo, M.V.; Romero, J.; Mendiola, J.A.; Ibañez, E.; Fontecha, J. Total milk fatextraction and quantification of polar and neutral lipids of cow, goat, and ewe milk by using a pressurized liquid system andchromatographic techniques. J. Dairy Sci. 2014, 97, 6719–6728. [CrossRef]
66. Balthazar, C.F.; Pimentel, T.C.; Ferrão, L.L.; Almada, C.N.; Santillo, A.; Albenzio, M.; Mollakhalili, N.; Mortazavian, A.M.;Nascimento, J.S.; Silva, M.C.; et al. Sheep Milk: Physicochemical Characteristics and Relevance for Functional Food Development.Compr. Rev. Food Sci. Food Saf. 2017, 16, 247–262. [CrossRef] [PubMed]
67. Serra, A.; Conte, G.; Ciucci, F.; Bulleri, E.; Corrales-Retana, L.; Cappucci, A.; Buccioni, A.; Mele, M. Dietary linseed supplemen-tation affects the fatty acid composition of the sn-2 position of triglycerides in sheep milk. J. Dairy Sci. 2018, 101, 6742–6751.[CrossRef]
68. Pegolo, S.; Stocco, G.; Mele, M.; Schiavon, S.; Bittante, G.; Cecchinato, A. Factors affecting variations in the detailed fatty acidprofile of Mediterranean buffalo milk determined by 2-dimensional gas chromatography. J. Dairy Sci. 2017, 100, 2564–2576.[CrossRef]
69. Ménard, O.; Ahmad, S.; Rousseau, F.; Briard-Bion, V.; Gaucheron, F.; Lopez, C. Buffalo vs. cow milk fat globules: Size distribution,zeta-potential, compositions in total fatty acids and in polar lipids from the milk fat globule membrane. Food Chem. 2010, 120,544–551. [CrossRef]
70. Medhammar, E.; Wijesinha-Bettoni, R.; Stadlmayr, B.; Nilsson, E.; Charrondiere, U.R.; Burlingame, B. Composition of milk fromminor dairy animals and buffalo breeds: A biodiversity perspective. J. Sci. Food Agric. 2011, 92, 445–474. [CrossRef] [PubMed]
71. Lordan, R.; Zabetakis, I. Invited review: The anti-inflammatory properties of dairy lipids. J. Dairy Sci. 2017, 100, 4197–4212.[CrossRef]
72. Jensen, R.G. Lipids in human milk. Lipids 1999, 34, 1243–1271. [CrossRef] [PubMed]
Foods 2021, 10, 2643 21 of 21
73. Viriato, R.L.S.; Queirós, M.d.S.; Macedo, G.A.; Ribeiro, A.P.B.; Gigante, M.L. Design of new lipids from bovine milk fat for babynutrition. Crit. Rev. Food Sci. Nutr. 2020, 2, 1–15. [CrossRef]
74. Kuksis, A.; Marai, L.; Myher, J.J. Triglyceride structure of milk fats. J. Am. Oil Chem. Soc. 1973, 50, 193–201. [CrossRef]75. Prosser, C.G.; Svetashev, V.I.; Vyssotski, M.V.; Lowry, D.J. Composition and distribution of fatty acids in triglycerides from goat
infant formulas with milk fat. J. Dairy Sci. 2010, 93, 2857–2862. [CrossRef]76. Blasi, F.; Montesano, D.; De Angelis, M.; Maurizi, A.; Ventura, F.; Cossignani, L.; Simonetti, M.S.; Damiani, P. Results of
stereospecific analysis of triacylglycerol fraction from donkey, cow, ewe, goat and buffalo milk. J. Food Compos. Anal. 2008, 21, 1–7.[CrossRef]
77. Liu, Z.; Rochfort, S.; Cocks, B. Milk lipidomics: What we know and what we don’t. Prog. Lipid Res. 2018, 71, 70–85. [CrossRef]78. Holzmüller, W.; Kulozik, U. Technical difficulties and future challenges in isolating membrane material from milk fat globules in
industrial settings–A critical review. Int. Dairy J. 2016, 61, 51–66. [CrossRef]79. Huang, Z.; Zheng, H.; Brennan, C.S.; Mohan, M.S.; Stipkovits, L.; Li, L.; Kulasiri, D. Production of milk phospholipid-enriched
dairy ingredients. Foods 2020, 9, 263. [CrossRef] [PubMed]80. Bernard, L.; Bonnet, M.; Delavaud, C.; Delosière, M.; Ferlay, A.; Fougère, H.; Graulet, B. Milk Fat Globule in Ruminant: Major
and Minor Compounds, Nutritional Regulation and Differences Among Species. Eur. J. Lipid Sci. Technol. 2018, 120, 1700039.[CrossRef]
81. Huston, G.E.; Patton, S. Factors Related to the Formation of Cytoplasmic Crescents on Milk Fat Globules. J. Dairy Sci. 1990, 73,2061–2066. [CrossRef]
82. Gallier, S.; Gragson, D.; Jiménez-Flores, R.; Everett, D. Using confocal laser scanning microscopy to probe the milk fat globulemembrane and associated proteins. J. Agric. Food Chem. 2010, 58, 4250–4257. [CrossRef] [PubMed]