comparative proteomics analysis of human lung squamous carcinoma
TRANSCRIPT
Biochemical and Biophysical Research Communications 309 (2003) 253–260
www.elsevier.com/locate/ybbrc
BBRC
Comparative proteomics analysis of human lung squamous carcinomaq
Cui Li,a,b Zhuchu Chen,a,b,* Zhiqiang Xiao,a Xiaoying Wu,b Xianquan Zhan,b
Xiaopeng Zhang,b Maoyu Li,b JianLing Li,a Xueping Feng,a Songping Liang,c
Ping Chen,c and Jing-yun Xiec
a Medical Research Center, Xiangya Hospital, Central South University, Changsha 410008, Chinab Cancer Research Institute, Xiangya School of Medicine, Central South University, Changsha 410078, China
c College of Life Science, Hunan Normal University, Changsha 410006, China
Received 5 August 2003
Abstract
Two-dimensional polyacrylamide gel electrophoresis (2-DE) profiles of human lung squamous carcinoma tissue and paired
surrounding normal bronchial epithelial tissue were compared. Selected differential protein-spots were identified with peptide mass
fingerprinting based on matrix-assisted laser desorption/ionization time-of-flight mass spectrometry (MALDI-TOF-MS) and da-
tabase searching. Well-resolved and reproducible 2-DE patterns of both the tumor and the normal tissues were acquired. The
average deviations of spot position were 0.873� 0.125mm in IEF direction and 1.025� 0.213mm in SDS–PAGE direction, re-
spectively. For the tumor tissues, a total of 1349� 67 spots were detected and 1235� 48 spots were matched with an average
matching rate of 91.5%. For the corresponding normal tissues, a total of 1297� 73 spots were detected and 1183� 56 spots were
matched with an average matching rate of 91.2%. A total of 1069� 45 spots were matched between the tumor and the normal
tissues. Forty differential proteins between tumor and normal tissues were characterized. Some proteins were the products of
oncogenes and others were involved in the regulation of cell cycle and signal transduction. These data are valuable for mass
identification of differentially expressed proteins involved in lung carcinogenesis, establishing human lung cancer proteome database
and screening molecular marker to further study human lung squamous carcinoma.
� 2003 Published by Elsevier Inc.
Keywords: Human lung squamous carcinoma tissue; Normal bronchial epithelial tissue; 2-DE PAGE; MALDI-TOF-MS; Proteome; Differential
expression protein
Lung cancer is a malignant tumor with a very high
incidence and mortality. According to histological di-
agnosis, lung cancer comprises a broad spectrum of
tumors that include squamous carcinoma, adenocarci-
noma, large-cell carcinoma, and small-cell carcinoma.Squamous carcinoma is the most common type, ac-
counting for 30–50% in all of lung cancer patients [1].
Molecular pathogenesis of human lung cancer has been
qAbbreviations: 2-DE, two-dimensional polyacrylamide gel electro-
phoresis; MALDI-TOF-MS, matrix-assisted laser desorption/
ionization time-of-flight mass spectrometry; CCA, a-cyano-4-hydroxy-cinnamic acid; FACS, fluorescence-activated cell sorter; LCM, laser
capture microdissection.* Corresponding author. Fax: +86-731-432-7332.
E-mail address: [email protected] (Z. Chen).
0006-291X/$ - see front matter � 2003 Published by Elsevier Inc.
doi:10.1016/S0006-291X(03)01578-X
partially revealed at the levels of genomic alteration and
transcriptional regulation (mRNA) [2]. However func-
tional complexity of normal and neoplastic tissues is not
dictated solely by the encoding genomic information,
but also determined by execution molecules, proteins.Thus, the proteomic approach is essential to understand
pathogenesis and development of lung cancer. Some
tumor-related markers have been identified and are ap-
plied in clinic diagnosis thanks to the pioneering pro-
teomic studies. For example, TAO1 and TAO2 are the
effective markers that distinguish adenocarcinoma of
lung origin from adenocarcinoma metastasized from
other organs [3,4]. PGP9.5, a protein that can induceautoantibodies in lung cancer patients [4–6]. Some
studies also indicated that AOE372, an antioxidant
enzyme, and ATP5D, an ATP synthase subunit, are
254 C. Li et al. / Biochemical and Biophysical Research Communications 309 (2003) 253–260
significantly over-expressed in lung adenocarcinoma [7].These newly identified lung adenocarcinoma specific
markers possess great potential in early diagnosis and
monitoring responses to therapy. However, these pro-
teomic studies focus on lung adenocarcinoma. A lack of
similar study on proteomic profiles of squamous carci-
noma hinders our effort to understand and cure this
cancer. Therefore, it is necessary to obtain proteomic
data on this particular cancer.2-DE is the principal step of proteomics and widely
used in comparative studies of protein expression levels
between healthy and diseased states. Hence, in this
study, the total proteins from human lung squamous
carcinoma and control were separated with 2-DE and
analyzed. Differential expression of certain proteins in
the tumor and the corresponding normal tissues was
revealed by MALDI-TOF-MS and database analysis.The results presented here will no doubt provide clues to
further study of the carcinogenic mechanisms, diagnosis,
and therapy of lung squamous carcinoma.
Materials and methods
Tissue specimens and preparation. Fifteen human lung squamous
carcinoma tissues and paired normal bronchial epithelial tissues ad-
jacent to tumors were obtained from the First and the Second Xiangya
Hospital, Central South University. All patients were diagnosed by
histopathology. Patients’ medical records were reviewed. Fresh tumor
tissues and paired tumor-adjacent normal bronchial tissues at least
5 cm away from tumor were obtained immediately after surgery and
stored in liquid nitrogen. Epithelial cells were exfoliated from bron-
chial tissues. The tissues were repeatedly washed with saline in aseptic
condition to remove blood and excrescent tissues. Pure population of
tumor cells was then scraped from the surface of tumor mass [8]. The
processed specimens were either immediately lysed to extract total
proteins or were stored at )80 �C until use. A total of 30–80mg tissues
were ground into powder in liquid nitrogen and lysed in 400ll lysisbuffer (7mol/L urea, 2mol/L thiourea, 2% NP-40, 1% Triton X-100,
100mmol/L DTT, 5mmol/L PMSF, 4% CHAPS, 0.5mmol/L EDTA,
40mmol/L Tris, 2% pharmalyte, 1mg/ml DNase I, and 0.25mg/ml
RNase A). The lysates were vortexed followed by incubation at 37 �Cfor 1 h. The lysates were centrifuged at 15,000 rpm for 30min at 4 �C[9]. The supernatant was transferred to a fresh tube and precipitated
with TCA sediment method to recover total proteins. The concentra-
tion of the total proteins was determined with the BCA Protein Assay
Kit (Pierce).
IPG-2D PAGE. IEF was performed using IPGstrip (pH 3-10L,
180mm� 3mm� 0.5mm) on IPGphor isoelectric focusing cell
(Amersham Biosciences). Second-dimension SDS–PAGE (Bio-Rad)
was conducted as described by manufacturer and Gorg [10]. After
electrophoresis, the protein spots were visualized by silver-based
staining technique with the protein silver stain kit (Amersham
Biosciences).
Image analysis. The stained 2-DE gels were scanned with LabScan
software on Imagescanner (Amersham Biosciences). ImageMaster 2D
Elite 4.01 analysis software (Amersham Biosciences) was used for spot-
intensity calibration, spot detection, background abstraction, match-
ing, 1-D calibration, and the establishment of average-gel. Intensity of
each spot was quantified by calculation of spot volume after normal-
ization of the image using the total spot volume normalization method
multiplied by the total area of all the spots. The reproducibility of spot
position was calculated with Gorbett’s method [11]. Statistical analysis
was carried out with SPSS for Windows 10.0 and Excel.
MALDI-TOF-MS. Forty differential spots were excised from pre-
parative gels using biopsy punches and transferred to a 1.5ml sili-
conized Eppendorf tube. One protein-free gel piece was treated in
parallel as a negative control. Proteins were in-gel digested as previ-
ously described [12]. The gel-spots were destained in the destaining
solution that consisted of 100mmol/L Na2S2O3 and 30mmol/L
K3Fe(CN)6 (V/V, 1:1). The protein-containing gel-spots were reduced
in the reduction buffer (100mmol/L NH4HCO3 and 10mmol/L DTT)
for 1 h at 57 �C and then alkylated in the alkylation buffer (100mmol/L
NH4HCO3 and 55mmol/L iodoacetamide) in the dark for 30min at
room temperature. The gel pieces were dried in a vacuum centrifuge.
The dried gel-pieces were incubated in the digestion solution that
consisted of 50mmol/L NH4HCO3, 5mM/L CaCl2, and 0.1 g/L
TPCK–trypsin for 24 h at 37 �C. The tryptic peptide mixture was ex-
tracted and purified with Millipore ZIPTIP C18 column. The purified
tryptic peptide mixture was mixed with CCA matrix solution and
vortexed gently. A volume (2ll) of the mixture containing CCA matrix
was loaded on a stainless steel plate and air-dried. The samples were
analyzed with Applied Biosystems Voyager System 4307 MALDI-
TOFMass Spectrometer (ABI). The parameters were set up as follows:
positive ion-reflector mode, accelerating voltage 20 kV, grid voltage
64.5%, mirror voltage ratio 1.12, N2 laser wavelength 337 nm, pulse
width 3 ns, the number of laser shots 50, acquisition mass range 1000–
3000Da, delay 100 ns, and vacuum degree 4� 10�7 Torr. A trypsin-
fragment peak served as internal standard for mass calibration. A list
of the corrected mass peaks was the peptide mass fingerprinting
(PMF).
Database analysis. Proteins were identified with peptide mass fin-
gerprinting data by searching software PeptIdent (http://www.exp-
asy.pku.edu.cn). The searching parameters were set up as follows: the
mass tolerance was �0.5Da; the number of missed cleavage sites was
allowed up to 1; the cysteine residue was modified as carbamidom-
ethyl-cys; the minimum number of matched-peptides was 4; species
was selected as Homo sapiens (human); the peptide ion was [M+H]þ;
the isotope masses were used; and the searching range was within the
experimental pI value �0.5 pH unit and experimental Mr �20%.
Results
2-DE pattern of human lung squamous carcinoma tissues
and normal bronchial epithelial tissues adjacent to tumors
In order to measure the reproducibility, 2-DE for the
tumor- and normal-tissues from the same patient was
repeated three times, respectively. The image analysis
showed that these 2-DE maps were reproducible. A totalof 100 well-resolved and matched spots among three
tumor-gels were chosen randomly to calculate the de-
viation of the spot position. The spot positional devia-
tion was 0.873� 0.125mm in the IEF direction and
1.025� 0.213mm in SDS–PAGE direction. For human
lung squamous carcinoma tissues, a total of 1349� 67
spots were detected, 1235� 48 spots were matched with
an average matching rate of 91.5%. For normal bron-chial epithelial tissues, a total of 1297� 73 spots were
detected, 1183� 56 spots were matched with an average
matching rate of 91.2%. The well-resolved and repro-
ducible 2-DE patterns of human lung squamous carci-
noma tissues and normal bronchial epithelial tissues
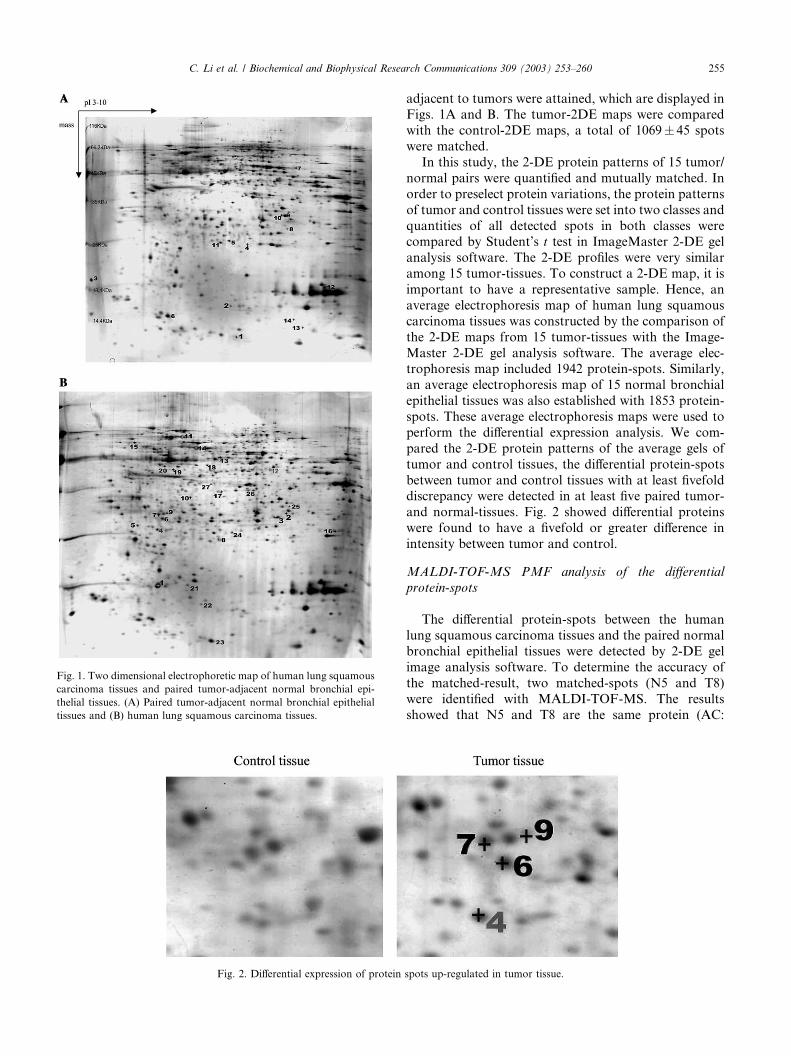
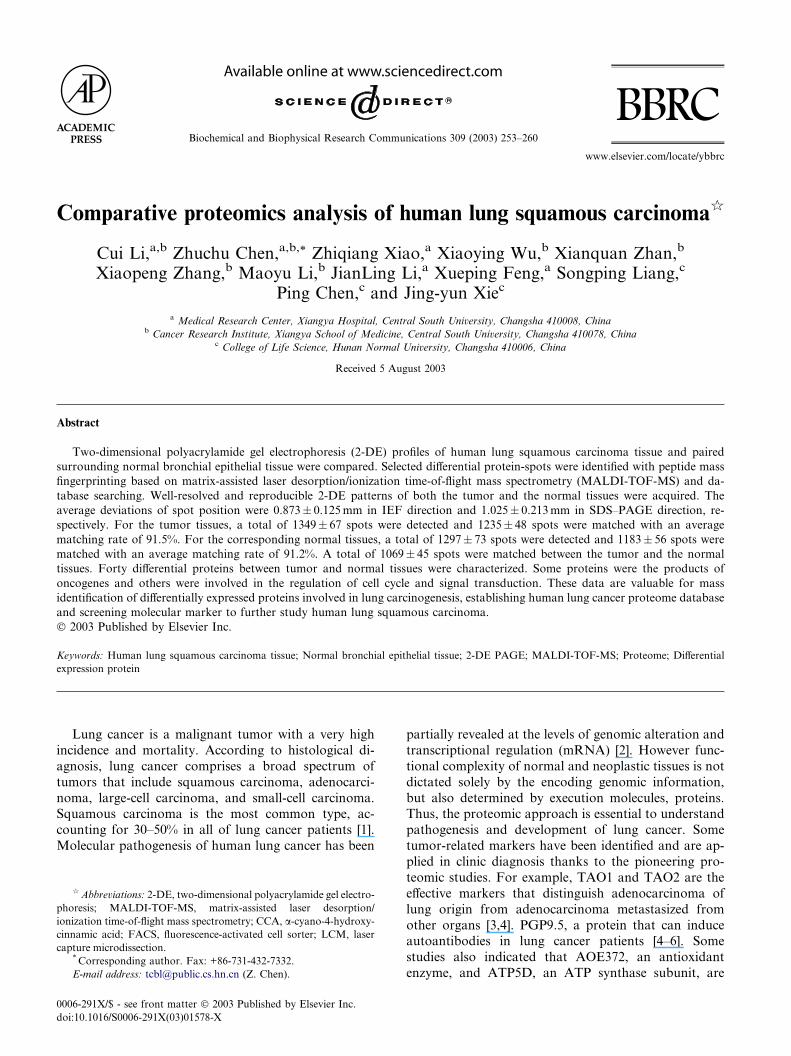
Fig. 1. Two dimensional electrophoretic map of human lung squamous
carcinoma tissues and paired tumor-adjacent normal bronchial epi-
thelial tissues. (A) Paired tumor-adjacent normal bronchial epithelial
tissues and (B) human lung squamous carcinoma tissues.
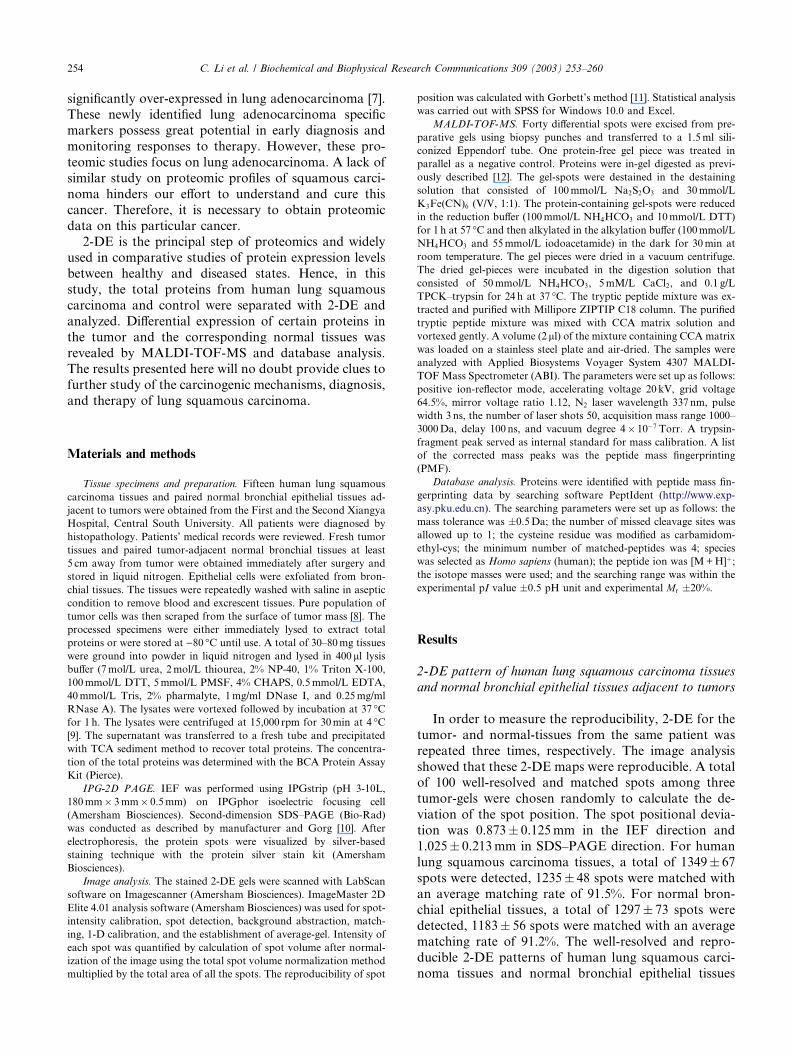
Fig. 2. Differential expression of protein
C. Li et al. / Biochemical and Biophysical Research Communications 309 (2003) 253–260 255
adjacent to tumors were attained, which are displayed inFigs. 1A and B. The tumor-2DE maps were compared
with the control-2DE maps, a total of 1069� 45 spots
were matched.
In this study, the 2-DE protein patterns of 15 tumor/
normal pairs were quantified and mutually matched. In
order to preselect protein variations, the protein patterns
of tumor and control tissues were set into two classes and
quantities of all detected spots in both classes werecompared by Student’s t test in ImageMaster 2-DE gel
analysis software. The 2-DE profiles were very similar
among 15 tumor-tissues. To construct a 2-DE map, it is
important to have a representative sample. Hence, an
average electrophoresis map of human lung squamous
carcinoma tissues was constructed by the comparison of
the 2-DE maps from 15 tumor-tissues with the Image-
Master 2-DE gel analysis software. The average elec-trophoresis map included 1942 protein-spots. Similarly,
an average electrophoresis map of 15 normal bronchial
epithelial tissues was also established with 1853 protein-
spots. These average electrophoresis maps were used to
perform the differential expression analysis. We com-
pared the 2-DE protein patterns of the average gels of
tumor and control tissues, the differential protein-spots
between tumor and control tissues with at least fivefolddiscrepancy were detected in at least five paired tumor-
and normal-tissues. Fig. 2 showed differential proteins
were found to have a fivefold or greater difference in
intensity between tumor and control.
MALDI-TOF-MS PMF analysis of the differential
protein-spots
The differential protein-spots between the human
lung squamous carcinoma tissues and the paired normal
bronchial epithelial tissues were detected by 2-DE gel
image analysis software. To determine the accuracy of
the matched-result, two matched-spots (N5 and T8)
were identified with MALDI-TOF-MS. The results
showed that N5 and T8 are the same protein (AC:
spots up-regulated in tumor tissue.
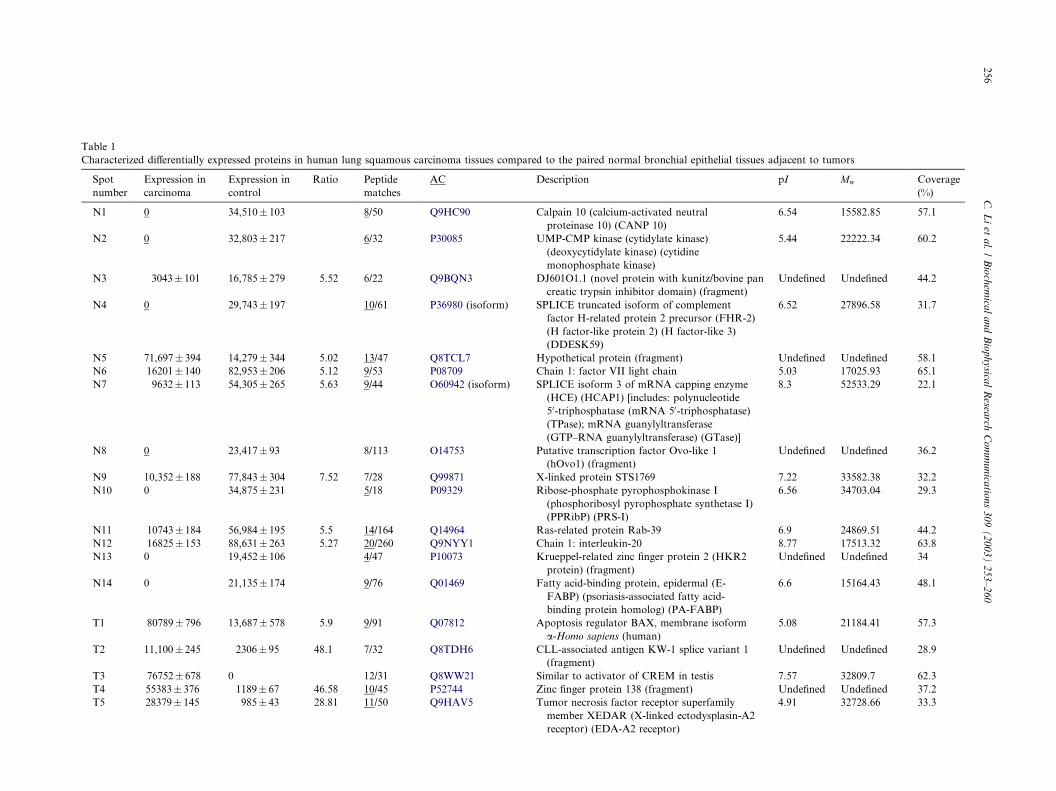
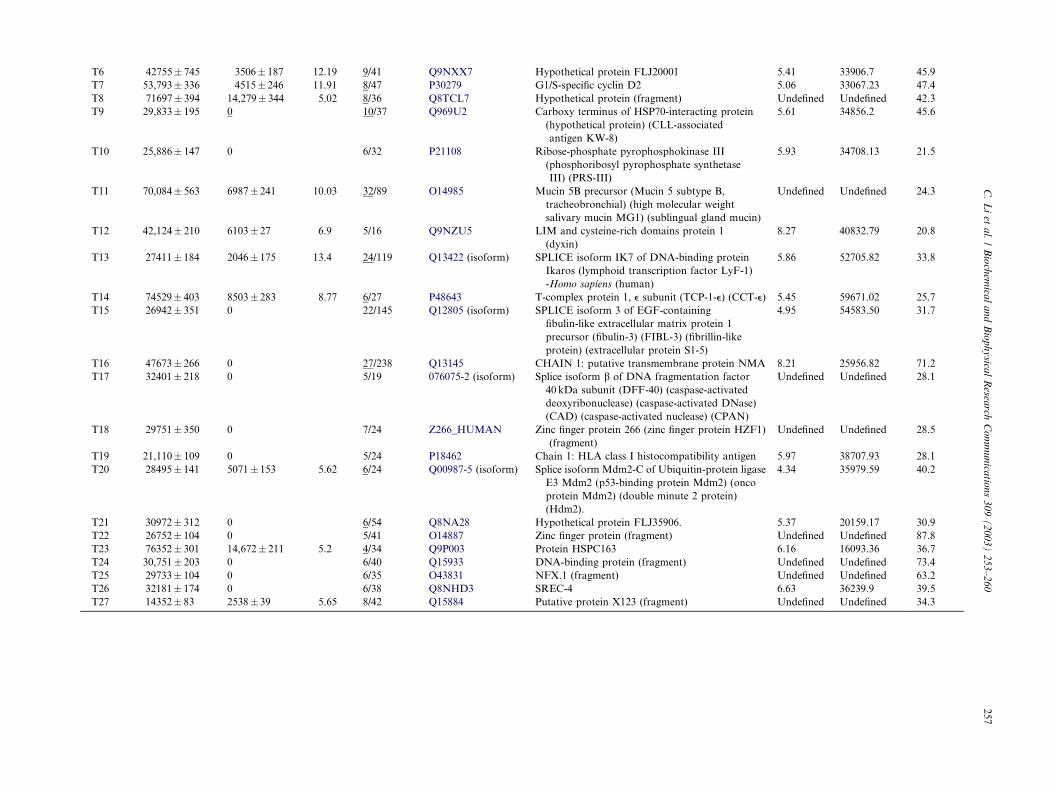
Table 1
Characterized differentially expressed proteins in human lung squamous carcinoma tissues compared to the paired normal bronchial epithelial tissues adjacent to tumors
Spot
number
Expression in
carcinoma
Expression in
control
Ratio Peptide
matches
AC Description pI Mw Coverage
(%)
N1 0 34,510� 103 8/50 Q9HC90 Calpain 10 (calcium-activated neutral
proteinase 10) (CANP 10)
6.54 15582.85 57.1
N2 0 32,803� 217 6/32 P30085 UMP-CMP kinase (cytidylate kinase)
(deoxycytidylate kinase) (cytidine
monophosphate kinase)
5.44 22222.34 60.2
N3 3043� 101 16,785� 279 5.52 6/22 Q9BQN3 DJ601O1.1 (novel protein with kunitz/bovine pan
creatic trypsin inhibitor domain) (fragment)
Undefined Undefined 44.2
N4 0 29,743� 197 10/61 P36980 (isoform) SPLICE truncated isoform of complement
factor H-related protein 2 precursor (FHR-2)
(H factor-like protein 2) (H factor-like 3)
(DDESK59)
6.52 27896.58 31.7
N5 71,697� 394 14,279� 344 5.02 13/47 Q8TCL7 Hypothetical protein (fragment) Undefined Undefined 58.1
N6 16201� 140 82,953� 206 5.12 9/53 P08709 Chain 1: factor VII light chain 5.03 17025.93 65.1
N7 9632� 113 54,305� 265 5.63 9/44 O60942 (isoform) SPLICE isoform 3 of mRNA capping enzyme
(HCE) (HCAP1) [includes: polynucleotide
50-triphosphatase (mRNA 50-triphosphatase)
(TPase); mRNA guanylyltransferase
(GTP–RNA guanylyltransferase) (GTase)]
8.3 52533.29 22.1
N8 0 23,417� 93 8/113 O14753 Putative transcription factor Ovo-like 1
(hOvo1) (fragment)
Undefined Undefined 36.2
N9 10,352� 188 77,843� 304 7.52 7/28 Q99871 X-linked protein STS1769 7.22 33582.38 32.2
N10 0 34,875� 231 5/18 P09329 Ribose-phosphate pyrophosphokinase I
(phosphoribosyl pyrophosphate synthetase I)
(PPRibP) (PRS-I)
6.56 34703.04 29.3
N11 10743� 184 56,984� 195 5.5 14/164 Q14964 Ras-related protein Rab-39 6.9 24869.51 44.2
N12 16825� 153 88,631� 263 5.27 20/260 Q9NYY1 Chain 1: interleukin-20 8.77 17513.32 63.8
N13 0 19,452� 106 4/47 P10073 Krueppel-related zinc finger protein 2 (HKR2
protein) (fragment)
Undefined Undefined 34
N14 0 21,135� 174 9/76 Q01469 Fatty acid-binding protein, epidermal (E-
FABP) (psoriasis-associated fatty acid-
binding protein homolog) (PA-FABP)
6.6 15164.43 48.1
T1 80789� 796 13,687� 578 5.9 9/91 Q07812 Apoptosis regulator BAX, membrane isoform
a-Homo sapiens (human)
5.08 21184.41 57.3
T2 11,100� 245 2306� 95 48.1 7/32 Q8TDH6 CLL-associated antigen KW-1 splice variant 1
(fragment)
Undefined Undefined 28.9
T3 76752� 678 0 12/31 Q8WW21 Similar to activator of CREM in testis 7.57 32809.7 62.3
T4 55383� 376 1189� 67 46.58 10/45 P52744 Zinc finger protein 138 (fragment) Undefined Undefined 37.2
T5 28379� 145 985� 43 28.81 11/50 Q9HAV5 Tumor necrosis factor receptor superfamily
member XEDAR (X-linked ectodysplasin-A2
receptor) (EDA-A2 receptor)
4.91 32728.66 33.3
256
C.Liet
al./Biochem
icalandBiophysica
lResea
rchCommunica
tions309(2003)253–260
T6 42755� 745 3506� 187 12.19 9/41 Q9NXX7 Hypothetical protein FLJ20001 5.41 33906.7 45.9
T7 53,793� 336 4515� 246 11.91 8/47 P30279 G1/S-specific cyclin D2 5.06 33067.23 47.4
T8 71697� 394 14,279� 344 5.02 8/36 Q8TCL7 Hypothetical protein (fragment) Undefined Undefined 42.3
T9 29,833� 195 0 10/37 Q969U2 Carboxy terminus of HSP70-interacting protein
(hypothetical protein) (CLL-associated
antigen KW-8)
5.61 34856.2 45.6
T10 25,886� 147 0 6/32 P21108 Ribose-phosphate pyrophosphokinase III
(phosphoribosyl pyrophosphate synthetase
III) (PRS-III)
5.93 34708.13 21.5
T11 70,084� 563 6987� 241 10.03 32/89 O14985 Mucin 5B precursor (Mucin 5 subtype B,
tracheobronchial) (high molecular weight
salivary mucin MG1) (sublingual gland mucin)
Undefined Undefined 24.3
T12 42,124� 210 6103� 27 6.9 5/16 Q9NZU5 LIM and cysteine-rich domains protein 1
(dyxin)
8.27 40832.79 20.8
T13 27411� 184 2046� 175 13.4 24/119 Q13422 (isoform) SPLICE isoform IK7 of DNA-binding protein
Ikaros (lymphoid transcription factor LyF-1)
-Homo sapiens (human)
5.86 52705.82 33.8
T14 74529� 403 8503� 283 8.77 6/27 P48643 T-complex protein 1, e subunit (TCP-1-e) (CCT-e) 5.45 59671.02 25.7
T15 26942� 351 0 22/145 Q12805 (isoform) SPLICE isoform 3 of EGF-containing
fibulin-like extracellular matrix protein 1
precursor (fibulin-3) (FIBL-3) (fibrillin-like
protein) (extracellular protein S1-5)
4.95 54583.50 31.7
T16 47673� 266 0 27/238 Q13145 CHAIN 1: putative transmembrane protein NMA 8.21 25956.82 71.2
T17 32401� 218 0 5/19 076075-2 (isoform) Splice isoform b of DNA fragmentation factor
40 kDa subunit (DFF-40) (caspase-activated
deoxyribonuclease) (caspase-activated DNase)
(CAD) (caspase-activated nuclease) (CPAN)
Undefined Undefined 28.1
T18 29751� 350 0 7/24 Z266_HUMAN Zinc finger protein 266 (zinc finger protein HZF1)
(fragment)
Undefined Undefined 28.5
T19 21,110� 109 0 5/24 P18462 Chain 1: HLA class I histocompatibility antigen 5.97 38707.93 28.1
T20 28495� 141 5071� 153 5.62 6/24 Q00987-5 (isoform) Splice isoform Mdm2-C of Ubiquitin-protein ligase
E3 Mdm2 (p53-binding protein Mdm2) (onco
protein Mdm2) (double minute 2 protein)
(Hdm2).
4.34 35979.59 40.2
T21 30972� 312 0 6/54 Q8NA28 Hypothetical protein FLJ35906. 5.37 20159.17 30.9
T22 26752� 104 0 5/41 O14887 Zinc finger protein (fragment) Undefined Undefined 87.8
T23 76352� 301 14,672� 211 5.2 4/34 Q9P003 Protein HSPC163 6.16 16093.36 36.7
T24 30,751� 203 0 6/40 Q15933 DNA-binding protein (fragment) Undefined Undefined 73.4
T25 29733� 104 0 6/35 O43831 NFX.1 (fragment) Undefined Undefined 63.2
T26 32181� 174 0 6/38 Q8NHD3 SREC-4 6.63 36239.9 39.5
T27 14352� 83 2538� 39 5.65 8/42 Q15884 Putative protein X123 (fragment) Undefined Undefined 34.3
C.Liet
al./Biochem
icalandBiophysica
lResea
rchCommunica
tions309(2003)253–260
257
258 C. Li et al. / Biochemical and Biophysical Research Communications 309 (2003) 253–260
Q8TCL7, hypothetical protein) (Table 1). Forty differ-ential protein-spots (12 spots only expressed in tumor-
tissues, seven spots only in control-tissues, the rest of the
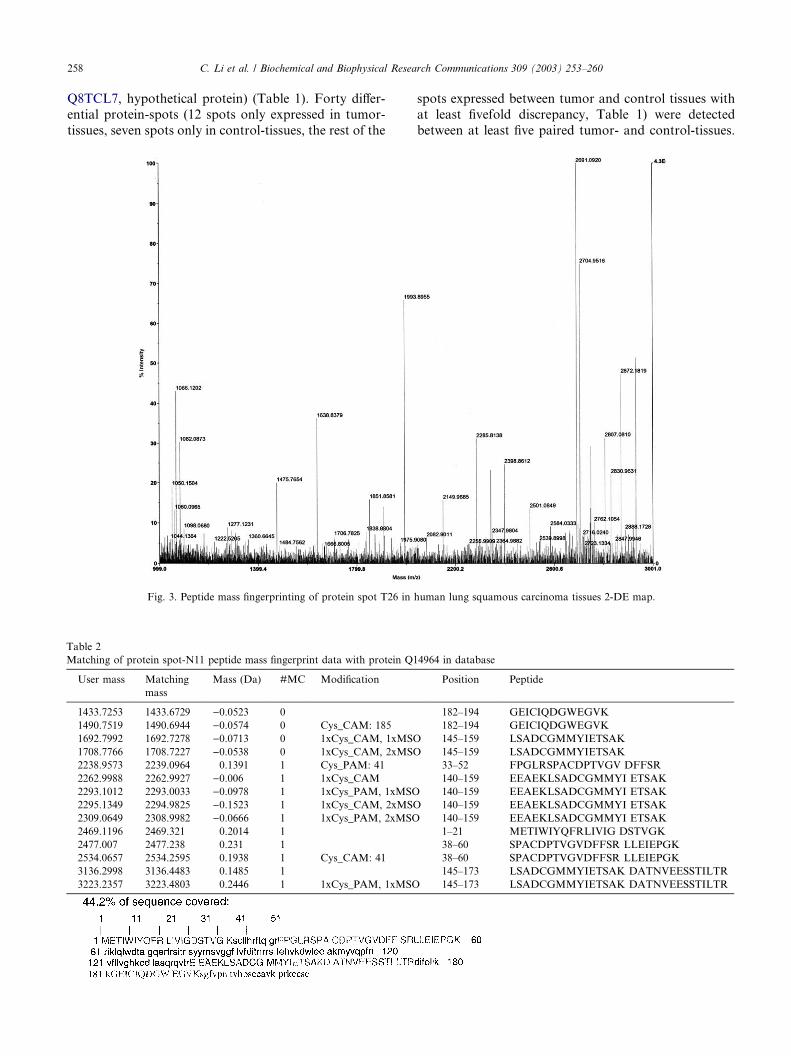
Fig. 3. Peptide mass fingerprinting of protein spot T26 in
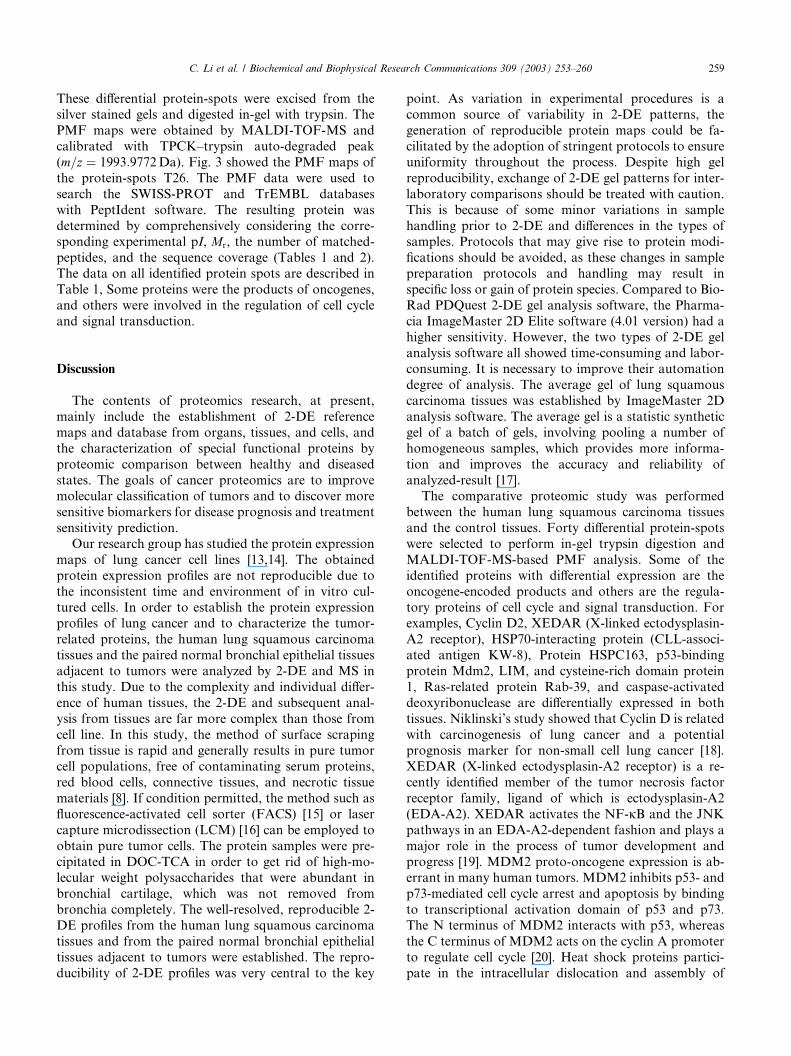
Table 2
Matching of protein spot-N11 peptide mass fingerprint data with protein Q1
User mass Matching
mass
Mass (Da) #MC Modification
1433.7253 1433.6729 )0.0523 0
1490.7519 1490.6944 )0.0574 0 Cys_CAM: 185
1692.7992 1692.7278 )0.0713 0 1xCys_CAM, 1xMSO
1708.7766 1708.7227 )0.0538 0 1xCys_CAM, 2xMSO
2238.9573 2239.0964 0.1391 1 Cys_PAM: 41
2262.9988 2262.9927 )0.006 1 1xCys_CAM
2293.1012 2293.0033 )0.0978 1 1xCys_PAM, 1xMSO
2295.1349 2294.9825 )0.1523 1 1xCys_CAM, 2xMSO
2309.0649 2308.9982 )0.0666 1 1xCys_PAM, 2xMSO
2469.1196 2469.321 0.2014 1
2477.007 2477.238 0.231 1
2534.0657 2534.2595 0.1938 1 Cys_CAM: 41
3136.2998 3136.4483 0.1485 1
3223.2357 3223.4803 0.2446 1 1xCys_PAM, 1xMSO
spots expressed between tumor and control tissues withat least fivefold discrepancy, Table 1) were detected
between at least five paired tumor- and control-tissues.
human lung squamous carcinoma tissues 2-DE map.
4964 in database
Position Peptide
182–194 GEICIQDGWEGVK
182–194 GEICIQDGWEGVK
145–159 LSADCGMMYIETSAK
145–159 LSADCGMMYIETSAK
33–52 FPGLRSPACDPTVGV DFFSR
140–159 EEAEKLSADCGMMYI ETSAK
140–159 EEAEKLSADCGMMYI ETSAK
140–159 EEAEKLSADCGMMYI ETSAK
140–159 EEAEKLSADCGMMYI ETSAK
1–21 METIWIYQFRLIVIG DSTVGK
38–60 SPACDPTVGVDFFSR LLEIEPGK
38–60 SPACDPTVGVDFFSR LLEIEPGK
145–173 LSADCGMMYIETSAK DATNVEESSTILTR
145–173 LSADCGMMYIETSAK DATNVEESSTILTR
C. Li et al. / Biochemical and Biophysical Research Communications 309 (2003) 253–260 259
These differential protein-spots were excised from thesilver stained gels and digested in-gel with trypsin. The
PMF maps were obtained by MALDI-TOF-MS and
calibrated with TPCK–trypsin auto-degraded peak
(m=z ¼ 1993:9772Da). Fig. 3 showed the PMF maps of
the protein-spots T26. The PMF data were used to
search the SWISS-PROT and TrEMBL databases
with PeptIdent software. The resulting protein was
determined by comprehensively considering the corre-sponding experimental pI, Mr, the number of matched-
peptides, and the sequence coverage (Tables 1 and 2).
The data on all identified protein spots are described in
Table 1, Some proteins were the products of oncogenes,
and others were involved in the regulation of cell cycle
and signal transduction.
Discussion
The contents of proteomics research, at present,
mainly include the establishment of 2-DE reference
maps and database from organs, tissues, and cells, and
the characterization of special functional proteins by
proteomic comparison between healthy and diseased
states. The goals of cancer proteomics are to improvemolecular classification of tumors and to discover more
sensitive biomarkers for disease prognosis and treatment
sensitivity prediction.
Our research group has studied the protein expression
maps of lung cancer cell lines [13,14]. The obtained
protein expression profiles are not reproducible due to
the inconsistent time and environment of in vitro cul-
tured cells. In order to establish the protein expressionprofiles of lung cancer and to characterize the tumor-
related proteins, the human lung squamous carcinoma
tissues and the paired normal bronchial epithelial tissues
adjacent to tumors were analyzed by 2-DE and MS in
this study. Due to the complexity and individual differ-
ence of human tissues, the 2-DE and subsequent anal-
ysis from tissues are far more complex than those from
cell line. In this study, the method of surface scrapingfrom tissue is rapid and generally results in pure tumor
cell populations, free of contaminating serum proteins,
red blood cells, connective tissues, and necrotic tissue
materials [8]. If condition permitted, the method such as
fluorescence-activated cell sorter (FACS) [15] or laser
capture microdissection (LCM) [16] can be employed to
obtain pure tumor cells. The protein samples were pre-
cipitated in DOC-TCA in order to get rid of high-mo-lecular weight polysaccharides that were abundant in
bronchial cartilage, which was not removed from
bronchia completely. The well-resolved, reproducible 2-
DE profiles from the human lung squamous carcinoma
tissues and from the paired normal bronchial epithelial
tissues adjacent to tumors were established. The repro-
ducibility of 2-DE profiles was very central to the key
point. As variation in experimental procedures is acommon source of variability in 2-DE patterns, the
generation of reproducible protein maps could be fa-
cilitated by the adoption of stringent protocols to ensure
uniformity throughout the process. Despite high gel
reproducibility, exchange of 2-DE gel patterns for inter-
laboratory comparisons should be treated with caution.
This is because of some minor variations in sample
handling prior to 2-DE and differences in the types ofsamples. Protocols that may give rise to protein modi-
fications should be avoided, as these changes in sample
preparation protocols and handling may result in
specific loss or gain of protein species. Compared to Bio-
Rad PDQuest 2-DE gel analysis software, the Pharma-
cia ImageMaster 2D Elite software (4.01 version) had a
higher sensitivity. However, the two types of 2-DE gel
analysis software all showed time-consuming and labor-consuming. It is necessary to improve their automation
degree of analysis. The average gel of lung squamous
carcinoma tissues was established by ImageMaster 2D
analysis software. The average gel is a statistic synthetic
gel of a batch of gels, involving pooling a number of
homogeneous samples, which provides more informa-
tion and improves the accuracy and reliability of
analyzed-result [17].The comparative proteomic study was performed
between the human lung squamous carcinoma tissues
and the control tissues. Forty differential protein-spots
were selected to perform in-gel trypsin digestion and
MALDI-TOF-MS-based PMF analysis. Some of the
identified proteins with differential expression are the
oncogene-encoded products and others are the regula-
tory proteins of cell cycle and signal transduction. Forexamples, Cyclin D2, XEDAR (X-linked ectodysplasin-
A2 receptor), HSP70-interacting protein (CLL-associ-
ated antigen KW-8), Protein HSPC163, p53-binding
protein Mdm2, LIM, and cysteine-rich domain protein
1, Ras-related protein Rab-39, and caspase-activated
deoxyribonuclease are differentially expressed in both
tissues. Niklinski’s study showed that Cyclin D is related
with carcinogenesis of lung cancer and a potentialprognosis marker for non-small cell lung cancer [18].
XEDAR (X-linked ectodysplasin-A2 receptor) is a re-
cently identified member of the tumor necrosis factor
receptor family, ligand of which is ectodysplasin-A2
(EDA-A2). XEDAR activates the NF-jB and the JNK
pathways in an EDA-A2-dependent fashion and plays a
major role in the process of tumor development and
progress [19]. MDM2 proto-oncogene expression is ab-errant in many human tumors. MDM2 inhibits p53- and
p73-mediated cell cycle arrest and apoptosis by binding
to transcriptional activation domain of p53 and p73.
The N terminus of MDM2 interacts with p53, whereas
the C terminus of MDM2 acts on the cyclin A promoter
to regulate cell cycle [20]. Heat shock proteins partici-
pate in the intracellular dislocation and assembly of
260 C. Li et al. / Biochemical and Biophysical Research Communications 309 (2003) 253–260
many proteins and are associated with carcinogenesis.LIM and cysteine-rich domain protein 1 may function
as regulators of transcription. Altered function of LIM
and cysteine-rich domain protein 1 by chromosomal
translocations, leads to leukaemia [21]. Our results
showed that Cyclin D2, XEDAR, p53-binding protein
Mdm2, LIM, and cysteine-rich domain protein 1,
HSP70-interacting protein, and protein HSPC163 were
up-regulated or expressed only in lung squamous car-cinomas, compared to that in normal tissues. These data
suggest a role of these proteins in the carcinogenesis of
lung squamous carcinoma. Ras-related protein Rab-39
was down-regulated in lung squamous carcinomas
compared with control, the mechanism of which awaits
further study [22]. The comparative proteomics is an
effective platform to study the human lung squamous
carcinoma. The 2-DE maps presented in this study willbenefit identification of potential tumor markers and
understanding of the mechanisms of human lung squa-
mous carcinoma.
Acknowledgments
This work was supported by a grant from National 973 Project of
China (2001CB5102), for Outstanding Scholars of New Era from
Ministry of Education of China (2002-48), National Natural Science
Foundation of China (30000028, 30240056), and key research program
from Science and Technology Committee of Hunan, China
(02SSY2001-1), and key research program from Public Health Bureau
of Hunan Province, China (Z02-04).
References
[1] A.D. Lopez, Counting the dead in China: measuring tobacco’s
impact in the developing world, BMJ 317 (1998) 1399–1400.
[2] Y. Sekido, K.M. Fong, J.D. Minna, Progress in understanding the
molecular pathogenesis of human lung cancer, Biochim. Biophys.
Acta 1378 (1998) F21–F59.
[3] T. Hirano, K. Fujioka, B. Franzen, et al., Relationship between
TAO1 and TAO2 polypeptides associated with lung adenocarci-
noma and histocytological features, Br. J. Cancer 75 (1997) 978–
985.
[4] J.M. Oh, F. Brichory, E. Puravs, R. Kuick, C. Wood, J.M.
Rouillard, J. Tra, S. Kardia, D. Beer, S. Hanash, A database of
protein expression in lung cancer, Proteomics 1 (2001) 1303–1319.
[5] F. Brichory, D. Beer, S. Hanash, et al., Proteomics-based
identification of protein gene product 9.5 as a tumor antigen that
induces a humoral immune response in lung cancer, Cancer Res.
61 (2001) 7908–7912.
[6] K. Hibi, W.H. Westra, M. Borges, S. Goodman, D. Sidransky, J.
Jen, PGP9.5 as a candidate tumor marker for non-small-cell lung
cancer, Am. J. Pathol. 155 (1999) 711–715.
[7] G.A. Chen, T.G. Gharib, C.C. Huang, et al., Proteomic analysis
of lung adenocarcinoma: identification of a highly expressed set of
proteins in tumors, Clin. Cancer Res. 8 (2002) 2298–2305.
[8] A.A. Alaiya, U.J. Roblick, B. Franzen, H.P. Bruch, G. Auer,
Protein expression profiling in human lung, breast, bladder, renal,
colorectal and ovarian cancers, J. Chromatogr. B 787 (2003) 207–
222.
[9] N. Araki, T. Morimasa, T. Sakai, et al., Comparative analysis of
brain proteins from P53-deficient mice by two-dimensional
electrophoresis, Electrophoresis 21 (2000) 1880–1889.
[10] A. Gorg, C. Obermaier, G. Boguth, et al., The current state of
two-dimensional electrophoresis with immobilized pH gradients,
Electrophoresis 21 (2000) 1037–1053.
[11] J.M. Gorbett, M.J. Dunn, A. Posch, et al., Positional reproduc-
ibility of protein spots in two-dimensional polyacrylamide gel
electrophoresis using immobilized pH gradients isoelectric focus-
ing in the first dimension: an interlaboratory comparison, Elec-
trophoresis 15 (1994) 1205–1211.
[12] P. Chen, J.Y. Xie, S.P. Liang, Identification of protein spots in
silver-stained two-dimensional gels by MALDI-TOF mass peptide
map analysis, Acta Biochim. Biophys. Sin. 32 (2000) 387–391.
[13] X.Q. Zhan, Y.J. Guan, C. Li, Z.C. Chen, J.Y. Xie, P. Chen, S.P.
Liang, Differential proteomic analysis of human lung adenocar-
cinoma cell line A-549 and normal cell line HBE, Acta Biochim.
Biophys. Sin. 34 (2002) 50–56.
[14] X.Q. Zhan, Y.J. Guan, Z.C. Chen, C. Li, et al., Analysis of human
pulmonary adenocarcinoma cell line NCI-H520 proteome by two-
dimensional electrophoresis and MALDI-TOF-MS, Chin. J.
Cancer 20 (2001) 575–582.
[15] M. Quadroni, P. James, Proteomics and automation, Electropho-
resis 20 (1999) 664–677.
[16] D.K. Ornstein, J.W. Gillespie, C.P. Paweletz, Proteomic
analysis of laser capture microdissection human prostate
cancer and in vitro prostate cell, Electrophoresis 21 (2000)
2235–2240.
[17] Y.F. Jia, Q.X. Lin, R.J. Guo, H. Guo, S.J. Liu, The image
analysis of two-dimensional gel electrophoresis, Prog. Biochem.
Biophys. 28 (2001) 246–250.
[18] J. Niklinski, W. Niklinska, J. Laudanski, et al., Prognostic
molecular markers in non-small cell lung cancer, Lung Cancer
34 (Suppl. 2) (2001) s53–s58.
[19] S.K. Sinha, S. Zachariah, H.I. Quinones, et al., Role of TRAF3
and -6 in the activation of the NF-kappa B and JNK pathways by
X-linked ectodermal dysplasia receptor, J. Biol. Chem. 277 (2002)
44953–44961.
[20] T. Leveillard, B. Wasylyk, The MDM2 C-terminal region binds to
TAFII250 and is required for MDM2 regulation of the cyclin A
promoter, J. Biol. Chem. 272 (1997) 30651–30661.
[21] I. Sanchez-Garcia, T.H. Rabbitts, LIM domain proteins in
leukaemia and development, Semin. Cancer Biol. 4 (1993) 349–
358.
[22] G.P. Pfeifer, J.H. Yoon, L. Liu, et al., Methylation of the
RASSF1A gene in human cancers, Biol. Chem. 383 (2002) 907–
914, legend.