comparative metagenomic analysis of soil microbial communities across three hexachlorocyclohexane...
TRANSCRIPT

Comparative Metagenomic Analysis of Soil MicrobialCommunities across Three HexachlorocyclohexaneContamination LevelsNaseer Sangwan1, Pushp Lata1, Vatsala Dwivedi1, Amit Singh1, Neha Niharika1, Jasvinder Kaur1,
Shailly Anand1, Jaya Malhotra1, Swati Jindal1, Aeshna Nigam1, Devi Lal1, Ankita Dua1, Anjali Saxena1,
Nidhi Garg1, Mansi Verma1, Jaspreet Kaur1, Udita Mukherjee1, Jack A. Gilbert2,5, Scot E. Dowd3,
Rajagopal Raman1, Paramjit Khurana4, Jitendra P. Khurana4, Rup Lal1*
1 Department of Zoology, University of Delhi, Delhi, India, 2 Argonne National Laboratory, Argonne, Illinois, United States of America, 3 MR DNA (Molecular Research LP),
Shallowater, Texas, United States of America, 4 Interdisciplinary Centre for Plant Genomics & Department of Plant Molecular Biology, University of Delhi South Campus,
New Delhi, India, 5 Department of Ecology and Evolution, University of Chicago, Chicago, Illinois, United States of America
Abstract
This paper presents the characterization of the microbial community responsible for the in-situ bioremediation ofhexachlorocyclohexane (HCH). Microbial community structure and function was analyzed using 16S rRNA amplicon andshotgun metagenomic sequencing methods for three sets of soil samples. The three samples were collected from a HCH-dumpsite (450 mg HCH/g soil) and comprised of a HCH/soil ratio of 0.45, 0.0007, and 0.00003, respectively. Certain bacterial;(Chromohalobacter, Marinimicrobium, Idiomarina, Salinosphaera, Halomonas, Sphingopyxis, Novosphingobium, Sphingomonasand Pseudomonas), archaeal; (Halobacterium, Haloarcula and Halorhabdus) and fungal (Fusarium) genera were found to bemore abundant in the soil sample from the HCH-dumpsite. Consistent with the phylogenetic shift, the dumpsite alsoexhibited a relatively higher abundance of genes coding for chemotaxis/motility, chloroaromatic and HCH degradation (lingenes). Reassembly of a draft pangenome of Chromohalobacter salaxigenes sp. (,8X coverage) and 3 plasmids (pISP3, pISP4and pLB1; 13X coverage) containing lin genes/clusters also provides an evidence for the horizontal transfer of HCHcatabolism genes.
Citation: Sangwan N, Lata P, Dwivedi V, Singh A, Niharika N, et al. (2012) Comparative Metagenomic Analysis of Soil Microbial Communities across ThreeHexachlorocyclohexane Contamination Levels. PLoS ONE 7(9): e46219. doi:10.1371/journal.pone.0046219
Editor: Kelly A. Brayton, Washington State University, United States of America
Received April 20, 2012; Accepted August 28, 2012; Published September 28, 2012
Copyright: � 2012 Sangwan et al. This is an open-access article distributed under the terms of the Creative Commons Attribution License, which permitsunrestricted use, distribution, and reproduction in any medium, provided the original author and source are credited.
Funding: This work was supported by grants under University of Delhi/Department of Science and Technology PURSE Program and grants from Department ofBiotechnology, Government of India under project BT/PR3301/BCE/8/875/2011 and Application of microorganisms and allied sector F.No.AMAAS/2006–07/NBAIM/CIR. This work was also supported in part by the United States Department of Energy under Contract DE-AC02-06CH11357. The funders had no role instudy design, data collection and analysis, decision to publish, or preparation of the manuscript.
Competing Interests: One of the co-authors in this manuscript is an employee in a private company (MR DNA Molecular Research LP, 503 Clovis Rd,Shallowater, Texas 79363 806-789-7984, United States of America) and this does not alter the authors’ adherence to all the PLOS ONE policies on sharing data andmaterials. The other authors have declared that no competing interests exist.
* E-mail: [email protected]
Introduction
From the early 1950 s to late 1980 s, hexachlorocyclohexane
(HCH) was one of the most globally popular pesticides used for
agricultural crops. HCH is chemically synthesized by the process
of photochlorination of benzene. The synthesized product is called
as technical-HCH (t-HCH) and consists of five isomers namely, a-
(60–70%), c- (12–16%), b- (10–12%), d- (6–10%) and e- (3–4%)
[1]. The insecticidal property of HCH is contributed mainly by the
c-HCH (also known as Lindane) [2]. The process of extracting the
c -HCH isomer from the t-HCH generates a HCH-waste
(consisting of a-, b-, d- HCH) which is 8 times the amount of
lindane produced [1]. In the last 60 years, 600,000 tons of lindane
has been produced, thereby, generating a HCH-waste (referred as
HCH-muck) of around 4–7 million tons [3–4]. The inappropriate
waste-disposal techniques and the indiscriminate use of this
pesticide have created a global environmental contamination issue
[1].
This environmental contamination is mainly associated with the
physicochemical properties of the HCH isomers which are
completely different from other pollutants [5]. The axial and
equatorial position of the chlorine atoms around the cyclohexane
ring governs the persistence of these HCH isomers in the
environment. Over the years, the build-up of huge stockpiles of
HCH waste and their leaching into the environment through air
and water have marked HCH as a problematic polluting
compound [3]. A primary concern is the human health risks
associated with the carcinogenic [6], endocrine disruptor and
neurotoxic [6] properties of the HCH isomers. In May 2008
signatories of the Stockholm Convention listed a-, b- and c- HCH
amongst the recognized persistent organic pollutants (UNEP
2009).
Sites heavily contaminated with HCH have been reported from
Germany, Japan, Spain, The Netherlands, Portugal, Greece,
Canada, the United States, Eastern Europe, South Africa and
India [5]. By the 1970’s and 1980’s the usage and production of t-
PLOS ONE | www.plosone.org 1 September 2012 | Volume 7 | Issue 9 | e46219

HCH and lindane was banned in most of the industrialized
countries. In India the use of t-HCH was introduced in 1950’s and
has continued till 1997. However, even after 1997, there remained
restricted production and use of lindane [7]. In the last 15 years
7000–8000 tons of lindane has been manufactured and the
corresponding HCH-muck been improperly disposed off at several
locations [2] (called HCH dumpsites). These HCH-dumpsites
form the ideal experimental sites to understand how microbial
communities respond to HCH pollution.
Owing to the global presence of the HCH open sinks, several
primal efforts have focused on developing an efficient bioremedia-
tion technology [8–11]. As a first step the genetics, biochemistry
and physiology of microbial degradation of HCH isomers
especially of c-HCH has been studied in detail in Sphingomonads.
For example, the genetic pathways responsible for the degradation
of c HCH, also called lin genes (lin pathway), have been
characterized from Sphingobium japonicum UT26 [12] and Sphingo-
bium indicum B90A [5,13]. In general c-HCH degradation pathway
is divided into upper and lower pathways. The upper pathway of
c-HCH is mediated by dehydrochlorination (linA), haloalkane
dehalogenation (linB) and dehydrogenation (linC/linX) in a
sequential manner leading to the formation of 2, 5-dichlorohy-
droquinone. 2, 5-dichlorohydroquinone (lower pathway) is further
converted to succinyl-CoA and acetyl-CoA by the action of
reductive dechlorinase (linD), ring cleavage oxygenase (linE),
maleylacetatereductase (linF), an acyl-CoA transferase (linG, H)
and a thiolase (linJ). By and large the expression of lin genes in
these strains is heterogeneous in nature as the genes of the upper
pathway are expressed constitutively (linA, linB and linC) [14] and
others (linE and linD) can be induced via transcription factors (linR)
[14–15]. In addition to their primary role in the degradation of c-
HCH, linA and linB play an important role in the degradation of a-
, b-, d- and e-HCH; but they also degrade the intermediates that
are constitutively generated by this pathway. Sequence differences
in the primary LinA and LinB enzymes in the pathway play a key
role in determining their ability to degrade the different isomers.
These studies formed the base of field trials where Sphingobium
indicum B90A has been used as a primary bioremediatory element;
however, these efforts have had limited success [9]. While one
organism may play a dominant role in the degradation process, the
role of the associated microbial species in the microbial consortia
may also play a role in augmenting its capability. Therefore,
characterizing the microbial community structure at HCH-
dumpsites should be a priority.
Here we present results of the first detailed investigation of the
unexplored bacterial, archaeal and fungal diversity that exists in
the soil of a HCH dumpsite. In addition to the taxonomic
characterization, changes in their functional dynamics are also
studied. The comparative gene centric analysis performed in this
study clearly indicate that the marked differences in the microbial
community are associated with the changes in the functional
diversity especially related to their membrane transport, chemo-
taxis/motility and catabolic genes (lin genes) affected by the
presence of HCH isomers at the dumpsite.
Materials and Methods
Ethics StatementNo specific permits were required for the described field studies.
Selection of HCH Contamination, Soil Sampling and TotalDNA Extraction
To study the shift in microbial community structure across the
increasing HCH contamination, we collected bulk soil samples
from a HCH dumpsite situated at Ummari village, Lucknow [7]
(27u 009 24.799 N, 81u 089 57.899 E), along with two more locations
situated at a distance of 1 km (27u 009 31.199 N, 81u 089 54.7 E)
and 5 km (27u 009 59.599 N, 81u 089 36.0.8 E) away from the
dumpsite. The latter two soils were used as reference to assess the
changes in microbial community under HCH stress at the
dumpsite. Sampling was performed in the September of 2010
considering seasonal crop rotation (land was not processed for
farming). Since sampling sites represent physicochemically differ-
ent soils from uncultivable (HCH-dumpsite, 450 mg/g) to
agriculturally managed (a small segment at 5 km site), subsamples
(10 subsamples from each composite mix; 500 g soil/subsample)
were collected at a depth of 10–20 cm, coordinates with any type
of vegetation (natural or agricultural) were strictly avoided. Sub-
samples were transported on ice (4uC) and stored at 280uC till
processed for HCH residue estimation and physiochemical
analysis using methods described earlier [7]. DNA from each
subsample was isolated by using PowerMaxH Soil DNA Isolation
Kit (MO-BIO, USA). Equal concentration ( = 200 mg) of environ-
ment DNA from each subsample (10 subsamples/composite pool)
were mixed to form a composite genetic pool representing total
DNA composition for each site. DNA purity and concentration
was analyzed by using NanoDrop spectrophotometer (NanoDrop
Technologies Inc., Wilmington, DE, USA). Isolated total DNA
was stored at 220uC till processed for microbial diversity and
sequence analyses.
Sequence Data GenerationWe performed targeted amplicon and shotgun pyrosequencing
of the environment DNA using titanium protocols (Roche,
Indianapolis, IN, USA). Roche 454 analysis software version 2.0
was used to analyze the sequences. The Tag-Encoded FLX
Amplicon Pyrosequencing (TEFAP) was performed as described
earlier [16] by using one-step PCR, mixture of Hot Start and
HotStar high fidelity Taq polymerases. For shotgun sequencing of
environmental DNA samples a full picotitre plate was run for each
shotgun pyrosequencing library representing individual soil
gradient. A total of 1.2 Gigabases of nucleotide sequence was
generated (Table 1). Raw reads were processed for various quality
measures using Seq-trim pipeline [17]. Reads were preprocessed
at the following parameters; minimum length = 250 bp, minimum
quality score = Phred Q20 average and reads with ambiguous
bases (including N) were not used for further analysis.
Microbial Diversity AnalysisWe estimated microbial diversity across increasing HCH
contamination by using three different methods: TEFAP,
metagenomic SSU rRNA typing and direct comparison of EGTs
(Environmental Gene Tags) to the reference genomes. For
bacterial, archaeal and fungal diversity analysis by TEFAP [16]
method a total of 6 individual primer sets were utilized (Table S1).
Following sequencing, all failed sequence reads, low quality
sequence ends (Phred Q20 average) and tags/primers and reads
,250 bp were removed. The resulting sequences were then
deleted of any non-bacterial/archaeal/fungal ribosome sequences
and chimeras using custom software [18] set at default parameters.
For archaeal analysis, in addition to the above steps, sequences
with greater identity to bacterial 16S rRNA gene sequences were
also deleted. Unique reads were BLASTN [19] (E-value cutoff of
161025 minimum coverage 90% and 88% identity) against
GreenGene [20] (16S rRNA) and SILVA [21] (SSUs and LSUs)
databases. Resulting outputs were compiled and data reduction
analysis performed by using a NET and C# analysis pipeline [22].
In the second approach SSU rRNAs from the shotgun
Metagenomic Analysis of HCH Contaminated Soils
PLOS ONE | www.plosone.org 2 September 2012 | Volume 7 | Issue 9 | e46219

metagenomic sequences were binned from each metagenome
using BLASTN [19] (E-value cutoff of 1610210 minimum
coverage 90% and 88% identity) against rRNA databases
mentioned above. OTU (Operational Taxonomic Unit: status
was assigned to sequences above 300 bp and similar to reference
sequences (.95%). OTUs were clustered with 97% similarity
criteria using UCLUST [23]. Candidates OTUs were used to
assign phylogeny using RDP [24] scheme at 80% confidence value
[25]. Relative abundance matrix (genus) of the metagenomes was
used for statistical analysis. In the third approach taxonomical
profiles were constructed by mapping metagenomic reads against
NCBI genome database using NBC [26] (Naive Bayesian
Classifier) at a N-mer length of 12.
Qualitative and Quantitative Measurements ofPhylogenetic Diversity
For each metagenome, a subset of 1000 randomly selected
candidate OTUs were used to construct a relaxed neighbor-
joining tree using Clearcut [27] with Kimura correction. To
understand the phylogenetic correlation between sampled soil
cohorts, distance matrices were constructed from each phylogeny
and Mantel test (10000 permutations, two tailed: p-value) was
performed using PASSAGE-2 [28]. Additionally, un-weighted
UniFrac [29] was run on phylogenetic tree (at 1000 permutation)
constructed after combining candidate OTUs from each meta-
genome. Rarefaction plots and non-parametric diversity indices
were calculated using EstimateS [30]. The statistics utilized are not
based upon biological replications but instead based upon
technical replications provided by utilizing multiple diversity
assays. Thus, we are representing the observational evaluation of
the 3 samples analyzed using a variety of diversity assays and
metagenome sequencing data from samples with three different
contamination levels of HCH.
Characterization of Metagenomic Gene ContentMetagenomic sequences were annotated using evidence based
annotation approach [31]. Sequences were BLASTX [19] against
several protein databases (COGs, Pfam, SWISS PROT/TREM-
BLE and KEGG) at an E-value cutoff: 161025. Predicted genes
were tabulated and classified into functional categories from lower
orders (individual genes) to higher orders (cellular processes).
Relative abundance for each gene was calculated by dividing the
similarity hits for an individual gene by total hits against any of the
database. Higher functional order enriched in any of the
metagenome was later analyzed at the finer scales. To understand
the gradient specific functional traits, endemic metagenomic reads
were binned using MegaBLAST [32] (reads of one metagenome
against combination of remaining).
Community Potential and Participation for HCHDegradation
Sequences for well-characterized HCH degrading genes
(Table S8) were downloaded from NCBI (dated 11th March,
2011) and utilized as a template for DNA-Seq based analysis
that was performed using ArrayStar (DNAstar) at default
settings. Relative expression was calculated in each metagenome
as per manufacturer’s guidelines followed by statistical analysis
(Two sided Fishers exact test and storey’s FDR method).
Additionally, metagenomic reads representing any of the lin
gene were binned (BLASTN at E-value; 10210 and 85% query
coverage), and reference assembled on the ORF of respective lin
gene. As mentioned above, protein guided DNA assembly for
each lin gene was performed using Transpipe [33]. Relative
abundance of lindane degradation pathway was quantified for
each HCH gradient via comparing extracted lin gene sequences
against KEGG [34].
Microdiversity Analysis of the Environmental GenomesPhylogenetic reports created by 16S-rRNA pyro-tag, metage-
nomic SSUs and EGTs comparison with known genomes
revealed the enrichment of genera like Marinobacter, Chromohalo-
bacter, Sphingomonas, Sphingopyxsis and Novosphingobium (Fig.1(A) and
Fig.S1) along with increasing HCH contamination. Since most
of these genera are genetically and functionally selected to
degrade or tolerate HCH [5], we further focused our assembly
efforts to assess their genomic and plasmid microdiversity. All
metagenomic reads were aligned against the reference genomes
(Table S9) and plasmids and recruitment plots were generated
using MUMMER [35] as explained earlier [36]. Metagenomic
reads were assembled into contigs using velvet_0.5.01 [37] (k-
mer length = 31). Contigs were BLASTX [19] (E-value = 1025)
against NCBI nr (non redundant) database. Phylogenetic
identity was given to the contigs using MEGAN [38] at default
parameters. Largest clusters were grown by recruiting singlets
using Scarf algorithm [39] at following parameters, -g x –x T –
c T –l 6–M T -n 2. Coverage was calculated for each contig via
aligning metagenomic reads back to the contigs using Mosiak
aligner (www.bioinformatics.bc.edu) at default parameters.
Reference genome sequences (Table S9) were shredded into
3 kb long pseudo-contigs and concatenated with metgenomic
contigs. Pooled contigs (reference genomes and metagenome)
were later clustered based upon their tetra nucleotide frequency
correlations as explained previously [40]. After performing the
length distribution of contig pool following parameters were
optimized for tetra-ESOM analysis; minimum length of
contig = 1800 bp and maximum size window = 3500 bp. To
maximize the use of data contigs were further binned using the
%GC character as %G+C varies between species but remain
highly constant within species [41]. Contigs were submitted to
RAST [42] server for gene calling and annotation.
Statistical AnalysisIdentification of genes or subsystems enriched between any two
metagenomes was done using two-sided Fishers exact test with
Table 1. Chemical properties and sequencing data of soilgradients with HCH gradient.
Characteristic Dumpsite 1 Km 5 Km
pH 7.21 7.81 7.93
EC (dS/m) 8.50 0.19 0.43
Organic carbon (%) 30.74 0.45 0.67
Available K (kg/ha) 918 40.5 84.3
Available P (kg/ha) 60.3 93 318
Available N (kg/ha) 335 397 460
Salinity Highly Saline Normal Normal
gHCH (mg/g) 450 0.7 0.03
Sequence count 1,187,505 1,124,891 1,187,505
Mean length bp (SD) 337 (112) 339 (126) 337 (112)
Mean GC % (SD) 62 (9) 60 (10) 62 (9)
gHCH: represents the sum of a and b HCH isomers concentration.Salinity levels are representing the EC and cation concentration.doi:10.1371/journal.pone.0046219.t001
Metagenomic Analysis of HCH Contaminated Soils
PLOS ONE | www.plosone.org 3 September 2012 | Volume 7 | Issue 9 | e46219

storey’s FDR method for multiple test correction using STAMP
[43]. Genes or subsystems were considered as enriched if the p-
value was significant along with pair wise comparison of
metagenomes. A principle component analysis on correlation
matrix with 1000 bootstrap value was performed to compare
taxonomic profiles generated after 454 pyro-tagging of 16S-rRNA
gene, metagenomic SSU-rRNA typing and direct comparison of
EGTs with reference genomes. Two-way clustering was also
performed on normalized genus versus metagenome sample
(relative abundance from each taxonomy predictions method)
matrix with some changes in parameters as methods explained
elsewhere [44].
Data AvailabilityThe TEFAP data were submitted to NCBI SRA under
accessions SRA045821.1, SRP008135.1, 260594.1 and runs under
SRR342413.1 whereas shotgun sequencing data runs under
SRX0964712. Data were also uploaded to MG-RAST [45]
(accessions: Dumpsite = 4461840.3, 1 km = 4461013.3 and
5 km = 4461011.3).
Results and Discussion
Physicochemical Analysis of SoilsThe physicochemical analysis of the composite soil samples
from three locations (Table 1) showed significant differences
(P,0.00001 in all corresponding comparisons; Fisher’s Exact test
and Storey’s FDR method) in electrical conductivity (maximum at
the dumpsite; 8.5 dS/m). The dumpsite soil sample was highly
saline (Electrical conductivity and cation concentration) and
available potassium was .10 times higher (918 kg/ha) as
compared to other composite samples (1 km = 40 kg/ha,
5 km = 84.3 kg/ha). This difference in electrical conductivity
(EC) could be due to higher abundance of ions (especially cations)
as a result of pesticide contamination [46] and high potassium
concentration is a characteristic feature of soil ecosystems with
inherent bioremediation potential [47]. HCH contamination was
Figure 1. Phylogenetic analysis of the microbiomes. (A) Dual dendrogram of top 50 bacterial genera across three metagenomes obtained afterTEFAP analysis using four bacterial primer sets. Genera and sample categories were clustered using Manhattan distance metric, top 50 genera withstandard deviation .0.4 and having at least 0.8% of the total abundance were selected. Colour scale is representing the relative abundance ofsequence reads (normalized by sample-mean). (B) Phylogenetic correlation of microbial communities across increasing HCH contamination, a subsetof 1000 randomly selected OTUs from each metagenome was used to construct an elucidan distance matrix. Matrices were pair-wise compared usingMantel-test (1000 permutation, 0.05 as standard P -value) and Pearson correlation values were calculated. Asterisks indicate the statistical significanceP,0.001(mean6sm). (C) Relative percentage of reads assigned to different archeal (I) and fungal (II) genera in TEFAP analysis.doi:10.1371/journal.pone.0046219.g001
Metagenomic Analysis of HCH Contaminated Soils
PLOS ONE | www.plosone.org 4 September 2012 | Volume 7 | Issue 9 | e46219

mainly composed of a- and b- HCH (g HCH) and was up to
450 mg/g, 0.7 mg/g, 0.03 mg/g soil from the dumpsite, 1 km
and 5 km away soil samples, respectively (Table 1). The levels of
gHCH reported from the dumpsite are the highest reported from
any of the dumpsites studied so far [48–49].
Microbial Diversity EstimationIn our first taxonomic approach we performed 16S rRNA
amplicon pyrosequencing (TEFAP, Tag-Encoded FLX Amplicon
Pyrosequencing) for each composite genetic pool using kingdom
specific primers (Table S1) targeted at the conserved domains of
the rRNA genes [16]. Fig. 1 provides an overview of bacterial,
archaeal and fungal diversity based on TEFAP analysis. In this
analysis a total of 114, 771 sequences with an average length of
338 nucleotides were generated, of which 13,437 and 17,293 were
derived from archaeal and fungal assays, respectively. After quality
control steps (average quality score = Phred Q20 and tags, primers
and reads ,250 bp length were removed) a total of 72,178, 4,535
and 14,294 sequences were utilized for bacterial, archaeal and
fungal diversity analysis, respectively.
Bacterial Diversity AnalysisBacterial diversity was analyzed among the 3 sites using 4
bacterial primer pairs (Fig. 1A). The dual dendrogram is clustered
based upon weighted pair average and Manhattan distances.
Dumpsite assays were clustered together regardless of which
primer was utilized. Two of the primer pairs (530F-1100R and
515F-860R) (Table S1) always demonstrated high similarity to
each other independently of the environment analyzed (Fig. 1A),
which is to be expected, as they cover a similar region of the 16S
rRNA gene, but this also suggests that they retrieve a similar
community profile despite potential primer bias.
Several genera demonstrated notable differences (average and
standard deviation after each individual assay) between the sites
(Fig. 1A). Pseudomonas (2.9% 61.9), Sphingomonas (2.8% 63.2),
Novosphingobium (2.7% 61.8), Sphingopyxis (1.8% 62.4), Marinobacter
(14.8% 63.1) Chromohalobacter (2.7% 65.6), Halomonas (4.4% 61.1)
and Alcanivorus (4.2% 66.1) were more abundant in the dumpsite
dataset. The first four of these genera have already been reported
to degrade HCH isomers in pure cultures [5]. Interestingly, the
dumpsite soil dataset was also found to be enriched for anaerobes
Clostridium and Dehalobacter (Table S2) that are also reported to
degrade HCH isomers [50–51]. In contrast, the 1 km and 5 km
datasets were predominated by Escherichia/Shigella (37.8/7.6%
63.1); Acidobacterium (17.3% 62.6), Salmonella (7.6% 62.3), Levilinea
(3.5% 60.7) and Rubrobacterin (3.3% 61.3), respectively. This
finding is not unexpected as these bacteria especially Escherichia/
Shigella commonly colonize soils impacted by human or animal
waste, and a small segment of these sites were using such waste as a
fertilizer for growing rice, wheat and vegetables.
We also observed bacterial genera which were unique to the
dumpsite dataset. The criteria for selection of these genera
required that each of the bacterial diversity assays agreed (i.e. for
the genera all four were positive at the dumpsite and negative at
the other sites). These genera and the average percentage (average
among the four bacterial diversity assays) are presented in Table
S3. Marinimicrobium (1.1% 60.45), Idiomarina (0.67% 60.16) and
Salinisphaera (0.46% 60.20) were abundant as well as unique to the
dumpsite dataset alone (Table S3). However, there is no clear
evidence of their association with the degradation of HCH
isomers, nor any documented presence at HCH dumpsites in the
literature, although they have been reported from hyper saline
environments [52], which suggests that the salinity of the dumpsite
could be promoting unique microbial composition. Some of the
major genera that were predominantly present at lowest HCH site
(5 km) include Cladilinea, Streptomyces and Gemmatimonas (Table S4).
The bacterial/phylum distribution based upon SSU rRNA
analysis using RDP [24] (Table S5) was by and large in agreement
with that of TEFAP analysis. The most abundant phyla present in
the dumpsite and 1 km datasets were Proteobacteria (50–50.8%)
followed by Firmicutes (33.8–43%) and Actinobacteria (4–14.5%).
In contrast Firmicutes (70%) were most abundant in the 5 km
(lowest HCH) dataset (Table S5), which are known to be dominant
in dry/arid soils [53]. Fusobacteria, Cyanobacteria and Chlorobi
were completely absent in the dumpsite and 1 km datasets.
Therefore, while HCH contamination did impact the diversity and
abundance of the various bacterial genera, it did not markedly
affect phylum level diversity or abundance. A Mantel test of beta-
diversity between sites (between distance matrices generated from
phylogenetic tree of candidate OTUs; Fig. 1B) indicates a
significant linear correlation (P,0.001) between increasing stress
conditions (HCH contamination and salinity) and microbial
community structure. These beta-diversity patterns are driven by
the change in diversity and abundance of genera as described
above rather than higher taxonomic ranks.
Further insights into the bacterial diversity within the three
metagenomic datasets was obtained by computationally identify-
ing the reads matching bacterial 16S rRNA gene sequences from
the metagenomic reads (EGTs) and assigning them to different
taxonomic levels (SSU rRNA). We also mapped EGTs to .1100
bacterial genomes (EGT genome typing) in NCBI reference
genome database [54]. A total of 2,926, 4,164 and 2,301 SSU
rRNA reads were obtained from the dumpsite, 1 km and 5 km
datasets, respectively. The phylogenetic composition obtained by
TEFAP, SSU rRNA and EGT typing analysis was compared at
the genus (Fig S1) and phylum level (Fig S2). Despite the general
accordance, there are some noteworthy differences between the
TEFAP, SSU rRNA typing and EGT typing. For example,
Streptococcus was more abundant (9.6%) at the dumpsite according
to EGT typing in comparison to TEFAP (1%, 61.2) prediction,
while Acidobacterium was predominant in TEFAP analysis at the
dumpsite (13.3%, 62.3) in comparison to SSU rRNA typing (1%).
Relative enrichment of Pseudomonas (P,0.001 in all corresponding
comparisons), Sphingomonas (P,0.001 in all corresponding com-
parisons) and Chromohalobacter (P,0.001 in all corresponding
comparisons) was validated by all three approaches used. Some
of the differences among these three techniques could possibly be
attributed to the inherent biases of each technique, such as low
coverage of 16S rRNA in metagenomic data (SSU rRNA), PCR
primer amplification (TEFAP), and lack of relevant genomes for
this environment (EGT genome typing) as reported previously
[55–56]. Two strong points emerge from the data. First, the data
reflect that at the surface soil (up to 20 cm) there is relative
enrichment of bacterial, archaeal and fungal taxa genetically
evolved to tolerate high salinity and degrade HCH isomers. Thus
natural attenuation, a process in which microbial community
contribute to the pollutant degradation is already in operation but
needs to be monitored in detail over several other parameters
(salinity, organic wastes and time). Second, for rapid degradation
of HCH isomers at the dumpsite, the metagenomic data suggests
that it may indeed be possible to effectively biostimulate the
indigenous bacterial community by application of specific nutri-
ents that would target the productivity of specific taxa [10–11]
(taxa specific minimal salt medium and electron donors).
Archaeal and Fungal DiversitySo far the available literature on microbial diversity at the HCH
dumpsites only reflects the presence of bacteria [10,48–49], with
Metagenomic Analysis of HCH Contaminated Soils
PLOS ONE | www.plosone.org 5 September 2012 | Volume 7 | Issue 9 | e46219

archaeal and fungal diversity having never been analyzed at a
HCH dumpsite. Based upon relative abundance (reads assigned to
a particular archaeal genus/total reads assigned to the archaeal
domain), Nitrososphaera (.90%) and related genera were enriched
in the 1 km and the 5 km datasets whereas in the dumpsite dataset
there was a relative increase in the abundance of genera like
Halobacterium (.30%), Haloarcula (.10%), Halorhabdus (.10%) and
Halopelagius (.5%) (Fig. 1C–I). Archaeal genera like Halorhabdus
[57] and Halobacterium [58] have already been reported as naturally
selected inhabitants of highly saline (EC and cations concentration)
environments. In general, halophilic bacteria and archaea have a
broad catabolic potential [52], and hence these halophiles may
have a role in HCH degradation at the dumpsite. Evaluation of
fungal diversity based upon TEFAP analysis at the dumpsite
revealed high proportion of Fusarium species (.50%) that were
absent in our sampled genetically pooled samples representing two
remote sites (Fig. 1C–II). Fusarium species were tentatively
identified as either F. equiseti or F. oxysporum (LSU with .97%
sequence similarity to the reference sequence; Fig. S3). While the
role of other dominant fungal species is not yet known, the ability
of Fusarium sp. to degrade HCH isomers in pure cultures has been
described previously [59–60]. The 1 km site, a certain segment of
which is potentially impacted by human or animal waste fertilizer,
showed comparatively high proportions of Sarcosphaera (48.13%)
and Peziza (14.67%), while the most distant site (5 km) was
relatively high in Trichocladium (28.94%) and Oidium (10.13%).
Unlike the bacterial analysis, there were too few archaeal or fungal
sequences identified by rRNA classification or genomic mapping
from the metagenomic data to providing meaningful results.
Nevertheless the microbial community at the dumpsite and 1 km
datasets were more closely related to each other than 1 km-5 km
or dumpsite-5 km datasets (Fig. 1A, S1 and S2), validating the
HCH contamination and salinity hypothesis. Further increase in
sequencing depth and replicates could help to improve the
resolution of these findings.
Metagenome Functional OverviewProtein functions generated from evidence-based annotation
(Pfam, COGs, SWISS PROT/TREMBLE and KEGG databases)
were classified at various hierarchies [31] (individual genes, protein
families and cellular processes). Observed increase in HCH
contamination resulted in an increase in the relative abundance
of cellular processes such as membrane transport (P,0.001 for all
pair wise comparison), motility and chemotaxis (P,0.001 for 5 km
versus 1 km and ,0.01 for dumpsite versus 1 km dataset
comparison), transposases and plasmid maintenance (P,0.001
for all pair wise comparisons) (Fig. 2A). Additionally, phage and
prophage elements were also heightened in the HCH dumpsite,
suggesting an increase in genetic mobility due to pollution or
salinity stress. Enriched subsystems and protein families involved
in each of the above-mentioned processes were identified and
characterized (Fig. 2B and Table S6). Categories involved in
aromatic compound metabolism include chlorobenzoate, benzo-
ate and toluene degradation (Table S6), which have been reported
as end products of anaerobic degradation of HCH [61], were
found to be positively correlated to the HCH contamination.
Rarefaction estimates (Fig. 2C), two sided Fisher’s Exact test and
Storey’s FDR method were performed on the Pfam [62] database
results (protein families) using STAMP [43]. Protein families that
were significantly higher in the dumpsite include transposons
(P,1e211 for each pair wise comparisons), phages (P,1e215 for
each pair wise comparisons), IS elements (P,1e210 for each pair
wise comparisons), alpha-beta hydrolase folds (P,1e215 for each
pair wise comparisons), major facilitator super family (P,1e215 for
each pair wise comparisons) and short chain dehydrogenases
(P,1e215 for each pair wise comparisons). It is not surprising that
an increase in salinity levels and HCH contamination resulted in
an increase in the enrichment of microbial genes coding for
enzymes and proteins involved in aromatic compound metabo-
lism, stress tolerance, multidrug resistance and motility/chemo-
taxis proteins. Similarly, the genes involved in motility, chemotaxis
and sensing, were required for sensing HCH isomers [63].
Based on SOM (Self Organization Mapping) analysis we
observed that genes coding for phage DNA synthesis, capsid
proteins, packaging and transposase families like Tn3, IS-6100,
and integrase core domain were predominantly present in the
dumpsite and the 1 km datasets (Table S6). At the dumpsite there
was also a notable enrichment of error prone DNA repair genes
and genes facilitating enhanced mutation rates. Finally, the
dumpsite and the 1 km datasets showed high relative abundance
and diversity of proteins involved in transposition and conjugation
mechanisms. The overall functional diversity based on KEGG
[34] enzyme profiling clearly revealed the impact of HCH and
salinity on microbial responses. For instance, the dumpsite and the
5 km datasets had the least correlation (R2:0.92), whereas the
dumpsite and 1 km datasets were more correlated (R2:0.943),
while 1 km and 5 km datasets were the most correlated (R2:0.98)
(Fig. 2D). When the metagenomic data was analyzed at a higher
functional category, the contributions of functional genes from
eukaryotes was significantly higher at the 5 km, while bacteria
contributed more significantly to the metabolic potential of the
dumpsite (data not shown).
Community Potential and Participation in HCHDegradation
To know the relative enrichment of genes already assigned to
HCH degradation pathway, functional binning was performed on
each of the datasets using BLASTN [19] and transpipe [33]
analysis. We were able to bin reads against 12 unique genes that
have already been reported to be involved in the HCH
degradation pathways. Notable among these are: linA, linB, linC,
dehydrochlorinase, chlorocatechol 1,2-dioxygenase, 2,4,6-trichlo-
rophenol monooxygenase, 2,6-dichloro-p-hydroquinone 1,2-diox-
ygenase, and 2,5-dichloro-2,5-cyclohexadiene-1,4-diol, (chloro)
muconate-cycloisomerase, LysR family transcriptional regulator
(LinR), TRAP-type mannitol/chloroaromatic compound trans-
port system and periplasmic component (ttg2 gene) (Fig. 3 and
Table S7). We compared the three datasets for the presence and
relative abundance of HCH degradation genes (lin genes). The
dumpsite and 1 km site had a higher metabolic potential to
degrade HCH isomers, compared to the 5 km site in which these
genes were nearly absent (Fig. 3). Additionally, ABC transporter
genes like ttg2 [64] and Ton-B receptors [65] were found in higher
relative abundance at the dumpsite in comparison to the other
datasets. These transporter genes have been reported from
Sphingomonads where they help in the transport of complex
hydrophobic compounds like HCH across the membrane thus
facilitating the degradation process [64].
Sequences (Table S8) related to the lin operon, gene clusters and
plasmids were downloaded from NCBI and each of the
metagenomes were reference assembled to existing linA,B,C,-
D,E,R,X genes and plasmids. We found 34,953 matches in the
dumpsite metagenomic data, 35,256 in the 1 km site, and only
24,442 sequences from the 5 km site. Results from DNA-Seq
based analysis (Fig. 4) were in agreement with those of functional
binning, HCH contamination levels and taxonomic enrichment
studied in each of the metagenomes. We observed a very high
relative abundance of genes encoding for Lin A and Lin B, as these
Metagenomic Analysis of HCH Contaminated Soils
PLOS ONE | www.plosone.org 6 September 2012 | Volume 7 | Issue 9 | e46219

two primary enzymes are responsible for the degradation of all
HCH isomers and also some of the intermediates (Fig. 3 and 4).
We observed that linA, linB, and linC genes were abundant at the
dumpsite and 1 km datasets (Fig. 3 and 4) indicating that either a
large majority of bacteria contain these genes or that these genes
were present in multiple copies as two copies of linA gene have
already been reported from Sphingomonads that harbor these
genes [13,64]. Our previous studies have revealed certain end
products of degradation of a, b and d HCH under aerobic
condition by using Sphingobium indicum B90A, and also under
anaerobic conditions [5]. However, the enrichment of benzoate,
toluene, naphthalene and aromatic ring opening genes at the
HCH dumpsite (Table S6) is an indicator that even the end
products are degraded further.
Recruiting Chromohalobacter Salexigens Pangenome andTracing Horizontal Gene Transfer Potential of lin Genes insitu
Metagenomic studies enable the recovery of partial genetic
information from a broad distribution of the community
membership. However, for the dominant organism (or pan
organism) in a given community it is often possible to reassemble
a complete genome, albeit a pan-genome comprised of sequences
from a number of closely related species or strains [65–66]. Based
on the phylogenetic profiles generated by TEFAP, metagenomic
SSUs and direct comparison of EGTs to reference genomes, we
generated metagenomic recruitment plots for various reference
genomes (Table S9) using MUMMER [35]. De-novo assembly (see
material and methods) of all three datasets resulted into 2,388,526
contigs (N50 = 745 bp, maximum contig size = 3458 bp, average
contig coverage = ,5X). Owing to the primary focus of our
further assembly efforts to reconstruct the enriched, salinity
tolerant and HCH degrading draft or complete pangenomes
(genomic fragments from similar species), de-novo assembled contigs
were clustered based upon their nucleotide compositional charac-
teristics (tetra nucleotide frequencies and %G+C) as explained
earlier [40,67].
Owing to the relatively high abundance of Chromohalobacter
salexigens DSM 3043 in our taxonomic analysis, a draft pan-
genome of Chromohalobacter sp. was constructed from the metagen-
ome data (Fig. 5A, S1, S4). The Chromohalobacter sp. assembly
Figure 2. Functional traits of the studied metagenomes. (A) Cellular processes enriched over increasing HCH contamination. Metagenomicreads were compared against the COG database and relative percentage (y-axis) for each category (x-axis) was calculated. (B) Heat map showing therelative abundance of top 50 subsystems enriched over increasing HCH concentrations (percentage cut-off = 0.8%, standard deviation cut-off = 0.4%).(C) Rarefaction analysis performed on unique protein families (Pfam) sampled across three HCH gradients. (D) Comparison of functional categoriessimilarity between metagenome gradient pairs. KEGG enzyme profile of each metagenome was compared. Asterisks indicate significant differences(Two sided Fishers exact test with Bonferroni multiple test correction, P,0.01). ABBREVATIONS: (1) DS = dumpsite gradient, 1 km = 1 km gradientand 5 km = 5 km gradient.doi:10.1371/journal.pone.0046219.g002
Metagenomic Analysis of HCH Contaminated Soils
PLOS ONE | www.plosone.org 7 September 2012 | Volume 7 | Issue 9 | e46219
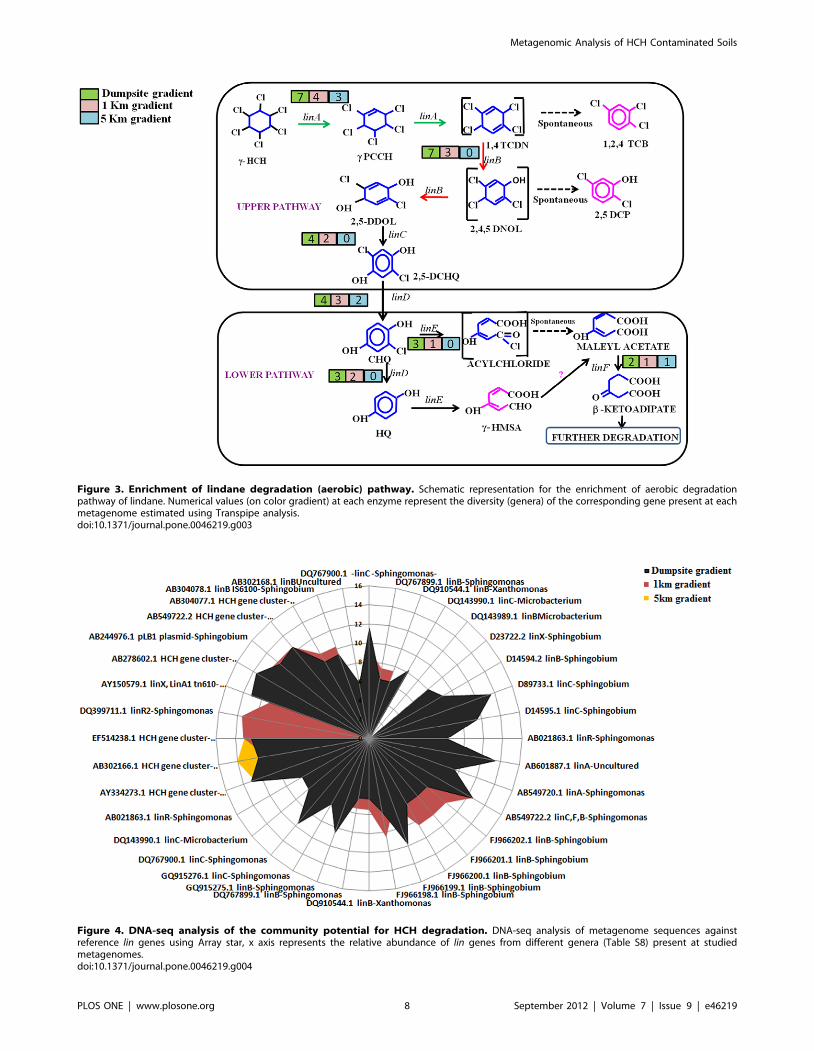
Figure 3. Enrichment of lindane degradation (aerobic) pathway. Schematic representation for the enrichment of aerobic degradationpathway of lindane. Numerical values (on color gradient) at each enzyme represent the diversity (genera) of the corresponding gene present at eachmetagenome estimated using Transpipe analysis.doi:10.1371/journal.pone.0046219.g003
Figure 4. DNA-seq analysis of the community potential for HCH degradation. DNA-seq analysis of metagenome sequences againstreference lin genes using Array star, x axis represents the relative abundance of lin genes from different genera (Table S8) present at studiedmetagenomes.doi:10.1371/journal.pone.0046219.g004
Metagenomic Analysis of HCH Contaminated Soils
PLOS ONE | www.plosone.org 8 September 2012 | Volume 7 | Issue 9 | e46219

consists of 5189 contigs (average contig size = 513 bp, average
coverage ,8X) totaling 1,580 kbp of total draft pan-genome
(Fig. 5A and S4). The RAST annotation server [42] was used to
annotate 778 protein coding sequences (CDS) and 189 hypothet-
ical proteins on the contigs that were confirmed with an average
BLASTp identity of 98.5% to the reference coding sequences.
These observations clearly indicate the enrichment of Chromo-
halobacter over an increasing HCH contamination level, as
observed by TEFAP analysis. We were able to assemble the
complete 16S rRNA gene sequence of Chromohalobacter sp. (99.9%
identical to 16S rRNA gene sequence of Chromohalobacter salexigens
DSM 3043; (Contig no = 646 size = 1652 bp, coverage = .35).
Since there was no other 16S rRNA gene sequence (phylogenetic
marker) of Chromohalobacter salexigens in our assembly it certainly
indicates low interstrain microdiversity of Chromohalobacter salexigens
(average BLASTp identity to the reference coding sequenc-
es = 98.5%). It is essential to note that potassium cations released
by the pesticide in contaminated soils can lead to an increase in the
total salinity of the soil matrix [46]. Chromohalobacter salexigens DSM
3043 is a halophilic gamma-proteobacterium with a versatile
metabolism allowing fast growth on a large variety of simple
carbon compounds as its sole carbon and energy source. This
bacterium is also resistant to saturated aromatic hydrocarbons and
heavy metals and is a host to several versatile plasmids [68–69]. As
with other studies that highlight the in-silico potential for re-
assembled genomes to support specific phenotypes, the role of
Figure 5. Quantifying the enrichment of environmental genomes/plasmids. Metagenomic recruitment plots of genomes/plasmidsconstructed using all three studied metagenome sequences. Reads were mapped with coverage parameter. (A) Assembled contigs ofChromohalobacter salexigens (5189 contigs) from mtegenomic reads, shaded region represents the location of 16SrRNA gene sequence. (B) pISP4, (C)Sphingobium japonicum UT26 chromosome 1, (D) pISP3 and (E) pLB1. Localization of lin genes on respective genomes is marked along withrepresentation symbols for IS-elements.doi:10.1371/journal.pone.0046219.g005
Metagenomic Analysis of HCH Contaminated Soils
PLOS ONE | www.plosone.org 9 September 2012 | Volume 7 | Issue 9 | e46219

these organisms in HCH degradation needs to be confirmed
through biochemical tests. However, this information could help
to refine the culture conditions necessary for axenic isolation in
this organism(s), for example by generating a flux balance
metabolic model of the organism (e.g. ModelSEED) [70].
The lin genes are already known for their mobile nature and
association with IS-elements [64] however, there is no evidence of
their relative mobility or evolution. Previous reports on the
localization of lin genes especially linA, linB, linC, linDER across
different species indicate that many of these genes are present
across genomes as well as plasmids [12,71–73]. Recently the
presence of lin genes has been reported on the genome (3.51 Mbp)
of Sphingobium japonicum UT26 [12] and plasmids; pISP3 (43k bp)
and pISP4 (21k bp) in Sphingomonas sp. MM1 [74]. An exogenous
plasmid pLB1 (21k bp) that carried IS-6100 composite transposon
containing two copies of linB [75] was isolated directly from HCH
contaminated soil. Thus we targeted our assembly efforts
(clustering using tetra-ESOM and %GC character) to understand
the microdiversity and organization of lin genes as metagenomic
islands using reference sequences of the genome of Sphingobium
japonicum UT26 (the solitary representative sequenced genome of
HCH degrading bacterium available so far) and three plasmids
pISP3, pISP4 and pLB1. For this purpose, we generated
metagenomic recruitment plots and binned the contigs for the
first chromosome of UT26 and three plasmids. Metagenomic
recruitment plots of genome and plasmids (Fig. 5. A, B, C, D and
E) clearly showed an abundance of metagenomic reads against
reference sequences in the range of 97% to 100%. When
metagenomic islands were identified over the recruitment plots it
became evident that except for the IS-element of the linB gene
there were hardly any reads mapped over the IS-elements related
to the other lin genes (Fig. 5. B, C, D and E). This suggested a
relative genomic plasticity and faster rate of evolution for various
linA, linC, linDER and linF over linB genes. The studies also reflect
that the bacterial community at the dumpsite is enriched for HCH
degradation potential (lin genes), insertion elements, integrases,
prophages and/or plasmids, which are contributing in the
continuous genetic adaptation of these bacteria.
ConclusionsThis is the first metagenomic analysis of samples collected from
soils with differential concentration of HCH contamination.
Though the presence of halophilic bacteria can be attributed to
strong salinity differences between the dumpsite and the other two
sites, the enrichment and diversity of lin genes suggests that HCH
contamination did play a significant role in structuring the
functional potential of the community. This study has shown the
enrichment of ubiquitous but yet unknown archaeal, bacterial and
fungal taxa under HCH contamination (and highly saline
conditions). A higher diversity and abundance of lin genes,
transposons, plamids, prophages, ABC transporters and genes
associated with chemotaxis/motility and membrane transport
were observed at the HCH dumpsite dataset. The data thus
provided strong evidence not only for the enrichment of a specific
microbial population and genes but a massive lateral transfer of
catabolic genes (lin) through conjugation and transposition among
the members of the established microbial community. We
recovered one partial enriched microbial genome and three
nearly-complete plasmids containing lin genes, indicating that
these bacteria harbor catabolic plasmids, and dominate this HCH
stressed environment. While the results presented here can prove
to be an invaluable supplement for the on-going efforts in the
development of in-situ bioremediation technologies for HCH, this
study also suggests good prospects for developing economically
viable HCH bioremediation technology. The latter may involve
the use of specific tailor- made nutrients(s) and chemicals like taxa
specific minimal salt medium [10], and various electron donors
[11]. In addition, this study also points out that bioaugmentation
by using a consortium (cultivable representatives of the enriched
genera) of both HCH degraders and non-degraders could improve
the efficiency of remediation efforts that focus on the use of a single
taxon.
Supporting Information
Figure S1 Two way clustering of bacterial genus(predicted by EGT mapping to NCBI genomes, SSUrRNA analysis against GreenGenes database and by taxaspecific 16S rRNA pyrotagging) versus sample matrix.Genera and sample categories were clustered using Manhattan
distance metric, top 50 genera with standard deviation .0.4 and
having at least 0.8% of the total abundance were selected. Colour
scale is representing the relative abundance of sequence reads after
normalising the data from the respective means of individual
column (one sample).
(TIF)
Figure S2 PCA (principle component analysis) per-formed on the total diversity patterns (phylum) obtainedafter EGT mapping, metagenomic SSU rRNA analysisand taxa specific pyro-tagging. Correlation matrix was
selected for the co-ordination with 1000 bootstrap values.
(TIF)
Figure S3 Phylogentic analysis of fungal 18S rRNA genesequences. Phylogenetic analysis was performed on the partial
(300 bp) 18S rRNA gene sequences obtained from bTEFAP
analysis of dumpsite metagenome (n = 42) and reference sequences
(n = 49) using the neighbour joining method with Kimura two-
parameter model. The bootstrapped consensus tree, inferred from
1,000 replicates is presented as a radial tree. Bootstrap values
(percentages of replicate trees in which the associated taxa
clustered together) are shown for selected nodes in the tree. The
tree is drawn to scale, with branch lengths corresponding to the
evolutionary distances used to infer the phylogenetic tree.
(TIF)
Figure S4 Schematic representation of graft pangenome(contigs) of Chromohalobacter salexgens sp. assembledusing tetraESOM and %GC based clustering on de-novoassembled metagenome contigs. (A) Circular representation
of the draft genome (contigs bin). From outside towards the centre:
outermost circle, metagenomic contigs arranged using reference
sequence, circle 2, metagenomic reads coverage (coordinates with
,8X coverage are not represented); circle 3; innermost circle, GC
content of the contigs. (B) Contigs are ordered using reference
genome sequence (representing by black base ring). Red colored
positions represent the non coding tRNA and rRNA genes.
(TIF)
Table S1 List of specific primers used in the presentstudy for TEFAP (Tag- Encoded FLX Amplicon Pyrose-quencing) analysis: First four primer sets in the firstcolumn were used for bacterial selective assay.
(DOCX)
Table S2 Relative abundance (percentage) of anaerobicbacteria (HCH degradation related) at all three meta-genomes obtained after bTEFAP analysis using fourbacterial assays.
(DOCX)
Metagenomic Analysis of HCH Contaminated Soils
PLOS ONE | www.plosone.org 10 September 2012 | Volume 7 | Issue 9 | e46219

Table S3 The bacterial genera which were unique to thedumpsite dataset. The average relative percentage across each
of the 4 bacterial diversity assays is presented. For the dumpsite the
standard deviation is also provided. For both the one km and 5 km
sites each of the assays was negative for these genera.
(DOCX)
Table S4 Genera enriched in the pristine 5 km com-pared to the one km dumpsite soil sample. Those which
were significantly higher based upon ANOVA and Tukey-Kramer
among the diversity assays are in bold.
(DOCX)
Table S5 Phylum distributions defined by SSUrRNAtyping against Ribosomal Database Project (RDP). The
relative percentage of each bacterial phylum from each site is
provided.
(DOCX)
Table S6 Metagenome annotations at various ranks.Percentage of total reads mapped to each category is given in
respective columns.
(DOCX)
Table S7 Sequence recruitment for various lin genes(reference sequences).
(DOCX)
Table S8 The relative expression based upon an RNA-seq based analysis. The NCBI sequences for the noted
accessions were utilized as the reference transcriptome and the raw
reads from each of the 3 metagenomic sites were compared. The
genera of the NCBI genes and the gene designations are also
indicated.
(DOCX)
Table S9 List of reference genotypes used in this studyto construct metagenomic recruitment plots.(DOCX)
Acknowledgments
We gratefully acknowledge detailed discussions and suggestions of Sunit
Jain of University of Michigan. We also thank Dr. Faizan Haider from
University of Lucknow for helping in sample collection and Dr. Rakesh
Sharma and Dr. V. C Kalia of Institute of Genomics and Integrative
Biology, Delhi for critically reviewing the manuscript.
Author Contributions
Conceived and designed the experiments: RL JPK PK. Performed the
experiments: RL NS PL VD RR. Analyzed the data: RL NS SED
Jasvinder Kaur Jaspreet Kaur SA NN JM SJ AN DL AD A. Saxena NG
MV UM. Contributed reagents/materials/analysis tools: RL NS SED.
Wrote the paper: RL NS JPK SED JAG. Sample Collection: RL NS PL
VD A. Singh.
References
1. Vijgen J (2006) The legacy of lindane HCH isomer production–main report. A
global overview of residue management, formulation and disposal. International
HCH and Pesticides Association, Holte, Denmark; http://www.cluin.org/
download/misc/Lindane_Main_Report_DEF20JAN06.pdf.
2. Vega FA, Covelo EF, Andrade ML (2007) Accidental organochlorine pesticide
contamination of soil in Porrino, Spain. J Environ Qual 36: 272–279.
3. Willett KL, Ulrich EM, Hites RA (1998) Differential Toxicity and Environ-
mental Fates of Hexachlorocyclohexane Isomers. Environ Sci Technol 32:
2197–2207.
4. Vijgen J, Abhilash PC, Li YF, Lal R, Forter M, et al. (2011) Hexachlorocy-
clohexane (HCH) as new Stockholm Convention POPs – a global perspective on
the management of Lindane and its waste isomers. Environ Sci Pollut Res Int
18: 152–162.
5. Lal R, Pandey G, Sharma P, Kumari K, Malhotra S, et al. (2010) Biochemistry
of microbial degradation of hexachlorocyclohexane and prospects for bioreme-
diation. Microbiol Mol Biol Rev 74: 58–80.
6. Kalantzi OI, Hewitt R, Ford KJ, Cooper L, Alcock RE, et al. (2004) Low dose
induction of micronuclei by lindane. Carcinogenesis 25: 613–622.
7. Jit S, Dadhwal M, Kumari H, Jindal S, Kaur J, et al. (2011) Evaluation of
hexachlorocyclohexane contamination from the last lindane production plant
operating in India. Environ Sci Pollut Res Int 18: 586–597.
8. Phillips TM, Seech AG, Lee H, Trevors JT (2005) Biodegradation of
hexachlorocyclohexane (HCH) by microorganisms. Biodegradation 16: 363–
392.
9. Raina V, Suar M, Singh A, Prakash O, Dadhwal M, et al. (2008) Enhanced
biodegradation of hexachlorocyclohexane (HCH) in contaminated soils via
inoculation with Sphingobium indicum B90A. Biodegradation 19: 27–40.
10. Dadhwal M, Singh A, Prakash O, Gupta SK, Kumari K, et al. (2009) Proposal
of biostimulation for hexachlorocyclohexane (HCH)-decontamination and
characterization of culturable bacterial community from high-dose point
HCH-contaminated soils. J Appl Microbiol 106: 381–392.
11. Cui Z, Meng F, Hong J, Li X, Ren X (2012) Effects of electron donors on the
microbial reductive dechlorination of hexachlorocyclohexane and on the
environment. J Biosci Bioeng 113: 765–770.
12. Nagata Y, Natsui S, Endo R, Ohtsubo Y, Ichikawa N, et al. (2011) Genomic
organization and genomic structural rearrangements of Sphingobium japonicum
UT26, an archetypal c-hexachlorohexane-degrading bacterium. Enzyme
Microb Technol 49: 499–508.
13. Kumari R, Subudhi S, Suar M, Dhingra G, Raina V, et al. (2002) Cloning and
Characterization of lin Genes Responsible for the Degradation of Hexachloro-
cyclohexane Isomers by Sphingomonas paucimobilis Strain B90. Appl Environ
Microbiol 68: 6021–6028.
14. Suar M, Hauser A, Poiger T, Buser HR, Muller MD, et al. (2005)
Enantioselective transformation of alpha-hexachlorocyclohexane by the dehy-
drochlorinases LinA1 and LinA2 from the soil bacterium Sphingomonas
paucimobilis B90A. Appl Environ Microbiol 71: 8514–8518.
15. Miyauchi K, Lee HS, Fukuda M, Takagi M, Nagata Y (2002) Cloning and
characterization of linR, involved in regulation of the downstream pathway for
gamma-hexachlorocyclohexane degradation in Sphingomonas paucimobilis UT26.
Appl Environ Microbiol 68: 1803–1807.
16. Dowd SE, Callaway TR, Wolcott RD, Sun Y, McKeehan T, et al. (2008)
Evaluation of the bacterial diversity in the feces of cattle using 16S rDNA
bacterial tag-encoded FLX amplicon pyrosequencing (bTEFAP). BMC Micro-
biol 8: 125.
17. Falgueras J, Lara AJ, Fernandez-Pozo N, Canton FR, Perez-Trabado G, et al.
(2010) SeqTrim: a high-throughput pipeline for pre-processing any type of
sequence read. BMC Bioinformatics 11: 38.
18. Gontcharova V, Youn E, Wolcott RD, Hollister EB, Gentry TJ, et al. (2010)
Black Box Chimera Check (B2C2): a Windows-Based Software for Batch
Depletion of Chimeras from Bacterial 16S rRNA Gene Datasets. Open
Microbiol J 4: 47–52.
19. Altschul SF, Gish W, Miller W, Myers EW, Lipman DJ (1990) Basic local
alignment search tool. J Mol Bio 215: 403–410.
20. DeSantis TZ, Hugenholtz P, Larsen N, Rojas M, Brodie EL, et al. (2006)
Greengenes, a chimera-checked 16S rRNA gene database and workbench
compatible with ARB. Appl Environ Microbiol 72: 5069–5072.
21. Pruesse E, Quast C, Knittel K, Fuchs BM, Ludwig W, et al. (2007) SILVA: a
comprehensive online resource for quality checked and aligned ribosomal RNA
sequence data compatible with ARB. Nucleic Acids Res 35: 7188–7196.
22. Callaway TR, Dowd SE, Wolcott RD, Sun Y, McReynolds JL, et al. (2009)
Evaluation of the bacterial diversity in cecal contents of laying hens fed various
molting diets by using bacterial tag-encoded FLX amplicon pyrosequencing.
Poult Sci 88: 298–302.
23. Edgar RC (2010) Search and clustering orders of magnitude faster than BLAST.
Bioinformatics 26: 2460–2461.
24. Cole JR, Wang Q, Cardenas E, Fish J, Chai B, et al. (2009) The Ribosomal
Database Project: improved alignments and new tools for rRNA analysis.
Nucleic Acids Res 37: 141–145.
25. Krober M, Bekel T, Diaz NN, Goesmann A, Jaenicke S, et al (2009)
Phylogenetic characterization of a biogas plant microbial community integrating
clone library 16S-rDNA sequences and metagenome sequence data obtained by
454-pyrosequencing. J Biotechnol 142: 38–49.
26. Rosen GL, Reichenberger ER, Rosenfeld AM (2011) NBC: the Naıve Bayes
Classification tool webserver for taxonomic classification of metagenomic reads.
Bioinformatics 27: 127–129.
27. Sheneman L, Evans J, Foster JA (2006) Clearcut: a fast implementation of
relaxed neighbor-joining. Bioinformatics 22: 2823–2824.
28. Rosenberg MS, Anderson CD (2011) PASSaGE: Pattern Analysis, Spatial
Statistics and Geographic Exegesis. Version 2. Methods Ecol Evol 2: 229–232.
29. Lozupone C, Hamdy M, Knight R (2006) UniFrac - An online tool for
comparing microbial community diversity in a phylogenetic context. BMC
Bioinformatics 7: 371.
Metagenomic Analysis of HCH Contaminated Soils
PLOS ONE | www.plosone.org 11 September 2012 | Volume 7 | Issue 9 | e46219

30. Colwell RK, Chao A, Gotelli NJ, Lin SY, Mao CX, et al. (2012) Models and
estimators linking individual-based and sample-based rarefaction, extrapolationand comparison of assemblages. J Plant Ecol 5: 3–21.
31. Tringe SG, Mering CV, Kobayashi A, Salamov AA, Chen K, et al (2005)
Comparative metagenomics of microbial communities. Science 308: 554–557.32. Zhang Z, Schwartz S, Wagner L, Miller W (2000) A greedy algorithm for
aligning DNA sequences. J Comput Biol 7: 203–214.33. Barker MS, Dlugosch KM, Dinh L, Challa RS, Kane NC, et al. (2010)
EvoPipes.net: Bioinformatic Tools for Ecological and Evolutionary Genomics.
Evol Bioinform online 6: 143–149.34. Kanehisa M, Goto S, Kawashima S, Okuno Y, Hattori M (2004) The KEGG
resource for deciphering the genome. Nucleic Acids Res 32: 277–280.35. Kurtz S, Phillippy A, Delcher AL, Smoot M, Shumway M, et al. (2004) Versatile
and open software for comparing large genomes. Genome Biol 5: 12.36. Pasic L, Mueller BR, Cuadrado ABM, Mira A, Rohwer F, et al. (2009)
Metagenomic islands of hyperhalophiles: the case of Salinibacter ruber. BMC
Genomics 10: 570.37. Zerbino DR, Birney E (2008) Velvet: algorithms for de novo short read assembly
using de Bruijn graphs. Genome Res 18: 821–829.38. Huson DH, Auch AF, Qi J, Schuster SC (2007) MEGAN analysis of
metagenomic data. Genome Res 17: 377–386.
39. Barker MS, Dlugosch KM, Reddy ACC, Amyotte SN, Rieseberg LH (2009)SCARF: maximizing next-generation EST assemblies for evolutionary and
population genomic analyses. Bioinformatics 25: 535–536.40. Dick GJ, Anderson AF, Baker BJ, Simmons SL, Thomas BC, et al. (2009)
Community-wide analysis of microbial genome sequence signatures. GenomeBiol 10: 85.
41. Bentley SD, Parkhill J (2004) Comparative genomic structure of prokaryotes.
Annu Rev Genet 38: 771–792.42. Aziz RK, Bartels D, Best AA, DeJongh M, Disz T, et al. (2008) The RAST
Server: rapid annotations using subsystems technology. BMC Genomics 9: 75.43. Parks DH, Beiko RG (2010) Identifying biologically relevant differences between
metagenomic communities. Bioinformatics 26: 715–721.
44. DeLong EF, Preston CM, Mincer T, Rich V, Hallam SJ, et al. (2006)Community genomics among stratified microbial assemblages in the ocean’s
interior. Science 311: 496–503.45. Meyer F, Paarmann D, D’Souza M, Olson R, Glass EM, et al. (2008) The
metagenomics RAST server – a public resource for the automatic phylogeneticand functional analysis of metagenomes. BMC Bioinformatics 9: 386.
46. Mwangi K, Boga HI, Muigai AW, Kiiyuikia C, Tsanuo MK (2010) Degradation
of dichlorodiphenyltrichloroethane (DDT) by bacterial isolates from cultivatedand uncultivated soil. Afr J Microbiol Res 4: 185–196.
47. Walker A, Jurado-Exposito M, Bending GD, Smith VJR (2001) Spatialvariability in the degradation rate of isoproturon in soil. Environ Pollut 111:
407–415.
48. Boltner D, Moreno-Morillas S, Ramos JL (2005) 16S rDNA phylogeny anddistribution of lin genes in novel hexachlorocyclohexane degrading Sphingomonas
strains. Environ Microbiol 7: 1329–1338.49. Mohn WW, Mertens B, Neufeld JD, Verstraete W, de Lorenzo V (2006)
Distribution and phylogeny of hexachlorocyclohexane- degrading bacteria insoils from Spain. Environ Microbiol 8: 60–68.
50. MacRae IC, Raghu K, Bautista EM (1969) Anaerobic degradation of the
insecticide lindane by Clostridium sp. Nature 221: 859–860.51. van Doesburg W, van Eckert MHA, Middeldrop PJM, Balk M, Schraa G, et al.
(2005) Reductive dechlorination of beta hexachlorocyclohexane (beta-HCH) bya Dehalobacter species in co-culture with a Sedimenibacter sp. FEMS Microbiol
Ecol 54: 87–95.
52. Borgne SL, Paniagua D, Duhalt RV (2008) Biodegradation of organic pollutantsby halophilic bacteria and archaea. J Mol Microbiol Biotechnol 15: 74–92.
53. KOberl M, MUller H, Ramadan EM, Berg G (2011) Desert farming benefitsfrom microbial potential in arid soils and promotes diversity and plant health.
PLoS One 6: e24452.
54. Pruitt KD, Tatusova T, Magcott DR (2007) NCBI reference sequences (RefSeq):a curated non-redundant sequence database of genomes, transcripts and
proteins. Nucleic Acid Res 35: 61–65.
55. Hugenholtz P, Tyson GW, Webb RI, Wagner AM, Blackall LL (2001)Investigation of candidate division TM7, a recently recognized major lineage of
the domain Bacteria with no known pure-culture representatives. Appl EnvironMicrobiol 67: 411–419.
56. Brulc JM, Antonopoulos DA, Miller ME, Wilson MK, Yannarell AC, et al.(2009) Gene-centric metagenomics of the fiber-adherent bovine rumen
microbiome reveals forage specific glycoside hydrolases. Proc Natl Acad
Sci U S A 106: 1948–1953.
57. Waino M, Tindall BJ, Ingvorsen K (2000) Halorhabdus utahensis gen. nov., sp.
nov., an aerobic, extremely halophilic member of the Archaea from Great SaltLake, Utah. Int J Syst Evol Microbiol 50: 183–190.
58. Yeo A (1998) Molecular biology of salt tolerance in the context of whole-plantphysiology. J Exp Bot 49: 915–929.
59. Siddique T, Okeke BC, Arshad M, Frankenberger WT (2003) Enrichment andisolation of endosulfan-degrading microorganisms. J Environ Qual 32: 47–54.
60. Sagar V, Singh DP (2011) Biodegradation of lindane pesticide by non white- rotssoil fungus Fusarium sp. World J Microbiol Biotechnol 27: 1747–1754.
61. Middeldorp PJ, van Doesburg W, Schraa G, Stams AJ (2005) Reductivedechlorination of hexachlorocyclohexane (HCH) isomers in soil under anaerobic
conditions. Biodegradation 16: 283–290.
62. Bateman A, Coin L, Durbin R, Finn RD, Hollich V, et al. (2004) The Pfam
protein families database. Nucleic Acids Res 32: 138–141.
63. Endo R, Ohtsubo Y, Tsuda M, Nagata Y (2007) Identification and
characterization of genes encoding a putative ABC-type transporter essential
for utilization of gamma- hexachlorocyclohexane in Sphingobium japonicum UT26.J Bacteriol 189: 3712–3720.
64. Dogra C, Raina V, Pal R, Suar M, Lal S, et al. (2004) Organization of lin Genesand IS-6100 among Different Strains of Hexachlorocyclohexane-Degrading
Sphingomonas paucimobilis: Evidence for Horizontal Gene Transfer. J Bacteriol 186:2225–2235.
65. Caro-Quintero A, Konstantinidis KT (2012) Bacterial species may exist,metagenomics reveal. Environ Microbiol 14: 347–355.
66. Desai N, Gilbert JA, Glass E, Meyer F (2012) Current state and future trends inmetagenomic sequence analysis. Current Opinions in Bioinformatics 23: 72–76.
67. Tyson GW, Chapman J, Hugenholtz P, Allen EE, Ram RJ, et al. (2004)Community structure and metabolism through reconstruction of microbial
genomes from the environment. Nature 428: 37–43.
68. Canovas D, Vargas C, Csonka LN, Ventosa A, Nieto JJ (1996) Osmoprotectants
in Halomonas elongata: high-affinity betaine transport system and choline betaine
pathway. J Bacteriol 178: 7221–7226.
69. Arahal DR, Garcıa MT, Vargas C, Canovas D, Nieto JJ, et al. (2001)
Chromohalobacter salexigens sp. nov., a moderately halophilic species that includesHalomonas elongata DSM 3043 and ATCC 33174. Int J Syst Evol Microbiol 51:
1457–1462.
70. Henry CS, DeJongh M, Best AA, Frybarger PM, Linsay B, et al. (2010) High-
throughput generation, optimization and analysis of genome-scale metabolicmodels. Nat Biotechnol 28: 977–982.
71. Nagata Y, Kamakura M, Endo R, Miyazaki R, Ohtsubo Y, et al. (2006)Distribution of gamma- hexachlorocyclohexane- degrading genes on three
replicons in Sphingobium japonicum UT26. FEMS Microbiol Lett 256: 112–118.
72. Ceremonie H, Boubakri H, Mavingui P, Simonet P, Vogel TM (2006) Plasmid
encoded gamma-hexachlorocyclohexane degradation genes and insertion
sequences in Sphingobium francese (ex-Sphingomonas paucimobilis Sp+). FEMSMicrobiol Lett 257: 243–252.
73. Malhotra S, Sharma P, Kumari H, Singh A, Lal R (2007) Localization of HCHcataboilic genes (lin) genes in Sphingobium indicum B90A. Indian J Microbiol 47:
271–275.
74. Tabata M, Endo R, Ito M, Ohtsubo Y, Kumar A, et al. (2011) The lin genes for
c-hexachlorocyclohexane degradation in Sphingomonas sp. MM-1 proved to bedispersed across multiple plasmids. Biosci Biotechnol Biochem 75: 466–472.
75. Miyazaki R, Sato Y, Ito M, Ohtsubo Y, Nagata Y, et al. (2006) Completenucleotide sequence of an Exogenously isolated plasmid, pLB1, involved in
gamma-hexachlorocyclohexane degradation. Appl Environ Microbiol 72: 6923–
6933.
Metagenomic Analysis of HCH Contaminated Soils
PLOS ONE | www.plosone.org 12 September 2012 | Volume 7 | Issue 9 | e46219