comparative evaluation of peer-to-peer systems using
TRANSCRIPT
Comparative Evaluation of Peer-to-Peer Systems
Using PeerfactSim.KOM
Matthias Feldotto∗, Kalman Graffi†
∗University of Paderborn, Germany, †Technology of Social Networks Group, University of Dusseldorf, Germany
Email: ∗[email protected], †[email protected]
Abstract—Comparative evaluations of peer-to-peer protocolsthrough simulations are a viable approach to judge the per-formance and costs of the individual protocols in large-scalenetworks. In order to support this work, we enhanced the peer-to-peer systems simulator PeerfactSim.KOM with a fine-grainedanalyzer concept, with exhaustive automated measurements andgnuplot generators as well as a coordination control to evaluatea set of experiment setups in parallel. Thus, by configuring allexperiments and protocols only once and starting the simulator,all desired measurements are performed, analyzed, evaluated andcombined, resulting in a holistic environment for the comparativeevaluation of peer-to-peer systems.
I. INTRODUCTION
Peer-to-peer (p2p) networks emerged in the early 2000s
and shaped the view on large-scale overlay networks. Besides
the popular file sharing applications, further use cases also
emerged, such as real-time communication [1] or online social
networks [2]-[6]. The general strength of p2p overlays is the
harness of the overlay network members to create an efficient,
cost-free infrastructure to host distributed applications. Also in
future, the trend towards decentralized overlays will continue.
However, several challenges arise like reliability, availability,
robustness and security, among others. In order to address
these challenges, several p2p protocols have been proposed.
In order to evaluate p2p protocols in large-scale networks
(1,000+), simulators offer a reasonable trade-off between
testbed-based evaluation and analysis. Using simulators like
PeerfactSim.KOM [7], PeerSim [8] or OverSim [9], re-
searchers can investigate the behavior of p2p protocols under a
wide range of parameter configurations, user behavior models
and churn models. For a p2p simulator it is essential to
support besides main p2p overlays also several layers above
and below. Minimal requirements are an application layer gen-
erating proper workload as well as a network layer resembling
validated network properties as delay, loss and bandwidth.
Further layers for services such as monitoring, replication or
distributed data structures, or transport layer functions such as
UDP or TCP characteristics are also favorable.
Besides the functional requirements on a p2p simulator,
also its usage in context of detailed evaluation defines notable
challenges. The extensive evaluation of new p2p protocols
requires parameter studies to be performed with several seeds.
This gives insights in the behavior of the protocol and shows
This work was partially supported by the German Research Foundation (DFG)within the Collaborative Research Centre “On-The-Fly Computing” (SFB 901)
interdependencies of the chosen parameters. Thus, optimal
settings for given expected scenarios can be derived. Choosing
a large number of seeds (10+) per parameter configuration
allows to identify the common behavior of the protocol and
to reduce the impact of individual outliers. Additionally, the
results for a single protocol has to be compared to the results
of previously existing protocols, in order to estimate quality
improvements. This comparison should be ideally performed
for all monitored metrics, over all seeds and for all considered
protocols.
In this paper we present our extensions for the discrete
and event-based p2p simulator PeerfactSim.KOM1 [10], [11],
which comprise following features:
• Seed count: Now the number of experiments per setup
can be defined initially. The corresponding simulations
are carried out in parallel, the results of the individual
runs are aggregated and overall statistical results for the
experiment setup are calculated.
• Setup of experiments: Our extension allows to define
all experiment configurations and all parameter varia-
tions in addition to the number of seeds initially. Per
setup/configuration and seed, results are created and all
configuration results are combined and plotted in com-
parative plots.
• Analyzers: We integrated a general set of analyzers at
all layers, especially at the overlay layer, which grasps
during the simulation all actions and creates statistics on
the performance and costs of the overlay. For each metric
an exhaustive statistical analysis is created consisting
of average, median, standard deviations, minimum and
maximum values.
• Automated output: Besides the generation of result files,
corresponding gnuplot [12] files are also created and
executed, thus printing all results at the end of the
simulations.
The discrete and event-based p2p simulator Peerfact-
Sim.KOM [10], [11] now comes with our extensions. It allows
to define all protocols to evaluate, the range of their parameter
settings as well as the number of seeds per setup initially.
All simulations are started in one point and parallelly run
and calculated afterward. The simulator merges all results
in the end and generates suitable gnuplot scripts and graphs
to all result combinations. Thus, the simulator is very user-
1www.peerfact.org

or receiving of a message or the initiation of a lookup. These
events are interpreted and analyzed in dedicated monitor-
ing packages, which exist for every protocol category (see
Sec. IV-B). As for structured overlays, for example, the set of
interesting metrics is the same, their relevant information is an-
alyzed in common classes that the individual protocols inherit
from. Thus, for all protocols of the same category, objective
and comparative evaluations are performed. The analysis of
the protocol behavior is printed in comma-separated value
files and corresponding gnuplot files are generated with every
simulation. Thus, the results of the simulation are directly
presentable after the simulation ends.
IV. EVALUATION PROCESS
PeerfactSim.KOM is due to the event-based simulation
engine itself and its various implementations on the different
layers (cf. Sec. III) are very suitable for evaluating p2p
networks in a realistic scenario. For a comparative evaluation
of different p2p systems, a simulator needs to have two
properties, among others: On the one hand the different layers
have to own a well-specified API to enable the exchange
of components in one layer without modifications on others.
Here we look in detail at different overlays, so we need an
API which provides the common functions for the application
layer. This API is presented in Sec. IV-A. On the other hand
the simulator needs functionalities for configuring the different
scenarios and comparatively analyzing the simulation results.
In detail, we need configuration elements which produce the
same scenario several times and only change one single part
(in our case the overlay). At the end, we want to have an
output to do a comparative assessment for the modified parts.
The power here is the fact to provide these functions in a
user-friendly way and automatize as many steps as possible.
We cover this topic in Sec. IV-B.
A. API for Overlays and Applications
In this subsection, we focus on an API between the different
layers to enable an exchange of single components without
changing the other layers. Only if a simulator provides this
functionality it is possible to do real comparative evaluations of
single aspects. In the use case of this paper, we concentrate on
the replacement of overlays, therefore we present a common
API for them which is used by the different applications. Of
course, also all other layers have similar concepts to replace
single components there, for example the network layer.
In the overlay layer, we find different interfaces, arranged in
a hierarchy (cf. Fig. 2). On top, we find the OverlayNode,
which provides basic operations and properties like its unique
identifier. On the next level, we find on the one hand the
JoinLeaveOverlayNode which provides basic join and
leave operations for nodes in a p2p network, on the other
hand we have an IDONode which has more special operations
for information dissemination networks (IDO) and also more
special join/leave operations. For more details on IDOs, please
refer to [23]. Below the JoinLeaveOverlayNode, we find
basic interfaces for structured and unstructured overlay nodes.
OverlayNode
JoinLeaveOverlayNodeIDONode
KBRNode
DHTNode
UnstructuredOverlayNode
HeterogeneousNode HomogeneousNode
Fig. 2. Hierarchy of Overlay Interfaces
The UnstructuredOverlayNode is further divided into
an interface for a HeterogeneousOverlayNode and a
HomogeneousOverlayNode. They both define methods
for publishing data to and querying data from the network. On
the structured site we have an interface for a KBRNode, which
is based on the common API for structured p2p overlays [18].
It provides all methods which a structured overlay node should
offer, such as routing and lookups. As a last basic interface
we have the DHTNode, which extends the KBRNode and is
for distributed hash tables (DHTs), and therefore offers store
and lookup operations.
This hierarchy offers the possibility to use the API which is
needed by the application. If, for example, we only need the
join and leave of nodes, we can use an API on a higher level
than in a case where we need lookups. To see the use of these
APIs we look at two sample applications in more detail. First
of all there are different lookup generators: They are either
based on the DHT or on the KBR interface. Their main use is
to test and evaluate of different overlays and their properties
(for example, the hop count). They need the join, leave and
lookup operation and support further operations like periodic
lookups with different random distributions.
The more complex and realistic application is a file-sharing
application. It supports different APIs by using individual
overlay handlers: Next to the DHT and KBR interface it
also has support for unstructured overlays. This application
simulates a realistic file sharing behavior in a network. Files
are chosen from defined file sets, for example with a Zipf
distribution [24]. They can be published by all or only by a
subset of all nodes. The search for documents can also be man-
aged by the application. While the searching for the correct
locations of files (for publishing and downloading) is handled
by different overlays (through the described interfaces), the
up- and download itself is managed by an independent content
distribution where different implementations are also possible.
With this complex and modifiable combination of components
nearly each file sharing scenario can be simulated.
Both applications enable us to evaluate the properties of the
underlying overlay networks. It depends on the concrete goals
which application is the best in each case. Further applications
exist in the simulator and can also be added. For example
a complex index-based search for items is included in the
simulator or applications for special scenarios.
B. Configuration and Analysis
In this section, we describe the configuration and analysis of
comparative evaluations with PeerfactSim.KOM. First, we in-
troduce the user-side handling with configuring the evaluation
and getting the results. Then, we look in the internal behavior
of the monitoring, especially the work of the analyzers.
The simulator comes with different runners: There exist
different variants of a GUIRunner with visual output and a
SimulatorRunner for use in a console to start simulations.
A single simulation can be started with them by using a
configuration file and variable values as parameters; the use of
them is described in [7] and the current documentation on the
website. As a new runner, we introduce the BatchRunner.
It is set on top of the SimulatorRunner and reuses it for
the single simulations. In contrast, here we allow to give the
variables multiple values. Together with a configuration file
and a number of seeds, the runner creates the combination of
all variable combinations together with the number of seeds.
The BatchRunner allows two different modes: On the
one hand a script can be generated which includes commands
to start all needed simulations and also the merging process.
This script can be used on a cluster, on separate machines or
the single commands can be exported to different formats. So it
is very flexible, independent of the underlying system architec-
ture for big evaluations. On the other hand the BatchRunner
offers the possibility for the whole simulation in one call.
Instead of writing a script with commands, all simulations are
executed directly by the runner. Through a further parameter,
the number of parallel executions in independent processes
can be defined. If a simulation fails, the runner automatically
restarts this single failed simulation. In the end it automatically
calls the merging process.
The merging process completes the automatic evaluation.
After all simulations have finished, it merges the output data
and creates the single run, multiple-seed run and comparative
graphics. At the end, we have a hierarchy in the output folder
which contains all important files in three different layers:
1) Comparative evaluation: plot scripts and generated
graphics for comparison with all parameter combinations
2) Multiple-seed evaluation: data files, plot scripts and
generated graphics for one parameter combination with
all merged seeds
3) Single evaluation: data files, plot scripts and generated
graphics for one configuration with one seed
By having the data files, the gnuplot scripts and the graphics
in the folders, the user can modify them easily for different
purposes, for example for publishing in a paper. The resulting
data files and also the plots depend on the used analyzers.
To have an automatic process also in this part of the
evaluation, an intelligent monitoring process was developed.
During the simulation (cf. Fig. 3(a)), different events (for
example the sending of a message) are called in the monitor
of the simulation. This monitor forwards the event to all
registered analyzers of the event type. The analyzers evaluate
the event and save the needed information in different metrics.
The metrics store the overall values and additionally values
grouped by the peers. After the simulation or during output
steps (cf. Fig. 3(b)), the data of the metrics are passed to data
files through the analyzers. Furthermore, the analyzers produce
Event
Monitor
Analyzer
Metric
(a) During thesimulation
Plot
Script
Analyzer
Metric
Data
Analyzer
Metric
(b) During output steps andafter the simulation
Fig. 3. The monitoring process
gnuplot scripts fitting exactly to the metrics. In the end, the
plots are produced with an installed gnuplot binary from the
script and data files. As output we have three different types
(for the data files as well as for the scripts and graphics):
• output of all peers ordered by the time
• output grouped by the single peers
• output grouped by the single peers and sorted by their
values
Each analyzer produces these three types of data and
script files once, and depending on the included metrics,
different plot outputs. All plots are produced as PNG and as
monochrome PDF for the direct include in publications. These
outputs are found in each output layer of the comparative
evaluation.
We have implemented and included the following analyzers
which evaluate the most interesting aspects of p2p systems
in the simulator. Further, more specific analyzers can be
added (e.g. such as the file sharing analyzer for the presented
application):
• DefaultAggregationAnalyzer:
query events in aggregation nodes
• DefaultChurnAnalyzer:
session times and inter-session times
• DefaultConnectivityAnalyzer:
on- and offline events of nodes
• DefaultDHTOverlayAnalyzer:
lookup and store events in a DHT overlay
• DefaultKBROverlayAnalyzer:
query and routing events in a KBR overlay
• DefaultNetAnalyzer:
sent and received messages in the network layer
• DefaultOperationAnalyzer:
operations in the simulator
• DefaultTransAnalyzer:
sent and received messages in the transport layer
• DefaultUnstructuredAnalyzer:
connections and queries in an unstructured overlay
• DefaultMemoryUsageAnalyzer:
memory used by the simulator
• DefaultTimeUsageAnalyzer:
time used by the simulator
Because of the architecture of the monitoring component,
each analyzer can be easily extended by adding a further
metric to measure another interesting property. All outputs

0
5
10
15
20
25
30
0 100 200 300 400 500 600 700 800 900 1000
Fin
ish
ed
Do
wn
loa
ds [
nu
mb
er]
Peer
Sum of Finished Downloads
Gnutella06
Gia
Chord
EpiChord
ReChord
CaReChord
Pastry
Can
Fig. 4. Successful downloads of different overlays in a simplified modelwith the file sharing application
are also automatically extended. Next to the new values in
the data files we directly receive new generated plot scripts
and the created graphs.
To summarize, we defined and implemented a complete
automatic evaluation process. By only defining a configuration
file and the varying variables, the simulator produces a very
complex and exhaustive output with all interesting measure-
ments in the end which can be directly reused. An example
subset of this output is presented in the next section.
V. SAMPLE EVALUATIONS
In this section, we look at some sample evaluations and use
the output of the simulations to compare different overlays. We
start with the comparison of unstructured and structured over-
lays in a typical file sharing application in a simple scenario.
Then we go on with the simple network to compare different
properties of the structured overlays. In the next step we
investigate different Chord variants to compare them in a more
complex and realistic network model with integrated churn.
At the end we look at the used simulation time and memory
consumption for the simulations in PeerfactSim.KOM.
To compare the overlays we first use a very simple scenario.
The network layer is based on a simple network model
with static delay and no packet loss. The network consists
of 1000 nodes, as an application we use the presented file
sharing application (cf. Sec. IV). The overlays simulated are
Gnutella06 [25] and Gia [26] as unstructured variants and
Chord [27], EpiChord [28], ReChord [29], CaReChord [30],
Pastry [31] and CAN [32] as structured DHT-based overlays.
To have smooth representative values, all configurations are
run 20 times with different seeds and the results are merged.
Each simulation consists of three phases. First a joining phase
of 120 minutes, in this time all nodes try to join the network
uniformly distributed. It follows a publishing phase of 60
minutes and a lookup phase of 120 minutes. The nodes
publish and lookup files from a file set based on a Zipf
distribution [24].
After running the simulations we get different compara-
tive plots, also two plots we want to investigate now: The
successful downloads with the different overlays (cf. Fig. 4)
10
100
1000
10000
100000
1e+06
0 100 200 300 400 500 600 700 800 900 1000
Bandwidth in [Bytes/sec]
Peer
Throughput of Incoming Bandwidth
Gnutella06
Gia
Chord
EpiChord
ReChord
CaReChord
Pastry
Can
Fig. 5. Used bandwidth of different overlays in a simplified model
and the used bandwidths by the different overlays (cf. Fig. 5).
The successful downloads got by each used overlay are very
similar, which shows us that all overlays are working correctly
and can be used for a file sharing scenario. The unstructured
overlays find as many files as the structured variants. The
more interesting point is the used bandwidth. Here we have
big differences between the different overlays, which can be
seen very well in Fig. 5. We find much higher values in the
structured variants, especially in the Chord variants. This is
reasoned by the fact that these overlays investigate much more
work in holding the correct typology. It can be seen very well
in the case of ReChord and CaReChord that these two overlays
have also a self-stabilizing process which consumes further
bandwidth. By using 20 seeds and merging the results directly,
which is done by the simulator itself, we do not have to worry
about individual outliers. Instead we see directly the common
behavior of the simulated protocol and its properties and can
compare the tested configurations with each other.
In the next step we want to investigate the behavior of all
the DHT-based overlays in more detail. Therefore we use the
presented lookup generator which periodically starts random
lookups with the DHT interface (cf. Sec. IV-A). Thereby we
reach a stable simulation scenario. Each simulation consists
of two phases. First a joining phase of 120 minutes, in which
time all nodes try to join the network uniformly distributed.
After it follows a lookup phase of 180 minutes in which
each node looks up random values in uniform distributed
intervals between 30 and 120 seconds. The other properties
stay the same. By using the introduced configuration process,
only the altering variables have to be changed, the rest of
the configuration does not have o be modified or created
new. This enables us to run various evaluations in different
complex scenarios without spending much time in configuring
and preparing the simulations.
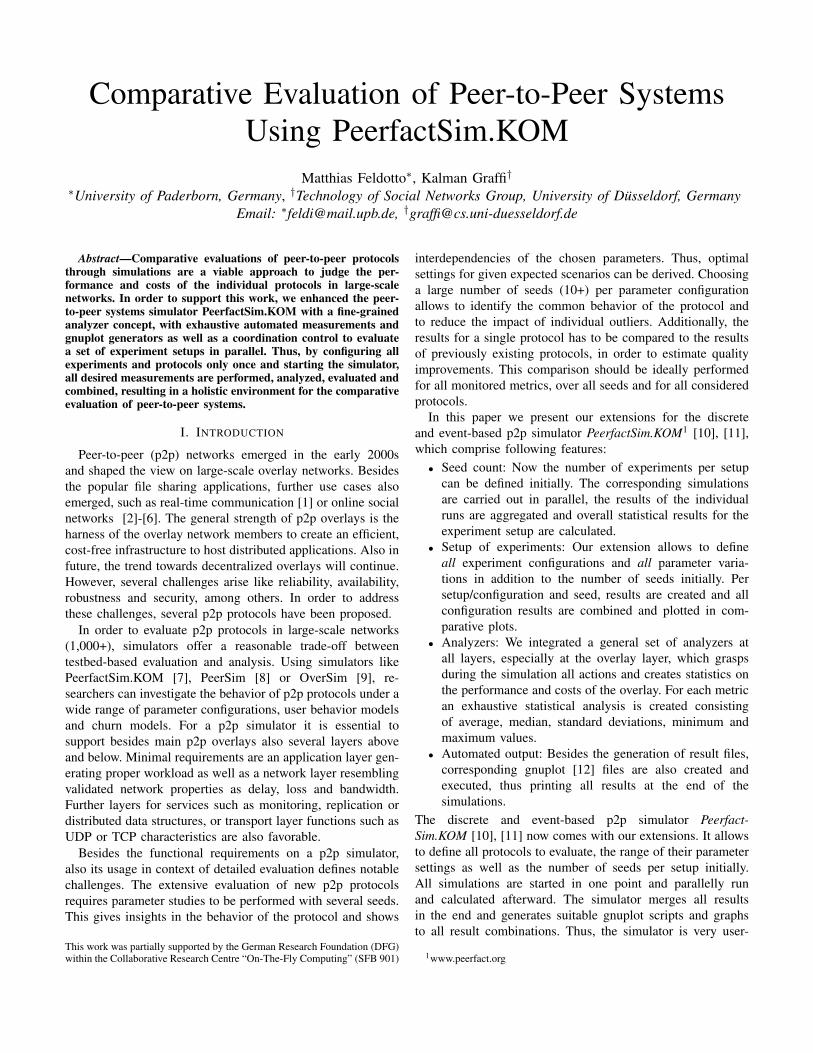
We look at the hop counts of the overlays (cf. Fig. 6), the
load of each peer, in terms of forwarded (cf. Fig. 7) and served
lookups (cf. Fig. 8), and used bandwidth (cf. Fig. 9).
The hop count measures the main performance of the
overlays (cf. Fig. 6). The fewer hops are required, the faster
a lookup can be finished. Additionally, the hop count should
be nearly equal for all peers. This fact can be seen in the
1
10
100
0 200 400 600 800 1000
Hop C
ount [number]
Peer
Average of Hop Count
Chord
EpiChord
ReChord
CaReChord
Pastry
Can
Fig. 6. Hop count of different overlays in a simplified model
0
1000
2000
3000
4000
5000
6000
7000
8000
9000
10000
0 100 200 300 400 500 600 700 800 900 1000
Forwarded Messages [number]
Peer
Sum of Forwarded Messages
Chord
EpiChord
ReChord
CaReChord
Pastry
Can
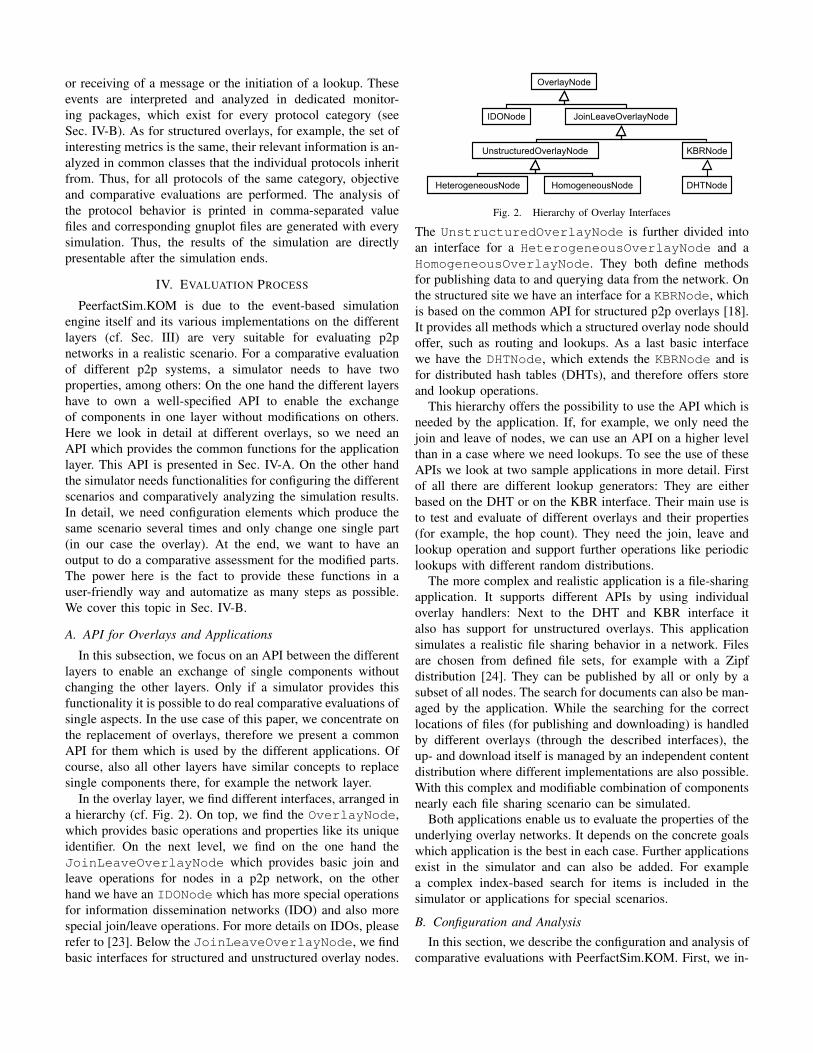
Fig. 7. Forwarded lookups by different nodes in different overlays in asimplified model
measurements of all plots, only the hop count in CAN deviates
for the different peers. CAN is also with hop count values
between 20 and 40 hops the worst tested overlay, which is
based on its topology in a two-dimensional coordinate system.
It follows Chord, ReChord and CaReChord with a stable hop
count at around six hops. As the three overlays use exactly
the same routing process, they also have the same hop count.
Pastry has a hop count between three and six hops in this
scenario. EpiChord can reach average values between two and
three, as it uses a cache and often only needs one hop for
a lookup. The automatically generated graph enables us to
directly compare all overlays.
By looking at the forwarded and served lookups, we can
measure the fairness of the overlay. All peers should have a
similar amount of load, the forwarded messages indicate the
load in the routing process (cf. Fig. 7). While Chord and its
variants distribute the routing load fairly among the peers,
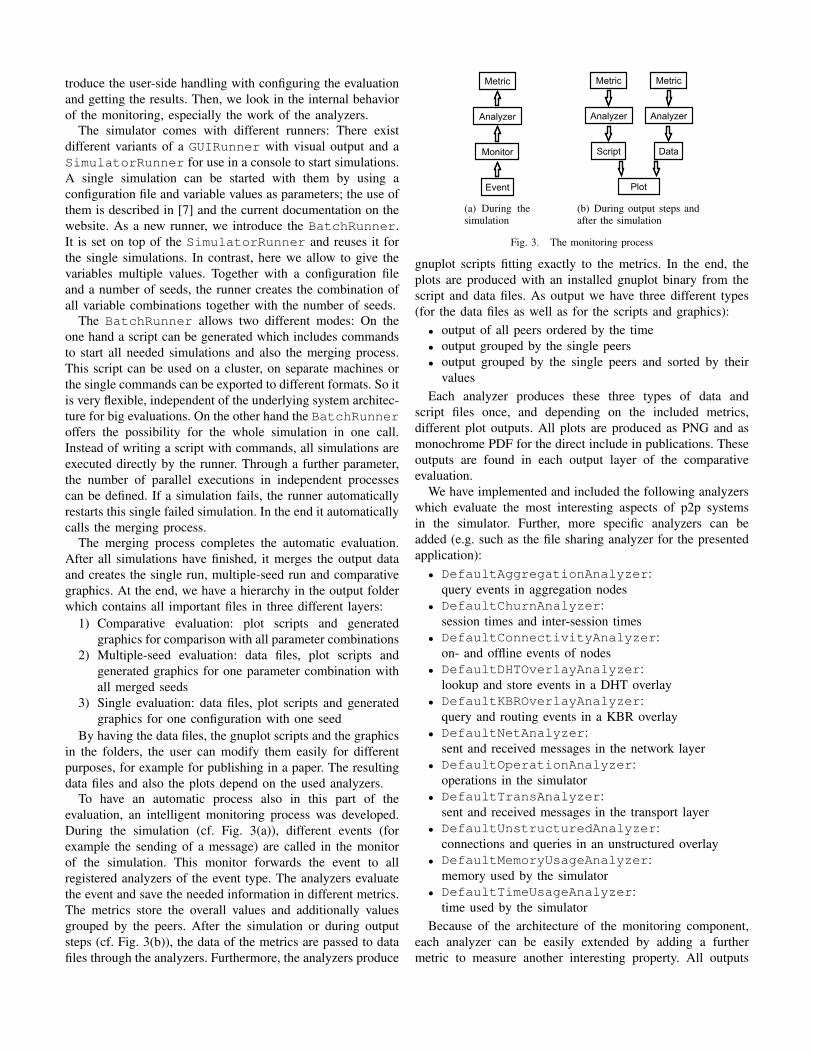
CAN and Pastry have an imbalance. The served messages
indicate how fair the data is distributed among the peers and
how many lookups have to be served by them (cf. Fig. 8).
We see a similar distribution in all overlays. There are always
some nodes which have to serve more messages and others
which have to serve nearly no messages. This is explained by
the random distribution of the lookup targets.
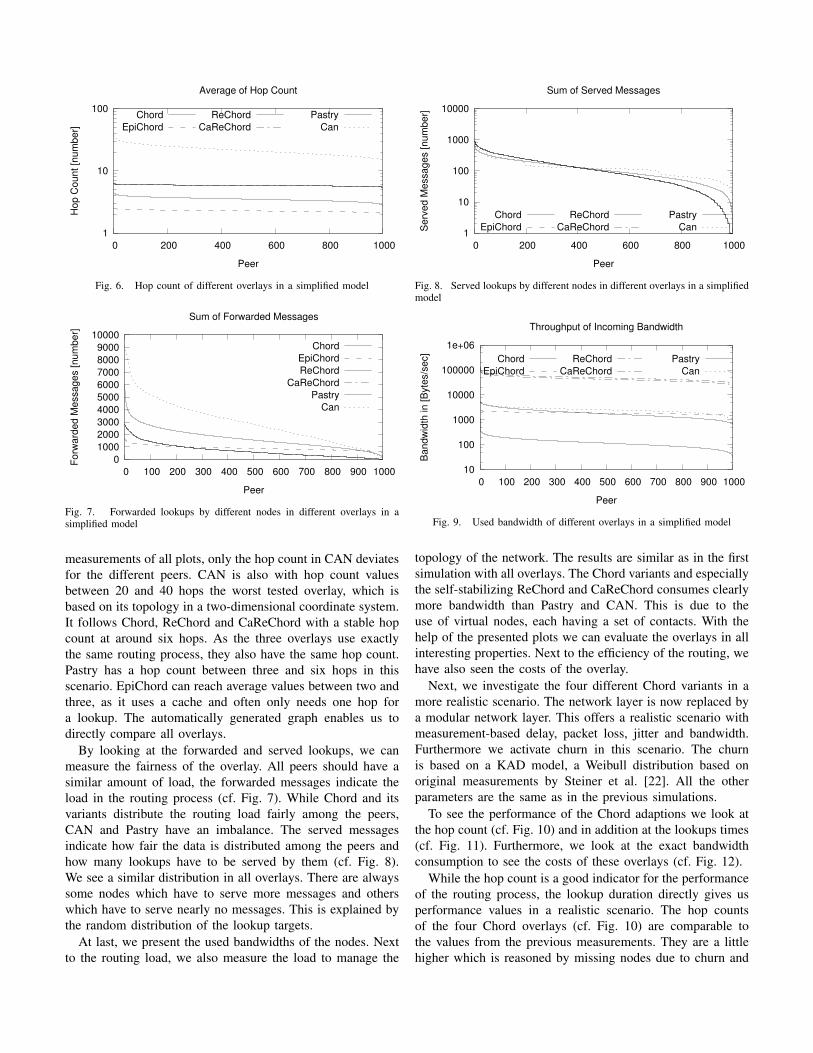
At last, we present the used bandwidths of the nodes. Next
to the routing load, we also measure the load to manage the
1
10
100
1000
10000
0 200 400 600 800 1000
Se
rve
d M
essa
ge
s [
nu
mb
er]
Peer
Sum of Served Messages
Chord
EpiChord
ReChord
CaReChord
Pastry
Can
Fig. 8. Served lookups by different nodes in different overlays in a simplifiedmodel
10
100
1000
10000
100000
1e+06
0 100 200 300 400 500 600 700 800 900 1000
Bandwidth in [Bytes/sec]
Peer
Throughput of Incoming Bandwidth
Chord
EpiChord
ReChord
CaReChord
Pastry
Can
Fig. 9. Used bandwidth of different overlays in a simplified model
topology of the network. The results are similar as in the first
simulation with all overlays. The Chord variants and especially
the self-stabilizing ReChord and CaReChord consumes clearly
more bandwidth than Pastry and CAN. This is due to the
use of virtual nodes, each having a set of contacts. With the
help of the presented plots we can evaluate the overlays in all
interesting properties. Next to the efficiency of the routing, we
have also seen the costs of the overlay.
Next, we investigate the four different Chord variants in a
more realistic scenario. The network layer is now replaced by
a modular network layer. This offers a realistic scenario with
measurement-based delay, packet loss, jitter and bandwidth.
Furthermore we activate churn in this scenario. The churn
is based on a KAD model, a Weibull distribution based on
original measurements by Steiner et al. [22]. All the other
parameters are the same as in the previous simulations.
To see the performance of the Chord adaptions we look at
the hop count (cf. Fig. 10) and in addition at the lookups times
(cf. Fig. 11). Furthermore, we look at the exact bandwidth
consumption to see the costs of these overlays (cf. Fig. 12).
While the hop count is a good indicator for the performance
of the routing process, the lookup duration directly gives us
performance values in a realistic scenario. The hop counts
of the four Chord overlays (cf. Fig. 10) are comparable to
the values from the previous measurements. They are a little
higher which is reasoned by missing nodes due to churn and
0.001
0.01
0.1
1
10
100
0 100 200 300 400 500 600 700 800 900 1000
Hop Count [number]
Peer
Average Hop Count
Chord
EpiChord
ReChord
CaReChord
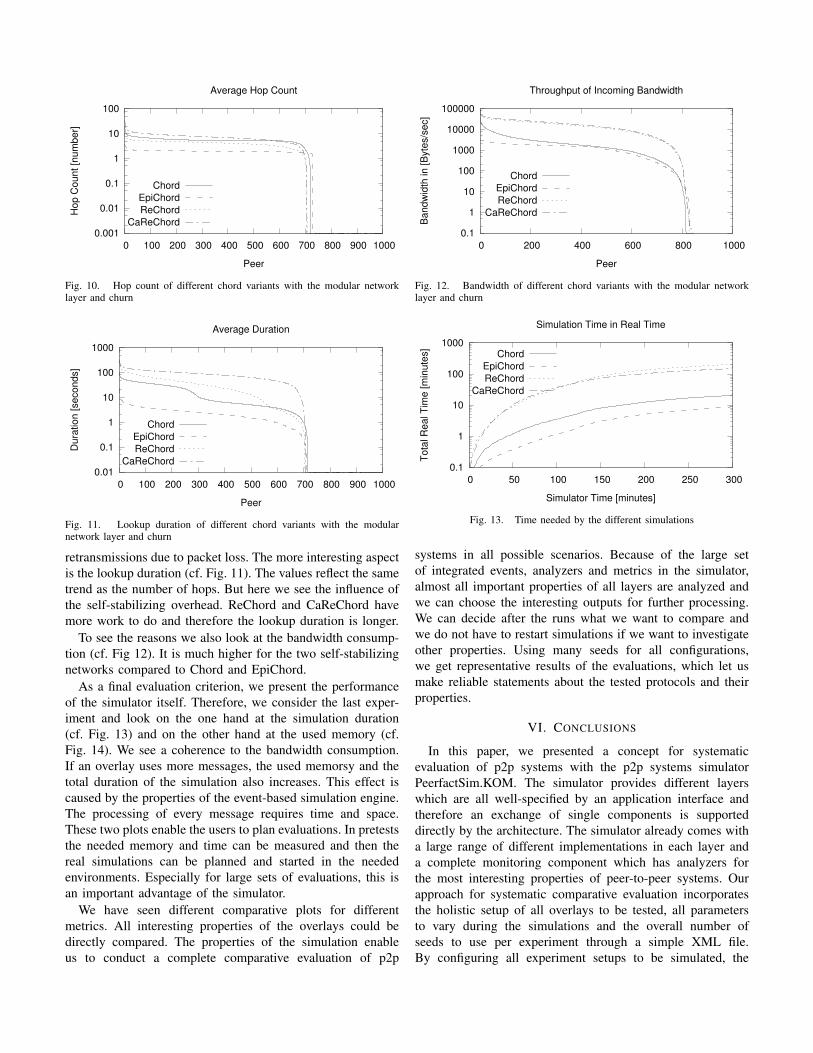
Fig. 10. Hop count of different chord variants with the modular networklayer and churn
0.01
0.1
1
10
100
1000
0 100 200 300 400 500 600 700 800 900 1000
Duration [seconds]
Peer
Average Duration
Chord
EpiChord
ReChord
CaReChord
Fig. 11. Lookup duration of different chord variants with the modularnetwork layer and churn
retransmissions due to packet loss. The more interesting aspect
is the lookup duration (cf. Fig. 11). The values reflect the same
trend as the number of hops. But here we see the influence of
the self-stabilizing overhead. ReChord and CaReChord have
more work to do and therefore the lookup duration is longer.
To see the reasons we also look at the bandwidth consump-
tion (cf. Fig 12). It is much higher for the two self-stabilizing
networks compared to Chord and EpiChord.
As a final evaluation criterion, we present the performance
of the simulator itself. Therefore, we consider the last exper-
iment and look on the one hand at the simulation duration
(cf. Fig. 13) and on the other hand at the used memory (cf.
Fig. 14). We see a coherence to the bandwidth consumption.
If an overlay uses more messages, the used memorsy and the
total duration of the simulation also increases. This effect is
caused by the properties of the event-based simulation engine.
The processing of every message requires time and space.
These two plots enable the users to plan evaluations. In pretests
the needed memory and time can be measured and then the
real simulations can be planned and started in the needed
environments. Especially for large sets of evaluations, this is
an important advantage of the simulator.
We have seen different comparative plots for different
metrics. All interesting properties of the overlays could be
directly compared. The properties of the simulation enable
us to conduct a complete comparative evaluation of p2p
0.1
1
10
100
1000
10000
100000
0 200 400 600 800 1000
Ba
nd
wid
th in
[B
yte
s/s
ec]
Peer
Throughput of Incoming Bandwidth
Chord
EpiChord
ReChord
CaReChord
Fig. 12. Bandwidth of different chord variants with the modular networklayer and churn
0.1
1
10
100
1000
0 50 100 150 200 250 300
To
tal R
ea
l T
ime
[m
inu
tes]
Simulator Time [minutes]
Simulation Time in Real Time
Chord
EpiChord
ReChord
CaReChord
Fig. 13. Time needed by the different simulations
systems in all possible scenarios. Because of the large set
of integrated events, analyzers and metrics in the simulator,
almost all important properties of all layers are analyzed and
we can choose the interesting outputs for further processing.
We can decide after the runs what we want to compare and
we do not have to restart simulations if we want to investigate
other properties. Using many seeds for all configurations,
we get representative results of the evaluations, which let us
make reliable statements about the tested protocols and their
properties.
VI. CONCLUSIONS
In this paper, we presented a concept for systematic
evaluation of p2p systems with the p2p systems simulator
PeerfactSim.KOM. The simulator provides different layers
which are all well-specified by an application interface and
therefore an exchange of single components is supported
directly by the architecture. The simulator already comes with
a large range of different implementations in each layer and
a complete monitoring component which has analyzers for
the most interesting properties of peer-to-peer systems. Our
approach for systematic comparative evaluation incorporates
the holistic setup of all overlays to be tested, all parameters
to vary during the simulations and the overall number of
seeds to use per experiment through a simple XML file.
By configuring all experiment setups to be simulated, the

300 350 400 450 500 550 600 650 700 750 800 850
0 50 100 150 200 250 300
Used Memory [MB]
Simulator Time [minutes]
Maximum used Memory
Chord
EpiChord
ReChord
CaReChord
Fig. 14. Memory used by the different simulations
user of the simulator can initiate all simulation runs in one
instance. Once all simulations are run, the results are merged
on the level of individual simulation runs, across several
simulation runs of one setup with several seeds, as well as
across parameter or overlay variations. The results present
an exhaustive comparison of the configured overlays and
protocols in full details, both in comma-separated value files
as well as automatically generated and plotted gnuplot graphs.
The evaluation has shown a comparison of both structured and
unstructured p2p overlays at the use case of file sharing as well
as lookup resolving for structured p2p overlays. The proposed
and integrated extensions for PeerfactSim.KOM enable the
user to classify and compare different peer-to-peer overlays
extensively and also their parameters in different scenarios.
REFERENCES
[1] Skype, “Skype - Peer-to-peer Internet Telephony,”http://www.skype.com, 2004.
[2] L. A. Cutillo, R. Molva, and T. Strufe, “Safebook: Feasibility ofTransitive Cooperation for Privacy on a Decentralized Social Network,”in IEEE WOWMOM ’09: Proceedings of the IEEE International Sym-
posium on a World of Wireless, Mobile and Multimedia Networks, 2009.[3] K. Graffi, C. Groß, P. Mukherjee, A. Kovacevic, and R. Steinmetz,
“LifeSocial.KOM: A P2P-based Platform for Secure Online Social Net-works,” in IEEE P2P ’10: Proceedings of the International Conference
on Peer-to-Peer Computing, 2010.[4] K. Graffi, C. Groß, D. Stingl, D. Hartung, A. Kovacevic, and R. Stein-
metz, “LifeSocial.KOM: A Secure and P2P-based Solution for OnlineSocial Networks,” in Proceedings of IEEE CCNC ’11, 2011.
[5] K. Graffi, P. Mukherjee, B. Menges, D. Hartung, A. Kovacevic, andR. Steinmetz, “Practical Security in P2P-based Social Networks,” inIEEE LCN ’09: Proceedings of the Annual Conference on Local Com-
puter Networks, 2009.[6] K. Graffi, S. Podrajanski, P. Mukherjee, A. Kovacevic, and R. Steinmetz,
“A Distributed Platform for Multimedia Communities,” in Proceedings
of IEEE ISM ’08, 2008.[7] A. Kovacevic, S. Kaune, H. Heckel, A. Mink, K. Graffi, O. Heckmann,
and R. Steinmetz, “PeerfactSim.KOM - A Simulator for Large-ScalePeer-to-Peer Networks,” Technische Universitat Darmstadt, Germany,Tech. Rep. Tr-2006-06, 2006.
[8] A. Montresor and M. Jelasity, “PeerSim: A scalable P2P simulator,” inIEEE P2P’09: Proceedings of the International Conference on Peer-to-
Peer Computing, 2009.[9] I. Baumgart, B. Heep, and S. Krause, “OverSim: A Scalable and Flexible
Overlay Framework for Simulation and Real Network Applications,” inIEEE P2P ’09: Proceedings of the International Conference on Peer-
to-Peer Computing, 2009.[10] K. Graffi, “PeerfactSim.KOM: A P2P System Simulator Experiences
and Lessons Learned,” in IEEE P2P ’11: Proceedings of the Interna-
tional Conference on Peer-to-Peer Computing, 2011.
[11] A. Kovacevic, S. Kaune et al., “Benchmarking Platform for Peer-to-PeerSystems,” it - Information Technology, vol. 49, no. 5, 2007.
[12] T. Williams and C. Kelley, “gnuplot 4.6: An Interactive Plotting Pro-gram,” http://www.gnuplot.info, 2012.
[13] S. Naicken, B. Livingston, A. Basu, S. Rodhetbhai, I. Wakeman, andD. Chalmers, “The state of peer-to-peer simulators and simulations,”Computer Communication Review, vol. 37, no. 2, pp. 95–98, 2007.
[14] T. M. Gil, F. Kaashoek, J. Li, R. Morris, and J. Stri-bling, “P2PSim: A Simulator for Peer-to-Peer Protocols,”http://http://pdos.csail.mit.edu/p2psim, 2006.
[15] J. P. Ahullo and P. G. Lopez, “PlanetSim: An Extensible Simulation Toolfor Peer-to-Peer Networks and Services,” in IEEE P2P’09: Proceedings
of the International Conference on Peer-to-Peer Computing, 2009.[16] W. Galuba, K. Aberer, Z. Despotovic, and W. Kellerer, “ProtoPeer:
From Simulation to Live Deployment in One Step,” in IEEE P2P’08:
Proceedings of the International Conference on Peer-to-Peer Computing,2008.
[17] K. Shudo, Y. Tanaka, and S. Sekiguchi, “Overlay Weaver: An OverlayConstruction Toolkit,” Computer Communications, vol. 31, no. 2, 2008.
[18] F. Dabek, B. Y. Zhao, P. Druschel, J. Kubiatowicz, and I. Stoica,“Towards a Common API for Structured Peer-to-Peer Overlays,” inIPTPS ’03: Proceedings of the International Workshop on Peer-to-Peer
Systems, ser. LNCS, vol. 2735. Springer, 2003.[19] S. Sioutas, G. Papaloukopoulos, E. Sakkopoulos, K. Tsichlas, and
Y. Manolopoulos, “A Novel Distributed P2P Simulator Architecture:D-P2P-sim,” in ACM CIKM’09: Proceedings of the ACM Conference
on Information and Knowledge Management, 2009.[20] H. Casanova, A. Legrand, and M. Quinson, “SimGrid: a Generic
Framework for Large-Scale Distributed Experiments,” in IEEE UKSIM
’08: Proceedings of the International Conference on Computer Modeling
and Simulation, ser. UKSIM ’08, 2008.[21] D. Stingl, C. Groß, J. Ruckert, L. Nobach, A. Kovacevic, and R. Stein-
metz, “PeerfactSim.KOM: A Simulation Framework for Peer-to-PeerSystems,” in IEEE HPCS’11: Proceedings of the International Con-
ference on High Performance Computing and Simulation, 2011.[22] M. Steiner, T. En-Najjary, and E. Biersack, “Long Term Study of Peer
Behavior in the KAD DHT,” IEEE/ACM Transactions on Networking,vol. 17, 2009.
[23] C. Gross, M. Lehn, C. Munker, A. P. Buchmann, and R. Steinmetz,“Towards a Comparative Performance Evaluation of Overlays for Net-worked Virtual Environments,” in IEEE P2P’11: Proceedings of the
International Conference on Peer-to-Peer Computing, 2011.[24] G. K. Zipf, Human Behaviour and the Principle of Least Effort: an
Introduction to Human Ecology. Addison-Wesley, 1949.[25] T. Klingberg and R. Manfredi, “Gnutella 0.6,” http://rfc-
gnutella.sourceforge.net/src/rfc-0 6-draft.html, 2002.[26] Y. Chawathe, S. Ratnasamy, L. Breslau, N. Lanham, and S. Shenker,
“Making Gnutella-like P2P systems scalable,” in SIGCOMM ’03: Pro-
ceedings of the Conference on Applications, Technologies, Architectures,
and Protocols for Computer Communications. ACM, 2003.[27] I. Stoica, R. Morris, D. Karger, M. F. Kaashoek, and H. Balakr-
ishnan, “Chord: A Scalable Peer-to-Peer Lookup Service for InternetApplications,” in SIGCOMM ’01: Proceedings of the International
Conference on Applications, Technologies, Architectures, and Protocols
for Computer Communications. ACM, 2001.[28] B. Leong, B. Liskov, and E. D. Demaine, “EpiChord: Parallelizing the
Chord Lookup Algorithm with reactive Routing State Management,”Computer Communications, vol. 29, no. 9, pp. 1243–1259, 2006.
[29] S. Kniesburges, A. Koutsopoulos, and C. Scheideler, “Re-chord: A self-stabilizing chord overlay network,” in ACM SPAA ’11: Proceedings of
the ACM Symp. on Parallelism in Algorithms and Architectures, 2011.[30] M. Benter, M. Divband, S. Kniesburges, A. Koutsopoulos, and K. Graffi,
“Ca-Re-Chord: A Churn Resistant Self-stabilizing Chord Overlay Net-work,” in NetSys’13: Proceedings of the Networked Systems Annual
Technical Conf., 2013.[31] A. I. T. Rowstron and P. Druschel, “Pastry: Scalable, Decentralized
Object Location, and Routing for Large-Scale Peer-to-Peer Systems,” inIFIP/ACM Middleware ’01: Proceedings of the International Conference
on Distributed Systems Platforms, ser. LNCS, vol. 2218. Springer, 2001.[32] S. Ratnasamy, P. Francis, M. Handley, R. Karp, and S. Schenker, “A
Scalable Content-Addressable Network,” in ACM SIGCOMM ’01: Pro-
ceedings of the Conference on Applications, Technologies, Architectures,
and Protocols for Computer Communications, vol. 31, no. 4. ACM,2001.