companies and intellectual property commission
TRANSCRIPT
Companies and IntellectualProperty Commission
ANNUAL REPORT 2013/2014
CIPC Annual Report 2013/2014 1
TABLE OF CONTENTSPart A: General Information ....................................................................................................................................................................................3
1.1 Public entity’s general information ....................................................................................................................................................................................................................4
1.2 List of Abbreviations /Acronyms .........................................................................................................................................................................................................................5
1.3 Foreword by the Minister .........................................................................................................................................................................................................................................6
1.4 Commissioner’s Overview .......................................................................................................................................................................................................................................7
1.5 Statement of responsibility and confirmation of the accuracy of the annual report .....................................................................................................15
1.6 Strategic Overview ....................................................................................................................................................................................................................................................16
1.7 Legislative and Other Mandates .......................................................................................................................................................................................................................17
1.8 Organisational Structure .......................................................................................................................................................................................................................................18
Part B: Performance Information ..........................................................................................................................................................................19
2.1 Auditor-General’s Report: Predetermined Objectives .........................................................................................................................................................................20
2.2 Situational analysis ....................................................................................................................................................................................................................................................20
2.2.1 Service delivery environment ............................................................................................................................................................................................................................20
2.2.2 Organisational environment ..............................................................................................................................................................................................................................20
2.2.3 Key policy developments and legislative changes ...............................................................................................................................................................................21
2.3 Strategic Outcome Oriented Goals ................................................................................................................................................................................................................21
2.4 Performance information by programme/activity/objective ........................................................................................................................................................21
2.4.1 Description of each programme/activity/objective ............................................................................................................................................................................21
2.4.2 Strategic objectives, performance indicators, planned targets and actual achievements ..........................................................................................23
2.4.3 Strategy to overcome areas of under performance .............................................................................................................................................................................28
2.4.4 Changes to planned targets ...............................................................................................................................................................................................................................28
2.4.5 Linking performance with budgets ...............................................................................................................................................................................................................31
2.5 Revenue collection ...................................................................................................................................................................................................................................................31
2.6 Capital investment ....................................................................................................................................................................................................................................................32
Part C: Governance ..................................................................................................................................................................................................33
3.1 Introduction .................................................................................................................................................................................................................................................................34
3.2 Portfolio Committees ..............................................................................................................................................................................................................................................34
3.3 Executive Authority ..................................................................................................................................................................................................................................................34
3.4 The Accounting Authority ....................................................................................................................................................................................................................................34
3.4.1 Introduction ..................................................................................................................................................................................................................................................................34
3.5 Committees ...................................................................................................................................................................................................................................................................35
3.5.1 Audit Committee and Risk Committee ........................................................................................................................................................................................................35
Companies and Intellectual Property Commission2
3.5.2 Remuneration of committee members .....................................................................................................................................................................................................35
3.6 Risk Management ......................................................................................................................................................................................................................................................36
3.7 Internal Control Unit ................................................................................................................................................................................................................................................36
3.8 Internal Audit and Audit Committees...........................................................................................................................................................................................................36
3.9 Compliance with laws and regulations ........................................................................................................................................................................................................37
3.10 Fraud and Corruption ..............................................................................................................................................................................................................................................37
3.11 Minimising Conflict of Interest ..........................................................................................................................................................................................................................38
3.12 Code of Conduct ........................................................................................................................................................................................................................................................38
3.13 Health, Safety and Environmental Issues ....................................................................................................................................................................................................38
3.14 Company Secretary (if applicable) ..................................................................................................................................................................................................................38
3.15 Social Responsibility .................................................................................................................................................................................................................................................38
3.16 Audit Committee Report ......................................................................................................................................................................................................................................40
Part D: Human Resource Management ...............................................................................................................................................................43
4.1 Introduction ..................................................................................................................................................................................................................................................................44
4.2 Human Resource Oversight Statistics ...........................................................................................................................................................................................................46
Part E: Financial Information .................................................................................................................................................................................53
5.1 Report of the External Auditor ...........................................................................................................................................................................................................................54
5.2 Annual Financial Statements ..............................................................................................................................................................................................................................57

CIPC Annual Report 2013/2014 3
PART A: General Information
“It always seems impossible until its done.”Nelson Mandela
Companies and Intellectual Property Commission4
Part A: General Information 1.1 Public Entity’s General Information
Registered name of the public entity
Companies and Intellectual Property Commission (CIPC)
Registration Numbers and/or other relevant numbers
Not applicable
Registered Office address
the dti campus (Block F – Entfutfukweni)
77 Mentjies Street
Sunnyside,
Pretoria
Postal Address
P.O. Box 429
Pretoria
0001
Contact telephone numbers
+27 12 394 9973
Email address Website address
[email protected] www.cipc.co.za
External Auditors Information
Auditor-General South Africa
PO Box 446
Pretoria
0001
Bankers Information
ABSA
PO Box 4210
Pretoria
0001
Company Secretary
Not applicable
CIPC Annual Report 2013/2014 5
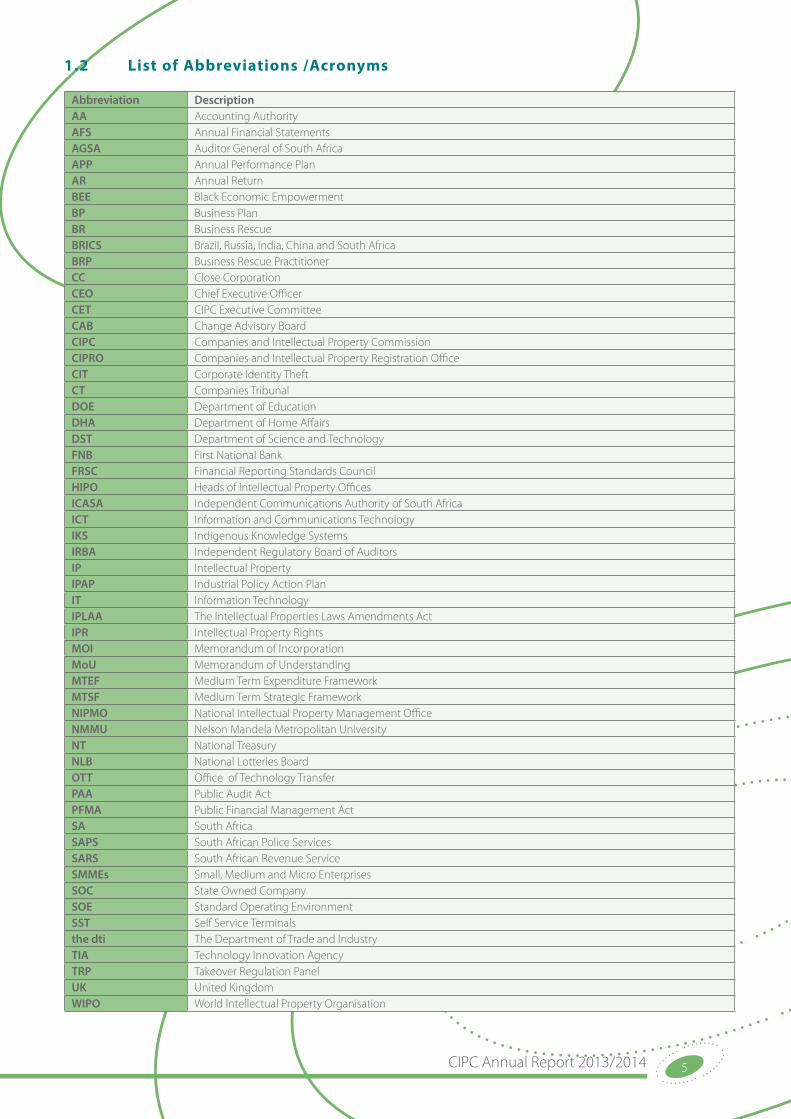
1.2 List of Abbreviations /Acronyms
Abbreviation DescriptionAA Accounting AuthorityAFS Annual Financial StatementsAGSA Auditor General of South AfricaAPP Annual Performance PlanAR Annual ReturnBEE Black Economic EmpowermentBP Business PlanBR Business RescueBRICS Brazil, Russia, India, China and South AfricaBRP Business Rescue PractitionerCC Close CorporationCEO Chief Executive OfficerCET CIPC Executive CommitteeCAB Change Advisory Board CIPC Companies and Intellectual Property CommissionCIPRO Companies and Intellectual Property Registration OfficeCIT Corporate Identity TheftCT Companies Tribunal DOE Department of EducationDHA Department of Home AffairsDST Department of Science and TechnologyFNB First National BankFRSC Financial Reporting Standards CouncilHIPO Heads of Intellectual Property OfficesICASA Independent Communications Authority of South AfricaICT Information and Communications TechnologyIKS Indigenous Knowledge SystemsIRBA Independent Regulatory Board of AuditorsIP Intellectual PropertyIPAP Industrial Policy Action PlanIT Information TechnologyIPLAA The Intellectual Properties Laws Amendments ActIPR Intellectual Property RightsMOI Memorandum of IncorporationMoU Memorandum of UnderstandingMTEF Medium Term Expenditure FrameworkMTSF Medium Term Strategic FrameworkNIPMO National Intellectual Property Management OfficeNMMU Nelson Mandela Metropolitan UniversityNT National TreasuryNLB National Lotteries BoardOTT Office of Technology TransferPAA Public Audit ActPFMA Public Financial Management Act SA South AfricaSAPS South African Police ServicesSARS South African Revenue ServiceSMMEs Small, Medium and Micro EnterprisesSOC State Owned CompanySOE Standard Operating EnvironmentSST Self Service Terminalsthe dti The Department of Trade and IndustryTIA Technology Innovation AgencyTRP Takeover Regulation PanelUK United KingdomWIPO World Intellectual Property Organisation

Companies and Intellectual Property Commission6
1.3 Foreword by the Minister
The introduction of the Companies Act, No 71 of 2008, in May 2011 has had a substantial impact on the corporate landscape by introducing new measures for corporate transparency, providing a new regime for distressed companies and reducing the regulatory burden by simplifying the governance requirements for small businesses.
Over the past three years it has become apparent that the legislation and its intent were well crafted and appropriate for the South African context. No major deficiencies have been identified, although certain areas of the law require refinement and fine tuning. The courts have contributed to clarifying provisions and have created more certainty through their interpretation of the Act, especially in the area of business rescue.
The statistics of the CIPC show that the phasing out of the close corporation has not discouraged corporate formation, and the number of companies registered is increasing every year.
While a number of short comings in the business rescue regime are becoming apparent with its implementation, especially around the sanctions applied to business practitioners and the regulation of their activities, the regime has already shown successes. 12% (129) of the companies that have entered into business rescue over the past three years, have concluded their business
rescue proceedings successfully (substantially implemented the proceedings) and most of these companies have continued trading. The CIPC will be conducting research in the next financial year to test the actual success of these proceedings.
Over the past year, the CIPC has expanded its regulatory oversight role and has issued 156 compliance notices for transgressions that are fundamental to company governance, including the provision of financial statements to its shareholders. The high-profile Telkom case has demonstrated the need for good corporate governance practices in large companies, including state-owned entities. Improvement in the compliance rate with annual return filing is also noted. The CIPC will focus on other compliance areas in the next financial period. I am pleased to note that the entity is playing the broader role that was envisaged in the Companies Act, 2008.
The CIPC has also demonstrated a focus on innovative service delivery. Two services were launched in the period under review, which are unique to South Africa. The first initiative was the launch of the integrated bank account opening and company registration process; a collaboration between the CIPC and FNB. The second initiative relates to the introduction of self-service terminals at the first CIPC Service Centre, which have been designed to cater for small businesses. The self-service terminals provide for automated touch screen services, which are integrated with the Department of Home Affairs and allow for instant identity verification. As a result of the verification, customers are not required to submit any supporting documentation to conclude their transactions. The expansion of this service offering will improve access for customers across the country and provide a greater choice of channels to businesses.
South Africa is moving closer to the world-class implementation of the Companies Act. I am pleased to note the progress that has been made and look forward to further successes in the year to come.
Dr Rob Davies, MP
Minister of Trade and Industry
CIPC Annual Report 2013/2014 7
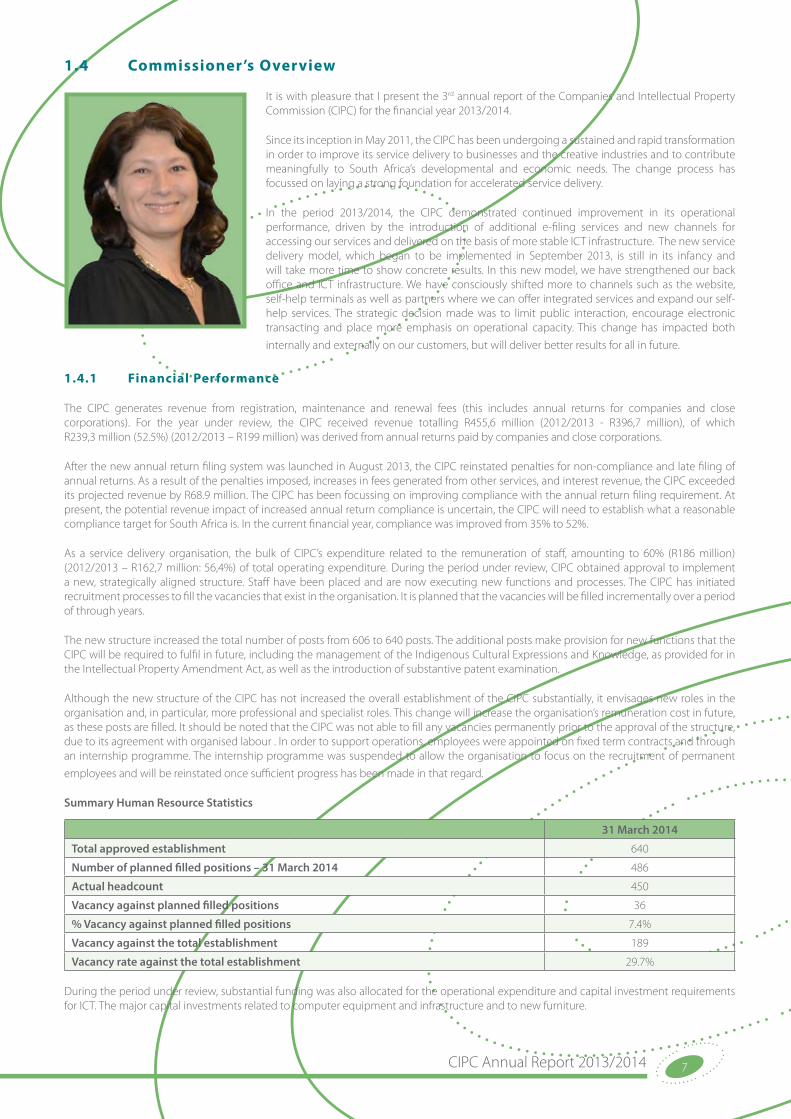
1.4 Commissioner’s Overview
It is with pleasure that I present the 3rd annual report of the Companies and Intellectual Property Commission (CIPC) for the financial year 2013/2014.
Since its inception in May 2011, the CIPC has been undergoing a sustained and rapid transformation in order to improve its service delivery to businesses and the creative industries and to contribute meaningfully to South Africa’s developmental and economic needs. The change process has focussed on laying a strong foundation for accelerated service delivery.
In the period 2013/2014, the CIPC demonstrated continued improvement in its operational performance, driven by the introduction of additional e-filing services and new channels for accessing our services and delivered on the basis of more stable ICT infrastructure. The new service delivery model, which began to be implemented in September 2013, is still in its infancy and will take more time to show concrete results. In this new model, we have strengthened our back office and ICT infrastructure. We have consciously shifted more to channels such as the website, self-help terminals as well as partners where we can offer integrated services and expand our self-help services. The strategic decision made was to limit public interaction, encourage electronic transacting and place more emphasis on operational capacity. This change has impacted both
internally and externally on our customers, but will deliver better results for all in future.
1.4.1 Financial Performance
The CIPC generates revenue from registration, maintenance and renewal fees (this includes annual returns for companies and close corporations). For the year under review, the CIPC received revenue totalling R455,6 million (2012/2013 - R396,7 million), of which R239,3 million (52.5%) (2012/2013 – R199 million) was derived from annual returns paid by companies and close corporations.
After the new annual return filing system was launched in August 2013, the CIPC reinstated penalties for non-compliance and late filing of annual returns. As a result of the penalties imposed, increases in fees generated from other services, and interest revenue, the CIPC exceeded its projected revenue by R68.9 million. The CIPC has been focussing on improving compliance with the annual return filing requirement. At present, the potential revenue impact of increased annual return compliance is uncertain, the CIPC will need to establish what a reasonable compliance target for South Africa is. In the current financial year, compliance was improved from 35% to 52%.
As a service delivery organisation, the bulk of CIPC’s expenditure related to the remuneration of staff, amounting to 60% (R186 million) (2012/2013 – R162,7 million: 56,4%) of total operating expenditure. During the period under review, CIPC obtained approval to implement a new, strategically aligned structure. Staff have been placed and are now executing new functions and processes. The CIPC has initiated recruitment processes to fill the vacancies that exist in the organisation. It is planned that the vacancies will be filled incrementally over a period of through years.
The new structure increased the total number of posts from 606 to 640 posts. The additional posts make provision for new functions that the CIPC will be required to fulfil in future, including the management of the Indigenous Cultural Expressions and Knowledge, as provided for in the Intellectual Property Amendment Act, as well as the introduction of substantive patent examination.
Although the new structure of the CIPC has not increased the overall establishment of the CIPC substantially, it envisages new roles in the organisation and, in particular, more professional and specialist roles. This change will increase the organisation’s remuneration cost in future, as these posts are filled. It should be noted that the CIPC was not able to fill any vacancies permanently prior to the approval of the structure, due to its agreement with organised labour . In order to support operations, employees were appointed on fixed term contracts and through an internship programme. The internship programme was suspended to allow the organisation to focus on the recruitment of permanent
employees and will be reinstated once sufficient progress has been made in that regard.
Summary Human Resource Statistics
31 March 2014
Total approved establishment 640
Number of planned filled positions – 31 March 2014 486
Actual headcount 450
Vacancy against planned filled positions 36
% Vacancy against planned filled positions 7.4%
Vacancy against the total establishment 189
Vacancy rate against the total establishment 29.7%
During the period under review, substantial funding was also allocated for the operational expenditure and capital investment requirements for ICT. The major capital investments related to computer equipment and infrastructure and to new furniture.
Companies and Intellectual Property Commission8
In order to accommodate the number of staff on its structure, the CIPC has had to move to a completely open plan environment. This necessitated minor changes to the building and new smaller furniture that was appropriate for the open plan design. The CIPC also used this as an opportunity to upgrade the cabling, network and computer equipment for its building. Most of these costs were incurred in the financial period under review. The CIPC accordingly spent R5,332 million on new furniture and invested a substantial R17,096 million in computer equipment.
CIPC will continue with its modernisation investments in the ICT systems and infrastructure in the medium term to enable the continued migration to e-filing and the digitisation of its records.
1.4.2 Operational Performance
1.4.2.1 Register Activities
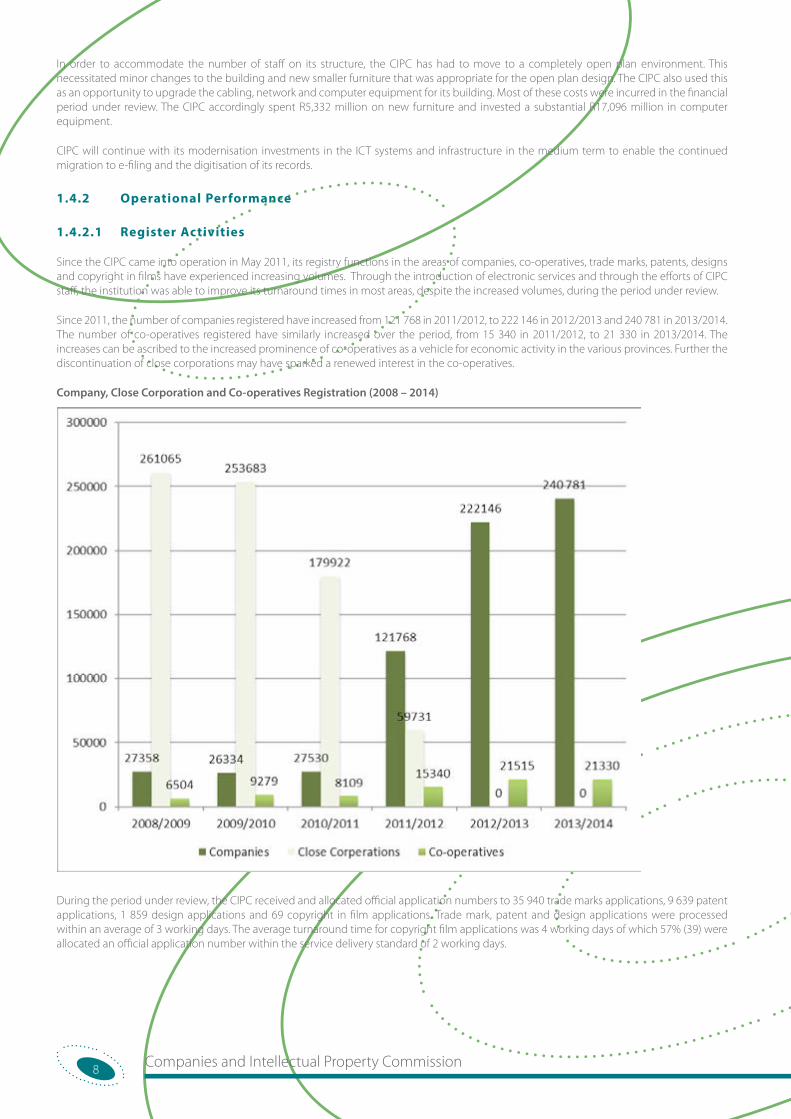
Since the CIPC came into operation in May 2011, its registry functions in the areas of companies, co-operatives, trade marks, patents, designs and copyright in films have experienced increasing volumes. Through the introduction of electronic services and through the efforts of CIPC staff, the institution was able to improve its turnaround times in most areas, despite the increased volumes, during the period under review.
Since 2011, the number of companies registered have increased from 121 768 in 2011/2012, to 222 146 in 2012/2013 and 240 781 in 2013/2014. The number of co-operatives registered have similarly increased over the period, from 15 340 in 2011/2012, to 21 330 in 2013/2014. The increases can be ascribed to the increased prominence of co-operatives as a vehicle for economic activity in the various provinces. Further the discontinuation of close corporations may have sparked a renewed interest in the co-operatives.
Company, Close Corporation and Co-operatives Registration (2008 – 2014)
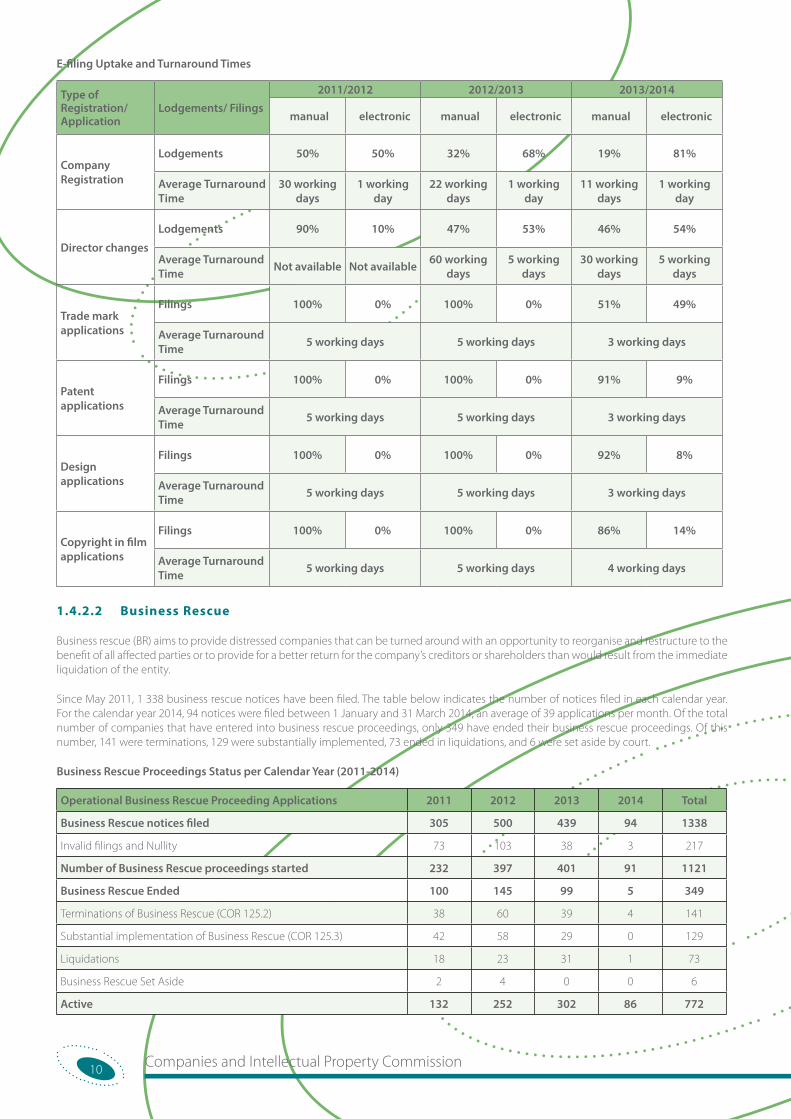
During the period under review, the CIPC received and allocated official application numbers to 35 940 trade marks applications, 9 639 patent applications, 1 859 design applications and 69 copyright in film applications. Trade mark, patent and design applications were processed within an average of 3 working days. The average turnaround time for copyright film applications was 4 working days of which 57% (39) were allocated an official application number within the service delivery standard of 2 working days.
CIPC Annual Report 2013/2014 9
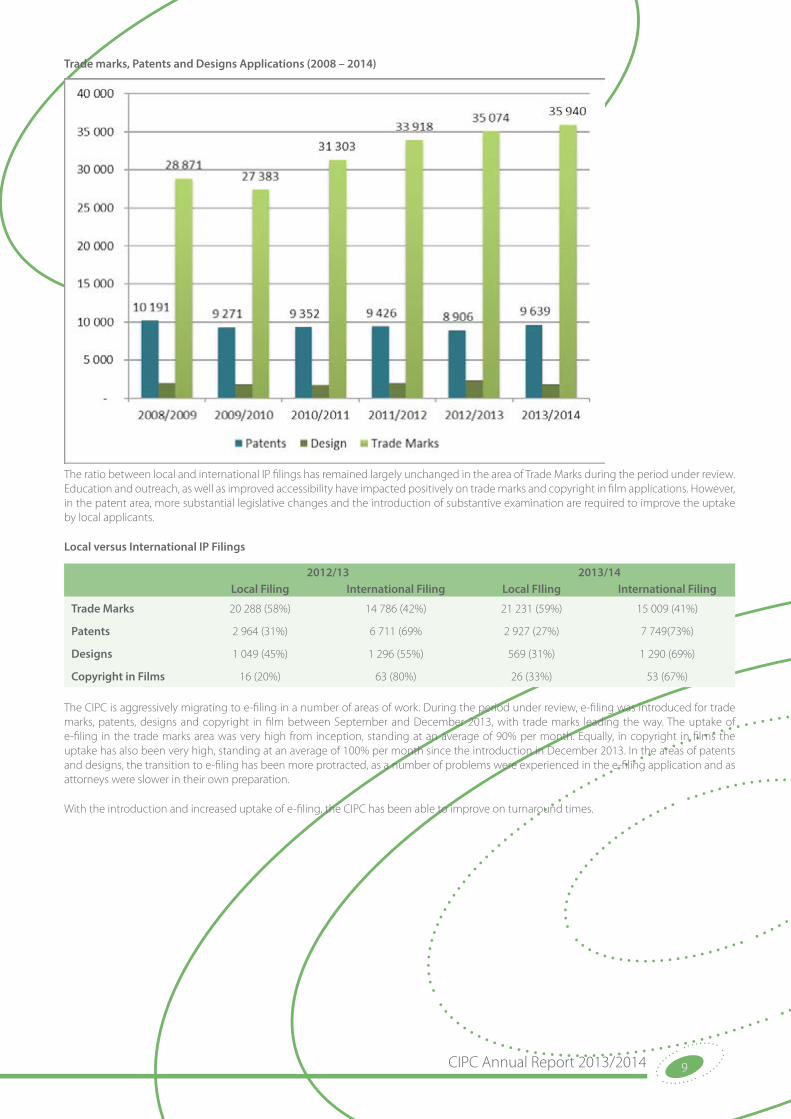
Trade marks, Patents and Designs Applications (2008 – 2014)
The ratio between local and international IP filings has remained largely unchanged in the area of Trade Marks during the period under review. Education and outreach, as well as improved accessibility have impacted positively on trade marks and copyright in film applications. However, in the patent area, more substantial legislative changes and the introduction of substantive examination are required to improve the uptake by local applicants.
Local versus International IP Filings
2012/13 2013/14Local Filing International Filing Local FIling International Filing
Trade Marks 20 288 (58%) 14 786 (42%) 21 231 (59%) 15 009 (41%)
Patents 2 964 (31%) 6 711 (69% 2 927 (27%) 7 749(73%)
Designs 1 049 (45%) 1 296 (55%) 569 (31%) 1 290 (69%)
Copyright in Films 16 (20%) 63 (80%) 26 (33%) 53 (67%)
The CIPC is aggressively migrating to e-filing in a number of areas of work. During the period under review, e-filing was introduced for trade marks, patents, designs and copyright in film between September and December 2013, with trade marks leading the way. The uptake of e-filing in the trade marks area was very high from inception, standing at an average of 90% per month. Equally, in copyright in films the uptake has also been very high, standing at an average of 100% per month since the introduction in December 2013. In the areas of patents and designs, the transition to e-filing has been more protracted, as a number of problems were experienced in the e-filing application and as attorneys were slower in their own preparation.
With the introduction and increased uptake of e-filing, the CIPC has been able to improve on turnaround times.
Companies and Intellectual Property Commission10
E-filing Uptake and Turnaround Times
Type of Registration/Application
Lodgements/ Filings
2011/2012 2012/2013 2013/2014
manual electronic manual electronic manual electronic
Company Registration
Lodgements 50% 50% 32% 68% 19% 81%
Average Turnaround Time
30 working days
1 working day
22 working days
1 working day
11 working days
1 working day
Director changes
Lodgements 90% 10% 47% 53% 46% 54%
Average Turnaround Time Not available Not available 60 working
days5 working
days30 working
days5 working
days
Trade mark applications
Filings 100% 0% 100% 0% 51% 49%
Average Turnaround Time 5 working days 5 working days 3 working days
Patent applications
Filings 100% 0% 100% 0% 91% 9%
Average Turnaround Time 5 working days 5 working days 3 working days
Design applications
Filings 100% 0% 100% 0% 92% 8%
Average Turnaround Time 5 working days 5 working days 3 working days
Copyright in film applications
Filings 100% 0% 100% 0% 86% 14%
Average Turnaround Time 5 working days 5 working days 4 working days
1.4.2.2 Business Rescue
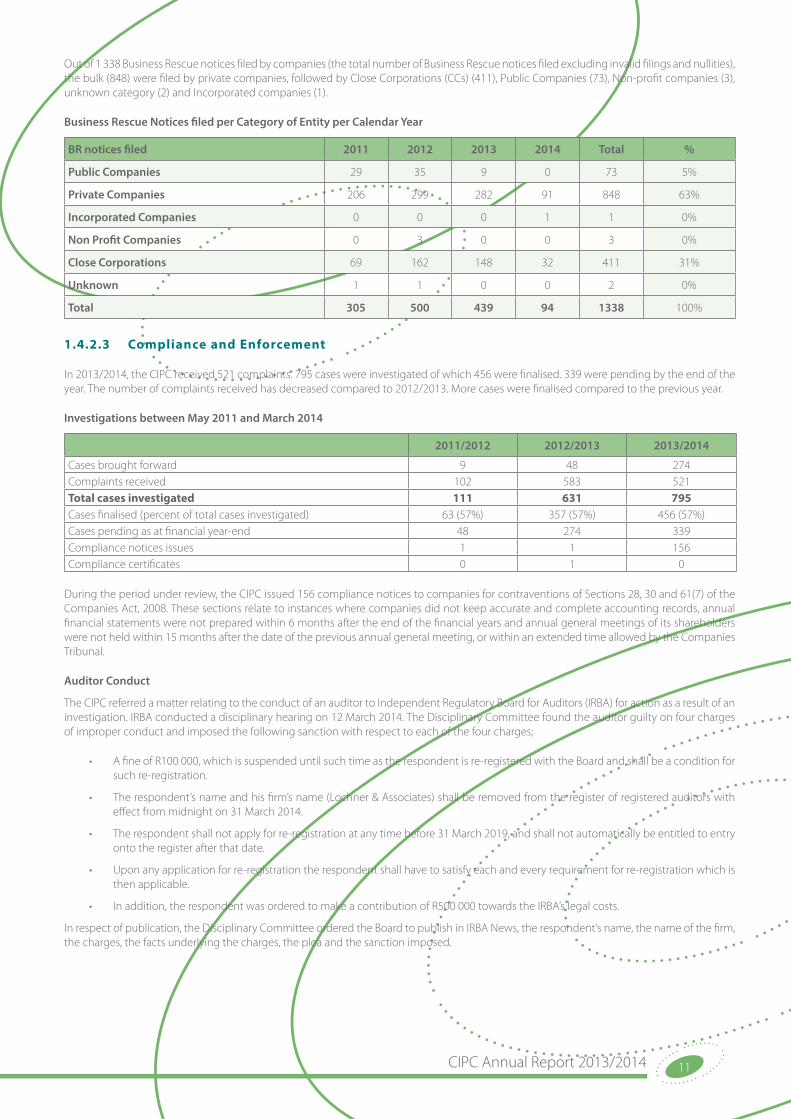
Business rescue (BR) aims to provide distressed companies that can be turned around with an opportunity to reorganise and restructure to the benefit of all affected parties or to provide for a better return for the company’s creditors or shareholders than would result from the immediate liquidation of the entity.
Since May 2011, 1 338 business rescue notices have been filed. The table below indicates the number of notices filed in each calendar year. For the calendar year 2014, 94 notices were filed between 1 January and 31 March 2014, an average of 39 applications per month. Of the total number of companies that have entered into business rescue proceedings, only 349 have ended their business rescue proceedings. Of this number, 141 were terminations, 129 were substantially implemented, 73 ended in liquidations, and 6 were set aside by court.
Business Rescue Proceedings Status per Calendar Year (2011-2014)
Operational Business Rescue Proceeding Applications 2011 2012 2013 2014 Total
Business Rescue notices filed 305 500 439 94 1338
Invalid filings and Nullity 73 103 38 3 217
Number of Business Rescue proceedings started 232 397 401 91 1121
Business Rescue Ended 100 145 99 5 349
Terminations of Business Rescue (COR 125.2) 38 60 39 4 141
Substantial implementation of Business Rescue (COR 125.3) 42 58 29 0 129
Liquidations 18 23 31 1 73
Business Rescue Set Aside 2 4 0 0 6
Active 132 252 302 86 772
CIPC Annual Report 2013/2014 11
Out of 1 338 Business Rescue notices filed by companies (the total number of Business Rescue notices filed excluding invalid filings and nullities), the bulk (848) were filed by private companies, followed by Close Corporations (CCs) (411), Public Companies (73), Non-profit companies (3), unknown category (2) and Incorporated companies (1).
Business Rescue Notices filed per Category of Entity per Calendar Year
BR notices filed 2011 2012 2013 2014 Total %
Public Companies 29 35 9 0 73 5%
Private Companies 206 299 282 91 848 63%
Incorporated Companies 0 0 0 1 1 0%
Non Profit Companies 0 3 0 0 3 0%
Close Corporations 69 162 148 32 411 31%
Unknown 1 1 0 0 2 0%
Total 305 500 439 94 1338 100%
1.4.2.3 Compliance and Enforcement
In 2013/2014, the CIPC received 521 complaints. 795 cases were investigated of which 456 were finalised. 339 were pending by the end of the year. The number of complaints received has decreased compared to 2012/2013. More cases were finalised compared to the previous year.
Investigations between May 2011 and March 2014
2011/2012 2012/2013 2013/2014
Cases brought forward 9 48 274Complaints received 102 583 521Total cases investigated 111 631 795Cases finalised (percent of total cases investigated) 63 (57%) 357 (57%) 456 (57%)Cases pending as at financial year-end 48 274 339Compliance notices issues 1 1 156Compliance certificates 0 1 0
During the period under review, the CIPC issued 156 compliance notices to companies for contraventions of Sections 28, 30 and 61(7) of the Companies Act, 2008. These sections relate to instances where companies did not keep accurate and complete accounting records, annual financial statements were not prepared within 6 months after the end of the financial years and annual general meetings of its shareholders were not held within 15 months after the date of the previous annual general meeting, or within an extended time allowed by the Companies Tribunal.
Auditor Conduct
The CIPC referred a matter relating to the conduct of an auditor to Independent Regulatory Board for Auditors (IRBA) for action as a result of an investigation. IRBA conducted a disciplinary hearing on 12 March 2014. The Disciplinary Committee found the auditor guilty on four charges of improper conduct and imposed the following sanction with respect to each of the four charges;
• A fine of R100 000, which is suspended until such time as the respondent is re-registered with the Board and shall be a condition for such re-registration.
• The respondent’s name and his firm’s name (Lochner & Associates) shall be removed from the register of registered auditors with effect from midnight on 31 March 2014.
• The respondent shall not apply for re-registration at any time before 31 March 2019, and shall not automatically be entitled to entry onto the register after that date.
• Upon any application for re-registration the respondent shall have to satisfy each and every requirement for re-registration which is then applicable.
• In addition, the respondent was ordered to make a contribution of R500 000 towards the IRBA’s legal costs.
In respect of publication, the Disciplinary Committee ordered the Board to publish in IRBA News, the respondent’s name, the name of the firm, the charges, the facts underlying the charges, the plea and the sanction imposed.
Companies and Intellectual Property Commission12
Unauthorized Director or Member Changes
During the period under review, the CIPC enforcement section investigated 15 cases of allegations of unauthorised director or member changes. The outcomes in these cases were either that the director / member statuses were reversed or it was determined that the changes were correctly made. In one matter adverse findings were made against both parties but the director statuses were not amended. Both parties were advised that they should try and work together and also that they can approach the CIPC for assistance for a possible consent order should they consider it appropriately. Regarding the referral of the test case in relation to the submission of false information to the NPA, it can be confirmed that the NPA has accepted the matter and is working on it.
Other Governance Failures
State-owned enterprises
On 10 February 2014, the CIPC issued a Compliance Notice to the Director and Group Chief Executive Officer (CEO) of Telkom SA State-owned company (SOC) Limited, Mr. SN Maseko. The Compliance Notice was in response to the CIPC concluding that Mr.Maseko granted an interest free loan to the CFO of Telkom Mr. J Schindehutte prior to the Board of Telkom passing the necessary financial assistance resolutions, in contravention of Sections 44 and 45 of the Companies Act 71 of 2008.
The Compliance Notice required Mr Maseko to do the following:
• Update the Commissioner of the CIPC on a monthly basis on the progress made in recovering the loan amount which totalled R 5 997 775, 43 from Mr. J Schindehutte.
• Attend corporate governance and a director duties course within 90 business days from the date of the Compliance Notice at his own expense.
• Inform the shareholders of Telkom of the contents of the Compliance Notice.
Telkom confirmed to the CIPC that the full amount of the loan had been recovered from Mr Schindehutte. Mr Maseko noted the directive to attend a corporate governance and director duties course and he indicated that he would make the necessary arrangements to attend such training within the stipulated time frame. Further a copy of the Compliance Notice was provided to the Independent Communications Authority of South Africa (ICASA), in line with Section 171(3) of the Companies Act No. 71 of 2008.
Home Owners Associations
A member of a Homeowners Association alleged that the Board of Directors is refusing him access to information that was discussed at Annual General Meetings. The complainant formally served a Form CoR 24, “Request for Access to Company Information” but did not receive the requested documents. Inspectors requested informally and formally information from the Homeowners Association. Their cooperation was not satisfactory. The Inspectors concluded that the Companies Act allows the complainant access to all the information requested; the Homeowners Association obtained legal advice but despite the legal advice decided not to provide the information, contrary to Section 26(1) read with Section 24(3) of the Companies Act; the ‘confidentiality claim’ was used to prevent the complainant from having access to the information. The CEO and the directors put their own protection before the interest of the Homeowners Association and their non-compliance with Section 26(1) read with Section 24(3) of the Companies Act will be captured in the register wherein non-compliance with notices are recorded for the purpose of possible prosecution and /or the imposition of administrative fines where non-compliance continues.
IP Enforcement
CIPC monitored ambush marketing during the African Cup of Nations tournament hosted in three cities from 11 January 2014 to 11 February 2014, Cape Town, Polokwane and Bloemfontein. All ambush marketing incidents were resolved amicably between the rights holder and the infringer. No criminal actions were pursued.
1.4.2.4 Education and Awareness
CIPC’s mandate includes education and awareness. This has become very critical in ensuring that the customers and the public in general are aware of the Companies Act, 2008 including CIPC’s role, as well as their responsibilities in terms of the Act. To broaden the impact of education and awareness CIPC worked closely with the dti by participating in events such as the After Care Project, Taking the dti to the people, and Launch of Informal Trader Upliftment Project.
WIPO Summer School
Following the successful Summer School in 2012 in Cape Town, the 2013 WIPO Summer School took place at the Nelson Mandela Metropolitan University (NMMU) in Port Elizabeth on 25 November – 06 December 2013. The Summer School is a partnership between CIPC, National Intellectual Property Management Office (NIPMO) and World IP Office (WIPO). The focus of the 2013 WIPO Summer School was on IP and Technology Transfer. A total of 50 local and international participants attended. One of the innovations in 2013 was the introduction of the IP education/orientation segment focusing on the high school students surrounding the host academic institution. More than 20 students, 4 teachers and about 3 officials of the Department of Education (DoE) participated.
CIPC Annual Report 2013/2014 13
Ms Karen Lee-Rata from WIPO Academy commended South Africa for hosting the event and indicated that the South African Summer School 2013 was now the second most popular WIPO Summer School in the world after the one hosted by WIPO Academy in Geneva. This is important to note as the numbers of participants were declining before CIPC involvement in the Summer School. It is not just the number of participants that increased but also the number of African participants in particular, which enhanced local IP development.
IP Wise
IP awareness is driven through the IP Wise programme and is intended to bring about a change in mind-set of targeted groups on how they can develop and protect their IP, as well as exploit the commercialization opportunities. To an extent there can be positive impact in the effective utilization of IP by South African innovators both in the public and private sector. Since the conception of this programme, successful IP Wise campaigns have been held to improve education and awareness to this sector, more than 6 sessions in various institutions and provinces have been held to date. These initiatives managed to reach a total of 200 researchers and research students at the Free State University, North West University, Wits University, Council for Scientific and Industrial Research, University of Limpopo and Nelson Mandela Metropolitan University. They were exposed to IP, its development, registration, ownership, protection, commercialization and licensing. A new programme is being developed for the new round of sessions.
CIPC in general continues to engage in several activities to create awareness with all stakeholders including the general public about the rights and responsibilities of IP; educating other law enforcement counterparts in customs and police departments; as well as promoting registration of films and visual recordings. CIPC participated and made presentations to on roles and responsibilities in terms of the Counterfeit Goods Act; South African Police Services (SAPS) during the Rustenburg Film Festival; the Polokwane Film Festival; the Formalization workshops by the dti in Cape Town; on World IP day (ongoing); as well as during a Joint Awareness Campaign on Conservation of Ideas.
1.4.2.5 Highlights for the Year
BRICS IP Offices
CIPC championed the establishment of the Brazil, Russia, India, China and South Africa Heads of Intellectual Property Offices (BRICS HIPO) in May 2013 leading to the adoption and signing of the BRICS IP Offices Cooperation Roadmap by all BRICS IP Offices. This is a very positive step in the implementation of the Trade and Investment Cooperation Agreement signed by the Trade Ministers on the 5th BRICS Summit in Durban earlier in 2013. Following the second meeting of the BRICS HIPO on 24 September 2013, the BRICS HIPOs participated in a joint panel discussion during the CIPC/NIPMO 2013 IP Conference (Durban, 17 – 20 November 2013) focusing on Creating and Leveraging IP in Developing Countries, as part of the implementation of the BRICS IP Offices Cooperation Roadmap. The focus of the discussion was on the initiatives that the BRICS IP Offices are embarking upon to support innovation. Implementation of the Cooperation Roadmap continued as chaired by the CIPC.
IP Conference on Creating and Leveraging IP in Developing Countries
In order to advocate the importance of IP protection and exploitation for economic development, CIPC and NIPMO cooperated on the 2013 IP Conference. The focus of the conference was on Creating and Leveraging IP in Developing Countries. The co-hosting of the conference with CIPC was to ensure an expanded impact since both organizations are major players in the IP space and have differentiated stakeholders. Whilst NIPMO’s focus is on publicly financed research and development (R&D) institutions, CIPC’s stakeholder base focuses on industry participants who all are key to innovation and its protection therefore attracting a broad pool of conference participants. The conference took place on 17 – 20 November 2013 in Durban, South Africa and was attended by about 250 delegates from South Africa, Africa and the developing world. The Minister of Trade and Industry, Dr Rob Davies,MP launched the IP Portal during the conference.
There were also exhibitions and pitching sessions led by the Innovation Hub and more than 20 companies exhibited. About four innovations won at the pitching sessions and each won an amount varying from R10 000.00 to R25 000.00. The conference was followed by the Boot camp on 21 and 22 of November 2013 which focused on IP management by entrepreneurs and small businesses. The response from the conference has been very positive, CIPC and NIPMO were commended by most participants for hosting such a conference. This contributed to the encouragement of innovation as well as IP based SMME’s.
Self-Service Centres and Terminals
An innovative service centre method was developed by CIPC during the period under review. The first Self-Service Terminals (SST) roll-out was at the Sunnypark Shopping Centre in January 2014. The initial services offered include customer registration, name reservation, company registration and filing of annual returns. The SST includes a finger print identity verification functionality directly linked to the Department of Home Affairs (DHA) which allows customers to use finger print technology to substitute signatures. The SSTs provide a cost-effective and speedy method to transact with CIPC. The organisation plans to extend the SSTs throughout the country and additional services will be explored such as address and director changes..
Companies and Intellectual Property Commission14
Integrated Bank Account Opening and Company Registration
The Minister of the dti launched the FNB-CIPC Collaboration Project on Monday, 19 August 2013. The essence of the project was an integrated bank account opening and company registration where Customers, are able to simultaneously open a corporate bank account with First National Bank (FNB) and register a company with CIPC through FNB online functionality at no additional charge than CIPC’s prescribed fees. This project gave effect to key strategic outcomes which is the ease of starting a business in South Africa (SA); reduction of red tape; improving service delivery; more accessibility to the broader public; as well as to improving integrity of the corporate register. This project is considered a world first where a public entity collaborated with a bank to provide an integrated account opening and company registration service. Subsequent phases of the project were identified; these include name reservations and annual return filing. CIPC continued to collaborate with FNB to innovate ways to improve CIPC services. The second phase of the project which include name reservations in the company registration-bank-account-opening integrated offering, scheduled for roll-out in May 2014. To date 3 200 companies have been registered through the FNB process since the project was implemented in June 2013.
CIPC is also engaging with other banks, including Standard Bank, Absa and Nedbank.
1.4.2.6 Challenges
As much as a lot of progress has been achieved during the period, CIPC continue to experience the following challenges:
• Call Centre – the new call centre model was implemented during the year under review but it couldn’t give the anticipated result. It was subsequently reviewed in quarter 2 leading to substantial improvement however this could not be sustained. This is again under review to see if it can’t be improved further.
• ICT and Legacy systems – CIPC has invested substantially of its ICT infrastructure leading to improvement in the stability. However applications need to upgraded to ensure sustained improvement of the customer experience. A new enterprise management system is being procured and will be implemented to improve the environment in the new year.
1.4.2.7 Conclusion
The CIPC will continue with its strategic journey over the period 2014 to 2019 to achieve the world class implementation of the objectives set out in the Companies Act, 2008, and to provide an enabling and facilitative environment for entrepreneurship, investment and innovation in the broader South African society. It is in line with the dti’s objective of ‘Ensuring an economy that benefits all.’
I would like to thank the Deputy Commissioner for his unwavering support and hard work to ensure the success of key projects for the CIPC. I would wish to acknowledge the critical role played by the senior and executive management of CIPC in ensuring the performance improvements and the successful transition of the CIPC. I would like to thank all CIPC staff for their hard work and commitment to service delivery. I also wish to acknowledge the key role played by representatives of organized labour in implementing a major change process within the CIPC. Without their wisdom and commitment to the broader organization, it would not have been possible. Lastly, I would like to thank the Minister for his leadership, guidance and support since the inception of the CIPC and throughout its journey.
Commissioner
Astrid Ludin
Date: 22 August 2014
CIPC Annual Report 2013/2014 15
1.5 Statement of Responsibility and Confirmation of the Accuracy of the Annual Report
To the best of my knowledge and belief, I confirm the following:
All information and amounts disclosed in the annual report is consistent with the annual financial statements audited by the Auditor General.
The annual report is complete, accurate and is free from any omissions.
The annual report has been prepared in accordance with the guidelines on the annual report as issued by National Treasury.
The Annual Financial Statements (Part E) have been prepared in accordance with the South African Statements of Generally Recognised Accounting Practice (GRAP) standards applicable to the public entity.
The accounting authority is responsible for the preparation of the annual financial statements and for the judgements made in this information.
The accounting authority is responsible for establishing, and implementing a system of internal control that has been designed to provide reasonable assurance as to the integrity and reliability of the performance information, the human resources information and the annual financial statements.
The external auditors are engaged to express an independent opinion on the annual financial statements.
In our opinion, the annual report fairly reflects the operations, the performance information, the human resources information and the financial affairs of the entity for the financial year ended 31 March 2014.
Yours faithfully
Commissioner
Astrid Ludin
Date: 22 August 2014
Companies and Intellectual Property Commission16
1.6 Strategic Overview
Vision
The vision of CIPC is to be the gateway to sustainable formal economic participation and investment for all in South Africa.
Mission
The mission of CIPC is to unlock value in businesses and intellectual property by:
• Providing easy, accessible and value-adding registration services for business entities, intellectual property rights holders and regulated practitioners;
• Maintaining and disclosing secure, accurate, credible and relevant information regarding business entities, business rescue practitioners, corporate conduct and reputation, intellectual property rights and indigenous cultural expression;
• Increasing awareness and knowledge of company and intellectual property laws, inclusive of the compliance obligations and opportunities for business entities and intellectual property rights holders to drive growth and sustainability, as well as the knowledge of the actual and potential impact of these laws in promoting the broader policy objectives of government;
• Taking the necessary steps to visibly, effectively and efficiently monitor and enforce compliance with the laws that CIPC administers.
CIPC values
Value What it meansPassion for service We work as one to seamlessly serve our Customers with passion, commitment and dedication.
Integrity We live out fairness, impartiality and respect in all of our actions as individuals and as an organisation.
Empowerment We recognize the value of our employees and partners and provide them with the discretion and tools to effectively deliver on their responsibilities.
Accountability We hold one another accountable for our commitments. We are responsible and responsive in the execution of our duties.
Collaboration We believe in the power of teams, teamwork and collaborative effort to deliver exceptional service and to execute our duties effectively.
CIPC Annual Report 2013/2014 17
1.7 Legislative and Other Mandates
The CIPC is a Schedule 3A Public Entity under the PFMA and administers all or parts of fifteen (15) pieces of legislation relating to corporate and intellectual property regulation. Its mandate encompasses companies, close corporations, co-operatives, trade marks, patents, designs, aspects of copyright legislation and enforcement of rules and regulations in most of these areas of law. CIPC’s primary institutional mandate is derived from the Companies Act, 2008, which establishes CIPC as a juristic person.
Legislation Mandate Sector
Companies Act, No 71 of 2008
Register companies, business rescue practitioners and corporate names, maintain data, regulate governance of and disclosure by companies, accredit dispute resolution agents; educate and inform about all laws; non-binding opinions; and circulars, policy and legislative advice
Economy-wide
Close Corporations Act, No 69 of 1984
Maintain data, regulate governance of and disclosure by close corporations Economy-wide
Co-operatives Act, No 14 of 2005
Register co-operatives, maintain data, regulate governance of and disclosure by co-operatives
Economy-wide
Co-operatives Amendment Act, No 6 of 2013
Amend the accounting practices and requirements for co-operatives by providing for audit and independent review of co-operatives
Establish the Co-operative Development Agency and the Tribunal
Economy-wide
Share Block Control Act, No 59 of 1980
Regulate conduct and disclosure by share block schemes Economy-wide
Consumer Protection Act, No 68 of 2008
Register business names Economy-wide
Trade Marks Act, No 194 of 1993
Register trade marks, maintain data, resolve disputes Economy-wide
Merchandise Marks Act, No 17 of 1941 (Unauthorized Use of State Emblems Act, No 37 of 1961)
Prevent and enforce the unauthorized use of state emblems Economy-wide
Patents Act, No 57 of 1978 Register patents, maintain data, publish patent journal, administer Court of Commissioner of Patents
Economy-wide
Designs Act, No 195 of 1993 Register designs, maintain data, resolve disputes Economy-wide
Copyright Act, No 98 of 1978 Provide non-binding advice to the public Creative industries
Registration of Cinematography Films Act, No 62 of 1977
Register films, maintain data Film industry
Performers Protection Act, No 11 of 1967
Accredit Collecting Societies; regulate their governance, conduct and disclosure Music industry
Intellectual Property Laws Amendment Act of 2013
Record and register Indigenous Knowledge (IK), administer the National Trust and Council for IK, accredit dispute resolution agencies
Creative industries
Counterfeit Goods Act, No 37 of 1997
Conduct and co-ordinate search and seizure operations, oversee depots Economy-wide
Companies and Intellectual Property Commission18
1.8 Organisational Structure
The CIPC obtained approval for its new organisational structure in July 2013. The structure was implemented from 1 September 2013.
Internal Audit
Governance, Risk and Compliance
Strategy
Innovation and Creativity Group
Business Intelligence and Systems Group
Business Regulation and Reputation
Group
Corporate Registers
Enforcement and Compliance
Education, Policy and Legal
Enterprise Information
Management and Assurance
ICT Service Delivery
ICT Strategy and Architecture
Facilities and Security
Client Engagement and Channel Management
Human Capital
Finance and Procurement
Corporate Services Group
Deputy Commissioner
Commissioner
Patents, Designs and Innovation
Creative Industries

CIPC Annual Report 2013/2014 19
PART B: Performance Information
“I’d rather invest in an entrepreneur who has failed before than one who assumes success from day one.”
Kevin O’Leary
Inside the first CIPC Self-Service Centre
Sunnypark, Pretoria
Companies and Intellectual Property Commission20
Part B: Performance Information2.1 Auditor-General’s Report: Predetermined Objectives
Refer to AG Report from pages 54 to 56 for material findings on predetermined objectives.
2.2 Situational Analysis
2.2.1 Service Delivery Environment
Since its establishment in 2011 CIPC has gone through rapid transformation in an effort to establish an institutional foundation that would improve service delivery and position it strategically to fulfil its mandate as per the Companies Act, No. 71 of 2008. While building a new organization, the process of driving the internal improvements had to continue to ensure that the organization continues to deliver hence the CIPC analogy of building a plane whilst in the air.
Challenges with the accuracy of data were identified. This led to an intervention of the team from Internal Audit, Strategy, Business and ICT which assisted in dealing with the challenges identified. It is our belief that we are now on the correct path to improved accuracy and better integrity of our performance information.
There has been a significant improvement in the reduction of the turnaround times in most services rendered. This is mainly due to the fact that there has been a better definition of processes, clarity of roles as well as a more stable ICT environment. The introduction of online services such as the company registration functionality, improved annual return system, and online IP applications contributed positively in the service delivery improvement. The SST’s provided a further impetus in assisting the SMMEs and customers in general. Customer identification has been further enhanced by this initiative whilst the essence of partnerships in government was taken to a new level.
Simplification of company registration through standardisation of the Memorandum of Incorporation (MOI) for private companies has resulted in increased company registrations. High volumes of MOI changes were received during the course of the year under review due to customers taking advantage of the simplified and quicker registration for a private company and opting to amend the MOI at a later period. Although this was a challenge the staff of CIPC was up to the task and continued to their best in lessening the delays that arose.
The de-registration of entities continue to be a challenge where there is non-compliance with the filing of annual returns. Understanding the impact of deregistration on the customers and the banks, CIPC partnered with the banks to ensure that clients are made aware in order to redress before final deregistration. This has proved to be one of the contributors to improving compliance to annual returnsin terms of the legislation.
The Collective Societies Regulations continue to pose a challenge in relation to the allocation of royalties as well as the acceptable formula for distribution thereof. CIPC continues to engage the Collective Societies in an effort to deal with the impasse.
2.2.2 Organisational Environment
The CIPC was established in May 2011 and has faced a number of challenges in its first three years of existence. In addition to the challenge of executing its functions as envisaged by the Companies Act, 2008, it has also had to deal with a legacy of poor, badly maintained ICT infrastructure, organisational stagnation, low employee morale and poor service delivery. The organisation has faced a dual strategic challenge, namely:
• A transactional challenge - to deliver a faster, more accurate, reliable and secure manner for the registration of companies and intellectual property rights, to safeguard the integrity of data and to enable responsive access to requests for information. This requires the re-engineering and integration of business processes, the IT enablement of workflows and information management, the training and development of competent people and the development of Customer-centric access, communication and service delivery channels; and
• A transformational challenge– to add greater value to entrepreneurs through enhanced products and services, a range of easily accessible channels as well as ongoing communication and engagement with segmented Customer communities. Furthermore, to positively impact good governance in South Africa, create a culture of voluntary compliance with legislation and to build the required capabilities to be able to deliver on the ‘new’ components of the CIPC mandate.
With the approval of a new, strategically aligned structure in the July 2013, the CIPC was able to begin implementing its broader new mandate. Concurrently, the organisational modernisation has progressed and has included the purchase and implementation of new ICT hardware and systems, the revision of policies and the design and implementation of new human resource systems. During the period under review, the CIPC underwent far-reaching change, not only in structure, but in the requirements of the roles and the ways of working. The organisation was able to contain the potential negative impact of such a disruption and has been able to continue to improve on the delivery of its mandate.
CIPC Annual Report 2013/2014 21
2.2.3 Key Policy Developments and Legislative Changes
The Intellectual Property Laws Amendment Bill was signed into law (IP Laws Amendment Act, No 28 of 2013) during the 3rd quarter of the year under review. This meant that CIPC has to speed up the preparations for the implementation thereof as well as contribute to the drafting of the relevant regulations. To date CIPC is part of the dti team drafting the regulations and is engaged with WIPO to ensure adequate readiness. This will continue in the next reporting period.
The Co-operatives Amendment Act, No.6 of 2013 was signed into law by the President of the Republic of South Africa during the period under review. Among others the purpose of the Act is as follows:-
• To provide for the categories of primary co-operatives.
• To provide for a single national apex co-operative,
• To provide for the annual submission of information to the registrar,
• To amend the accounting practices and requirements for co-operatives by providing for audit and independent review of co-operatives, as well as
• To establish co-operative Development Agency and the Tribunal.
Following the signing of the Act, the dti began a process of drafting the regulations to implement the Act. CIPC will be affected by the implementation of this Act and as such CIPC is actively involved in the drafting process. These regulations will be published in the Government Gazette as soon as they are ready for public comment.
CIPC is expected to play a significant role in the implementation of the Act and as such is implementing some interventions to ensure organisational readiness. Some of the current preparations include modifications and update to the current IT system, as well as training of staff on the amended sections of the Act. It is expected that this will unfold during the course of the next reporting period.
2.3 Strategic Outcome Oriented Goals
CIPC has identified three outcome oriented strategic goals that aim to give effect and substance to its strategy. These are: -
1. To improve the competitiveness of the South African economy by enhancing the reputation of South African businesses and the South African business environment;
2. To contribute to a knowledge-based economy and competitive local industries by promoting innovation, creativity and indigenous cultural expression and knowledge;
3. To promote broader formal economic participation by enhancing service delivery and extending the reach of CIPC.
2.4 Performance Information by Programme/Activity/Objective
2.4.1 Description of each Programme/Activity/Objective
Each outcome oriented strategic goal has strategic objectives and is linked to a programme.
Programme Strategic Outcome Oriented Goal Strategic objectives
Business Regulation and Reputation
To improve the competitiveness of the South African economy by enhancing the reputation of South African businesses and the South African business environment
1.1 To encourage the formalisation of South African businesses and their identity1.2 Encourage the maintenance of high standards of corporate governance, transparency and brand protection
Innovation and Creativity Promotion
To contribute to a knowledge-based economy and competitive local industries by promoting innovation, creativity and indigenous cultural expression and knowledge
2.1 To promote the protection and commercial exploitation of innovations in key sectors2.2 To protect our cultural heritage and support a strong competitive South African creative industry that provides benefit to local artists
Service Delivery and Access To promote broader formal economic participation by enhancing service delivery and extending the reach of CIPC
3.1 To provide easy access to credible, reliable and relevant information and advice and secure, value-added services3.2 Build an enabling and intelligent work environment anchored in a governed and sustainable organisation3.3 To improve the reputation and organisational performance of CIPC

Companies and Intellectual Property Commission22
PROGRAMME 1: BUSINESS REGULATION AND REPUTATION
The Business Regulation and Reputation programme purpose is to enhance the reputation of South African businesses and the South African business environment by ensuring that the registers of corporate entities, their managers and their identity have integrity and that a culture of corporate compliance and high standards of governance, disclosure and corporate reputation is established. Business Rescue continues to be an imperative intervention to ensure entities remain sustainable and in business. CIPC has an impact on resolving insolvency through the business rescue process.
The CIPC is required to monitor compliance with certain requirements of the legislation, such as the submission of annual returns, the rotation of auditors and disclosures in terms of the financial reporting standards and the requirements for prospectuses. Furthermore, the CIPC investigates complaints and enforces the provision of the Companies Act, the Close Corporations Act, the Share Block Companies Act and the Co-operatives Act relating to governance and disclosure. Although the CIPC is currently conducting investigations into complaints and is deregistering companies and close corporations that have not submitted annual returns, it plans to significantly expand on its compliance monitoring functions.
The programme also aims to provide policy and legal insight and advice on the co-ordination, implementation and impact of the respective laws. The function also entails continuously tracking international developments in the areas of corporate governance, disclosure, corporate registration and enforcement and trade marks. It also entails educating business owners and practitioners on compliance of the legislation.
PROGRAMME 2: INNOVATION AND CREATIVITY PROMOTION
The Innovation and Creativity Promotion programme purpose is to support the international intellectual property (IP) system and to promote local innovation and creativity by maintaining accurate and secure registries of patents, designs, film productions and recordals of indigenous cultural expressions and creative works, as well as by supervising and regulating the distribution of benefits of copyright and IK rights and protecting existing rights. The Innovation and Creativity Promotion Programme primarily encourages the uptake in the registering of patents, designs, film productions and recording indigenous cultural expressions and knowledge. The programme is also aims to provide policy and legal insight and advice on the co-ordination, implementation and impact of the respective laws.
This programme also oversees the accreditation of distribution agencies for the music industry and monitors the governance of the accredited institutions. In addition, the programme registers patent attorneys that have passed the Patent Board Examination and in future will also be responsible for the registration of intermediaries that transact on behalf of clients. As the intermediaries are primarily specialist lawyers, it is expected that the registration process will not involve intensive scrutiny.
The Programme is responsible for monitoring the unauthorised use of private and public intellectual property rights, with a particular focus on the protection of the intellectual property rights holders in the creative industries. These rights holders would also include communities that have registered rights in respect of indigenous cultural expressions and knowledge. The CIPC also sees an opportunity to promote local innovation and creativity by creating awareness of the opportunities that could flow from formalising rights through their registration, but also by making available information about opportunities and financing available for commercialisation.
PROGRAMME 3: SERVICE DELIVERY AND ACCESSThe purpose of the programme is to promote better access to and service delivery by CIPC by ensuring that our access channels are secure and easily accessible to all, that the institution has sufficient and appropriate organisational resources to deliver the best possible service and that operational excellence is established in all areas of the organisation. The emphasis of the CIPC business model is equally on the quality of the services it provides, the acceptable speed with which it delivers them and the value that its products, services and solutions generate for Customers. The CIPC’s business model focuses on the manner in which it deliver services, the quality of those services, the fees it will charge to be sustainable and the potential for value addition.
In order to deliver on its strategic mandate, CIPC has identified three key resources that it will need to build, develop and / or acquire: an informed, competent and engaged workforce; intelligent information technology systems and infrastructure; and strategic partners that assist the CIPC to deliver on its broader mandate in a mutually beneficial manner.
A large fraction of the CIPC’s services has been delivered through intermediaries - IP legal practitioners, company secretarial services, provincial small business development partners and other associated intermediaries. Customers chose to transact through intermediaries for the sake of convenience, but also because CIPC was difficult to access and navigate. CIPC focuses on improving its direct services to Customers through the implementation of a new business model which is based on a direct channel and partnership approach. This approach is aimed at meeting Customer needs through telephone services – where greater emphasis is placed on answering calls and resolving Customer queries, through Customer faxing or emailing documentation as well as Self-help terminals being rolled out.
The CIPC works with collaboration partners to increase access to its products, services and solutions through the development of indirect channels. These channels are managed in collaboration with identified service delivery partners. The partners are identified on the basis of the increased value that the combined services of the CIPC and its partners can deliver to its Customers. The key principles that inform the choice of service delivery partners is a combination of this enhanced value to entrepreneurs and inventors as well as the partners’ ability to contribute to the increased ease of doing business in South Africa. At all times, the selection of partners should not compromise CIPC’s operations or Customer service standards. Identity verification is a key required capability, so that the integrity of the CIPC’s information can be consistently relied upon at all times and through all channels.
In order to deliver the enhanced services required by its Customers and stakeholders, CIPC require competent, engaged employees who deliver high quality work at an acceptable speed of delivery. As a public sector regulatory agency rather than a business, the CIPC’s ultimate goal is not to be profitable but is rather focussed on a self-sustaining funding model that delivers sufficient revenue to cover the capital and operating costs of the services it delivers. Operational efficiencies are enhanced by intelligent, high performance Information Technology (IT) systems, which serve CIPC employees, CIPC Customers and their partners and registered intermediaries. Expenditure on its IT systems continues to be a consistent feature in its budget over the period of the strategic plan and into the future.
Given the importance and sensitivity of the information held by the CIPC and the impact of service delivery on the business sector, CIPC prioritises information integrity and security, disaster recovery and change management in all its efforts. It places significant emphasis on pro-actively managing the strategic risks that have been identified, while providing innovative and value-adding services.

CIPC Annual Report 2013/2014 23
An
nu
al P
erfo
rman
ce R
epo
rt2
.4.2
St
rate
gic
Ob
ject
ives
, Per
form
ance
In
dic
ato
rs, P
lan
ned
Tar
get
s an
d A
ctu
al A
chie
vem
ents
Out
com
e or
ient
ed s
trat
egic
goa
l 1: I
mpr
ove
the
com
petit
iven
ess
of th
e So
uth
Afr
ican
bus
ines
s en
viro
nmen
t
Stra
tegi
c O
bjec
tive
1.1:
Enc
oura
ge th
e fo
rmal
isat
ion
of S
outh
Afr
ican
bus
ines
ses
and
thei
r ide
ntit
y
Com
pani
es
For t
he y
ear,
2013
/201
4 (1
Apr
il 20
13–
31 M
arch
201
4), a
tota
l of 2
40 7
81 n
ew c
ompa
nies
wer
e re
gist
ered
of w
hich
81%
(194
759
) wer
e re
gist
ered
via
the
hybr
id o
n-lin
e sy
stem
at a
n av
erag
e tu
rnar
ound
tim
e of
1 w
orki
ng d
ay a
nd 1
9% (4
6 02
2) m
anua
l reg
istr
atio
ns a
t an
aver
age
turn
arou
nd ti
me
of 1
1 w
orki
ng d
ays.
92%
(42
500)
of t
he m
anua
l tra
nsac
tions
wer
e pr
oces
sed
with
in 2
5 w
orki
ng d
ays
and
98%
(1
91 1
38) o
f the
on-
line
hybr
id tr
ansa
ctio
ns w
ere
proc
esse
d w
ithin
3 w
orki
ng d
ays.
Co-o
pera
tives
For t
he y
ear 2
013/
2014
(1 A
pril
2013
– 3
1 M
arch
201
4), a
tota
l of 2
1 33
0 ne
w c
o-op
erat
ives
wer
e re
gist
ered
with
in a
n av
erag
e tu
rnar
ound
tim
e of
16
wor
king
day
s w
ith 9
2% (1
9 64
0) o
f the
co-
oper
ativ
es
regi
stra
tions
pro
cess
ed w
ithin
21
wor
king
day
s.
Trad
e m
arks
For t
he y
ear 2
013/
2014
(1 A
pril
2013
– 3
1 M
arch
201
4), a
tota
l of 3
5 94
0 ne
w tr
ade
mar
ks a
pplic
atio
ns w
ere
allo
cate
d an
offi
cial
app
licat
ion
num
ber a
t an
aver
age
turn
arou
nd ti
me
of 3
wor
king
day
s. 96
%
(34
613)
wer
e al
loca
ted
an o
ffici
al a
pplic
atio
n nu
mbe
r with
in th
e se
rvic
e de
liver
y st
anda
rd o
f 5 w
orki
ng d
ays.
Of t
he to
tal n
ew tr
adem
arks
app
licat
ions
, 17
692
(49%
) wer
e pr
oces
sed
elec
tron
ical
ly.
Stra
tegi
c O
bjec
tive
1.2:
Enc
oura
ge th
e m
aint
enan
ce o
f hig
h st
anda
rds
of c
orpo
rate
gov
erna
nce,
tran
spar
ency
and
bra
nd p
rote
ctio
n
Ann
ual R
etur
ns
Of t
he to
tal o
f 988
939
ent
ities
whi
ch w
ere
proj
ecte
d to
file
ann
ual r
etur
ns d
urin
g th
e pe
riod,
1 A
pril
2013
– 3
1 M
arch
201
4, o
nly
509
551
(52%
) com
plie
d.
This
is a
n im
prov
emen
t fro
m 3
5% d
urin
g th
e pe
riod,
1 A
pril
– 30
Sep
tem
ber 2
013.
Ava
ilabi
lity
and
accu
racy
of e
-mai
l and
cel
lula
r pho
ne c
onta
ct d
etai
ls fo
r com
pani
es, c
lose
cor
pora
tions
and
its
resp
ectiv
e di
rect
ors
or m
embe
rs m
ake
send
ing
rem
inde
rs d
ifficu
lt. T
he d
ereg
istr
atio
n no
tifica
tion
proc
ess
is a
lso
very
cos
tly a
nd n
ot s
o eff
ectiv
e in
enc
oura
ging
filin
g of
ann
ual r
etur
ns.
A n
umbe
r of i
nitia
tives
hav
e be
en s
tart
ed to
impr
ove
filin
g of
ann
ual r
etur
ns. A
wel
com
ing
lett
er w
as im
plem
ente
d fo
r new
com
pany
regi
stra
tions
(all
type
s ex
cept
for P
ublic
and
Sta
te O
wne
d co
mpa
nies
) du
ring
the
third
qua
rter
as
part
of t
he r
egis
trat
ion
cert
ifica
te t
hat
the
com
pany
rec
eive
upo
n re
gist
ratio
n. T
he w
elco
min
g le
tter
hig
hlig
hts
to t
he c
ompa
ny t
hat
ther
e ar
e ce
rtai
n m
atte
rs t
hat
it ne
eds
to c
ompl
y w
ith d
urin
g its
life
spa
n an
d co
ntin
ues
to li
st s
ome
of t
he m
ore
impo
rtan
t co
mpl
ianc
e ite
ms
with
a b
rief d
iscu
ssio
n as
to w
hat
each
ent
ails
. Th
ese
com
plia
nce
item
s lis
ted
are
annu
al re
turn
s, pr
epar
atio
n of
fina
ncia
l sta
tem
ents
, and
not
ifica
tion
to C
IPC
rega
rdin
g ad
dres
s an
d di
rect
orsh
ip c
hang
es.
A r
eque
st h
as b
een
mad
e to
the
Nat
iona
l Tre
asur
y (N
T) t
o in
clud
e pr
oof o
f ann
ual r
etur
n co
mpl
ianc
e as
par
t of
the
man
dato
ry d
ocum
enta
tion
subm
itted
by
pros
pect
ive
bidd
ers
durin
g th
e te
nder
ing
proc
ess
as p
art o
f gov
ernm
ent t
ende
r req
uire
men
ts.
A M
emor
andu
m o
f Und
erst
andi
ng (M
oU) h
as b
een
sign
ed b
etw
een
the
Nat
iona
l Lot
terie
s Bo
ard
(NLB
) and
CIP
C re
gard
ing
colla
bora
tion
on e
duca
tion
and
awar
enes
s, an
nual
retu
rns
and
data
sha
ring.
As
a fir
st st
ep, N
LB h
as u
nder
take
n to
com
mun
icat
e w
ith n
on-p
rofit
com
pani
es o
n its
dat
a ba
se re
gard
ing
thei
r dut
y to
com
ply
with
ann
ual r
etur
ns e
spec
ially
con
side
ring
that
abo
ut 2
0 00
0 no
n-pr
ofit c
ompa
nies
w
ere
refe
rred
for d
ereg
istr
atio
n du
e to
ann
ual r
etur
n no
n-co
mpl
ianc
e du
ring
Nov
embe
r 201
3.
Not
with
stan
ding
the
abov
e, C
IPC
has
con
tinue
d to
col
labo
rate
with
the
bank
s in
pro
vidi
ng th
e lis
ts o
f ent
ities
that
hav
e be
en re
ferr
ed fo
r der
egis
trat
ion.
The
ent
ities
that
wer
e re
ferr
ed fo
r der
egis
trat
ion
durin
g Ja
nuar
y 20
13 w
ill b
e fin
ally
der
egis
tere
d du
ring
the
four
th q
uart
er a
fter
the
lega
l not
ifica
tion
proc
ess
has
been
com
plet
ed.
Inve
stig
atio
ns
For 2
013/
2014
(1 A
pril
2013
– 3
1 M
arch
201
4), 4
56 c
ases
wer
e cl
osed
at a
n av
erag
e of
76
wor
king
day
s, of
whi
ch 6
0% (2
73) w
ere
proc
esse
d w
ithin
135
wor
king
day
s.
Companies and Intellectual Property Commission24
PRO
GRA
MM
E 1:
BU
SIN
ESS
REG
ULA
TIO
N A
ND
REP
UTA
TIO
N
Out
put
Mea
sure
/Indi
cato
rA
ctua
l ac
hiev
emen
t 20
12/2
013
Base
line
2012
/201
3Pl
anne
d Ta
rget
20
13/2
014
Act
ual
Ach
ieve
men
t 20
13/2
014
Dev
iatio
n fr
om p
lann
ed
targ
ets
to a
ctua
l ac
hiev
emen
t for
20
13/2
014
Reas
on fo
r Var
ianc
e
STRA
TEG
IC G
OA
L 1:
To
impr
ove
the
com
petit
iven
ess
of th
e So
uth
Afr
ican
eco
nom
y by
enh
anci
ng th
e re
puta
tion
of S
outh
Afr
ican
bus
ines
ses
and
the
Sout
h A
fric
an e
nviro
nmen
t
STRA
TEG
IC O
BJEC
TIVE
1.1
To
enco
urag
e th
e fo
rmal
isat
ion
of s
mal
l bus
ines
ses
and
thei
r ide
ntit
y
New
com
pani
es
regi
ster
ed m
anua
lly
with
in th
e pu
blis
hed
serv
ice
stan
dard
% o
f new
com
pani
es
regi
ster
ed m
anua
lly
with
in th
e pu
blis
hed
serv
ice
stan
dard
Not
repo
rted
95%
of n
ew
com
pani
es re
gist
ered
m
anua
lly w
ithin
25
wor
king
day
s
85%
of n
ew
com
pani
es re
gist
ered
m
anua
lly w
ithin
25
wor
king
day
s
92%
Act
ual
achi
evem
ent w
as
7% h
ighe
r tha
n th
e se
t tar
get.
Targ
et w
as s
et l
ower
to m
itiga
te th
e ris
ks
of c
halle
nges
suc
h as
sys
tem
slo
w re
spon
se
time
and
high
vol
umes
. The
se w
ere
wel
l man
aged
and
resu
lted
in im
prov
ed
perf
orm
ance
.
Com
pani
es
regi
ster
ed
elec
tron
ical
ly w
ithin
th
e pu
blis
hed
serv
ice
stan
dard
% o
f com
pani
es
regi
ster
ed
elec
tron
ical
ly w
ithin
th
e pu
blis
hed
serv
ice
stan
dard
Not
repo
rted
95%
of c
ompa
nies
re
gist
ered
el
ectr
onic
ally
with
in 3
w
orki
ng d
ays
85%
of c
ompa
nies
re
gist
ered
el
ectr
onic
ally
with
in 3
w
orki
ng d
ays
98%
Act
ual
achi
evem
ent w
as
13%
hig
her t
han
the
set t
arge
t.
Targ
et w
as s
et lo
wer
to m
itiga
te th
e ris
ks o
f ch
alle
nges
suc
h as
sys
tem
slo
w re
spon
se
time
and
high
vol
umes
. The
se w
ere
wel
l man
aged
and
resu
lted
in im
prov
ed
perf
orm
ance
.
Co-o
pera
tives
re
gist
ered
man
ually
w
ithin
the
publ
ishe
d se
rvic
e st
anda
rd
% o
f co-
oper
ativ
es
regi
ster
ed m
anua
lly
with
in th
e pu
blis
hed
serv
ice
stan
dard
Not
repo
rted
23%
of c
o-op
erat
ives
re
gist
ered
man
ually
w
ithin
21
wor
king
da
ys
85%
of c
o-op
erat
ives
re
gist
ered
man
ually
w
ithin
21
wor
king
da
ys
92%
Act
ual
achi
evem
ent w
as
7% h
ighe
r tha
n th
e se
t tar
get.
Targ
et w
as s
et lo
wer
to m
itiga
te th
e ris
ks o
f ch
alle
nges
suc
h as
sys
tem
slo
w re
spon
se
time
and
high
vol
umes
. The
se w
ere
wel
l man
aged
and
resu
lted
in im
prov
ed
perf
orm
ance
.
New
trad
e m
arks
ap
plic
atio
ns
allo
cate
d an
offi
cial
ap
plic
atio
n nu
mbe
r w
ithin
the
publ
ishe
d se
rvic
e st
anda
rd
% o
f new
trad
e m
arks
app
licat
ions
al
loca
ted
an o
ffici
al
appl
icat
ion
num
ber
with
in th
e pu
blis
hed
serv
ice
stan
dard
Not
repo
rted
90%
of n
ew tr
ade
mar
ks a
pplic
atio
ns
allo
cate
d an
offi
cial
ap
plic
atio
n nu
mbe
r w
ithin
5 w
orki
ng d
ays
85%
of n
ew tr
ade
mar
ks a
pplic
atio
ns
allo
cate
d an
offi
cial
ap
plic
atio
n nu
mbe
r w
ithin
5 w
orki
ng d
ays
96%
Act
ual
achi
evem
ent
was
11%
hig
her
than
the
set
targ
et.
Targ
et w
as s
et to
low
er to
miti
gate
the
risks
of
cha
lleng
es s
uch
as s
yste
m s
low
resp
onse
tim
e an
d hi
gh v
olum
es. T
hese
wer
e w
ell m
anag
ed a
nd re
sulte
d in
impr
oved
pe
rfor
man
ce. T
he in
trod
uctio
n of
e-fi
ling
also
mad
e a
posi
tive
cont
ribut
ion.
CIPC Annual Report 2013/2014 25
PRO
GRA
MM
E 1:
BU
SIN
ESS
REG
ULA
TIO
N A
ND
REP
UTA
TIO
N
Out
put
Mea
sure
/Indi
cato
rA
ctua
l ac
hiev
emen
t 20
12/2
013
Base
line
2012
/201
3Pl
anne
d Ta
rget
20
13/2
014
Act
ual
Ach
ieve
men
t 20
13/2
014
Dev
iatio
n fr
om p
lann
ed
targ
ets
to a
ctua
l ac
hiev
emen
t for
20
13/2
014
Reas
on fo
r Var
ianc
e
STRA
TEG
IC O
BJEC
TIVE
1.2
To
enco
urag
e th
e m
aint
enan
ce o
f hig
h st
anda
rds
of c
orpo
rate
gov
erna
nce,
tran
spar
ency
and
bra
nd p
rote
ctio
n
Com
pani
es th
at h
ave
com
plie
d w
ith th
e fil
ing
of a
nnua
l ret
urns
as
pre
scrib
ed
% o
f com
pani
es th
at
have
com
plie
d w
ith
the
filin
g of
ann
ual
retu
rns
as p
resc
ribed
Not
repo
rted
70%
75%
52%
Act
ual
achi
evem
ent w
as
23%
low
er th
an th
e se
t tar
get.
Ava
ilabi
lity
and
accu
racy
of e
-mai
l and
ce
ll ph
one
cont
act d
etai
ls fo
r com
pani
es
and
clos
e co
rpor
atio
ns a
nd it
s re
spec
tive
dire
ctor
s or
mem
bers
mak
es s
endi
ng
rem
inde
rs d
ifficu
lt.
The
dere
gist
ratio
n no
tifica
tion
proc
ess
is a
lso
very
cos
tly a
nd n
ot s
o eff
ectiv
e.
Inve
stig
atio
ns
com
plet
ed w
ithin
th
e pu
blis
hed
serv
ice
stan
dard
% o
f inv
estig
atio
ns
com
plet
ed w
ithin
th
e pu
blis
hed
serv
ice
stan
dard
Not
repo
rted
33%
of i
nves
tigat
ions
co
mpl
eted
with
in 1
35
wor
king
day
s
85%
of i
nves
tigat
ions
co
mpl
eted
with
in 1
35
wor
king
day
s60
%
Act
ual
achi
evem
ent w
as
25%
low
er th
an th
e se
t tar
get.
Due
to th
e fa
ct th
at in
vest
igat
ions
of m
ost o
f th
ese
case
s ar
e de
pend
ent o
n is
sues
out
side
th
e co
ntro
l of t
he C
IPC
inve
stig
ator
s, m
ost
case
s ta
ke lo
ng to
fina
lise.
Companies and Intellectual Property Commission26
Out
com
e or
ient
ed s
trat
egic
goa
l 2: T
o pr
omot
e in
nova
tion,
cre
ativ
ity
and
indi
geno
us c
ultu
ral e
xpre
ssio
n
Stra
tegi
c O
bjec
tive
2.1:
Pro
mot
e th
e pr
otec
tion
and
com
mer
cial
exp
loita
tion
of in
nova
tions
in k
ey s
ecto
rs
Pate
nts
For 2
013/
2014
(1 A
pril
2013
– 3
1 M
arch
201
4), 9
639
new
pat
ent a
pplic
atio
ns w
ere
allo
cate
d an
offi
cial
app
licat
ion
num
ber a
t an
aver
age
of 3
wor
king
day
s of
whi
ch 9
8% (9
402
) wer
e al
loca
ted
an o
ffici
al
appl
icat
ion
num
ber w
ithin
the
serv
ice
deliv
ery
stan
dard
of 5
wor
king
day
s. O
f the
tota
l new
pat
ents
app
licat
ions
, 9%
(895
) wer
e pr
oces
sed
elec
tron
ical
ly.
Des
igns
For t
he y
ear t
o da
te (1
Apr
il 20
13 –
31
Mar
ch 2
014)
1 8
59 n
ew d
esig
n ap
plic
atio
ns w
ere
allo
cate
d an
offi
cial
app
licat
ion
num
ber a
t an
aver
age
of 3
wor
king
day
s of w
hich
97%
(1 8
11) w
ere
allo
cate
d an
offi
cial
ap
plic
atio
n nu
mbe
r with
in th
e se
rvic
e de
liver
y st
anda
rd o
f 5 w
orki
ng d
ays.
Of t
he to
tal n
ew d
esig
ns a
pplic
atio
ns, 8
% (1
48) w
ere
proc
esse
d el
ectr
onic
ally
.
2.2
To p
rote
ct o
ur c
ultu
ral h
erita
ge a
nd s
uppo
rt a
str
ong
com
petit
ive
Sout
h A
fric
an c
reat
ive
indu
stry
that
pro
vide
s be
nefit
to lo
cal a
rtis
ts
Copy
righ
t in
film
For t
he y
ear 2
013/
2014
(1 A
pril
2013
– 3
1 M
arch
201
3), 6
9 co
pyrig
hts
in fi
lm a
pplic
atio
ns w
ere
allo
cate
d an
offi
cial
app
licat
ion
num
ber a
t an
aver
age
of 4
wor
king
day
s of
whi
ch 5
7% (3
9) w
ere
allo
cate
d an
offi
cial
app
licat
ion
num
ber w
ithin
the
serv
ice
deliv
ery
stan
dard
of 2
wor
king
day
s. O
f the
tota
l new
cop
yrig
ht in
film
app
licat
ions
, 14%
(10)
wer
e pr
oces
sed
elec
tron
ical
ly.
The
intr
oduc
tion
of e
-filin
g re
sulte
d in
sys
tem
err
ors
that
resu
lted
in d
elay
s in
pro
cess
ing
of tr
ansa
ctin
g co
pyrig
ht in
film
app
licat
ions
dur
ing
quar
ter 3
and
4.
PRO
GRA
MM
E 2:
INN
OVA
TIO
N a
nd C
REAT
IVIT
Y PR
OM
OTI
ON
Out
put
Mea
sure
/Indi
cato
rA
ctua
l ac
hiev
emen
t 20
12/2
013
Base
line
2012
/201
3Pl
anne
d Ta
rget
20
13/2
014
Act
ual
2013
/201
4
Dev
iatio
n fr
om
plan
ned
targ
ets
to
actu
al a
chie
vem
ent
for 2
013/
2014
Reas
on fo
r Var
ianc
e
STRA
TEG
IC G
OA
L 2:
To c
ontr
ibut
e to
a k
now
ledg
e-ba
sed
econ
omy
and
com
petit
ive
loca
l ind
ustr
ies
by p
rom
otin
g in
nova
tion,
cre
ativ
ity
and
indi
geno
us c
ultu
ral e
xpre
ssio
n an
d kn
owle
dge
STRA
TEG
IC O
BJEC
TIVE
2.1
: To
prom
ote
the
prot
ectio
n an
d co
mm
erci
al e
xplo
itatio
n of
inno
vatio
ns in
key
sec
tors
New
pat
ent a
pplic
atio
ns
allo
cate
d an
offi
cial
app
licat
ion
num
ber w
ithin
the
publ
ishe
d se
rvic
e st
anda
rd
% o
f new
pat
ent a
pplic
atio
ns
allo
cate
d an
offi
cial
app
licat
ion
num
ber w
ithin
the
publ
ishe
d se
rvic
e st
anda
rd
Not
repo
rted
87%
of n
ew p
aten
t ap
plic
atio
ns a
lloca
ted
an
offici
al a
pplic
atio
n nu
mbe
r w
ithin
5 w
orki
ng d
ays
85%
of n
ew p
aten
t ap
plic
atio
ns a
lloca
ted
an
offici
al a
pplic
atio
n nu
mbe
r w
ithin
5 w
orki
ng d
ays
98%
Act
ual a
chie
vem
ent w
as
12%
hig
her t
han
the
set
targ
et.
The
intr
oduc
tion
of e
-filin
g an
d ris
k m
itiga
tion
of
chal
leng
es s
uch
as s
yste
m
slow
resp
onse
tim
e an
d hi
gh
volu
mes
resu
lted
in im
prov
ed
perf
orm
ance
.
New
des
ign
appl
icat
ions
al
loca
ted
an o
ffici
al a
pplic
atio
n nu
mbe
r with
in th
e pu
blis
hed
serv
ice
stan
dard
% o
f new
des
ign
appl
icat
ions
al
loca
ted
an o
ffici
al a
pplic
atio
n nu
mbe
r with
in th
e pu
blis
hed
serv
ice
stan
dard
Not
repo
rted
98%
of n
ew d
esig
n ap
plic
atio
ns a
lloca
ted
an
offici
al a
pplic
atio
n nu
mbe
r w
ithin
5 w
orki
ng d
ays
85%
of n
ew d
esig
n ap
plic
atio
ns a
lloca
ted
an
offici
al a
pplic
atio
n nu
mbe
r w
ithin
5 w
orki
ng d
ays
97%
Act
ual a
chie
vem
ent w
as
12%
hig
her t
han
the
set
targ
et.
The
intr
oduc
tion
of e
-filin
g an
d ris
k m
itiga
tion
of
chal
leng
es s
uch
as s
yste
m
slow
resp
onse
tim
e an
d hi
gh
volu
mes
resu
lted
in im
prov
ed
perf
orm
ance
.
STRA
TEG
IC O
BJEC
TIVE
2.2
: To
prot
ect o
ur c
ultu
ral h
erita
ge a
nd s
uppo
rt a
str
ong
com
petit
ive
Sout
h A
fric
an c
reat
ive
indu
stry
that
pro
vide
s be
nefit
to lo
cal a
rtis
ts
New
cop
yrig
ht in
film
ap
plic
atio
ns a
lloca
ted
an o
ffici
al
appl
icat
ion
num
ber w
ithin
the
publ
ishe
d se
rvic
e st
anda
rd
% o
f cop
yrig
ht in
film
ap
plic
atio
ns a
lloca
ted
an o
ffici
al
appl
icat
ion
num
ber w
ithin
the
publ
ishe
d se
rvic
e st
anda
rd
Not
repo
rted
64%
of c
opyr
ight
in fi
lm
appl
icat
ions
allo
cate
d an
offi
cial
app
licat
ion
num
ber
with
in 2
wor
king
day
s
85%
of c
opyr
ight
in fi
lm
appl
icat
ions
allo
cate
d an
offi
cial
app
licat
ion
num
ber
with
in 2
wor
king
day
s
57%
Act
ual a
chie
vem
ent w
as
28%
low
er th
an th
e se
t ta
rget
.
The
intr
oduc
tion
of e
-filin
g re
sulte
d in
sys
tem
cha
lleng
es
that
resu
lted
in d
elay
s in
pr
oces
sing
app
licat
ions
.
CIPC Annual Report 2013/2014 27
Out
com
e or
ient
ed s
trat
egic
goa
l 3: T
o pr
omot
e br
oade
r for
mal
eco
nom
ic p
artic
ipat
ion
Stra
tegi
c O
bjec
tive
3.1:
Pro
vide
eas
y ac
cess
to c
redi
ble,
relia
ble
and
rele
vant
info
rmat
ion
and
advi
ce a
nd s
ecur
e, v
alue
-add
ed s
ervi
ces
Web
site
ava
ilabi
lity
For t
he y
ear 2
013/
14 (1
Apr
il 20
13 –
31
Mar
ch 2
014)
, the
web
site
ava
ilabi
lity
was
an
aver
age
of 9
2%.
Calls
ans
wer
ed
For t
he y
ear 2
013/
14 (1
Apr
il 20
13 –
31
Mar
ch 2
014)
, the
per
cent
age
of c
alls
ans
wer
ed th
at c
ome
thro
ugh
the
call
cent
re n
umbe
r was
31%
.
Alth
ough
the
impl
emen
tatio
n of
a n
ew c
all a
nsw
er m
odel
resu
lted
in im
prov
ed p
erfo
rman
ce fr
om 3
0% in
Qua
rter
1 to
42%
in Q
uart
er 3
, cha
lleng
es s
uch
as p
rovi
ding
sys
tem
acc
ess
and
othe
r log
istic
s fo
r th
e ne
w v
olun
teer
recr
uits
reve
rsed
thes
e im
prov
emen
ts.
Stra
tegi
c O
bjec
tive
3.2:
Bui
ld a
n en
ablin
g an
d in
telli
gent
wor
k en
viro
nmen
t anc
hore
d in
a g
over
ned
and
sust
aina
ble
orga
niza
tion
Expe
nditu
re a
gain
st re
venu
e
100%
of o
pera
tiona
l exp
ense
s w
ere
cove
red
by o
pera
ting
reve
nue
in a
ll fo
ur q
uart
ers.
PRO
GRA
MM
E 3:
SER
VICE
DEL
IVER
Y A
ND
ACC
ESS
Out
put
Mea
sure
/Indi
cato
rA
ctua
l ac
hiev
emen
t 20
12/2
013
Base
line
2012
/201
3Pl
anne
d Ta
rget
20
13/2
014
Act
ual
Ach
ieve
men
t 20
13/2
014
Dev
iatio
n fr
om
plan
ned
targ
ets
to
actu
al a
chie
vem
ent
for 2
013/
2014
Reas
on fo
r Var
ianc
e
STRA
TEG
IC G
OA
L 3:
To
prom
ote
broa
der e
cono
mic
par
ticip
atio
n
STRA
TEG
IC O
BJEC
TIVE
3.1
: To
prom
ote
broa
der f
orm
al e
cono
mic
par
ticip
atio
n by
enh
anci
ng s
ervi
ce d
eliv
ery
and
exte
ndin
g th
e re
ach
of C
IPC
Web
site
ava
ilabi
lity
for
on-li
ne fi
lings
24/
7%
web
site
ava
ilabi
lity
for
on-li
ne fi
lings
24/
7N
ot re
port
edN
ot m
easu
red
90%
92%
Act
ual a
chie
vem
ent w
as
2% h
ighe
r tha
n th
e se
t ta
rget
.
Seve
ral I
CT
stab
ilisa
tion
initi
ativ
es re
sulte
d in
impr
oved
pe
rfor
man
ce.
Calls
ans
wer
ed d
urin
g th
e re
port
ing
perio
d
% o
f cal
ls a
nsw
ered
du
ring
the
repo
rtin
g pe
riod
Not
repo
rted
28%
50%
31%
Act
ual a
chie
vem
ent w
as
19%
low
er th
an th
e se
t ta
rget
.
Alth
ough
the
impl
emen
tatio
n of
the
Swed
ish
Mod
el
resu
lted
in im
prov
ed p
erfo
rman
ce fr
om a
30%
in
Qua
rter
1 to
42%
in Q
uart
er 3
, a n
umbe
r of f
acto
rs
cont
ribut
ed to
a d
eclin
e in
cal
l tak
ing
from
Dec
embe
r to
the
end
of th
e fin
anci
al y
ear.
Thes
e in
clud
ed
oper
atio
nal w
ork
pres
sure
, the
impa
ct o
n pr
oces
sing
ta
rget
s an
d th
e ab
ility
of s
taff
to d
eal w
ith d
ifficu
lt cu
stom
ers.
In a
dditi
on, i
t see
ms
that
sta
ff w
ere
disc
oura
ged
to ta
ke c
alls
by
one
of th
e re
pres
enta
tive
trad
e un
ions
STRA
TEG
IC O
BJEC
TIVE
3.2
: To
build
an
enab
ling
and
inte
llige
nt w
ork
envi
ronm
ent a
ncho
red
in a
gov
erne
d an
d su
stai
nabl
e or
gani
satio
n
Ope
ratin
g ex
pend
iture
co
vere
d by
ope
ratin
g re
venu
e ye
ar to
dat
e (Y
TD)
% o
f ope
ratin
g ex
pend
iture
cov
ered
by
oper
atin
g re
venu
e ye
ar
to d
ate
(YTD
)
140%
124%
100%
100%
The
targ
et w
as a
chie
ved
as s
et.
N/A

Companies and Intellectual Property Commission28
2.4
.3
Stra
teg
y to
ove
rco
me
area
s o
f u
nd
er p
erfo
rman
ce*
The
CIP
C h
as a
chie
ved
and
exce
eded
its t
arge
ts in
mos
t are
as, w
ith th
e ex
cept
ion
of th
e pe
rcen
tage
of c
alls
ans
wer
ed, t
he p
erce
ntag
e of
app
licat
ions
for c
opyr
ight
in fi
lms p
roce
ssed
with
in th
e se
rvic
e de
liver
y st
anda
rds,
annu
al re
turn
com
plia
nce
and
the
perc
enta
ge o
f inv
estig
atio
ns c
ompl
eted
with
in t
he s
ervi
ce d
eliv
ery
stan
dard
s. Th
e Co
pyrig
ht in
Film
s ta
rget
s w
ere
not
met
due
to
tech
nica
l pro
gram
min
g ch
alle
nges
exp
erie
nced
with
the
roll-
out o
f e-fi
ling
and
this
has
sin
ce b
een
addr
esse
d. W
ith re
gard
to th
e A
nnua
l Ret
urn
targ
et n
ot m
et, i
t was
real
ised
that
the
targ
et w
as s
et u
nrea
listic
ally
hig
h gi
ven
the
low
com
plia
nce
base
line
and
as s
uch
the
targ
et w
ill b
e re
vise
d to
set
a m
ore
real
istic
targ
et. F
urth
er C
IPC
will
be
impl
emen
ting
mon
thly
der
egis
trat
ion
to e
nsur
e th
at c
ompl
ianc
e w
ith th
e an
nual
retu
rns
legi
slat
ion
is a
dher
ed to
. CIP
C w
ill a
lso
be g
ivin
g th
e en
titie
s an
opp
ortu
nity
to u
pdat
e th
eir c
onta
ct d
etai
ls to
ens
ure
impr
oved
com
mun
icat
ion
and
bett
er c
ompl
ianc
e. A
med
ia c
ampa
ign
on v
ario
us is
sues
in
clud
ing
annu
al re
turn
s du
ring
the
next
repo
rtin
g pe
riod
will
be
impl
emen
ted.
In re
latio
n to
inve
stig
atio
ns t
arge
ts n
ot m
et, t
he c
ases
wer
e no
t ca
tego
rised
with
due
con
side
ratio
n of
the
ir co
mpl
exity
and
impa
cted
on
the
achi
evem
ent
of t
he s
et t
arge
ts. T
he c
ateg
oris
atio
n of
cas
es
will
be
furt
her e
xplo
red
to e
nsur
e th
at c
ases
are
cat
egor
ised
, inv
estig
ated
and
repo
rted
on
acco
rdin
g to
thei
r com
plex
ity. F
urth
erm
ore,
a n
umbe
r of e
xter
nal d
epen
denc
ies
exis
t, as
inve
stig
atio
ns a
re o
ften
ha
mpe
red
by s
low
resp
onse
s fro
m b
oth
com
plai
nant
s an
d re
spon
dent
s.
Fina
lly th
e ca
ll an
swer
rate
rem
ains
a c
halle
nge,
but
the
mod
el im
plem
ente
d ha
s al
read
y be
en re
view
ed to
war
ds th
e en
d of
the
4th q
uart
er o
f the
yea
r in
ques
tion.
Man
agem
ent w
ill c
ontin
ue to
mon
itor
prog
ress
with
the
impl
emen
tatio
n an
d en
gage
the
rele
vant
sta
keho
lder
s w
here
nec
essa
ry.
2.4
.4
Ch
ang
es t
o p
lan
ned
tar
get
s*
In M
arch
201
3, C
IPC
tabl
ed it
s St
rate
gic
Plan
for 2
013/
14 –
201
7/18
and
the
Ann
ual P
erfo
rman
ce P
lan
(APP
) for
201
3/14
– 2
015/
16. H
owev
er, t
he A
udito
r-G
ener
al’s
(AG
) find
ings
on
the
2012
/201
3 A
nnua
l Re
port
Per
form
ance
Info
rmat
ion;
the
subs
eque
nt M
inis
ter’s
lett
er ra
isin
g co
ncer
n ov
er th
ese
findi
ngs;
sim
ilar c
once
rns
by th
e C
IPC
Aud
it Co
mm
ittee
; as
wel
l as
our i
nter
nal a
udit
findi
ngs
on p
erfo
rman
ce
info
rmat
ion,
nec
essi
tate
d th
e C
IPC
to re
view
its
curr
ent A
PP (2
013/
2014
– 2
016/
2017
) and
Bus
ines
s Pl
an (B
P) (2
013/
14).
The
purp
ose
of re
view
ing
the
APP
and
BP
was
to e
nsur
e th
at th
e pe
rfor
man
ce m
easu
res
or in
dica
tors
mee
t the
SM
ART
crit
eria
(spe
cific
, mea
sura
ble,
att
aina
ble,
real
istic
and
tim
e bo
und)
and
the
othe
r set
cr
iteria
of b
eing
relia
ble,
ver
ifiab
le, w
ell d
efine
d, re
leva
nt, c
ost e
ffect
ive
and
appr
opria
te. T
he fo
llow
ing
chan
ges
wer
e ap
prov
ed b
y th
e M
inis
ter o
f the
dti
, Dr R
ob D
avie
s, M
P.
CIPC Annual Report 2013/2014 29
Chan
ges
in p
lann
ed ta
rget
s
OLD
REVI
EWED
Out
put
Perf
orm
ance
M
easu
re
or In
dica
tor
Base
line
Ann
ual T
arge
tO
utpu
tPe
rfor
man
ce
Mea
sure
or
Indi
cato
rBa
selin
e A
nnua
l Tar
get
Com
pani
es re
gist
ered
m
anua
lly w
ithin
the
publ
ishe
d se
rvic
e st
anda
rd
% o
f com
pani
es
regi
ster
ed m
anua
lly
with
in th
e pu
blis
hed
serv
ice
stan
dard
95%
85%
of c
ompa
nies
re
gist
ered
man
ually
w
ithin
25
wor
king
day
s
New
com
pani
es
regi
ster
ed m
anua
lly
with
in th
e pu
blis
hed
serv
ice
stan
dard
% o
f new
com
pani
es
regi
ster
ed m
anua
lly
with
in th
e pu
blis
hed
serv
ice
stan
dard
95%
85%
of n
ew c
ompa
nies
re
gist
ered
man
ually
with
in 2
5 w
orki
ng d
ays
from
the
date
of
trac
king
Com
pani
es re
gist
ered
el
ectr
onic
ally
with
in
the
publ
ishe
d se
rvic
e st
anda
rd
% o
f com
pani
es
regi
ster
ed e
lect
roni
cally
w
ithin
the
publ
ishe
d se
rvic
e st
anda
rd
95%
85%
com
pani
es
regi
ster
ed e
lect
roni
cally
w
ithin
3 w
orki
ng d
ays
New
com
pani
es
regi
ster
ed e
lect
roni
cally
w
ithin
the
publ
ishe
d se
rvic
e st
anda
rd
% o
f new
com
pani
es
regi
ster
ed e
lect
roni
cally
w
ithin
the
publ
ishe
d se
rvic
e st
anda
rd
95%
85%
of n
ew c
ompa
nies
re
gist
ered
ele
ctro
nica
lly w
ithin
3
wor
king
day
s fro
m re
ceip
t of
supp
ortin
g do
cum
enta
tion
Co-o
pera
tives
regi
ster
ed
with
in th
e pu
blis
hed
serv
ice
stan
dard
% o
f co-
oper
ativ
es
regi
ster
ed w
ithin
the
publ
ishe
d se
rvic
e st
anda
rd
23%
85%
of c
o-op
erat
ives
re
gist
ered
with
in 2
1 w
orki
ng d
ays
Co-o
pera
tives
regi
ster
ed
man
ually
with
in th
e pu
blis
hed
serv
ice
stan
dard
% o
f co-
oper
ativ
es
regi
ster
ed m
anua
lly
with
in th
e pu
blis
hed
serv
ice
stan
dard
23%
85%
of c
o-op
erat
ives
re
gist
ered
man
ually
with
in 2
1 w
orki
ng d
ays
from
the
date
of
trac
king
Trad
e m
arks
app
licat
ions
pr
oces
sed
with
in th
e pu
blis
hed
serv
ice
stan
dard
% o
f tra
de m
arks
ap
plic
atio
ns p
roce
ssed
w
ithin
the
publ
ishe
d se
rvic
e st
anda
rd
90%
85%
of t
rade
mar
ks
appl
icat
ions
pro
cess
ed
with
in 5
wor
king
day
s
New
trad
e m
arks
ap
plic
atio
ns a
lloca
ted
an o
ffici
al a
pplic
atio
n nu
mbe
r w
ithin
the
publ
ishe
d se
rvic
e st
anda
rd
% o
f new
trad
e m
arks
ap
plic
atio
ns a
lloca
ted
an o
ffici
al a
pplic
atio
n nu
mbe
r w
ithin
the
publ
ishe
d se
rvic
e st
anda
rd
90%
85%
of n
ew tr
ade
mar
ks
appl
icat
ions
allo
cate
d an
offi
cial
app
licat
ion
num
ber
with
in 5
wor
king
day
s of
ha
ving
rece
ived
app
licat
ions
Ann
ual r
etur
n co
mpl
ianc
eA
nnua
l ret
urn
com
plia
nce
rate
70%
75
%Co
mpa
nies
that
hav
e co
mpl
ied
with
the
filin
g of
ann
ual r
etur
ns a
s pr
escr
ibed
% o
f com
pani
es th
at
have
com
plie
d w
ith th
e fil
ing
of a
nnua
l ret
urns
as
pres
crib
ed
70%
75
%of
com
pani
es th
at h
ave
com
plie
d w
ith th
e fil
ing
of
annu
al re
turn
s as
pre
scrib
ed
at th
e en
d of
the
repo
rtin
g pe
riod
Pate
nt a
pplic
atio
ns
proc
esse
d w
ithin
the
publ
ishe
d se
rvic
e st
anda
rd
% o
f pat
ent a
pplic
atio
ns
proc
esse
d w
ithin
the
publ
ishe
d se
rvic
e st
anda
rd
87%
85%
of p
aten
t ap
plic
atio
ns p
roce
ssed
w
ithin
5 w
orki
ng d
ays
New
pat
ent a
pplic
atio
ns
allo
cate
d an
app
licat
ion
num
ber w
ithin
the
publ
ishe
d se
rvic
e st
anda
rd
% o
f new
pat
ent
appl
icat
ions
allo
cate
d an
app
licat
ion
num
ber
with
in th
e pu
blis
hed
serv
ice
stan
dard
87%
85%
of n
ew p
aten
t ap
plic
atio
ns a
lloca
ted
an
appl
icat
ion
num
ber w
ithin
5
wor
king
day
s of
hav
ing
rece
ived
the
appl
icat
ion
Des
ign
appl
icat
ions
pr
oces
sed
with
in th
e pu
blis
hed
serv
ice
stan
dard
% o
f des
ign
appl
icat
ions
pr
oces
sed
with
in th
e pu
blis
hed
serv
ice
stan
dard
98%
85%
of d
esig
n ap
plic
atio
ns p
roce
ssed
w
ithin
5 w
orki
ng d
ays
New
des
ign
appl
icat
ions
al
loca
ted
an a
pplic
atio
n nu
mbe
r with
in th
e pu
blis
hed
serv
ice
stan
dard
% o
f new
des
ign
appl
icat
ions
allo
cate
d an
app
licat
ion
num
ber
with
in th
e pu
blis
hed
serv
ice
stan
dard
98%
85%
of n
ew d
esig
n ap
plic
atio
ns a
lloca
ted
an
appl
icat
ion
num
ber w
ithin
5
wor
king
day
s of
hav
ing
rece
ived
the
appl
icat
ion
Copy
right
in fi
lm
appl
icat
ions
pro
cess
ed
with
in th
e pu
blis
hed
serv
ice
stan
dard
% o
f cop
yrig
ht in
film
ap
plic
atio
ns p
roce
ssed
w
ithin
the
publ
ishe
d se
rvic
e st
anda
rd
64%
85%
of c
opyr
ight
in fi
lm
appl
icat
ions
pro
cess
ed
with
in 2
wor
king
day
s
New
cop
yrig
ht in
film
ap
plic
atio
ns a
lloca
ted
an a
pplic
atio
n nu
mbe
r w
ithin
the
publ
ishe
d se
rvic
e st
anda
rd
% o
f new
cop
yrig
ht in
fil
m a
pplic
atio
ns a
lloca
ted
an a
pplic
atio
n nu
mbe
r w
ithin
the
publ
ishe
d se
rvic
e st
anda
rd
64%
85%
of n
ew c
opyr
ight
in fi
lm
appl
icat
ions
allo
cate
d an
ap
plic
atio
n nu
mbe
r with
in
2 w
orki
ng d
ays
of h
avin
g re
ceiv
ed th
e ap
plic
atio
n
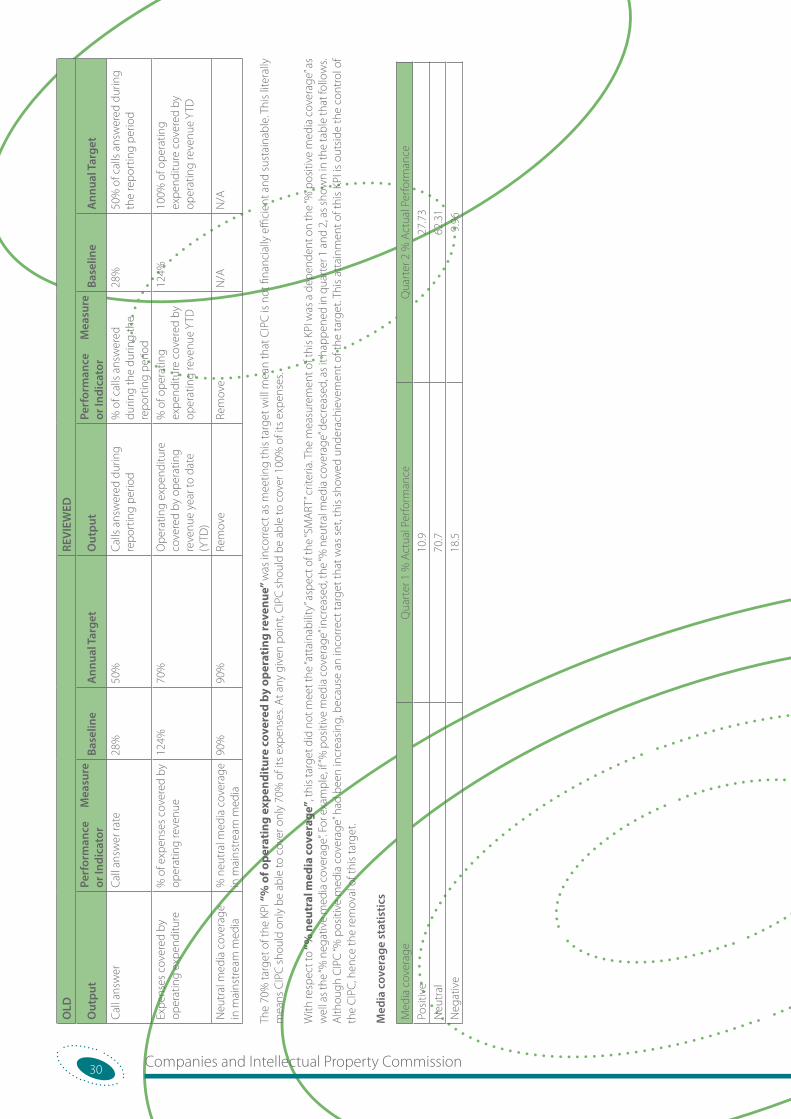
Companies and Intellectual Property Commission30
OLD
REVI
EWED
Out
put
Perf
orm
ance
M
easu
re
or In
dica
tor
Base
line
Ann
ual T
arge
tO
utpu
tPe
rfor
man
ce
Mea
sure
or
Indi
cato
rBa
selin
e A
nnua
l Tar
get
Call
answ
erCa
ll an
swer
rate
28%
50%
Calls
ans
wer
ed d
urin
g re
port
ing
perio
d%
of c
alls
ans
wer
ed
durin
g th
e du
ring
the
repo
rtin
g pe
riod
28%
50%
of c
alls
ans
wer
ed d
urin
g th
e re
port
ing
perio
d
Expe
nses
cov
ered
by
oper
atin
g ex
pend
iture
% o
f exp
ense
s co
vere
d by
op
erat
ing
reve
nue
124%
70%
Ope
ratin
g ex
pend
iture
co
vere
d by
ope
ratin
g re
venu
e ye
ar to
dat
e (Y
TD)
% o
f ope
ratin
g ex
pend
iture
cov
ered
by
oper
atin
g re
venu
e YT
D
124%
100%
of o
pera
ting
expe
nditu
re c
over
ed b
y op
erat
ing
reve
nue
YTD
Neu
tral
med
ia c
over
age
in m
ains
trea
m m
edia
% n
eutr
al m
edia
cov
erag
e in
mai
nstr
eam
med
ia90
%90
%Re
mov
eRe
mov
eN
/AN
/A
The
70%
targ
et o
f the
KPI
“%
of o
pera
ting
exp
endi
ture
cov
ered
by
oper
atin
g re
venu
e” w
as in
corr
ect a
s m
eetin
g th
is ta
rget
will
mea
n th
at C
IPC
is n
ot fi
nanc
ially
effi
cien
t and
sus
tain
able
. Thi
s lit
eral
ly
mea
ns C
IPC
sho
uld
only
be
able
to c
over
onl
y 70
% o
f its
exp
ense
s. A
t any
giv
en p
oint
, CIP
C s
houl
d be
abl
e to
cov
er 1
00%
of i
ts e
xpen
ses.
With
resp
ect t
o “%
neu
tral
med
ia c
over
age”
, thi
s ta
rget
did
not
mee
t the
“att
aina
bilit
y” a
spec
t of t
he “S
MA
RT” c
riter
ia. T
he m
easu
rem
ent o
f thi
s KP
I was
a d
epen
dent
on
the
“% p
ositi
ve m
edia
cov
erag
e” a
s w
ell a
s the
“% n
egat
ive
med
ia c
over
age”
. For
exa
mpl
e, if
“% p
ositi
ve m
edia
cov
erag
e” in
crea
sed,
the
“% n
eutr
al m
edia
cov
erag
e” d
ecre
ased
, as i
t hap
pene
d in
qua
rter
1 a
nd 2
, as s
how
n in
the
tabl
e th
at fo
llow
s. A
lthou
gh C
IPC
“% p
ositi
ve m
edia
cov
erag
e” h
ad b
een
incr
easi
ng, b
ecau
se a
n in
corr
ect t
arge
t tha
t was
set
, thi
s sh
owed
und
erac
hiev
emen
t of t
he ta
rget
. Thi
s at
tain
men
t of t
his
KPI i
s ou
tsid
e th
e co
ntro
l of
the
CIP
C, h
ence
the
rem
oval
of t
his
targ
et.
Med
ia c
over
age
stat
istic
s
Med
ia c
over
age
Qua
rter
1 %
Act
ual P
erfo
rman
ceQ
uart
er 2
% A
ctua
l Per
form
ance
Posi
tive
10.9
27.7
3N
eutr
al70
.762
.31
Neg
ativ
e18
.59.
96
CIPC Annual Report 2013/2014 31
2.4.5 Linking performance with budgets*
2013/2014 2012/2013
Programme/ activity/ objective Budget Actual Expenditure
(Over)/ Under Expenditure Budget Actual
Expenditure(Over)/ Under
Expenditure
R’000 R’000 R’000 R’000 R’000 R’000
Compensation of employees 191,700 185,983 5,717 191,000 162,700 28,300
Goods and services 150,969 119,280 33,689 156,522 125,705 30,817
Audit Fees 9,300 7,386 1,914 9,300 6,350 2,950
Bank Charges 1,500 1,138 362 1,500 1,163 337
Advertisements 6,535 3,849 2,686 4,475 1,075 3,400
Communications 17,018 10,083 6,935 19,018 8,705 10,313
Temporary Administration and Support Staff 1,310 691 619 1,310 1,396 (86)
Consultants and Special Services 51,002 34,932 16,070 56,620 40,891 15,729
Depreciation and Amortisation 0 5,713 (5,713) 0 6,052 (6,052)
Internet and Network Costs - ICT related services 4,000 2,132 1,868 5,000 4,917 83
Inventory 8,907 6,970 1,937 6,898 6,745 153
Maintenance, repair and running cost 6,048 6,852 (804) 6,223 6,499 (276)
Operating Lease 25,401 23,883 1,518 27,401 22,943 4,458
Travel and Subsistence 4,200 3,496 704 4,200 4,468 (268)
Doubtful Debts and Impairment - 81 (81) 0 1,336 (1,336)
Other 15,748 12,074 3,674 14,577 13,165 1,412
Total Expenditure 342,669 305,263 37,406 396,301 288,405 107,896
As a service delivery organisation, the bulk of expenditure related to the remuneration of staff, amounting to 60% (R186 million) (2012/2013 – R162,7 million: 56,4%) of the total operating expenditure. Substantial funding was also allocated for the operational expenditure and capital investment requirements for ICT. CIPC will continue with its modernisation investments in the ICT systems and infrastructure in the medium term to enable the migration to e-filing and the digitisation of its records.
2.5 Revenue collection*
2013/2014 2012/2013
Sources of revenue Estimate Actual Amount Collected
( Over)/Under Collection Estimate Actual Amount
Collected (Over)/Under
Collection
R’000 R’000 R’000 R’000 R’000 R’000
Annual Returns: Companies
102,546 137,690 (35,144) 129,862 119,844 10,018
Annual Returns: CCs 94,658 101,678 (7,020) 92,202 79,234 12,968
Companies 62,000 65,233 (3,233) 54,000 56,816 (2,816)
Co-operatives 5,543 3,774 1,769 1,500 4,863 (3,363)
Data Sales 12,000 20,291 (8,291) 18,445 17,666 779
Trademarks 30,000 28,703 1,297 24,430 28,287 (3,857)
Patents and designs 17,000 19,481 (2,481) 13,718 20,237 (6,519)
Copyright in film 3,000 2,782 218 2,829 2,899 (-70)
Total 326,747 379,632 (52,885) 336,986 329,846 7,140
Companies and Intellectual Property Commission32
The CIPC generates revenue from registration, maintenance and renewal fees (this includes annual returns for companies and close corporations). For the year under review, the CIPC received revenue totalling R455,6 million (2012/2013 - R396,7 million), of which R239.3 million (52.5%) (2012/2013 – R199 million) was derived from annual returns paid by companies and close corporations. After the new Annual Return filing system was launched in August 2013, the CIPC reinstated penalties for non-compliance and late filing of annual returns. The CIPC has made substantial progress in cleaning the data in the companies and close corporations register, as well as placing companies and close corporations into deregistration, which will assist in improving the compliance rate of annual return filings. CIPC also experienced an increase of R10 million in fees generated from various other services (an increase from R130 million for 2012/2013 to R140 million in 2013/2014).
2.6 Capital investment*
2013/2014 2012/2013
Programme/ activity/ objective Budget Actual
Expenditure(Over)/ Under
Expenditure Budget Actual Expenditure
(Over)/ Under Expenditure
R’000 R’000 R’000 R’000 R’000 R’000
Capital Investment
Computer hardware 17,500 17,096 404 5,000 4,581 419
Computer software 2,500 4,270 (-1,770) 9,500 6,182 3,318
Furniture and equipment 8,500 5,332 3,168 500 262 238
Total Expenditure 28,500 26,698 1,802 15,000 11,025 3,975
As part of its strategy to improve service delivery, the CIPC allocated financial resources for the improvement of ICT systems and software. Funds were also allocated for the renovation and upgrading of furniture and equipment to improve the work environment for staff. During the period under review, IT systems have been stabilised with improved infrastructure, improved functionality, greater security and enhanced bandwidth. This has enabled the CIPC to introduce new innovations and continuous improvements. CIPC also procured new furniture to replace the out dated and obsolete furniture.
*Unaudited supplementary information

CIPC Annual Report 2013/2014 33
PART C: Governance
Some Members of the CIPC Executive Team (CET)Front row from left: Ms Velaphi Skosana( SM: Indigenous Cultural Expression & Knowledge), Ms Elena Zdravkova (SM: Patents and Designs),
Mr Rector Rapoo( SM: Co-operative) Mr Lungile Dukwana( Chief Strategy Executive Strategy),Ms Astrid Ludin ( Commissioner), Mr Doctor Mduli( SM: Knowledge Center), Mr William Nape(SM: Human Capital Management), Ms Lebo Mokheseng ( Senior Internal Audit Manager),
Ms Nokwanda Mdletshe ( Strategy &Planning Specialist), Mr Tayron Tshitaudzi ( Divisional Manager: Governance, Risk & Compliance).
Back Row from left: Mr Andre Kritzinger ( Executive Manager: Business Intelligence & Systems), Mr Renier du Toit( CFO) Mr Rory Voller ( Deputy Commissioner), Mr Andre Oosthuizen( SM: Facilities & Security), Mr Dhaya Raidoo( SM: Service Centre), Ms Lana van Zyl( SM: Corporate Governance Surveillance & Enforcement),
Mr Joey Mathekga ( SM: Corporate Disclosure & Compliance), Mr William Chingate( Chief Audit Executive)
“Umuntu ngumuntu ngabantu” - “I am because you are, you are because we are”
Unknown
Companies and Intellectual Property Commission34
Part C: Governance3.1 Introduction
Corporate governance forms the foundation of the conduct of operations of the CIPC. Management is compliant to and guided by, inter alia the Companies Act, PFMA and other legislative requirements and governance principles. Further in its Governance Framework CIPC has established the following Committees to support the Accounting Authorities in performing its functions as per the PFMA:
• Strategic Management Committee: CIPC Executive Team (CET)
• Operational Performance Committee (OPC)
• Internal Risk and Fraud Committee
• ICT Change Control Board
• Bid Specification Committee
• Bid Evaluation Committee
• Bid Adjudication Committee
• Disposal Committee
3.2 Portfolio Committees
A briefing by CIPC on its 2012/2013 Annual Report to the Portfolio Committee on Trade and Industry was held on 08 October 2013. Another scheduled meeting with the Portfolio Committee during the year under review was postponed and later cancelled due to the 2014 election programme.
3.3 Executive Authority
The Minister of the dti, Dr Rob Davies, MP approved quarterly performance reports of the three quarters. The Minister gave the following commentary:
Quarter 1:
• Noted partial achievement of planned quarterly targets.
• Raised a concern regarding the stability of the IT infrastructure and reiterated that he had sent a proposal to initiate an assessment of CIPC IT infrastructure, and that a report should be submitted when finalised.
• Appreciated the manner in which CIPC is collaborating with SARS to improve the filing mechanism and FNB to offer integrated services of opening a bank account and company registration.
Quarter 2:
• Noted 70% achievement of the set targets which was an improvement from the first quarter.
• Mentioned the approval of the structure and remuneration framework which would contribute towards the stability and further improvement in the organisation.
Quarter 3:
• Noted the decline of performance from 70% in quarter 2 to 58% in quarter 3.
• Commended CIPC for the introduction of the self-service terminals.
• Noted non-compliance with the PMFA requirement of submitting quarterly reports on time.
3.4 The Accounting Authority
3.4.1 Introduction
The Commissioner is designated as the Accounting Authority of the Companies and Intellectual Property Commission.
CIPC Annual Report 2013/2014 35
3.5 Committees
3.5.1 Audit Committee and Risk Committee
The CIPC has established oversight structures to ensure continuity and sustained governance and oversight within the CIPC in line with the requirements of the PFMA, Treasury regulations and related good governance requirements. The Audit Committee is constituted in terms of the PFMA, Treasury Regulations and sound corporate governance practices. The main responsibilities of the Audit Committee are set out in its Charter. Risk Committee is a subcommittee of the Audit Committee. This Committee also interlinks with the Audit Committee to ensure that combined assurance is promoted by all governance structures. The purpose of the Risk Committee is to review corporate risk management and control processes, as well as to monitor key strategic risks identified in the entity. The committee also monitors the implementation of fraud prevention programmes in the organisation.
At the same time the existing internal governance structures and processes have been constantly improved to enhance governance and accountability and to entrench this throughout the entity. A review of the governance structures, as part of the on-going leadership journey, is currently in process. The underlying principles of corporate governance followed by the CIPC include the values, ethics and commitment to best business practices.
For the 2013/2014 financial year, the Audit Committee met on the following dates:
• 26 April 2013
• 27 May 2013 (Special Meeting)
• 25 July 2013
• 14 August 2013 (Special Meeting)
• 23 October 2013
• 07 February 2014
The composition of the Audit Committee for the year ended 31 March 2014 was as follows:
Names of members Role Number of eligible/qualifying meetings
Meetings attended
Mr DA Braithwaite Independent Chairperson (appointment ended 30 October 2013)
5 5
Mr AN Mhlongo Independent Chairperson (appointed with effect from 1 November 2013)
1 1
Mr AN Mhlongo Independent member (1 April 2013 to 30 October 2013)
5 5
Mr AC Bischof Independent member 6 6
Mr YN Gordhan Independent member 6 6
Ms R Kenosi Independent member 6 5
Ms A Ludin Commissioner: CIPC 6 6
Mr K Naidoo Group Chief Financial Officer: the dti 6 5
3.5.2 Remuneration of Committee Members
Audit Committee members not holding executive office in the CIPC or not being in the public service are remunerated in accordance with tariffs approved by the Executive Authority.
Name Remuneration Other allowance Other reimbursements Total
Mr DA Braithwaite R 162,251.30 R 1,024.27 R 216.00 R 163,491.57
Mr AN Mhlongo R 227,717.00 R 9,598.20 - R 237,315.20
Mr AC Bischof R 135,301.00 R 4,885.30 - R 140,186.30
Mr YN Gordhan R 185,358.00 R 7,233.94 - R 192,591.94
Ms R Kenosi R 183,957.32 R 3,130.56 - R 187,087.88
Ms A Ludin N/A N/A - -
Mr K Naidoo N/A N/A - -
Companies and Intellectual Property Commission36
3.6 Risk Management
The CIPC has adopted a Risk Management Framework and Policy that direct the operations of the risk management in the organisation. These are continually being reviewed to ensure relevance and applicability. Both strategic and operational risk assessments aligned with the strategic objectives were conducted during the year. The Internal Fraud and Risk Committee provides oversight on all operational risks. The Risk Committee (a subcommittee of the Audit Committee) has played an important role in monitoring the implementation of risk management system and programme in the organisation. The monitoring of mitigation plans to address the risks are continuously monitored throughout the year. For the 2013/2014 financial year the Risk Committee met on the following dates:
• 12 April 2013
• 10 July 2013
• 11 October 2013
• 06 February 2014
The composition of the Risk Committee for the year ended 31 March 2014 was as follows:
Names of members Role Number of eligible/qualifying meetings Meetings attended
Mr AN Mhlongo Independent Chairperson (appointment ended 30 October 2013)
3 3
Ms R Kenosi Independent Chairperson (appointed with effect from 1 November 2013)
2 2
Mr YN Gordhan Independent member 4 4Mr K Naidoo Group Chief Financial Officer: the dti 4 2Ms A Ludin Commissioner: CIPC 4 4Mr R Voller Deputy Commissioner 4 4Mr ER du Toit Chief Financial Officer 4 3
There is substantial progress made in the implementation of risk management and risk maturity assessment will be conducted within the next two years.
3.7 Internal Control Unit
The CIPC does not have an internal control unit. The functions of the internal control unit are fulfilled by the Internal Audit Division; Governance, Risk and Compliance Division; and Operational Excellence Unit.
3.8 Internal Audit and Audit Committees
CIPC has a functional Internal Audit Division which is responsible for:
• assisting the Accounting Authority and management in monitoring the adequacy and effectiveness of the risk management process of the entity;
• assisting the Accounting Authority and management in maintaining an effective internal control environment by evaluating those controls continuously in order to determine whether they are adequately designed, operating efficiently and effectively and to recommend improvements; and
• Giving assurance to the Audit Committee that adequate management processes are in place to identify and monitor risks, and that effective internal controls are in place to manage those risks. The Internal Audit Division independently audits and evaluates the effectiveness of the CIPC’s risk management, internal controls and governance processes. In addition, the Internal Audit Division may provide consulting services to add value and improve the Commission’s operations.
Internal controls reviewed consist of strategic, operating, financial reporting and compliance controls, and encompass controls relating to:
• the information management environment;
• the reliability and integrity of financial and operating information;
• the safeguarding of assets; and
• the effective and efficient use of the entity’s resources.
The annual audit plan is based on an assessment of risk areas identified by management, as well as focus areas highlighted by the Audit Committee, the Risk Committee and management. The annual audit plan is updated, as appropriate, to ensure that the Audit Committee, the Risk Committee and management are responsive to changes in the business. A comprehensive report on internal audit findings is presented to management and the Audit Committee at the scheduled meetings. Follow-up audits were conducted in areas where significant internal control weaknesses are found.
CIPC Annual Report 2013/2014 37
During the year 2013/2014, Internal Audit Division performed audits in the following areas per the approved annual plan:
• ICT general controls
• ICT governance
• ICT application controls
• Risk management
• Financial controls
• Policies and legislative compliance
• Company registration processes
• Business rescue processes
• Quarterly reviews of organisational performance information
• Quarterly co-ordination of the audit findings tracking register
In addition, six audit projects of varying magnitude were performed at the request of Management.
The functions of the Audit Committee include review of the following among others:
a) the effectiveness of the internal control systems;
b) the effectiveness of the internal audit function;
c) the risk areas of the institution’s operations to be covered in the scope of internal and external audits;
d) the adequacy, reliability and accuracy of the financial information provided to management and other users of such information;
e) any accounting and auditing concerns identified as a result of internal and external audits;
f ) the institution’s compliance with legal and regulatory provisions; and
g) the activities of the internal audit function, including its annual work programme, coordination with the external auditors, the reports of significant investigations and the responses of management to specific recommendations.
The Audit Committee members profile.
Name Qualifications Internal/External
Position Date Appointed
Date Resigned
No. of meetings attended
Mr DA Braithwaite CA (SA) External N/A July 2010 31/10/2013 5/5
Mr NA. Mhlongo CA (SA) External N/A March 2011 N/A 6/6
Mr AC Bischof CA (SA) External N/A March 2011 N/A 6/6
Mr YN Gordhan CA (SA) External N/A March 2011 N/A 6/6
Ms R Kenosi CA (SA) External N/A April 2011 N/A 5/6
Ms A Ludin Masters in International Affairs
Internal Commissioner May 2011 N/A 6/6
Mr K Naidoo B Com Internal Group CFO – the dti July 2011 N/A 5/6
3.9 Compliance with Laws and Regulations
As a public entity, compliance to applicable laws and regulations is a cornerstone of good governance and processes are available to monitor compliance. During the 2013/2014 financial year, Internal Audit conducted a review of legislative compliance and recommendations are continued to be implemented. As part of transitional arrangements, the CIPC has continued to maintain effective, efficient and transparent systems of financial, internal control and risk management.
3.10 Fraud and Corruption
The CIPC has started to strengthen its fraud and corruption prevention initiatives. Post the end of the financial year, the Fraud Prevention Policy and Strategy was approved to formally direct and guide the management of these irregularities.
The CIPC has the email fraud alert system which is web-based and cases received are investigated. In the 2014/2015 financial year, the improvements of attending to cases are being planned. The Commission will also intensify its fight of fraud and corruption and other unethical conduct through the enhanced implementation of whistle blowing policy in the 2014/2015 financial year.
Companies and Intellectual Property Commission38
Case registration – 2013/2014 financial year
Cases Number of cases % Misuse of client accounts 75 43%Agent related allegations 44 25%Unauthorised use of identity documents 22 13%Irregular business practice 11 6%Unauthorised change of directors 9 5%Unauthorised COR39/CR2 6 3%Theft of an entity name 3 2%Others 4 2%Total number of cases 174 100%
A total of 174 cases were received during the year. The majority of these cases are classified as misuse of customers’ accounts and agents related complaints which represent a total of more than 60%. A total of 38% (66 cases) were analysed, investigated and finalised at year end. Of these, 89% of the cases were resolved within 45 working days turnaround time. 79% (52 cases) were closed within 15 working days. 16 of the 52 cases were closed within 1 working day. The maximum time taken was 56 working days. 7 cases (11%) took more than 45 working days to resolve.
3.11 Minimizing Conflict of Interest
All Bid (Specification, Evaluation and Adjudication) Committee members are appointed by the Accounting Authority and during their sitting they sign the declaration of interest for all matters tabled before them. All SCM practitioners sign for the code of conduct for SCM Practitioners every financial year.
3.12 Code of Conduct
The code of conduct and ethics provides a set of guidelines and key obligations of CIPC employees to uphold CIPC core values of integrity, accountability and passion for service in executing its mandate. It provides for standards of conduct that CIPC employees should demonstrate in exercising their respective functions and duties and how to act in the best interest of the organisation. Any breach of the code of conduct and ethics is dealt with as misconduct and disciplinary measures as contained in the disciplinary code are taken against the responsible official.
3.13 Health, Safety and Environmental Issues
In respect of health and safety, the organisation followed the prescribed procedures in terms of the Occupational Health and Safety Act, (Act 85 of 1993), in the appointment of health and safety representatives within the workplace. A total of 13 health and safety representatives were appointed with their core functions being responsible for safety within the workplace, identifying, reporting and attending to health and safety risks they became aware of or identified during safety inspections conducted to minimise safety risks and hazards. A number of challenges were faced in respect of housekeeping due to large volumes of paper flowing through business units which necessitated the organisation to plan and implement new ways of working, changing processes and procedures to minimise this risk after the refurbishment of the accommodation within the second quarter of the new financial year. Only one minor injury was reported during the reporting period.
3.14 Company Secretary
This is not applicable to CIPC.
3.15 Social Responsibility
As part of the Mandela Day initiative, CIPC donated 22 bicycles and 24 Movie tickets to the Leamogetswe Safety Home in Atteridgeville on 18 July 2013. The bicycles were part of the confiscated counterfeit goods disposed of in a socially responsible manner. Confiscated goods may be donated provided that all infringing marks are removed. The children at Leamogetswe are destitute and walk long distances to school. The gesture by the CIPC was therefore greatly welcome by the Home. The Deputy Commissioner of the CIPC and the Chief Financial Officer were present on the day to officially hand the bicycles to the children at the Home.
In addition, CIPC officials participated in Blood Donation services conducted by the South African Blood Donation Services on a bi-monthly basis on the Campus within the financial year period 2013/14.

CIPC Annual Report 2013/2014 39
AUDIT COMMITTEE
From left Mr Nala Mhlongo ( Audit Committee Chairperson), Mr Yaswant Gordhan (Independent Audit Committee Member),
Ms Rene Kenosi ( Independent Audit Committee Member), Ms Austrid Ludin (CIPC Commissioner), Mr Anton Bischof (Independent Audit Committee Member) and Mr Kumaran Naidoo ( Group CFO –the dti).
Absent: Mr DA Braitwaite (Chairperson until 31 October 2013)
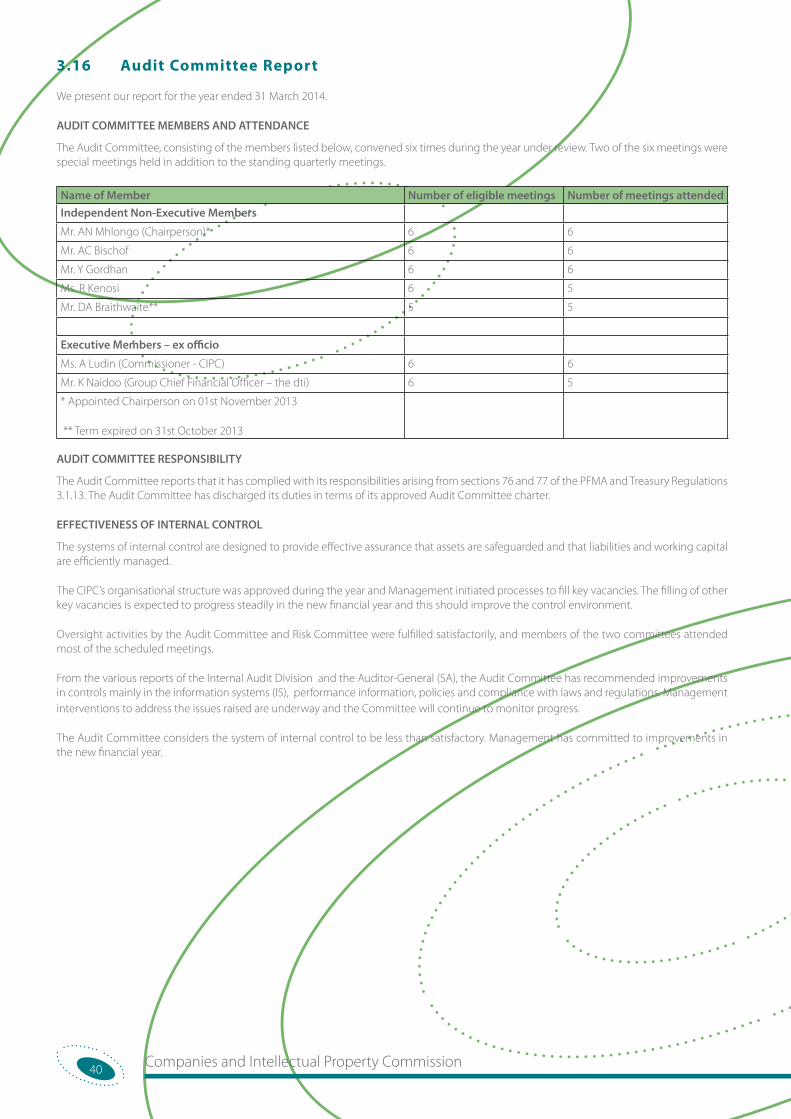
Companies and Intellectual Property Commission40
3.16 Audit Committee Report
We present our report for the year ended 31 March 2014.
AUDIT COMMITTEE MEMBERS AND ATTENDANCE
The Audit Committee, consisting of the members listed below, convened six times during the year under review. Two of the six meetings were special meetings held in addition to the standing quarterly meetings.
Name of Member Number of eligible meetings Number of meetings attendedIndependent Non-Executive Members
Mr. AN Mhlongo (Chairperson)* 6 6
Mr. AC Bischof 6 6
Mr. Y Gordhan 6 6
Ms. R Kenosi 6 5
Mr. DA Braithwaite** 5 5
Executive Members – ex officio
Ms. A Ludin (Commissioner - CIPC) 6 6
Mr. K Naidoo (Group Chief Financial Officer – the dti) 6 5
* Appointed Chairperson on 01st November 2013
** Term expired on 31st October 2013
AUDIT COMMITTEE RESPONSIBILITY
The Audit Committee reports that it has complied with its responsibilities arising from sections 76 and 77 of the PFMA and Treasury Regulations 3.1.13. The Audit Committee has discharged its duties in terms of its approved Audit Committee charter.
EFFECTIVENESS OF INTERNAL CONTROL
The systems of internal control are designed to provide effective assurance that assets are safeguarded and that liabilities and working capital are efficiently managed.
The CIPC’s organisational structure was approved during the year and Management initiated processes to fill key vacancies. The filling of other key vacancies is expected to progress steadily in the new financial year and this should improve the control environment.
Oversight activities by the Audit Committee and Risk Committee were fulfilled satisfactorily, and members of the two committees attended most of the scheduled meetings.
From the various reports of the Internal Audit Division and the Auditor-General (SA), the Audit Committee has recommended improvements in controls mainly in the information systems (IS), performance information, policies and compliance with laws and regulations. Management interventions to address the issues raised are underway and the Committee will continue to monitor progress.
The Audit Committee considers the system of internal control to be less than satisfactory. Management has committed to improvements in the new financial year.

CIPC Annual Report 2013/2014 41
RISK MANAGEMENT
The Risk Committee is a sub-committee of the Audit Committee. The Risk Committee is satisfied with the progress on implementation of risk management initiatives in the CIPC. There are however concerns about the weaknesses in the informationsystems. Management interventions in this area have been positive.
INTERNAL AUDIT
The Internal Audit Division has undergone a restructuring and operated with co-sourced partners. The Audit Committee was concerned about delays in issuing reports and at times the poor quality of reports produced. Assurance was given that the remedial action will be taken to address the aforementioned. There is a need to upskill staff and continue to improve this function.
QUALITY OF MANAGEMENT REPORTS
The Audit Committee is satisfied with the content and quality of the quarterly reports as prepared and issued by Management during the year under review in terms of the PFMA.
FINANCE FUNCTION
The Audit Committee is satisfied that the Finance function underwent restructuring during the year and it continues to fill necessary vacancies.
EVALUATION OF THE AUDITED FINANCIAL STATEMENTS
The Audit Committee has:
• Reviewed and discussed with management the audited financial statements and the Auditor-General (SA)’s report;
• Reviewed the appropriateness of accounting policies and practices;
• Reviewed the Auditor-General (SA)’s Final Management Report and management’s responses thereto;
• Reviewed and considered reports from the internal auditors; and
• Noted that there were no significant adjustments resulting from the annual audit.
The Audit Committee concurs with and accepts the conclusions of the Auditor General (SA) on the annual financial statements.
A.N. Mhlongo
Chairperson of the Audit Committee
28 July 2014

Companies and Intellectual Property Commission42
“It takes 20 years to build a reputation and five minutes to ruin it. If you think about that,
you’ll do things differently.”Warren Buffett

CIPC Annual Report 2013/2014 43
PART D: Human Resource
Management“Employees, as the heartbeat of the organisation, are led by example and are enabled to achieve
sustainable excellence in a conducive working environment.”CIPC People Strategy
Companies and Intellectual Property Commission44
Part D: Human Resource Management4.1 Introduction
4.1.1 Overview of Human Resource matters
The CIPC has implemented a new organisational structure which resulted in employees being matched and placed in new positions. Most of these employees may require training interventions to assist them to cope with challenges. Key positions were advertised and the selection process is unfolding amid some challenges which are concomitant to an organisation undergoing transformation. Most of the Human Resource policies are still being developed. The challenge remains that the new policies must talk to the needs of the CIPC and assist to reach the objectives of the organisation on people. The organisation is still undergoing massive change and has a high vacancy rate as a result of the organisation’s transition and the creation of additional posts on the establishment.
4.1.2 Set Human Resource Priorities for the Year under Review and the Impact of these Priorities
The CIPC crafted a People Strategy and Human Resource Plan with the following statement:
“Employees, as the heartbeat of the organisation, are led by example and are enabled to achieve sustainable excellence in a conducive working environment.
• Organisational Culture, Values and Ethics– for the organisation to move forward there is a need to develop and nourish an organisational culture that talks to the new organisation. The CIPC specifically requires and encourages a culture of collaboration/team work and innovation with sound ethical conduct.
• Employee Relations and Wellness - Employee wellness is intrinsic to the employee value proposition in terms of optimising wellness within the CIPC. In line with the global trends, CIPC is shifting towards a holistic preventative approach to wellness. This encompasses the provision of support and guidance to healthy employees, as well as the traditional health and wellness provided by organisations.
This comprehensive wellness programme is an integral part of the overall strategy and will incorporate multiple new capabilities, such as:
• Employee Relations services
• Education on wellness
• Clinic and advisory services
• HIV programmes
• Anti-abuse programmes
• Debt management, etc.
For the period under review the following was achieved in the above regard:-
• Counselling services provided to 51 employees through Careways and, internal counselling sessions.
• 393 health related consultations provided through the onsite Occupational Health Clinic Services.
• E-care information on health and financial issues communicated to employees via email on a monthly basis.
• Exercise sessions arranged for employees namely: Weekly soccer tournaments; onsite physical exercise sessions twice per week; 3 Fun Run initiatives conducted.
• 3 Wellness Day Events conducted with 179 employees attending. The following health tests conducted: blood, sugar, cholesterol, Body Mass Index, HIV Counselling and Testing;
• Financial Lifeskills sessions conducted and 55 officials attended.
• Health Information sessions conducted, eg. Talk by a dietician on making healthy food choices
• Recruitment and Selection - CIPC is implementing recruitment in a phased approach of advertising vacant positions. This process may result in further vacancies, especially at team member level as some team members may be appointed as team leaders or team managers due to internal advertising of positions.
The Internship programme may be another source for recruitment.
A core principle of future recruitment and promotion will be to encourage the development and promotion of internal staff to build morale and commitment, while introducing key external resourcing where critical skills gaps exist that cannot be effectively sourced or developed from within.
Assessment as part of recruitment is essential to enable effective recruitment and selection. Technical competence and personality/ culture fit to the organisation is and will be considered for all future appointments.
CIPC Annual Report 2013/2014 45
• Competence and Capability–The CIPC has developed a competency framework and it is important that communication strategies are designed and executed, explaining the framework, the competencies required per specific job and the competencies required for future growth. The remuneration framework sets out details for movement within bands, and promotion from one band to another. Competency assessments will be conducted for all staff and feedback on their strengths and areas of development will be incorporated into personal development plans.
The CIPC Training and Development plan will address the identified skills gap and design programmes to meet the need for new competencies to enable employees to reach their potential. This has implications in terms of planning and prioritisation. Employees were matched and placed without skills gap analysis. All future recruitment will include assessments. A proper gap analysis is important as part of planning for competency development.
In terms of priority, the following main areas of competence development represent a focus for the CIPC:
• Technical (or regulatory competence)
• Management and Leadership competencies
• Service competencies
• Job family specific technical competencies (typing, matric programme, basic accountancy, etc.)
4.1.3 Workforce Planning Framework and Key Strategies to Attract and Recruit a Skilled and Capable Workforce
The approved structure for the CIPC has 640 positions inclusive of the Commissioner’s and Deputy Commissioner’s positions. The CIPC endeavours to be an employer of choice. The remuneration framework provides for growth opportunities for employees who perform. The CIPC believes in internal upward mobility where possible and attraction of talent from outside where such talent is not available internally. The implementation of a combination of cutting edge rewards and incentives will also set the CIPC among the best organisations talented employees will yearn to be a part of.
4.1.4 Employee Performance Management Framework
The CIPC is in the process of putting a new employee performance management system in place. This system will be implemented across all levels of the organisation and will include the automation of Performance Agreements on a VIP Human Resources system. In the absence of a performance management system the CIPC used the organisational performance to reward performance.
4.1.5 Policy Development
Policy development is one of the priority areas within the Human Capital Division of the CIPC. Some of these policies are already in development like the Performance Management Policy, Reward and Recognition Strategy.
4.1.6 Highlights/Achievements
The Organisational Design process was led by the Commissioner’s Office with the following successes:
• New CIPC Remuneration Framework was approved and implemented.
• A Reward and Recognition Policy and Performance Management Policy were approved by CIPC Executive Team and are awaiting consultation with Organised Labour.
• Matching and placing against the new structure was completed across all levels.
• VIP System was implemented. This includes the Employee Self Service (ESS) which enabled the automation of leave. This is a classic example of how the CIPC modernises processes.
• Most of the advertised critical positions at Divisional Manager level were successfully filled.
4.1.7 Challenges faced by the Public Entity
The CIPC has been going through a transformation phase. This phase required management to provide direction. Most of the employees of the CIPC came from the public service and would naturally interact with new developments in the context of a public service framework. The CIPC is introducing new ways of working and a constant reference to public service prescripts hamper employees ability to move into the new culture being inculcated.
The organisation utilised the dti’s human resources’ policies in the absence of its own policies. In the absence of such new policies reliance was also placed on facilitated engagements with organised labour on issues affecting employees. Policies will be developed in the new reporting period.
The approval of the new CIPC structure also resulted in a large number of vacancies (196) representing about 29% of the entire establishment. The recruitment process to fill these vacancies is unfolding.
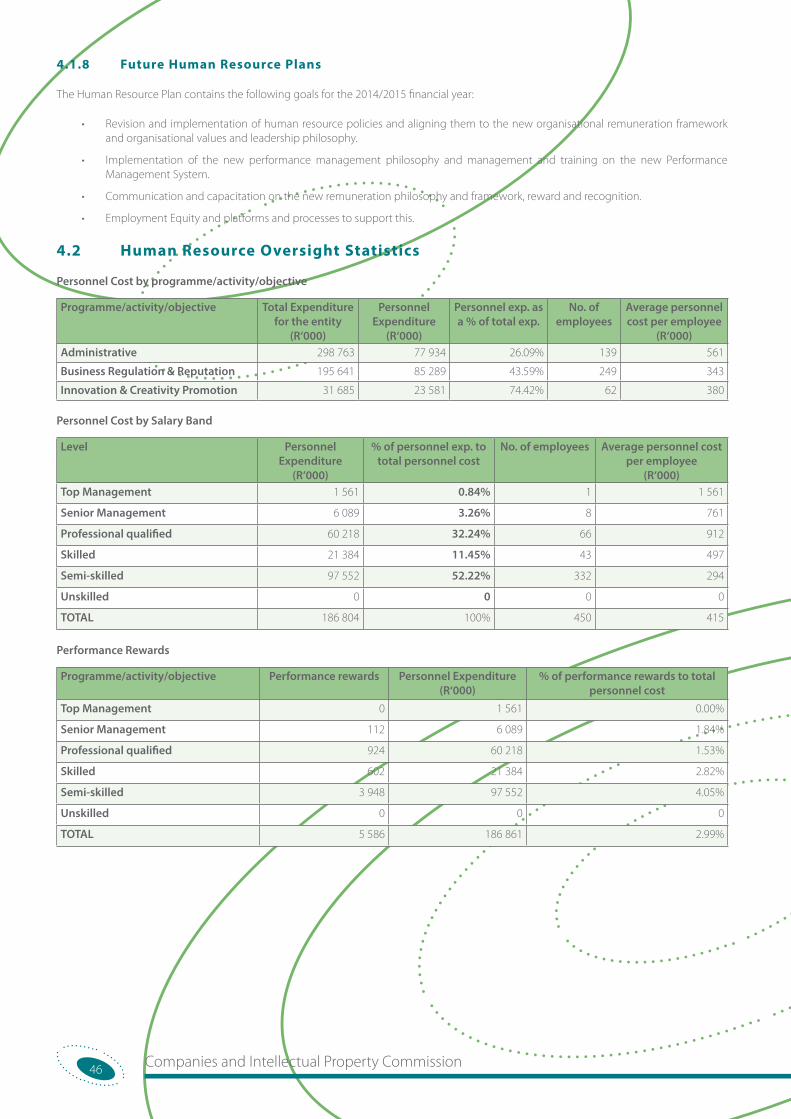
Companies and Intellectual Property Commission46
4.1.8 Future Human Resource Plans
The Human Resource Plan contains the following goals for the 2014/2015 financial year:
• Revision and implementation of human resource policies and aligning them to the new organisational remuneration framework and organisational values and leadership philosophy.
• Implementation of the new performance management philosophy and management and training on the new Performance Management System.
• Communication and capacitation on the new remuneration philosophy and framework, reward and recognition.
• Employment Equity and platforms and processes to support this.
4.2 Human Resource Oversight Statistics
Personnel Cost by programme/activity/objective
Programme/activity/objective Total Expenditure for the entity
(R‘000)
Personnel Expenditure
(R‘000)
Personnel exp. as a % of total exp.
No. of employees
Average personnel cost per employee
(R‘000) Administrative 298 763 77 934 26.09% 139 561
Business Regulation & Reputation 195 641 85 289 43.59% 249 343
Innovation & Creativity Promotion 31 685 23 581 74.42% 62 380
Personnel Cost by Salary Band
Level Personnel Expenditure
(R‘000)
% of personnel exp. to total personnel cost
No. of employees Average personnel cost per employee
(R‘000) Top Management 1 561 0.84% 1 1 561
Senior Management 6 089 3.26% 8 761
Professional qualified 60 218 32.24% 66 912
Skilled 21 384 11.45% 43 497
Semi-skilled 97 552 52.22% 332 294
Unskilled 0 0 0 0
TOTAL 186 804 100% 450 415
Performance Rewards
Programme/activity/objective Performance rewards Personnel Expenditure (R‘000)
% of performance rewards to total personnel cost
Top Management 0 1 561 0.00%
Senior Management 112 6 089 1.84%
Professional qualified 924 60 218 1.53%
Skilled 602 21 384 2.82%
Semi-skilled 3 948 97 552 4.05%
Unskilled 0 0 0
TOTAL 5 586 186 861 2.99%
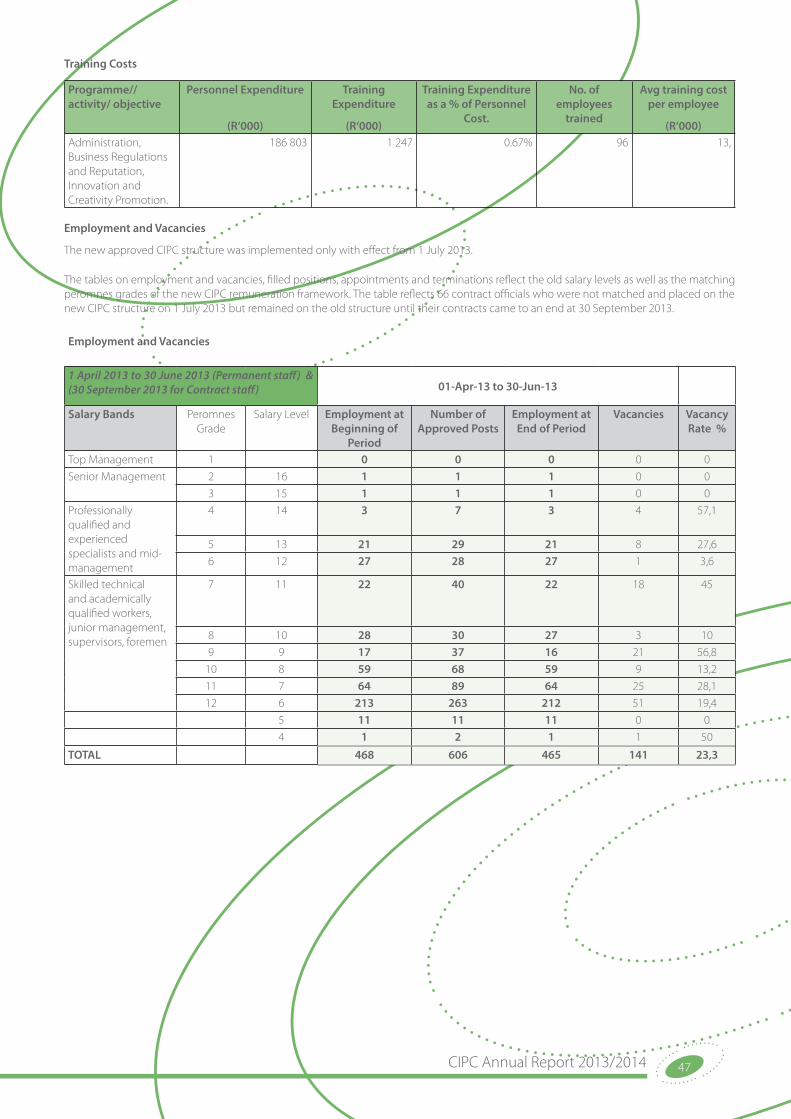
CIPC Annual Report 2013/2014 47
Training Costs
Programme//activity/ objective
Personnel Expenditure
(R‘000)
Training Expenditure
(R‘000)
Training Expenditure as a % of Personnel
Cost.
No. of employees
trained
Avg training cost per employee
(R‘000)Administration, Business Regulations and Reputation, Innovation and Creativity Promotion.
186 803 1 247 0.67% 96 13,
Employment and Vacancies
The new approved CIPC structure was implemented only with effect from 1 July 2013.
The tables on employment and vacancies, filled positions, appointments and terminations reflect the old salary levels as well as the matching peromnes grades of the new CIPC remuneration framework. The table reflects 66 contract officials who were not matched and placed on the new CIPC structure on 1 July 2013 but remained on the old structure until their contracts came to an end at 30 September 2013.
Employment and Vacancies
1 April 2013 to 30 June 2013 (Permanent staff) & (30 September 2013 for Contract staff) 01-Apr-13 to 30-Jun-13
Salary Bands Peromnes Grade
Salary Level Employment at Beginning of
Period
Number of Approved Posts
Employment at End of Period
Vacancies Vacancy Rate %
Top Management 1 0 0 0 0 0
Senior Management 2 16 1 1 1 0 0
3 15 1 1 1 0 0
Professionally qualified and experienced specialists and mid-management
4 14 3 7 3 4 57,1
5 13 21 29 21 8 27,6
6 12 27 28 27 1 3,6
Skilled technical and academically qualified workers, junior management, supervisors, foremen
7 11 22 40 22 18 45
8 10 28 30 27 3 10
9 9 17 37 16 21 56,8
10 8 59 68 59 9 13,2
11 7 64 89 64 25 28,1
12 6 213 263 212 51 19,4
5 11 11 11 0 0
4 1 2 1 1 50
TOTAL 468 606 465 141 23,3
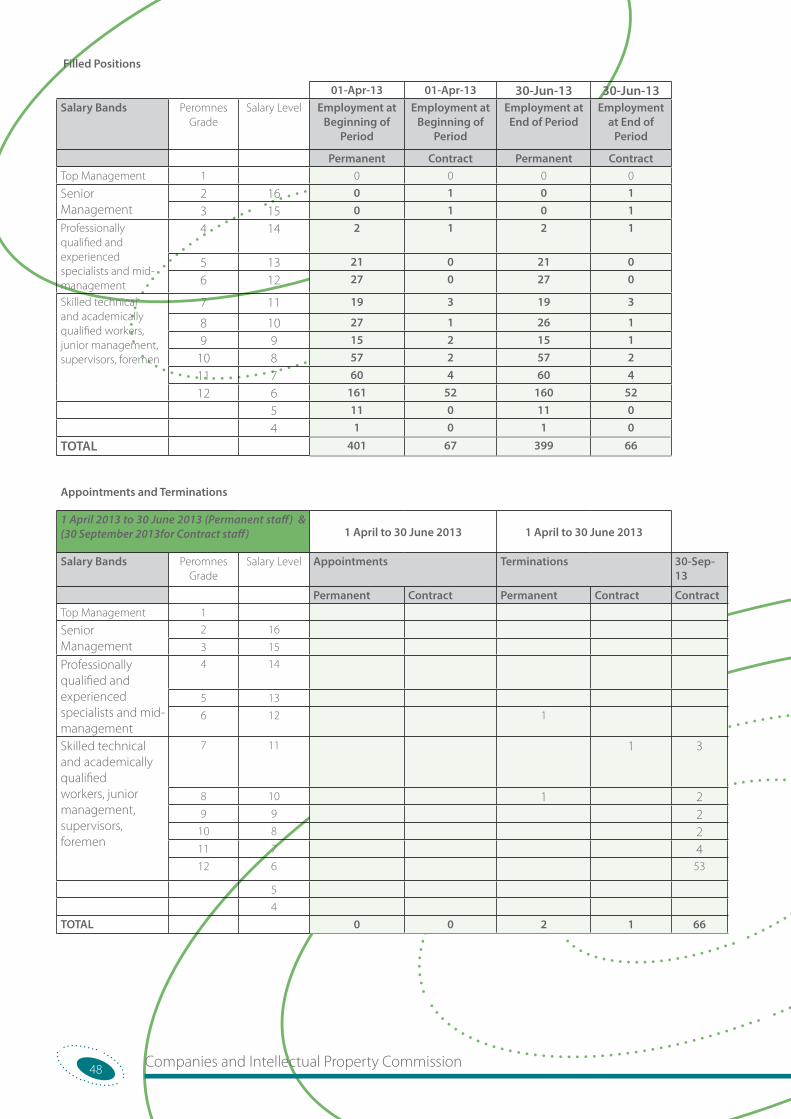
Companies and Intellectual Property Commission48
Filled Positions
01-Apr-13 01-Apr-13 30-Jun-13 30-Jun-13Salary Bands Peromnes
GradeSalary Level Employment at
Beginning of Period
Employment at Beginning of
Period
Employment at End of Period
Employment at End of
Period
Permanent Contract Permanent Contract Top Management 1 0 0 0 0 Senior Management
2 16 0 1 0 1 3 15 0 1 0 1
Professionally qualified and experienced specialists and mid-management
4 14 2 1 2 1
5 13 21 0 21 0 6 12 27 0 27 0
Skilled technical and academically qualified workers, junior management, supervisors, foremen
7 11 19 3 19 3 8 10 27 1 26 1 9 9 15 2 15 1
10 8 57 2 57 2 11 7 60 4 60 4 12 6 161 52 160 52
5 11 0 11 0 4 1 0 1 0 TOTAL 401 67 399 66
Appointments and Terminations
1 April 2013 to 30 June 2013 (Permanent staff) & (30 September 2013for Contract staff) 1 April to 30 June 2013 1 April to 30 June 2013
Salary Bands Peromnes Grade
Salary Level Appointments Terminations 30-Sep-13
Permanent Contract Permanent Contract ContractTop Management 1
Senior Management
2 16 3 15
Professionally qualified and experienced specialists and mid-management
4 14
5 13 6 12 1
Skilled technical and academically qualified workers, junior management, supervisors, foremen
7 11 1 3
8 10 1 29 9 2
10 8 211 7 412 6 53
5
4 TOTAL 0 0 2 1 66
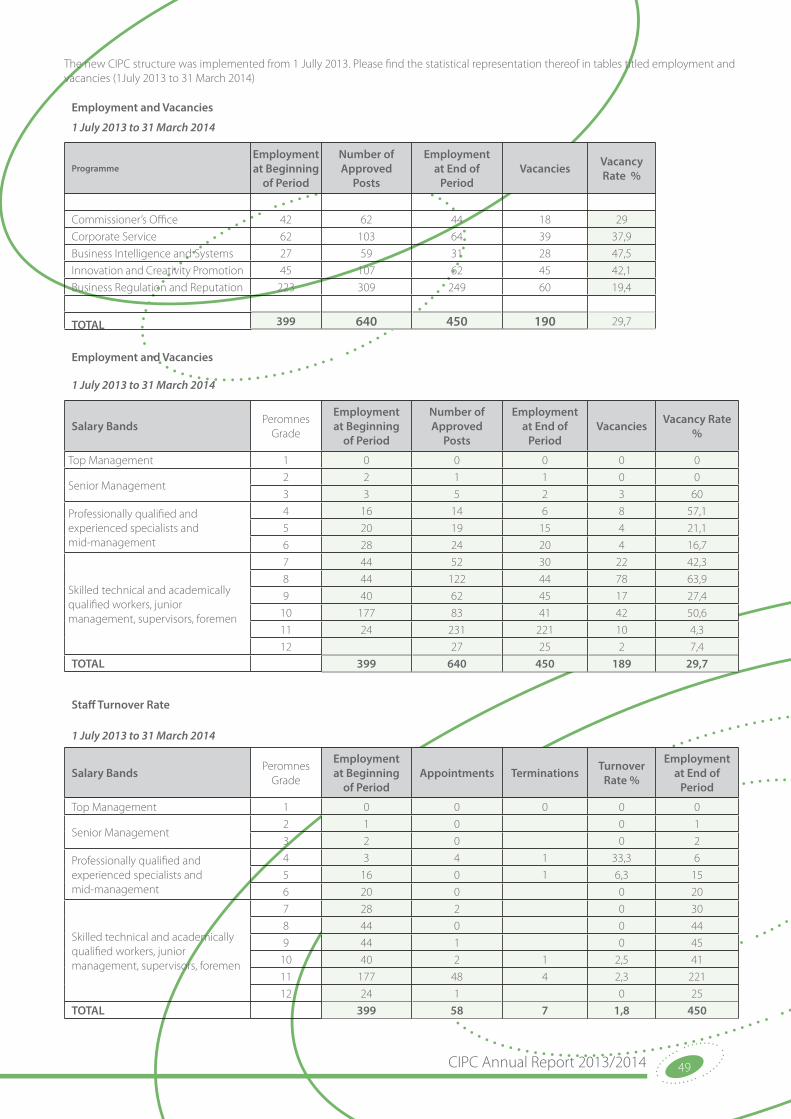
CIPC Annual Report 2013/2014 49
The new CIPC structure was implemented from 1 Jully 2013. Please find the statistical representation thereof in tables titled employment and vacancies (1July 2013 to 31 March 2014)
Employment and Vacancies
1 July 2013 to 31 March 2014
ProgrammeEmployment at Beginning
of Period
Number of Approved
Posts
Employment at End of
PeriodVacancies Vacancy
Rate %
Commissioner’s Office 42 62 44 18 29
Corporate Service 62 103 64 39 37,9
Business Intelligence and Systems 27 59 31 28 47,5
Innovation and Creativity Promotion 45 107 62 45 42,1
Business Regulation and Reputation 223 309 249 60 19,4
TOTAL 399 640 450 190 29,7
Employment and Vacancies
1 July 2013 to 31 March 2014
Salary Bands Peromnes Grade
Employment at Beginning
of Period
Number of Approved
Posts
Employment at End of
PeriodVacancies Vacancy Rate
%
Top Management 1 0 0 0 0 0
Senior Management2 2 1 1 0 0
3 3 5 2 3 60
Professionally qualified and experienced specialists and mid-management
4 16 14 6 8 57,1
5 20 19 15 4 21,1
6 28 24 20 4 16,7
Skilled technical and academically qualified workers, junior management, supervisors, foremen
7 44 52 30 22 42,3
8 44 122 44 78 63,9
9 40 62 45 17 27,4
10 177 83 41 42 50,6
11 24 231 221 10 4,3
12 27 25 2 7,4
TOTAL 399 640 450 189 29,7
Staff Turnover Rate
1 July 2013 to 31 March 2014
Salary Bands Peromnes Grade
Employment at Beginning
of PeriodAppointments Terminations Turnover
Rate %
Employment at End of
Period
Top Management 1 0 0 0 0 0
Senior Management2 1 0 0 1
3 2 0 0 2
Professionally qualified and experienced specialists and mid-management
4 3 4 1 33,3 6
5 16 0 1 6,3 15
6 20 0 0 20
Skilled technical and academically qualified workers, junior management, supervisors, foremen
7 28 2 0 30
8 44 0 0 44
9 44 1 0 45
10 40 2 1 2,5 41
11 177 48 4 2,3 221
12 24 1 0 25
TOTAL 399 58 7 1,8 450
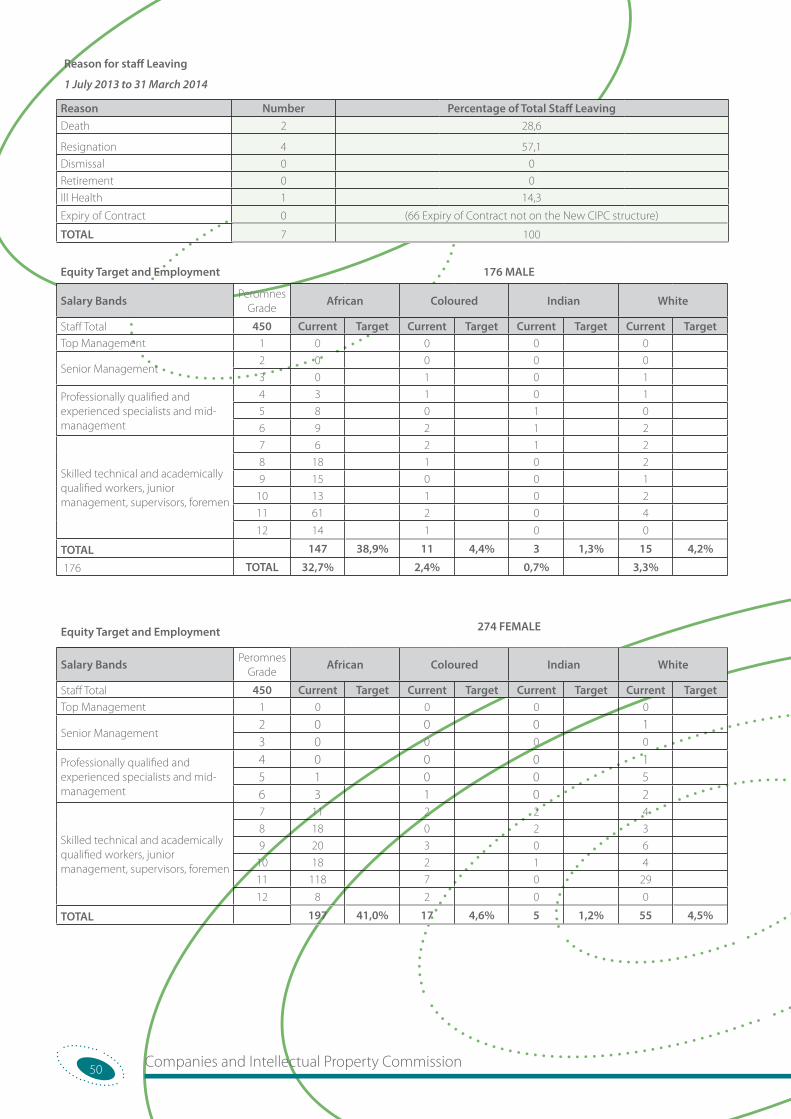
Companies and Intellectual Property Commission50
Reason for staff Leaving
1 July 2013 to 31 March 2014
Reason Number Percentage of Total Staff LeavingDeath 2 28,6
Resignation 4 57,1
Dismissal 0 0
Retirement 0 0
Ill Health 1 14,3
Expiry of Contract 0 (66 Expiry of Contract not on the New CIPC structure)
TOTAL 7 100
Equity Target and Employment 176 MALE
Salary Bands Peromnes Grade
African Coloured Indian White
Staff Total 450 Current Target Current Target Current Target Current TargetTop Management 1 0 0 0 0
Senior Management2 0 0 0 0
3 0 1 0 1
Professionally qualified and experienced specialists and mid-management
4 3 1 0 1
5 8 0 1 0
6 9 2 1 2
Skilled technical and academically qualified workers, junior management, supervisors, foremen
7 6 2 1 2
8 18 1 0 2
9 15 0 0 1
10 13 1 0 2
11 61 2 0 4
12 14 1 0 0
TOTAL 147 38,9% 11 4,4% 3 1,3% 15 4,2%
176 TOTAL 32,7% 2,4% 0,7% 3,3%
Equity Target and Employment 274 FEMALE
Salary Bands Peromnes Grade
African Coloured Indian White
Staff Total 450 Current Target Current Target Current Target Current TargetTop Management 1 0 0 0 0
Senior Management2 0 0 0 1 3 0 0 0 0
Professionally qualified and experienced specialists and mid-management
4 0 0 0 1 5 1 0 0 5 6 3 1 0 2
Skilled technical and academically qualified workers, junior management, supervisors, foremen
7 11 2 2 4
8 18 0 2 3
9 20 3 0 6
10 18 2 1 4
11 118 7 0 29
12 8 2 0 0
TOTAL 197 41,0% 17 4,6% 5 1,2% 55 4,5%
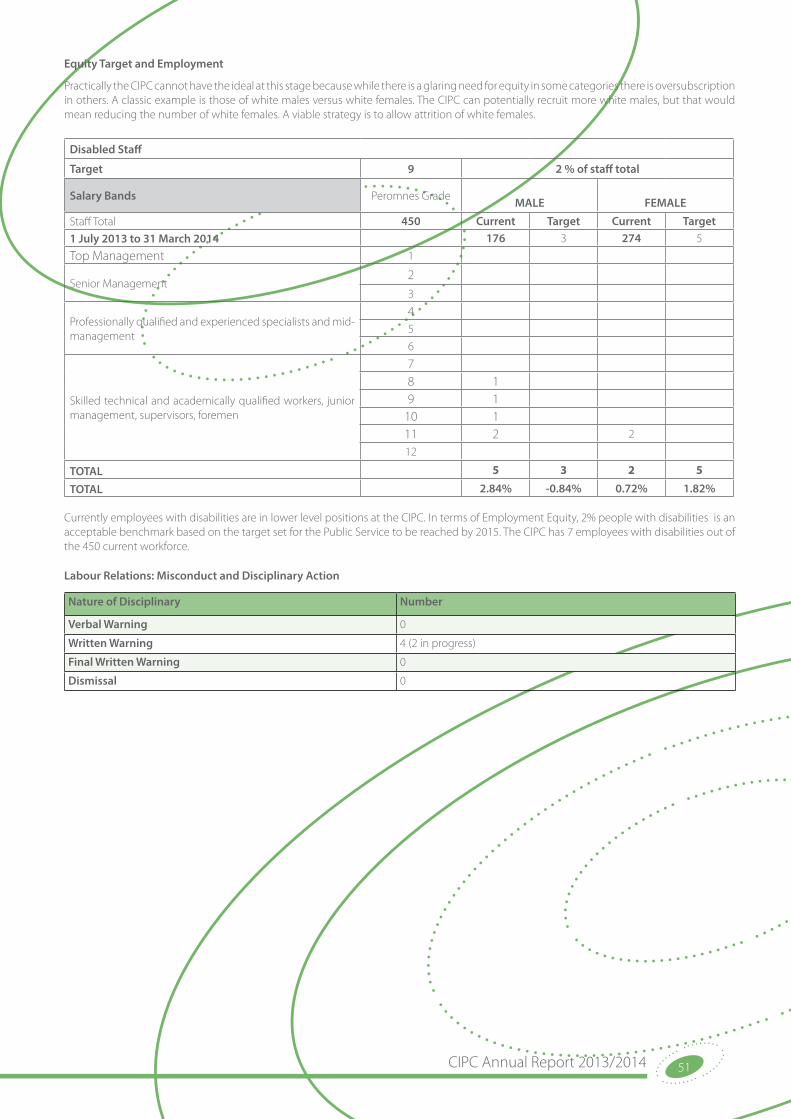
CIPC Annual Report 2013/2014 51
Equity Target and Employment
Practically the CIPC cannot have the ideal at this stage because while there is a glaring need for equity in some categories there is oversubscription in others. A classic example is those of white males versus white females. The CIPC can potentially recruit more white males, but that would mean reducing the number of white females. A viable strategy is to allow attrition of white females.
Disabled Staff
Target 9 2 % of staff total
Salary Bands Peromnes Grade MALE FEMALE
Staff Total 450 Current Target Current Target1 July 2013 to 31 March 2014 176 3 274 5
Top Management 1
Senior Management2 3
Professionally qualified and experienced specialists and mid-management
4 5 6
Skilled technical and academically qualified workers, junior management, supervisors, foremen
7 8 1 9 1
10 1 11 2 2
12
TOTAL 5 3 2 5
TOTAL 2.84% -0.84% 0.72% 1.82%
Currently employees with disabilities are in lower level positions at the CIPC. In terms of Employment Equity, 2% people with disabilities is an acceptable benchmark based on the target set for the Public Service to be reached by 2015. The CIPC has 7 employees with disabilities out of the 450 current workforce.
Labour Relations: Misconduct and Disciplinary Action
Nature of Disciplinary Number
Verbal Warning 0
Written Warning 4 (2 in progress)
Final Written Warning 0
Dismissal 0

Companies and Intellectual Property Commission52
“It takes 20 years to build a reputation and five minutes to ruin it. If you think about that,
you’ll do things differently.”Warren Buffett

CIPC Annual Report 2013/2014 53
PART E: Financial Information
“Sunlight is justly commended as the best disinfectant, electric light as the best policeman.” Justice Louis Brandeis (1916)
Companies and Intellectual Property Commission54
Part E: Financial Information5.1 Report of the External Auditor
Report of the Auditor-General to Parliament on the Companies and Intellectual Property Commission (CIPC)
Report on the Financial Statements
Introduction
1. I have audited the financial statements of the Companies and Intellectual Property Commission (CIPC) set out on pages 57 to 96, which comprise of the statement of financial position as at 31 March 2014, the statement of financial performance, statement of changes in net assets, statement of cash flows and statement of comparison of budget and actual amounts for the year then ended, as well as the notes, comprising a summary of significant accounting policies and other explanatory information.
Accounting authority’s responsibility for the financial statements
2. The accounting authority is responsible for the preparation and fair presentation of these financial statements in accordance with South African Standards of Generally Recognised Accounting Practice (SA Standards of GRAP) and the requirements of the Public Finance Management Act of South Africa, 1999 (Act No. 1 of 1999) (PFMA), and for such internal control as the accounting authority determines is necessary to enable the preparation of financial statements that are free from material misstatement, whether due to fraud or error.
Auditor-General’s responsibility
3. My responsibility is to express an opinion on these financial statements based on my audit. I conducted my audit in accordance with the Public Audit Act of South Africa, 2004 (Act No. 25 of 2004) (PAA), the general notice issued in terms thereof and International Standards on Auditing. Those standards require that I comply with ethical requirements and plan and perform the audit to obtain reasonable assurance about whether the financial statements are free from material misstatement.
4. An audit involves performing procedures to obtain audit evidence about the amounts and disclosures in the financial statements. The procedures selected depend on the auditor’s judgement, including the assessment of the risks of material misstatement of the financial statements, whether due to fraud or error. In making those risk assessments, the auditor considers internal control relevant to the entity’s preparation and fair presentation of the financial statements in order to design audit procedures that are appropriate in the circumstances, but not for the purpose of expressing an opinion on the effectiveness of the entity’s internal control. An audit also includes evaluating the appropriateness of accounting policies used and the reasonableness of accounting estimates made by management, as well as evaluating the overall presentation of the financial statements.
5. I believe that the audit evidence I have obtained is sufficient and appropriate to provide a basis for my audit opinion.
Opinion
6. In my opinion, the financial statements present fairly, in all material respects, the financial position of the CIPC as at 31 March 2014, and its financial performance and cash flows for the year then ended in accordance with SA Standards of GRAP and the requirements of the PFMA.
Emphasis of matter
7. I draw attention to the matter below. My opinion is not modified in respect of this matter.
Restatement of corresponding figures
8. As disclosed in note 29.2 to the financial statements, the corresponding figures for 31 March 2013 have been restated as a result of the finalisation of a legal opinion obtained by management as well as errors discovered by management during 2014 in the financial statements of the CIPC at, and for the year ended, 31 March 2013.
CIPC Annual Report 2013/2014 55
REPORT ON OTHER LEGAL AND REGULATORY REQUIREMENTS
9. In accordance with the PAA and the general notice issued in terms thereof, I report the following findings on the reported performance information against predetermined objectives for selected programmes presented in the annual performance report, non-compliance with legislation as well as internal control. The objective of my tests was to identify reportable findings as described under each subheading but not to gather evidence to express assurance on these matters. Accordingly, I do not express an opinion or conclusion on these matters.
Predetermined objectives
10. I performed procedures to obtain evidence about the usefulness and reliability of the reported performance information for the following selected programmes presented in the annual performance report of the public entity for the year ended 31 March 2014:
• Programme 1: Business regulation and reputation (on pages 24 to 25)
• Programme 3: Service delivery and access (on page 27)
11. I evaluated the reported performance information against the overall criteria of usefulness and reliability.
12. I evaluated the usefulness of the reported performance information to determine whether it was presented in accordance with the National Treasury’s annual reporting principles and whether the reported performance was consistent with the planned programmes. I further performed tests to determine whether indicators and targets were well defined, verifiable, specific, measurable, time bound and relevant, as required by the National Treasury’s Framework for managing programme performance information (FMPPI).
13. I assessed the reliability of the reported performance information to determine whether it was valid, accurate and complete.
14. The material findings in respect of the selected programmes are as follows:
Selected programmes
Reliability of reported performance information
15. The FMPPI requires auditees to have appropriate systems to collect, collate, verify and store performance information to ensure valid, accurate and complete reporting of actual achievements against planned objectives, indicators and targets.
16. I was unable to obtain the information and explanations I considered necessary to satisfy myself as to the reliability of the reported performance information.
17. This was due to the fact that the auditee could not provide sufficient appropriate evidence in support of the reported performance information and the auditee’s records not permitting the application of alternative audit procedures.
Additional matter
18. I draw attention to the following matter:
Achievement of planned targets
19. Refer to the annual performance report on pages 24 to 25 and page 27 for information on the achievement of planned targets for the year. This information should be considered in the context of the material findings on the reliability of the reported performance information for the selected programmes reported in paragraphs 15 to 17 of this report.
Compliance with laws and regulations
20. I performed procedures to obtain evidence that the public entity had complied with applicable legislation regarding financial matters, financial management and other related matters. My findings on material non-compliance with specific matters in key legislation, as set out in the general notice issued in terms of the PAA, are as follows:
Expenditure management
21. The accounting authority did not take effective steps to prevent irregular expenditure as required by section 51(1)(b)(ii) of the PFMA.

Companies and Intellectual Property Commission56
Internal control
22. I considered internal control relevant to my audit of the financial statements, annual performance report and compliance with legislation. The matters reported below are limited to the significant internal control deficiencies that resulted in the findings on the annual performance report and the findings on non-compliance with legislation included in this report.
Financial and performance management
23. Management did not timeously perform data validation processes and implement corrective action in order to ensure that performance information is supported by reliable reports. Furthermore, management did not have sufficient controls to ensure that source documentation supporting actual achievements was available.
24. Management did not take effective steps to timeously monitor compliance with applicable laws and regulations to prevent irregular expenditure.
Pretoria
29 July 2014

CIPC Annual Report 2013/2014 57
Annual Financial Statementsfor the year ended 31 March 2014

Companies and Intellectual Property Commission58
ContentsAccounting Authority’s Responsibility 59
Statement of Financial Position 60
Statement of Financial Performance 61
Statement of Changes in Net Assets 62
Statement of Cash Flows 63
Statement of Comparison of Budget and Actual amounts 64
Accounting Policies 65 – 75
Notes to the Annual Financial Statements 76 - 96
Business address: Bank details: ABSA
77 Meintjies Street PO Box 4210
Sunnyside Pretoria
Pretoria 0001
0002
Postal address: Auditors: Auditor General
PO Box 429 PO Box 446
Pretoria Pretoria
0001 0001
CIPC Annual Report 2013/2014 59
Accounting Authority’s responsibility for the annual financial statementsfor the year ended 31 March 2014
The financial statements for the year ended 31 March 2014, are prepared in accordance with South African Statements of Generally Recognised Accounting Practice (GRAP) and incorporate disclosure in line with the accounting policies of the entity and the requirements of the Public Finance Management Act 1999 (Act No. 1 of 1999) (PFMA). The financial statements after restatement are based on appropriate accounting policies consistently applied (unless otherwise stated) and, supported by reasonable and prudent judgments and estimates.
The Accounting Authority is responsible for the preparation and integrity of the financial statements and related information included in the Annual Report. In order for the Accounting Authority to discharge these responsibilities, as well as those imposed in terms of the PFMA and other applicable legislation, a system of internal controls has been developed, and maintained.
The internal controls include a risk-based system approach of internal auditing and administrative controls designed to provide reasonable, but not absolute, assurance that assets are safeguarded and transactions executed and recorded in accordance with generally accepted business practices, as well as the entity’s policies and procedures. Trained and skilled personnel, with an appropriate segregation of duties, implement these controls. Monitoring of these controls includes a regular review of their operations by the Accounting Authority and independent oversight by the Audit Committee.
The Auditor-General South Africa, as external auditor, is responsible for expressing an opinion on the financial statements.
The Accounting Authority approved and signed the annual financial statements for the year ended 31 March 2014, as set out on pages 57 to 96.
Ms A Ludin
Commissioner (Accounting Authority: Companies and Intellectual Property Commission) (CIPC)
Date: 29 July 2014
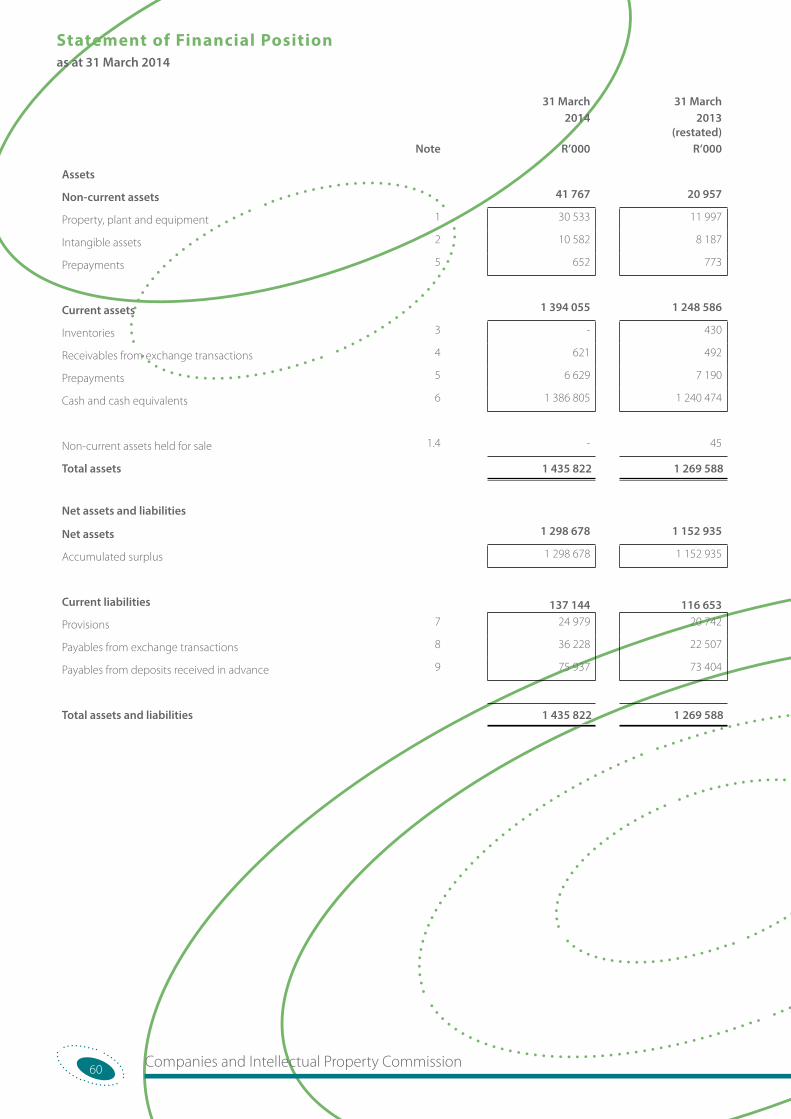
Companies and Intellectual Property Commission60
Statement of Financial Positionas at 31 March 2014
31 March 31 March2014 2013
(restated)Note R’000 R’000
Assets
Non-current assets 41 767 20 957
Property, plant and equipment 1 30 533 11 997
Intangible assets 2 10 582 8 187
Prepayments 5 652 773
Current assets 1 394 055 1 248 586
Inventories 3 - 430
Receivables from exchange transactions 4 621 492
Prepayments 5 6 629 7 190
Cash and cash equivalents 6 1 386 805 1 240 474
Non-current assets held for sale 1.4 - 45
Total assets 1 435 822 1 269 588
Net assets and liabilities
Net assets 1 298 678 1 152 935
Accumulated surplus 1 298 678 1 152 935
Current liabilities 137 144 116 653
Provisions 7 24 979 20 742
Payables from exchange transactions 8 36 228 22 507
Payables from deposits received in advance 9 75 937 73 404
Total assets and liabilities 1 435 822 1 269 588
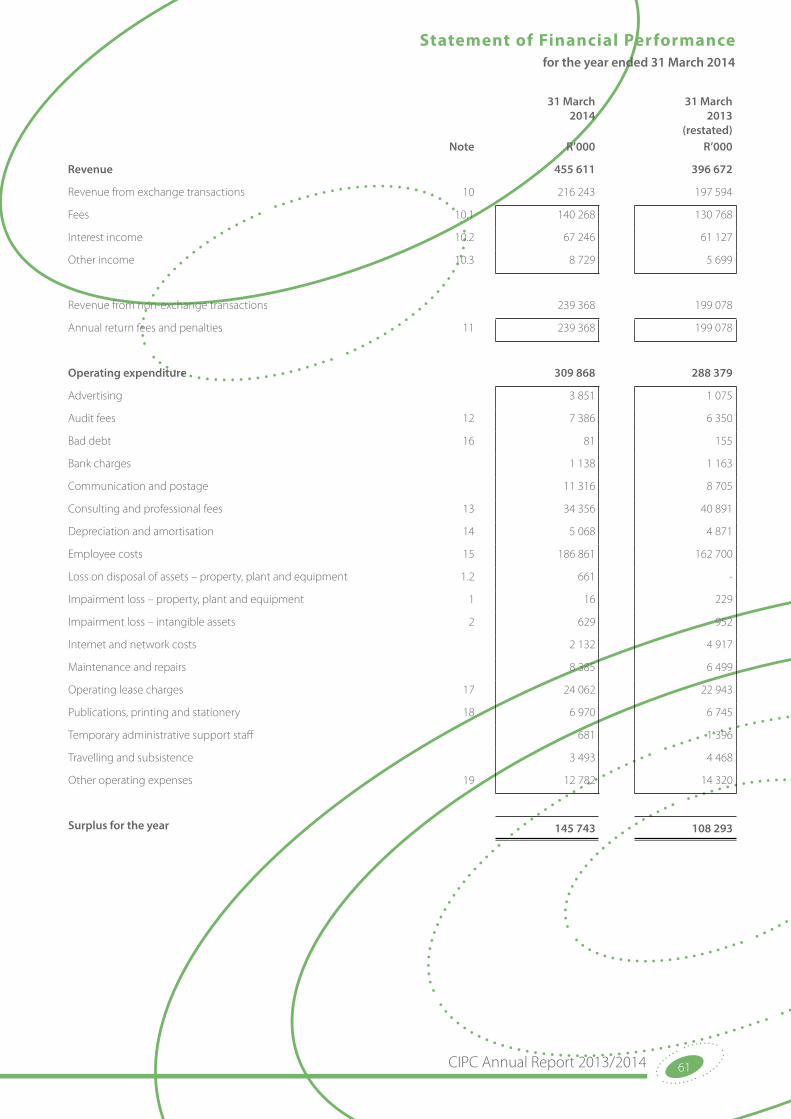
CIPC Annual Report 2013/2014 61
Statement of Financial Performancefor the year ended 31 March 2014
31 March 2014
31 March 2013
(restated)Note R’000 R’000
Revenue 455 611 396 672
Revenue from exchange transactions 10 216 243 197 594
Fees 10.1 140 268 130 768
Interest income 10.2 67 246 61 127
Other income 10.3 8 729 5 699
Revenue from non-exchange transactions 239 368 199 078
Annual return fees and penalties 11 239 368 199 078
Operating expenditure 309 868 288 379
Advertising 3 851 1 075
Audit fees 12 7 386 6 350
Bad debt 16 81 155
Bank charges 1 138 1 163
Communication and postage 11 316 8 705
Consulting and professional fees 13 34 356 40 891
Depreciation and amortisation 14 5 068 4 871
Employee costs 15 186 861 162 700
Loss on disposal of assets – property, plant and equipment 1.2 661 -
Impairment loss – property, plant and equipment 1 16 229
Impairment loss – intangible assets 2 629 952
Internet and network costs 2 132 4 917
Maintenance and repairs 8 385 6 499
Operating lease charges 17 24 062 22 943
Publications, printing and stationery 18 6 970 6 745
Temporary administrative support staff 681 1 396
Travelling and subsistence 3 493 4 468
Other operating expenses 19 12 782 14 320
Surplus for the year 145 743 108 293
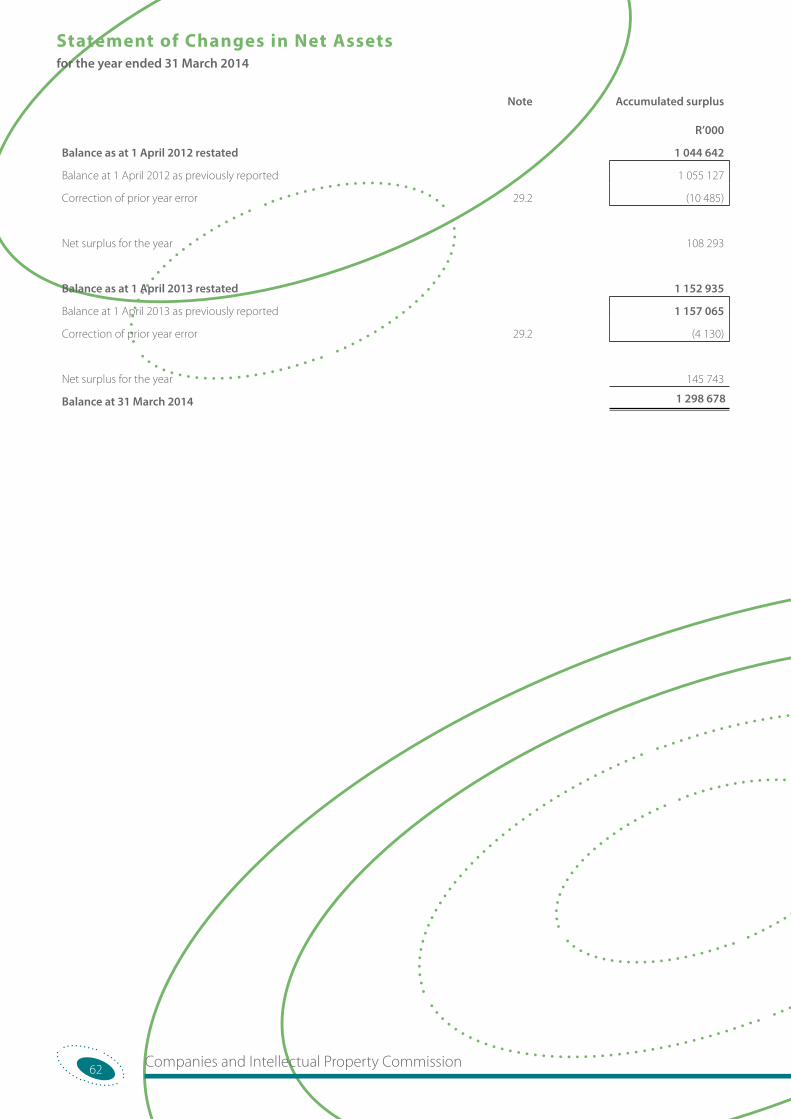
Companies and Intellectual Property Commission62
Statement of Changes in Net Assetsfor the year ended 31 March 2014
Note Accumulated surplus
R’000
Balance as at 1 April 2012 restated 1 044 642
Balance at 1 April 2012 as previously reported 1 055 127
Correction of prior year error 29.2 (10 485)
Net surplus for the year 108 293
Balance as at 1 April 2013 restated 1 152 935
Balance at 1 April 2013 as previously reported 1 157 065
Correction of prior year error 29.2 (4 130)
Net surplus for the year 145 743
Balance at 31 March 2014 1 298 678
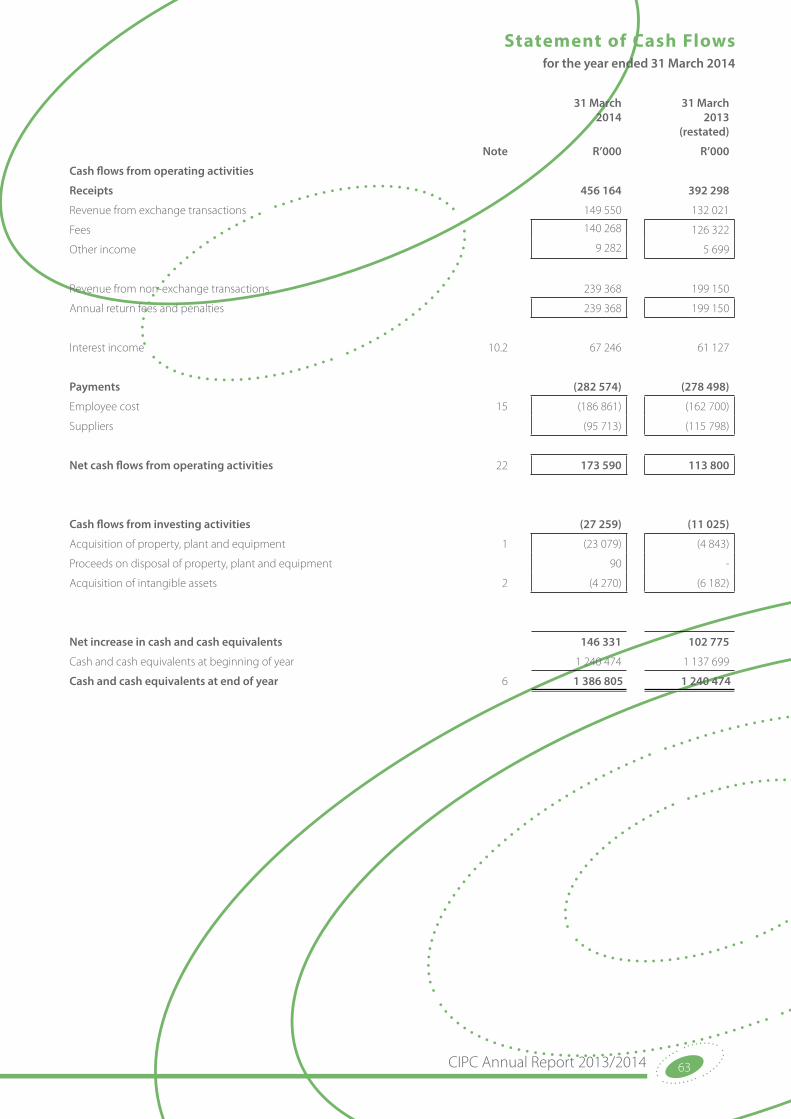
CIPC Annual Report 2013/2014 63
Statement of Cash Flowsfor the year ended 31 March 2014
31 March 2014
31 March 2013
(restated)
Note R’000 R’000
Cash flows from operating activities
Receipts 456 164 392 298
Revenue from exchange transactions 149 550 132 021
Fees 140 268 126 322
Other income 9 282 5 699
Revenue from non-exchange transactions 239 368 199 150
Annual return fees and penalties 239 368 199 150
Interest income 10.2 67 246 61 127
Payments (282 574) (278 498)
Employee cost 15 (186 861) (162 700)
Suppliers (95 713) (115 798)
Net cash flows from operating activities 22 173 590 113 800
Cash flows from investing activities (27 259) (11 025)
Acquisition of property, plant and equipment 1 (23 079) (4 843)
Proceeds on disposal of property, plant and equipment 90 -
Acquisition of intangible assets 2 (4 270) (6 182)
Net increase in cash and cash equivalents 146 331 102 775
Cash and cash equivalents at beginning of year 1 240 474 1 137 699
Cash and cash equivalents at end of year 6 1 386 805 1 240 474
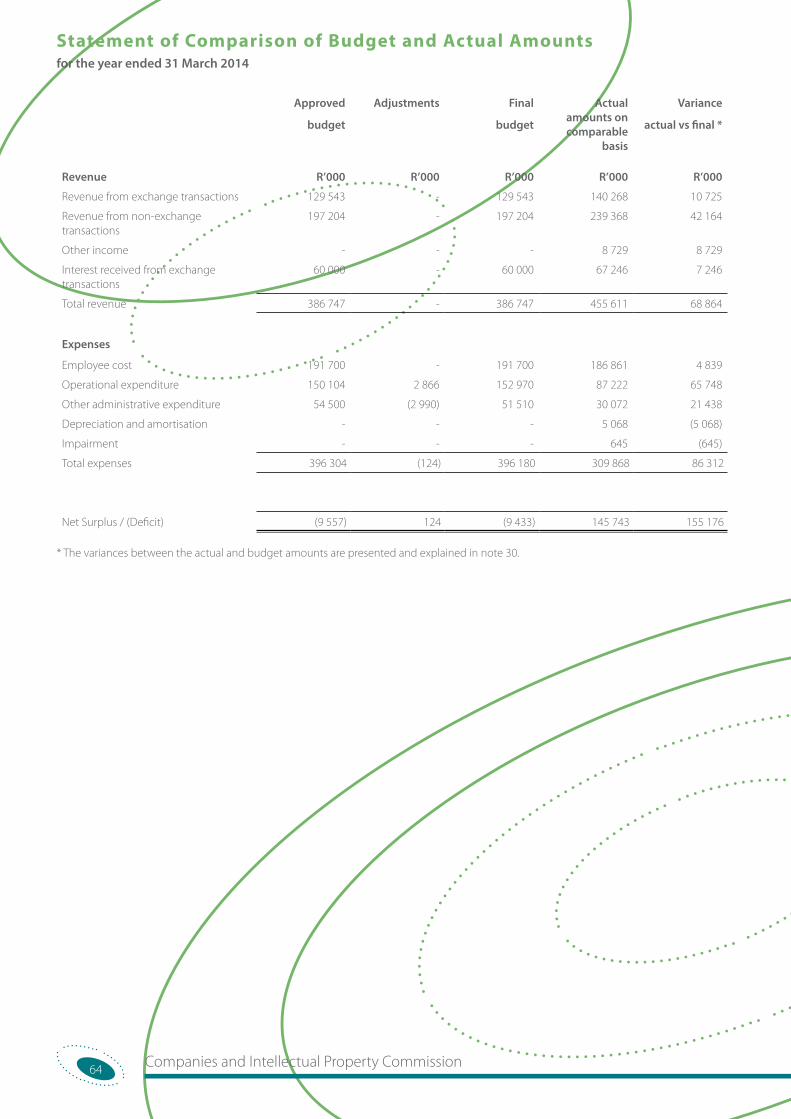
Companies and Intellectual Property Commission64
Statement of Comparison of Budget and Actual Amountsfor the year ended 31 March 2014
Approved
budget
Adjustments Final
budget
Actual amounts on comparable
basis
Variance
actual vs final *
Revenue R’000 R’000 R’000 R’000 R’000
Revenue from exchange transactions 129 543 - 129 543 140 268 10 725
Revenue from non-exchange transactions
197 204 - 197 204 239 368 42 164
Other income - - - 8 729 8 729
Interest received from exchange transactions
60 000 - 60 000 67 246 7 246
Total revenue 386 747 - 386 747 455 611 68 864
Expenses
Employee cost 191 700 - 191 700 186 861 4 839
Operational expenditure 150 104 2 866 152 970 87 222 65 748
Other administrative expenditure 54 500 (2 990) 51 510 30 072 21 438
Depreciation and amortisation - - - 5 068 (5 068)
Impairment - - - 645 (645)
Total expenses 396 304 (124) 396 180 309 868 86 312
Net Surplus / (Deficit) (9 557) 124 (9 433) 145 743 155 176
* The variances between the actual and budget amounts are presented and explained in note 30.
CIPC Annual Report 2013/2014 65
Accounting policiesfor the year ended 31 March 2014
1. Basis of preparation
The financial statements have been prepared in accordance with Standards of Generally Recognised Accounting Practice (GRAP), including any interpretations, guidelines and directives issued by the Accounting Standards Board (ASB) in accordance with Section 91(1) of the Public Finance Management Act (Act 1 of 1999).
These financial statements have been prepared on an accrual basis of accounting, and are in accordance with historical cost convention unless specified otherwise. They are presented in South African Rand. All figures have been rounded to the nearest thousand rand.
Applicable Standards of GRAP approved for which the Minister of Finance has determined the effective date and which were adopted:
Standard Description Objective
GRAP 1 Presentation of Financial Statements
The objective of this Standard is to prescribe the basis for presentation of general purpose financial statements, to ensure comparability both with the entity’s financial statements of previous years and with the financial statements of other entities. To achieve this objective, this Standard sets out overall considerations for the presentation of financial statements, guidelines for their structure and minimum requirements for their content. The recognition, measurement and disclosure of specific transactions, other events and conditions are dealt with in other Standards of GRAP.
GRAP 2 Cash Flow Statements The objective of this Standard is to require the provision of information about the historical changes in cash and cash equivalents of an entity by means of a cash flow statement which classifies cash flows during the year from operating, investing and financing activities.
GRAP 3 Accounting Policies, Changes in Accounting Estimates and Errors
The objective of this Standard is to prescribe the criteria for selecting and changing accounting policies, together with the accounting treatment and disclosure of changes in accounting policies, changes in accounting estimates and corrections of errors. The Standard is intended to enhance the relevance and reliability of the entity’s financial statements and the comparability of those financial statements over time and with the financial statements of other entities.
Disclosure requirements for accounting policies, except those for changes in accounting policies, are set out in the Standard of GRAP on Presentation of Financial Statements.
The application of this Standard of GRAP is considered to be consistent with the requirements of the equivalent Statement of SA GAAP which had been previously complied with, and therefore has no effect on the amounts previously reported.
GRAP 5 Borrowing Costs This Standard prescribes the accounting treatment for borrowing costs. This Standard generally requires an entity to capitalise borrowing costs that are directly attributable to the acquisition, construction or production of a qualifying asset as part of the cost of that asset. However, the Standard permits the expensing of borrowing costs where it is inappropriate to capitalise borrowing costs that are directly attributable to the acquisition, construction or production of a qualifying asset. Other borrowing costs are recognised as an expense.
GRAP 9 Revenue from Exchange Transactions
The objective of this Standard is to prescribe the accounting treatment of revenue arising from exchange transactions and events. The principle issue in accounting for revenue is determining when to recognise revenue. Revenue is recognised when it is probable that future economic benefits or service potential will flow to the entity and these benefits can be measured reliably. This Standard identifies the circumstances in which these criteria will be met and, therefore, revenue will be recognised. It also provides practical guidance on the application of these criteria.
GRAP 12 Inventories The objective of this Standard is to prescribe the accounting treatment for inventories. A principle issue in accounting for inventories is the amount of cost to be recognised as an asset and carried forward until the related revenues are recognised. This Standard provides guidance on the determination of cost and its subsequent recognition as an expense, including any write-down to net realisable value or current replacement cost. It also provides guidance on the cost formulas that are used to assign costs to inventories.
GRAP 13 Leases The objective of this Standard is to prescribe, for lessees and lessors, the appropriate accounting policies and disclosures to apply in relation to leases.
Companies and Intellectual Property Commission66
Accounting policiesfor the year ended 31 March 2014
Standard Description Objective
GRAP 14 Events After the Reporting Date
The objective of this Standard is to prescribe:
(a) when an entity should adjust its financial statements for events after the reporting date; and
(b) the disclosures that an entity should give about the date when the financial statements were authorised for issue and about events after the reporting date.
The Standard also requires that an entity should not prepare its financial statements on a going concern basis if events after the reporting date indicate that the going concern assumption is not appropriate.
GRAP 17 Property, Plant and Equipment
The objective of this Standard is to prescribe the accounting treatment for property, plant and equipment so that the users of financial statements can discern information about an entity’s investment in its property, plant and equipment, and the changes in such investment. The principal issues in accounting for property, plant and equipment are the recognition of the assets, the determination of their carrying amounts, and the depreciation charges and impairment losses to be recognised in relation to them.
GRAP 19 Provisions, Contingent Liabilities and Contingent Assets
The objective of this Standard is to define provisions, contingent liabilities and contingent assets, identify the circumstances in which provisions should be recognised, how they should be measured, and the disclosures that should be made about them. The Standard also requires that certain information be disclosed about contingent liabilities and contingent assets in the notes to the financial statements to enable users to understand their nature, timing and amount.
GRAP 21 Impairment of Non-cash-generating Assets
The objective of this Standard is to prescribe the procedures that an entity applies to determine whether a non-cash-generating asset is impaired, and to ensure that impairment losses are recognised. The Standard also specifies when an entity would reverse an impairment loss and prescribes disclosures.
GRAP 23 Revenue from Non-exchange Transactions (Taxes and Transfers)
The objective of this Standard is to prescribe requirements for the financial reporting of revenue arising from non-exchange transactions, other than non-exchange transactions that give rise to an entity combination. The Standard deals with issues that need to be considered in recognising and measuring revenue from non-exchange transactions, including the identification of contributions from owners.
GRAP 24 Presentation of Budget Information in Financial Statements
This Standard requires a comparison of budget amounts and the actual amounts arising from execution of the budget to be included in the financial statements of entities that are required to, or elect to, make publicly available their approved budget and for which they are, therefore, held publicly accountable. The Standard also requires disclosure of an explanation of the reasons for material differences between the budget and actual amounts. Compliance with the requirements of this Standard will ensure that entities discharge their accountability obligations and enhance the transparency of their financial statements by demonstrating compliance with the approved budget for which they are held publicly accountable and, where the budget and the financial statements are prepared on the same basis, their financial performance in achieving the budgeted results.
GRAP 25 Employee Benefits The objective of this Standard is to prescribe the accounting and disclosure for employee benefits. The Standard requires an entity to recognise:
(a) a liability when an employee has provided service in exchange for employee benefits to be paid in the future; and
(b) an expense when the entity consumes the economic benefits or service potential arising from service provided by an employee in exchange for employee benefits.
The implementation of the standard will not have a material impact on the annual financial statements and may lead to additional disclosure requirements.
GRAP 26 Impairment of cash-generating Assets
The objective of this Standard is to prescribe the procedures that an entity applies to determine whether a cash-generating asset is impaired and to ensure that impairment losses are recognised. The Standard also specifies when an entity would reverse an impairment loss and prescribes disclosures.
CIPC Annual Report 2013/2014 67
Accounting policiesfor the year ended 31 March 2014
Standard Description Objective
GRAP 31 Intangible Assets The objective of this Standard is to prescribe the accounting treatment for intangible assets that are not dealt with specifically in another Standard of GRAP. This Standard requires an entity to recognise an intangible asset if, and only if, specified criteria are met. The Standard also specifies how to measure the carrying amount of intangible assets and requires specified disclosures about intangible assets.
GRAP 100 Non-current Assets held for Sale and Discontinued Operations
The objective of this Standard is to specify the accounting for assets held for sale, and the presentation and disclosure of discontinued operations. In particular, the Standard requires:
(a) assets that meet the criteria to be classified as held for sale to be measured at the lower of carrying amount and fair value less costs to sell, and depreciation on such assets to cease; and
(b) assets that meet the criteria to be classified as held for sale to be presented separately on the face of the statement of financial position and the results of discontinued operations to be presented separately in the statement of financial performance.
GRAP 104 Financial Instruments This Standard prescribes recognition, measurement, presentation and disclosure requirements for financial instruments. Financial instruments are broadly defined as those contracts that results in a financial asset in one entity, and a financial liability or residual interest in another entity. A key distinguishing factor between financial assets and financial liabilities and other assets and liabilities, is that they are settled in cash or by exchanging financial instruments rather than through the provision of goods or services.
Applicable directives to Standards of GRAP approved for which the Minister of Finance has determined the effective date and which were adopted:
Directive Description
Directive 1 Repeal of Existing Transitional Provisions in, and Consequential Amendments to, Standards of GRAP
Directive 2 Transitional Provisions for the Adoption of Standards of GRAP by Public Entities, Municipal Entities and Constitutional Institutions
Directive 5 Determining the GRAP Reporting Framework
Directive 7 The Application of Deemed Cost on the Adoption of Standards of GRAP
Applicable interpretations of the Standards of GRAP for which the Minister of Finance has determined the effective date and which were adopted:
Interpretation Description
IGRAP 1 Applying the Probability Test on Initial Recognition of Exchange Revenue
IGRAP 3 Determining Whether an Arrangements Contains a Lease
IGRAP 14 Recognised Accounting Practice Evaluating The Substance of Transactions Involving the Legal Form of a Lease
IGRAP 16 Applying the Probability test on Initial Recognition of Revenue
Applicable Standards of GRAP approved, but for which the Minister of Finance has not yet determined an effective date, and that entities may consider to early adopt:
Standards Description Objective
GRAP 20 Related Party Disclosures The objective of this Standard is to ensure that a reporting entity’s financial statements contain the disclosures necessary to draw attention to the possibility that its financial position and surplus or deficit may have been affected by the existence of related parties and by transactions and outstanding balances with such parties.
The implementation of the standard will not have a material impact on the annual financial statements and may lead to additional disclosure requirements.
GRAP 105 Transfer of Functions between Entities under Common Control
The objective of this Standard is to establish accounting principles for the acquirer and transferor in a transfer of functions between entities under common control.
The implementation of the standard will not have a material impact on the annual financial statements and may lead to additional disclosure requirements.
GRAP 108 Statutory Receivables The objective of this Standard is to prescribe accounting requirements for the recognition, measurement, presentation and disclosure of statutory receivables.
Companies and Intellectual Property Commission68
Accounting policiesfor the year ended 31 March 2014
Standards, interpretations and directives of Standards of GRAP approved, whether effective or not, which are not applicable to the operations of the CIPC:
GRAP 6 Consolidated and Separate Financial Statements
GRAP 7 Investments in Associates
GRAP 8 Interests in Joint Ventures
GRAP 10 Financial Reporting in Hyperinflationary Economies
GRAP 11 Construction Contracts
GRAP 12 Inventory
GRAP 16 Investment Property
GRAP 18 Segment Reporting
GRAP 27 Agriculture
GRAP 32 Service Concession Arrangements: Grantor
GRAP 103 Heritage Assets
GRAP 106 Transfer of functions between Entities not under Common Control
GRAP 107 Mergers
IGRAP 2 Changes in Existing Decommissioning, Restoration and Similar Liabilities
IGRAP 4 Practice Rights to Interests Arising from Decommissioning, Restoration and Environmental Rehabilitation Funds
IGRAP 5 Applying the Restatement Approach under The Standard of GRAP on Financial Reporting in Hyperinflationary Economies
IGRAP 6 Loyalty Programmes
IGRAP 7 The Limit on a Defined Benefit Asset, Minimum Funding Requirements and their Interaction
IGRAP 8 Agreements for the Construction of Assets from Exchange Transactions
IGRAP 9 Distributions of Non-Cash Assets to Owners
IGRAP 10 Assets Received from Customers
IGRAP 11 Consolidation – Special Purpose Entities
IGRAP 12 Jointly Controlled Entities – Non-Monetary Contributions by Ventures
IGRAP 13 Operating Leases – Incentives
IGRAP 15 Revenue – Barter Transactions Involving Advertising Services
IGRAP 17 Service Concession Arrangements Where a Grantor Controls a Significant Residual Interest in an Asset
Directive 3 Transitional Provisions for High Capacity Municipalities
Directive 4 Transitional Provisions for Medium and Low Capacity Municipalities
Directive 6 Transitional Provisions for Revenue collected by the South African Revenue Service (SARS)
Directive 8 Transitional Provisions for Parliament and Provincial Legislatures
Directive 9 The application of the Standards of GRAP by Trading Entities
CIPC Annual Report 2013/2014 69
Accounting policiesfor the year ended 31 March 2014
2. Property, plant and equipment
Items of property, plant and equipment are stated at cost less accumulated depreciation and impairment losses. Property, plant and equipment are depreciated on a straight-line basis so as to write of the cost of each asset to its residual value over its estimated useful life. Depreciation commences when assets are available for use. Management expects to dispose the assets at the end of their useful lives and therefore the residual values are estimated to be negligible. Useful lives and residual values are assessed on an annual basis.
Where parts of an item of property, plant and equipment have different useful lives, they are accounted for as separate items of property, plant and equipment.
The cost of an item of property, plant and equipment is recognised as an asset when:
• it is probable that future economic benefits or service potential associated with the item will flow to the commission; and
• the cost or fair value of the item can be measured reliably.
The estimated useful lives of property, plant and equipment are currently as follows:
• Computer equipment
• Office furniture and other equipment
• Leasehold improvements
3 – 10 years
5 – 15 years
Lease period
Gains and losses on disposal of an item of property, plant and equipment are determined by comparing the proceeds from disposal with the carrying amount of property, plant and equipment, and are recognised net within other income in surplus or deficit.
Subsequent expenditure incurred on items of property, plant and equipment is only capitalised to the extent that such expenditure enhances the value or previous capacity of those assets. Repairs and maintenance not deemed to enhance the economic benefits or service potential of items of property, plant and equipment are expensed as incurred.
Items of property, plant and equipment are derecognised when the asset is disposed of, or when there are no further economic benefits or service potential expected from the use of the asset.
3. Intangible assets
Recognition and measurement
Intangible assets represent directly attributable costs associated with the acquisition, development and installation of computer software and licences. Software, which is not an integral part of related computer hardware, is classified as intangible assets.
Intangible assets are stated at cost less accumulated amortisation and impairment losses. Costs pertaining to research are charged to surplus or deficit. Development costs are recognised as intangible assets. The cost of an item of intangible assets is recognised as an asset when:
• it is probable that future economic benefits or service potential associated with the item will flow to the commission; and
• the cost or fair value of the item can be measured reliably.
An intangible asset arising from development of an internal project is recognised when the following can be demonstrated:
(a) the technical feasibility of completing the intangible asset so that it will be available for use;
(b) intention to complete the intangible asset and use it;
(c) ability to use the intangible asset;
(d) how the intangible asset will generate probable future economic benefits or service potential;
(e) the availability of adequate technical, financial and other resources to complete the development and to use the intangible asset;
(f ) its ability to measure reliably the expenditure attributable to the intangible asset during its development.
Companies and Intellectual Property Commission70
Accounting policiesfor the year ended 31 March 2014
Amortisation
Amortisation is calculated over the cost of the asset, or other amount substituted for cost, less its residual value.
Amortisation is recognised in profit or loss on a straight-line basis over the estimated useful lives of intangible assets, other than goodwill, from the date that they are available for use, since this most closely reflects the expected pattern of consumption of the future economic benefits or service potential embodied in the asset. Useful lives and residual values are assessed on an annual basis. The estimated useful lives of intangible assets are currently as follows:
• Computer software 5 – 12 years
Impairment losses are determined as the excess of the carrying amount of intangible assets over the recoverable service amount, and are charged to surplus or deficit.
An intangible asset is derecognised on disposal, or when no future economic benefits are expected from use or disposal. Gains and losses arising from derecognition of an intangible asset, measured as the difference between the net disposal proceeds and the carrying amount of the assets, are recognised in surplus or deficit when the asset is derecognised.
Subsequent expenditure incurred on intangible assets is only capitalised to the extent that such expenditure enhances the value or previous capacity of those assets. Repairs and maintenance not deemed to enhance the economic benefits or service potential of intangible assets, are expensed as incurred.
4. Non-current assets held for sale
Non-current assets are classified as held for sale if their carrying amount will be recovered principally through a sale transaction rather than through continuing use. This condition is regarded as met only when the sale is highly probable and the asset is available for immediate sale in its present condition. Management must be committed to the sale, which should be expected to qualify for recognition as a completed sale within one year from the date of classification.
Non-current assets held for sale are measured at the lower of its carrying amount and fair value less costs to sell. A non-current asset is not depreciated nor amortised while it is classified as held for sale.
Interest and other expenses attributable to the liabilities of a disposal group classified as held for sale are recognised in surplus or deficit.
5. Impairment
Financial assets
A financial asset not carried at fair value is assessed at each reporting date to determine whether there is objective evidence that it is impaired. A financial asset is impaired if objective evidence indicates that a loss event has occurred after the initial recognition of the asset, and that the loss event had a negative effect on the estimated future cash flows of that asset that can be estimated reliably.
Objective evidence that financial assets are impaired can include default or delinquency of a receivable, or other indications that a debtor will enter bankruptcy.
Evidence of impairment for receivables is considered at both a specific and collective asset level. All individually significant receivables are assessed for specific impairment. All individually significant receivables not to be specifically impaired are then collectively assessed for any impairment that has been incurred but not yet identified. Receivables that are not individually significant are collectively assessed for impairment by grouping together receivables with similar risk characteristics.
An impairment loss in respect of a financial asset measured at amortised cost is calculated as the difference between its carrying amount and the present value of the estimated future cash flows, discounted at the asset’s original effective interest rate. Losses are recognised in surplus and deficit and reflected in an allowance account against receivables. When a subsequent event causes the amount of impairment loss to decrease, the decrease in impairment loss is reversed through surplus and deficit.
CIPC Annual Report 2013/2014 71
Accounting policiesfor the year ended 31 March 2014
Non-financial assets
Non-cash generating assets
The carrying amounts of the entity’s non-financial (non-cash generating) assets are reviewed at each reporting date to determine whether there is any indication of impairment. If any such indication exists, the entity will estimate the recoverable service amount of the asset. The recoverable service amount of an asset is the greater of its value in use, and its fair value less costs to sell. In assessing value in use, the present value of the asset’s remaining service potential must be determined. The present value of the remaining service potential of the asset is determined by using the depreciated replacement cost approach. Under this approach, the present value of the remaining service potential of an asset is determined as the depreciated replacement cost of the asset. The replacement cost of an asset is the cost to replace the asset’s gross service potential. This cost is depreciated to reflect the asset in its used condition.
When the recoverable service amount of an asset is less than its carrying amount, the carrying amount of the asset is reduced to its recoverable service amount. That reduction is an impairment loss and is recognised in surplus and deficit. An impairment loss recognised in prior years for an asset is reversed if, and only if, there has been a change in the estimates used to determine the asset’s recoverable service amount since the last impairment loss was recognised. If this is the case, the carrying amount of the asset is increased to its recoverable service amount. That increase is a reversal of an impairment loss.
Cash generating assets
The carrying amounts of the entity’s non-financial (cash generating) assets, other than inventories, are reviewed at each reporting date to determine whether there is any indication of impairment. If any such indication exists, then the asset’s recoverable amount is estimated.
The recoverable amount of an asset or cash-generating unit is the greater of its value in use, and its fair value less costs to sell. In assessing value in use, the estimated future cash flows are discounted to their present value using a pre-tax discount rate that reflects current market assessments of the time, value for money and the risks specific to the asset. For the purpose of impairment testing, assets that cannot be tested individually are grouped together into the smallest group of assets that generates cash inflows from continuing use that are largely independent of the cash inflows of other assets or groups of assets (the “cash-generating unit”, or “CGU”).
An impairment loss is recognised if the carrying amount of an asset or its CGU, exceeds its estimated recoverable amount. Impairment losses are recognised in surplus and deficit.
Impairment losses recognised in prior years are assessed at each reporting date for any indications that the loss has decreased or no longer exists. An impairment loss is reversed if there has been a change in the estimates used to determine the recoverable amount. An impairment loss is reversed only to the extent that the assets carrying amount does not exceed the carrying amount that would have been determined, net of depreciation or amortisation, if no impairment loss had been recognised.
6. Operating Leases
Operating leases where the lessor retains the risks and rewards of ownership of the underlying asset are classified as operating leases.
Rentals payable under operating leases are charged as an expense on a straight-line basis over the term of the lease.
7. Inventories
Inventories are recognised as an asset if, and only if:
(a) it is probable that future economic benefits or service potential associated with the item will flow to the entity, and
(b) the cost of the inventories can be measured reliably.
Inventories that qualify for recognition as assets are initially measured at cost. Inventories comprise stationery and consumables and are stated at the lower of cost and net realisable value. Cost is determined using the weighted average cost method.
Obsolete, redundant, damaged and slow-moving inventory and any write-down of inventory to net realisable value are charged to surplus or deficit.
8. Financial instruments
Financial assets
The entity initially recognises loans and receivables and deposits on the date that it originated. All other financial assets, including assets at fair value, are recognised initially on the trade date at which the entity becomes a party to the contractual provisions of the instrument.
Companies and Intellectual Property Commission72
Accounting policiesfor the year ended 31 March 2014
Financial assets relevant to the entity comprise trade and other receivables and cash and cash equivalents. Classification depends on the purpose for which the financial instruments were obtained and takes place at initial recognition. Management determines the classification of its financial assets at initial recognition.
The entity classifies financial assets into the following category:
• Financial instruments at amortised cost.
Cash and cash equivalents
Cash and cash equivalents comprise cash balances and deposits with original maturities of three months or less.
Loans and receivables
Loans and receivables are financial assets with fixed or determinable payments that are not quoted in an active market. Such assets are recognised initially at fair value plus any directly attributable transaction costs. Subsequent to initial recognition, loans and receivables are measured at amortised cost using the effective interest method, less any impairment losses. Loans and receivables comprise prepayments and receivables from exchange transactions.
Financial liabilities
All financial liabilities are recognised initially on the trade date at which the entity becomes a party to the contractual provisions of the instrument.
Financial assets and liabilities are offset, and the net amount presented in the statement of financial position when, and only when, the entity or a third party has a legal right to offset the amounts and intends either to settle on a net basis, or to realise the asset and settle the liability simultaneously.
Non-derivative financial liabilities relevant to the entity are loans and borrowings and trade and other payables. Such financial liabilities are recognised initially at fair value plus any directly attributable transaction costs. Subsequent to initial recognition these financial liabilities are measured at amortised cost using the effective interest method.
Payables from deposits received in advance: Deferred income
Deferred income represents advance payments received from customers for future transactions. Deferred income that has not been utilised for a period of 36 months from receipt, is recognised as revenue.
Fair value determination
Financial assets and financial liabilities are subsequently measured at amortised cost. The interest expense or revenue is calculated using the effective interest rate method. This method calculates the rate of interest that is necessary to discount the estimated stream of principal and interest cash flows through the expected life of the financial instrument, to equal the amount at initial recognition. The rate is then applied to the carrying amount at each reporting date to determine the interest expense or income for the year. In this manner, the interest expense or income is recognised on a level yield to maturity basis.
Derecognition
A financial asset is derecognised only when:
h) the contractual rights to the cash flows from the financial asset expire, are settled or waived;
i) the entity transfers to another party substantially all of the risks and rewards of ownership of the financial asset;
j) or the entity, despite having retained some significant risks and rewards of ownership of the financial asset, has transferred control of the asset to another party, and the other party has the practical ability to sell the asset in its entirety to an unrelated third party, and is able to exercise that ability unilaterally and without needing to impose additional restrictions on the transfer. In this case, the entity will:
(i) derecognise the asset; and
(ii) recognise separately any rights and obligations created or retained in the transfer.
A financial liability (or a part of a financial liability) is removed from the statement of financial position when, and only when, the obligation specified in the contract is discharged, cancelled, expired or waived.

CIPC Annual Report 2013/2014 73
Accounting policiesfor the year ended 31 March 2014
Gains and losses
A gain or loss arising from a change in the fair value of a financial asset or financial liability measured at fair value is recognised in surplus or deficit. For financial assets and financial liabilities measured at amortised cost or cost, a gain or loss is recognised in surplus or deficit when the financial asset or financial liability is derecognised or impaired, or through the amortisation process.
Offsetting
Financial assets and liabilities are offset and the net amount presented in the statement of financial position when, and only when, the entity or a third party has a legal right to offset the amounts, and intends either to settle on a net basis or to realise the asset and settle the liability simultaneously.
9. Revenue from exchange transactions
Exchange transactions are transactions in which one entity receives assets or services, or has liabilities extinguished, and directly gives approximately equal value (primarily in the form of cash, goods, services, or use of assets) to another entity in exchange.
Interest income
Interest income comprises interest income on funds invested. Interest income is recognised on a time proportion basis using the effective interest rate method.
Revenue from fees
Revenue is measured at the fair value of the consideration received or receivable.
When the outcome of the rendering of a service can be measured reliably, revenue associated with the transaction is recognised at the stage of completion of the transaction. The outcome of the transaction can be estimated reliably when all the following conditions are satisfied:
• the amount of revenue can be measured reliably;
• it is probable that the economic benefits associated with the transaction will flow to the entity;
• the stage of completion of the transaction can be measured reliably; and
• the costs incurred for the transaction and the costs to complete the transaction can be measured reliably.
When the outcome of a transaction involving the rendering of a service cannot be measured reliably, revenue is recognised only to the extent of the expenses recoverable.
Advance payments on customer accounts are only recognised as revenue on the rendering of services. Customer accounts that have insufficient funds are raised as receivables.
Trade receivables from exchange transactions
Exchange revenue is measured at the fair value of the consideration received or receivable. Exchange revenue comprises finance income and other operating income, and is recognised when it is probable that future economic benefits will flow to the entity, and these benefits can be measured reliably. Accounts receivable arising from these transactions are categorised as financial instruments at amortised cost.
10. Revenue from non-exchange transactions
Non-exchange transactions are transactions that are not exchange transactions. In a non-exchange transaction, an entity either receives value from another entity without directly giving approximately equal value in exchange, or gives value to another entity without directly receiving approximately equal value in exchange.
Revenue from annual return fees
An inflow of resources from a non-exchange transaction recognised as an asset is recognised as revenue, except to the extent that a liability is also recognised in respect of the same inflow.
Non-exchange revenue comprises annual return revenue and transfer revenue.
An inflow of resources from a non-exchange transaction is recognised as revenue at fair value. Fair value is deemed to be the transaction cost and is based on the annual return fee as prescribed in the annual returns table as set out in Annexure 2 of the Companies Regulations, 2011.

Companies and Intellectual Property Commission74
Accounting policiesfor the year ended 31 March 2014
Trade receivables from non-exchange transactions
Annual return fees are recognised only when an entity filed an annual return, since this is when the initial recognition criteria are met. The filing and payment of the annual return constitutes a single transaction, as these transactions must happen simultaneously to file a successful annual return and is measured at fair value.
Transfer revenue is an unconditional government grant related to operational costs that is measured at fair value of the consideration received, and is recognised when the transfer becomes receivable.
11. Finance cost
Finance expenses comprise interest expense on borrowings. Borrowing costs are recognised using the effective interest method.
12. Provisions and contingencies
Provisions are recognised when the entity has a present legal or constructive obligation as a result of past events, and it is probable that an outflow of economic benefits will be required to settle the obligation, and a reliable estimate can be made of the amount of the obligation. The amount of a provision is the best estimate of the expenditure expected to be required to settle the present obligation at the reporting date.
Provisions are determined by discounting the expected future cash flows at a pre-tax rate which reflects current market assessments of the time value of money, and the risks specific to the liability. The unwinding of the discount is recognised as finance cost.
Contingent assets and liabilities are not recognised but are disclosed unless the possibility of flow of resources is remote. If the disclosures of contingencies may seriously prejudice the entity then the general nature of the contingency is disclosed, together with the reason as to why further information is not disclosed.
13. Employee benefits
Post-employment benefits – Retirement
The entity makes contributions to the Government Employees’ Pension Fund along with its employees to provide for retirement benefits. The Commission is liable for any shortfall in the fund. Contributions are charged to surplus or deficit when made.
Short and long-term benefits
The cost of all short-term employee benefits, such as salaries, bonuses, housing allowances, medical and other contributions are recognised during the year in which the employee renders the related service, and is not discounted.
A liability is recognised for the amount expected to be paid under short-term cash bonus or profit-sharing plans, if the entity has a present legal or constructive obligation to pay this amount as a result of past service provided by the employee, and the obligation can be estimated reliably.
14. Critical accounting estimates and judgements
The preparation of the annual financial statements in conformity with GRAP requires management to make judgements, estimates and assumptions that affect the application of accounting policies and the reported amounts of assets, liabilities, income and expenses. Actual results may differ from these estimates. The estimates and assumptions that have a significant risk of causing a material adjustment to the carrying amounts of assets and liabilities are detailed in the notes to the financial statements, where applicable. Management continuously evaluates estimates and judgments based on historical experience and other factors, including expectations of future events that are believed to be reasonable under the circumstances. Except for those mentioned below, details of management accounting estimates and judgements are disclosed under the relevant notes.
15. Budget information
The approved and final budget amounts and variances between the actual and budget amounts are presented and explained. The approved budget is prepared on a cash basis and is presented by functional classification.
CIPC Annual Report 2013/2014 75
Accounting policiesfor the year ended 31 March 2014
16. Irregular expenditure
Irregular expenditure comprises expenditure, other than unauthorised expenditure, incurred in contravention of, or that is not in accordance with, a requirement of any applicable legislation, including:
• the Public Finance Management Act (PFMA), Act 1 of 1999 (as amended by Act 29 of 1999); or
• the State Tender Board Act, 1968 (Act No. 86 of 1968; or any regulation made in terms of the that Act).
Irregular expenditure is accounted for as expenditure in the statement of financial performance and where relevant a receivable is raised in the statement of financial position.
17. Fruitless and wasteful expenditure
Fruitless and wasteful expenditure means expenditure that was made in vain, and which would have been avoided had reasonable care been exercised.
Fruitless and wasteful expenditure is accounted for as expenditure in the statement of financial performance and where relevant a receivable is raised in the statement of financial position.
18. Related parties
Related parties are identified as being those parties that control or have significant influence over the CIPC and those parties that are controlled or significantly influenced by the CIPC. Disclosure is made of all relationships involving control, even when there are no transactions between such parties during the year, all other related party transactions and management compensation.
All related party transactions are consistent with normal operating relationships between the entities, and are undertaken on terms and conditions that are normal for such transactions in these circumstances.
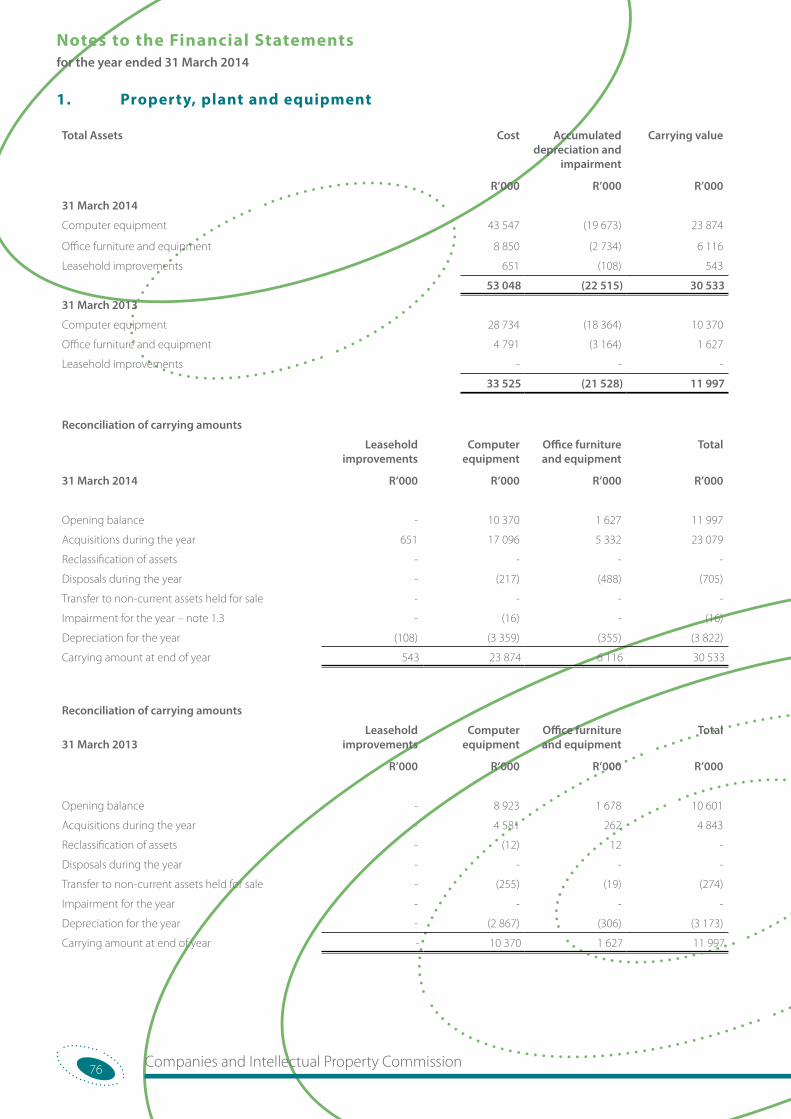
Companies and Intellectual Property Commission76
Notes to the Financial Statements for the year ended 31 March 2014
1. Property, plant and equipment
Total Assets Cost
R’000
Accumulated depreciation and
impairment
R’000
Carrying value
R’000
31 March 2014
Computer equipment 43 547 (19 673) 23 874
Office furniture and equipment 8 850 (2 734) 6 116
Leasehold improvements 651 (108) 543
53 048 (22 515) 30 533
31 March 2013
Computer equipment 28 734 (18 364) 10 370
Office furniture and equipment 4 791 (3 164) 1 627
Leasehold improvements - - -
33 525 (21 528) 11 997
Reconciliation of carrying amounts
31 March 2014
Leasehold improvements
R’000
Computer equipment
R’000
Office furniture and equipment
R’000
Total
R’000
Opening balance - 10 370 1 627 11 997
Acquisitions during the year 651 17 096 5 332 23 079
Reclassification of assets - - - -
Disposals during the year - (217) (488) (705)
Transfer to non-current assets held for sale - - - -
Impairment for the year – note 1.3 - (16) - (16)
Depreciation for the year (108) (3 359) (355) (3 822)
Carrying amount at end of year 543 23 874 6 116 30 533
Reconciliation of carrying amounts
31 March 2013Leasehold
improvements
R’000
Computer equipment
R’000
Office furniture and equipment
R’000
Total
R’000
Opening balance - 8 923 1 678 10 601
Acquisitions during the year - 4 581 262 4 843
Reclassification of assets - (12) 12 -
Disposals during the year - - - -
Transfer to non-current assets held for sale - (255) (19) (274)
Impairment for the year - - - -
Depreciation for the year - (2 867) (306) (3 173)
Carrying amount at end of year - 10 370 1 627 11 997
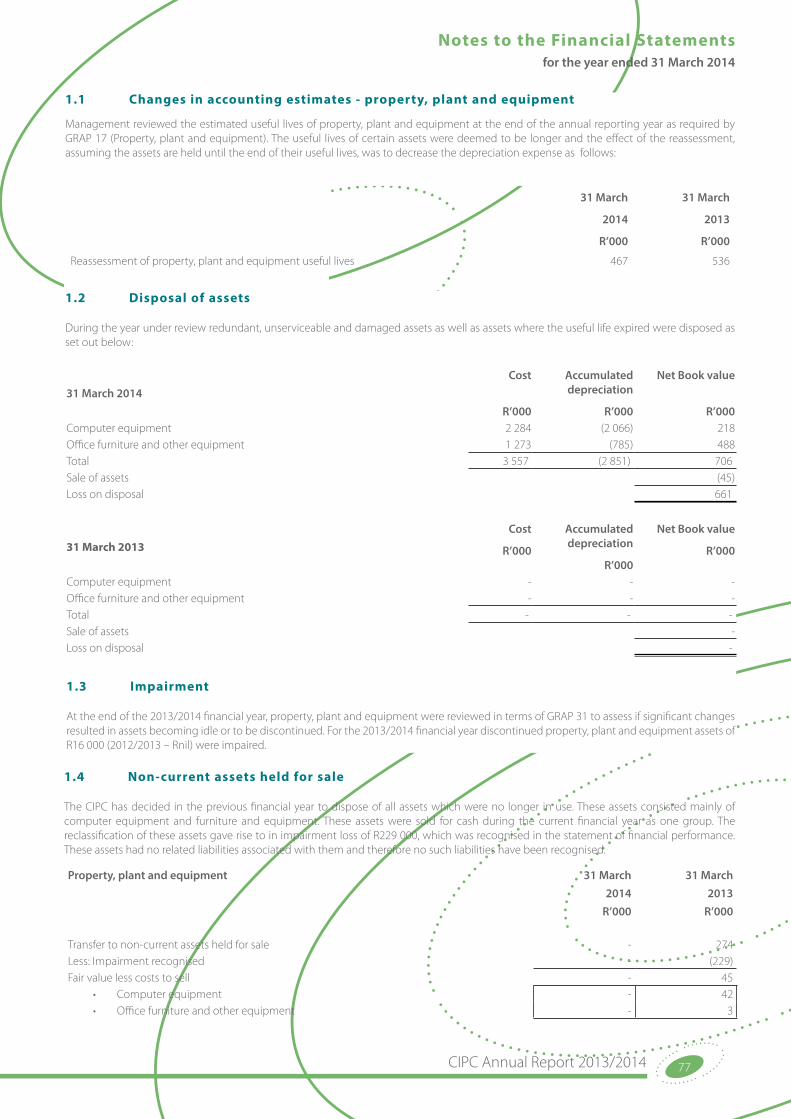
CIPC Annual Report 2013/2014 77
Notes to the Financial Statements for the year ended 31 March 2014
1.1 Changes in accounting estimates - property, plant and equipment
Management reviewed the estimated useful lives of property, plant and equipment at the end of the annual reporting year as required by GRAP 17 (Property, plant and equipment). The useful lives of certain assets were deemed to be longer and the effect of the reassessment, assuming the assets are held until the end of their useful lives, was to decrease the depreciation expense as follows:
31 March
2014
R’000
31 March
2013
R’000
Reassessment of property, plant and equipment useful lives 467 536
1.2 Disposal of assets
During the year under review redundant, unserviceable and damaged assets as well as assets where the useful life expired were disposed as set out below:
31 March 2014 Cost
R’000
Accumulated depreciation
R’000
Net Book value
R’000Computer equipment 2 284 (2 066) 218Office furniture and other equipment 1 273 (785) 488Total 3 557 (2 851) 706Sale of assets (45)Loss on disposal 661
31 March 2013 Cost
R’000
Accumulated depreciation
R’000
Net Book value
R’000
Computer equipment - - -Office furniture and other equipment - - -Total - - -Sale of assets -Loss on disposal -
1.3 Impairment
At the end of the 2013/2014 financial year, property, plant and equipment were reviewed in terms of GRAP 31 to assess if significant changes resulted in assets becoming idle or to be discontinued. For the 2013/2014 financial year discontinued property, plant and equipment assets of R16 000 (2012/2013 – Rnil) were impaired.
1.4 Non-current assets held for sale
The CIPC has decided in the previous financial year to dispose of all assets which were no longer in use. These assets consisted mainly of computer equipment and furniture and equipment. These assets were sold for cash during the current financial year as one group. The reclassification of these assets gave rise to in impairment loss of R229 000, which was recognised in the statement of financial performance. These assets had no related liabilities associated with them and therefore no such liabilities have been recognised.
Property, plant and equipment 31 March2014
R’000
31 March2013
R’000
Transfer to non-current assets held for sale - 274Less: Impairment recognised - (229)Fair value less costs to sell - 45
• Computer equipment - 42• Office furniture and other equipment - 3
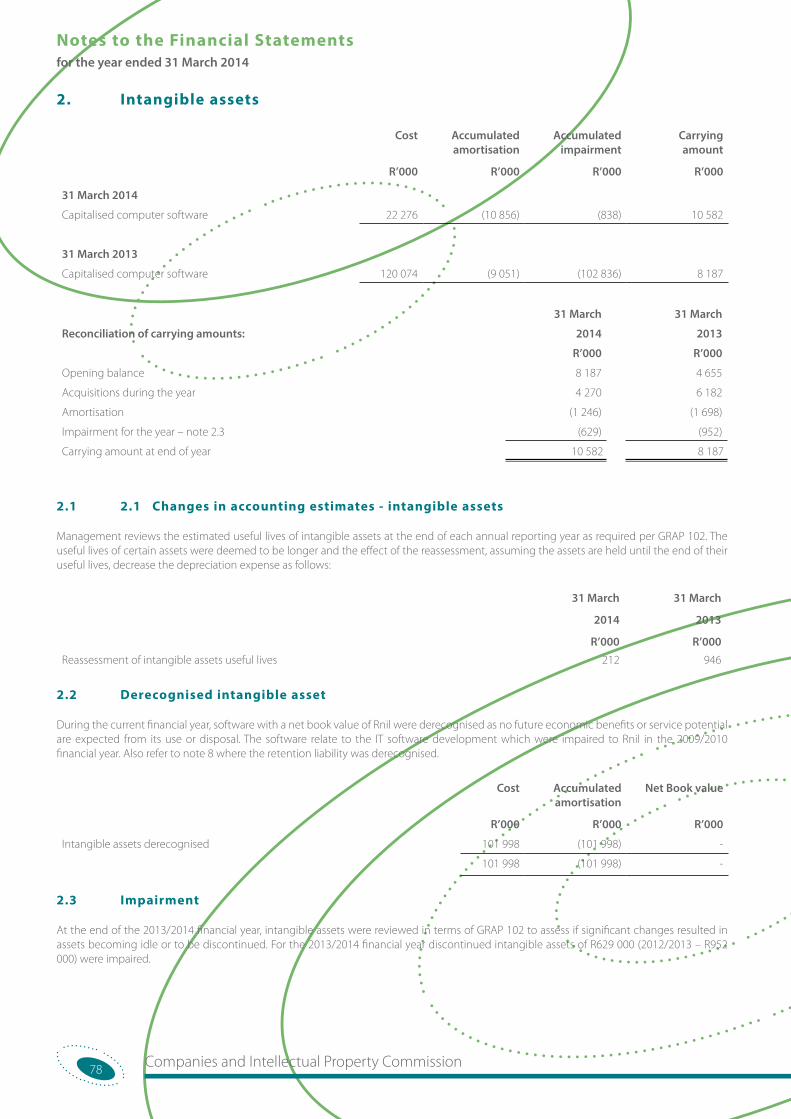
Companies and Intellectual Property Commission78
Notes to the Financial Statements for the year ended 31 March 2014
2. Intangible assets
Cost
R’000
Accumulated amortisation
R’000
Accumulated impairment
R’000
Carrying amount
R’000
31 March 2014
Capitalised computer software 22 276 (10 856) (838) 10 582
31 March 2013
Capitalised computer software 120 074 (9 051) (102 836) 8 187
31 March 31 March
Reconciliation of carrying amounts: 2014 2013
R’000 R’000
Opening balance 8 187 4 655
Acquisitions during the year 4 270 6 182
Amortisation (1 246) (1 698)
Impairment for the year – note 2.3 (629) (952)
Carrying amount at end of year 10 582 8 187
2.1 2.1 Changes in accounting estimates - intangible assets
Management reviews the estimated useful lives of intangible assets at the end of each annual reporting year as required per GRAP 102. The useful lives of certain assets were deemed to be longer and the effect of the reassessment, assuming the assets are held until the end of their useful lives, decrease the depreciation expense as follows:
31 March
2014
R’000
31 March
2013
R’000Reassessment of intangible assets useful lives 212 946
2.2 Derecognised intangible asset
During the current financial year, software with a net book value of Rnil were derecognised as no future economic benefits or service potential are expected from its use or disposal. The software relate to the IT software development which were impaired to Rnil in the 2009/2010 financial year. Also refer to note 8 where the retention liability was derecognised.
Cost
R’000
Accumulated amortisation
R’000
Net Book value
R’000
Intangible assets derecognised 101 998 (101 998) -
101 998 (101 998) -
2.3 Impairment
At the end of the 2013/2014 financial year, intangible assets were reviewed in terms of GRAP 102 to assess if significant changes resulted in assets becoming idle or to be discontinued. For the 2013/2014 financial year discontinued intangible assets of R629 000 (2012/2013 – R952 000) were impaired.
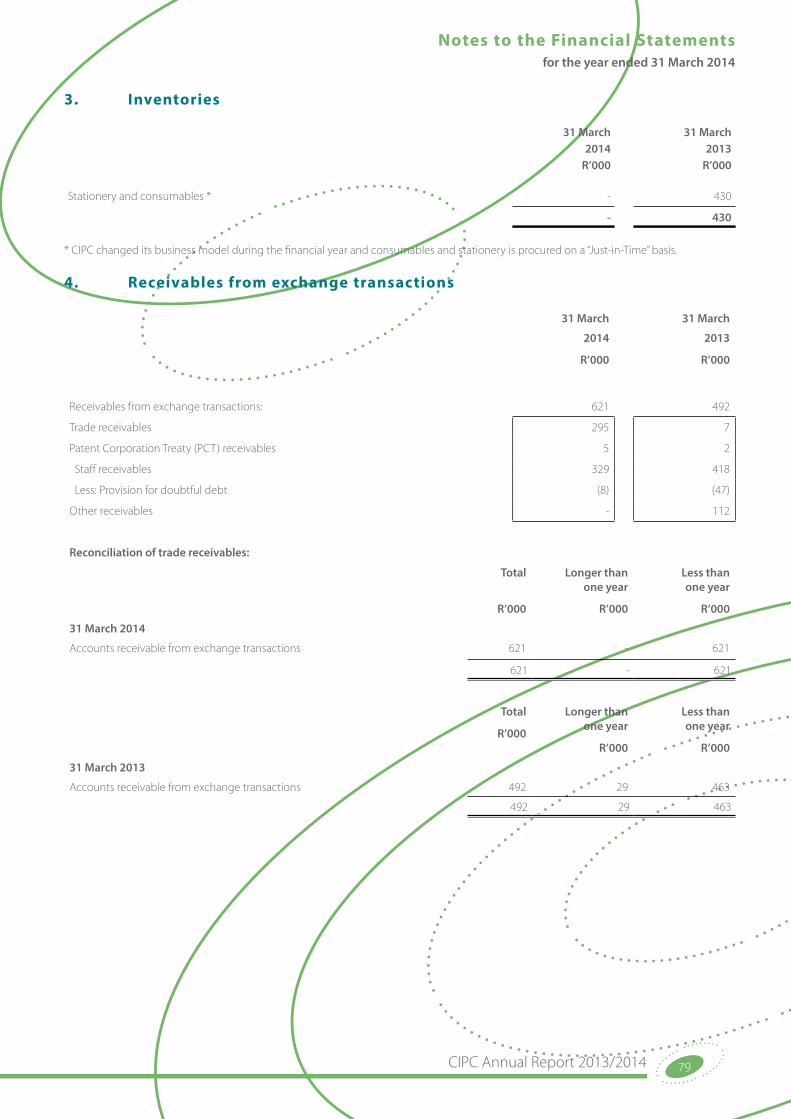
CIPC Annual Report 2013/2014 79
Notes to the Financial Statements for the year ended 31 March 2014
3. Inventories
31 March 31 March2014 2013
R’000 R’000
Stationery and consumables * - 430
- 430
* CIPC changed its business model during the financial year and consumables and stationery is procured on a “Just-in-Time” basis.
4. Receivables from exchange transactions
31 March 31 March
2014
R’000
2013
R’000
Receivables from exchange transactions: 621 492
Trade receivables 295 7
Patent Corporation Treaty (PCT) receivables 5 2
Staff receivables 329 418
Less: Provision for doubtful debt (8) (47)
Other receivables - 112
Reconciliation of trade receivables:
Total
R’000
Longer than one year
R’000
Less than one year
R’000
31 March 2014
Accounts receivable from exchange transactions 621 - 621
621 - 621
Total
R’000
Longer than one year
R’000
Less than one year
R’000
31 March 2013
Accounts receivable from exchange transactions 492 29 463
492 29 463
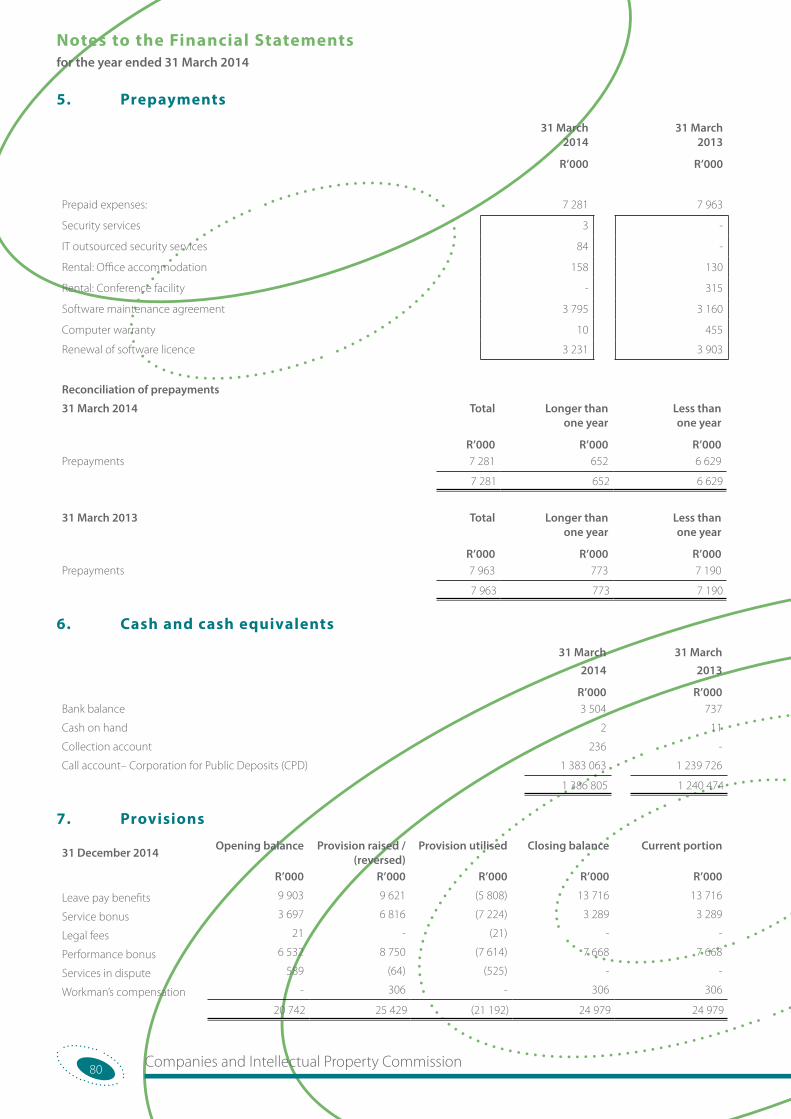
Companies and Intellectual Property Commission80
Notes to the Financial Statements for the year ended 31 March 2014
5. Prepayments
31 March 2014
R’000
31 March 2013
R’000
Prepaid expenses: 7 281 7 963
Security services 3 -
IT outsourced security services 84 -
Rental: Office accommodation 158 130
Rental: Conference facility - 315
Software maintenance agreement 3 795 3 160
Computer warranty 10 455
Renewal of software licence 3 231 3 903
Reconciliation of prepayments
31 March 2014 Total
R’000
Longer than one year
R’000
Less than one year
R’000Prepayments 7 281 652 6 629
7 281 652 6 629
31 March 2013 Total
R’000
Longer than one year
R’000
Less than one year
R’000Prepayments 7 963 773 7 190
7 963 773 7 190
6. Cash and cash equivalents
31 March 31 March2014
R’000
2013
R’000Bank balance 3 504 737
Cash on hand 2 11
Collection account 236 -
Call account– Corporation for Public Deposits (CPD) 1 383 063 1 239 726
1 386 805 1 240 474
7. Provisions
31 December 2014 Opening balance Provision raised / (reversed)
Provision utilised Closing balance Current portion
R’000 R’000 R’000 R’000 R’000
Leave pay benefits 9 903 9 621 (5 808) 13 716 13 716
Service bonus 3 697 6 816 (7 224) 3 289 3 289
Legal fees 21 - (21) - -
Performance bonus 6 532 8 750 (7 614) 7 668 7 668
Services in dispute 589 (64) (525) - -
Workman’s compensation - 306 - 306 306
20 742 25 429 (21 192) 24 979 24 979
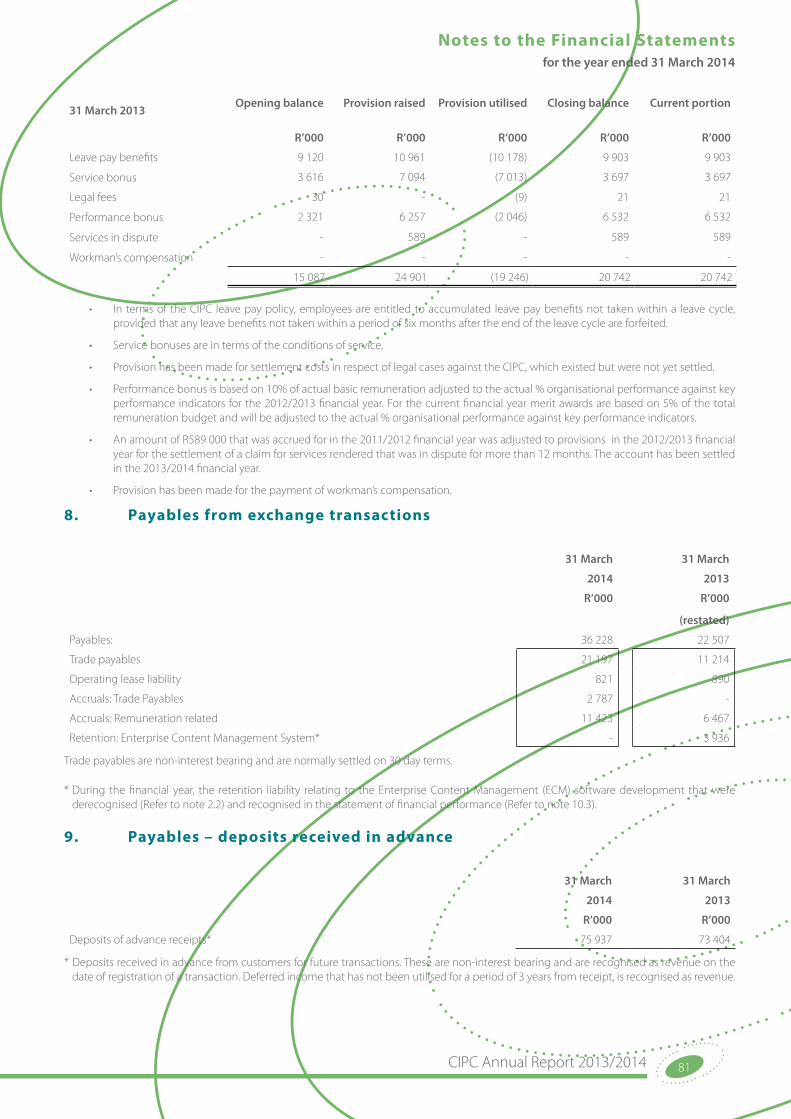
CIPC Annual Report 2013/2014 81
Notes to the Financial Statements for the year ended 31 March 2014
31 March 2013Opening balance Provision raised Provision utilised Closing balance Current portion
R’000 R’000 R’000 R’000 R’000
Leave pay benefits 9 120 10 961 (10 178) 9 903 9 903
Service bonus 3 616 7 094 (7 013) 3 697 3 697
Legal fees 30 - (9) 21 21
Performance bonus 2 321 6 257 (2 046) 6 532 6 532
Services in dispute - 589 - 589 589
Workman’s compensation - - - - -
15 087 24 901 (19 246) 20 742 20 742
• In terms of the CIPC leave pay policy, employees are entitled to accumulated leave pay benefits not taken within a leave cycle, provided that any leave benefits not taken within a period of six months after the end of the leave cycle are forfeited.
• Service bonuses are in terms of the conditions of service.
• Provision has been made for settlement costs in respect of legal cases against the CIPC, which existed but were not yet settled.
• Performance bonus is based on 10% of actual basic remuneration adjusted to the actual % organisational performance against key performance indicators for the 2012/2013 financial year. For the current financial year merit awards are based on 5% of the total remuneration budget and will be adjusted to the actual % organisational performance against key performance indicators.
• An amount of R589 000 that was accrued for in the 2011/2012 financial year was adjusted to provisions in the 2012/2013 financial year for the settlement of a claim for services rendered that was in dispute for more than 12 months. The account has been settled in the 2013/2014 financial year.
• Provision has been made for the payment of workman’s compensation.
8. Payables from exchange transactions
31 March 31 March
2014 2013
R’000 R’000
(restated)
Payables: 36 228 22 507
Trade payables 21 197 11 214
Operating lease liability 821 890
Accruals: Trade Payables 2 787 -
Accruals: Remuneration related 11 423 6 467
Retention: Enterprise Content Management System* - 3 936
Trade payables are non-interest bearing and are normally settled on 30 day terms.
* During the financial year, the retention liability relating to the Enterprise Content Management (ECM) software development that were derecognised (Refer to note 2.2) and recognised in the statement of financial performance (Refer to note 10.3).
9. Payables – deposits received in advance
31 March 31 March
2014 2013
R’000 R’000
Deposits of advance receipts* 75 937 73 404
* Deposits received in advance from customers for future transactions. These are non-interest bearing and are recognised as revenue on the date of registration of a transaction. Deferred income that has not been utilised for a period of 3 years from receipt, is recognised as revenue.
Companies and Intellectual Property Commission82
Notes to the Financial Statements for the year ended 31 March 2014
10. Revenue from exchange transactions:31 March 31 March
2014 2013
R’000 R’000
(restated)
Revenue - exchange transactions 216 243 197 594
10.1 Fees: 140 268 130 768
Corporate information 18 502 15 734
Company registration and maintenance 65 234 56 816
Data sales 1 790 1 933
Intellectual property registration and maintenance 50 968 51 422
Cooperatives registration and maintenance 3 774 4 863
10.2 Interest incomeInterest received – cash and cash equivalents 67 246 61 127
10.3 Other income 8 729 5 699
Other exchange transactions 145 119
Patent Corporation Treaty (PCT) income 74 67
Recognition of unallocated deposits as revenue 4 574 5 513
Derecognition of ECM liability (refer note 8) 3 936 -
11. Revenue from non-exchange transactions:31 March 31 March
2014 2013
R’000 R’000
Revenue - non-exchange transactions 239 368 199 078
Annual return revenue* 239 368 199 078
* Annual return penalties for the 2012/2013 and part of the 2013/2014 financial years have been waived. Annual Return penalties were re-instated with effect from 1 October 2013.
12. Audit fees31 March 31 March
2014 2013Surplus from operations is stated after taking into consideration the following expenditure: R’000 R’000External audit fees 3 959 3 647
• Regularity audit 3 723 2 964
• Computer audits 236 683
Internal audit fees (co-sourced portion) 3 427 2 703
7 386 6 350
CIPC Annual Report 2013/2014 83
Notes to the Financial Statements for the year ended 31 March 2014
13. Consulting and professional fees
31 March 31 March
2014 2013
R’000 R’000
Specialist information technology consultants, licences and services
Management consultants
29 139
5 217
21 344
19 547
34 356 40 891
14. Depreciation and amortisation
31 March 31 March
2014 2013
Depreciation R’000 R’000
• Computer equipment 3 359 2 867
• Office furniture and other equipment
• Leasehold improvements
355
108
306
-
Amortisation of intangible assets 1 246 1 698
5 068 4 871
15. Employee costs
31 March 31 March
2014 2013
R’000 R’000
(restated)
Total per the Statement of Financial Performance 186 861 162 700
Salary 137 044 108 602
Pension contributions 13 259 12 453
Medical contributions 6 217 6 121
Other benefits 30 341 35 524
The CIPC changed its organisational structure with effect from 1 July 2013. The remuneration framework was also changed from basic plus benefit remuneration model to a total cost to company remuneration framework.
Companies and Intellectual Property Commission84
Notes to the Financial Statements for the year ended 31 March 2014
Payments made to Executive Managers:
31 March 2014
R’000
Designation Name Remuneration Travel and Subsistence
allowance
Performance bonus
Total package
Commissioner Ms A Ludin 1 585 24 - 1 609
Deputy Commissioner Mr R Voller 1 156 32 14 1 202
Executive Manager: Business Intelligence and Systems
Mr A Kritzinger (Acting - Fixed term contract 1 April 2013 - 17 January 2014.
2 298 - - 2 298
Executive Manager: Business Intelligence and Systems
Mr A Kritzinger (Appointed 18 January 2014)
285 - - 285
Chief Financial Officer Mr ER du Toit 1 235 - 14 1 249
Chief Strategy Executive Mr L Dukwana 1 121 31 14 1 166
Chief Audit Executive Mr W. Chingate – Appointed 6 January 2014*
180 - - 180
* Compliance, Audit and Risk positions were outsourced to a service provider for the period 1 April 2013 to 5 January 2014.
Payments made to Executive Managers:
31 March 2013
R’000
Designation Name Remuneration Travel and subsistence
allowance
Performance bonus
Total package
Commissioner Ms A Ludin 1 585 54 - 1 639
Deputy Commissioner Mr R Voller 1 077 39 - 1 116
Chief Operating Officer (COO)
(Vacant) - - - -
Chief Financial Officer Mr ER du Toit 1 160 5 - 1 165
Chief Information Officer (CIO)
Mr A Kritzinger (appointed October 2012)
1 240 - - 1 240
Executive Manager: Compliance Audit and Risk
Ms T Nkuna (resigned July 2012) (vacant from August 2012)
380 - 4 384
Executive Manager: Customer Interface
Ms L Matandela (acting from April 2012 to December 2012) (vacant from January 2013)
659 14 - 673
Executive Manager: Strategic Support
Mr L Dukwana (acting COO from May 2011 to December 2012)
1 043 36 - 1 079
16. Bad debt
31 March 31 March2014
R’000
2013
R’000• Bad debts – accounts receivable exchange 81 73
• Bad debts – accounts receivable non-exchange - 82
81 155
CIPC Annual Report 2013/2014 85
Notes to the Financial Statements for the year ended 31 March 2014
17. Operating lease charges
31 March 31 March
2014
R’000
2013
R’000
• Vehicles 245 213
• Property 12 998 11 930
• Off-site storage facility 10 819 10 800
24 062 22 943
18. Publications, printing and stationary
31 March 31 March
2014 2013
R’000 R’000
• Publication and printing 1 482 -
• Stationery 5 488 6 473
• Other - 272
6 970 6 745
19. Other operating expenses
31 March 31 March
2014 2013
R’000 R’000
• Audit and risk committee fees 921 742
• Bursaries 160 262
• Conferences and venues 3 668 3 287
• Entertainment and refreshments 65 507
• Internship 623 2 144
• Legal fees 1 496 1 202
• Membership fees - Staff 82 88
• Membership fees - Institutions 1 500 -
• Other 454 480
• Interest – SARS 581 328
• Penalties - SARS 254 291
• Security and cleaning services 1 731 2 171
• Training 1 247 2 818
12 782 14 320
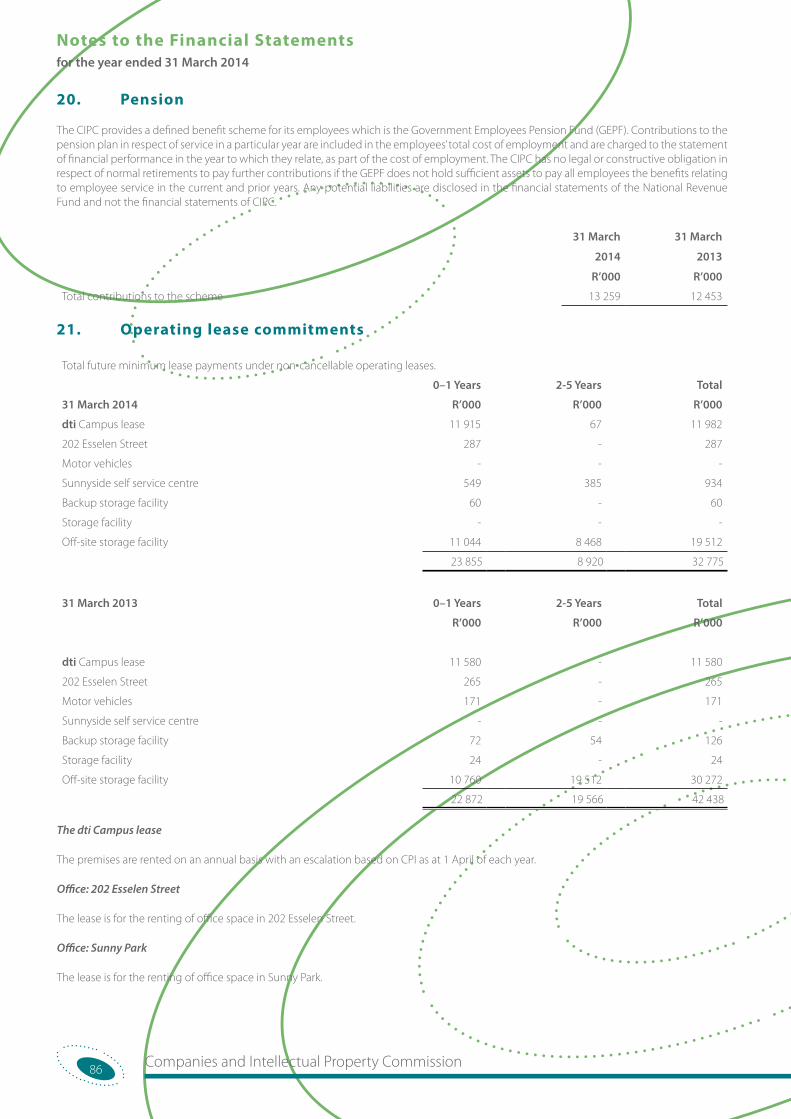
Companies and Intellectual Property Commission86
Notes to the Financial Statements for the year ended 31 March 2014
20. Pension
The CIPC provides a defined benefit scheme for its employees which is the Government Employees Pension Fund (GEPF). Contributions to the pension plan in respect of service in a particular year are included in the employees’ total cost of employment and are charged to the statement of financial performance in the year to which they relate, as part of the cost of employment. The CIPC has no legal or constructive obligation in respect of normal retirements to pay further contributions if the GEPF does not hold sufficient assets to pay all employees the benefits relating to employee service in the current and prior years. Any potential liabilities are disclosed in the financial statements of the National Revenue Fund and not the financial statements of CIPC.
31 March 31 March
2014 2013
R’000 R’000
Total contributions to the scheme 13 259 12 453
21. Operating lease commitments
Total future minimum lease payments under non-cancellable operating leases.
0–1 Years 2-5 Years Total
31 March 2014 R’000 R’000 R’000
dti Campus lease 11 915 67 11 982
202 Esselen Street 287 - 287
Motor vehicles - - -
Sunnyside self service centre 549 385 934
Backup storage facility 60 - 60
Storage facility - - -
Off-site storage facility 11 044 8 468 19 512
23 855 8 920 32 775
31 March 2013 0–1 Years 2-5 Years Total
R’000 R’000 R’000
dti Campus lease 11 580 - 11 580
202 Esselen Street 265 - 265
Motor vehicles 171 - 171
Sunnyside self service centre - - -
Backup storage facility 72 54 126
Storage facility 24 - 24
Off-site storage facility 10 760 19 512 30 272
22 872 19 566 42 438
The dti Campus lease
The premises are rented on an annual basis with an escalation based on CPI as at 1 April of each year.
Office: 202 Esselen Street
The lease is for the renting of office space in 202 Esselen Street.
Office: Sunny Park
The lease is for the renting of office space in Sunny Park.
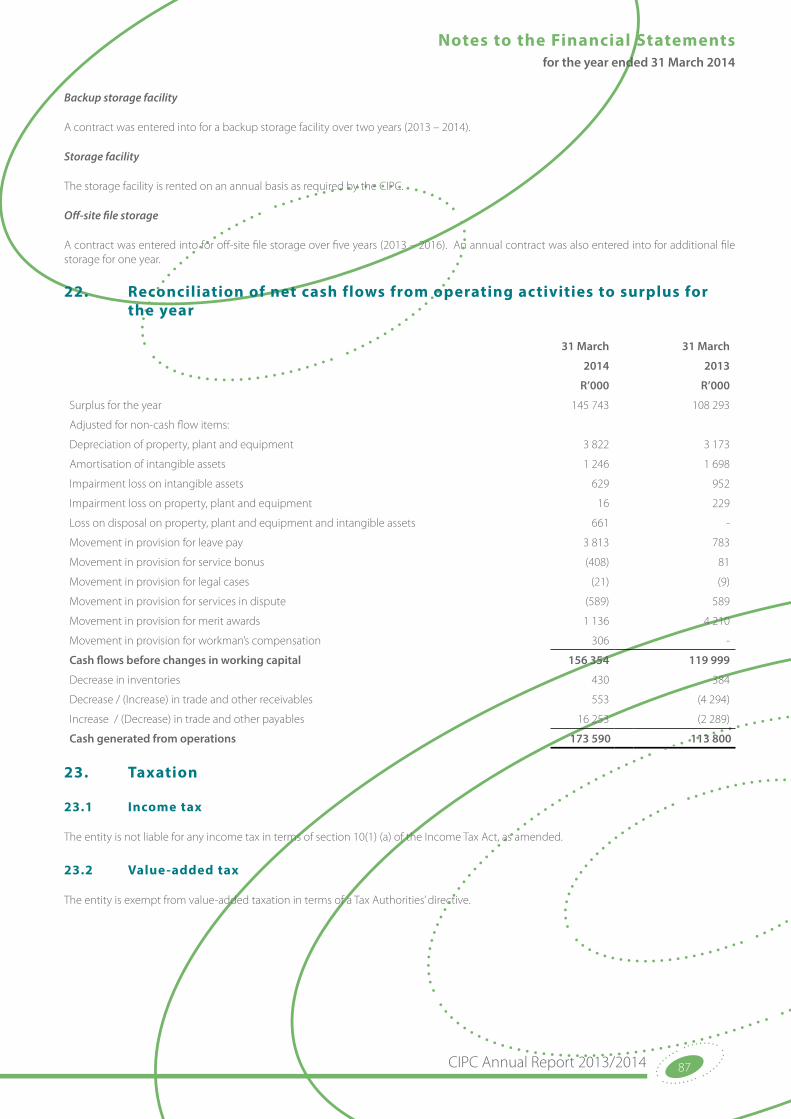
CIPC Annual Report 2013/2014 87
Notes to the Financial Statements for the year ended 31 March 2014
Backup storage facility
A contract was entered into for a backup storage facility over two years (2013 – 2014).
Storage facility
The storage facility is rented on an annual basis as required by the CIPC.
Off-site file storage
A contract was entered into for off-site file storage over five years (2013 – 2016). An annual contract was also entered into for additional file storage for one year.
22. Reconciliation of net cash flows from operating activities to surplus for the year
31 March 31 March
2014 2013
R’000 R’000
Surplus for the year 145 743 108 293
Adjusted for non-cash flow items:
Depreciation of property, plant and equipment 3 822 3 173
Amortisation of intangible assets 1 246 1 698
Impairment loss on intangible assets 629 952
Impairment loss on property, plant and equipment 16 229
Loss on disposal on property, plant and equipment and intangible assets 661 -
Movement in provision for leave pay 3 813 783
Movement in provision for service bonus (408) 81
Movement in provision for legal cases (21) (9)
Movement in provision for services in dispute (589) 589
Movement in provision for merit awards 1 136 4 210
Movement in provision for workman’s compensation 306 -
Cash flows before changes in working capital 156 354 119 999
Decrease in inventories 430 384
Decrease / (Increase) in trade and other receivables 553 (4 294)
Increase / (Decrease) in trade and other payables 16 253 (2 289)
Cash generated from operations 173 590 113 800
23. Taxation
23.1 Income tax
The entity is not liable for any income tax in terms of section 10(1) (a) of the Income Tax Act, as amended.
23.2 Value-added tax
The entity is exempt from value-added taxation in terms of a Tax Authorities’ directive.
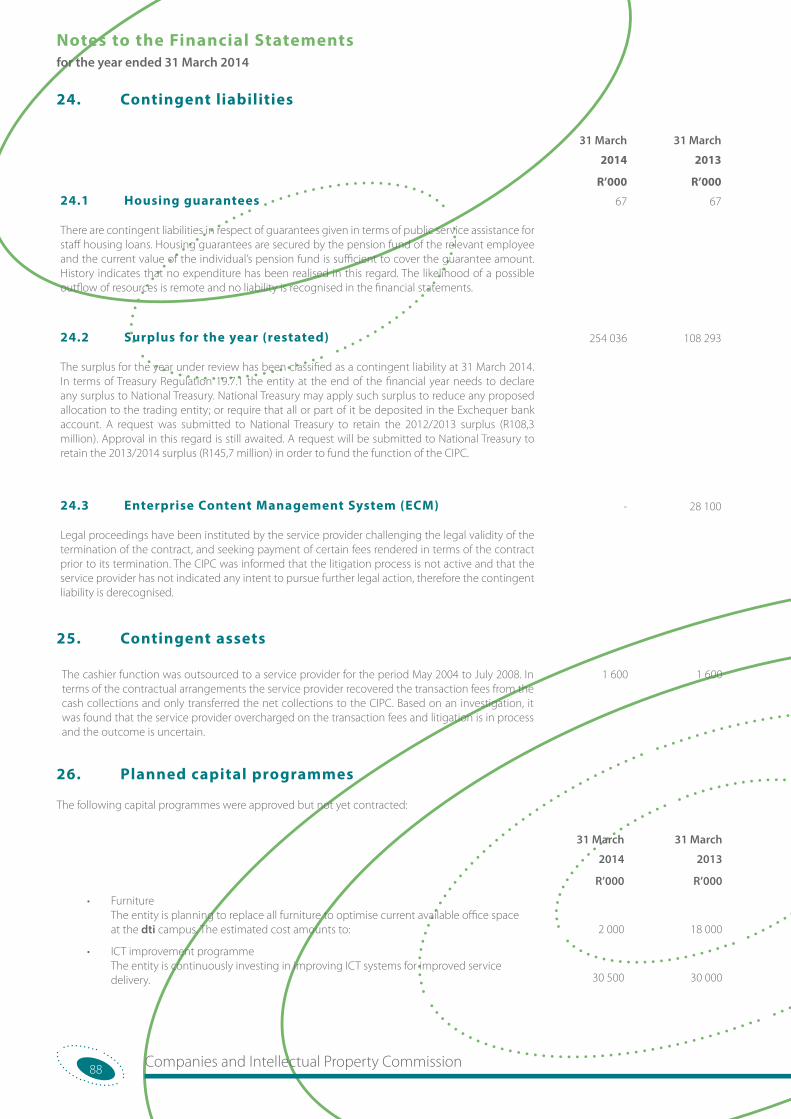
Companies and Intellectual Property Commission88
Notes to the Financial Statements for the year ended 31 March 2014
24. Contingent liabilities
31 March 31 March
2014
R’000
2013
R’000
24.1 Housing guarantees 67 67
There are contingent liabilities in respect of guarantees given in terms of public service assistance for staff housing loans. Housing guarantees are secured by the pension fund of the relevant employee and the current value of the individual’s pension fund is sufficient to cover the guarantee amount. History indicates that no expenditure has been realised in this regard. The likelihood of a possible outflow of resources is remote and no liability is recognised in the financial statements.
24.2 Surplus for the year (restated) 254 036 108 293
The surplus for the year under review has been classified as a contingent liability at 31 March 2014. In terms of Treasury Regulation 19.7.1 the entity at the end of the financial year needs to declare any surplus to National Treasury. National Treasury may apply such surplus to reduce any proposed allocation to the trading entity; or require that all or part of it be deposited in the Exchequer bank account. A request was submitted to National Treasury to retain the 2012/2013 surplus (R108,3 million). Approval in this regard is still awaited. A request will be submitted to National Treasury to retain the 2013/2014 surplus (R145,7 million) in order to fund the function of the CIPC.
24.3 Enterprise Content Management System (ECM) - 28 100
Legal proceedings have been instituted by the service provider challenging the legal validity of the termination of the contract, and seeking payment of certain fees rendered in terms of the contract prior to its termination. The CIPC was informed that the litigation process is not active and that the service provider has not indicated any intent to pursue further legal action, therefore the contingent liability is derecognised.
25. Contingent assets
The cashier function was outsourced to a service provider for the period May 2004 to July 2008. In terms of the contractual arrangements the service provider recovered the transaction fees from the cash collections and only transferred the net collections to the CIPC. Based on an investigation, it was found that the service provider overcharged on the transaction fees and litigation is in process and the outcome is uncertain.
1 600 1 600
26. Planned capital programmes
The following capital programmes were approved but not yet contracted:
31 March 31 March
2014
R’000
2013
R’000
• Furniture The entity is planning to replace all furniture to optimise current available office space at the dti campus. The estimated cost amounts to:
• ICT improvement programme The entity is continuously investing in improving ICT systems for improved service delivery.
2 000
30 500
18 000
30 000
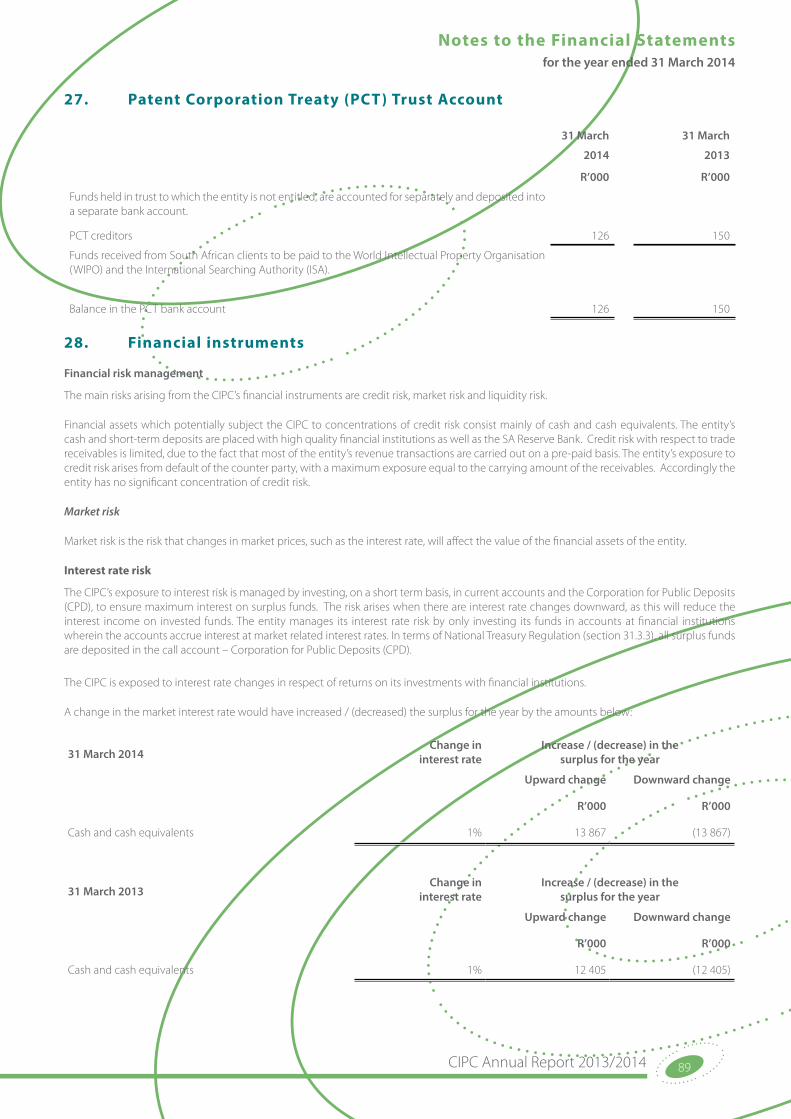
CIPC Annual Report 2013/2014 89
Notes to the Financial Statements for the year ended 31 March 2014
27. Patent Corporation Treaty (PCT ) Trust Account
31 March 31 March
2014
R’000
2013
R’000
Funds held in trust to which the entity is not entitled, are accounted for separately and deposited into a separate bank account.
PCT creditors 126 150
Funds received from South African clients to be paid to the World Intellectual Property Organisation (WIPO) and the International Searching Authority (ISA).
Balance in the PCT bank account 126 150
28. Financial instruments
Financial risk management
The main risks arising from the CIPC’s financial instruments are credit risk, market risk and liquidity risk.
Financial assets which potentially subject the CIPC to concentrations of credit risk consist mainly of cash and cash equivalents. The entity’s cash and short-term deposits are placed with high quality financial institutions as well as the SA Reserve Bank. Credit risk with respect to trade receivables is limited, due to the fact that most of the entity’s revenue transactions are carried out on a pre-paid basis. The entity’s exposure to credit risk arises from default of the counter party, with a maximum exposure equal to the carrying amount of the receivables. Accordingly the entity has no significant concentration of credit risk.
Market risk
Market risk is the risk that changes in market prices, such as the interest rate, will affect the value of the financial assets of the entity.
Interest rate risk
The CIPC’s exposure to interest risk is managed by investing, on a short term basis, in current accounts and the Corporation for Public Deposits (CPD), to ensure maximum interest on surplus funds. The risk arises when there are interest rate changes downward, as this will reduce the interest income on invested funds. The entity manages its interest rate risk by only investing its funds in accounts at financial institutions wherein the accounts accrue interest at market related interest rates. In terms of National Treasury Regulation (section 31.3.3), all surplus funds are deposited in the call account – Corporation for Public Deposits (CPD).
The CIPC is exposed to interest rate changes in respect of returns on its investments with financial institutions.
A change in the market interest rate would have increased / (decreased) the surplus for the year by the amounts below:
31 March 2014Change in
interest rateIncrease / (decrease) in the
surplus for the year
Upward change Downward change
R’000 R’000
Cash and cash equivalents 1% 13 867 (13 867)
31 March 2013Change in
interest rateIncrease / (decrease) in the
surplus for the year
Upward change Downward change
R’000 R’000
Cash and cash equivalents 1% 12 405 (12 405)
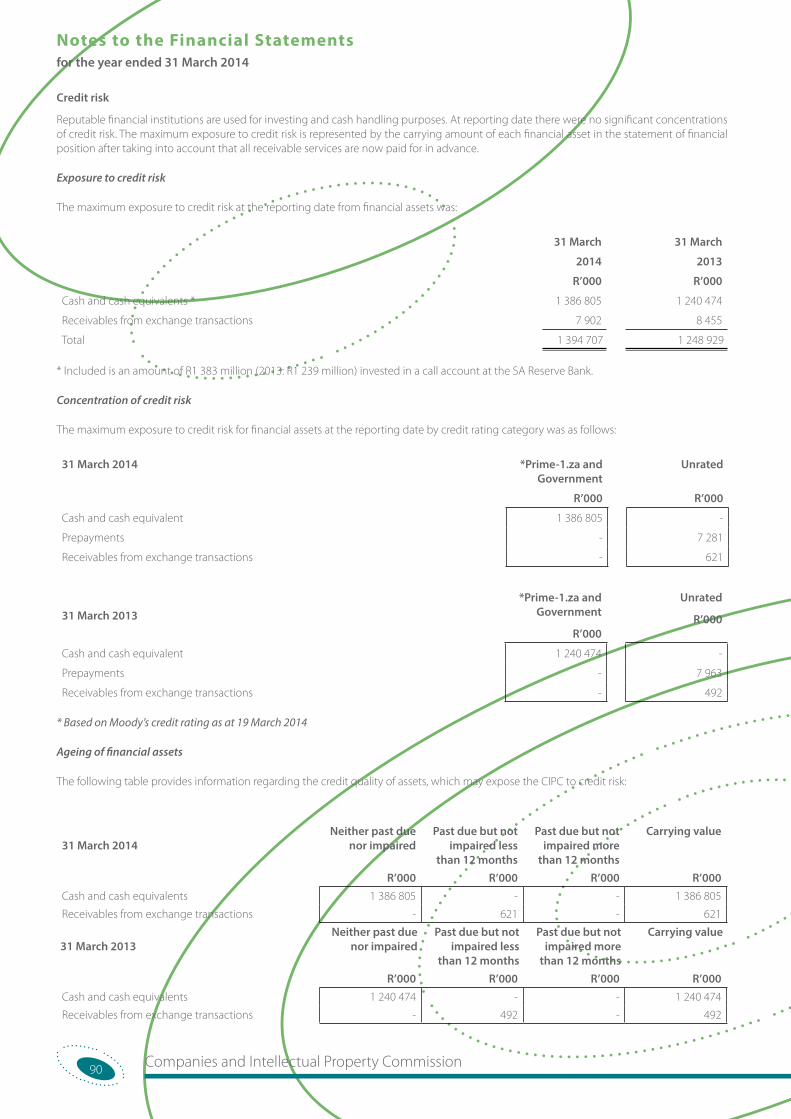
Companies and Intellectual Property Commission90
Notes to the Financial Statements for the year ended 31 March 2014
Credit risk
Reputable financial institutions are used for investing and cash handling purposes. At reporting date there were no significant concentrations of credit risk. The maximum exposure to credit risk is represented by the carrying amount of each financial asset in the statement of financial position after taking into account that all receivable services are now paid for in advance.
Exposure to credit risk
The maximum exposure to credit risk at the reporting date from financial assets was:
31 March 31 March
2014 2013
R’000 R’000
Cash and cash equivalents * 1 386 805 1 240 474
Receivables from exchange transactions 7 902 8 455
Total 1 394 707 1 248 929
* Included is an amount of R1 383 million (2013: R1 239 million) invested in a call account at the SA Reserve Bank.
Concentration of credit risk
The maximum exposure to credit risk for financial assets at the reporting date by credit rating category was as follows:
31 March 2014 *Prime-1.za and Government
Unrated
R’000 R’000
Cash and cash equivalent 1 386 805 -
Prepayments - 7 281
Receivables from exchange transactions - 621
31 March 2013*Prime-1.za and
Government
R’000
Unrated
R’000
Cash and cash equivalent 1 240 474 -
Prepayments - 7 963
Receivables from exchange transactions - 492
* Based on Moody’s credit rating as at 19 March 2014
Ageing of financial assets
The following table provides information regarding the credit quality of assets, which may expose the CIPC to credit risk:
31 March 2014Neither past due
nor impairedPast due but not
impaired less than 12 months
Past due but not impaired more
than 12 months
Carrying value
R’000 R’000 R’000 R’000Cash and cash equivalents 1 386 805 - - 1 386 805
Receivables from exchange transactions - 621 - 621
31 March 2013Neither past due
nor impairedPast due but not
impaired less than 12 months
Past due but not impaired more
than 12 months
Carrying value
R’000 R’000 R’000 R’000Cash and cash equivalents 1 240 474 - - 1 240 474
Receivables from exchange transactions - 492 - 492
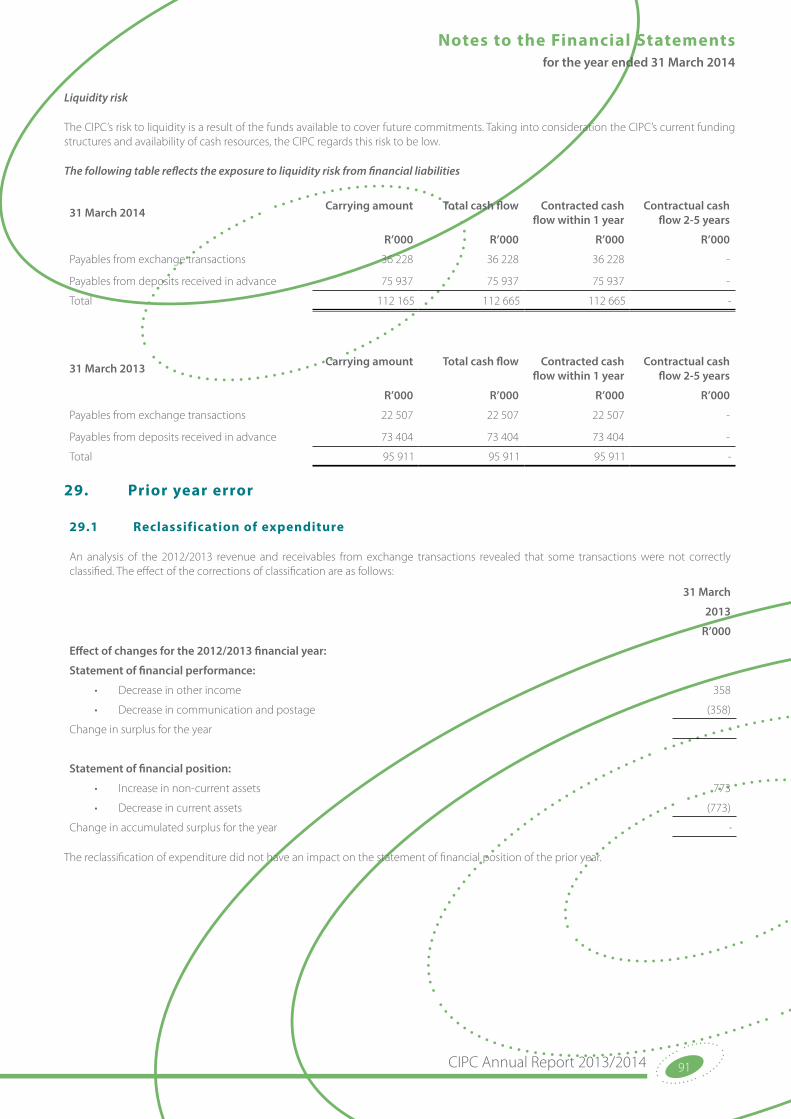
CIPC Annual Report 2013/2014 91
Notes to the Financial Statements for the year ended 31 March 2014
Liquidity risk
The CIPC’s risk to liquidity is a result of the funds available to cover future commitments. Taking into consideration the CIPC’s current funding structures and availability of cash resources, the CIPC regards this risk to be low.
The following table reflects the exposure to liquidity risk from financial liabilities
31 March 2014 Carrying amount Total cash flow Contracted cash flow within 1 year
Contractual cash flow 2-5 years
R’000 R’000 R’000 R’000
Payables from exchange transactions
Payables from deposits received in advance
36 228
75 937
36 228
75 937
36 228
75 937
-
-
Total 112 165 112 665 112 665 -
31 March 2013 Carrying amount Total cash flow Contracted cash flow within 1 year
Contractual cash flow 2-5 years
R’000 R’000 R’000 R’000
Payables from exchange transactions
Payables from deposits received in advance
22 507
73 404
22 507
73 404
22 507
73 404
-
-
Total 95 911 95 911 95 911 -
29. Prior year error
29.1 Reclassification of expenditure
An analysis of the 2012/2013 revenue and receivables from exchange transactions revealed that some transactions were not correctly classified. The effect of the corrections of classification are as follows:
31 March
2013
R’000
Effect of changes for the 2012/2013 financial year:
Statement of financial performance:
• Decrease in other income 358
• Decrease in communication and postage (358)
Change in surplus for the year -
Statement of financial position:
• Increase in non-current assets 773
• Decrease in current assets (773)
Change in accumulated surplus for the year -
The reclassification of expenditure did not have an impact on the statement of financial position of the prior year.
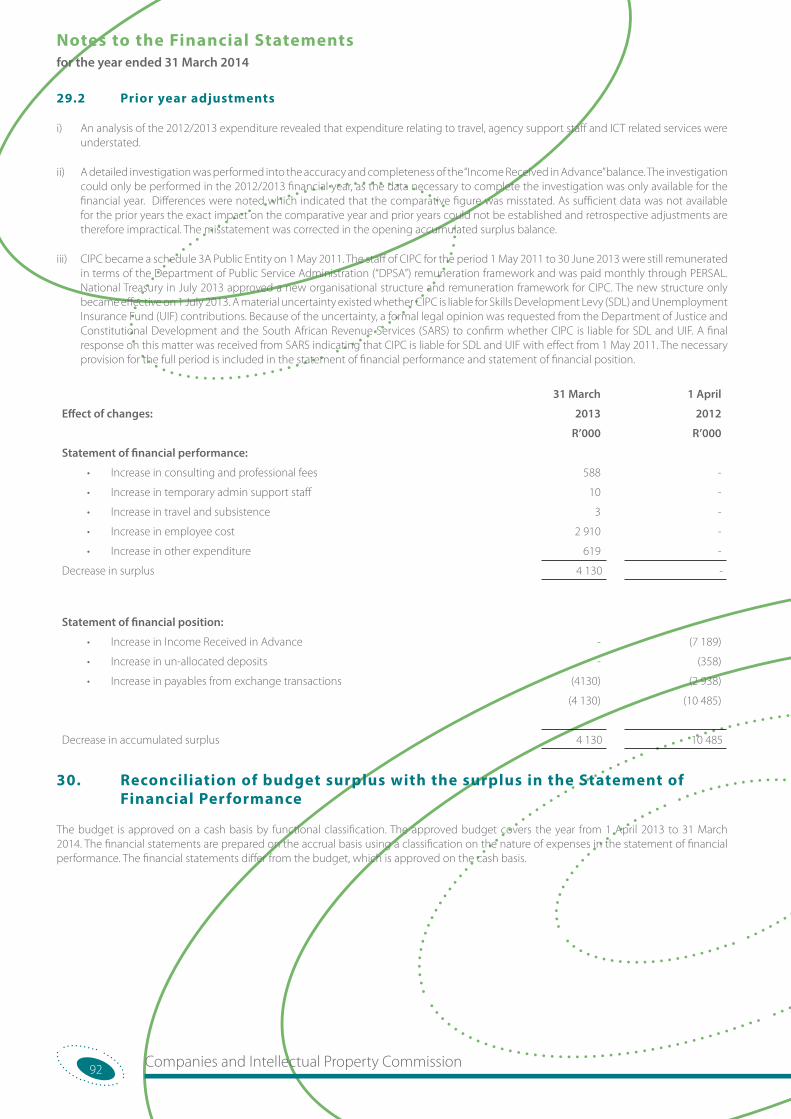
Companies and Intellectual Property Commission92
Notes to the Financial Statements for the year ended 31 March 2014
29.2 Prior year adjustments
i) An analysis of the 2012/2013 expenditure revealed that expenditure relating to travel, agency support staff and ICT related services were understated.
ii) A detailed investigation was performed into the accuracy and completeness of the “Income Received in Advance” balance. The investigation could only be performed in the 2012/2013 financial year, as the data necessary to complete the investigation was only available for the financial year. Differences were noted which indicated that the comparative figure was misstated. As sufficient data was not available for the prior years the exact impact on the comparative year and prior years could not be established and retrospective adjustments are therefore impractical. The misstatement was corrected in the opening accumulated surplus balance.
iii) CIPC became a schedule 3A Public Entity on 1 May 2011. The staff of CIPC for the period 1 May 2011 to 30 June 2013 were still remunerated in terms of the Department of Public Service Administration (“DPSA”) remuneration framework and was paid monthly through PERSAL. National Treasury in July 2013 approved a new organisational structure and remuneration framework for CIPC. The new structure only became effective on 1 July 2013. A material uncertainty existed whether CIPC is liable for Skills Development Levy (SDL) and Unemployment Insurance Fund (UIF) contributions. Because of the uncertainty, a formal legal opinion was requested from the Department of Justice and Constitutional Development and the South African Revenue Services (SARS) to confirm whether CIPC is liable for SDL and UIF. A final response on this matter was received from SARS indicating that CIPC is liable for SDL and UIF with effect from 1 May 2011. The necessary provision for the full period is included in the statement of financial performance and statement of financial position.
31 March 1 April
Effect of changes: 2013 2012
R’000 R’000
Statement of financial performance:
• Increase in consulting and professional fees 588 -
• Increase in temporary admin support staff 10 -
• Increase in travel and subsistence 3 -
• Increase in employee cost 2 910 -
• Increase in other expenditure 619 -
Decrease in surplus 4 130 -
Statement of financial position:
• Increase in Income Received in Advance - (7 189)
• Increase in un-allocated deposits - (358)
• Increase in payables from exchange transactions (4130) (2 938)
(4 130) (10 485)
Decrease in accumulated surplus 4 130 10 485
30. Reconciliation of budget surplus with the surplus in the Statement of Financial Performance
The budget is approved on a cash basis by functional classification. The approved budget covers the year from 1 April 2013 to 31 March 2014. The financial statements are prepared on the accrual basis using a classification on the nature of expenses in the statement of financial performance. The financial statements differ from the budget, which is approved on the cash basis.
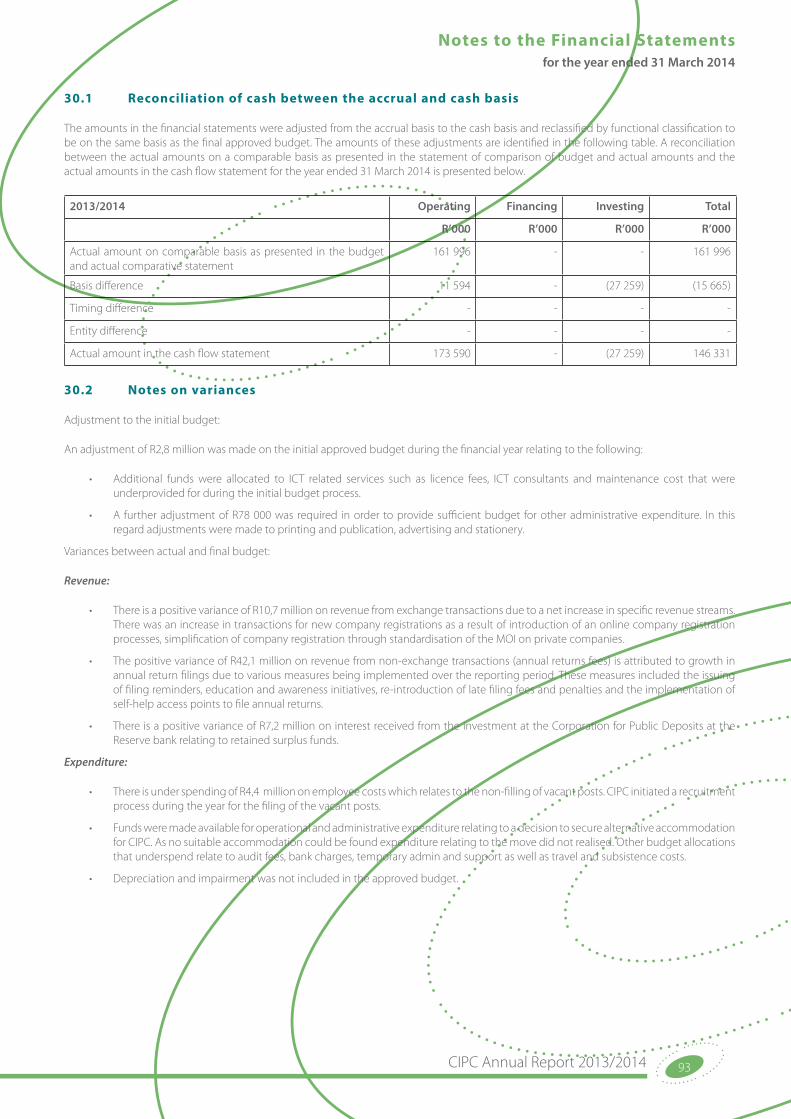
CIPC Annual Report 2013/2014 93
Notes to the Financial Statements for the year ended 31 March 2014
30.1 Reconciliation of cash between the accrual and cash basis
The amounts in the financial statements were adjusted from the accrual basis to the cash basis and reclassified by functional classification to be on the same basis as the final approved budget. The amounts of these adjustments are identified in the following table. A reconciliation between the actual amounts on a comparable basis as presented in the statement of comparison of budget and actual amounts and the actual amounts in the cash flow statement for the year ended 31 March 2014 is presented below.
2013/2014 Operating Financing Investing Total
R’000 R’000 R’000 R’000
Actual amount on comparable basis as presented in the budget and actual comparative statement
161 996 - - 161 996
Basis difference 11 594 - (27 259) (15 665)
Timing difference - - - -
Entity difference - - - -
Actual amount in the cash flow statement 173 590 - (27 259) 146 331
30.2 Notes on variances
Adjustment to the initial budget:
An adjustment of R2,8 million was made on the initial approved budget during the financial year relating to the following:
• Additional funds were allocated to ICT related services such as licence fees, ICT consultants and maintenance cost that were underprovided for during the initial budget process.
• A further adjustment of R78 000 was required in order to provide sufficient budget for other administrative expenditure. In this regard adjustments were made to printing and publication, advertising and stationery.
Variances between actual and final budget:
Revenue:
• There is a positive variance of R10,7 million on revenue from exchange transactions due to a net increase in specific revenue streams. There was an increase in transactions for new company registrations as a result of introduction of an online company registration processes, simplification of company registration through standardisation of the MOI on private companies.
• The positive variance of R42,1 million on revenue from non-exchange transactions (annual returns fees) is attributed to growth in annual return filings due to various measures being implemented over the reporting period. These measures included the issuing of filing reminders, education and awareness initiatives, re-introduction of late filing fees and penalties and the implementation of self-help access points to file annual returns.
• There is a positive variance of R7,2 million on interest received from the investment at the Corporation for Public Deposits at the Reserve bank relating to retained surplus funds.
Expenditure:
• There is under spending of R4,4 million on employee costs which relates to the non-filling of vacant posts. CIPC initiated a recruitment process during the year for the filing of the vacant posts.
• Funds were made available for operational and administrative expenditure relating to a decision to secure alternative accommodation for CIPC. As no suitable accommodation could be found expenditure relating to the move did not realised. Other budget allocations that underspend relate to audit fees, bank charges, temporary admin and support as well as travel and subsistence costs.
• Depreciation and impairment was not included in the approved budget.
Companies and Intellectual Property Commission94
Notes to the Financial Statements for the year ended 31 March 2014
31. Related party transactions
Related parties are identified as being those parties that control or have significant influence over the CIPC and those parties that are controlled or significantly influenced by the CIPC.
Name Relationship Nature of transaction
Transactions 31 March 2014
R’000
Balance due as at 31 March 2014
R’000
Transactions for the year up to
March 2013
R’000
Balance due at 31 March 2013
R’000
Department of Trade and Industry
Parent department
Lease of building and other operating expenditure
12 935 894 13 241 117
The following entities are part of the Department of Trade and Industry portfolio. The CIPC did not transact with the entities below during the financial year.
Name Relationship
Companies Tribunal Member of the dti group
National Consumer Commission (NCC) Member of the dti group
National Consumer Tribunal (NCT) Member of the dti group
National Credit Regulator (NCR) Member of the dti group
National Gambling Board (NGB) Member of the dti group
National Lotteries Board (NLB) Member of the dti group
National Lottery Distribution Trust Fund (NLDTF) Member of the dti group
National Regulator for Compulsory Specifications NRCS) Member of the dti group
Small Enterprise Development Agency (SEDA) Member of the dti group
South African Bureau of Standards (SABS) Member of the dti group
Export Credit Insurance Corporation of South Africa Member of the dti group
National Empowerment Fund (NEF) Member of the dti group
National Metrology Institute of South Africa Member of the dti group
South African National Accreditation System (SANAS) Member of the dti group
Transactions with key management
Total remuneration of key management is included in employees’ remuneration (refer to note 15 for Executive Management’s remuneration).
Income
The CIPC services are rendered free of charge to other government entities. The total amount for such services cannot be quantified as no process has been introduced to record such transactions.
Name Relationship Nature of transaction
Department of Labour National sphere of government Disclosure of CIPC information
Department of Agriculture, Forestry and Fisheries National sphere of government Disclosure of CIPC information
Department of Agriculture, Forestry and Fisheries National sphere of government Disclosure of CIPC information
Department of Community Safety National sphere of government Disclosure of CIPC information
Department of Co-operative Governance National sphere of government Disclosure of CIPC information
Department of Cultural Affairs and Sport National sphere of government Disclosure of CIPC information
Department of Economic Development and Tourism National sphere of government Disclosure of CIPC information
Department of Health National sphere of government Disclosure of CIPC information
Department of Justice National sphere of government Disclosure of CIPC information
Department of Public Enterprises National sphere of government Disclosure of CIPC information
CIPC Annual Report 2013/2014 95
Notes to the Financial Statements for the year ended 31 March 2014
Name Relationship Nature of transaction
Department of Water Affairs National sphere of government Disclosure of CIPC information
Department of Home Affairs National sphere of government Disclosure of CIPC information
Department of Science and Technology National sphere of government Disclosure of CIPC information
National Department of Social Development National sphere of government Disclosure of CIPC information
National Prosecuting Authority National sphere of government Disclosure of CIPC information
National Treasury National sphere of government Disclosure of CIPC information
Office of Ombud for Financial Services Providers Government institution Disclosure of CIPC information
Office of the President National sphere of government Disclosure of CIPC information
Public Protector National sphere of government Disclosure of CIPC information
Public Service Sector Education and Training Government institution Disclosure of CIPC information
SA National Parks Board Government institution Disclosure of CIPC information
SA Police Services National sphere of government Disclosure of CIPC information
State Security Agency Government institution Disclosure of CIPC information
Western Cape Liquor Authority Government institution Disclosure of CIPC information
Expenditure
The entity, as a Schedule 3A Public Entity under the Public Finance Management Act (PFMA), operates in an economic environment currently dominated by entities directly or indirectly owned by the South African Government. The CIPC discloses related party transaction and the nature of its relationship with the other party where the other party has significant influence through the participation in the financial and operating policy decisions, and/or where significant transactions occurred with such an entity.
32. Material losses
31 March 31 March
2014
R’000
2013
R’000
No material losses have occurred during the current financial year due to criminal conduct or any unauthorised expenditure, irregular expenditure, fruitless or wasteful expenditure, except as indicated below:
Wasteful Expenditure
ICT licence re-instatement fee
Reprinting of the 2012/2013 Annual report
Implementation of SDL and UIF – interest
750
59
581
-
-
327
1 390 327
A motivation for the waiving of penalties (R732 828) was submitted to the South African Revenue Services (SARS) and is currently under review. This will result in wasteful expenditure if unsuccessful.
Companies and Intellectual Property Commission96
Notes to the Financial Statements for the year ended 31 March 2014
33. Irregular expenditure
Expenditure where the prescribed approval process for the procurement process was not followed. Confirmation that value for money was received, was performed through an internal audit investigation.
Payment was only effected after the irregular expenditure was regularised:
31 March 2014
R’000
31 March 2013
R’000
2 426 3 543
Procurement of network services through SITA
Extension of backup contract
Extension of the appointment the Database administrator
Printing of strategy planning documentation
Appointment of Chief Technical Officer *
Internet services outside contract period
ICT Security services outside contract period
Repair of equipment – single quotation
ICT licence and support outside contract period
ICT maintenance contract outside contract period
Transport of foreign visitors
-
-
-
-
1 380
220
30
12
534
247
3
1 746
18
883
15
881
-
-
-
-
-
-
* Irregular expenditure relating to the Appointment of the Chief Technical Officer that was identified and reported in the prior year, was omitted from the printed 2012/2013 Annual Report due to a printing error.
Reconciliation of irregular expenditure
Opening balance 99 135 98 237
Irregular expenditure –current year 2 426 3 543
Less: amount approved by the Executive Authority with funding (1 380) (881)
Less: amount approved by the Accounting Authority with funding (1 945) (1 764)
Irregular expenditure awaiting condonement 98 236 99 135
Request for condonement of irregular expenditure submitted. Approval for this is still outstanding from the Department of Public Service and Administration.
34. Gifts and donations31 March 31 March
2014
R’000
2013
R’000
The acceptance or granting of a gift, donation or sponsorship is managed in terms of Section 76 of the Public Finance Management Act, 1999 (Act 1of 1999), and Treasury Regulation 21. Gifts and donations received by employees during the year under review were:
3 5
• Smaller gifts (less than R300) to various staff members 3 5

www.cipc.co.za
CIPC Contact Number: 086 100 2472
Postal Address: PO Box 429, Pretoria, 0001
ISBN: 978-0-621-42543-7