commission for university education university statistics
TRANSCRIPT
Quality the Agenda
COMMISSION FOR UNIVERSITY EDUCATION
UNIVERSITY STATISTICS
SECOND EDITION
2018
ii
Quality the Agenda
COMMISSION FOR UNIVERSITY EDUCATION
UNIVERSITY STATISTICS
(2016/2017)
ISBN 978-9966-009-25-8
iii
©2018 Commission for University Education, Kenya
This publication is copyrighted by the Commission for University Education. It is licensed for use under
the Creative Commons Attribution-Non Commercial-Share Alike 4.0 International License. Unless
otherwise noted, you are free to copy, duplicate or reproduce, and distribute, display, or transmit any part
of this publication or portions thereof without permission, and to make translations, adaptations. The
work must be attributed, but not in any way that suggests endorsement by the Commission for University
Education. This work may not be used for commercial purposes. If this work is altered, transformed, or
built upon, the resulting work must be distributed only under the same license.
Any of the above conditions can be waived if permission is obtained from the copyright holder. Nothing
in this license impairs or restricts the author’s moral rights. Fair dealing and other rights are in no way
affected by the above. The parts used must not misrepresent the meaning of the publication.
ISBN 978-9966-009-25-8
iv
EDITORIAL BOARD
1. Mrs. Eliza Mbatia - Chairperson of the Editorial Committee
2. Mr. John Mutethia - Member
3. Ms. Evelyn Okewo - Member
4. Mrs. Lynette Kisaka - Member
5. Ms. Stella Kiptoo - Member
6. Mr. Clifford Gicheru - Member
v
FOREWORD
This report on University statistics presents comprehensive university data covering the
following key thematic areas: academic programmes, student enrolment, staffing, graduation
trends and finance. This is the second detailed report on university data, which the Commission
for University Education (CUE) has prepared. The data presented is current and captures several
indicators of the university sector. These include, but are not limited to, the dynamics of gender
representation, programme diversification, enrolment, staff-student ratio and financing - all of
which have been documented.
With the knowledge that data is a vital element in making decisions and crafting policies, the
Commission is committed to building a rich data base, which will be easily accessed by any
authorized person upon request. Policies and projections will then be made based on tangible up-
to-date data. There will also be greater efficiency in the implementation of projects and realization
of targets. Unlike the previous years, the universities were more cooperative in providing data,
which is an indication that they have embraced the exercise wholeheartedly. Of note is data on
enrolment of students by County. Previously, universities were not capturing this information in
their admission records. But through Commission’s intervention and constructive engagement
with the universities, a significant number of them provided the data, which has been analyzed in
this report.
This report will be handy to the policy makers in various State departments, private sector,
NGOs, development partners and other interest groups who intend to partner with the university
sector in matters pertaining to training and research.
In line with the function of the Commission stipulated in Section 5 (1) of the Universities Act
(2012), Revised (2016), the Commission has put in place a framework for assuring quality of
research and integrity of data collection in the university sector. In doing this, the Commission is
inspired by ideals enshrined in its Vision, Mission, Strategic Objectives and Core Values.
Prof. Chacha Nyaigotti-Chacha
Chairman
Commission for University Education
vi
ACKNOWLEDGEMENT
Compilation of the 2016/2017 University Statistics Report would not have been possible without
the immense contribution of several people. First, I would like to thank the Chairman and the
entire Commission fraternity for their steadfast support during the process of collecting and
processing the University Data Book for 2016/17.
Secondly, I would like to thank both public and private universities for providing data on the
thematic areas which have been analyzed in this report and for working closely with the
Commission to validate the data so that the report captures accurately all the information they
shared.
Thirdly, I wish to acknowledge the Ministry of Education for its support and for authorizing two
of their officers, Mr. Polycarp Otieno and Mr. Philip Kinara to work with the team at the
Commission to ensure that the report is up to the required standard.
I gratefully acknowledge the time and expertise devoted to reviewing of the document by the
Commission’s Editorial Committee. Last but certainly not least, I would like to express my
deepest appreciation to the team in the Division of Planning, Research and Development for their
hard work and commitment to the task of producing this important report. These include Prof.
Jackson Too - Ag. Deputy Commission Secretary, Planning Research and Development; Ms.
Hyrine Matheka - Senior Assistant Commission Secretary, Planning and Resource Mobilization;
Ms. Stella Kiptoo - Assistant Commission Secretary; Dr. Alice Kande - Senior Research Officer;
Mr. Pius Walela - Senior Research Officer; Mr. Reynold Njue - Planning Officer, Partnership
and Resource Mobilization; Ms. Claris Adoyo - Research Officer; and Mr. Muriithi Njeru, Data
Analyst, who worked tirelessly to deliver this report.
Prof. Mwenda Ntarangwi
Commission Secretary/CEO
Commission for University Education
vii
ABBREVIATIONS AND ACRONYMS
ADEA Association for the Development of Education in Africa
CBA Collective Bargaining Agreement
CHET Centre for Higher Education Transformation
CUE Commission for University Education
DUC Differentiated Unit Cost
GER Gross Enrolment Rate
FDI Foreign Direct Investment
ICT Information Communication Technology
ISCED International Standard Classification of Education
KAG Kenya Assemblies of God
KUCCPS Kenya Universities and Colleges Central Placement Services
LIA Letter of Interim Authority
MOE Ministry of Education
OECD Organization for Economic Cooperation and Development
PGD Postgraduate Diploma
PSSP Privately Sponsored Students Programme
SDGs Sustainable Development Goals
STEM Science, Technology, Engineering and Mathematics
UCT University of Cape Town
UFB Universities Funding Board
UK United Kingdom
UNESCO United Nations Educational, Scientific and Cultural Organization
USA United States of America
viii
DEFINITION OF TERMS
Accreditation The procedure by which the Commission
recognizes an institution as a University and as
having fulfilled the prescribed criteria for mounting
its academic programmes
Academic programme The design of learning content, which is multi-
dimensional and includes intentions, structure of
content, delivery modes, academic resources and
assessment modes
Differentiated Unit Cost The annual per student cost of mounting a particular
degree programme
Full Time Staff Equivalent (FTSE) Measures the equivalence to full-time as recorded in
the Contract of Employment
Full Time Academic Staff Employees whose Contract of Employment is 100%
for that post
Part Time Academic Staff Employees whose Contract of Employment is for
anything less than the full-time equivalent (100%)
Public Chartered University A university established and maintained or assisted
out of public funds
Private Chartered University A university which is established or maintained out
of funds other than public funds
Student to Fulltime Staff Ratio The number of Full Time Equivalent (FTE) students
divided by Full Time Equivalent (FTE) Faculty
Universities Constituent Colleges Means a semi-autonomous component of a
chartered university whose academic affairs are
governed by the Senate of the university
Universities with Letter of Interim An instrument of accreditation granted to a
Authority private university as stipulated in the Universities
Act, 2012; Revised 2016
ix
TABLE OF CONTENTS
EDITORIAL BOARD ......................................................................................................................................... IV
FOREWORD........................................................................................................................................................ V
ACKNOWLEDGEMENT ................................................................................................................................... VI
ABBREVIATIONS AND ACRONYMS ............................................................................................................ VII
DEFINITION OF TERMS ................................................................................................................................ VIII
EXECUTIVE SUMMARY………………………………………………………………………………………...XIII
CHAPTER ONE ................................................................................................................................................... 1
INTRODUCTION ................................................................................................................................................ 1
1.0 BACKGROUND ............................................................................................................................................. 1 1.1 UNIVERSITY EDUCATION IN KENYA ........................................................................................................... 1
CHAPTER TWO.................................................................................................................................................. 4
METHODS ........................................................................................................................................................... 4
2.1 INTRODUCTION ........................................................................................................................................... 4 2.2 DESIGN OF DATA COLLECTION .................................................................................................................. 4 2.3 VALIDITY OF THE DATA COLLECTION INSTRUMENT ................................................................................ 5 2.4 DATA COLLECTION ..................................................................................................................................... 5 2.5 VALIDATION OF DATA ................................................................................................................................ 5 2.6 LIMITATIONS OF DATA ............................................................................................................................... 5
CHAPTER THREE.............................................................................................................................................. 6
UNIVERSITIES ACADEMIC PROGRAMMES ................................................................................................ 6
3.1 INTRODUCTION ........................................................................................................................................... 6 3.2 NUMBER OF ACADEMIC PROGRAMMES IN PUBLIC AND PRIVATE UNIVERSITIES IN KENYA ................... 7 3.3 PROGRAMMES BY CLUSTER ....................................................................................................................... 8
3.3.1 Programmes by Cluster in Public Chartered Universities ..................................................................... 8 3.3.2 Programmes by Cluster in Private Chartered Universities .................................................................... 9 3.3.3 Programmes by Cluster in Private Universities with LIA.................................................................... 10 3.3.4 Programmes by Cluster in Public and Private Universities ................................................................ 11
3.4 SUMMARY AND IMPLICATIONS ................................................................................................................. 13
CHAPTER FOUR .............................................................................................................................................. 15
ENROLMENT ................................................................................................................................................... 15
4.1 INTRODUCTION ......................................................................................................................................... 15 4.2 ENROLMENT IN PUBLIC AND PRIVATE UNIVERSITIES ............................................................................. 15
4.2.1 Enrolment in Public and Private Universities by Gender and Academic Level ................................. 16 4.3 ENROLMENT BY CLUSTER ................................................................................................................................ 18
4.3.1 Enrolment per Cluster in Public and Private Universities .................................................................. 18 4.3.2 Enrolment by Cluster in Public Universities ........................................................................................ 19 4.3.3 Enrolment by Cluster in Private Universities ...................................................................................... 21
4.4 SUMMARY AND IMPLICATIONS OF ENROLMENT ON UNIVERSITY EDUCATION ...................................... 22 4.5 ENROLMENT BY COUNTY ......................................................................................................................... 23
x
4.5.1 Enrolment by County in Public and Private Universities ........................................................................ 24 4.5.2 Enrolment by County and Gender in Public and Private Universities .................................................... 24 4.5.3 Enrolment by County in Public Chartered Universities .......................................................................... 25 4.5.4 Enrolment by County in Private Chartered Universities ..................................................................... 26
4.6 ENROLMENT OF INTERNATIONAL STUDENTS .......................................................................................... 28 4.6.1 Enrolment of International Students by Gender ............................................................................. 28 4.6.2 International Student Enrolment by Academic Level ..................................................................... 28 4.6.3 International Students enrolment in Public Universities .................................................................... 29 4.6.4 Enrolment of International Students by Gender in Public Universities ............................................ 30 4.6.5 Enrolment of International Students by Level in Public Chartered Universities .............................. 30 4.6.6 Enrolment of International Students in Private Chartered Universities ........................................... 31 4.6.7 Enrolment of International Students by Gender in Private Chartered Universities.......................... 31 4.6.8 Enrolment of International Students by Level in Private Chartered Universities .............................. 32 4.6.9 Summary and implications of Enrolment by County and Country ..................................................... 32
4.7 ENROLMENT OF STUDENTS WITH DISABILITIES ...................................................................................... 33
CHAPTER FIVE ................................................................................................................................................ 35
UNIVERSITIES ACADEMIC STAFF .............................................................................................................. 35
5.1 INTRODUCTION ......................................................................................................................................... 35 5.2 ACADEMIC STAFF IN PUBLIC AND PRIVATE UNIVERSITIES .................................................................... 36
5.2.1 Academic staff by Gender in Public and Private Universities ............................................................. 37 5.2.2 Academic staff by Gender and University Category ................................................................................ 37
5.3 ACADEMIC STAFF BY QUALIFICATION..................................................................................................... 38 5.3.1 Academic staff by Gender and Qualification ................................................................................... 38 5.3.2 Comparison of Academic staff by Qualification between 2015 and 2016 ...................................... 39
5.4 ACADEMIC STAFF BY RANK...................................................................................................................... 40 5.4.1 Academic Staff by Rank in Public and Private Universities ........................................................... 41 5.4.2 Academic Staff by Rank and Gender ............................................................................................... 41 5.4.3 Academic Staff by Rank and University Category ................................................................................... 42 5.4.4 Comparison of academic staff by rank between the years 2015 and 2016 .............................................. 43
5.5 ACADEMIC STAFF BY PROGRAMME DOMAIN .......................................................................................... 45 5.5.1 Academic Staff by Gender and Programme Domain ...................................................................... 45 5.5.2 Academic Staff by Rank and Programme Domain ......................................................................... 46 5.5.3 Student to Academic Staff Ratios ..................................................................................................... 48
5.6 SUMMARY AND IMPLICATION OF THE FINDINGS FOR KENYA’S UNIVERSITY EDUCATION SUB-SECTOR
……………………………………………………………………………………………………………………………………………………………..51
CHAPTER SIX .................................................................................................................................................. 53
UNIVERSITY GRADUATIONS ....................................................................................................................... 53
6.1 INTRODUCTION ......................................................................................................................................... 53 6.2 TOTAL GRADUATIONS IN ALL UNIVERSITIES .......................................................................................... 53 6.3 GRADUATIONS BY IN PUBLIC AND PRIVATE UNIVERSITIES..................................................................... 54 6.4 GRADUATIONS BY GENDER IN PUBLIC AND PRIVATE UNIVERSITIES ..................................................... 54 6.5 GRADUATIONS PER UNIVERSITY CATEGORY .......................................................................................... 55
6.5.1 Graduations by University Category and Gender ................................................................................ 55 6.6 GRADUATIONS BY LEVEL IN PUBLIC AND PRIVATE UNIVERSITIES ........................................................ 56 6.7 GRADUATIONS BY LEVEL AND GENDER IN PUBLIC CHARTERED UNIVERSITIES ................................... 56 6.8 GRADUATIONS BY LEVEL AND GENDER IN PRIVATE CHARTERED UNIVERSITIES ................................. 57 6.9 GRADUATION BY LEVEL AND GENDER IN PRIVATE UNIVERSITIES CONSTITUENT COLLEGES ............. 57
xi
6.10 GRADUATIONS BY LEVEL AND GENDER IN UNIVERSITIES WITH LETTERS OF INTERIM AUTHORITY ... 58 6.11 GRADUATIONS BY GENDER AND CLUSTER AND IN PUBLIC AND PRIVATE UNIVERSITIES ..................... 58 6.12 GRADUATIONS BY CLUSTER AND LEVEL IN PUBLIC AND PRIVATE UNIVERSITIES ................................ 59 6.13 SUMMARY AND IMPLICATIONS OF THE FINDINGS FOR UNIVERSITY EDUCATION SUB-SECTOR ............. 62
CHAPTER SEVEN ............................................................................................................................................ 65
UNIVERSITIES INCOME AND EXPENDITURE .......................................................................................... 65
7.1 INTRODUCTION ......................................................................................................................................... 65 7.2 SUMMARY OF INCOME STREAMS IN PUBLIC AND PRIVATE UNIVERSITIES ............................................ 66 7.3 PROPORTION OF INCOME IN PUBLIC AND PRIVATE UNIVERSITIES ........................................................ 66 7.4 INCOME STREAMS IN PUBLIC AND PRIVATE UNIVERSITIES .................................................................... 67
7.4.1 Government Capitation ......................................................................................................................... 67 7.4.2 Student Fees .......................................................................................................................................... 67 7.4.3 Research Grants .................................................................................................................................... 68 7.4.4 Other Incomes ....................................................................................................................................... 68
7.5 UNIVERSITIES EXPENDITURE AND EXPENDITURE ITEMS ............................................................................ 68 7.6 SUMMARY OF EXPENDITURE AND EXPENDITURE ITEMS IN PUBLIC AND PRIVATE UNIVERSITIES ............. 69 7.7 PROPORTION OF EXPENDITURE ITEMS IN PUBLIC AND PRIVATE UNIVERSITIES ......................................... 69 7.8 EXPENDITURE ITEMS IN PUBLIC AND PRIVATE UNIVERSITIES ............................................................... 70
7.8.1 Staff Costs ......................................................................................................................................... 70 7.8.2 Building costs .......................................................................................................................................... 70 7.8.3 Maintenance Costs ................................................................................................................................ 71 7.8.4 Other Expenditure ................................................................................................................................ 71
7.9 BUDGET SURPLUS/DEFICIT ANALYSIS ..................................................................................................... 71 7.10 IMPLICATION OF THE FINDINGS FOR KENYA’S UNIVERSITY EDUCATION SUB-SECTOR ....................... 72
CHAPTER EIGHT ............................................................................................................................................ 73
CONCLUSIONS AND RECOMMENDATIONS .............................................................................................. 73
8.1 INTRODUCTION ......................................................................................................................................... 73 8.2 PROGRAMMES ........................................................................................................................................... 73 8.3 UNIVERSITY ENROLMENT ........................................................................................................................ 74
8.3.1 Enrolment by County ............................................................................................................................ 75 8.3.2 International Enrolment ....................................................................................................................... 76 8.3.3 Enrolment of Persons with Disability (PwDs) ..................................................................................... 76
8.4 UNIVERSITY STAFFING ............................................................................................................................. 77 8.5 GRADUATION ............................................................................................................................................ 78 8.6 UNIVERSITY INCOME AND EXPENDITURE ................................................................................................ 79 8.7 EMERGING ISSUES..................................................................................................................................... 80
ANNEXES .......................................................................................................................................................... 81
ANNEX 1 : NUMBER OF PROGRAMMES IN PUBLIC CHARTERED UNIVERSITIES ................................................... 81 ANNEX 2: NUMBER OF PROGRAMMES IN PUBLIC UNIVERSITIES CONSTITUENT COLLEGES .............................. 82 ANNEX 3: NUMBER OF PROGRAMMES IN PRIVATE CHARTERED UNIVERSITIES ................................................. 82 ANNEX 4: NUMBER OF PROGRAMMES IN PRIVATE CONSTITUENT COLLEGES .................................................... 83 ANNEX 5: NUMBER OF PROGRAMMES IN INSTITUTIONS WITH LETTERS OF INTERIM AUTHORITY ................... 83 ANNEX 6: PROGRAMMES BY CLUSTER IN PUBLIC CONSTITUENT COLLEGES ..................................................... 84 ANNEX 7: PROGRAMMES BY CLUSTER IN PRIVATE CONSTITUENT COLLEGES ................................................... 85 ANNEX 8: PROGRAMMES BY CLUSTER AND ACADEMIC LEVEL IN PUBLIC CHARTERED UNIVERSITIES ............ 86
xii
ANNEX 9: PROGRAMMES BY CLUSTER AND ACADEMIC LEVEL IN PUBLIC CONSTITUENT COLLEGES ............. 94 ANNEX 10: PROGRAMMES BY CLUSTER AND ACADEMIC LEVEL IN PRIVATE CHARTERED UNIVERSITIES........ 95 ANNEX 11: PROGRAMMES BY CLUSTER IN PRIVATE CONSTITUENT COLLEGES ............................................... 100 ANNEX 12: PROGRAMMES BY CLUSTER AND ACADEMIC LEVEL IN INSTITUTIONS WITH LETTERS OF INTERIM
AUTHORITY .......................................................................................................................................................... 101 ANNEX 13: ENROLMENT BY GENDER AND ACADEMIC LEVEL IN PUBLIC AND PRIVATE UNIVERSITIES .......... 103 ANNEX 14: PROPORTION OF MASTERS TO DOCTORATE STUDENTS ................................................................... 103 ANNEX 15: ENROLMENT BY CLUSTER IN PUBLIC AND PRIVATE UNIVERSITIES ................................................ 104 ANNEX 16: ENROLMENT BY GENDER AND ACADEMIC LEVEL IN PUBLIC CHARTERED UNIVERSITIES ........... 105 ANNEX 17: ENROLMENT BY GENDER AND ACADEMIC LEVEL IN PUBLIC CONSTITUENT COLLEGES .............. 106 ANNEX 18: ENROLMENT BY GENDER AND ACADEMIC LEVEL IN PRIVATE CONSTITUENT COLLEGES ............ 106 ANNEX 19: ENROLMENT BY GENDER AND ACADEMIC LEVEL IN PRIVATE CHARTERED UNIVERSITIES ......... 107 ANNEX 20: ENROLMENT BY GENDER AND ACADEMIC LEVEL IN INSTITUTIONS WITH LIA ............................. 108 ANNEX 21: UNIVERSITY STAFFING BY RANK IN PUBLIC CHARTERED UNIVERSITIES ....................................... 109 ANNEX 22: UNIVERSITY STAFFING BY RANK IN PUBLIC UNIVERSITIES CONSTITUENT COLLEGES ................. 110 ANNEX 23: UNIVERSITY STAFFING BY RANK IN PRIVATE CHARTERED UNIVERSITIES..................................... 111 ANNEX 24: UNIVERSITY STAFFING BY RANK IN PRIVATE UNIVERSITIES CONSTITUENT COLLEGE ................. 112 ANNEX 25: UNIVERSITY STAFFING BY RANK IN INSTITUTIONS WITH LETTER OF INTERIM AUTHORITY ......... 112 ANNEX 26: UNIVERSITY STAFFING BY QUALIFICATION IN PUBLIC CHARTERED UNIVERSITIES ...................... 113 ANNEX 27: UNIVERSITY STAFFING BY QUALIFICATION IN PUBLIC UNIVERSITIES CONSTITUENT COLLEGES 114 ANNEX 28: UNIVERSITY STAFFING BY QUALIFICATION IN PRIVATE CHARTERED UNIVERSITIES ................... 115 ANNEX 29: UNIVERSITY STAFFING BY QUALIFICATION IN PRIVATE UNIVERSITIES CONSTITUENT COLLEGE 116 ANNEX 30: UNIVERSITY STAFFING BY QUALIFICATION IN INSTITUTIONS WITH LIA ....................................... 116 ANNEX 31: UNIVERSITY STAFFING BY RANK AND CLUSTER IN PUBLIC CHARTERED UNIVERSITIES ............... 117 ANNEX 32: UNIVERSITY STAFFING BY RANK AND CLUSTER IN PUBLIC UNIVERSITY CONSTITUENT COLLEGES
……………………………………………………………………………………………………………………………………………………………118 ANNEX 33: UNIVERSITY STAFFING BY RANK AND CLUSTER IN PRIVATE CHARTERED UNIVERSITIES ............ 119 ANNEX 34: UNIVERSITY STAFFING BY RANK AND CLUSTER IN UNIVERSITIES WITH LIA ................................ 120 ANNEX 35: UNIVERSITY STAFFING BY RANK AND CLUSTER IN PRIVATE UNIVERSITIES CONSTITUENT
COLLEGES............................................................................................................................................................. 121 ANNEX 36: UNIVERSITIES STAFFING COMPARISON BETWEEN YEARS 2015 AND 2016 ...................................... 122 ANNEX 37: STUDENTS ENROLMENT PER COUNTY AND GENDER IN PUBLIC AND PRIVATE UNIVERSITIES ....... 123 ANNEX 38: ENROLMENT BY GENDER AND COUNTY IN PUBLIC CHARTERED UNIVERSITIES ............................ 124 ANNEX 39: ENROLMENT BY GENDER AND COUNTY IN PRIVATE CHARTERED UNIVERSITIES ......................... 125 ANNEX 40: INTERNATIONAL STUDENTS BY LEVEL IN PUBLIC CHARTERED UNIVERSITIES ............................. 127 ANNEX 41: INTERNATIONAL STUDENTS BY LEVEL IN PUBLIC UNIVERSITIES CONSTITUENT COLLEGES ........ 128 ANNEX 42: INTERNATIONAL STUDENTS BY LEVEL IN PRIVATE CHARTERED UNIVERSITIES ............................ 129 ANNEX 43: INTERNATIONAL STUDENTS BY LEVEL IN INSTITUTIONS WITH LIA................................................ 132 ANNEX 44: INTERNATIONAL STUDENTS BY LEVEL IN PRIVATE UNIVERSITIES CONSTITUENT COLLEGES ...... 132 ANNEX 45: COUNTIES IN KENYA ......................................................................................................................... 135 ANNEX 46: GRADUATION IN PUBLIC CHARTERED UNIVERSITIES ..................................................................... 136 ANNEX 47: GRADUATION IN PUBLIC CHARTERED BY DEGREE AWARD IN 2015 AND 2016 .............................. 137 ANNEX 48: GRADUATION IN PUBLIC CHARTERED UNIVERSITIES BY GENDER IN 2015 AND 2016 .................... 139 ANNEX 49: GRADUATION IN PRIVATE CHARTERED UNIVERSITIES BY GENDER IN 2015 AND 2016 .................. 140 ANNEX 50: GRADUATION IN PRIVATE CHARTERED UNIVERSITIES BY DEGREE AWARD .................................. 141 ANNEX 51: GRADUATION IN PRIVATE UNIVERSITIES CONSTITUENT COLLEGES BY GENDER .......................... 143 ANNEX 52: GRADUATION IN PRIVATE UNIVERSITY CONSTITUENT COLLEGES BY DEGREE AWARD ............... 144 ANNEX 53: GRADUATION IN UNIVERSITIES WITH LIA BY GENDER ................................................................... 145 ANNEX 54: GRADUATION IN UNIVERSITIES WITH LIA BY DEGREE AWARD ..................................................... 146 REFERENCES .................................................................................................................................................... 147
xiii
EXECUTIVE SUMMARY
University Statistics Report 2016/2017 provides database of invaluable information to all
stakeholders. It will form a useful resource for making decisions on policy formulation,
implementation, monitoring and evaluation. This is in line with the mandate of the Commission
to collect, disseminate and maintain data on university education and to promote quality research
and innovation. This report is organized into eight chapters namely: Introduction; methodology;
academic programmes; students’ enrolment; academic staff distribution by rank; graduation;
income and expenditure as well as conclusions and recommendations.
The report opens with Chapter one which is an introduction that briefly describes the expansion
of university education, sessional papers, policy and legislative frameworks that have guided the
sector. It also presents the mandate, functions, vision and the mission of the Commission as well
as the Commission’s core values. Chapter two gives a synopsis of the methodology used in
collecting and analyzing data which culminated into this publication. It broadly covers the
development and validation of the data collection instrument; the data collection and processing;
and validation of data. This Chapter also presents the scope and limitation of the data.
In Chapter three universities academic programmes have been discussed comprehensively. The
chapter begins by giving a summary of universities academic programmes in public and private
universities’. The academic programmes are further clustered and classified in terms of
university categories. The chapter further gives the implications of the universities programmes
in view of Kenya’s long term development agenda.
Student enrolment is a very instrumental part of this report because accurate statistics of students
in the Universities is constantly sought for by several government agencies to enable them plan
well and allocate resources equitably. Chapter four therefore presents a detailed report on
students’ enrolment in universities. It provides data on students enrolment in public and private
universities segregated in terms of gender. It also gives enrolment per programme level and
cluster. The chapter analyses male and female enrolment per academic programme level and
provides calculations of the ratio of academic staff to students. Postgraduate students constitute
the pool from which the next generation of academics is drawn. The number of master’s and
doctoral enrolments remains small. Available data shows that men dominate postgraduate
enrolments. Finally the report presents enrolment of students by county; country of origin
(international); as well as students with disability.
The academic qualification and distribution of staff by rank are analyzed in depth in Chapter
five. A very significant finding which has been reported in this chapter is that there were fewer
doctoral than master’s degree holders. The evidence further points to the fact that the number of
males with master’s and doctorate degrees is consistently higher than that of females. The
distribution of men and women across ranks shows that the latter are underrepresented at the
xiv
higher ranks — from senior lecturer to full professor — and overrepresented at the level of
lecturer and below.
Chapter six provides data on graduation numbers that are divided up into academic levels,
gender and programme clusters. Chapter seven presents data on universities income and
expenditure. It identifies the various income streams and expenditure items in the universities
and gives the proportions of each. It further analyses the budget surplus/deficit realized by the
universities.
Conclusions and recommendations have been discussed in Chapter eight. It is summarized and
modelled along the following thematic areas: university enrolment; university staffing; university
programmes; graduations and university income and expenditure.
Finally the annexes provide comprehensive information of other university data. These are
necessary for planning and monitoring of the university sub sector.
1
Chapter One
Introduction
1.0 Background
The Commission for University Education (CUE) was established by an Act of Parliament, The
Universities Act No. 42 of 2012 (Rev. 2016) to ensure maintenance of standards, quality and
relevance in all aspects of university education, training and research.
This report includes efforts by the Commission for University Education (CUE) to achieve part
of its specific functions as stipulated in Section 5 (1) of the Universities Act of 2012 (Rev. 2016):
‘to monitor and evaluate the state of university education systems in relation to the national
development goals; promote quality research and innovation; and to collect, analyze and
disseminate university data on annual basis’.
Universities in Kenya are established by the Commission for University Education after
consideration of an application by a sponsor who may be the Kenyan Government or private
person(s) and/or entities. Universities established by the Government are referred to as public
universities while those established by private person(s) or entities are private universities. There
are two categories under public universities: Public Chartered Universities and the Public
Constituent Colleges. Private universities are categorized into Private Chartered Universities,
Private Constituent Colleges and Universities operating with Letters of Interim Authority (LIA).
At the time of collecting the 2016/2017 university data, there were seventy (70) universities in
Kenya comprising of thirty (30) Public Chartered Universities, five (5) Public Constituent
Colleges, eighteen (18) Private Chartered Universities, five (5) Private Constituent Colleges and
twelve (12) universities operating with Letters of Interim Authority.
1.1 University education in Kenya
The university subsector in Kenya has exponentially grown over the last four decades from one
(1) university in 1970 to 33 universities in 2012 and 70 Universities in 2016. This growth has
greatly been occasioned by, among other factors, the government’s need to increase access,
equity, relevance and quality of university education.
The growth of the university sector previously benefited from the strong social demand arising
from an increasing population base of young people who attain the Kenya Certificate of
Secondary Education and the continued need to provide a highly educated and trained workforce.
To support this growth, the government has periodically developed various legal frameworks
and strategies to ensure that it delivers the envisioned quality and relevant education required for
socio-economic and other forms of development in the country. Among some of the legal
2
frameworks and policy documents that have greatly influenced the shaping of the university
education in Kenya are; the sessional paper no. 14 of 2012, the Universities Act No. 42 of 2012
(revised 2016) and Kinyanjui report of 2007.
The Government aims to improve access and equity in University education and envisages an
increase in enrolment from 181,000 in 2010 to 600,000 students by 2022 while taking
appropriate measures to ensure a student composition that reflects national diversity. To increase
access and equity, the Government and the private sector have made major strides in actualizing
Public Private Partnership (PPP) initiatives that have seen the private sector play a key role in
expanding access and equity in university education.
These efforts have yielded fruits as the number of academic programmes offered as well as the
number of students enrolled have been increasing steadily to 3900 programmes and 548,000
students in 2016. Students are enrolled into the universities either as government sponsored or
privately sponsored. Government sponsored students are placed by the Kenya Universities and
Colleges Central Placement Service (KUCCPS) to various Universities. Previously, KUCCPS
placed students only into public universities as the then law provided. However from 2016,
government sponsored students have been placed in both public and private universities.
Privately sponsored students apply directly to the University and are admitted upon satisfying the
entry requirements for the particular programme as set by the respective University Senates. The
Kenyan Constitution, 2010, requires all public institutions to ensure equity in terms of gender,
Persons with Disability, regional distribution among others. The Commission collected data on
student enrolment segregated by gender, enrolment of students with Disabilities as well as by
counties and countries of origin.
The university sub sector is expected to provide the manpower required to achieve the Vision
2030, the ‘Big Four” agenda and all other national development goals. The Sessional paper no.
14 of 2012, articulates the need to strengthen and grow academic programmes that support the
national priority and strategic areas. There have been efforts to improve the quality and relevance
of the programmes on offer in Kenyan universities. The Kenyan Government in the Vision 2030
has identified the need for manpower in Science, Technology Engineering and Mathematics
(STEM) programmes in order to achieve its development goals.
However, as this report details in the various sections, the programmes on offer and student
enrolment and graduations are highly skewed to the Arts, Humanities and Social Sciences as
opposed to STEM. In monitoring the quality of university education, there are a number of
quality indicators to check for, these include: employability ratios, the enrolment of international
students, the student- lecturer ratios, among others.
The Commission set out to determine the number and origin of international students as well as
the number of students and academic staff in the universities. To guide staffing, the CUE 2014
Harmonised Criteria and Guidelines on Appointment and Promotion of Academic Staff in
Universities in Kenya, identifies eight categories for grading academic staff and the required
qualification for each rank. These are: Graduate Assistant/Junior Research Fellow; Tutorial
3
Fellow/Junior Research Fellow; Lecturer/Research Fellow; Senior Lecturer/Senior Research
Fellow; Associate Professor; Professor; Adjunct Academic Staff and Visiting Academic staff.
This report covers all these categories except for Adjunct and Visiting Academic Staff. Efforts
will be made to capture the missing categories of staff in subsequent data collection exercises.
Financial health of an institution determines the quality and quantity of all the other resources an
institution can afford. The data on income and expenditure allows stakeholders to have an
overview of what proportion of income is sourced from the various income streams, as well as
what the university income is majorly being utilized for. The outcome of this section of the
report revealed that majority of the universities operated in a deficit in the year 2016. While
acknowledging that declining finances and revenues has been a common feature in universities
across the globe, the universities are expected to re-think sustainability strategies that will see
them weather the storm presently and guarantee a future.
In conclusion, the University sub sector has made progressive gains in promoting access to
university education as the number of universities, programmes and students has grown
remarkably. However, there is still need for concerted efforts to address relevance, equity and
quality in university education. In particular, more should be done to ensure that the quality and
type of courses offered by universities are in line with the requirements of national development
as stipulated in the Kenya Vision 2030. The subsector needs to source for alternative funding as
the funds from student fees and the Exchequer are not sufficient to cater for the operations of the
universities. There is also need to look at the efficacy of the universities systems and
streamlining them for efficiency and effectiveness.
4
Chapter Two
Methods
2.1 Introduction
University data is one of the most important information required from universities. The
Government needs this data regularly to plan, forecast and provide for needs in the university
education sector. As a regulator, the Commission is committed to collecting, analyzing and
maintaining data for use by government, researchers and other stakeholder who require
university education statistics. This effort is based on the belief that, in an ever dynamic,
sophisticated and knowledge-driven world, no meaningful national development can be achieved
without empowering the national statistical database with timely and reliable data. Furthermore,
factual decisions and policies have been shown to be better at targeting their purpose, easily
evaluated and increasingly efficient.
The data collected from universities covers various aspects in the university such as enrolment,
staffing, programmes, staff qualification, graduations and enrolment of students with disabilities.
This data lays the foundation for statistical information which will offer a reliable database for
designing evidence-based policy in universities in Kenya and forms the basis for further research
and analysis. Policy makers, researchers, postgraduate students, State Departments, Non-
Governmental Organizations and numerous other stakeholders in the education sector will find
this data invaluable.
2.2 Design of Data Collection
The data tool used to capture data for this report was quantitative by design. The target
population was all public and private universities in Kenya. Since all the cases were considered,
it qualifies to be considered, a saturated census. Data collection took five months; June to
October 2017, and the data sought covered the 2016/2017 academic year. There were 70 public
and private universities at the time of collecting the data. However, three did not have all the
required information as they were newly registered.
Data was collected using a questionnaire with five key variables namely: Academic programmes,
students’ enrolment, staffing, graduation trends and income & expenditure. With respect to
academic programmes, the International Standard Classification of Education (ISCED)
developed by UNESCO was adopted. It classifies programmes offered in universities into
twenty-one clusters and provides a means for comparison of education statistics and indicators
across countries through uniform and internationally agreed definitions.
The tool captured enrolment of students in public and private universities desegregated by
gender, academic level, country of origin and disability. For academic staff, gender, academic
5
qualification, establishment and tenure (i.e. whether full time or part time) were captured in the
tool.
2.3 Validity of the Data Collection Instrument
A tool developed by the Commission in conjunction with research experts from the University of
Groningen in Netherlands, was used to collect data from universities. The same tool was used in
the previous year and had been subjected to two validation workshops attended by two officers,
Registrar and Directors of Quality Assurance, from each university.
2.4 Data Collection
Questionnaires were sent to 70 Universities through e-mail. This was followed by phone calls to
confirm that the questionnaires had been received. The contact persons in universities were
academic registrars and/or quality assurance officers. In cases where the two could not be
reached, vice chancellors were contacted. Data received from universities were cleaned, collated
and entered into one main excel sheet and analyzed according to the following variables:
university programmes, student enrolments, staff qualifications and establishments, graduation
trends and finance. Descriptive statistics, which included frequency tables, percentages, ratios,
charts and graphs were used to analyze data. These were then compiled into one document.
2.5 Validation of Data
Data validation was done in a stakeholder workshop attended by Registrars or Quality Assurance
officers from the universities. Together with Officers from Planning, Research and Development
Division from the Commission, they engaged in cross-checking and verifying data from the
universities. Analyzed data output was interrogated to ascertain its validity and reliability. Where
there were doubts or anomaly, the original data entries were scrutinized and appropriately
analyzed.
2.6 Limitations of Data
Data collection was not without challenges. There were blank spaces, especially with regard to
privately sponsored students. Classifying students as either self-sponsored, Government-
sponsored or Distance learners was a challenge.
The tool did not also provide for data entry on students with multiple disabilities. Some
universities admitted not being certain of where to place the programmes they offered against the
UNESCO classification, while some programmes they offered were not listed in the
classification. There was the likelihood that there was double counting of lecturers due to part
timing.
Financial information was incomplete or was not provided in accordance with the instructions
given. Another challenge arose from the fact that private and public universities have their
financial years beginning (and ending) at different months of the year. However, consultations
were made to enter appropriate figures.
6
Chapter Three
Universities Academic Programmes
3.1 Introduction
This chapter gives a highlight of the various programmes that were offered by both public and
private universities in Kenya during the 2016/2017 academic year. An explicit summary of the
number and the type of programmes in each of the universities is provided. Universities
programmes were classified into nineteen (19) clusters adapted from the International Standard
Classification of Education (ISCED).
The role of the universities in actualizing the nation’s development blue print has over the years
been emphasized in several policy documents among them the Ominde Report (1964); Gachathi
Report (1976); Mackay Report (1982); Kamunge Report (1988); Sessional Paper No. 1 of 2005;
Kinyanjui Report (2006); Sessional Paper No. 10 of 2012; as well as Kenya Vision 2030 which
is the country’s new development blueprint covering the period 2008 to 2030. All the while, the
government has over the years envisaged a university sector that enables realization of individual
and national goals of social, economic, and political development in a highly competitive and
rapidly changing global Environment and Forestry. With their broad remit around the creation
and dissemination of knowledge and their unique position within society, Universities have a
critical role to play in the achievement of national and global development goals.
National development agenda can only be realized through transformation of the Kenyan
economy driven by technological innovation, a shift from knowledge-reproduction to
knowledge-production, and ensuring the availability of a critical mass of well-qualified human
resource to spur development. Human resource development as an essential enabler for an
industrializing economy can only be realized by offering quality education and training (Kenya
Vision 2030). The heart of this transformation is a university education system that is focused,
efficient and able to create knowledge, which is accessible, equitable and relevant to sustain a
knowledge economy in a globally competitive arena. For a university to be globally competitive
and to meet the expectations of the 21st century and beyond, the programmes offered should be
aligned to the dictates of the market while ensuring quality and relevance.
The desire for equitable and accessible higher education has in the recent years resulted to an
exponential growth of universities. However, a general concern in the university sector in Kenya
has been the issue of substantial graduate unemployment (Economic Survey, 2017); the
imbalance between Humanities, Arts and Social sciences on the one hand and Science,
Technology Engineering and Mathematics on the other, and the consequent shortage of needed
knowledge and skills in areas such as Manufacturing, Housing, Health, Food Security,
Biotechnology and Information Communication Technology (CUE, 2016). Commission for
7
University Education has over the years enhanced efforts in regulating and assuring quality
university education by setting standards and monitoring compliance to achieve national and
global competitiveness (Universities Standards and Regulations, 2014).
One of the key functions of the Commission is to accredit and inspect programmes offered by
universities to ensure relevance and compliance with the stipulated guidelines for development
of a university programme. This section provides a comprehensive list of the nature of
programmes offered by the universities in the year 2016.
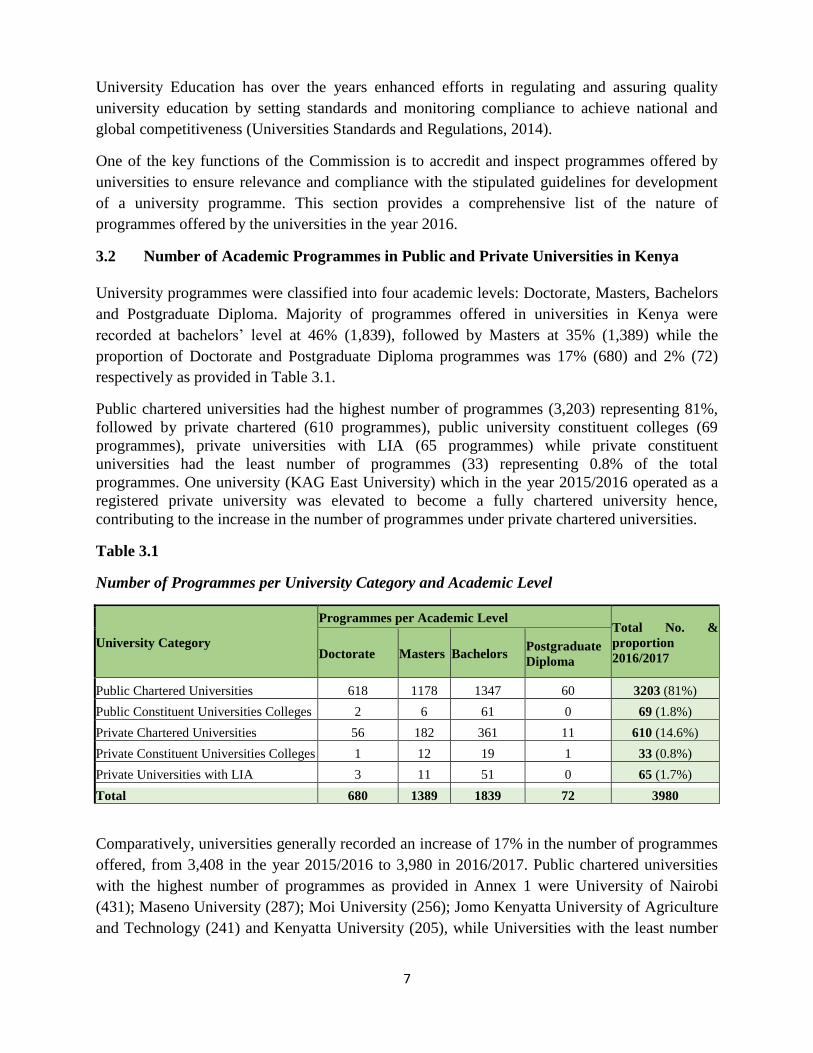
3.2 Number of Academic Programmes in Public and Private Universities in Kenya
University programmes were classified into four academic levels: Doctorate, Masters, Bachelors
and Postgraduate Diploma. Majority of programmes offered in universities in Kenya were
recorded at bachelors’ level at 46% (1,839), followed by Masters at 35% (1,389) while the
proportion of Doctorate and Postgraduate Diploma programmes was 17% (680) and 2% (72)
respectively as provided in Table 3.1.
Public chartered universities had the highest number of programmes (3,203) representing 81%,
followed by private chartered (610 programmes), public university constituent colleges (69
programmes), private universities with LIA (65 programmes) while private constituent
universities had the least number of programmes (33) representing 0.8% of the total
programmes. One university (KAG East University) which in the year 2015/2016 operated as a
registered private university was elevated to become a fully chartered university hence,
contributing to the increase in the number of programmes under private chartered universities.
Table 3.1
Number of Programmes per University Category and Academic Level
University Category
Programmes per Academic Level Total No. &
proportion
2016/2017 Doctorate Masters Bachelors Postgraduate
Diploma
Public Chartered Universities 618 1178 1347 60 3203 (81%)
Public Constituent Universities Colleges 2 6 61 0 69 (1.8%)
Private Chartered Universities 56 182 361 11 610 (14.6%)
Private Constituent Universities Colleges 1 12 19 1 33 (0.8%)
Private Universities with LIA 3 11 51 0 65 (1.7%)
Total 680 1389 1839 72 3980
Comparatively, universities generally recorded an increase of 17% in the number of programmes
offered, from 3,408 in the year 2015/2016 to 3,980 in 2016/2017. Public chartered universities
with the highest number of programmes as provided in Annex 1 were University of Nairobi
(431); Maseno University (287); Moi University (256); Jomo Kenyatta University of Agriculture
and Technology (241) and Kenyatta University (205), while Universities with the least number
8
of programmes were Cooperative University College of Kenya (5), Taita Taveta University (12)
Kirinyaga University (19); Multimedia University of Kenya (33); Murang’a and Machakos
Universities both with 42 programmes.
A significant drop in the number of programmes offered by public universities constituent
colleges was recorded which was partly attributable to the fact that all the seven (7) public
university constituent colleges in the academic year 2015/2016 had been elevated to the status of
public chartered universities, hence the 4 public constituent universities in the year 2016/2017
were relatively new establishments and consequently had few approved programmes. Details of
the exact number of programmes per level in the public university constituent colleges are
provided in Annex 2.
The number of programmes in private chartered universities increased with a relatively small
margin of 14%, which was attributed to elevation of one university, which previously operated as
a registered private university to the status of private chartered university during the academic
year 2016/2017. Mount Kenya University had the highest number of programmes (98) while
Adventist University had the least with 11 programmes. Annex 3 provides the number of
programmes per level in private chartered universities.
Private universities operating under LIA recorded a 0.1% drop in the number of programmes
offered between the academic years 2015/2016 and 2016/2017 with majority of programmes
being offered at bachelors level. A similar pattern was observed in private universities
constituent colleges where majority of the programmes (57%) were offered at bachelors level.
Regina Pacis University College had one (1) programme at undergraduate level in the academic
year 2015/2016, however, no data was obtained from the institution in the academic year
2016/2017 due to institutional restructuring and hence all academic activities during that year
were being undertaken by the parent institution – Catholic University of East Africa. A
comprehensive list of the programmes offered in private universities with LIA and private
universities constituent colleges is provided in Annexes 4 and 5.
3.3 Programmes by Cluster
The nature of programmes offered in various universities is largely determined by the nature of
the institution’s establishment, market forces, appraisal by professional bodies, availability and
adequacy of infrastructure and human resources among other factors. This section details the
focus by each of the universities as indicated by the type of the programmes offered. There was a
notable increase in the number of programmes in various clusters between the years 2015/2016
and 2016/2017 as indicated in the sections below:
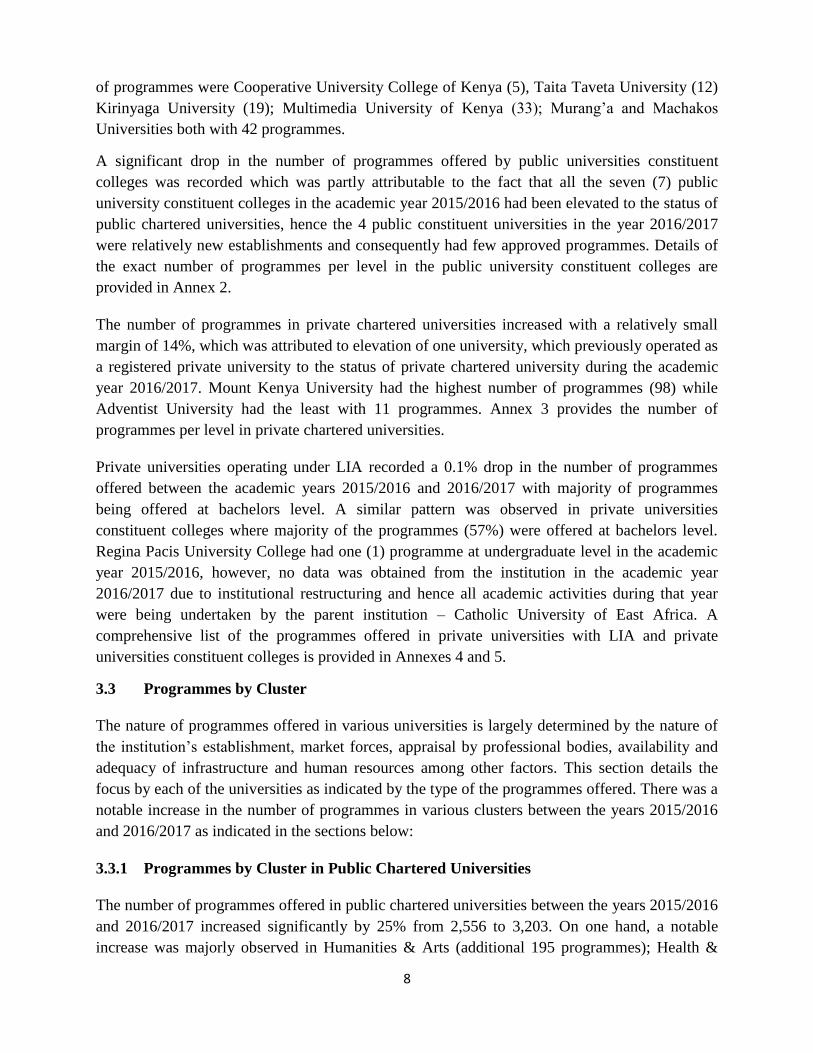
3.3.1 Programmes by Cluster in Public Chartered Universities
The number of programmes offered in public chartered universities between the years 2015/2016
and 2016/2017 increased significantly by 25% from 2,556 to 3,203. On one hand, a notable
increase was majorly observed in Humanities & Arts (additional 195 programmes); Health &
9
Welfare (additional 89 programmes); Life Science & Physical Science (additional 88
programmes); and Education (Arts) with an additional 78 programmes. On the other hand, three
clusters namely; Mathematics & Statistics; Services and Social & Behavioral Science recorded
fewer programmes than those that had been declared in the previous academic year 2015/2016.
The top four popular programmes in public chartered universities were Humanities and Arts
(493); Life Science and Physical Science (420); Agriculture, Livestock & Fisheries (381); and
Health and Welfare (331). The least popular programmes were Law (8); Manufacturing (11);
Architecture (43) and Services with 44 programmes. The figures and proportions are provided in
Table 3.2.
Table 3.2
Programmes by Cluster in Public Chartered Universities
Cluster
Programme Level Total No. &
proportion
2016/2017 Doctorate Master Bachelor
Postgraduate
Diploma
Agriculture, Livestock and Fisheries 77 130 144 10 381 (17%)
Architecture 7 15 21 0 43 (0.1%)
Business and Administration 44 97 152 2 295 (12.8%)
Computing and ICT 17 30 86 4 137 (5.9%)
Education (Arts) 72 133 77 8 290 (12.6%)
Education (Science) 5 11 31 0 47 (2%)
Engineering 27 44 100 1 172 (7.4%)
Environment and Forestry 33 55 62 5 155 (6.7%)
Health and Welfare 62 153 112 4 331 (14%)
Humanities and Arts 119 220 144 10 493 (21.4%)
Journalism and Information 9 25 37 0 71 (3%)
Law 1 1 6 0 8 (0.3%)
Life Science and Physical Science 95 150 171 4 420 (18.2%)
Manufacturing 2 3 6 0 11 (0.4%)
Mathematics and Statistics 8 21 40 1 70 (3.0%)
Security and Conflict Resolution 14 28 34 3 79 (3.4%)
Services 2 15 24 3 44 (1.9%)
Social and Behavioral Science 14 35 52 0 101 (4.3%)
Other 10 12 29 4 55(2.4%)
Total 618 1178 1347 60 3203
In public university constituent colleges, a similar trend of concentration of programmes in the
Humanities, Arts and Business Administration was observed as provided in Annex 6. Several
clusters such as Engineering, Architecture, Manufacturing and Law were the least popular with
no single programme in all the four public universities constituent colleges.
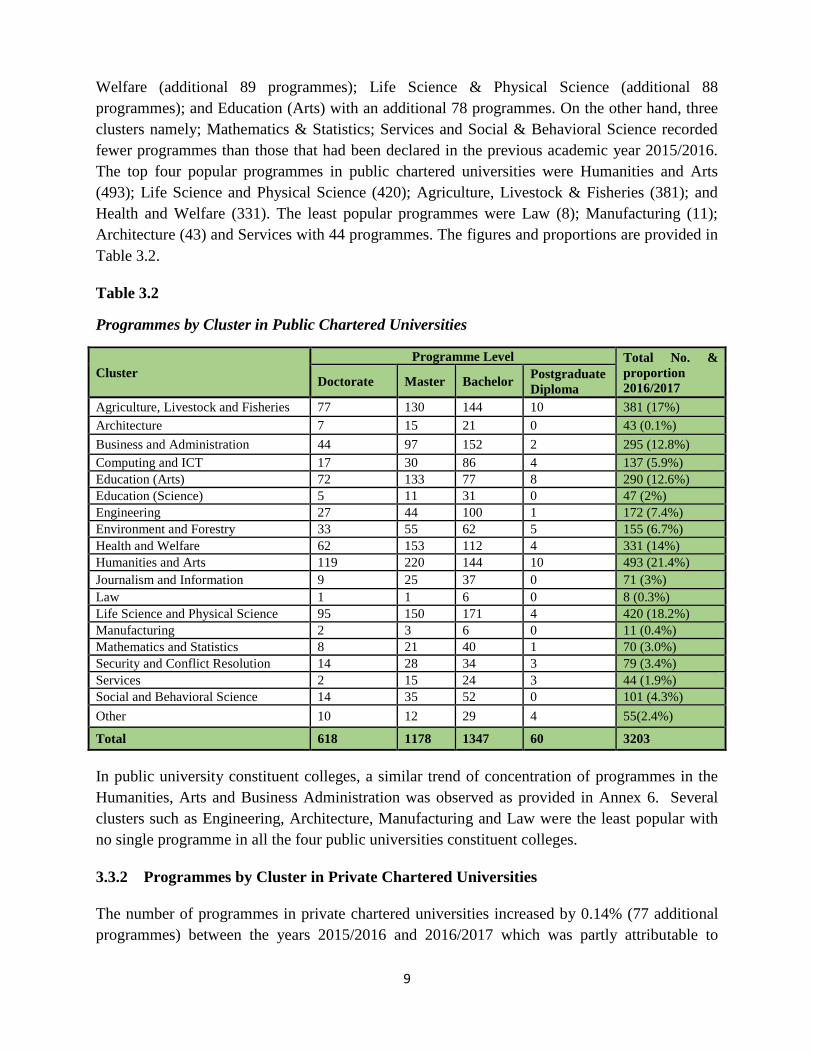
3.3.2 Programmes by Cluster in Private Chartered Universities
The number of programmes in private chartered universities increased by 0.14% (77 additional
programmes) between the years 2015/2016 and 2016/2017 which was partly attributable to
10
elevation of KAG East from a registered university to a fully chartered university. The
programmes were largely concentrated in Humanities and Arts (145 programmes); Business and
Administration (111 programmes); Health & Welfare (65 programmes) and Education (Arts)
with 64 programmes. None of the private chartered universities offered Architecture and had few
offerings in Manufacturing (1 programme); Engineering (2 programmes); Environment and
Forestry (4 programmes); and Education (Science) with 5 programmes. The figures and
proportions for these programmes are provided in Table 3.3.
Table 3.3
Programmes by Cluster in Private Chartered Universities
Programme Level Total No. &
proportion
2016/2017 Doctorate Master Bachelor
Postgraduate
Diploma
Agriculture, Livestock and Fisheries 1 2 8 0 11 (1.8%)
Architecture 0 0 0 0 0
Business and Administration 12 42 55 2 111 (18.2%)
Computing and ICT 4 16 41 0 61 (10%)
Education (Arts) 8 16 33 7 64 (10.5%)
Education (Science) 0 0 5 0 5 (0.8%)
Engineering 0 0 2 0 2 (0.3%)
Environment and Forestry 0 1 3 0 4 (0.6%)
Health and Welfare 2 20 43 0 65 (10.6%)
Humanities and Arts 16 57 71 1 145 (17.2%)
Journalism and Information 1 1 9 0 11 (1.8%)
Law 0 0 6 0 6 (1%)
Life Science and Physical Science 0 3 19 0 22 (3.6%)
Manufacturing 0 0 1 0 1 (0.2%)
Mathematics and Statistics 2 4 14 0 20 (3.3%)
Security and Conflict Resolution 0 4 9 0 13 (2.1%)
Services 0 0 8 0 8 (1.3%)
Social and Behavioural Science 10 16 26 1 53 (8.7%)
Others 0 0 8 0 8 (1.3%)
Total 56 182 361 11 610
In private universities constituent colleges, Science, Technology, Engineering and Mathematics
(STEM) related programmes such as Mathematics, Engineering, Manufacturing, Architecture
and other science were insignificantly represented. The number of programmes across the
clusters were also comparatively low ranging from 0 to 17 programmes with majority in Social
and Behavioral Science (17); Education{Arts}(4) and Health & Welfare with 4 programmes as
provided in Annex 7.
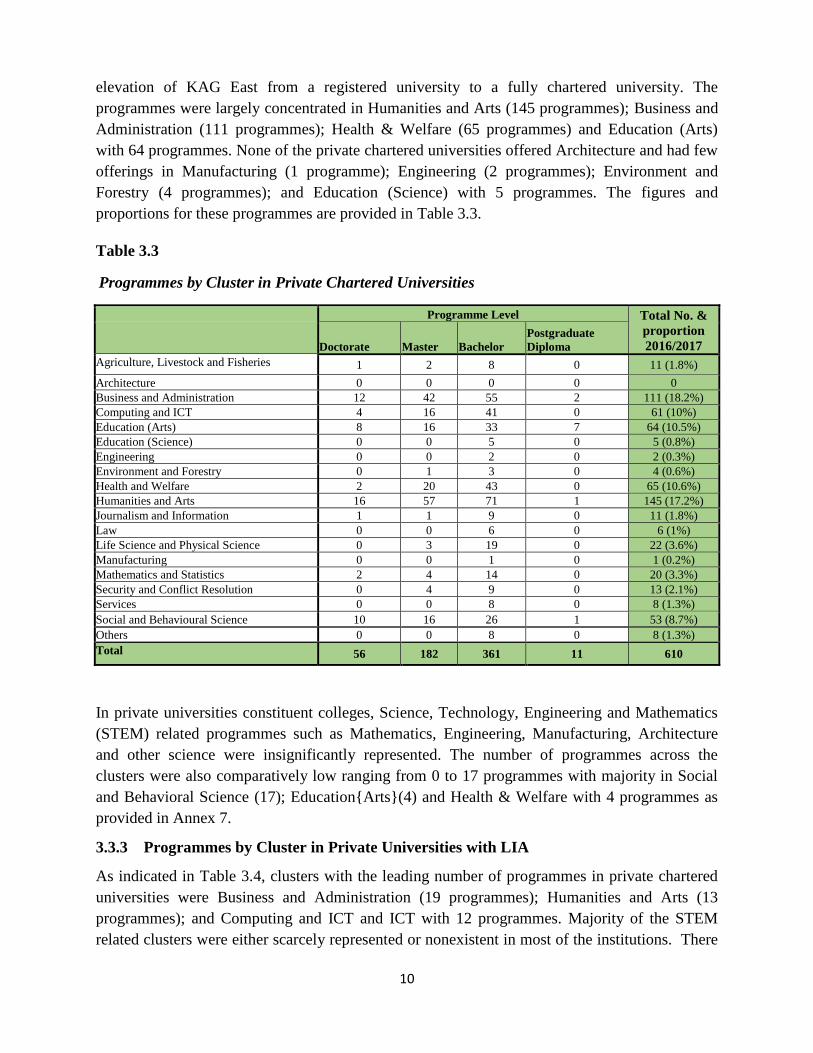
3.3.3 Programmes by Cluster in Private Universities with LIA
As indicated in Table 3.4, clusters with the leading number of programmes in private chartered
universities were Business and Administration (19 programmes); Humanities and Arts (13
programmes); and Computing and ICT and ICT with 12 programmes. Majority of the STEM
related clusters were either scarcely represented or nonexistent in most of the institutions. There
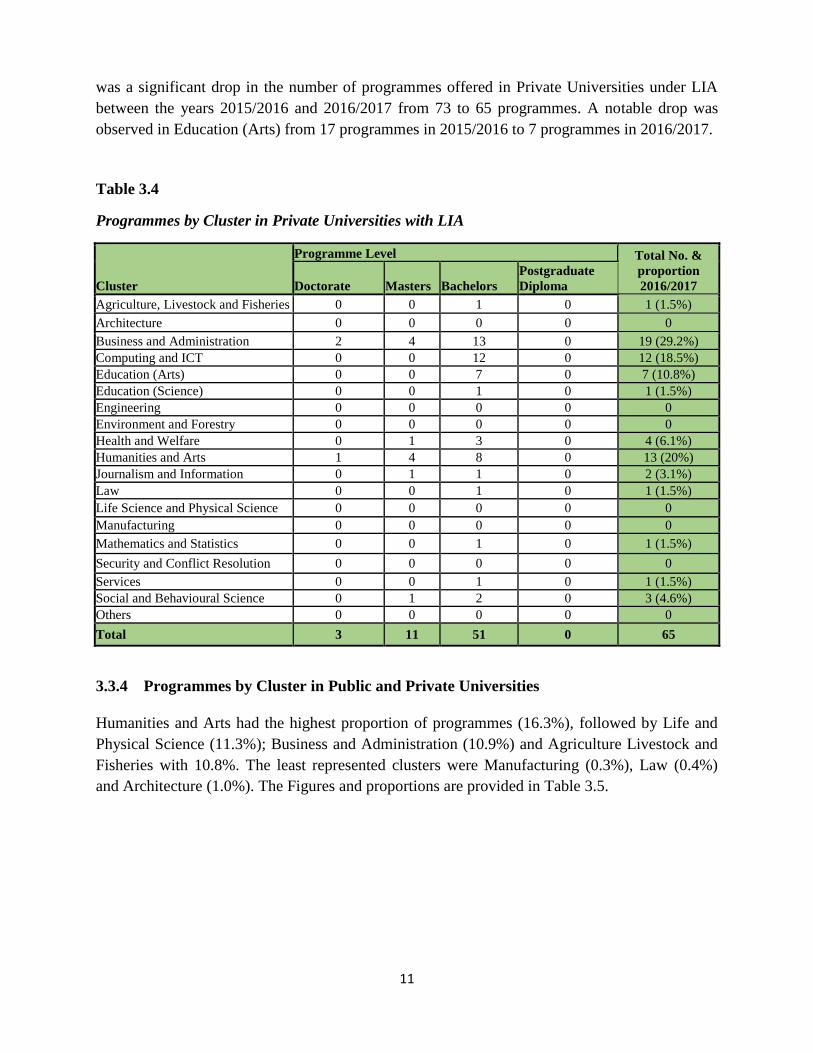
11
was a significant drop in the number of programmes offered in Private Universities under LIA
between the years 2015/2016 and 2016/2017 from 73 to 65 programmes. A notable drop was
observed in Education (Arts) from 17 programmes in 2015/2016 to 7 programmes in 2016/2017.
Table 3.4
Programmes by Cluster in Private Universities with LIA
Cluster
Programme Level Total No. &
proportion
2016/2017 Doctorate Masters Bachelors
Postgraduate
Diploma
Agriculture, Livestock and Fisheries 0 0 1 0 1 (1.5%)
Architecture 0 0 0 0 0
Business and Administration 2 4 13 0 19 (29.2%)
Computing and ICT 0 0 12 0 12 (18.5%)
Education (Arts) 0 0 7 0 7 (10.8%)
Education (Science) 0 0 1 0 1 (1.5%)
Engineering 0 0 0 0 0
Environment and Forestry 0 0 0 0 0
Health and Welfare 0 1 3 0 4 (6.1%)
Humanities and Arts 1 4 8 0 13 (20%)
Journalism and Information 0 1 1 0 2 (3.1%)
Law 0 0 1 0 1 (1.5%)
Life Science and Physical Science 0 0 0 0 0
Manufacturing 0 0 0 0 0
Mathematics and Statistics 0 0 1 0 1 (1.5%)
Security and Conflict Resolution 0 0 0 0 0
Services 0 0 1 0 1 (1.5%)
Social and Behavioural Science 0 1 2 0 3 (4.6%)
Others 0 0 0 0 0
Total 3 11 51 0 65
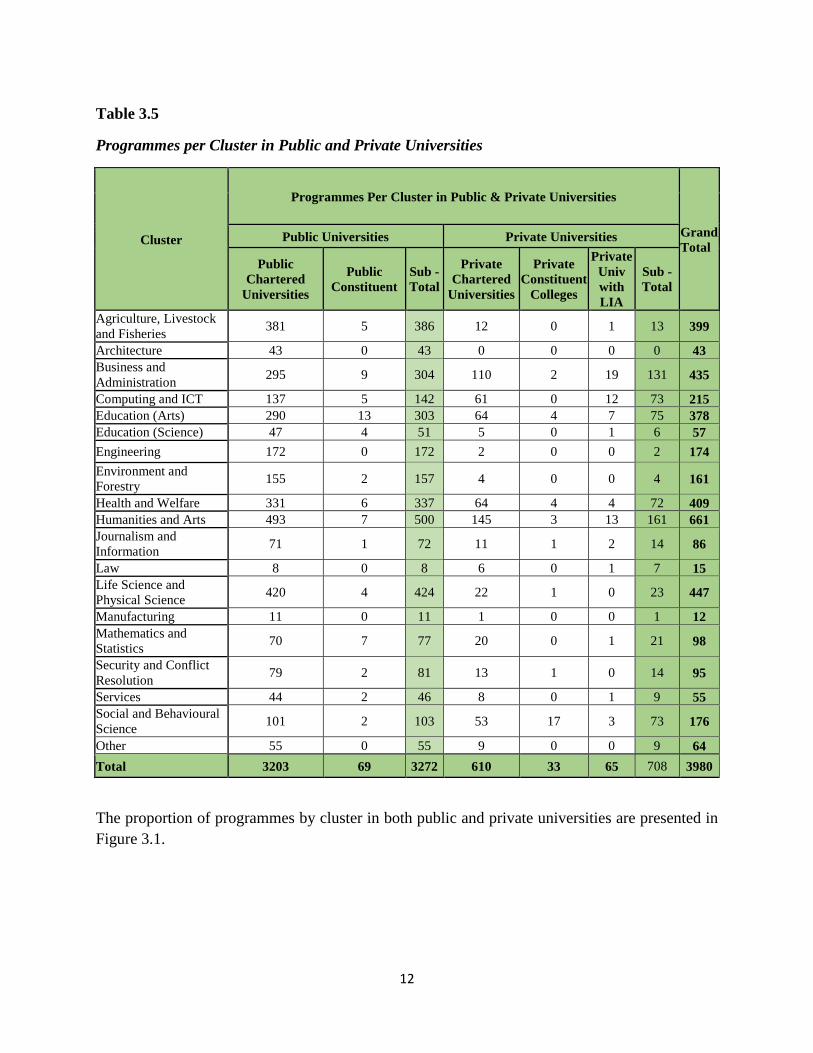
3.3.4 Programmes by Cluster in Public and Private Universities
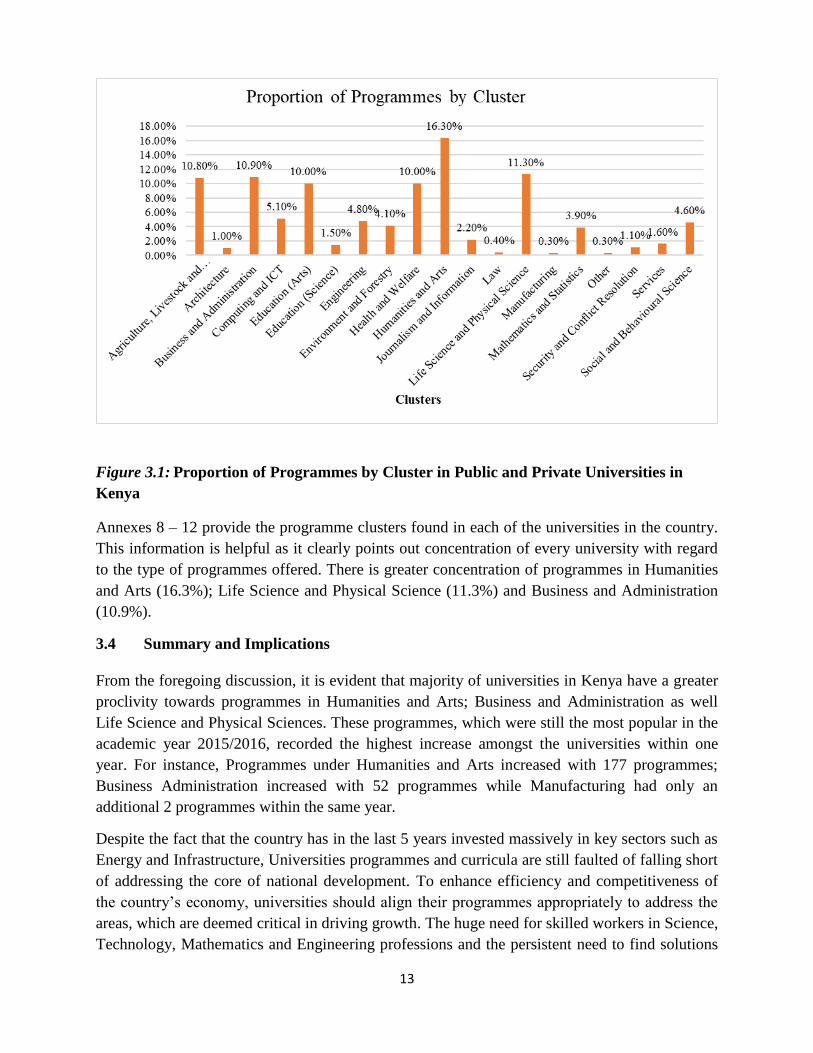
Humanities and Arts had the highest proportion of programmes (16.3%), followed by Life and
Physical Science (11.3%); Business and Administration (10.9%) and Agriculture Livestock and
Fisheries with 10.8%. The least represented clusters were Manufacturing (0.3%), Law (0.4%)
and Architecture (1.0%). The Figures and proportions are provided in Table 3.5.
12
Table 3.5
Programmes per Cluster in Public and Private Universities
Cluster
Programmes Per Cluster in Public & Private Universities
Grand
Total Public Universities Private Universities
Public
Chartered
Universities
Public
Constituent
Sub -
Total
Private
Chartered
Universities
Private
Constituent
Colleges
Private
Univ
with
LIA
Sub -
Total
Agriculture, Livestock
and Fisheries 381 5 386 12 0 1 13 399
Architecture 43 0 43 0 0 0 0 43
Business and
Administration 295 9 304 110 2 19 131 435
Computing and ICT 137 5 142 61 0 12 73 215
Education (Arts) 290 13 303 64 4 7 75 378
Education (Science) 47 4 51 5 0 1 6 57
Engineering 172 0 172 2 0 0 2 174
Environment and
Forestry 155 2 157 4 0 0 4 161
Health and Welfare 331 6 337 64 4 4 72 409
Humanities and Arts 493 7 500 145 3 13 161 661
Journalism and
Information 71 1 72 11 1 2 14 86
Law 8 0 8 6 0 1 7 15
Life Science and
Physical Science 420 4 424 22 1 0 23 447
Manufacturing 11 0 11 1 0 0 1 12
Mathematics and
Statistics 70 7 77 20 0 1 21 98
Security and Conflict
Resolution 79 2 81 13 1 0 14 95
Services 44 2 46 8 0 1 9 55
Social and Behavioural
Science 101 2 103 53 17 3 73 176
Other 55 0 55 9 0 0 9 64
Total 3203 69 3272 610 33 65 708 3980
The proportion of programmes by cluster in both public and private universities are presented in
Figure 3.1.
13
Figure 3.1: Proportion of Programmes by Cluster in Public and Private Universities in
Kenya
Annexes 8 – 12 provide the programme clusters found in each of the universities in the country.
This information is helpful as it clearly points out concentration of every university with regard
to the type of programmes offered. There is greater concentration of programmes in Humanities
and Arts (16.3%); Life Science and Physical Science (11.3%) and Business and Administration
(10.9%).
3.4 Summary and Implications
From the foregoing discussion, it is evident that majority of universities in Kenya have a greater
proclivity towards programmes in Humanities and Arts; Business and Administration as well
Life Science and Physical Sciences. These programmes, which were still the most popular in the
academic year 2015/2016, recorded the highest increase amongst the universities within one
year. For instance, Programmes under Humanities and Arts increased with 177 programmes;
Business Administration increased with 52 programmes while Manufacturing had only an
additional 2 programmes within the same year.
Despite the fact that the country has in the last 5 years invested massively in key sectors such as
Energy and Infrastructure, Universities programmes and curricula are still faulted of falling short
of addressing the core of national development. To enhance efficiency and competitiveness of
the country’s economy, universities should align their programmes appropriately to address the
areas, which are deemed critical in driving growth. The huge need for skilled workers in Science,
Technology, Mathematics and Engineering professions and the persistent need to find solutions
14
in key areas of national development among them the Big 4 - Food Security, Health care,
Manufacturing and affordable housing should largely influence universities curricula. Deliberate
focus by universities coupled by Government support to run such programmes is a key ingredient
to ensure that the country has a continuous supply of labour force with the required skills and
competencies. The role of Humanities and Arts in anchoring and sustaining country’s democracy
cannot be understated. There is therefore, need to embrace the creative potential of linking arts to
scientific enquiry and innovation. Universities that choose to focus in Arts and Humanities
should strategically invest in requisite infrastructure and ensure that graduates in such disciplines
have proper market orientation.
Effort should also be put in place to ensure that accreditation of new programmes is harmonized
with information from the ministry of labour on human resource planning and audit to ensure
development of programmes that are synchronised with the current and the future national
development goals.
15
Chapter Four
Enrolment
4.1 Introduction
Enrolment in universities has been increasing since the establishment of the first Kenyan
university, University of Nairobi, in 1970 with about 3,443 students. This growth is projected to
continue and reach over 600,000 students by 2022. The Kenya Constitution and the Kenya
Vision 2030 emphasizes on access, equity and gender parity in enrolment to achieve a better
regional distribution and also meet the aspirations of Sustainable Development Goals on Quality
Education and Gender Equality.
During the year 2016, seven (7) public universities constituent colleges were awarded Charters
and one (1) registered University was chartered into private university. This chapter outlines
analytics and summaries on enrolment in 68 Kenyan universities under four programme levels
i.e. Postgraduate diploma (PGD), Bachelors, Masters and Doctorate (PhD) and further provides
enrolments per cluster in public and private universities. This chapter also captures data on
students enrolment by County, international students and students with disabilities in the
universities.
4.2 Enrolment in Public and Private Universities
Total enrolment in all Public and Private Universities increased from 539, 749 in the year 2015
to 547,316 in 2016. This represents an overall marginal increase in enrolment of only 1.4%. But
interestingly there was marked increase of students by 10,431 or 13% in Private Universities;
while in Public Universities there was a decrease in enrolment by 2,864 or 0.6%. The placement
of Government Sponsored students by Kenya Universities and Colleges Central Placement
Service (KUCCPS) into private universities, which started in 2016, may explain the increase in
enrolment in private universities. Across the different levels, the rise in enrolment was recorded
in Masters and Doctorate levels while the numbers reduced with Bachelors in public universities.
At Postgraduate Diploma level, there was a reduction in the number of students who enrolled in
both public and private universities. From these statistics, Postgraduate Diploma programme
seems to be losing its lustre as students wishing to advance their studies seem to prefer to get into
Masters programmes. Table 4.1 provides enrolment features in public and private universities.
16
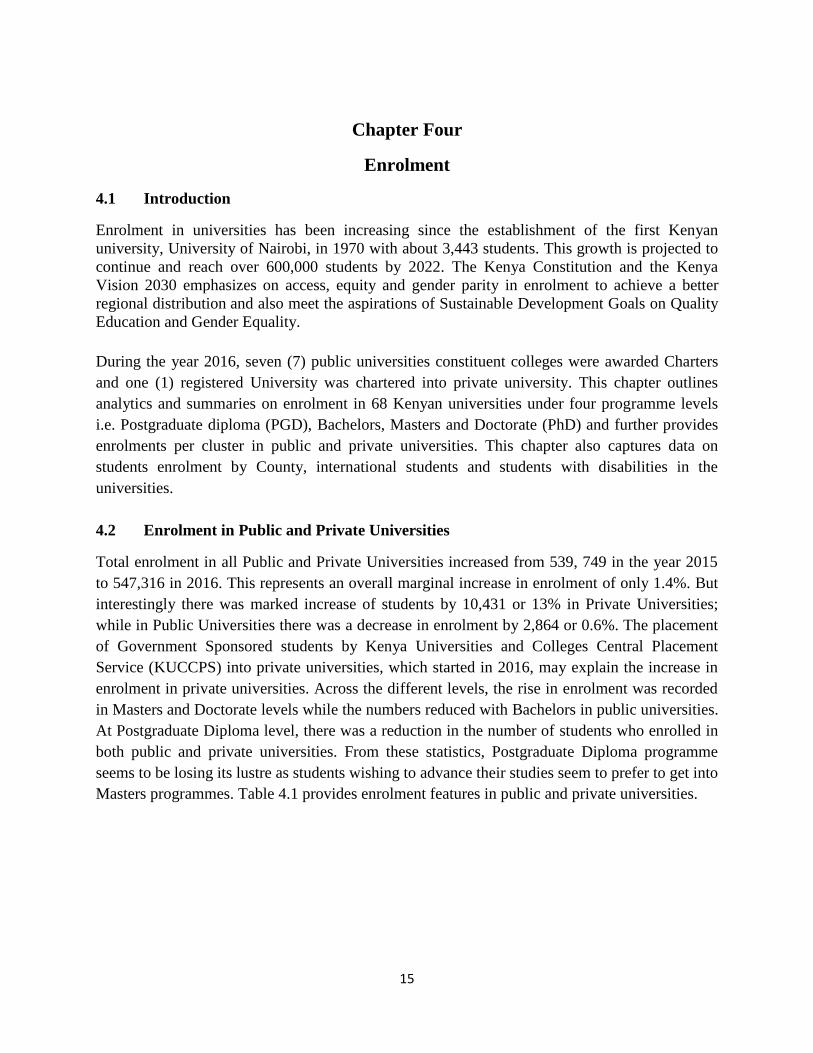
Table 4.1
Enrolment in Public and Private Universities
Enrolment Public University Private University Total
Programme 2015 2016 2015 2016 2015 2016
PhD 6,059 8,372 1,087 1,205 7,146
9,577
Masters 45,571
48,767
9,890
9,454
55,461
58,221
Bachelors 409,222 400,927
66,528 77,491 475,750
478,418
PGD 968 890
424 210 1,392
1,100
Total 461,820 458,956 77,929 88,360 539,749 547, 316
From Table 4.1, it is apparent that undergraduate enrolment supersedes post graduate enrolment
by a very large margin. The present statistics show that for every 100 undergraduate students
studying in the university there are only 12 masters and 2 PhD students being trained. The
transition of Masters students to PhD is also worrying because the ratio of 58,221 to 9,577 or 6:1
is not satisfactory. Compared to the universities in UK or Canada where the ratio is 2:1; Kenya is
doing poorly (UNESCO, 2008). The glaring gap in these ratios needs urgent attention. It is
estimated that universities Kenya requires an average output of 2,400 PhDs per year to meet the
targeted increase of 10% Gross Enrolment Rate (Ministry of Education, 2012).
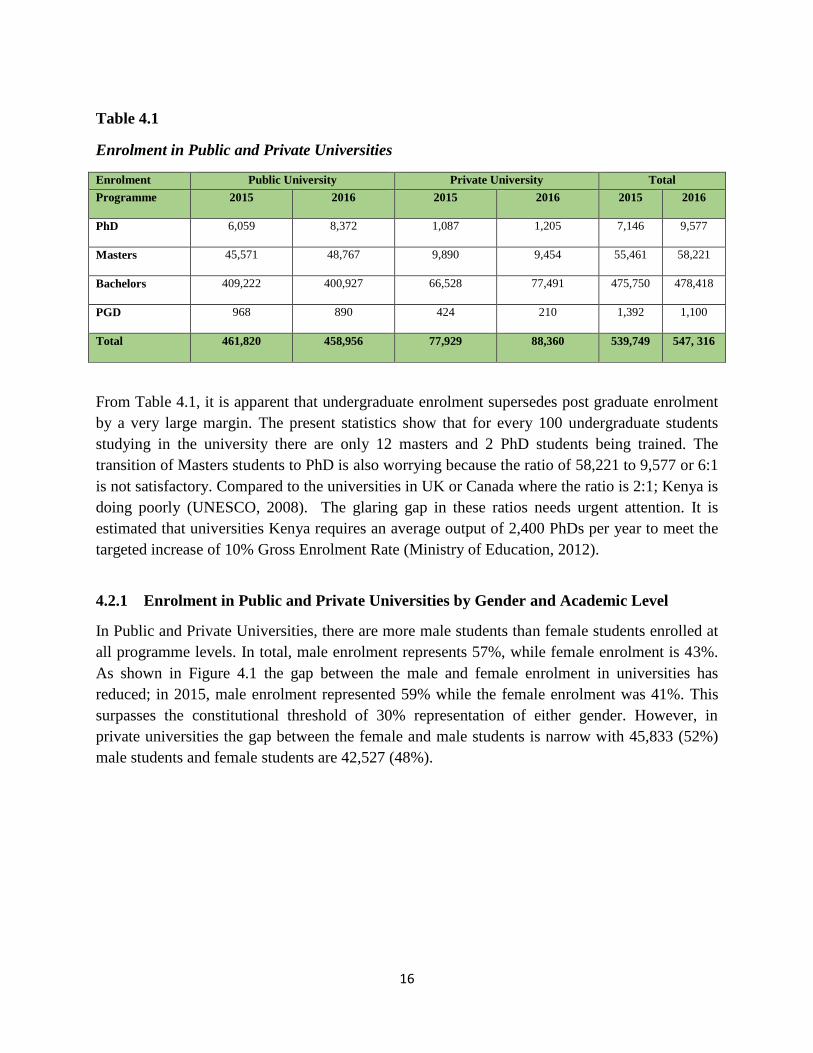
4.2.1 Enrolment in Public and Private Universities by Gender and Academic Level
In Public and Private Universities, there are more male students than female students enrolled at
all programme levels. In total, male enrolment represents 57%, while female enrolment is 43%.
As shown in Figure 4.1 the gap between the male and female enrolment in universities has
reduced; in 2015, male enrolment represented 59% while the female enrolment was 41%. This
surpasses the constitutional threshold of 30% representation of either gender. However, in
private universities the gap between the female and male students is narrow with 45,833 (52%)
male students and female students are 42,527 (48%).
17
Figure 4.1 Enrolment in Public and Private Universities in terms of gender
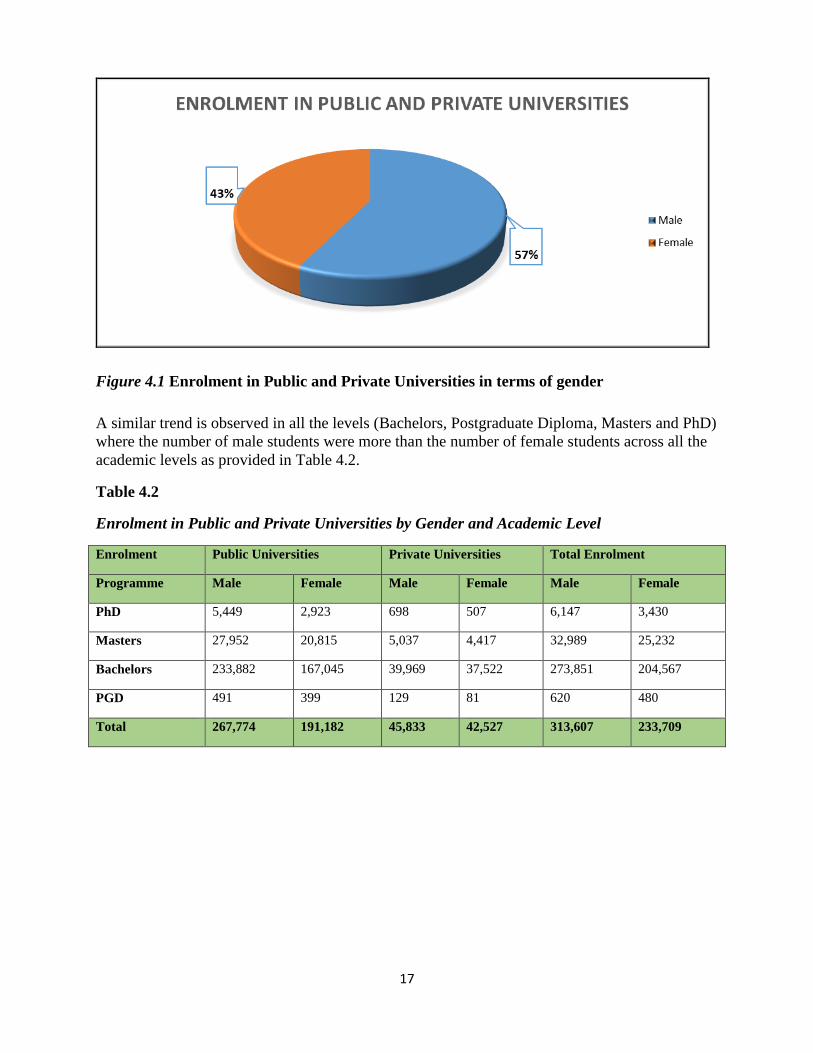
A similar trend is observed in all the levels (Bachelors, Postgraduate Diploma, Masters and PhD)
where the number of male students were more than the number of female students across all the
academic levels as provided in Table 4.2.
Table 4.2
Enrolment in Public and Private Universities by Gender and Academic Level
Enrolment Public Universities Private Universities Total Enrolment
Programme Male Female Male Female Male Female
PhD 5,449 2,923 698 507 6,147 3,430
Masters 27,952
20,815
5,037
4,417
32,989
25,232
Bachelors 233,882 167,045 39,969 37,522 273,851 204,567
PGD 491
399
129 81 620 480
Total 267,774 191,182 45,833 42,527 313,607 233,709
18
4.3 Enrolment by Cluster
The UNESCO International Standard Classification of Education (ISCED) identifies clusters into
which academic programmes can be classified namely: Agriculture, Livestock and Fisheries,
Architecture, Business and Administration, Computing and ICT, Education(Arts), Education
(Science), Engineering, Environment and Forestry, Health and Welfare, Humanities and Arts,
Journalism and Information, Law, Life Science and Physical Science, Manufacturing,
Mathematics and Statistics, Security and Conflict resolution, Services and Social and Behavioral
Science. The collected data was further analyzed per cluster and the summaries generated per
university category are presented as follows;
4.3.1 Enrolment per Cluster in Public and Private Universities
Of the 19 Clusters, Business and Administration had the highest enrolments with 144, 318,
which accounted for 26% of total enrolments, followed by Education (Arts) with 108, 533
students (20%) and Humanities and Arts with 43, 526 representing 8% of the total enrolment.
The clusters with the lowest enrolments were Architecture (1%), Manufacturing and other
‘unclassified clusters’, which had less than 1%.
At Doctorate level, the Business and Administration cluster had the highest enrolment with 3,891
students representing 40% of all Doctoral students. The Manufacturing cluster had no enrolments
at the doctorate level. At Masters Level, the Business and Administration cluster had the highest
enrolment of 27,700 followed by Humanities and Arts with 8,481, then Health and Welfare
cluster with 4,519 students. The cluster with the least enrolment was manufacturing with 7 then
Architecture and Education (Science) clusters with 181students respectively. At Bachelors level,
the Business and Administration cluster had the highest enrolment of 112, 643 followed by
Education (Arts) with 102, 367 then Humanities and Arts with 34,129 students. Manufacturing
cluster had the least enrolment with 687 students.
At Postgraduate Diploma, Education (Arts) had the highest enrolment with 828 students,
followed by Humanities and Arts with 97 and Security and Conflict Resolution cluster with 39
students. There were no enrolments recorded at Postgraduate Diploma level in Architecture,
Computing and ICT and ICT, Education (Science), Journalism and Information, Law,
Manufacturing, Social and Behavioral Sciences. 4 Fellowship programmes were recorded under
the Health and Welfare cluster. Table 4.3 shows Enrolment in public and private universities by
cluster.
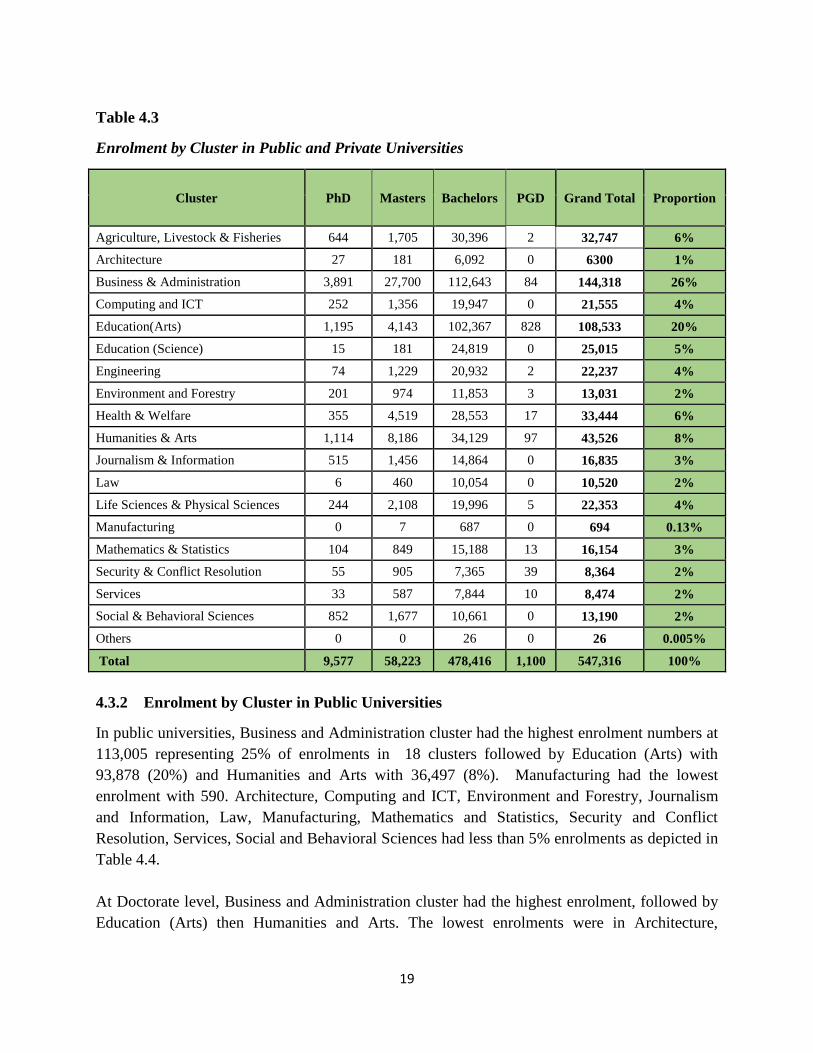
19
Table 4.3
Enrolment by Cluster in Public and Private Universities
Cluster PhD Masters Bachelors PGD Grand Total Proportion
Agriculture, Livestock & Fisheries 644 1,705 30,396 2 32,747 6%
Architecture 27 181 6,092 0 6300 1%
Business & Administration 3,891 27,700 112,643 84 144,318 26%
Computing and ICT 252 1,356 19,947 0 21,555 4%
Education(Arts) 1,195 4,143 102,367 828 108,533 20%
Education (Science) 15 181 24,819 0 25,015 5%
Engineering 74 1,229 20,932 2 22,237 4%
Environment and Forestry 201 974 11,853 3 13,031 2%
Health & Welfare 355 4,519 28,553 17 33,444 6%
Humanities & Arts 1,114 8,186 34,129 97 43,526 8%
Journalism & Information 515 1,456 14,864 0 16,835 3%
Law 6 460 10,054 0 10,520 2%
Life Sciences & Physical Sciences 244 2,108 19,996 5 22,353 4%
Manufacturing 0 7 687 0 694 0.13%
Mathematics & Statistics 104 849 15,188 13 16,154 3%
Security & Conflict Resolution 55 905 7,365 39 8,364 2%
Services 33 587 7,844 10 8,474 2%
Social & Behavioral Sciences 852 1,677 10,661 0 13,190 2%
Others 0 0 26 0 26 0.005%
Total 9,577 58,223 478,416 1,100 547,316 100%
4.3.2 Enrolment by Cluster in Public Universities
In public universities, Business and Administration cluster had the highest enrolment numbers at
113,005 representing 25% of enrolments in 18 clusters followed by Education (Arts) with
93,878 (20%) and Humanities and Arts with 36,497 (8%). Manufacturing had the lowest
enrolment with 590. Architecture, Computing and ICT, Environment and Forestry, Journalism
and Information, Law, Manufacturing, Mathematics and Statistics, Security and Conflict
Resolution, Services, Social and Behavioral Sciences had less than 5% enrolments as depicted in
Table 4.4.
At Doctorate level, Business and Administration cluster had the highest enrolment, followed by
Education (Arts) then Humanities and Arts. The lowest enrolments were in Architecture,
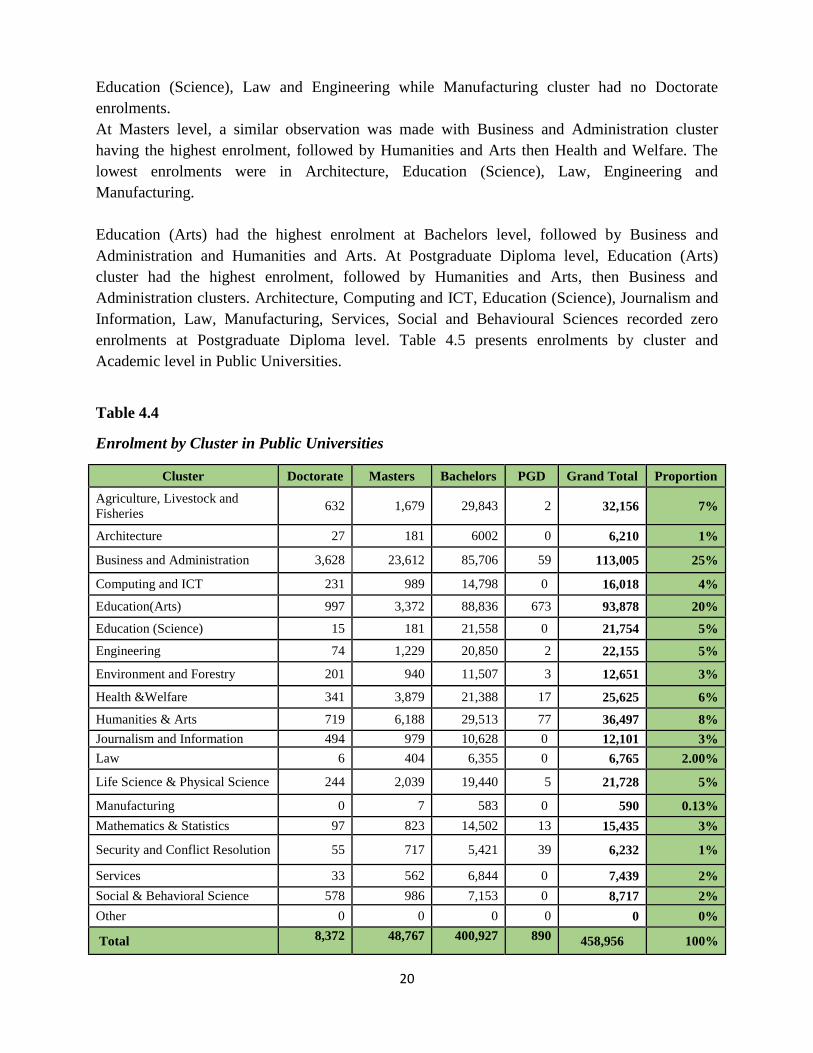
20
Education (Science), Law and Engineering while Manufacturing cluster had no Doctorate
enrolments.
At Masters level, a similar observation was made with Business and Administration cluster
having the highest enrolment, followed by Humanities and Arts then Health and Welfare. The
lowest enrolments were in Architecture, Education (Science), Law, Engineering and
Manufacturing.
Education (Arts) had the highest enrolment at Bachelors level, followed by Business and
Administration and Humanities and Arts. At Postgraduate Diploma level, Education (Arts)
cluster had the highest enrolment, followed by Humanities and Arts, then Business and
Administration clusters. Architecture, Computing and ICT, Education (Science), Journalism and
Information, Law, Manufacturing, Services, Social and Behavioural Sciences recorded zero
enrolments at Postgraduate Diploma level. Table 4.5 presents enrolments by cluster and
Academic level in Public Universities.
Table 4.4
Enrolment by Cluster in Public Universities
Cluster Doctorate Masters Bachelors PGD Grand Total Proportion
Agriculture, Livestock and
Fisheries 632 1,679 29,843 2 32,156 7%
Architecture 27 181 6002 0 6,210 1%
Business and Administration 3,628 23,612 85,706 59 113,005 25%
Computing and ICT 231 989 14,798 0 16,018 4%
Education(Arts) 997 3,372 88,836 673 93,878 20%
Education (Science) 15 181 21,558 0 21,754 5%
Engineering 74 1,229 20,850 2 22,155 5%
Environment and Forestry 201 940 11,507 3 12,651 3%
Health &Welfare 341 3,879 21,388 17 25,625 6%
Humanities & Arts 719 6,188 29,513 77 36,497 8%
Journalism and Information 494 979 10,628 0 12,101 3%
Law 6 404 6,355 0 6,765 2.00%
Life Science & Physical Science 244 2,039 19,440 5 21,728 5%
Manufacturing 0 7 583 0 590 0.13%
Mathematics & Statistics 97 823 14,502 13 15,435 3%
Security and Conflict Resolution 55 717 5,421 39 6,232 1%
Services 33 562 6,844 0 7,439 2%
Social & Behavioral Science 578 986 7,153 0 8,717 2%
Other 0 0 0 0 0 0%
Total 8,372 48,767 400,927 890 458,956 100%
21
4.3.3 Enrolment by Cluster in Private Universities
Notably in private universities, Architecture cluster which had no enrolments in 2015 registered
90 students at the Bachelors level. Highest enrolments were recorded in Business and
Administration and Education (Arts) clusters while fewer students numbers were registered in
Science - oriented clusters for instance, Engineering, Manufacturing, Life and Physical sciences,
Environment and Forestry as well as in Mathematics. This mirrors the scenario witnessed in
2015 where increased student’s numbers were registered in Education (Arts) at 40%. The biggest
decline was in Computing and ICT clusters with 31% drop in students enrolled.
At Doctorate level, the clusters with the highest level of enrolment were Humanities and Arts
with 395 students, Social and Behavioral Sciences with 274 students and Business and
Administration with 263 students. Several clusters such as Architecture, Education (Science),
Engineering, Law, Manufacturing, Services, Environment and Forestry, Life Science and
Physical Science, and Security and Conflict Resolution did not have any students in Private
Universities.
At Master’s level, the clusters with the highest enrolment were Business and Administration with
4,088 students, Humanities and Arts with 1,998 students and Education Arts with 771 students.
Similar to Doctorate level, Architecture, Education (Science), Engineering, Manufacturing and
Services did not have any students enrolled.
At Bachelor’s level, clusters with the highest enrolment were Business and Administration with
26,937 students, Education (Arts) with 13,531 students and Health and Welfare with 7,165
students while clusters with the least enrolment were Engineering with 82 students, Architecture
with 90 students and Manufacturing with 104 students. At Postgraduate Diploma level, only four
clusters had enrolments. These were; Business and Administration with 25 students, Education
(Arts) with 155 students, Humanities and Arts with 20 students and Services with 10 students.
The rest of the clusters did not have enrolments. Table 4.5 gives a summary of enrolments in
Private Universities.
There were 4 students enrolled in Fellowship programme to provide Leadership and
Management skills to professionals managing Health Programs in Kenya and support service
delivery in partner institutions at the University of Nairobi who were not included in the analysis.
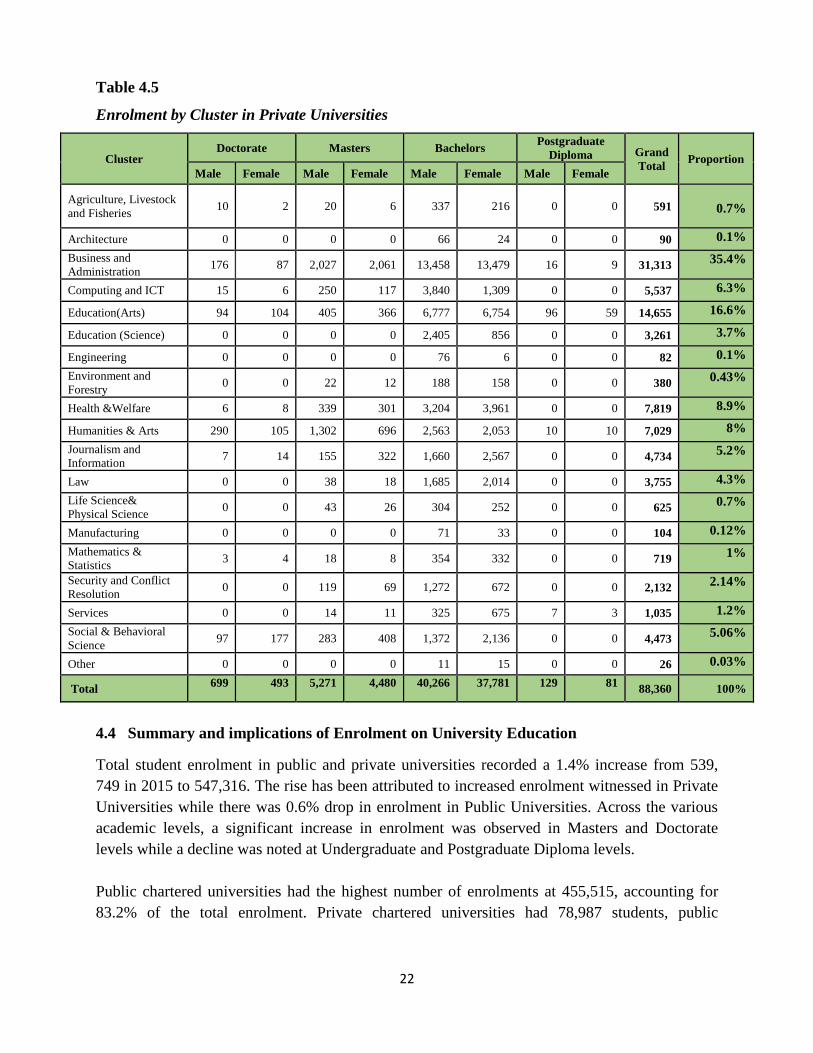
22
Table 4.5
Enrolment by Cluster in Private Universities
Cluster Doctorate Masters Bachelors
Postgraduate
Diploma Grand
Total Proportion
Male Female Male Female Male Female Male Female
Agriculture, Livestock
and Fisheries 10 2 20 6 337 216 0 0 591
0.7%
Architecture 0 0 0 0 66 24 0 0 90 0.1%
Business and
Administration 176 87 2,027 2,061 13,458 13,479 16 9 31,313
35.4%
Computing and ICT 15 6 250 117 3,840 1,309 0 0 5,537 6.3%
Education(Arts) 94 104 405 366 6,777 6,754 96 59 14,655 16.6%
Education (Science) 0 0 0 0 2,405 856 0 0 3,261 3.7%
Engineering 0 0 0 0 76 6 0 0 82 0.1%
Environment and
Forestry 0 0 22 12 188 158 0 0 380
0.43%
Health &Welfare 6 8 339 301 3,204 3,961 0 0 7,819 8.9%
Humanities & Arts 290 105 1,302 696 2,563 2,053 10 10 7,029 8%
Journalism and
Information 7 14 155 322 1,660 2,567 0 0 4,734
5.2%
Law 0 0 38 18 1,685 2,014 0 0 3,755 4.3%
Life Science&
Physical Science 0 0 43 26 304 252 0 0 625
0.7%
Manufacturing 0 0 0 0 71 33 0 0 104 0.12%
Mathematics &
Statistics 3 4 18 8 354 332 0 0 719
1%
Security and Conflict
Resolution 0 0 119 69 1,272 672 0 0 2,132
2.14%
Services 0 0 14 11 325 675 7 3 1,035 1.2%
Social & Behavioral
Science 97 177 283 408 1,372 2,136 0 0 4,473
5.06%
Other 0 0 0 0 11 15 0 0 26 0.03%
Total 699 493 5,271 4,480 40,266 37,781 129 81
88,360 100%
4.4 Summary and implications of Enrolment on University Education
Total student enrolment in public and private universities recorded a 1.4% increase from 539,
749 in 2015 to 547,316. The rise has been attributed to increased enrolment witnessed in Private
Universities while there was 0.6% drop in enrolment in Public Universities. Across the various
academic levels, a significant increase in enrolment was observed in Masters and Doctorate
levels while a decline was noted at Undergraduate and Postgraduate Diploma levels.
Public chartered universities had the highest number of enrolments at 455,515, accounting for
83.2% of the total enrolment. Private chartered universities had 78,987 students, public
23
university constituent colleges had 3,441 students, universities with LIA had 8,205 and private
university constituent colleges with 1,168 students.
Analysis by gender indicated that male students surpassed female students at all programme
levels in public and private universities. However in Universities with LIA, there were more
female students enrolled under the Bachelors programmes. This is because the women university
with LIA had the highest enrolment. With only a gap of 14% to achieve gender parity, the
enrolment status was very encouraging as it is near parity – a target advocated by the Sustainable
Development Goals (UNESCO, 2015). Generally, the gender gap is narrower as compared to
2015.
The current data further shows that the ratio of undergraduate students to postgraduate (both
Masters and PhD) is 7:1 and that not many Masters degree graduates move on to enroll for a PhD
degree. The implication of low enrolments in PhD is that there will be few academic staff
available to teach undergraduate students. As will be seen in Chapter 5, which deals with staffing
in universities, there are few Lecturers with PhD qualifications. The majority of them have
Masters qualifications. If this trend continues, it means that there will be few qualified academics
teaching in the universities. A cycle of low PhD enrolment leading to low staff development;
which in turn leads to low PhD output could be created, unless deliberate efforts are put in place
to address the matter.
The Business and Administration, Education (Arts), Humanities and Arts clusters had the largest
student enrolment numbers while the Science, Technology, Engineering and Mathematics
(STEM) clusters still register low students enrolments especially at the postgraduate levels. This
means that fewer Kenyans are studying and doing research in these areas which greatly impedes
the country’s efforts towards producing manpower that can fast track the realization of Vision
2030, becoming a knowledge economy as well as to compete globally.
4.5 Enrolment by County
Counties in Kenya are geographical units envisioned by the 2010 Constitution of Kenya as the
units of devolved government. Details of the division and the names of the respective counties
are provided in Annex 45. This section relays information on the counties of origin of students
enrolled in Universities in Kenya. It also employs analytics to provide in depth insight of the
students based on county of origin. Data was received from 25 public chartered universities and
22 private chartered universities. This information comprised of a total of 110,612 male students
and 76,974 female students totaling to 187,586. This information is provided in detail in the
following sections:
24
4.5.1 Enrolment by County in Public and Private Universities
Data collected from public and private chartered universities showed that majority of students
originated from Nairobi county (17,928, 9.56%) followed by Kisii (9,754, 5.2%) and Kiambu
counties (8,787, 4.68%). The counties that produced the least number of students were Mandera
(249, 0.13 %) followed by Tana River (275, 0.15%) and Lamu (275, 0.15%) as provided in Table
4.6.
4.5.2 Enrolment by County and Gender in Public and Private Universities
There were more male students than female students enrolled in universities. Nairobi County
produced the highest male university student population (9253, 8.35%) followed by Kisii (5859,
5.30%) and Kiambu counties (4837, 4.37%), Tana River County (166, 0.15%) produced the least
male student population followed by Lamu (168, 0.15%) and Mandera counties (182, 0.16%). In
the same breadth, Nairobi County produced the highest number of female university students
(8693, 11.29%) followed by Kiambu (3950, 5.13%) and Kisii (3895, 5.06 %) counties, Wajir and
Mandera counties produced the least female student representation (67, 0.09 %) followed by
Lamu county (107, 0.14%).
Wajir county had the highest ratio (3:1) of the total number of male students to their female
counterparts, followed by Turkana (2.9:1) and Mandera counties (2.72:1), Elgeyo Marakwet
County had the least male to female ratio (1.05:1) followed by Nairobi (1.06:1) and Nandi
counties (1.2:1). As indicated in Table 4.7, Wajir County had the highest gender disparity
followed by Turkana, Mandera (63.19%) counties. On the other hand, Elgeyo Marakwet County
had the least gender disparity followed by Nairobi and Kajiado counties. Additional information
is provided in Annex 37.
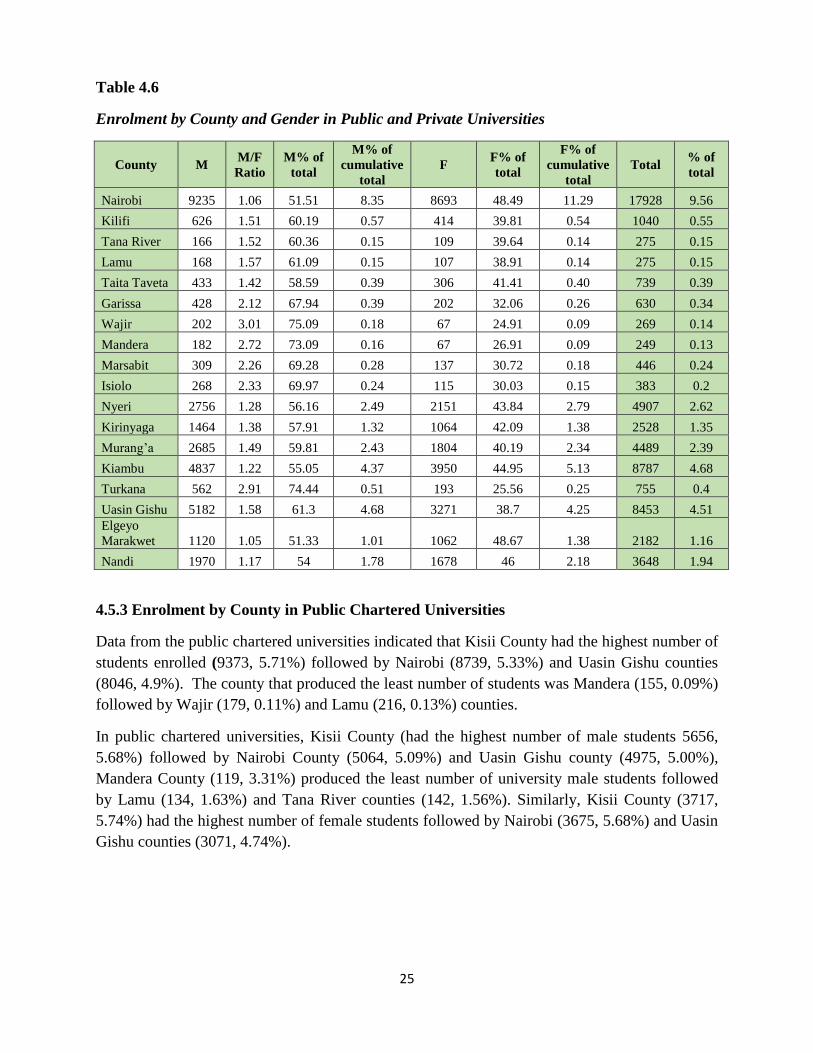
25
Table 4.6
Enrolment by County and Gender in Public and Private Universities
County M M/F
Ratio
M% of
total
M% of
cumulative
total
F F% of
total
F% of
cumulative
total
Total % of
total
Nairobi 9235 1.06 51.51 8.35 8693 48.49 11.29 17928 9.56
Kilifi 626 1.51 60.19 0.57 414 39.81 0.54 1040 0.55
Tana River 166 1.52 60.36 0.15 109 39.64 0.14 275 0.15
Lamu 168 1.57 61.09 0.15 107 38.91 0.14 275 0.15
Taita Taveta 433 1.42 58.59 0.39 306 41.41 0.40 739 0.39
Garissa 428 2.12 67.94 0.39 202 32.06 0.26 630 0.34
Wajir 202 3.01 75.09 0.18 67 24.91 0.09 269 0.14
Mandera 182 2.72 73.09 0.16 67 26.91 0.09 249 0.13
Marsabit 309 2.26 69.28 0.28 137 30.72 0.18 446 0.24
Isiolo 268 2.33 69.97 0.24 115 30.03 0.15 383 0.2
Nyeri 2756 1.28 56.16 2.49 2151 43.84 2.79 4907 2.62
Kirinyaga 1464 1.38 57.91 1.32 1064 42.09 1.38 2528 1.35
Murang’a 2685 1.49 59.81 2.43 1804 40.19 2.34 4489 2.39
Kiambu 4837 1.22 55.05 4.37 3950 44.95 5.13 8787 4.68
Turkana 562 2.91 74.44 0.51 193 25.56 0.25 755 0.4
Uasin Gishu 5182 1.58 61.3 4.68 3271 38.7 4.25 8453 4.51
Elgeyo
Marakwet 1120 1.05 51.33 1.01 1062 48.67 1.38 2182 1.16
Nandi 1970 1.17 54 1.78 1678 46 2.18 3648 1.94
4.5.3 Enrolment by County in Public Chartered Universities
Data from the public chartered universities indicated that Kisii County had the highest number of
students enrolled (9373, 5.71%) followed by Nairobi (8739, 5.33%) and Uasin Gishu counties
(8046, 4.9%). The county that produced the least number of students was Mandera (155, 0.09%)
followed by Wajir (179, 0.11%) and Lamu (216, 0.13%) counties.
In public chartered universities, Kisii County (had the highest number of male students 5656,
5.68%) followed by Nairobi County (5064, 5.09%) and Uasin Gishu county (4975, 5.00%),
Mandera County (119, 3.31%) produced the least number of university male students followed
by Lamu (134, 1.63%) and Tana River counties (142, 1.56%). Similarly, Kisii County (3717,
5.74%) had the highest number of female students followed by Nairobi (3675, 5.68%) and Uasin
Gishu counties (3071, 4.74%).
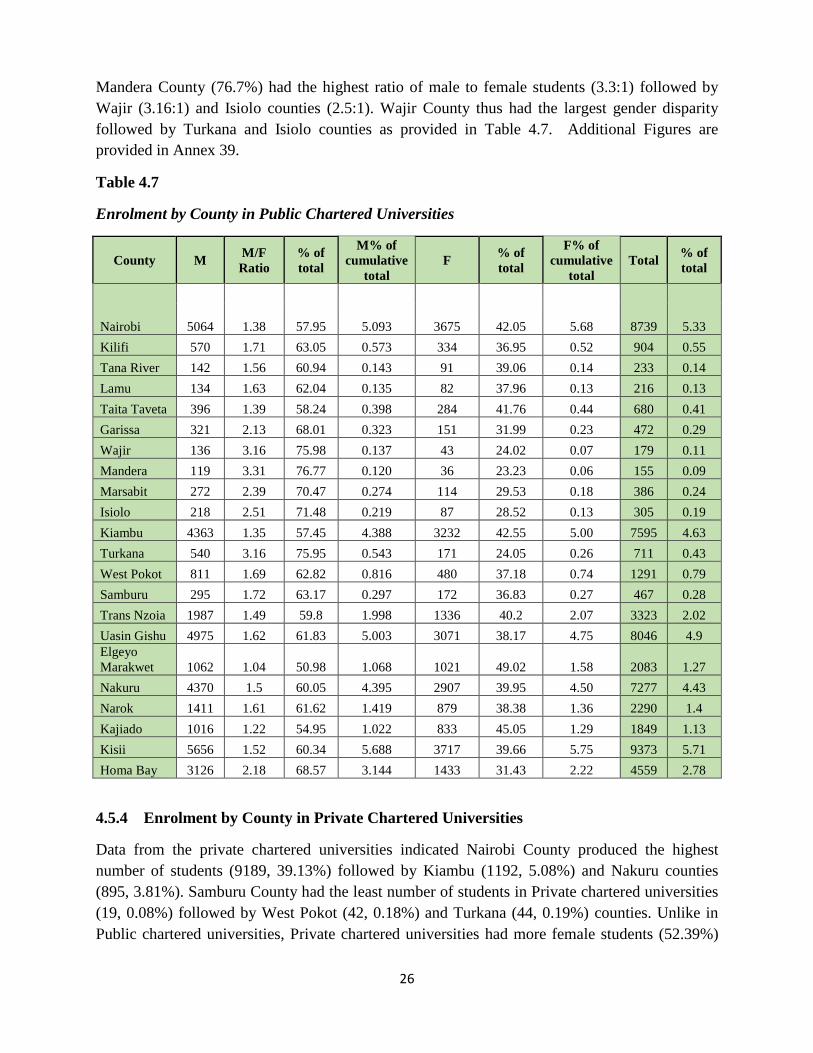
26
Mandera County (76.7%) had the highest ratio of male to female students (3.3:1) followed by
Wajir (3.16:1) and Isiolo counties (2.5:1). Wajir County thus had the largest gender disparity
followed by Turkana and Isiolo counties as provided in Table 4.7. Additional Figures are
provided in Annex 39.
Table 4.7
Enrolment by County in Public Chartered Universities
County M M/F
Ratio
% of
total
M% of
cumulative
total
F % of
total
F% of
cumulative
total
Total % of
total
Nairobi 5064 1.38 57.95 5.093 3675 42.05 5.68 8739 5.33
Kilifi 570 1.71 63.05 0.573 334 36.95 0.52 904 0.55
Tana River 142 1.56 60.94 0.143 91 39.06 0.14 233 0.14
Lamu 134 1.63 62.04 0.135 82 37.96 0.13 216 0.13
Taita Taveta 396 1.39 58.24 0.398 284 41.76 0.44 680 0.41
Garissa 321 2.13 68.01 0.323 151 31.99 0.23 472 0.29
Wajir 136 3.16 75.98 0.137 43 24.02 0.07 179 0.11
Mandera 119 3.31 76.77 0.120 36 23.23 0.06 155 0.09
Marsabit 272 2.39 70.47 0.274 114 29.53 0.18 386 0.24
Isiolo 218 2.51 71.48 0.219 87 28.52 0.13 305 0.19
Kiambu 4363 1.35 57.45 4.388 3232 42.55 5.00 7595 4.63
Turkana 540 3.16 75.95 0.543 171 24.05 0.26 711 0.43
West Pokot 811 1.69 62.82 0.816 480 37.18 0.74 1291 0.79
Samburu 295 1.72 63.17 0.297 172 36.83 0.27 467 0.28
Trans Nzoia 1987 1.49 59.8 1.998 1336 40.2 2.07 3323 2.02
Uasin Gishu 4975 1.62 61.83 5.003 3071 38.17 4.75 8046 4.9
Elgeyo
Marakwet 1062 1.04 50.98 1.068 1021 49.02 1.58 2083 1.27
Nakuru 4370 1.5 60.05 4.395 2907 39.95 4.50 7277 4.43
Narok 1411 1.61 61.62 1.419 879 38.38 1.36 2290 1.4
Kajiado 1016 1.22 54.95 1.022 833 45.05 1.29 1849 1.13
Kisii 5656 1.52 60.34 5.688 3717 39.66 5.75 9373 5.71
Homa Bay 3126 2.18 68.57 3.144 1433 31.43 2.22 4559 2.78
4.5.4 Enrolment by County in Private Chartered Universities
Data from the private chartered universities indicated Nairobi County produced the highest
number of students (9189, 39.13%) followed by Kiambu (1192, 5.08%) and Nakuru counties
(895, 3.81%). Samburu County had the least number of students in Private chartered universities
(19, 0.08%) followed by West Pokot (42, 0.18%) and Turkana (44, 0.19%) counties. Unlike in
Public chartered universities, Private chartered universities had more female students (52.39%)
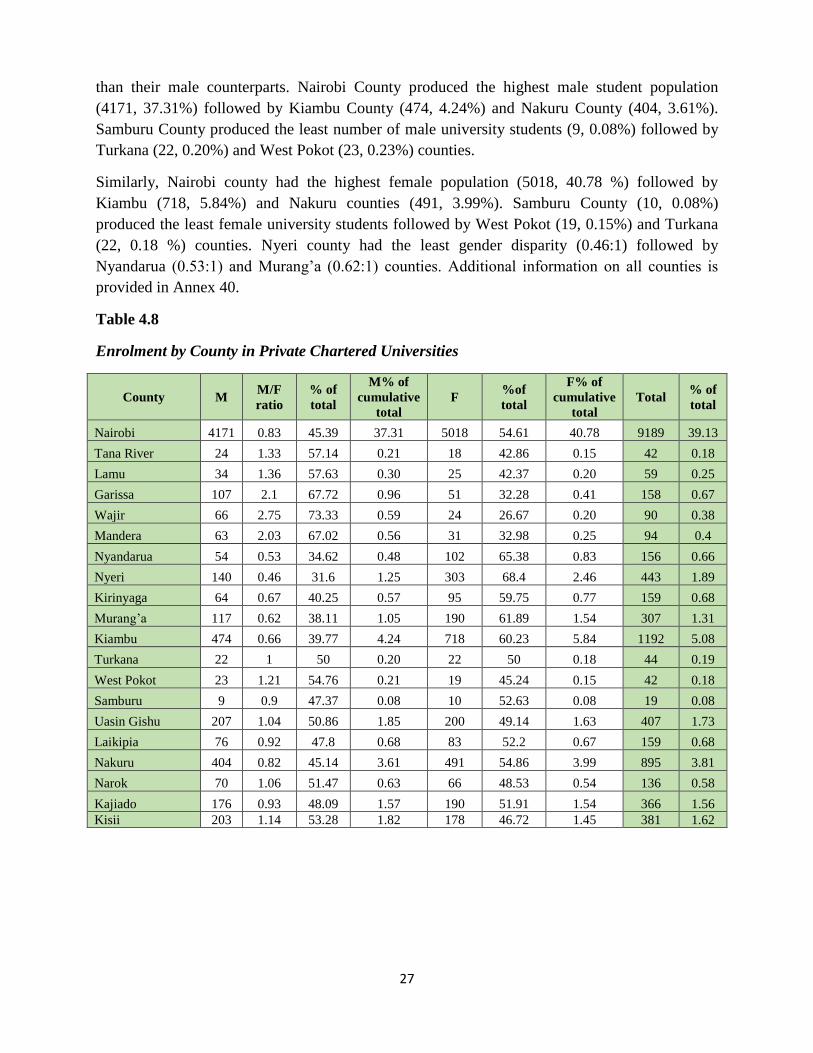
27
than their male counterparts. Nairobi County produced the highest male student population
(4171, 37.31%) followed by Kiambu County (474, 4.24%) and Nakuru County (404, 3.61%).
Samburu County produced the least number of male university students (9, 0.08%) followed by
Turkana (22, 0.20%) and West Pokot (23, 0.23%) counties.
Similarly, Nairobi county had the highest female population (5018, 40.78 %) followed by
Kiambu (718, 5.84%) and Nakuru counties (491, 3.99%). Samburu County (10, 0.08%)
produced the least female university students followed by West Pokot (19, 0.15%) and Turkana
(22, 0.18 %) counties. Nyeri county had the least gender disparity (0.46:1) followed by
Nyandarua (0.53:1) and Murang’a (0.62:1) counties. Additional information on all counties is
provided in Annex 40.
Table 4.8
Enrolment by County in Private Chartered Universities
County M M/F
ratio
% of
total
M% of
cumulative
total
F %of
total
F% of
cumulative
total
Total % of
total
Nairobi 4171 0.83 45.39 37.31 5018 54.61 40.78 9189 39.13
Tana River 24 1.33 57.14 0.21 18 42.86 0.15 42 0.18
Lamu 34 1.36 57.63 0.30 25 42.37 0.20 59 0.25
Garissa 107 2.1 67.72 0.96 51 32.28 0.41 158 0.67
Wajir 66 2.75 73.33 0.59 24 26.67 0.20 90 0.38
Mandera 63 2.03 67.02 0.56 31 32.98 0.25 94 0.4
Nyandarua 54 0.53 34.62 0.48 102 65.38 0.83 156 0.66
Nyeri 140 0.46 31.6 1.25 303 68.4 2.46 443 1.89
Kirinyaga 64 0.67 40.25 0.57 95 59.75 0.77 159 0.68
Murang’a 117 0.62 38.11 1.05 190 61.89 1.54 307 1.31
Kiambu 474 0.66 39.77 4.24 718 60.23 5.84 1192 5.08
Turkana 22 1 50 0.20 22 50 0.18 44 0.19
West Pokot 23 1.21 54.76 0.21 19 45.24 0.15 42 0.18
Samburu 9 0.9 47.37 0.08 10 52.63 0.08 19 0.08
Uasin Gishu 207 1.04 50.86 1.85 200 49.14 1.63 407 1.73
Laikipia 76 0.92 47.8 0.68 83 52.2 0.67 159 0.68
Nakuru 404 0.82 45.14 3.61 491 54.86 3.99 895 3.81
Narok 70 1.06 51.47 0.63 66 48.53 0.54 136 0.58
Kajiado 176 0.93 48.09 1.57 190 51.91 1.54 366 1.56
Kisii 203 1.14 53.28 1.82 178 46.72 1.45 381 1.62
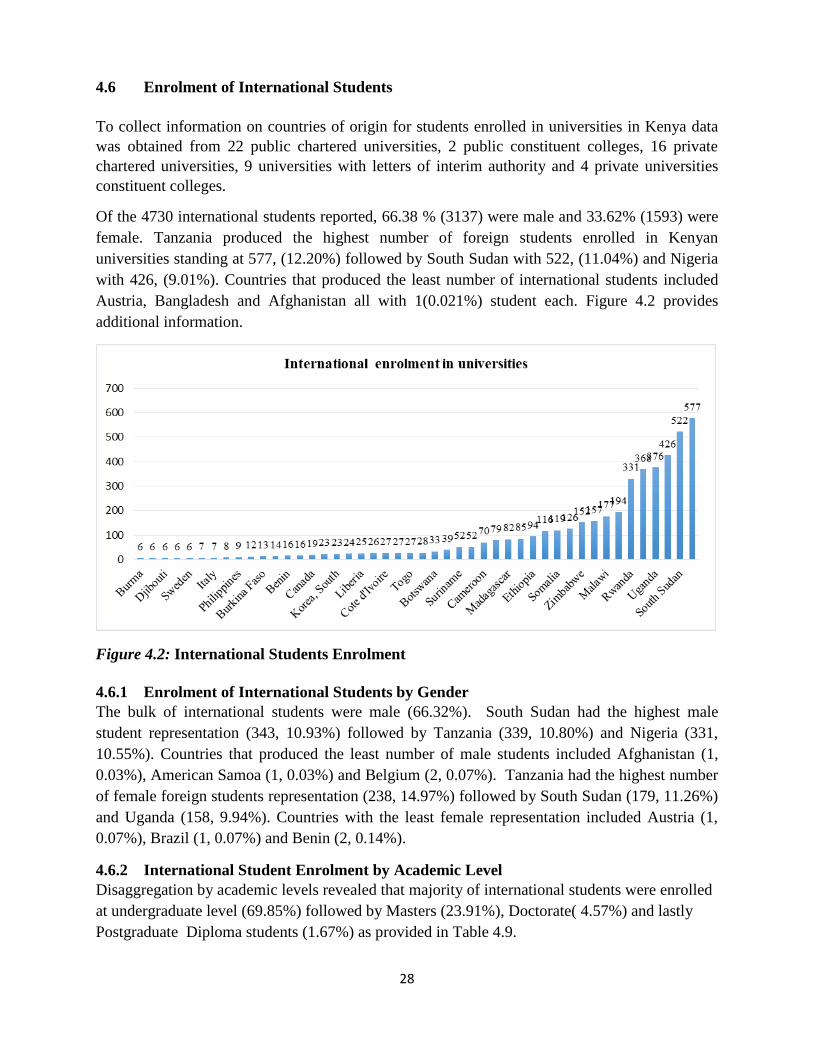
28
4.6 Enrolment of International Students
To collect information on countries of origin for students enrolled in universities in Kenya data
was obtained from 22 public chartered universities, 2 public constituent colleges, 16 private
chartered universities, 9 universities with letters of interim authority and 4 private universities
constituent colleges.
Of the 4730 international students reported, 66.38 % (3137) were male and 33.62% (1593) were
female. Tanzania produced the highest number of foreign students enrolled in Kenyan
universities standing at 577, (12.20%) followed by South Sudan with 522, (11.04%) and Nigeria
with 426, (9.01%). Countries that produced the least number of international students included
Austria, Bangladesh and Afghanistan all with 1(0.021%) student each. Figure 4.2 provides
additional information.
Figure 4.2: International Students Enrolment
4.6.1 Enrolment of International Students by Gender
The bulk of international students were male (66.32%). South Sudan had the highest male
student representation (343, 10.93%) followed by Tanzania (339, 10.80%) and Nigeria (331,
10.55%). Countries that produced the least number of male students included Afghanistan (1,
0.03%), American Samoa (1, 0.03%) and Belgium (2, 0.07%). Tanzania had the highest number
of female foreign students representation (238, 14.97%) followed by South Sudan (179, 11.26%)
and Uganda (158, 9.94%). Countries with the least female representation included Austria (1,
0.07%), Brazil (1, 0.07%) and Benin (2, 0.14%).
4.6.2 International Student Enrolment by Academic Level
Disaggregation by academic levels revealed that majority of international students were enrolled
at undergraduate level (69.85%) followed by Masters (23.91%), Doctorate( 4.57%) and lastly
Postgraduate Diploma students (1.67%) as provided in Table 4.9.
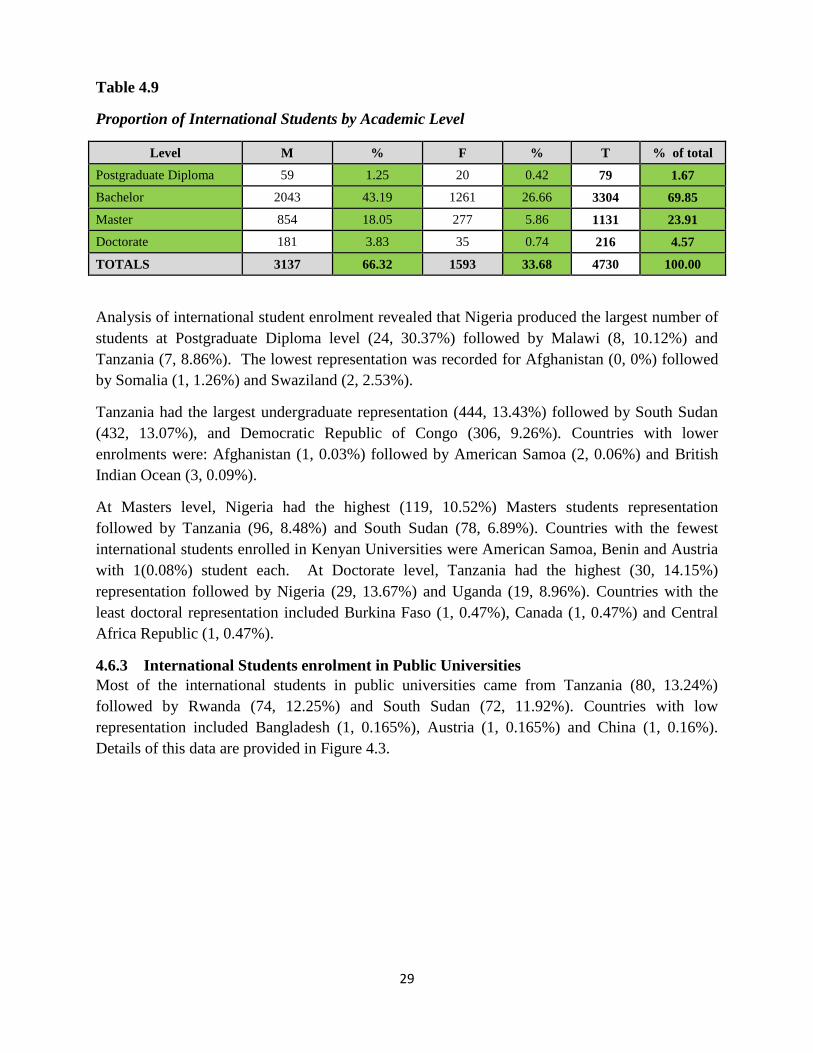
29
Table 4.9
Proportion of International Students by Academic Level
Level M % F % T % of total
Postgraduate Diploma 59 1.25 20 0.42 79 1.67
Bachelor 2043 43.19 1261 26.66 3304 69.85
Master 854 18.05 277 5.86 1131 23.91
Doctorate 181 3.83 35 0.74 216 4.57
TOTALS 3137 66.32 1593 33.68 4730 100.00
Analysis of international student enrolment revealed that Nigeria produced the largest number of
students at Postgraduate Diploma level (24, 30.37%) followed by Malawi (8, 10.12%) and
Tanzania (7, 8.86%). The lowest representation was recorded for Afghanistan (0, 0%) followed
by Somalia (1, 1.26%) and Swaziland (2, 2.53%).
Tanzania had the largest undergraduate representation (444, 13.43%) followed by South Sudan
(432, 13.07%), and Democratic Republic of Congo (306, 9.26%). Countries with lower
enrolments were: Afghanistan (1, 0.03%) followed by American Samoa (2, 0.06%) and British
Indian Ocean (3, 0.09%).
At Masters level, Nigeria had the highest (119, 10.52%) Masters students representation
followed by Tanzania (96, 8.48%) and South Sudan (78, 6.89%). Countries with the fewest
international students enrolled in Kenyan Universities were American Samoa, Benin and Austria
with 1(0.08%) student each. At Doctorate level, Tanzania had the highest (30, 14.15%)
representation followed by Nigeria (29, 13.67%) and Uganda (19, 8.96%). Countries with the
least doctoral representation included Burkina Faso (1, 0.47%), Canada (1, 0.47%) and Central
Africa Republic (1, 0.47%).
4.6.3 International Students enrolment in Public Universities
Most of the international students in public universities came from Tanzania (80, 13.24%)
followed by Rwanda (74, 12.25%) and South Sudan (72, 11.92%). Countries with low
representation included Bangladesh (1, 0.165%), Austria (1, 0.165%) and China (1, 0.16%).
Details of this data are provided in Figure 4.3.
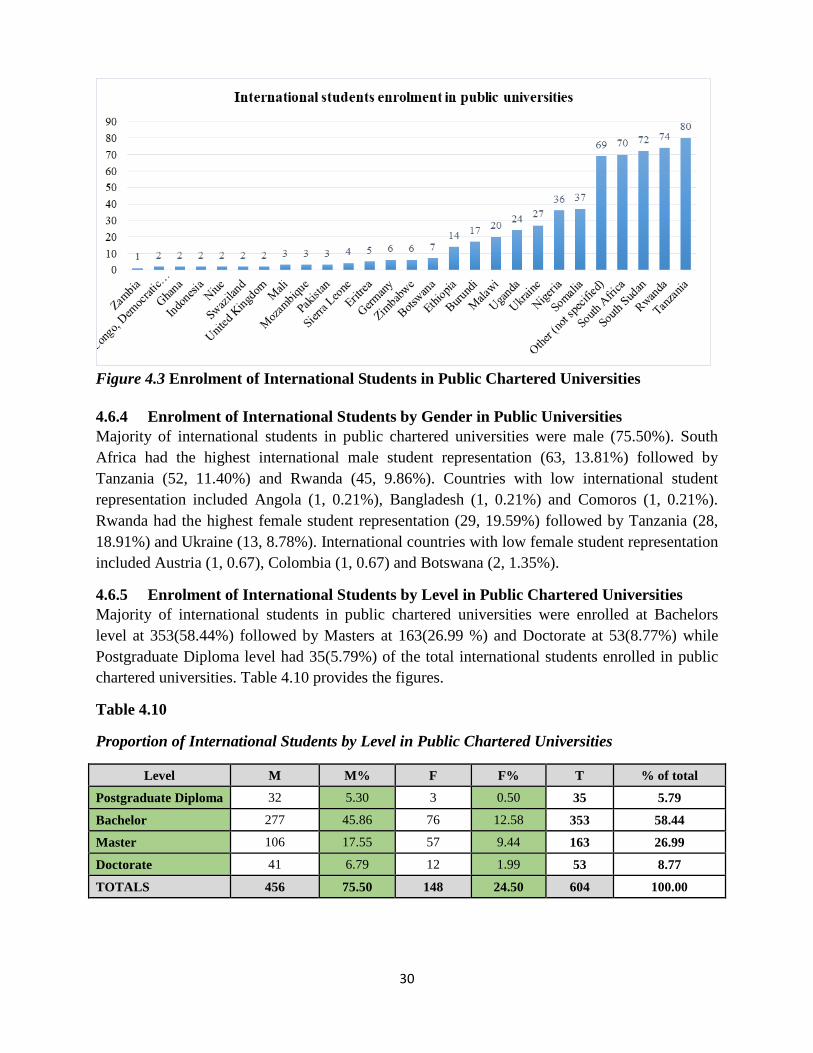
30
Figure 4.3 Enrolment of International Students in Public Chartered Universities
4.6.4 Enrolment of International Students by Gender in Public Universities
Majority of international students in public chartered universities were male (75.50%). South
Africa had the highest international male student representation (63, 13.81%) followed by
Tanzania (52, 11.40%) and Rwanda (45, 9.86%). Countries with low international student
representation included Angola (1, 0.21%), Bangladesh (1, 0.21%) and Comoros (1, 0.21%).
Rwanda had the highest female student representation (29, 19.59%) followed by Tanzania (28,
18.91%) and Ukraine (13, 8.78%). International countries with low female student representation
included Austria (1, 0.67), Colombia (1, 0.67) and Botswana (2, 1.35%).
4.6.5 Enrolment of International Students by Level in Public Chartered Universities
Majority of international students in public chartered universities were enrolled at Bachelors
level at 353(58.44%) followed by Masters at 163(26.99 %) and Doctorate at 53(8.77%) while
Postgraduate Diploma level had 35(5.79%) of the total international students enrolled in public
chartered universities. Table 4.10 provides the figures.
Table 4.10
Proportion of International Students by Level in Public Chartered Universities
Level M M% F F% T % of total
Postgraduate Diploma 32 5.30 3 0.50 35 5.79
Bachelor 277 45.86 76 12.58 353 58.44
Master 106 17.55 57 9.44 163 26.99
Doctorate 41 6.79 12 1.99 53 8.77
TOTALS 456 75.50 148 24.50 604 100.00
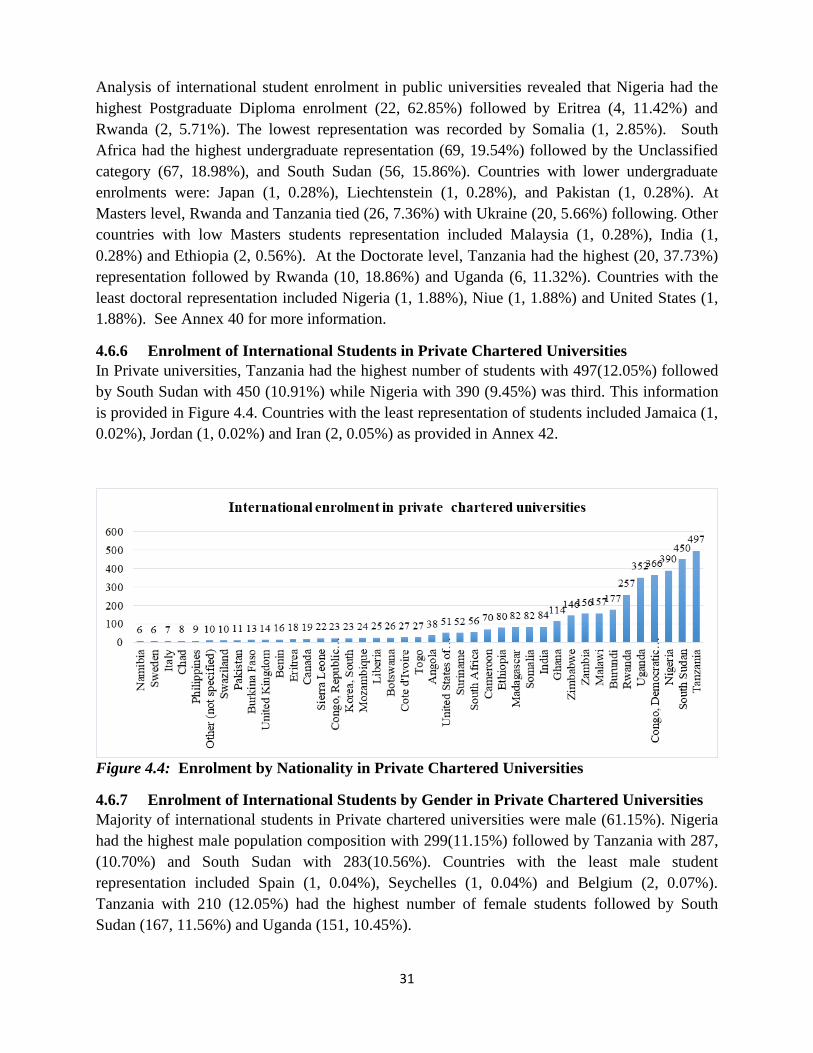
31
Analysis of international student enrolment in public universities revealed that Nigeria had the
highest Postgraduate Diploma enrolment (22, 62.85%) followed by Eritrea (4, 11.42%) and
Rwanda (2, 5.71%). The lowest representation was recorded by Somalia (1, 2.85%). South
Africa had the highest undergraduate representation (69, 19.54%) followed by the Unclassified
category (67, 18.98%), and South Sudan (56, 15.86%). Countries with lower undergraduate
enrolments were: Japan (1, 0.28%), Liechtenstein (1, 0.28%), and Pakistan (1, 0.28%). At
Masters level, Rwanda and Tanzania tied (26, 7.36%) with Ukraine (20, 5.66%) following. Other
countries with low Masters students representation included Malaysia (1, 0.28%), India (1,
0.28%) and Ethiopia (2, 0.56%). At the Doctorate level, Tanzania had the highest (20, 37.73%)
representation followed by Rwanda (10, 18.86%) and Uganda (6, 11.32%). Countries with the
least doctoral representation included Nigeria (1, 1.88%), Niue (1, 1.88%) and United States (1,
1.88%). See Annex 40 for more information.
4.6.6 Enrolment of International Students in Private Chartered Universities
In Private universities, Tanzania had the highest number of students with 497(12.05%) followed
by South Sudan with 450 (10.91%) while Nigeria with 390 (9.45%) was third. This information
is provided in Figure 4.4. Countries with the least representation of students included Jamaica (1,
0.02%), Jordan (1, 0.02%) and Iran (2, 0.05%) as provided in Annex 42.
Figure 4.4: Enrolment by Nationality in Private Chartered Universities
4.6.7 Enrolment of International Students by Gender in Private Chartered Universities
Majority of international students in Private chartered universities were male (61.15%). Nigeria
had the highest male population composition with 299(11.15%) followed by Tanzania with 287,
(10.70%) and South Sudan with 283(10.56%). Countries with the least male student
representation included Spain (1, 0.04%), Seychelles (1, 0.04%) and Belgium (2, 0.07%).
Tanzania with 210 (12.05%) had the highest number of female students followed by South
Sudan (167, 11.56%) and Uganda (151, 10.45%).
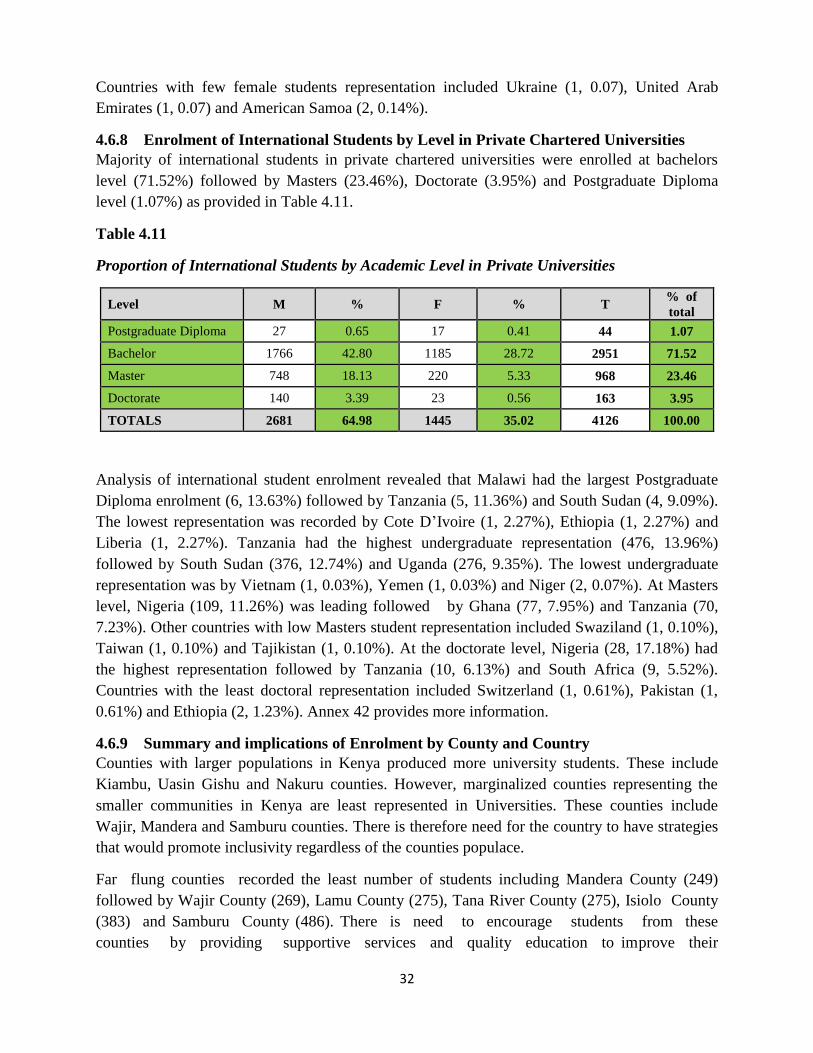
32
Countries with few female students representation included Ukraine (1, 0.07), United Arab
Emirates (1, 0.07) and American Samoa (2, 0.14%).
4.6.8 Enrolment of International Students by Level in Private Chartered Universities
Majority of international students in private chartered universities were enrolled at bachelors
level (71.52%) followed by Masters (23.46%), Doctorate (3.95%) and Postgraduate Diploma
level (1.07%) as provided in Table 4.11.
Table 4.11
Proportion of International Students by Academic Level in Private Universities
Level M % F % T % of
total
Postgraduate Diploma 27 0.65 17 0.41 44 1.07
Bachelor 1766 42.80 1185 28.72 2951 71.52
Master 748 18.13 220 5.33 968 23.46
Doctorate 140 3.39 23 0.56 163 3.95
TOTALS 2681 64.98 1445 35.02 4126 100.00
Analysis of international student enrolment revealed that Malawi had the largest Postgraduate
Diploma enrolment (6, 13.63%) followed by Tanzania (5, 11.36%) and South Sudan (4, 9.09%).
The lowest representation was recorded by Cote D’Ivoire (1, 2.27%), Ethiopia (1, 2.27%) and
Liberia (1, 2.27%). Tanzania had the highest undergraduate representation (476, 13.96%)
followed by South Sudan (376, 12.74%) and Uganda (276, 9.35%). The lowest undergraduate
representation was by Vietnam (1, 0.03%), Yemen (1, 0.03%) and Niger (2, 0.07%). At Masters
level, Nigeria (109, 11.26%) was leading followed by Ghana (77, 7.95%) and Tanzania (70,
7.23%). Other countries with low Masters student representation included Swaziland (1, 0.10%),
Taiwan (1, 0.10%) and Tajikistan (1, 0.10%). At the doctorate level, Nigeria (28, 17.18%) had
the highest representation followed by Tanzania (10, 6.13%) and South Africa (9, 5.52%).
Countries with the least doctoral representation included Switzerland (1, 0.61%), Pakistan (1,
0.61%) and Ethiopia (2, 1.23%). Annex 42 provides more information.
4.6.9 Summary and implications of Enrolment by County and Country
Counties with larger populations in Kenya produced more university students. These include
Kiambu, Uasin Gishu and Nakuru counties. However, marginalized counties representing the
smaller communities in Kenya are least represented in Universities. These counties include
Wajir, Mandera and Samburu counties. There is therefore need for the country to have strategies
that would promote inclusivity regardless of the counties populace.
Far flung counties recorded the least number of students including Mandera County (249)
followed by Wajir County (269), Lamu County (275), Tana River County (275), Isiolo County
(383) and Samburu County (486). There is need to encourage students from these
counties by providing supportive services and quality education to improve their
33
representation in Universities. There is also need to empower the girl child in the marginalized
counties. This will ensure they are also adequately represented in higher education and further
promote equity.
While the information on student enrolment from counties and countries of origin is critical,
Universities lack effective mechanisms to collect this data. Substantive data about students’
counties of origin in respective institutions is important for policy development.
From the foregoing discussion, it is evident that universities in Kenya have continued to attract
students from other African countries and beyond. This is an encouraging trend and efforts
should be put in place to further popularize local universities at the global scene.
Most of the international students were drawn from regional countries such as
Uganda,Tanzania and South Sudan. As such, Kenya should maintain and endeavour to deepen
this relationship so as to continue attracting even more students from this countries.
Majority of the international students were male and undertook undergraduate courses.
Efforts should be put in place to encourage enrolment of international students at post graduate
levels. To be able to comprehensively capture this type of data, this report recemmends that all
universities put in place a mechanism to exhaustively capture students enrolment details by
county and country and for all academic levels. This will show a clear picture of the local
universities’ attractiveness to the rest of the world.
4.7 Enrolment of Students with Disabilities
The number of students with disabilities in the universities increased by 36.6% from 645 in 2015
to 881 in 2016. The majority were enrolled in public universities (786), representing 89.2% of
the total number of students with disabilities enrolled, compared to 95 in private universities
representing 10.8%. Table 4.12 shows that students with physical impairment were the highest
enrolled at 53.3%, followed by students with visual impairment at 33.3% and hearing
impairment at 8.1% of the total enrollment. The least number of students with disabilities had
learning impairment representing 0.22% of the total students with disabilities enrolled.
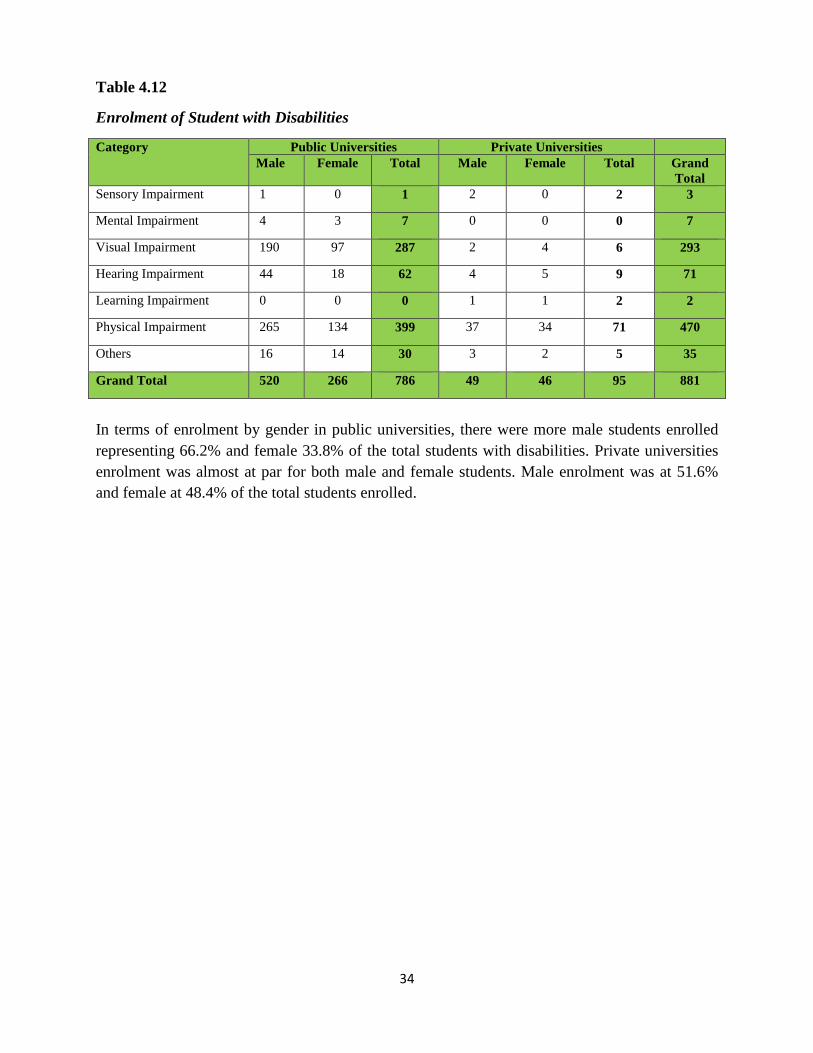
34
Table 4.12
Enrolment of Student with Disabilities
Category Public Universities Private Universities
Male Female Total Male Female Total Grand
Total
Sensory Impairment 1 0 1 2 0 2 3
Mental Impairment 4 3 7 0 0 0 7
Visual Impairment 190 97 287 2 4 6 293
Hearing Impairment 44 18 62 4 5 9 71
Learning Impairment 0 0 0 1 1 2 2
Physical Impairment 265 134 399 37 34 71 470
Others 16 14 30 3 2 5 35
Grand Total 520 266 786 49 46 95 881
In terms of enrolment by gender in public universities, there were more male students enrolled
representing 66.2% and female 33.8% of the total students with disabilities. Private universities
enrolment was almost at par for both male and female students. Male enrolment was at 51.6%
and female at 48.4% of the total students enrolled.
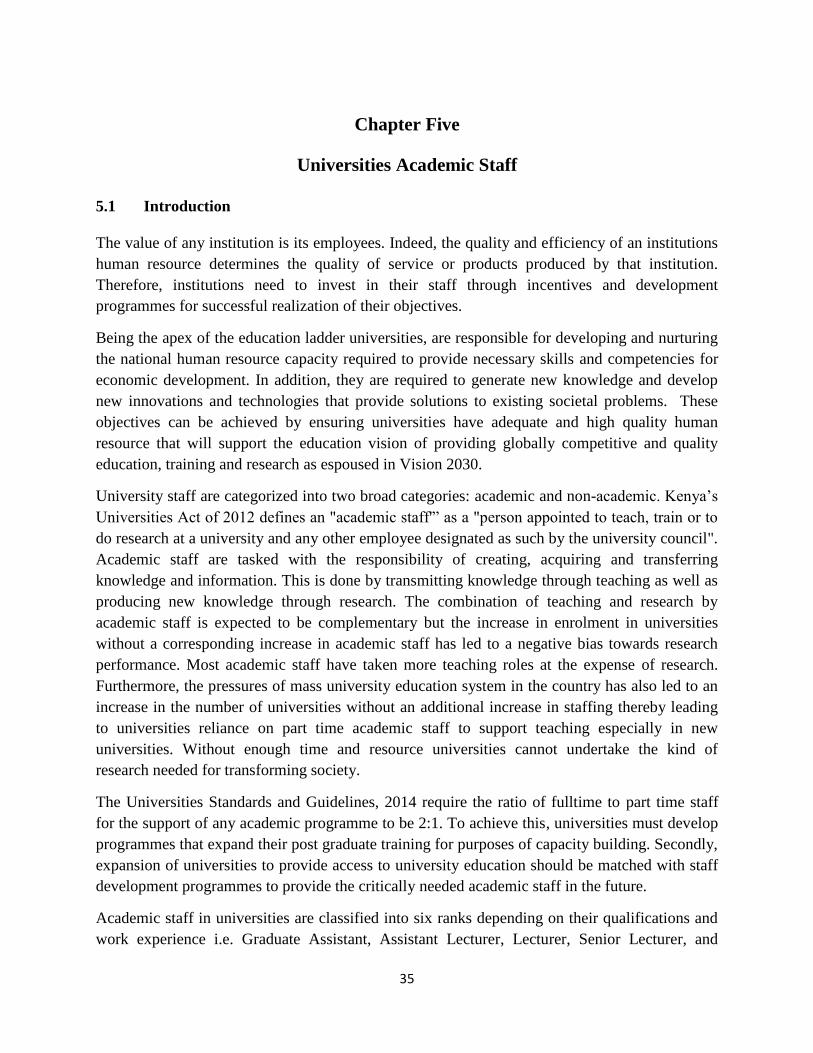
35
Chapter Five
Universities Academic Staff
5.1 Introduction
The value of any institution is its employees. Indeed, the quality and efficiency of an institutions
human resource determines the quality of service or products produced by that institution.
Therefore, institutions need to invest in their staff through incentives and development
programmes for successful realization of their objectives.
Being the apex of the education ladder universities, are responsible for developing and nurturing
the national human resource capacity required to provide necessary skills and competencies for
economic development. In addition, they are required to generate new knowledge and develop
new innovations and technologies that provide solutions to existing societal problems. These
objectives can be achieved by ensuring universities have adequate and high quality human
resource that will support the education vision of providing globally competitive and quality
education, training and research as espoused in Vision 2030.
University staff are categorized into two broad categories: academic and non-academic. Kenya’s
Universities Act of 2012 defines an "academic staff'” as a "person appointed to teach, train or to
do research at a university and any other employee designated as such by the university council".
Academic staff are tasked with the responsibility of creating, acquiring and transferring
knowledge and information. This is done by transmitting knowledge through teaching as well as
producing new knowledge through research. The combination of teaching and research by
academic staff is expected to be complementary but the increase in enrolment in universities
without a corresponding increase in academic staff has led to a negative bias towards research
performance. Most academic staff have taken more teaching roles at the expense of research.
Furthermore, the pressures of mass university education system in the country has also led to an
increase in the number of universities without an additional increase in staffing thereby leading
to universities reliance on part time academic staff to support teaching especially in new
universities. Without enough time and resource universities cannot undertake the kind of
research needed for transforming society.
The Universities Standards and Guidelines, 2014 require the ratio of fulltime to part time staff
for the support of any academic programme to be 2:1. To achieve this, universities must develop
programmes that expand their post graduate training for purposes of capacity building. Secondly,
expansion of universities to provide access to university education should be matched with staff
development programmes to provide the critically needed academic staff in the future.
Academic staff in universities are classified into six ranks depending on their qualifications and
work experience i.e. Graduate Assistant, Assistant Lecturer, Lecturer, Senior Lecturer, and
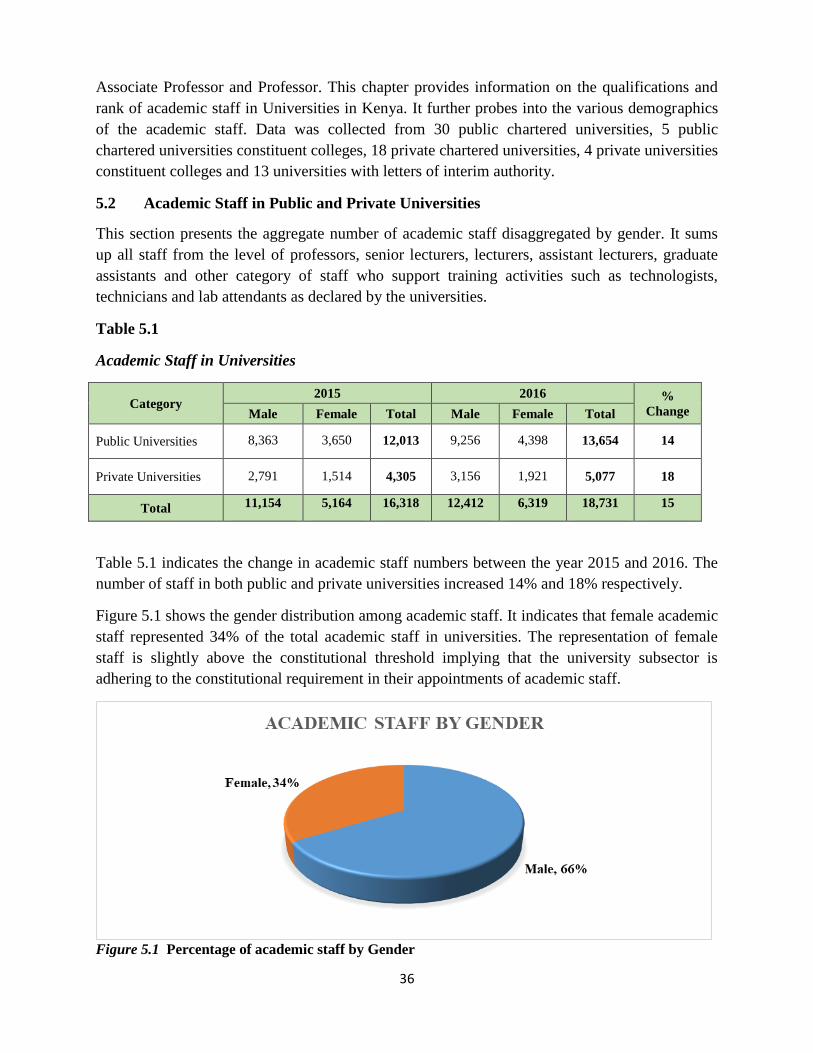
36
Associate Professor and Professor. This chapter provides information on the qualifications and
rank of academic staff in Universities in Kenya. It further probes into the various demographics
of the academic staff. Data was collected from 30 public chartered universities, 5 public
chartered universities constituent colleges, 18 private chartered universities, 4 private universities
constituent colleges and 13 universities with letters of interim authority.
5.2 Academic Staff in Public and Private Universities
This section presents the aggregate number of academic staff disaggregated by gender. It sums
up all staff from the level of professors, senior lecturers, lecturers, assistant lecturers, graduate
assistants and other category of staff who support training activities such as technologists,
technicians and lab attendants as declared by the universities.
Table 5.1
Academic Staff in Universities
Category 2015 2016 %
Change Male Female Total Male Female Total
Public Universities 8,363 3,650 12,013 9,256 4,398 13,654 14
Private Universities 2,791 1,514 4,305 3,156 1,921 5,077 18
Total 11,154 5,164 16,318 12,412 6,319 18,731 15
Table 5.1 indicates the change in academic staff numbers between the year 2015 and 2016. The
number of staff in both public and private universities increased 14% and 18% respectively.
Figure 5.1 shows the gender distribution among academic staff. It indicates that female academic
staff represented 34% of the total academic staff in universities. The representation of female
staff is slightly above the constitutional threshold implying that the university subsector is
adhering to the constitutional requirement in their appointments of academic staff.
Figure 5.1 Percentage of academic staff by Gender
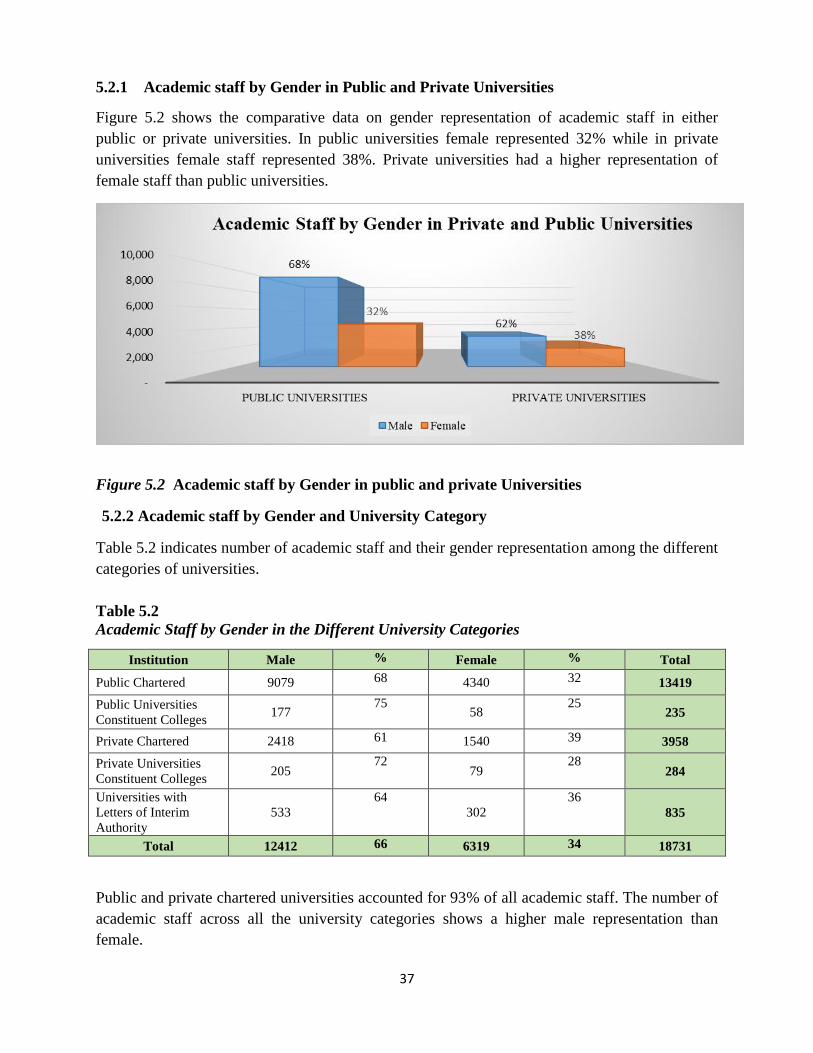
37
5.2.1 Academic staff by Gender in Public and Private Universities
Figure 5.2 shows the comparative data on gender representation of academic staff in either
public or private universities. In public universities female represented 32% while in private
universities female staff represented 38%. Private universities had a higher representation of
female staff than public universities.
Figure 5.2 Academic staff by Gender in public and private Universities
5.2.2 Academic staff by Gender and University Category
Table 5.2 indicates number of academic staff and their gender representation among the different
categories of universities.
Table 5.2
Academic Staff by Gender in the Different University Categories
Institution Male % Female % Total
Public Chartered 9079 68 4340 32 13419
Public Universities
Constituent Colleges 177
75 58
25 235
Private Chartered 2418 61 1540 39 3958
Private Universities
Constituent Colleges 205
72 79
28 284
Universities with
Letters of Interim
Authority
533
64
302
36
835
Total 12412 66 6319 34 18731
Public and private chartered universities accounted for 93% of all academic staff. The number of
academic staff across all the university categories shows a higher male representation than
female.
38
5.3 Academic Staff by Qualification
Quality staff are an essential component of quality education. The Universities Standards and
Guidelines, 2014 specify that “the minimum academic qualifications of academic staff for a
given level of academic programme shall be at least one level above what he or she is supposed
to teach. This section provides information on the qualification of academic staff in universities.
Figure 5.3 indicates that 53% of academic staff have a Masters qualification. This is
commensurate with the higher enrolment of students at Bachelors degree who are mainly taught
by Masters degree holders. The percentage of academic staff with PhD qualification was 32%.
The representation of staff with higher levels of qualification at above 80% is an indicator of
quality human resource capacity for teaching and research. Universities should strive to develop
capacity of the staff through incentives such as scholarships and reduced workloads. This would
enable staff to progress in their studies and achieve doctorate qualification especially those at
lecturer rank without PhDs so as to comply with the University Standards and Guidelines, 2014,
and enhance expertise in their fields to become producers of knowledge through research.
Figure 5.3 Academic staff by Qualifications
5.3.1 Academic staff by Gender and Qualification
To better understand the representation of university academic staff in terms of gender, the data
was analyzed to depict the proportion of each qualification level by gender. Figure 5.4 indicates
that, overall across all the qualification levels male academic staff had higher qualifications than
their female colleagues. Among the proportion of all academic staff with PhD’s, 71% were male
while 21% female. This scenario is replicated across all the other qualification levels with male
representation being over 60% at each qualification level. This situation is not peculiar as the
percentage of male academic staff is higher than the female academic staff in universities as
shown in Figure 5.1.
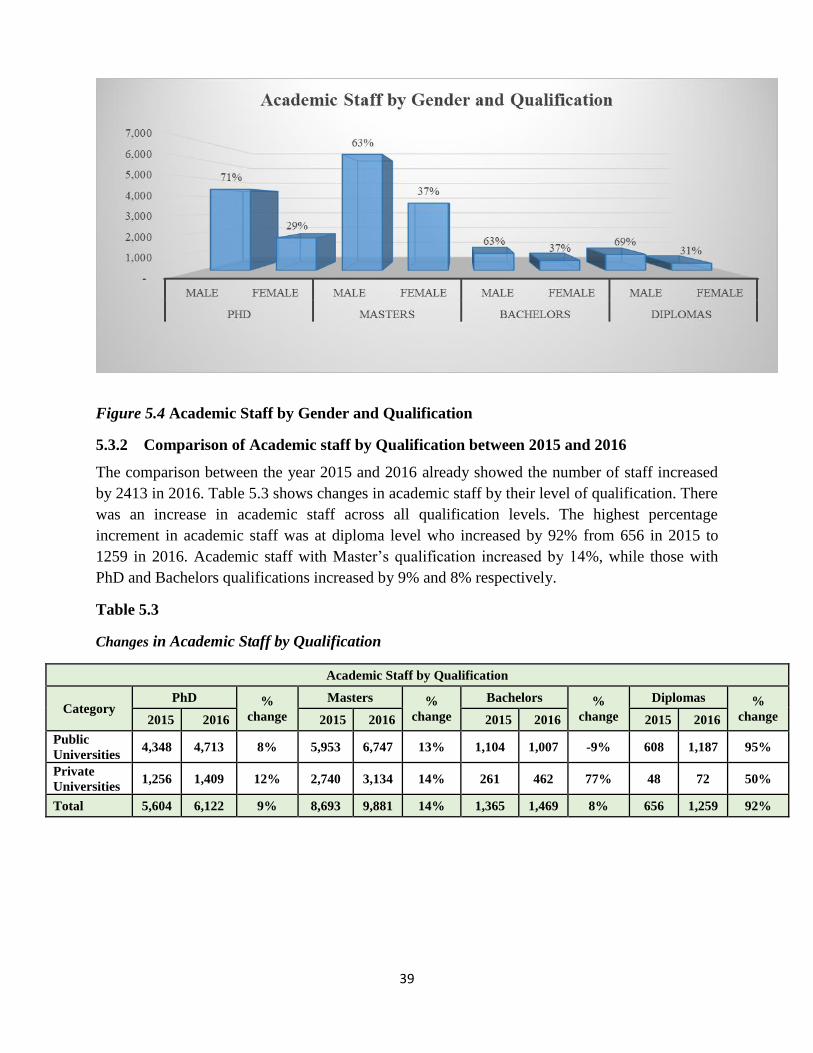
39
Figure 5.4 Academic Staff by Gender and Qualification
5.3.2 Comparison of Academic staff by Qualification between 2015 and 2016
The comparison between the year 2015 and 2016 already showed the number of staff increased
by 2413 in 2016. Table 5.3 shows changes in academic staff by their level of qualification. There
was an increase in academic staff across all qualification levels. The highest percentage
increment in academic staff was at diploma level who increased by 92% from 656 in 2015 to
1259 in 2016. Academic staff with Master’s qualification increased by 14%, while those with
PhD and Bachelors qualifications increased by 9% and 8% respectively.
Table 5.3
Changes in Academic Staff by Qualification
Academic Staff by Qualification
Category PhD %
change
Masters %
change
Bachelors %
change
Diplomas %
change 2015 2016 2015 2016 2015 2016 2015 2016
Public
Universities 4,348 4,713 8% 5,953 6,747 13% 1,104 1,007 -9% 608 1,187 95%
Private
Universities 1,256 1,409 12% 2,740 3,134 14% 261 462 77% 48 72 50%
Total 5,604 6,122 9% 8,693 9,881 14% 1,365 1,469 8% 656 1,259 92%
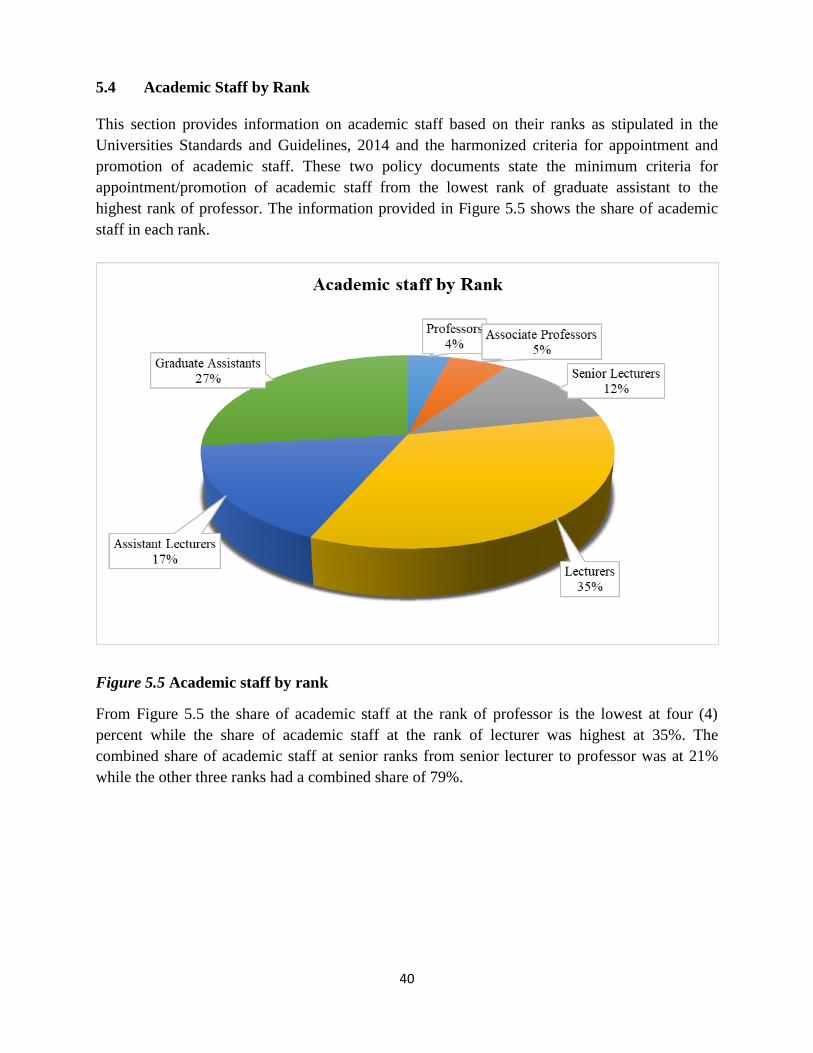
40
5.4 Academic Staff by Rank
This section provides information on academic staff based on their ranks as stipulated in the
Universities Standards and Guidelines, 2014 and the harmonized criteria for appointment and
promotion of academic staff. These two policy documents state the minimum criteria for
appointment/promotion of academic staff from the lowest rank of graduate assistant to the
highest rank of professor. The information provided in Figure 5.5 shows the share of academic
staff in each rank.
Figure 5.5 Academic staff by rank
From Figure 5.5 the share of academic staff at the rank of professor is the lowest at four (4)
percent while the share of academic staff at the rank of lecturer was highest at 35%. The
combined share of academic staff at senior ranks from senior lecturer to professor was at 21%
while the other three ranks had a combined share of 79%.
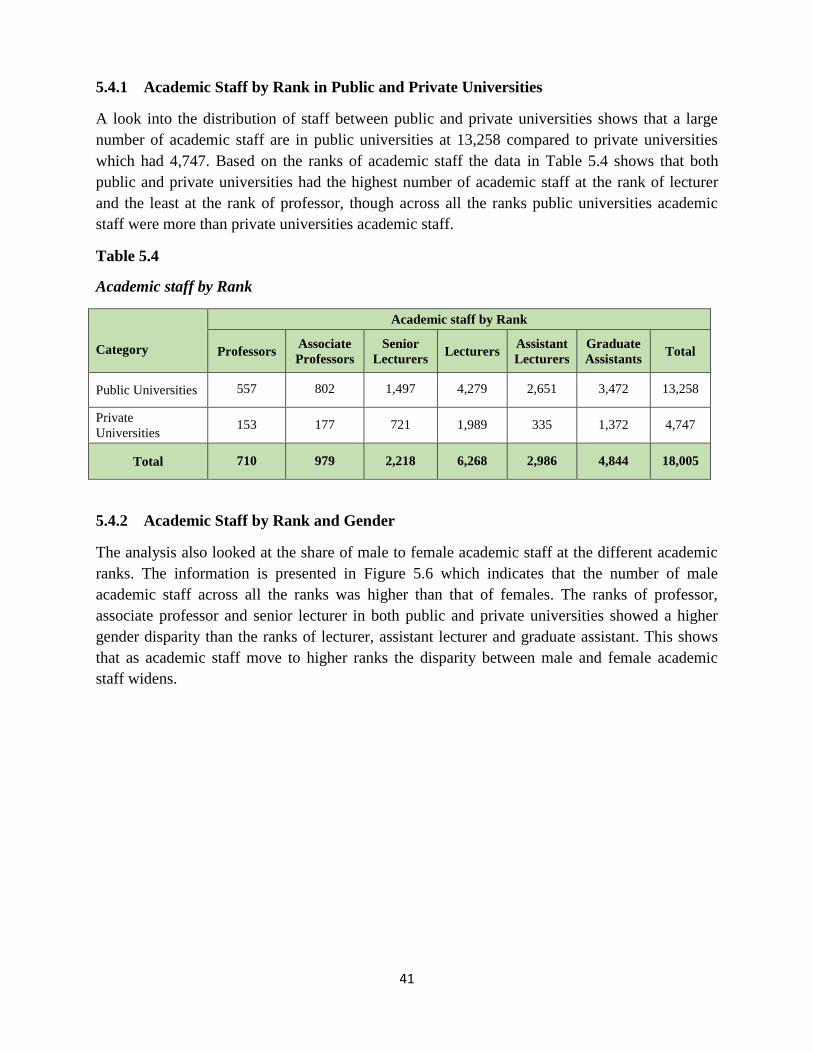
41
5.4.1 Academic Staff by Rank in Public and Private Universities
A look into the distribution of staff between public and private universities shows that a large
number of academic staff are in public universities at 13,258 compared to private universities
which had 4,747. Based on the ranks of academic staff the data in Table 5.4 shows that both
public and private universities had the highest number of academic staff at the rank of lecturer
and the least at the rank of professor, though across all the ranks public universities academic
staff were more than private universities academic staff.
Table 5.4
Academic staff by Rank
Category
Academic staff by Rank
Professors Associate
Professors
Senior
Lecturers Lecturers
Assistant
Lecturers
Graduate
Assistants Total
Public Universities 557 802 1,497 4,279 2,651 3,472 13,258
Private
Universities 153 177 721 1,989 335 1,372 4,747
Total 710 979 2,218 6,268 2,986 4,844 18,005
5.4.2 Academic Staff by Rank and Gender
The analysis also looked at the share of male to female academic staff at the different academic
ranks. The information is presented in Figure 5.6 which indicates that the number of male
academic staff across all the ranks was higher than that of females. The ranks of professor,
associate professor and senior lecturer in both public and private universities showed a higher
gender disparity than the ranks of lecturer, assistant lecturer and graduate assistant. This shows
that as academic staff move to higher ranks the disparity between male and female academic
staff widens.
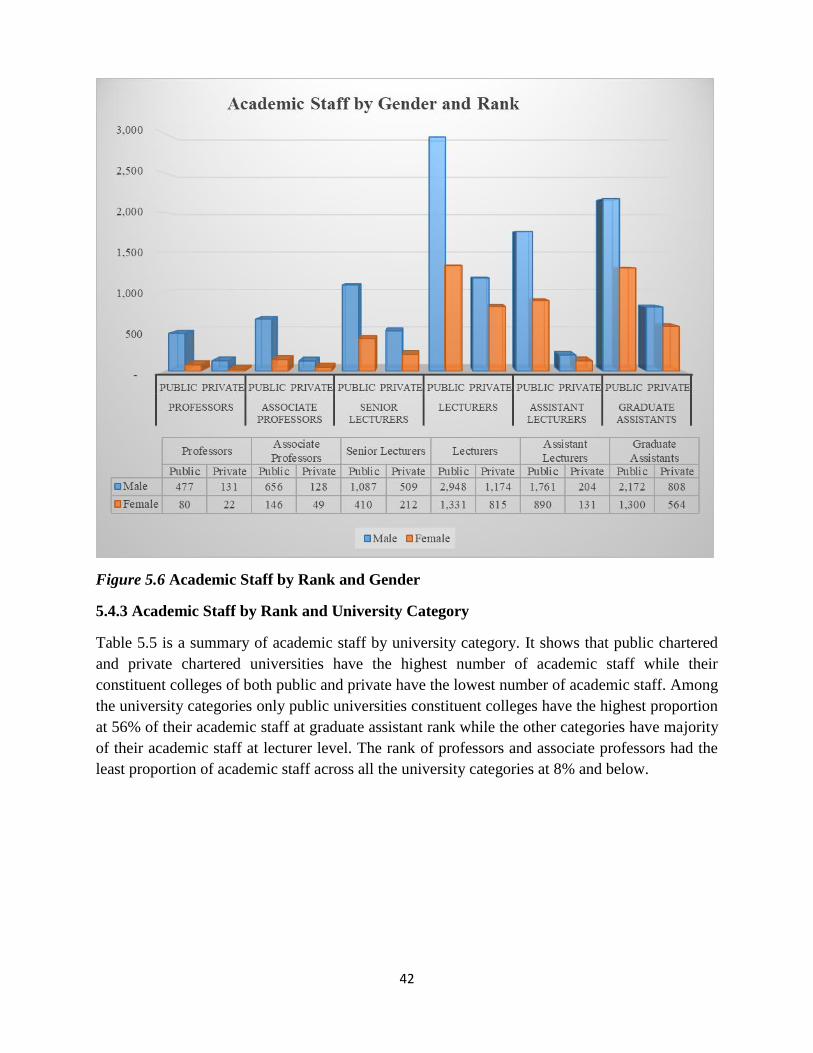
42
Figure 5.6 Academic Staff by Rank and Gender
5.4.3 Academic Staff by Rank and University Category
Table 5.5 is a summary of academic staff by university category. It shows that public chartered
and private chartered universities have the highest number of academic staff while their
constituent colleges of both public and private have the lowest number of academic staff. Among
the university categories only public universities constituent colleges have the highest proportion
at 56% of their academic staff at graduate assistant rank while the other categories have majority
of their academic staff at lecturer level. The rank of professors and associate professors had the
least proportion of academic staff across all the university categories at 8% and below.
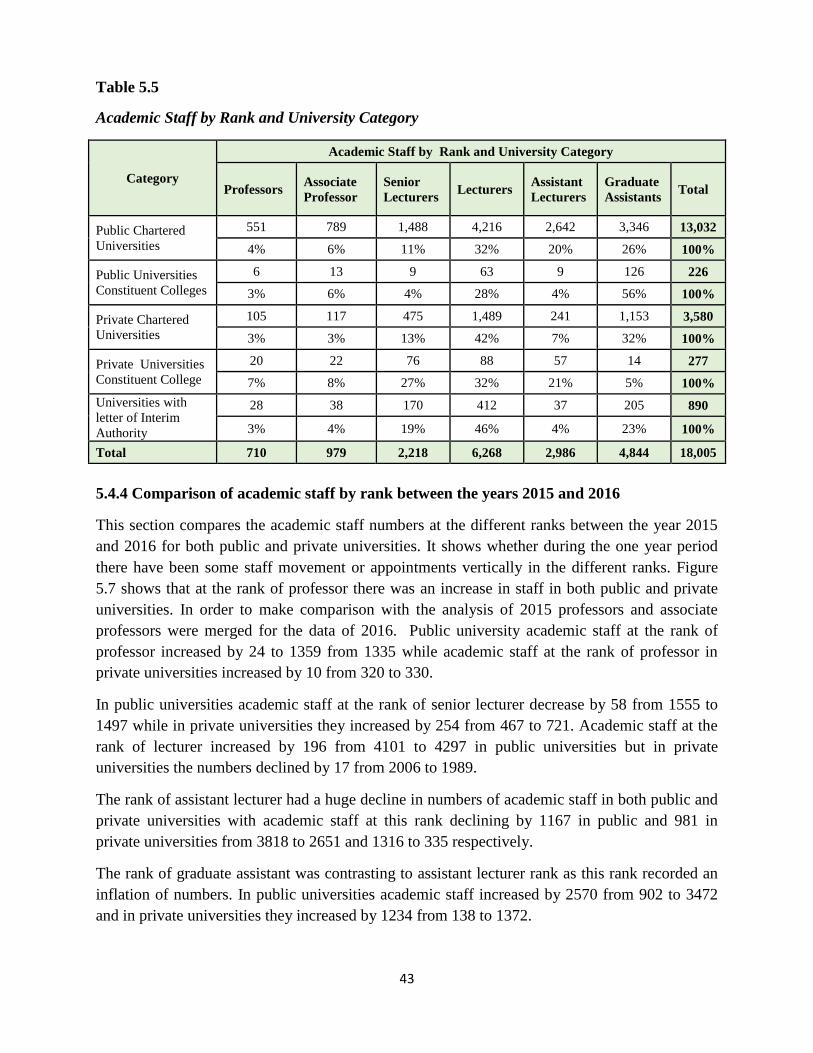
43
Table 5.5
Academic Staff by Rank and University Category
Category
Academic Staff by Rank and University Category
Professors Associate
Professor
Senior
Lecturers Lecturers
Assistant
Lecturers
Graduate
Assistants Total
Public Chartered
Universities
551 789 1,488 4,216 2,642 3,346 13,032
4% 6% 11% 32% 20% 26% 100%
Public Universities
Constituent Colleges
6 13 9 63 9 126 226
3% 6% 4% 28% 4% 56% 100%
Private Chartered
Universities
105 117 475 1,489 241 1,153 3,580
3% 3% 13% 42% 7% 32% 100%
Private Universities
Constituent College
20 22 76 88 57 14 277
7% 8% 27% 32% 21% 5% 100%
Universities with
letter of Interim
Authority
28 38 170 412 37 205 890
3% 4% 19% 46% 4% 23% 100%
Total 710 979 2,218 6,268 2,986 4,844 18,005
5.4.4 Comparison of academic staff by rank between the years 2015 and 2016
This section compares the academic staff numbers at the different ranks between the year 2015
and 2016 for both public and private universities. It shows whether during the one year period
there have been some staff movement or appointments vertically in the different ranks. Figure
5.7 shows that at the rank of professor there was an increase in staff in both public and private
universities. In order to make comparison with the analysis of 2015 professors and associate
professors were merged for the data of 2016. Public university academic staff at the rank of
professor increased by 24 to 1359 from 1335 while academic staff at the rank of professor in
private universities increased by 10 from 320 to 330.
In public universities academic staff at the rank of senior lecturer decrease by 58 from 1555 to
1497 while in private universities they increased by 254 from 467 to 721. Academic staff at the
rank of lecturer increased by 196 from 4101 to 4297 in public universities but in private
universities the numbers declined by 17 from 2006 to 1989.
The rank of assistant lecturer had a huge decline in numbers of academic staff in both public and
private universities with academic staff at this rank declining by 1167 in public and 981 in
private universities from 3818 to 2651 and 1316 to 335 respectively.
The rank of graduate assistant was contrasting to assistant lecturer rank as this rank recorded an
inflation of numbers. In public universities academic staff increased by 2570 from 902 to 3472
and in private universities they increased by 1234 from 138 to 1372.
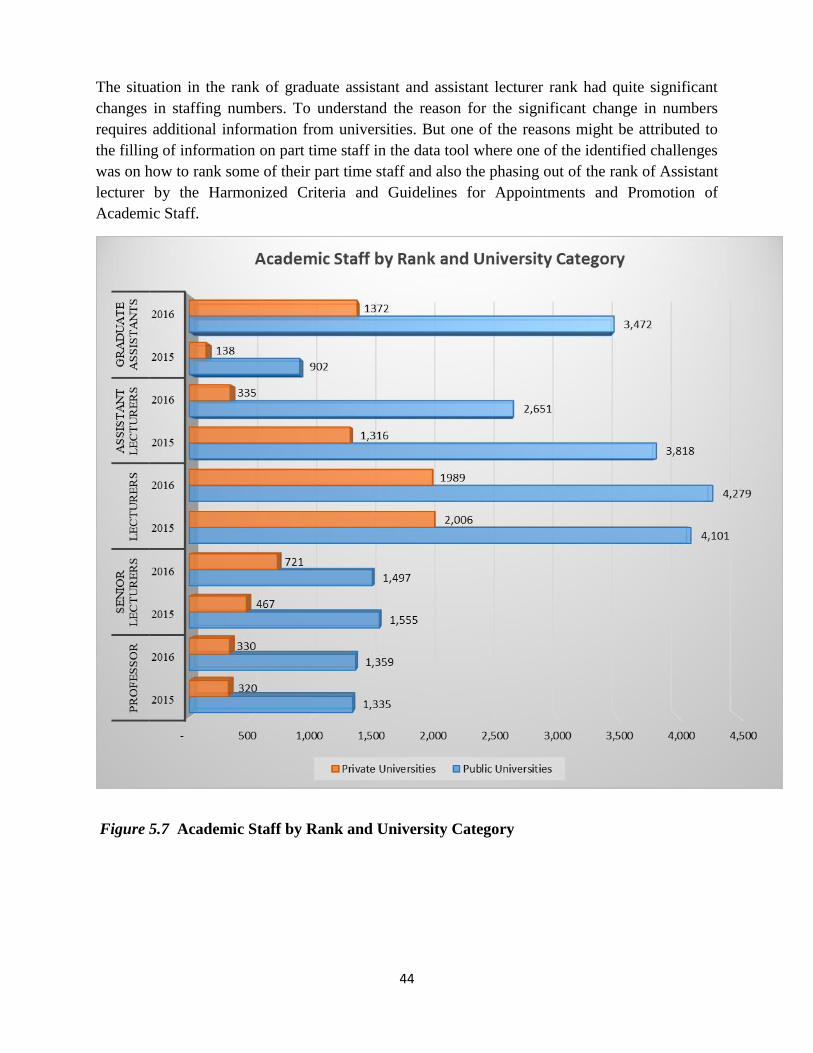
44
The situation in the rank of graduate assistant and assistant lecturer rank had quite significant
changes in staffing numbers. To understand the reason for the significant change in numbers
requires additional information from universities. But one of the reasons might be attributed to
the filling of information on part time staff in the data tool where one of the identified challenges
was on how to rank some of their part time staff and also the phasing out of the rank of Assistant
lecturer by the Harmonized Criteria and Guidelines for Appointments and Promotion of
Academic Staff.
Figure 5.7 Academic Staff by Rank and University Category
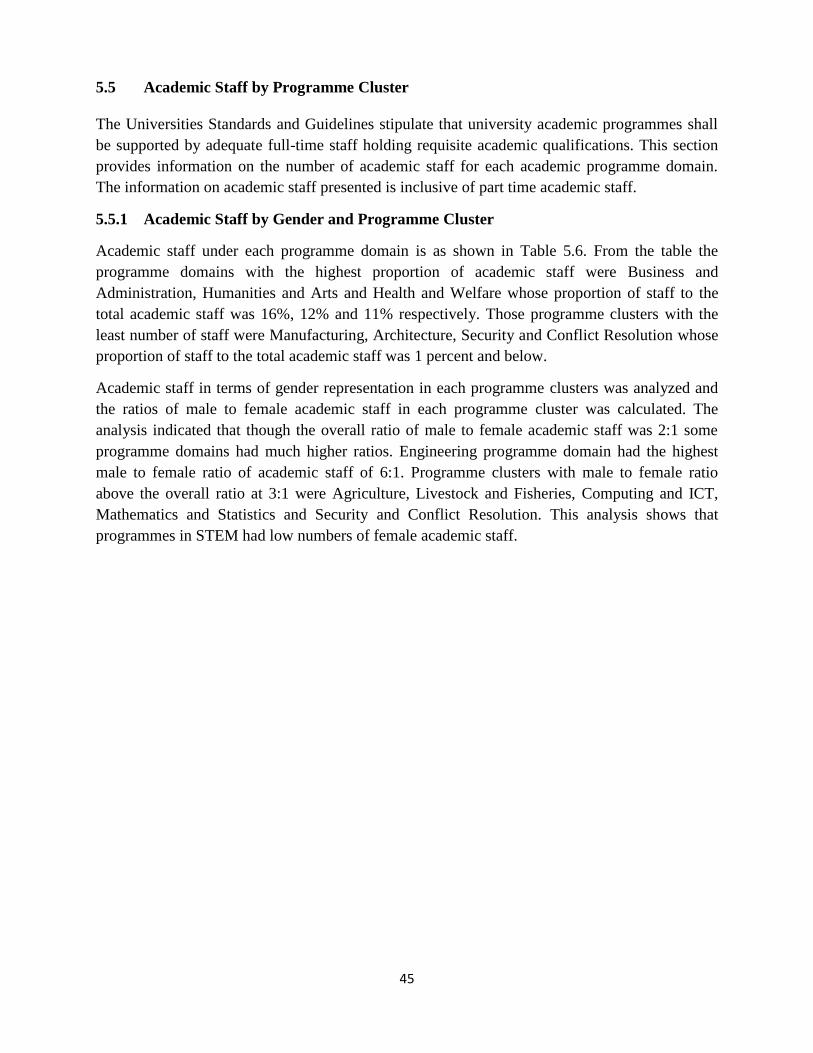
45
5.5 Academic Staff by Programme Cluster
The Universities Standards and Guidelines stipulate that university academic programmes shall
be supported by adequate full-time staff holding requisite academic qualifications. This section
provides information on the number of academic staff for each academic programme domain.
The information on academic staff presented is inclusive of part time academic staff.
5.5.1 Academic Staff by Gender and Programme Cluster
Academic staff under each programme domain is as shown in Table 5.6. From the table the
programme domains with the highest proportion of academic staff were Business and
Administration, Humanities and Arts and Health and Welfare whose proportion of staff to the
total academic staff was 16%, 12% and 11% respectively. Those programme clusters with the
least number of staff were Manufacturing, Architecture, Security and Conflict Resolution whose
proportion of staff to the total academic staff was 1 percent and below.
Academic staff in terms of gender representation in each programme clusters was analyzed and
the ratios of male to female academic staff in each programme cluster was calculated. The
analysis indicated that though the overall ratio of male to female academic staff was 2:1 some
programme domains had much higher ratios. Engineering programme domain had the highest
male to female ratio of academic staff of 6:1. Programme clusters with male to female ratio
above the overall ratio at 3:1 were Agriculture, Livestock and Fisheries, Computing and ICT,
Mathematics and Statistics and Security and Conflict Resolution. This analysis shows that
programmes in STEM had low numbers of female academic staff.
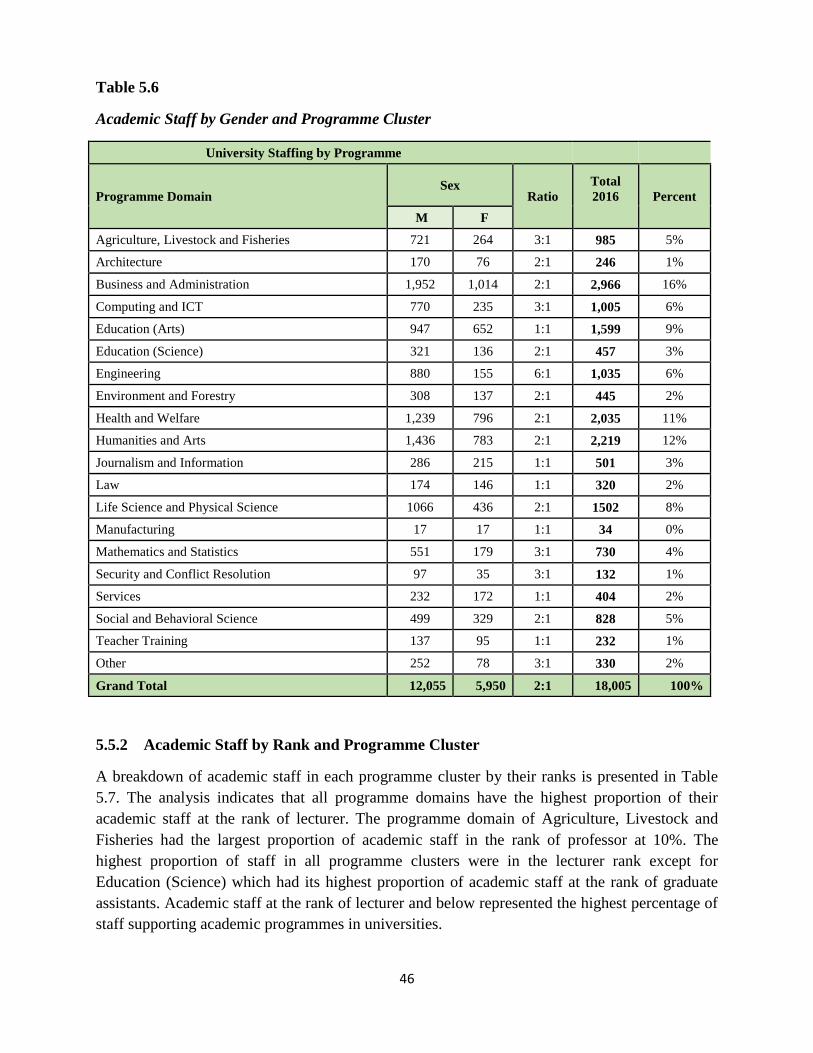
46
Table 5.6
Academic Staff by Gender and Programme Cluster
University Staffing by Programme
Programme Domain Sex
Ratio
Total
2016
Percent
M F
Agriculture, Livestock and Fisheries 721 264 3:1 985 5%
Architecture 170 76 2:1 246 1%
Business and Administration 1,952 1,014 2:1 2,966 16%
Computing and ICT 770 235 3:1 1,005 6%
Education (Arts) 947 652 1:1 1,599 9%
Education (Science) 321 136 2:1 457 3%
Engineering 880 155 6:1 1,035 6%
Environment and Forestry 308 137 2:1 445 2%
Health and Welfare 1,239 796 2:1 2,035 11%
Humanities and Arts 1,436 783 2:1 2,219 12%
Journalism and Information 286 215 1:1 501 3%
Law 174 146 1:1 320 2%
Life Science and Physical Science 1066 436 2:1 1502 8%
Manufacturing 17 17 1:1 34 0%
Mathematics and Statistics 551 179 3:1 730 4%
Security and Conflict Resolution 97 35 3:1 132 1%
Services 232 172 1:1 404 2%
Social and Behavioral Science 499 329 2:1 828 5%
Teacher Training 137 95 1:1 232 1%
Other 252 78 3:1 330 2%
Grand Total 12,055 5,950 2:1 18,005 100%
5.5.2 Academic Staff by Rank and Programme Cluster
A breakdown of academic staff in each programme cluster by their ranks is presented in Table
5.7. The analysis indicates that all programme domains have the highest proportion of their
academic staff at the rank of lecturer. The programme domain of Agriculture, Livestock and
Fisheries had the largest proportion of academic staff in the rank of professor at 10%. The
highest proportion of staff in all programme clusters were in the lecturer rank except for
Education (Science) which had its highest proportion of academic staff at the rank of graduate
assistants. Academic staff at the rank of lecturer and below represented the highest percentage of
staff supporting academic programmes in universities.
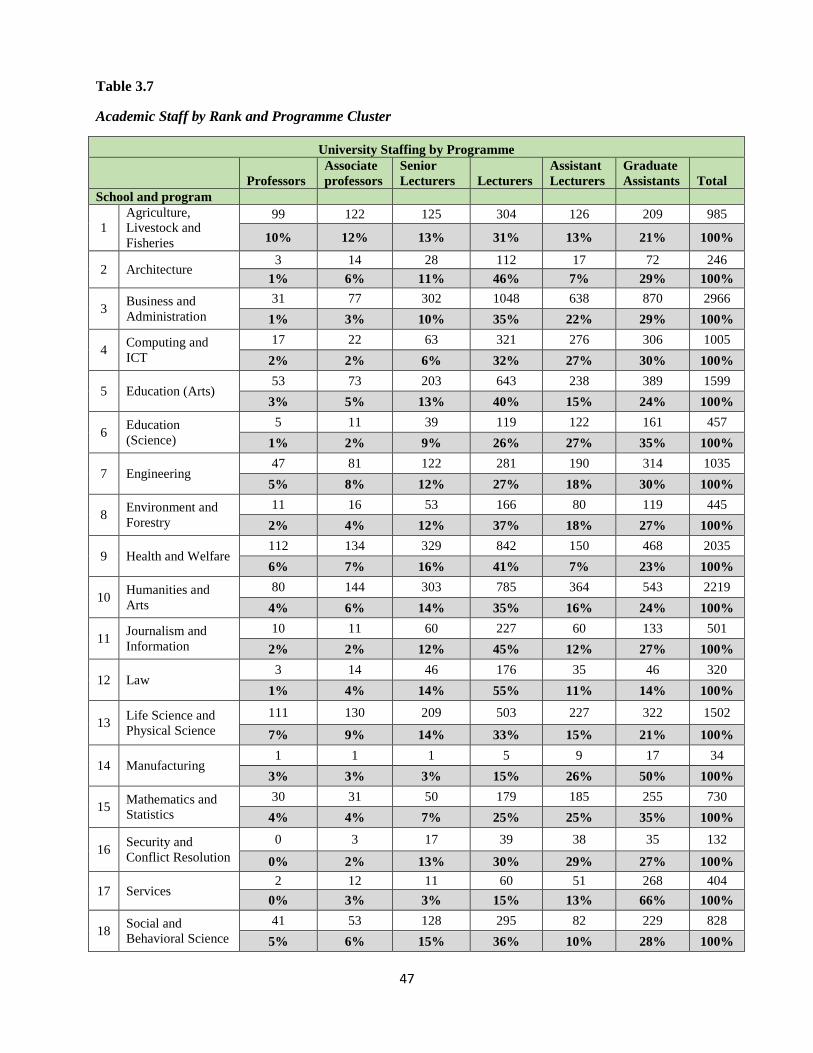
47
Table 3.7
Academic Staff by Rank and Programme Cluster
University Staffing by Programme
Professors
Associate
professors
Senior
Lecturers Lecturers
Assistant
Lecturers
Graduate
Assistants Total
School and program
1
Agriculture,
Livestock and
Fisheries
99 122 125 304 126 209 985
10% 12% 13% 31% 13% 21% 100%
2 Architecture 3 14 28 112 17 72 246
1% 6% 11% 46% 7% 29% 100%
3 Business and
Administration
31 77 302 1048 638 870 2966
1% 3% 10% 35% 22% 29% 100%
4 Computing and
ICT
17 22 63 321 276 306 1005
2% 2% 6% 32% 27% 30% 100%
5 Education (Arts) 53 73 203 643 238 389 1599
3% 5% 13% 40% 15% 24% 100%
6 Education
(Science)
5 11 39 119 122 161 457
1% 2% 9% 26% 27% 35% 100%
7 Engineering 47 81 122 281 190 314 1035
5% 8% 12% 27% 18% 30% 100%
8 Environment and
Forestry
11 16 53 166 80 119 445
2% 4% 12% 37% 18% 27% 100%
9 Health and Welfare 112 134 329 842 150 468 2035
6% 7% 16% 41% 7% 23% 100%
10 Humanities and
Arts
80 144 303 785 364 543 2219
4% 6% 14% 35% 16% 24% 100%
11 Journalism and
Information
10 11 60 227 60 133 501
2% 2% 12% 45% 12% 27% 100%
12 Law 3 14 46 176 35 46 320
1% 4% 14% 55% 11% 14% 100%
13 Life Science and
Physical Science
111 130 209 503 227 322 1502
7% 9% 14% 33% 15% 21% 100%
14 Manufacturing 1 1 1 5 9 17 34
3% 3% 3% 15% 26% 50% 100%
15 Mathematics and
Statistics
30 31 50 179 185 255 730
4% 4% 7% 25% 25% 35% 100%
16 Security and
Conflict Resolution
0 3 17 39 38 35 132
0% 2% 13% 30% 29% 27% 100%
17 Services 2 12 11 60 51 268 404
0% 3% 3% 15% 13% 66% 100%
18 Social and
Behavioral Science
41 53 128 295 82 229 828
5% 6% 15% 36% 10% 28% 100%
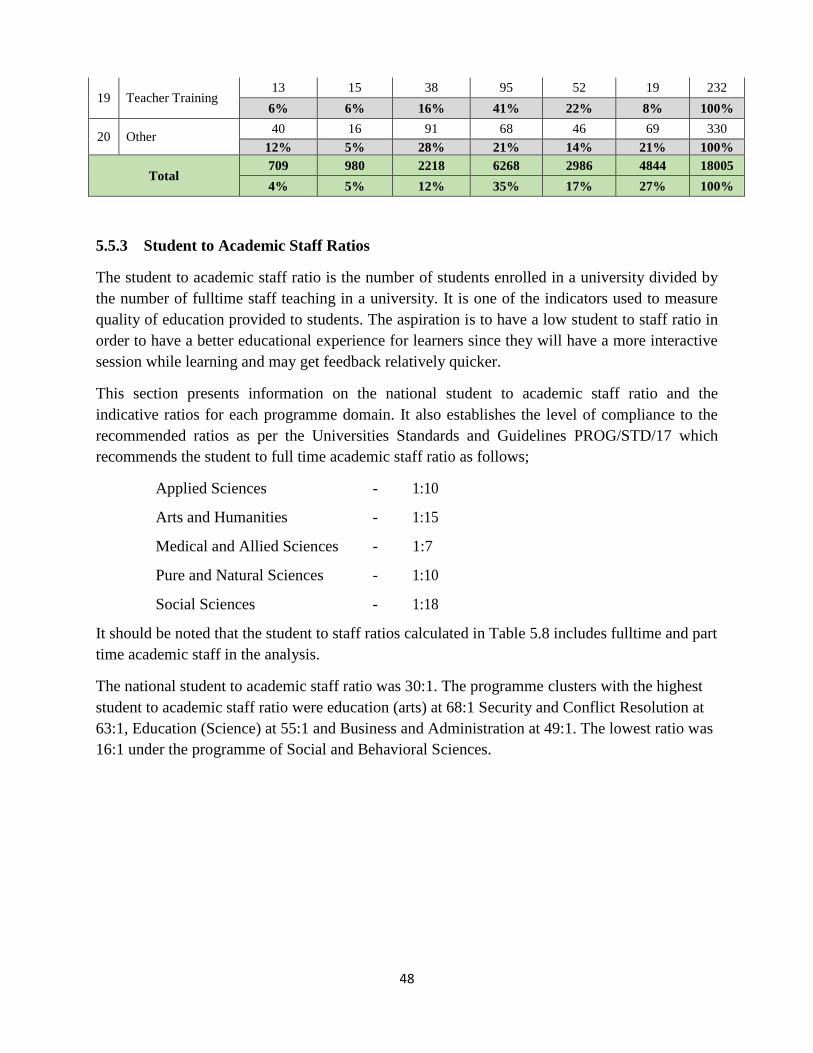
48
19 Teacher Training 13 15 38 95 52 19 232
6% 6% 16% 41% 22% 8% 100%
20 Other 40 16 91 68 46 69 330
12% 5% 28% 21% 14% 21% 100%
Total 709 980 2218 6268 2986 4844 18005
4% 5% 12% 35% 17% 27% 100%
5.5.3 Student to Academic Staff Ratios
The student to academic staff ratio is the number of students enrolled in a university divided by
the number of fulltime staff teaching in a university. It is one of the indicators used to measure
quality of education provided to students. The aspiration is to have a low student to staff ratio in
order to have a better educational experience for learners since they will have a more interactive
session while learning and may get feedback relatively quicker.
This section presents information on the national student to academic staff ratio and the
indicative ratios for each programme domain. It also establishes the level of compliance to the
recommended ratios as per the Universities Standards and Guidelines PROG/STD/17 which
recommends the student to full time academic staff ratio as follows;
Applied Sciences - 1:10
Arts and Humanities - 1:15
Medical and Allied Sciences - 1:7
Pure and Natural Sciences - 1:10
Social Sciences - 1:18
It should be noted that the student to staff ratios calculated in Table 5.8 includes fulltime and part
time academic staff in the analysis.
The national student to academic staff ratio was 30:1. The programme clusters with the highest
student to academic staff ratio were education (arts) at 68:1 Security and Conflict Resolution at
63:1, Education (Science) at 55:1 and Business and Administration at 49:1. The lowest ratio was
16:1 under the programme of Social and Behavioral Sciences.
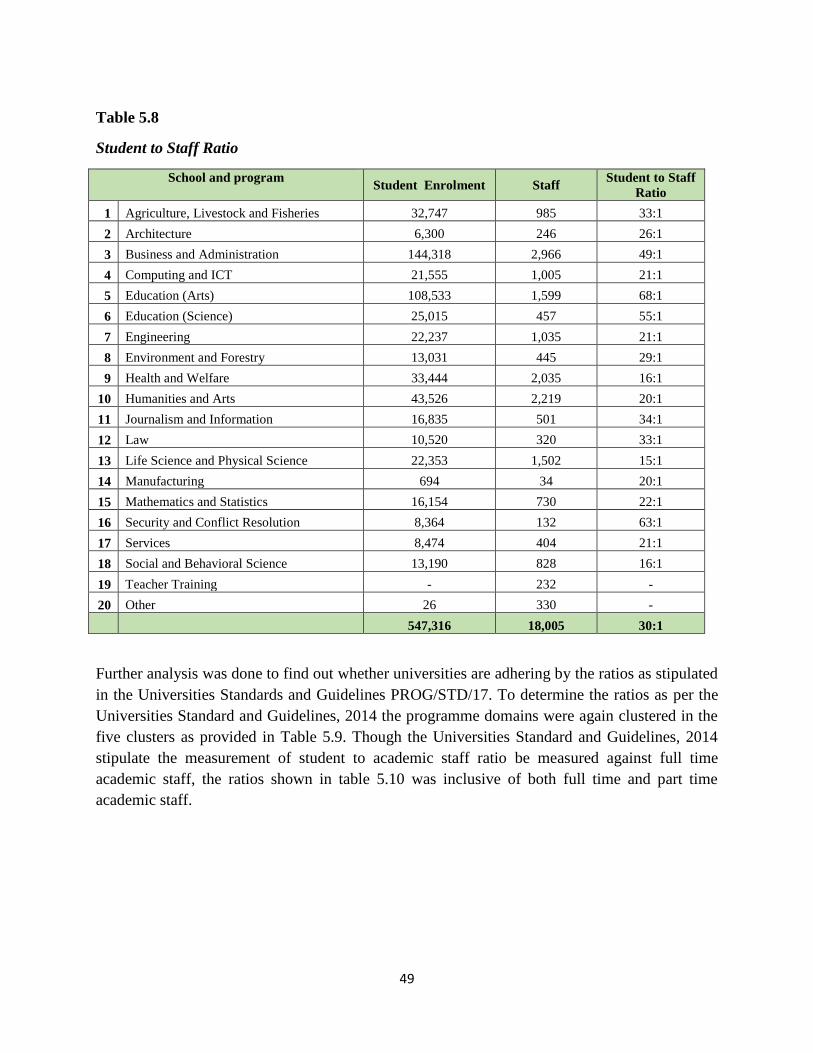
49
Table 5.8
Student to Staff Ratio
School and program
Student Enrolment Staff
Student to Staff
Ratio
1 Agriculture, Livestock and Fisheries 32,747 985 33:1
2 Architecture 6,300 246 26:1
3 Business and Administration 144,318 2,966 49:1
4 Computing and ICT 21,555 1,005 21:1
5 Education (Arts) 108,533 1,599 68:1
6 Education (Science) 25,015 457 55:1
7 Engineering 22,237 1,035 21:1
8 Environment and Forestry 13,031 445 29:1
9 Health and Welfare 33,444 2,035 16:1
10 Humanities and Arts 43,526 2,219 20:1
11 Journalism and Information 16,835 501 34:1
12 Law 10,520 320 33:1
13 Life Science and Physical Science 22,353 1,502 15:1
14 Manufacturing 694 34 20:1
15 Mathematics and Statistics 16,154 730 22:1
16 Security and Conflict Resolution 8,364 132 63:1
17 Services 8,474 404 21:1
18 Social and Behavioral Science 13,190 828 16:1
19 Teacher Training - 232 -
20 Other 26 330 -
547,316 18,005 30:1
Further analysis was done to find out whether universities are adhering by the ratios as stipulated
in the Universities Standards and Guidelines PROG/STD/17. To determine the ratios as per the
Universities Standard and Guidelines, 2014 the programme domains were again clustered in the
five clusters as provided in Table 5.9. Though the Universities Standard and Guidelines, 2014
stipulate the measurement of student to academic staff ratio be measured against full time
academic staff, the ratios shown in table 5.10 was inclusive of both full time and part time
academic staff.
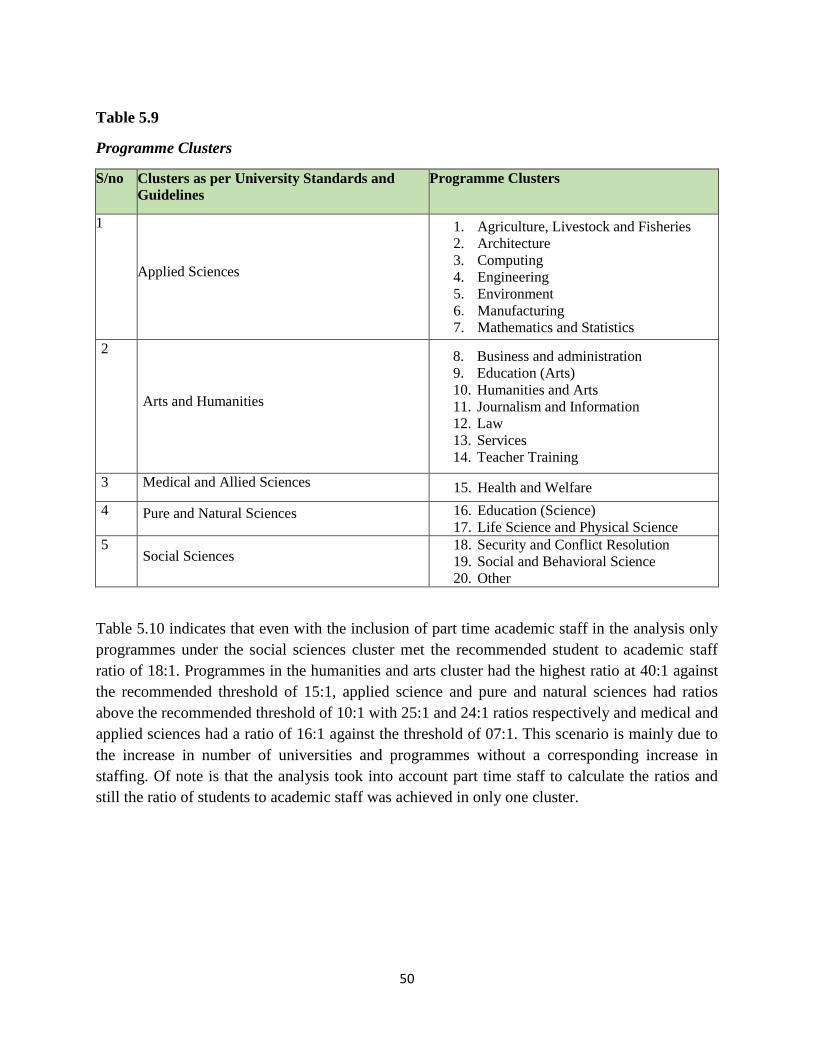
50
Table 5.9
Programme Clusters
S/no Clusters as per University Standards and
Guidelines
Programme Clusters
1
Applied Sciences
1. Agriculture, Livestock and Fisheries
2. Architecture
3. Computing
4. Engineering
5. Environment
6. Manufacturing
7. Mathematics and Statistics
2
Arts and Humanities
8. Business and administration
9. Education (Arts)
10. Humanities and Arts
11. Journalism and Information
12. Law
13. Services
14. Teacher Training
3 Medical and Allied Sciences 15. Health and Welfare
4 Pure and Natural Sciences 16. Education (Science)
17. Life Science and Physical Science
5 Social Sciences
18. Security and Conflict Resolution
19. Social and Behavioral Science
20. Other
Table 5.10 indicates that even with the inclusion of part time academic staff in the analysis only
programmes under the social sciences cluster met the recommended student to academic staff
ratio of 18:1. Programmes in the humanities and arts cluster had the highest ratio at 40:1 against
the recommended threshold of 15:1, applied science and pure and natural sciences had ratios
above the recommended threshold of 10:1 with 25:1 and 24:1 ratios respectively and medical and
applied sciences had a ratio of 16:1 against the threshold of 07:1. This scenario is mainly due to
the increase in number of universities and programmes without a corresponding increase in
staffing. Of note is that the analysis took into account part time staff to calculate the ratios and
still the ratio of students to academic staff was achieved in only one cluster.
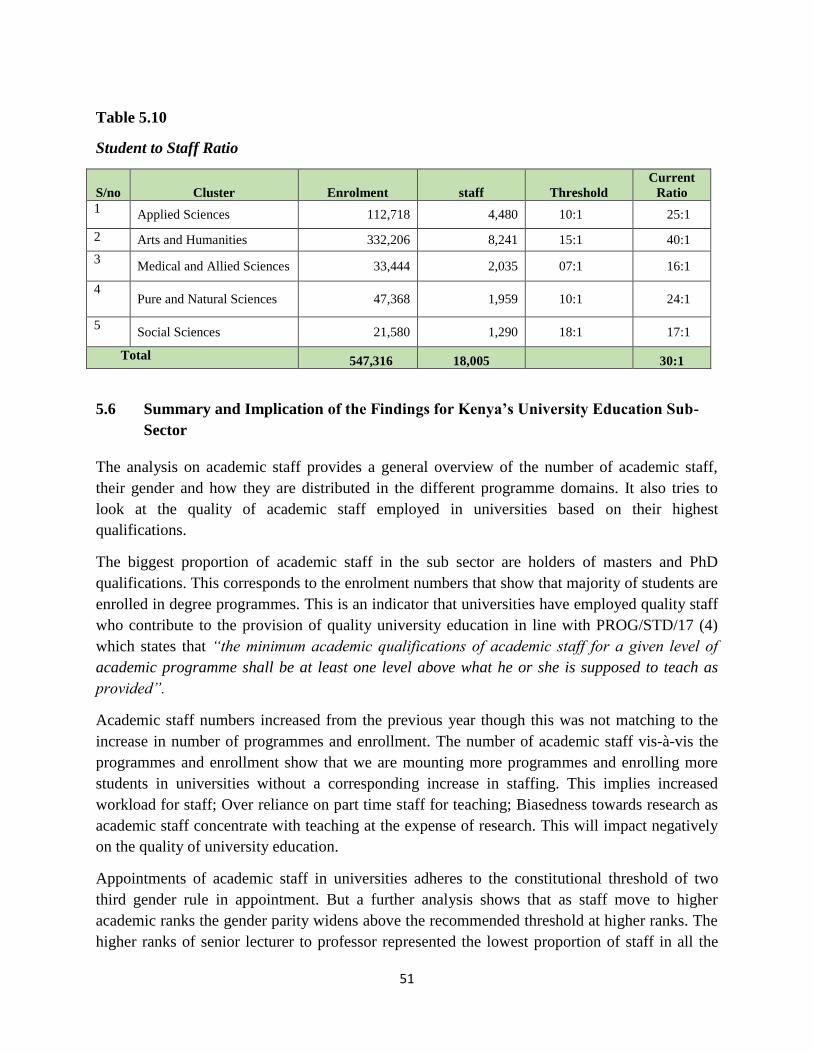
51
Table 5.10
Student to Staff Ratio
S/no Cluster Enrolment staff Threshold
Current
Ratio
1 Applied Sciences 112,718 4,480 10:1 25:1
2 Arts and Humanities 332,206 8,241 15:1 40:1
3 Medical and Allied Sciences 33,444 2,035 07:1 16:1
4 Pure and Natural Sciences 47,368 1,959 10:1 24:1
5 Social Sciences 21,580 1,290 18:1 17:1
Total 547,316 18,005
30:1
5.6 Summary and Implication of the Findings for Kenya’s University Education Sub-
Sector
The analysis on academic staff provides a general overview of the number of academic staff,
their gender and how they are distributed in the different programme domains. It also tries to
look at the quality of academic staff employed in universities based on their highest
qualifications.
The biggest proportion of academic staff in the sub sector are holders of masters and PhD
qualifications. This corresponds to the enrolment numbers that show that majority of students are
enrolled in degree programmes. This is an indicator that universities have employed quality staff
who contribute to the provision of quality university education in line with PROG/STD/17 (4)
which states that “the minimum academic qualifications of academic staff for a given level of
academic programme shall be at least one level above what he or she is supposed to teach as
provided”.
Academic staff numbers increased from the previous year though this was not matching to the
increase in number of programmes and enrollment. The number of academic staff vis-à-vis the
programmes and enrollment show that we are mounting more programmes and enrolling more
students in universities without a corresponding increase in staffing. This implies increased
workload for staff; Over reliance on part time staff for teaching; Biasedness towards research as
academic staff concentrate with teaching at the expense of research. This will impact negatively
on the quality of university education.
Appointments of academic staff in universities adheres to the constitutional threshold of two
third gender rule in appointment. But a further analysis shows that as staff move to higher
academic ranks the gender parity widens above the recommended threshold at higher ranks. The
higher ranks of senior lecturer to professor represented the lowest proportion of staff in all the
52
programme domains. Additionally, the ratio of male to female academic staff in STEM related
programme domains was higher than the national average ratio of 2:1.
Academic staff in the rank of assistant lecturer reduced significantly while those in the rank of
graduate assistant increased significantly. Universities are slowly realigning to the recommended
grading of academic staff in line with Harmonized Criteria and Guidelines for Appointment and
Promotion of Academic Staff as the number of academic staff in the rank of assistant lecturer are
decreasing. Universities are not meeting the recommended student to academic staff ratios of the
different clusters as stipulated in the Universities Standards and Guidelines even with the
inclusion of part time academic staff in the calculations. Only one cluster i.e. social sciences met
the recommended threshold. The high student to academic staff ratios in some clusters even with
the inclusion of part time staff in the analysis will impact negatively on the quality of university
education.
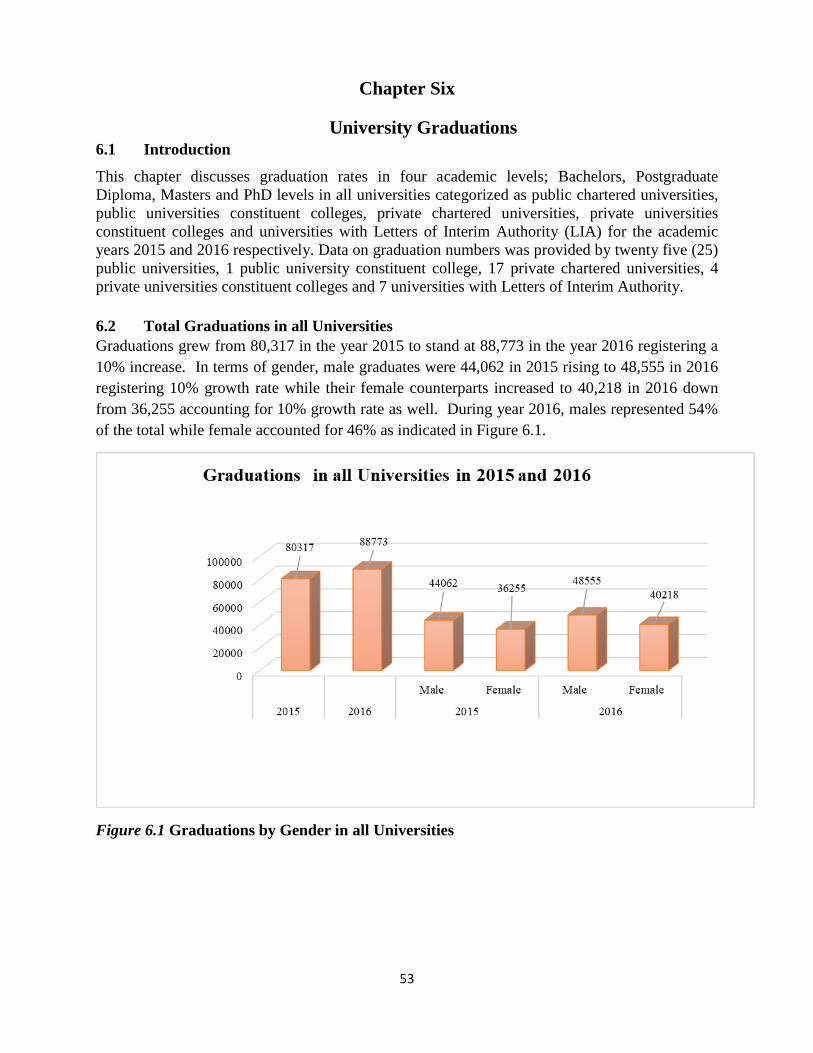
53
Chapter Six
University Graduations
6.1 Introduction
This chapter discusses graduation rates in four academic levels; Bachelors, Postgraduate
Diploma, Masters and PhD levels in all universities categorized as public chartered universities,
public universities constituent colleges, private chartered universities, private universities
constituent colleges and universities with Letters of Interim Authority (LIA) for the academic
years 2015 and 2016 respectively. Data on graduation numbers was provided by twenty five (25)
public universities, 1 public university constituent college, 17 private chartered universities, 4
private universities constituent colleges and 7 universities with Letters of Interim Authority.
6.2 Total Graduations in all Universities
Graduations grew from 80,317 in the year 2015 to stand at 88,773 in the year 2016 registering a
10% increase. In terms of gender, male graduates were 44,062 in 2015 rising to 48,555 in 2016
registering 10% growth rate while their female counterparts increased to 40,218 in 2016 down
from 36,255 accounting for 10% growth rate as well. During year 2016, males represented 54%
of the total while female accounted for 46% as indicated in Figure 6.1.
Figure 6.1 Graduations by Gender in all Universities
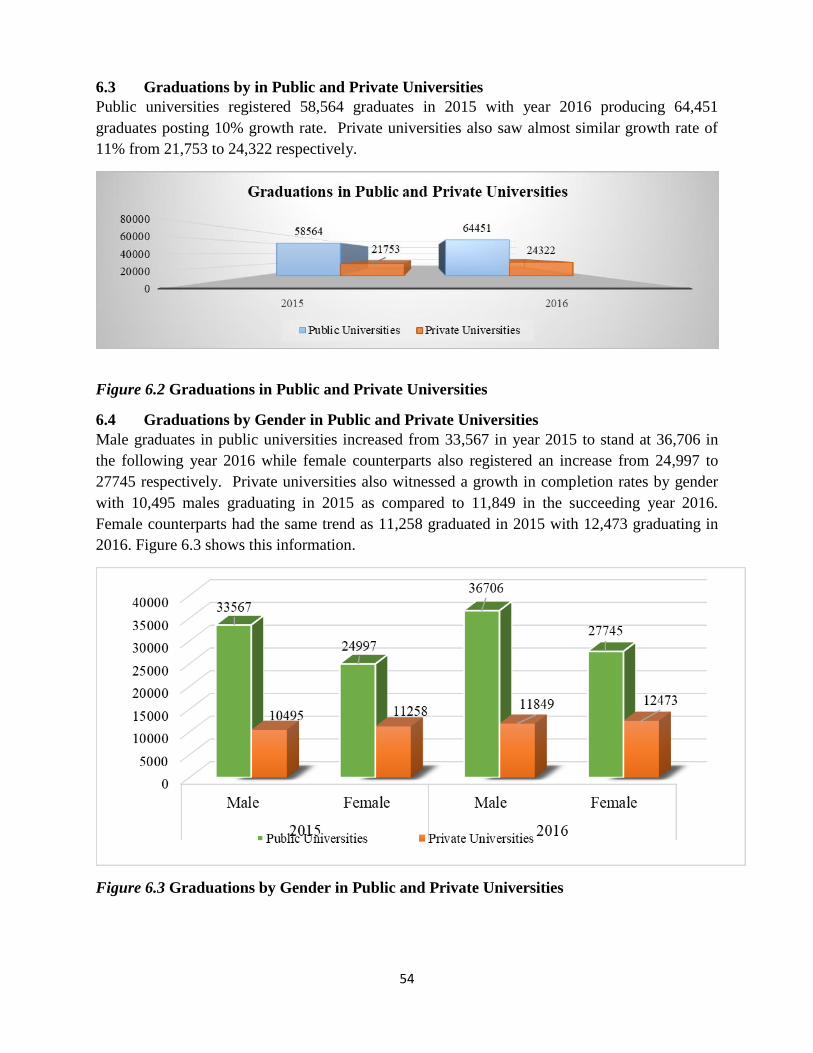
54
6.3 Graduations by in Public and Private Universities
Public universities registered 58,564 graduates in 2015 with year 2016 producing 64,451
graduates posting 10% growth rate. Private universities also saw almost similar growth rate of
11% from 21,753 to 24,322 respectively.
Figure 6.2 Graduations in Public and Private Universities
6.4 Graduations by Gender in Public and Private Universities
Male graduates in public universities increased from 33,567 in year 2015 to stand at 36,706 in
the following year 2016 while female counterparts also registered an increase from 24,997 to
27745 respectively. Private universities also witnessed a growth in completion rates by gender
with 10,495 males graduating in 2015 as compared to 11,849 in the succeeding year 2016.
Female counterparts had the same trend as 11,258 graduated in 2015 with 12,473 graduating in
2016. Figure 6.3 shows this information.
Figure 6.3 Graduations by Gender in Public and Private Universities
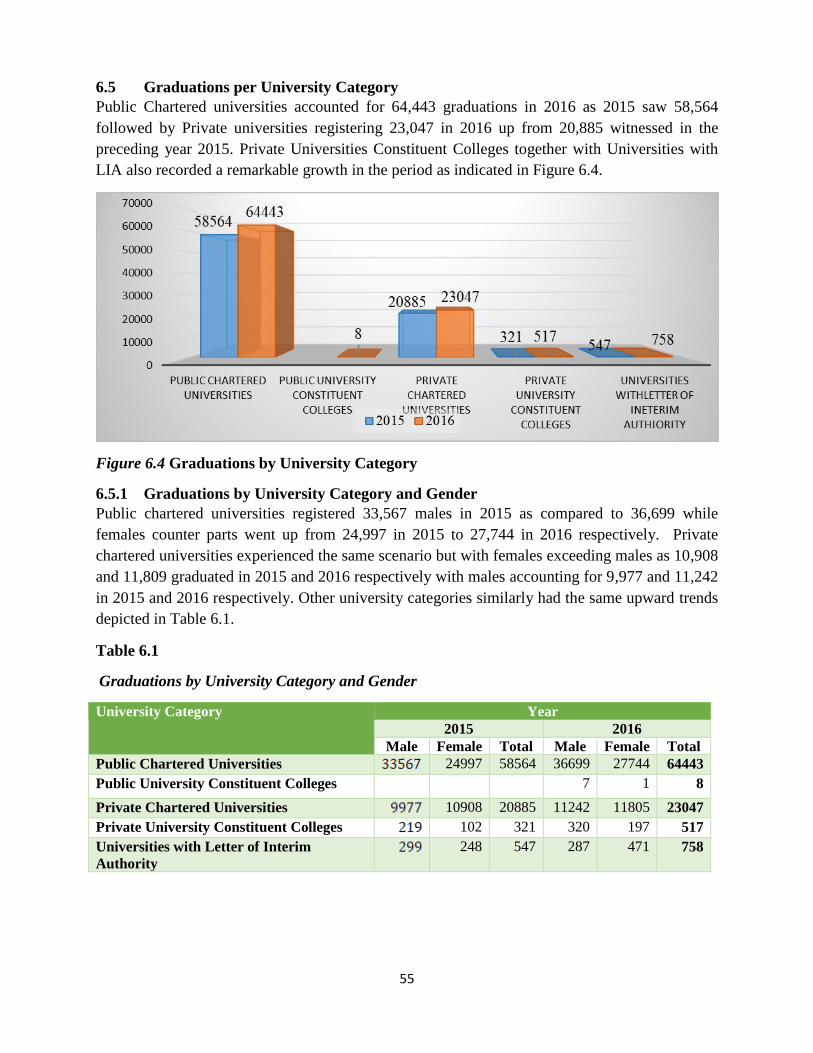
55
6.5 Graduations per University Category
Public Chartered universities accounted for 64,443 graduations in 2016 as 2015 saw 58,564
followed by Private universities registering 23,047 in 2016 up from 20,885 witnessed in the
preceding year 2015. Private Universities Constituent Colleges together with Universities with
LIA also recorded a remarkable growth in the period as indicated in Figure 6.4.
Figure 6.4 Graduations by University Category
6.5.1 Graduations by University Category and Gender
Public chartered universities registered 33,567 males in 2015 as compared to 36,699 while
females counter parts went up from 24,997 in 2015 to 27,744 in 2016 respectively. Private
chartered universities experienced the same scenario but with females exceeding males as 10,908
and 11,809 graduated in 2015 and 2016 respectively with males accounting for 9,977 and 11,242
in 2015 and 2016 respectively. Other university categories similarly had the same upward trends
depicted in Table 6.1.
Table 6.1
Graduations by University Category and Gender
University Category Year
2015 2016
Male Female Total Male Female Total
Public Chartered Universities
24997 58564 36699 27744 64443
Public University Constituent Colleges 7 1 8
Private Chartered Universities
10908 20885 11242 11805 23047
Private University Constituent Colleges
102 321 320 197 517
Universities with Letter of Interim
Authority
248 547 287 471 758
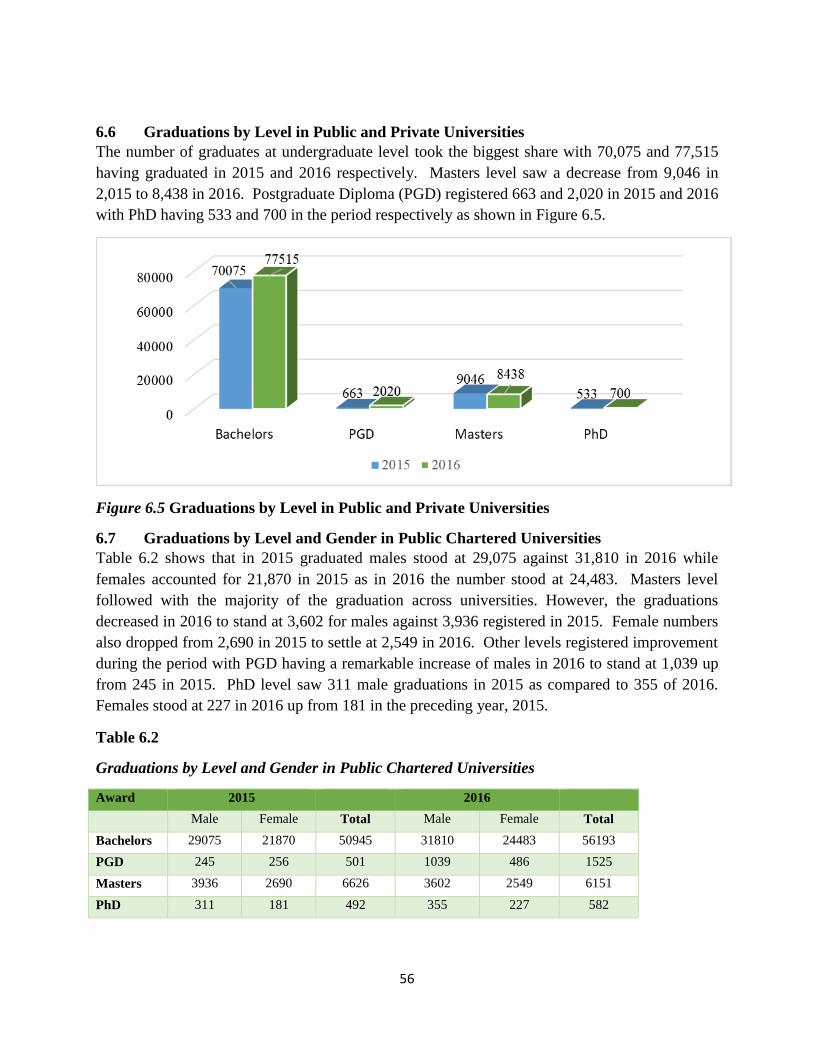
56
6.6 Graduations by Level in Public and Private Universities
The number of graduates at undergraduate level took the biggest share with 70,075 and 77,515
having graduated in 2015 and 2016 respectively. Masters level saw a decrease from 9,046 in
2,015 to 8,438 in 2016. Postgraduate Diploma (PGD) registered 663 and 2,020 in 2015 and 2016
with PhD having 533 and 700 in the period respectively as shown in Figure 6.5.
Figure 6.5 Graduations by Level in Public and Private Universities
6.7 Graduations by Level and Gender in Public Chartered Universities
Table 6.2 shows that in 2015 graduated males stood at 29,075 against 31,810 in 2016 while
females accounted for 21,870 in 2015 as in 2016 the number stood at 24,483. Masters level
followed with the majority of the graduation across universities. However, the graduations
decreased in 2016 to stand at 3,602 for males against 3,936 registered in 2015. Female numbers
also dropped from 2,690 in 2015 to settle at 2,549 in 2016. Other levels registered improvement
during the period with PGD having a remarkable increase of males in 2016 to stand at 1,039 up
from 245 in 2015. PhD level saw 311 male graduations in 2015 as compared to 355 of 2016.
Females stood at 227 in 2016 up from 181 in the preceding year, 2015.
Table 6.2
Graduations by Level and Gender in Public Chartered Universities
Award 2015 2016
Male Female Total Male Female Total
Bachelors 29075 21870 50945 31810 24483 56193
PGD 245 256 501 1039 486 1525
Masters 3936 2690 6626 3602 2549 6151
PhD 311 181 492 355 227 582
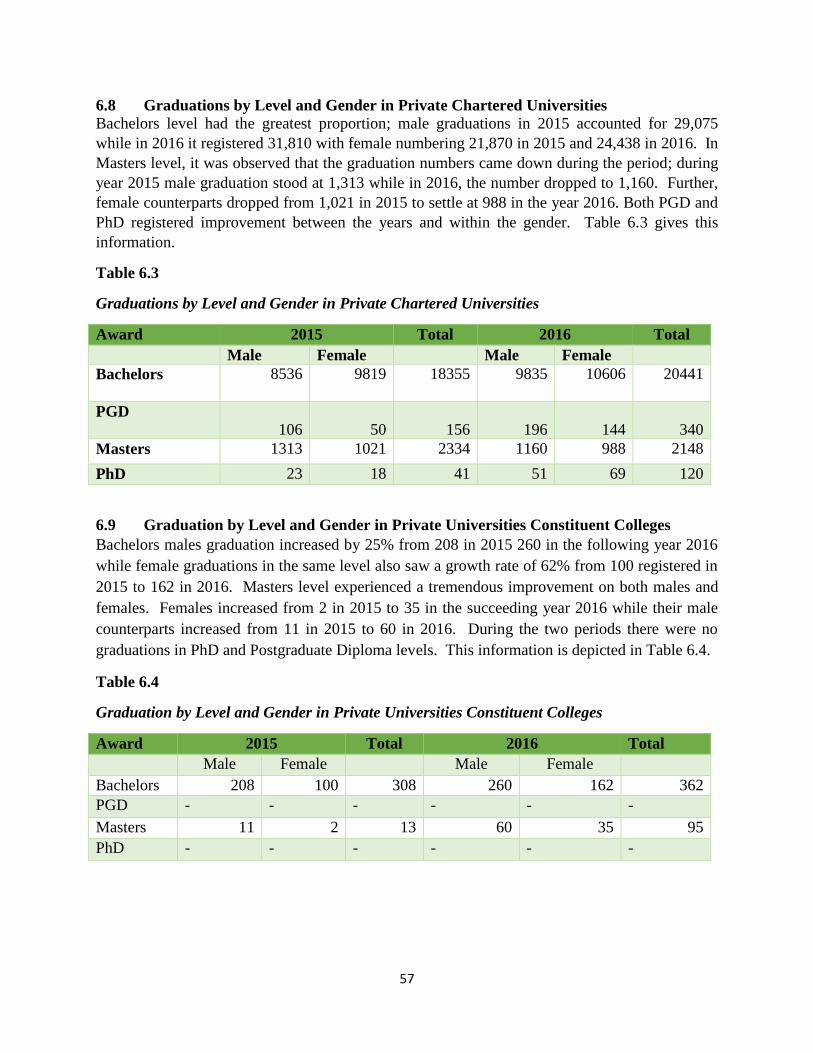
57
6.8 Graduations by Level and Gender in Private Chartered Universities
Bachelors level had the greatest proportion; male graduations in 2015 accounted for 29,075
while in 2016 it registered 31,810 with female numbering 21,870 in 2015 and 24,438 in 2016. In
Masters level, it was observed that the graduation numbers came down during the period; during
year 2015 male graduation stood at 1,313 while in 2016, the number dropped to 1,160. Further,
female counterparts dropped from 1,021 in 2015 to settle at 988 in the year 2016. Both PGD and
PhD registered improvement between the years and within the gender. Table 6.3 gives this
information.
Table 6.3
Graduations by Level and Gender in Private Chartered Universities
Award 2015 Total 2016 Total
Male Female Male Female
Bachelors 8536
9819 18355
9835
10606
20441
PGD
106
50
156
196
144
340
Masters 1313 1021 2334 1160 988 2148
PhD 23 18 41 51 69 120
6.9 Graduation by Level and Gender in Private Universities Constituent Colleges
Bachelors males graduation increased by 25% from 208 in 2015 260 in the following year 2016
while female graduations in the same level also saw a growth rate of 62% from 100 registered in
2015 to 162 in 2016. Masters level experienced a tremendous improvement on both males and
females. Females increased from 2 in 2015 to 35 in the succeeding year 2016 while their male
counterparts increased from 11 in 2015 to 60 in 2016. During the two periods there were no
graduations in PhD and Postgraduate Diploma levels. This information is depicted in Table 6.4.
Table 6.4
Graduation by Level and Gender in Private Universities Constituent Colleges
Award 2015 Total 2016 Total
Male Female Male Female
Bachelors 208 100 308 260 162 362
PGD - - - - - -
Masters 11 2 13 60 35 95
PhD - - - - - -
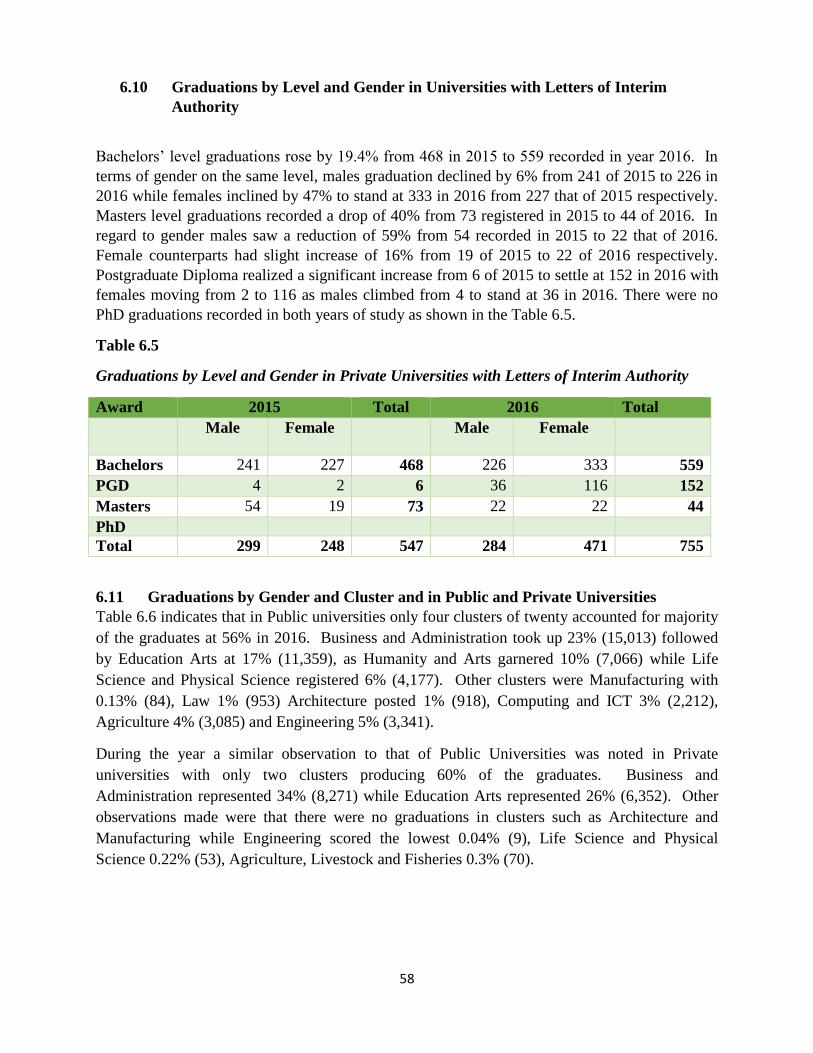
58
6.10 Graduations by Level and Gender in Universities with Letters of Interim
Authority
Bachelors’ level graduations rose by 19.4% from 468 in 2015 to 559 recorded in year 2016. In
terms of gender on the same level, males graduation declined by 6% from 241 of 2015 to 226 in
2016 while females inclined by 47% to stand at 333 in 2016 from 227 that of 2015 respectively.
Masters level graduations recorded a drop of 40% from 73 registered in 2015 to 44 of 2016. In
regard to gender males saw a reduction of 59% from 54 recorded in 2015 to 22 that of 2016.
Female counterparts had slight increase of 16% from 19 of 2015 to 22 of 2016 respectively.
Postgraduate Diploma realized a significant increase from 6 of 2015 to settle at 152 in 2016 with
females moving from 2 to 116 as males climbed from 4 to stand at 36 in 2016. There were no
PhD graduations recorded in both years of study as shown in the Table 6.5.
Table 6.5
Graduations by Level and Gender in Private Universities with Letters of Interim Authority
6.11 Graduations by Gender and Cluster and in Public and Private Universities
Table 6.6 indicates that in Public universities only four clusters of twenty accounted for majority
of the graduates at 56% in 2016. Business and Administration took up 23% (15,013) followed
by Education Arts at 17% (11,359), as Humanity and Arts garnered 10% (7,066) while Life
Science and Physical Science registered 6% (4,177). Other clusters were Manufacturing with
0.13% (84), Law 1% (953) Architecture posted 1% (918), Computing and ICT 3% (2,212),
Agriculture 4% (3,085) and Engineering 5% (3,341).
During the year a similar observation to that of Public Universities was noted in Private
universities with only two clusters producing 60% of the graduates. Business and
Administration represented 34% (8,271) while Education Arts represented 26% (6,352). Other
observations made were that there were no graduations in clusters such as Architecture and
Manufacturing while Engineering scored the lowest 0.04% (9), Life Science and Physical
Science 0.22% (53), Agriculture, Livestock and Fisheries 0.3% (70).
Award 2015 Total 2016 Total
Male Female Male Female
Bachelors 241 227 468 226 333 559
PGD 4 2 6 36 116 152
Masters 54 19 73 22 22 44
PhD
Total 299 248 547 284 471 755
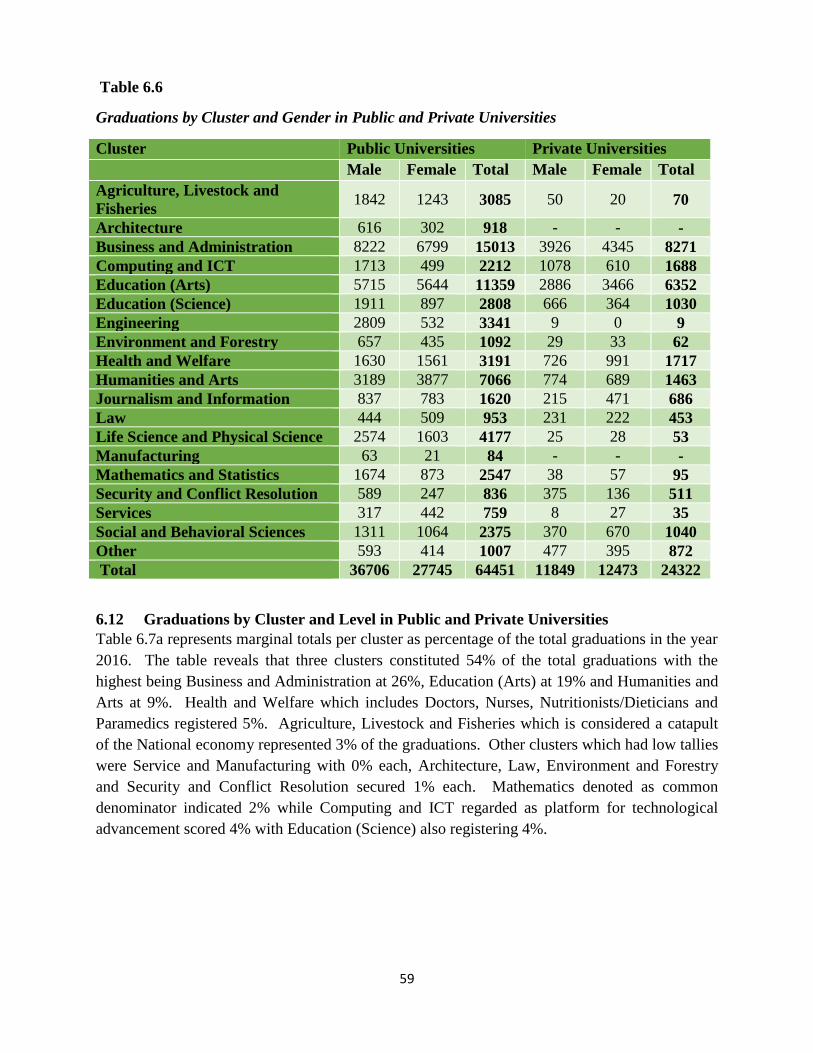
59
Table 6.6
Graduations by Cluster and Gender in Public and Private Universities
Cluster Public Universities Private Universities
Male Female Total Male Female Total
Agriculture, Livestock and
Fisheries 1842 1243 3085 50 20 70
Architecture 616 302 918 - - -
Business and Administration 8222 6799 15013 3926 4345 8271
Computing and ICT 1713 499 2212 1078 610 1688
Education (Arts) 5715 5644 11359 2886 3466 6352
Education (Science) 1911 897 2808 666 364 1030
Engineering 2809 532 3341 9 0 9
Environment and Forestry 657 435 1092 29 33 62
Health and Welfare 1630 1561 3191 726 991 1717
Humanities and Arts 3189 3877 7066 774 689 1463
Journalism and Information 837 783 1620 215 471 686
Law 444 509 953 231 222 453
Life Science and Physical Science 2574 1603 4177 25 28 53
Manufacturing 63 21 84 - - -
Mathematics and Statistics 1674 873 2547 38 57 95
Security and Conflict Resolution 589 247 836 375 136 511
Services 317 442 759 8 27 35
Social and Behavioral Sciences 1311 1064 2375 370 670 1040
Other 593 414 1007 477 395 872
Total 36706 27745 64451 11849 12473 24322
6.12 Graduations by Cluster and Level in Public and Private Universities
Table 6.7a represents marginal totals per cluster as percentage of the total graduations in the year
2016. The table reveals that three clusters constituted 54% of the total graduations with the
highest being Business and Administration at 26%, Education (Arts) at 19% and Humanities and
Arts at 9%. Health and Welfare which includes Doctors, Nurses, Nutritionists/Dieticians and
Paramedics registered 5%. Agriculture, Livestock and Fisheries which is considered a catapult
of the National economy represented 3% of the graduations. Other clusters which had low tallies
were Service and Manufacturing with 0% each, Architecture, Law, Environment and Forestry
and Security and Conflict Resolution secured 1% each. Mathematics denoted as common
denominator indicated 2% while Computing and ICT regarded as platform for technological
advancement scored 4% with Education (Science) also registering 4%.
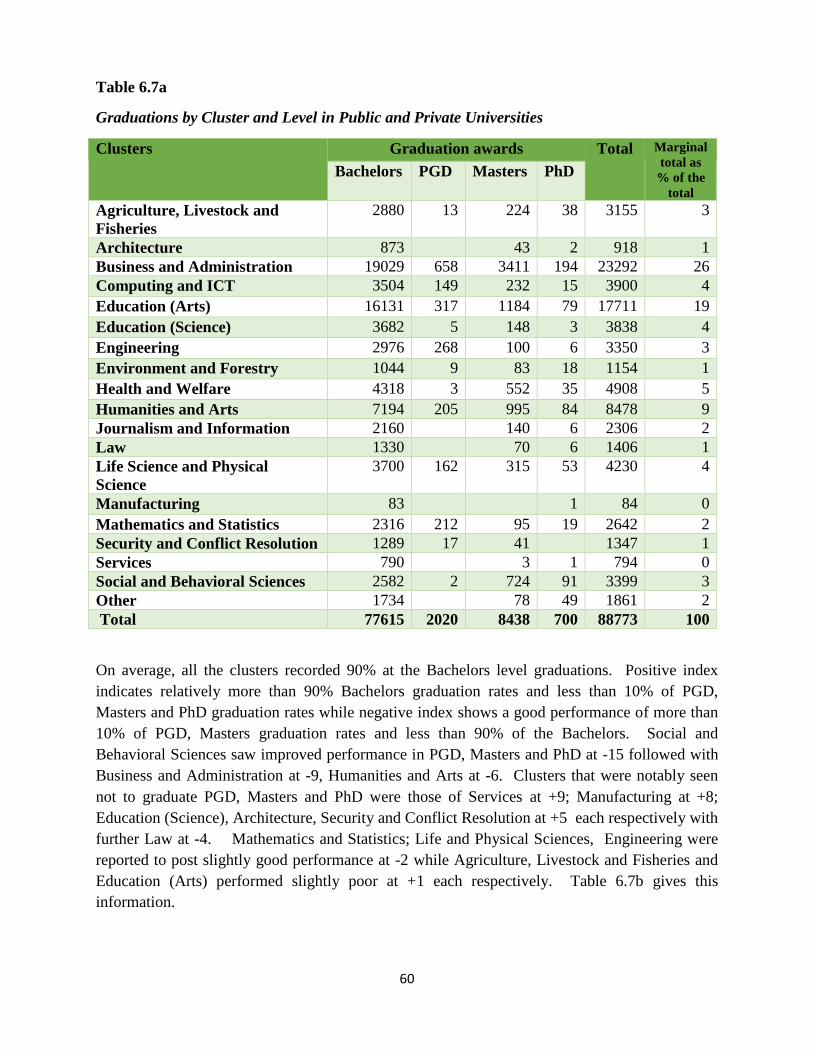
60
Table 6.7a
Graduations by Cluster and Level in Public and Private Universities
Clusters Graduation awards Total Marginal
total as
% of the
total
Bachelors PGD Masters PhD
Agriculture, Livestock and
Fisheries
2880 13 224 38 3155 3
Architecture 873 43 2 918 1
Business and Administration 19029 658 3411 194 23292 26
Computing and ICT 3504 149 232 15 3900 4
Education (Arts) 16131 317 1184 79 17711 19
Education (Science) 3682 5 148 3 3838 4
Engineering 2976 268 100 6 3350 3
Environment and Forestry 1044 9 83 18 1154 1
Health and Welfare 4318 3 552 35 4908 5
Humanities and Arts 7194 205 995 84 8478 9
Journalism and Information 2160 140 6 2306 2
Law 1330 70 6 1406 1
Life Science and Physical
Science
3700 162 315 53 4230 4
Manufacturing 83 1 84 0
Mathematics and Statistics 2316 212 95 19 2642 2
Security and Conflict Resolution 1289 17 41 1347 1
Services 790 3 1 794 0
Social and Behavioral Sciences 2582 2 724 91 3399 3
Other 1734 78 49 1861 2
Total 77615 2020 8438 700 88773 100
On average, all the clusters recorded 90% at the Bachelors level graduations. Positive index
indicates relatively more than 90% Bachelors graduation rates and less than 10% of PGD,
Masters and PhD graduation rates while negative index shows a good performance of more than
10% of PGD, Masters graduation rates and less than 90% of the Bachelors. Social and
Behavioral Sciences saw improved performance in PGD, Masters and PhD at -15 followed with
Business and Administration at -9, Humanities and Arts at -6. Clusters that were notably seen
not to graduate PGD, Masters and PhD were those of Services at +9; Manufacturing at +8;
Education (Science), Architecture, Security and Conflict Resolution at +5 each respectively with
further Law at -4. Mathematics and Statistics; Life and Physical Sciences, Engineering were
reported to post slightly good performance at -2 while Agriculture, Livestock and Fisheries and
Education (Arts) performed slightly poor at +1 each respectively. Table 6.7b gives this
information.
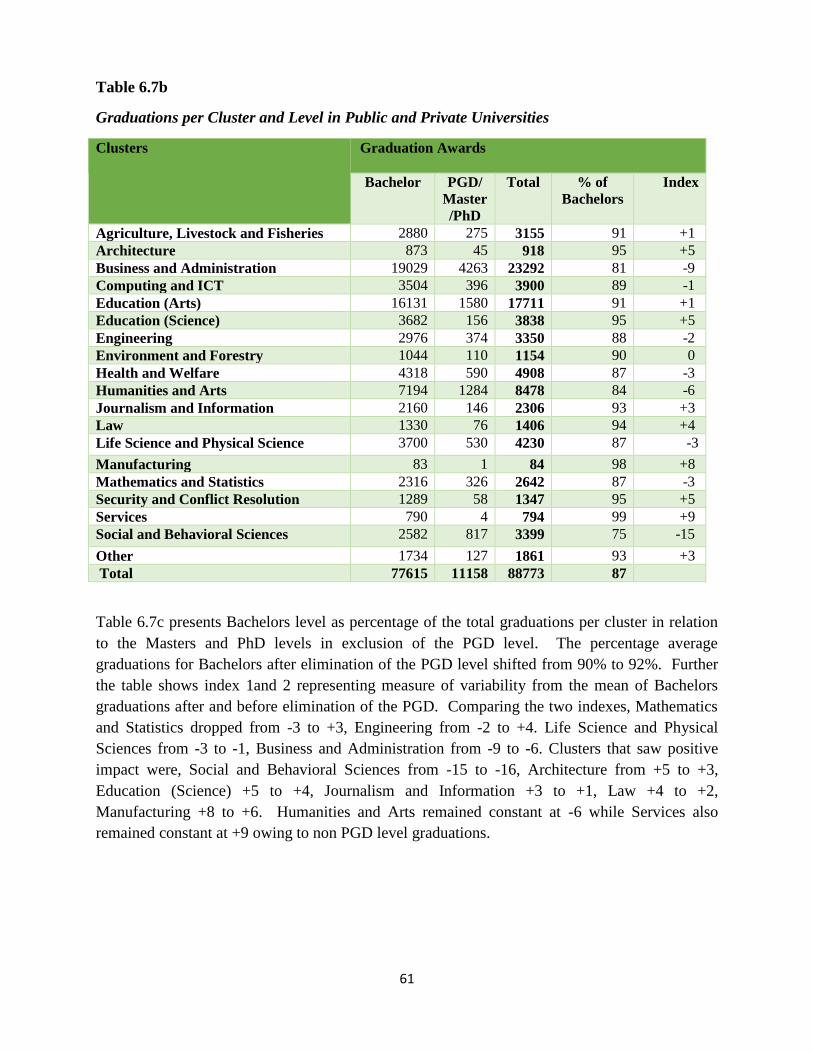
61
Table 6.7b
Graduations per Cluster and Level in Public and Private Universities
Clusters Graduation Awards
Bachelor PGD/
Master
/PhD
Total % of
Bachelors
Index
Agriculture, Livestock and Fisheries 2880 275 3155 91 +1
Architecture 873 45 918 95 +5
Business and Administration 19029 4263 23292 81 -9
Computing and ICT 3504 396 3900 89 -1
Education (Arts) 16131 1580 17711 91 +1
Education (Science) 3682 156 3838 95 +5
Engineering 2976 374 3350 88 -2
Environment and Forestry 1044 110 1154 90 0
Health and Welfare 4318 590 4908 87 -3
Humanities and Arts 7194 1284 8478 84 -6
Journalism and Information 2160 146 2306 93 +3
Law 1330 76 1406 94 +4
Life Science and Physical Science 3700 530 4230 87 -3
Manufacturing 83 1 84 98 +8
Mathematics and Statistics 2316 326 2642 87 -3
Security and Conflict Resolution 1289 58 1347 95 +5
Services 790 4 794 99 +9
Social and Behavioral Sciences 2582 817 3399 75 -15
Other 1734 127 1861 93 +3
Total 77615 11158 88773 87
Table 6.7c presents Bachelors level as percentage of the total graduations per cluster in relation
to the Masters and PhD levels in exclusion of the PGD level. The percentage average
graduations for Bachelors after elimination of the PGD level shifted from 90% to 92%. Further
the table shows index 1and 2 representing measure of variability from the mean of Bachelors
graduations after and before elimination of the PGD. Comparing the two indexes, Mathematics
and Statistics dropped from -3 to +3, Engineering from -2 to +4. Life Science and Physical
Sciences from -3 to -1, Business and Administration from -9 to -6. Clusters that saw positive
impact were, Social and Behavioral Sciences from -15 to -16, Architecture from +5 to +3,
Education (Science) +5 to +4, Journalism and Information +3 to +1, Law +4 to +2,
Manufacturing +8 to +6. Humanities and Arts remained constant at -6 while Services also
remained constant at +9 owing to non PGD level graduations.
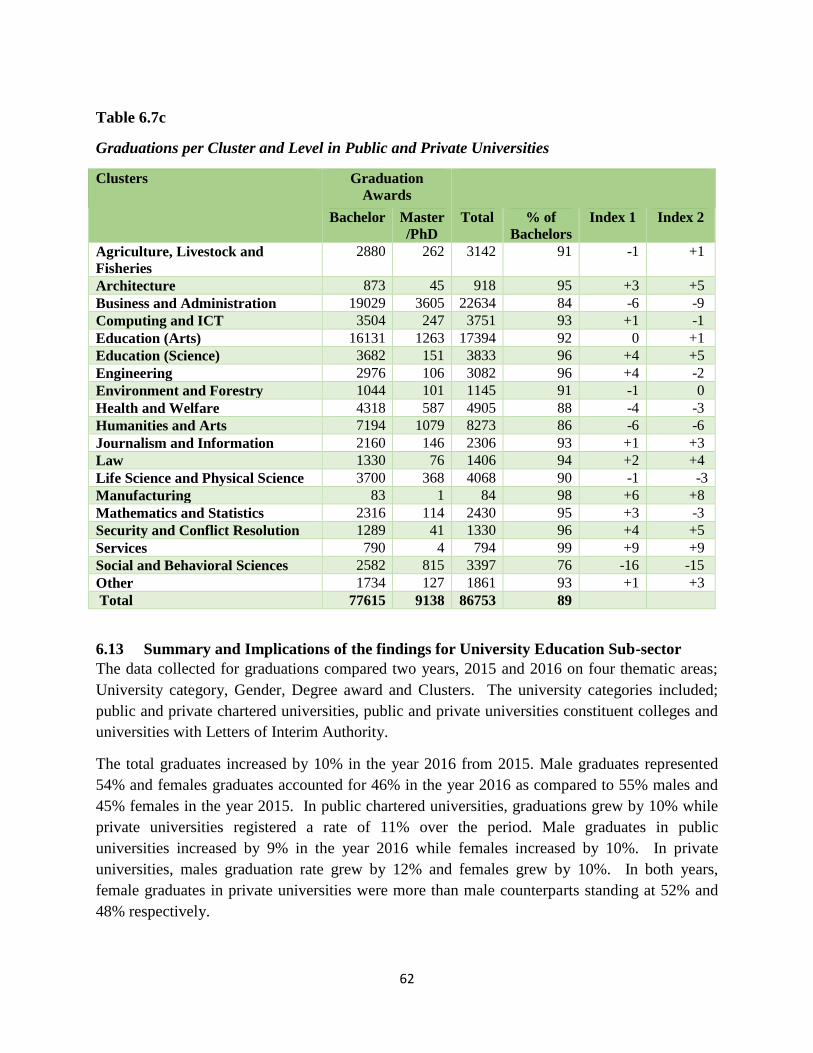
62
Table 6.7c
Graduations per Cluster and Level in Public and Private Universities
Clusters Graduation
Awards
Bachelor Master
/PhD
Total % of
Bachelors
Index 1 Index 2
Agriculture, Livestock and
Fisheries
2880 262 3142 91 -1 +1
Architecture 873 45 918 95 +3 +5
Business and Administration 19029 3605 22634 84 -6 -9
Computing and ICT 3504 247 3751 93 +1 -1
Education (Arts) 16131 1263 17394 92 0 +1
Education (Science) 3682 151 3833 96 +4 +5
Engineering 2976 106 3082 96 +4 -2
Environment and Forestry 1044 101 1145 91 -1 0
Health and Welfare 4318 587 4905 88 -4 -3
Humanities and Arts 7194 1079 8273 86 -6 -6
Journalism and Information 2160 146 2306 93 +1 +3
Law 1330 76 1406 94 +2 +4
Life Science and Physical Science 3700 368 4068 90 -1 -3
Manufacturing 83 1 84 98 +6 +8
Mathematics and Statistics 2316 114 2430 95 +3 -3
Security and Conflict Resolution 1289 41 1330 96 +4 +5
Services 790 4 794 99 +9 +9
Social and Behavioral Sciences 2582 815 3397 76 -16 -15
Other 1734 127 1861 93 +1 +3
Total 77615 9138 86753 89
6.13 Summary and Implications of the findings for University Education Sub-sector
The data collected for graduations compared two years, 2015 and 2016 on four thematic areas;
University category, Gender, Degree award and Clusters. The university categories included;
public and private chartered universities, public and private universities constituent colleges and
universities with Letters of Interim Authority.
The total graduates increased by 10% in the year 2016 from 2015. Male graduates represented
54% and females graduates accounted for 46% in the year 2016 as compared to 55% males and
45% females in the year 2015. In public chartered universities, graduations grew by 10% while
private universities registered a rate of 11% over the period. Male graduates in public
universities increased by 9% in the year 2016 while females increased by 10%. In private
universities, males graduation rate grew by 12% and females grew by 10%. In both years,
female graduates in private universities were more than male counterparts standing at 52% and
48% respectively.
63
In respect to total graduations by level, Bachelors remained highest at 87% in both years while
Masters level registered 11% in 2015 with 9% graduating in 2016, a decrease of 6%. PhDs saw
31% growth from 2015 to 2016.
In regard to graduations by gender and level, both categories registered an increase in the period
of 10% and 11% respectively. On Masters level both male and females decreased by 8% and 3%
respectively. Although PGD and PhD recorded low rates of graduations, they both reported an
increase between the genders over the period.
Garissa University College, the only constituent college at the time, reported an improvement in
graduations by gender posting 10% and 11% growth rates of males and females respectively.
Masters graduations were adversely affected with males recording 8% and females 5%
respectively. Postgraduate Diploma and PhD levels trended upwards during the period on both
categories of gender.
Private chartered Universities also witnessed growth with majority at Bachelors level for both
male and female at 11% and 8% respectively. Masters level indicated downwards trend for both
males and females reporting 11% and 3% respectively while PGD and PhD levels posted an
increase.
Private universities constituent colleges held graduations on Bachelors and Masters levels only
where both of the levels registered growth on both males and females. Universities with Letters
of Interim Authority had 38% growth rate in graduations from 2015 to 2016.
Comparing graduations rates per cluster between public and private universities in the year 2016
and year 2015, it indicates that Art based clusters produced majority of the graduates. Business
and Administration, Education Arts, Humanity and Arts accounted for 50% in public universities
and 66% in private universities. The envisaged critical clusters towards realization of Vision
2030 mainly, Mathematics and Statistics, Manufacturing, Architecture, Computing and ICT,
Engineering and Agriculture, Livestock and Fisheries, reported 17% of the total graduations in
public universities while the contribution of private universities was at 6%.
The study involved 54 public and private universities. Irrespective of being public or private, all
universities have the same core functions-teaching, research, and community service. Further
private universities are fulfilling a very essential need by providing access to qualified students
as the spaces at the nation’s public universities are inadequate to meet the requirement of a
rapidly increasing student population.
Education is one of the fundamental rights of individuals. It is a critical factor for any nation’s
development and has always played and continues to play a significant role as change agent. This
explains why a sizable percentage of the resources is invested in the educational sector and a
number of global declarations affirm the right of humans to education.
64
According to World Economic Forum (2014) there was clearly a values-based case for gender
equality: women are one half of the world’s population and deserve equal access to health,
education, economic participation and earning potential and political decision-making power.
Ultimately, gender equality is fundamental to whether and how societies thrive. The Constitution
of Kenya (2010) guarantees the right to equality for both men and women by providing thresh
hold of one third to either sex in the country. The study revealed that the envisaged thresh hold
was attained on the total graduations while it was observed that in private universities female
graduates in both years exceeded male counterparts. Lowering cut off admissions points
influenced the increase in enrolment for female students and hence graduations especially in
public universities (JAB 2002/2003) report.
The study indicated that the PhD graduates were significantly low as compared to the required
numbers for sustainable national development. Sessional paper No. 14 of 2012 points out that to
achieve the desired student-faculty ratio of 1:40, it has been estimated that the number of
additional PhDs required by universities in order to meet the stated GER of 10% (approximately
600,000 students) within 10 years by 2022 universities would collectively need to graduate an
average of 2400 PhDs annually for the next five years. The target of 2400 PhDs annually may
remain a dream as the trend shows that less than 400 graduate yearly while masters graduates
who are potential PhDs holders registered a downwards trend the study revealed.
Nationally, the need for an increase in degrees awarded in areas of Science, Technology,
Engineering and Mathematics (STEM) continues to suffer. While there are graduations in
STEM degree programmes, it does not commensurate with the workforce demand. In addition,
to the concern in STEM programmes, inadequate females graduating in STEM programmes
aggravates the situation. The results of the study resonates with the fact that private universities
almost in their entirety do not train in STEM programmes as majority have put their focus in
Arts programmes a potential detriment towards achieving Vision 2030 aspirations.
65
Chapter Seven
Universities Income and Expenditure
7.1 Introduction
The growth of higher education sector in Kenya has been encouraged by increasing resource
allocation and provision of incentives for investment and participation in developing skills
training in the country. Higher education has experienced tremendous growth leading to
increased demand for resources to the sector to improve and sustain quality education. This has
put strain on resources provided for the sector. There is need for sustainable mechanisms to be
put in place to ensure higher education continues to play a vital role in social-economic
development. Currently, public institutions receive most funding from Government which is no
longer adequate as they face stiff competition from other sectors for the limited government
financial resources. Hence, Universities diversified sources of income as well as ensured more
efficient and cost effective use of resource. This led to universities introducing a dual track
tuition policy known as the privately sponsored student programme (PSSP) or Module II
programme where students meet the full cost of university education without government
subsidy.
The Government has developed policies and strategies to guide the financing of higher education
in Kenya among them: the Kinyanjui Report (2007); Public Universities Inspection Board Report
on Transformation of Higher Education & Training in Kenya: Securing Kenya’s Development in
the Knowledge Economy (2006); the Wandiga Report on the National Strategy for University
Education 2007-2015; the Taskforce Report on Aligning Education and Training to the
Constitution of Kenya (2010) and Kenya Vision 2030 and Beyond (2012); the Universities Act
of 2012 (revised 2016); Sessional Paper No. 14 of 2012; and Sessional Paper No. 2 of 2015 on
Reforming Education and Training Sectors in Kenya. The Differentiated Unit Cost (DUC) was
introduced as a basis of financing higher education in Kenya and Universities Funding Board
(UFB) established with the mandate to develop the detailed institutional funding criteria and
disbursing of government funding. Other legislative frameworks in place include the
Constitution of Kenya 2010, Chapter 12; Public Finance Management Act 2012; Public Finance
Management Regulations 2015; and International Public Sector Accounting Standards (IPSAS).
In 2016, the Government sponsored the first batch of students to Private Universities and 30
private Universities received government capitation.
This chapter discusses incomes and expenditures of universities in Kenya for a period of three
years (2014-2016) based on the budget cycle. The analysis covered 35 public Universities, 21
private universities and 13 universities with Letter of Interim Authority and, gives the main
sources of income received by Universities and their expenditures. The income streams are
classified into four namely: government capitation, student fees, research grants and other
incomes, while the expenditure items are classified into 4 namely: staff costs, capital
development, maintenance and other expenses. Finally, a comparison of the income and
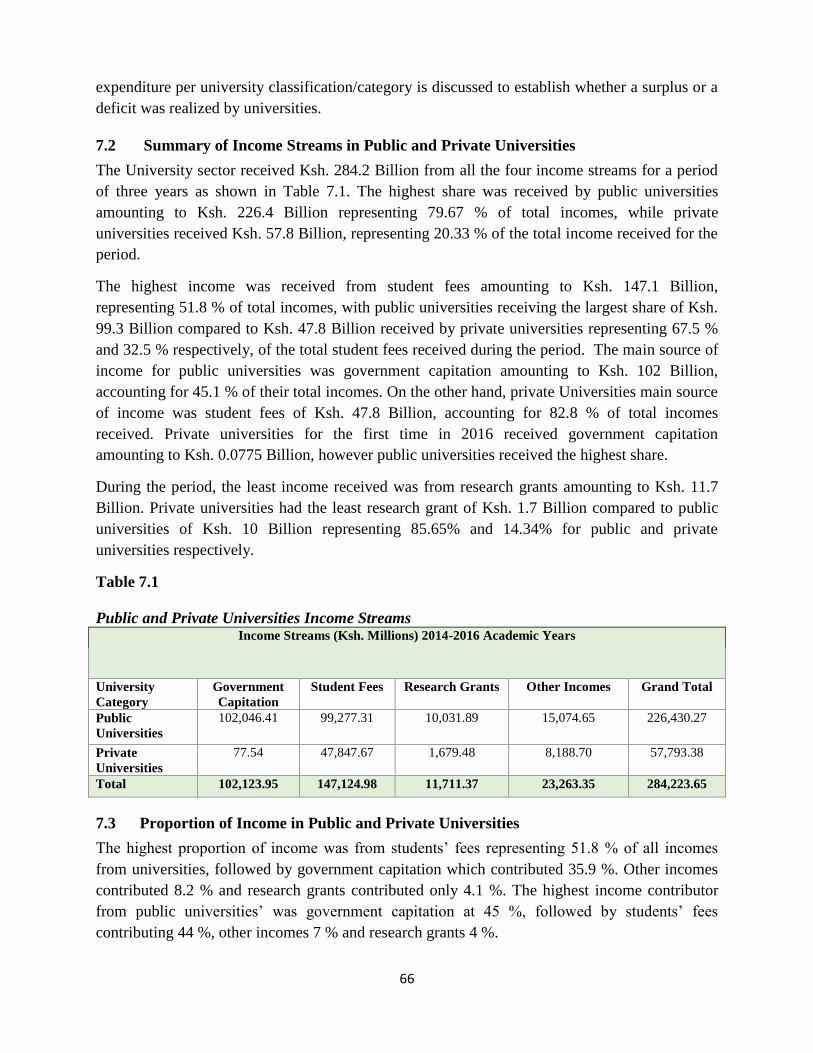
66
expenditure per university classification/category is discussed to establish whether a surplus or a
deficit was realized by universities.
7.2 Summary of Income Streams in Public and Private Universities
The University sector received Ksh. 284.2 Billion from all the four income streams for a period
of three years as shown in Table 7.1. The highest share was received by public universities
amounting to Ksh. 226.4 Billion representing 79.67 % of total incomes, while private
universities received Ksh. 57.8 Billion, representing 20.33 % of the total income received for the
period.
The highest income was received from student fees amounting to Ksh. 147.1 Billion,
representing 51.8 % of total incomes, with public universities receiving the largest share of Ksh.
99.3 Billion compared to Ksh. 47.8 Billion received by private universities representing 67.5 %
and 32.5 % respectively, of the total student fees received during the period. The main source of
income for public universities was government capitation amounting to Ksh. 102 Billion,
accounting for 45.1 % of their total incomes. On the other hand, private Universities main source
of income was student fees of Ksh. 47.8 Billion, accounting for 82.8 % of total incomes
received. Private universities for the first time in 2016 received government capitation
amounting to Ksh. 0.0775 Billion, however public universities received the highest share.
During the period, the least income received was from research grants amounting to Ksh. 11.7
Billion. Private universities had the least research grant of Ksh. 1.7 Billion compared to public
universities of Ksh. 10 Billion representing 85.65% and 14.34% for public and private
universities respectively.
Table 7.1
Public and Private Universities Income Streams
Income Streams (Ksh. Millions) 2014-2016 Academic Years
University
Category
Government
Capitation
Student Fees Research Grants Other Incomes Grand Total
Public
Universities
102,046.41 99,277.31 10,031.89 15,074.65 226,430.27
Private
Universities
77.54 47,847.67 1,679.48 8,188.70 57,793.38
Total 102,123.95 147,124.98 11,711.37 23,263.35 284,223.65
7.3 Proportion of Income in Public and Private Universities
The highest proportion of income was from students’ fees representing 51.8 % of all incomes
from universities, followed by government capitation which contributed 35.9 %. Other incomes
contributed 8.2 % and research grants contributed only 4.1 %. The highest income contributor
from public universities’ was government capitation at 45 %, followed by students’ fees
contributing 44 %, other incomes 7 % and research grants 4 %.
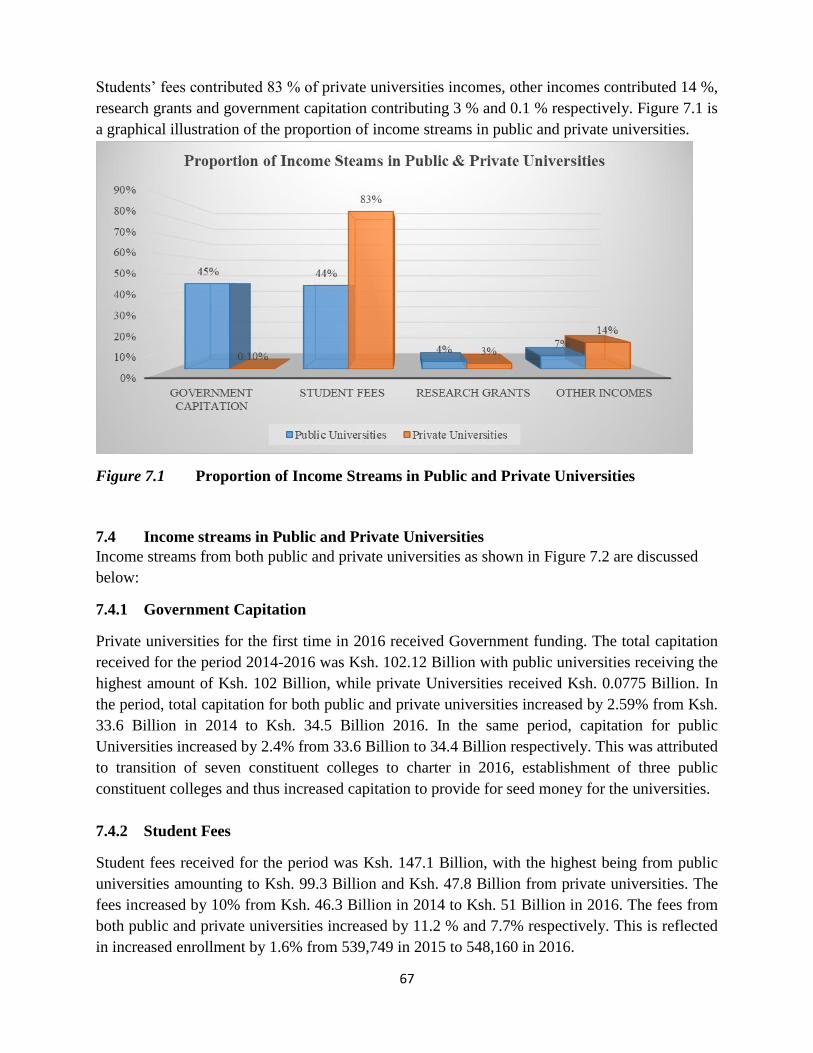
67
Students’ fees contributed 83 % of private universities incomes, other incomes contributed 14 %,
research grants and government capitation contributing 3 % and 0.1 % respectively. Figure 7.1 is
a graphical illustration of the proportion of income streams in public and private universities.
Figure 7.1 Proportion of Income Streams in Public and Private Universities
7.4 Income streams in Public and Private Universities
Income streams from both public and private universities as shown in Figure 7.2 are discussed
below:
7.4.1 Government Capitation
Private universities for the first time in 2016 received Government funding. The total capitation
received for the period 2014-2016 was Ksh. 102.12 Billion with public universities receiving the
highest amount of Ksh. 102 Billion, while private Universities received Ksh. 0.0775 Billion. In
the period, total capitation for both public and private universities increased by 2.59% from Ksh.
33.6 Billion in 2014 to Ksh. 34.5 Billion 2016. In the same period, capitation for public
Universities increased by 2.4% from 33.6 Billion to 34.4 Billion respectively. This was attributed
to transition of seven constituent colleges to charter in 2016, establishment of three public
constituent colleges and thus increased capitation to provide for seed money for the universities.
7.4.2 Student Fees
Student fees received for the period was Ksh. 147.1 Billion, with the highest being from public
universities amounting to Ksh. 99.3 Billion and Ksh. 47.8 Billion from private universities. The
fees increased by 10% from Ksh. 46.3 Billion in 2014 to Ksh. 51 Billion in 2016. The fees from
both public and private universities increased by 11.2 % and 7.7% respectively. This is reflected
in increased enrollment by 1.6% from 539,749 in 2015 to 548,160 in 2016.
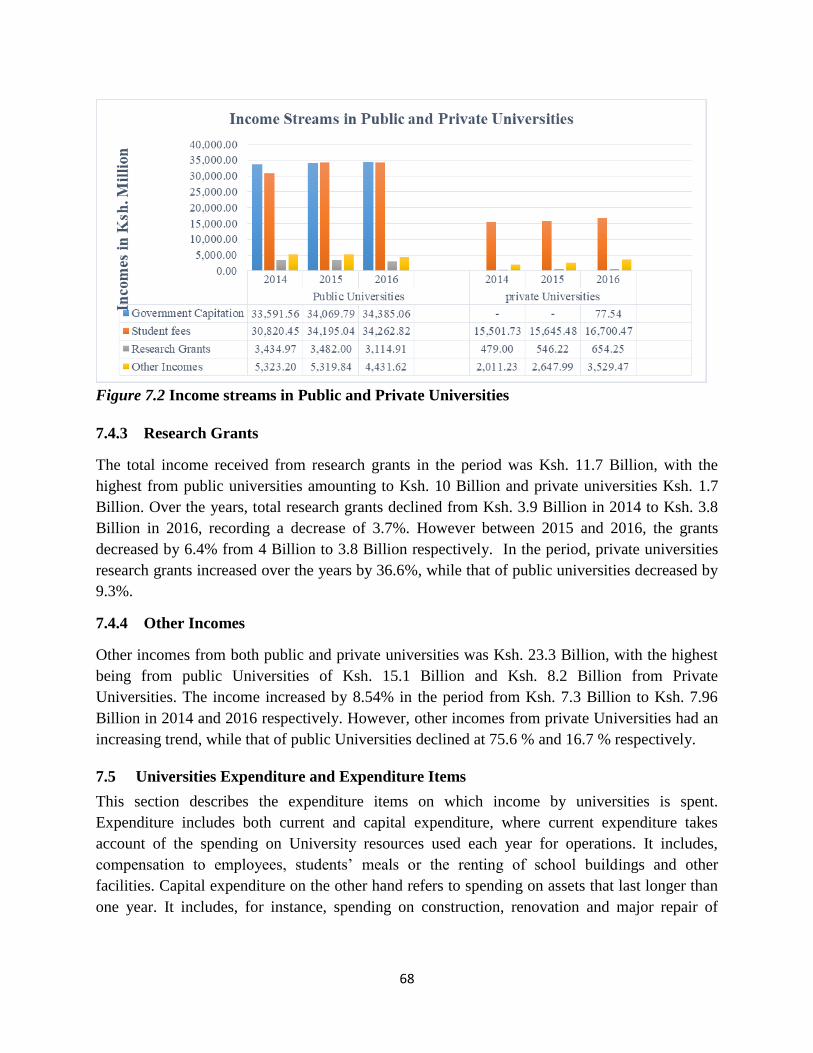
68
Figure 7.2 Income streams in Public and Private Universities
7.4.3 Research Grants
The total income received from research grants in the period was Ksh. 11.7 Billion, with the
highest from public universities amounting to Ksh. 10 Billion and private universities Ksh. 1.7
Billion. Over the years, total research grants declined from Ksh. 3.9 Billion in 2014 to Ksh. 3.8
Billion in 2016, recording a decrease of 3.7%. However between 2015 and 2016, the grants
decreased by 6.4% from 4 Billion to 3.8 Billion respectively. In the period, private universities
research grants increased over the years by 36.6%, while that of public universities decreased by
9.3%.
7.4.4 Other Incomes
Other incomes from both public and private universities was Ksh. 23.3 Billion, with the highest
being from public Universities of Ksh. 15.1 Billion and Ksh. 8.2 Billion from Private
Universities. The income increased by 8.54% in the period from Ksh. 7.3 Billion to Ksh. 7.96
Billion in 2014 and 2016 respectively. However, other incomes from private Universities had an
increasing trend, while that of public Universities declined at 75.6 % and 16.7 % respectively.
7.5 Universities Expenditure and Expenditure Items
This section describes the expenditure items on which income by universities is spent.
Expenditure includes both current and capital expenditure, where current expenditure takes
account of the spending on University resources used each year for operations. It includes,
compensation to employees, students’ meals or the renting of school buildings and other
facilities. Capital expenditure on the other hand refers to spending on assets that last longer than
one year. It includes, for instance, spending on construction, renovation and major repair of
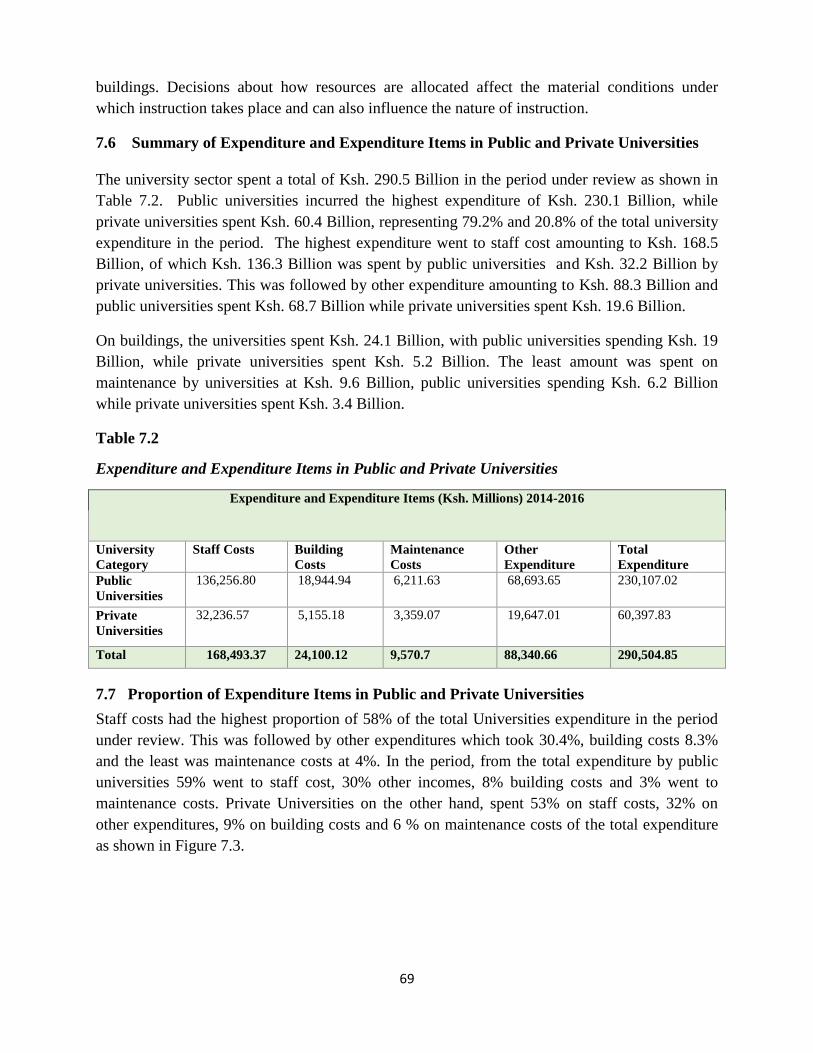
69
buildings. Decisions about how resources are allocated affect the material conditions under
which instruction takes place and can also influence the nature of instruction.
7.6 Summary of Expenditure and Expenditure Items in Public and Private Universities
The university sector spent a total of Ksh. 290.5 Billion in the period under review as shown in
Table 7.2. Public universities incurred the highest expenditure of Ksh. 230.1 Billion, while
private universities spent Ksh. 60.4 Billion, representing 79.2% and 20.8% of the total university
expenditure in the period. The highest expenditure went to staff cost amounting to Ksh. 168.5
Billion, of which Ksh. 136.3 Billion was spent by public universities and Ksh. 32.2 Billion by
private universities. This was followed by other expenditure amounting to Ksh. 88.3 Billion and
public universities spent Ksh. 68.7 Billion while private universities spent Ksh. 19.6 Billion.
On buildings, the universities spent Ksh. 24.1 Billion, with public universities spending Ksh. 19
Billion, while private universities spent Ksh. 5.2 Billion. The least amount was spent on
maintenance by universities at Ksh. 9.6 Billion, public universities spending Ksh. 6.2 Billion
while private universities spent Ksh. 3.4 Billion.
Table 7.2
Expenditure and Expenditure Items in Public and Private Universities
Expenditure and Expenditure Items (Ksh. Millions) 2014-2016
University
Category
Staff Costs Building
Costs
Maintenance
Costs
Other
Expenditure
Total
Expenditure
Public
Universities
136,256.80 18,944.94 6,211.63 68,693.65 230,107.02
Private
Universities
32,236.57 5,155.18 3,359.07 19,647.01 60,397.83
Total 168,493.37 24,100.12 9,570.7 88,340.66 290,504.85
7.7 Proportion of Expenditure Items in Public and Private Universities
Staff costs had the highest proportion of 58% of the total Universities expenditure in the period
under review. This was followed by other expenditures which took 30.4%, building costs 8.3%
and the least was maintenance costs at 4%. In the period, from the total expenditure by public
universities 59% went to staff cost, 30% other incomes, 8% building costs and 3% went to
maintenance costs. Private Universities on the other hand, spent 53% on staff costs, 32% on
other expenditures, 9% on building costs and 6 % on maintenance costs of the total expenditure
as shown in Figure 7.3.
70
Figure 7.3 Proportion of Expenditure Items in Public and Private Universities
7.8 Expenditure Items in Public and Private Universities
The expenditure items from both public and private universities are shown in Figure 7.4 and are
discussed as follows:
7.8.1 Staff Costs
Universities staff costs amounted to Ksh. 168.5 Billion in the period and public universities spent
Ksh. 136.3 Billion while private universities spent Ksh. 32.2 Billion. Total staff costs increased
by 5.7 % from Ksh. 55 Billion in 2014 to Ksh. 58.1 Billion in 2016, largely attributed to both
public and private universities. Public universities staff costs increased by 5.65 % while that of
private universities increased by 6.1%, due to increased number of staff as a result of seven
public constituent colleges transition to charter and establishment of three new public colleges.
In addition, one private university was awarded charter and one university with Letter of Interim
Authority (LIA) in 2016.
7.8.2 Building costs
The total building expenditure for all universities was Ksh. 24.1 Billion, with public universities
spending Ksh. 18.9 Billion and private Universities 5.2 Billion. The expenditure on building
decreased by 24.42 % from 10.2 Billion in 2014 to 7.7 Billion in 2016, mainly attributed to
public universities. Public universities building cost decreased by 17.4 %, while that of private
universities decreased by 49.6 %. The decreased cost in private universities may be attributed to
heavy reliance on sponsors, donors and partners in development funding which may not be
consistent, while government institutions are funded by government on continuous basis during
the projects life time.
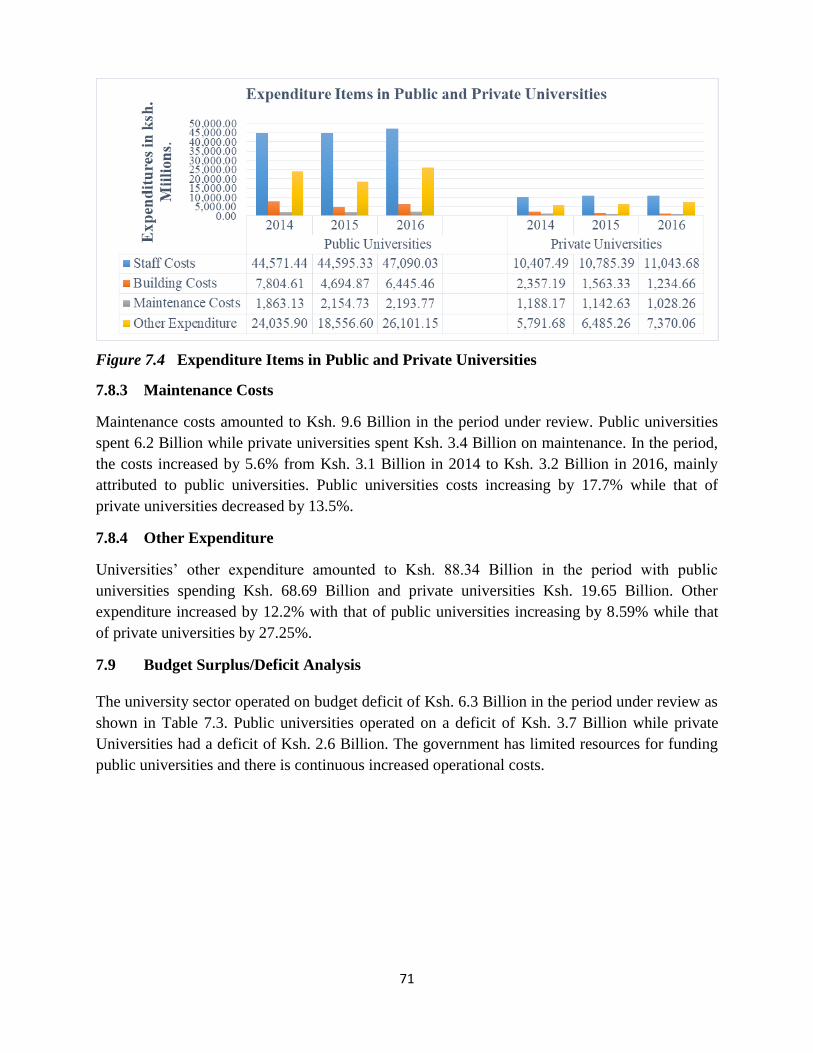
71
Figure 7.4 Expenditure Items in Public and Private Universities
7.8.3 Maintenance Costs
Maintenance costs amounted to Ksh. 9.6 Billion in the period under review. Public universities
spent 6.2 Billion while private universities spent Ksh. 3.4 Billion on maintenance. In the period,
the costs increased by 5.6% from Ksh. 3.1 Billion in 2014 to Ksh. 3.2 Billion in 2016, mainly
attributed to public universities. Public universities costs increasing by 17.7% while that of
private universities decreased by 13.5%.
7.8.4 Other Expenditure
Universities’ other expenditure amounted to Ksh. 88.34 Billion in the period with public
universities spending Ksh. 68.69 Billion and private universities Ksh. 19.65 Billion. Other
expenditure increased by 12.2% with that of public universities increasing by 8.59% while that
of private universities by 27.25%.
7.9 Budget Surplus/Deficit Analysis
The university sector operated on budget deficit of Ksh. 6.3 Billion in the period under review as
shown in Table 7.3. Public universities operated on a deficit of Ksh. 3.7 Billion while private
Universities had a deficit of Ksh. 2.6 Billion. The government has limited resources for funding
public universities and there is continuous increased operational costs.
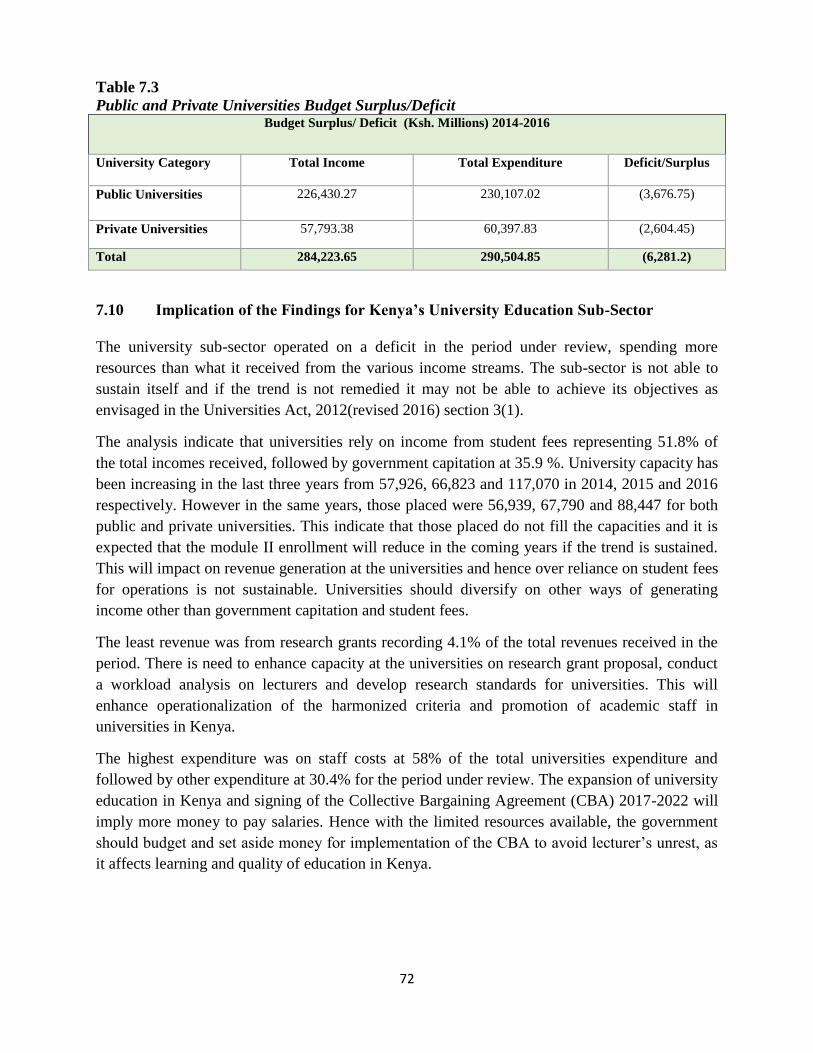
72
Table 7.3
Public and Private Universities Budget Surplus/Deficit Budget Surplus/ Deficit (Ksh. Millions) 2014-2016
University Category Total Income Total Expenditure
Deficit/Surplus
Public Universities 226,430.27 230,107.02 (3,676.75)
Private Universities 57,793.38 60,397.83 (2,604.45)
Total 284,223.65 290,504.85 (6,281.2)
7.10 Implication of the Findings for Kenya’s University Education Sub-Sector
The university sub-sector operated on a deficit in the period under review, spending more
resources than what it received from the various income streams. The sub-sector is not able to
sustain itself and if the trend is not remedied it may not be able to achieve its objectives as
envisaged in the Universities Act, 2012(revised 2016) section 3(1).
The analysis indicate that universities rely on income from student fees representing 51.8% of
the total incomes received, followed by government capitation at 35.9 %. University capacity has
been increasing in the last three years from 57,926, 66,823 and 117,070 in 2014, 2015 and 2016
respectively. However in the same years, those placed were 56,939, 67,790 and 88,447 for both
public and private universities. This indicate that those placed do not fill the capacities and it is
expected that the module II enrollment will reduce in the coming years if the trend is sustained.
This will impact on revenue generation at the universities and hence over reliance on student fees
for operations is not sustainable. Universities should diversify on other ways of generating
income other than government capitation and student fees.
The least revenue was from research grants recording 4.1% of the total revenues received in the
period. There is need to enhance capacity at the universities on research grant proposal, conduct
a workload analysis on lecturers and develop research standards for universities. This will
enhance operationalization of the harmonized criteria and promotion of academic staff in
universities in Kenya.
The highest expenditure was on staff costs at 58% of the total universities expenditure and
followed by other expenditure at 30.4% for the period under review. The expansion of university
education in Kenya and signing of the Collective Bargaining Agreement (CBA) 2017-2022 will
imply more money to pay salaries. Hence with the limited resources available, the government
should budget and set aside money for implementation of the CBA to avoid lecturer’s unrest, as
it affects learning and quality of education in Kenya.
73
Chapter Eight
Conclusions and Recommendations
8.1 Introduction
This chapter presents a summary of conclusions and recommendations of the report based on
collected data from universities. It provides a snapshot of the critical variables in this sector with
far reaching policy implications. Data collected focused on five thematic areas namely:
programmes, enrolment, staffing, graduation and Universities Income and Expenditure. These
variables were analyzed against five university categories - public chartered and their
constituent universities, private chartered and their constituent universities as well as private
universities with Letters of Interim Authority (LIA). From the analyses done in the preceding
chapters, this section draws conclusions and proposes a raft of recommendations.
8.2 Programmes
Public Chartered universities had the highest number of programmes (3,203) representing 81%,
followed by private chartered universities (610 programmes), public university constituent
colleges (69 programmes), private universities with Letters of Interim Authority (LIA) (65
programmes) while private constituent universities had the least number of programmes (33)
representing 0.8% of the total programmes.
Majority of the universities have continued to mount programmes in Humanities and Arts;
Business and Administration as well Life Science and Physical Science. These programmes
recorded the highest increase amongst the universities in the academic year 2015/2016. For
instance, programmes under Humanities and Arts increased with 177 programmes; Business
Administration increased with 52 programmes while manufacturing had an additional 2
programmes within the same year.
A general concern in the university sector in Kenya is the imbalance between humanities, Arts
and Social sciences on the one hand and Science, Technology Engineering and Mathematics on
the other. The consequent shortage of needed knowledge and skills in areas such as
Manufacturing, Housing, Health, Food security, Biotechnology and Information and
Communication Technology is obvious and cannot be gainsaid.
Despite the fact that the country has in the last 5 years invested heavily in key sectors such as
Energy and Infrastructure, university programmes and curricula stand faulted for not addressing
the main sectors and pillars of national development. This may be attributed to disconnect
between policy makers in the government and university set up. The two entities rarely speak to
each other.
74
Recommendations:
To enhance efficiency and competitiveness of the country’s economy:
i) Universities should align their programmes appropriately to address the areas critical in
driving growth and development. The huge need for skilled workers in Science,
Technology, Mathematics and Engineering professions as well as key sectors such as
Food Security, Health care, Manufacturing and affordable housing (The Big Four)
should largely influence universities curricula;
ii) Accreditation of new programmes should match the needs of the country as informed by
manpower surveys from the Ministry of Labour to ensure establishment of programmes
that are synchronised with the present and projected needs;
iii) The Commission should work closely with the ministry of East Africa Community as well
as Labour and Social Protection to operationalize the Kenya Labour Market Information
System;
iv) Students in the formative years of schooling should be exposed to Science, Technology
Engineering and Mathematics (STEM) related courses that will open their minds to
appreciate Science and to address emerging societal challenges. STEM should be readily
embedded into the Competence - based Curriculum from the early learning stages to
tertiary level.
8.3 University Enrolment
Student enrolment in universities rose from 122,847 in 2008 to 547,316 in 2016 (an exponential
increase of more than 300%). Private chartered universities have a student enrollment of 78,987,
representing 14% of the total enrolment in Kenyan universities. The increase in enrolment is a
result of increased population base of learners in primary and secondary schools as well as those
already past the age of traditional university enrolment.
Analysis of students’ enrolment by programmes depicts concentration of students in certain
programs in comparison with others. Business and Administration, for instance, had the highest
number of enrolments with 144,318 (26%), followed by Education (Arts) with 108,533 students
(20%), while Humanities and Arts had 43,938 (8%). The programmes with the lowest
enrolments were Engineering with 22,237 (4%) and Manufacturing with 694 (0.14%). The huge
disparity between enrolments in Arts based and Science oriented programmes may partly be
attributed to the cost of mounting the programmes.
Current statistics show that for 100 undergraduate students studying in the university there were
only 12 masters and 2 PhD students being trained. At the ratio of 58,221 to 9,577 or 6:1, the
transition of Masters Students to PhD is quite low. Compared to the universities in UK or
Canada, where the ratio is 2:1; Kenya is not doing well (UNESCO, 2008).
75
From the data, it was evident that most university student enrolments are found in public
universities with many of them at undergraduate level and very few at PhD level.
Recommendations:
i) Implementation of the proposed Differentiated Unit Cost (DUC) should be fast tracked to
enable universities mount the Science-oriented programmes which require more financial
resources compared with the very popular Humanities and Social Sciences.
ii) Higher Education Loans Board (HELB) should enhance financial support to students
who are enrolled in Science, Technology, Engineering and Mathematics programmes.
iii) Students should be motivated to pursue STEM courses through provision of scholarships,
rewards and mentorship programmes.
iv) The grim picture painted by the data presented calls for concerted efforts by the players
in the sector with support from the Government to fast track staff development.
v) Strategies should be initiated to encourage female enrolment in postgraduate
programmes, and mechanisms should be put in place to promote timely completion of
courses and curb the high dropout rate.
8.3.1 Enrolment by County
Students’ enrolment data by county was previously not available as most universities had not
developed elaborate mechanisms in their admission documents to capture the parameter. The
2016/2017 university statistics report captured the parameter albeit not completely since most of
the universities did not provide complete data.
Analysis of the data collected from both Public and Private chartered universities, revealed that
Nairobi County had the highest number of students at (17,928) enrolled; followed by Kisii with
(9,754) and Kiambu with (8,787). Counties with the least number of students enrolled in the
university was Lamu (275), Wajir (269), and Mandera (249) County.
In terms of gender, there were more male students than female students enrolled with Nairobi
County having the highest male student population (9,253) followed by Kisii (5,859) and Nakuru
Counties. Wajir (68) and Mandera (68) counties had the least female student representation
while Lamu and Tana River Counties had the least male student population at 168 and 167
respectively.
Recommendation:
It is evident that counties in the North Eastern part of Kenya have low enrolments in the
university compared with Counties in other regions like Kisii and Kiambu whose enrolments are
much higher. The big disparity may be attributed to certain historical factors, which may be
corrected with more support from the government and development partners through affirmative
policies.
76
8.3.2 International Enrolment
Many universities in Kenya have been able to attract international students from all over the
world. There were a total of 5,447 international students from 105 identified and 10 unidentified
countries - which is only 0.99% of the total student enrolment in the university. The majority
(89%) of these international students were enrolled in Private Universities while a small fraction
(11%) were in Public Universities.
Analysis of the Country data, revealed that Tanzania had the highest number of international
students represented (577) followed by South Sudan (522), Nigeria (426) and Uganda (376).
Others were: Democratic Republic of Congo (368), Rwanda (331), Burundi (194), Malawi (177)
and Zambia (157) to mention a few. Far flung countries like Madagascar, South Korea and
Pakistan had 82, 23 and 14 respectively.
Majority of international students (56.61%) were enrolled at Undergraduate level followed by
Masters (29.19 %) and Doctorate (6.79%).
From these Figures it is noteworthy that Kenya attracts international students in her universities.
However at about 1% of the total enrolment, it falls far short of the international ratio of 10%
which would truly make our universities curve an international image. The fact that Kenyan
graduates are generally accepted in the region and internationally, means that its system and
quality of education is held in high esteem. The cross-border mobility of professionals working
in diaspora and remitting capital (now reported to be the third foreign revenue stream) is
contributing a significant proportion to the GDP.
Recommendations:
Universities should strive to attract international students, particularly at post graduate level by:
i) Investing more resources in infrastructure, enriching curriculum as well as the faculty.
Tied to that is the need to improve the quality and relevance of the programmes and
enhance completion rates.
ii) A national policy should be crafted to encourage enrolment of international students in
Universities with functional international offices to address the unique needs of foreign
students.
iii) Universities should endeavor to provide predictable university calendars, availability of
hostels on campus and guarantee continuity of learning even when there are cases of
unrest in the universities.
iv) University should leverage the use of technology to support learning across borders
through virtual learning.
8.3.3 Enrolment of Persons with Disability (PwDs)
The number of students with disabilities reported was quite small 881 (0.16%) compared to the
overall enrolment at university level. Although this was reported as the total number of persons
77
with disabilities, there is a possibility that the numbers could be more. To have a clearer
perspective of the number of persons with disability transiting to the university, there is need to
capture data of persons with disability who register for the Kenya Certificate of Secondary
Examination (KCSE) and then track to establish those who qualified to join university. In that
way, it will be possible to have a sense of the statistics of PwDs in the university.
8.4 University Staffing
The analysis of academic staff provided a general overview of the number, gender and how
academic staff were distributed in the different programme domains. Analysis of the quality of
academic staff employed in universities based on their highest qualifications is also provided.
Most academic staff were found in public universities compared to those in private universities.
The majority of them, 68% were male, while 32% were female. Although this meets the one
third policy of either gender representation in appointments, a further analysis of academic staff
of the ranks they hold, shows that gender disparity widens at higher ranks of Senior Lecturer to
professor. Most of the academic staff were master’s holders (53%) and only 34% were PhD
holders with the highest numbers being found in public universities. In terms of rank, most of the
academics were at the level of Lecturer (39%); while those at the level of Senior Lecturer and
Professor were 13% and 10% respectively. The ratio of male to female academic staff in STEM
related programme domains was also skewed with the male academics dominating in those
fields. The report further indicates that universities are not meeting the recommended student to
academic staff ratios of the different clusters as stipulated in the Universities Standards and
Guidelines even with the inclusion of part time academic staff in the calculations except in the
Social Science cluster. The high student to academic staff ratios in some clusters even with the
inclusion of part time staff in the analysis impacts negatively on the quality of university
education.
The findings have varied implications on the university sub sector as explained below;
1. The number of academic staff vis-à-vis the programmes and enrolment show enrolment
has risen as more programmes have been mounted without a corresponding increase in
staff levels. The implication of this is:
i. There will be increased workload for staff;
ii. Over reliance on part time staff for teaching;
iii. Minimum research as academic staff concentrate on teaching at the expense of
research;
This will impact negatively on the quality of university education;
2. The university sub sector adheres to the constitutional threshold of one third gender
policy in appointment of academic staff. But looking at the different ranks the analysis
shows that as staff move to higher academic ranks the gender disparity widens above the
recommended threshold;
78
3. The sub sector is slowly realigning to the recommended grading of academic staff in line
with Harmonized Criteria and Guidelines for Appointment and Promotion of Academic
Staff as the number of academic staff in the rank of Assistant Lecturer are decreasing;
4. The high student to academic staff ratios in some clusters even with the inclusion of part
time staff will impact negatively on the provision of quality university education.
Recommendations:
Arising from implications articulated above the following recommendations are proposed:
i) Universities should strictly adhere to the CUE harmonized criteria for appointment and
promotion of university academic staff on the required qualifications of staff
(Universities Standard and Guidelines INST/STD/04), teaching loads and staff student
ratios.
ii) There is need for a national policy to guide recruitment and management of part time
university academic staff.
iii) There is need for an articulate policy on management of postgraduate programmes to
encourage enrolment and completion at the required timelines.
iv) The Commission should ensure that universities include enrolment and staffing
projections in all new applications for institutions and programme accreditation.
v) The Commission should ensure that before any new programme is accredited, the
recommended student to academic staff ratios as stipulated in the Universities Standards
and Guidelines PROG/STD/17 is not breached.
vi) A comprehensive audit of all existing programmes should be undertaken to determine
how universities are adhering to the recommended full time academic staff to student
ratios in each cluster.
vii) Universities should endeavor to embrace Technology appropriately so as to mitigate staff
shortages.
8.5 Graduation
The total graduates increased by 10% in the year 2016. There were more male graduates (54%)
than female 46% in the year 2016. Male graduates in public universities had 9% increase in the
year 2016 with females increasing by 10%. In private universities males had a growth rate of
12% with females growing by 10%. In both years, female graduates in private universities were
more than male counterparts standing at 52% and 48% respectively.
Analysis of total graduations by level shows that Bachelors remained all high at 87% in both
years, while at Masters Level it registered a decrease from 11% in 2015 to 9% graduating in
2016. With regard to graduations by gender and level, both categories registered an increase in
the period at 10% and 11% respectively. At Masters level both male and females decreased by
8% and 3% respectively.
79
Comparing graduations rates per cluster between Public and Private Universities in the year 2016
and year 2015, it indicated the same trend of Art based clusters producing majority of the
graduates. Business and Administration, Education Arts, Humanity and Arts accounted for 50%
in public universities while accounting for 66% in private universities. The envisaged critical
clusters towards realization of vision 2030 mainly, Mathematics and Statistics, Manufacturing,
Architecture, Computing and ICT, Engineering and Agriculture, Livestock and Fisheries
reported 17% of the total graduations in public universities while contributing to 6% in private
universities.
Recommendations:
i) The government, universities, national tertiary educational institutions and the private
sector should work together to develop creative complementary funding models that
promote high quality postgraduate training.
ii) Universities should put in place mechanisms to facilitate timely completion of studies
especially at Post Graduate level.
8.6 University Income and Expenditure
Higher education has experienced tremendous growth leading to increased demand for resources
to the sector to improve and sustain quality education. Currently, higher learning institutions
receive most funding from Government which is no longer adequate as they face stiff
competition from other sectors for the limited government financial resources. The report
indicates that the university sub-sector operated on a deficit in the period under review, spending
more resources than what it received from the various income streams. If the trend is not
remedied the sector may not be able to achieve its objectives as envisaged in the Universities
Amendment Act, 2016.
The analysis for the period under review indicates that Universities largely rely on income from
student fees representing 51.8% of the total incomes received, followed by government
capitation at 35.9%. The least revenue was obtained from research grants at 4.1% of the total
revenues received in the period.
Universities should explore ways of forging partnerships with Industry so that the training in the
university relates to what the industry requires. Firms would be eager to support universities
where training activities adds value to the persons they will be hiring in future. With proper
structures such arrangements could contribute to the firms as well as to the wider economy. For
example, Safaricom is supporting an academy at Strathmore University in Kenya that offers a
Master of Science degree in mobile telecommunications and innovation; Manu Chandaria
Foundation has set up the Business Incubation Hub in Kenyatta University; while IBM has
established research and training centers in Catholic and Kabarak Universities.
80
8.7 Emerging Issues
The following are some of the emerging issues that are bound to shape the university subsector
in Kenya presently and in future.
i) Curriculum reforms currently being undertaken (competency - based learning) – The
Commission should champion the reforms by embedding them in programme and
institutional accreditation process.
ii) The Commission should prepare the university sector to handle the anticipated high
transition arising from the government policy of 100% transition to Secondary
Education.
iii) The University Education Management Information Systems (UEMIS) should be
integrated with the National Education Management Information System (NEMIS) to
enable among other features, real time capture of university data and tracking of students
to university level.
These issues will have implications to the university sub - sector in terms of aligning
programmes to fit into the competence based approach and re-tooling of the academic staff to
deliver the content of their revised curricula. The use of technology to learn and manage
university operations is also critical. In order to meet these future expectations, there will be need
to build the capacity of the academic staff so that they get appropriate skill sets to cope with new
technological demands.
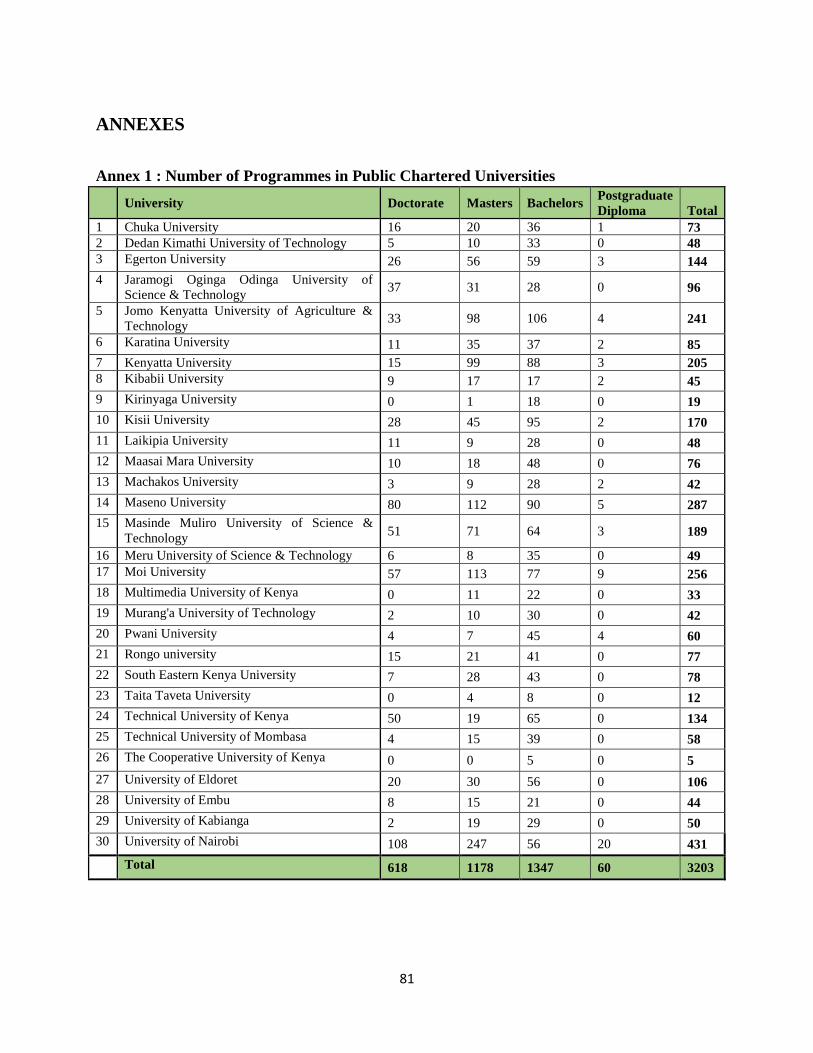
81
ANNEXES
Annex 1 : Number of Programmes in Public Chartered Universities
University Doctorate Masters Bachelors
Postgraduate
Diploma Total
1 Chuka University 16 20 36 1 73
2 Dedan Kimathi University of Technology 5 10 33 0 48
3 Egerton University 26 56 59 3 144
4 Jaramogi Oginga Odinga University of
Science & Technology 37 31 28 0 96
5 Jomo Kenyatta University of Agriculture &
Technology 33 98 106 4 241
6 Karatina University 11 35 37 2 85
7 Kenyatta University 15 99 88 3 205
8 Kibabii University 9 17 17 2 45
9 Kirinyaga University 0 1 18 0 19
10 Kisii University 28 45 95 2 170
11 Laikipia University 11 9 28 0 48
12 Maasai Mara University 10 18 48 0 76
13 Machakos University 3 9 28 2 42
14 Maseno University 80 112 90 5 287
15 Masinde Muliro University of Science &
Technology 51 71 64 3 189
16 Meru University of Science & Technology 6 8 35 0 49
17 Moi University 57 113 77 9 256
18 Multimedia University of Kenya 0 11 22 0 33
19 Murang'a University of Technology 2 10 30 0 42
20 Pwani University 4 7 45 4 60
21 Rongo university 15 21 41 0 77
22 South Eastern Kenya University 7 28 43 0 78
23 Taita Taveta University 0 4 8 0 12
24 Technical University of Kenya 50 19 65 0 134
25 Technical University of Mombasa 4 15 39 0 58
26 The Cooperative University of Kenya 0 0 5 0 5
27 University of Eldoret 20 30 56 0 106
28 University of Embu 8 15 21 0 44
29 University of Kabianga 2 19 29 0 50
30 University of Nairobi 108 247 56 20 431
Total 618 1178 1347 60 3203
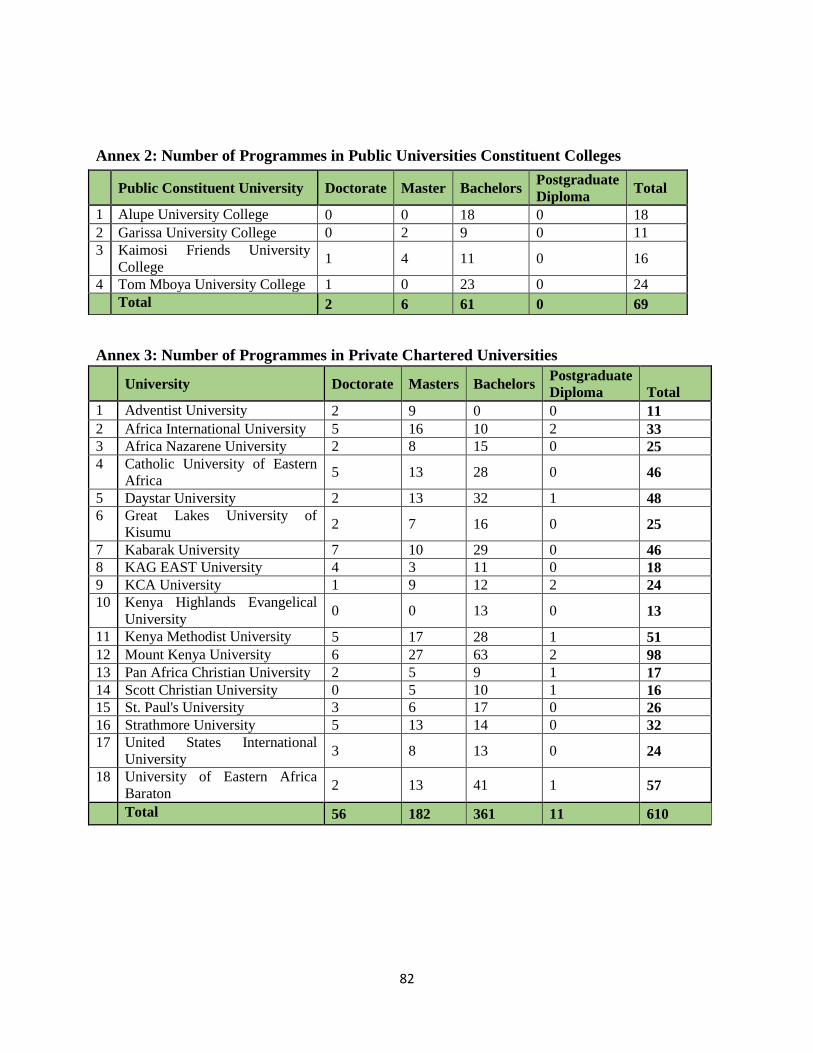
82
Annex 2: Number of Programmes in Public Universities Constituent Colleges
Annex 3: Number of Programmes in Private Chartered Universities
University Doctorate Masters Bachelors
Postgraduate
Diploma Total
1 Adventist University 2 9 0 0 11
2 Africa International University 5 16 10 2 33
3 Africa Nazarene University 2 8 15 0 25
4 Catholic University of Eastern
Africa 5 13 28 0 46
5 Daystar University 2 13 32 1 48
6 Great Lakes University of
Kisumu 2 7 16 0 25
7 Kabarak University 7 10 29 0 46
8 KAG EAST University 4 3 11 0 18
9 KCA University 1 9 12 2 24
10 Kenya Highlands Evangelical
University 0 0 13 0 13
11 Kenya Methodist University 5 17 28 1 51
12 Mount Kenya University 6 27 63 2 98
13 Pan Africa Christian University 2 5 9 1 17
14 Scott Christian University 0 5 10 1 16
15 St. Paul's University 3 6 17 0 26
16 Strathmore University 5 13 14 0 32
17 United States International
University 3 8 13 0 24
18 University of Eastern Africa
Baraton 2 13 41 1 57
Total 56 182 361 11 610
Public Constituent University Doctorate Master Bachelors
Postgraduate
Diploma Total
1 Alupe University College 0 0 18 0 18
2 Garissa University College 0 2 9 0 11
3 Kaimosi Friends University
College 1 4 11 0 16
4 Tom Mboya University College 1 0 23 0 24
Total 2 6 61 0 69
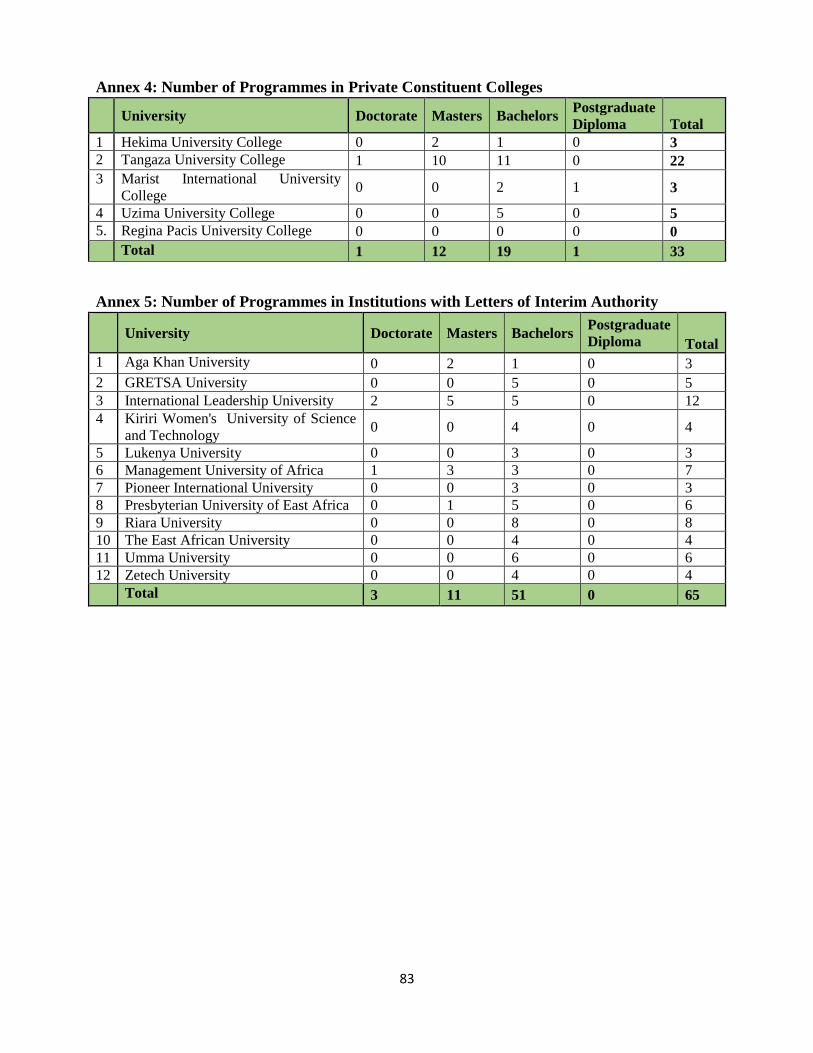
83
Annex 4: Number of Programmes in Private Constituent Colleges
University Doctorate Masters Bachelors
Postgraduate
Diploma Total
1 Hekima University College 0 2 1 0 3
2 Tangaza University College 1 10 11 0 22
3 Marist International University
College 0 0 2 1 3
4 Uzima University College 0 0 5 0 5
5. Regina Pacis University College 0 0 0 0 0
Total 1 12 19 1 33
Annex 5: Number of Programmes in Institutions with Letters of Interim Authority
University Doctorate Masters Bachelors
Postgraduate
Diploma Total
1 Aga Khan University 0 2 1 0 3
2 GRETSA University 0 0 5 0 5
3 International Leadership University 2 5 5 0 12
4 Kiriri Women's University of Science
and Technology 0 0 4 0 4
5 Lukenya University 0 0 3 0 3
6 Management University of Africa 1 3 3 0 7
7 Pioneer International University 0 0 3 0 3
8 Presbyterian University of East Africa 0 1 5 0 6
9 Riara University 0 0 8 0 8
10 The East African University 0 0 4 0 4
11 Umma University 0 0 6 0 6
12 Zetech University 0 0 4 0 4
Total 3 11 51 0 65
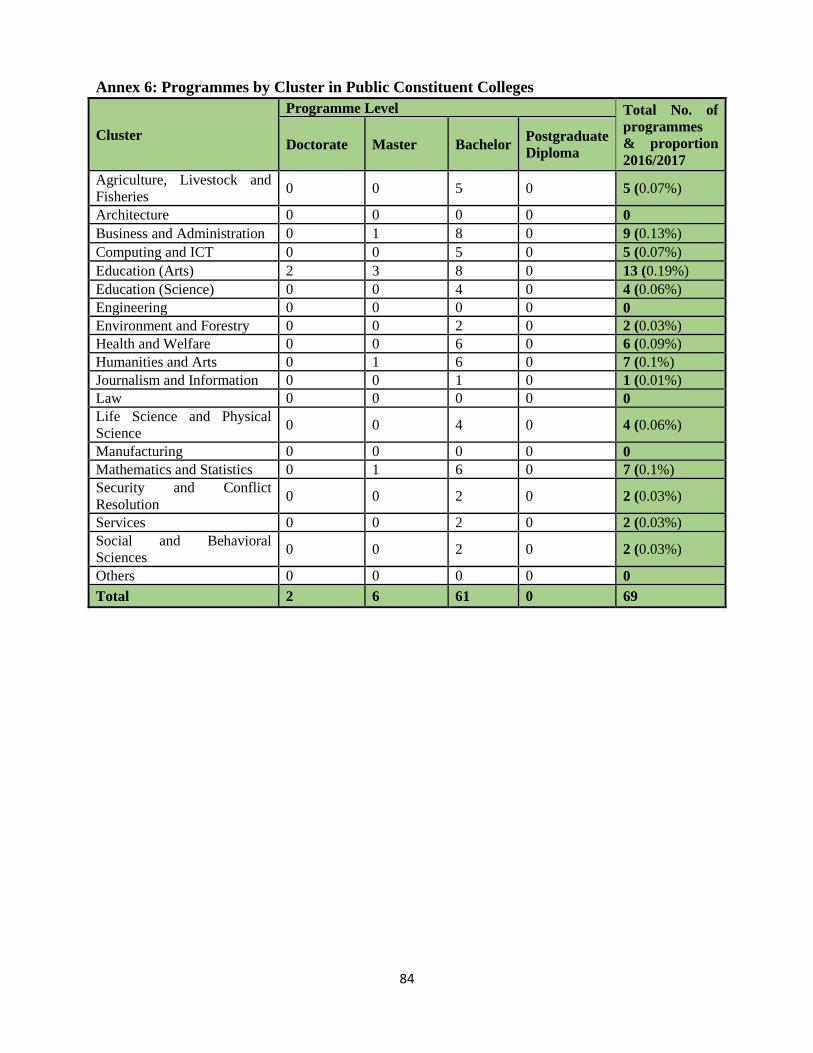
84
Annex 6: Programmes by Cluster in Public Constituent Colleges
Cluster
Programme Level Total No. of
programmes
& proportion
2016/2017 Doctorate Master Bachelor
Postgraduate
Diploma
Agriculture, Livestock and
Fisheries 0 0 5 0 5 (0.07%)
Architecture 0 0 0 0 0
Business and Administration 0 1 8 0 9 (0.13%)
Computing and ICT 0 0 5 0 5 (0.07%)
Education (Arts) 2 3 8 0 13 (0.19%)
Education (Science) 0 0 4 0 4 (0.06%)
Engineering 0 0 0 0 0
Environment and Forestry 0 0 2 0 2 (0.03%)
Health and Welfare 0 0 6 0 6 (0.09%)
Humanities and Arts 0 1 6 0 7 (0.1%)
Journalism and Information 0 0 1 0 1 (0.01%)
Law 0 0 0 0 0
Life Science and Physical
Science 0 0 4 0 4 (0.06%)
Manufacturing 0 0 0 0 0
Mathematics and Statistics 0 1 6 0 7 (0.1%)
Security and Conflict
Resolution 0 0 2 0 2 (0.03%)
Services 0 0 2 0 2 (0.03%)
Social and Behavioral
Sciences 0 0 2 0 2 (0.03%)
Others 0 0 0 0 0
Total 2 6 61 0 69
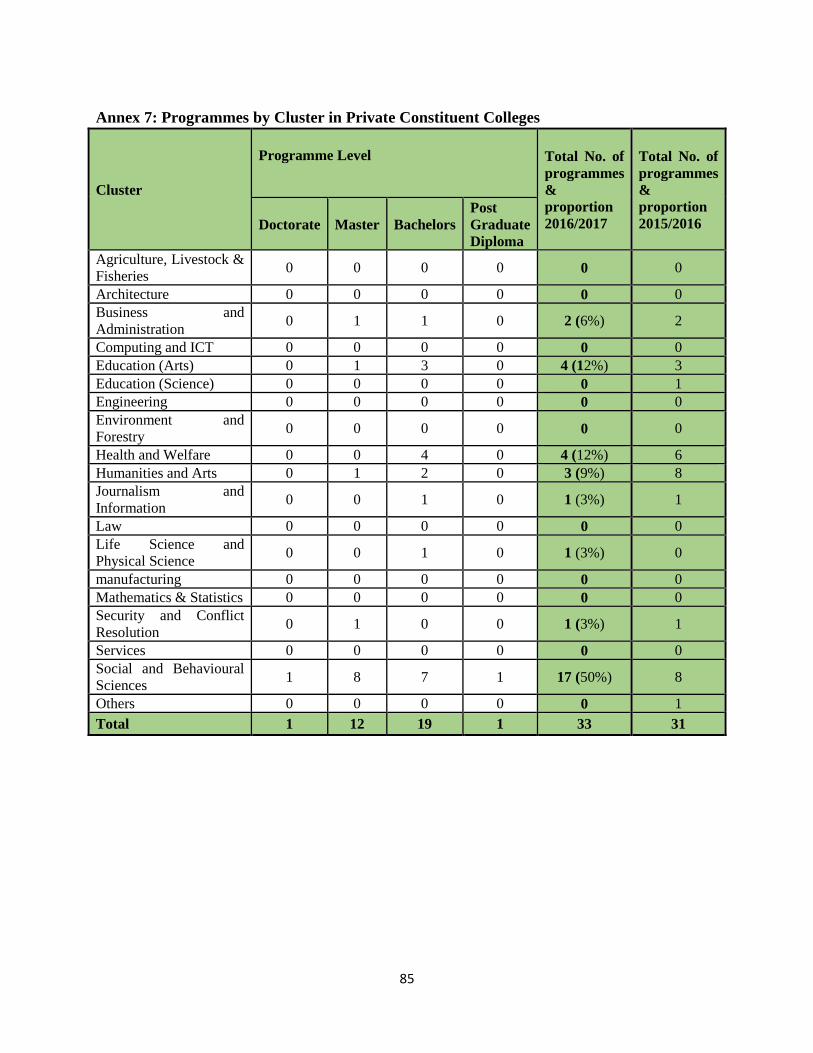
85
Annex 7: Programmes by Cluster in Private Constituent Colleges
Cluster
Programme Level
Total No. of
programmes
&
proportion
2016/2017
Total No. of
programmes
&
proportion
2015/2016 Doctorate Master Bachelors
Post
Graduate
Diploma
Agriculture, Livestock &
Fisheries 0 0 0 0 0 0
Architecture 0 0 0 0 0 0
Business and
Administration 0 1 1 0 2 (6%) 2
Computing and ICT 0 0 0 0 0 0
Education (Arts) 0 1 3 0 4 (12%) 3
Education (Science) 0 0 0 0 0 1
Engineering 0 0 0 0 0 0
Environment and
Forestry 0 0 0 0 0 0
Health and Welfare 0 0 4 0 4 (12%) 6
Humanities and Arts 0 1 2 0 3 (9%) 8
Journalism and
Information 0 0 1 0 1 (3%) 1
Law 0 0 0 0 0 0
Life Science and
Physical Science 0 0 1 0 1 (3%) 0
manufacturing 0 0 0 0 0 0
Mathematics & Statistics 0 0 0 0 0 0
Security and Conflict
Resolution 0 1 0 0 1 (3%) 1
Services 0 0 0 0 0 0
Social and Behavioural
Sciences 1 8 7 1 17 (50%) 8
Others 0 0 0 0 0 1
Total 1 12 19 1 33 31
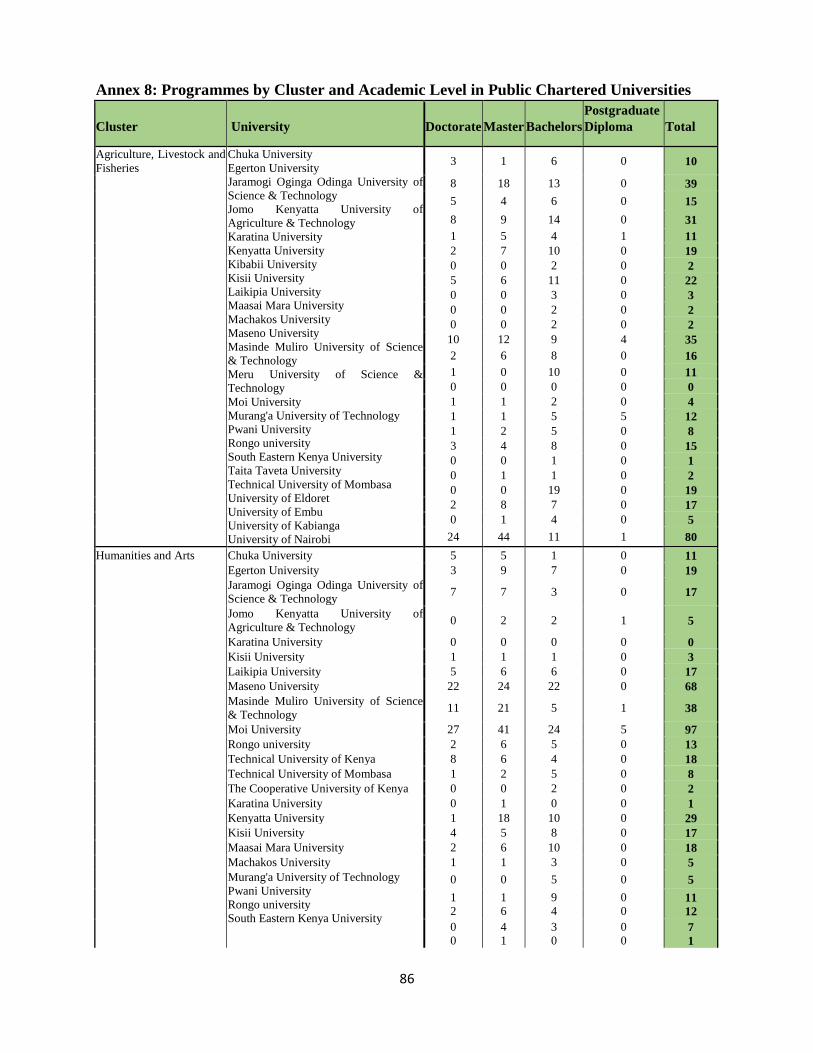
86
Annex 8: Programmes by Cluster and Academic Level in Public Chartered Universities
Cluster University Doctorate Master Bachelors
Postgraduate
Diploma Total
Agriculture, Livestock and
Fisheries
Chuka University
Egerton University
Jaramogi Oginga Odinga University of
Science & Technology
Jomo Kenyatta University of
Agriculture & Technology
Karatina University
Kenyatta University
Kibabii University
Kisii University
Laikipia University
Maasai Mara University
Machakos University
Maseno University
Masinde Muliro University of Science
& Technology
Meru University of Science &
Technology
Moi University
Murang'a University of Technology
Pwani University
Rongo university
South Eastern Kenya University
Taita Taveta University
Technical University of Mombasa
University of Eldoret
University of Embu
University of Kabianga
University of Nairobi
3 1 6 0 10
8 18 13 0 39
5 4 6 0 15
8 9 14 0 31
1 5 4 1 11
2 7 10 0 19
0 0 2 0 2
5 6 11 0 22
0 0 3 0 3
0 0 2 0 2
0 0 2 0 2
10 12 9 4 35
2 6 8 0 16
1 0 10 0 11
0 0 0 0 0
1 1 2 0 4
1 1 5 5 12
1 2 5 0 8
3 4 8 0 15
0 0 1 0 1
0 1 1 0 2
0 0 19 0 19
2 8 7 0 17
0 1 4 0 5
24 44 11 1 80
Humanities and Arts Chuka University 5 5 1 0 11
Egerton University 3 9 7 0 19
Jaramogi Oginga Odinga University of
Science & Technology 7 7 3 0 17
Jomo Kenyatta University of
Agriculture & Technology 0 2 2 1 5
Karatina University 0 0 0 0 0
Kisii University 1 1 1 0 3
Laikipia University 5 6 6 0 17
Maseno University 22 24 22 0 68
Masinde Muliro University of Science
& Technology 11 21 5 1 38
Moi University 27 41 24 5 97
Rongo university 2 6 5 0 13
Technical University of Kenya 8 6 4 0 18
Technical University of Mombasa 1 2 5 0 8
The Cooperative University of Kenya 0 0 2 0 2
Karatina University 0 1 0 0 1
Kenyatta University 1 18 10 0 29
Kisii University 4 5 8 0 17
Maasai Mara University 2 6 10 0 18
Machakos University 1 1 3 0 5
Murang'a University of Technology
Pwani University
Rongo university
South Eastern Kenya University
0 0 5 0 5
1
2
1
6
9
4
0
0 11
12
0
0
4
1
3
0
0
0 7
1
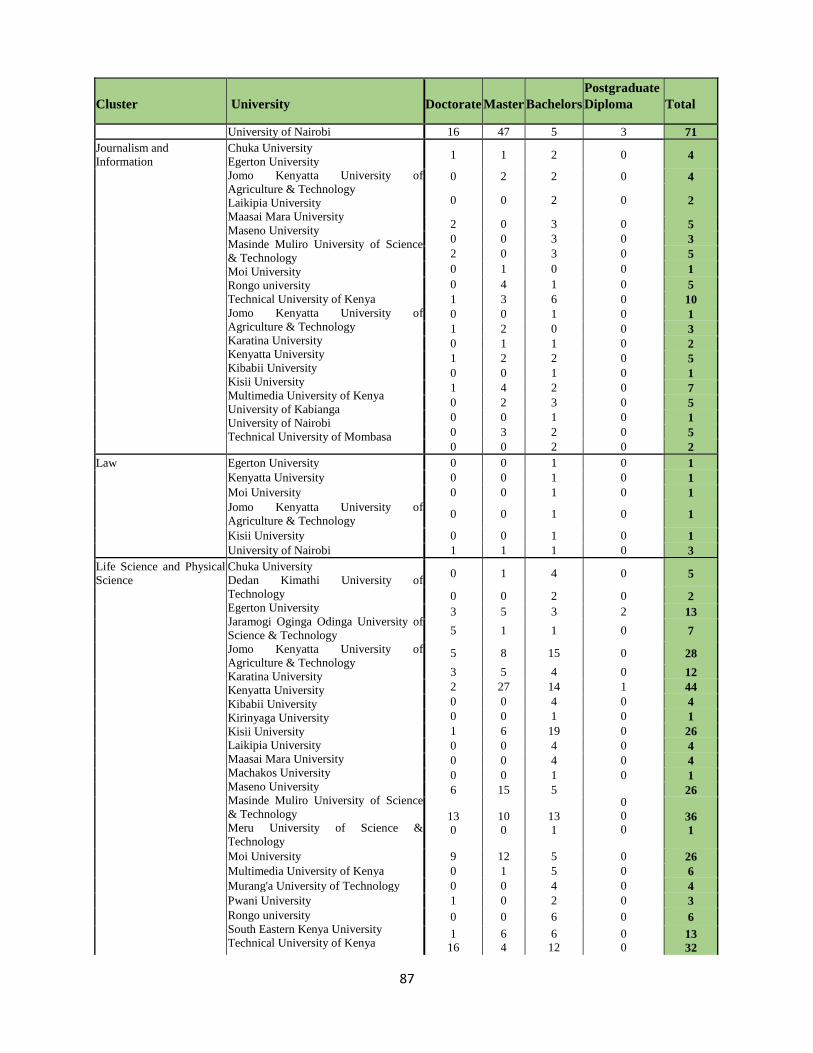
87
Cluster University Doctorate Master Bachelors
Postgraduate
Diploma Total
University of Nairobi 16 47 5 3 71
Journalism and
Information
Chuka University
Egerton University
Jomo Kenyatta University of
Agriculture & Technology
Laikipia University
Maasai Mara University
Maseno University
Masinde Muliro University of Science
& Technology
Moi University
Rongo university
Technical University of Kenya
Jomo Kenyatta University of
Agriculture & Technology
Karatina University
Kenyatta University
Kibabii University
Kisii University
Multimedia University of Kenya
University of Kabianga
University of Nairobi
Technical University of Mombasa
1 1 2 0 4
0 2 2 0 4
0 0 2 0 2
2 0 3 0 5
0 0 3 0 3
2 0 3 0 5
0 1 0 0 1
0 4 1 0 5
1 3 6 0 10
0 0 1 0 1
1 2 0 0 3
0 1 1 0 2
1 2 2 0 5
0 0 1 0 1
1 4 2 0 7
0 2 3 0 5
0 0 1 0 1
0 3 2 0 5
0 0 2 0 2
Law Egerton University 0 0 1 0 1
Kenyatta University 0 0 1 0 1
Moi University 0 0 1 0 1
Jomo Kenyatta University of
Agriculture & Technology 0 0 1 0 1
Kisii University 0 0 1 0 1
University of Nairobi 1 1 1 0 3
Life Science and Physical
Science
Chuka University
Dedan Kimathi University of
Technology
Egerton University
Jaramogi Oginga Odinga University of
Science & Technology
Jomo Kenyatta University of
Agriculture & Technology
Karatina University
Kenyatta University
Kibabii University
Kirinyaga University
Kisii University
Laikipia University
Maasai Mara University
Machakos University
Maseno University
Masinde Muliro University of Science
& Technology
Meru University of Science &
Technology
0 1 4 0 5
0 0 2 0 2
3 5 3 2 13
5 1 1 0 7
5 8 15 0 28
3 5 4 0 12
2 27 14 1 44
0 0 4 0 4
0 0 1 0 1
1 6 19 0 26
0 0 4 0 4
0 0 4 0 4
0 0 1 0 1
6 15 5 0
0
0
26
13
0
10
0
13
1 36
1
Moi University 9 12 5 0 26
Multimedia University of Kenya 0 1 5 0 6
Murang'a University of Technology 0 0 4 0 4
Pwani University 1 0 2 0 3
Rongo university
South Eastern Kenya University
Technical University of Kenya
0 0 6 0 6
1
16
6
4
6
12
0
0 13
32
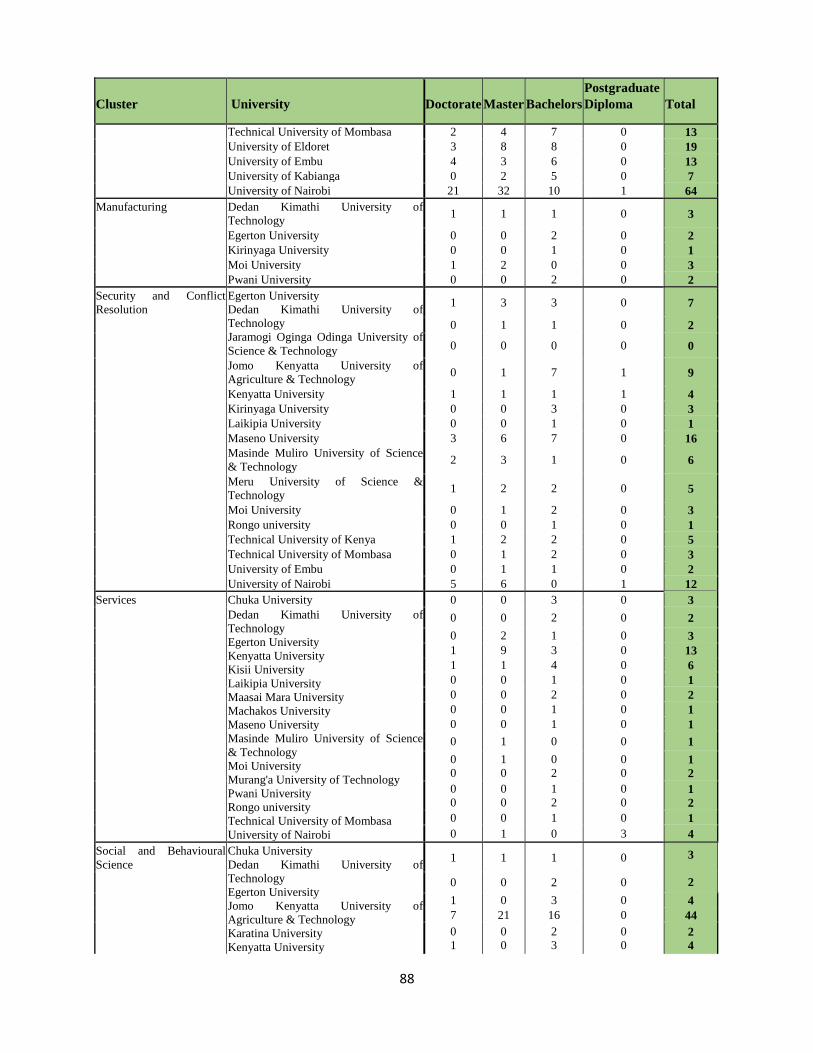
88
Cluster University Doctorate Master Bachelors
Postgraduate
Diploma Total
Technical University of Mombasa 2 4 7 0 13
University of Eldoret 3 8 8 0 19
University of Embu 4 3 6 0 13
University of Kabianga 0 2 5 0 7
University of Nairobi 21 32 10 1 64
Manufacturing Dedan Kimathi University of
Technology 1 1 1 0 3
Egerton University 0 0 2 0 2
Kirinyaga University 0 0 1 0 1
Moi University 1 2 0 0 3
Pwani University 0 0 2 0 2
Security and Conflict
Resolution
Egerton University
Dedan Kimathi University of
Technology
Jaramogi Oginga Odinga University of
Science & Technology
1 3 3 0 7
0 1 1 0 2
0 0 0 0 0
Jomo Kenyatta University of
Agriculture & Technology 0 1 7 1 9
Kenyatta University 1 1 1 1 4
Kirinyaga University 0 0 3 0 3
Laikipia University 0 0 1 0 1
Maseno University 3 6 7 0 16
Masinde Muliro University of Science
& Technology 2 3 1 0 6
Meru University of Science &
Technology 1 2 2 0 5
Moi University 0 1 2 0 3
Rongo university 0 0 1 0 1
Technical University of Kenya 1 2 2 0 5
Technical University of Mombasa 0 1 2 0 3
University of Embu 0 1 1 0 2
University of Nairobi 5 6 0 1 12
Services Chuka University 0 0 3 0 3
Dedan Kimathi University of
Technology
Egerton University
Kenyatta University
Kisii University
Laikipia University
Maasai Mara University
Machakos University
Maseno University
Masinde Muliro University of Science
& Technology
Moi University
Murang'a University of Technology
Pwani University
Rongo university
Technical University of Mombasa
University of Nairobi
0 0 2 0 2
0 2 1 0 3
1 9 3 0 13
1 1 4 0 6
0 0 1 0 1
0 0 2 0 2
0 0 1 0 1
0 0 1 0 1
0 1 0 0 1
0
0
1
0
0
2
0
0 1
2
0
0
0
0
1
2
0
0 1
2
0 0 1 0 1
0 1 0 3 4
Social and Behavioural
Science
Chuka University
Dedan Kimathi University of
Technology
Egerton University
Jomo Kenyatta University of
Agriculture & Technology
Karatina University
Kenyatta University
1 1 1 0 3
2 0 0 2 0
1 0 3 0 4
7 21 16 0 44
0
1
0
0
2
3
0
0 2
4
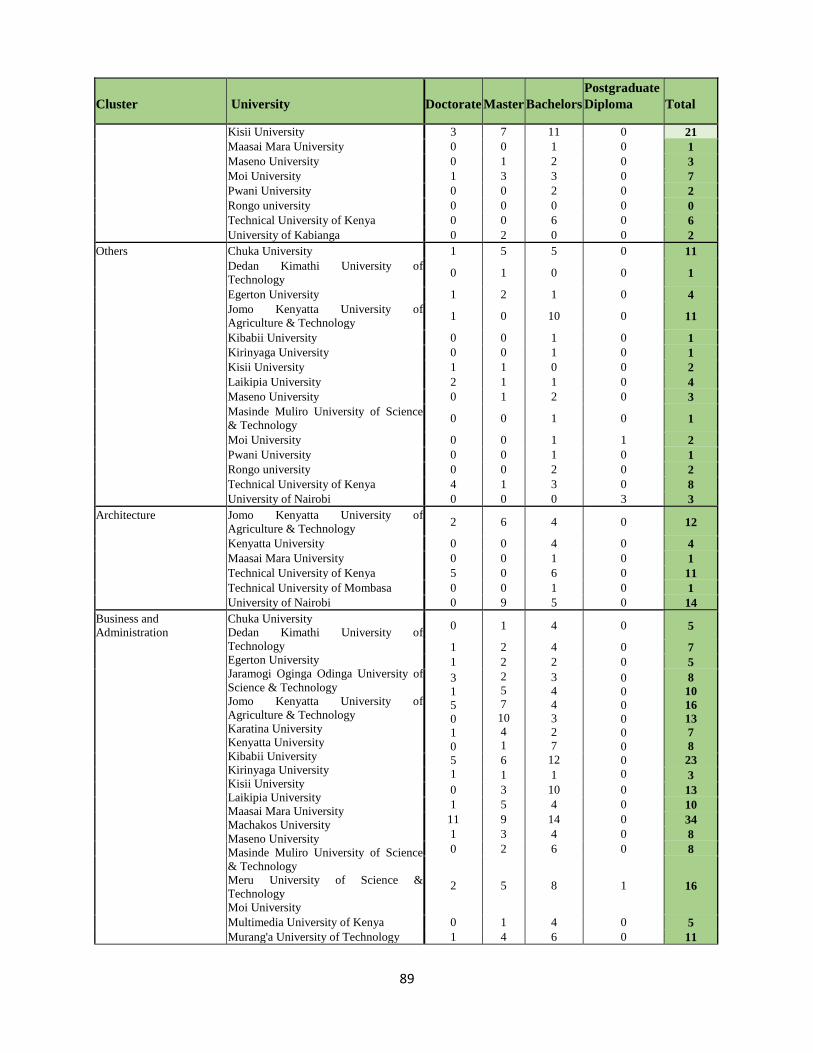
89
Cluster University Doctorate Master Bachelors
Postgraduate
Diploma Total
Kisii University 3 7 11 0 21
Maasai Mara University 0 0 1 0 1
Maseno University 0 1 2 0 3
Moi University 1 3 3 0 7
Pwani University 0 0 2 0 2
Rongo university 0 0 0 0 0
Technical University of Kenya 0 0 6 0 6
University of Kabianga 0 2 0 0 2
Others Chuka University 1 5 5 0 11
Dedan Kimathi University of
Technology 0 1 0 0 1
Egerton University 1 2 1 0 4
Jomo Kenyatta University of
Agriculture & Technology 1 0 10 0 11
Kibabii University 0 0 1 0 1
Kirinyaga University 0 0 1 0 1
Kisii University 1 1 0 0 2
Laikipia University 2 1 1 0 4
Maseno University 0 1 2 0 3
Masinde Muliro University of Science
& Technology 0 0 1 0 1
Moi University 0 0 1 1 2
Pwani University 0 0 1 0 1
Rongo university 0 0 2 0 2
Technical University of Kenya 4 1 3 0 8
University of Nairobi 0 0 0 3 3
Architecture Jomo Kenyatta University of
Agriculture & Technology 2 6 4 0 12
Kenyatta University 0 0 4 0 4
Maasai Mara University 0 0 1 0 1
Technical University of Kenya 5 0 6 0 11
Technical University of Mombasa 0 0 1 0 1
University of Nairobi 0 9 5 0 14
Business and
Administration
Chuka University
Dedan Kimathi University of
Technology
Egerton University
Jaramogi Oginga Odinga University of
Science & Technology
Jomo Kenyatta University of
Agriculture & Technology
Karatina University
Kenyatta University
Kibabii University
Kirinyaga University
Kisii University
Laikipia University
Maasai Mara University
Machakos University
Maseno University
Masinde Muliro University of Science
& Technology
Meru University of Science &
Technology
Moi University
0 1 4 0 5
1 2 4 0 7
1 2 2 0 5
3
1
5
0
1
0
5
1
2
5
7
10
4
1
3
4
4
3
2
7
12
0
0
0
0
0
0
0
0
8
10
16
13
7
8
23 6
1 1 3
0 3 10 0 13
1 5 4 0 10
11 9 14 0 34
1 3 4 0 8
0 2 6 0 8
2 5 8 1 16
Multimedia University of Kenya 0 1 4 0 5
Murang'a University of Technology 1 4 6 0 11
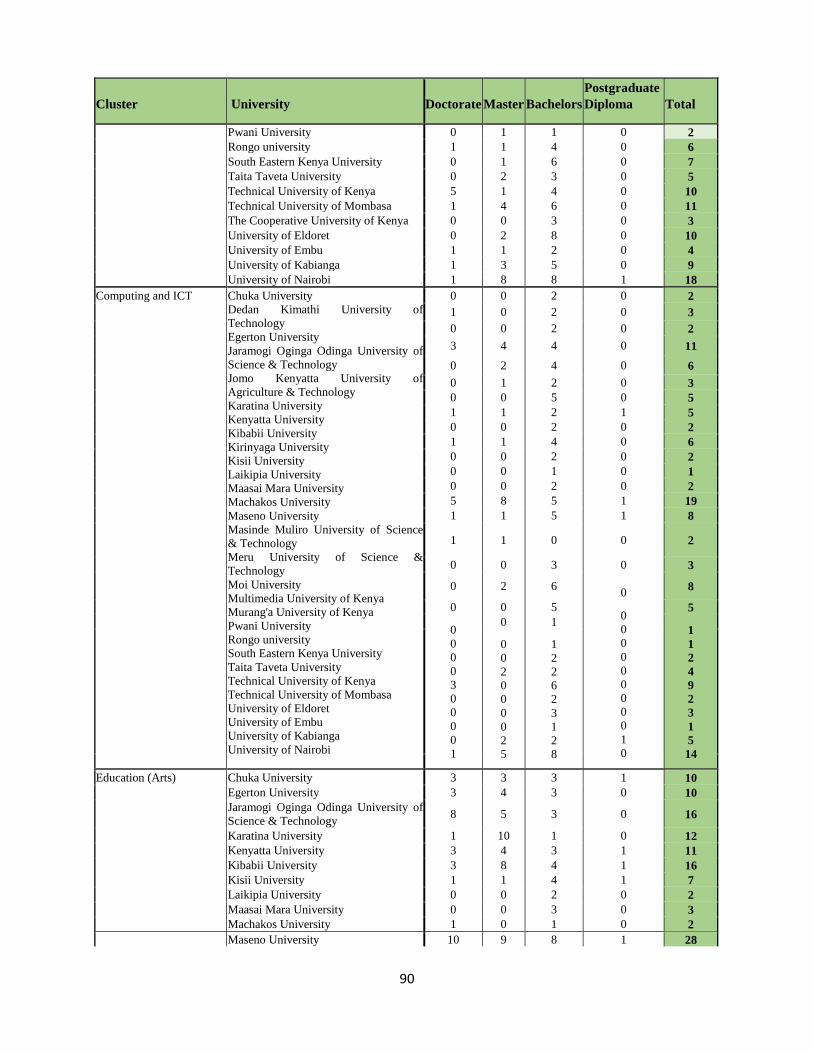
90
Cluster University Doctorate Master Bachelors
Postgraduate
Diploma Total
Pwani University 0 1 1 0 2
Rongo university 1 1 4 0 6
South Eastern Kenya University 0 1 6 0 7
Taita Taveta University 0 2 3 0 5
Technical University of Kenya 5 1 4 0 10
Technical University of Mombasa 1 4 6 0 11
The Cooperative University of Kenya 0 0 3 0 3
University of Eldoret 0 2 8 0 10
University of Embu 1 1 2 0 4
University of Kabianga 1 3 5 0 9
University of Nairobi 1 8 8 1 18
Computing and ICT Chuka University
Dedan Kimathi University of
Technology
Egerton University
Jaramogi Oginga Odinga University of
Science & Technology
Jomo Kenyatta University of
Agriculture & Technology
Karatina University
Kenyatta University
Kibabii University
Kirinyaga University
Kisii University
Laikipia University
Maasai Mara University
Machakos University
Maseno University
Masinde Muliro University of Science
& Technology
Meru University of Science &
Technology
Moi University
Multimedia University of Kenya
Murang'a University of Kenya
Pwani University
Rongo university
South Eastern Kenya University
Taita Taveta University
Technical University of Kenya
Technical University of Mombasa
University of Eldoret
University of Embu
University of Kabianga
University of Nairobi
0 0 2 0 2
1 0 2 0 3
0 0 2 0 2
3 4 4 0 11
0 2 4 0 6
0 1 2 0 3
0 0 5 0 5
1 1 2 1 5
0 0 2 0 2
1 1 4 0 6
0 0 2 0 2
0 0 1 0 1
0 0 2 0 2
5 8 5 1 19
1 1 5 1 8
1 1 0 0 2
0 0 3 0
0
3
0 2 6 8
0 0 5 0
0
0
0
0
0
0
0
0
1
0
5
0
0
0
0
3
0
0
0
0
1
0 1 1
1
2
4
9
2
3
1
5
14
0
0
2
0
0
0
0
2
5
1
2
2
6
2
3
1
2
8
Education (Arts) Chuka University 3 3 3 1 10
Egerton University 3 4 3 0 10
Jaramogi Oginga Odinga University of
Science & Technology 8 5 3 0 16
Karatina University 1 10 1 0 12
Kenyatta University 3 4 3 1 11
Kibabii University 3 8 4 1 16
Kisii University 1 1 4 1 7
Laikipia University 0 0 2 0 2
Maasai Mara University 0 0 3 0 3
Machakos University 1 0 1 0 2
Maseno University 10 9 8 1 28
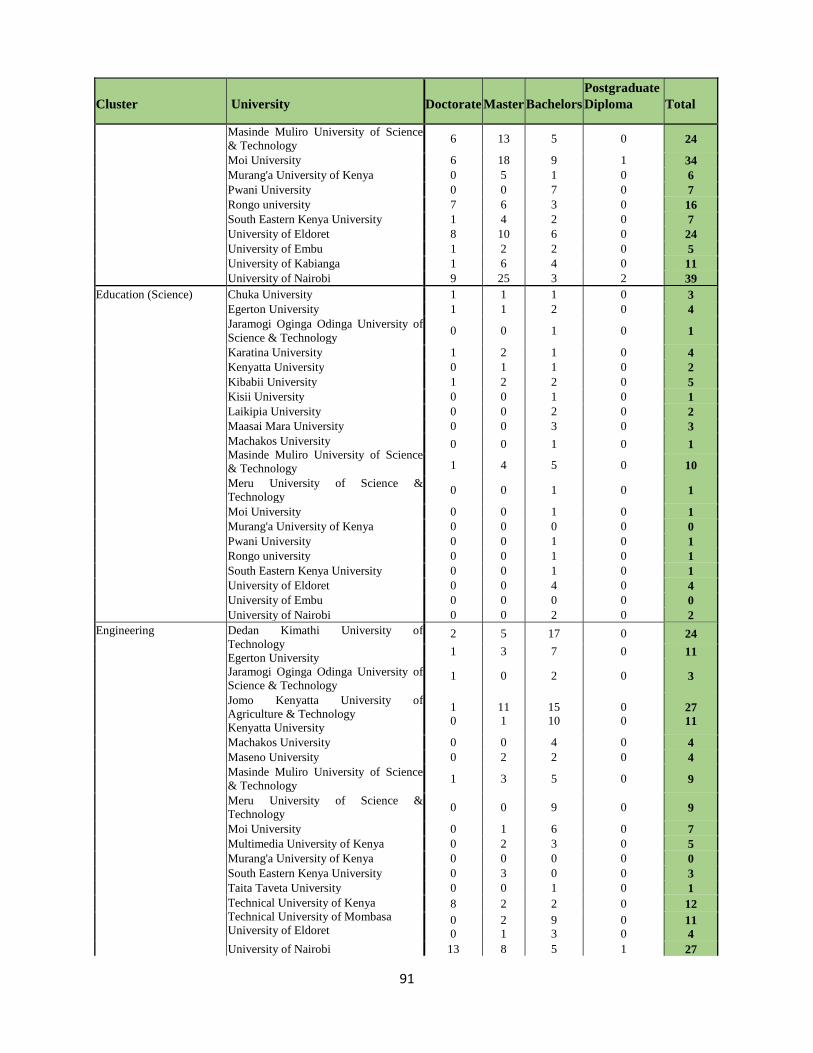
91
Cluster University Doctorate Master Bachelors
Postgraduate
Diploma Total
Masinde Muliro University of Science
& Technology 6 13 5 0 24
Moi University 6 18 9 1 34
Murang'a University of Kenya 0 5 1 0 6
Pwani University 0 0 7 0 7
Rongo university 7 6 3 0 16
South Eastern Kenya University 1 4 2 0 7
University of Eldoret 8 10 6 0 24
University of Embu 1 2 2 0 5
University of Kabianga 1 6 4 0 11
University of Nairobi 9 25 3 2 39
Education (Science) Chuka University 1 1 1 0 3
Egerton University 1 1 2 0 4
Jaramogi Oginga Odinga University of
Science & Technology 0 0 1 0 1
Karatina University 1 2 1 0 4
Kenyatta University 0 1 1 0 2
Kibabii University 1 2 2 0 5
Kisii University 0 0 1 0 1
Laikipia University 0 0 2 0 2
Maasai Mara University 0 0 3 0 3
Machakos University
Masinde Muliro University of Science
& Technology
0 0 1 0 1
1 4 5 0 10
Meru University of Science &
Technology 0 0 1 0 1
Moi University 0 0 1 0 1
Murang'a University of Kenya 0 0 0 0 0
Pwani University 0 0 1 0 1
Rongo university 0 0 1 0 1
South Eastern Kenya University 0 0 1 0 1
University of Eldoret 0 0 4 0 4
University of Embu 0 0 0 0 0
University of Nairobi 0 0 2 0 2
Engineering Dedan Kimathi University of
Technology
Egerton University
Jaramogi Oginga Odinga University of
Science & Technology
2 5 17 0 24
1 3 7 0 11
1 0 2 0 3
Jomo Kenyatta University of
Agriculture & Technology
Kenyatta University
1
0
11
1
15
10
0
0 27
11
Machakos University 0 0 4 0 4
Maseno University 0 2 2 0 4
Masinde Muliro University of Science
& Technology 1 3 5 0 9
Meru University of Science &
Technology 0 0 9 0 9
Moi University 0 1 6 0 7
Multimedia University of Kenya 0 2 3 0 5
Murang'a University of Kenya 0 0 0 0 0
South Eastern Kenya University 0 3 0 0 3
Taita Taveta University 0 0 1 0 1
Technical University of Kenya
Technical University of Mombasa
University of Eldoret
8 2 2 0 12
0
0
2
1
9
3
0
0 11
4
University of Nairobi 13 8 5 1 27
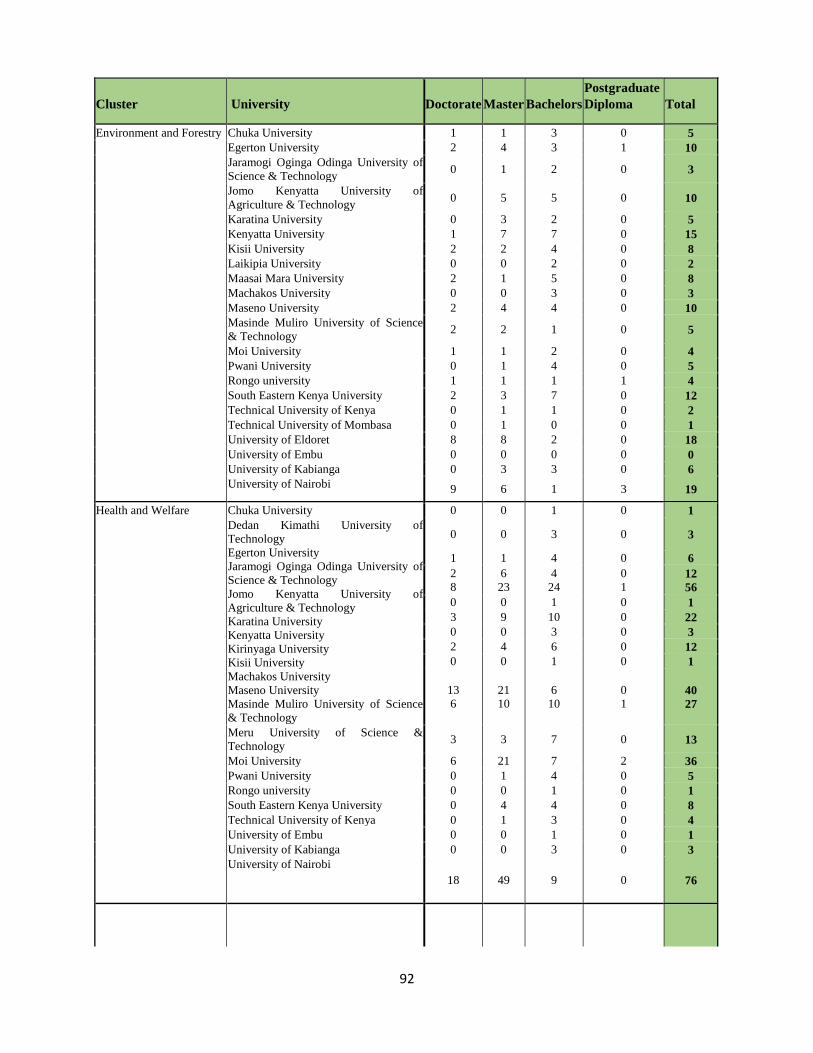
92
Cluster University Doctorate Master Bachelors
Postgraduate
Diploma Total
Environment and Forestry Chuka University 1 1 3 0 5
Egerton University 2 4 3 1 10
Jaramogi Oginga Odinga University of
Science & Technology 0 1 2 0 3
Jomo Kenyatta University of
Agriculture & Technology 0 5 5 0 10
Karatina University 0 3 2 0 5
Kenyatta University 1 7 7 0 15
Kisii University 2 2 4 0 8
Laikipia University 0 0 2 0 2
Maasai Mara University 2 1 5 0 8
Machakos University 0 0 3 0 3
Maseno University 2 4 4 0 10
Masinde Muliro University of Science
& Technology 2 2 1 0 5
Moi University 1 1 2 0 4
Pwani University 0 1 4 0 5
Rongo university 1 1 1 1 4
South Eastern Kenya University 2 3 7 0 12
Technical University of Kenya 0 1 1 0 2
Technical University of Mombasa 0 1 0 0 1
University of Eldoret 8 8 2 0 18
University of Embu 0 0 0 0 0
University of Kabianga 0 3 3 0 6
University of Nairobi 9 6 1 3 19
Health and Welfare Chuka University 0 0 1 0 1
Dedan Kimathi University of
Technology
Egerton University
Jaramogi Oginga Odinga University of
Science & Technology
Jomo Kenyatta University of
Agriculture & Technology
Karatina University
Kenyatta University
Kirinyaga University
Kisii University
Machakos University
Maseno University
Masinde Muliro University of Science
& Technology
0 0 3 0 3
1 1 4 0 6
2
8
6
23
4
24
0
1 12
56
0 0 1 0 1
3 9 10 0 22
0 0 3 0 3
2 4 6 0 12
0 0 1 0 1
13
6
21
10
6
10
0
1 40
27
Meru University of Science &
Technology 3 3 7 0 13
Moi University 6 21 7 2 36
Pwani University 0 1 4 0 5
Rongo university 0 0 1 0 1
South Eastern Kenya University 0 4 4 0 8
Technical University of Kenya 0 1 3 0 4
University of Embu 0 0 1 0 1
University of Kabianga 0 0 3 0 3
University of Nairobi
18 49 9 0 76
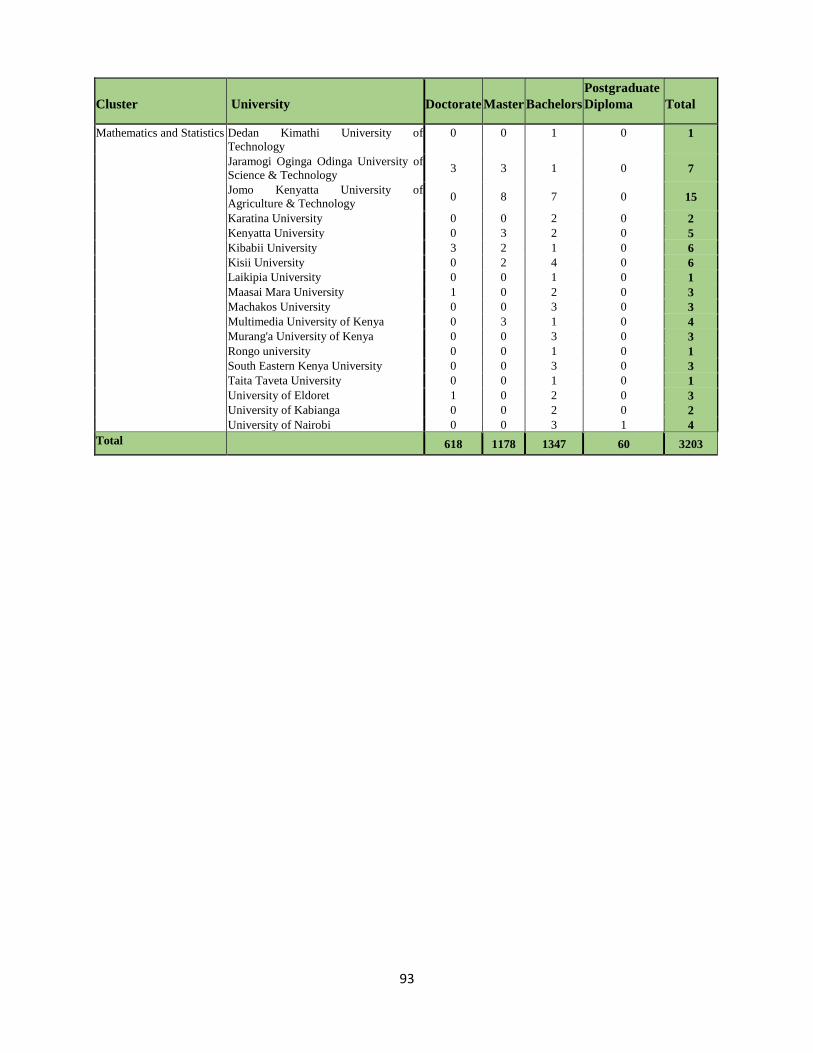
93
Cluster University Doctorate Master Bachelors
Postgraduate
Diploma Total
Mathematics and Statistics Dedan Kimathi University of
Technology
0 0 1 0 1
Jaramogi Oginga Odinga University of
Science & Technology 3 3 1 0 7
Jomo Kenyatta University of
Agriculture & Technology 0 8 7 0 15
Karatina University 0 0 2 0 2
Kenyatta University 0 3 2 0 5
Kibabii University 3 2 1 0 6
Kisii University 0 2 4 0 6
Laikipia University 0 0 1 0 1
Maasai Mara University 1 0 2 0 3
Machakos University 0 0 3 0 3
Multimedia University of Kenya 0 3 1 0 4
Murang'a University of Kenya 0 0 3 0 3
Rongo university 0 0 1 0 1
South Eastern Kenya University 0 0 3 0 3
Taita Taveta University 0 0 1 0 1
University of Eldoret 1 0 2 0 3
University of Kabianga 0 0 2 0 2
University of Nairobi 0 0 3 1 4
Total 618 1178 1347 60 3203
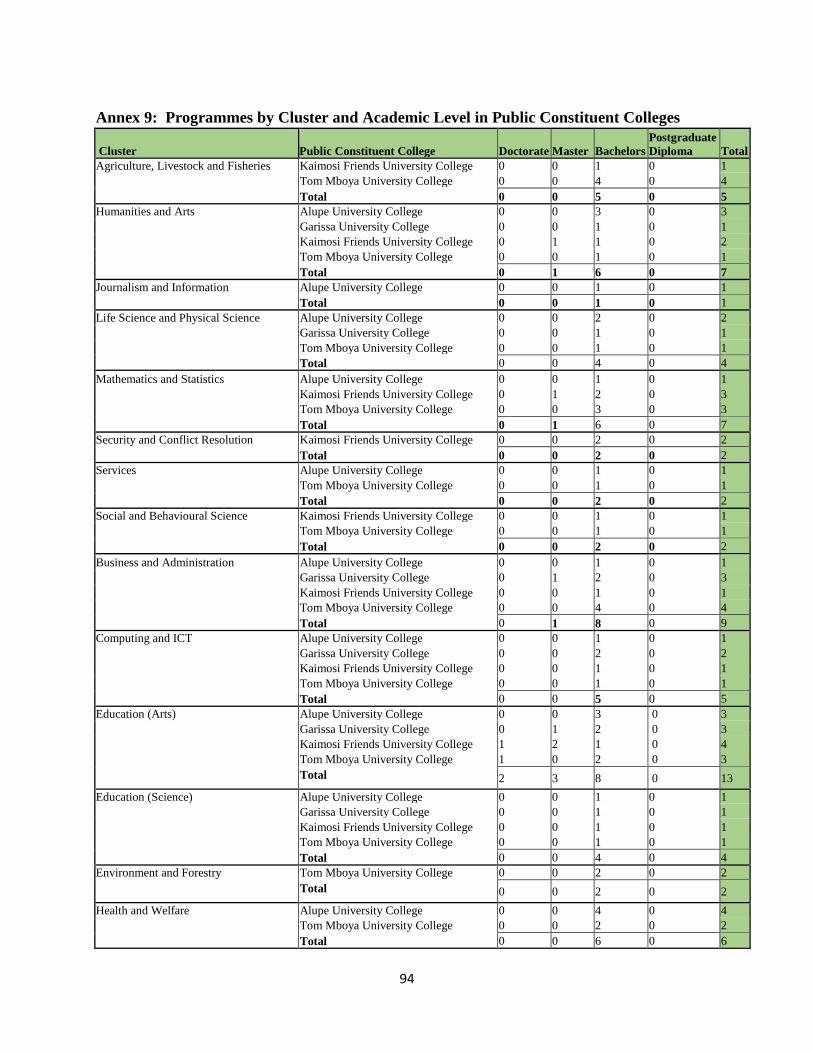
94
Annex 9: Programmes by Cluster and Academic Level in Public Constituent Colleges
Cluster Public Constituent College Doctorate Master Bachelors
Postgraduate
Diploma Total
Agriculture, Livestock and Fisheries Kaimosi Friends University College 0 0 1 0 1
Tom Mboya University College 0 0 4 0 4
Total 0 0 5 0 5
Humanities and Arts Alupe University College 0 0 3 0 3
Garissa University College 0 0 1 0 1
Kaimosi Friends University College 0 1 1 0 2
Tom Mboya University College 0 0 1 0 1
Total 0 1 6 0 7
Journalism and Information Alupe University College 0 0 1 0 1
Total 0 0 1 0 1
Life Science and Physical Science Alupe University College 0 0 2 0 2
Garissa University College 0 0 1 0 1
Tom Mboya University College 0 0 1 0 1
Total 0 0 4 0 4
Mathematics and Statistics Alupe University College 0 0 1 0 1
Kaimosi Friends University College 0 1 2 0 3
Tom Mboya University College 0 0 3 0 3
Total 0 1 6 0 7
Security and Conflict Resolution Kaimosi Friends University College 0 0 2 0 2
Total 0 0 2 0 2
Services Alupe University College 0 0 1 0 1
Tom Mboya University College 0 0 1 0 1
Total 0 0 2 0 2
Social and Behavioural Science Kaimosi Friends University College 0 0 1 0 1
Tom Mboya University College 0 0 1 0 1
Total 0 0 2 0 2
Business and Administration Alupe University College 0 0 1 0 1
Garissa University College 0 1 2 0 3
Kaimosi Friends University College 0 0 1 0 1
Tom Mboya University College 0 0 4 0 4
Total 0 1 8 0 9
Computing and ICT Alupe University College 0 0 1 0 1
Garissa University College 0 0 2 0 2
Kaimosi Friends University College 0 0 1 0 1
Tom Mboya University College 0 0 1 0 1
Total 0 0 5 0 5
Education (Arts) Alupe University College 0 0 3 0 3
Garissa University College 0 1 2 0 3
Kaimosi Friends University College 1 2 1 0 4
Tom Mboya University College 1 0 2 0 3
Total 2 3 8 0 13
Education (Science) Alupe University College 0 0 1 0 1
Garissa University College 0 0 1 0 1
Kaimosi Friends University College 0 0 1 0 1
Tom Mboya University College 0 0 1 0 1
Total 0 0 4 0 4
Environment and Forestry Tom Mboya University College 0 0 2 0 2
Total 0 0 2 0 2
Health and Welfare Alupe University College 0 0 4 0 4
Tom Mboya University College 0 0 2 0 2
Total 0 0 6 0 6
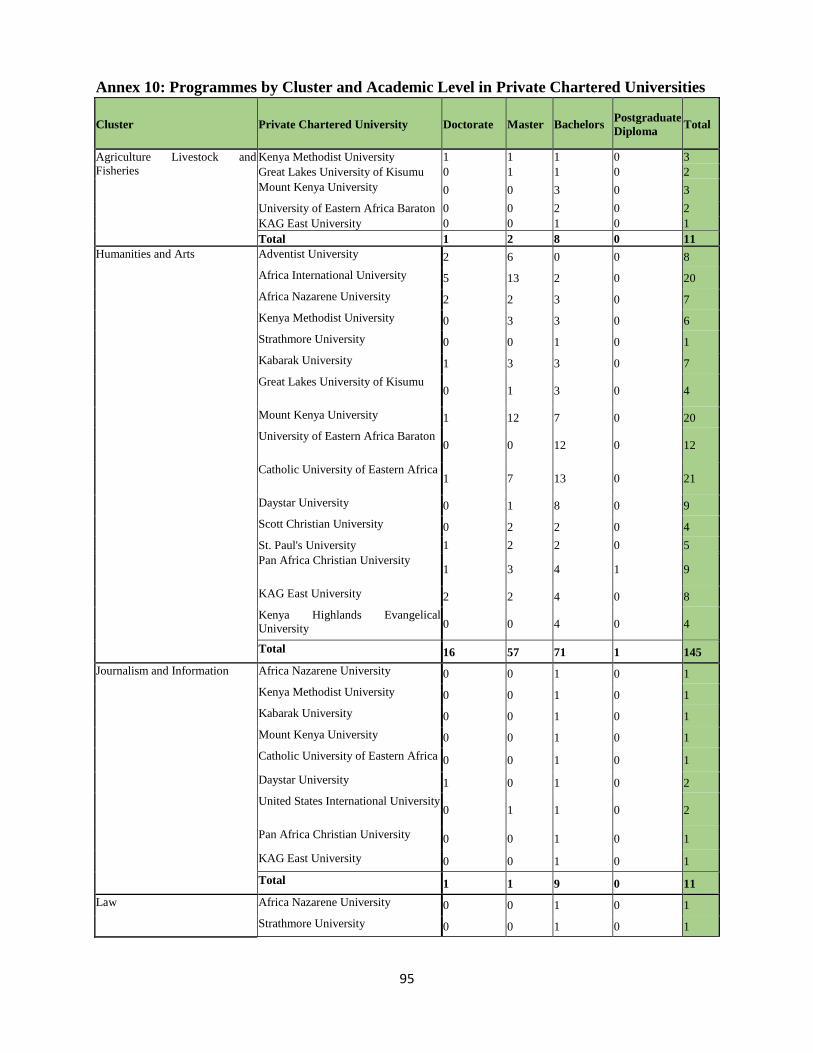
95
Annex 10: Programmes by Cluster and Academic Level in Private Chartered Universities
Cluster Private Chartered University Doctorate Master Bachelors Postgraduate
Diploma Total
Agriculture Livestock and
Fisheries
Kenya Methodist University 1 1 1 0 3
Great Lakes University of Kisumu 0 1 1 0 2
Mount Kenya University 0 0 3 0 3
University of Eastern Africa Baraton 0 0 2 0 2
KAG East University 0 0 1 0 1
Total 1 2 8 0 11
Humanities and Arts Adventist University 2 6 0 0 8
Africa International University 5 13 2 0 20
Africa Nazarene University 2 2 3 0 7
Kenya Methodist University 0 3 3 0 6
Strathmore University 0 0 1 0 1
Kabarak University 1 3 3 0 7
Great Lakes University of Kisumu 0 1 3 0 4
Mount Kenya University 1 12 7 0 20
University of Eastern Africa Baraton 0 0 12 0 12
Catholic University of Eastern Africa 1 7 13 0 21
Daystar University 0 1 8 0 9
Scott Christian University 0 2 2 0 4
St. Paul's University 1 2 2 0 5
Pan Africa Christian University 1 3 4 1 9
KAG East University 2 2 4 0 8
Kenya Highlands Evangelical
University 0 0 4 0 4
Total 16 57 71 1 145
Journalism and Information Africa Nazarene University 0 0 1 0 1
Kenya Methodist University 0 0 1 0 1
Kabarak University 0 0 1 0 1
Mount Kenya University 0 0 1 0 1
Catholic University of Eastern Africa 0 0 1 0 1
Daystar University 1 0 1 0 2
United States International University 0 1 1 0 2
Pan Africa Christian University 0 0 1 0 1
KAG East University 0 0 1 0 1
Total 1 1 9 0 11
Law Africa Nazarene University 0 0 1 0 1
Strathmore University 0 0 1 0 1
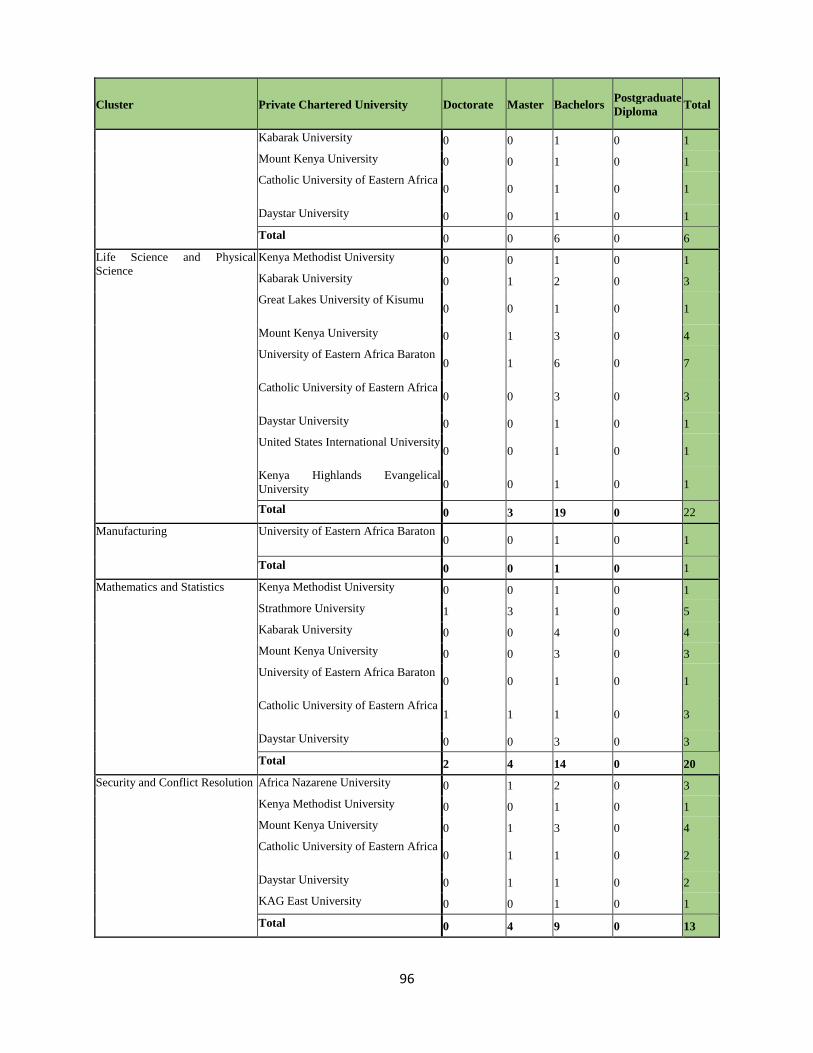
96
Cluster Private Chartered University Doctorate Master Bachelors Postgraduate
Diploma Total
Kabarak University 0 0 1 0 1
Mount Kenya University 0 0 1 0 1
Catholic University of Eastern Africa 0 0 1 0 1
Daystar University 0 0 1 0 1
Total 0 0 6 0 6
Life Science and Physical
Science
Kenya Methodist University 0 0 1 0 1
Kabarak University 0 1 2 0 3
Great Lakes University of Kisumu 0 0 1 0 1
Mount Kenya University 0 1 3 0 4
University of Eastern Africa Baraton 0 1 6 0 7
Catholic University of Eastern Africa 0 0 3 0 3
Daystar University 0 0 1 0 1
United States International University 0 0 1 0 1
Kenya Highlands Evangelical
University 0 0 1 0 1
Total 0 3 19 0 22
Manufacturing University of Eastern Africa Baraton 0 0 1 0 1
Total 0 0 1 0 1
Mathematics and Statistics Kenya Methodist University 0 0 1 0 1
Strathmore University 1 3 1 0 5
Kabarak University 0 0 4 0 4
Mount Kenya University 0 0 3 0 3
University of Eastern Africa Baraton 0 0 1 0 1
Catholic University of Eastern Africa 1 1 1 0 3
Daystar University 0 0 3 0 3
Total 2 4 14 0 20
Security and Conflict Resolution Africa Nazarene University 0 1 2 0 3
Kenya Methodist University 0 0 1 0 1
Mount Kenya University 0 1 3 0 4
Catholic University of Eastern Africa 0 1 1 0 2
Daystar University 0 1 1 0 2
KAG East University 0 0 1 0 1
Total 0 4 9 0 13
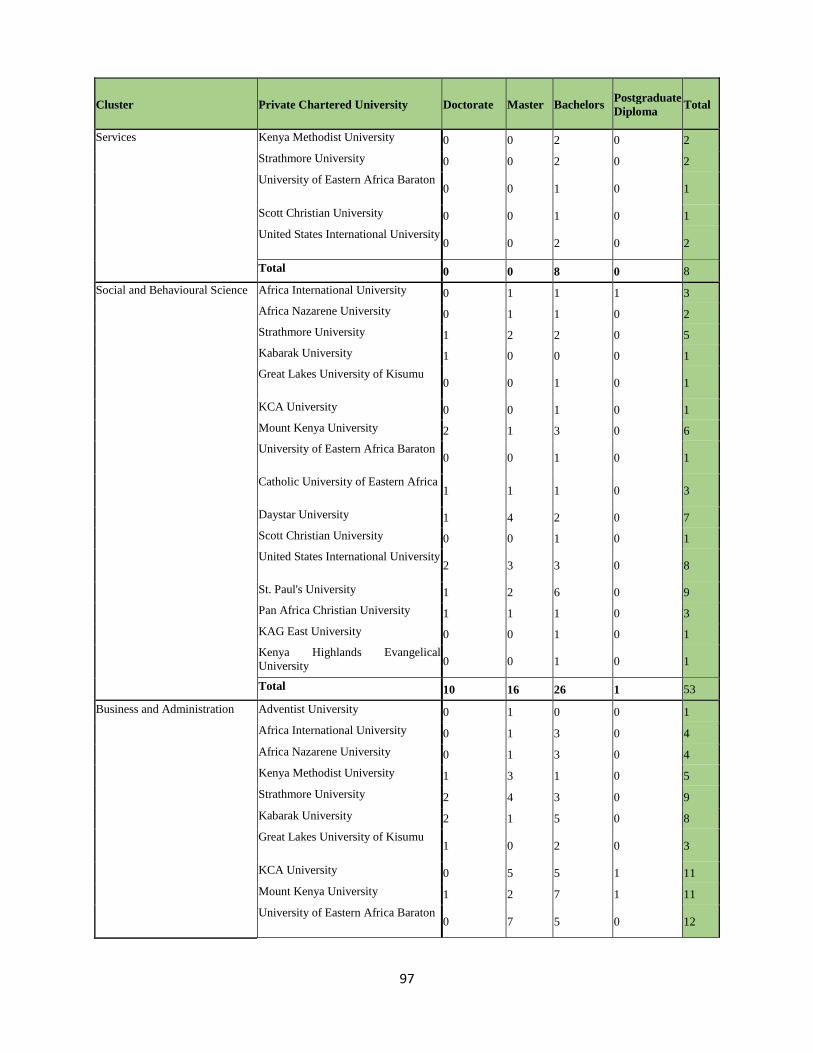
97
Cluster Private Chartered University Doctorate Master Bachelors Postgraduate
Diploma Total
Services Kenya Methodist University 0 0 2 0 2
Strathmore University 0 0 2 0 2
University of Eastern Africa Baraton 0 0 1 0 1
Scott Christian University 0 0 1 0 1
United States International University 0 0 2 0 2
Total 0 0 8 0 8
Social and Behavioural Science Africa International University 0 1 1 1 3
Africa Nazarene University 0 1 1 0 2
Strathmore University 1 2 2 0 5
Kabarak University 1 0 0 0 1
Great Lakes University of Kisumu 0 0 1 0 1
KCA University 0 0 1 0 1
Mount Kenya University 2 1 3 0 6
University of Eastern Africa Baraton 0 0 1 0 1
Catholic University of Eastern Africa 1 1 1 0 3
Daystar University 1 4 2 0 7
Scott Christian University 0 0 1 0 1
United States International University 2 3 3 0 8
St. Paul's University 1 2 6 0 9
Pan Africa Christian University 1 1 1 0 3
KAG East University 0 0 1 0 1
Kenya Highlands Evangelical
University 0 0 1 0 1
Total 10 16 26 1 53
Business and Administration Adventist University 0 1 0 0 1
Africa International University 0 1 3 0 4
Africa Nazarene University 0 1 3 0 4
Kenya Methodist University 1 3 1 0 5
Strathmore University 2 4 3 0 9
Kabarak University 2 1 5 0 8
Great Lakes University of Kisumu 1 0 2 0 3
KCA University 0 5 5 1 11
Mount Kenya University 1 2 7 1 11
University of Eastern Africa Baraton 0 7 5 0 12
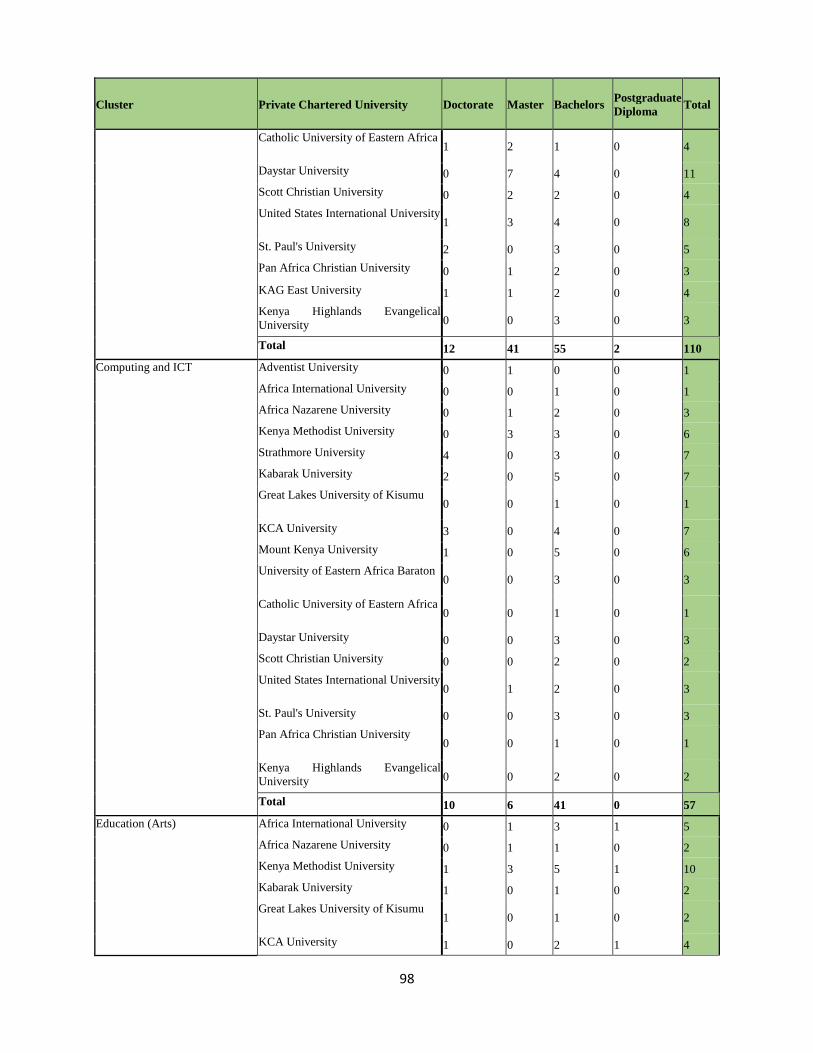
98
Cluster Private Chartered University Doctorate Master Bachelors Postgraduate
Diploma Total
Catholic University of Eastern Africa 1 2 1 0 4
Daystar University 0 7 4 0 11
Scott Christian University 0 2 2 0 4
United States International University 1 3 4 0 8
St. Paul's University 2 0 3 0 5
Pan Africa Christian University 0 1 2 0 3
KAG East University 1 1 2 0 4
Kenya Highlands Evangelical
University 0 0 3 0 3
Total 12 41 55 2 110
Computing and ICT Adventist University 0 1 0 0 1
Africa International University 0 0 1 0 1
Africa Nazarene University 0 1 2 0 3
Kenya Methodist University 0 3 3 0 6
Strathmore University 4 0 3 0 7
Kabarak University 2 0 5 0 7
Great Lakes University of Kisumu 0 0 1 0 1
KCA University 3 0 4 0 7
Mount Kenya University 1 0 5 0 6
University of Eastern Africa Baraton 0 0 3 0 3
Catholic University of Eastern Africa 0 0 1 0 1
Daystar University 0 0 3 0 3
Scott Christian University 0 0 2 0 2
United States International University 0 1 2 0 3
St. Paul's University 0 0 3 0 3
Pan Africa Christian University 0 0 1 0 1
Kenya Highlands Evangelical
University 0 0 2 0 2
Total 10 6 41 0 57
Education (Arts) Africa International University 0 1 3 1 5
Africa Nazarene University 0 1 1 0 2
Kenya Methodist University 1 3 5 1 10
Kabarak University 1 0 1 0 2
Great Lakes University of Kisumu 1 0 1 0 2
KCA University 1 0 2 1 4
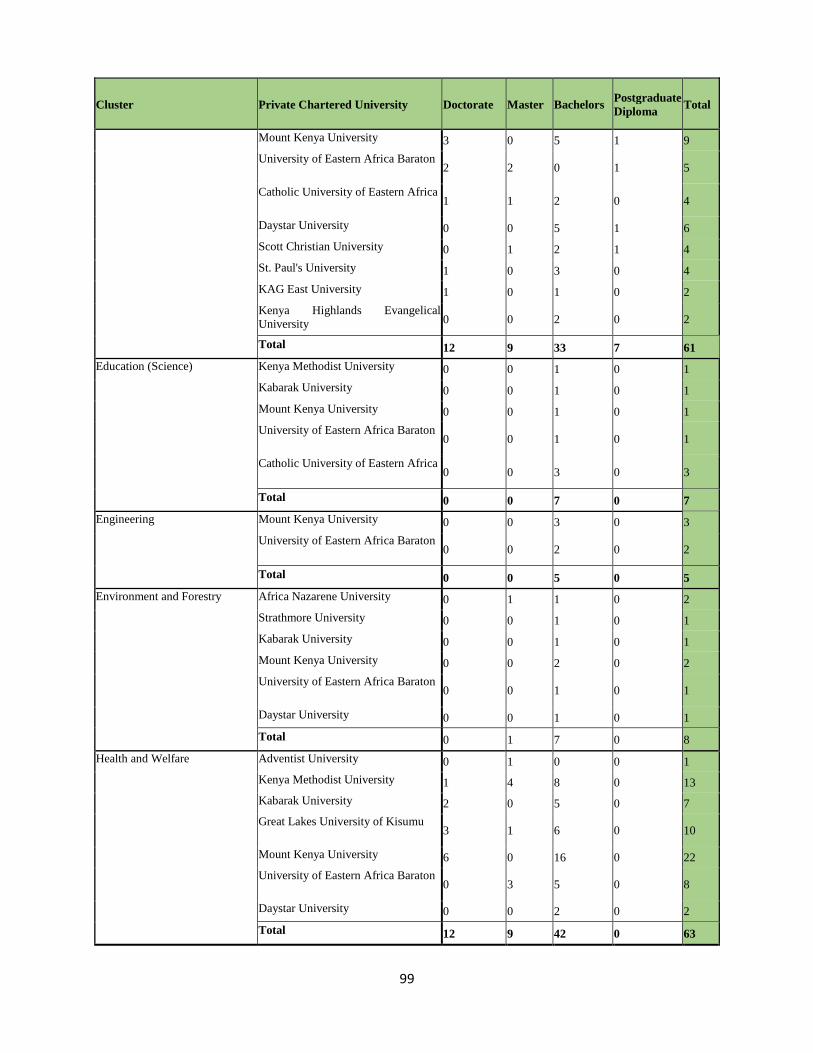
99
Cluster Private Chartered University Doctorate Master Bachelors Postgraduate
Diploma Total
Mount Kenya University 3 0 5 1 9
University of Eastern Africa Baraton 2 2 0 1 5
Catholic University of Eastern Africa 1 1 2 0 4
Daystar University 0 0 5 1 6
Scott Christian University 0 1 2 1 4
St. Paul's University 1 0 3 0 4
KAG East University 1 0 1 0 2
Kenya Highlands Evangelical
University 0 0 2 0 2
Total 12 9 33 7 61
Education (Science) Kenya Methodist University 0 0 1 0 1
Kabarak University 0 0 1 0 1
Mount Kenya University 0 0 1 0 1
University of Eastern Africa Baraton 0 0 1 0 1
Catholic University of Eastern Africa 0 0 3 0 3
Total 0 0 7 0 7
Engineering Mount Kenya University 0 0 3 0 3
University of Eastern Africa Baraton 0 0 2 0 2
Total 0 0 5 0 5
Environment and Forestry Africa Nazarene University 0 1 1 0 2
Strathmore University 0 0 1 0 1
Kabarak University 0 0 1 0 1
Mount Kenya University 0 0 2 0 2
University of Eastern Africa Baraton 0 0 1 0 1
Daystar University 0 0 1 0 1
Total 0 1 7 0 8
Health and Welfare Adventist University 0 1 0 0 1
Kenya Methodist University 1 4 8 0 13
Kabarak University 2 0 5 0 7
Great Lakes University of Kisumu 3 1 6 0 10
Mount Kenya University 6 0 16 0 22
University of Eastern Africa Baraton 0 3 5 0 8
Daystar University 0 0 2 0 2
Total 12 9 42 0 63
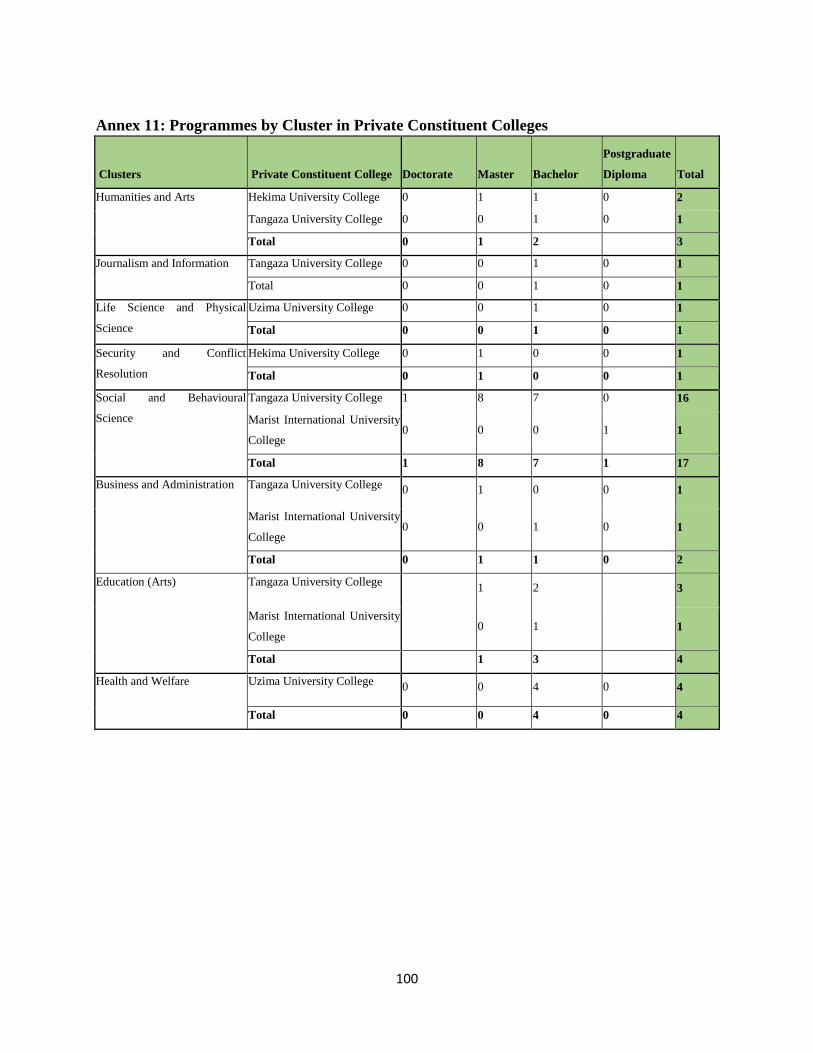
100
Annex 11: Programmes by Cluster in Private Constituent Colleges
Clusters Private Constituent College Doctorate Master Bachelor
Postgraduate
Diploma Total
Humanities and Arts Hekima University College 0 1 1 0 2
Tangaza University College 0 0 1 0 1
Total 0 1 2 3
Journalism and Information Tangaza University College 0 0 1 0 1
Total 0 0 1 0 1
Life Science and Physical
Science
Uzima University College 0 0 1 0 1
Total 0 0 1 0 1
Security and Conflict
Resolution
Hekima University College 0 1 0 0 1
Total 0 1 0 0 1
Social and Behavioural
Science
Tangaza University College 1 8 7 0 16
Marist International University
College 0 0 0 1 1
Total 1 8 7 1 17
Business and Administration Tangaza University College 0 1 0 0 1
Marist International University
College 0 0 1 0 1
Total 0 1 1 0 2
Education (Arts) Tangaza University College 1 2 3
Marist International University
College 0 1 1
Total 1 3 4
Health and Welfare Uzima University College 0 0 4 0 4
Total 0 0 4 0 4
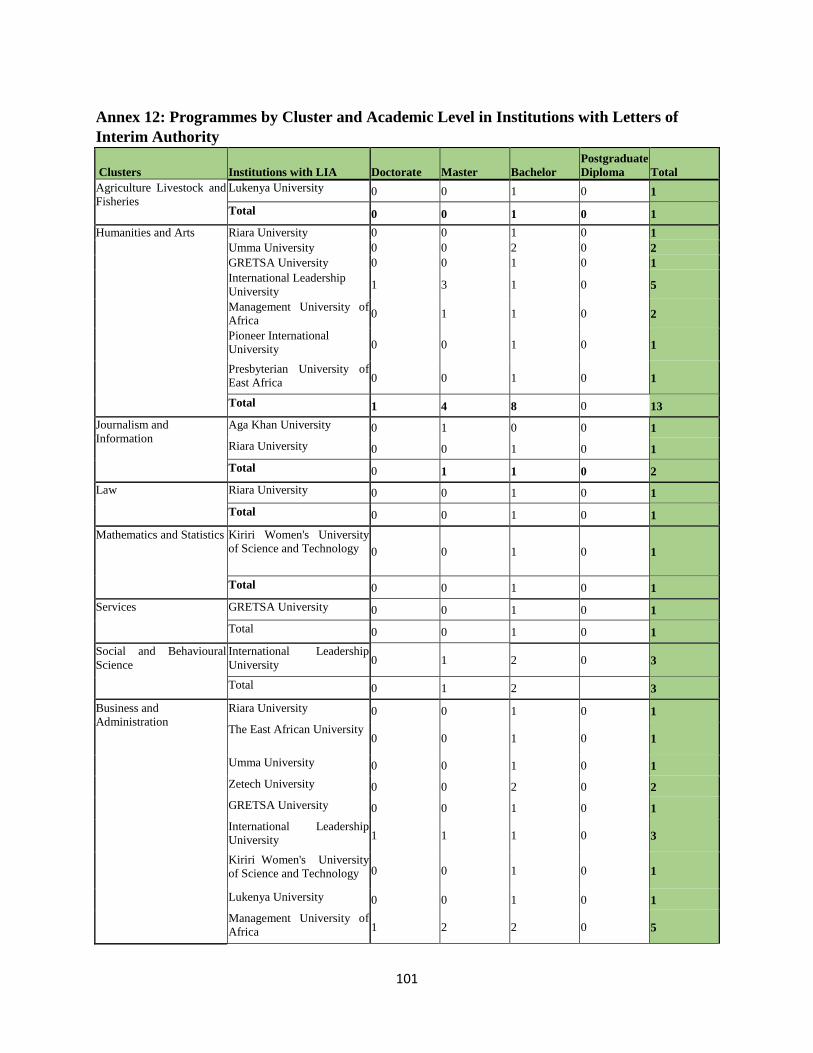
101
Annex 12: Programmes by Cluster and Academic Level in Institutions with Letters of
Interim Authority
Clusters Institutions with LIA Doctorate Master Bachelor
Postgraduate
Diploma Total
Agriculture Livestock and
Fisheries
Lukenya University 0 0 1 0 1
Total 0 0 1 0 1
Humanities and Arts Riara University 0 0 1 0 1
Umma University 0 0 2 0 2
GRETSA University 0 0 1 0 1
International Leadership
University 1 3 1 0 5
Management University of
Africa 0 1 1 0 2
Pioneer International
University 0 0 1 0 1
Presbyterian University of
East Africa 0 0 1 0 1
Total 1 4 8 0 13
Journalism and
Information
Aga Khan University 0 1 0 0 1
Riara University 0 0 1 0 1
Total 0 1 1 0 2
Law Riara University 0 0 1 0 1
Total 0 0 1 0 1
Mathematics and Statistics Kiriri Women's University
of Science and Technology 0 0 1 0 1
Total 0 0 1 0 1
Services GRETSA University 0 0 1 0 1
Total 0 0 1 0 1
Social and Behavioural
Science
International Leadership
University 0 1 2 0 3
Total 0 1 2 3
Business and
Administration
Riara University 0 0 1 0 1
The East African University 0 0 1 0 1
Umma University 0 0 1 0 1
Zetech University 0 0 2 0 2
GRETSA University 0 0 1 0 1
International Leadership
University 1 1 1 0 3
Kiriri Women's University
of Science and Technology 0 0 1 0 1
Lukenya University 0 0 1 0 1
Management University of
Africa 1 2 2 0 5
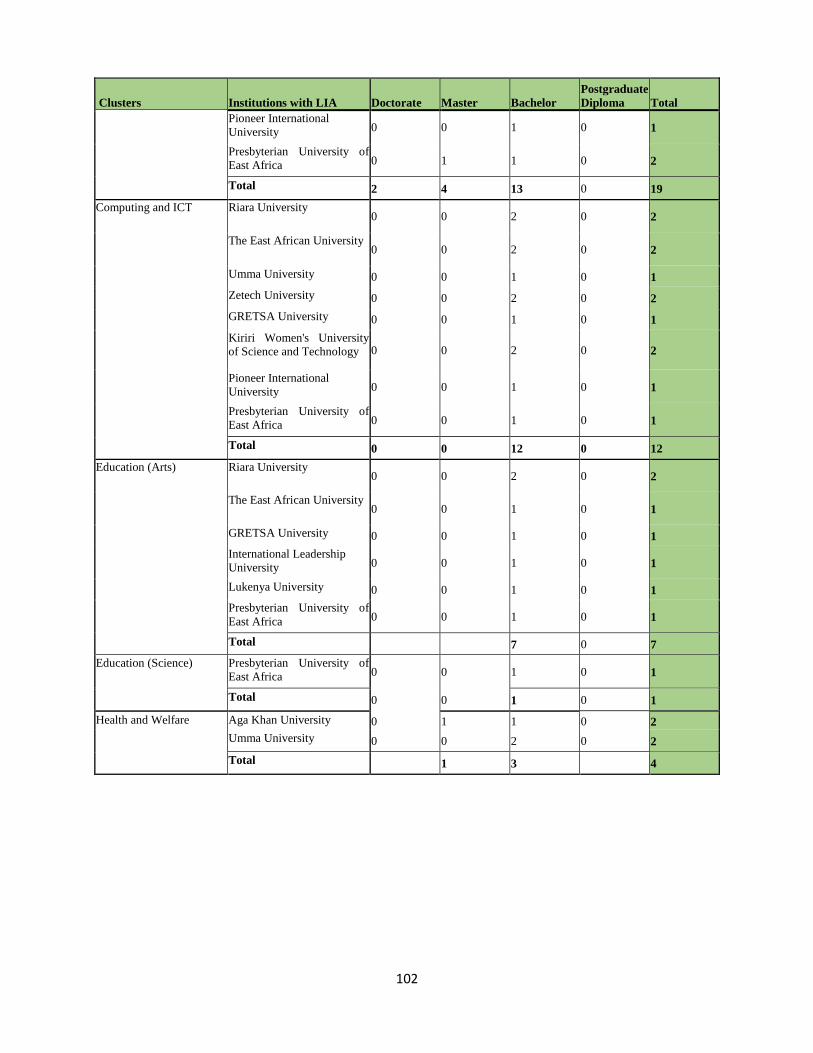
102
Clusters Institutions with LIA Doctorate Master Bachelor
Postgraduate
Diploma Total
Pioneer International
University 0 0 1 0 1
Presbyterian University of
East Africa 0 1 1 0 2
Total 2 4 13 0 19
Computing and ICT Riara University 0 0 2 0 2
The East African University 0 0 2 0 2
Umma University 0 0 1 0 1
Zetech University 0 0 2 0 2
GRETSA University 0 0 1 0 1
Kiriri Women's University
of Science and Technology 0 0 2 0 2
Pioneer International
University 0 0 1 0 1
Presbyterian University of
East Africa 0 0 1 0 1
Total 0 0 12 0 12
Education (Arts) Riara University 0 0 2 0 2
The East African University 0 0 1 0 1
GRETSA University 0 0 1 0 1
International Leadership
University 0 0 1 0 1
Lukenya University 0 0 1 0 1
Presbyterian University of
East Africa 0 0 1 0 1
Total 7 0 7
Education (Science) Presbyterian University of
East Africa 0 0 1 0 1
Total 0 0 1 0 1
Health and Welfare Aga Khan University 0 1 1 0 2
Umma University 0 0 2 0 2
Total 1 3 4
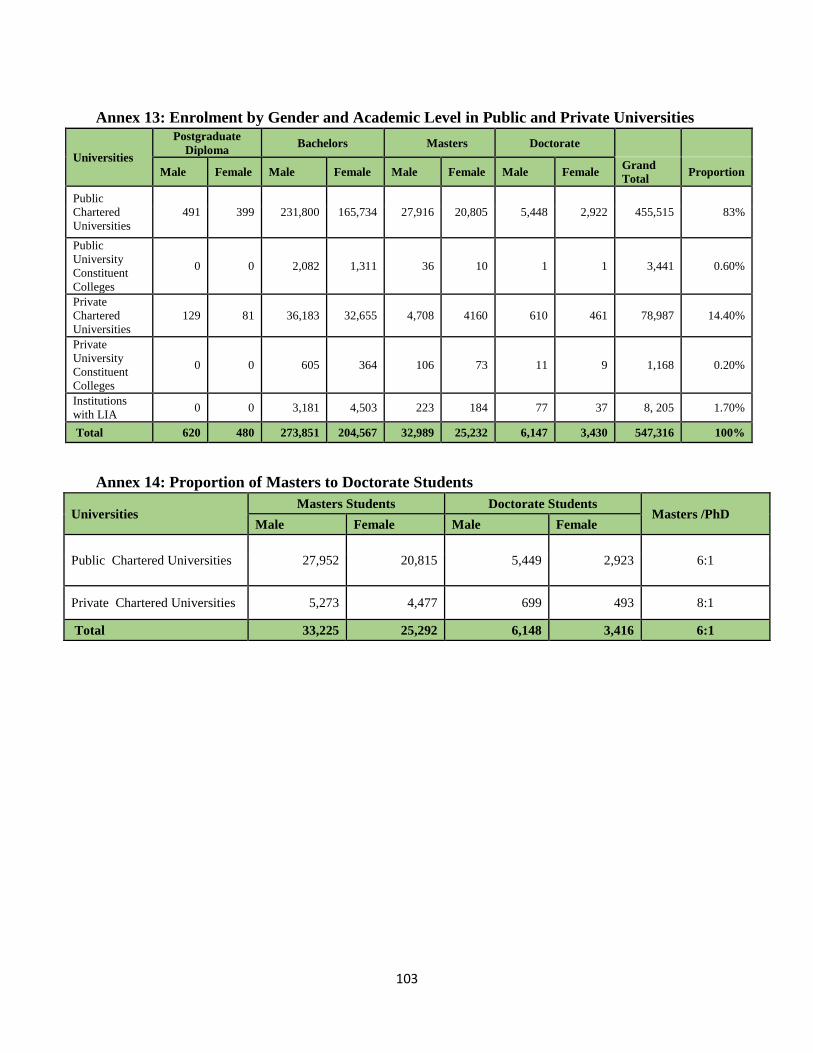
103
Annex 13: Enrolment by Gender and Academic Level in Public and Private Universities
Universities
Postgraduate
Diploma Bachelors Masters Doctorate
Male Female Male Female Male Female Male Female Grand
Total Proportion
Public
Chartered
Universities
491 399 231,800 165,734 27,916 20,805 5,448 2,922 455,515 83%
Public
University
Constituent
Colleges
0 0 2,082 1,311 36 10 1 1 3,441 0.60%
Private
Chartered
Universities
129 81 36,183 32,655 4,708 4160 610 461 78,987 14.40%
Private
University
Constituent
Colleges
0 0 605 364 106 73 11 9 1,168 0.20%
Institutions
with LIA 0 0 3,181 4,503 223 184 77 37 8, 205 1.70%
Total 620 480 273,851 204,567 32,989 25,232 6,147 3,430 547,316 100%
Annex 14: Proportion of Masters to Doctorate Students
Universities Masters Students Doctorate Students
Masters /PhD Male Female Male Female
Public Chartered Universities 27,952 20,815 5,449 2,923 6:1
Private Chartered Universities 5,273 4,477 699 493 8:1
Total 33,225 25,292 6,148 3,416 6:1
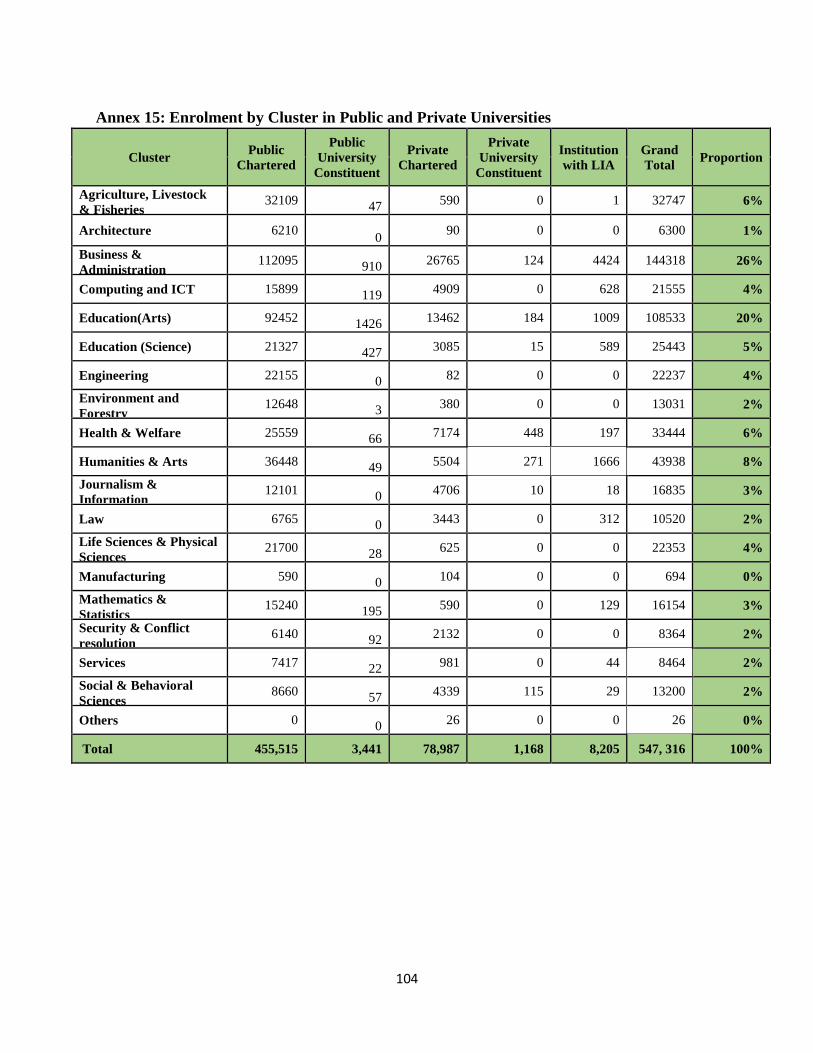
104
Annex 15: Enrolment by Cluster in Public and Private Universities
Cluster Public
Chartered
Public
University
Constituent
Private
Chartered
Private
University
Constituent
Institution
with LIA
Grand
Total Proportion
Agriculture, Livestock
& Fisheries 32109
47 590 0 1 32747 6%
Architecture 6210 0
90 0 0 6300 1%
Business &
Administration 112095
910 26765 124 4424 144318 26%
Computing and ICT 15899 119
4909 0 628 21555 4%
Education(Arts) 92452 1426
13462 184 1009 108533 20%
Education (Science) 21327 427
3085 15 589 25443 5%
Engineering 22155 0
82 0 0 22237 4%
Environment and
Forestry 12648
3 380 0 0 13031 2%
Health & Welfare 25559 66
7174 448 197 33444 6%
Humanities & Arts 36448 49
5504 271 1666 43938 8%
Journalism &
Information 12101
0 4706 10 18 16835 3%
Law 6765 0
3443 0 312 10520 2%
Life Sciences & Physical
Sciences 21700
28 625 0 0 22353 4%
Manufacturing 590 0
104 0 0 694 0%
Mathematics &
Statistics 15240
195 590 0 129 16154 3%
Security & Conflict
resolution 6140
92 2132 0 0 8364 2%
Services 7417 22
981 0 44 8464 2%
Social & Behavioral
Sciences 8660
57 4339 115 29 13200 2%
Others 0 0
26 0 0 26 0%
Total 455,515 3,441 78,987 1,168 8,205 547, 316 100%
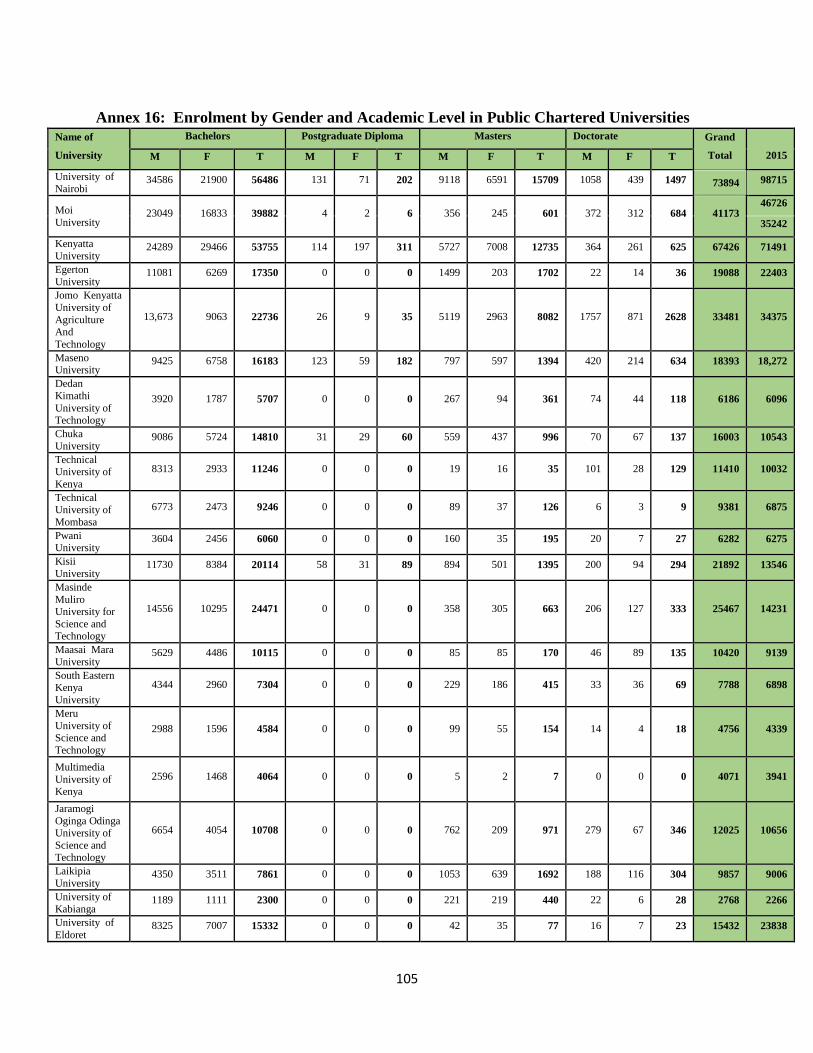
105
Annex 16: Enrolment by Gender and Academic Level in Public Chartered Universities
Name of
University
Bachelors Postgraduate Diploma Masters Doctorate Grand
Total
2015 M F T M F T M F T M F T
University of Nairobi
34586 21900 56486 131 71 202 9118 6591 15709 1058 439 1497 73894 98715
Moi
University 23049 16833 39882 4 2 6 356 245 601 372 312 684 41173
46726
35242
Kenyatta
University 24289 29466 53755 114 197 311 5727 7008 12735 364 261 625 67426 71491
Egerton
University 11081 6269 17350 0 0 0 1499 203 1702 22 14 36 19088 22403
Jomo Kenyatta
University of
Agriculture And
Technology
13,673 9063 22736 26 9 35 5119 2963 8082 1757 871 2628 33481 34375
Maseno University
9425 6758 16183 123 59 182 797 597 1394 420 214 634 18393 18,272
Dedan
Kimathi
University of Technology
3920 1787 5707 0 0 0 267 94 361 74 44 118 6186 6096
Chuka
University 9086 5724 14810 31 29 60 559 437 996 70 67 137 16003 10543
Technical University of
Kenya
8313 2933 11246 0 0 0 19 16 35 101 28 129 11410 10032
Technical University of
Mombasa
6773 2473 9246 0 0 0 89 37 126 6 3 9 9381 6875
Pwani University
3604 2456 6060 0 0 0 160 35 195 20 7 27 6282 6275
Kisii
University 11730 8384 20114 58 31 89 894 501 1395 200 94 294 21892 13546
Masinde
Muliro University for
Science and Technology
14556 10295 24471 0 0 0 358 305 663 206 127 333 25467 14231
Maasai Mara
University 5629 4486 10115 0 0 0 85 85 170 46 89 135 10420 9139
South Eastern Kenya
University
4344 2960 7304 0 0 0 229 186 415 33 36 69 7788 6898
Meru
University of Science and
Technology
2988 1596 4584 0 0 0 99 55 154 14 4 18 4756 4339
Multimedia
University of Kenya
2596 1468 4064 0 0 0 5 2 7 0 0 0 4071 3941
Jaramogi
Oginga Odinga University of
Science and Technology
6654 4054 10708 0 0 0 762 209 971 279 67 346 12025 10656
Laikipia
University 4350 3511 7861 0 0 0 1053 639 1692 188 116 304 9857 9006
University of Kabianga
1189 1111 2300 0 0 0 221 219 440 22 6 28 2768 2266
University of
Eldoret 8325 7007 15332 0 0 0 42 35 77 16 7 23 15432 23838
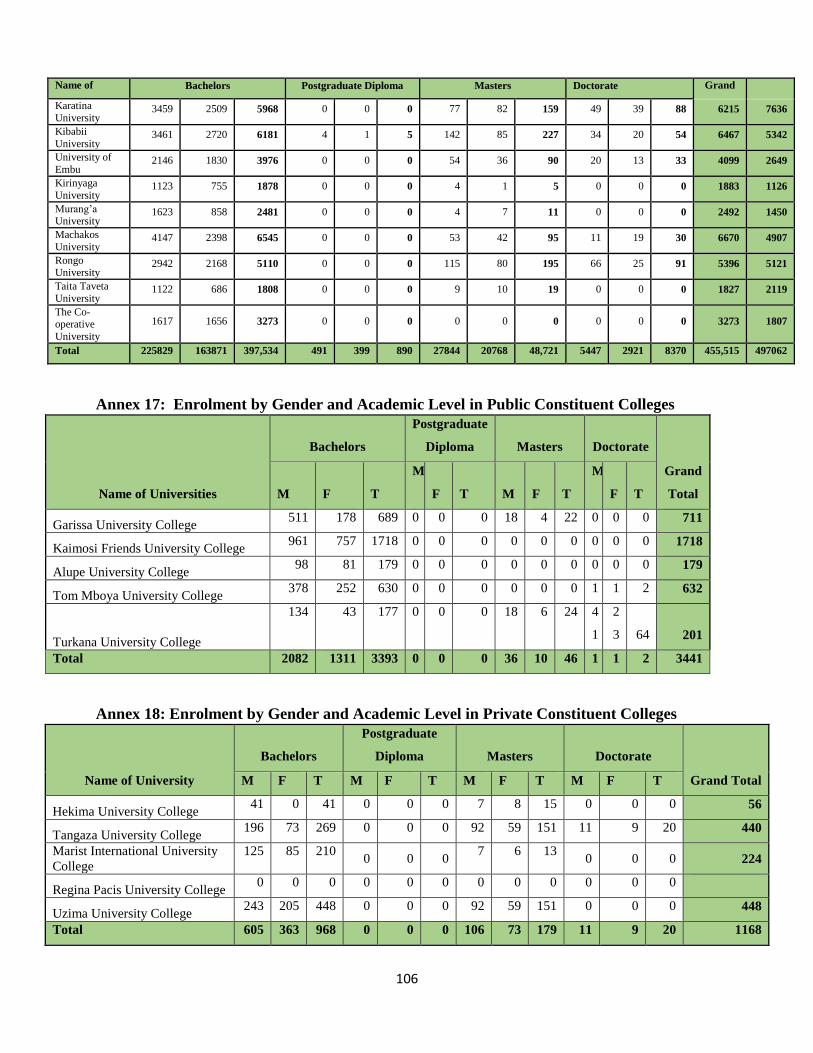
106
Name of
University
Bachelors Postgraduate Diploma Masters Doctorate Grand
Total
2015 Karatina
University 3459 2509 5968 0 0 0 77 82 159 49 39 88 6215 7636
Kibabii
University 3461 2720 6181 4 1 5 142 85 227 34 20 54 6467 5342
University of
Embu 2146 1830 3976 0 0 0 54 36 90 20 13 33 4099 2649
Kirinyaga
University 1123 755 1878 0 0 0 4 1 5 0 0 0 1883 1126
Murang’a University
1623 858 2481 0 0 0 4 7 11 0 0 0 2492 1450
Machakos
University 4147 2398 6545 0 0 0 53 42 95 11 19 30 6670 4907
Rongo University
2942 2168 5110 0 0 0 115 80 195 66 25 91 5396 5121
Taita Taveta
University 1122 686 1808 0 0 0 9 10 19 0 0 0 1827 2119
The Co-operative
University
1617 1656 3273 0 0 0 0 0 0 0 0 0 3273 1807
Total 225829 163871 397,534 491 399 890 27844 20768 48,721 5447 2921 8370 455,515 497062
Annex 17: Enrolment by Gender and Academic Level in Public Constituent Colleges
Name of Universities
Bachelors
Postgraduate
Diploma Masters Doctorate
Grand
Total M F T
M
F T M F T
M
F T
Garissa University College 511 178 689 0 0 0 18 4 22 0 0 0 711
Kaimosi Friends University College 961 757 1718 0 0 0 0 0 0 0 0 0 1718
Alupe University College 98 81 179 0 0 0 0 0 0 0 0 0 179
Tom Mboya University College 378 252 630 0 0 0 0 0 0 1 1 2 632
Turkana University College
134 43 177 0 0 0 18 6 24 4
1
2
3 64 201
Total 2082 1311 3393 0 0 0 36 10 46 1 1 2 3441
Annex 18: Enrolment by Gender and Academic Level in Private Constituent Colleges
Name of University
Bachelors
Postgraduate
Diploma Masters Doctorate
Grand Total M F T M F T M F T M F T
Hekima University College 41 0 41 0 0 0 7 8 15 0 0 0 56
Tangaza University College 196 73 269 0 0 0 92 59 151 11 9 20 440
Marist International University
College
125 85 210 0 0 0
7 6 13 0 0 0 224
Regina Pacis University College 0 0 0 0 0 0 0 0 0 0 0 0
Uzima University College 243 205 448 0 0 0 92 59 151 0 0 0 448
Total 605 363 968 0 0 0 106 73 179 11 9 20 1168
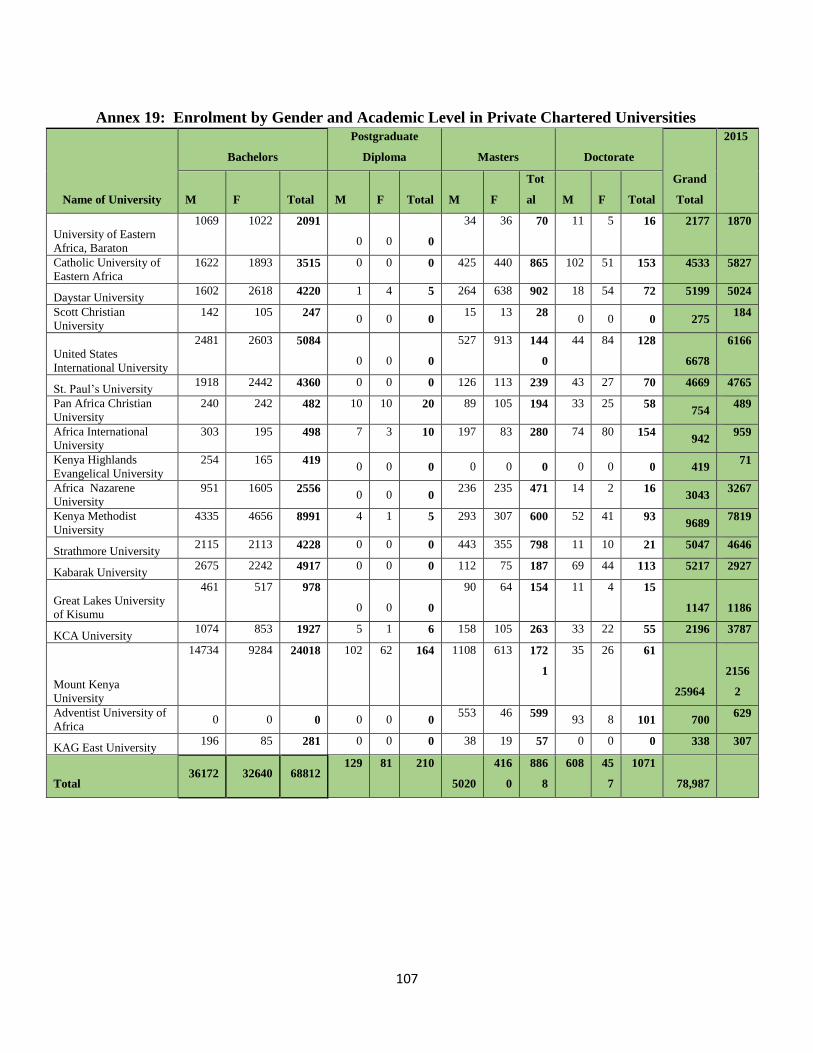
107
Annex 19: Enrolment by Gender and Academic Level in Private Chartered Universities
Name of University
Bachelors
Postgraduate
Diploma Masters Doctorate
Grand
Total
2015
M F Total M F Total M F
Tot
al M F Total
University of Eastern
Africa, Baraton
1069 1022 2091
0 0 0
34 36 70 11 5 16 2177
1870
Catholic University of
Eastern Africa
1622 1893 3515 0 0 0 425 440 865 102 51 153 4533 5827
Daystar University 1602 2618 4220 1 4 5 264 638 902 18 54 72 5199 5024
Scott Christian
University
142 105 247 0 0 0
15 13 28 0 0 0 275
184
United States
International University
2481 2603 5084
0 0 0
527 913 144
0
44 84 128
6678
6166
St. Paul’s University 1918 2442 4360 0 0 0 126 113 239 43 27 70 4669 4765
Pan Africa Christian
University
240 242 482 10 10 20 89 105 194 33 25 58 754
489
Africa International
University
303 195 498 7 3 10 197 83 280 74 80 154 942
959
Kenya Highlands
Evangelical University
254 165 419 0 0 0 0 0 0 0 0 0 419
71
Africa Nazarene
University
951 1605 2556 0 0 0
236 235 471 14 2 16 3043
3267
Kenya Methodist
University
4335 4656 8991 4 1 5 293 307 600 52 41 93 9689
7819
Strathmore University 2115 2113 4228 0 0 0 443 355 798 11 10 21 5047 4646
Kabarak University 2675 2242 4917 0 0 0 112 75 187 69 44 113 5217 2927
Great Lakes University
of Kisumu
461 517 978
0 0 0
90 64 154 11 4 15
1147
1186
KCA University 1074 853 1927 5 1 6 158 105 263 33 22 55 2196 3787
Mount Kenya
University
14734 9284 24018 102 62 164 1108 613 172
1
35 26 61
25964
2156
2
Adventist University of
Africa 0 0 0 0 0 0
553 46 599 93 8 101 700
629
KAG East University 196 85 281 0 0 0 38 19 57 0 0 0 338 307
Total 36172 32640 68812
129 81 210
5020
416
0
886
8
608 45
7
1071
78,987
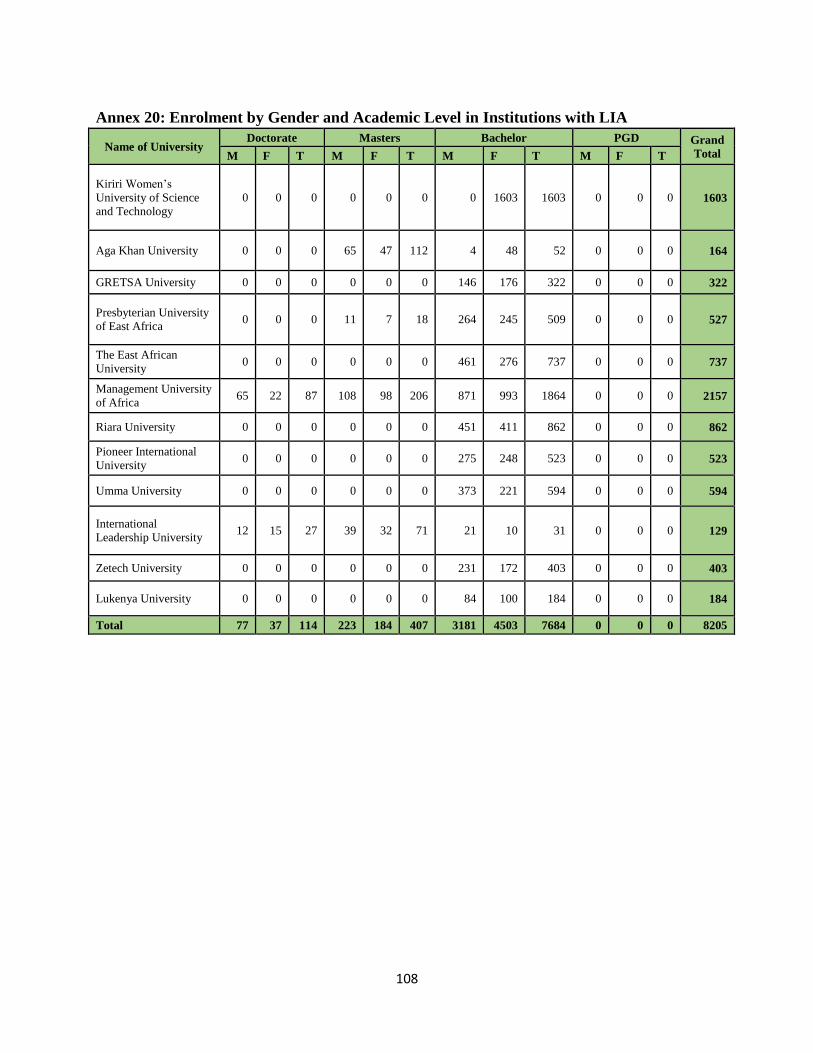
108
Annex 20: Enrolment by Gender and Academic Level in Institutions with LIA
Name of University Doctorate Masters Bachelor PGD Grand
Total M F T M F T M F T M F T
Kiriri Women’s
University of Science
and Technology
0 0 0 0 0 0 0 1603 1603 0 0 0 1603
Aga Khan University 0 0 0 65 47 112 4 48 52 0 0 0 164
GRETSA University 0 0 0 0 0 0 146 176 322 0 0 0 322
Presbyterian University
of East Africa 0 0 0 11 7 18 264 245 509 0 0 0 527
The East African
University 0 0 0 0 0 0 461 276 737 0 0 0 737
Management University
of Africa 65 22 87 108 98 206 871 993 1864 0 0 0 2157
Riara University 0 0 0 0 0 0 451 411 862 0 0 0 862
Pioneer International
University 0 0 0 0 0 0 275 248 523 0 0 0 523
Umma University 0 0 0 0 0 0 373 221 594 0 0 0 594
International
Leadership University 12 15 27 39 32 71 21 10 31 0 0 0 129
Zetech University 0 0 0 0 0 0 231 172 403 0 0 0 403
Lukenya University 0 0 0 0 0 0 84 100 184 0 0 0 184
Total 77 37 114 223 184 407 3181 4503 7684 0 0 0 8205
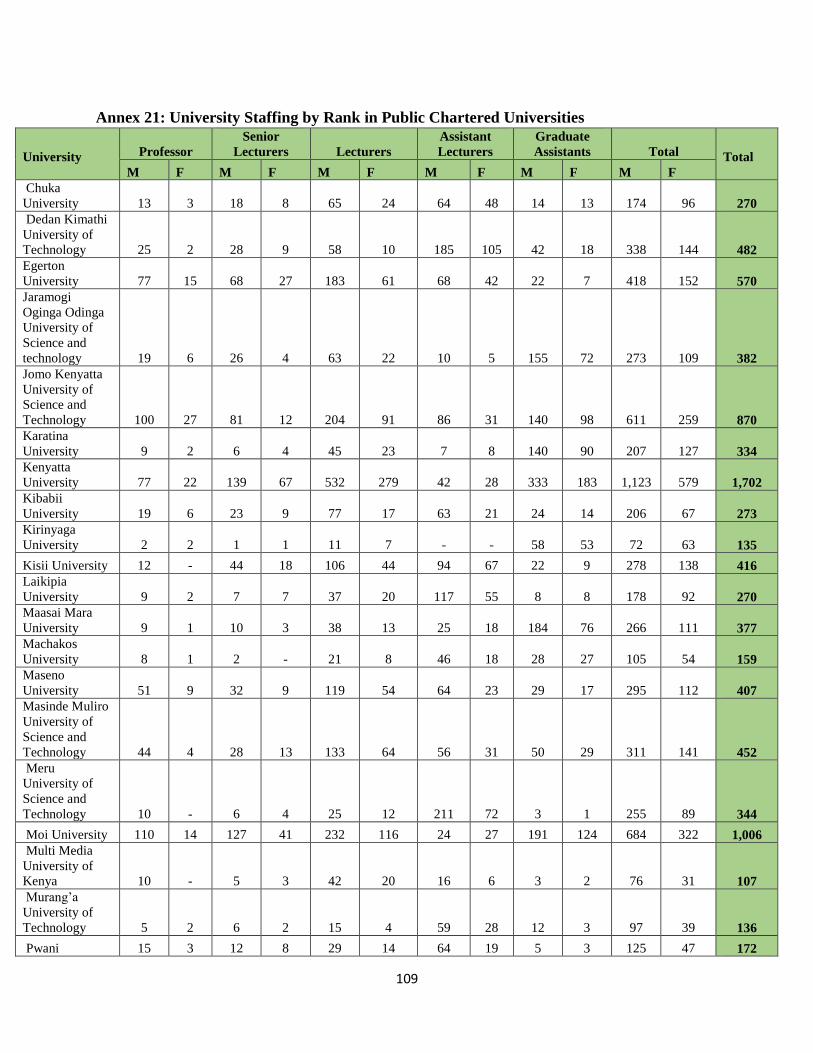
109
Annex 21: University Staffing by Rank in Public Chartered Universities
University
Professor
Senior
Lecturers Lecturers
Assistant
Lecturers
Graduate
Assistants Total Total
M F M F M F M F M F M F
Chuka
University 13 3 18 8 65 24 64 48 14 13 174 96 270
Dedan Kimathi
University of
Technology 25 2 28 9 58 10 185 105 42 18 338 144 482
Egerton
University 77 15 68 27 183 61 68 42 22 7 418 152 570
Jaramogi
Oginga Odinga
University of
Science and
technology 19 6 26 4 63 22 10 5 155 72 273 109 382
Jomo Kenyatta
University of
Science and
Technology 100 27 81 12 204 91 86 31 140 98 611 259 870
Karatina
University 9 2 6 4 45 23 7 8 140 90 207 127 334
Kenyatta
University 77 22 139 67 532 279 42 28 333 183 1,123 579 1,702
Kibabii
University 19 6 23 9 77 17 63 21 24 14 206 67 273
Kirinyaga
University 2 2 1 1 11 7 - - 58 53 72 63 135
Kisii University 12 - 44 18 106 44 94 67 22 9 278 138 416
Laikipia
University 9 2 7 7 37 20 117 55 8 8 178 92 270
Maasai Mara
University 9 1 10 3 38 13 25 18 184 76 266 111 377
Machakos
University 8 1 2 - 21 8 46 18 28 27 105 54 159
Maseno
University 51 9 32 9 119 54 64 23 29 17 295 112 407
Masinde Muliro
University of
Science and
Technology 44 4 28 13 133 64 56 31 50 29 311 141 452
Meru
University of
Science and
Technology 10 - 6 4 25 12 211 72 3 1 255 89 344
Moi University 110 14 127 41 232 116 24 27 191 124 684 322 1,006
Multi Media
University of
Kenya 10 - 5 3 42 20 16 6 3 2 76 31 107
Murang’a
University of
Technology 5 2 6 2 15 4 59 28 12 3 97 39 136
Pwani 15 3 12 8 29 14 64 19 5 3 125 47 172
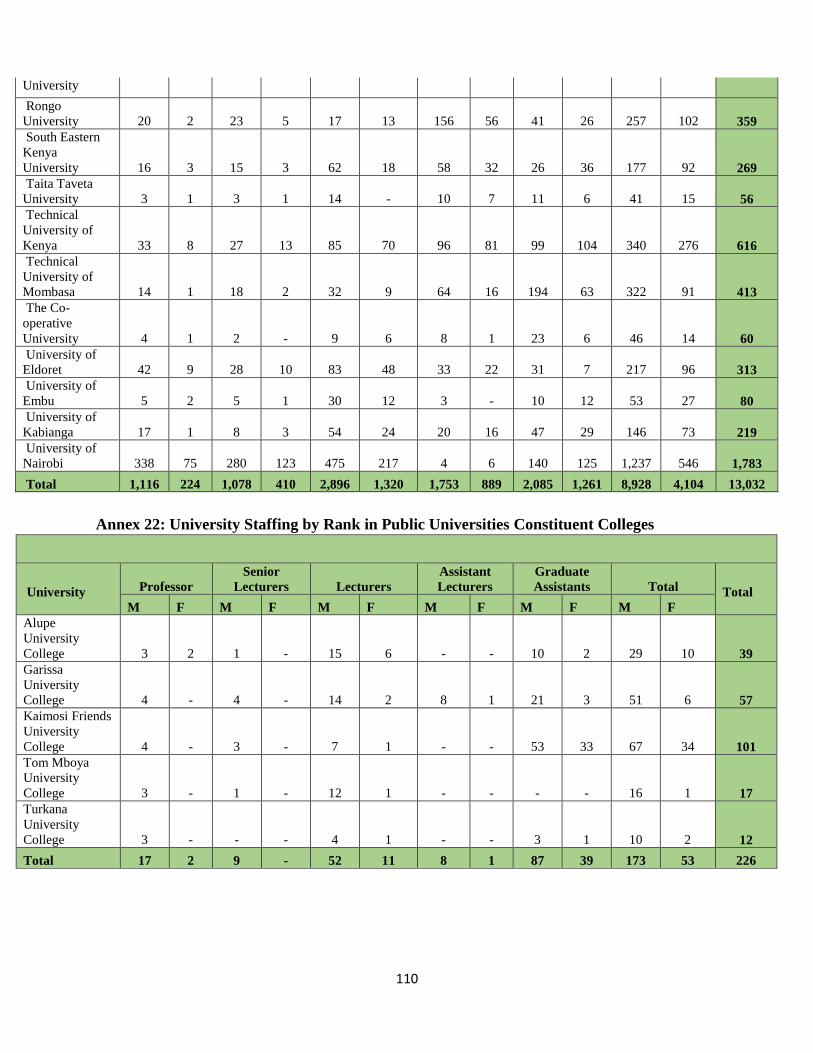
110
University
Rongo
University 20 2 23 5 17 13 156 56 41 26 257 102 359
South Eastern
Kenya
University 16 3 15 3 62 18 58 32 26 36 177 92 269
Taita Taveta
University 3 1 3 1 14 - 10 7 11 6 41 15 56
Technical
University of
Kenya 33 8 27 13 85 70 96 81 99 104 340 276 616
Technical
University of
Mombasa 14 1 18 2 32 9 64 16 194 63 322 91 413
The Co-
operative
University 4 1 2 - 9 6 8 1 23 6 46 14 60
University of
Eldoret 42 9 28 10 83 48 33 22 31 7 217 96 313
University of
Embu 5 2 5 1 30 12 3 - 10 12 53 27 80
University of
Kabianga 17 1 8 3 54 24 20 16 47 29 146 73 219
University of
Nairobi 338 75 280 123 475 217 4 6 140 125 1,237 546 1,783
Total 1,116 224 1,078 410 2,896 1,320 1,753 889 2,085 1,261 8,928 4,104 13,032
Annex 22: University Staffing by Rank in Public Universities Constituent Colleges
University
Professor
Senior
Lecturers Lecturers
Assistant
Lecturers
Graduate
Assistants Total Total
M F M F M F M F M F M F
Alupe
University
College 3 2 1 - 15 6 - - 10 2 29 10 39
Garissa
University
College 4 - 4 - 14 2 8 1 21 3 51 6 57
Kaimosi Friends
University
College 4 - 3 - 7 1 - - 53 33 67 34 101
Tom Mboya
University
College 3 - 1 - 12 1 - - - - 16 1 17
Turkana
University
College 3 - - - 4 1 - - 3 1 10 2 12
Total 17 2 9 - 52 11 8 1 87 39 173 53 226
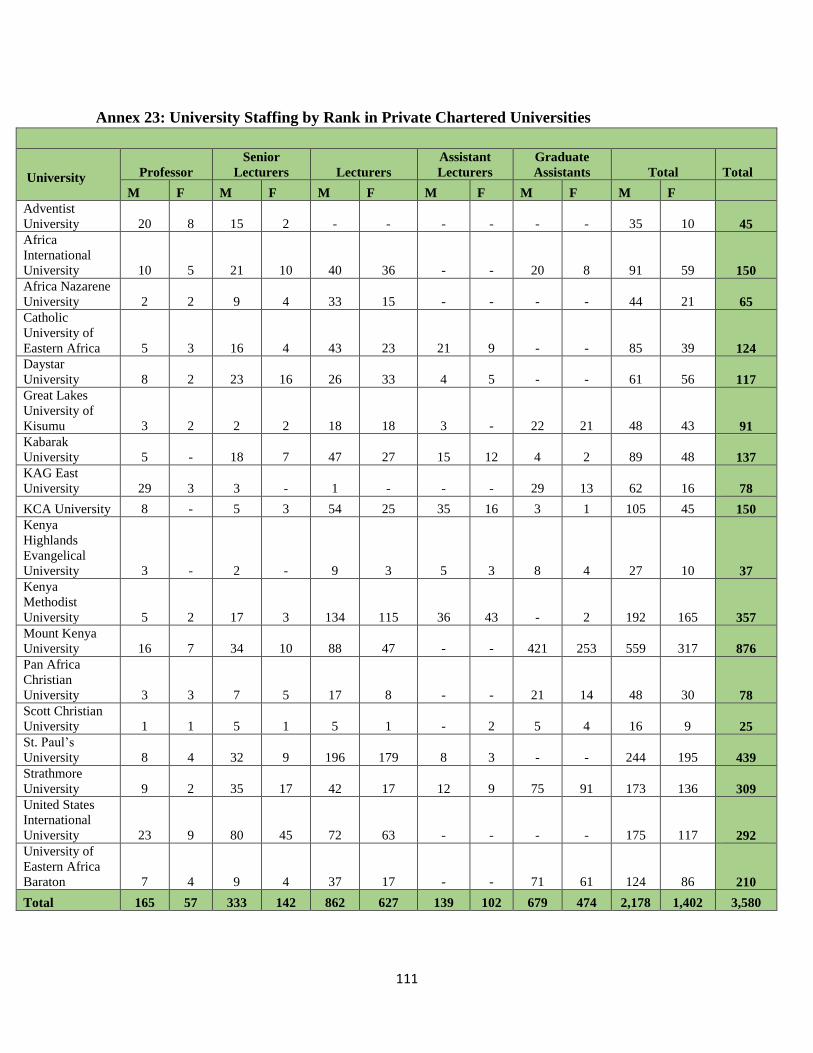
111
Annex 23: University Staffing by Rank in Private Chartered Universities
University
Professor
Senior
Lecturers Lecturers
Assistant
Lecturers
Graduate
Assistants Total Total
M F M F M F M F M F M F
Adventist
University 20 8 15 2 - - - - - - 35 10 45
Africa
International
University 10 5 21 10 40 36 - - 20 8 91 59 150
Africa Nazarene
University 2 2 9 4 33 15 - - - - 44 21 65
Catholic
University of
Eastern Africa 5 3 16 4 43 23 21 9 - - 85 39 124
Daystar
University 8 2 23 16 26 33 4 5 - - 61 56 117
Great Lakes
University of
Kisumu 3 2 2 2 18 18 3 - 22 21 48 43 91
Kabarak
University 5 - 18 7 47 27 15 12 4 2 89 48 137
KAG East
University 29 3 3 - 1 - - - 29 13 62 16 78
KCA University 8 - 5 3 54 25 35 16 3 1 105 45 150
Kenya
Highlands
Evangelical
University 3 - 2 - 9 3 5 3 8 4 27 10 37
Kenya
Methodist
University 5 2 17 3 134 115 36 43 - 2 192 165 357
Mount Kenya
University 16 7 34 10 88 47 - - 421 253 559 317 876
Pan Africa
Christian
University 3 3 7 5 17 8 - - 21 14 48 30 78
Scott Christian
University 1 1 5 1 5 1 - 2 5 4 16 9 25
St. Paul’s
University 8 4 32 9 196 179 8 3 - - 244 195 439
Strathmore
University 9 2 35 17 42 17 12 9 75 91 173 136 309
United States
International
University 23 9 80 45 72 63 - - - - 175 117 292
University of
Eastern Africa
Baraton 7 4 9 4 37 17 - - 71 61 124 86 210
Total 165 57 333 142 862 627 139 102 679 474 2,178 1,402 3,580
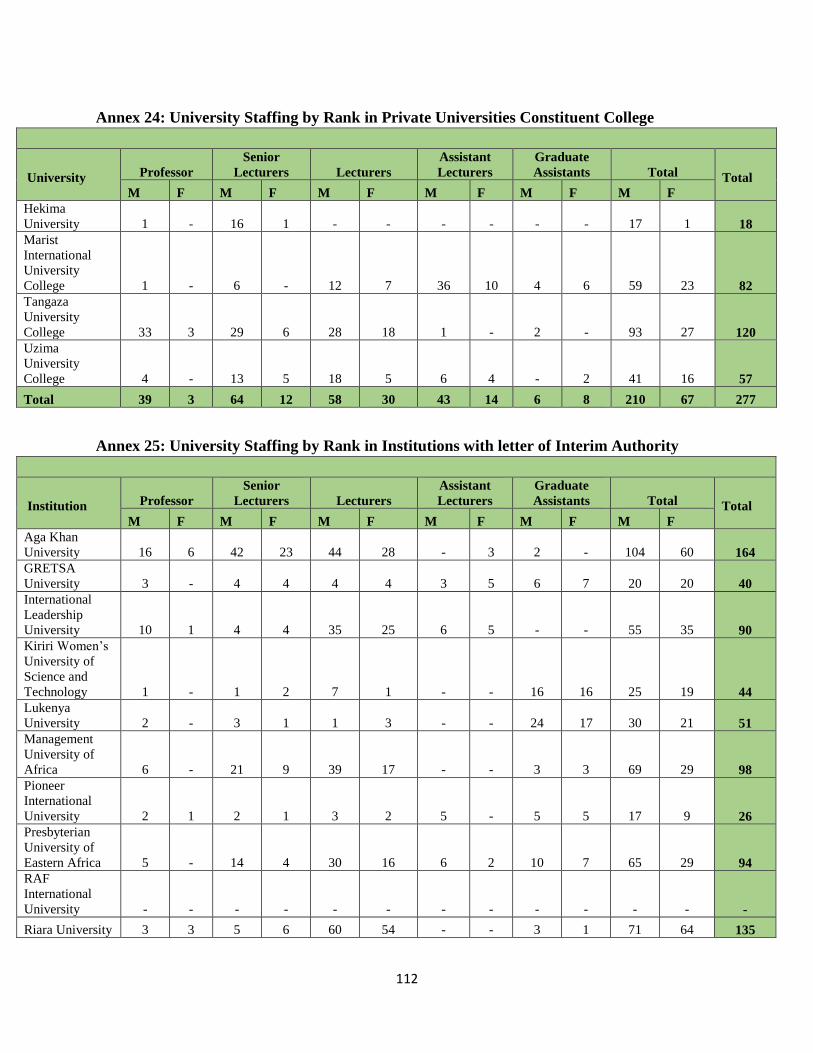
112
Annex 24: University Staffing by Rank in Private Universities Constituent College
University
Professor
Senior
Lecturers Lecturers
Assistant
Lecturers
Graduate
Assistants Total Total
M F M F M F M F M F M F
Hekima
University 1 - 16 1 - - - - - - 17 1 18
Marist
International
University
College 1 - 6 - 12 7 36 10 4 6 59 23 82
Tangaza
University
College 33 3 29 6 28 18 1 - 2 - 93 27 120
Uzima
University
College 4 - 13 5 18 5 6 4 - 2 41 16 57
Total 39 3 64 12 58 30 43 14 6 8 210 67 277
Annex 25: University Staffing by Rank in Institutions with letter of Interim Authority
Institution
Professor
Senior
Lecturers Lecturers
Assistant
Lecturers
Graduate
Assistants Total Total
M F M F M F M F M F M F
Aga Khan
University 16 6 42 23 44 28 - 3 2 - 104 60 164
GRETSA
University 3 - 4 4 4 4 3 5 6 7 20 20 40
International
Leadership
University 10 1 4 4 35 25 6 5 - - 55 35 90
Kiriri Women’s
University of
Science and
Technology 1 - 1 2 7 1 - - 16 16 25 19 44
Lukenya
University 2 - 3 1 1 3 - - 24 17 30 21 51
Management
University of
Africa 6 - 21 9 39 17 - - 3 3 69 29 98
Pioneer
International
University 2 1 2 1 3 2 5 - 5 5 17 9 26
Presbyterian
University of
Eastern Africa 5 - 14 4 30 16 6 2 10 7 65 29 94
RAF
International
University - - - - - - - - - - - - -
Riara University 3 3 5 6 60 54 - - 3 1 71 64 135
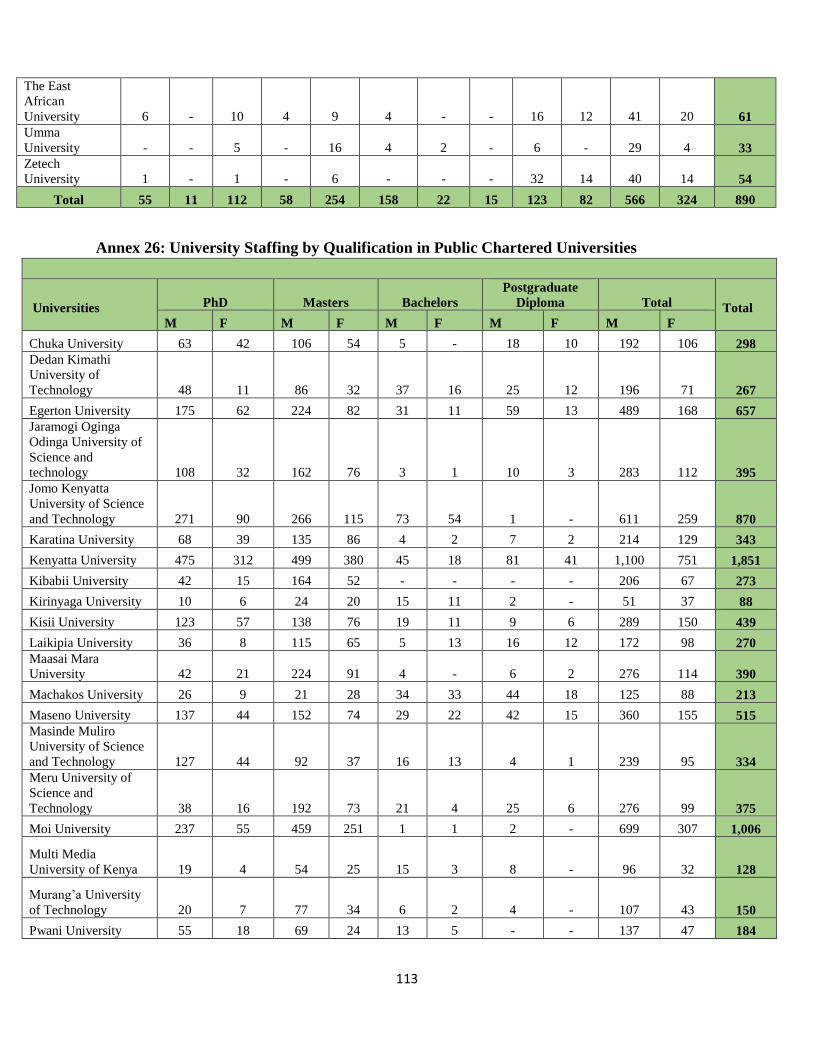
113
The East
African
University 6 - 10 4 9 4 - - 16 12 41 20 61
Umma
University - - 5 - 16 4 2 - 6 - 29 4 33
Zetech
University 1 - 1 - 6 - - - 32 14 40 14 54
Total 55 11 112 58 254 158 22 15 123 82 566 324 890
Annex 26: University Staffing by Qualification in Public Chartered Universities
Universities
PhD Masters Bachelors
Postgraduate
Diploma Total Total
M F M F M F M F M F
Chuka University 63 42 106 54 5 - 18 10 192 106 298
Dedan Kimathi
University of
Technology 48 11 86 32 37 16 25 12 196 71 267
Egerton University 175 62 224 82 31 11 59 13 489 168 657
Jaramogi Oginga
Odinga University of
Science and
technology 108 32 162 76 3 1 10 3 283 112 395
Jomo Kenyatta
University of Science
and Technology 271 90 266 115 73 54 1 - 611 259 870
Karatina University 68 39 135 86 4 2 7 2 214 129 343
Kenyatta University 475 312 499 380 45 18 81 41 1,100 751 1,851
Kibabii University 42 15 164 52 - - - - 206 67 273
Kirinyaga University 10 6 24 20 15 11 2 - 51 37 88
Kisii University 123 57 138 76 19 11 9 6 289 150 439
Laikipia University 36 8 115 65 5 13 16 12 172 98 270
Maasai Mara
University 42 21 224 91 4 - 6 2 276 114 390
Machakos University 26 9 21 28 34 33 44 18 125 88 213
Maseno University 137 44 152 74 29 22 42 15 360 155 515
Masinde Muliro
University of Science
and Technology 127 44 92 37 16 13 4 1 239 95 334
Meru University of
Science and
Technology 38 16 192 73 21 4 25 6 276 99 375
Moi University 237 55 459 251 1 1 2 - 699 307 1,006
Multi Media
University of Kenya 19 4 54 25 15 3 8 - 96 32 128
Murang’a University
of Technology 20 7 77 34 6 2 4 - 107 43 150
Pwani University 55 18 69 24 13 5 - - 137 47 184
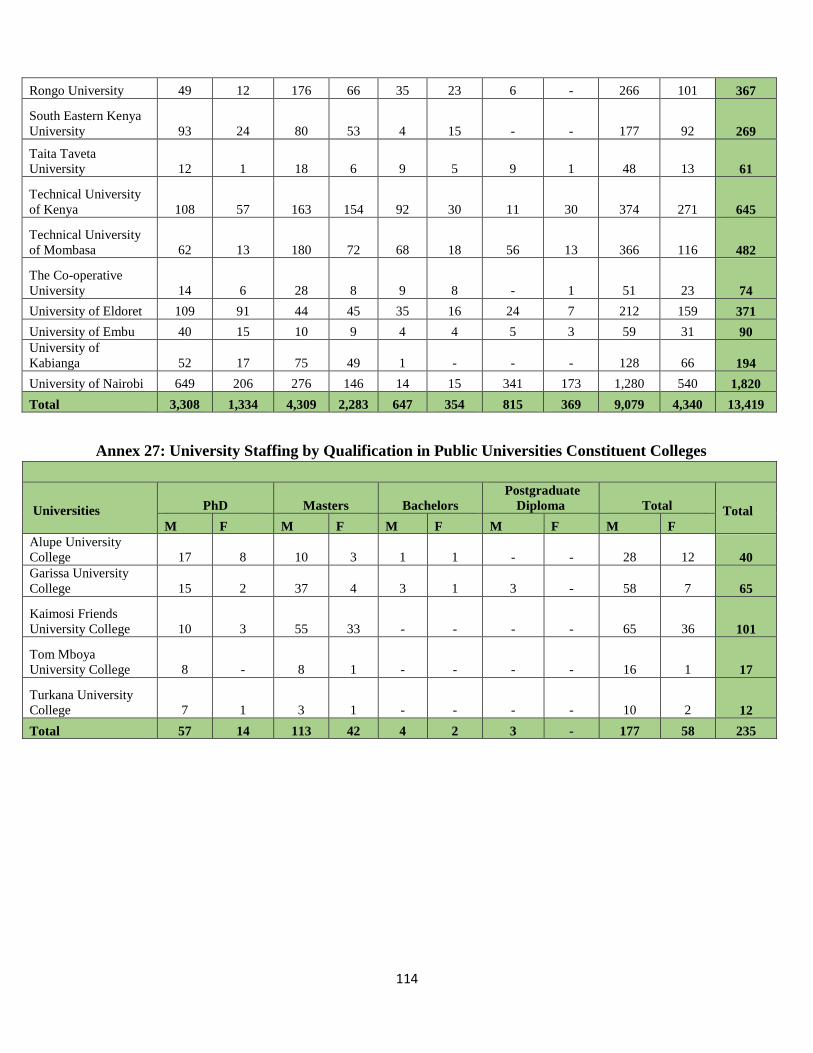
114
Rongo University 49 12 176 66 35 23 6 - 266 101 367
South Eastern Kenya
University 93 24 80 53 4 15 - - 177 92 269
Taita Taveta
University 12 1 18 6 9 5 9 1 48 13 61
Technical University
of Kenya 108 57 163 154 92 30 11 30 374 271 645
Technical University
of Mombasa 62 13 180 72 68 18 56 13 366 116 482
The Co-operative
University 14 6 28 8 9 8 - 1 51 23 74
University of Eldoret 109 91 44 45 35 16 24 7 212 159 371
University of Embu 40 15 10 9 4 4 5 3 59 31 90
University of
Kabianga 52 17 75 49 1 - - - 128 66 194
University of Nairobi 649 206 276 146 14 15 341 173 1,280 540 1,820
Total 3,308 1,334 4,309 2,283 647 354 815 369 9,079 4,340 13,419
Annex 27: University Staffing by Qualification in Public Universities Constituent Colleges
Universities
PhD Masters Bachelors
Postgraduate
Diploma Total Total
M F M F M F M F M F
Alupe University
College 17 8 10 3 1 1 - - 28 12 40
Garissa University
College 15 2 37 4 3 1 3 - 58 7 65
Kaimosi Friends
University College 10 3 55 33 - - - - 65 36 101
Tom Mboya
University College 8 - 8 1 - - - - 16 1 17
Turkana University
College 7 1 3 1 - - - - 10 2 12
Total 57 14 113 42 4 2 3 - 177 58 235
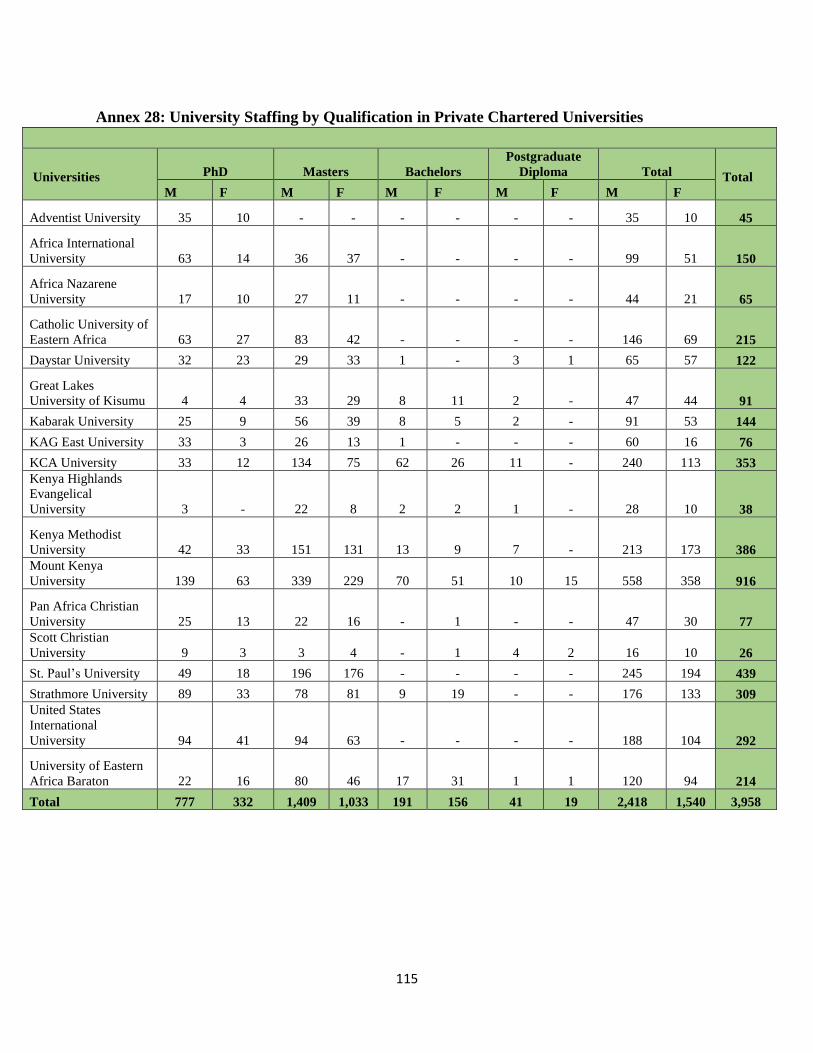
115
Annex 28: University Staffing by Qualification in Private Chartered Universities
Universities
PhD Masters Bachelors
Postgraduate
Diploma Total Total
M F M F M F M F M F
Adventist University 35 10 - - - - - - 35 10 45
Africa International
University 63 14 36 37 - - - - 99 51 150
Africa Nazarene
University 17 10 27 11 - - - - 44 21 65
Catholic University of
Eastern Africa 63 27 83 42 - - - - 146 69 215
Daystar University 32 23 29 33 1 - 3 1 65 57 122
Great Lakes
University of Kisumu 4 4 33 29 8 11 2 - 47 44 91
Kabarak University 25 9 56 39 8 5 2 - 91 53 144
KAG East University 33 3 26 13 1 - - - 60 16 76
KCA University 33 12 134 75 62 26 11 - 240 113 353
Kenya Highlands
Evangelical
University 3 - 22 8 2 2 1 - 28 10 38
Kenya Methodist
University 42 33 151 131 13 9 7 - 213 173 386
Mount Kenya
University 139 63 339 229 70 51 10 15 558 358 916
Pan Africa Christian
University 25 13 22 16 - 1 - - 47 30 77
Scott Christian
University 9 3 3 4 - 1 4 2 16 10 26
St. Paul’s University 49 18 196 176 - - - - 245 194 439
Strathmore University 89 33 78 81 9 19 - - 176 133 309
United States
International
University 94 41 94 63 - - - - 188 104 292
University of Eastern
Africa Baraton 22 16 80 46 17 31 1 1 120 94 214
Total 777 332 1,409 1,033 191 156 41 19 2,418 1,540 3,958
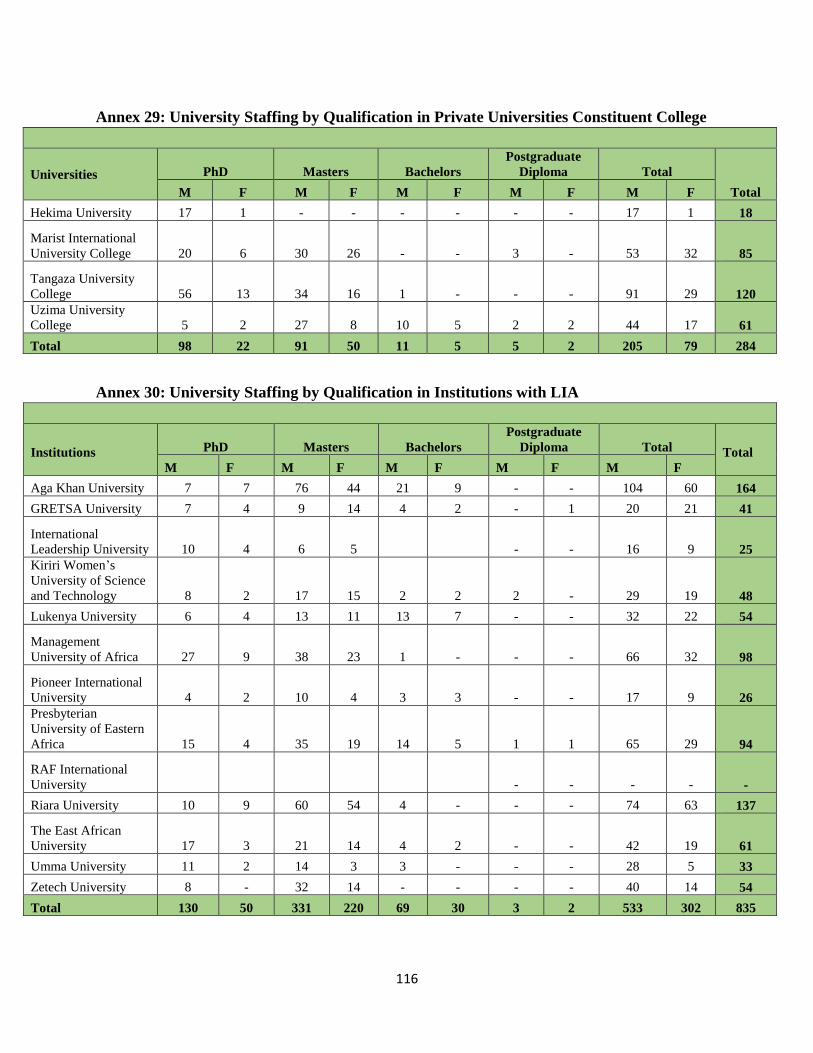
116
Annex 29: University Staffing by Qualification in Private Universities Constituent College
Universities PhD Masters Bachelors
Postgraduate
Diploma Total
Total M F M F M F M F M F
Hekima University 17 1 - - - - - - 17 1 18
Marist International
University College 20 6 30 26 - - 3 - 53 32 85
Tangaza University
College 56 13 34 16 1 - - - 91 29 120
Uzima University
College 5 2 27 8 10 5 2 2 44 17 61
Total 98 22 91 50 11 5 5 2 205 79 284
Annex 30: University Staffing by Qualification in Institutions with LIA
Institutions
PhD Masters Bachelors
Postgraduate
Diploma Total Total
M F M F M F M F M F
Aga Khan University 7 7 76 44 21 9 - - 104 60 164
GRETSA University 7 4 9 14 4 2 - 1 20 21 41
International
Leadership University 10 4 6 5
- - 16 9 25
Kiriri Women’s
University of Science
and Technology 8 2 17 15 2 2 2 - 29 19 48
Lukenya University 6 4 13 11 13 7 - - 32 22 54
Management
University of Africa 27 9 38 23 1 - - - 66 32 98
Pioneer International
University 4 2 10 4 3 3 - - 17 9 26
Presbyterian
University of Eastern
Africa 15 4 35 19 14 5 1 1 65 29 94
RAF International
University
- - - - -
Riara University 10 9 60 54 4 - - - 74 63 137
The East African
University 17 3 21 14 4 2 - - 42 19 61
Umma University 11 2 14 3 3 - - - 28 5 33
Zetech University 8 - 32 14 - - - - 40 14 54
Total 130 50 331 220 69 30 3 2 533 302 835
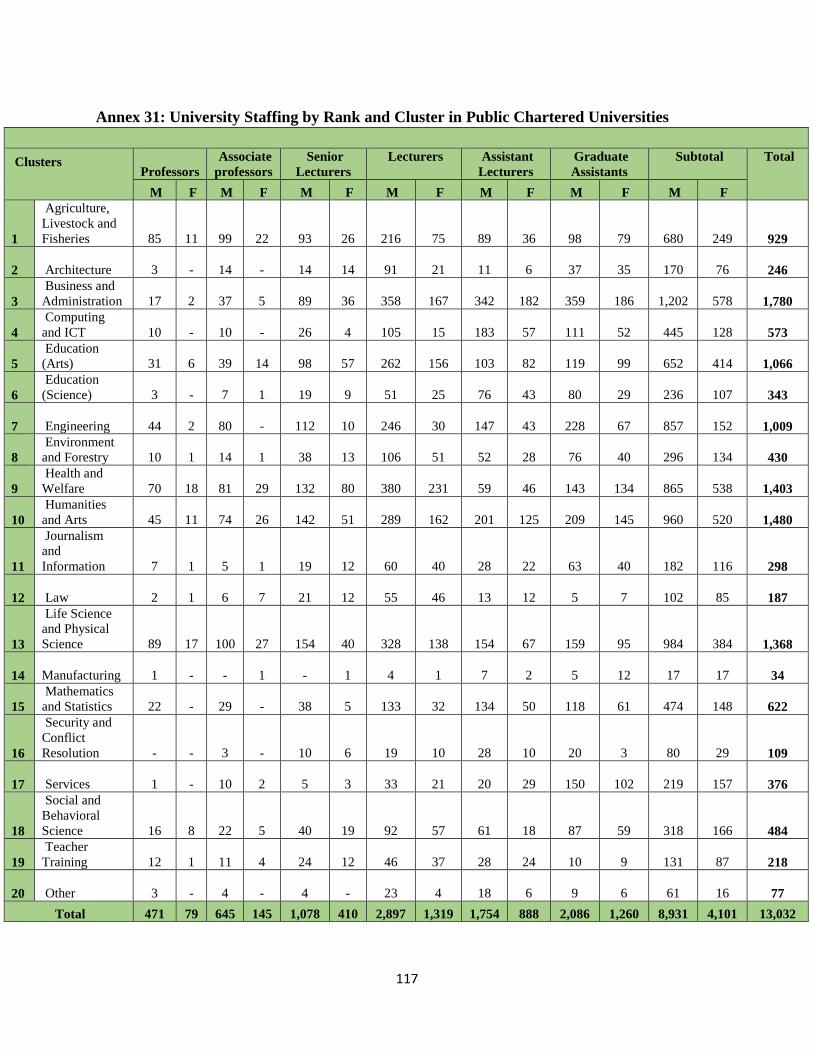
117
Annex 31: University Staffing by Rank and Cluster in Public Chartered Universities
Clusters
Professors
Associate
professors
Senior
Lecturers
Lecturers Assistant
Lecturers
Graduate
Assistants
Subtotal Total
M F M F M F M F M F M F M F
1
Agriculture,
Livestock and
Fisheries 85 11 99 22 93 26 216 75 89 36 98 79 680 249 929
2 Architecture 3 - 14 - 14 14 91 21 11 6 37 35 170 76 246
3
Business and
Administration 17 2 37 5 89 36 358 167 342 182 359 186 1,202 578 1,780
4
Computing
and ICT 10 - 10 - 26 4 105 15 183 57 111 52 445 128 573
5
Education
(Arts) 31 6 39 14 98 57 262 156 103 82 119 99 652 414 1,066
6
Education
(Science) 3 - 7 1 19 9 51 25 76 43 80 29 236 107 343
7 Engineering 44 2 80 - 112 10 246 30 147 43 228 67 857 152 1,009
8
Environment
and Forestry 10 1 14 1 38 13 106 51 52 28 76 40 296 134 430
9
Health and
Welfare 70 18 81 29 132 80 380 231 59 46 143 134 865 538 1,403
10
Humanities
and Arts 45 11 74 26 142 51 289 162 201 125 209 145 960 520 1,480
11
Journalism
and
Information 7 1 5 1 19 12 60 40 28 22 63 40 182 116 298
12 Law 2 1 6 7 21 12 55 46 13 12 5 7 102 85 187
13
Life Science
and Physical
Science 89 17 100 27 154 40 328 138 154 67 159 95 984 384 1,368
14 Manufacturing 1 - - 1 - 1 4 1 7 2 5 12 17 17 34
15
Mathematics
and Statistics 22 - 29 - 38 5 133 32 134 50 118 61 474 148 622
16
Security and
Conflict
Resolution - - 3 - 10 6 19 10 28 10 20 3 80 29 109
17 Services 1 - 10 2 5 3 33 21 20 29 150 102 219 157 376
18
Social and
Behavioral
Science 16 8 22 5 40 19 92 57 61 18 87 59 318 166 484
19
Teacher
Training 12 1 11 4 24 12 46 37 28 24 10 9 131 87 218
20 Other 3 - 4 - 4 - 23 4 18 6 9 6 61 16 77
Total 471 79 645 145 1,078 410 2,897 1,319 1,754 888 2,086 1,260 8,931 4,101 13,032
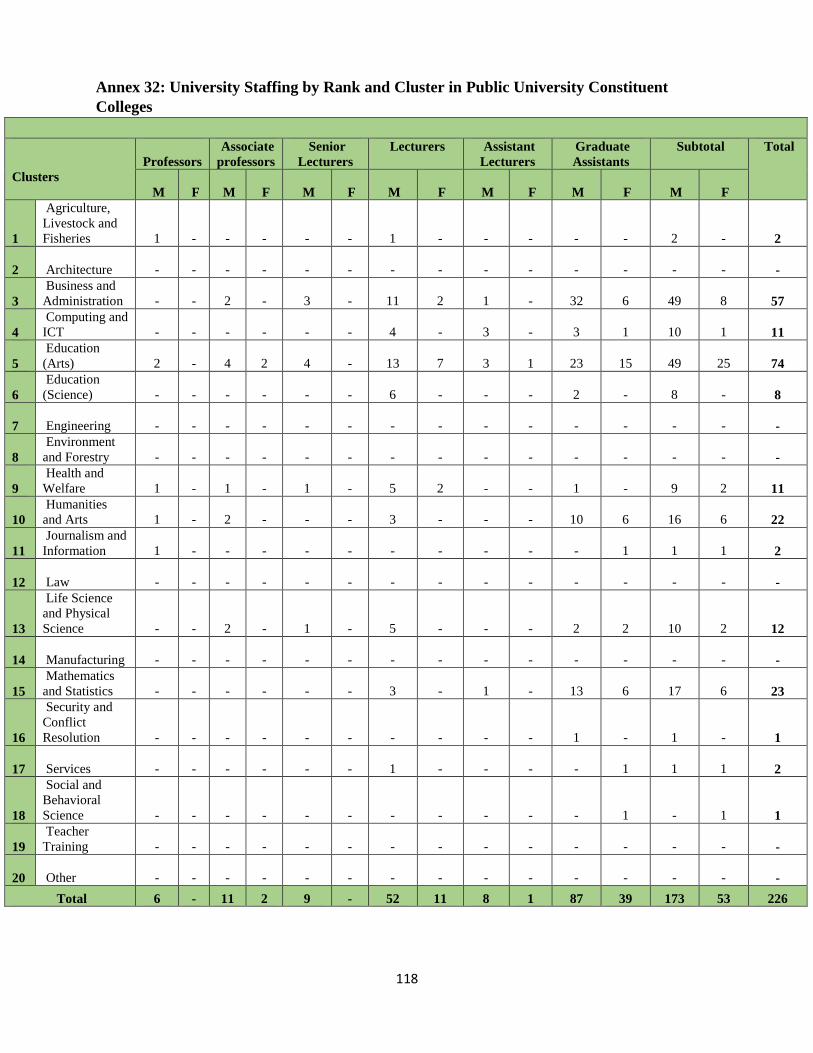
118
Annex 32: University Staffing by Rank and Cluster in Public University Constituent
Colleges
Clusters
Professors
Associate
professors
Senior
Lecturers
Lecturers Assistant
Lecturers
Graduate
Assistants
Subtotal Total
M F M F M F M F M F M F M F
1
Agriculture,
Livestock and
Fisheries 1 - - - - - 1 - - - - - 2 - 2
2 Architecture - - - - - - - - - - - - - - -
3
Business and
Administration - - 2 - 3 - 11 2 1 - 32 6 49 8 57
4
Computing and
ICT - - - - - - 4 - 3 - 3 1 10 1 11
5
Education
(Arts) 2 - 4 2 4 - 13 7 3 1 23 15 49 25 74
6
Education
(Science) - - - - - - 6 - - - 2 - 8 - 8
7 Engineering - - - - - - - - - - - - - - -
8
Environment
and Forestry - - - - - - - - - - - - - - -
9
Health and
Welfare 1 - 1 - 1 - 5 2 - - 1 - 9 2 11
10
Humanities
and Arts 1 - 2 - - - 3 - - - 10 6 16 6 22
11
Journalism and
Information 1 - - - - - - - - - - 1 1 1 2
12 Law - - - - - - - - - - - - - - -
13
Life Science
and Physical
Science - - 2 - 1 - 5 - - - 2 2 10 2 12
14 Manufacturing - - - - - - - - - - - - - - -
15
Mathematics
and Statistics - - - - - - 3 - 1 - 13 6 17 6 23
16
Security and
Conflict
Resolution - - - - - - - - - - 1 - 1 - 1
17 Services - - - - - - 1 - - - - 1 1 1 2
18
Social and
Behavioral
Science - - - - - - - - - - - 1 - 1 1
19
Teacher
Training - - - - - - - - - - - - - - -
20 Other - - - - - - - - - - - - - - -
Total 6 - 11 2 9 - 52 11 8 1 87 39 173 53 226
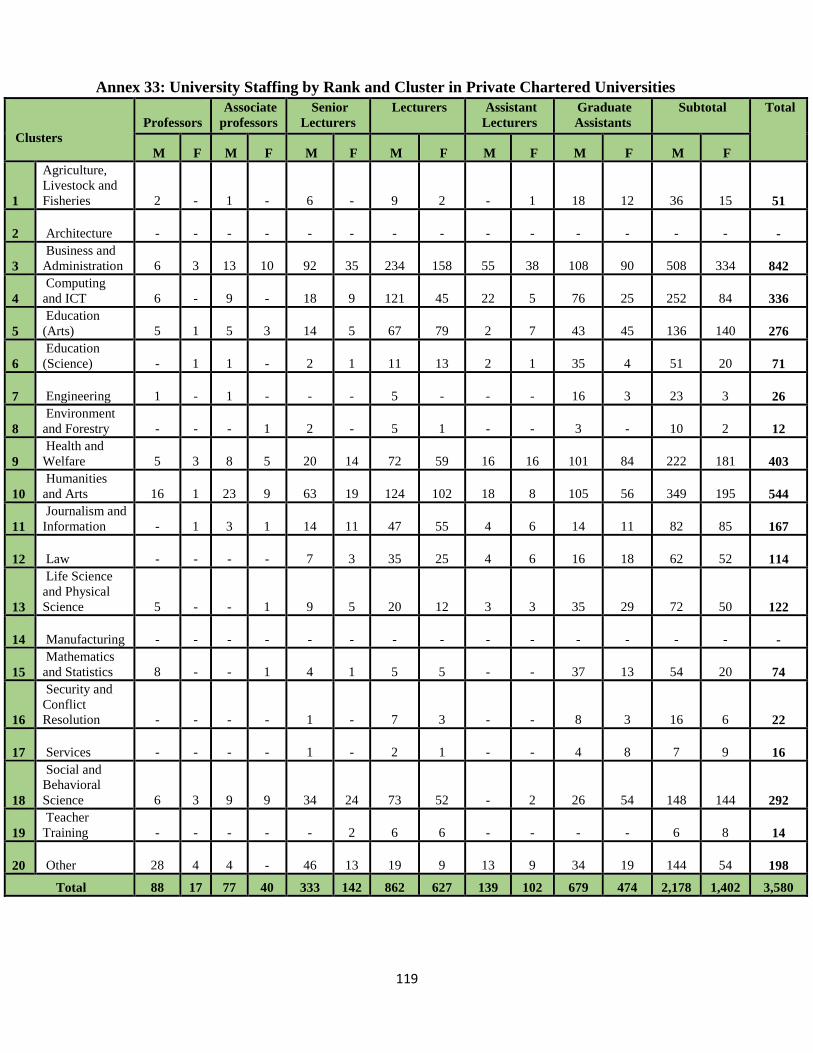
119
Annex 33: University Staffing by Rank and Cluster in Private Chartered Universities
Clusters
Professors
Associate
professors
Senior
Lecturers
Lecturers Assistant
Lecturers
Graduate
Assistants
Subtotal Total
M F M F M F M F M F M F M F
1
Agriculture,
Livestock and
Fisheries 2 - 1 - 6 - 9 2 - 1 18 12 36 15 51
2 Architecture - - - - - - - - - - - - - - -
3
Business and
Administration 6 3 13 10 92 35 234 158 55 38 108 90 508 334 842
4
Computing
and ICT 6 - 9 - 18 9 121 45 22 5 76 25 252 84 336
5
Education
(Arts) 5 1 5 3 14 5 67 79 2 7 43 45 136 140 276
6
Education
(Science) - 1 1 - 2 1 11 13 2 1 35 4 51 20 71
7 Engineering 1 - 1 - - - 5 - - - 16 3 23 3 26
8
Environment
and Forestry - - - 1 2 - 5 1 - - 3 - 10 2 12
9
Health and
Welfare 5 3 8 5 20 14 72 59 16 16 101 84 222 181 403
10
Humanities
and Arts 16 1 23 9 63 19 124 102 18 8 105 56 349 195 544
11
Journalism and
Information - 1 3 1 14 11 47 55 4 6 14 11 82 85 167
12 Law - - - - 7 3 35 25 4 6 16 18 62 52 114
13
Life Science
and Physical
Science 5 - - 1 9 5 20 12 3 3 35 29 72 50 122
14 Manufacturing - - - - - - - - - - - - - - -
15
Mathematics
and Statistics 8 - - 1 4 1 5 5 - - 37 13 54 20 74
16
Security and
Conflict
Resolution - - - - 1 - 7 3 - - 8 3 16 6 22
17 Services - - - - 1 - 2 1 - - 4 8 7 9 16
18
Social and
Behavioral
Science 6 3 9 9 34 24 73 52 - 2 26 54 148 144 292
19
Teacher
Training - - - - - 2 6 6 - - - - 6 8 14
20 Other 28 4 4 - 46 13 19 9 13 9 34 19 144 54 198
Total 88 17 77 40 333 142 862 627 139 102 679 474 2,178 1,402 3,580
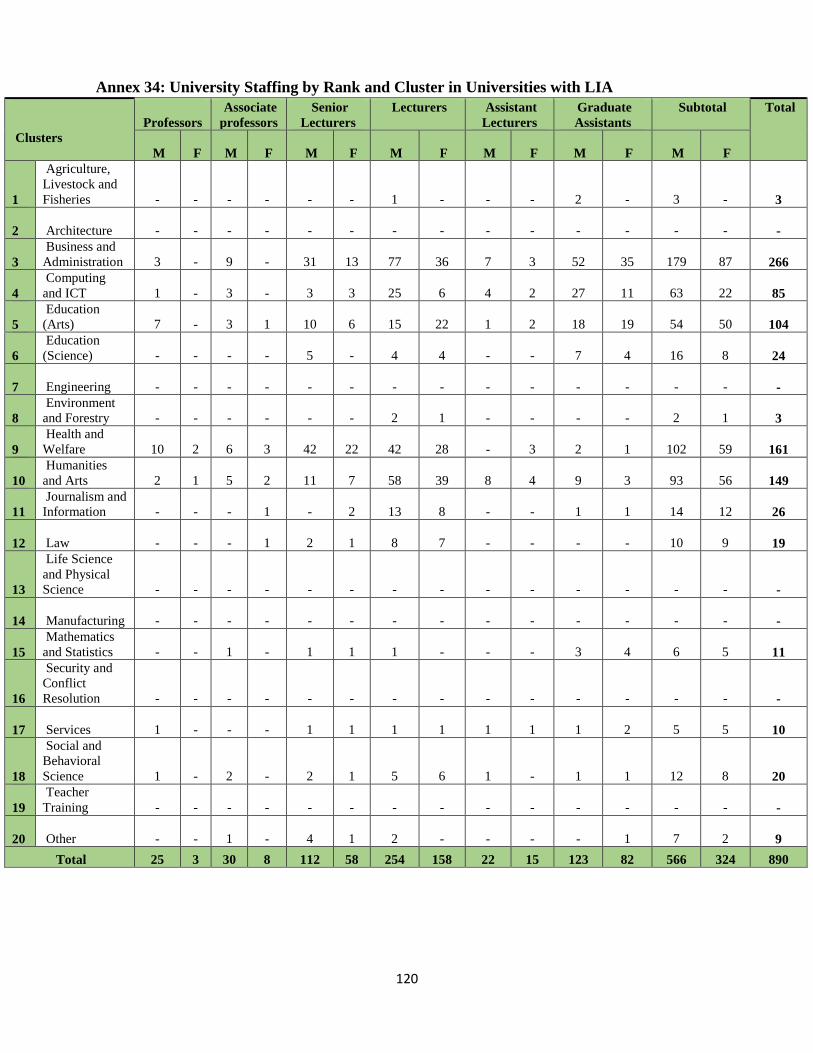
120
Annex 34: University Staffing by Rank and Cluster in Universities with LIA
Clusters
Professors
Associate
professors
Senior
Lecturers
Lecturers Assistant
Lecturers
Graduate
Assistants
Subtotal Total
M F M F M F M F M F M F M F
1
Agriculture,
Livestock and
Fisheries - - - - - - 1 - - - 2 - 3 - 3
2 Architecture - - - - - - - - - - - - - - -
3
Business and
Administration 3 - 9 - 31 13 77 36 7 3 52 35 179 87 266
4
Computing
and ICT 1 - 3 - 3 3 25 6 4 2 27 11 63 22 85
5
Education
(Arts) 7 - 3 1 10 6 15 22 1 2 18 19 54 50 104
6
Education
(Science) - - - - 5 - 4 4 - - 7 4 16 8 24
7 Engineering - - - - - - - - - - - - - - -
8
Environment
and Forestry - - - - - - 2 1 - - - - 2 1 3
9
Health and
Welfare 10 2 6 3 42 22 42 28 - 3 2 1 102 59 161
10
Humanities
and Arts 2 1 5 2 11 7 58 39 8 4 9 3 93 56 149
11
Journalism and
Information - - - 1 - 2 13 8 - - 1 1 14 12 26
12 Law - - - 1 2 1 8 7 - - - - 10 9 19
13
Life Science
and Physical
Science - - - - - - - - - - - - - - -
14 Manufacturing - - - - - - - - - - - - - - -
15
Mathematics
and Statistics - - 1 - 1 1 1 - - - 3 4 6 5 11
16
Security and
Conflict
Resolution - - - - - - - - - - - - - - -
17 Services 1 - - - 1 1 1 1 1 1 1 2 5 5 10
18
Social and
Behavioral
Science 1 - 2 - 2 1 5 6 1 - 1 1 12 8 20
19
Teacher
Training - - - - - - - - - - - - - - -
20 Other - - 1 - 4 1 2 - - - - 1 7 2 9
Total 25 3 30 8 112 58 254 158 22 15 123 82 566 324 890
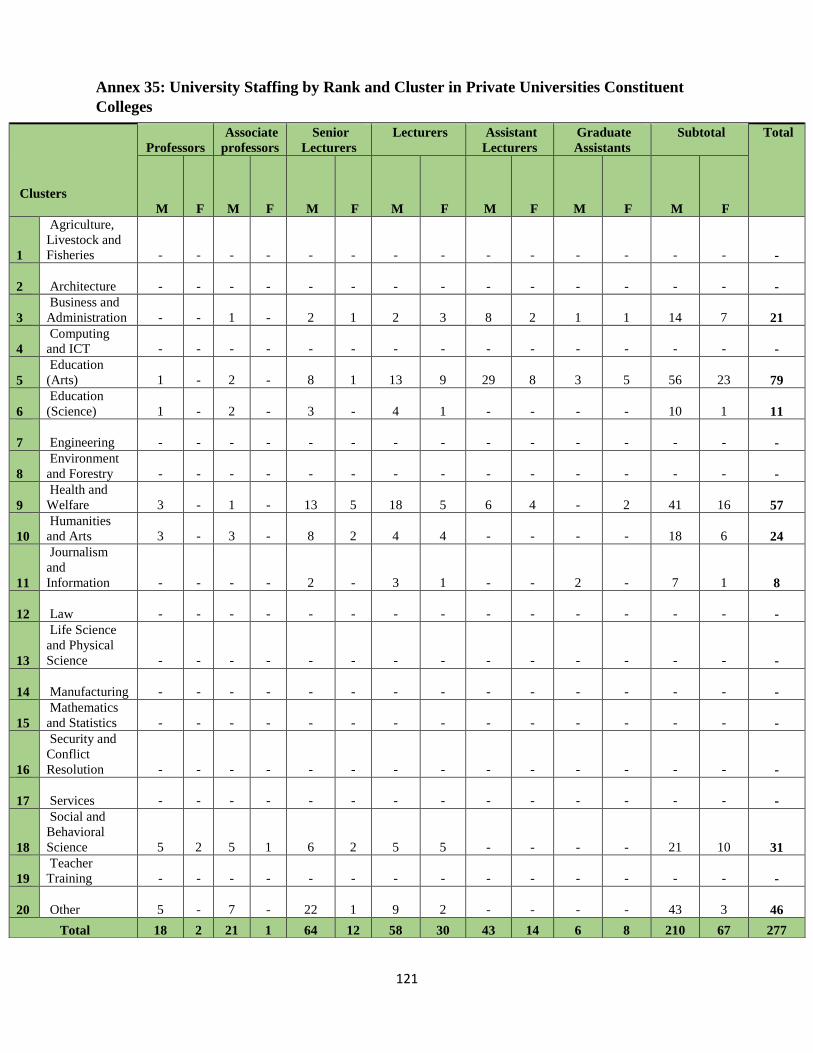
121
Annex 35: University Staffing by Rank and Cluster in Private Universities Constituent
Colleges
Clusters
Professors
Associate
professors
Senior
Lecturers
Lecturers Assistant
Lecturers
Graduate
Assistants
Subtotal Total
M F M F M F M F M F M F M F
1
Agriculture,
Livestock and
Fisheries - - - - - - - - - - - - - - -
2 Architecture - - - - - - - - - - - - - - -
3
Business and
Administration - - 1 - 2 1 2 3 8 2 1 1 14 7 21
4
Computing
and ICT - - - - - - - - - - - - - - -
5
Education
(Arts) 1 - 2 - 8 1 13 9 29 8 3 5 56 23 79
6
Education
(Science) 1 - 2 - 3 - 4 1 - - - - 10 1 11
7 Engineering - - - - - - - - - - - - - - -
8
Environment
and Forestry - - - - - - - - - - - - - - -
9
Health and
Welfare 3 - 1 - 13 5 18 5 6 4 - 2 41 16 57
10
Humanities
and Arts 3 - 3 - 8 2 4 4 - - - - 18 6 24
11
Journalism
and
Information - - - - 2 - 3 1 - - 2 - 7 1 8
12 Law - - - - - - - - - - - - - - -
13
Life Science
and Physical
Science - - - - - - - - - - - - - - -
14 Manufacturing - - - - - - - - - - - - - - -
15
Mathematics
and Statistics - - - - - - - - - - - - - - -
16
Security and
Conflict
Resolution - - - - - - - - - - - - - - -
17 Services - - - - - - - - - - - - - - -
18
Social and
Behavioral
Science 5 2 5 1 6 2 5 5 - - - - 21 10 31
19
Teacher
Training - - - - - - - - - - - - - - -
20 Other 5 - 7 - 22 1 9 2 - - - - 43 3 46
Total 18 2 21 1 64 12 58 30 43 14 6 8 210 67 277
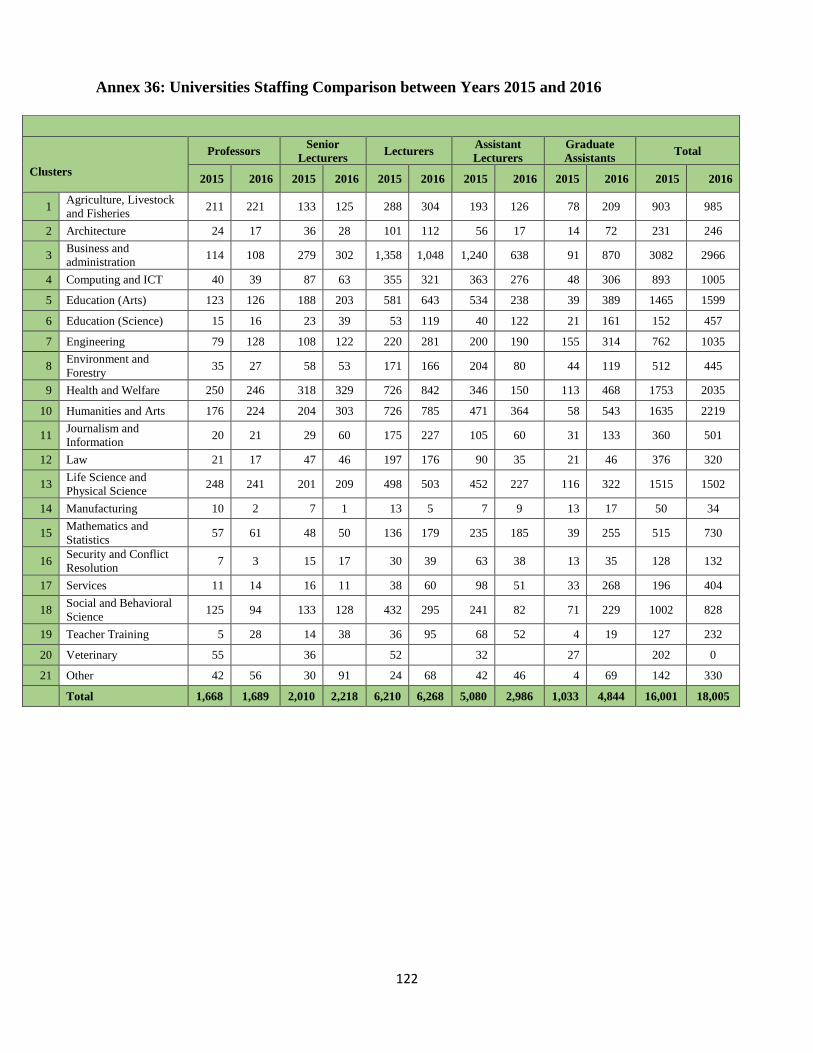
122
Annex 36: Universities Staffing Comparison between Years 2015 and 2016
Clusters
Professors Senior
Lecturers Lecturers
Assistant
Lecturers
Graduate
Assistants Total
2015 2016 2015 2016 2015 2016 2015 2016 2015 2016 2015 2016
1 Agriculture, Livestock
and Fisheries 211 221 133 125 288 304 193 126 78 209 903 985
2 Architecture 24 17 36 28 101 112 56 17 14 72 231 246
3 Business and
administration 114 108 279 302 1,358 1,048 1,240 638 91 870 3082 2966
4 Computing and ICT 40 39 87 63 355 321 363 276 48 306 893 1005
5 Education (Arts) 123 126 188 203 581 643 534 238 39 389 1465 1599
6 Education (Science) 15 16 23 39 53 119 40 122 21 161 152 457
7 Engineering 79 128 108 122 220 281 200 190 155 314 762 1035
8 Environment and
Forestry 35 27 58 53 171 166 204 80 44 119 512 445
9 Health and Welfare 250 246 318 329 726 842 346 150 113 468 1753 2035
10 Humanities and Arts 176 224 204 303 726 785 471 364 58 543 1635 2219
11 Journalism and
Information 20 21 29 60 175 227 105 60 31 133 360 501
12 Law 21 17 47 46 197 176 90 35 21 46 376 320
13 Life Science and
Physical Science 248 241 201 209 498 503 452 227 116 322 1515 1502
14 Manufacturing 10 2 7 1 13 5 7 9 13 17 50 34
15 Mathematics and
Statistics 57 61 48 50 136 179 235 185 39 255 515 730
16 Security and Conflict
Resolution 7 3 15 17 30 39 63 38 13 35 128 132
17 Services 11 14 16 11 38 60 98 51 33 268 196 404
18 Social and Behavioral
Science 125 94 133 128 432 295 241 82 71 229 1002 828
19 Teacher Training 5 28 14 38 36 95 68 52 4 19 127 232
20 Veterinary 55 36 52 32 27 202 0
21 Other 42 56 30 91 24 68 42 46 4 69 142 330
Total 1,668 1,689 2,010 2,218 6,210 6,268 5,080 2,986 1,033 4,844 16,001 18,005
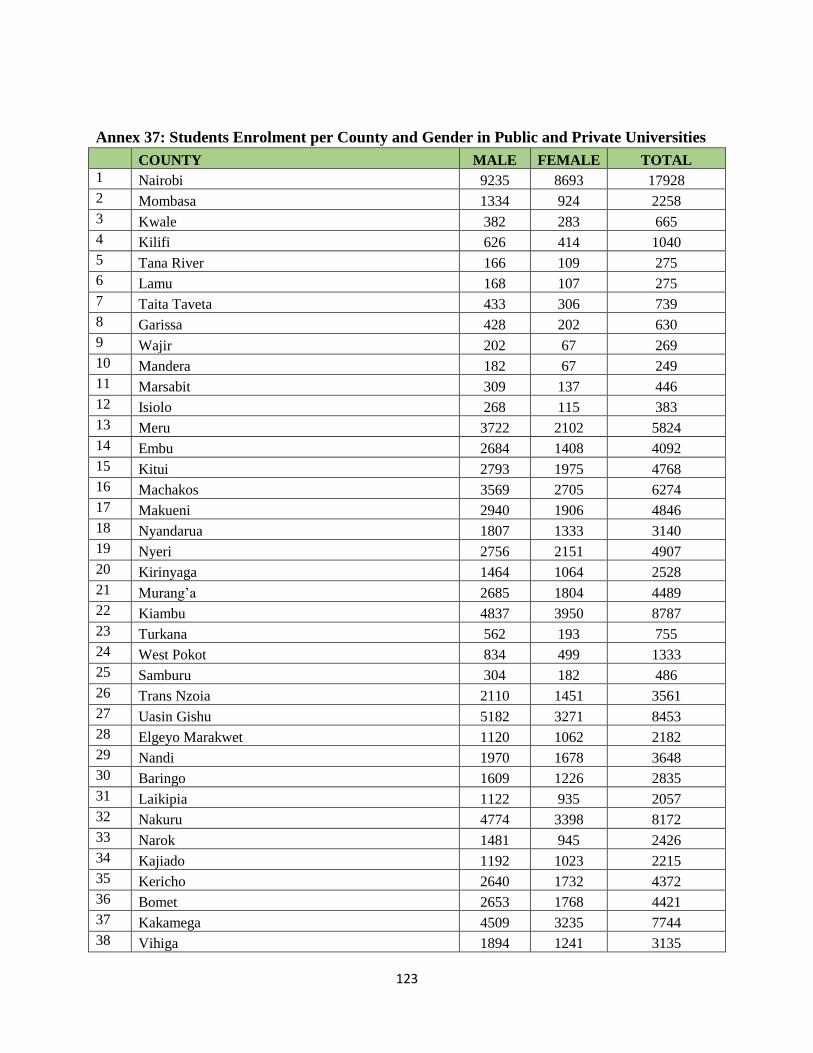
123
Annex 37: Students Enrolment per County and Gender in Public and Private Universities
COUNTY MALE FEMALE TOTAL
1 Nairobi 9235 8693 17928
2 Mombasa 1334 924 2258
3 Kwale 382 283 665
4 Kilifi 626 414 1040
5 Tana River 166 109 275
6 Lamu 168 107 275
7 Taita Taveta 433 306 739
8 Garissa 428 202 630
9 Wajir 202 67 269
10 Mandera 182 67 249
11 Marsabit 309 137 446
12 Isiolo 268 115 383
13 Meru 3722 2102 5824
14 Embu 2684 1408 4092
15 Kitui 2793 1975 4768
16 Machakos 3569 2705 6274
17 Makueni 2940 1906 4846
18 Nyandarua 1807 1333 3140
19 Nyeri 2756 2151 4907
20 Kirinyaga 1464 1064 2528
21 Murang’a 2685 1804 4489
22 Kiambu 4837 3950 8787
23 Turkana 562 193 755
24 West Pokot 834 499 1333
25 Samburu 304 182 486
26 Trans Nzoia 2110 1451 3561
27 Uasin Gishu 5182 3271 8453
28 Elgeyo Marakwet 1120 1062 2182
29 Nandi 1970 1678 3648
30 Baringo 1609 1226 2835
31 Laikipia 1122 935 2057
32 Nakuru 4774 3398 8172
33 Narok 1481 945 2426
34 Kajiado 1192 1023 2215
35 Kericho 2640 1732 4372
36 Bomet 2653 1768 4421
37 Kakamega 4509 3235 7744
38 Vihiga 1894 1241 3135
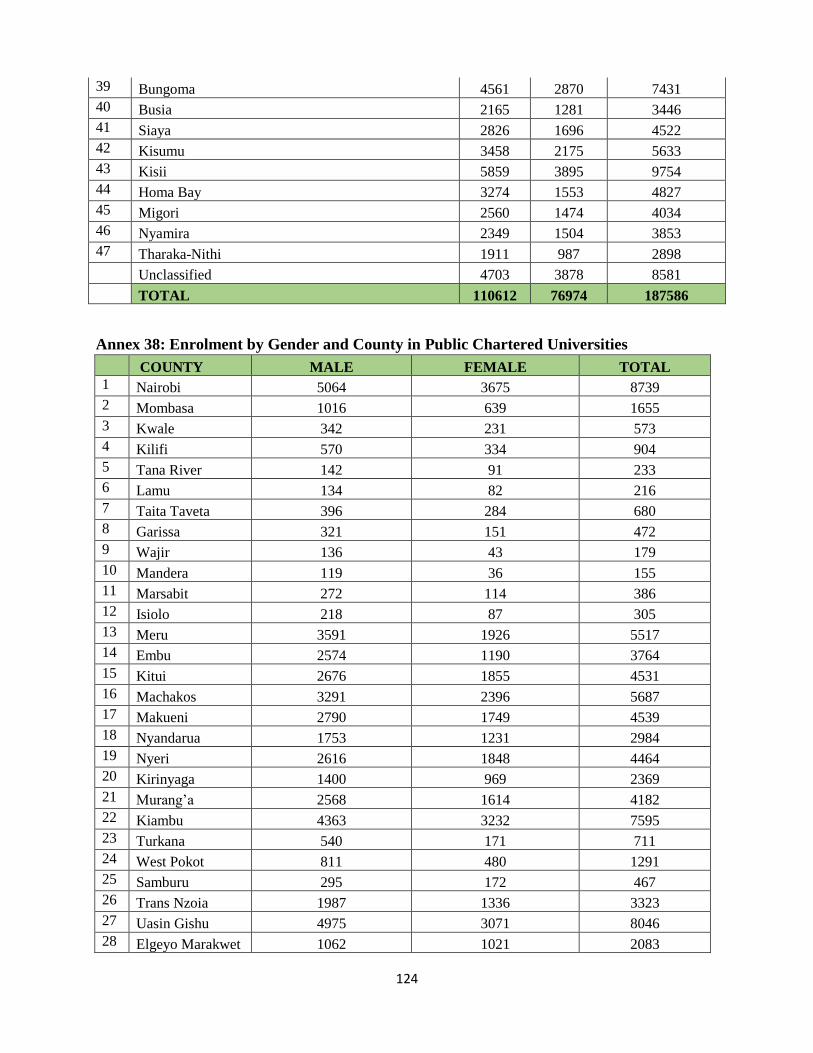
124
39 Bungoma 4561 2870 7431
40 Busia 2165 1281 3446
41 Siaya 2826 1696 4522
42 Kisumu 3458 2175 5633
43 Kisii 5859 3895 9754
44 Homa Bay 3274 1553 4827
45 Migori 2560 1474 4034
46 Nyamira 2349 1504 3853
47 Tharaka-Nithi 1911 987 2898
Unclassified 4703 3878 8581
TOTAL 110612 76974 187586
Annex 38: Enrolment by Gender and County in Public Chartered Universities
COUNTY MALE FEMALE TOTAL
1 Nairobi 5064 3675 8739
2 Mombasa 1016 639 1655
3 Kwale 342 231 573
4 Kilifi 570 334 904
5 Tana River 142 91 233
6 Lamu 134 82 216
7 Taita Taveta 396 284 680
8 Garissa 321 151 472
9 Wajir 136 43 179
10 Mandera 119 36 155
11 Marsabit 272 114 386
12 Isiolo 218 87 305
13 Meru 3591 1926 5517
14 Embu 2574 1190 3764
15 Kitui 2676 1855 4531
16 Machakos 3291 2396 5687
17 Makueni 2790 1749 4539
18 Nyandarua 1753 1231 2984
19 Nyeri 2616 1848 4464
20 Kirinyaga 1400 969 2369
21 Murang’a 2568 1614 4182
22 Kiambu 4363 3232 7595
23 Turkana 540 171 711
24 West Pokot 811 480 1291
25 Samburu 295 172 467
26 Trans Nzoia 1987 1336 3323
27 Uasin Gishu 4975 3071 8046
28 Elgeyo Marakwet 1062 1021 2083
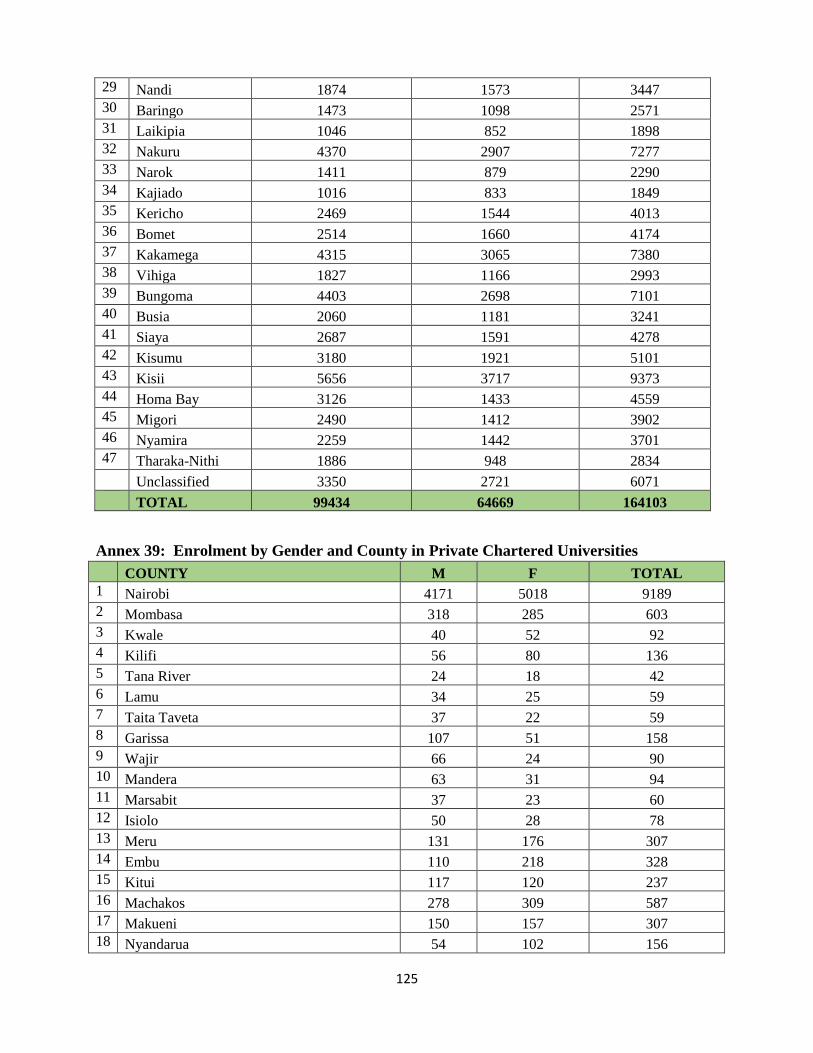
125
29 Nandi 1874 1573 3447
30 Baringo 1473 1098 2571
31 Laikipia 1046 852 1898
32 Nakuru 4370 2907 7277
33 Narok 1411 879 2290
34 Kajiado 1016 833 1849
35 Kericho 2469 1544 4013
36 Bomet 2514 1660 4174
37 Kakamega 4315 3065 7380
38 Vihiga 1827 1166 2993
39 Bungoma 4403 2698 7101
40 Busia 2060 1181 3241
41 Siaya 2687 1591 4278
42 Kisumu 3180 1921 5101
43 Kisii 5656 3717 9373
44 Homa Bay 3126 1433 4559
45 Migori 2490 1412 3902
46 Nyamira 2259 1442 3701
47 Tharaka-Nithi 1886 948 2834
Unclassified 3350 2721 6071
TOTAL 99434 64669 164103
Annex 39: Enrolment by Gender and County in Private Chartered Universities
COUNTY M F TOTAL
1 Nairobi 4171 5018 9189
2 Mombasa 318 285 603
3 Kwale 40 52 92
4 Kilifi 56 80 136
5 Tana River 24 18 42
6 Lamu 34 25 59
7 Taita Taveta 37 22 59
8 Garissa 107 51 158
9 Wajir 66 24 90
10 Mandera 63 31 94
11 Marsabit 37 23 60
12 Isiolo 50 28 78
13 Meru 131 176 307
14 Embu 110 218 328
15 Kitui 117 120 237
16 Machakos 278 309 587
17 Makueni 150 157 307
18 Nyandarua 54 102 156
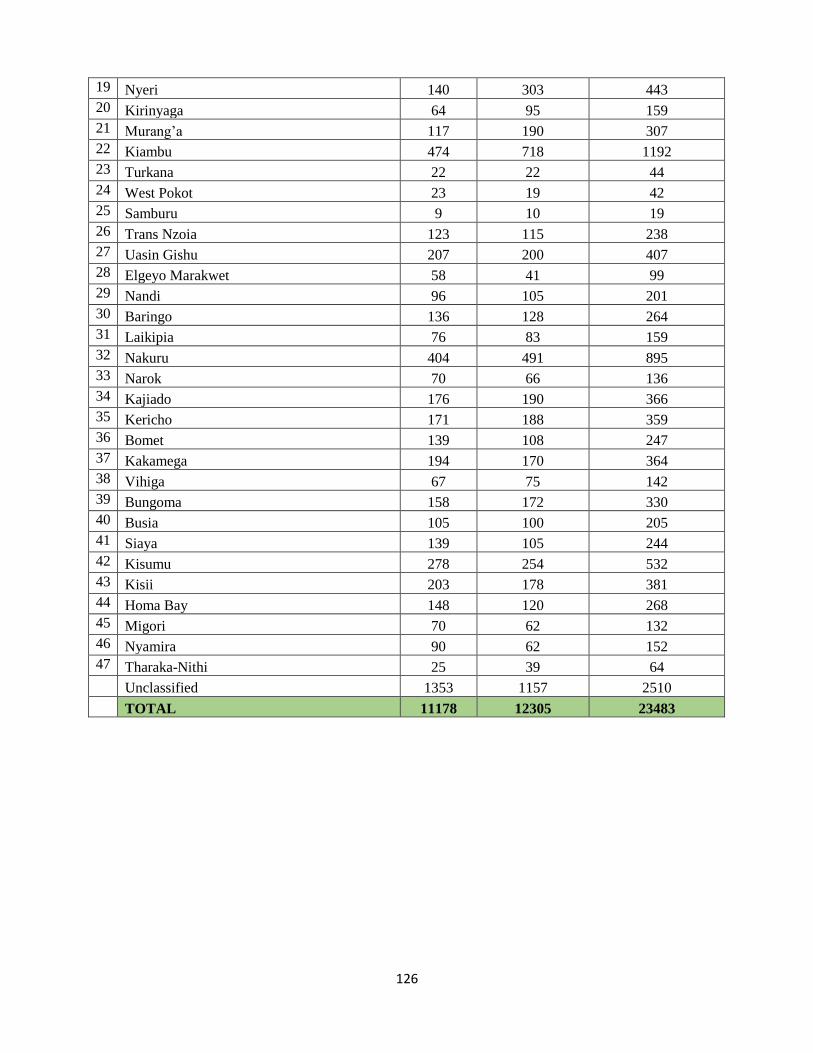
126
19 Nyeri 140 303 443
20 Kirinyaga 64 95 159
21 Murang’a 117 190 307
22 Kiambu 474 718 1192
23 Turkana 22 22 44
24 West Pokot 23 19 42
25 Samburu 9 10 19
26 Trans Nzoia 123 115 238
27 Uasin Gishu 207 200 407
28 Elgeyo Marakwet 58 41 99
29 Nandi 96 105 201
30 Baringo 136 128 264
31 Laikipia 76 83 159
32 Nakuru 404 491 895
33 Narok 70 66 136
34 Kajiado 176 190 366
35 Kericho 171 188 359
36 Bomet 139 108 247
37 Kakamega 194 170 364
38 Vihiga 67 75 142
39 Bungoma 158 172 330
40 Busia 105 100 205
41 Siaya 139 105 244
42 Kisumu 278 254 532
43 Kisii 203 178 381
44 Homa Bay 148 120 268
45 Migori 70 62 132
46 Nyamira 90 62 152
47 Tharaka-Nithi 25 39 64
Unclassified 1353 1157 2510
TOTAL 11178 12305 23483
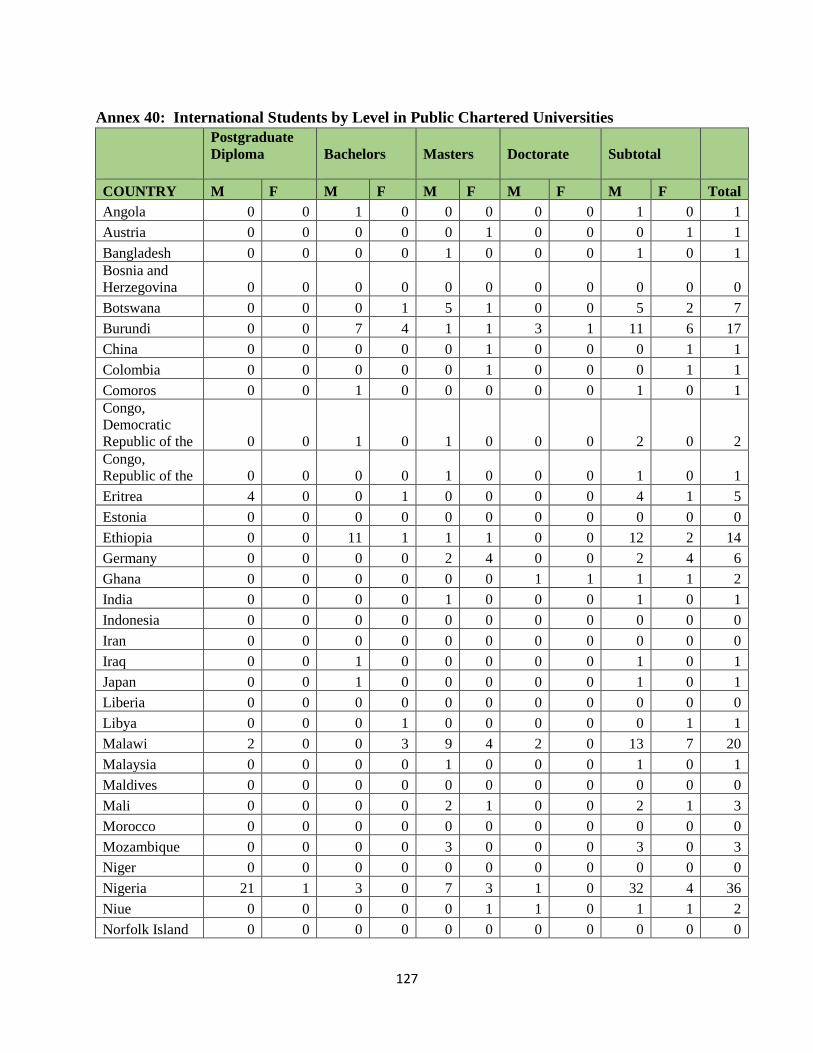
127
Annex 40: International Students by Level in Public Chartered Universities
Postgraduate
Diploma
Bachelors
Masters
Doctorate
Subtotal
COUNTRY M F M F M F M F M F Total
Angola 0 0 1 0 0 0 0 0 1 0 1
Austria 0 0 0 0 0 1 0 0 0 1 1
Bangladesh 0 0 0 0 1 0 0 0 1 0 1
Bosnia and
Herzegovina 0 0 0 0 0 0 0 0 0 0 0
Botswana 0 0 0 1 5 1 0 0 5 2 7
Burundi 0 0 7 4 1 1 3 1 11 6 17
China 0 0 0 0 0 1 0 0 0 1 1
Colombia 0 0 0 0 0 1 0 0 0 1 1
Comoros 0 0 1 0 0 0 0 0 1 0 1
Congo,
Democratic
Republic of the 0 0 1 0 1 0 0 0 2 0 2
Congo,
Republic of the 0 0 0 0 1 0 0 0 1 0 1
Eritrea 4 0 0 1 0 0 0 0 4 1 5
Estonia 0 0 0 0 0 0 0 0 0 0 0
Ethiopia 0 0 11 1 1 1 0 0 12 2 14
Germany 0 0 0 0 2 4 0 0 2 4 6
Ghana 0 0 0 0 0 0 1 1 1 1 2
India 0 0 0 0 1 0 0 0 1 0 1
Indonesia 0 0 0 0 0 0 0 0 0 0 0
Iran 0 0 0 0 0 0 0 0 0 0 0
Iraq 0 0 1 0 0 0 0 0 1 0 1
Japan 0 0 1 0 0 0 0 0 1 0 1
Liberia 0 0 0 0 0 0 0 0 0 0 0
Libya 0 0 0 1 0 0 0 0 0 1 1
Malawi 2 0 0 3 9 4 2 0 13 7 20
Malaysia 0 0 0 0 1 0 0 0 1 0 1
Maldives 0 0 0 0 0 0 0 0 0 0 0
Mali 0 0 0 0 2 1 0 0 2 1 3
Morocco 0 0 0 0 0 0 0 0 0 0 0
Mozambique 0 0 0 0 3 0 0 0 3 0 3
Niger 0 0 0 0 0 0 0 0 0 0 0
Nigeria 21 1 3 0 7 3 1 0 32 4 36
Niue 0 0 0 0 0 1 1 0 1 1 2
Norfolk Island 0 0 0 0 0 0 0 0 0 0 0
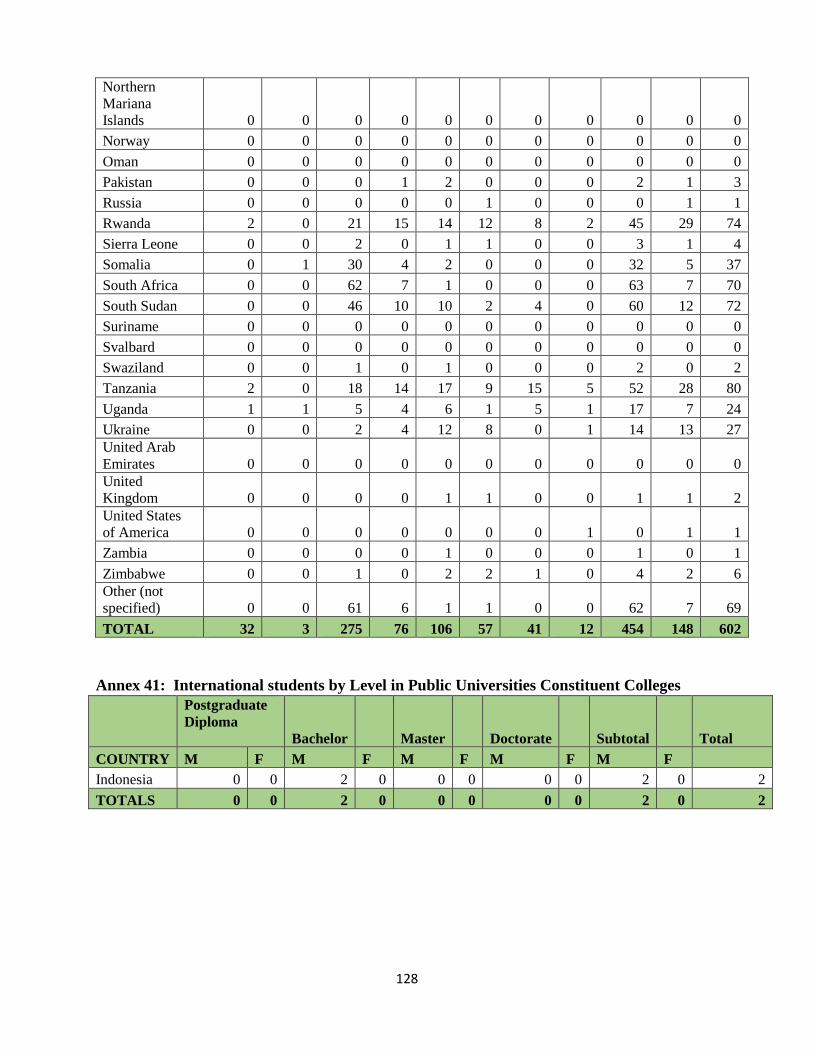
128
Northern
Mariana
Islands 0 0 0 0 0 0 0 0 0 0 0
Norway 0 0 0 0 0 0 0 0 0 0 0
Oman 0 0 0 0 0 0 0 0 0 0 0
Pakistan 0 0 0 1 2 0 0 0 2 1 3
Russia 0 0 0 0 0 1 0 0 0 1 1
Rwanda 2 0 21 15 14 12 8 2 45 29 74
Sierra Leone 0 0 2 0 1 1 0 0 3 1 4
Somalia 0 1 30 4 2 0 0 0 32 5 37
South Africa 0 0 62 7 1 0 0 0 63 7 70
South Sudan 0 0 46 10 10 2 4 0 60 12 72
Suriname 0 0 0 0 0 0 0 0 0 0 0
Svalbard 0 0 0 0 0 0 0 0 0 0 0
Swaziland 0 0 1 0 1 0 0 0 2 0 2
Tanzania 2 0 18 14 17 9 15 5 52 28 80
Uganda 1 1 5 4 6 1 5 1 17 7 24
Ukraine 0 0 2 4 12 8 0 1 14 13 27
United Arab
Emirates 0 0 0 0 0 0 0 0 0 0 0
United
Kingdom 0 0 0 0 1 1 0 0 1 1 2
United States
of America 0 0 0 0 0 0 0 1 0 1 1
Zambia 0 0 0 0 1 0 0 0 1 0 1
Zimbabwe 0 0 1 0 2 2 1 0 4 2 6
Other (not
specified) 0 0 61 6 1 1 0 0 62 7 69
TOTAL 32 3 275 76 106 57 41 12 454 148 602
Annex 41: International students by Level in Public Universities Constituent Colleges
Postgraduate
Diploma
Bachelor Master Doctorate Subtotal Total
COUNTRY M F M F M F M F M F
Indonesia 0 0 2 0 0 0 0 0 2 0 2
TOTALS 0 0 2 0 0 0 0 0 2 0 2
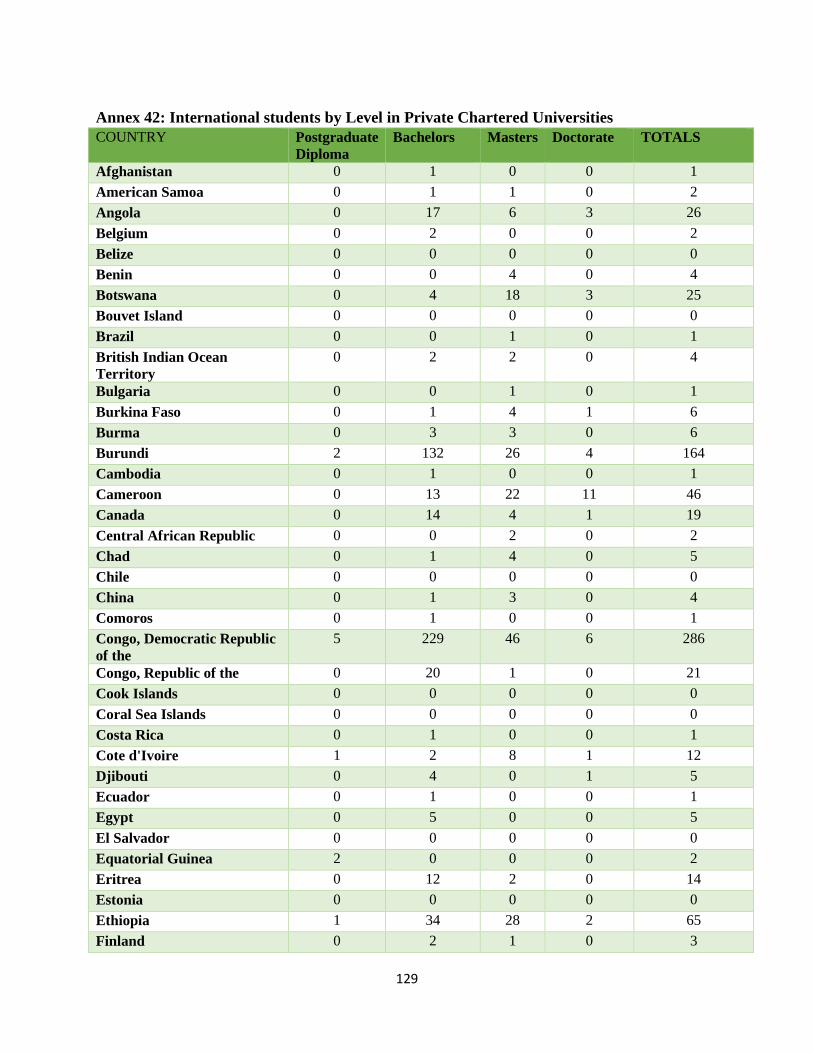
129
Annex 42: International students by Level in Private Chartered Universities
COUNTRY Postgraduate
Diploma
Bachelors Masters Doctorate TOTALS
Afghanistan 0 1 0 0 1
American Samoa 0 1 1 0 2
Angola 0 17 6 3 26
Belgium 0 2 0 0 2
Belize 0 0 0 0 0
Benin 0 0 4 0 4
Botswana 0 4 18 3 25
Bouvet Island 0 0 0 0 0
Brazil 0 0 1 0 1
British Indian Ocean
Territory
0 2 2 0 4
Bulgaria 0 0 1 0 1
Burkina Faso 0 1 4 1 6
Burma 0 3 3 0 6
Burundi 2 132 26 4 164
Cambodia 0 1 0 0 1
Cameroon 0 13 22 11 46
Canada 0 14 4 1 19
Central African Republic 0 0 2 0 2
Chad 0 1 4 0 5
Chile 0 0 0 0 0
China 0 1 3 0 4
Comoros 0 1 0 0 1
Congo, Democratic Republic
of the
5 229 46 6 286
Congo, Republic of the 0 20 1 0 21
Cook Islands 0 0 0 0 0
Coral Sea Islands 0 0 0 0 0
Costa Rica 0 1 0 0 1
Cote d'Ivoire 1 2 8 1 12
Djibouti 0 4 0 1 5
Ecuador 0 1 0 0 1
Egypt 0 5 0 0 5
El Salvador 0 0 0 0 0
Equatorial Guinea 2 0 0 0 2
Eritrea 0 12 2 0 14
Estonia 0 0 0 0 0
Ethiopia 1 34 28 2 65
Finland 0 2 1 0 3
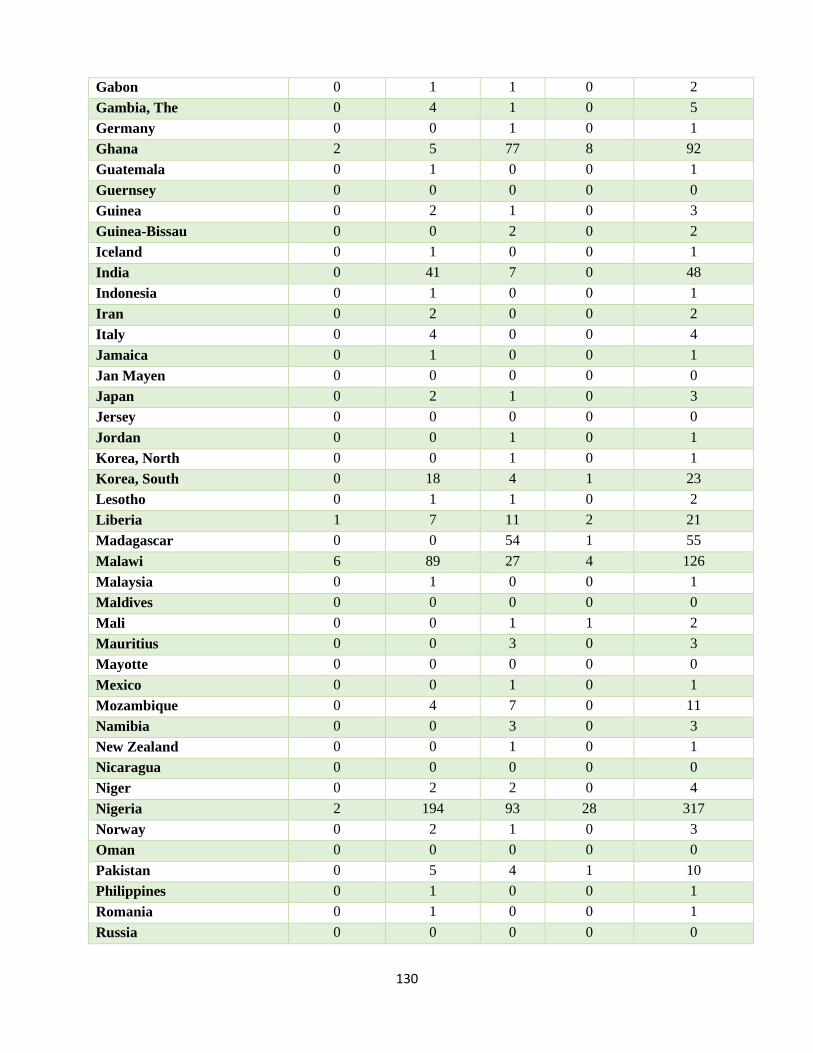
130
Gabon 0 1 1 0 2
Gambia, The 0 4 1 0 5
Germany 0 0 1 0 1
Ghana 2 5 77 8 92
Guatemala 0 1 0 0 1
Guernsey 0 0 0 0 0
Guinea 0 2 1 0 3
Guinea-Bissau 0 0 2 0 2
Iceland 0 1 0 0 1
India 0 41 7 0 48
Indonesia 0 1 0 0 1
Iran 0 2 0 0 2
Italy 0 4 0 0 4
Jamaica 0 1 0 0 1
Jan Mayen 0 0 0 0 0
Japan 0 2 1 0 3
Jersey 0 0 0 0 0
Jordan 0 0 1 0 1
Korea, North 0 0 1 0 1
Korea, South 0 18 4 1 23
Lesotho 0 1 1 0 2
Liberia 1 7 11 2 21
Madagascar 0 0 54 1 55
Malawi 6 89 27 4 126
Malaysia 0 1 0 0 1
Maldives 0 0 0 0 0
Mali 0 0 1 1 2
Mauritius 0 0 3 0 3
Mayotte 0 0 0 0 0
Mexico 0 0 1 0 1
Mozambique 0 4 7 0 11
Namibia 0 0 3 0 3
New Zealand 0 0 1 0 1
Nicaragua 0 0 0 0 0
Niger 0 2 2 0 4
Nigeria 2 194 93 28 317
Norway 0 2 1 0 3
Oman 0 0 0 0 0
Pakistan 0 5 4 1 10
Philippines 0 1 0 0 1
Romania 0 1 0 0 1
Russia 0 0 0 0 0
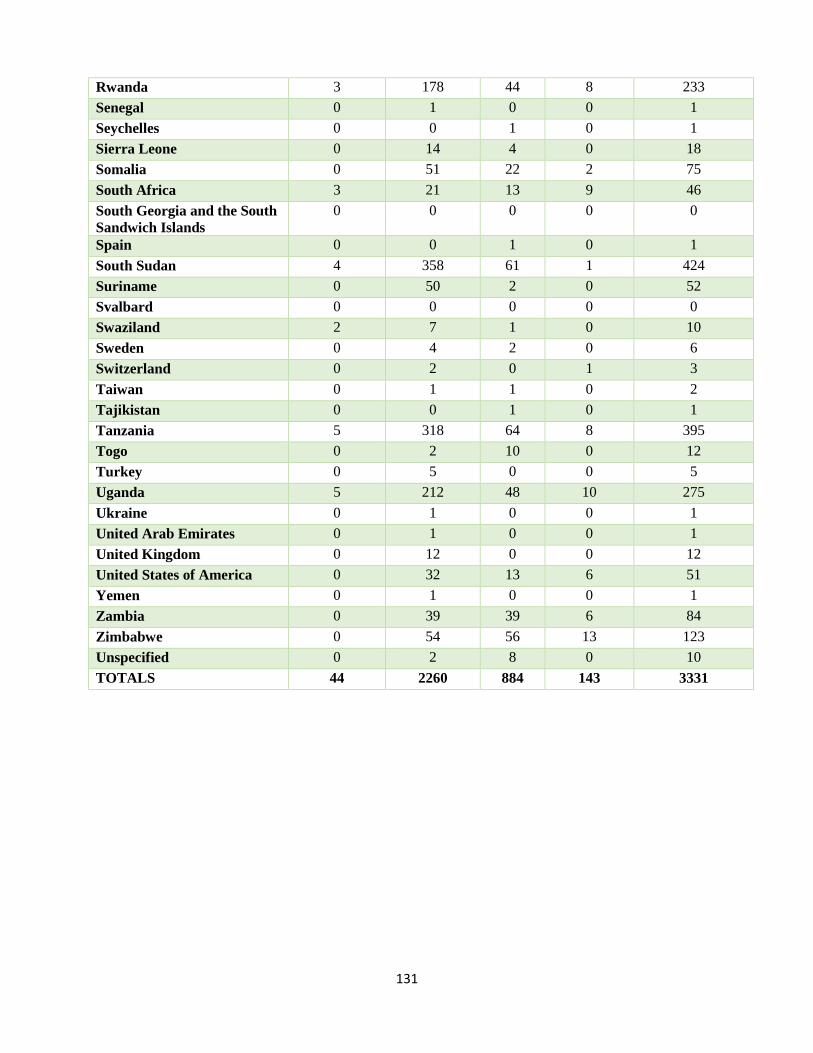
131
Rwanda 3 178 44 8 233
Senegal 0 1 0 0 1
Seychelles 0 0 1 0 1
Sierra Leone 0 14 4 0 18
Somalia 0 51 22 2 75
South Africa 3 21 13 9 46
South Georgia and the South
Sandwich Islands
0 0 0 0 0
Spain 0 0 1 0 1
South Sudan 4 358 61 1 424
Suriname 0 50 2 0 52
Svalbard 0 0 0 0 0
Swaziland 2 7 1 0 10
Sweden 0 4 2 0 6
Switzerland 0 2 0 1 3
Taiwan 0 1 1 0 2
Tajikistan 0 0 1 0 1
Tanzania 5 318 64 8 395
Togo 0 2 10 0 12
Turkey 0 5 0 0 5
Uganda 5 212 48 10 275
Ukraine 0 1 0 0 1
United Arab Emirates 0 1 0 0 1
United Kingdom 0 12 0 0 12
United States of America 0 32 13 6 51
Yemen 0 1 0 0 1
Zambia 0 39 39 6 84
Zimbabwe 0 54 56 13 123
Unspecified 0 2 8 0 10
TOTALS 44 2260 884 143 3331
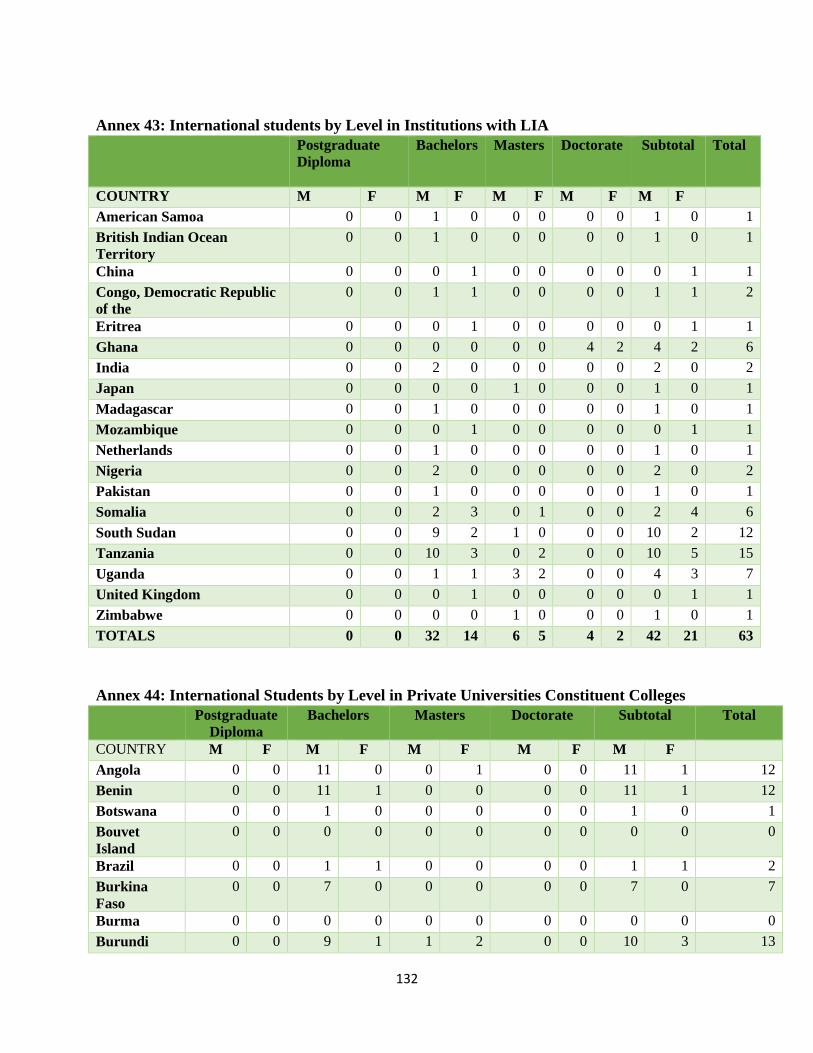
132
Annex 43: International students by Level in Institutions with LIA
Postgraduate
Diploma
Bachelors Masters Doctorate Subtotal Total
COUNTRY M F M F M F M F M F
American Samoa 0 0 1 0 0 0 0 0 1 0 1
British Indian Ocean
Territory
0 0 1 0 0 0 0 0 1 0 1
China 0 0 0 1 0 0 0 0 0 1 1
Congo, Democratic Republic
of the
0 0 1 1 0 0 0 0 1 1 2
Eritrea 0 0 0 1 0 0 0 0 0 1 1
Ghana 0 0 0 0 0 0 4 2 4 2 6
India 0 0 2 0 0 0 0 0 2 0 2
Japan 0 0 0 0 1 0 0 0 1 0 1
Madagascar 0 0 1 0 0 0 0 0 1 0 1
Mozambique 0 0 0 1 0 0 0 0 0 1 1
Netherlands 0 0 1 0 0 0 0 0 1 0 1
Nigeria 0 0 2 0 0 0 0 0 2 0 2
Pakistan 0 0 1 0 0 0 0 0 1 0 1
Somalia 0 0 2 3 0 1 0 0 2 4 6
South Sudan 0 0 9 2 1 0 0 0 10 2 12
Tanzania 0 0 10 3 0 2 0 0 10 5 15
Uganda 0 0 1 1 3 2 0 0 4 3 7
United Kingdom 0 0 0 1 0 0 0 0 0 1 1
Zimbabwe 0 0 0 0 1 0 0 0 1 0 1
TOTALS 0 0 32 14 6 5 4 2 42 21 63
Annex 44: International Students by Level in Private Universities Constituent Colleges
Postgraduate
Diploma
Bachelors Masters Doctorate Subtotal Total
COUNTRY M F M F M F M F M F
Angola 0 0 11 0 0 1 0 0 11 1 12
Benin 0 0 11 1 0 0 0 0 11 1 12
Botswana 0 0 1 0 0 0 0 0 1 0 1
Bouvet
Island
0 0 0 0 0 0 0 0 0 0 0
Brazil 0 0 1 1 0 0 0 0 1 1 2
Burkina
Faso
0 0 7 0 0 0 0 0 7 0 7
Burma 0 0 0 0 0 0 0 0 0 0 0
Burundi 0 0 9 1 1 2 0 0 10 3 13
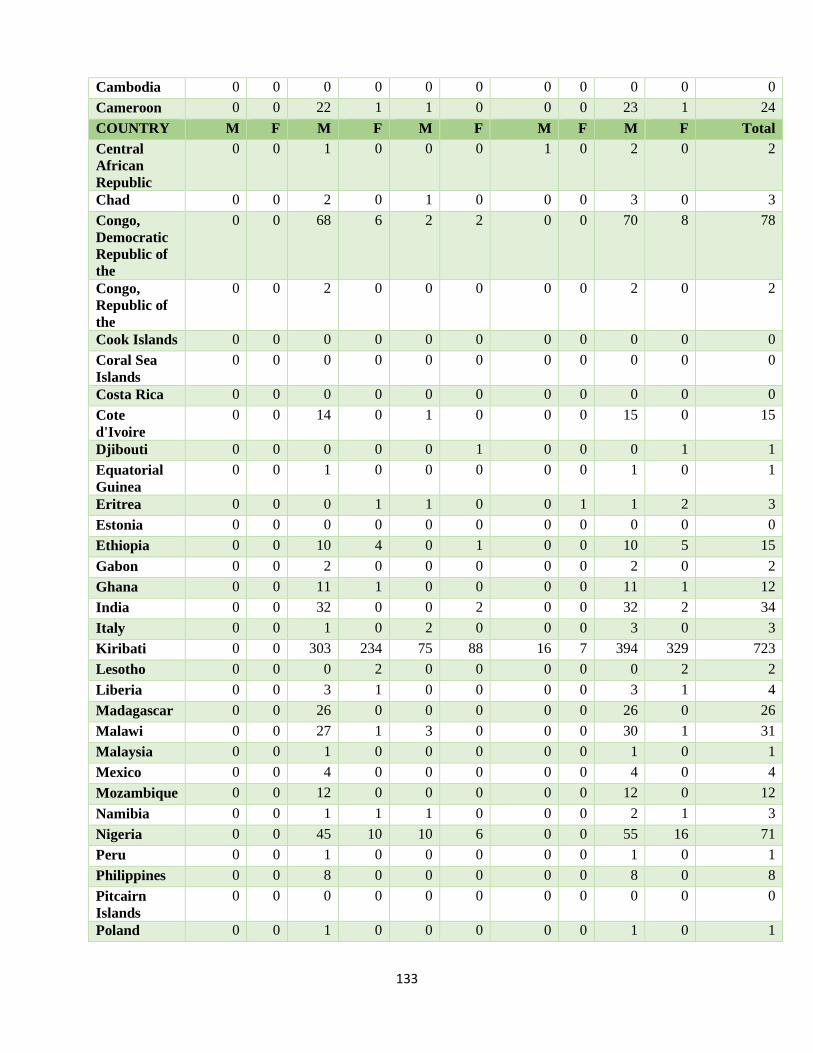
133
Cambodia 0 0 0 0 0 0 0 0 0 0 0
Cameroon 0 0 22 1 1 0 0 0 23 1 24
COUNTRY M F M F M F M F M F Total
Central
African
Republic
0 0 1 0 0 0 1 0 2 0 2
Chad 0 0 2 0 1 0 0 0 3 0 3
Congo,
Democratic
Republic of
the
0 0 68 6 2 2 0 0 70 8 78
Congo,
Republic of
the
0 0 2 0 0 0 0 0 2 0 2
Cook Islands 0 0 0 0 0 0 0 0 0 0 0
Coral Sea
Islands
0 0 0 0 0 0 0 0 0 0 0
Costa Rica 0 0 0 0 0 0 0 0 0 0 0
Cote
d'Ivoire
0 0 14 0 1 0 0 0 15 0 15
Djibouti 0 0 0 0 0 1 0 0 0 1 1
Equatorial
Guinea
0 0 1 0 0 0 0 0 1 0 1
Eritrea 0 0 0 1 1 0 0 1 1 2 3
Estonia 0 0 0 0 0 0 0 0 0 0 0
Ethiopia 0 0 10 4 0 1 0 0 10 5 15
Gabon 0 0 2 0 0 0 0 0 2 0 2
Ghana 0 0 11 1 0 0 0 0 11 1 12
India 0 0 32 0 0 2 0 0 32 2 34
Italy 0 0 1 0 2 0 0 0 3 0 3
Kiribati 0 0 303 234 75 88 16 7 394 329 723
Lesotho 0 0 0 2 0 0 0 0 0 2 2
Liberia 0 0 3 1 0 0 0 0 3 1 4
Madagascar 0 0 26 0 0 0 0 0 26 0 26
Malawi 0 0 27 1 3 0 0 0 30 1 31
Malaysia 0 0 1 0 0 0 0 0 1 0 1
Mexico 0 0 4 0 0 0 0 0 4 0 4
Mozambique 0 0 12 0 0 0 0 0 12 0 12
Namibia 0 0 1 1 1 0 0 0 2 1 3
Nigeria 0 0 45 10 10 6 0 0 55 16 71
Peru 0 0 1 0 0 0 0 0 1 0 1
Philippines 0 0 8 0 0 0 0 0 8 0 8
Pitcairn
Islands
0 0 0 0 0 0 0 0 0 0 0
Poland 0 0 1 0 0 0 0 0 1 0 1
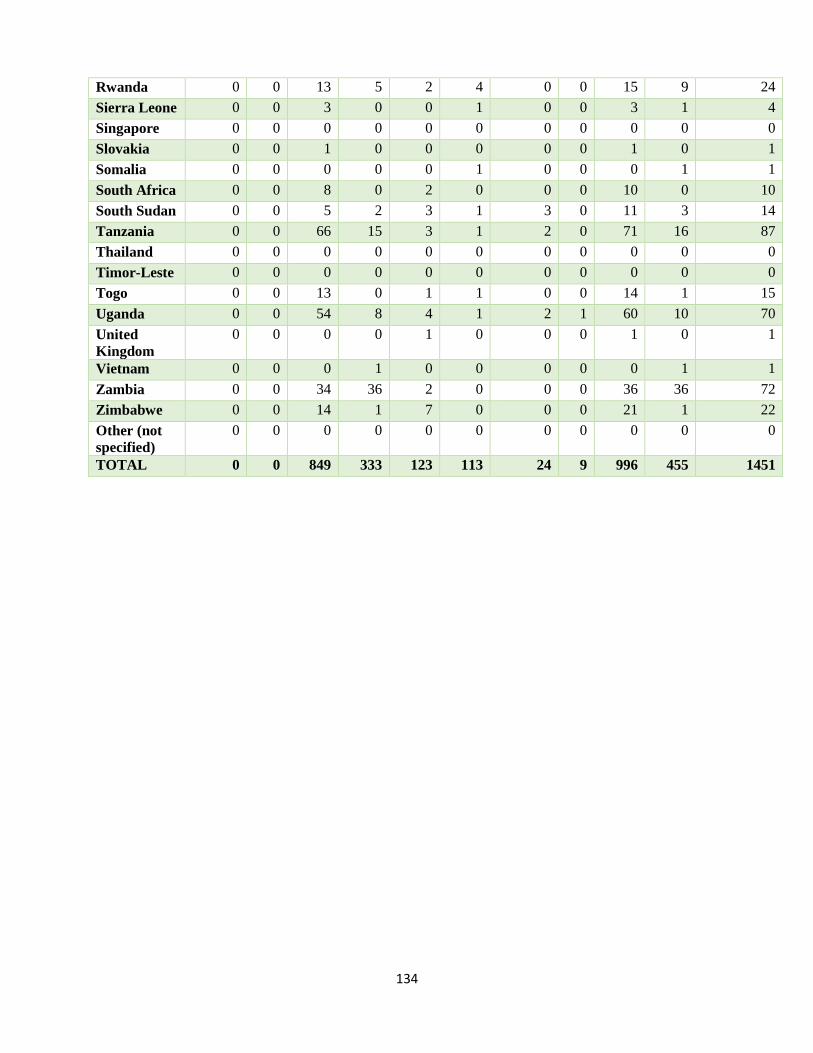
134
Rwanda 0 0 13 5 2 4 0 0 15 9 24
Sierra Leone 0 0 3 0 0 1 0 0 3 1 4
Singapore 0 0 0 0 0 0 0 0 0 0 0
Slovakia 0 0 1 0 0 0 0 0 1 0 1
Somalia 0 0 0 0 0 1 0 0 0 1 1
South Africa 0 0 8 0 2 0 0 0 10 0 10
South Sudan 0 0 5 2 3 1 3 0 11 3 14
Tanzania 0 0 66 15 3 1 2 0 71 16 87
Thailand 0 0 0 0 0 0 0 0 0 0 0
Timor-Leste 0 0 0 0 0 0 0 0 0 0 0
Togo 0 0 13 0 1 1 0 0 14 1 15
Uganda 0 0 54 8 4 1 2 1 60 10 70
United
Kingdom
0 0 0 0 1 0 0 0 1 0 1
Vietnam 0 0 0 1 0 0 0 0 0 1 1
Zambia 0 0 34 36 2 0 0 0 36 36 72
Zimbabwe 0 0 14 1 7 0 0 0 21 1 22
Other (not
specified)
0 0 0 0 0 0 0 0 0 0 0
TOTAL 0 0 849 333 123 113 24 9 996 455 1451
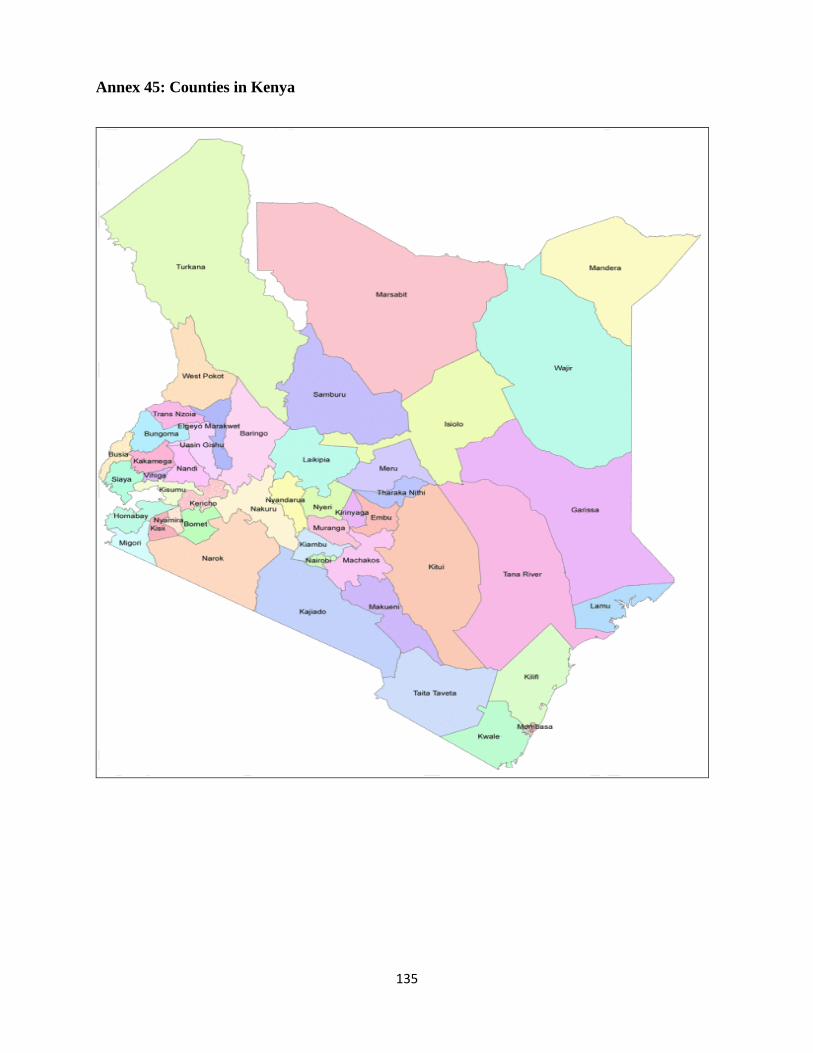
135
Annex 45: Counties in Kenya
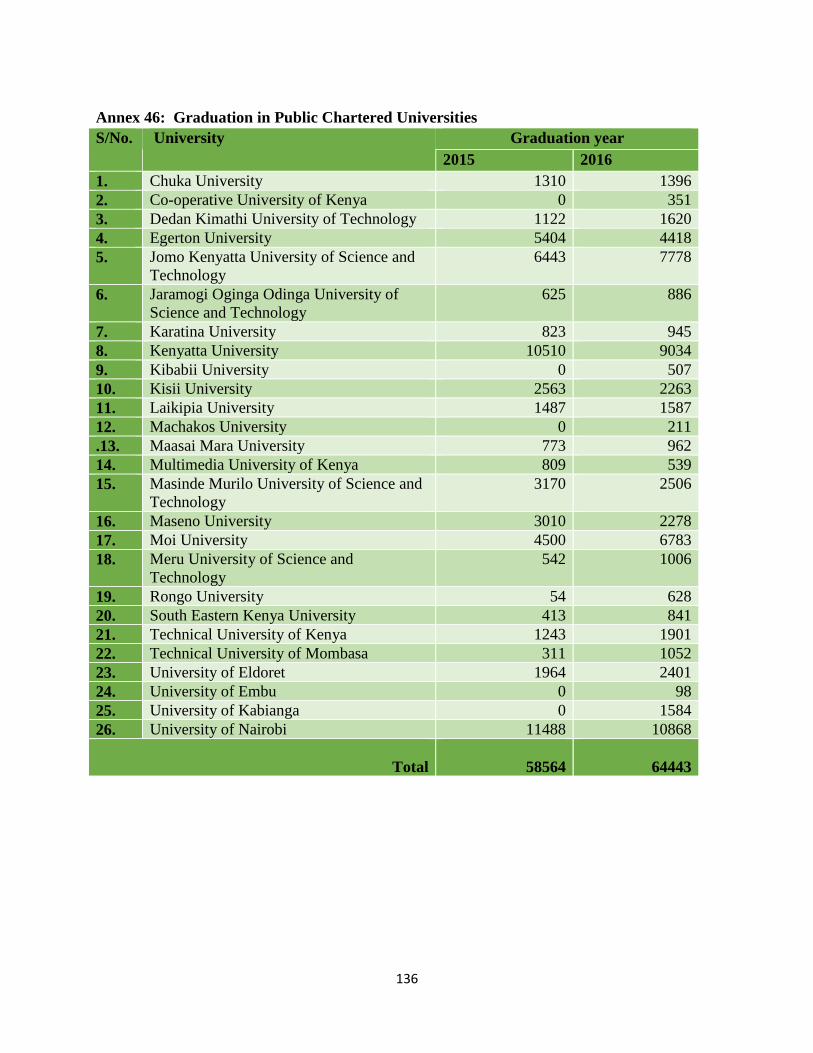
136
Annex 46: Graduation in Public Chartered Universities
S/No. University Graduation year
2015 2016
1. Chuka University 1310 1396
2. Co-operative University of Kenya 0 351
3. Dedan Kimathi University of Technology 1122 1620
4. Egerton University 5404 4418
5. Jomo Kenyatta University of Science and
Technology
6443 7778
6. Jaramogi Oginga Odinga University of
Science and Technology
625 886
7. Karatina University 823 945
8. Kenyatta University 10510 9034
9. Kibabii University 0 507
10. Kisii University 2563 2263
11. Laikipia University 1487 1587
12. Machakos University 0 211
.13. Maasai Mara University 773 962
14. Multimedia University of Kenya 809 539
15. Masinde Murilo University of Science and
Technology
3170 2506
16. Maseno University 3010 2278
17. Moi University 4500 6783
18. Meru University of Science and
Technology
542 1006
19. Rongo University 54 628
20. South Eastern Kenya University 413 841
21. Technical University of Kenya 1243 1901
22. Technical University of Mombasa 311 1052
23. University of Eldoret 1964 2401
24. University of Embu 0 98
25. University of Kabianga 0 1584
26. University of Nairobi 11488 10868
Total
58564
64443
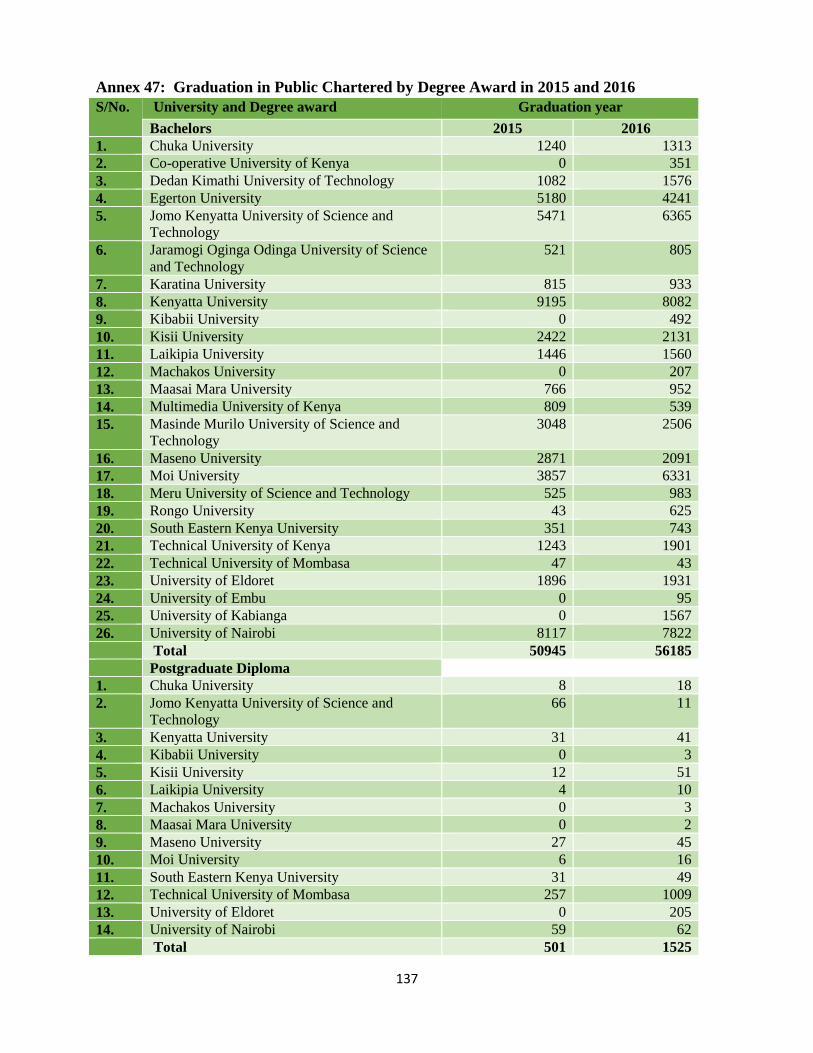
137
Annex 47: Graduation in Public Chartered by Degree Award in 2015 and 2016
S/No. University and Degree award Graduation year
Bachelors 2015 2016
1. Chuka University 1240 1313
2. Co-operative University of Kenya 0 351
3. Dedan Kimathi University of Technology 1082 1576
4. Egerton University 5180 4241
5. Jomo Kenyatta University of Science and
Technology
5471 6365
6. Jaramogi Oginga Odinga University of Science
and Technology
521 805
7. Karatina University 815 933
8. Kenyatta University 9195 8082
9. Kibabii University 0 492
10. Kisii University 2422 2131
11. Laikipia University 1446 1560
12. Machakos University 0 207
13. Maasai Mara University 766 952
14. Multimedia University of Kenya 809 539
15. Masinde Murilo University of Science and
Technology
3048 2506
16. Maseno University 2871 2091
17. Moi University 3857 6331
18. Meru University of Science and Technology 525 983
19. Rongo University 43 625
20. South Eastern Kenya University 351 743
21. Technical University of Kenya 1243 1901
22. Technical University of Mombasa 47 43
23. University of Eldoret 1896 1931
24. University of Embu 0 95
25. University of Kabianga 0 1567
26. University of Nairobi 8117 7822
Total 50945 56185
Postgraduate Diploma
1. Chuka University 8 18
2. Jomo Kenyatta University of Science and
Technology
66 11
3. Kenyatta University 31 41
4. Kibabii University 0 3
5. Kisii University 12 51
6. Laikipia University 4 10
7. Machakos University 0 3
8. Maasai Mara University 0 2
9. Maseno University 27 45
10. Moi University 6 16
11. South Eastern Kenya University 31 49
12. Technical University of Mombasa 257 1009
13. University of Eldoret 0 205
14. University of Nairobi 59 62
Total 501 1525
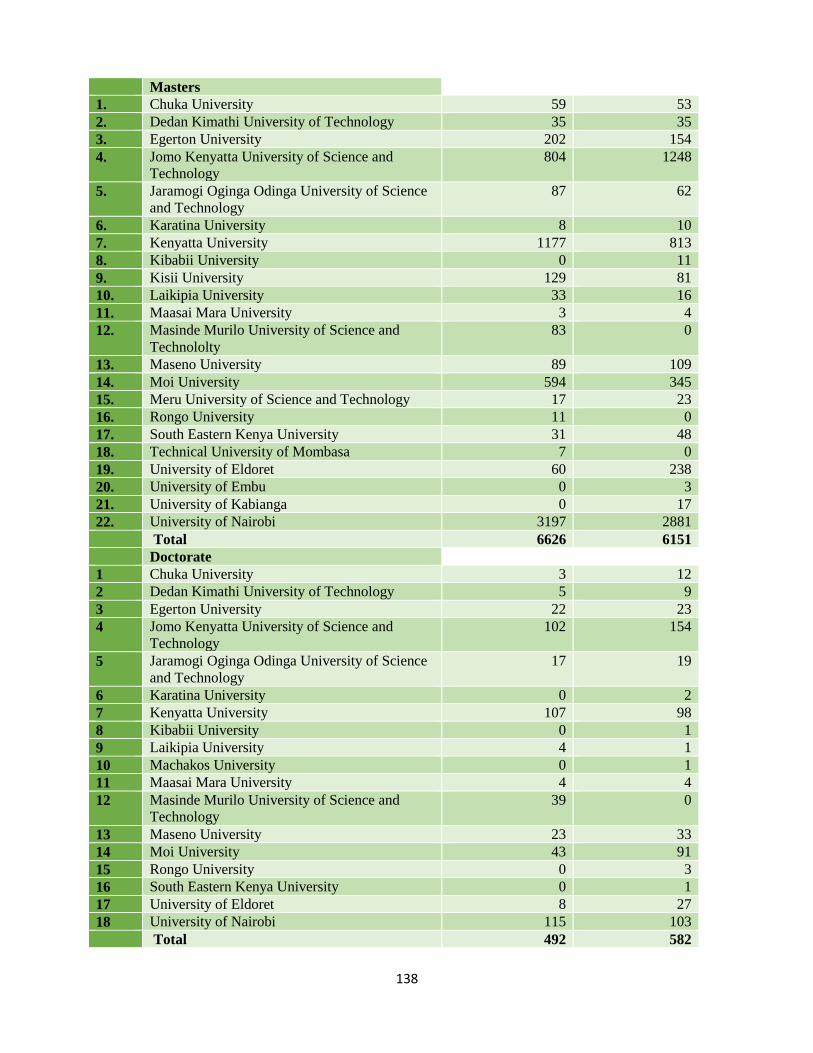
138
Masters
1. Chuka University 59 53
2. Dedan Kimathi University of Technology 35 35
3. Egerton University 202 154
4. Jomo Kenyatta University of Science and
Technology
804 1248
5. Jaramogi Oginga Odinga University of Science
and Technology
87 62
6. Karatina University 8 10
7. Kenyatta University 1177 813
8. Kibabii University 0 11
9. Kisii University 129 81
10. Laikipia University 33 16
11. Maasai Mara University 3 4
12. Masinde Murilo University of Science and
Technololty
83 0
13. Maseno University 89 109
14. Moi University 594 345
15. Meru University of Science and Technology 17 23
16. Rongo University 11 0
17. South Eastern Kenya University 31 48
18. Technical University of Mombasa 7 0
19. University of Eldoret 60 238
20. University of Embu 0 3
21. University of Kabianga 0 17
22. University of Nairobi 3197 2881
Total 6626 6151
Doctorate
1 Chuka University 3 12
2 Dedan Kimathi University of Technology 5 9
3 Egerton University 22 23
4 Jomo Kenyatta University of Science and
Technology
102 154
5 Jaramogi Oginga Odinga University of Science
and Technology
17 19
6 Karatina University 0 2
7 Kenyatta University 107 98
8 Kibabii University 0 1
9 Laikipia University 4 1
10 Machakos University 0 1
11 Maasai Mara University 4 4
12 Masinde Murilo University of Science and
Technology
39 0
13 Maseno University 23 33
14 Moi University 43 91
15 Rongo University 0 3
16 South Eastern Kenya University 0 1
17 University of Eldoret 8 27
18 University of Nairobi 115 103
Total 492 582
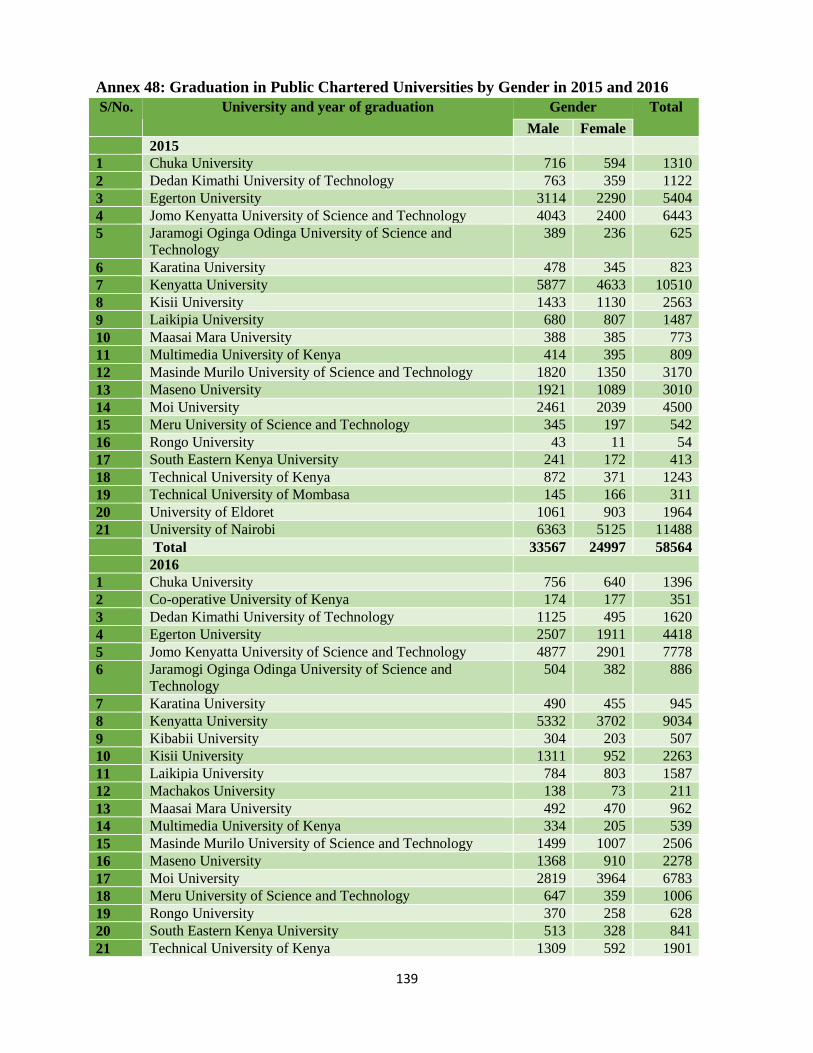
139
Annex 48: Graduation in Public Chartered Universities by Gender in 2015 and 2016
S/No. University and year of graduation Gender Total
Male Female
2015
1 Chuka University 716 594 1310
2 Dedan Kimathi University of Technology 763 359 1122
3 Egerton University 3114 2290 5404
4 Jomo Kenyatta University of Science and Technology 4043 2400 6443
5 Jaramogi Oginga Odinga University of Science and
Technology
389 236 625
6 Karatina University 478 345 823
7 Kenyatta University 5877 4633 10510
8 Kisii University 1433 1130 2563
9 Laikipia University 680 807 1487
10 Maasai Mara University 388 385 773
11 Multimedia University of Kenya 414 395 809
12 Masinde Murilo University of Science and Technology 1820 1350 3170
13 Maseno University 1921 1089 3010
14 Moi University 2461 2039 4500
15 Meru University of Science and Technology 345 197 542
16 Rongo University 43 11 54
17 South Eastern Kenya University 241 172 413
18 Technical University of Kenya 872 371 1243
19 Technical University of Mombasa 145 166 311
20 University of Eldoret 1061 903 1964
21 University of Nairobi 6363 5125 11488
Total 33567 24997 58564
2016
1 Chuka University 756 640 1396
2 Co-operative University of Kenya 174 177 351
3 Dedan Kimathi University of Technology 1125 495 1620
4 Egerton University 2507 1911 4418
5 Jomo Kenyatta University of Science and Technology 4877 2901 7778
6 Jaramogi Oginga Odinga University of Science and
Technology
504 382 886
7 Karatina University 490 455 945
8 Kenyatta University 5332 3702 9034
9 Kibabii University 304 203 507
10 Kisii University 1311 952 2263
11 Laikipia University 784 803 1587
12 Machakos University 138 73 211
13 Maasai Mara University 492 470 962
14 Multimedia University of Kenya 334 205 539
15 Masinde Murilo University of Science and Technology 1499 1007 2506
16 Maseno University 1368 910 2278
17 Moi University 2819 3964 6783
18 Meru University of Science and Technology 647 359 1006
19 Rongo University 370 258 628
20 South Eastern Kenya University 513 328 841
21 Technical University of Kenya 1309 592 1901
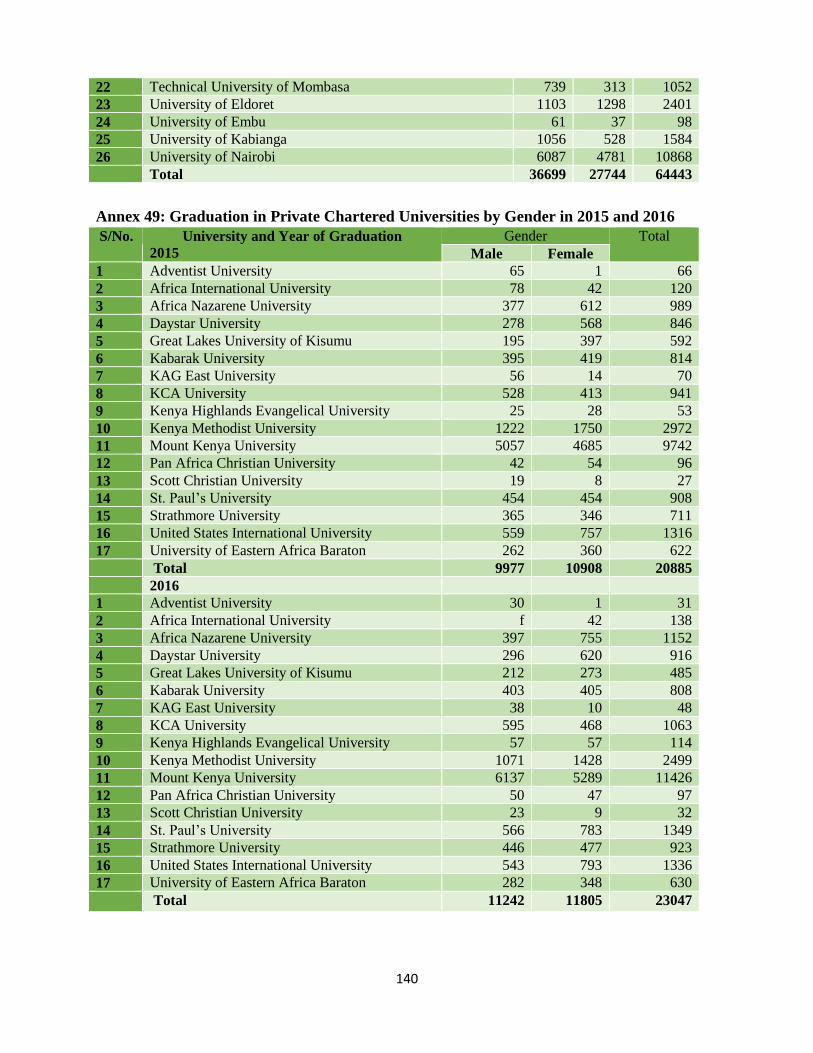
140
22 Technical University of Mombasa 739 313 1052
23 University of Eldoret 1103 1298 2401
24 University of Embu 61 37 98
25 University of Kabianga 1056 528 1584
26 University of Nairobi 6087 4781 10868
Total 36699 27744 64443
Annex 49: Graduation in Private Chartered Universities by Gender in 2015 and 2016
S/No. University and Year of Graduation
2015
Gender Total
Male Female
1 Adventist University 65 1 66
2 Africa International University 78 42 120
3 Africa Nazarene University 377 612 989
4 Daystar University 278 568 846
5 Great Lakes University of Kisumu 195 397 592
6 Kabarak University 395 419 814
7 KAG East University 56 14 70
8 KCA University 528 413 941
9 Kenya Highlands Evangelical University 25 28 53
10 Kenya Methodist University 1222 1750 2972
11 Mount Kenya University 5057 4685 9742
12 Pan Africa Christian University 42 54 96
13 Scott Christian University 19 8 27
14 St. Paul’s University 454 454 908
15 Strathmore University 365 346 711
16 United States International University 559 757 1316
17 University of Eastern Africa Baraton 262 360 622
Total 9977 10908 20885
2016
1 Adventist University 30 1 31
2 Africa International University f 42 138
3 Africa Nazarene University 397 755 1152
4 Daystar University 296 620 916
5 Great Lakes University of Kisumu 212 273 485
6 Kabarak University 403 405 808
7 KAG East University 38 10 48
8 KCA University 595 468 1063
9 Kenya Highlands Evangelical University 57 57 114
10 Kenya Methodist University 1071 1428 2499
11 Mount Kenya University 6137 5289 11426
12 Pan Africa Christian University 50 47 97
13 Scott Christian University 23 9 32
14 St. Paul’s University 566 783 1349
15 Strathmore University 446 477 923
16 United States International University 543 793 1336
17 University of Eastern Africa Baraton 282 348 630
Total 11242 11805 23047
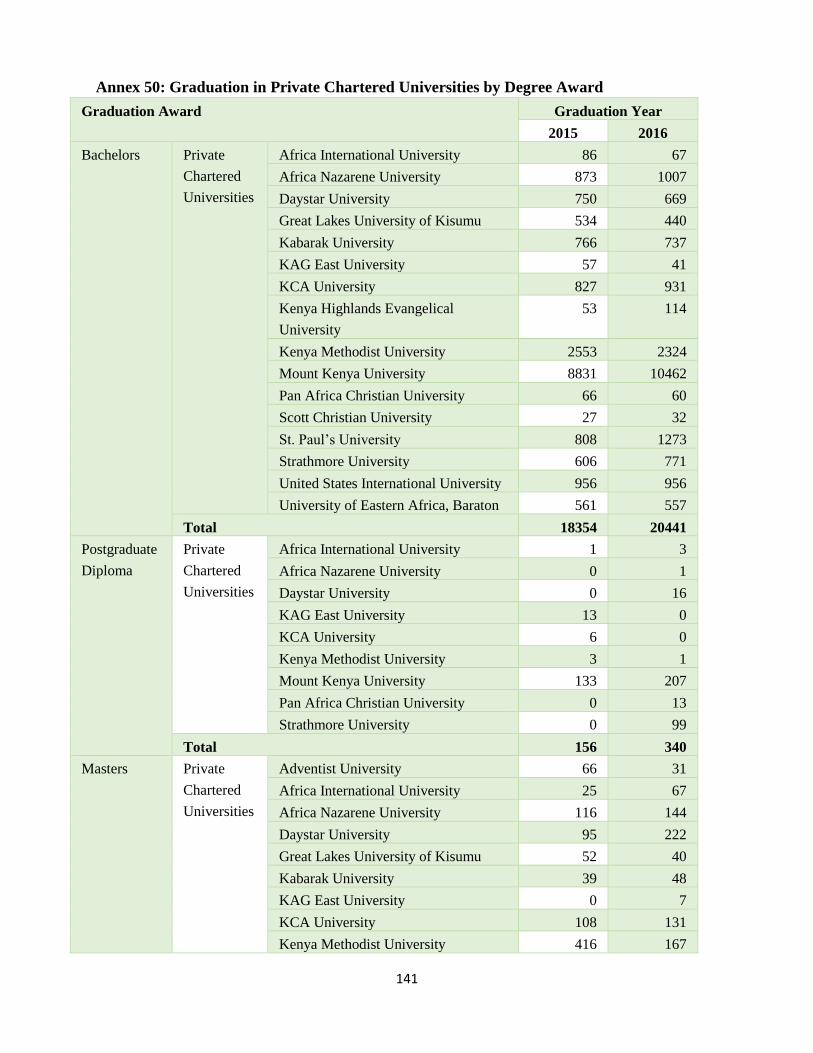
141
Annex 50: Graduation in Private Chartered Universities by Degree Award
Graduation Award Graduation Year
2015 2016
Bachelors Private
Chartered
Universities
Africa International University 86 67
Africa Nazarene University 873 1007
Daystar University 750 669
Great Lakes University of Kisumu 534 440
Kabarak University 766 737
KAG East University 57 41
KCA University 827 931
Kenya Highlands Evangelical
University
53 114
Kenya Methodist University 2553 2324
Mount Kenya University 8831 10462
Pan Africa Christian University 66 60
Scott Christian University 27 32
St. Paul’s University 808 1273
Strathmore University 606 771
United States International University 956 956
University of Eastern Africa, Baraton 561 557
Total 18354 20441
Postgraduate
Diploma
Private
Chartered
Universities
Africa International University 1 3
Africa Nazarene University 0 1
Daystar University 0 16
KAG East University 13 0
KCA University 6 0
Kenya Methodist University 3 1
Mount Kenya University 133 207
Pan Africa Christian University 0 13
Strathmore University 0 99
Total 156 340
Masters Private
Chartered
Universities
Adventist University 66 31
Africa International University 25 67
Africa Nazarene University 116 144
Daystar University 95 222
Great Lakes University of Kisumu 52 40
Kabarak University 39 48
KAG East University 0 7
KCA University 108 131
Kenya Methodist University 416 167
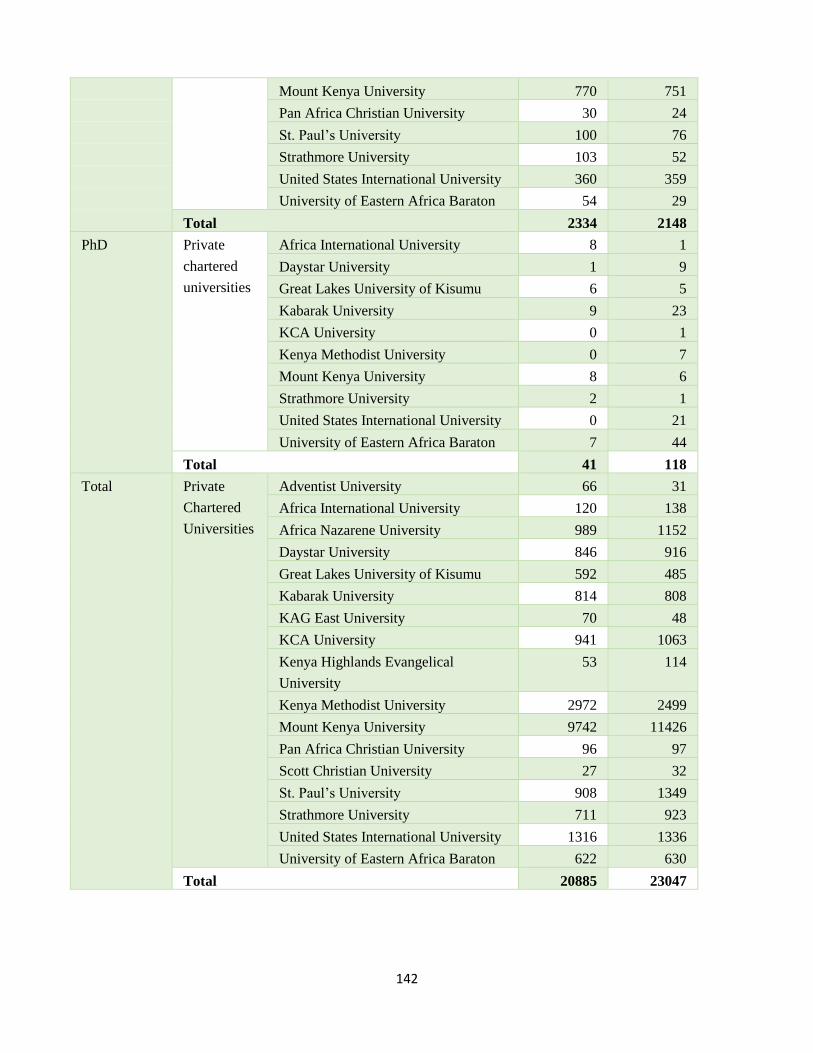
142
Mount Kenya University 770 751
Pan Africa Christian University 30 24
St. Paul’s University 100 76
Strathmore University 103 52
United States International University 360 359
University of Eastern Africa Baraton 54 29
Total 2334 2148
PhD Private
chartered
universities
Africa International University 8 1
Daystar University 1 9
Great Lakes University of Kisumu 6 5
Kabarak University 9 23
KCA University 0 1
Kenya Methodist University 0 7
Mount Kenya University 8 6
Strathmore University 2 1
United States International University 0 21
University of Eastern Africa Baraton 7 44
Total 41 118
Total Private
Chartered
Universities
Adventist University 66 31
Africa International University 120 138
Africa Nazarene University 989 1152
Daystar University 846 916
Great Lakes University of Kisumu 592 485
Kabarak University 814 808
KAG East University 70 48
KCA University 941 1063
Kenya Highlands Evangelical
University
53 114
Kenya Methodist University 2972 2499
Mount Kenya University 9742 11426
Pan Africa Christian University 96 97
Scott Christian University 27 32
St. Paul’s University 908 1349
Strathmore University 711 923
United States International University 1316 1336
University of Eastern Africa Baraton 622 630
Total 20885 23047
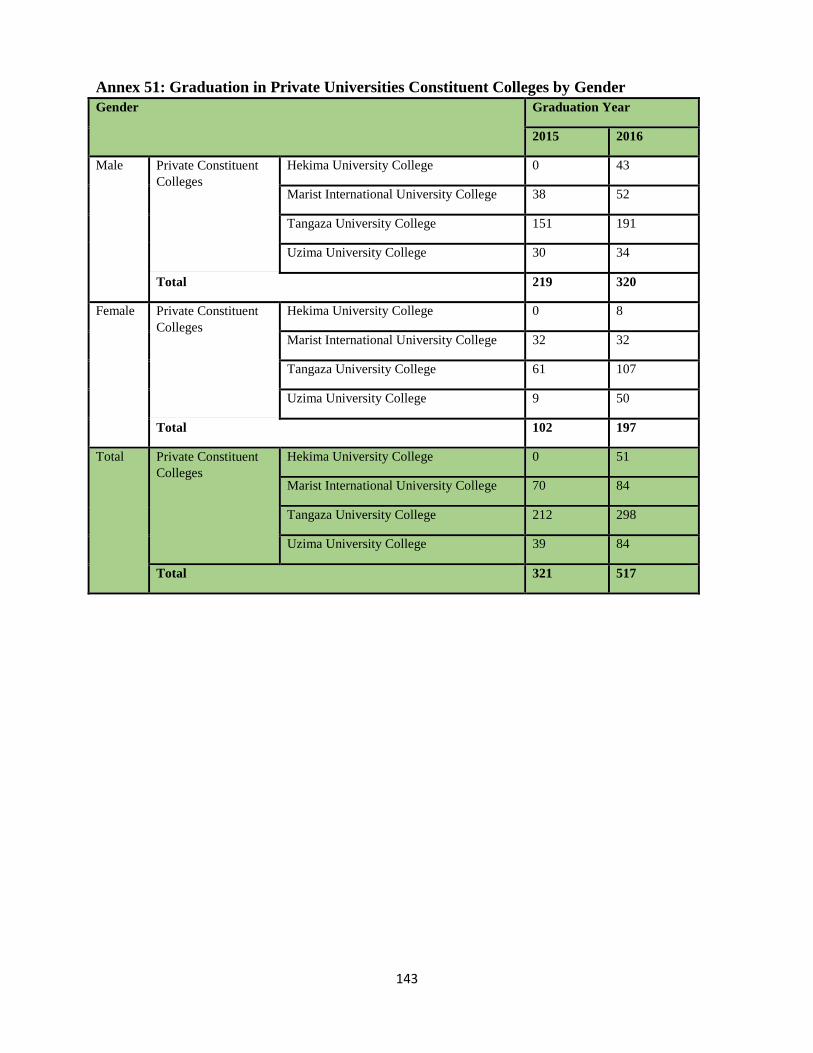
143
Annex 51: Graduation in Private Universities Constituent Colleges by Gender
Gender Graduation Year
2015 2016
Male Private Constituent
Colleges
Hekima University College 0 43
Marist International University College 38 52
Tangaza University College 151 191
Uzima University College 30 34
Total 219 320
Female Private Constituent
Colleges
Hekima University College 0 8
Marist International University College 32 32
Tangaza University College 61 107
Uzima University College 9 50
Total 102 197
Total Private Constituent
Colleges
Hekima University College 0 51
Marist International University College 70 84
Tangaza University College 212 298
Uzima University College 39 84
Total 321 517
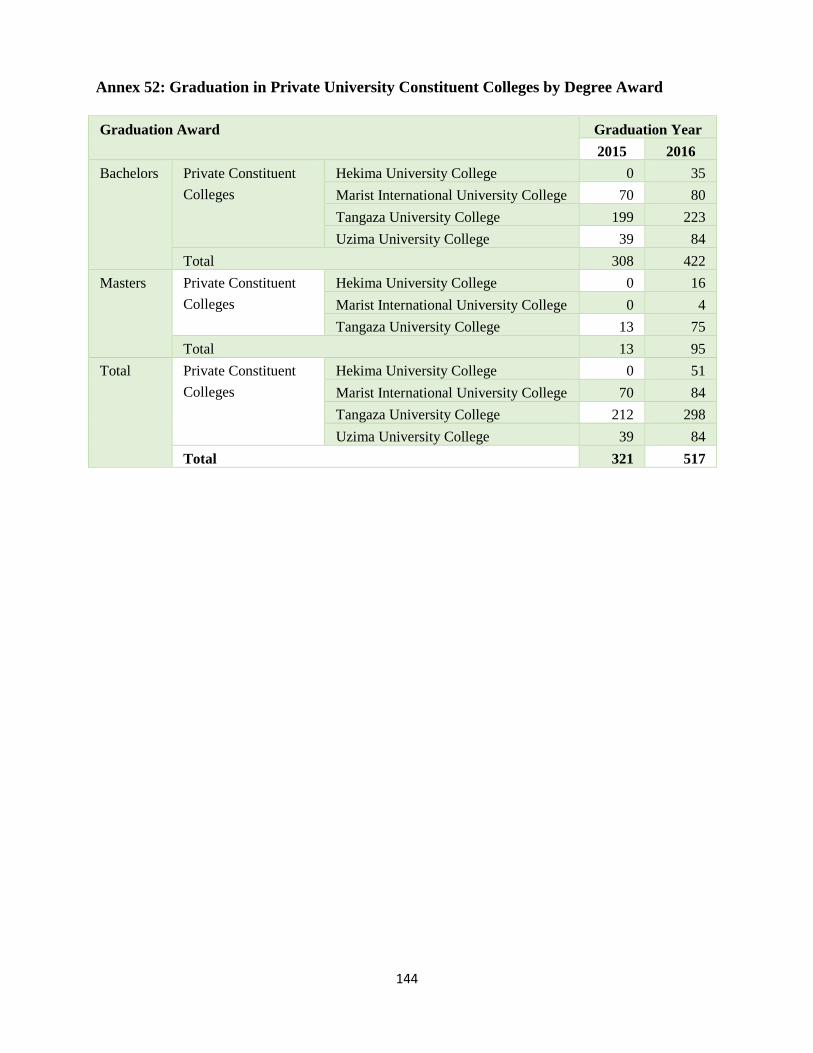
144
Annex 52: Graduation in Private University Constituent Colleges by Degree Award
Graduation Award Graduation Year
2015 2016
Bachelors Private Constituent
Colleges
Hekima University College 0 35
Marist International University College 70 80
Tangaza University College 199 223
Uzima University College 39 84
Total 308 422
Masters Private Constituent
Colleges
Hekima University College 0 16
Marist International University College 0 4
Tangaza University College 13 75
Total 13 95
Total Private Constituent
Colleges
Hekima University College 0 51
Marist International University College 70 84
Tangaza University College 212 298
Uzima University College 39 84
Total 321 517
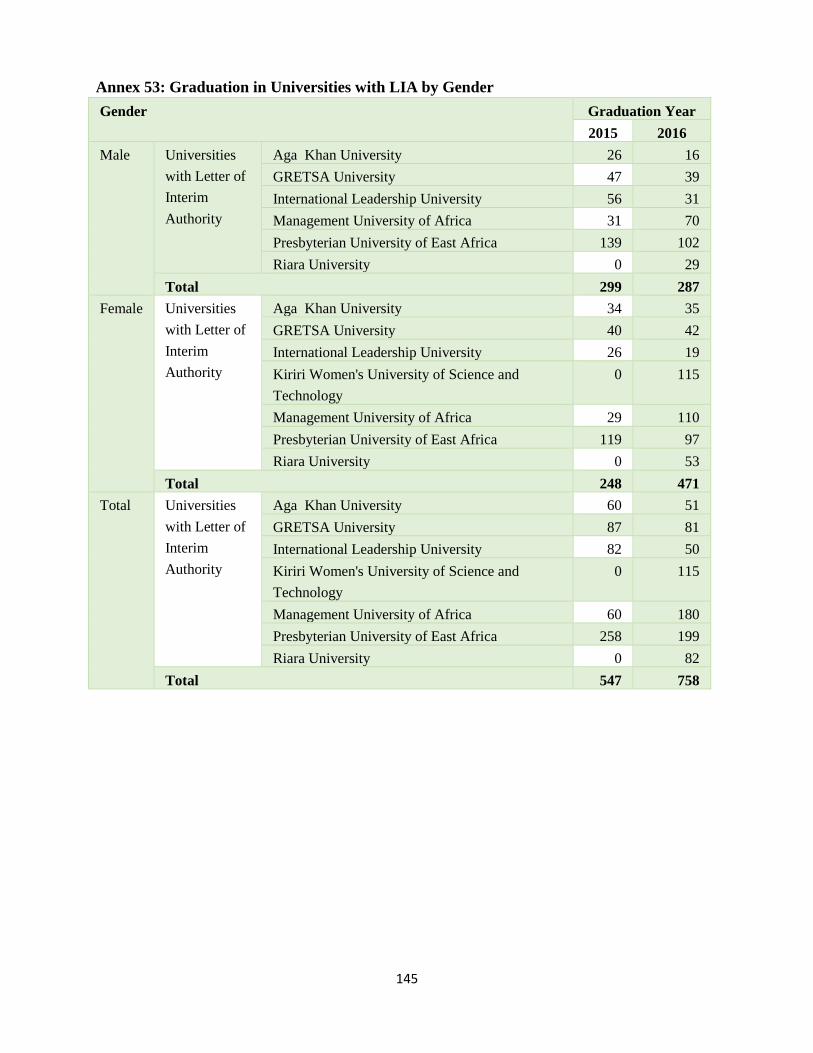
145
Annex 53: Graduation in Universities with LIA by Gender
Gender Graduation Year
2015 2016
Male Universities
with Letter of
Interim
Authority
Aga Khan University 26 16
GRETSA University 47 39
International Leadership University 56 31
Management University of Africa 31 70
Presbyterian University of East Africa 139 102
Riara University 0 29
Total 299 287
Female Universities
with Letter of
Interim
Authority
Aga Khan University 34 35
GRETSA University 40 42
International Leadership University 26 19
Kiriri Women's University of Science and
Technology
0 115
Management University of Africa 29 110
Presbyterian University of East Africa 119 97
Riara University 0 53
Total 248 471
Total Universities
with Letter of
Interim
Authority
Aga Khan University 60 51
GRETSA University 87 81
International Leadership University 82 50
Kiriri Women's University of Science and
Technology
0 115
Management University of Africa 60 180
Presbyterian University of East Africa 258 199
Riara University 0 82
Total 547 758
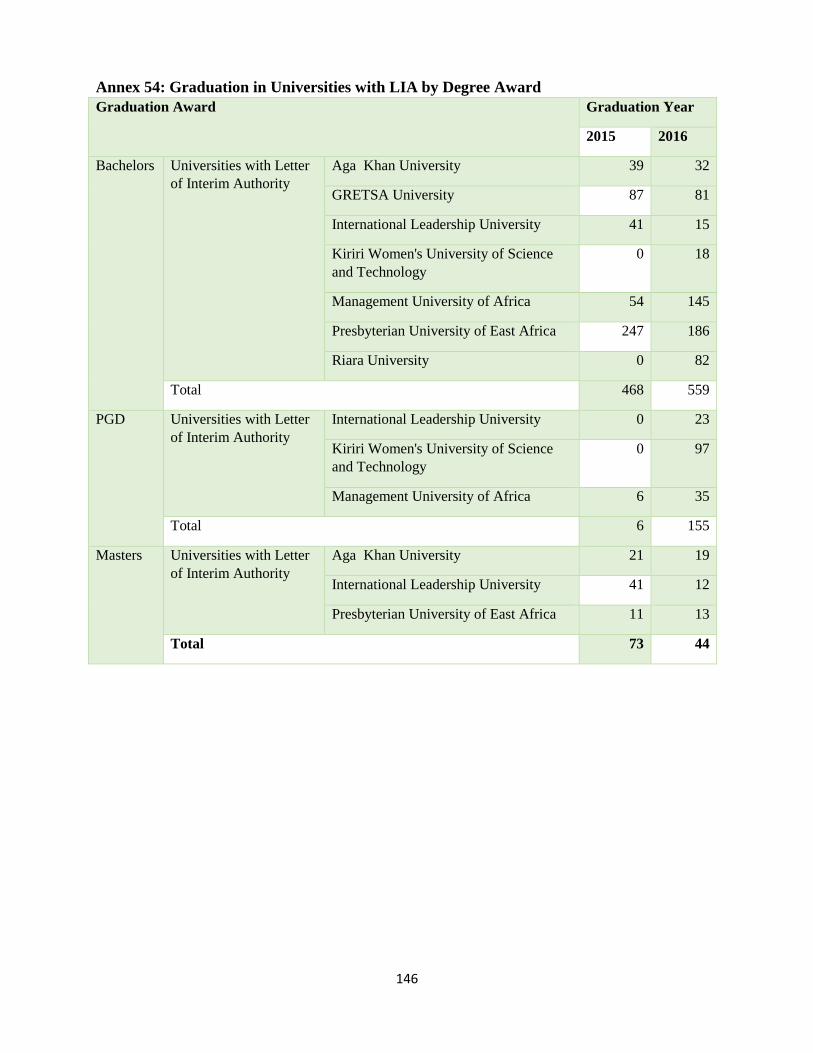
146
Annex 54: Graduation in Universities with LIA by Degree Award
Graduation Award Graduation Year
2015 2016
Bachelors Universities with Letter
of Interim Authority
Aga Khan University 39 32
GRETSA University 87 81
International Leadership University 41 15
Kiriri Women's University of Science
and Technology
0 18
Management University of Africa 54 145
Presbyterian University of East Africa 247 186
Riara University 0 82
Total 468 559
PGD Universities with Letter
of Interim Authority
International Leadership University 0 23
Kiriri Women's University of Science
and Technology
0 97
Management University of Africa 6 35
Total 6 155
Masters Universities with Letter
of Interim Authority
Aga Khan University 21 19
International Leadership University 41 12
Presbyterian University of East Africa 11 13
Total 73 44
147
REFERENCES
Africa-America Institute (2015). State of Education in Africa Report. Retrieved February 2018,
from www.aaionline.org/wp-content/uploads/2015/09/AAI-SOE-report-2015-final.pdf
Association for the Development of Education in Africa (2015). The Role of Research and
Postgraduate Studies in African Higher Education . Dakar,: ADEA.
Commission for University Education (2014). Harmonized Criteria and Guidelines for
Appointment and Promotion of Academic Staff in Universities in Kenya. CUE:Nairobi
Commission for University Education (2014). Universities Standards and Guidelines.
CUE:Nairobi
Commission for University Education (2016). State of University Education in Kenya. CUE:
Nairobi.
Eurydice Report. (2017). Modernisation of Higher Education in Europe: Academic Staff.
European Commission.
Darvas, P., Gao, S., Shen, Y., & Bawany, B. (2017). Sharing Higher Education's promise beyong
the few in Sub-saharan Africa. Directions in Development-Human Development.
doi:http://dx.doi-org/10.1596/978-1-4648
Engineers Board of Kenya (2014). Strategic Plan 2014-2019. Nairobi: Ministry of Transport and
Infrastructure.
Fredua-Kwarteng, E., & Ofuso, S. K. (2018, March). How can Universities address Spiralling
enrolment? Retrieved from University World News:
www.universityworldnews.com/article.php?story=20180214094656754
Government of Kenya (2006). Kenya Vision 2030. Nairobi: Government Printers.
Government of Kenya (2012). Universities Act. Nairobi: Government Printers.
Government of Kenya (1964). Kenya Education Commission, Nairobi: Government Printer.
Government of Kenya (1981). Second University in Kenya (Mackay Report) Nairobi;
Government
Printer.
Government of Kenya (1988). Report of the Presidential Working Party on Education and
Manpower Training for the Next Decade and Beyond, (Kamunge Report). Nairobi;
Government Printer.
Government of Kenya (1999). Report of the Inquiry into the Education System of Kenya
(TIQET) Koech Report, Nairobi; Government Printer.
Government of Kenya (2005). Sessional Paper No.1 on Policy Framework for Education,
Training and Research, Nairobi; Government Printer.
Government of Kenya (2007). Vision 2030: Nairobi, Government Printer.
Government of Kenya (1976). Report of the National Committee on Educational Objectives and
Policies (Gachathi Report) Nairobi; Government Printer
Government of Kenya (2012). Sessional Paper No. 10 of 2012. Report of the National
Committee on Educational Objectives and Policies (Gachathi Report) Nairobi; Government
Printer.
Hong, S., & Mbeke, C. (2016). Policies of Access and Quality of Higher Education in China and
Kenya: A Comparative Study. International & Comparative Education, 4-11.
Kabiru Kinyanjui Report. (2006). The Public Universities Inspection Board Report on
Transformation of Higher Education and Training in kenya. Nairobi.
Kenya National Bureaus of Statistics (2017). Economic Survey, 2017: KNBS: Nairobi.
148
Khodabocus, F. (2016). Challenges to Doctoral Education in Africa. International Higher
Education , 25-27.
McCowan, T., Walker, M., Fongwa, S., Oanda, I., Sifuna, D., Adedeji, S., . . . Tamanja, E.
(2016). Universities, Employability and Inclusive Development: Repositioning Higher
Education in Ghana, Kenya, Nigeria and South Africa. British Council.
Mohamedbai, G. (2018, March). The Changing Landscape of Private Higher Education.
Retrieved from University World News:
www.universityworldnews.com/article.php?story=2017103110332862
University of Oxford (2015). International Trends in Higher Education. London: University of
Oxford.
World Economic Forum (2014). Global Competitiveness Report. Switzerland
149
Commission for University Education
Red Hill Road, off, Limuru Road, Gigiri
P.O. Box 54999-00200, Nairobi, Kenya
: + 254 (20) 7205120| 0726-445566| 0717-445566| 0780-656575|
[email protected] : @CUE_Kenya
Commission for University Education, Kenya
Website: www.cue.or.ke
ISBN 978-9966-009-25-8