collaborative construction planning: towards 4d visualizations adapted to practitioners requirements
TRANSCRIPT

Proceedings of the CIB W78 2010: 27th International Conference –Cairo, Egypt, 16-18 November
COLLABORATIVE CONSTRUCTION PLANNING: TOWARDS 4D VISUALIZATIONS ADAPTED TO PRACTITIONERS REQUIREMENTS
Conrad Boton, Civil Engineer, PhD student, [email protected] Henri Tudor Public Research Center, Luxembourg-Kirchberg, Luxembourg, FRE MAP-CRAI, Research Centre in Architecture and Engineering, Nancy, France Sylvain Kubicki, Dr. Architect, Research Engineer, [email protected] Henri Tudor Public Research Center, Luxembourg-Kirchberg, Luxembourg FRE MAP-CRAI, Research Centre in Architecture and Engineering, Nancy, France Gilles Halin, Dr., Lecturer, [email protected] FRE MAP-CRAI, Research Centre in Architecture and Engineering, Nancy, France
ABSTRACT
Managing the intervention of various actors during the construction phase is a recurrent issue in the construction sector. This is partly due to the multiplicity of stakeholders and the need to manage interfaces necessary for efficient planning and coordination of construction tasks. 4D CAD technology appears to be an innovative approach to answer such issues. It consists in combining a 3D model with the time dimension, in order to simulate the progress of works construction along the time. Our main hypothesis is that the use of 4D to support the actors’ collaborative work is not adapted enough to the need of the sector because the classical view (Gantt + 3D model) does not take into account the specific requirements related to particular usages (planning of interventions and reservations request for a contractor; simulation and integration of works’ interfaces for an engineer, etc..). It is therefore challenging to adapt the visualization to business needs of users. Developments in Human-Machine Interface and Information Visualization fields could allow us selecting user views properties (I.e. Structure, Quantity of information displayable, Graphical attributes, Content description, Interaction principles, Business view) and compose “business views”. Therefore, the article propose taxonomy to describe user views in order to setup a method for business visualization design, enabling to: 1) Identify business tasks (usages) related to the roles of different users, 2) Offer services tailored to different usages, and 3) Suggest visualization modes fitting each usage on the basis of our visualization model. In a case study we formalize a collaborative process to identify the usages of each practitioners involved in the collaboration construction process planning. It especially targets collaborative management of works’ interfaces. Then, after defining the required services, we suggest combining visualization methods suitable for each use in order to achieve views composition for each stakeholder. Keywords: Construction process, Collaboration, 4D CAD, Human-Computer Interface, Information visualization, Business view, Model driven engineering
1. INTRODUCTION
Managing the intervention of stakeholders in collaborative works such as in construction sector is an important issue. The main reasons are the multiplicity of stakeholders coming from different trades and also the need of managing work’s interfaces between them. This issue has been previously explored (Hanrot 2003, Tahon 1997)
but the question remains recurring. It is therefore necessary to explore new solutions both on human side of collaboration (i.e. processes and working practices) and on the technological side. Thus, 4D CAD appears to be an innovative approach to support the simulation of the construction activity. Several uses of the 4D CAD have been proposed and tested since its emergence (Chau & al. 2005). From the simple simulation of the construction to interventions and reservations management, the proposed developments provide solutions more or less relevant to the problem. An important aspect of the construction industry is the flexibility that characterizes projects’ management. Indeed, each stakeholder of a cooperative project’s context has his own interests, his methods and specific tasks. In this context generic solutions are difficult to adopt successfully. It is then important to adapt solutions to the needs of users. One of the key points in adapting CSCW tools (groupware) is to design visualizations matching the business requirements of users. Considering previous 4D developments, the standard view (i.e. Gantt planning associated with 3D model) currently proposed to different actors in 4D CAD tools does not take into account this adaptation. Specific requirements related to tasks performed by particular roles (planning of interventions and reservations request for a contractor; simulation and integration of works’ interfaces for an engineer, etc…) are not considered. This work relies on previous works (Kubicki & Halin 2010) that mainly aim to model the collaborative context of construction projects and to propose IT services and business views based on business tasks requirements. In this paper we will first make a brief state of the art of 4D CAD developments in the construction field in order to identify activities and services used to support the collaborative work. Then, an overview of research works in the fields of Human-Computer Interface and Information Visualization will allow us to define taxonomic attributes, in order to propose a metamodel that can describe “business views”. As an application, we suggest a scenario of collaborative use of 4D model helping us to identify the tasks of different stakeholders, to define services and possible user views for these tasks. The developed metamodel allows us to describe and compare the user views in order to choose the most adapted one for each task and to compose coordinated multiple views for each actor involved in the process.
2. 4D USE IN AEC AND IMPORTANCE OF ADAPTED VISUALIZATI ON
4D CAD technology consists in linking a three-dimensional (3D) model of a construction project with the works’ planning. It leads to obtain an "augmented planning” that can represent the construction progress over time (Kubicki 2006, Chau & al. 2005). The use of 4D helps to resolve recurrent problems in the AEC projects. To this end, several applications have been proposed and tested. (Sriprasert & Dawood 2003) made the assumption that in complex and simultaneous construction projects, reliable planning is central to effective collaboration. But they observed that the thousands of articles published during the previous 50 years on construction planning are very fragmentary and have not yet provided a universal system that addresses a typical problem in the construction sector. They proposed a method called "Planning multi-constraint" and developed a 4D prototype embedded in the environment of Autodesk Architectural Desktop. (Chau & al. 2004) estimated that the visual link between the timing and conditions of construction site could facilitate decision-making during both phases of planning and construction. The focus of 4D CAD developments has often been placed at the building components, always missing useful features that can help manage the site in the following areas: generation of on-site usage patterns, estimation of quantities of building materials help and costs estimate. To repair these deficiencies, they designed a 4D visualization model for both construction managers to plan daily activities more effectively, and also add to knowledge and understanding the relevance of modern computer graphics to the responsibilities of manager of the construction site. (Kubicki 2006) has particularly mentioned the use of 4D as an attractive solution since, by integrating 3D model and Gantt chart, it can assist the preparation phase of construction by the 3D analysis sequence of implementation, and shows the progress during construction. Going further, he imagined to generalize the 4D visualization (planning + 3D model) by linking it to a third "view" specific to the coordination, i.e. the construction meeting report. There would thus be the trio: meeting reporting, 3D model and schedule to navigate through coordination information and improve understanding of the state of activity by each actor. To show the feasibility, he proposed a prototype (Bat'iViews). (Lu & al. 2007) proposed a construction planning method that integrates operations simulation with critical path method (CPM)-based 4D-CAD in order to provide
a more useful tool that overcomes the shortcomings of the current ones, and presented a trial application of the method on a precast viaduct construction project in Hong Kong. (Seok & al. 2009) established that “the link methodologies in current 4D CAD viewer should be improved with understanding of characteristic by each project type and suggested a link method in 4D CAD system for plant project management. Furthermore, studies have been conducted to assess the real value of the use of 4D CAD models in construction projects. (Staub-French & Khanzode 2007) worked on two different building construction projects in California that have implemented 3D and 4D modeling in varying degrees throughout the design and construction process. They concluded that 3D and 4D modeling may have a significant impact on project implementation, including increased productivity, elimination of interference on the ground, pre-production increased, fewer times, fewer requests for information, unless change orders, unless increased costs and decreased time. They proposed a guideline to help teams to implement 3D and 4D models in construction projects, particularly to address technical problems, procedural and organizational issues that are often barriers to adopting these technologies. (Dawood & Sikka 2007) conducted an experiment among participants of different age groups (11-22 years). The aim of the experiment is to assess how much information participants are able to extract and retain in their minds by the analysis of two different formats of graphical representation (4D model and 2D). The research results have provided quantitative data showing that the 4D group outperformed the 2D group by constructing 7% faster the physical model, spending 22% less time to extract intelligence information from the construction and reconstructing 77% less compared to the 2D Group. The 4D group participants were able to communicate and coordinate better compared to participants in the group 2D. (Mahalingam & al. 2010) made an assessment, through the study of four construction projects underway in India and the applicability of 4D CAD in construction projects. They established that it could offer advantages at the stage of development and project planning, and in the construction phase. According to them, it seems particularly useful during the construction phase for comparing the constructability of the working methods, to visually identify conflicts or clashes (overlaps), and as a visual tool for contractors, customers, subcontractors and suppliers to discuss and plan the project progress. As we can see, the 4D models are of obvious interest to the AEC. In addition, efforts have been made to improve the collaborative 4D planning (Sriprasert & Dawood 2003, Zhou & al. 2009). But adapting visualization to the business requirements of different actors still remains a challenging issue. It should be noted that some characteristics of AEC have to be taken into account. Indeed, “an AEC operation is characterized on the one hand by the particularities of the architectural object (situated object, prototype object) and on the other the specificities of the cooperative tasks (variable teams, decentralization of decision)” (Kubicki & al 2006). Then actors tend to use different visualization modes, depending on their role. It is therefore necessary to consider adapting the display to business needs of users. “Therefore visualization techniques of project context’s information could be designed according to the tasks, and be identified as an adaptable visualization service which could be chosen, integrated and used by the actors to perform their activity inside a project” (Kubicki & Halin 2010). Moreover many works showed the value of adapted visualization (Davidson 1993, Norman 1994). So, visualization must be designed not only in terms of aesthetics and ergonomics, but also as meeting real needs related of each user and the actions they will have to operate within their design and construction process.
3. TOWARD ADAPTED BUSINESS VIEWS IN 4D CAD – SUPPORTED COLLABORATIVE WORK IN AEC
3.1 METHOD
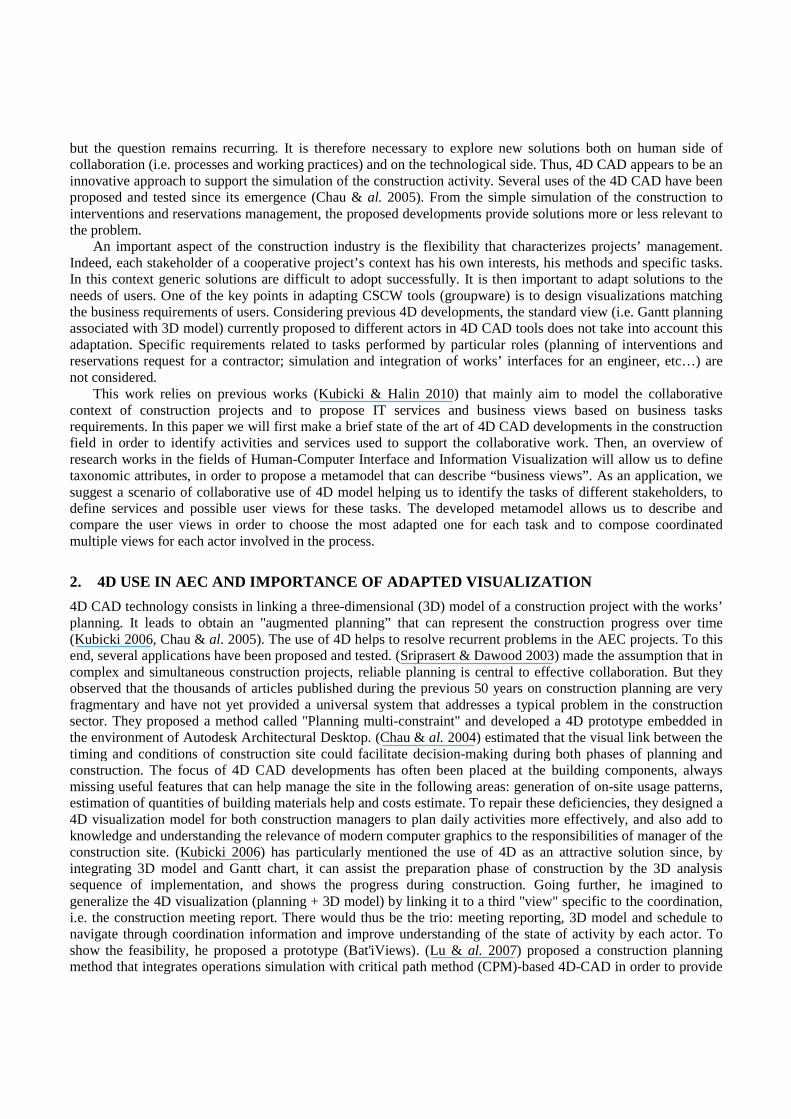
Above we have shown the benefits of the use of 4D CAD as a medium for collaborative planning activity in AEC. In most of the scenarios encountered in the literature, the same 4D view (3D + Gantt) is proposed to all players. Of course, as said, this view does not take into account the specific needs associated with certain tasks. In addition, an important principle of information visualization recommends not displaying more information than necessary to avoid cognitive overload. We propose to match business views to the tasks of actors. In order to design views adapted to actors’ tasks in a 4D CAD use context, we followed a multi-step approach as shown in Figure 1. Initially, it’s important to work on formalizing a process scenario. This process will allow to clearly
identifying the tasks of each actor. Identifying such tasks helped us to understand the related information needed to achieve them and the visualization techniques that could be used (Step 1). After that, the visualization needs could be identified, i.e. the interaction principles and specific visualization tasks related to business tasks we previously identified (Step 2). Then, it would be possible to describe and compare possible visualization techniques in order to choose the most adapted one, according to the visualization needs. That will finally enable to design the most adapted business view (Step 3).
Process model
Identification of business tasks
Business tasks
Needed information
Identifying visualization needs
Needed interaction principles
Needed visualisation tasks Comparison of techniques
Choose business view
Choose adapted technique
Business viewPossibles visualization techniques
+
Visualization needs
Step 1 Step 2 Step 3 Figure 1: Multi-step approach to compose business view
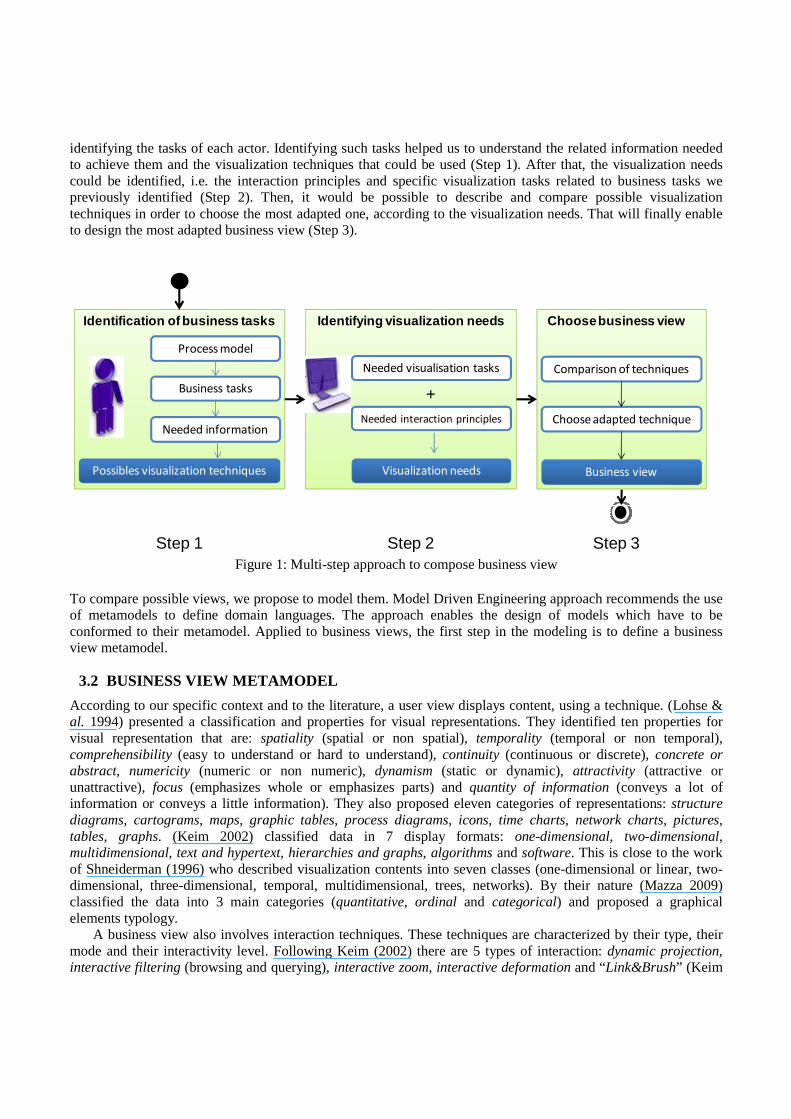
To compare possible views, we propose to model them. Model Driven Engineering approach recommends the use of metamodels to define domain languages. The approach enables the design of models which have to be conformed to their metamodel. Applied to business views, the first step in the modeling is to define a business view metamodel.
3.2 BUSINESS VIEW METAMODEL
According to our specific context and to the literature, a user view displays content, using a technique. (Lohse & al. 1994) presented a classification and properties for visual representations. They identified ten properties for visual representation that are: spatiality (spatial or non spatial), temporality (temporal or non temporal), comprehensibility (easy to understand or hard to understand), continuity (continuous or discrete), concrete or abstract, numericity (numeric or non numeric), dynamism (static or dynamic), attractivity (attractive or unattractive), focus (emphasizes whole or emphasizes parts) and quantity of information (conveys a lot of information or conveys a little information). They also proposed eleven categories of representations: structure diagrams, cartograms, maps, graphic tables, process diagrams, icons, time charts, network charts, pictures, tables, graphs. (Keim 2002) classified data in 7 display formats: one-dimensional, two-dimensional, multidimensional, text and hypertext, hierarchies and graphs, algorithms and software. This is close to the work of Shneiderman (1996) who described visualization contents into seven classes (one-dimensional or linear, two-dimensional, three-dimensional, temporal, multidimensional, trees, networks). By their nature (Mazza 2009) classified the data into 3 main categories (quantitative, ordinal and categorical) and proposed a graphical elements typology. A business view also involves interaction techniques. These techniques are characterized by their type, their mode and their interactivity level. Following Keim (2002) there are 5 types of interaction: dynamic projection, interactive filtering (browsing and querying), interactive zoom, interactive deformation and “Link&Brush” (Keim
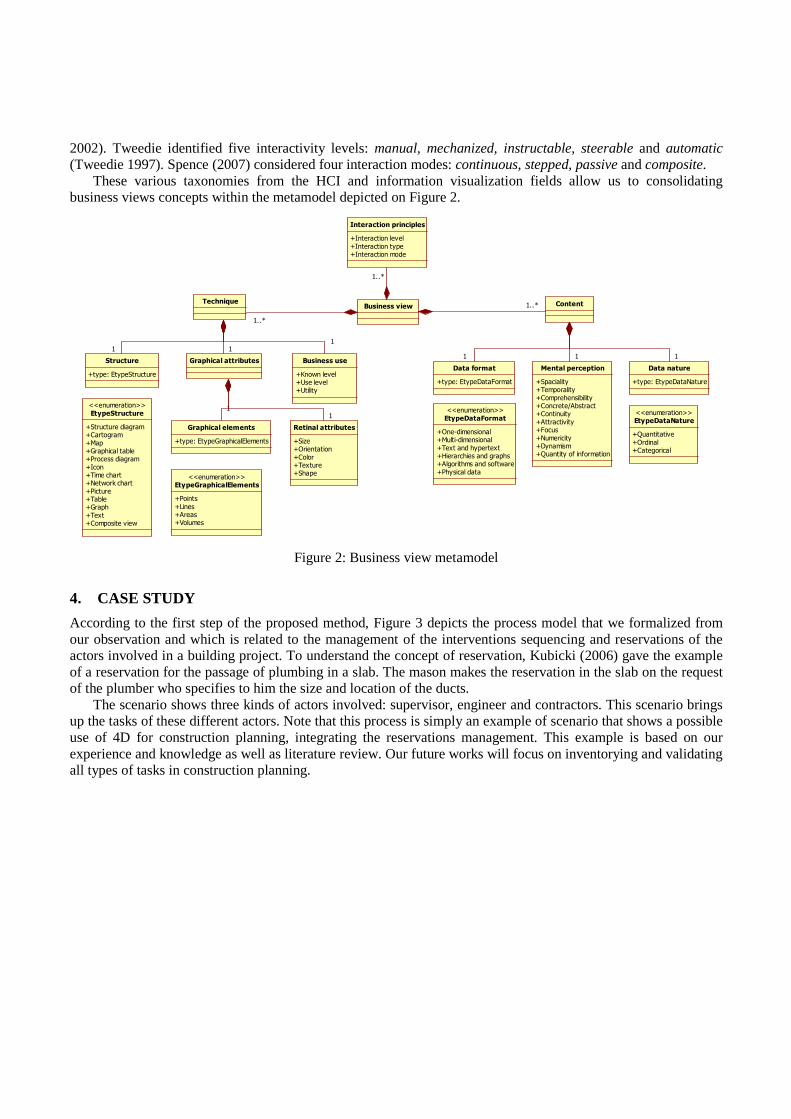
2002). Tweedie identified five interactivity levels: manual, mechanized, instructable, steerable and automatic (Tweedie 1997). Spence (2007) considered four interaction modes: continuous, stepped, passive and composite. These various taxonomies from the HCI and information visualization fields allow us to consolidating business views concepts within the metamodel depicted on Figure 2.
Business view
Interaction principles
+Interaction level+Interaction type+Interaction mode
Technique Content
Structure
+type: EtypeStructure
Graphical attributes Business use
+Known level+Use level+Utility
EtypeStructure<<enumeration>>
+Structure diagram+Cartogram+Map+Graphical table+Process diagram+Icon+Time chart+Network chart+Picture+Table+Graph+Text+Composite view
Graphical elements
+type: EtypeGraphicalElements
EtypeGraphicalElements<<enumeration>>
+Points+Lines+Areas+Volumes
Retinal attributes
+Size+Orientation+Color+Texture+Shape
Data format
+type: EtypeDataFormat
Mental perception
+Spaciality+Temporality+Comprehensibility+Concrete/Abstract+Continuity+Attractivity+Focus+Numericity+Dynamism+Quantity of information
EtypeDataFormat<<enumeration>>
+One-dimensional+Multi-dimensional+Text and hypertext+Hierarchies and graphs+Algorithms and software+Physical data
Data nature
+type: EtypeDataNature
EtypeDataNature<<enumeration>>
+Quantitative+Ordinal+Categorical
1..*
11 1
1..*
111
1..*
11
Figure 2: Business view metamodel
4. CASE STUDY
According to the first step of the proposed method, Figure 3 depicts the process model that we formalized from our observation and which is related to the management of the interventions sequencing and reservations of the actors involved in a building project. To understand the concept of reservation, Kubicki (2006) gave the example of a reservation for the passage of plumbing in a slab. The mason makes the reservation in the slab on the request of the plumber who specifies to him the size and location of the ducts. The scenario shows three kinds of actors involved: supervisor, engineer and contractors. This scenario brings up the tasks of these different actors. Note that this process is simply an example of scenario that shows a possible use of 4D for construction planning, integrating the reservations management. This example is based on our experience and knowledge as well as literature review. Our future works will focus on inventorying and validating all types of tasks in construction planning.
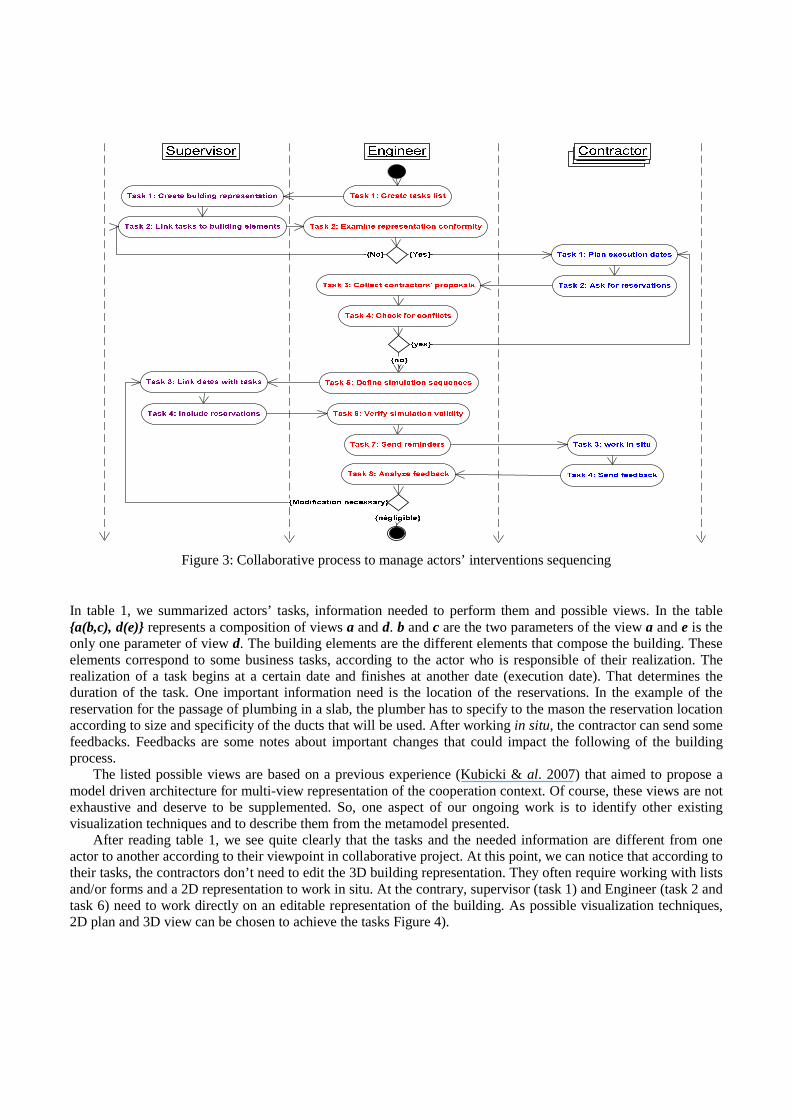
Figure 3: Collaborative process to manage actors’ interventions sequencing
In table 1, we summarized actors’ tasks, information needed to perform them and possible views. In the table {a(b,c), d(e)} represents a composition of views a and d. b and c are the two parameters of the view a and e is the only one parameter of view d. The building elements are the different elements that compose the building. These elements correspond to some business tasks, according to the actor who is responsible of their realization. The realization of a task begins at a certain date and finishes at another date (execution date). That determines the duration of the task. One important information need is the location of the reservations. In the example of the reservation for the passage of plumbing in a slab, the plumber has to specify to the mason the reservation location according to size and specificity of the ducts that will be used. After working in situ, the contractor can send some feedbacks. Feedbacks are some notes about important changes that could impact the following of the building process. The listed possible views are based on a previous experience (Kubicki & al. 2007) that aimed to propose a model driven architecture for multi-view representation of the cooperation context. Of course, these views are not exhaustive and deserve to be supplemented. So, one aspect of our ongoing work is to identify other existing visualization techniques and to describe them from the metamodel presented. After reading table 1, we see quite clearly that the tasks and the needed information are different from one actor to another according to their viewpoint in collaborative project. At this point, we can notice that according to their tasks, the contractors don’t need to edit the 3D building representation. They often require working with lists and/or forms and a 2D representation to work in situ. At the contrary, supervisor (task 1) and Engineer (task 2 and task 6) need to work directly on an editable representation of the building. As possible visualization techniques, 2D plan and 3D view can be chosen to achieve the tasks Figure 4).

Table 1: Tasks and needs of information for each actor
BUSINESS TASKS INFORMATION NEEDS POSSIBLE VIEWSTask 1: Create the building représentation
Building elements, Building representation
- {List view(building_element), 2D plan view},
- {List view(building_element), 3D model view}
Task 2: Link tasks to building elements
Tasks, building elements - {List view(building_element), List view(tasks)}
- {Table view(building_element, tasks)}
Task 3: Link dates with tasks Execution dates, duration, tasks
- {Table view(task, duration, date)}
- {List view(task), Table view(task, date, duration)}
- {List view(task), Pert view(task, earlier date, late date)}
- {Gantt view(task, beginind date, end date)}
Task 4: Include reservations Tasks, reservations locations
- {Table view(task, reservation location)}
- {(Table view(tasks, reservation), reservation sketch}
BUSINESS TASKS INFORMATION NEEDS POSSIBLE VIEWSTask 1: Create tasks list Tasks - {List view(task)}
Task 2: Examine the representation conformity
Tasks, building representation
- {List view(task), 2D plan view(building_element)},
- {List view(task), 3D model view(building_element)}
Task 3: Collect contractors' proposals
Dates, tasks, reservations - {Table view(task, date, reservation)}
- {Table view(task, date), Table view(task, reservation)}
- {List view(reservation), Gantt view(task, beginind_date, end_date)}
- {List view(reservation), Pert view(task, earlier_date, late_date)}
Task 4: Check for conflicts Tasks, durations, reservations
- {Table view(task, duration, reservation)}
- {Table view(task, duration), Table view (task, reservation)}
Task 5: Define simulation sequences
Dates, tasks, reservations - {Table view(task, date, reservation)}
- {Table view(task, date), Table view (task, reservation)}
- {List view(reservation), Gantt view(task, beginind_date, end_date)}
- {List view(reservation), Pert view(task, earlier_date, late_date)}
Task 6: Verify reservation validity
Building representation, reservations
- {List view(reservation), 2D plan view(building_element)},
- {List view(reservation), 3D model view(building_element)}
Task 7: Send reminders Dates - {List view(date)}
- {Calendar view(date, event)}
Task 8: Analyze feedbacks Feedbacks, Dates - {Table view(feedback, date)}
- {List view(feedback), Calendar view(date, event)}
- {Text view(feedback), Calendar view(date, event)}
BUSINESS TASKS INFORMATION NEEDS POSSIBLE VIEWSTask 1: Plan execution dates Dates, tasks - {Table view(task, date)}
- {List view(task), Calendar view(date, event)}
- {Form view(task, date), Calendar view(date, event)}
Task 2: Ask for reservation(s) Tasks, reservation request
- {Table view(task, reservation, location)}
- {Form view(task, reservation, location)}
Task 3: Work in situ Reservation locations - {Table view(reservation, location), 2D plan view(building_element)}
- {2D plan(building_element), reservation sketch(position, size)}
Task 4: Send feedback Feedback - {List view(feedback)}
- {Form view(feedback)}
SUPERVISOR
ENGINEER
CONTRACTOR
Using the taxonomy of visualization tasks proposed by (Valiati & al. 2006), we can, in instance, describe the visualization needs for the engineer’s task 6. So, in terms of visualization for this task, engineer will have to:
- Visualize the data (i.e. building representation) - Locate the position (i.e. of reservations) - Identify the dependencies (i.e. of tasks and reservations) - Compare the values (i.e. of simulation sequences with dates list) - Determine any variance (i.e. between simulation sequences and dates list) - Infer trends (i.e. validity or no)
We see that this business task requires some specific visualization tasks and a visualization technique that enables adapted interaction principles supporting them. In order to do it, we suggest modeling the two proposed techniques (2D plan and 3D views) in order to compare them.

Visualizing the building representation corresponds to a passive mode of interaction and don’t call at a particular interaction style. Both 2D plan view and 3D model view can enable to achieve it. To locate the position of reservations, engineer need to clearly see them among other kinds of information in the space. Thus, he needs a visualization technique that emphasis parts. To identify the dependencies of tasks and reservations, the engineer needs particular interactions that could be navigation or direct manipulations. Those kinds of interaction are possible with the 3D model view but not with the 2D plan view. Instances to describe the two proposed views are shown in table 2. Differences in attributes values are presented with red color. We can see that the 2D plan view is less adapted for those identified views tasks. For that reason, it is probably better in this case to choose the 3D view that appears more adapted. In a view design process, our hypothesis is that one can apply the same operation to the other tasks in order to identify the best visualization techniques and propose adapted business views composition for each actor.
2D view
3D view
Figure 4: Two possible views to support engineer task 6
Table 2: instances for modeling and comparison of 3D view and 2D plan view
3D view 2D plan view
CONTENT Physical data Physical data
Spatiality Spatial Spatial
Temporality No Temporal No temporal
Comprehensibility Easy to understand Easy to understand
Concrete - Abstract Concrete Concrete
Continuity Discrete Discrete
Attractivity Attractive Unattractive
Focus Emphasizes parts Emphasizes whole
Numericity Non numeric Non numeric
Dynamism Static Static
Quantity of information A lot A little
Ordinal ordinal
TECHNIQUE Modelling map
Kwowledge level Quite known Very known
Use level Not quite used Quite used
POSSIBLE INTERACTIONSProjection dynamique,
Déformation, Zoom,… Zoom
Continuous, discret, composite passive
Attributs
Nature of data
Business view
Structure of the technique
Interaction mode
Data format
Mental model
Interaction styles

5. CONCLUSION
The use of 4D CAD in the AEC projects appears as being very helpful in resolving recurring problems in the sector such as the sequencing of the actors’ intervention and the reservations’ management. However, the existing visualization modes are not always sufficiently adapted to the needs of users. We proposed in this paper a first version of a “business view” metamodel, incorporating the key concepts found in the literature of HCI and Visualization fields. We suggested a method to adapted business views to the business tasks. In the case study, we showed that it is possible to propose different views to actors according to their tasks. With our metamodel we can model several possible views for a given task and compare them. The interest is to be able to choose the most appropriated according to the visualization needs related to the task. In the future, we will work to define an experimental protocol, in order to consolidate, improve and validate the construction management process model according to a cooperative context. We will also work on the consolidation of the metamodel. Moreover, we have to describe better our three steps (business tasks, visualization needs and business views). In particular, it is important to deepen the second one (visualization needs) in order to create relationship with the two others. The corresponding model transformations should make our approach operational, and enable to develop a tool that could help to design business views.
ACKNOWLEDGMENT
This paper was supported by the AFR PhD Grants funded by the National Research Fund (FNR), Luxembourg.
REFERENCES
Chau, K. W., Anson, M., and Zhang, J. P. (2004). "Four-Dimensional Visualization of Construction Scheduling and Site Utilization." Journal of Construction Engineering and Management, ASCE, 130(4), 598-606.
Dawood, N., and Sikka, S. (2007). "Measuring the effectiveness of 4D planning as a valuable communication tool." Construction, 198-205.
Davidson C. (1993) "What your database hides away." New Scientist. Guerriero, A. (2009). "La représentation de la confiance dans l'activité collective. Application à la coordination de
l'activité de chantier de construction." Thèse de doctorat, (Institut National Polytechnique de Lorraine. Ecole doctorale IAEM Lorraine. Nancy-Université), 286.
Halin, G., and Kubicki, S. (2005). "Architecture dirigée par les modèles pour une représentation multi-vues du contexte de coopération." IHM 2005: Proceedings of the 17th international conference Francophone sur l'Interaction Homme-Machine, ACM, New York, NY, USA, 211-214.
Hanrot, S. (2003). "Enjeux pour l'ingénierie de maîtrise d'œuvre." Pratiques de projet et ingénieries, Ministère de l'Equipement Plan Urbanisme Construction Architecture, Paris.
Keim, D. A. (2002). "Information Visualization and Visual Data Mining." IEEE Transactions on Visualization and Computer Graphics, IEEE Educational Activities Department, Piscataway, NJ, USA, 8(1), 1-8.
Kubicki, S. (2006). "Assister la coordination flexible de l'activité de construction de bâtiments, Une approche par les modèles pour la proposition d'outils de visualisation du contexte de coopération." Thèse de doctorat, (Département de Formation Doctorale en Informatique - Université Henri Poincaré, Nancy-1), 384.
Kubicki, S., Bignon, J. C., Halin, G., and Humbert, P. (2006). "Assistance to building construction coordination – towards a multi-view cooperative platform." ITcon Vol. 11, 565-586.
Kubicki, S., Halin, G., and Guerriero, A. (2007). "Multi-visualization of the Cooperative Context in Building Construction Activity A Model-Based Approach to design AEC-specific Visualization Interfaces." 2007 11th International Conference Information Visualization (IV '07), Ieee, 590-595.
Kubicki, S., and Halin, G. (2010). "Usage-centered design of adaptable visualization services - Application to cooperation support services system in the AEC sector." First International Conference on Exploring Services Sciences- IESS, Lecture Notes in Business Information Processing n° 53, Geneva, Switzerland.
Lohse, G. L., Biolsi, K., Walker, N., and Rueter, H. H. (1994). "A classification of visual representations." Commun. ACM, ACM, New York, NY, USA, 37(12), 36-49.
Lu, M., Zhang, Y., and Zhang, J. (2007). "Construction planning methodology integrating operations simulation and four dimensional computer aided design (4D-CAD)." SCSC: Proceedings of the 2007 summer computer simulation conference, Society for Computer Simulation International, San Diego, CA, USA, 1193-1200.
Mahalingam, A., Kashyap, R., and Mahajan, C. (2010). "An evaluation of the applicability of 4D CAD on construction projects." Automation in Construction, 19(2), 148-159.
Mazza, R. (2009). Introduction to Information Visualization. Springer London, 139. Norman, B. D. (1994). "Things That Make Us Smart." SIGCHI Bulletin. Seok, K. L., Seong, K. H., Seok, M. H., and Hak, K. C. (2009). "Improvement of Link Process in 4D CAD
Viewer by Using Interface Board for Construction Project Management." ADVCOMP '09: Proceedings of the 2009 Third International Conference on Advanced Engineering Computing and Applications in Sciences, IEEE Computer Society, Washington, DC, USA, 83-88.
Shneiderman, B. (1996). "The Eyes Have It: A Task by Data Type Taxonomy for Information Visualizations." Proceedings IEEE Symposium on Visual Languages, IEEE Computer Society, Boulder, CO, USA, 336-343.
Spence, R. (2007). Information Visualization: Design for Interaction (2nd Edition). Prentice-Hall, Inc., Upper Saddle River, NJ, USA.
Sriprasert, E., and Dawood, N. (2003). "Multi-constraint information management and visualisation for collaborative planning and control in construction." Virtual Reality, 8(July), 341-366.
Staub-French, S., and Khanzode, A. (2007). "3D and 4D modeling for design and construction coordination: issues and lessons learned." ITcon, vol. 12, 381-407.
Tahon, C. (1997). "Le pilotage simultané d'un projet de construction." Plan Construction et Architecture. Collection Recherche n°87, Paris, 124.
Tweedie, L. (1997). "Characterizing interactive externalizations." Proceedings of the ACM Human Factors in Computing Systems Conference (CHI’), 97, 375-382.
Valiati, E. R., Pimenta, M. S., and Freitas, C. M. (2006). "A taxonomy of tasks for guiding the evaluation of multidimensional visualizations." BELIV '06: Proceedings of the 2006 AVI workshop on Beyond time and errors, ACM, New York, NY, USA, 1-6.
Zhou, W., Heesom, D., Georgakis, P., Nwagboso, C., and Feng, A. (2009). "An interactive approach to collaborative 4D construction planning." Journal of Information Technology, 14(March), 30-47.