cognitive function in a general population of men and women: a cross sectional study in the european...
TRANSCRIPT
Hayat et al. BMC Geriatrics 2014, 14:142http://www.biomedcentral.com/1471-2318/14/142
RESEARCH ARTICLE Open Access
Cognitive function in a general population ofmen and women: a cross sectional study in theEuropean Investigation of Cancer–Norfolk cohort(EPIC-Norfolk)Shabina A Hayat1*, Robert Luben1, Stephanie Moore1, Nichola Dalzell1, Amit Bhaniani1, Serena Anuj1,Fiona E Matthews2, Nick Wareham3, Kay-Tee Khaw1 and Carol Brayne1
Abstract
Background: Although ageing is strongly associated with cognitive decline, a wide range of cognitive ability isobserved in older populations with varying rates of change across different cognitive domains.
Methods: Cognitive function was measured as part of the third health examination of the European ProspectiveInvestigation of Cancer in Norfolk (EPIC-Norfolk 3) between 2006 and 2011 (including measures from the pilotphase from 2004 to 2006). This was done using a battery consisting of seven previously validated cognitive functiontests assessing both global function and specific domains. The battery included a shortened version of theExtended Mental State Exam (SF-EMSE); letter cancellation task; Hopkins Verbal Learning Test (HVLT); CambridgeNeuropsychological Test Automated Battery Paired Associates Learning Test (CANTAB-PAL); Visual Sensitivity Test(VST); Shortened version of the National Adult Reading Test (Short-NART) and a task to test for prospective memory.We report the distribution of cognitive function in different cognitive domains by age and sex and compare theutility of a number of assessment tests in a general population of older men and women.
Results: Cognitive test data were available for 8585 men and women taking part in EPIC-Norfolk 3. Increasing agewas generally associated with declining mean cognitive function, but there was a wide range observed within eachage group as well as variability across different cognitive domains. Some sex differences were also observed.
Conclusion: Descriptive data are presented for this general population sample of older men and women. There is awide range of cognitive performance seen in this population. Though average performance declines with age,there is large individual variability across different cognitive domains. These variations may provide insights into thedeterminants of cognitive function in later life.
Keywords: Ag(e)ing, Follow up studies, United Kingdom, Middle aged, Cognition, Cognition disorders
BackgroundAgeing is generally associated with memory impairmentand cognitive decline, however, this decline is not inevit-able [1] and not all domains of cognitive function areequally affected with age [2]. A broad range of cognitivecapability is observed in the older population [3] as wellas substantial inter-individual heterogeneity in rates of
* Correspondence: [email protected] of Public Health and Primary Care, Institute of Public Health,University of Cambridge School of Clinical Medicine, Cambridge, UKFull list of author information is available at the end of the article
© 2014 Hayat et al.; licensee BioMed Central. TCommons Attribution License (http://creativecreproduction in any medium, provided the orDedication waiver (http://creativecommons.orunless otherwise stated.
decline [4]. The range encompasses high cognitive func-tioning even in the very old [5], mild cognitive impair-ment (MCI), through to dementia at the other end ofthe spectrum.Mild Cognitive Impairment (MCI) is described as the
transitional state between normal cognitive ageing and de-mentia [6], with detectable impairment to memory or cog-nitive abilities when compared to healthy controls, but notto the extent as seen in individuals suffering with mild de-mentia [7]. The amnestic form of MCI has been shown tobe predictive of dementia [7-10], however, the conversion
his is an Open Access article distributed under the terms of the Creativeommons.org/licenses/by/4.0), which permits unrestricted use, distribution, andiginal work is properly credited. The Creative Commons Public Domaing/publicdomain/zero/1.0/) applies to the data made available in this article,

Hayat et al. BMC Geriatrics 2014, 14:142 Page 2 of 16http://www.biomedcentral.com/1471-2318/14/142
rate has been shown to vary significantly [7] and only aminority of individuals with MCI progress to dementiawithin clinically relevant time frames. As a result of theheterogeneity in both the aetiology and outcome of thiscondition, MCI is still an area of major debate, with noconsensus on its classification [11]. Reliable identificationof those individuals with MCI who remain stable com-pared to those who decline would maximise efficacy ofpotential treatments and preventive interventions aroundthis transitional stage [12]. To determine the factors thatcontribute to this variability in not just the rates of declinein MCI, but also in the different cognitive abilities, willhelp to improve the understanding of the natural progres-sion of decline in an ageing population.Substantial data already exist on dementia and cognitive
impairment, mainly in the older population, from using awide range of instruments, each with merits and limita-tions that assess different aspects or stages of cognition.Episodic memory deficits have been shown in a numberof studies to be associated with the strongest and mostpersistent risk of cognitive decline [13,14] and are themost common and earliest complaints in MCI [15]. How-ever deficits in other cognitive domains can also occur,some early on, including attention, executive functioning,prospective memory, semantic memory, verbal ability,visuospatial skills, attention and processing speed [16-19].There is a need for assessments to cover a broad range ofability and domains, and have an optimal balance betweensensitivity and specificity with high positive predictivevalue in the settings in which they will be applied.There are no cures for dementia, but there are some ad-
vances in the development of drugs [20] that are knownto improve symptoms, or temporarily slow down diseaseprogression in early and middle stages of the disease. Toexploit the potential benefits of any such treatment and tofacilitate decision making for future plans, it is importantto identify early indicators of decline. However, before weare able to advise guidelines and policies on health, weneed to gain better insight into the ageing process in thegeneral population and the range of functions in both do-main specific and global cognition.The primary aim of this study was to obtain data from
a general population of men and women without overtcognitive impairment using a comprehensive cognitivetest battery assessing a range of function includingmemory (retrospective and prospective), executive func-tion, attention, calculation, registration, language, praxis,abstract thinking, processing and new learning. The sec-ondary aim was to explore the comparability of the dif-ferent tests and their use in a community setting. Wefocused on producing a standardised protocol for testadministration and scoring, thus minimising variation,differences in interpretation and reducing subjectivity.Details of the standardisation methods are given here.
MethodsThe European Prospective Investigation of Cancer(EPIC) is a 10-country collaboration studying diet anddisease with half a million participants [21,22], of whichEPIC-Norfolk is one of the UK centres. Detailed descrip-tions of recruitment and study methods at baseline havebeen reported elsewhere [23]. Briefly, participants wererecruited at baseline through registers in thirty five gen-eral practices in Norfolk between 1993 and 1997. Gen-eral practice registers approximate population basedregisters as virtually all the population are registeredthrough the UK National Health Service. Participantswho consented at baseline were re-invited for a healthexamination at subsequent phases. The data presentedhere is from the third health examination (3HC orEPIC-Norfolk 3) conducted between 2006 and 2011 (in-cluding data from the pilot phase between 2004 and2006) [24]. The characteristics of the participants takingpart in EPIC-Norfolk 3 are given in Table 1. Attritionrates and characteristics of these returning participantshave been described previously where the cohort wasshown to represent a diverse population [24]. This studywas approved by the Norfolk Local Research Ethics Com-mittee (05/Q0101/191) and East Norfolk and WaveneyNHS Research Governance Committee (2005EC07L). Par-ticipants gave signed informed consent at both baselineand then subsequently at the 3HC to cover new measuresthat were not present in previous health examinations.The Cognition battery used in EPIC-Norfolk 3 (EPIC-
COG) comprised of a number of validated tests that have allbeen described previously. These included a shortenedversion of the Extended Mental State Exam [25] (SF-EMSE),letter cancellation task [26] as used in the Medical ResearchCouncil Cognitive Function and Ageing Study (MRC CFAS)[27], Hopkins Verbal Learning Test (HVLT) [28],Cambridge Neuropsychological Test Automated BatteryPaired Associates Learning Test (CANTAB-PAL) [29-31],Visual Sensitivity Test (VST) to assess visual impairmentdeficits contributing to cognitive impairment [32] Short Na-tional Adult Reading Test (Short-NART) [33] and a test forprospective memory (also as described in MRC CFAS) [34].These tests are briefly described here with further informationgiven in the Additional file 1. The tests were selected with theintention to cover an array of cognitive domains and a rangeof difficulty. Modifications were made to shorten some of thetests to allow for use in an epidemiological setting. The bat-tery was part of a broader health examination that lasted ap-proximately 2–3 hours depending on the participant.
Cognitive testsShort Form Extended Mental State Exam (SF-EMSE)The Extended Mental State Exam (EMSE) [25] extendsthe widely used Mini Mental State Exam (MMSE) [35], atest known for its limitations [36,37], in particular in

Table 1 Characteristics of the men and women in theEPIC-Norfolk 3 cohort
Characteristic Men(N = 3861)
Women(N = 4762)
Mean (SD)
Age 69.4 ( 8.1) 68.1 (8.0)
Mental activity score(from Questionnaire)
21.1 (4.7) 23.2 (4.7)
Frequency% (N)
Education level
Left school with no formal qualification 22.2 (857) 29.7 (1412)
Left school with at least O level orequivalent
77.8 (3003) 70.3 (3349)
Social class
I-III Non-manual 64.5 (2472) 67.2 (3165)
III Manual-V 35.5 (1362) 32.8 (1544)
Smoking status
Current 4.2 (159) 4.5 (213)
Former 57.8 (2198) 36.4 (1711)
Never 38.0 (1446) 59.1 (2774)
Physical activity
Inactive 37.4 (1422) 37.2 (1748)
Moderately-inactive 25.1 (954) 32.2 (1513)
Moderately-active 18.7 (713) 16.9 (796)
Active 18.8 (714) 13.6 (641)
Employment and social activity
Retired from main occupation 75.9 (2855) 78.8 (3562)
Active in social groups 59.5 (2264) 68.5 (3219)
SD = Standard Deviation, Frequency N = Number.
Hayat et al. BMC Geriatrics 2014, 14:142 Page 3 of 16http://www.biomedcentral.com/1471-2318/14/142
higher functioning individuals [25]. The original EMSEconsists of 47 items in total including items from theCambridge Mental Disorders of the Elderly Examination(CAMDEX) interview schedule [38] as well as items rec-ommended in the report from the MRC Alzheimer’sDisease Workshop in 1987 [39]. Here, we used a modi-fied shorter version consisting of 26 selected items asses-sing functioning at the higher end of the ability range.
Short Form Mini Mental State Exam (SF-MMSE)The SF-MMSE predicts the full-scale MMSE score by as-suming an almost perfect performance on the excludeditems in a highly functioning population [40]. The ‘fullderived’ MMSE score (SF-MMSE Score +14) was used inthe analysis here to allow the comparison of the other com-ponents of the battery using the SF-MMSE scores as a vali-dated and recognised standard.
Attention and visual search (Letter Cancellation)This task involved a visual search of a set of random let-ters with the aim of crossing out as many of the 72
possible target letters (P and W) within one minute. Theoutcome measure was ‘Accuracy Score’ (number of cor-rectly identified target letters minus all potential targetletters missed).
Hopkins Verbal Learning Test (HVLT)Participants were asked to memorise words presentedon a computer screen. At the end of the presentationparticipants were asked to recall the words. The list wasshown a further two times. Correctly recalled wordswere recorded and the combined score of all three trials(Total HVLT Score) was used as the outcome measure.
Cambridge Neuropsychological Test Automated BatteryPaired Associates Learning Test (CANTAB-PAL)The Paired Associates Learning Test (CANTAB-PAL),tests episodic memory and new learning and has shownto be a sensitive tool as a determinant of memory deficitin the early stages of dementia [30,31,41,42]. Six whiteboxes (and then eight at the final stage) were presentedon a touch screen, opening sequentially to display 1,2,3,6and then 8 abstract visual patterns. Immediately afterthe final test pattern was displayed, one of the patternswas displayed in the middle of the screen and the par-ticipant was required to touch the box where that pat-tern was located on the screen. The task consisted ofeight stages and up to ten presentations after which thetask terminated. The outcome measure used here wasthe ‘first trial memory score’ (FTMS), the number of pat-terns correctly associated to their locations in the firstattempt summed across the stages completed.
Visual sensitivity test (reaction time)This test consisted of two parts: Firstly, a triangle ap-peared randomly on the screen and the participant wasrequired to press the space bar on the computer as soonas the triangle was seen. In the second part, a triangleformed from a screen full of moving dots and again theparticipant had to press the space bar as soon as the tri-angle was seen. The outcome measure of reaction time(in milliseconds) was recorded and stored automaticallyunder the participant’s unique study number.
The National Adult Reading Test (NART)The National Adult Reading Test (NART) [43] shown tocorrelate with pre-morbid intelligence and general cog-nitive ability [44,45], is accepted in both clinical and re-search settings. It is known to have some limitations,particularly in the less educated [46]. The participantwas required to correctly pronounce the list of NARTwords presented on a computer screen. In this study, theshort NART protocol [33,47] was used. The outcomemeasure was ‘NART Error Score’, where a higher scoreindicates lower performance.

Hayat et al. BMC Geriatrics 2014, 14:142 Page 4 of 16http://www.biomedcentral.com/1471-2318/14/142
Prospective memoryThis is a test for the memory for future intentions, previ-ously suggested to be sensitive to early stages of cognitivedecline [34,48]. Participants were asked to remember tocarry out an explicit instruction at a specified point laterin the appointment. Participants were defined as being‘successful’ if they carried out at least one correct actionwithout having to be prompted.
CovariatesData on covariates were obtained from a self-administered questionnaire. Smoking status, mentalactivities, employment status and hobbies were ob-tained from responses from the health questionnairecompleted near the time of EPIC-Norfolk 3. The men-tal activity score was calculated by assigning 1 pointfor an individual who reported doing a particular ac-tivity once a year or less up to 5 points if they did theactivity every day. In total there were seven activities(listening to the radio, reading the newspaper, readingmagazines, reading books, playing games such as cards orchess, crosswords and puzzles). The minimum scorepossible was 7 and the maximum was 35. Those withmissing data were excluded from the analysis.Education level was obtained from baseline question-
naire and was coded into two categories: The first con-sisted of those leaving school with no formal qualification(less than O level or equivalent). The second categoryconsisted of those leaving school with at least some quali-fication. The qualification group combined those attainingO-level or equivalent (completing school to the age of 15),A-level or equivalent (completing schooling to the age of17 years) and those obtaining a degree or equivalent.
Missing data and extreme outliersIf a test was abandoned or the participant refused tocontinue, the participant was scored on what had beencompleted and the data included in the analysis. Reasonsfor refusal were recorded to differentiate those partici-pants who refused or failed to complete as a result of atechnical fault or ran out of time, from those who re-fused because they expressed anxiety or difficulty withthe task. Those who refused prior to starting a test orthose who said no to a test component were assigned asmissing data. Any participant identification number thatcould not be accurately assigned to a known individualwas also removed from the final analysis as were any im-plausible values described below.
StatisticsThe outcome measures of six of the test components werecontinuous. The prospective memory variable measurewas dichotomised into ‘successful’ and ‘unsuccessful’. Thedescriptive data (using the original untransformed scores
of the continuous variables) are presented as medians andinter-quartile ranges as the cognitive scores in EPIC-COGwere not normally distributed (although means and stand-ard deviations are also presented in the Additional files 2and 3: Table S1-S2). For the SF-EMSE Items, lettercancellation (Accuracy Score), HVLT, and CANTAB-PAL(FTMS), a higher score indicated better performance. Theoutcome measure for VST (reaction time) and for theNART (Short NART-Error Score), a higher score indicatedpoorer performance. Cross sectional data are presented byage and sex and by age, sex and MMSE Category. To givefurther details of the data, a graphical representation of thescores using a range of percentiles (1st, 10th, 25th, 50th,75th, 90th and 99th) by age group and sex are also pro-vided. Statistical analysis was performed using SPSS ver-sion 21.0 (IBM Corp., Armonk, NY, USA).
ResultsOf the 8623 participants attending EPIC-Norfolk 3, 45%(n = 3861) were men and 55% (n = 4762) were women.Cognitive data were collected on 8585 individuals, withover 90% completing or attempting six or all seven ofthe tests in the battery. The CANTAB-PAL and VSThad slightly lower completion rate (at 86.5% and 83% re-spectively), partly due to a technical computer failure,resulting in loss of data on 150 participants. Table 2summarises the cognitive domains covered by each ofthe tests used in this study and the number of partici-pants completing each test component.Men and women were equally likely to complete all
seven components, with 6011 (69.7%) participantsattempting all seven test components of EPIC-COGand only 850 participants (less than 10%) of those tak-ing part attempting or completing five components orfewer. Those completing all seven components wereslightly younger (mean age 68.8 compared to 70.9 yearsin men and 67.4 compared to 69.8 years in women),and were more likely to be either in paid employmentor actively taking part in regular social networks whencompared those who did not complete all the tests.More men had left school with qualifications thanwomen (77.8% compared to 70.3%), although morewomen participated in regular social activities (68.5%for women compared to 59.5% for men). Women alsoreported more mental stimulating activities in theirleisure time (with mean mental activity score of 23.2 inwomen as compared to 21.1 for men).Distributions for cognitive function (by each test com-
ponent and stratified by sex) are presented in Figure 1.The EMSE distribution had a negative skew but did nothave the same strong ceiling effect as the SF-MMSEscores in this cohort (distribution not shown), with 2298(27%) of participants scoring the maximum SF- MMSEscore of 29 as compared to only 2.4% (n = 200) scoring

Table 2 Summary of test components of the EPIC-COG battery and the number of participants who successfullyattempting all or part of each component
Cognitive test Cognitive domain Outcome measure*(Maximum possible test score)
Number of participantsattempted/completed
test component
Short form-extended mentalstate exam (SF-EMSE)
Global measure of cognition from MMSE to assesdomains for retrospective memory (immediate anddelayed), attention and calculation, registration, verbalregistration, language (object naming/sentence),visual and constructional skills, praxis. Added items forMemory (extension on retrospective memory), praxis,verbal fluency (animal naming), language (writing todictation) and abstract thinking.
SF-EMSE Score (37) 98% (8483)
Letter cancellation task Executive function - (covering visual search, attention,mental and processing speed)
Accurately identified target lettersin one minute (72)
97.5% (8410)
Hopkins verbal learningtest (HVLT)
Recognition/learning and episodic memory Total HVLT Score - Total ofcorrectly identified targetwords over 3 trials (36)
93.7% (8081)
CANTAB®-paired associatelearning (CANTAB-PAL)
Episodic memory and new learning/Visuospatial First Trial Memory Score (26) 86.5% (7281)
Visual sensitivity test (VST) Visuospatial (magnocellular pathway) Reaction Time in milliseconds 83% (7144)
National adult readingtest (NART)
Proxy Measure of IQ - Pre-morbid Intelligence Short NART Error Score - Using theshort-NART algorithm (50)
94.1% (8112)
Time and event based task Prospective memory Success vs Failure 97% (8403)
*Frequencies for only one outcome measure given in this summary table.
Hayat et al. BMC Geriatrics 2014, 14:142 Page 5 of 16http://www.biomedcentral.com/1471-2318/14/142
the maximum EMSE score of 37. The data for lettercancellation (PW Accuracy) and HVLT Total Score wereboth approximately normal distributed, as was the distri-bution for FTMS (other than a peak at score 0, whichsuggests that a high proportion of participants were un-able to achieve a correct response immediately). Thedata for reaction time of the VST were highly positivelyskewed (as a result of a few extreme, but genuine slowresponders).For the short NART, there was a peak at the error
score of 24, followed by alternating peaks and troughs indata giving a ‘comb’ distribution. This pattern in the dis-tribution is as a result of the short NART algorithm (asdescribed in the Additional file 1). The peaks in the dis-tribution can be attributed to those assigned an errorscore by the algorithm, artificially inflating the scores atthese points. The greatest peak (and the starting point ofthis comb effect of the data) was seen to occur at thecut-off point of score of 20 (giving a full NART error of24), which was the point where participants with thisscore or lower, did not continue with the second half ofthe test.The median scores of each of the test components
were plotted with age in men and women as shown inFigure 2a-2g. The data presented here are cross-sectional values showing the association of scores withage group. The graphical presentations in Figure 2 indi-cate that median scores decline with age. The proportionof participants successfully completing the prospectivememory task lowers with increased age group. In the case
of the VST (Figure 2f), the median reaction time increaseswith age group. The NART error score showed an in-crease with age initially, remains steady then a slight re-duction in the oldest group (Figure 2g). In almost all tests,women generally performed better than men.The data were further characterised by calculating per-
centile scores plotted by age group (Figure 3). In this fig-ure, lower scores are seen across increasing age group.Higher percentiles of cognitive scores remain reason-ably stable across age groups, but the spread and vari-ation in scores becoming greater across each age group,with the lowest percentile having markedly lower per-formance. The variation in scores was least for the SF-EMSE compared to the other tests in the battery. Forreaction time and short NART error score, the 99thpercentile indicated the poorest performers. The shortNART error score exhibited widest variation across ageand even some improvement in scores in the oldest agegroups.
Comparability of test components with the widelyaccepted MMSEThe measures from each test component were com-pared to the MMSE, which is widely used in both re-search and clinical settings. The accepted cut off scoreof less than or equal to 23 as indicating presence ofcognitive impairment has evolved from research find-ings [37] although higher cut-offs have been used[49,50]. In this high functioning cohort, there were veryfew individuals with a score of ≤23; therefore the cut

Figure 1 Distribution of scores (of continuous variables) in menand women in EPIC-Norfolk 3.
Hayat et al. BMC Geriatrics 2014, 14:142 Page 6 of 16http://www.biomedcentral.com/1471-2318/14/142
off used here for poorest performance was based on the10th percentile score of 24. We used our modified formof the MMSE (i.e. SF-MMSE) and created three cat-egories based on the distribution of SF-MMSE scores inthe study population. The first category was definedas ≤ 24), the third category was defined at the highestSF-MMSE scores (28 and 29) and the middle categorywas created using the remaining scores of 25–27.Tables 3 and 4 shows the distribution of all the tests in
EPIC-COG across the three SF-MMSE categories inmen and women respectively. The general trends for allthe test components were similar with the scores of thecontinuous test variables improving across SF-MMSEcategories. For the prospective memory test, the propor-tion of participants successfully completing the task alsoincreased across the three SF-MMSE categories. Again,scores in women were slightly higher than men. Therewas still a range of performance seen across all three SF-MMSE categories.The top performing 2298 participants who performed
perfectly on the SF-MMSE (achieving a maximum pos-sible score of 29), also included participants who wereamongst the poor performers (with scores in the bottom10th percentile) for the other components. These find-ings were still valid for the top 25% and for the top 10%of the SF-EMSE performers (Table 5), although thenumbers were increasingly lower than those seen withthe top SF-MMSE scores.Spearman’s rank correlation coefficients were calcu-
lated (Table 6) to investigate the strength of relation-ship between each of the tests used in EPIC-COG. Thecorrelations were moderate to weak for most tests withHVLT having stronger associations with the other tests,such as with SF-EMSE (r = 0.49) followed by FTMS(r = 0.38) and short NART (r = −0.38). This inverse as-sociation was as a result of the NART Error scale, withlarger number representing poor performance.To illustrate the relationship of the tests further, the
distribution of the scores were plotted as contour plots(Figure 4). The contours represent the strength of therelationship between the scores of the test components.The first plot in each row shows the outcome measurevariable of each individual test plotted against itselfdepicting the perfect positively linear association. Thepeak (white area) representing the region with greatestdensity of scores, centres at different points for eachtest pair combination. There seemed to be some un-defined spread for each test, however there was a sys-tematic pattern seen in all the plots, with some of thetest pairs showing a better relationship than others.The general direction of the plot and the peak of over-lap of scores seem to appear in areas where one wouldexpect, however with most of the plots what is seen atbest is a moderate relationship between these tests.

Figure 2 Cognition performance with age in men and women. 2a-2d are cognition test scores where higher scores indicating betterperformance and figures 2f and 2g are error scores where higher scores indicating poorer performance. Median values shown for the continuousvariables and for prospective memory (figures 2e) shown as percentage of the participants successfully completing task.
Hayat et al. BMC Geriatrics 2014, 14:142 Page 7 of 16http://www.biomedcentral.com/1471-2318/14/142
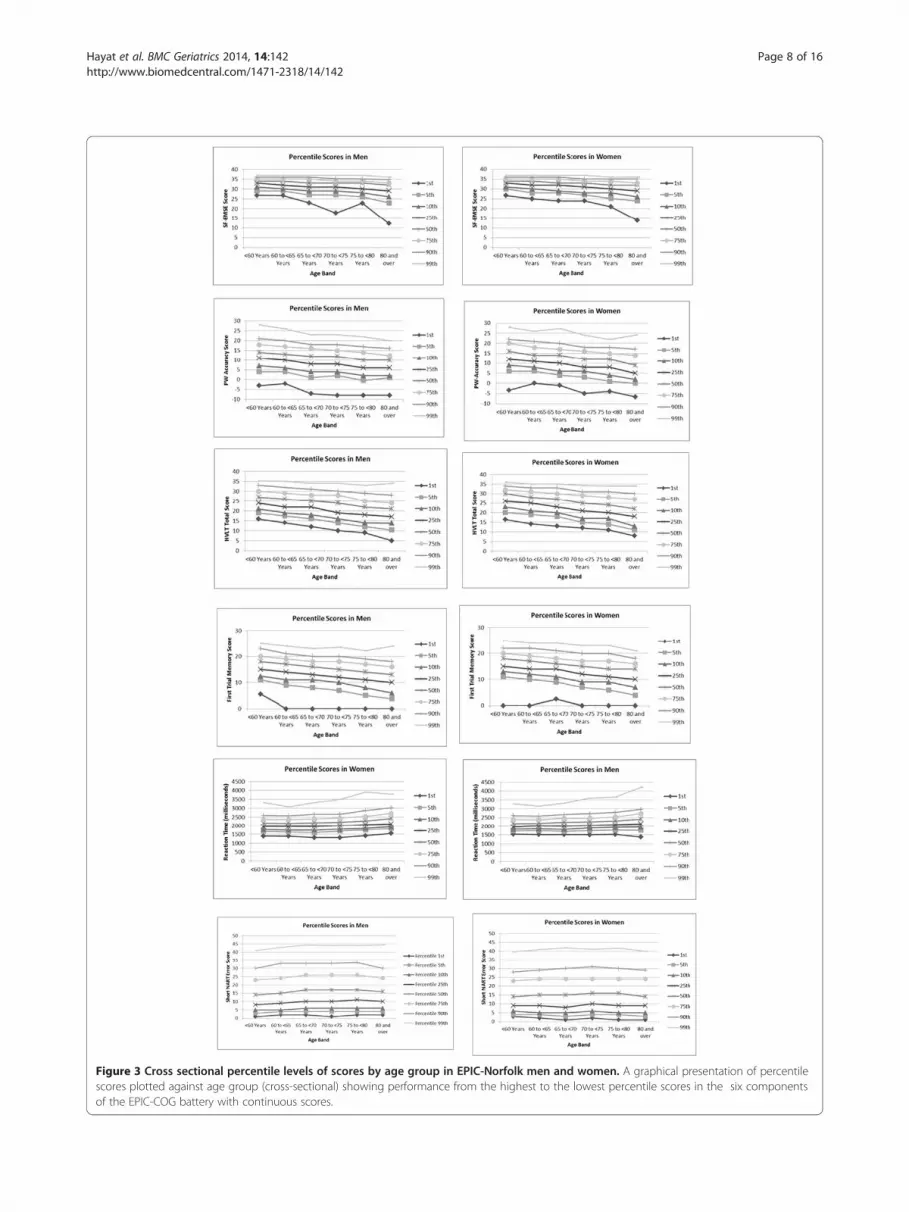
Figure 3 Cross sectional percentile levels of scores by age group in EPIC-Norfolk men and women. A graphical presentation of percentilescores plotted against age group (cross-sectional) showing performance from the highest to the lowest percentile scores in the six componentsof the EPIC-COG battery with continuous scores.
Hayat et al. BMC Geriatrics 2014, 14:142 Page 8 of 16http://www.biomedcentral.com/1471-2318/14/142

Hayat et al. BMC Geriatrics 2014, 14:142 Page 9 of 16http://www.biomedcentral.com/1471-2318/14/142
DiscussionIn this cross-sectional study, we report on cognitivefunction profiles across a range of domains using previ-ously validated instruments in a general population ofmen and women from mid to later life (age 48–92years). We focused mainly on age related differences incognition measures, and found that, despite the EPIC-COG being a relatively long battery, it was well toleratedby this general study population.Individuals can have impairment in one cognitive do-
main but perform well in another or a number of cogni-tive deficits can occur concurrently. There is increasingevidence of substantial variability in cognitive abilitieswithin individuals. Hilborn et al., (2009) termed thisvariability in performance across different tasks withinan individual as ‘dispersion’. It is important to gain abetter understanding of the dispersion displayed byhealthy individuals in order to allow accurate clinicaljudgment on unhealthy or abnormal dispersion [51].Previous studies have shown that a variety of cognitive
deficits are associated with preclinical stages of differenttypes of dementias and that decline can occur in a num-ber of cognitive domains, even before any of the clinicalcriteria of early stages of cognitive decline are met [52-54].Our findings are consistent with previous studies that haveshown variability and dispersion across different cognitivedomains [51,55] in older people. Further investigation isnecessary to confirm whether the differences observedacross the domains provide any meaningful indicators ofcognitive performance over time.The frequency distribution and data from the pilot
(where the full NART was used for 300 participants) in-dicate that the short NART equation does not hold sowell in this heterogeneous ageing population as it did inthe homogenous sample of elderly women living in arural setting that it was initially tested on. The aim ofthe short- NART was to lessen participant load and anx-iety, however in an assessment such as the one in thisstudy; participants were as likely to be anxious for any ofthe other components. The pilot data show that partici-pants who obtained a score of 20 (n = 82) for the firsthalf of NART obtained a mean score of 7.9 (SD = 3.7)for the second half, which is better than what the algo-rithm predicts. Therefore, we would recommend thatdespite the appeal of the short NART, this protocol isnot appropriate for a higher functioning populationwhere few individuals have poor reading skills. If thereare concerns about causing distress, then we would sug-gest lowering the cut-off to at least 17 rather than havingthe cut-off at 20.Prevalence of severe cognitive impairment is relatively
low in our cohort but as with previous studies [56,57],we also found age to be inversely associated with thecomplete range of cognitive function being tested with
the exception of NART, where there did not seem to beany strong association between the short NART scoreand age. This confirms previous findings that NART is agood measure of pre-morbidity [44,45] and that age haslittle or no effect on NART performance in the absenceof early dementia [58].We observed some differences in abilities across gen-
der and age categories. These may have arisen becauseof age and sex differences in education status. Althoughwe have not investigated education in detail here, thereis good heterogeneity of individuals leaving school withand without qualifications in all age groups analysed.We also observed a trend not noted in other studies, ofwomen performing better than men in all the test com-ponents across all age groups, even though more menthan women reported leaving school with some qualifi-cation suggesting that educational status would not ex-plain the sex differences seen in this cohort. However,women reported to be more socially active and to bedoing more mentally stimulating activities in their sparetime, which have been linked to better cognitive per-formance at older age. The effects of education, socialnetworks and mental activity will be the focus of furtherresearch.Although the test scores generally decline across age
groups with the widest variation seen in the oldest agegroup, there is still a range of capability from poor tohigh performance in each age band, with some partici-pants from the oldest age group outperforming theiryounger counterparts. Percentile scores from our cross-sectional data (Figure 3) show that the greatest declinein all test components is seen in poor performers acrossall the age groups. This graphical presentation can beused to compare scores or estimate age and sex adjustedscores across the different domains investigated here. In-dividuals scoring below the 25th percentile could beconsidered as cognitively impaired for that domain andrequire further investigation.The MMSE’s lack of ability to assess individual do-
mains and its poor sensitivity to mild cognitive impair-ments are frequently cited limitations [59,60] This isbecause most healthy individuals can successfully answermost of the test items. Even though more demandingtests are available [25,36,60,61], the MMSE still remainsthe most widely used and cited test of global cognition.To allow comparability with other studies, we includedthe SF-MMSE to provide a baseline for future studiesand as a means of comparing the psychometric qualitiesand utility of the other tests used in the battery. TheMMSE, being a global measure of cognition containsitems that test the same domains of memory function asthe other components of EPIC-COG. As expected, apositive trend was seen in all the tests with increasedSF-MMSE score category, however, a range of scores
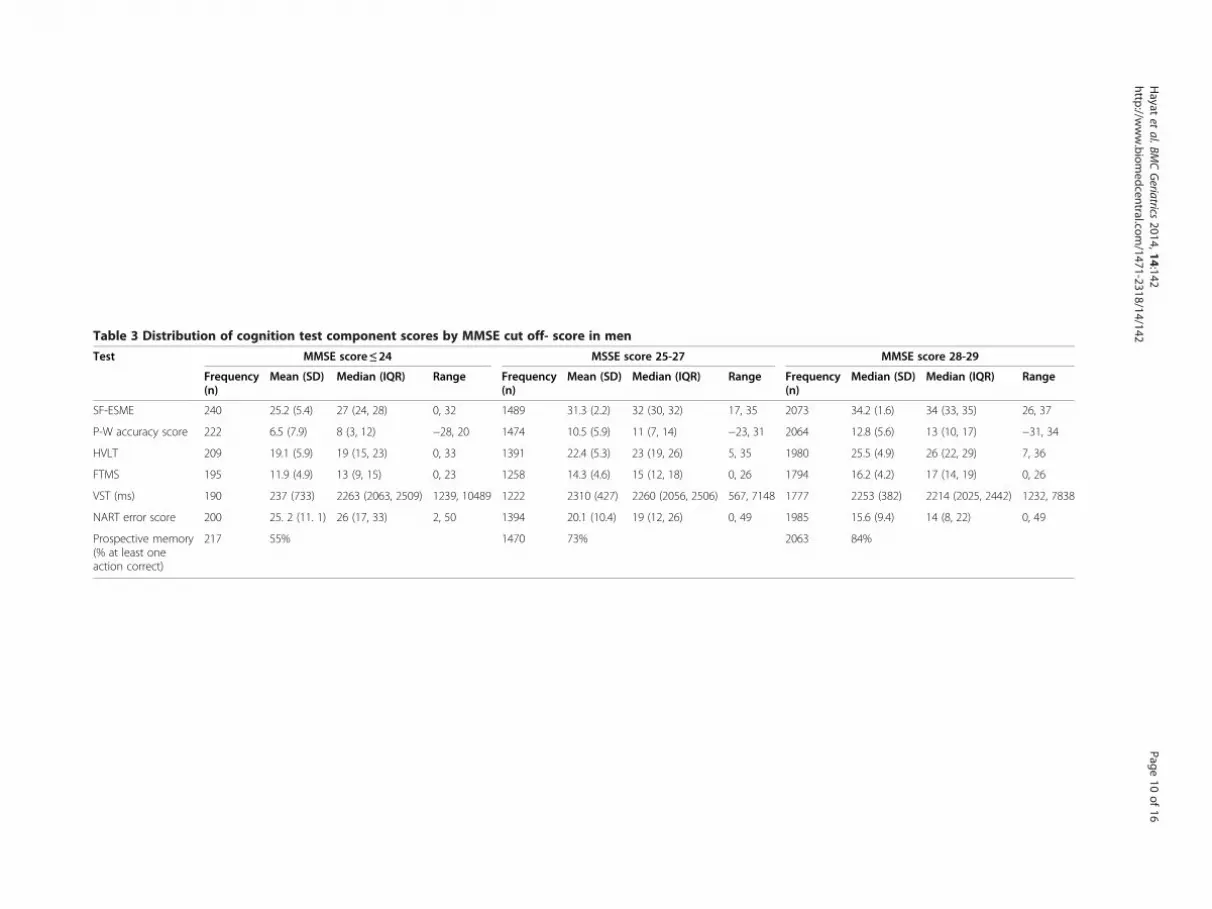
Table 3 Distribution of cognition test component scores by MMSE cut off- score in men
Test MMSE score ≤ 24 MSSE score 25-27 MMSE score 28-29
Frequency(n)
Mean (SD) Median (IQR) Range Frequency(n)
Mean (SD) Median (IQR) Range Frequency(n)
Median (SD) Median (IQR) Range
SF-ESME 240 25.2 (5.4) 27 (24, 28) 0, 32 1489 31.3 (2.2) 32 (30, 32) 17, 35 2073 34.2 (1.6) 34 (33, 35) 26, 37
P-W accuracy score 222 6.5 (7.9) 8 (3, 12) −28, 20 1474 10.5 (5.9) 11 (7, 14) −23, 31 2064 12.8 (5.6) 13 (10, 17) −31, 34
HVLT 209 19.1 (5.9) 19 (15, 23) 0, 33 1391 22.4 (5.3) 23 (19, 26) 5, 35 1980 25.5 (4.9) 26 (22, 29) 7, 36
FTMS 195 11.9 (4.9) 13 (9, 15) 0, 23 1258 14.3 (4.6) 15 (12, 18) 0, 26 1794 16.2 (4.2) 17 (14, 19) 0, 26
VST (ms) 190 237 (733) 2263 (2063, 2509) 1239, 10489 1222 2310 (427) 2260 (2056, 2506) 567, 7148 1777 2253 (382) 2214 (2025, 2442) 1232, 7838
NART error score 200 25. 2 (11. 1) 26 (17, 33) 2, 50 1394 20.1 (10.4) 19 (12, 26) 0, 49 1985 15.6 (9.4) 14 (8, 22) 0, 49
Prospective memory(% at least oneaction correct)
217 55% 1470 73% 2063 84%
Hayat
etal.BM
CGeriatrics
2014,14:142Page
10of
16http://w
ww.biom
edcentral.com/1471-2318/14/142

Table 4 Distribution of cognition test component scores by MMSE cut off- score in women
Test MMSE score ≤ 24 MSSE score 25-27 MMSE score 28-29
Frequency(n)
Mean (SD) Median (IQR) Range Frequency(n)
Mean (SD) Median (IQR) Range Frequency(n)
Median (SD) Median (IQR) Range
SF-ESME 390 26. 8 (3.8) 28 (26. 29) 4, 32 1718 31.5 (2.0) 32 (30, 33) 20, 35 2573 34.4 (1.5) 35 (34, 35) 24, 37
P-W accuracy score 375 9.3 (6.4) 10 (613) −16, 35 1710 12.3 (5.8) 12 (9, 16) −28, 32 2565 14.3 (5.8) 14 (11, 18) −26, 54
HVLT 352 21.1 (6.0) 22 (17, 25) 5, 36 1612 24.6 (5.3) 25 (21, 29) 0, 36 2467 27.9 (4.5) 29 (25, 31) 10, 36
FTMS 325 13.2 (4.5) 13 (11, 17) 0, 24 1433 14.8 (4.6) 15 (12, 18) 0, 26 2212 16. 6 (4.1) 17 (14, 19) 0, 26
VST (ms) 302 2393 (825) 2294 (2076, 2538) 459, 12869 1408 2259 (447) 2216 (2004, 2466) 1054, 7973 2167 2184 (374) 2156 (1965, 2374) 710, 8695
NART error score 358 24. 3 (10.4) 24 (16, 31) 2, 50 1616 18.6 (9.4) 18 (11, 26) 0, 47 2487 14.3 (8.4) 13 (8, 20) 0, 45
Prospective memory(% at least oneaction correct)
379 64% 1707 79% 2567 90%
Hayat
etal.BM
CGeriatrics
2014,14:142Page
11of
16http://w
ww.biom
edcentral.com/1471-2318/14/142

Table 5 Distribution of scores in participants with near perfect SF-MMSE and SF-EMSE scores
(A) Top MMSE score of 29 (B) Top 25% EMSE score (≥35) (C) Top 10% EMSE score (≥36)
Men Women Men Women Men Women
N* Frequency% (N)
N* Frequency% (N)
N* Frequency% (N)
N* Frequency% (N)
N* Frequency% (N)
N* Frequency% (N)
P-W accuracy score(10th percentile < = 5)
1006 8.2 (82) 1286 5.3 (68) 1034 5.5 (57) 1336 4.2 (56) 418 2.9 (12) 569 3.1 (18)
HVLT (10th percentile < =18) 962 6.7 (64) 1238 2.4 (30) 998 4.6 (46) 1285 1.1 (14) 404 1.5 (6) 568 0.5 (3)
FTMS (10th percentile < = 10) 870 6.2 (54) 1122 4.2 (47) 895 5.1 (46) 1149 3.6 (41) 360 5.3 (19) 514 2.5 (13)
VST (10th percentile > =2702 ms) 874 7.8 (68) 1100 5.4 (59) 904 7.1 (64) 1131 4.6 (52) 366 5.2 (19) 509 4.5 (23)
Short NART error score(10th percentile > =31)
964 5.9 (57) 1252 2.6 (33) 1006 4.0 (40) 1308 1.7 (22) 409 1.7 (7) 577 1.2 (7)
Participants achieving (A) Perfect MMSE Score of 29 (B) Top 25% SF-EMSE score and (C) Top 10% SF-EMSE score and scoring in the bottom 10th percentile of theother cognition tests.N*: Total Number of Participants with both test scores available.N: Number of participants in the bottom 10th percentile.
Hayat et al. BMC Geriatrics 2014, 14:142 Page 12 of 16http://www.biomedcentral.com/1471-2318/14/142
were seen for other tests in each of the SF-MMSEcategories.On further investigation of participants obtaining the
maximum score of 29 on the SF-MMSE, we found inthe range of 6-8% of men and 2-5% of women alsoscored in the bottom 10th percentile of the other tests(Table 5). On examining those individuals who obtainedthe top 25% and further in the top 10% SF-EMSE scores,there were still participants in poorest performers (10thpercentile) of the other tests, although the figures werereduced. Those scoring in the bottom 10th percentiletended to be older than those with scores above the 10thpercentile for all the tests apart from the Short NARTThe number of participants scoring the maximum pos-sible on the SF-EMSE was small (n = 200). None of theseindividuals scored in the bottom 10th percentile of theother tests other than one person who scored in the low-est 10th percentile for the NART. We show that obtaininga perfect score on the MMSE does not indicate absence ofimpairment and this confirms previous findings for theneed to supplement the MMSE in cognitive testing [37],particularly in a normal to high functioning population.The limited reliability and validity of the MMSE in a
general population has been attributed to the restrictedrange of MMSE. The EMSE has been shown to be sensi-tive across a range of performance, to avoid the ceiling
Table 6 Spearman’s correlation coefficient between the test c
SF-EMSE PW accuracy
PW-Accuracy 0.33
HVLT 0.49 0.33
FTMS 0.34 0.26
Prospective memory 0.26 0.19
VST −0.16 −0.17
NART −0.38 −0.21
effect and that (even in its short form as it has been usedhere), the EMSE provides extended coverage of cognitivedomains (extending on attention, memory, processingand executive function). This report confirms previousfindings that the EMSE has advantages over the MMSEparticularly for testing individuals at the high end of theperformance range [25].Spearman’s rank correlation (Table 6) show correla-
tions are moderate to weak for most tests with HVLThaving the strongest associations with other test compo-nents especially with FTMS and NART. This is not sur-prising, as HVLT, FTMS and NART assess similarcognitive sub domains of memory and language, how-ever the moderate degree of correlation is somewhatcounterintuitive as we would expect this to be higher.The contour plots (Figure 4) depict the spread of scores(and area of overlap) indicating that with some associ-ation, there is also some non-systematic scatter of scoressuggesting that these tests may be assessing different as-pects of cognitive function.We have also addressed some practical and methodo-
logical issues with regards to minimising variability andsubjectivity that can be introduced at any part of admin-istration, scoring or cleaning of the data. We have de-scribed methods of standardisation in an epidemiologicalsetting to ensure accuracy and consistency. Having these
omponents of the EPIC-COG battery
HVLT FTMS Prospective memory VST
0.38
0.23 0.21
−0.17 −0.17 −0.09
−0.34 −0.21 −0.13 0.06
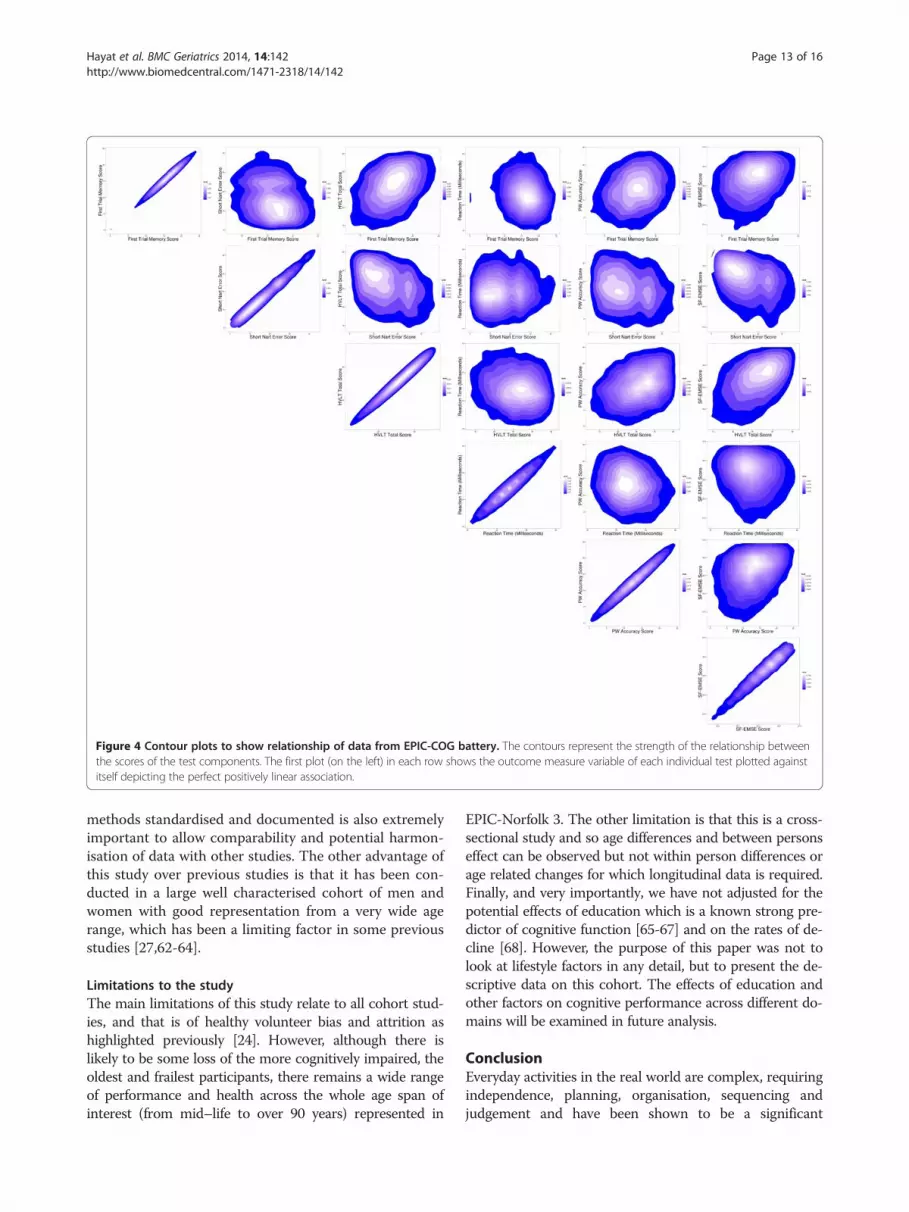
Figure 4 Contour plots to show relationship of data from EPIC-COG battery. The contours represent the strength of the relationship betweenthe scores of the test components. The first plot (on the left) in each row shows the outcome measure variable of each individual test plotted againstitself depicting the perfect positively linear association.
Hayat et al. BMC Geriatrics 2014, 14:142 Page 13 of 16http://www.biomedcentral.com/1471-2318/14/142
methods standardised and documented is also extremelyimportant to allow comparability and potential harmon-isation of data with other studies. The other advantage ofthis study over previous studies is that it has been con-ducted in a large well characterised cohort of men andwomen with good representation from a very wide agerange, which has been a limiting factor in some previousstudies [27,62-64].
Limitations to the studyThe main limitations of this study relate to all cohort stud-ies, and that is of healthy volunteer bias and attrition ashighlighted previously [24]. However, although there islikely to be some loss of the more cognitively impaired, theoldest and frailest participants, there remains a wide rangeof performance and health across the whole age span ofinterest (from mid–life to over 90 years) represented in
EPIC-Norfolk 3. The other limitation is that this is a cross-sectional study and so age differences and between personseffect can be observed but not within person differences orage related changes for which longitudinal data is required.Finally, and very importantly, we have not adjusted for thepotential effects of education which is a known strong pre-dictor of cognitive function [65-67] and on the rates of de-cline [68]. However, the purpose of this paper was not tolook at lifestyle factors in any detail, but to present the de-scriptive data on this cohort. The effects of education andother factors on cognitive performance across different do-mains will be examined in future analysis.
ConclusionEveryday activities in the real world are complex, requiringindependence, planning, organisation, sequencing andjudgement and have been shown to be a significant

Hayat et al. BMC Geriatrics 2014, 14:142 Page 14 of 16http://www.biomedcentral.com/1471-2318/14/142
predictor of functional status [69]. Therefore, assessingcognitive function in a range of domains such as executivefunctions, planning, flexibility, abstract thinking, semanticmemory as well as episodic memory is vital. Also of con-siderable importance is to accurately identify early declinein individuals or those with MCI who are known to be atincreased risk of dementia, particularly Alzheimer’s dis-ease (AD) compared to older people without any obviouscognitive impairment.Here we have used a comprehensive battery of accur-
ate and well tolerated tests to provide evidence of cogni-tive function in a number of cognitive domains that havepreviously been reported to be involved in much earlierstages of decline. We have described how, even thoughthere is reduction in performance across age, there isalso a great deal of heterogeneity in older individuals.Further work is needed to understand why cognitiveabilities vary so greatly across individuals and cognitivedomains and to investigate the more subtle changes incognition. We have also demonstrated that the EMSEeven in its short form provides a better description ofthe cognitive abilities in a general functioning populationand that the short NART protocol is not suitable for aheterogeneous higher functioning population. Finally,careful consideration should be given to the purposefor using a particular test (including whether the aimis to obtain global or domain specific measure, timeavailability and target population) when selecting an as-sessment tool for cognitive function.There is epidemiological evidence of associations be-
tween lifestyle factors (such as diet, smoking and exer-cise) and risk of dementia [70]. The EPIC-Norfolk studyhas over twenty years of lifestyle, biological and geneticinformation, collected from mid to late in life. This studyis well placed not only to identify factors associated withdecline but also factors associated with maintaining abil-ities in older age. With the data already collected andfurther follow up data, we can investigate patterns of be-haviours over time and predict how those behavioursaffect cognitive function.
Additional files
Additional file 1: Supplementary information. Cognitive function in ageneral population of men and women: A cross sectional study in theEuropean Investigation of Cancer and Nutrition–Norfolk cohort (EPIC-Norfolk).
Additional file 2: Table S1. Cognitive scores stratified by age in men inEPIC-Norfolk 3.
Additional file 3: Table S2. Cognitive scores stratified by age inwomen in EPIC-Norfolk 3.
Competing interestsThe authors declare that they have no competing interests.
Authors’ contributionsSAH drafted the manuscript and undertook statistical analysis with assistanceand guidance from FM. ND and SM conducted and coordinated the fieldwork.The co-authors AB, SA were part of the research team involved with studydesign, set up and made substantial contribution to the collection of the data.RL assisted with data analysis and provided graphics used in the manuscript.KTK, NW and CB are principal investigators who contributed to the conceptionand study design and guidance on the presentation and interpretation of thesedata. All authors contributed to data analysis and interpretation of the data, andall authors reviewed and approved the final manuscript.
AcknowledgementsWe are extremely grateful to EPIC-Norfolk participants and collaborating GPpractices in Norfolk, as without their contribution this study would not bepossible. We would also like to thank all staff in Norfolk and Cambridge fortheir dedication and hard work. We are very grateful to Cambridge Cognition(Cambridge, UK) for the free use of the CANTAB-PAL software. Unfortunately,due to rules of commercial intellectual property and confidentiality, we wereunable to obtain the algorithm to gain a full understanding of the outcomemeasures for this test. However we are indebted to Dr Andrew Blackwell for hisguidance and assistance. We thank Linda Barnes (MRC CFAS) for her assistancewith training staff and data cleaning and Marleen Lentjes, Yue Leng and VictoriaKeevil (University of Cambridge) for their invaluable assistance and support withthe writing of this manuscript. The infrastructure for this study was supportedby the Medical Research Council, UK (G0401527) and Cancer Research UK(CRUK, C864/A8257). The clinic for EPIC-Norfolk 3 was funded by Research intoAgeing (262). The pilot phase was supported by MRC (G9502233) and CRUK(C864/A2883).
Author details1Department of Public Health and Primary Care, Institute of Public Health,University of Cambridge School of Clinical Medicine, Cambridge, UK. 2MRCBiostatistics Unit, Institute of Public Health, Cambridge, UK. 3MRCEpidemiology Unit, University of Cambridge School of Clinical Medicine,Cambridge Biomedical Campus, Cambridge CB2 0QQ, UK.
Received: 13 August 2014 Accepted: 11 December 2014Published: 19 December 2014
References1. Rapp PR, Amaral DG: Individual differences in the cognitive and
neurobiological consequences of normal aging. TINS 1992,15(9):340–345.
2. Grady CL, Craik FI: Changes in memory processing with age. Curr OpinNeurobiol 2000, 10:224–231.
3. O’Connor DW: Memory complaints and impairment in 55 normaldepressed and demented elderly persons identified in a communitysurvey. Arch Gen Psychiatry 1990, 47:224–227.
4. Wilson RS, Beckett LA, Barnes LL, Schneider JA, Bach J, Evans DA, BennetDA: Individual differences in rates of change in cognitive abilities ofolder persons. Psychol Aging 2002, 17(2):179–193.
5. Berkman LF, Seeman TE, Albert M, Blazer D, Kahn R, Mohs R, Finch C,Schneider E, Cotman C, McClearn G, Nesselroade, Featherman D, GarmezyN, McKhann G, Brim G, Prager D, Rowe J: High, usual and impairedfunctioning in community-dwelling older men and women: findingsfrom the MacArthur Foundation Research Network on Successful Aging.J Clin Epidemiol 1993, 46(10):1129–1406.
6. De Jager CA, Hogervorst E, Combrinck M, Budge MM: Sensitivity andspecificity of neuropsychological tests for mild cognitive impairment,vascular cognitive impairment and Alzheimer’ s disease. Psychol Med2003, 33:1039–1050.
7. Peterson RC, Smith GE, Waring SC, Ivnik RJ, Tangalos EG, Kokmen E: MildCognitive Impairment. Clinical Characterizationand Outcome. Arch Neurol1999, 56:303–309.
8. Bennett DA, Wilson RS, Schneider JA, Evans DA, Beckett LA, Aggarawal NT,Barnes LL, Fox JH, Bach J: Natural history of mild cognitive impairment inolder persons. Neurology 2002, 59:198–205.
9. Tuokko H, Frerichs R, Graham J, Rockwood K, Kristjansson B, Fisk J, BergmanH, Kozma A, McDowell I: Five-year follow-up of Cognitive Impairmentwith No Dementia. Arch Neurol 2003, 60:577–582.

Hayat et al. BMC Geriatrics 2014, 14:142 Page 15 of 16http://www.biomedcentral.com/1471-2318/14/142
10. Bennet DA, Wilson RS, Schneider JA, Evans DA, Beckett LA, Aggarwal NT,Barnes LL, Fox JH, Bach J: Natural history of mild cognitive impairment inolder persons. Neurology 2002, 59:198–295.
11. Stephan SBC, Matthews FE, McKeith I, Bond J, Brayne C, the MRC CognitiveFunction and Ageing Study (MRC CFAS): Early cognitive change in thegeneral population: How do different definitions work? J Am Geriatr Soc2007, 55:1534–1549.
12. Nestor PJ, Scheltens P, Hodges JR: Advances in the early detection ofAlzheimer’s disease. Nat Rev Neurosci 2004, 5:S34–S41. doi:10.1038/nml1433.
13. Aggarwal NT, Wilson RS, Beck TL, Bienias JL, Bennett DA: Mild cognitiveimpairment in different functional domains and incident Alzheimer’sdisease. J Neurol Neurosurg Psychiatry 2005, 76:1479–1484. doi:10.1136/jnnp.2004.053561.
14. De Jager CA, Schrijnemaekers ACMC, Honey TEM, Budge MM: Detection ofMCI in the clinic: evaluation of the sensitivity and specificity of acomputerised test battery, the Hopkins Verbal Learning Test and theMMSE. Age Ageing 2009, 38(4):455–460. doi:10.1093/ageing/afp068.
15. Petersen RC, Doody R, Kurz A, Mohs RC, Morris JC, Rabins PV, Ritchie K,Rossor M, Thal L, Winblad B: Current Concepts in Mild Cognitive Impairment.Arch Neurol 2001, 58:1985–1992.
16. Tucker-Drob EM: Global and domain-specific changes in cognitionthroughout adulthood. Dev Psychol 2011, 47(2):331–343.
17. Ylikoski R, Ylikoski A, Keskivaara P, Tilvis R, Sulkava R, Erkinjuntti T:Heterogeneity of cognitive profiles in aging: successful aging, normalaging, and individuals at risk for cognitive decline. Eur J Neurol 1999,6(6):645–652.
18. Perry RJ, Watson P, Hodges JR: The nature and staging of attentiondysfunction in early (minimal and mild) Alzheimer’s disease: relationshipto episodic and semantic memory impairment. Neuropsychologia 2000,38:252–271.
19. Bäckman L, Jones S, Berger AK, Laukka EJ, Small BJ: Multiple cognitivedeficits during the transition to Alzheimer’s disease. J Intern Med 2004,256:195–204.
20. Overshott R, Burns A: Treatment of dementia. J Neurol Neurosurg Psychiatry2005, 76:v53–v59. doi:10.1136/jnnp.2005.082537.
21. Riboli E, Kaaks R: The EPIC Project: rationale and study design. EuropeanProspective Investigation into Cancer and Nutrition. Int J Epidemiol 1997,26(Suppl 1):S6–S14.
22. Riboli E: Background and rationale of the European ProspectiveInvestigation into Cancer and Nutrition (EPIC). Ann Oncol 1992, 3:783–791.
23. Day N, Oakes S, Luben R, Khaw KT, Bingham S, Wareham N: Study designand characteristics of the cohort. EPIC-Norfolk: European ProspectiveInvestigation of Cancer. Br J Cancer 1999, 80(Suppl 1):95–103.
24. Hayat SA, Luben R, Keevil VL, Moore S, Dalzell N, Bhaniani A, Khawaja AP,Foster P, Brayne C, Wareham NJ, Khaw KT: Cohort Profile: A prospectivecohort study of objective physical and cognitive capability and visualhealth in an ageing population of men and women in Norfolk(EPIC-Norfolk 3). Int J Epidemiol 2013:1–10. doi:10.1093/ije/dyt086.
25. Huppert FA, Cabelli ST, Matthews FE, the MRC Cognitive Function andAgeing Study (MRC CFAS): Brief cognitive assessment in a UK populationsample – distributional properties and the relationship between theMMSE and an extended mental state examination. BMC Geriatr 2005,5:7. doi:10.1186/1471-2318-5-7.
26. Richards M, Kuh D, Hardy R, Wadsworth M: Lifetime cognitive function andtiming of the natural menopause. Neurology 1999, 53(2):308–314.
27. MRC CFAS: Cognitive function and dementia in six areas of England andWales: The distribution of MMSE and GMS organicity level in the MRCCFA Study. The Medical Research Council Cognitive Function andAgeing Study (MRC CFAS). Psychol Med 1998, 28:319–335.
28. Brandt J: The Hopkins Verbal Learning Test: Development of a newmemory test with six equivalent forms. Clin Neuropsychol 1991, 5:125–142.
29. Sahakian B, Morris R, Evenden J, Heald A, Levy R, Philpot M, Robbins T:A comparative study of visuospatial memory and learning in Alzheimer-type dementia and Parkinson’s disease. Brain 1988, 111:695–718.
30. Fowler KS, Saling MM, Conway EL, Semple JM, Louis WJ: Paired AssociatesPerformance in the early detection of DAT. J Int Neuropsychol Soc 2002, 8(1):58–71.
31. Fowler KS, Saling MM, Conway EL, Semple JM, Louis WJ: Computerizedneuropsychological tests in the early detection of dementia. J IntNeuropsychol Soc 2002, 3:139–146.
32. Kirby E, Bandelow S, Hogervorst E: Visual impairment in Alzheimer’sDisease. J Alzheimers Dis 2010, 21:15–34.
33. Beardsall L, Brayne C: Estimation of verbal intelligence in an elderlycommunity: A prediction analysis using a shortened NART. Br J ClinPsychol 1990, 29:83–90.
34. Huppert FA, Johnson AL, Nickson J, MRC CFAS: High prevalence ofProspective Memory Impairment in the Elderly and in Early-stageDementia: Findings from a Population-based Study. Appl CognitPsychol 2000, 14:S63–S81.
35. Folstein MF, Folstein SE, McHugh PR: “Mini-mental state”. A practicalmethod for the cognitive state of patients for the clinician. J Psychiatr Res1975, 12:189–198.
36. Teng EL, Chui HC: The Modified Mini-Mental State (3MS) examination.J Clin Psychiatry 1987, 48:314–318.
37. Tombaugh TN, McIntyre NJ: The mini-mental state examination:a comprehensive review. J Am Geriatr Soc 1992, 40:922–935.
38. Roth M, Tym E, Mountjoy CQ, Huppert FA, Hendrie H, Verma S, Goddard R:CAMDEX. A standardised instrument for the diagnosis of mentaldisorder in the elderly with special reference to the early detection ofdementia. Br J Psychiatry 1986, 149:698–709.
39. Medical Research Council: Report form the MRC Alzheimer's Disease Workshop.Medical Research Council; 1987.
40. Matthews FE, Stephan BCM, Khaw KT, Hayat S, Luben R, Bhaniani A,Moore S, Brayne C: Full-scale scores of the Mini Mental StateExamination can be generated from an abbreviated version. J ClinEpidemiol 2011, 64(9):1005–1013.
41. Swainson R, Hodges JR, Galton CJ, Semple J, Michael A, Dunn BD, Iddon JL,Robbins TW, Sahakian BJ: Early detection and differential diagnosis ofAlzheimer’s disease and depression with neuropsychological tasks.Dement Geriatr Cogn Disord 2001, 12:265–280.
42. Blackwell AD, Sahakian BJ, Vesey R, Semple J, Robbins TW, Hodges JR:Detecting Dementia. Novel neuropsychological markers of pre-clinicalAlzheimer’s Disease. Dement Geriatr Cogn Disord 2004, 17:42–48.
43. Nelson HR: National Adult Reading Test (NART): Test Manual. Windsor:NFER-Nelson; 1982.
44. Crawford JR, Parker DM, Stewart LE, Besson JA, De Lacy G: Prediction ofWAIS IQ with the National Adult Reading Test. Br J Clin Psychol 1989,28:267–273.
45. Crawford JR, Deary IJ, Starr J, Whalley LJ: The NART as an index of priorintellectual functioning: a retrospective validity study covering a 66-yearinterval. Psychol Med 2001, 31:451–458.
46. Brayne C, Beardsall L: Estimation of verbal intelligence in an elderlycommunity: An epidemiological study using NART. Br J Clin Psychol 1990,29:21–223.
47. Crawford JR, Parker DM, Allan KM, Jack AM, Morrison FM: The Short NART:Cross-validation, relationship to IQ and some practical considerations.Br J Clin Psychol 1991, 30:223–229.
48. Huppert FA, Beardsall L: Prospective memory impairment as an earlyindicator of dementia. J Clin Exp Neuropsychol 1993, 15:805–821.
49. Ismail Z, Rajji TK, Shulman KI: Brief cognitive screening instruments:An Update. Int J Geriatr Psychiatry 2010, 25(2):111–120.
50. Lacy M, Kaemmerer T, Czipri S: Standardized Mini-Mental State ExaminationScores and Verbal Memory Performance at a Memory Center: Implicationsfor Cognitive Screening. Am J Alzheimers Dis Other Demen 2014, 1-8doi:10.1177/1533317514539378
51. Hilborn JV, Strauss E, Hultsch DF, Hunter MA: Intra-individual variabilityacross cognitive domains: Investigation of dispersion levels andperformance profiles in older adults. J Clin Exp Neuropsychol 2009,31(4):412–424.
52. Cullum S, Huppert FA McGee M, Dening T, Ahmed A, Paykel ES, Brayne C:Decline Across Different Domains of Cognitive Function in NormalAgeing. Results of a Longitudinal Population Based Study usingCAMCOG. Int J Geriatr Psychiatr 2000, 15(9):853–862.
53. Colie A, Maruff P, Shafiq-Antonacci R, Smith M, Hallup M, Schofield PR, MastersCL, Currie J: Memory decline in healthy older people. Implications foridentifying mild cognitive impairment. Neurology 2001, 56:1533–1538.
54. Weaver Cargin J, Maruff P, Collie A, Masters C: Mild memory impairment inhealthy older adults is distinct from normal aging. Brain Cogn 2006,60:146–155.
55. Christensen H, Mackinnon AJ, Korten AE, Jorm AF, Henderson AS, Jacomb P,Rodgers B: An Analysis of Diversity in the Cognitive Performance ofElderly Community Dwellers: Individual Differences in Change Scores asa Function of Age. Psychol Aging 1999, 14(3):365–379.

Hayat et al. BMC Geriatrics 2014, 14:142 Page 16 of 16http://www.biomedcentral.com/1471-2318/14/142
56. White L, Katzman R, Losonczy K, Salive M, Wallace R, Berkman L, Taylor J,Fillenbaum G, Havlik R: Association of Education with incidence of CognitiveImpairment in Three Established Populations for Epidemiological Studies ofthe Elderly. J Clin Epidemiol 1994, 47:363–374.
57. Brayne C, Gill C, Paykel ES, Huppert F, O'Connor DW: Cognitive Decline inan Elderly Population - A Two Wave Study of Change. Psychol Med 1995,25:673–683.
58. Crawford JR, Stewart LE, Garthwaite PE, Parker DM, Besson JAO: The relationshipbetween demographic variables and NART performance in normal subjects.Br J Clin Psychol 1988, 27:181–182.
59. Beatty WW, Goodkin DE: Screening for cognitive impairment in multiplesclerosis. An evaluation of the Mini-Mental State Examination. Arch Neurol1990, 47:297–301.
60. Tombaugh TN, McDowell I, Krisjansson B, Hubley AM: Mini-Mental StateExamination (MMSE) and the Modified MMSE (3MS): A psychometriccomparison and normative data. Psychol Assess 1996, 8:48–59.
61. Nasreddine ZS, Phillips NA, Bédirian V, Charbonneau S, Whitehead V, Collin I,Cummings JL, Chertkow H: The Montreal Cognitive Assessment, MoCA:a brief screening tool for mild cognitive impairment. J Am Geriatr Soc2005, 53:695–699.
62. Fleming J, Zhao E, O’Connor DW, Pollitt PA, Brayne C, the CC75C study:Cohort Profile: The Cambridge City over-75s Cohort (CC75C). Int JEpidemiol 2007, 36:40–46. doi:10.1093/ije/dyl293.
63. Caerphilly and Speedwell Collaborative group: Caerphilly and Speedwellcollaborative heart disease studies. J Epidemiol Community Health 1984,38:259–262.
64. Christensen H, Jorm AF, Henderson AS, Mackinnon AJ, Korten AE, Scott LR:Therelationship between health and cognitive functioning in an elderlycommunity sample. Age Ageing 1994, 23:204–212.
65. Jagger C, Matthews R, Melzer D, Matthews F, Brayne C, MRC CFAS:Educational differences in the dynamics of disability incidence, recoveryand mortality: Findings from the MRC Cognitive Function and AgeingStudy (MRC CFAS). Int J Epidemiol 2007, 36:358–365. doi:10.1093/ije/dyl307.
66. O'Connor DW, Pollitt PA, Treasure FP, Brook CPB, Reiss BB: The influence ofeducation, social class and sex on Mini-Mental State scores. Psychol Med1989, 19:771–776.
67. Brayne C, Calloway P: The association of education and socioeconomicstatus with the Mini Mental State Examination and the clinical diagnosisof dementia in elderly people. Age Ageing 1990, 19:91–96.
68. Scarmeas N, Albert SM, Manly JJ, Stern Y: Education and rates of cognitivedecline in incident Alzheimer’s disease. J Neurol Neurosurg Psychiatry 2006,77:308–316. doi:10.1136/jnnp.2005.072306.
69. Bell-McGinty S, Podell K, Franzen M, Baird A, Williams M: Standard measureof executive function in predicting instrumental activities of daily livingin older adults. Int J of Geriatr Psychiatry 2002, 17:828–834.
70. Barnett JH, Hachinski V, Blackwell AD: BMC Med 2013, 11:246. doi:10.1186/1741-7015-11-246.
doi:10.1186/1471-2318-14-142Cite this article as: Hayat et al.: Cognitive function in a generalpopulation of men and women: a cross sectional study in the EuropeanInvestigation of Cancer–Norfolk cohort (EPIC-Norfolk). BMC Geriatrics2014 14:142.
Submit your next manuscript to BioMed Centraland take full advantage of:
• Convenient online submission
• Thorough peer review
• No space constraints or color figure charges
• Immediate publication on acceptance
• Inclusion in PubMed, CAS, Scopus and Google Scholar
• Research which is freely available for redistribution
Submit your manuscript at www.biomedcentral.com/submit