cognitive effects of bilingualism: digging deeper for the contributions of language dominance,...
TRANSCRIPT
This article was downloaded by: [Florida International University]On: 21 October 2013, At: 09:11Publisher: RoutledgeInforma Ltd Registered in England and Wales Registered Number: 1072954 Registeredoffice: Mortimer House, 37-41 Mortimer Street, London W1T 3JH, UK
International Journal of BilingualEducation and BilingualismPublication details, including instructions for authors andsubscription information:http://www.tandfonline.com/loi/rbeb20
Cognitive effects of bilingualism:digging deeper for the contributionsof language dominance, linguisticknowledge, socio-economic status andcognitive abilitiesVirginia C. Mueller Gathercole a , Enlli Môn Thomas a , Leah Jonesa , Nestor Viñas Guasch a , Nia Young a & Emma K. Hughes aa School of Psychology and ESRC Centre for Research onBilingualism in Theory and Practice , Bangor University , Bangor,Gwynedd, UKPublished online: 16 Aug 2010.
To cite this article: Virginia C. Mueller Gathercole , Enlli Môn Thomas , Leah Jones , Nestor ViñasGuasch , Nia Young & Emma K. Hughes (2010) Cognitive effects of bilingualism: digging deeperfor the contributions of language dominance, linguistic knowledge, socio-economic status andcognitive abilities, International Journal of Bilingual Education and Bilingualism, 13:5, 617-664,DOI: 10.1080/13670050.2010.488289
To link to this article: http://dx.doi.org/10.1080/13670050.2010.488289
PLEASE SCROLL DOWN FOR ARTICLE
Taylor & Francis makes every effort to ensure the accuracy of all the information (the“Content”) contained in the publications on our platform. However, Taylor & Francis,our agents, and our licensors make no representations or warranties whatsoever as tothe accuracy, completeness, or suitability for any purpose of the Content. Any opinionsand views expressed in this publication are the opinions and views of the authors,and are not the views of or endorsed by Taylor & Francis. The accuracy of the Contentshould not be relied upon and should be independently verified with primary sourcesof information. Taylor and Francis shall not be liable for any losses, actions, claims,proceedings, demands, costs, expenses, damages, and other liabilities whatsoeveror howsoever caused arising directly or indirectly in connection with, in relation to orarising out of the use of the Content.

This article may be used for research, teaching, and private study purposes. Anysubstantial or systematic reproduction, redistribution, reselling, loan, sub-licensing,systematic supply, or distribution in any form to anyone is expressly forbidden. Terms &Conditions of access and use can be found at http://www.tandfonline.com/page/terms-and-conditions
Dow
nloa
ded
by [F
lorid
a In
tern
atio
nal U
nive
rsity
] at 0
9:11
21
Oct
ober
201
3
Cognitive effects of bilingualism: digging deeper for the contributionsof language dominance, linguistic knowledge, socio-economic statusand cognitive abilities
Virginia C. Mueller Gathercole*, Enlli Mon Thomas, Leah Jones,Nestor Vinas Guasch, Nia Young and Emma K. Hughes
School of Psychology and ESRC Centre for Research on Bilingualism in Theory and Practice,Bangor University, Bangor, Gwynedd, UK
(Received 15 February 2009; final version received 17 April 2010)
This study explores the extent to which a bilingual advantage can be observed forexecutive function tasks in children of varying levels of language dominance, andexamines the contributions of general cognitive knowledge, linguistic abilities,language use and socio-economic level to performance. Welsh!English bilingualand English monolingual primary school age and teenage children were tested ontwo executive function tasks, a tapping task and a Stroop task. Bilingual childrencame from homes in which only Welsh, Welsh and English, or only English wasspoken.Results differed by task. On the tapping task, bilingual children from only
Welsh homes showed overall superior performance, monolinguals inferior, withthe other two bilingual groups between them. Performance correlated with generalcognitive abilities with number and pattern discrimination, as well as, at the olderage, with balanced use of the two languages. On the Stroop task, language testedmattered; there were no differences across groups in Welsh, but complex patternsin English. The only strictly bilingual advantage on the Stroop was at the youngerage for children from Welsh and English homes when tested in English, andperformance was also influenced by SES level, cognitive abilities, vocabulary levelsand use of the two languages.
Keywords: executive function; language balance; language dominance; tapping;Stroop; Welsh bilinguals
Introduction: cognitive advantages of bilingualism
The question of bilinguals’ linguistic and cognitive abilities relative to those of theirmonolingual counterparts has been the subject of intense study and scrutiny over thelast century. Debates have examined children’s and adults’ capacities in a number oflinguistic and cognitive realms. Early studies had mixed results concerning whetherbilingualism was seen to have negative or positive effects on cognition, but manystudies were flawed in that they did not control, e.g. for socio-economic or culturaldifferences between the monolinguals and bilinguals studied (Cummins 1992;Genesee, Paradis, and Crago 2004; Hakuta 1986; Oller and Pearson 2002). Recently,more controlled studies have indicated a complex picture of the relationship between
*Corresponding author. Email: [email protected]
International Journal of Bilingual Education and BilingualismVol. 13, No. 5, September 2010, 617!664
ISSN 1367-0050 print/ISSN 1747-7522 online
# 2010 Taylor & Francis
DOI: 10.1080/13670050.2010.488289
http://www.informaworld.com
Dow
nloa
ded
by [F
lorid
a In
tern
atio
nal U
nive
rsity
] at 0
9:11
21
Oct
ober
201
3
bilinguals’ and monolinguals’ abilities. It is clear that in some ways, bilinguals’knowledge of certain aspects of their languages ! in particular in lexical,morphological and syntactic realms ! is affected by amount of exposure, so theirabilities may show initial delays relative to those of their monolingual cohorts (Ben-Zeev 1977; Gathercole 2002a, 2002b, 2002c, 2007a, 2007b; Gathercole and Hoff2007; Gathercole and Thomas 2009; Pearson and Fernandez 1994; Pearson,Fernandez, and Oller 1993, 1995; Thomas and Gathercole 2007; Umbel et al. 1992).
At the same time, bilinguals have been reported to show an advantage over theirmonolingual peers in the realms of metalinguistic abilities (Bialystok 1993) andcertain cognitive abilities, particularly related to executive function (Blair, Zelazo,and Greenberg 2005; Zelazo and Muller 2002), involving selective attention,inhibition of attention to misleading information, and switching attention in taskswith competing and misleading cues (Bialystok et al. 2004; Hernandez Pardo, Costa,and Sebastian-Galles 2008; Johnson 1991). In these tasks, a high degree of cognitivecontrol (Bialystok and Ryan 1985) must be maintained, whether to inhibit irrelevantcues or to ‘detach’ the verbal message from its reference (e.g. separate the linguisticform from its meaning). Successful completion entails ignoring conflicting orextraneous information. Bialystok (1993, 1999, 2001) argues that bilinguals havean advantage here because from the beginning of their use of two languages,bilinguals must constantly control which of their languages is being used at themoment, at the same time suppressing the use of their other language (see alsoCummins 1976; Green 1998; Hakuta 1986; Johnson 1991). This is purported to leadto more fully developed neurological mechanisms for controlling such attention,referred to as ‘executive function’, exactly the same abilities that enable proficientperformance in the types of non-linguistic tasks mentioned (Bialystok and Ryan1985; Blair, Zelazo, and Greenberg 2005; Zelazo and Muller 2002).
The advantage of bilinguals in executive control tasks is apparent in many non-verbal tasks involving perceptually misleading cues. Among these are the ‘dimen-sional change card sort task’ (Bialystok 1999; Frye, Zelazo, and Palfai 1995; Zelazo,Frye, and Rapus 1996). In this task, participants are shown two target cards, onerepresenting, e.g. a circle of one colour (blue) and the other, a square of anothercolour (red), and then several other cards also showing circles and squares but ofopposite colouring (red circles and blue squares). The child is asked first to sort theitems according to one dimension (e.g. colour). Bilingual and monolingual childrencan complete the task equally well. However, if the children are then asked to re-sortthe cards according to shape (circles, squares), the bilingual children respond moreaccurately and more quickly (Bialystok 1999). In another task, the towers task,children are shown two towers built from Legos of different sizes, with each LegoTM
representing a family living in the tower, and the child must say which tower holdsmore families. Again, bilingual children are more successful at this task thanmonolinguals are (Bialystok 2001). A third task used has been the Simon task(Bialystok et al. 2004; Martin and Bialystok 2003). Children are shown colouredstimuli on the left or right side of a computer, and they are asked to press a key ! oneon the left or one on the right ! according to the colour of the stimulus on thecomputer. ‘Incongruent’ trials, in which the stimulus and the correct key are onopposite sides of the computer, take more time (the ‘Simon effect’) than ‘congruent’trials, in which the stimulus and the key are on the same side. Bilingual 4-year-olds
618 V.C.M. Gathercole et al.D
ownl
oade
d by
[Flo
rida
Inte
rnat
iona
l Uni
vers
ity] a
t 09:
11 2
1 O
ctob
er 2
013
show less of a Simon effect than monolinguals, and indeed also an advantage in the‘congruent’ cases.
One other task that requires ignoring irrelevant cues is the Stroop (1935) task. Inone condition, individuals are shown a colour word (e.g. green) written in a font of acolour different from the colour named by the word (e.g. green written in a red font).The participant is asked to name the colour of the font, not read the word. Therefore,there is a conflict between the colour named by the colour word and the colour of thefont in which it is written. This task is harder than one in which an irrelevant word orsymbol (e.g. a number) is written in an ink colour that the subject has to identify.A number of studies have examined whether bilinguals outperform monolinguals. Ina recent study by Bialystok, Craik, and Luk (2008), for example, younger and olderadults were tested for performance on a number of tasks, including a Stroop task.Reaction time data showed a greater Stroop effect (i.e. a greater cost for incongruencebetween the word spelled by a colour name and the colour of the letters) amongmonolinguals than bilinguals, as well as a greater Stroop effect among older thanyounger adults. Reasoning that the greater the automaticity of reading, the larger theStroop effect should be, these authors considered that monolinguals may show agreater Stroop effect because of such greater automaticity. To examine this, theyisolated slower monolingual readers’ performance relative to the bilinguals’performance, and they still observed a greater Stroop effect among monolinguals.
Despite the many studies documenting the cognitive advantage in bilinguals,some recent research has begun to challenge the generality of the effect in bilinguals.Some work has questioned the source of the effect in these studies, some havereported the absence of a bilingual effect, and some have argued for better controlover the choice of bilingual participants. For example, Namazi and Thordardottir(2008) conducted a study of memory, controlled attention and sentence comprehen-sion in 5-year-old bilinguals and monolinguals. They chose bilingual children whohad been exposed to French and English from birth 40% to 60% of the time. Whilethey found a slight bilingual advantage on some tasks (but a monolingual one onsome others), they pointed out that the way in which ‘bilingualism’ is operationalisedvaries across studies, making it difficult to compare across studies.
Others have found a bilingualism effect in some tasks but not in others. Yang andLust (2004), for example, found no difference between monolingual and bilingualchildren’s performance on a dimensional change card sort task but an advantage ofbilinguals in an attentional network test, including a flanker task. They note thattheir monolinguals performed better on a vocabulary task, and so language abilitymay have contributed to the effects in the study. They argue that, among other things,their participants may have differed from those in previous studies in level oflinguistic proficiency, and that the influence of level of language proficiency onexecutive control is in need of closer investigation. Furthermore, their studycontrolled for the languages of their participants, whereas many studies on thebilingual advantage pool participants from a variety of linguistic backgrounds, withvarious first languages and a common second language (e.g. English). Variations inthe first language backgrounds could have an effect on performance. Indeed, inanother study, Yang and Lust (2007) reported that children learning Korean andChinese showed better performance on executive function tasks than those learningSpanish, regardless of linguality status (monolingual vs. bilingual).
International Journal of Bilingual Education and Bilingualism 619D
ownl
oade
d by
[Flo
rida
Inte
rnat
iona
l Uni
vers
ity] a
t 09:
11 2
1 O
ctob
er 2
013
Rosselli et al. (2002) also controlled for language background and examinedSpanish!English bilinguals’ and monolinguals’ performance on several Stroop tasks.They grouped bilinguals according to level of proficiency, and they found that ingeneral, bilinguals’ performance was on the whole equivalent to monolinguals’. Theone exception to this was that when asked to respond in English, bilinguals weregenerally slower than monolinguals, and Spanish-dominant bilinguals were slowerthan both English-dominant and balanced bilinguals. The colour naming effects,according to the authors, may be related to vocabulary size (see also Sumiya andHealy 2004). They also argued that their bilingual subjects may have been affected bythe fact that they were tested in both languages, while the monolinguals were tested inonly one language. There may thus have been improvement from learning effects forthe bilinguals, or, conversely, there may have been some switch costs for having toswitch from one language to the other.
Similarly, in Chen and Ho (1986), Chinese L1!English L2 speakers in Grade 2through college were asked to perform Stroop tasks in Chinese and English; in somecases the language of the stimulus was the same as the language of the response, andin some different. The general finding was that within-language responding createdgreater interference than between-language responding, except for the youngestchildren. For these children, responses in English took longer with Chinese stimulithan with English stimuli. Since the younger children were less proficient in English,these results suggest that proficiency plays a role in the presence of the Stroop effect:the greater the proficiency, the more likely the within-language interference.
Some (e.g. Morton and Harper 2007) have questioned whether socio-economiclevel might also contribute to results; this is because the monolingual and bilingualpopulations tested in some studies may have come from distinct socio-economicbackgrounds (e.g. monolinguals from the general local population, bilinguals fromL2 immigrants seeking higher education). Some have also reported that the effects ofbilingualism may be more pronounced at some SES levels than at other levels(Woodard and Rodman 2007). These results coincide with recent work reported byNeville (2009) indicating profound cognitive and neurological effects of SES level onattention in children.
Such studies are suggestive that the source of experimental effects in bilinguals vs.monolinguals is not always clear, and demonstrate the need for more well-controlledstudies. The contributions of degree of proficiency in the language, SES factors,general cognitive abilities, age and gender (and interactions between these) are stilllittle understood in relation to bilinguals’ and monolinguals’ performance. Even therole of language dominance in the bilingual’s performance is still unclear ! it is notknown to what extent various levels of relative language dominance might affect thecognitive benefits of bilingualism (Bialystok 1988). Bialystok et al. (2004) note that‘Research . . .has revealed that the cognitive and linguistic consequences of bilingu-alism are more salient for those bilinguals who are relatively balanced in theirproficiency . . .’ (292), and ‘we cannot be certain about the extension of our results tobilinguals with more limited bilingual experience’ (302). In many studies, binguals arechosen as ‘balanced’ on the basis of the fact that they have spoken both of theirlanguages on a daily basis throughout their lives. As noted by Hakuta (1987),bilinguals lie on continua of dominance. While it is quite often the case that relativelybalanced bilinguals (whose command of their two languages is about equal) are alsobilinguals who use both of their languages on a daily basis, it is not necessarily the
620 V.C.M. Gathercole et al.D
ownl
oade
d by
[Flo
rida
Inte
rnat
iona
l Uni
vers
ity] a
t 09:
11 2
1 O
ctob
er 2
013
case that these are one and the same thing (Grosjean 1994; Grosjean and Li 2003),and more fully balanced bilinguals are quite rare (Hakuta 1987). A bilingual mightuse both languages on a daily basis and yet have greater command of one of them,and, conversely, a relatively balanced bilingual may not use both languages on a dailybasis. Bilinguals, whether they use their two languages on a daily basis or not, are nota homogeneous group.
Ultimately, the extent to which each factor contributes to performance is not wellunderstood. The goal of the present study was to test performance on two executivefunction tasks, a tapping task and a Stroop task, by bilinguals and monolinguals forwhom a number of factors were controlled and tested. The data come from Welsh!English bilinguals living in North Wales. The participants thus come from ahomogeneous cultural context and span a wide range of socio-economic back-grounds.
In this study, we strictly divide the bilingual participants, first, according to thelanguages that their parents speak to them in the home ! only Welsh at home(OWH), Welsh and English (WEH), or only English (OEH). In our work onchildren’s acquisition of Welsh (Gathercole, Laporte, and Thomas 2005; Gathercoleand Thomas 2005; Gathercole, Thomas, and Laporte 2001; Thomas and Gathercole2005) and on bilingual language transmission in Welsh homes (Gathercole 2007a), wehave consistently divided bilingual participants into such three home languagegroups and have found consistent differences in the timing of acquisition or specificabilities in Welsh vs. English. The greater the exposure to Welsh, the earlier the childdevelops Welsh structures and vocabulary; the greater the exposure to English, theearlier the development of English forms; children who have equal exposure fallbetween these two groups (see Gathercole and Hoff 2007; Gathercole 2005). Homelanguage is therefore indicative of language dominance in an individual.
The determination of relative ‘dominance’ across those three home languagegroups is not unproblematic, however. Typically, at initial stages, OWH children canbe considered the most Welsh-dominant of the three types, OEH the most English-dominant, with WEH children in between. But with time, the differences across thegroups become less pronounced. Many children in North Wales begin schoolingprimarily in Welsh. State schooling (the equivalent of public school in the USA)typically begins at age 4, and many children attend preschools before that age. Thismeans that OEH children usually begin Welsh at least by age 4 when they beginprimary school, and OWH and WEH children continue hearing Welsh in school aswell. But many communities are relatively bilingual, so children are exposed to bothlanguages outside the home.
As noted, our research has shown that in vocabulary and morpho-syntax, timingof development corresponds to level of exposure. Differences across groups continuelargely in parallel for vocabulary, especially for Welsh, for which differences continuethrough adulthood (Gathercole and Thomas 2009). For morpho-syntax, however,differences across children begin gradually to become neutralised, so that during theschool years children gradually catch up with their peers who are more dominant inthe language, catching up on simpler structures earlier than more complex ones(Gathercole and Thomas 2009; Gathercole 2010). Differences in English becomenegligible by the teenage years; differences in Welsh are more long-lasting.
Given this, one might make distinct predictions about which group shows greaterlanguage ‘balance’ depending on the age. At the early ages, preschool and early to
International Journal of Bilingual Education and Bilingualism 621D
ownl
oade
d by
[Flo
rida
Inte
rnat
iona
l Uni
vers
ity] a
t 09:
11 2
1 O
ctob
er 2
013
mid primary school, one can predict that the WEH children should show the greatestbalance in their proficiency of Welsh and English. By the teen years, however, asdifferences across English become indistinguishable, but differences in Welsh are stillobservable, one might predict that the OWH children show the greatest balance inproficiency of Welsh and English.
In the study that follows, in addition to these groupings based on home language,we administered several other tasks and sought information on speakers’ usage of thetwo languages on a daily basis, in order to be able to make more fine-grainedanalyses of the conditions under which bilingualism promotes executive control. Theparticipants were tested for executive control measures in only one of their languages,whether they were monolingual or bilingual; participants were also tested forvocabulary and grammatical abilities in their language(s); participants were tested forcognitive performance on a non-executive function task; and extensive backgroundinformation was collected to enable classification of participants for use of the twolanguages.
General research method
Participants in two age groups (around 7!8 and 13!15 years of age) wereadministered a set of executive function tasks, including the tapping task and Strooptask to be reported here. The children were also administered vocabulary tests inEnglish and Welsh, tests of receptive grammatical knowledge in Welsh and English,and tests of general (non-executive function) cognitive abilities. For every participant,parents filled out an extensive background questionnaire that included informationon language use in the home and at school, parental language background andparental education and professions.
We predicted, first, that the overall findings would be consistent with findingsshowing that bilinguals’ performance on executive function tasks is superior to thatof monolingual peers. The results would further explore whether there are ‘outerboundaries’ to the bilingual advantage in relation to relative language dominance inthe bilingual and the extent to which factors other than bilingualism per se mightcontribute to performance.
We report first the results for both tasks according to home language effects, andthen we will explore correlations in performance with the other factors.
Tapping tasks
Method
Participants
Bilingual children were recruited through schools in North Wales, the bilinguals fromGwynedd, Denbigh, and Conwy counties, and the monolinguals from the Chesterarea, just across the Welsh border into England. Informed consent letters were sent toparents requesting permission to invite their child to participate in the project.Participants fell into two age categories and four major home language groups.Children were either primary school age (henceforward, ‘primary age’) (mean age8;1, range 6;4!8;11) or secondary school age (henceforward, ‘teens’ or ‘teenage’)(mean age 14;5, range 12;4!16;0). On the basis of the background questionnaires,
622 V.C.M. Gathercole et al.D
ownl
oade
d by
[Flo
rida
Inte
rnat
iona
l Uni
vers
ity] a
t 09:
11 2
1 O
ctob
er 2
013
children were classified, first, as either monolingual (N"42) or bilingual (N"151).The bilingual children were further classified as coming from homes in which onlyWelsh was spoken (OWH) (N"57), both Welsh and English were spoken (WEH)(N"47), or only English was spoken (OEH) (N"47). A child was classified as OWHif the parents reported at least 80% use of Welsh in the home in speech to the childfrom birth to the present time. Similarly, a child was classified as OEH if the parentsreported at least 80% use of English in the home in speech to the child from birth tothe present. And children were classified as WEH if the parents reported between40% and 60% use of both languages in the home in speech to the child from birth tothe present. (Any child whose home language background fell outside these rangeswas not included in the study.)
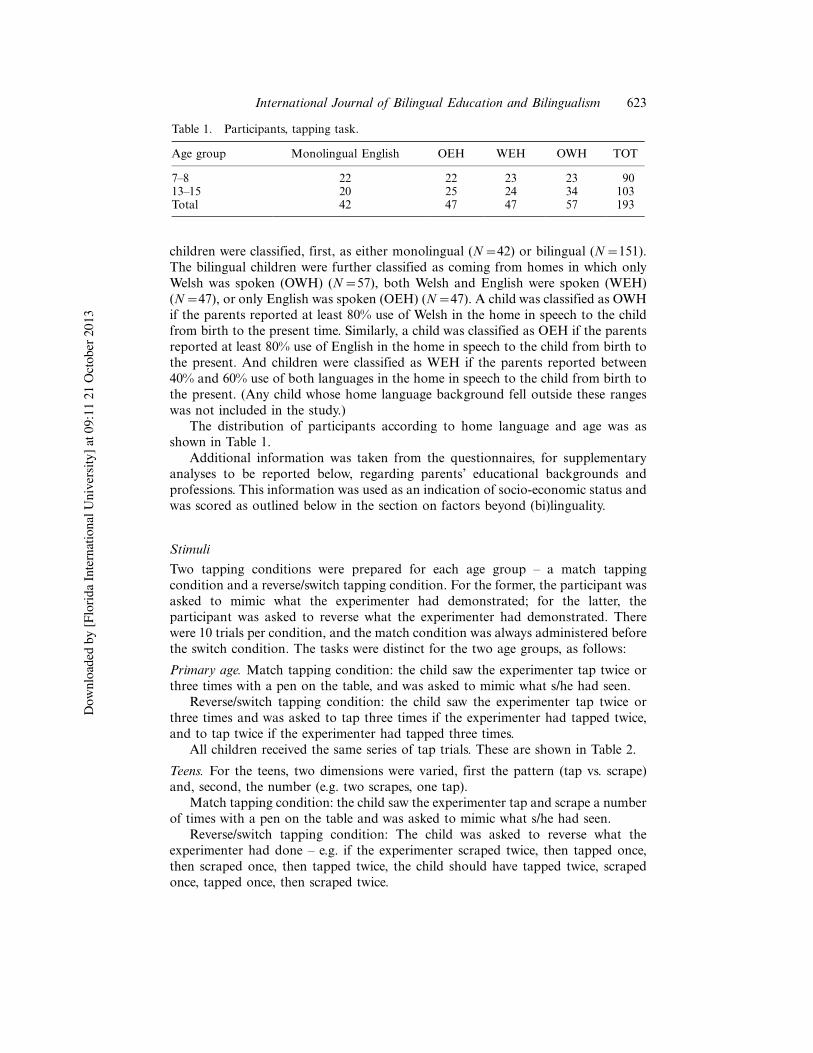
The distribution of participants according to home language and age was asshown in Table 1.
Additional information was taken from the questionnaires, for supplementaryanalyses to be reported below, regarding parents’ educational backgrounds andprofessions. This information was used as an indication of socio-economic status andwas scored as outlined below in the section on factors beyond (bi)linguality.
Stimuli
Two tapping conditions were prepared for each age group ! a match tappingcondition and a reverse/switch tapping condition. For the former, the participant wasasked to mimic what the experimenter had demonstrated; for the latter, theparticipant was asked to reverse what the experimenter had demonstrated. Therewere 10 trials per condition, and the match condition was always administered beforethe switch condition. The tasks were distinct for the two age groups, as follows:
Primary age. Match tapping condition: the child saw the experimenter tap twice orthree times with a pen on the table, and was asked to mimic what s/he had seen.
Reverse/switch tapping condition: the child saw the experimenter tap twice orthree times and was asked to tap three times if the experimenter had tapped twice,and to tap twice if the experimenter had tapped three times.
All children received the same series of tap trials. These are shown in Table 2.
Teens. For the teens, two dimensions were varied, first the pattern (tap vs. scrape)and, second, the number (e.g. two scrapes, one tap).
Match tapping condition: the child saw the experimenter tap and scrape a numberof times with a pen on the table and was asked to mimic what s/he had seen.
Reverse/switch tapping condition: The child was asked to reverse what theexperimenter had done ! e.g. if the experimenter scraped twice, then tapped once,then scraped once, then tapped twice, the child should have tapped twice, scrapedonce, tapped once, then scraped twice.
Table 1. Participants, tapping task.
Age group Monolingual English OEH WEH OWH TOT
7!8 22 22 23 23 9013!15 20 25 24 34 103Total 42 47 47 57 193
International Journal of Bilingual Education and Bilingualism 623D
ownl
oade
d by
[Flo
rida
Inte
rnat
iona
l Uni
vers
ity] a
t 09:
11 2
1 O
ctob
er 2
013
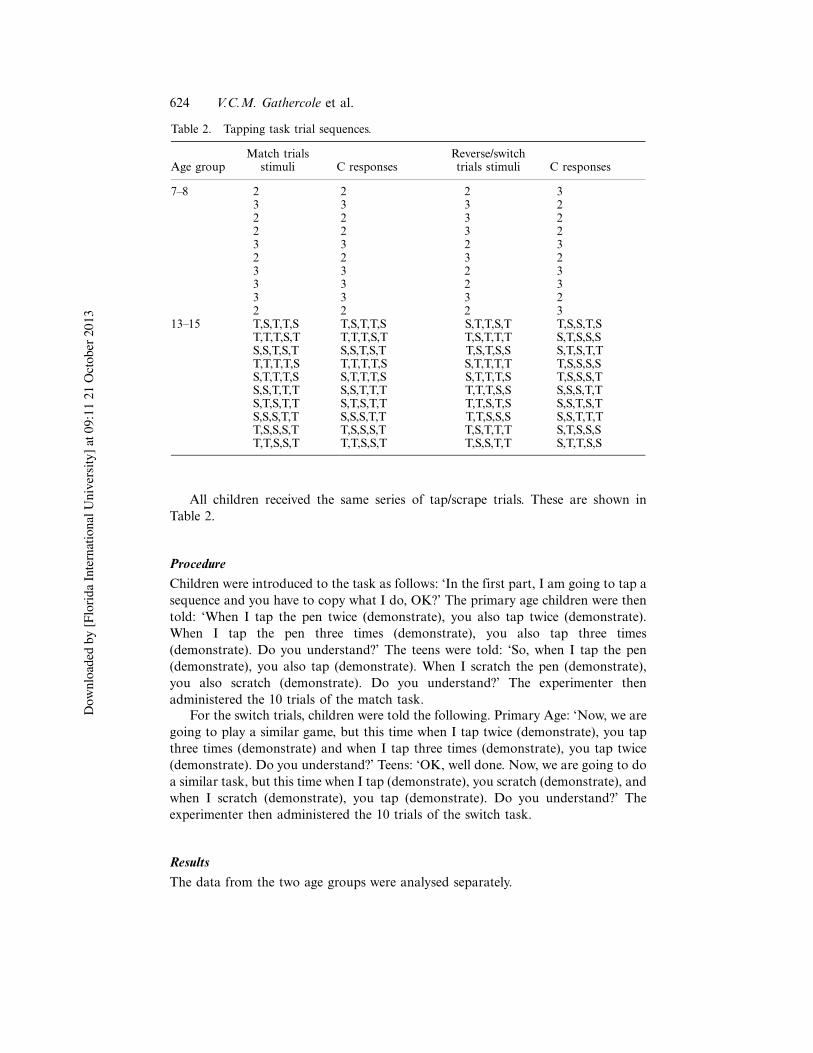
All children received the same series of tap/scrape trials. These are shown inTable 2.
Procedure
Children were introduced to the task as follows: ‘In the first part, I am going to tap asequence and you have to copy what I do, OK?’ The primary age children were thentold: ‘When I tap the pen twice (demonstrate), you also tap twice (demonstrate).When I tap the pen three times (demonstrate), you also tap three times(demonstrate). Do you understand?’ The teens were told: ‘So, when I tap the pen(demonstrate), you also tap (demonstrate). When I scratch the pen (demonstrate),you also scratch (demonstrate). Do you understand?’ The experimenter thenadministered the 10 trials of the match task.
For the switch trials, children were told the following. Primary Age: ‘Now, we aregoing to play a similar game, but this time when I tap twice (demonstrate), you tapthree times (demonstrate) and when I tap three times (demonstrate), you tap twice(demonstrate). Do you understand?’ Teens: ‘OK, well done. Now, we are going to doa similar task, but this time when I tap (demonstrate), you scratch (demonstrate), andwhen I scratch (demonstrate), you tap (demonstrate). Do you understand?’ Theexperimenter then administered the 10 trials of the switch task.
Results
The data from the two age groups were analysed separately.
Table 2. Tapping task trial sequences.
Age groupMatch trials
stimuli C responsesReverse/switchtrials stimuli C responses
7!8 2 2 2 33 3 3 22 2 3 22 2 3 23 3 2 32 2 3 23 3 2 33 3 2 33 3 3 22 2 2 3
13!15 T,S,T,T,S T,S,T,T,S S,T,T,S,T T,S,S,T,ST,T,T,S,T T,T,T,S,T T,S,T,T,T S,T,S,S,SS,S,T,S,T S,S,T,S,T T,S,T,S,S S,T,S,T,TT,T,T,T,S T,T,T,T,S S,T,T,T,T T,S,S,S,SS,T,T,T,S S,T,T,T,S S,T,T,T,S T,S,S,S,TS,S,T,T,T S,S,T,T,T T,T,T,S,S S,S,S,T,TS,T,S,T,T S,T,S,T,T T,T,S,T,S S,S,T,S,TS,S,S,T,T S,S,S,T,T T,T,S,S,S S,S,T,T,TT,S,S,S,T T,S,S,S,T T,S,T,T,T S,T,S,S,ST,T,S,S,T T,T,S,S,T T,S,S,T,T S,T,T,S,S
624 V.C.M. Gathercole et al.D
ownl
oade
d by
[Flo
rida
Inte
rnat
iona
l Uni
vers
ity] a
t 09:
11 2
1 O
ctob
er 2
013
Primary age
An analysis of variance (ANOVA) in which tapping condition (match, switch) andhome language (MonE, OEH, WEH, OWH) were treated as variables revealed maineffects of tapping condition, F(1, 86)"47.71, pB0.001, and of home language, F(3,86)"2.76, p"0.047. All children performed better on the match condition (mean"9.15 correct) than on the switch condition (mean"7.63 correct).
OWH and OEH children performed significantly better (8.85, 9.07 correct) thanMonE children (7.43 correct), p"0.025 and p"0.011, pairwise comparisons,respectively. WEH children were between these (mean"8.22 correct), and notsignificantly different from either group. (These differences were fairly consistent forboth tapping conditions: match: OEH vs. MonE, p"0.005, OWH vs. MonE, p"0.014; switch: OEH vs. MonE, p"0.032, OWH vs. MonE, p"0.057.)
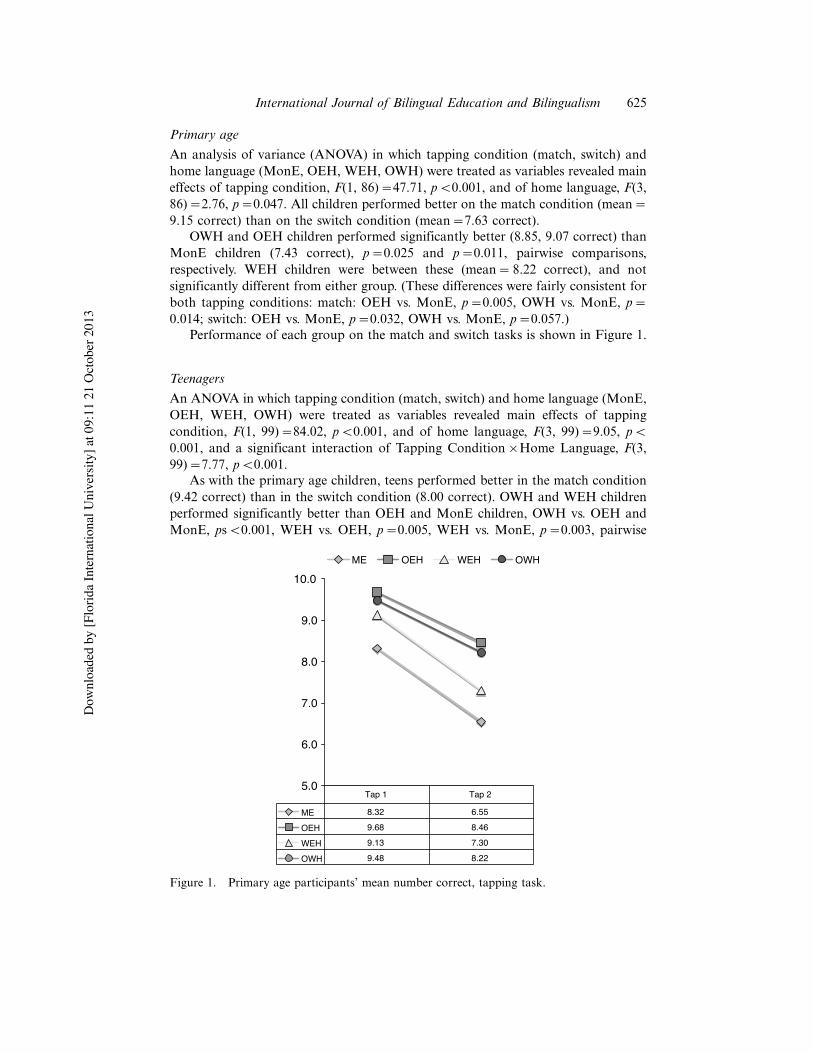
Performance of each group on the match and switch tasks is shown in Figure 1.
Teenagers
An ANOVA in which tapping condition (match, switch) and home language (MonE,OEH, WEH, OWH) were treated as variables revealed main effects of tappingcondition, F(1, 99)"84.02, pB0.001, and of home language, F(3, 99)"9.05, pB0.001, and a significant interaction of Tapping Condition#Home Language, F(3,99)"7.77, pB0.001.
As with the primary age children, teens performed better in the match condition(9.42 correct) than in the switch condition (8.00 correct). OWH and WEH childrenperformed significantly better than OEH and MonE children, OWH vs. OEH andMonE, psB0.001, WEH vs. OEH, p"0.005, WEH vs. MonE, p"0.003, pairwise
5.0
6.0
7.0
8.0
9.0
10.0ME OEH WEH OWH
ME 55.68.32
OEH 64.886.9
WEH 7.3031.9
OWH 22.884.9
Tap 1 Tap 2
Figure 1. Primary age participants’ mean number correct, tapping task.
International Journal of Bilingual Education and Bilingualism 625D
ownl
oade
d by
[Flo
rida
Inte
rnat
iona
l Uni
vers
ity] a
t 09:
11 2
1 O
ctob
er 2
013
comparisons; OWH: 9.40 correct, WEH: 9.21 correct, OEH: 8.18 correct, MonE:8.10 correct.
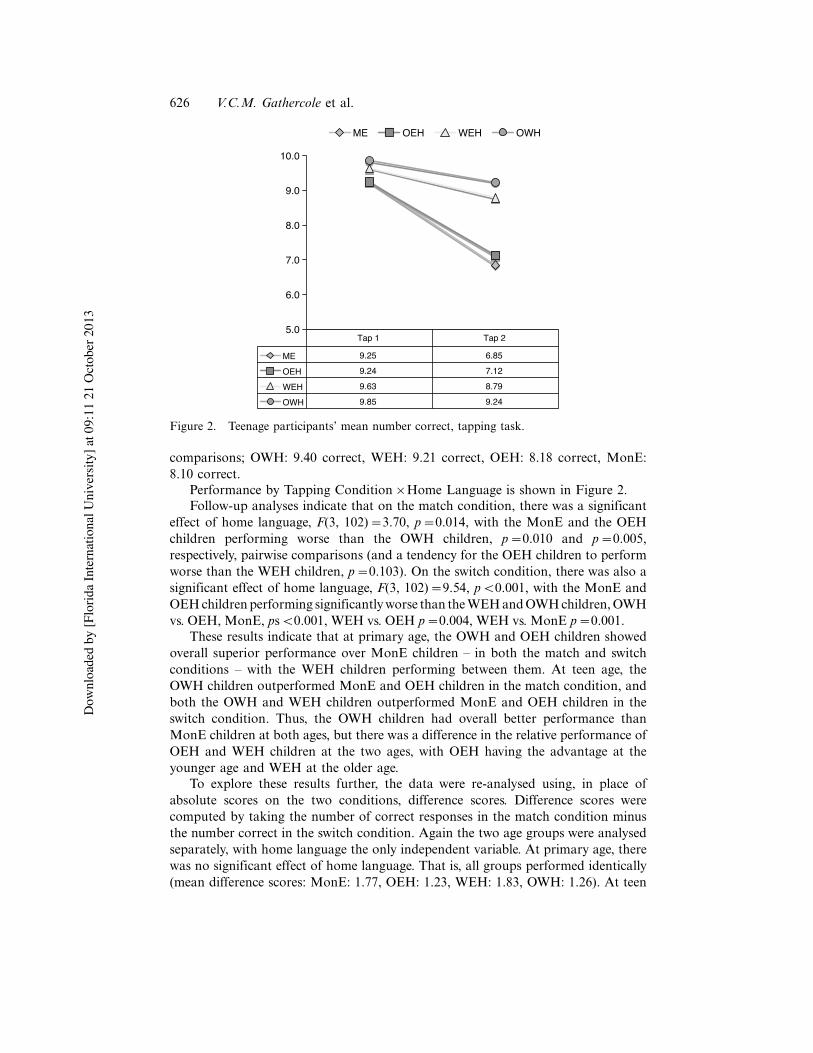
Performance by Tapping Condition#Home Language is shown in Figure 2.Follow-up analyses indicate that on the match condition, there was a significant
effect of home language, F(3, 102)"3.70, p"0.014, with the MonE and the OEHchildren performing worse than the OWH children, p"0.010 and p"0.005,respectively, pairwise comparisons (and a tendency for the OEH children to performworse than the WEH children, p"0.103). On the switch condition, there was also asignificant effect of home language, F(3, 102)"9.54, pB0.001, with the MonE andOEHchildrenperforming significantlyworse than theWEHandOWHchildren,OWHvs. OEH, MonE, psB0.001, WEH vs. OEH p"0.004, WEH vs. MonE p"0.001.
These results indicate that at primary age, the OWH and OEH children showedoverall superior performance over MonE children ! in both the match and switchconditions ! with the WEH children performing between them. At teen age, theOWH children outperformed MonE and OEH children in the match condition, andboth the OWH and WEH children outperformed MonE and OEH children in theswitch condition. Thus, the OWH children had overall better performance thanMonE children at both ages, but there was a difference in the relative performance ofOEH and WEH children at the two ages, with OEH having the advantage at theyounger age and WEH at the older age.
To explore these results further, the data were re-analysed using, in place ofabsolute scores on the two conditions, difference scores. Difference scores werecomputed by taking the number of correct responses in the match condition minusthe number correct in the switch condition. Again the two age groups were analysedseparately, with home language the only independent variable. At primary age, therewas no significant effect of home language. That is, all groups performed identically(mean difference scores: MonE: 1.77, OEH: 1.23, WEH: 1.83, OWH: 1.26). At teen
5.0
6.0
7.0
8.0
9.0
10.0
ME OEH WEH OWH
ME 58.652.9
OEH 21.742.9
WEH 97.836.9
OWH 42.958.9
2paT1paT
Figure 2. Teenage participants’ mean number correct, tapping task.
626 V.C.M. Gathercole et al.D
ownl
oade
d by
[Flo
rida
Inte
rnat
iona
l Uni
vers
ity] a
t 09:
11 2
1 O
ctob
er 2
013
age, there was a significant effect of home language, F(3, 102)"7.77, pB0.001.MonE and OEH children had significantly higher difference scores than WEH andOWH children, OWH vs. OEH p"0.001, OWH vs. MonE pB0.001, WEH vs. OEHp"0.007, WEH vs. MonE p"0.002, pairwise comparisons (mean difference scores:MonE: 2.40; OEH: 2.12; WEH: 0.83, OWH: 0.62).
Discussion, tapping task
The tapping task results reveal the following. At primary age, the OWH and OEHchildren show overall better performance than MonE children, in both the match andswitch conditions. This provides some support for a bilingual advantage, but acrossthe board. In addition, it supports an advantage in the less-balanced bilinguals morethan the more balanced bilinguals, in that OWH and OEH children at this age arelikely to have less ‘balanced’ abilities in their two languages than WEH children (tobe examined further below through correlational analyses). When difference scoresare examined, however, the analyses reveal no difference across home languagegroups. This means that the bilingual advantage observed is across-the-board, notrestricted to the switch condition.
At teen age, the OWH and WEH children show a clear advantage over MonE andOEH children, whether absolute scores or difference scores are examined. Absolutescores show a clear advantage in both conditions for the OWH children, and anadvantage only in the switch condition for the WEH children. These results againsupport abilingual advantage.At this age, theOWHandWEHchildrenboth show fullyfluent, balanced abilities in both their languages (see Gathercole and Thomas 2009).
Stroop task
Method
Primary age and young teenage participants were administered a set of Stroop tasksin one of their languages.
Participants
Participants fell into two age categories and four major home language groups.Children were either primary age (mean age 7;11, range 6;4!8;11) or teens (mean age14;6, range 12;4!16;0). On the basis of the background questionnaires, children wereclassified, first, as either monolingual (N"41) or bilingual (N"217). The bilingualchildren were further classified as coming from homes in which only Welsh wasspoken (OWH) (N"72), both Welsh and English were spoken (WEH) (N"68), oronly English was spoken (OEH) (N"77). A child was classified as OWH if theparents reported at least 80% use of Welsh in the home in speech to the child frombirth to the present time. Similarly, a child was classified as OEH if the parentsreported at least 80% use of English in the home in speech to the child from birth tothe present. And children were classified as WEH if the parents reported between40% and 60% use of both languages in the home in speech to the child from birth tothe present. (Any child whose home language background fell outside these rangeswas not included in the study.)
International Journal of Bilingual Education and Bilingualism 627D
ownl
oade
d by
[Flo
rida
Inte
rnat
iona
l Uni
vers
ity] a
t 09:
11 2
1 O
ctob
er 2
013
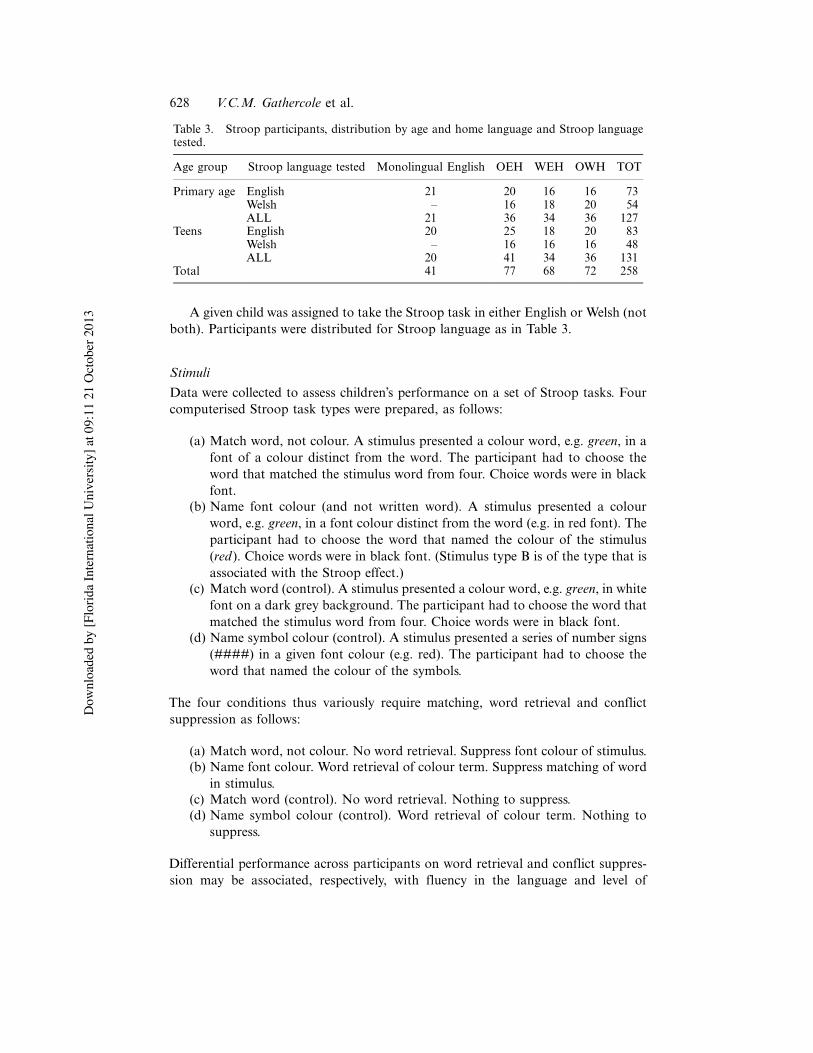
A given child was assigned to take the Stroop task in either English or Welsh (notboth). Participants were distributed for Stroop language as in Table 3.
Stimuli
Data were collected to assess children’s performance on a set of Stroop tasks. Fourcomputerised Stroop task types were prepared, as follows:
(a) Match word, not colour. A stimulus presented a colour word, e.g. green, in afont of a colour distinct from the word. The participant had to choose theword that matched the stimulus word from four. Choice words were in blackfont.
(b) Name font colour (and not written word). A stimulus presented a colourword, e.g. green, in a font colour distinct from the word (e.g. in red font). Theparticipant had to choose the word that named the colour of the stimulus(red ). Choice words were in black font. (Stimulus type B is of the type that isassociated with the Stroop effect.)
(c) Match word (control). A stimulus presented a colour word, e.g. green, in whitefont on a dark grey background. The participant had to choose the word thatmatched the stimulus word from four. Choice words were in black font.
(d) Name symbol colour (control). A stimulus presented a series of number signs(####) in a given font colour (e.g. red). The participant had to choose theword that named the colour of the symbols.
The four conditions thus variously require matching, word retrieval and conflictsuppression as follows:
(a) Match word, not colour. No word retrieval. Suppress font colour of stimulus.(b) Name font colour. Word retrieval of colour term. Suppress matching of word
in stimulus.(c) Match word (control). No word retrieval. Nothing to suppress.(d) Name symbol colour (control). Word retrieval of colour term. Nothing to
suppress.
Differential performance across participants on word retrieval and conflict suppres-sion may be associated, respectively, with fluency in the language and level of
Table 3. Stroop participants, distribution by age and home language and Stroop languagetested.
Age group Stroop language tested Monolingual English OEH WEH OWH TOT
Primary age English 21 20 16 16 73Welsh ! 16 18 20 54ALL 21 36 34 36 127
Teens English 20 25 18 20 83Welsh ! 16 16 16 48ALL 20 41 34 36 131
Total 41 77 68 72 258
628 V.C.M. Gathercole et al.D
ownl
oade
d by
[Flo
rida
Inte
rnat
iona
l Uni
vers
ity] a
t 09:
11 2
1 O
ctob
er 2
013
bilingualism. Thus, bilinguals in general may do better than monolinguals onconditions A and B (both involving some level in inhibition), while level of languageability in the language of the task may affect performance on B and D (bothinvolving colour name retrieval).
Trials were presented on a computer screen. A total of 20 trials per condition werepresented in random order. The conditions were counterbalanced for presentationacross participants. Three practice trials were presented per condition immediatelybefore testing began. Responses to test trials were recorded by the computer foraccuracy and for reaction time.
Results
Initial analyses examined accuracy of performance and reaction times in accordancewith participants’ age, home language, language of the task and task condition.
Accuracy
Participants achieved scores out of 20 per trial type. These scores were entered as thedependent variable into ANOVAs for each language, with task condition, homelanguage and age group as independent variables.
Welsh. Accuracy scores for Welsh revealed significant main effects of Stroopcondition, F(3, 288)"12.52, pB0.001, and age group, F(1, 96)"4.77, p"0.031.Children overall performed worse on the Name Font Colour condition (B) (mean"18.38) than all the others, pairwise comparisons psB0.001, worse on the NameSymbol Colour condition (D) (mean"19.08) than on the Match Word condition (C)(mean"19.49), pairwise comparison p"0.006, and nearly worse on the MatchWord, Not Colour condition (A) (mean"19.13) than on the Match Word condition(C), p"0.068. Children in the younger group achieved a mean of 18.81 correct, whilethose in the older group achieved a mean of 19.23 correct.
There was no significant effect of home language or any significant interactioninvolving home language. There were no other main or interaction effects. Forinformation, performance by home language by Stroop condition is shown in Figure 3and by home language, Stroop condition and age in Figure 4.
English. Accuracy scores for English revealed significant main effects of Stroopcondition, F(3, 444)"11.27, pB0.001, age group, F(1, 148)"13.16, pB0.001, andhome language, F(1, 148)"6.28, pB0.001. Performance on the Name Font Colour,Not Word condition (B) was worse (18.21) than all other conditions, pairwise psB0.001, and the Name Symbol Colour condition (D) was worse (18.89) than the MatchWord condition (C) (19.36), pairwise p"0.012. (Performance on condition (A), theMatch Word, Not Colour condition (19.03) was nearly significantly worse than thaton the Match Word condition (C), p"0.079.) Older children generally performedbetter (mean 19.26) than younger children (mean 18.48).
OWH children performed worse (18.18) than both OEH (19.22) and WEH(19.41) children, pairwise p"0.001 and pB0.001, respectively. Monolingualsperformed significantly worse (18.68) than WEH children, p"0.019, and nearlysignificantly worse than OEH children, p"0.063.
International Journal of Bilingual Education and Bilingualism 629D
ownl
oade
d by
[Flo
rida
Inte
rnat
iona
l Uni
vers
ity] a
t 09:
11 2
1 O
ctob
er 2
013

Figure 4. Mean number correct by Stroop condition, home language, and age, Welsh Stroop.
Figure 3. Mean number correct by Stroop condition and home language, Welsh Stroop.
630 V.C.M. Gathercole et al.D
ownl
oade
d by
[Flo
rida
Inte
rnat
iona
l Uni
vers
ity] a
t 09:
11 2
1 O
ctob
er 2
013
There were also significant interactions of Stroop Condition#Home Language,F(9, 444)"3.59, pB0.001, of Age Group#Home Language, F(3, 148)"3.30, p"0.022, and of Stroop Condition#Age Group#Home Language, F(9, 444)"2.20,p"0.021.
Performance by age group, home language and Stroop condition is shown inFigure 5.
To explore the interactions, follow-up ANOVAs were conducted separately foreach age group, with home language and Stroop conditions as variables. For theteens, there was a main effect of Stroop condition, F(3, 237)"9.35, pB0.001, but notof home language. Performance was worse on the Name Font Colour, Not Wordcondition (B) (18.77) than on all other three conditions (all 19.40 to 19.49), pairwisepsB0.001.
For the primary age children, there were main effects of Stroop condition, F(3,207)"5.46, p"0.001, and of home language, F(3, 69)"4.67, p"0.005. The NameFont Colour, Not Word condition (B) (17.65) was worse than all other conditions,(B) vs. (A) p"0.027, (B) vs. (C) pB0.001, (B) vs. (D) p"0.022; and the NameSymbol Colour condition (D) (18.38) was worse than the Match Word (C) condition(19.24), pairwise p"0.026. (Mean performance on condition (A) was 18.65.) OWHchildren (17.27) performed worse than OEH (19.08) and WEH (19.39) children,pairwise p"0.004 and p"0.001, respectively; MonE (18.19) performed significantlyworse than WEH bilinguals, p"0.049.
These results were modified by an interaction of Stroop Condition#HomeLanguage, F(9, 207)"2.75, p"0.005. Further exploration revealed that the homelanguage groups differed in performance by condition as follows:
Figure 5. Mean number correct by Stroop condition, home language, and age, EnglishStroop.
International Journal of Bilingual Education and Bilingualism 631D
ownl
oade
d by
[Flo
rida
Inte
rnat
iona
l Uni
vers
ity] a
t 09:
11 2
1 O
ctob
er 2
013
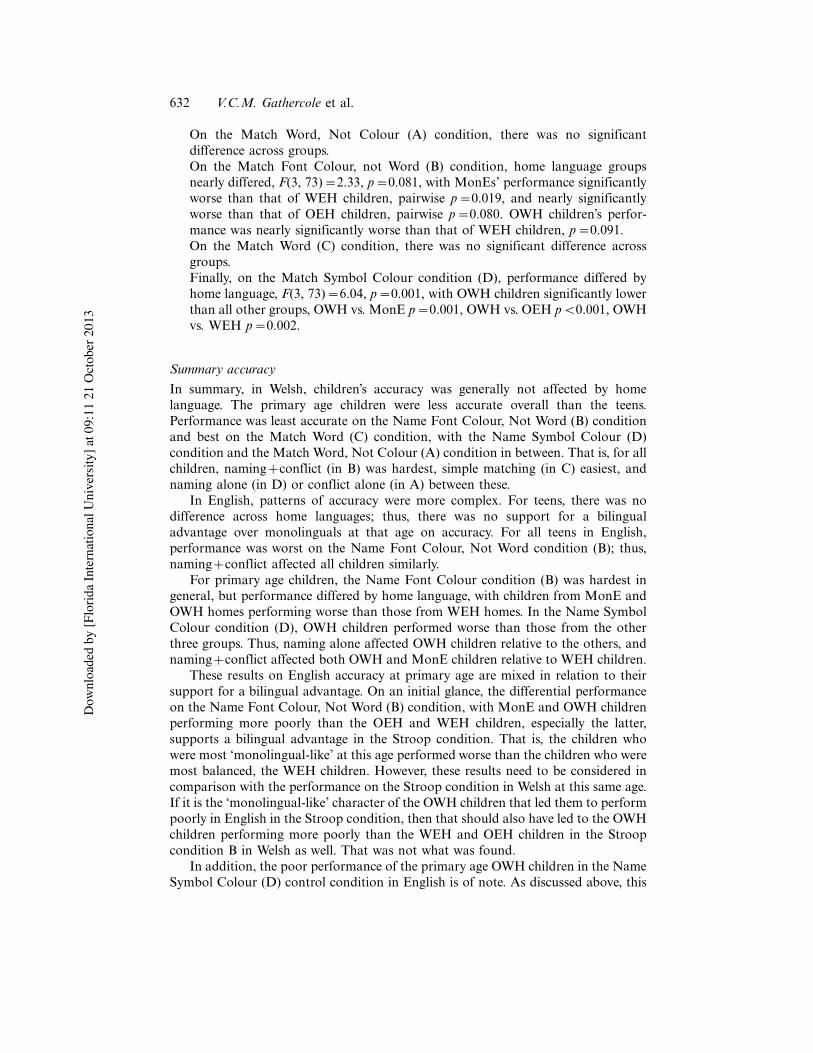
On the Match Word, Not Colour (A) condition, there was no significantdifference across groups.On the Match Font Colour, not Word (B) condition, home language groupsnearly differed, F(3, 73)"2.33, p"0.081, with MonEs’ performance significantlyworse than that of WEH children, pairwise p"0.019, and nearly significantlyworse than that of OEH children, pairwise p"0.080. OWH children’s perfor-mance was nearly significantly worse than that of WEH children, p"0.091.On the Match Word (C) condition, there was no significant difference acrossgroups.Finally, on the Match Symbol Colour condition (D), performance differed byhome language, F(3, 73)"6.04, p"0.001, with OWH children significantly lowerthan all other groups, OWH vs. MonE p"0.001, OWH vs. OEH pB0.001, OWHvs. WEH p"0.002.
Summary accuracy
In summary, in Welsh, children’s accuracy was generally not affected by homelanguage. The primary age children were less accurate overall than the teens.Performance was least accurate on the Name Font Colour, Not Word (B) conditionand best on the Match Word (C) condition, with the Name Symbol Colour (D)condition and the Match Word, Not Colour (A) condition in between. That is, for allchildren, naming$conflict (in B) was hardest, simple matching (in C) easiest, andnaming alone (in D) or conflict alone (in A) between these.
In English, patterns of accuracy were more complex. For teens, there was nodifference across home languages; thus, there was no support for a bilingualadvantage over monolinguals at that age on accuracy. For all teens in English,performance was worst on the Name Font Colour, Not Word condition (B); thus,naming$conflict affected all children similarly.
For primary age children, the Name Font Colour condition (B) was hardest ingeneral, but performance differed by home language, with children from MonE andOWH homes performing worse than those from WEH homes. In the Name SymbolColour condition (D), OWH children performed worse than those from the otherthree groups. Thus, naming alone affected OWH children relative to the others, andnaming$conflict affected both OWH and MonE children relative to WEH children.
These results on English accuracy at primary age are mixed in relation to theirsupport for a bilingual advantage. On an initial glance, the differential performanceon the Name Font Colour, Not Word (B) condition, with MonE and OWH childrenperforming more poorly than the OEH and WEH children, especially the latter,supports a bilingual advantage in the Stroop condition. That is, the children whowere most ‘monolingual-like’ at this age performed worse than the children who weremost balanced, the WEH children. However, these results need to be considered incomparison with the performance on the Stroop condition in Welsh at this same age.If it is the ‘monolingual-like’ character of the OWH children that led them to performpoorly in English in the Stroop condition, then that should also have led to the OWHchildren performing more poorly than the WEH and OEH children in the Stroopcondition B in Welsh as well. That was not what was found.
In addition, the poor performance of the primary age OWH children in the NameSymbol Colour (D) control condition in English is of note. As discussed above, this
632 V.C.M. Gathercole et al.D
ownl
oade
d by
[Flo
rida
Inte
rnat
iona
l Uni
vers
ity] a
t 09:
11 2
1 O
ctob
er 2
013
condition requires the retrieval of the colour name from memory to perform well. Atthese ages, the OWH children are the least proficient in English of the four homelanguage groups. Their lower proficiency appears responsible for their poorerperformance on the D condition. Given this explanation, a comparable explanationappears in order for the poor performance of the OWH children in the B Stroopcondition, which also requires the retrieval of the colour name from memory.
This opens up the possibility that relatively poor performance in the Stroopcondition may be attributable to two distinct sources !monolingualism in the case ofthe MonE children, lower fluency in English in the case of the OWH children. Weshall return to this possibility below.
Reaction time
Reaction time measures were similarly analysed for the Welsh and English conditions,with home language, age group, and Stroop condition as independent variables.
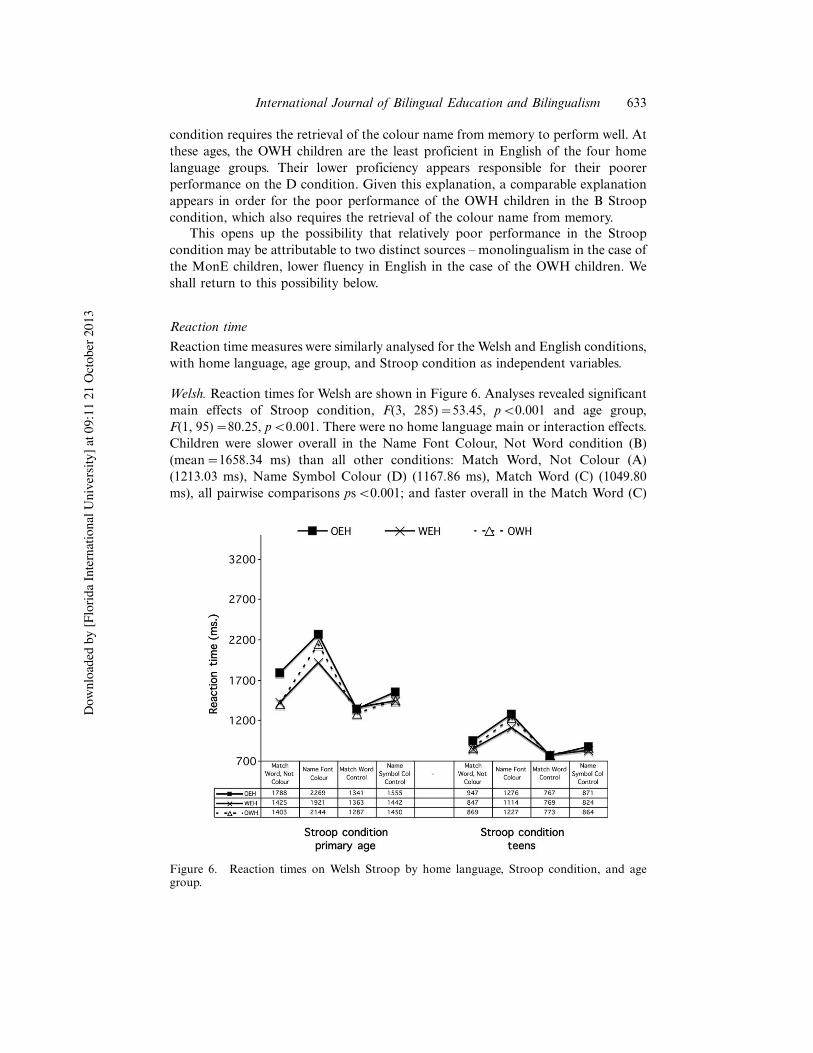
Welsh. Reaction times for Welsh are shown in Figure 6. Analyses revealed significantmain effects of Stroop condition, F(3, 285)"53.45, pB0.001 and age group,F(1, 95)"80.25, pB0.001. There were no home language main or interaction effects.Children were slower overall in the Name Font Colour, Not Word condition (B)(mean"1658.34 ms) than all other conditions: Match Word, Not Colour (A)(1213.03 ms), Name Symbol Colour (D) (1167.86 ms), Match Word (C) (1049.80ms), all pairwise comparisons psB0.001; and faster overall in the Match Word (C)
Figure 6. Reaction times on Welsh Stroop by home language, Stroop condition, and agegroup.
International Journal of Bilingual Education and Bilingualism 633D
ownl
oade
d by
[Flo
rida
Inte
rnat
iona
l Uni
vers
ity] a
t 09:
11 2
1 O
ctob
er 2
013
condition than the others, ps50.001. Primary age children were almost twice as slowas teens, with means of 1615.6 vs. 928.9 ms., respectively.
There was also a significant interaction of Stroop Condition#Age Group, F(3,285)"4.29, p"0.006. Follow-up analyses examined each age group separately.
At primary age, there was a significant effect of Stroop condition, F(3, 153)"27.34, pB0.001, with performance on the Name Font Colour, Not Word (B)condition slower (2111.13 ms.) than on all other conditions, psB0.001, andperformance on the Match Word (C) condition significantly faster (1330.11 ms.)than all other conditions, (C) vs. (A) p"0.020, (C) vs. (B) pB0.001, (C) vs. (D) p"0.013; Match Word, Not Colour (A) condition (1538.83 ms.), Name Symbol Colour(D) condition (1482.39 ms.)
Among the teens, there was a significant effect of Stroop condition, F(3, 132)"79.5, pB0.001. Teens took longer on the Name Font Colour, Not Word (B)condition (1205.5 ms) than all others, pairwise psB0.001, and were faster on theMatch Word condition (C) (769.5 ms) than all others, pairwise psB0.001: MatchWord, Not Colour (A): 887.2 ms.; Name Font Colour, Not Word (B): 1205.5 ms.;Match Word (C): 769.5 ms.; Name Symbol Colour (D): 853.3 ms.
Summary, Welsh RTs
In summary, on the Welsh Stroop, both the younger and the older childrenperformed differently by Stroop condition, with the Name Font Colour, Not Word(i.e. name$conflict) condition taking the longest, and the simple Match Wordcondition the shortest. (The simple Match Word, Not Colour conflict condition andthe simple Name Colour condition were in between these two.) There were nosignificant effects related to home language.
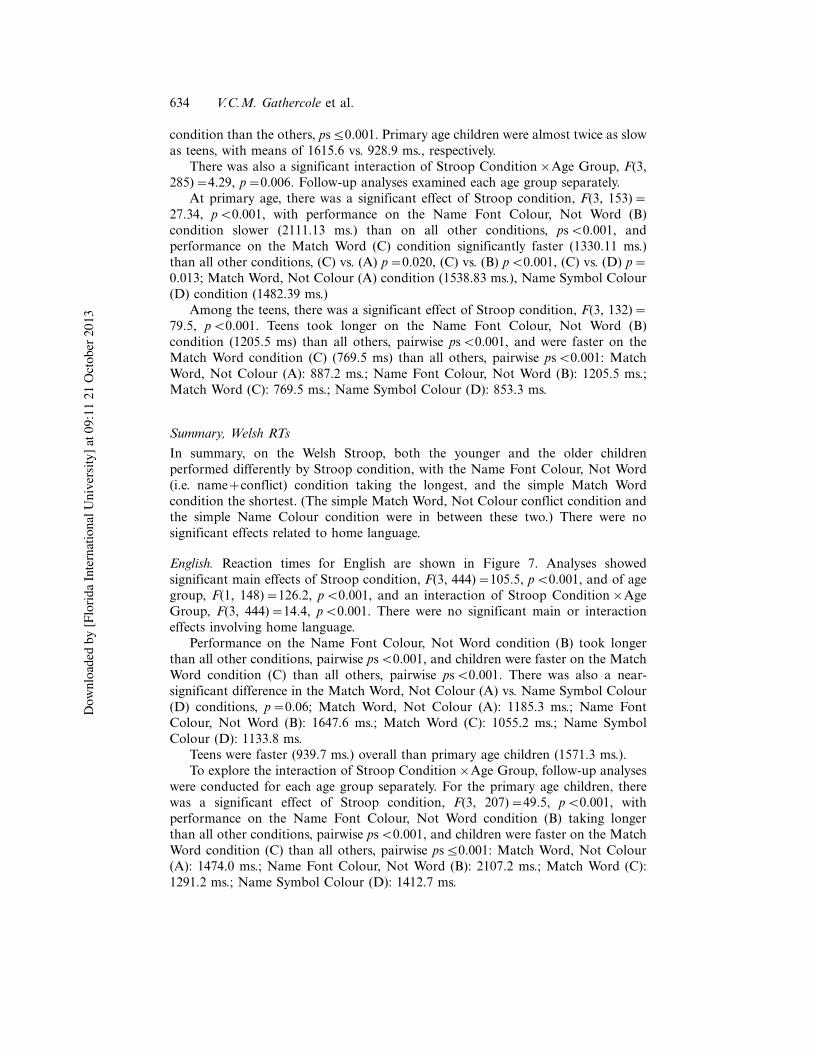
English. Reaction times for English are shown in Figure 7. Analyses showedsignificant main effects of Stroop condition, F(3, 444)"105.5, pB0.001, and of agegroup, F(1, 148)"126.2, pB0.001, and an interaction of Stroop Condition#AgeGroup, F(3, 444)"14.4, pB0.001. There were no significant main or interactioneffects involving home language.
Performance on the Name Font Colour, Not Word condition (B) took longerthan all other conditions, pairwise psB0.001, and children were faster on the MatchWord condition (C) than all others, pairwise psB0.001. There was also a near-significant difference in the Match Word, Not Colour (A) vs. Name Symbol Colour(D) conditions, p"0.06; Match Word, Not Colour (A): 1185.3 ms.; Name FontColour, Not Word (B): 1647.6 ms.; Match Word (C): 1055.2 ms.; Name SymbolColour (D): 1133.8 ms.
Teens were faster (939.7 ms.) overall than primary age children (1571.3 ms.).To explore the interaction of Stroop Condition#Age Group, follow-up analyses
were conducted for each age group separately. For the primary age children, therewas a significant effect of Stroop condition, F(3, 207)"49.5, pB0.001, withperformance on the Name Font Colour, Not Word condition (B) taking longerthan all other conditions, pairwise psB0.001, and children were faster on the MatchWord condition (C) than all others, pairwise ps50.001: Match Word, Not Colour(A): 1474.0 ms.; Name Font Colour, Not Word (B): 2107.2 ms.; Match Word (C):1291.2 ms.; Name Symbol Colour (D): 1412.7 ms.
634 V.C.M. Gathercole et al.D
ownl
oade
d by
[Flo
rida
Inte
rnat
iona
l Uni
vers
ity] a
t 09:
11 2
1 O
ctob
er 2
013
For the teens, analyses again revealed a main effect of Stroop condition,F(3, 237)"95.1, pB0.001. Performance on the Name Font Colour, Not Wordcondition (B) took longer (1188.0 ms.) than all other conditions, pairwise psB0.001,and children were faster on the Match Word condition (C) (819.1 ms.) than all otherconditions: (C) vs. (A) p"0.003, (C) vs. (B) pB0.001, (C) vs. (D) p"0.044; MatchWord, Not Colour (A): 896.6 ms.; Name Font Colour, Not Word (B); and NameSymbol Colour (D): 854.9 ms. Performance on the Match Word, Not Colour (A)condition was also significantly slower than on the Name Symbol Colour (D)condition, p"0.041.
Finally, the teen analyses revealed a significant effect of home language, F(3,79)"3.02, p"0.035, with MonE children slower overall (1028.0 ms.) than all theother groups (between 884.0 and 930.8 ms.), MonE vs. OEH p"0.043, MonE vs.WEH p"0.006, MonE vs. OWH p"0.027.
Summary, English RTs
In summary, on English, both the younger and the older children performeddifferently by Stroop condition, with the Name Font Colour, Not Word (i.e. name$conflict) condition taking the longest, and the simple Match Word condition theshortest. At the younger age, the Match Word, Not Colour (A) (conflict only)condition and the Name Symbol Colour (name only) condition were in betweenthese two. At the older age, the Name Symbol Colour condition (name only) wassignificantly faster than the Match Word, Not Colour (conflict only) condition.
Figure 7. Reaction times on English Stroop by home language, Stroop condition, and agegroup.
International Journal of Bilingual Education and Bilingualism 635D
ownl
oade
d by
[Flo
rida
Inte
rnat
iona
l Uni
vers
ity] a
t 09:
11 2
1 O
ctob
er 2
013
At the older age, monolinguals took longer overall across conditions than thethree bilingual groups. This result supports a bilingual advantage, but it supports itglobally, not for only the Stroop condition B, and the advantage is apparent only inthe performance of the teen age group tested in English.
Difference scores
To explore these results further, the data were re-analysed using, in place of absolutescores on the four conditions, difference scores based on the two most criticalconditions. Difference scores may provide a more accurate picture of bilingual vs.monolingual performance. This is because difference scores help to neutralise anyabsolute differences in overall performance and focus on whether there is afacilitative effect of bilingualism in the critical target condition. (Thus, for example,if a child is generally slow, s/he will be slow in both the control and the targetconditions, which could show up as an absolute difference between that child andothers in the target condition; but the difference in timing between that child’sperformance in the control and target conditions may be minimal, so his/herperformance on the difference scores may be identical to that of a child who justhappens to be faster overall.) Difference scores for both accuracy and reaction timeswere computed. Accuracy difference scores were computed by taking the numbercorrect in the Match Word control condition (C) minus the number correct in theName Font Colour, Not Word condition (B); reaction time difference scores werecomputed by taking the reaction times in the Name Font Colour, Not Wordcondition (B) and subtracting the reaction times in the Match Word controlcondition (C). Again the two Stroop language conditions were analysed separately,with home language and age group treated as independent variables.
For Welsh Stroop, the accuracy difference scores showed no significant differenceby home language or age. However, the reaction time difference scores showed asignificant effect of age group, F(1, 101)"8.53, p"0.004, with the younger childrenshowing larger reaction time differences (781.0 ms) than the older children (436.4ms). There was no home language difference.
For the English Stroop, the accuracy difference scores showed an effect of agegroup, F(1, 155)"5.58, p"0.019, with the younger children showing a meandifference of 1.59, and the older 0.72. There was also a significant effect of age groupwith the reaction time difference scores, F(1, 155)"22.88, pB0.001, with theyounger children showing larger reaction time differences (816.0 ms) than the olderchildren (368.9 ms). There were no home language differences.
The difference scores for the Stroop measures, whether accuracy or reaction timescores, then, fail to support a bilingual advantage for either the Welsh or Englishdata.
Discussion, Stroop tasks
These findings on the Stroop tasks reveal the following. First, in relation to correctresponding, there was no home language effect in relation to Welsh testing at eitherage, whether raw correct scores or difference scores are examined. Nor was there ahome language effect in relation to English testing for the teen age group, whetherraw correct scores or difference scores are examined.
636 V.C.M. Gathercole et al.D
ownl
oade
d by
[Flo
rida
Inte
rnat
iona
l Uni
vers
ity] a
t 09:
11 2
1 O
ctob
er 2
013
For the primary age children tested in English, there was an advantage on task Bfor the WEH children over the MonE and OWH children, when raw correct scoresare examined (but not when difference scores are examined). The poorer perfor-mance of the MonE relative to WEH children supports a bilingual advantage, andsuggests that that advantage may be most apparent in children with a more balancedcommand of the two languages (as judged by having exposure to both languagesfrom birth). (See further discussion below.) The poorer performance of the OWHchildren may reflect lower fluency in English than in the other groups, supported bythe poorer performance of the OWH group in the D condition as well.
In relation to reaction times, the data generally do not reveal home languagedifferences for either age for either language. The one exception to this is that whentested in English, the MonE teens performed generally slower overall (not just in theB condition) than the other groups.
Factors beyond (bi)linguality
The above analyses examined in detail the extent to which bilingualism per se andlanguage dominance in the bilingual, as inferred from home language, maycontribute to performance on executive function tasks. We have seen some mixedresults above. On the tapping task, the OWH children appear to have an advantageover the others, but on the Stroop task, if anything, it appears that the WEH childrenhave something of an advantage over the others, especially when the Stroop isconducted in English.
As noted in the introduction, a number of researchers have suggested that otherfactors, such as SES level, language abilities or general cognitive abilities, may bedetermining factors in performance on executive function tasks. Whenever possible,we gathered other information on our participants, beyond their home languagestatus and their performance on these executive function measures, in order toexamine what factors beyond linguality may explain their performance. In particular,we also tested participants on vocabulary abilities in English and Welsh, ongrammatical knowledge in English and Welsh, and on general cognitive abilities.In addition, through the questionnaire, we obtained information that could helpestablish socio-economic status, including parental education and professions. Thefollowing section examines the possible contributions of these other factors toperformance on the tapping and Stroop tasks.
Measures
Language
Tests of receptive vocabulary and receptive grammatical knowledge were conductedfor English and Welsh.
Vocabulary
Bilinguals’ and monolinguals’ receptive vocabulary abilities in English were measuredwith the British Picture Vocabulary Scales (BPVS) (Dunn, Dunn, and Whetton1982), and bilinguals’ receptive vocabulary in Welsh was measured using the Prawf
International Journal of Bilingual Education and Bilingualism 637D
ownl
oade
d by
[Flo
rida
Inte
rnat
iona
l Uni
vers
ity] a
t 09:
11 2
1 O
ctob
er 2
013
Geirfa Cymraeg (Gathercole and Thomas 2007; Gathercole, Thomas, and Hughes inpress). Both ask the participant to choose one out of four pictures that go with theword they hear aurally. Children’s raw scores were recorded for each of these.
Grammatical abilities
A battery of tasks was developed to assess comparable morpho-syntactic structuresin English and Welsh. These tasks included trials assessing knowledge of 13 types ofstructures: word order in active sentences; interpretation of passive sentences;comparative adjectives; superlative adjectives; negation; temporal conjunctions(before, after, until); past tense; future tense; three types of relative clauses; andtwo types of quantifiers. Children heard a sentence in the relevant language and wereasked to choose one picture out of four that best went with the sentence.
Two versions of the tests were drawn up for each language. The two versions usedthe same two sets of pictures across the two languages, but within each languagedistinct sentences applied in the two versions, so that different sentences and pictureswere used to cover the thirteen structure types. This allowed for balancing the use ofthe tests across subjects, so that bilinguals took one version of the test in onelanguage and the other version in the other language. (The words used in the twoversions for a given language were balanced, so that the same lexical items were usedacross the items in the two versions.)
Monolinguals were tested only in English, bilinguals in both of their languages,on separate occasions.
We also entered the following:
. Home Language group to which a child belonged.
. Age at which the child began to learn to speak Welsh.
. Age at which the child began to learn to speak English.
Language use
We also entered information on the following, to gauge the level of use of the twolanguages:
. The per cent of time the child speaks Welsh.
. The per cent of time the child speaks English.
. Whether the child speaks Welsh and English on a daily basis.
. The relative balance in the proportion of speaking in Welsh and English (with50/50 scored high, down to only W or only E scored low).
General cognitive abilities
To assess general cognitive abilities, bilingual and monolingual participants receivedRaven’s Coloured Progressive Matrices (Raven, Court, and Raven 1983). Theyounger children were also administered eight sections of the McCarthy Scales ofChildren’s Abilities (McCarthy 1972) (the sections that do not test verbal or motorabilities). The sections tested were block building, puzzle solving, pictorial memory,number questions, a tapping sequence, number memory match, number memory
638 V.C.M. Gathercole et al.D
ownl
oade
d by
[Flo
rida
Inte
rnat
iona
l Uni
vers
ity] a
t 09:
11 2
1 O
ctob
er 2
013
reverse, and count and sort, plus the total of these eight sub-tasks. Based on reportsin the literature, bilinguals and monolinguals were predicted to perform similarly onthese general cognitive tasks.
Socio-economic level and other factors
As an indicator of children’s socio-economic status, parental education andprofessions were assigned scores as follows. Education was coded for the highesteducation achieved within the British educational system: 1"Primary education, 2"GCSE, 3"A Level, 4"university undergraduate student or degree, 5"postgraduatestudent or degree. Professions were coded into three categories: 1"‘white-collar’profession requiring specialist training (e.g. pilot, scientist, GP); 3"‘blue-collar’profession requiring no specialist training (e.g. HGV driver, ironing business); and2"anything in between (e.g. teacher, store manager); 4 was used for unemployed.
Tapping task
Correlational analyses for each age group examined whether performance on thematch task, the switch task or the difference between them correlated with socio-economic factors, general cognitive abilities, language ability or language use. Here, aswith the Stroop task correlations to follow, correlations were calculated once with themonolingual participants included, and once without them. (The latter was to checkwhether any results were being skewed by the performance of the monolinguals.) (Analpha level of 0.05 was used for all correlations; however, near-significant correlations,when p50.06, are also shown in tables for information.)
SES
For socio-economic level, these tasks were tested for each age against the mother’sand father’s education and professions. None of these correlated significantly withtapping task performance.
General cognitive abilities
Correlations between general cognitive measures and the tapping task perfor-mance are shown in Table 4. In Table 4A, the data from all participants(bilinguals and monolinguals) are entered; in Table 4B the data only from thebilinguals. (In all correlational tables, results for the primary age children areshown as ‘7’ and in normal font, those for the teens are shown as ‘15’ and inbold italic font.) Recall that the primary age children were administered both theMcCarthy measures and Raven’s, but the teenagers were only administered theRaven’s.
Analyses reveal a high correlation between the tapping tasks and generalcognitive abilities measured by the McCarthy measures, especially in relation tocognitive tasks involving number. They also correlated highly with performance onthe Raven’s (which largely entails visual pattern discrimination and matching).
International Journal of Bilingual Education and Bilingualism 639D
ownl
oade
d by
[Flo
rida
Inte
rnat
iona
l Uni
vers
ity] a
t 09:
11 2
1 O
ctob
er 2
013
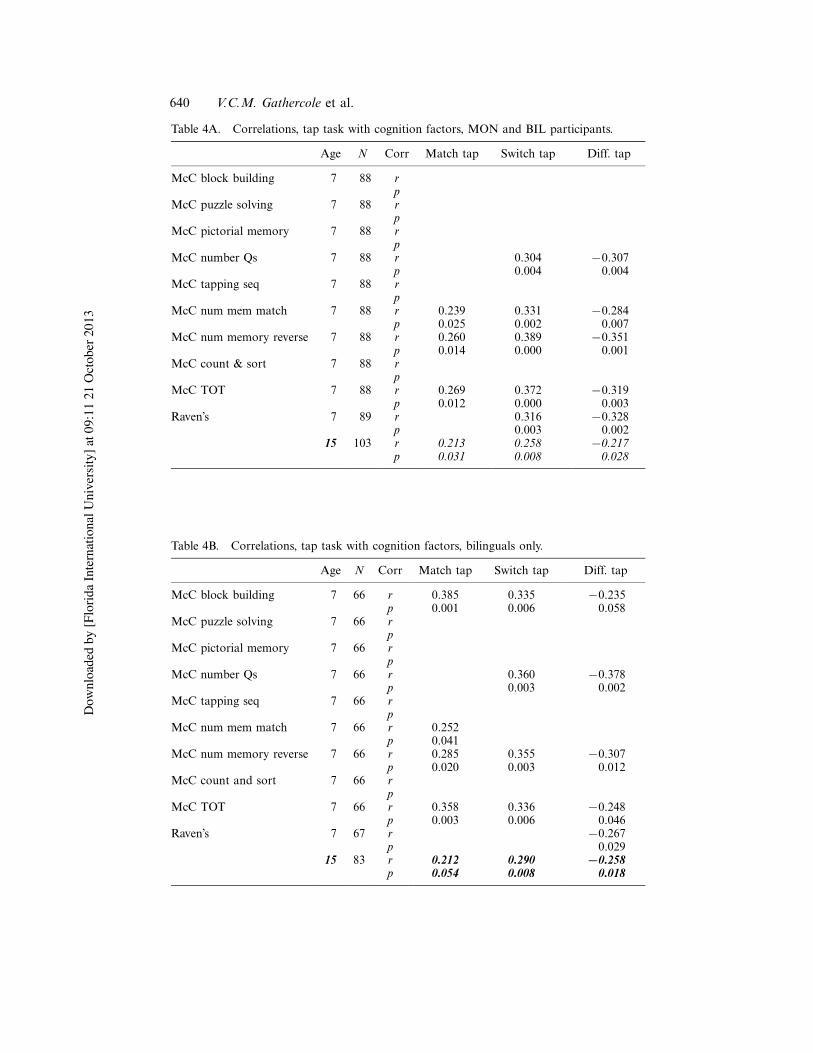
Table 4A. Correlations, tap task with cognition factors, MON and BIL participants.
Age N Corr Match tap Switch tap Diff. tap
McC block building 7 88 rp
McC puzzle solving 7 88 rp
McC pictorial memory 7 88 rp
McC number Qs 7 88 r 0.304 %0.307p 0.004 0.004
McC tapping seq 7 88 rp
McC num mem match 7 88 r 0.239 0.331 %0.284p 0.025 0.002 0.007
McC num memory reverse 7 88 r 0.260 0.389 %0.351p 0.014 0.000 0.001
McC count & sort 7 88 rp
McC TOT 7 88 r 0.269 0.372 %0.319p 0.012 0.000 0.003
Raven’s 7 89 r 0.316 %0.328p 0.003 0.002
15 103 r 0.213 0.258 %0.217p 0.031 0.008 0.028
Table 4B. Correlations, tap task with cognition factors, bilinguals only.
Age N Corr Match tap Switch tap Diff. tap
McC block building 7 66 r 0.385 0.335 %0.235p 0.001 0.006 0.058
McC puzzle solving 7 66 rp
McC pictorial memory 7 66 rp
McC number Qs 7 66 r 0.360 %0.378p 0.003 0.002
McC tapping seq 7 66 rp
McC num mem match 7 66 r 0.252p 0.041
McC num memory reverse 7 66 r 0.285 0.355 %0.307p 0.020 0.003 0.012
McC count and sort 7 66 rp
McC TOT 7 66 r 0.358 0.336 %0.248p 0.003 0.006 0.046
Raven’s 7 67 r %0.267p 0.029
15 83 r 0.212 0.290 !0.258p 0.054 0.008 0.018
640 V.C.M. Gathercole et al.D
ownl
oade
d by
[Flo
rida
Inte
rnat
iona
l Uni
vers
ity] a
t 09:
11 2
1 O
ctob
er 2
013
Language
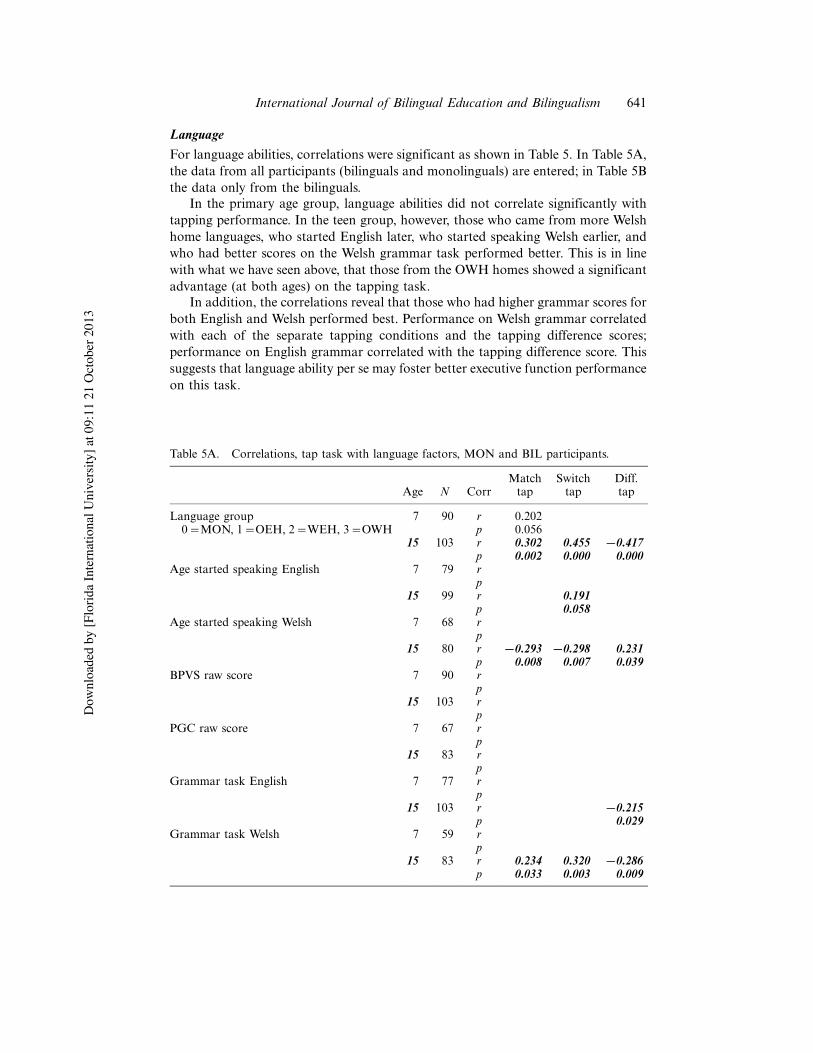
For language abilities, correlations were significant as shown in Table 5. In Table 5A,the data from all participants (bilinguals and monolinguals) are entered; in Table 5Bthe data only from the bilinguals.
In the primary age group, language abilities did not correlate significantly withtapping performance. In the teen group, however, those who came from more Welshhome languages, who started English later, who started speaking Welsh earlier, andwho had better scores on the Welsh grammar task performed better. This is in linewith what we have seen above, that those from the OWH homes showed a significantadvantage (at both ages) on the tapping task.
In addition, the correlations reveal that those who had higher grammar scores forboth English and Welsh performed best. Performance on Welsh grammar correlatedwith each of the separate tapping conditions and the tapping difference scores;performance on English grammar correlated with the tapping difference score. Thissuggests that language ability per se may foster better executive function performanceon this task.
Table 5A. Correlations, tap task with language factors, MON and BIL participants.
Age N CorrMatchtap
Switchtap
Diff.tap
Language group 7 90 r 0.2020"MON, 1"OEH, 2"WEH, 3"OWH p 0.056
15 103 r 0.302 0.455 !0.417p 0.002 0.000 0.000
Age started speaking English 7 79 rp
15 99 r 0.191p 0.058
Age started speaking Welsh 7 68 rp
15 80 r !0.293 !0.298 0.231p 0.008 0.007 0.039
BPVS raw score 7 90 rp
15 103 rp
PGC raw score 7 67 rp
15 83 rp
Grammar task English 7 77 rp
15 103 r !0.215p 0.029
Grammar task Welsh 7 59 rp
15 83 r 0.234 0.320 !0.286p 0.033 0.003 0.009
International Journal of Bilingual Education and Bilingualism 641D
ownl
oade
d by
[Flo
rida
Inte
rnat
iona
l Uni
vers
ity] a
t 09:
11 2
1 O
ctob
er 2
013
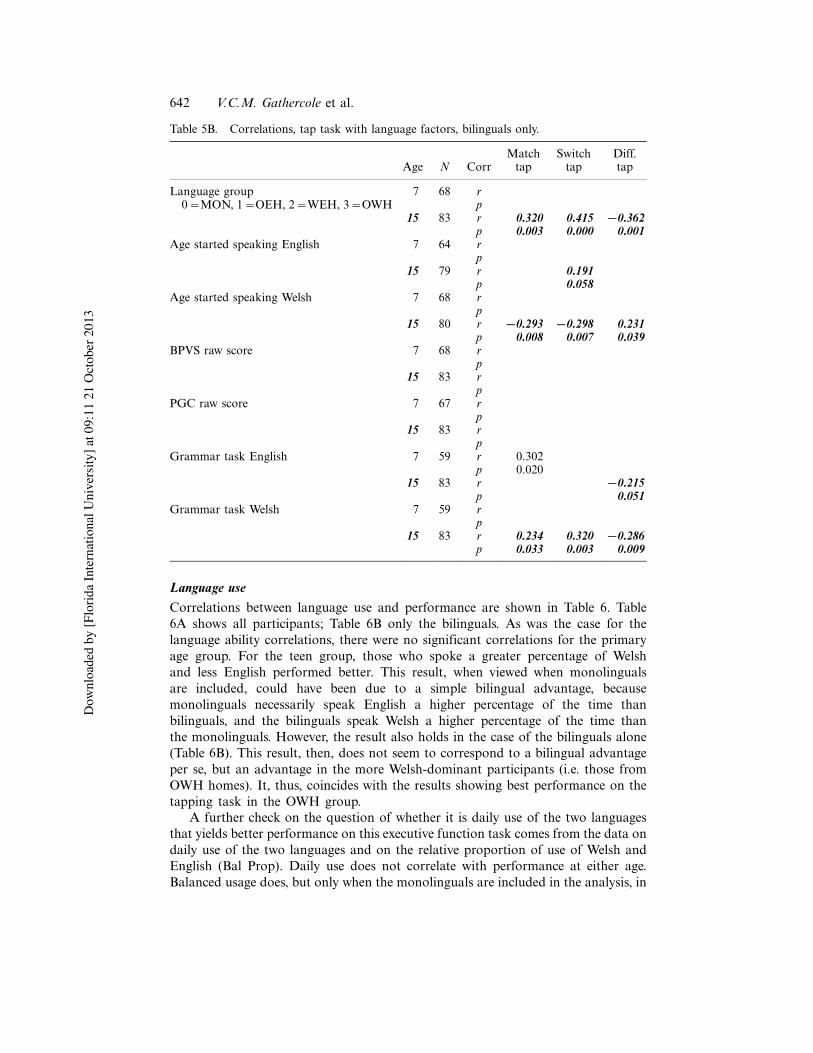
Language use
Correlations between language use and performance are shown in Table 6. Table6A shows all participants; Table 6B only the bilinguals. As was the case for thelanguage ability correlations, there were no significant correlations for the primaryage group. For the teen group, those who spoke a greater percentage of Welshand less English performed better. This result, when viewed when monolingualsare included, could have been due to a simple bilingual advantage, becausemonolinguals necessarily speak English a higher percentage of the time thanbilinguals, and the bilinguals speak Welsh a higher percentage of the time thanthe monolinguals. However, the result also holds in the case of the bilinguals alone(Table 6B). This result, then, does not seem to correspond to a bilingual advantageper se, but an advantage in the more Welsh-dominant participants (i.e. those fromOWH homes). It, thus, coincides with the results showing best performance on thetapping task in the OWH group.
A further check on the question of whether it is daily use of the two languagesthat yields better performance on this executive function task comes from the data ondaily use of the two languages and on the relative proportion of use of Welsh andEnglish (Bal Prop). Daily use does not correlate with performance at either age.Balanced usage does, but only when the monolinguals are included in the analysis, in
Table 5B. Correlations, tap task with language factors, bilinguals only.
Age N CorrMatchtap
Switchtap
Diff.tap
Language group 7 68 r0"MON, 1"OEH, 2"WEH, 3"OWH p
15 83 r 0.320 0.415 !0.362p 0.003 0.000 0.001
Age started speaking English 7 64 rp
15 79 r 0.191p 0.058
Age started speaking Welsh 7 68 rp
15 80 r !0.293 !0.298 0.231p 0.008 0.007 0.039
BPVS raw score 7 68 rp
15 83 rp
PGC raw score 7 67 rp
15 83 rp
Grammar task English 7 59 r 0.302p 0.020
15 83 r !0.215p 0.051
Grammar task Welsh 7 59 rp
15 83 r 0.234 0.320 !0.286p 0.033 0.003 0.009
642 V.C.M. Gathercole et al.D
ownl
oade
d by
[Flo
rida
Inte
rnat
iona
l Uni
vers
ity] a
t 09:
11 2
1 O
ctob
er 2
013
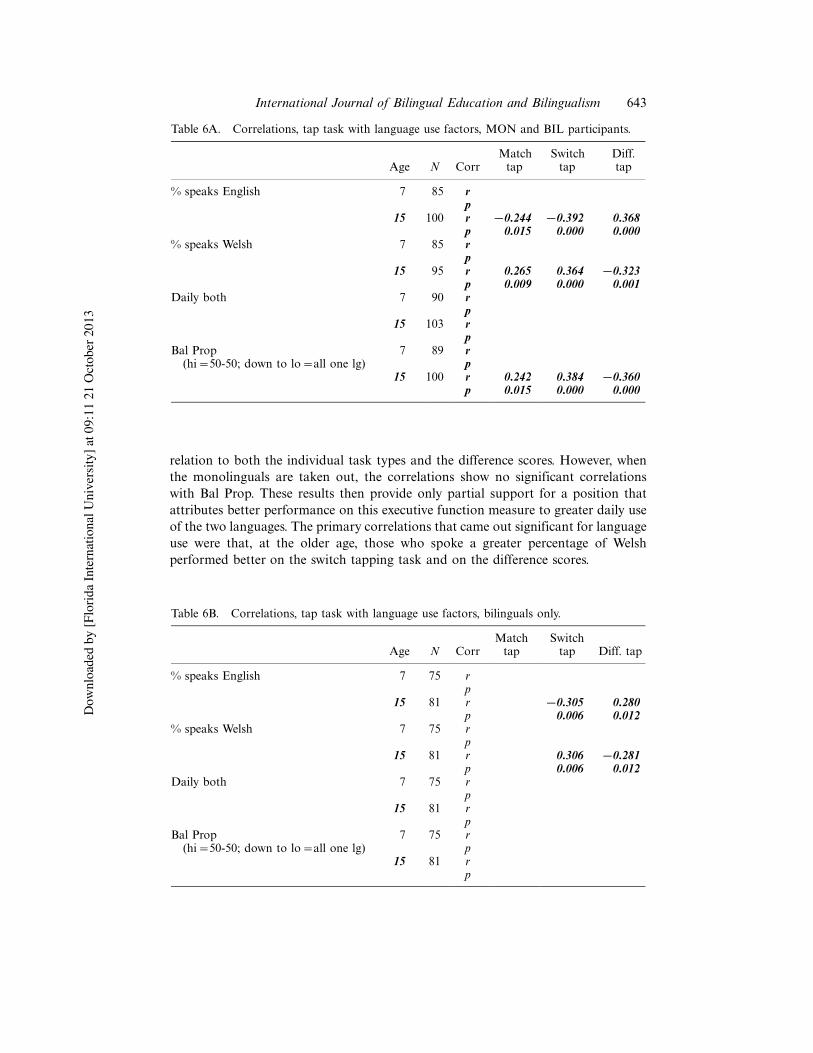
relation to both the individual task types and the difference scores. However, whenthe monolinguals are taken out, the correlations show no significant correlationswith Bal Prop. These results then provide only partial support for a position thatattributes better performance on this executive function measure to greater daily useof the two languages. The primary correlations that came out significant for languageuse were that, at the older age, those who spoke a greater percentage of Welshperformed better on the switch tapping task and on the difference scores.
Table 6A. Correlations, tap task with language use factors, MON and BIL participants.
Age N CorrMatchtap
Switchtap
Diff.tap
% speaks English 7 85 rp
15 100 r !0.244 !0.392 0.368p 0.015 0.000 0.000
% speaks Welsh 7 85 rp
15 95 r 0.265 0.364 !0.323p 0.009 0.000 0.001
Daily both 7 90 rp
15 103 rp
Bal Prop 7 89 r(hi"50-50; down to lo"all one lg) p
15 100 r 0.242 0.384 !0.360p 0.015 0.000 0.000
Table 6B. Correlations, tap task with language use factors, bilinguals only.
Age N CorrMatchtap
Switchtap Diff. tap
% speaks English 7 75 rp
15 81 r !0.305 0.280p 0.006 0.012
% speaks Welsh 7 75 rp
15 81 r 0.306 !0.281p 0.006 0.012
Daily both 7 75 rp
15 81 rp
Bal Prop 7 75 r(hi"50-50; down to lo"all one lg) p
15 81 rp
International Journal of Bilingual Education and Bilingualism 643D
ownl
oade
d by
[Flo
rida
Inte
rnat
iona
l Uni
vers
ity] a
t 09:
11 2
1 O
ctob
er 2
013
Summary, non-linguality factors and tapping
In summary, these additional measures suggest minimal contribution of socio-economic level to the tapping performance, a high degree of association with generalnumber abilities and pattern discrimination abilities, and superior performanceamong those bilinguals who began Welsh earlier and English later and who speak ahigh percentage of Welsh. The latter effect corresponds to what was found in theinitial analyses, which indicated superior performance among the children comingfrom OWH homes. We will explore this result below.
Stroop task
Similar correlational analyses were conducted for the Stroop data, in relation to eachage group and language tested.
SES
Table 7 shows the significant correlations between each of the four conditions and theSES factors of parental education and professions. The correlations in relation tonumber correct and to reaction time measures are included, as well as correlationsrelated to the difference scores (control task C vs. Stroop task B). Table 7A shows theresults for all participants, both monolinguals and bilinguals; Table 7B shows theresults for bilinguals only.
The significant correlations obtained in relation to socio-economic level aresomewhat scattered across the individual conditions for correct performance andreaction times, and only a couple of these have to do with performance on conditionB, the Stroop condition. However, a somewhat more robust correlational pattern isseen in relation to the difference scores, both number correct and reaction times.Significant correlations were found in at least one case for each SES factor, especiallywhen all participants are included in the analyses; when only the bilinguals areconsidered, some of these remain in relation to the mother’s profession. Thus, forSES, there is some evidence of a contribution to Stroop perfomance, more for thewhole group than for the bilinguals. But even there it is relevant that for the primaryage children, difference correct scores correlate with the mother’s profession, and forthe teens, reaction times for the Stroop condition B in English correlate with thefather’s profession.
General cognitive abilities
Correlations involving performance on the McCarthy and the Raven’s scales relativeto performance on the Stroop tasks are shown in Tables 8A and 8B, all participantsand bilinguals only, respectively. Significant correlations were found for a number ofthe measures, but these related mostly to performance on the two control tasks, Cand D, both for number correct and reaction times.
The one exception to this is that performance on the Raven’s correlated highlyboth with correct performance by the primary age children on the English B and Dtasks, as well as the difference correct scores, and with the reaction times in allconditions by the teens on the English tasks. These correlations suggest a
644 V.C.M. Gathercole et al.D
ownl
oade
d by
[Flo
rida
Inte
rnat
iona
l Uni
vers
ity] a
t 09:
11 2
1 O
ctob
er 2
013
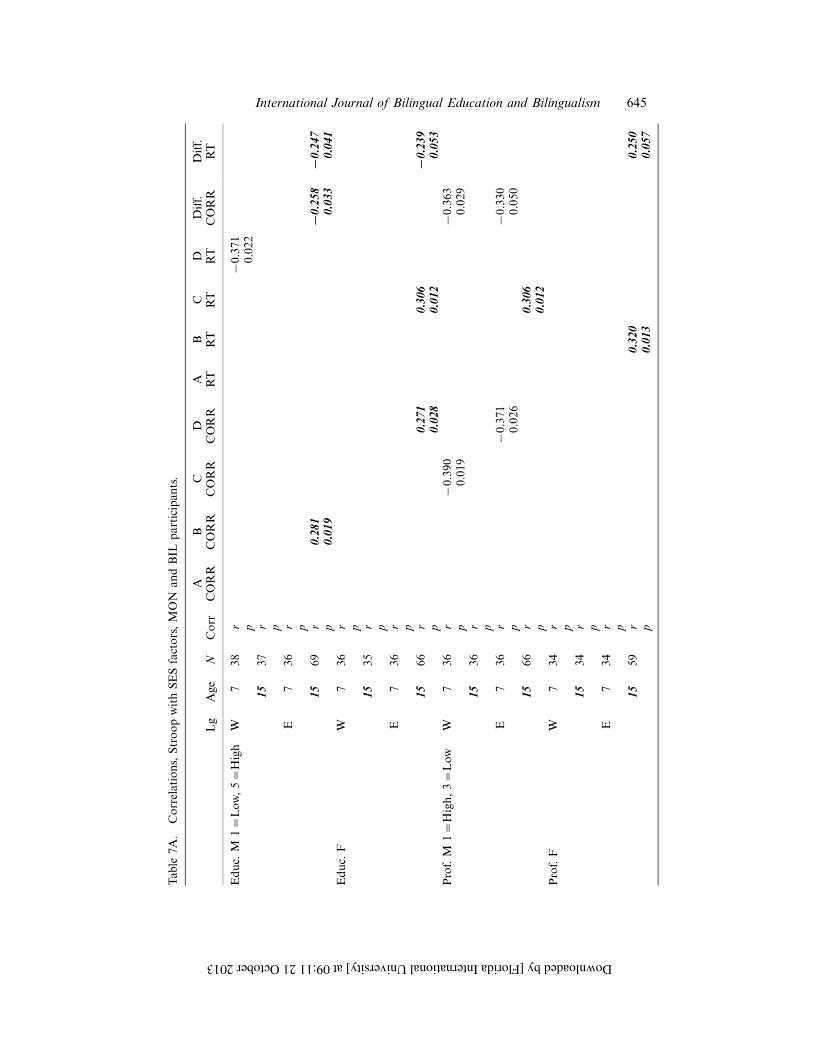
Table
7A.
Correlations,StroopwithSESfactors,MON
andBIL
participan
ts.
Lg
Age
NCorr
ACORR
BCORR
CCORR
DCORR
A RT
B RT
C RT
D RT
Diff.
CORR
Diff.
RT
Educ.
M1"Low,5"High
W7
38r
%0.37
1p
0.02
215
37r p
E7
36r p
1569
r0.28
1!0.25
8!0.24
7p
0.01
90.03
30.04
1Educ.
FW
736
r p15
35r p
E7
36r p
1566
r0.27
10.30
6!0.23
9p
0.02
80.01
20.05
3Prof.M
1"High,3"Low
W7
36r
%0.39
0%0.36
3p
0.01
90.02
915
36r p
E7
36r
%0.37
1%0.33
0p
0.02
60.05
015
66r
0.30
6p
0.01
2Prof.F
W7
34r p
1534
r pE
734
r p15
59r
0.32
00.25
0p
0.01
30.05
7
International Journal of Bilingual Education and Bilingualism 645
Downloaded by [Florida International University] at 09:11 21 October 2013
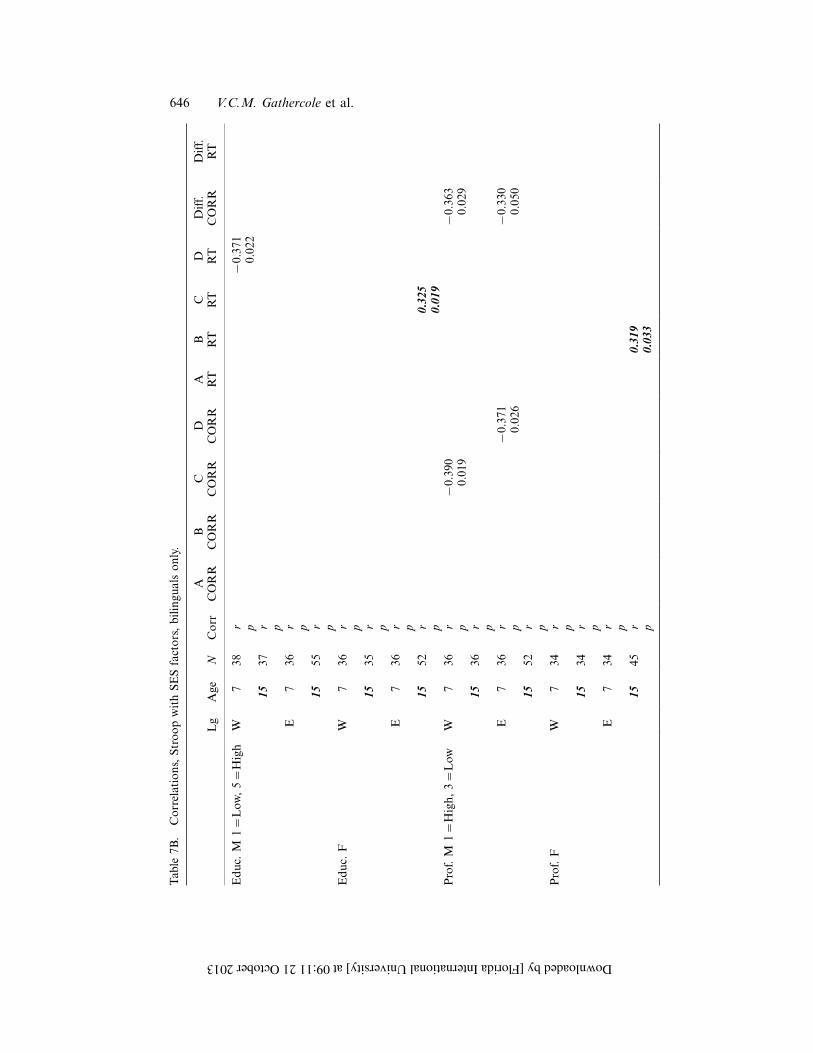
Table
7B.
Correlations,StroopwithSESfactors,bilingu
alsonly.
Lg
Age
NCorr
ACORR
BCORR
CCORR
DCORR
A RT
B RT
C RT
D RT
Diff.
CORR
Diff.
RT
Educ.
M1"Low,5"High
W7
38r
%0.37
1p
0.02
215
37r p
E7
36r p
1555
r pEduc.
FW
736
r p15
35r p
E7
36r p
1552
r0.32
5p
0.01
9Prof.M
1"High,3"Low
W7
36r
%0.39
0%0.36
3p
0.01
90.02
915
36r p
E7
36r
%0.37
1%0.33
0p
0.02
60.05
015
52r p
Prof.F
W7
34r p
1534
r pE
734
r p15
45r
0.31
9p
0.03
3
646 V.C.M. Gathercole et al.
Downloaded by [Florida International University] at 09:11 21 October 2013
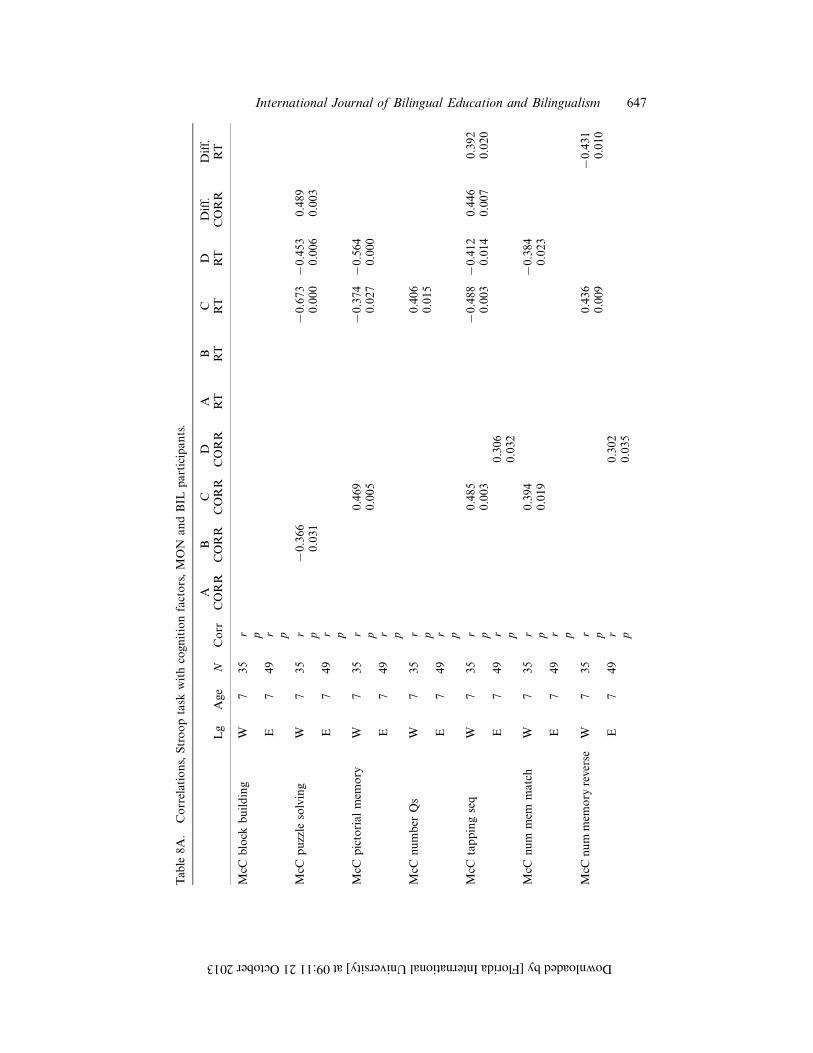
Table
8A.
Correlations,Strooptask
withcogn
itionfactors,MON
andBIL
participan
ts.
Lg
Age
NCorr
ACORR
BCORR
CCORR
DCORR
A RT
B RT
C RT
D RT
Diff.
CORR
Diff.
RT
McC
block
building
W7
35r p
E7
49r p
McC
puzzle
solving
W7
35r
%0.36
6%0.67
3%0.45
30.48
9p
0.03
10.00
00.00
60.00
3E
749
r p
McC
pictorial
mem
ory
W7
35r
0.46
9%0.37
4%0.56
4p
0.00
50.02
70.00
0E
749
r p
McC
number
Qs
W7
35r
0.40
6p
0.01
5E
749
r p
McC
tappingseq
W7
35r
0.48
5%0.48
8%0.41
20.44
60.39
2p
0.00
30.00
30.01
40.00
70.02
0E
749
r0.30
6p
0.03
2
McC
num
mem
match
W7
35r
0.39
4%0.38
4p
0.01
90.02
3E
749
r p
McC
num
mem
ory
reverse
W7
35r
0.43
6%0.43
1p
0.00
90.01
0E
749
r0.30
2p
0.03
5
International Journal of Bilingual Education and Bilingualism 647
Downloaded by [Florida International University] at 09:11 21 October 2013
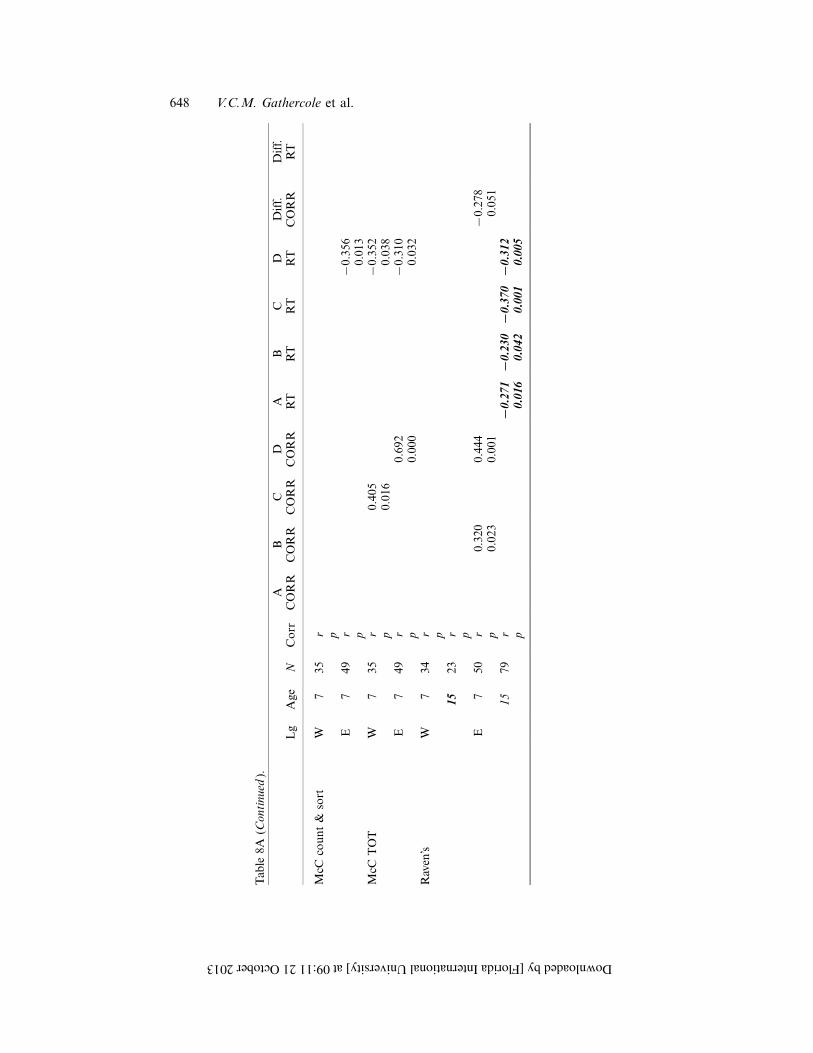
Table
8A(C
ontinu
ed).
Lg
Age
NCorr
ACORR
BCORR
CCORR
DCORR
A RT
B RT
C RT
D RT
Diff.
CORR
Diff.
RT
McC
count&
sort
W7
35r p
E7
49r
%0.35
6p
0.01
3McC
TOT
W7
35r
0.40
5%0.35
2p
0.01
60.03
8E
749
r0.69
2%0.31
0p
0.00
00.03
2Raven’s
W7
34r p
1523
r pE
750
r0.32
00.44
4%0.27
8p
0.02
30.00
10.05
115
79r
!0.27
1!0.23
0!0.37
0!0.31
2p
0.01
60.04
20.00
10.00
5
648 V.C.M. Gathercole et al.
Downloaded by [Florida International University] at 09:11 21 October 2013
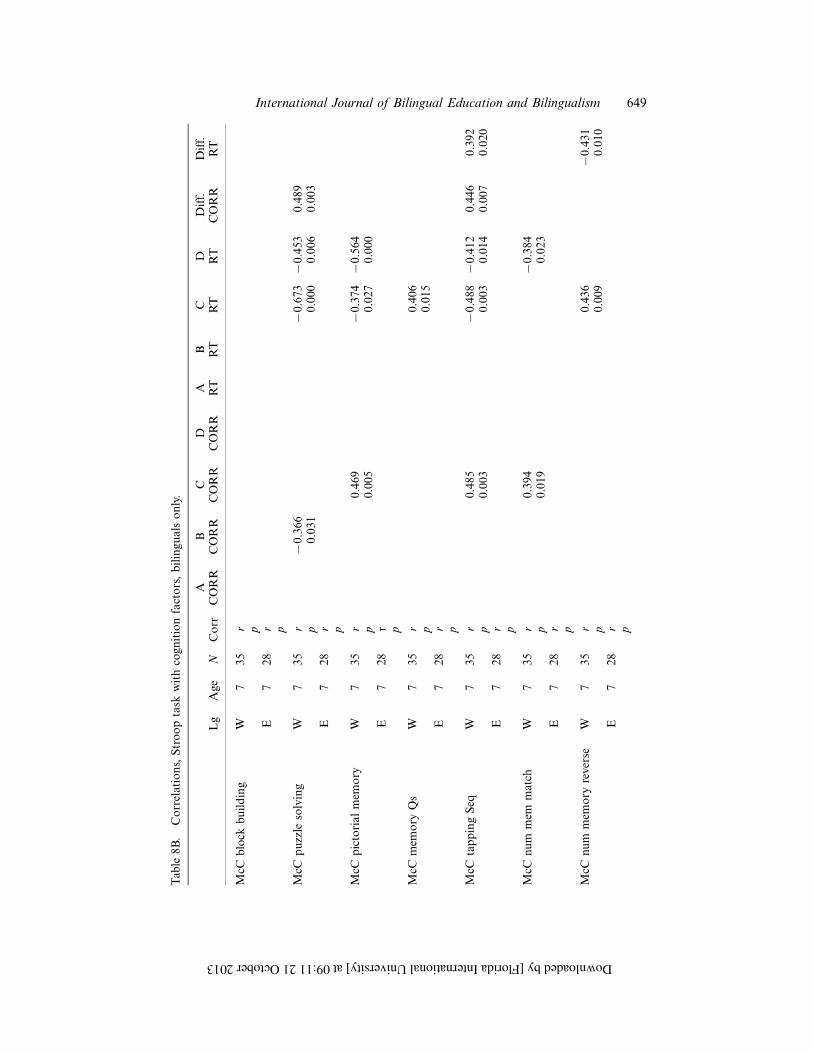
Table
8B.
Correlations,Strooptask
withcogn
itionfactors,bilingu
alsonly.
Lg
Age
NCorr
ACORR
BCORR
CCORR
DCORR
A RT
B RT
C RT
D RT
Diff.
CORR
Diff.
RT
McC
block
building
W7
35r p
E7
28r p
McC
puzzle
solving
W7
35r
%0.36
6%0.67
3%0.45
30.48
9p
0.03
10.00
00.00
60.00
3E
728
r p
McC
pictorial
mem
ory
W7
35r
0.46
9%0.37
4%0.56
4p
0.00
50.02
70.00
0E
728
r p
McC
mem
ory
Qs
W7
35r
0.40
6p
0.01
5E
728
r p
McC
tappingSeq
W7
35r
0.48
5%0.48
8%0.41
20.44
60.39
2p
0.00
30.00
30.01
40.00
70.02
0E
728
r p
McC
num
mem
match
W7
35r
0.39
4%0.38
4p
0.01
90.02
3E
728
r p
McC
num
mem
ory
reverse
W7
35r
0.43
6%0.43
1p
0.00
90.01
0E
728
r p
International Journal of Bilingual Education and Bilingualism 649
Downloaded by [Florida International University] at 09:11 21 October 2013
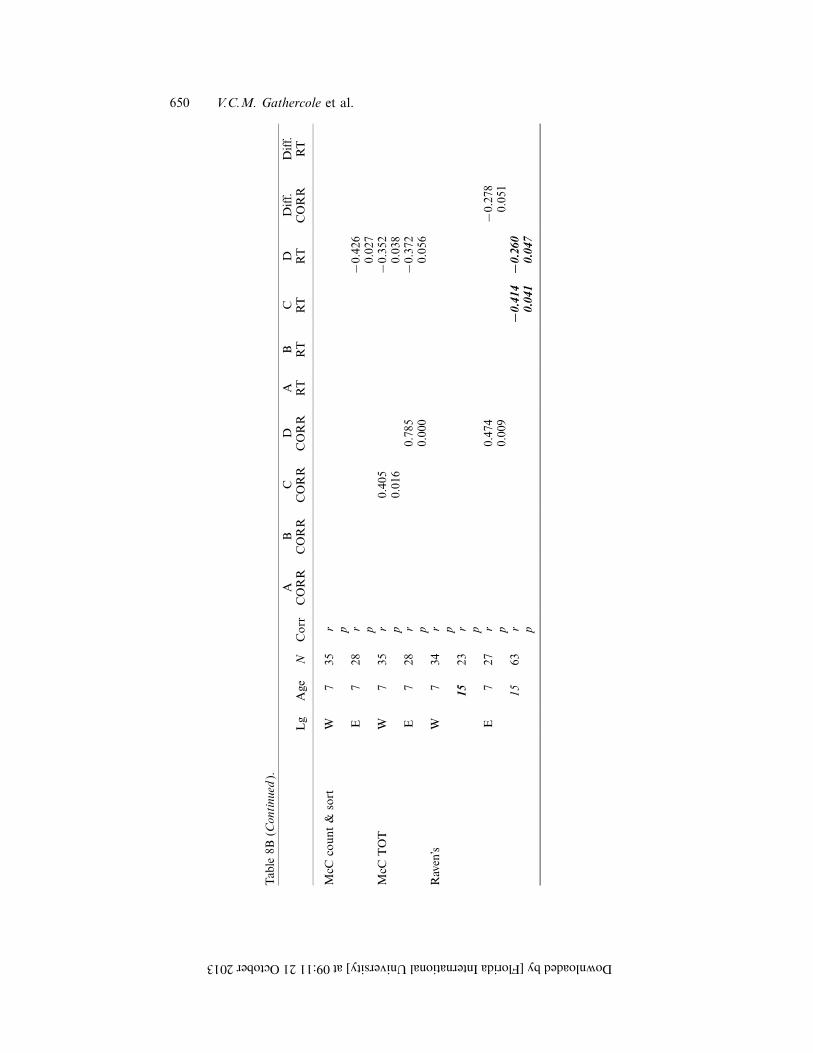
Table
8B(C
ontinu
ed).
Lg
Age
NCorr
ACORR
BCORR
CCORR
DCORR
A RT
B RT
C RT
D RT
Diff.
CORR
Diff.
RT
McC
count&
sort
W7
35r p
E7
28r
%0.42
6p
0.02
7McC
TOT
W7
35r
0.40
5%0.35
2p
0.01
60.03
8E
728
r0.78
5%0.37
2p
0.00
00.05
6Raven’s
W7
34r p
1523
r pE
727
r0.47
4%0.27
8p
0.00
90.05
115
63r
!0.41
4!0.26
0p
0.04
10.04
7
650 V.C.M. Gathercole et al.
Downloaded by [Florida International University] at 09:11 21 October 2013
contribution of general cognitive abilities to performance on the Stroop tasks ingeneral, as well as the B condition, the Stroop condition.
Language
Correlations between the language factors and performance on the Stroop are shownin Tables 9A and 9B, for all participants and only bilinguals, respectively.
For those participants tested in Welsh, neither home language group nor age atwhich the child began speaking English or Welsh was significant. For those tested inEnglish, home language and age at which the child began speaking English correlatednegatively with correct responding in a few cases, especially in relation to conditionD. This corresponds with the low performance already reported above for the OWHchildren in that condition.
Results for the vocabulary and grammar measures show quite a robustcorrelation between these and performance. For correct responding, they correlatemostly with performance on the control conditions, C and D. But for reaction timemeasures, they correlate about equally across the four conditions, whether we look atall participants (Table 9A) or only bilinguals (Table 9B). This is especially the casewhen considering vocabulary scores: high vocabulary ! in either language ! correlateswith lower reaction times. (Vocabulary did not, however, correlate highly with thedifference scores.) These results suggest a contribution of language ability per se toperformance on the Stroop tasks.
Language use
Correlations between language use and performance on the Stroop are shown inTables 10A and 10B, for all participants and for bilinguals only, respectively.
First, for children tested in Welsh, the primary age performance shows nocorrelations with language use, for either all children or for the bilinguals alone. Forthe teens, however, high performance on the Stroop correlated with a higherpercentage of use of English and a lower percentage of use of Welsh. This wasespecially true in conditions B and D. That is, those who speak more English and lessWelsh performed better in these tasks. This is at first counter-intuitive, since onemight not expect performance on the Welsh Stroop to correlate with use of Englishmore than use of Welsh. However, when these results are seen in the light of theadditional correlation of performance with a higher balance of usage of the twolanguages, then the results can be seen as indicating that those with less use ofEnglish and more use of Welsh are the least balanced in usage of the bilinguals.
The distribution of patterns of performance by per cent use of English and Welshis shown in Figures 8 and 9. In Figure 8A, correct responses in the B and Dconditions are shown by per cent use of English and Welsh; in Figure 8B, the correctdifference scores are plotted against per cent usage. These Figures demonstratethat, especially on the B condition, as usage of the two languages nears 50/50usage, performance improves. In Figure 9 reaction times on the B and D conditionsare plotted against per cent usage of English and Welsh, and, again, the graphsdemonstrate faster response times as usage nears 50/50.
For the children tested in English, the primary significant correlations occurred inthe case of the primary age children, rather than the teens. As for the Welsh results
International Journal of Bilingual Education and Bilingualism 651D
ownl
oade
d by
[Flo
rida
Inte
rnat
iona
l Uni
vers
ity] a
t 09:
11 2
1 O
ctob
er 2
013
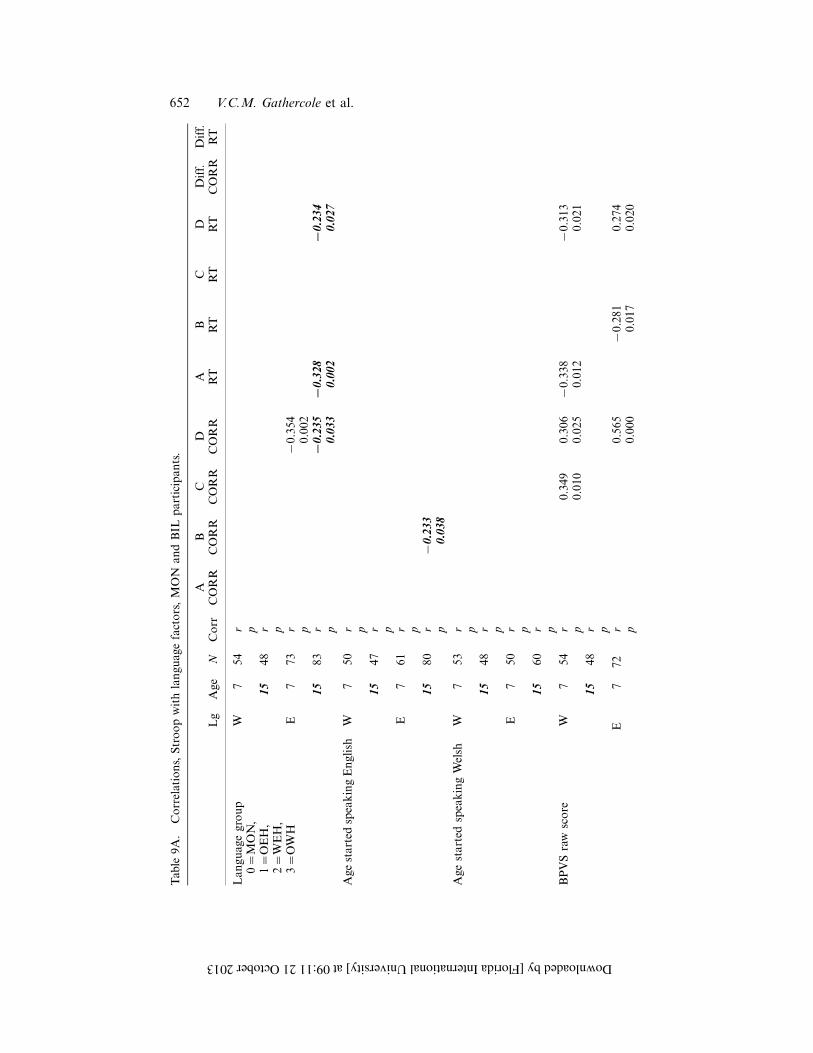
Table
9A.
Correlations,Stroopwithlangu
agefactors,MON
andBIL
participan
ts.
Lg
Age
NCorr
ACORR
BCORR
CCORR
DCORR
A RT
B RT
C RT
D RT
Diff.
CORR
Diff.
RT
Lan
guagegroup
W7
54r
0"MON,
p1"OEH,
1548
r2"WEH,
p3"OWH
E7
73r
%0.35
4p
0.00
215
83r
!0.23
5!0.32
8!0.23
4p
0.03
30.00
20.02
7
Age
startedspeakingEnglish
W7
50r p
1547
r pE
761
r p15
80r
%0.23
3p
0.03
8
Age
startedspeakingWelsh
W7
53r p
1548
r pE
750
r p15
60r p
BPVSraw
score
W7
54r
0.34
90.30
6%0.33
8%0.31
3p
0.01
00.02
50.01
20.02
115
48r p
E7
72r
0.56
5%0.28
10.27
4p
0.00
00.01
70.02
0
652 V.C.M. Gathercole et al.
Downloaded by [Florida International University] at 09:11 21 October 2013
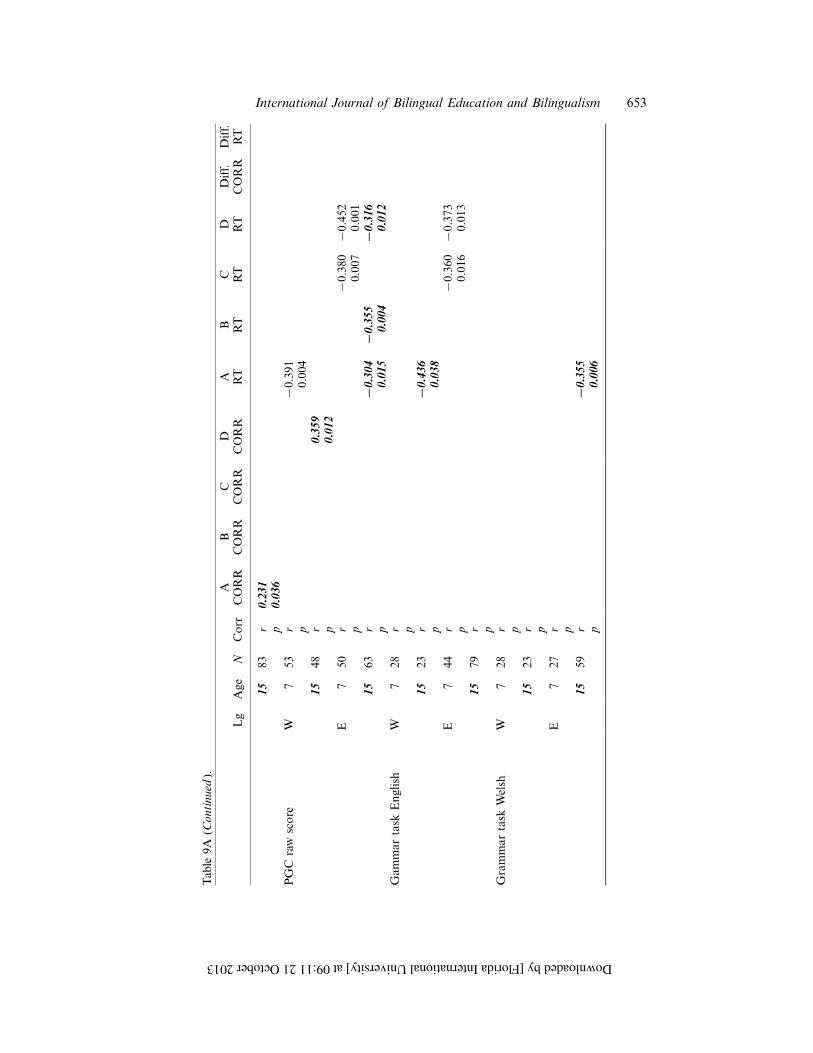
Table
9A(C
ontinu
ed).
Lg
Age
NCorr
ACORR
BCORR
CCORR
DCORR
A RT
B RT
C RT
D RT
Diff.
CORR
Diff.
RT
1583
r0.23
1p
0.03
6PGC
raw
score
W7
53r
%0.39
1p
0.00
415
48r
0.35
9p
0.01
2E
750
r%0.38
0%0.45
2p
0.00
70.00
115
63r
!0.30
4!0.35
5!0.31
6p
0.01
50.00
40.01
2Gam
mar
task
English
W7
28r p
1523
r!0.43
6p
0.03
8E
744
r%0.36
0%0.37
3p
0.01
60.01
315
79r p
Grammar
task
Welsh
W7
28r p
1523
r pE
727
r p15
59r
!0.35
5p
0.00
6
International Journal of Bilingual Education and Bilingualism 653
Downloaded by [Florida International University] at 09:11 21 October 2013

Table
9B.
Correlations,Stroopwithlangu
agefactors,bilingu
alsonly.
Lg
Age
NCorr
ACORR
BCORR
CCORR
DCORR
A RT
B RT
C RT
D RT
Diff.
CORR
Diff.
RT
Lan
guagegroup
W7
54r
0"MON,
p1"OEH,
1548
r2"WEH,
p3"OWH
E7
52r
%0.32
2%0.40
90.28
3p
0.02
00.00
30.04
215
63r p
Age
startedspeakingEnglish
W7
50r p
1547
r pE
747
r p15
60r
!0.27
3p
0.03
5
Age
startedspeakingWelsh
W7
53r p
1548
r pE
750
r p15
60r p
BPVSraw
score
W7
54r
0.34
90.30
60.33
8%0.31
3p
0.01
00.02
50.01
20.02
115
48r p
E7
51r
0.31
20.30
50.61
40.32
00.27
30.32
5p
0.02
60.03
00.00
00.02
20.05
30.02
0
654 V.C.M. Gathercole et al.
Downloaded by [Florida International University] at 09:11 21 October 2013
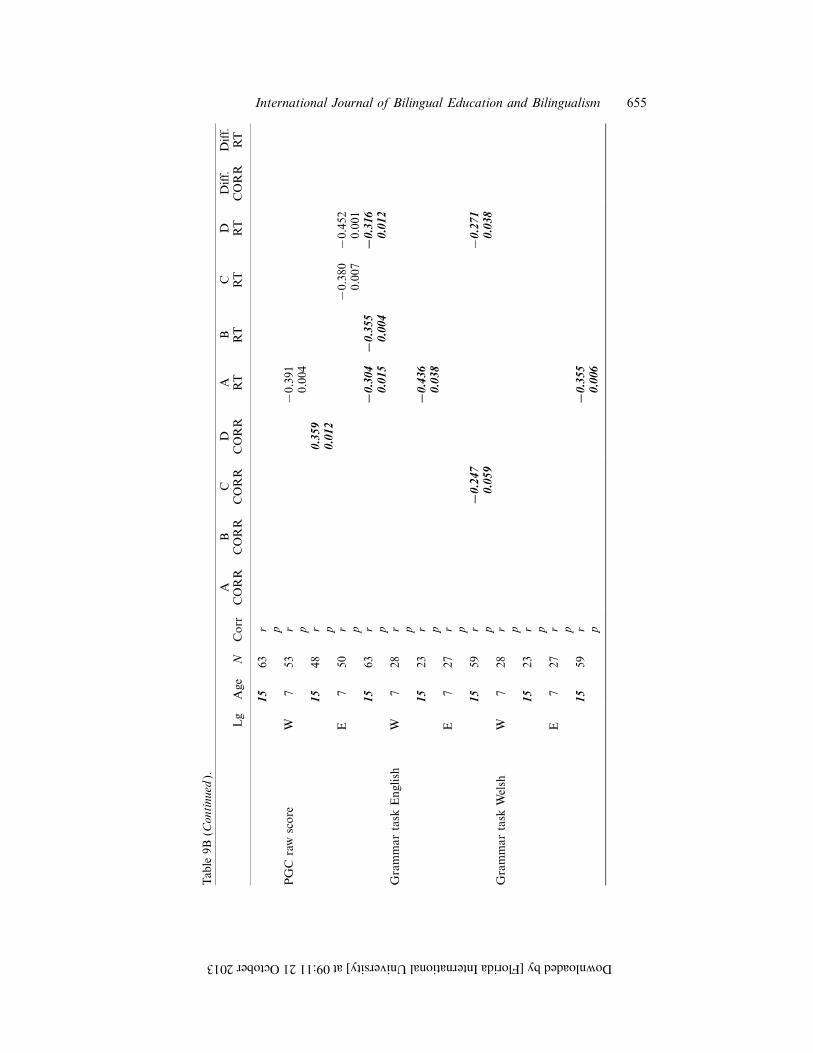
Table
9B(C
ontinu
ed).
Lg
Age
NCorr
ACORR
BCORR
CCORR
DCORR
A RT
B RT
C RT
D RT
Diff.
CORR
Diff.
RT
1563
r pPGC
raw
score
W7
53r
%0.39
1p
0.00
415
48r
0.35
9p
0.01
2E
750
r%0.38
0%0.45
2p
0.00
70.00
115
63r
!0.30
4!0.35
5!0.31
6p
0.01
50.00
40.01
2Grammar
task
English
W7
28r p
1523
r!0.43
6p
0.03
8E
727
r p15
59r
!0.24
7%0.27
1p
0.05
90.03
8Grammar
task
Welsh
W7
28r p
1523
r pE
727
r p15
59r
!0.35
5p
0.00
6
International Journal of Bilingual Education and Bilingualism 655
Downloaded by [Florida International University] at 09:11 21 October 2013
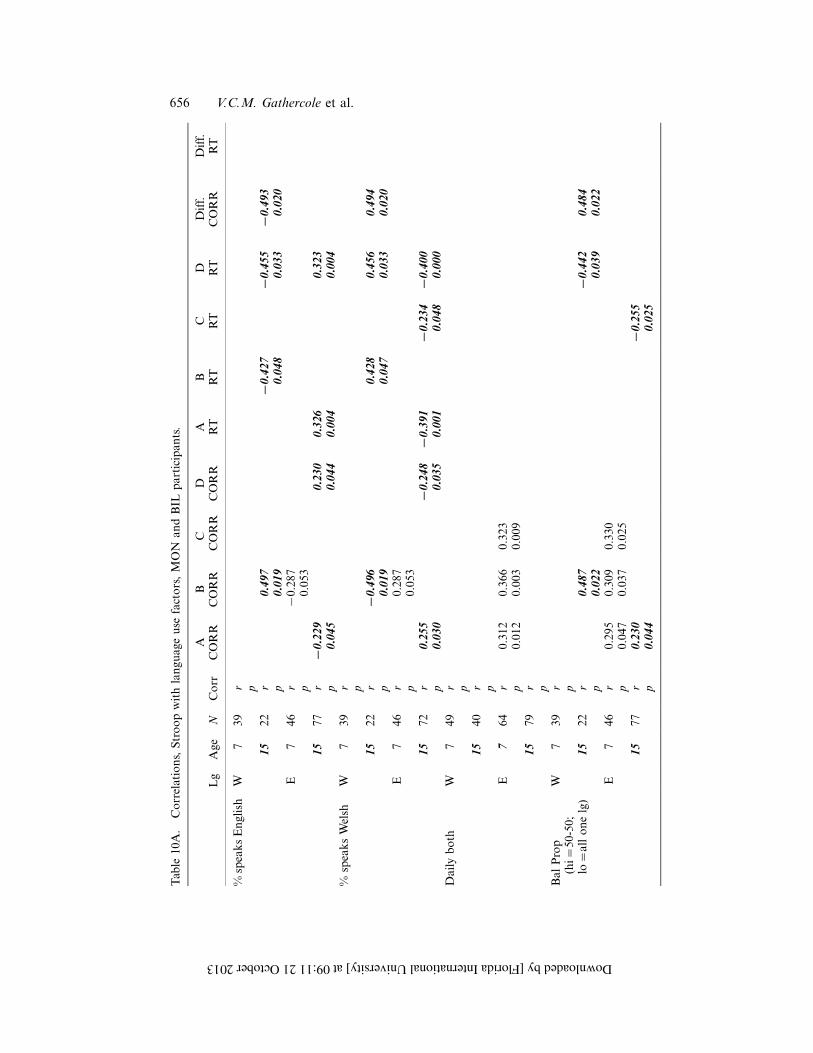
Table
10A.
Correlations,Stroopwithlangu
ageuse
factors,MON
andBIL
participan
ts.
Lg
Age
NCorr
ACORR
BCORR
CCORR
DCORR
A RT
B RT
C RT
D RT
Diff.
CORR
Diff.
RT
%speaksEnglish
W7
39r p
1522
r0.49
7!0.42
7!0.45
5!0.49
3p
0.01
90.04
80.03
30.02
0E
746
r%0.28
7p
0.05
315
77r
!0.22
90.23
00.32
60.32
3p
0.04
50.04
40.00
40.00
4%
speaksWelsh
W7
39r p
1522
r!0.49
60.42
80.45
60.49
4p
0.01
90.04
70.03
30.02
0E
746
r0.28
7p
0.05
315
72r
0.25
5!0.24
8!0.39
1!0.23
4!0.40
0p
0.03
00.03
50.00
10.04
80.00
0Daily
both
W7
49r p
1540
r pE
764
r0.31
20.36
60.32
3p
0.01
20.00
30.00
915
79r p
Bal
Prop
W7
39r
(hi"
50-50;
plo"allonelg)
1522
r0.48
7!0.44
20.48
4p
0.02
20.03
90.02
2E
746
r0.29
50.30
90.33
0p
0.04
70.03
70.02
515
77r
0.23
0!0.25
5p
0.04
40.02
5
656 V.C.M. Gathercole et al.
Downloaded by [Florida International University] at 09:11 21 October 2013
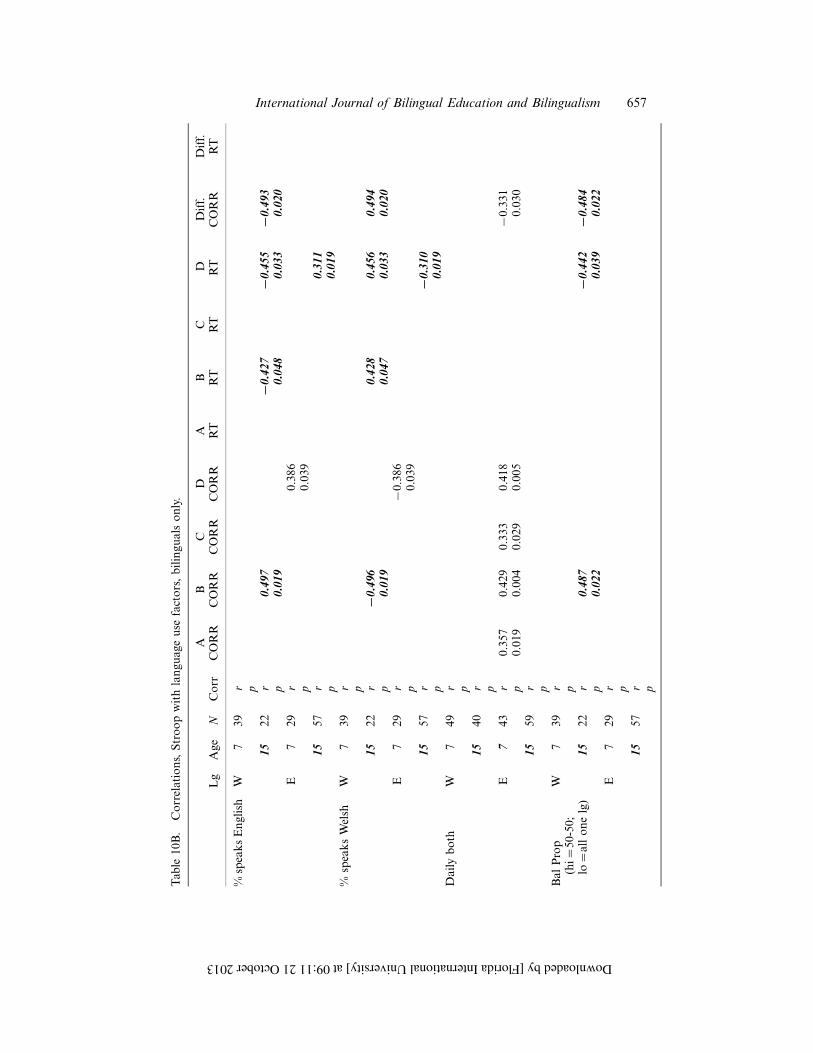
Table
10B.
Correlations,Stroopwithlangu
ageuse
factors,bilingu
alsonly.
Lg
Age
NCorr
ACORR
BCORR
CCORR
DCORR
A RT
B RT
C RT
D RT
Diff.
CORR
Diff.
RT
%speaksEnglish
W7
39r p
1522
r0.49
7!0.42
7!0.45
5!0.49
3p
0.01
90.04
80.03
30.02
0E
729
r0.38
6p
0.03
915
57r
0.31
1p
0.01
9%
speaksWelsh
W7
39r p
1522
r!0.49
60.42
80.45
60.49
4p
0.01
90.04
70.03
30.02
0E
729
r%0.38
6p
0.03
915
57r
!0.31
0p
0.01
9Daily
both
W7
49r p
1540
r pE
743
r0.35
70.42
90.33
30.41
8%0.33
1p
0.01
90.00
40.02
90.00
50.03
015
59r p
Bal
Prop
W7
39r
(hi"
50-50;
plo"allonelg)
1522
r0.48
7!0.44
2!0.48
4p
0.02
20.03
90.02
2E
729
r p15
57r p
International Journal of Bilingual Education and Bilingualism 657
Downloaded by [Florida International University] at 09:11 21 October 2013
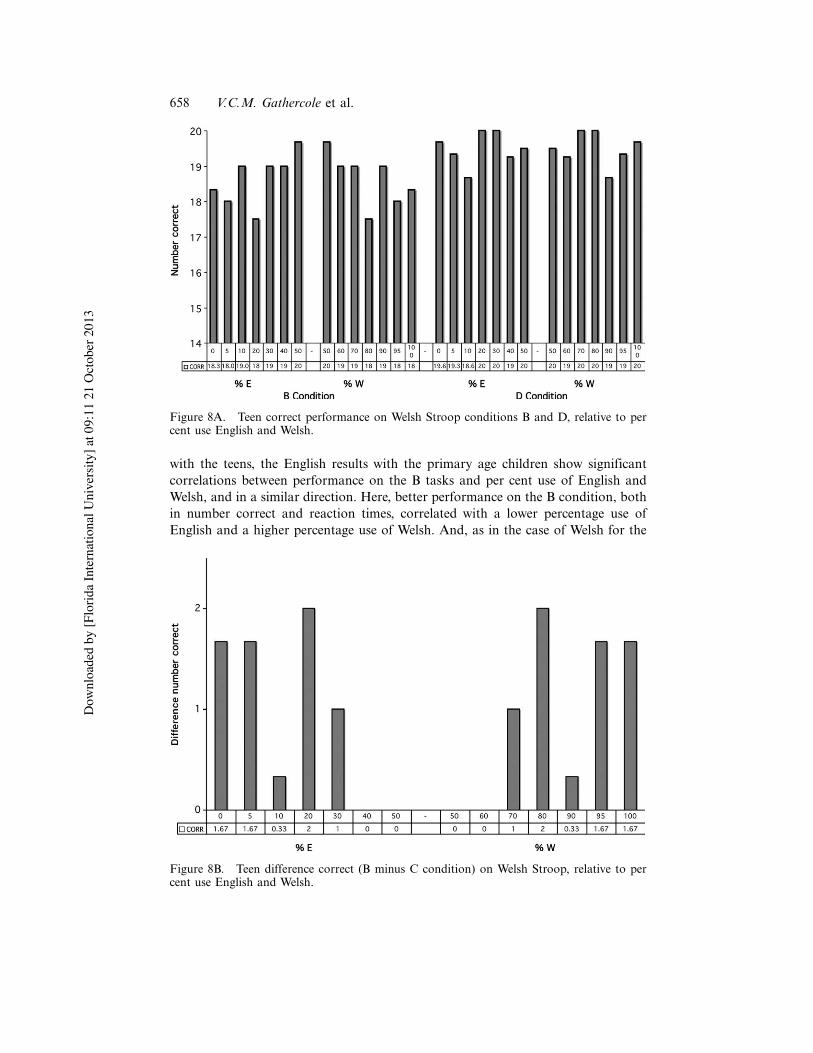
with the teens, the English results with the primary age children show significantcorrelations between performance on the B tasks and per cent use of English andWelsh, and in a similar direction. Here, better performance on the B condition, bothin number correct and reaction times, correlated with a lower percentage use ofEnglish and a higher percentage use of Welsh. And, as in the case of Welsh for the
Figure 8A. Teen correct performance on Welsh Stroop conditions B and D, relative to percent use English and Welsh.
Figure 8B. Teen difference correct (B minus C condition) on Welsh Stroop, relative to percent use English and Welsh.
658 V.C.M. Gathercole et al.D
ownl
oade
d by
[Flo
rida
Inte
rnat
iona
l Uni
vers
ity] a
t 09:
11 2
1 O
ctob
er 2
013
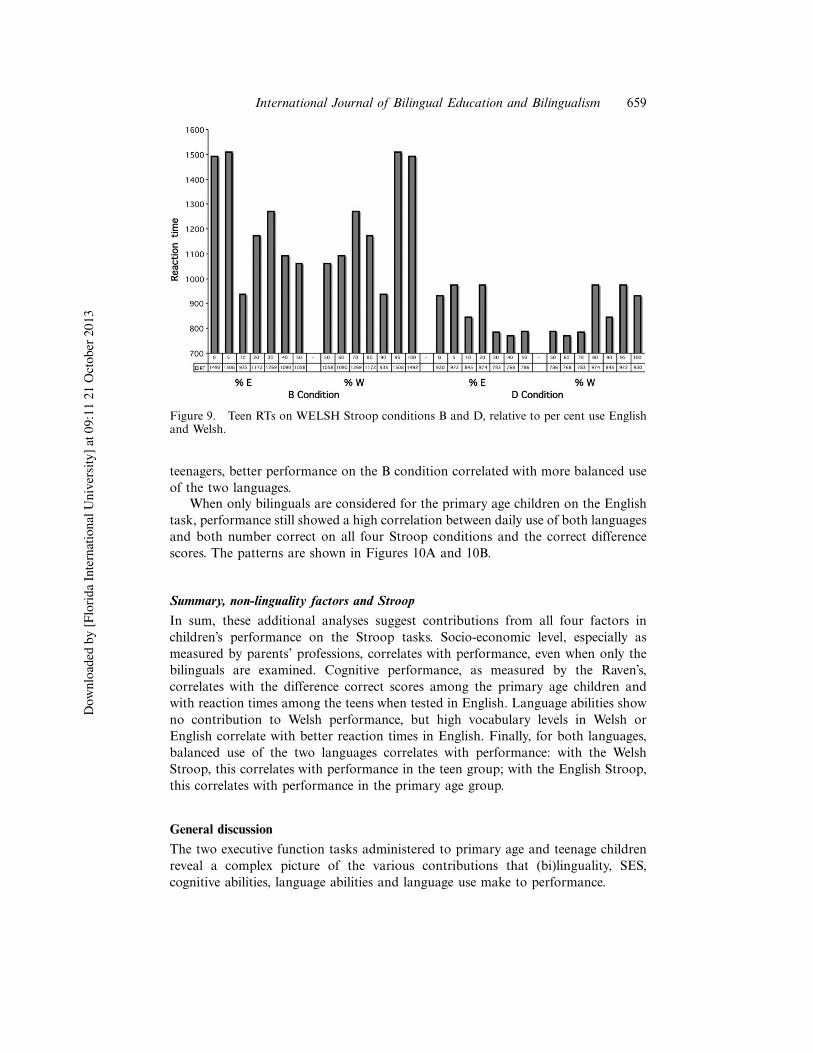
teenagers, better performance on the B condition correlated with more balanced useof the two languages.
When only bilinguals are considered for the primary age children on the Englishtask, performance still showed a high correlation between daily use of both languagesand both number correct on all four Stroop conditions and the correct differencescores. The patterns are shown in Figures 10A and 10B.
Summary, non-linguality factors and Stroop
In sum, these additional analyses suggest contributions from all four factors inchildren’s performance on the Stroop tasks. Socio-economic level, especially asmeasured by parents’ professions, correlates with performance, even when only thebilinguals are examined. Cognitive performance, as measured by the Raven’s,correlates with the difference correct scores among the primary age children andwith reaction times among the teens when tested in English. Language abilities showno contribution to Welsh performance, but high vocabulary levels in Welsh orEnglish correlate with better reaction times in English. Finally, for both languages,balanced use of the two languages correlates with performance: with the WelshStroop, this correlates with performance in the teen group; with the English Stroop,this correlates with performance in the primary age group.
General discussion
The two executive function tasks administered to primary age and teenage childrenreveal a complex picture of the various contributions that (bi)linguality, SES,cognitive abilities, language abilities and language use make to performance.
Figure 9. Teen RTs on WELSH Stroop conditions B and D, relative to per cent use Englishand Welsh.
International Journal of Bilingual Education and Bilingualism 659D
ownl
oade
d by
[Flo
rida
Inte
rnat
iona
l Uni
vers
ity] a
t 09:
11 2
1 O
ctob
er 2
013
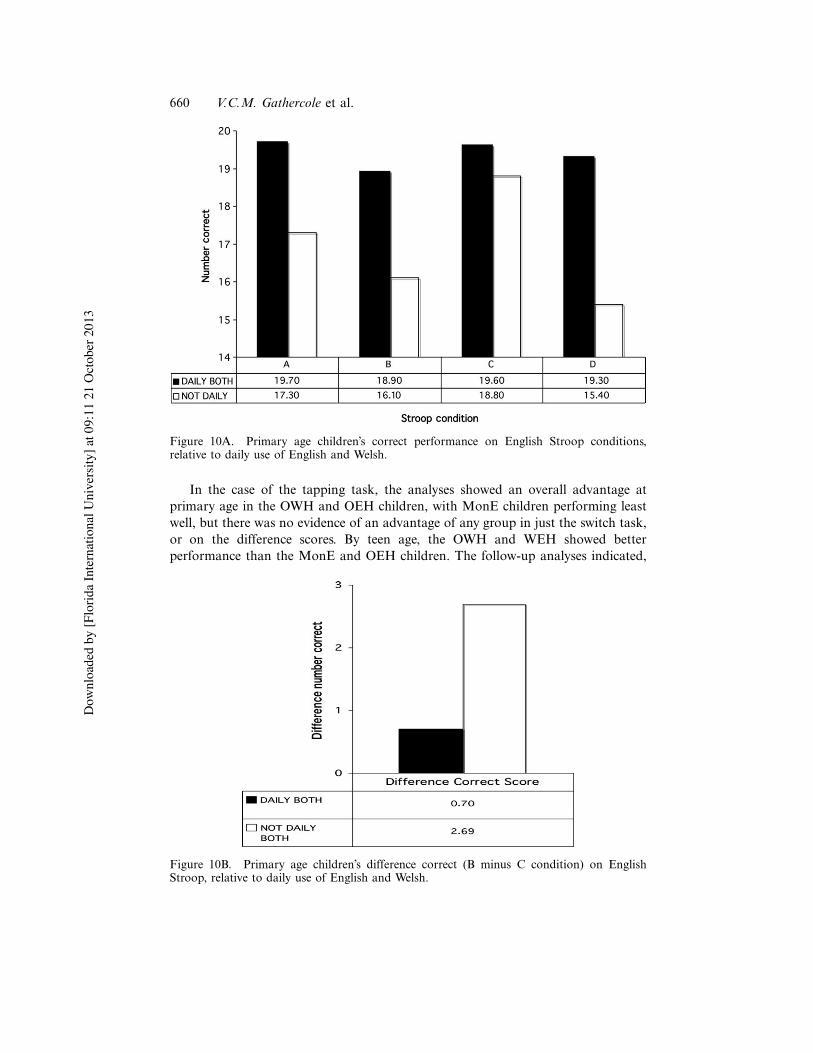
In the case of the tapping task, the analyses showed an overall advantage atprimary age in the OWH and OEH children, with MonE children performing leastwell, but there was no evidence of an advantage of any group in just the switch task,or on the difference scores. By teen age, the OWH and WEH showed betterperformance than the MonE and OEH children. The follow-up analyses indicated,
Figure 10A. Primary age children’s correct performance on English Stroop conditions,relative to daily use of English and Welsh.
Figure 10B. Primary age children’s difference correct (B minus C condition) on EnglishStroop, relative to daily use of English and Welsh.
660 V.C.M. Gathercole et al.D
ownl
oade
d by
[Flo
rida
Inte
rnat
iona
l Uni
vers
ity] a
t 09:
11 2
1 O
ctob
er 2
013
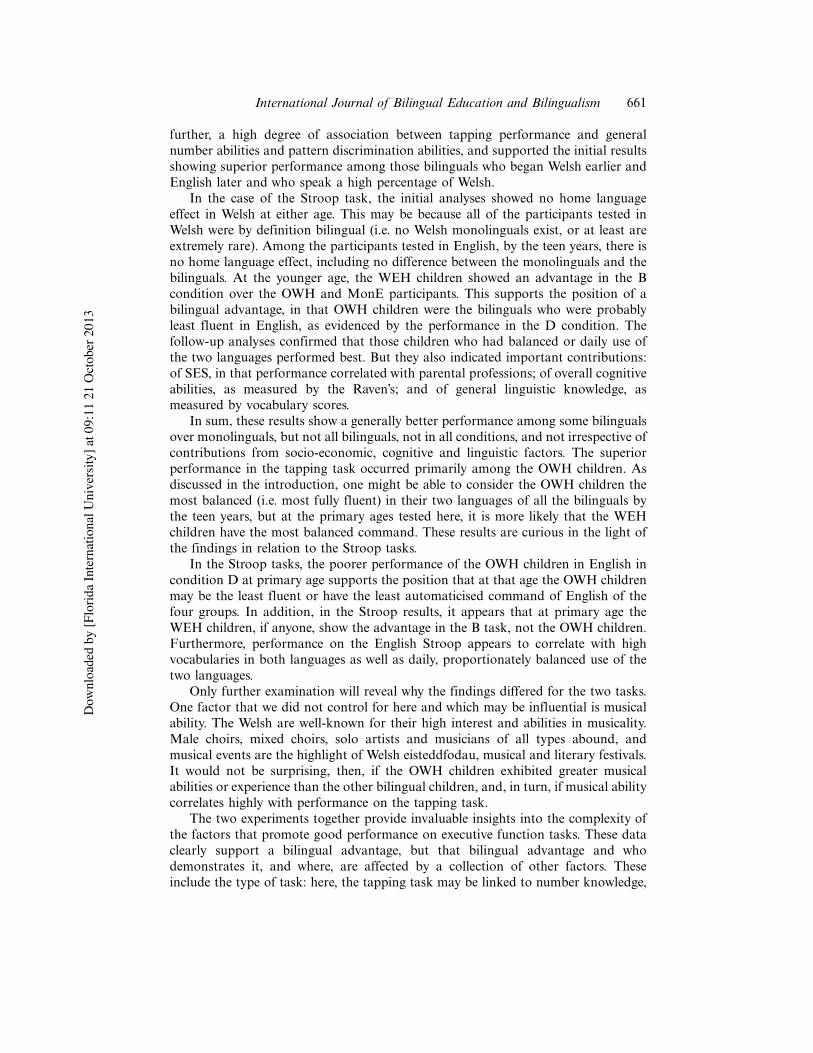
further, a high degree of association between tapping performance and generalnumber abilities and pattern discrimination abilities, and supported the initial resultsshowing superior performance among those bilinguals who began Welsh earlier andEnglish later and who speak a high percentage of Welsh.
In the case of the Stroop task, the initial analyses showed no home languageeffect in Welsh at either age. This may be because all of the participants tested inWelsh were by definition bilingual (i.e. no Welsh monolinguals exist, or at least areextremely rare). Among the participants tested in English, by the teen years, there isno home language effect, including no difference between the monolinguals and thebilinguals. At the younger age, the WEH children showed an advantage in the Bcondition over the OWH and MonE participants. This supports the position of abilingual advantage, in that OWH children were the bilinguals who were probablyleast fluent in English, as evidenced by the performance in the D condition. Thefollow-up analyses confirmed that those children who had balanced or daily use ofthe two languages performed best. But they also indicated important contributions:of SES, in that performance correlated with parental professions; of overall cognitiveabilities, as measured by the Raven’s; and of general linguistic knowledge, asmeasured by vocabulary scores.
In sum, these results show a generally better performance among some bilingualsover monolinguals, but not all bilinguals, not in all conditions, and not irrespective ofcontributions from socio-economic, cognitive and linguistic factors. The superiorperformance in the tapping task occurred primarily among the OWH children. Asdiscussed in the introduction, one might be able to consider the OWH children themost balanced (i.e. most fully fluent) in their two languages of all the bilinguals bythe teen years, but at the primary ages tested here, it is more likely that the WEHchildren have the most balanced command. These results are curious in the light ofthe findings in relation to the Stroop tasks.
In the Stroop tasks, the poorer performance of the OWH children in English incondition D at primary age supports the position that at that age the OWH childrenmay be the least fluent or have the least automaticised command of English of thefour groups. In addition, in the Stroop results, it appears that at primary age theWEH children, if anyone, show the advantage in the B task, not the OWH children.Furthermore, performance on the English Stroop appears to correlate with highvocabularies in both languages as well as daily, proportionately balanced use of thetwo languages.
Only further examination will reveal why the findings differed for the two tasks.One factor that we did not control for here and which may be influential is musicalability. The Welsh are well-known for their high interest and abilities in musicality.Male choirs, mixed choirs, solo artists and musicians of all types abound, andmusical events are the highlight of Welsh eisteddfodau, musical and literary festivals.It would not be surprising, then, if the OWH children exhibited greater musicalabilities or experience than the other bilingual children, and, in turn, if musical abilitycorrelates highly with performance on the tapping task.
The two experiments together provide invaluable insights into the complexity ofthe factors that promote good performance on executive function tasks. These dataclearly support a bilingual advantage, but that bilingual advantage and whodemonstrates it, and where, are affected by a collection of other factors. Theseinclude the type of task: here, the tapping task may be linked to number knowledge,
International Journal of Bilingual Education and Bilingualism 661D
ownl
oade
d by
[Flo
rida
Inte
rnat
iona
l Uni
vers
ity] a
t 09:
11 2
1 O
ctob
er 2
013
pattern discrimination abilities, and musical abilities; the Stroop task involveslanguage directly and indirectly, as it entails literacy. The former, then, was influencedby such cognitive abilities as number knowledge; the latter by linguistic abilities likevocabulary, as well as which language the Stroop was administered in. Beyond thesecognitive and linguistic factors, socio-economic level was also influential here in theStroop but not in the tapping task. Further research into cognitive effects ofbilingualism should take such factors into account in order to gain a deeperunderstanding of each of these factors.
Acknowledgements
This research was supported by ESRC grant RES-062-23-0175 on Cognitive effects ofbilingualism across the lifespan and by ESRC/HEFCW grant RES-535-30-0061 for the ESRCCentre for Research on Bilingualism in Theory and Practice, which we gratefully acknowledge.We also wish to express our thanks to all of the schools, parents and children who participatedin this work; without their very helpful cooperation this study could never have taken place.Thank you also to project students and research assistants who helped in data collection: CarysBlunt, Angela H. Clifford, Lowri Cunnington, Nikki Davies, Sinead Dolan, Susan D. Elliott,Katie Gibbins, Bethan Gritten, Lowri Hadden, Josselyn Hellriegel, Catherine L. Hogan, SiwanLong, Jason H. McEvoy, Sarah N. Pearce, Hannah Perryman, Emily Roberts, Sioned Roberts,Kathryn Sharp, Heather Shawcross, Lesley Waiting.
References
Ben-Zeev, S. 1977. Mechanisms by which childhood bilingualism affects understanding oflanguage and cognitive structures. In Bilingualism: Psychological, social, and educationalimplications, ed. P. Hornby, 29!55. New York: Academic Press.
Bialystok, E. 1988. Levels of bilingualism and levels of linguistic awareness. DevelopmentalPsychology 24, no. 4: 560!7.
Bialystok, E. 1993. Metalinguistic awareness: The development of children’s representations oflanguage. In Systems of representation in children: Development and use, ed. C. Pratt and A.Garton, 211!33. London: Wiley.
Bialystok, E. 1999. Cognitive complexity and attentional control in the bilingual mind. ChildDevelopment 70, no. 5: 636!44.
Bialystok, E. 2001. Bilingualism in development: Language, literacy, and cognition. New York:Cambridge University Press.
Bialystok, E., F. Craik, and G. Luk. 2008. Cognitive control and lexical access in younger andolder bilinguals. Journal of Experimental Psychology: Learning, Memory, and Cognition34, no. 4: 859!73.
Bialystok, E., F.I.M. Craik, R. Klein, and M. Viswanathan. 2004. Bilingualism, aging, andcognitive control: Evidence from the Simon task. Psychology and Aging 19, no. 2: 290!303.
Bialystok, E., and E.B. Ryan. 1985. Toward a definition of metalinguistic skill. Merrill PalmerQuarterly 31, no. 3: 229!51.
Blair, C., P.D. Zelazo, and M.T. Greenberg. 2005. The measurement of executive function inearly childhood. Developmental Neuropsychology 28, no. 2: 561!71.
Chen, H.-C., and C. Ho. 1986. Development of Stroop interference in Chinese!Englishbilinguals. Journal of Experimental Psychology: Learning, Memory, and Cognition 12, no. 3:397!401.
Cummins, J. 1976. The influence of bilingualism on cognitive growth: A synthesis of researchfindings and explanatory hypotheses. Working Papers on Bilingualism 9: 1!43.
Cummins, J. 1992. Bilingual education and English immersion: The Ramirez Report intheoretical perspective. Bilingual Research Journal 16, nos. 1!2: 91!104.
Dunn, L.M., L.M. Dunn, and C. Whetton. 1982. The British Picture Vocabulary Scale:Manual for the short and long forms. London: NFER-NELSON.
Frye, D., P.D. Zelazo, and T. Palfai. 1995. Theory of mind and rule-based reasoning. CognitiveDevelopment 10, no. 4: 483!527.
662 V.C.M. Gathercole et al.D
ownl
oade
d by
[Flo
rida
Inte
rnat
iona
l Uni
vers
ity] a
t 09:
11 2
1 O
ctob
er 2
013
Gathercole, V.C.M. 2002a. Command of the mass/count distinction in bilingual andmonolingual children: An English morphosyntactic distinction. In Language and literacyin bilingual children, ed. D.K. Oller and R.E. Eilers, 175!206. Clevedon, UK: MultilingualMatters.
Gathercole, V.C.M. 2002b. Grammatical gender in bilingual and monolingual children: ASpanish morphosyntactic distinction. In Language and literacy in bilingual children, ed.D.K. Oller and R.E. Eilers, 207!19. Clevedon, UK: Multilingual Matters.
Gathercole, V.C.M. 2002c. Monolingual and bilingual acquisition: Learning differenttreatments of that-trace phenomena in English and Spanish. In Language and literacy inbilingual children, ed. D.K. Oller and R.E. Eilers, 220!54. Clevedon, UK: MultilingualMatters.
Gathercole, V.C.M., ed. 2007a. Language transmission in bilingual families in Wales. Cardiff:Welsh Language Board.
Gathercole, V.C.M. 2007b. Miami and North Wales, so far and yet so near: Constructivistaccount of morpho-syntactic development in bilingual children. International Journal ofBilingual Education and Bilingualism 10, no. 3: 224!47.
Gathercole, V.C.M. 2010. Interface or face-to-face? The profiles and contours of bilinguals andspecific language impairment. Applied Psycholinguistics 31, no. 2: 58!69.
Gathercole, V.C.M., and E. Hoff. 2007. Input and the acquisition of language: Three questions.In The handbook of language development, ed. E. Hoff and M. Shatz, 107!27. New York:Blackwell.
Gathercole, V.C.M., N. Laporte, and E.M. Thomas. 2005. Differentiation, carry-over, andthe distributed characteristic in bilinguals: Structural ‘‘mixing’’ of the two languages? InISB4: Proceedings of the 4th International Symposium on Bilingualism, ed. J. Cohen, K.McAlister, K. Rolstad, and J. MacSwan, 838!51. Somerville, MA: Cascadilla Press.
Gathercole, V.C.M., and E.M. Thomas. 2005. Minority language survival: Input factorsinfluencing the acquisition of Welsh. In ISB4: Proceedings of the 4th InternationalSymposium on Bilingualism, ed. J. Cohen, K. McAlister, K. Rolstad, and J. MacSwan,852!74. Somerville, MA: Cascadilla Press.
Gathercole, V.C.M., and E.M. Thomas. 2007. Prawf Geirfa Cymraeg: Fersiwn 7!11 [WelshVocabulary Test: Version 7!11]. Bangor University. http://www.pgc.bangor.ac.uk.
Gathercole, V.C.M., and E.M. Thomas. 2009. Bilingual first-language development: Dominantlanguage takeover, threatened minority language take-up. Bilingualism: Language andCognition 12, no. 2: 213!37.
Gathercole, V.C.M., E.M. Thomas, and N. Laporte. 2001. The acquisition of grammaticalgender in Welsh. Journal of Celtic Language Learning 6: 53!87.
Gathercole, V.C.M., E.M. Thomas, and E.K. Hughes. In press. Prawf Geirfa Cymraeg: Fersiwn11!15 [Welsh Vocabulary Test: Version 11!15].
Genesee, F., J. Paradis, and M. Crago. 2004. Dual language development and disorders: Ahandbook on bilingualism and second language learning. Baltimore, MD: Paul Brookes.
Green, D.W. 1998. Mental control of the bilingual lexico-semantic system. Bilingualism:Language and Cognition 1, no. 2: 67!81.
Grosjean, F. 1994. Individual bilingualism. In The encyclopedia of language and linguistics, ed.R. Asher, 1656!60. Oxford: Pergamon Press.
Grosjean, F., and P. Li. 2003. Commentary. Imaging bilinguals: When the neurosciences meetthe language sciences. Bilingualism: Language and Cognition 6, no. 2: 159!65.
Hakuta, K. 1986. The mirror of language: The debate on bilingualism. New York: Basic Books.Hakuta, K. 1987. Degree of bilingualism and cognitive ability in mainland Puerto Rican
children. Child Development 58, no. 5: 1372!88.Hernandez Pardo, M., A. Costa, and N. Sebastian-Galles. 2008. The bilingual advantage in
attentional control: Monitor and conflict resolution processes. Paper presented atinternational conference on models of interaction in bilinguals, October 24!26, in Bangor,Wales, UK.
Johnson, J. 1991. Cognitive processes in bilingualism and their cognitive growth effects. InLanguage processes in bilingual children, ed. E. Bialystok, 193!221. Cambridge: CambridgeUniversity Press.
International Journal of Bilingual Education and Bilingualism 663D
ownl
oade
d by
[Flo
rida
Inte
rnat
iona
l Uni
vers
ity] a
t 09:
11 2
1 O
ctob
er 2
013
Martin, M.M., and E. Bialystok. 2003. The development of two kinds of inhibition inmonolingual and bilingual children: Simon vs. Stroop. Poster presented at the meeting ofthe Cognitive Development Society, Oct 24!25, in Park City, UT.
McCarthy, D. 1972. McCarthy scales of children’s abilities. New York: The PsychologicalCorporation.
Morton, J.B., and S.N. Harper. 2007. What did Simon say? Revisiting the bilingual advantage.Developmental Science 10, no. 6: 719!26.
Namazi, M., and E. Thordardottir. 2008. Controlled attention, working memory & languagein bilingual preschoolers. Paper presented at International Conference on Models ofInteraction in Bilinguals, October 24!26, in Bangor, Wales, UK.
Neville, H. 2009. Bilingualism: A window into neuroplasticity. Keynote paper presented atConference on Neurobilingualism: Bilingual functioning from infancy to adulthood,September 19!20, in Bangor University, Wales, UK.
Oller, D.K., and B.Z. Pearson. 2002. Assessing the effects of bilingualism: A background. InLanguage and literacy in bilingual children, ed. D.K. Oller and R.E. Eilers, 3!21. Clevedon,UK: Multilingual Matters.
Pearson, B.Z., and S. Fernandez. 1994. Patterns of interaction in the lexical growth in twolanguages of bilingual infants and toddlers. Language Learning 44, no. 4: 617!53.
Pearson, B.Z., S. Fernandez, and D.K. Oller. 1993. Lexical development in bilingual infantsand toddlers: Comparison to monolingual norms. Language Learning 43, no. 1: 93!120.
Pearson, B.Z., S. Fernandez, and D.K. Oller. 1995. Cross-language synonyms in the lexicons ofbilingual infants: One language or two? Journal of Child Language 22, no. 2: 345!68.
Raven, J.C., J.H. Court, and J. Raven. 1983. Manual for Raven’s Progressive Matrices andVocabulary Scales (Section 3) ! Standard Progressive Matrices. 1983 ed. London: Lewis.
Rosselli, M., A. Ardila, M.N. Santisi, M. Del, R. Arecco, J. Salvatierra, A. Conde, and B.Lenis. 2002. Stroop effect in Spanish!English bilinguals. Journal of the InternationalNeuropsychological Society 8, no. 6: 819!27.
Stroop, J.R. 1935. Studies of interference in serial verbal reactions. Journal of ExperimentalPsychology 18, no. 6: 643!62.
Sumiya, H., and A.F. Healy. 2004. Phonology in the bilingual Stroop effect. Memory &Cognition 32, no. 5: 752!8.
Thomas, E.M., and V.C.M. Gathercole. 2005. Obsolescence or survival for Welsh in the face ofEnglish dominance? In ISB4: Proceedings of the 4th International Symposium onBilingualism, ed. J. Cohen, K. McAlister, K. Rolstad, and J. MacSwan, 2233!54.Somerville, MA: Cascadilla Press.
Thomas, E.M., and V.C.M. Gathercole. 2007. Children’s productive command of grammaticalgender and mutation in Welsh: An alternative to rule-based learning. First Language 27,no. 3: 251!78.
Umbel, V.M., B.Z. Pearson, M.C. Fernandez, and D.K. Oller. 1992. Measuring bilingualchildren’s receptive vocabularies. Child Development 63, no. 4: 1012!20.
Woodard, E., and A. Rodman. 2007. Socio-economic status as a mediating factor in therelationship between bilingualism and the cognitive development of pre-school children.Paper presented at the annual meeting of the National Communication Association 93rdAnnual Convention, November 15, in Chicago, IL, USA.
Yang, S., and B. Lust. 2004. Testing effects of bilingualism on executive attention: Comparisonof cognitive performance on two non-verbal tests. Paper presented at Boston UniversityConference on Language Development (BULCD 29), November 5!7, in BostonUniversity, Boston, MA.
Yang, S., and B. Lust. 2007. Cross-linguistic differences in cognitive effects due to bilingualism:Experimental study of lexicon and executive attention in two typologically distinctlanguage groups. Proceedings of Boston University Conference on Language Development(BUCLD) 31, ed. H. Caunt-Nulton, S. Kulatilake, and I.Woo, Vol. 2, 692!703. Somerville,MA: Cascadilla Press.
Zelazo, P.D., D. Frye, and T. Rapus. 1996. An age-related dissociation between knowing rulesand using them. Cognitive Development 11, no. 1: 37!63.
Zelazo, P.D., and U. Muller. 2002. Executive functions in typical and atypical development. InHandbook of childhood cognitive development, ed. U. Goswami, 445!69. Oxford: Blackwell.
664 V.C.M. Gathercole et al.D
ownl
oade
d by
[Flo
rida
Inte
rnat
iona
l Uni
vers
ity] a
t 09:
11 2
1 O
ctob
er 2
013