coconut grove – west grove tree canopy variations over time
TRANSCRIPT

1
Miami’s Coconut Grove – West Grove tree canopy variation over time Final project submitted in partial fulfilment of the requirement for the Master of Science degree in Environmental Studies
Mark Gazaleh
Florida International University
01 May 2016
Abstract: This paper focuses on urban greening and specifically on levels of urban tree canopy cover in Coconut Grove, Miami. It provides an analysis of processes influencing canopy cover that may be helpful for tree advocates and urban planners. The research includes an overview of the area’s climate, geology and vegetation along with a historical and social outline on how Coconut Grove developed over time. A detailed analysis of the West Grove’s socio-economic history and urban development was undertaken to see how this may have contributed to its comparatively lower levels of canopy cover. The research was underpinned by a comparison of historical aerial and satellite images, as well as an analysis of the area’s Normalised Difference Vegetation Index (NDVI) to determine differentials in canopy cover between the West Grove and the rest of Coconut Grove. It has been argued that urban forests are “highly altered and extremely complex ecosystems” where humans are the main drivers of tree distribution (Dobbs et al. 2010, 2078-9). This paper demonstrates how the West Grove’s tree canopy—or the lack thereof—is a product of complex environmental, socio-economic as well as cultural constraints.
Coconut Grove, Miami, Florida 2016
Keywords: Coconut Grove, Miami, Canopy Cover, Trees, History, Urban Development
2
Contents
Introduction .................................................................................................................................................................................................3
Climate, Geology & Vegetation .................................................................................................................................................................3
Beginnings ...................................................................................................................................................................................................6
Early Settlement ..........................................................................................................................................................................................7
The Railway Arrives ................................................................................................................................................................................ 10
The West (Black) Grove .......................................................................................................................................................................... 13
Desegregation in Coconut Grove Stopped ............................................................................................................................................. 16
Slum lords, crime and drugs .................................................................................................................................................................... 19
Estimate of (West) Coconut Grove Canopy Cover ................................................................................................................................ 22
Background ......................................................................................................................................................................................... 22
Methodology ....................................................................................................................................................................................... 22
2009 Results ........................................................................................................................................................................................ 23
A] Image Coconut Grove Percentage of Block Area with NDVI> 0.6599 ............................................................................... 24
B] Summary Table Coconut Grove Percentage of Block Area with NDVI> 0.6599 .............................................................. 24
C] Image Coconut Grove Mean Aggregated NDVI at the Block Level ................................................................................... 25
D] Summary Table Coconut Grove Mean Aggregated NDVI at the Block Level ................................................................... 25
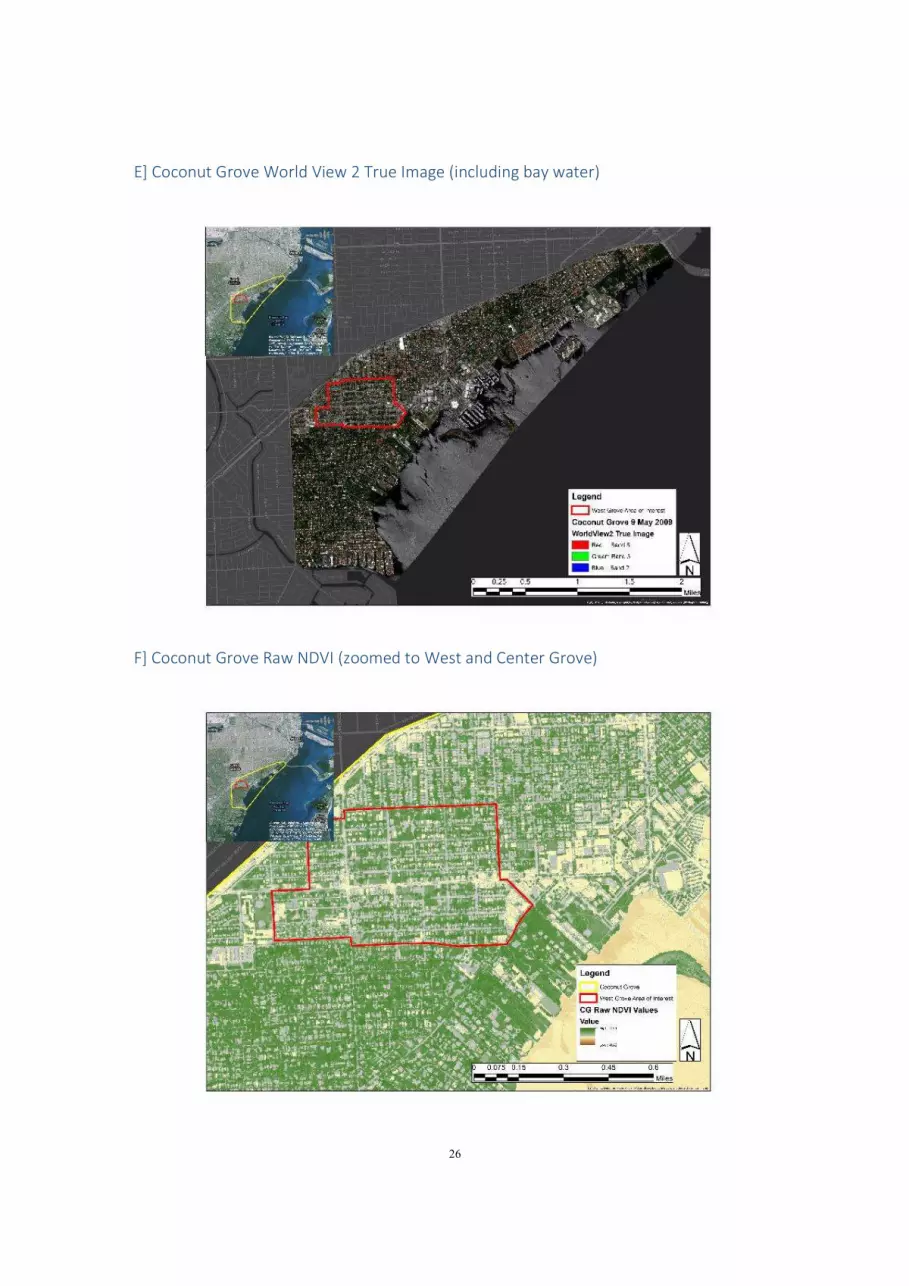
E] Coconut Grove World View 2 True Image (including bay water) ....................................................................................... 26
F] Coconut Grove Raw NDVI (zoomed to West and Center Grove) ........................................................................................ 26
Limitations and considerations .......................................................................................................................................................... 27
Historical Aerial Photography of West Grove ....................................................................................................................................... 28
1924 ..................................................................................................................................................................................................... 28
1928 ..................................................................................................................................................................................................... 29
1940 ..................................................................................................................................................................................................... 30
1971 ..................................................................................................................................................................................................... 31
1985 ..................................................................................................................................................................................................... 32
2015 ..................................................................................................................................................................................................... 33
Limitations and recommendations for future study ............................................................................................................................... 34
Overview and Conclusion ....................................................................................................................................................................... 35
Bibliography ............................................................................................................................................................................................. 36
Annex 1 ..................................................................................................................................................................................................... 44
A] 1924 Aerial Image (clipping) .................................................................................................................................................. 44
B] 1928 Aerial Image ................................................................................................................................................................... 45
C] 2009 - Raw NDVI Map of Coconut Grove ............................................................................................................................ 46
D] 2009 - Raw NDVI zoomed image of Center Grove and West Grove .................................................................................. 46
E] World View 2 Satellite Image Documentation ...................................................................................................................... 47
F] Examples of West and South Grove Street Level Views ...................................................................................................... 50

3
Introduction
This paper is the conclusion of research on urban greening and levels of urban tree canopy cover in the Miami area. It is widely assumed that increased number of urban trees and canopy cover is good for cities.1 Therefore a better understanding of the processes involved to determine urban tree canopy levels may be helpful for urban tree advocates and urban planners. This research paper focuses on a specific area within Coconut Grove. This is a coastal neighbourhood lying in Miami Dade County, which as a whole has been described as “one of the most densely urbanized areas in the United States” (Szantoi et al. 2012, p. 429). Coconut Grove takes pride in being one of the greenest areas of Miami.
The project identifies where canopy changes have occurred as well as providing possible explanations for such changes, focusing in particular on the West Grove (Village West, Black Grove) section. This is a historical Bahamian area of Miami. It was selected for its distinct history, culture, demographic characteristics and socio-economic conditions—social and developmental underpinnings which may have contributed to comparatively lower levels of canopy. The paper begins with a general description of the area’s climate, geology and vegetation. This is followed by a historical and social outline on how the Coconut Grove area developed over time. A detailed view of the West Grove’s socio-economic history and urban development is then analysed to see how this may have contributed to its comparatively lower levels of canopy cover. Historical aerial and current satellite images are also compared to support the earlier historical narrative. An analysis of the Normalised Difference Vegetation Index2 (NDVI) of the area is also undertaken to determine differentials in canopy cover between the West Grove, and the rest of Coconut Grove. The different types of analysis outlined above facilitate a better understanding of why differentials in urban greening in this neighbourhood may have occurred.3
Climate, Geology & Vegetation
Coconut Grove benefits from a subtropical climate, temperatures vary about 15 degrees Fahrenheit over the year, and most rainfall occurs in the summer. This tropical savannah, with alternate wet and dry
1 Urban trees and forests are perhaps the most prominent symbol of nature in a modern city. In the past, they would have provided locals with materials for subsistence but this is no longer a reasonable requirement for these spaces. Given projected population growth in cities, especially Miami, designing urban areas to be more liveable and less stressed will become increasingly important. Urban vegetation has been seen as a key component for human well-being in cities (Lowry et al., 2011, 248). Urban forests and green spaces are unique resources that contribute to the diversity of the urban ecosystem and improve human well-being through climate regulation, air pollution and noise reduction, recreational opportunities, outdoor education, habitat for wildlife and flora, and aesthetics (Zhao et al., 2010, 205). Moreover, urban greening does not just have a decorative function, but also fulfils a social facilitating function and an important environmental role – especially in hot climates (Gómez et al., 2011, 312). Natural city ecosystems and green elements such as trees, parks and green roofs are key attributes to building a sustainable city. Sustainable urbanism is where people are comfortable as well as “emotionally uplifted and aesthetically inspired” by their surroundings (Farr, 2007,). Connectivity to nature is linked to personal health and well-being (Plevak, 2012, 87-91). Trees reduce the impact of a large number of environmental stresses such as solar radiation; they limit water runoff, absorb urban noise, improve air quality, provide wildlife habitats and protect biodiversity. Urban forests are also tools to mitigate climate change, due to the trees’ ability to capture non-point air pollution (Hirokawa, 2010, 3). Wooded areas provide habitats for wildlife and street tree-lines allow flight corridors for birds across large urban areas (Mansfield et al., 2005, 180). Urban forests also provide numerous “spiritual, recreational and restorative opportunities for city residents who may otherwise have limited exposure to natural settings” (Conway and Bourne, 2013, 10).
2 The normalized difference vegetation index (NDVI) is a graphical indicator that allows the analysis of remote sensed data to determine whether an area contains live green vegetation or not.
3 It has been suggested that urban trees habitats are largely determined by three broad factors: urban morphology (the creation/maintenance of space for vegetation); natural factors (soil type, precipitation and its influence on the growth of biomass) and human management systems (culture, choice). Much research has focused on the connection between the socio-economic status of a neighbourhood (based on income and education) and the extent of its vegetation. A common finding is that levels of income and education are positively correlated with greater abundance/diversity of vegetation. It has been suggested that this is also in part due to peer pressure (keeping up with the neighbours), a desire to show social position, as well as having disposable income. (Lowry et al., 2011, 248-264).

4
seasons, encourages lush plant growth and abundant animal life, especially if humid/swampy conditions persist (Craighead 1971, p. 9). The Coconut Grove area, as part of Florida, lies on the ‘Florida Platform’ whose coast line has varied with changes in sea level due with planetary temperature cycles. These cycles “produced the emergence and submergence of land”, where the shape and extent of Florida has changed extensively over time (Hine 2013, p. 12, George 1995). The times when the area was underwater supported the production and laying down of carbonate sediment. (Hine 2013, p.21, p.185) The results of this process are a thick layer of (oolite) limestone as well as a limestone ridge which is runs along Coconut Grove’s coast (Silver Bluff).4 The ridge is said to have been formed in 7000 BP when the sea level was 5-8 feet higher than it is now (Stringfield 1966, p. 69). This coastal ridge also forms the Eastern boundary of the historic Everglades (Craighead 1971, p. 33).
Figure 1: Weathered Miami oolite and saw-grass (State Archives of Florida)
This pineland and rockland ridge has an “extremely rough, pitted, irregular surface” and is very difficult to walk across (see Figure 2). It is eroded to such an extent that fresh water flows through it from the Everglades to the bay. This limestone base itself had little fertility—it required breaking down by heavy labour or machinery as well as fertilizer to become productive (Craighead 1971, pp.149-150).
4 This ridge and old shoreline can be seen on the West side of South Bayshore Drive.(Jewell, 18)
5
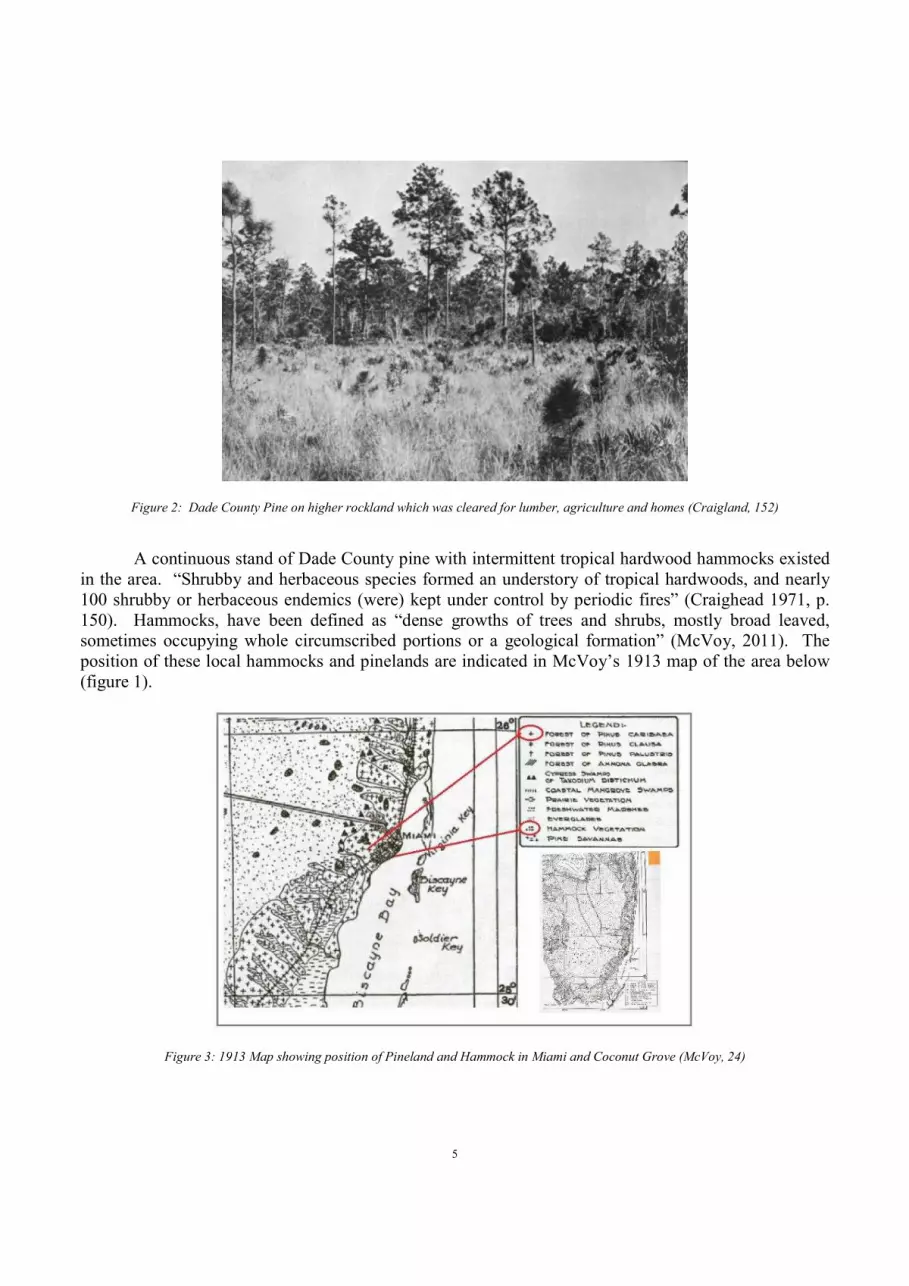
Figure 2: Dade County Pine on higher rockland which was cleared for lumber, agriculture and homes (Craigland, 152)
A continuous stand of Dade County pine with intermittent tropical hardwood hammocks existed in the area. “Shrubby and herbaceous species formed an understory of tropical hardwoods, and nearly 100 shrubby or herbaceous endemics (were) kept under control by periodic fires” (Craighead 1971, p. 150). Hammocks, have been defined as “dense growths of trees and shrubs, mostly broad leaved, sometimes occupying whole circumscribed portions or a geological formation” (McVoy, 2011). The position of these local hammocks and pinelands are indicated in McVoy’s 1913 map of the area below (figure 1).
Figure 3: 1913 Map showing position of Pineland and Hammock in Miami and Coconut Grove (McVoy, 24)
6
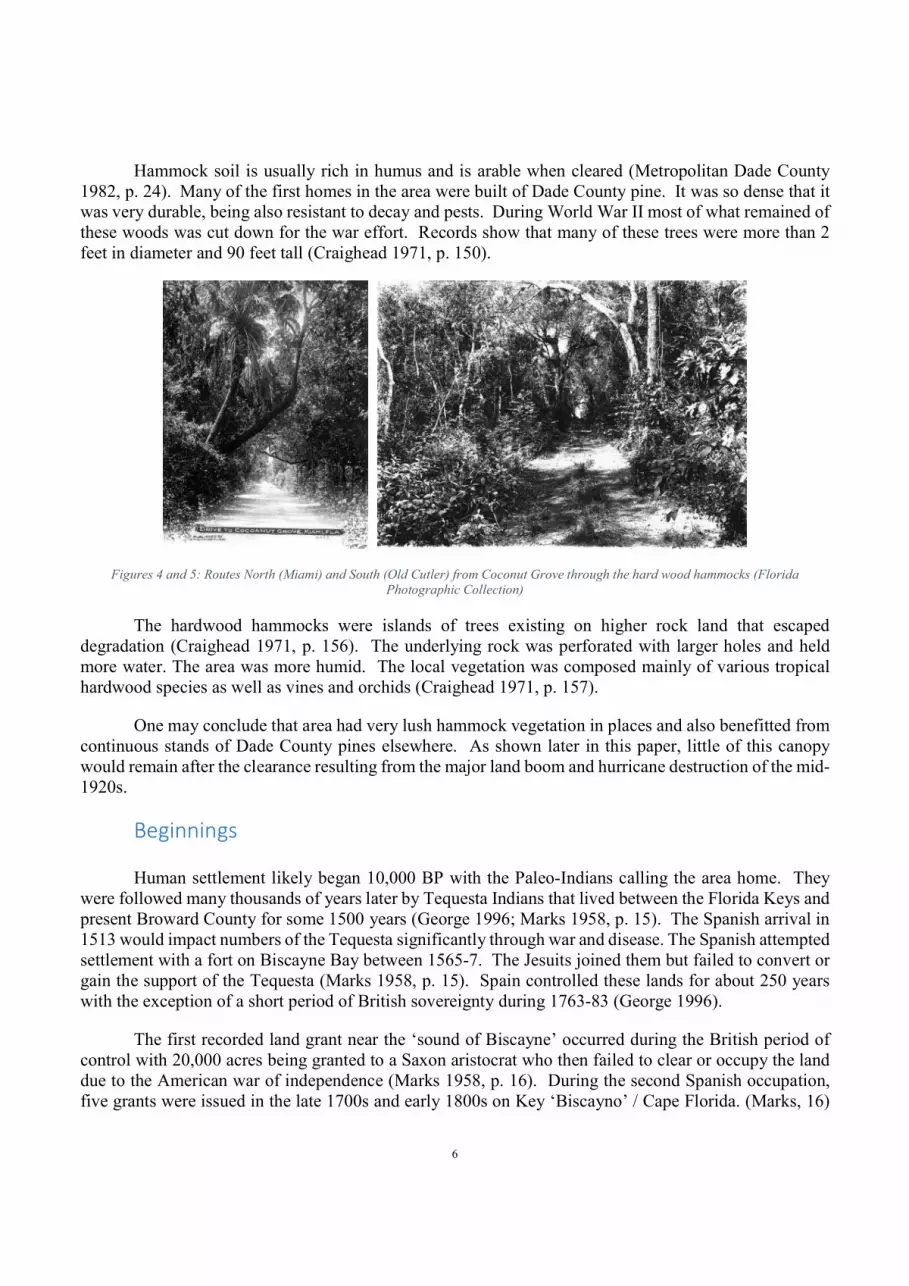
Hammock soil is usually rich in humus and is arable when cleared (Metropolitan Dade County 1982, p. 24). Many of the first homes in the area were built of Dade County pine. It was so dense that it was very durable, being also resistant to decay and pests. During World War II most of what remained of these woods was cut down for the war effort. Records show that many of these trees were more than 2 feet in diameter and 90 feet tall (Craighead 1971, p. 150).
Figures 4 and 5: Routes North (Miami) and South (Old Cutler) from Coconut Grove through the hard wood hammocks (Florida Photographic Collection)
The hardwood hammocks were islands of trees existing on higher rock land that escaped degradation (Craighead 1971, p. 156). The underlying rock was perforated with larger holes and held more water. The area was more humid. The local vegetation was composed mainly of various tropical hardwood species as well as vines and orchids (Craighead 1971, p. 157).
One may conclude that area had very lush hammock vegetation in places and also benefitted from continuous stands of Dade County pines elsewhere. As shown later in this paper, little of this canopy would remain after the clearance resulting from the major land boom and hurricane destruction of the mid-1920s.
Beginnings
Human settlement likely began 10,000 BP with the Paleo-Indians calling the area home. They were followed many thousands of years later by Tequesta Indians that lived between the Florida Keys and present Broward County for some 1500 years (George 1996; Marks 1958, p. 15). The Spanish arrival in 1513 would impact numbers of the Tequesta significantly through war and disease. The Spanish attempted settlement with a fort on Biscayne Bay between 1565-7. The Jesuits joined them but failed to convert or gain the support of the Tequesta (Marks 1958, p. 15). Spain controlled these lands for about 250 years with the exception of a short period of British sovereignty during 1763-83 (George 1996).
The first recorded land grant near the ‘sound of Biscayne’ occurred during the British period of control with 20,000 acres being granted to a Saxon aristocrat who then failed to clear or occupy the land due to the American war of independence (Marks 1958, p. 16). During the second Spanish occupation, five grants were issued in the late 1700s and early 1800s on Key ‘Biscayno’ / Cape Florida. (Marks, 16)

7
Four of these grants were honoured when in 1821 Florida was sold to the United States and were eventually conveyed to a Mr. Fitzpatrick (Marks 1958, pp. 16-18). The lots (in what became Brickell Hammock) were consolidated and slaves procured for the production of cotton (Merrick 1941, p. 7). Almost the entire bay-front hammock from Miami’s small settlement to one mile south of Coconut Grove was cleared in order to make this possible (Marks 1959, p. 18). The plantation was abandoned in 1835 during the second war with the local Seminole tribe who were fighting prospective deportation to Oklahoma and Arkansas (George 1996). A Third Seminole War (1855-1858) prompted the United States Army to re-establish Fort Dallas and clear the land around it at the mouth of the Miami River (George, 1996).
Figure 5: Miami's Fort Dallas (Miami Marine Heritage)
What notable activity occurred here happened only by virtue of sea transport. There was no back country and certainly no roads on Florida’s Eastern coast at least until the 1890s (Merrick 1941, p. 2). One path did exist though—most likely of Indian origin—in the form of jungle (hammock) trail and beach-front path. It followed the coast of Biscayne Bay all the way from Lemon City (now Little Haiti) down to Old Cutler’s Indian Hunting Grounds (southern end of Dade County) (Merrick 1941, p. 4; Moore Parks, 1971, p. 3). The first mail routes went by foot along the beach (Merrick 1941, p. 6). Though there had been intent to clear and work the land—harsh conditions, wars and the lack of land-based transport infrastructure forestalled any notable ‘progress’.
Early Settlement
Neighbouring West Indians, of British and American colonial provenance, also had an impact on South Florida. Their island fruits, vegetables and trees5 have had a lasting presence on the mainland (Merrick 1941, pp. 2-3). West Indians were first drawn to profits that could be made by wrecking and sponge diving. Black Bahamian labour was a critical input for ship crews, land conversion and agriculture
5 The West Indians were said to have brought coconuts, yams, casava, eddys, pounders, and benni to the Miami area (Merrick, 2, 3)

8
on Florida’s Lower East Coast (Historical Association of Southern Florida 1976). This dependence persisted until the arrival in the area in the early 1900s of many Georgian blacks with the railway (Merrick, 1941, p. 5). Black Bahamians notably had useful knowledge from the islands on how to convert and plant on the area’s “coral-rocky…forbidding and desolate” countryside. They supported the White community with their knowledge, as they “knew how to plant on it; and how to use it: and they knew too that all kinds of tropical trees would grow and thrive on (the) rock” (Merrick 1941, p. 5). English and French settlers that followed (in the 1880s) also influenced what fruit and vegetables were grown locally.6 This produce was first for sale in Key West and eventually made its way to Northern towns (Merrick 1941, p. 6). Beforehand, production of starch had been a good source of income—a process learned from the local Indians (Moore Parks 1971, p. 25).
Figure 6: A coontie root mill in what is now the centre of Coconut Grove. Coontie starch (flour substitute) was an important period Florida export. Image shows canopy cover typical for the area. (Munroe Collection)
Settlers also started coming from North Florida, Georgia, Mississippi, Alabama, and the Carolinas from the 1850s onward, but in contrast these were mostly hunters and trappers (Merrick 1941, p. 6). Later arrivals in 1884-96, were farmers from North Florida and Georgia. They had abandoned their lands up North due to the great freezes of 1894-5 which destroyed all their fruit groves and livelihoods. Their new homesteads would push agricultural development into the area’s back country by at least four to five miles in from shore (Merrick 1941, p. 9).
A narrative by Mr. Buck of life in Coconut Grove in the late 1870s attests that settling the area was not for the faint hearted. The text was intended to provide a reality check on over-confidence in the potential for good living in South Florida (at least for the common man). Many had contemplated a move there due to the recession in the Northern US at that time (Moore Parks 1975, p. 89). The visitor, a Mr Buck of Massachusetts, complained of the “false promise of ‘Florida fever’.” Serious resources (money and labour) were needed to make the land work productively, navigation on sea and bay were complicated by shallows, and the possibility of one’s home being destroyed by strong winds were just a few of the privations. He added that “it would be impossible to find, short of absolute desert, any poorer or more
6 English and French settlers would go on to develop commercial fruit groves (pineapples) and vegetable fields in the area.

9
forbidding looking surface” in the area. He also mentioned that the eroded limestone surface was extremely hard to work but that subsistence was possible for a poor man with low expectations (Buck 1979, p. 71-2).
Mr Buck described Coconut Grove’s shore as a “kind of prairie, covered with coarse grasses and wild flowers, and in some spots…rather marshy.” Behind this he saw a pine ridge, with pine-trees widely spaced, that extended back as much as three miles. He determined most of this land too rocky or infertile for him to cultivate (Buck 1979, p. 80). The hammocks, in contrast, had far greater potential for cultivation—especially where soil depths were deeper (Buck 1979, p. 81). Mr. Buck left the Grove once his resources ran out (Buck 1979, 85). Until the arrival of the railway, many would consider the area too isolated, and just a tough “rocky-soiled, insect-infested, tropical wilderness” (Merrick 1941, p. 10; Moore Parks 1975, p. 90).
Florida became a state in 1845. Township 54, range 41 East was first surveyed a year later and included in what is now Coconut Grove. Families could then obtain a title to 160 acres of land, if they built a home, cleared five acres of land and lived there for five years (Moore Parks 1971, pp. 1-10; Moore Parks 1975, pp. 96-7). It was the families of the Key Biscayne light house keepers that would first homestead in the Grove in 18837 (Moore Parks 1971, p. 6). Numerous settlers would also squat on the land in anticipation of gaining eventual homesteads. The first recorded subdivision was made in 1884 providing Coconut Grove and Dade County with their first city lots (Moore Parks 1971, p. 24; Merrick, 1941, p. 9). Early properties built here mainly faced seaward. Mangroves were cleared to facilitate access, breezes and views to the bay (Lombard 2001, p. 16-7). By 1887, the area had approximately a half-dozen wooden homes on the ridge, each roughly half a mile apart. It had a total population of 30 people. Bay View House, the only hotel in the Bay area, was the centre of village life (Kent 1971, p. 6, 33).
Figure 7: The Peacock Inn in Coconut Grove and Community Trail (circa 1885) after bay side clearances and before replanting (HistoryMiami)
7 The first application to Homestead in Coconut Grove was made earlier in 1868 (27th Ave south to the Moorings).

10
Coconut Grove was still a very remote place with few contacts to the outside world—the mail schooner only visited twice a month (Moore Parks 1971, p. 24). By 1890 the village grew to have over 75 residents, a hotel, several stores, and a school and a yacht club—as such it was much larger than Miami. Its Peacock hotel was a catalyst for the development of the area as it brought “more sophisticated (wealthier) visitors that wouldn’t have come to the area beforehand” (Moore Parks 1917, p. 30). These lands started to become far more valuable to speculators and developers alike.
The Railway Arrives
It was the arrival of the railroad, the incorporation of Miami in 1896, and two big freezes further North that changed everything. These brought more people willing to develop the local backcountry and allowed growers to sell their produce more profitably to wider markets. Many farmers in more Northern parts of Florida and beyond were ruined by big freezes in 1894-1895 which destroyed the citrus industry there. They, as well as many black farmers and workers, were forced to move to the warmer climes of South Florida (Dunn 1997, p. 47). Miami and Coconut Grove were perceived as not being at risk from these damaging low temperatures (Plasencia 2011, pp. 12-13).
Most of present day Coconut Grove and Coral Gables were soon cleared for fruit groves. Pineapples were even cultivated between grapefruits, avocados, mangos, with citrus trees planted as additional cash crops. The early citrus groves had been planted here at the expense of native pineland and hammock. The fruit business brought increasing prosperity to the area—especially when the railway was extended to Coconut Grove (Moore Parks 1971, pp. 45-49). In 1900 local economic activity shifted more and more towards real estate development. Agriculture would be eventually priced out by speculative land development (Moore Parks 1971, pp. 51). For example, the Sunshine Fruits Company not only subdivided its land in the South of the Grove but also offered caretaker services for absentee owners and developed the land for real estate (Historical and Environmental Preservation Board, City of Miami 2015, pp. 6-7).
Figure 8: Aerial image showing Coconut Grove (North West edge of which starts at the bottom right of the image) and the extent of its back-country citrus plantations identified in yellow boxes. See Annex1 to see image in greater detail. (Source: Underwood & Underwood of 1924, 1924-347b)
11
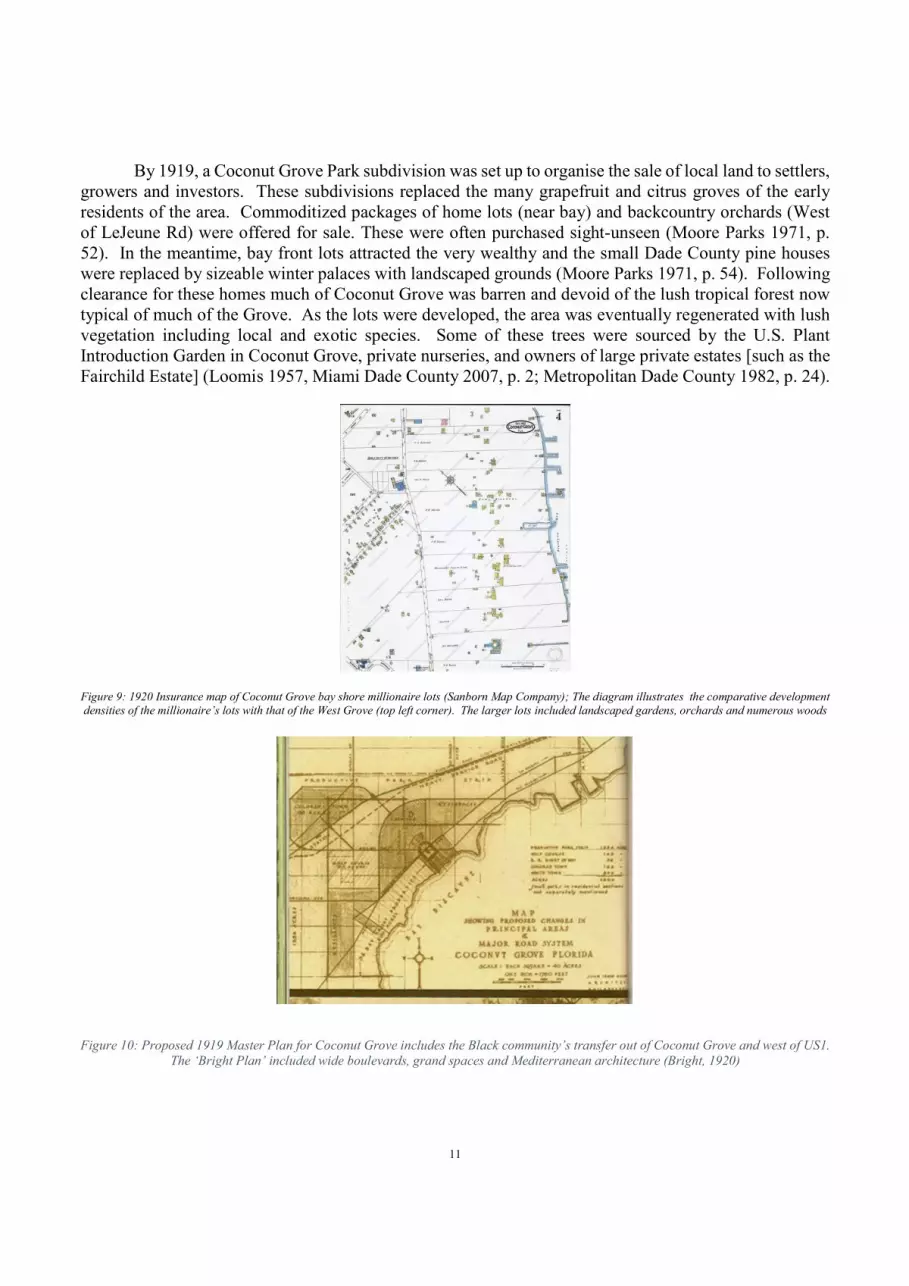
By 1919, a Coconut Grove Park subdivision was set up to organise the sale of local land to settlers, growers and investors. These subdivisions replaced the many grapefruit and citrus groves of the early residents of the area. Commoditized packages of home lots (near bay) and backcountry orchards (West of LeJeune Rd) were offered for sale. These were often purchased sight-unseen (Moore Parks 1971, p. 52). In the meantime, bay front lots attracted the very wealthy and the small Dade County pine houses were replaced by sizeable winter palaces with landscaped grounds (Moore Parks 1971, p. 54). Following clearance for these homes much of Coconut Grove was barren and devoid of the lush tropical forest now typical of much of the Grove. As the lots were developed, the area was eventually regenerated with lush vegetation including local and exotic species. Some of these trees were sourced by the U.S. Plant Introduction Garden in Coconut Grove, private nurseries, and owners of large private estates [such as the Fairchild Estate] (Loomis 1957, Miami Dade County 2007, p. 2; Metropolitan Dade County 1982, p. 24).
Figure 9: 1920 Insurance map of Coconut Grove bay shore millionaire lots (Sanborn Map Company); The diagram illustrates the comparative development densities of the millionaire’s lots with that of the West Grove (top left corner). The larger lots included landscaped gardens, orchards and numerous woods
Figure 10: Proposed 1919 Master Plan for Coconut Grove includes the Black community’s transfer out of Coconut Grove and west of US1. The ‘Bright Plan’ included wide boulevards, grand spaces and Mediterranean architecture (Bright, 1920)

12
Also in 1919, Coconut Grove sought to expand and be incorporated as a city. With this came a drive for municipal improvements like sewage disposal, streets, water, parks, sidewalks and street lights, fire and police protection (Moore Parks 1971, p. 63). The new city had also plans drawn up with Mediterranean style architecture and mirror lakes which could have transformed it into another West Palm Beach or Coral Gables. Controversially, it sought to push the Black Grove (discussed in the next section) to the other side of Dixie Highway to make space for a golf club. The plan would have had a significant impact (removal/displacement) on Coconut Grove’s remaining canopy. It was not to be—perhaps it was too expensive to achieve. In any case the Town Council was very busy approving plans for subdivision to facilitate sales in Florida’s land boom (Moore Parks 1971, p. 61-65).
Figure 11: 1923 Lateral image showing pineland in the background and land clearances in the West Grove [see also aerial image 1924 shown later in this document] (Fairchild Collection)
The city of Coconut Grove along with the town of Silver Bluff was annexed by the city of Miami by popular vote on September 2, 1925. Coconut Grove’s ‘overwhelming’ opposition was effectively diluted in the face of Miami’s massive voter drives and greater political activism (Moore Parks 1971, p. 70; Livingstone 2000, p. 43). The annexation came at a time of great optimism at the height of the area’s land boom. The later blockage of rail and port transportation and new taxes effectively ended the positive outlook for the area (Livingstone 2000, p. 49). Coconut Grove was absorbed but some of its early elements, such as Coconut Grove’s street names and to a certain extent its independent sense of identity were retained (Livingstone 2000, p. 50).
13
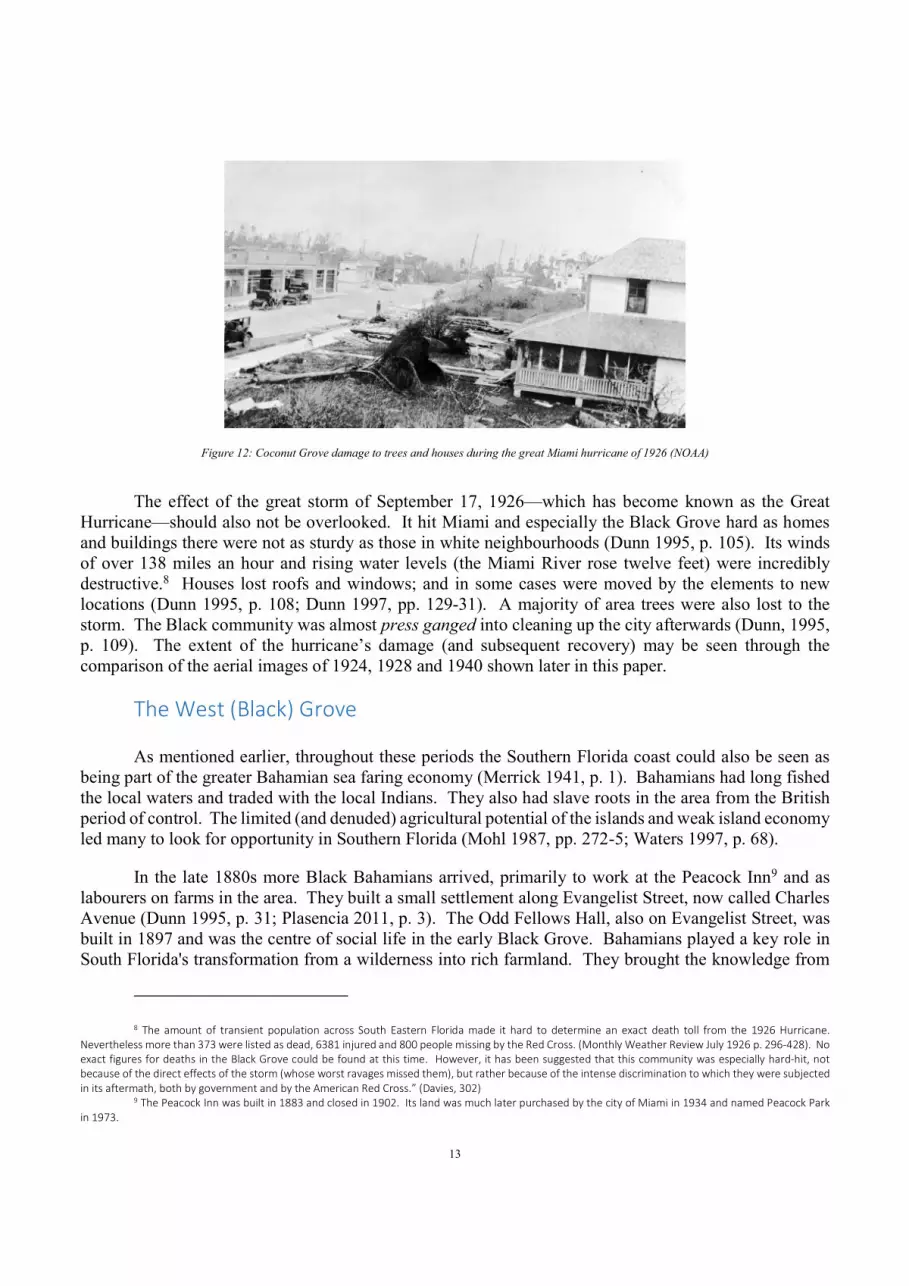
Figure 12: Coconut Grove damage to trees and houses during the great Miami hurricane of 1926 (NOAA)
The effect of the great storm of September 17, 1926—which has become known as the Great Hurricane—should also not be overlooked. It hit Miami and especially the Black Grove hard as homes and buildings there were not as sturdy as those in white neighbourhoods (Dunn 1995, p. 105). Its winds of over 138 miles an hour and rising water levels (the Miami River rose twelve feet) were incredibly destructive.8 Houses lost roofs and windows; and in some cases were moved by the elements to new locations (Dunn 1995, p. 108; Dunn 1997, pp. 129-31). A majority of area trees were also lost to the storm. The Black community was almost press ganged into cleaning up the city afterwards (Dunn, 1995, p. 109). The extent of the hurricane’s damage (and subsequent recovery) may be seen through the comparison of the aerial images of 1924, 1928 and 1940 shown later in this paper.
The West (Black) Grove
As mentioned earlier, throughout these periods the Southern Florida coast could also be seen as being part of the greater Bahamian sea faring economy (Merrick 1941, p. 1). Bahamians had long fished the local waters and traded with the local Indians. They also had slave roots in the area from the British period of control. The limited (and denuded) agricultural potential of the islands and weak island economy led many to look for opportunity in Southern Florida (Mohl 1987, pp. 272-5; Waters 1997, p. 68).
In the late 1880s more Black Bahamians arrived, primarily to work at the Peacock Inn9 and as labourers on farms in the area. They built a small settlement along Evangelist Street, now called Charles Avenue (Dunn 1995, p. 31; Plasencia 2011, p. 3). The Odd Fellows Hall, also on Evangelist Street, was built in 1897 and was the centre of social life in the early Black Grove. Bahamians played a key role in South Florida's transformation from a wilderness into rich farmland. They brought the knowledge from
8 The amount of transient population across South Eastern Florida made it hard to determine an exact death toll from the 1926 Hurricane. Nevertheless more than 373 were listed as dead, 6381 injured and 800 people missing by the Red Cross. (Monthly Weather Review July 1926 p. 296-428). No exact figures for deaths in the Black Grove could be found at this time. However, it has been suggested that this community was especially hard-hit, not because of the direct effects of the storm (whose worst ravages missed them), but rather because of the intense discrimination to which they were subjected in its aftermath, both by government and by the American Red Cross.” (Davies, 302)
9 The Peacock Inn was built in 1883 and closed in 1902. Its land was much later purchased by the city of Miami in 1934 and named Peacock Park in 1973.

14
their islands about the best way to grow crops on the coral rocks of the area (Dunn 1995, p. 31; Plasencia 2011, p. 3). This was very helpful for the white settlers in the area and influenced the type of flora and crops that were grown there (Dunn 1995, p. 31).
By the 1830s Black Bahamians had started working as sponge divers and in wrecker crews in Key West and by the 1850s had gone on to support land clearing and seasonal agricultural work (Mohl 1987, p. 273). Later, they would go on to work in construction and as porters in hotels and ports, as well as household help in Miami and Coconut Grove (Mohl 1987, p. 281). So many were coming, welcomed as a cheap source of much needed labour, that there were fears that the Bahamas were becoming depopulated (Mohl 1987, pp. 286-291; Waters 1997, p. 68).
Coconut Grove’s Peacock Hotel drew in the first black settlers to the area – the two or three that worked there also lived on the premises (Moore Parks 1971, p. 38). Black settlement began in earnest in Coconut Grove in the 1880s and was known as Kebo or Coloured Town (Jenkins 1975, p. 3; Gibson 2000). As more followed, they settled North of Main Highway (back road) on an early established homestead. These Bahamians brought the muscle to clear the surrounding land as well as the knowledge to cultivate its rocky surface. These early Blacks “bought their land…on a long term basis for as little as fifty cents a week. They became land owners and not tenants” (Moore Parks 1971, p. 39). Some of these homes still remain in-situ today. A great deal of the vegetation in the neighbourhood was planted by local men who brought much of it from the Bahamas (Gibson 2000). It has been noted that the early black residents "planted the crotons, the almond trees, the sapodillas and sugar apples. You could then walk the streets and pick the fruit" (Staletovich 2013).
The first black street in the Grove was little more than a footpath cut through the pines and palmettos. The road, which the black residents built themselves, would go on to host three churches, a black school and community centre. It became known as Evangelist Street and is now Charles Street (Moore Parks 1971, p. 39-40). This single street became the centre of business for the Bahamian settlers in Coconut Grove by the early 1900s (Plasencia 2011, p. 4). As the black community grew, the black business district moved to County Road, which was a much larger street than the older Evangelist Street (Plasencia 2011, p. 4-5). Grand Avenue would go on to have numerous businesses along it. By the 1950-60s a majority of them would be white owned (Plasencia 2011, p. 5).
One example of successful black settlement in the Grove was that of Bahamian Mr EW Stirrup. He worked tirelessly building homes in both the white and the black community (Moore Parks 1971, p. 41). Stirrup bought up numerous lots of a white homesteader in the Grove that came up for sale. He then built on them many small, Bahamian-style rental houses from the local hard pine wood. These shotgun houses are common throughout the Caribbean as they are affordable and can be built on small plots of land (Plasencia 2011, p. 9). Aside from the majority of Bahamians who owned their properties, the other black residents’ position was far more precarious as they had to rent their homes. Many of these homes are still standing in the Grove (Dunn 1995, p. 34). At one point, most of the downtown Grove was owned by ‘Uncle Abe’ Stirrup. Much of his fortune was lost with the financial collapse of the Biscayne Bank in the 1930s. Nevertheless he retained ownership of over 300 plots of land until his death in the late 1950s (Dunn 1995, p. 34).
So many Bahamians lived in the Black Grove that it had its own ‘island character’ and as such was very different from other black areas in Southern US cities (Mohl 1987, p. 273, 295-6). The Bahamian migrants may have come for the area’s higher wages, but were unaccustomed to its segregation,

15
discrimination and racism (Mohl 1987, pp. 287-8). These issues were not as extreme in segregated Coconut Grove as they were elsewhere in Miami (Moore Parks 1971, p. 41). Nevertheless, the environment effectively institutionalized the economic, educational and social disadvantages of this black community.
Figure 13: Period postcard of Bahamians in Coconut Grove / Overtown (HistoryMiami)
As noted earlier, the building of the Florida East Coast railway was the catalyst that brought so many into the area (George 1979, p. 434). Many of Miami’s new residents were from Southern US states and with them came hardened racial views. Race relations were volatile as poor whites saw blacks as a threat to jobs (Fleischmann 1992, p. 21). The rapid increase in the number of blacks in Miami (40% of the total population by 1910) worsened fears of black encroachment into white neighbourhoods. Blacks were often negatively stereotyped in the media, and viewed as potentially disruptive and dangerous. Essentially, the police managed public order within a ‘two-tiered’ justice system with the black community segregated into poorly serviced areas (Fleischmann 1992, p. 21).
There were even calls to use naval reserves in Miami to strengthen the perception of good order (Fleischmann 1992, pp. 21-23). The Ku Klux Klan was active in the area and even kidnapped a black Coconut Grove minister preaching racial equality. He was only released after promising to leave the Miami area immediately (George 1979, pp. 443-8; Dunn 1997, pp. 119-120). Black churches were very important to their communities as a place of worship with ‘dignity and respect’—rare spaces that facilitated black congregations, advancement, leadership and communication with the wider community (Fleischmann 1992, p. 31; Dunn 1997, pp. 107-108). Furthermore, an overview of the West Grove Census shows that by the 1940s a large majority of homes were rented. Residents of Bahamian origin in contrast were likely to own their properties. Many other locals included second generation Floridians, Georgian and the others from the Carolinas. A sizeable minority local residents were said to be landscapers and gardeners working in (local) private homes (for detail please see 1940 Census web site).
White landlords were not the only ones found to be taking advantage of their black tenants. Ebenezer Stirrup, still a major land owner in the area, was “exposed as an unscrupulous slumlord (by)…repeatedly refusing to comply with City sanitation regulations” (Connolly 2008, p.117, 420). Stirrup’s son would maintain the family home rental business despite demolition orders being placed on his properties. The very poor living conditions in the Black Grove were nevertheless comparatively better

16
than those in other black neighbourhoods because of the area’s gentler climate and lower population density (Millspaugh 2013, p. 137). Very few landlord, black or white, who were arrested for code violations, were ever charged—many of them benefitted from high-powered legal representation (Connolly 2008, p. 420). Indeed, slum housing was more profitable than the local hotel industry. Black housing for a 2 room row house in 1949 cost $100 deposit plus $18 per week while a fully-serviced hotel room on the beach cost $17.50 with no deposit (Connolly 2008, pp. 372-4). Just under a third of Black Grove housing had no electricity. Two thirds of homes lacked bathing facilities and almost all had no hot water (Millspaugh 2013, p. 139).
Figure 14: Extent of the Black Grove in the 1940 (City Planning and Zoning Board of Miami Slum Clearance Committee)
Desegregation in Coconut Grove Stopped
The war effort of the 1940s required a large increase in housing for service personnel in the Miami area. Furthermore, at that time federal courts began ruling that segregated (public) housing was unlawful. These two factors increased the pressure to allow black entry into previously segregated white neighbourhoods. The West Grove was no exception to this (Dunn 1997, pp. 204-5). White fears of their property values falling undermined attempts to allow the building of black homes in the area. In 1941, offers to buy out white residents to permit rezoning and to build a wall to separate the two communities were deemed unacceptable to the white community (Dunn 1997, pp. 205-6).

17
Figure 15: Negro Homes in White Town Protested: diagram with a dotted line that shows the location of a proposed racial dividing wall on Hibiscus Avenue (Miami Daily News June 12, 1941)
Still, demand to find housing for Miami’s black community was pressing and $5 million was available for the project. Coconut Grove’s white community also successfully fought off a federal housing initiative to build fifty duplex blocks in the West Grove in 1944 (Dunn 1997, pp. 206-7). The four commissioners present voted unanimously to prohibit the building of these residences stating that zoning based on race was unconstitutional (Placentia 2011, p. 2).
In 1946, however, the Miami Housing Authority recommended using a 24 acre plot for low-rent housing for blacks in Coconut Grove. It would also provide white grove residents “protection” with the building of a “wall and a 74 foot buffer strip (to) be constructed between the white and black sections. Parts of this wall remain today” (Dunn 1997, p. 207). In April 1946 segregation was ruled illegal – but this did not stop white resistance against the growth of the black neighbourhood of the Grove (Dunn 1997, p. 208).
18
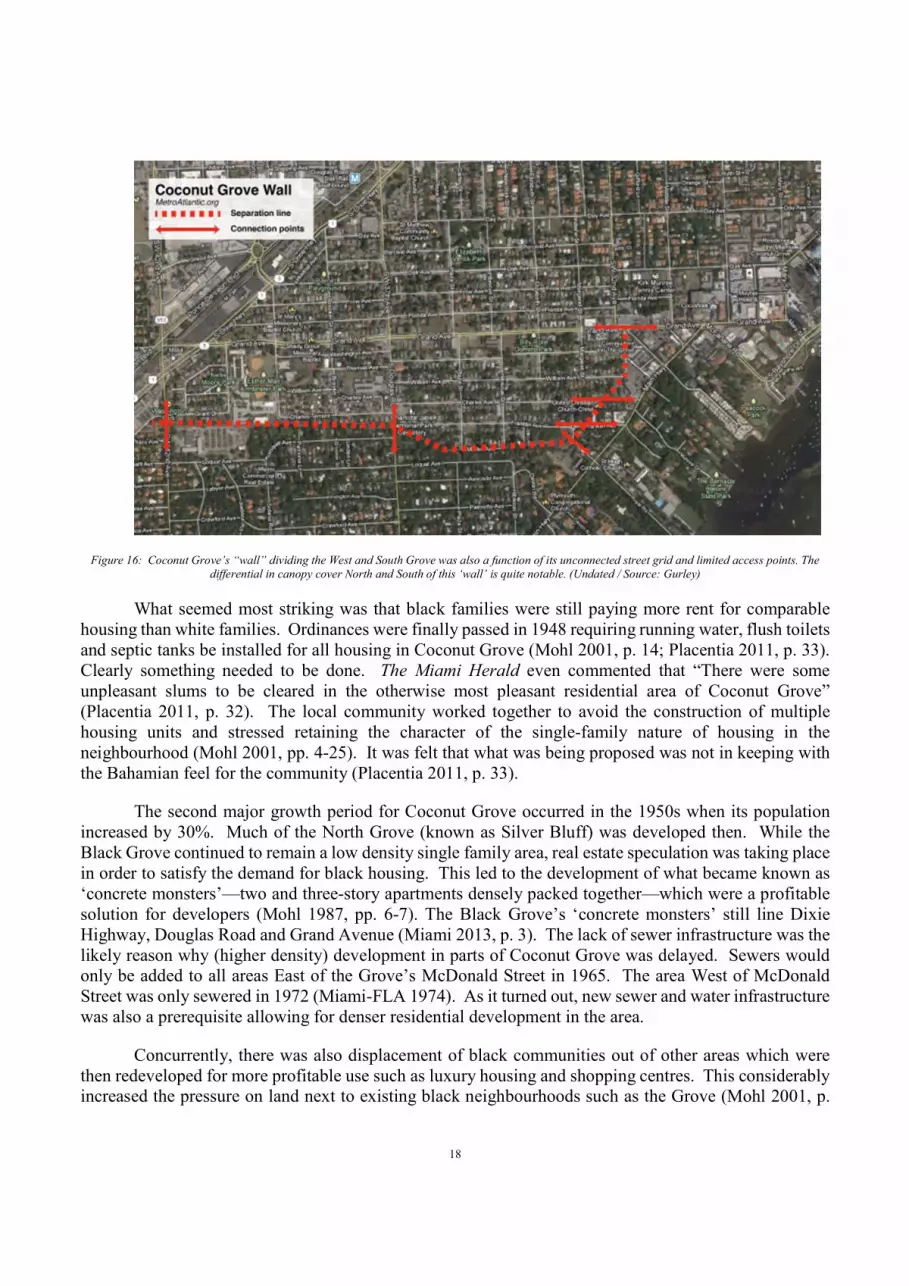
Figure 16: Coconut Grove’s “wall” dividing the West and South Grove was also a function of its unconnected street grid and limited access points. The differential in canopy cover North and South of this ‘wall’ is quite notable. (Undated / Source: Gurley)
What seemed most striking was that black families were still paying more rent for comparable housing than white families. Ordinances were finally passed in 1948 requiring running water, flush toilets and septic tanks be installed for all housing in Coconut Grove (Mohl 2001, p. 14; Placentia 2011, p. 33). Clearly something needed to be done. The Miami Herald even commented that “There were some unpleasant slums to be cleared in the otherwise most pleasant residential area of Coconut Grove” (Placentia 2011, p. 32). The local community worked together to avoid the construction of multiple housing units and stressed retaining the character of the single-family nature of housing in the neighbourhood (Mohl 2001, pp. 4-25). It was felt that what was being proposed was not in keeping with the Bahamian feel for the community (Placentia 2011, p. 33).
The second major growth period for Coconut Grove occurred in the 1950s when its population increased by 30%. Much of the North Grove (known as Silver Bluff) was developed then. While the Black Grove continued to remain a low density single family area, real estate speculation was taking place in order to satisfy the demand for black housing. This led to the development of what became known as ‘concrete monsters’—two and three-story apartments densely packed together—which were a profitable solution for developers (Mohl 1987, pp. 6-7). The Black Grove’s ‘concrete monsters’ still line Dixie Highway, Douglas Road and Grand Avenue (Miami 2013, p. 3). The lack of sewer infrastructure was the likely reason why (higher density) development in parts of Coconut Grove was delayed. Sewers would only be added to all areas East of the Grove’s McDonald Street in 1965. The area West of McDonald Street was only sewered in 1972 (Miami-FLA 1974). As it turned out, new sewer and water infrastructure was also a prerequisite allowing for denser residential development in the area.
Concurrently, there was also displacement of black communities out of other areas which were then redeveloped for more profitable use such as luxury housing and shopping centres. This considerably increased the pressure on land next to existing black neighbourhoods such as the Grove (Mohl 2001, p.

19
9). By the 1950s, a large portion of the Black Grove real estate—in an area of approximately forty blocks—was in the hands of white owners (Mohl 2001, p. 11). One remaining empty tract of 17 acres was notably owned by two white speculative builders, John Bouvier and Malcolm Wiseheart. They wished to build duplex apartments on this tract (Mohl 2001, p. 11).
The black community agreed that additional housing was needed but not in the large scale the developers presented. The developers argued that they could do what they wanted with the land—especially as it had been zoned for commercial and light-industrial use (Mohl 2001, p. 11). All the while, housing conditions in the Black Grove remained deplorable, with “whole families…packed into single rooms of broken-down old houses, into boarded up porches, shacks like lean-tos and in a few flimsy, over-crowded, too expensive apartment houses...(where)...nobody seemed to pay any attention to city ordinances against overcrowding, to buildings badly built, to uncollected filth. There was little or no police protection here where no police would bother to enforce what seemed like unenforceable laws” (Mohl 2001, p. 13). The diagram below from a period City of Miami study of housing quality shows the clear extent of the dire conditions prevalent in the area (City Planning and Zoning Board of Miami Slum Clearance Committee). The areas shaded in black denote a classification for demolition (1st priority).
Figure 17: Diagram outlining the poor condition of Black Grove housing in the late 1940’s. Facilities marked in the black coloured blocks were judged to be 90% recommended for demolition (City Planning and Zoning Board - Miami Slum Clearance Committee).
Slum lords, crime and drugs
The desire to protect the West Grove neighbourhood proved to be a real challenge. While zoning in the area remained for commercial and industrial use, mortgages for un-zoned residential use were not possible. However, powerful real estate interests overrode zoning restrictions and ensured that high density blocks were built. Thus, building codes went unenforced and condemnations were ignored (Mohl 2001, pp. 24-25). The slumlords would build high density housing while retaining ownership in the form of rental housing. It was feared that this new capacity would lead to an “influx of residents from other
20
areas…with a diminished sense of community… (as well as at times) an unwelcome criminal element” (Placentia 2011, pp. 34-7). The worst fears were proved right—desegregation of the 1960s permitted wealthier black residents to move out to other areas of Miami-Dade County. They were replaced by poorer black residents who had no ties to the neighbourhood. As a result, community cohesiveness was damaged, which in turn contributed to a huge increase in violent crime and drug use (Staletovich 2013). By the 1970s, it became clear that West Grove’s black housing was becoming unsustainably expensive. One observer remarked “as tough as it was to get that down payment together to buy a small cottage in the Grove, it has been even tougher for the black family to maintain the neighbourhood” (Placentia 2011, p. 39).
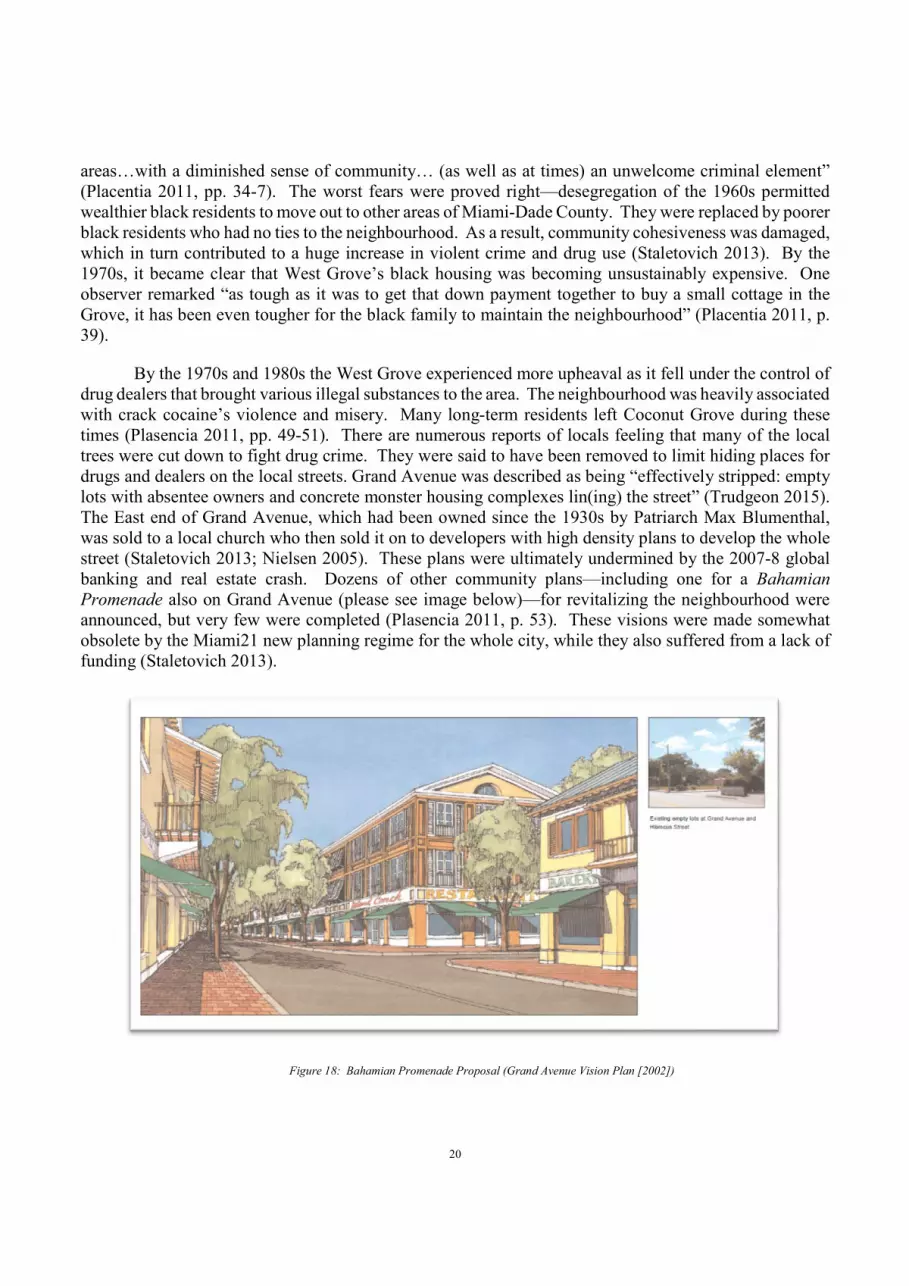
By the 1970s and 1980s the West Grove experienced more upheaval as it fell under the control of drug dealers that brought various illegal substances to the area. The neighbourhood was heavily associated with crack cocaine’s violence and misery. Many long-term residents left Coconut Grove during these times (Plasencia 2011, pp. 49-51). There are numerous reports of locals feeling that many of the local trees were cut down to fight drug crime. They were said to have been removed to limit hiding places for drugs and dealers on the local streets. Grand Avenue was described as being “effectively stripped: empty lots with absentee owners and concrete monster housing complexes lin(ing) the street” (Trudgeon 2015). The East end of Grand Avenue, which had been owned since the 1930s by Patriarch Max Blumenthal, was sold to a local church who then sold it on to developers with high density plans to develop the whole street (Staletovich 2013; Nielsen 2005). These plans were ultimately undermined by the 2007-8 global banking and real estate crash. Dozens of other community plans—including one for a Bahamian Promenade also on Grand Avenue (please see image below)—for revitalizing the neighbourhood were announced, but very few were completed (Plasencia 2011, p. 53). These visions were made somewhat obsolete by the Miami21 new planning regime for the whole city, while they also suffered from a lack of funding (Staletovich 2013).
Figure 18: Bahamian Promenade Proposal (Grand Avenue Vision Plan [2002])

21
The residents of the West Grove have until now managed to keep Grand Avenue a low-scale commercial street by refusing to allow rezoning on the lots behind it. In so doing, they have also maintained the residential character and single family density of those back streets (Plasencia 2013, p. 57). The local community has had one recent success with the construction of Gibson Plaza on Grand Avenue. One mixed used building—costing US$15 million and offering below market rents to seniors—was completed in 2014 (Viglucci 2014; Hamaludin 2014). This is in marked contrast to the numerous luxury high rise developments that continue to be built in the East Grove, consisting mainly of high rise hotels, apartment and office blocks (Plasencia 2013, p. 56).
Figure 19: Six city blocks of Grand Ave currently for sale in 2016 for $36MM between Plaza St and Margaret Street (plots located in red rectangles Source: LoopNet)
Currently many parcels of West Grove land have been cleared and assembled for sale. The above photograph of a 6 city block offering in 2016 (see Figure 19 above) shows the extent of the transition which is at hand on Grand Avenue (LoopNet 2016, Kellergis 2016). The combination of these lots made available for large scale development, may well further erode the proportion of trees and vegetation in the area.10 The number of larger, older trees in the area are likely to be reduced. In view of this possibility, it is useful to assess the stock of current greenery that exists in the area.
10 For a colourful exchange of views of the subject of the impact of property development in Coconut Grove, please see http://coconutgrovegrapevine.blogspot.com/2016/04/greed-is-ruining-character-of-grove.html

22
Estimate of (West) Coconut Grove Canopy Cover
Background
Recent estimates show that there are approximately 36 million trees on the 6,000 km2 area of Miami Dade County. Notably, assessments suggest that most trees are found on private land (85%), with the remaining 10% and 5% located respectively on public land and along streets.11 Densities (number of trees per unit area) are said to be highest in parks, public facilities and conservation areas. The County’s tree density—with an average of 92 trees per acre—ranks amongst the highest in US cities but is low compared to other Florida urban areas (Escobedo et al. 2014, p. 2). Another observation noted that Miami-Dade County’s average urban canopy cover had declined significantly to 12.4% in 2004, down from 31.3% in 1984 (Szantoi et al. 2012, p. 487).12 To counter this decline, the Million TREES Miami Campaign was set up in 2011 as a key endeavour to plant one million trees and achieve a goal of 30% tree canopy cover for the County. The County is now aiming to plant 838,000 trees by 2020 (Sentenac 2014; Miami-Dade County, 3). Nevertheless, a current analysis showed an urbanized 380 km2 area of the County to still have 12.2% tree coverage (Hochmair et al. 2015).
Methodology
An estimate of canopy cover in both Coconut Grove and the West Grove13 has been made by calculating the respective vegetation indices (NDVI) [normalized difference vegetation index] of both areas.14 NDVI is a commonly used measurement to differentiate vegetation and non-vegetation land cover (Myeong et al. 2003) in a process that results in a given pixel being assigned a value that ranges from -1 to +1.15 Low values of NDVI (0.1 and below) usually correspond to barren areas of rock and sand, mid-range values (0.2-0.3) to grassland and shrub, while high values (0.6-0.8) can be attributed to temperate and tropical rainforests (Weler 2000). A percentage of census blocks with a NDVI of higher that 0.6590—a robust indication level of canopy cover—were used to make the first comparisons across Coconut Grove which includes the West Grove (Image A). The second graphical representation demonstrates the variation of the mean NDVI for each area census block across Coconut Grove including the West Grove (Image C). The block data was classified into quintiles—colour coded from grey (lower NDVI) to green (higher NDVI).
11 The four most common species in the county in terms of numbers were melaleuca, (Melaleuca quinquinervia), red mangrove (Rhizophora mangle), button mangrove (Conocarpus erectus) and benjamin fig (Ficus benjamina) covering 42%, 13%, 6%, and 4% of the total tree population respectively (Escobedo, 2014, 2).
12 It has been suggested that the evolution in Miami Dade’s urban tree (and palm) cover over the last 20 years has been due to changing demographics, increased urban infill, the effects of Hurricane Andrew (1992), and possibly increased tree mortality from pest and disease outbreaks (Szantoi et al., 2008). As an indication of possible extent of storm-related tree losses, Miami’s pine stands lost 25-40% of their trees during Hurricane Andrew in 1992 (Loope, L., 1996, 24).
13 The area of focused interest is relatively small and encompasses a section of the Coconut Grove neighbourhood which lies in the South East of the City of Miami. The section of interest runs East-West lying within the grid of SW40th Street – Bird Road (North), SW 22nd Avenue (East), Grand Avenue (South) and SW42nd Avenue (West) – in Miami. The topography is fundamentally flat and the elevation of the study area is 13ft (4m). (Wikipedia) The area has a tropic monsoon climate with temperatures ranging between 60-91 degrees Fahrenheit (Wikipedia).
14 NDVI is a frequently used vegetation index drawn from the reflectance properties of leaves in red and near-IR wavelengths. Green plant leaves typically have low reflectance in the visible regions of the electromagnetic spectrum due to strong absorption by leaf mesophyll. Meanwhile, in the near infrared region, leaves exhibit high reflectance due to extensive scattering effects in these wavelengths (Tucker and Sellers, 1986; Tucker, 1979; Knipling, 1970). 15 NDVI is calculated from the formula: near-infrared radiation minus visible radiation divided by near-infrared radiation plus visible radiation. NDVI = (near IR band − red band) / (near IR band + red band). The index mostly produces brighter values for pixels that contain more vegetation.

23
The image analysis and presentation was made with a Geographic Information System (ARC-GIS) that processed an atmospherically corrected clipped multispectral image taken on 11 May 2009 by the WorldView-2 satellite.16 This image was chosen on the basis of value (FIU cost-free non-commercial use permitted), very high resolution (2m spatial), and its very high spectral diversity (8 Multispectral [4 standard colours: red, blue, green, near-IR], 4 new colours: red edge, coastal, yellow, near-IR2)17, and geolocation accuracy (<500m at image start stop). (Digital Globe) The NDVI calculations required the use of the image’s Red (630 -690 nm) and Near Infra Red1 (770 - 895 nm) bands. Water bodies were clipped from the image as much as possible, as sun reflecting from water may also produce high NDVI values and distort results.
2009 Results
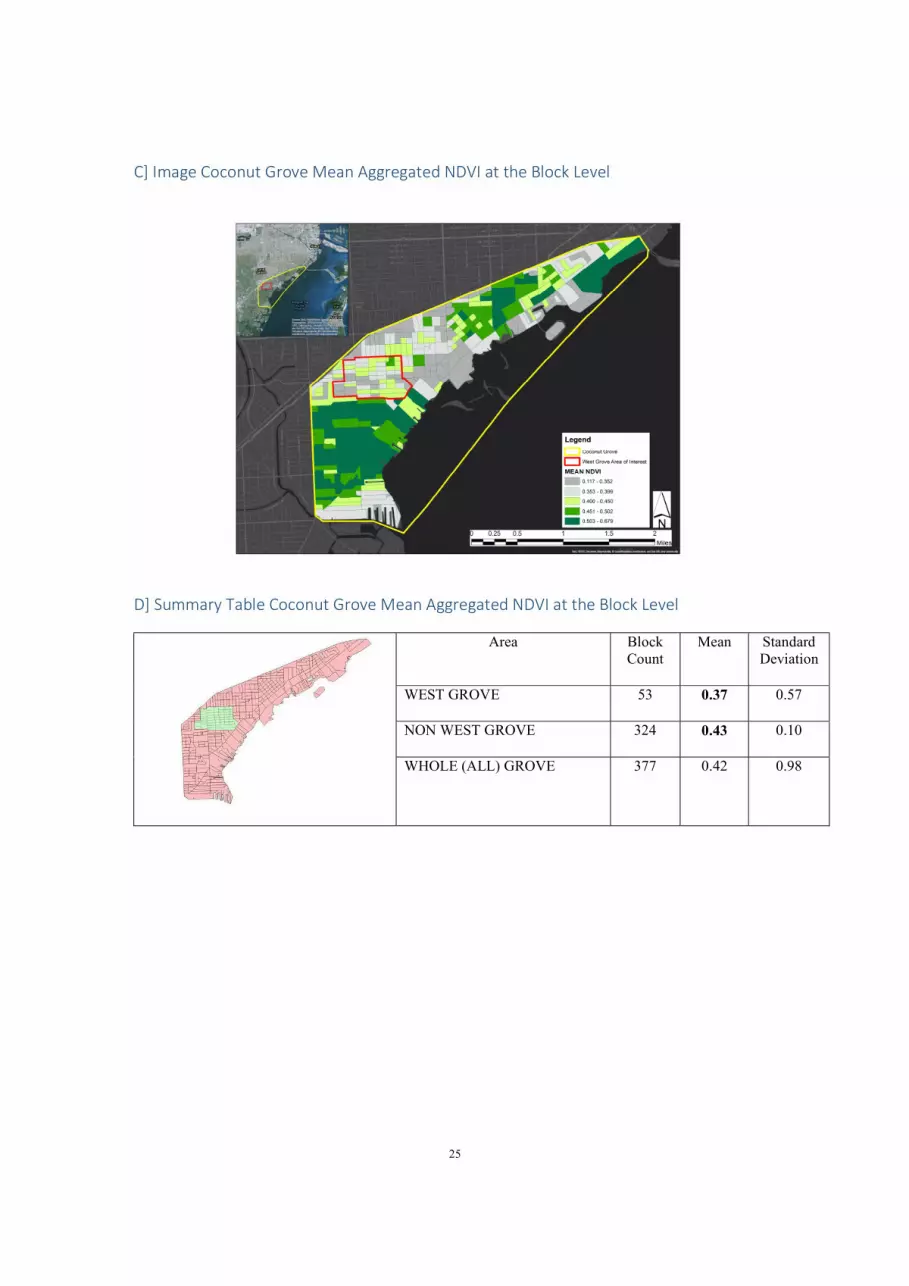
Both graphical representations (Image A and C below) clearly show a marked difference in vegetation cover between the West Grove and the South Grove. It is interesting to note that the lower value NDVI blocks also extend from the West Grove into surrounding area to its East (into the Centre Grove) and to its North. This may be the result of higher density development (zoning) in these areas. The NDVI results recover again somewhat into the North Grove—but not to the extent of the coverage represented in the South Grove. Surprisingly, some of the blocks that include park spaces along the coast have a low NDVI classification. With closer inspection, it can be seen that other land uses in some of the blocks with parks may have reduced their NDVI considerably (see Images E, F and Annex 1/ Raw NDVI diagrams C &D). An indicative statistical comparison between the NDVI of the West Grove and the remainder of the Grove was also undertaken and the results are listed below. Notably, the Non West Grove shows 23.8% of its census blocks with NDVI>0.6599 (i.e. robust tree cover threshold) in contrast with the West Grove which shows 12.6% (see Table B below). However, the difference between the two areas census blocks’ means aggregated NDVI was far less distinct (West Grove: 0.37 vs. Non West Grove 0.42). The West Grove’s mean values are shown to be marginally lower than that of the Whole Grove (West Grove: 0.37 vs. Non West Grove 0.43) (see Table D below). What is notable is the marked difference between the South Grove and the West Grove. The distinction between the West Grove and the area to its North and East is far less clear cut.
16 For greater detail on WV2 image characteristics, please see the extracted metadata listed in the supporting documentation section at the end of this document. The multispectral image was atmospherically, radiometrically and geometrically corrected. This was a level 3A image: meaning that radiometric correction, geometric correction and orthorectification have been processed for the image. (Source: http://jpe.oxford journals.org/ content/1/ 1/9.full)
17 World View2 image band characteristics: Panchromatic: 450 - 800 nm 8 Multispectral: Coastal: 400 - 450 nm Red: 630 -690 nm Blue: 450 - 510 nm Red Edge: 705 - 745 nm Green: 510 - 580 nm Near-IR1: 770 - 895 nm Yellow: 585 - 625 nm Near-IR2: 860 - 1040 nm

24
A] Image Coconut Grove Percentage of Block Area with NDVI> 0.6599
B] Summary Table Coconut Grove Percentage of Block Area with NDVI> 0.6599
Area Block Count
Mean Standard Deviation
WEST GROVE (Green) 53 0.126 0.054
NON WEST GROVE (Pink) 324 0.238 0.139
WHOLE (ALL) GROVE 377 0.221 0.136
25
C] Image Coconut Grove Mean Aggregated NDVI at the Block Level
D] Summary Table Coconut Grove Mean Aggregated NDVI at the Block Level
Area Block Count
Mean Standard Deviation
WEST GROVE 53 0.37 0.57
NON WEST GROVE 324 0.43 0.10
WHOLE (ALL) GROVE 377 0.42 0.98
26
E] Coconut Grove World View 2 True Image (including bay water)
F] Coconut Grove Raw NDVI (zoomed to West and Center Grove)

27
Limitations and considerations
A number of limitations of the above methodology should be noted. The NDVI results were expressed through a framework of census blocks which are not natural and thus arbitrary. Results may have been distorted. Whilst water areas were removed from the analysis (which generally register lower NDVI values, below 0.25 or lower), there may be other types of water bodies—namely swimming pools – that could potentially skew the values of NDVI of a particular block. There are not many swimming pools in the West Grove.
Using the mean as a measure of central tendency is more influenced by the existence of outliers. For example, if a census block is predominantly vegetated, but also contains an area that is highly built (non-vegetated), those non-vegetated pixels can skew the output of the mean NDVI for that particular block. The inverse can apply too: a block that is predominantly built (non-vegetated), may have a small number of pixels registering relatively high NDVI values, which will make the overall mean NDVI for that block higher than the majority of the block’s area would otherwise suggest.
In an attempt to reduce these data and methodological limitations, two different measures of NDVI at the block level were used: mean NDVI, and the percentage of total block area that registered NDVI pixel values of at least 0.66. The rationale for this threshold is twofold: firstly, as well-documented in the literature (LandscapeToolbox), only pixels registering NDVI values of greater than 0.25 are potentially living vegetation. Secondly, in light of the minimum threshold NDVI value for vegetation (0.25), an attempt was made to quantitatively capture the qualitative differences between vegetation types. Grass surfaces, for instance, will register NDVI values above 0.25, but will not register NDVI values as high as thick urban tree canopy.
It should also be noted that even at the very high resolution of this image, some smaller younger trees may still have dropped out of the analysis. The image was acquired during the leaf-on season (dated 11 May 2009) but NDVI values can still be influenced by other external factors (e.g., view angle, leaf orientation, and soil background (Campbell 2007). Furthermore, NDVI results may be heavily influenced by clouds and aerosols can often block the satellites’ view of the surface entirely, whilst temporary malfunctions and distortions may also have occurred. Therefore analysis of a single image may not be so reliable. Longer term averages of vegetation data help remove errors caused by clouds, but also unfortunately remove detail helpful when studying small areas (Weler 2000).
28
Historical Aerial Photography of West Grove
1924
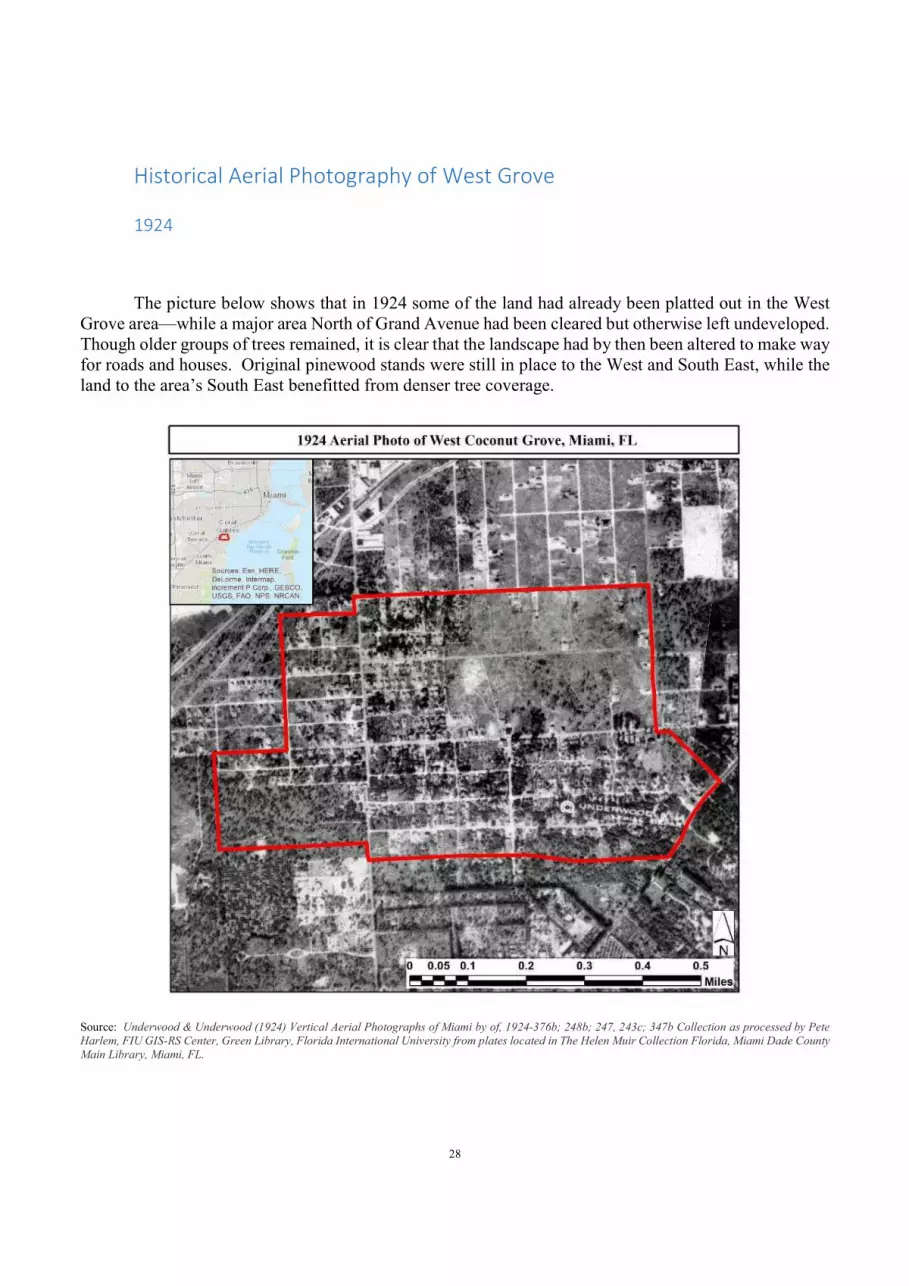
The picture below shows that in 1924 some of the land had already been platted out in the West Grove area—while a major area North of Grand Avenue had been cleared but otherwise left undeveloped. Though older groups of trees remained, it is clear that the landscape had by then been altered to make way for roads and houses. Original pinewood stands were still in place to the West and South East, while the land to the area’s South East benefitted from denser tree coverage.
Source: Underwood & Underwood (1924) Vertical Aerial Photographs of Miami by of, 1924-376b; 248b; 247, 243c; 347b Collection as processed by Pete Harlem, FIU GIS-RS Center, Green Library, Florida International University from plates located in The Helen Muir Collection Florida, Miami Dade County Main Library, Miami, FL.
29
1928
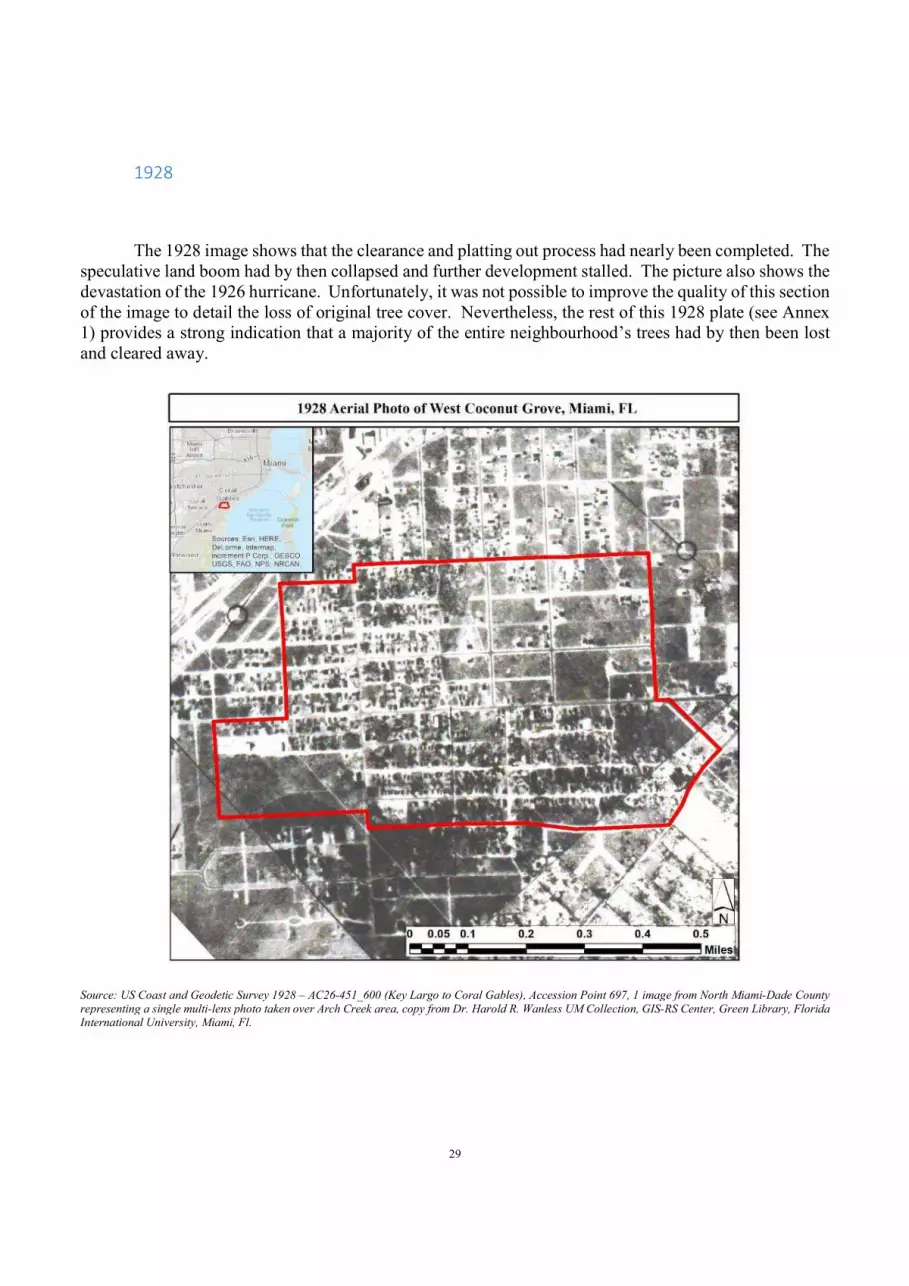
The 1928 image shows that the clearance and platting out process had nearly been completed. The speculative land boom had by then collapsed and further development stalled. The picture also shows the devastation of the 1926 hurricane. Unfortunately, it was not possible to improve the quality of this section of the image to detail the loss of original tree cover. Nevertheless, the rest of this 1928 plate (see Annex 1) provides a strong indication that a majority of the entire neighbourhood’s trees had by then been lost and cleared away.
Source: US Coast and Geodetic Survey 1928 – AC26-451_600 (Key Largo to Coral Gables), Accession Point 697, 1 image from North Miami-Dade County representing a single multi-lens photo taken over Arch Creek area, copy from Dr. Harold R. Wanless UM Collection, GIS-RS Center, Green Library, Florida International University, Miami, Fl.

30
1940
By 1940, tree canopy appears to have recovered—even on land that had been previously cleared, platted out and subsequently left vacant. After 1928, further housing development had happened mainly in the South and West of the area. Racial segregation and other urban planning issues, in combination with the effects of the economic depression, impacted the development elsewhere in the area. More trees are also evident around West Grove houses.
Source: U.S. Department of Agriculture (1940) Historical Aerial Photography for the Greater Everglades of South Florida: The 1940, 1:40,000 Photoset, USGS [U.S. Department of Agriculture, Soil Conservation Service (USDA/SCS)] RG 114: Aerial Photography; CJF-14-83; Can DN3690

31
1971
The establishment of uniform housing in the area was driven mainly by housing needs for (WWII) service personnel in the Miami area, as well as federal courts’ rulings that segregated (public) housing was unlawful. Tree coverage around houses can be clearly seen with the notable exception of the project in the area’s South West corner. The recovery of canopy coverage is far more notable to the South of the West Grove area.
Source: Florida Department of Transportation, FDOT Surveying & Mapping Office: 1971 Miami Dade County Aerial Photography: B/W MIA0824-10- 04
32
1985
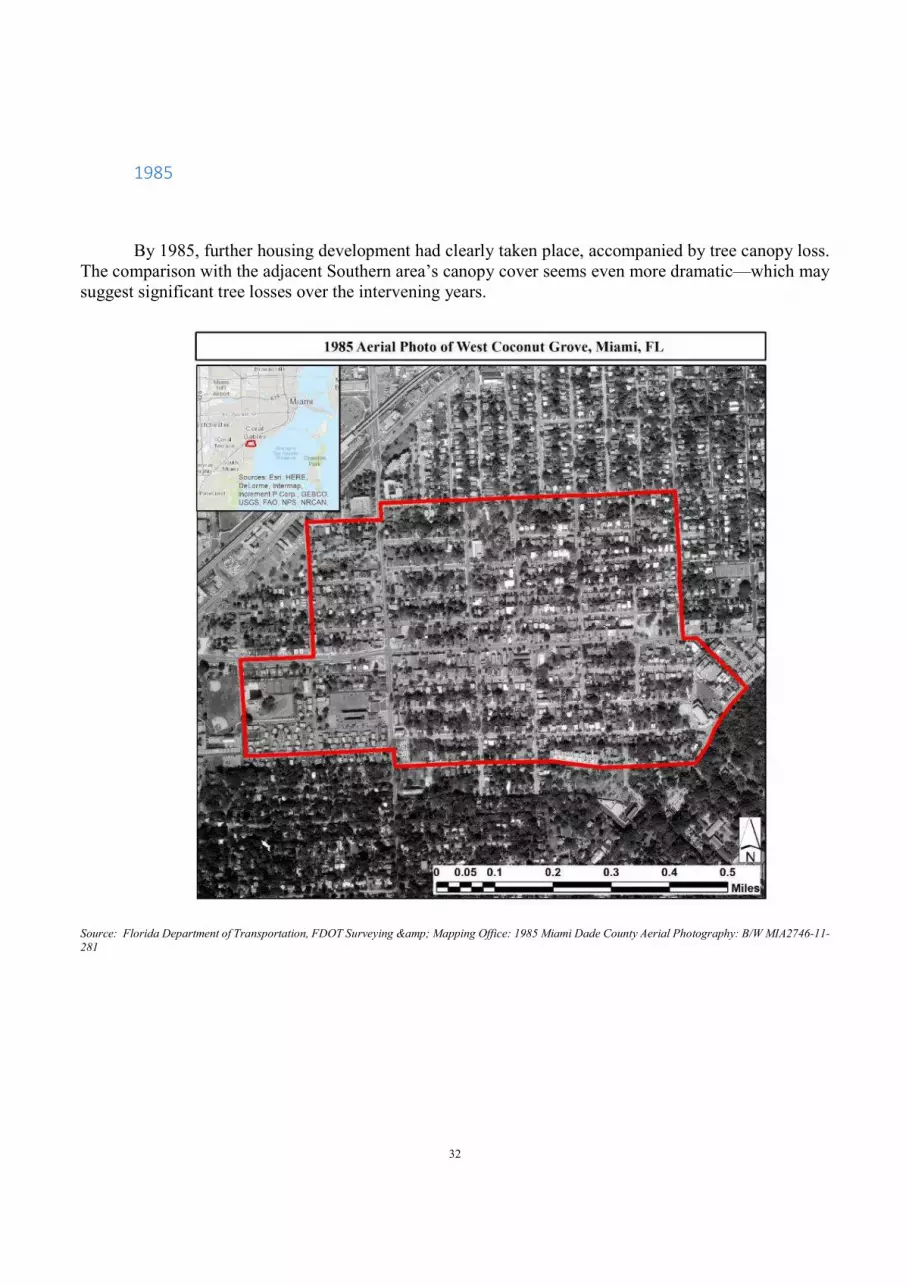
By 1985, further housing development had clearly taken place, accompanied by tree canopy loss. The comparison with the adjacent Southern area’s canopy cover seems even more dramatic—which may suggest significant tree losses over the intervening years.
Source: Florida Department of Transportation, FDOT Surveying & Mapping Office: 1985 Miami Dade County Aerial Photography: B/W MIA2746-11- 281

33
2015
The most recent image shows the pattern of greater tree canopy to the South of the area becoming
more entrenched. Meanwhile housing density seems to have been reduced. This is likely due to many lots having been cleared (now green grass) as a function of land speculation and other development initiatives. Lot-line housing developments (i.e. maximizing the construction footprint on a given area) may replace these cleared lots and thus further limit tree canopy growth.
Source: Florida Department of Transportation, FDOT Surveying & Mapping Office: 2015 Miami Dade County Aerial Photography: Orthophoto MIA15-471 & MIA15-648

34
Limitations and recommendations for future study
The lack of high resolution and wide spectrum imagery limited the quantitative assessment of historical canopy levels. Furthermore, the poor quality of some of these aerial photos (due to varying shadows, atmospheric conditions, variations in altitude, lens imperfections and warped plates) made precise quantitative assessments through hand digitization impossible. A determination of comparative accuracies between automated (remoted sensed) and hand-drawn (digitized) methods to assess canopy cover would be a necessary prerequisite before accepting any quantitative assessment of the older aerial imagery.
Furthermore, a further study to compare the results of Coconut Grove’s NDVI results with those classified as Urban Tree Canopy is recommended. Moreover, further research on both historical and current block census data in Coconut Grove would provide greater insight into how demographic characteristics (such as land tenure, income and education) could relate to local canopy cover.
Finally, useful forecasting and planning data could be obtained by analyzing possible future impact on canopy cover from high density (multi-family) apartment blocks and lot-line house developments in the West Grove along with projections for long-term sea-level change. The inclusion of updated satellite imagery showing the impact of new parkland and trees (Regatta Park) on Coconut Grove’s mean NDVI results would also be beneficial.
35
Overview and Conclusion
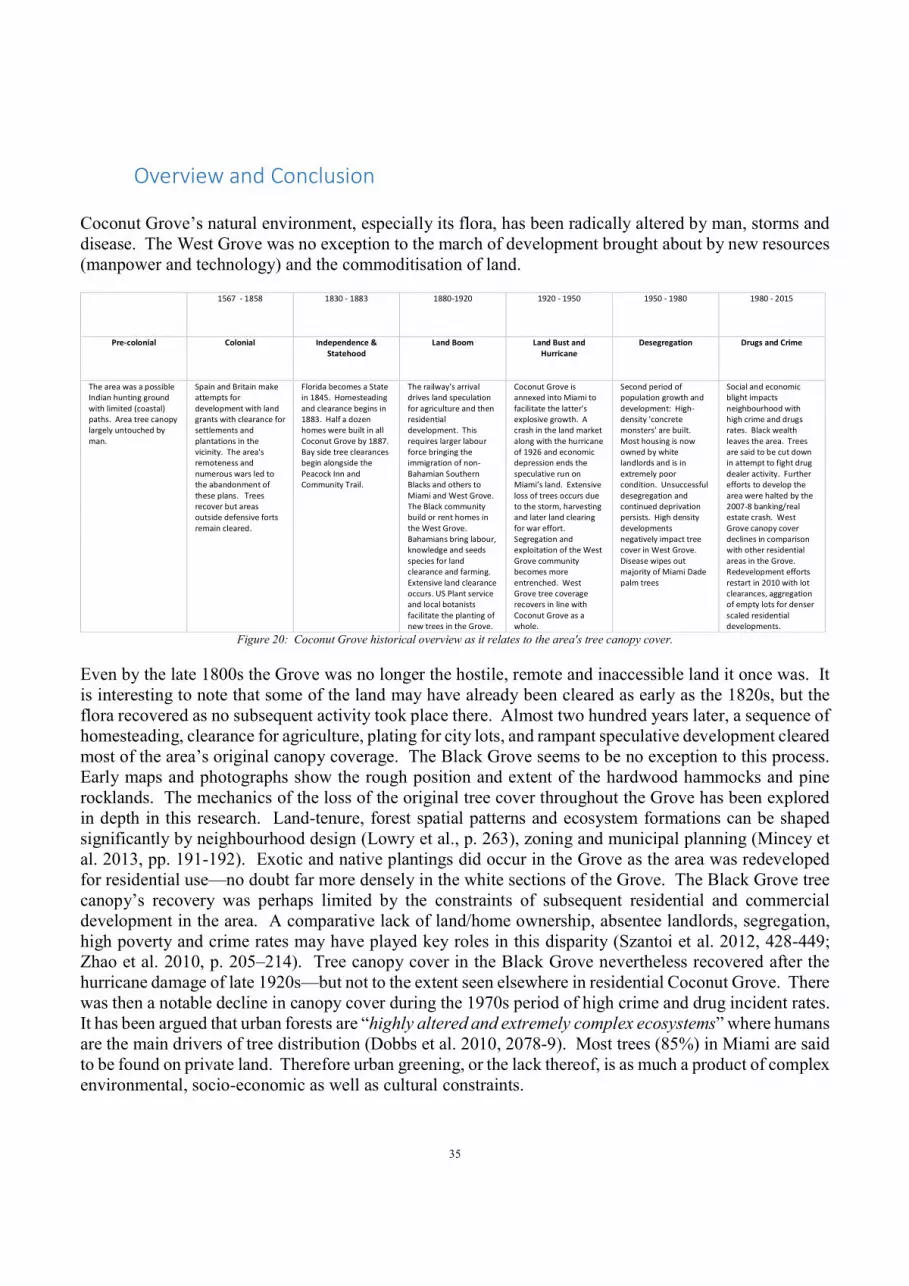
Coconut Grove’s natural environment, especially its flora, has been radically altered by man, storms and disease. The West Grove was no exception to the march of development brought about by new resources (manpower and technology) and the commoditisation of land.
1567 - 1858 1830 - 1883 1880-1920 1920 - 1950 1950 - 1980 1980 - 2015
Pre-colonial Colonial Independence & Statehood
Land Boom Land Bust and Hurricane
Desegregation Drugs and Crime
The area was a possible Indian hunting ground with limited (coastal) paths. Area tree canopy largely untouched by man.
Spain and Britain make attempts for development with land grants with clearance for settlements and plantations in the vicinity. The area's remoteness and numerous wars led to the abandonment of these plans. Trees recover but areas outside defensive forts remain cleared.
Florida becomes a State in 1845. Homesteading and clearance begins in 1883. Half a dozen homes were built in all Coconut Grove by 1887. Bay side tree clearances begin alongside the Peacock Inn and Community Trail.
The railway's arrival drives land speculation for agriculture and then residential development. This requires larger labour force bringing the immigration of non-Bahamian Southern Blacks and others to Miami and West Grove. The Black community build or rent homes in the West Grove. Bahamians bring labour, knowledge and seeds species for land clearance and farming. Extensive land clearance occurs. US Plant service and local botanists facilitate the planting of new trees in the Grove.
Coconut Grove is annexed into Miami to facilitate the latter's explosive growth. A crash in the land market along with the hurricane of 1926 and economic depression ends the speculative run on Miami’s land. Extensive loss of trees occurs due to the storm, harvesting and later land clearing for war effort. Segregation and exploitation of the West Grove community becomes more entrenched. West Grove tree coverage recovers in line with Coconut Grove as a whole.
Second period of population growth and development: High-density 'concrete monsters' are built. Most housing is now owned by white landlords and is in extremely poor condition. Unsuccessful desegregation and continued deprivation persists. High density developments negatively impact tree cover in West Grove. Disease wipes out majority of Miami Dade palm trees
Social and economic blight impacts neighbourhood with high crime and drugs rates. Black wealth leaves the area. Trees are said to be cut down in attempt to fight drug dealer activity. Further efforts to develop the area were halted by the 2007-8 banking/real estate crash. West Grove canopy cover declines in comparison with other residential areas in the Grove. Redevelopment efforts restart in 2010 with lot clearances, aggregation of empty lots for denser scaled residential developments.
Figure 20: Coconut Grove historical overview as it relates to the area's tree canopy cover.
Even by the late 1800s the Grove was no longer the hostile, remote and inaccessible land it once was. It is interesting to note that some of the land may have already been cleared as early as the 1820s, but the flora recovered as no subsequent activity took place there. Almost two hundred years later, a sequence of homesteading, clearance for agriculture, plating for city lots, and rampant speculative development cleared most of the area’s original canopy coverage. The Black Grove seems to be no exception to this process. Early maps and photographs show the rough position and extent of the hardwood hammocks and pine rocklands. The mechanics of the loss of the original tree cover throughout the Grove has been explored in depth in this research. Land-tenure, forest spatial patterns and ecosystem formations can be shaped significantly by neighbourhood design (Lowry et al., p. 263), zoning and municipal planning (Mincey et al. 2013, pp. 191-192). Exotic and native plantings did occur in the Grove as the area was redeveloped for residential use—no doubt far more densely in the white sections of the Grove. The Black Grove tree canopy’s recovery was perhaps limited by the constraints of subsequent residential and commercial development in the area. A comparative lack of land/home ownership, absentee landlords, segregation, high poverty and crime rates may have played key roles in this disparity (Szantoi et al. 2012, 428-449; Zhao et al. 2010, p. 205–214). Tree canopy cover in the Black Grove nevertheless recovered after the hurricane damage of late 1920s—but not to the extent seen elsewhere in residential Coconut Grove. There was then a notable decline in canopy cover during the 1970s period of high crime and drug incident rates. It has been argued that urban forests are “highly altered and extremely complex ecosystems” where humans are the main drivers of tree distribution (Dobbs et al. 2010, 2078-9). Most trees (85%) in Miami are said to be found on private land. Therefore urban greening, or the lack thereof, is as much a product of complex environmental, socio-economic as well as cultural constraints.
36
Bibliography
Ahern, J. (2013) Urban landscape sustainability and resilience: the promise and challenges of integrating ecology with urban planning and design. Landscape Ecology, Vol. 28(6), pp. 1203–1212.
Anderson, J., et al. (1976) A land use and land cover classification for use with remote sensor data, U.S. Geological Survey Professional Paper 964, Washington, U.S. Government Printing Office.
Brevard, M. (1904) History of Florida. New York: American Book Company, pp.275.
Buck, J. (1979) “Biscayne Sketches at the Far South” Tequesta, Vol. 34, pp.70-86.
Bright, J. (1920) A preliminary report for Coconut Grove, Florida on the subject of a town plan, History Miami Archives (Munroe Collection)
Carreiras, J., Pereira, J. (2006) Estimation of tree canopy cover in evergreen oak woodlands using remote sensing, Forest Ecology and Management, Vol. 223(1–3):45-53.
Conway, T., Bourne, K. (2013) A comparison of neighborhood characteristics related to canopy cover, stem density and species richness in an urban forest. Landscape and Urban Planning, Vol. 113, pp.10–18.
City Planning and Zoning Board of Miami Slum Clearance Committee (1949): Dwelling conditions in the two principal blighted areas [Coconut Grove Negro area and the central Negro area] Miami, Florida.
Coconut Grove Business Improvement District (2014), The History of Coconut Grove, available on http://coconutgrove.com/history/. Accessed Sept 21, 2015.
Connolly, N. (2008) Explosions, Eminent Domain, and Other Reponses to the Negro Housing Problem By Eminent Domain: Race and Capital in the Building of an American South Florida, Dissertation (PhD) , The University of Michigan, UMI Microform 3328795 available through http://search.proquest.com/docview/304575926
Conway, T., Bourne, K. (2013). A comparison of neighbourhood characteristics related to canopy cover, stem density and species richness in an urban forest. Landscape and Urban Planning, Vol. 113, pp. 10–18.
Craighead, H (1971) The Trees of South Florida: The Natural Environment and Their Succession. Miami: University of Miami Press. pp.212.
Dai, D. (2011) “Racial/ethnic and socioeconomic disparities in urban green space accessibility: Where to intervene?” Landscape and Urban Planning, Vol. 102, pp.234-244.
Davies, G. (2014) “Introduction: The American Politics of Disaster from the Civil War to the Present”, Journal of Policy History, Vol. 26, No. 03, July 2014, pp. 299-304.

37
DigitalGlobe (2013) WorldView-2, Available on http://global.digitalglobe.com/sites/default/ files/DG_WorldView2_DS_PROD.pdf
Dunn, M. (1995). Black Miami: the history and status of Blacks in Dade County, Florida (1896-1996). [Miami, Fla.?], unpublished manuscript: Florida International University Special Collections.
Dunn, M. (1997). Black Miami in the twentieth century. Gainesville: University Press of Florida.
Eastman, J. (1995) Idrisi for Windows. User's Guide. In Clarks Labs for Cartographic Technology and Geographic analysis, Vol. 5.
Escobedo, F., Klein, J., Pace, M., Mayer, H., Varela, S. (2014) Miami Dade County’s Urban Forests and Their Ecosystem Services, available on http://edis.ifas.ufl.edu/fr347, accessed 20 September, 2015.
Falco, T. (2016) Greed is Ruining the Charter of the Grove, Coconut Grove Grapevine, available on http://coconutgrovegrapevine.blogspot.com/2016/04/greed-is-ruining-character-of-grove.html, accessed on 6 April, 2016.
Farr, D. (2007) Sustainable Urbanism: Urban Design with Nature, Hoboken, NJ, John Wiley & Sons, pp.352.
Federation of American Scientists (undated) VEGETATION APPLICATIONS: AGRICULTURE, FORESTRY, AND ECOLOGY General Principles For Recognizing Vegetation in DEDICATION of the REMOTE SENSING TUTORIAL available on http:// fas.org/irp/imint/docs/rst/Sect3/Sect3_1.html
Fleischmann, T (1992), “Black Miamians in The Miami Metropolis”, 1896-1900, Tequesta, Vol. 52, pp.21-38.
Flocks, J., Escobedo, F., Wade, J., Varela, S., Wald, C., (2011) Environmental Justice Implications of Urban Tree Cover in Miami-Dade County, Florida. Environmental Justice, Vol. 4, No. 2, 2011.
Florida Department of Transportation, FDOT Surveying & Mapping Office: 1971 Miami Dade County Aerial Photography: B/W MIA0824-10-04
Florida Department of Transportation, FDOT Surveying & Mapping Office: 1985 Miami Dade County Aerial Photography: B/W MIA2746-11-281
Florida Department of Transportation, FDOT Surveying & Mapping Office: 2015 Miami Dade County Aerial Photography: Orthophoto MIA15-471 & MIA15-648
George, P (1995) A Journey Through Time: A Pictorial History of South Dade, Homestead, Fl: Community Bank of Homestead
George, P. (1996) “Miami: One Hundred Years of History”, South Florida History, Vol. 24, No. 2. pp.?

38
George, P.(1979) “Policing Miami’s Black Community, 1896-1930”, The Florida Historical Quarterly, Vol. 57, No. 4, pp.434-450.
Gibson, T. (2000) Forbearance, the Life Story of a Cocoanut Grove Native. Homestead, Florida: Helena Enterprises. pp.140.
Gómez, F., Jabaloyes, J., Montero, L., De Vicente, V., and Valcuende, M. (2011). Green Areas, the Most Significant Indicator of the Sustainability of Cities: Research on Their Utility for Urban Planning. Journal of Urban Planning Development. Vol. 137(3), pp.311–328.
Gurley (2013) “The (Segregation) Walls That Divide Us.” Metro Atlantic: Architecture, cities, transit and urbanism, 06 Mat 2013, available on https://metroatlantic.wordpress.com/2013/05/06/the-segregation-walls-that-divide-us/, assessed on 21 January 2016
Hamaludin, M. (2014) WEST GROVE GETTING HOUSING COMPLEX, South Florida Times, April 24, 2014, Available from http://goo.gl/jrDmhe
Herzfeld, M., (2010). “Engagement, gentrification, and the neoliberal hijacking of history” in Current Anthropology. Vol. 51, pp. 259-267.
Hine, A. (2013) Geologic History of Florida: Major Events That Formed the Sunshine State, Gainesville: University Press of Florida, pp.229.
Historical and Environmental Preservation Board, City of Miami (2015) FRANTZ RESIDENCE 3529 ST. GAUDENS ROAD Designation Report, pp. 6-7, Available from http://egov.ci.miami.fl.us/Legistarweb/Attachments/79890.pdf
Historical Association of Southern Florida (1976) Early Man in South Florida, Update – Vol. 3, No. 5, pp.?
Hochmair, Hartwig Henry; Gann, Daniel; Benjamin, Adam; and Fu, Zhaohui Jennifer, "Miami-Dade Urban Tree Canopy Analysis" (2015). GIS Center. Paper 44. http://digitalcommons.fiu.edu/gis/44
Hudson, F. (1943) “Beginnings in Dade County”, Tequesta, Vol. 1, No. 3, pp.1-35.
Jenkins Fields, D. (1975) Reflections on Black History: Coconut Grove 1880-1903, Update – Historical Association of Southern Florida, Vol. 3, no. 2, pp.?
Jewell, S. (2011) Exploring Wild South Florida, Pineapple Press Inc, pp.344.
Kent, G. (1971) "The Coconut Grove School," Tequesta, No. XXXI, pp.3-17.
Kallergis (2016) “Land assemblage in Coconut Grove hits the market for $40M” The Real Deal: South Florida Real Estate News, 13 May 2016 available from therealdeal.com/miami/2016/05/13/land-assemblage-in-coconut-grove-hits-the-market-for-40m
Kirkman, R. (2010). The Ethics of Metropolitan Growth: The Future of our Built Environment. London: Continuum. 174pp.
39
Konijnendijk, C. Nilsson, K., Randrup, T., Schipperijn, J. (Eds.), (2005). Urban Forests and Trees. Springer, Heidelberg. pp.516.
Kuttler, W. (2008) The Urban Climate – Basic and Applied Aspects. In Marzluff, J., Shulenberger, E., Endlicher, W., Alberti, M., Bradley, G., Ryan, C., ZumBrunnen, C. (Eds.), Urban Ecology, Springer US: New York, pp.233–248.
Landscape Toolbox USDA-ARS (2013) Normalized Difference Vegetation Index available on http://wiki.landscapetoolbox.org/doku.php/remote_sensing_methods:normalized_difference_vegetation_index accessed 02 March 2016.
Lillesand & Kiefer (2004) Remote sensing and image interpretation, New York: John Wiley & Sons.
Livingstone, G. (2000) “The Annexation of Coconut Grove”, Tequesta, No. LX, pp.32-56.
Lombard, J. (2001) Historic Landscapes of Florida, Miami: Deering Foundation and University of Miami School of Architecture, pp.134.
Loomis, H. (1957) Activities of the U.S. Plant Introduction Garden (edited 2001) United States Department of Agriculture – Agriculture Research Service. Available on http://www.ars.usda.gov/Research/docs.htm?docid=13849 accessed 10 October 2015
Loope, L. (1996) Effects of Hurricane Andrew on Natural and Archeological Resources, Technical Report NPS/NRGCC/NRTR/96-02, Homestead, FL: National Park Service, pp.200.
Loopnet (2016) 3396 Grand Ave Coconut Grove, FL 33133 ·276,035 SF · Land for Sale. Grove Assemblage (6 city blocks) $36,000,000. Available on http://www.loopnet.com/Listing/18918428/3396-grand-ave-Coconut-Grove-FL/ accessed 7 April 2016
Lowry, J., Baker, M., Ramsey R. (2011) Determinants of urban tree canopy in residential neighborhoods: Household characteristics, urban form, and the geophysical landscape. Urban Ecosystems, pp.247-266.
Lunetta, R., Lyon, J. (2004) Remote Sensing and GIS Accuracy Assessment. CRC Press
Mansfield, C., Pattanayak, S.K., McDow, W., McDonald, R., Halpin, P. (2005) Shades of Green: Measuring the value of urban forests in the housing market. Journal of Forest Economics, Elsevier, Vol. 11(3), pp.177-199.
Marks, H. (1958) The Earliest Land Grants in the Miami Area, Tequesta 58-1-03, pp.15-22.
McVoy, C., Obeysekera, J., Said, W., Vanarman, J., Dreschel, T. (2011) Landscapes and Hydrology of the Predrainage Everglades. Gainesville, Fla: University Press of Florida, 342pp.
Merrick, G. (1941) “Pre-Flagler Influences on the Lower Florida East Coast”, Tequesta, Vol. 1, No. 1, p.1-10.

40
Metropolitan Dade County (Fla.) (1982) From wilderness to metropolis: The history and architecture of Dade County, Florida, 1825-1940. Miami: Metropolitan Dade County.
MIAMI (FLA) (1974) A planning study for Coconut Grove. Miami, Fla, City of Miami, Planning Dept.
Miami Daily News (1941) Negro Homes in White Town Protested, Section B, p. 1, June 12, 1941 available from The Black Archives History and Research Foundation of South Florida, see http://theblackarchives.org/archon/index.php?p=digitallibrary/digital content &id=32
Miami-Dade County (2007) Street Tree Master Plan. Florida: Community Image Advisory Board, pp.17. Miami Dade County, (2012). Parks & Recreation Master Plan Review, from http://www.miamidade.gov/parksmasterplan/master-plan.asp accessed July 10, 2014.
Miami-Dade County (2013) Miami-Dade County At-A-Glance. Miami-Dade County, Department of Regulatory and Economic Resources, October 2013, pp4, available through http://www.miamidade.gov/info/about_miami-dade.asp, accessed Nov 10, 2014.
Miller, G., Spoolman, S. (2013) Environmental science: sustaining the earth. Wadsworth & Brooks/Cole Adv. Books & Software, pp.552.
Millspaugh, M. (2013) The Human Side of Urban Renewal. London: Forgotten Books. (Original work published pre-1945, year unknown, pp.118-9.
Mincey, S., Schmitt-Harsh, M., Thurau, R. (2013) Zoning, land use, and urban tree canopy cover: The importance of scale. Urban Forestry & Urban Greening, Vol. 12, No. 2, pp.191-199.
Mohl, R. (1987) “Black Immigrants: Bahamians in Early Twentieth-Century Miami”, The Florida Historical Quarterly, Vol. 65, No. 3, pp.271-297.
Mohl, R. (2001) "Elizabeth Virrick and the 'Concrete Monsters': Housing Reform in Postwar Miami." -- in Tequesta, no. 61, pp.5-37.
Moore Parks, A. (1971) “The History of Coconut Grove, Florida 1821-1925”, Thesis (M.A.) University of Miami, pp.78.
Moore Parks, A. (1975) “Miami in 1876”, Tequesta, Vol. 35, pp.89-139.
Moore Parks, A., and Bennett, B. (2010) Images of America, Coconut Grove. Chicago: Arcadia Publishing, pp.128.
Myeong, S., Nowak, D., Hopkin, P (2003) Urban cover mapping using digital, multi-spatial resolution aerial imagery, Urban Ecosystems, Vol. 5: 243–256.
Newman, Paul (1993) Monitoring urban forest canopy cover using satellite imagery, Environmental monitoring and assessment, Vol. 26(2-3) pp.175-176.

41
Nichol, L., Lee, C, (2005) Urban vegetation monitoring in Hong Kong using high resolution multispectral images, International Journal of Remote Sensing, Vol. 26(5), pp.903-918.
Nielsen, Kirk (2005) Fables of the Reconstruction, Miami New Times, July 14, 2005. available on http://www.miaminewtimes.com/news/fables-of-the-reconstruction-6339633
NOAA / National Weather Service Forecast Office Miami Florida (2007) Memorial Web Page for 1926 Great Miami Hurricane, Available on http://www.srh.noaa.gov/mfl/?n=miami_hurricane
Nowak, D., Rowntree, R., McPherson, E., Sisinni, S., Kerkmann, E., Stevens, J., (1996) Measuring and analyzing urban tree cover. Landscape and Urban Planning Vol. 36, pp.49-57.
Official 1940 Census Website (2012) 1940 Census, available on http://1940census.archives.gov/, accessed January 2015 – February 2016.
Plasencia, A. (2011) "A History of West Coconut Grove from 1925: Slum Clearance, Concrete Monsters, and the Dichotomy of East and West Coconut Grove," All Theses. Paper 1117. Available from http://tigerprints.clemson.edu/all_theses/1117.
Plevak, P. (2012) A More Sustainable Urban Living in the United States, Journal of Multidisciplinary Research, Vol. 4(3), pp.85-92.
Price, C. (2003) Quantifying the aesthetic benefits of urban forestry. Urban Forestry & Urban Greening, Vol. 1(3), 2003, pp.123-133.
Rae, R., Simon, G., and Braden, J. (2010) Public reactions to new street tree planting. Cities and the Environment, Vol. 3, No. 1, pp.1-21.
Rivers, L., and Brown, C. (1996) “African Americans in South Florida: A Home and a Haven for Reconstruction-Era Leaders." Tequesta ,Vol. 56, pp.5-23.
Satellite view of Coconut Grove centred on 25°43'44.11"N 80°14'55.24"W, Google Earth, v. 7.1.2., 2013
Scharenbroch, B. (2012) Urban Trees for Carbon Sequestration. In R. Lal & B. Augustin (Eds.), Carbon Sequestration in Urban Ecosystems, Springer Netherlands, pp.121–138.
Sentenac, H. (2014) Miami Working to Plant One Million Trees by 2020; Increase Shade Canopy to 30 Percent. Miami New Times, Available on http://blogs.miaminewtimes.com/ cultist/2014/10/miami_working_to_plant_one_million_trees_by_2020_increase_shade_canopy_to_30_draft.php, Oct 2, 2014. Accessed November 7, 2014.
Shepard, R. (2002) The Grand Avenue Vision Plan. University of Miami School of Architecture’s Center for Urban and Community Design. available on http://goo.gl/ZKdevC
Shochat, E., Lerman, S., Anderies, J., Warren P., Stanley, H., Nilon, C. (2010) Invasion, Competition, and Biodiversity Loss in Urban Ecosystems. BioScience, Vol. 60, No. 3, pp.199-208.

42
Song, C., Woodcock, C., Seto, K., Lenney, M., Macomber, S., (2001) Classification and Change Detection Using Landsat TM Data: When and How to Correct Atmospheric Effects?, Remote Sensing of Environment, Vol. 75, No. 2, , pp. 230-244,
Staletovich, J. & Borns, J. (2013) West Grove: The Miami neighbourhood that time forgot, Miami Herald, 6 April 2013, available on http://www.miamiherald.com/news/local/in-depth/article1948901.html, accessed Feb 02, 2016
Stringfield, V. (1966) “Geologic formations and their water bearing properties, Geological Survey Professional Paper”, Artesian Water in Tertiary Limestone in Southeastern States, Vol. 517, pp.117.
Szantoi, Z., Escobedo, F., Wagner, J., Rodriguez, J., Smith, J. (2012) Socioeconomic Factors and Urban Tree Cover Policies in a Subtropical Urban Forest, GI Science & Remote Sensing, pp.428-449.
Taylor, J. (1976) “South Dade’s Black Pioneers”, Update – Historical Association of Southern Florida – Vol. 3, No. 5, pp.10-12.
Tebeau, C. (1971) A History of Florida, Coral Gables: University of Miami Press, pp.527.
Tenley, M. C., Bourne, K. (2013) A comparison of neighborhood characteristics related to canopy cover, stem density and species richness in an urban forest, Landscape and Urban Planning, Vol. 113, pp. 10-18.
Trudgeon, S. (2015) “Excuse Me, Where’s Coconut Grove? Inside Miami’s Little Bahamas.” miamirail.org. Available on http://miamirail.org/summer-2015/excuse-me-wheres-coconut-grove-inside-miamis-little-bahamas/
Underwood & Underwood (1924) Vertical Aerial Photographs of Miami by of, 1924-376b; 248b; 247, 243c; 347b Collection as processed by Pete Harlem, FIU GIS-RS Center, Green Library, Florida International University from plates located in The Helen Muir Collection Florida, Miami Dade County Main Library, Miami, FL.
U.S. Coast and Geodetic Survey 1928 – AC26-451_600 (Key Largo to Coral Gables), Accession Point 697, 1 image from North Miami-Dade County representing a single multi-lens photo taken over Arch Creek area, copy from Dr. Harold R. Wanless UM Collection, GIS-RS Center, Green Library, Florida International University, Miami, Fl.
U.S. Coast and Geodetic Survey USCGS1932_807_143D_Z (Black Point to Miami), Accession Point 807, copy of Dr. Harold R. Wanless UM Collection, GIS-RS Center, Green Library, Florida International University, Miami, Fl.
U.S. Department of Agriculture (1940) Historical Aerial Photography for the Greater Everglades of South Florida: The 1940, 1:40,000 Photoset, USGS [U.S. Department of Agriculture, Soil Conservation Service (USDA/SCS)] RG 114: Aerial Photography; CJF-14-83; Can DN3690

43
Viglucci, A. (2014) The resurgence of Coconut Grove, Miami Herald, 29 November 2014, available on http://www.miamiherald.com/news/local/community/miami-dade/coconut-grove/article4199797.html , accessed 10 October 2015.
Walker, J. (2008) Human-induced Vegetation Dynamics and Avian Responses in a Rapidly Expanding Desert Metropolis., ARIZONA STATE UNIVERSITY, pp. 105.
Walton, J. (2008) Difficulties with estimating city-wide urban forest cover change from national, remotely-sensed tree canopy maps, Urban Ecosystems, 11(1):81-90.
Walton, J.; Nowak, D.; Greenfield, E. (2008) Assessing urban forest canopy cover using airborne or satellite imagery. Arboriculture & Urban Forestry. 34(6): 334-340.
Waters, R. (1997) Dr William B. Sawyer of Colored Town, Tequesta: The Journal of the Historical Association of Southern Florida. Vol. 1, No. 57, p.67-80.
Weler, J., Herring D. (2000) Measuring Vegetation (NDVI & EVI), NASA Earth Observatory, 20 August 2000, available on http://earthobservatory.nasa.gov/Features/MeasuringVegetation/ assessed 5 April 2016.
Wei L., Saphores, J., Gillespie, T. (2015) A comparison of the economic benefits of urban green spaces estimated with NDVI and with high-resolution land cover data, Landscape and Urban Planning, Vol.133, pp.105-117.
Winsberg, M. (2003) Data for Miami Dade County – Florida Weather. University Press of Florida, Gainesville, 240 pp.
Wolkomir, M. et al. (1997) “Denominational Subcultures of Environmentalism” in Review of Religious Research. Vol. 38:340.
Wright, E (2010) It Happened in Florida, Guilford (CT): Morris Book Publishing. 177 pp.
Wulder M., Coops, N. (2014) Satellites: Make Earth observations open access. Nature. 513(7516):30-1.
Xie, Y, Sha, Z, and Yu, M (2008) Remote sensing imagery in vegetation mapping: a review. Journal of Plant Ecology. Available on http://jpe.oxfordjournals.org/content/1/1/9.short, Accessed November 2015.
Zhao, X., Escobedo, F., Staudhammer, C. (2010) Spatial patterns of as subtropical, coastal urban forest Implications for land tenure, hurricanes, and invasives. Urban Forestry & Urban Greening. Vol. 9, Issue 3, pp. 205–214.
Zhou, X., and Kim, J. (2013) “Social disparities in tree canopy and park accessibility: A case study of six cities in Illinois using GIS and remote sensing,” Urban Forestry & Urban Greening. Vol. 12, pp. 88-97
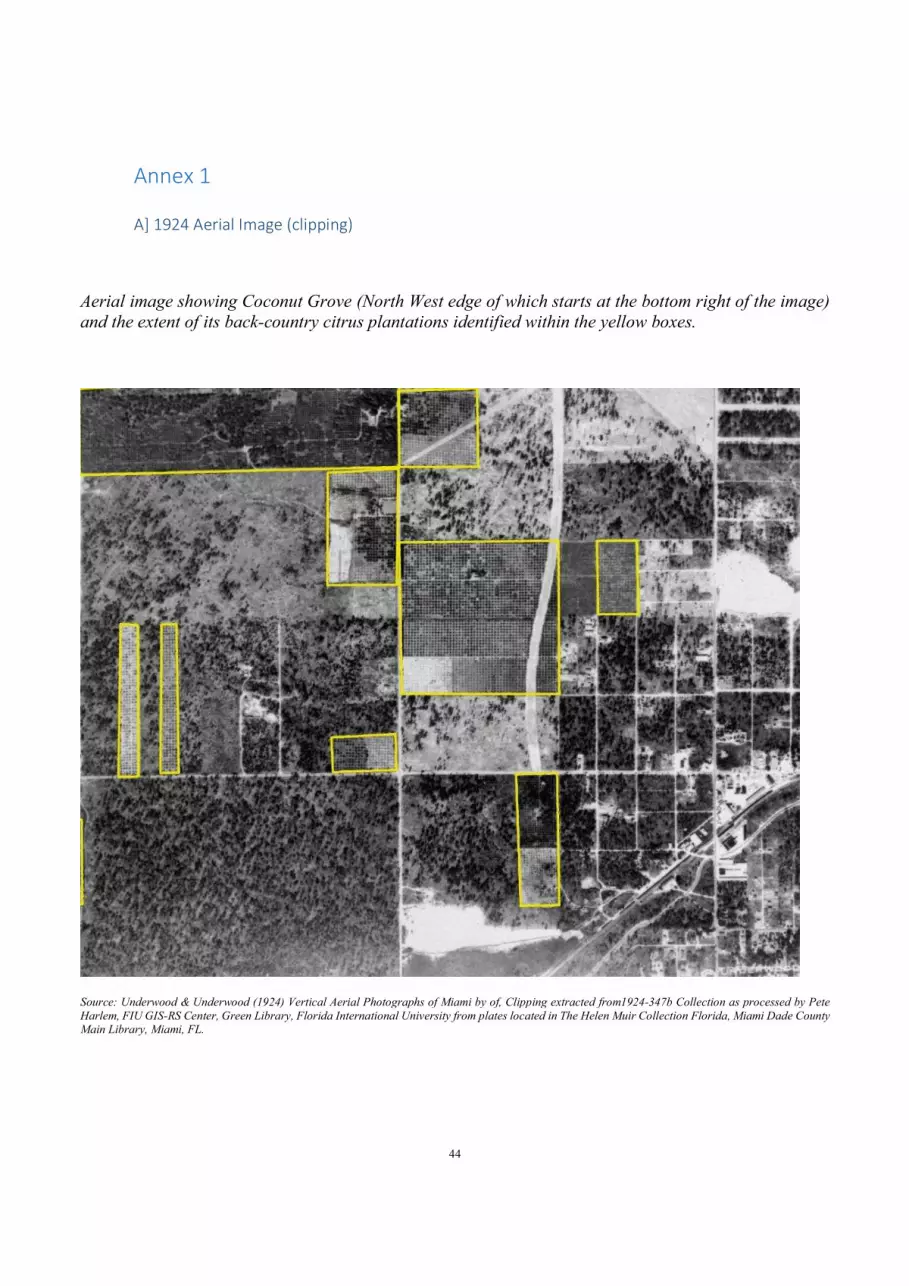
44
Annex 1
A] 1924 Aerial Image (clipping)
Aerial image showing Coconut Grove (North West edge of which starts at the bottom right of the image) and the extent of its back-country citrus plantations identified within the yellow boxes.
Source: Underwood & Underwood (1924) Vertical Aerial Photographs of Miami by of, Clipping extracted from1924-347b Collection as processed by Pete Harlem, FIU GIS-RS Center, Green Library, Florida International University from plates located in The Helen Muir Collection Florida, Miami Dade County Main Library, Miami, FL.

45
B] 1928 Aerial Image
Aerial image of parts of Coconut Grove, Silver Bluff and Coral Gables as viewed in 1928 after the housing market bust and extensive hurricane damage
Source: US Coast and Geodetic Survey 1928 – AC26-451_600 (Key Largo to Coral Gables), Accession Point 697, 1 image from North Miami-Dade County representing a single multi-lens photo taken over Arch Creek area, copy from Dr. Harold R. Wanless UM Collection, GIS-RS Center, Green Library, Florida International University, Miami, Fl.
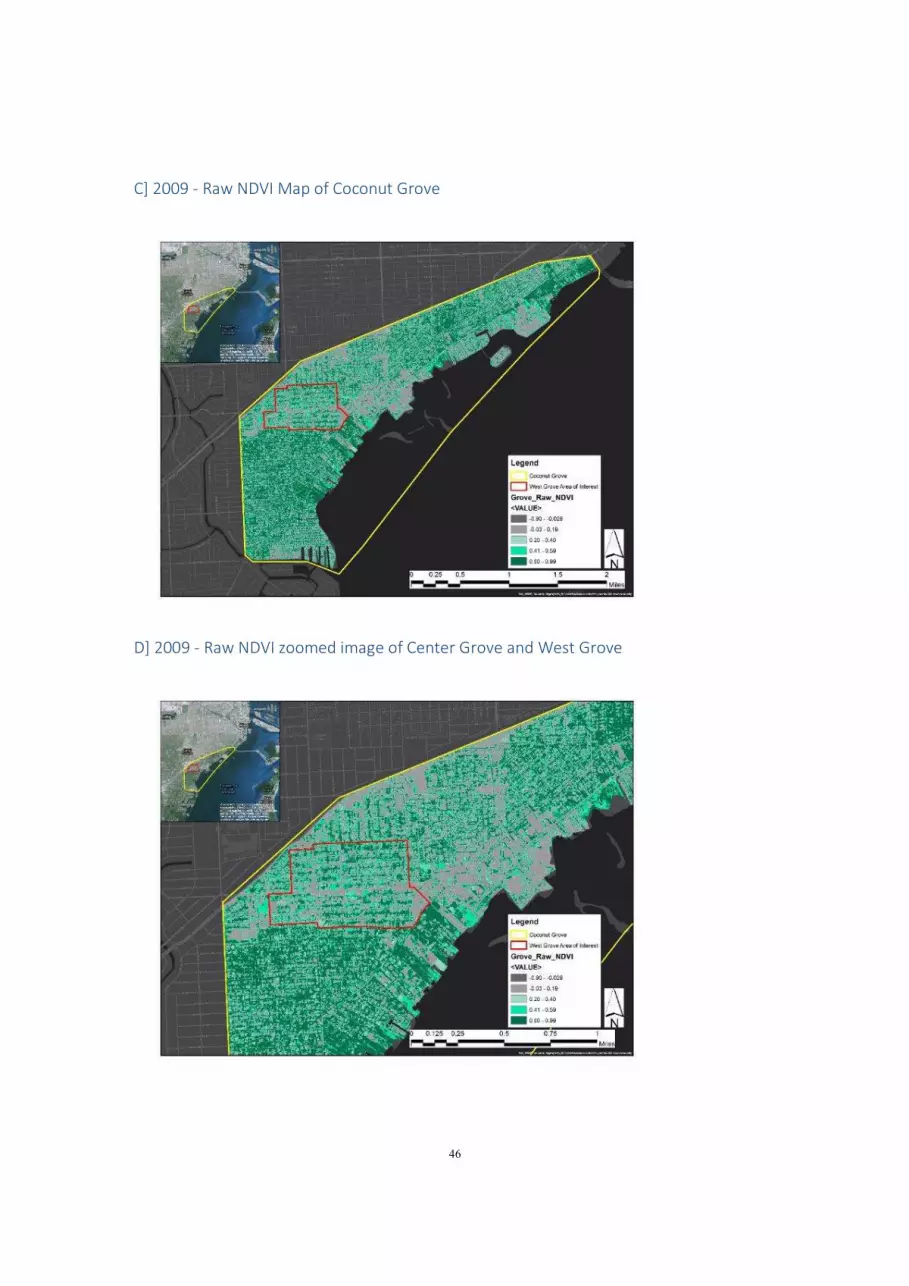
46
C] 2009 - Raw NDVI Map of Coconut Grove
D] 2009 - Raw NDVI zoomed image of Center Grove and West Grove

47
E] World View 2 Satellite Image Documentation
DigitalGlobe's WorldView-2 satellite sensor, provides 0.46m Panchromatic (B&W) mono and
stereo satellite image data. The information following below relates to the 11 May 2009 image used as a source for the Coconut Grove NDVI calculations included in this paper.
[1] Image File: 11may09162450-m1bs-500076185160_01_p011
version = "23.11"; generationTime = 2013-08-21T22:03:56.000000Z; productOrderId = "500076185160_01_P011"; productCatalogId = "2020011E7362D500"; imageDescriptor = "Basic1B"; bandId = "Multi"; panSharpenAlgorithm = "None"; numRows = 7584; numColumns = 8212; productLevel = "LV1B"; productType = "Basic"; numberOfLooks = 1; radiometricLevel = "Corrected"; bitsPerPixel = 16; compressionType = "None"; BEGIN_GROUP = BAND_C ULLon = -80.36424566; ULLat = 25.82911811; ULHAE = -18.22; URLon = -80.20023093; URLat = 25.82897152; URHAE = -16.99; LRLon = -80.20064802; LRLat = 25.69257561; LRHAE = -27.00; LLLon = -80.36450911; LLLat = 25.69275563; LLHAE = -17.76; absCalFactor = 9.295654e-03; effectiveBandwidth = 4.730000e-02; TDILevel = 24; END_GROUP = BAND_C BEGIN_GROUP = BAND_B ULLon = -80.36424566; ULLat = 25.82911811; ULHAE = -18.22; URLon = -80.20023093; URLat = 25.82897152; URHAE = -16.99; LRLon = -80.20064802; LRLat = 25.69257561; LRHAE = -27.00; LLLon = -80.36450911; LLLat = 25.69275563; LLHAE = -17.76; absCalFactor = 1.783568e-02; effectiveBandwidth = 5.430000e-02; TDILevel = 10; END_GROUP = BAND_B BEGIN_GROUP = BAND_G ULLon = -80.36424566; ULLat = 25.82911811; ULHAE = -18.22; URLon = -80.20023093; URLat = 25.82897152; URHAE = -16.99; LRLon = -80.20064802; LRLat = 25.69257561; LRHAE = -27.00; LLLon = -80.36450911; LLLat = 25.69275563; LLHAE = -17.76; absCalFactor = 1.364197e-02; effectiveBandwidth = 6.300000e-02; TDILevel = 10; END_GROUP = BAND_G BEGIN_GROUP = BAND_Y ULLon = -80.36424566; ULLat = 25.82911811; ULHAE = -18.22; URLon = -80.20023093; URLat = 25.82897152; URHAE = -16.99; LRLon = -80.20064802;

48
LRLat = 25.69257561; LRHAE = -27.00; LLLon = -80.36450911; LLLat = 25.69275563; LLHAE = -17.76; absCalFactor = 6.810718e-03; effectiveBandwidth = 3.740000e-02; TDILevel = 18; END_GROUP = BAND_Y BEGIN_GROUP = BAND_R ULLon = -80.36424566; ULLat = 25.82911811; ULHAE = -18.22; URLon = -80.20023093; URLat = 25.82897152; URHAE = -16.99; LRLon = -80.20064802; LRLat = 25.69257561; LRHAE = -27.00; LLLon = -80.36450911; LLLat = 25.69275563; LLHAE = -17.76; absCalFactor = 1.851735e-02; effectiveBandwidth = 5.740000e-02; TDILevel = 6; END_GROUP = BAND_R BEGIN_GROUP = BAND_RE ULLon = -80.36424566; ULLat = 25.82911811; ULHAE = -18.22; URLon = -80.20023093; URLat = 25.82897152; URHAE = -16.99; LRLon = -80.20064802; LRLat = 25.69257561; LRHAE = -27.00; LLLon = -80.36450911; LLLat = 25.69275563; LLHAE = -17.76; absCalFactor = 6.063145e-03; effectiveBandwidth = 3.930000e-02; TDILevel = 18; END_GROUP = BAND_RE BEGIN_GROUP = BAND_N ULLon = -80.36424566; ULLat = 25.82911811; ULHAE = -18.22; URLon = -80.20023093; URLat = 25.82897152; URHAE = -16.99; LRLon = -80.20064802; LRLat = 25.69257561; LRHAE = -27.00; LLLon = -80.36450911; LLLat = 25.69275563; LLHAE = -17.76; absCalFactor = 2.050828e-02; effectiveBandwidth = 9.890000e-02; TDILevel = 6; END_GROUP = BAND_N BEGIN_GROUP = BAND_N2 ULLon = -80.36424566; ULLat = 25.82911811; ULHAE = -18.22; URLon = -80.20023093; URLat = 25.82897152; URHAE = -16.99; LRLon = -80.20064802; LRLat = 25.69257561; LRHAE = -27.00; LLLon = -80.36450911; LLLat = 25.69275563; LLHAE = -17.76; absCalFactor = 9.042234e-03; effectiveBandwidth = 9.960000e-02; TDILevel = 24; END_GROUP = BAND_N2 outputFormat = "GeoTIFF"; BEGIN_GROUP = IMAGE_1 satId = "WV02"; mode = "FullSwath"; scanDirection = "Forward"; CatId = "103001000A7CCE00"; TLCTime = 2011-05-09T16:24:50.232258Z; numTLC = 2; TLCList = ( (0, 0.000000), (7584, 1.629200) );
49
firstLineTime = 2011-05-09T16:24:50.232257Z; avgLineRate = 4655.05; exposureDuration = 0.00021482; minCollectedRowGSD = 1.854; maxCollectedRowGSD = 1.855; meanCollectedRowGSD = 1.855; minCollectedColGSD = 1.857; maxCollectedColGSD = 1.858; meanCollectedColGSD = 1.857; meanCollectedGSD = 1.856; meanProductRowGSD = 2.001; meanProductColGSD = 2.003; meanProductGSD = 2.002; rowUncertainty = 22.12; colUncertainty = 28.33; minSunAz = 121.1; maxSunAz = 121.5; meanSunAz = 121.3; minSunEl = 75.2; maxSunEl = 75.3; meanSunEl = 75.3; minSatAz = 237.2; maxSatAz = 250.6; meanSatAz = 243.6; minSatEl = 86.7; maxSatEl = 87.2; meanSatEl = 86.9; minInTrackViewAngle = -1.6; maxInTrackViewAngle = -1.3; meanInTrackViewAngle = -1.5; minCrossTrackViewAngle = -2.3; maxCrossTrackViewAngle = -2.1; meanCrossTrackViewAngle = -2.2; minOffNadirViewAngle = 2.7; maxOffNadirViewAngle = 2.7; meanOffNadirViewAngle = 2.7; PNIIRS = 3.0; cloudCover = 0.000; resamplingKernel = "CC"; positionKnowledgeSrc = "R"; attitudeKnowledgeSrc = "R"; revNumber = 8300; END_GROUP = IMAGE_1 END;

50
F] Examples of West and South Grove Street Level Views
The selection of images below show the difference in tree canopy at street level (examples taken
on each side of Coconut Grove’s (segregation) wall.
Streetscapes north and south of the Coconut Grove ‘wall’. (Source: Google Maps / Streetview – Accessed June 2015)
West Grove Streetscape South Grove Streetscape

51
###