co preferential oxidation on cordierite monoliths coated with co/ceo2 catalysts
TRANSCRIPT
ww.sciencedirect.com
i n t e rn a t i o n a l j o u r n a l o f h y d r o g e n en e r g y 3 7 ( 2 0 1 2 ) 1 4 8 1 2e1 4 8 1 9
Available online at w
journal homepage: www.elsevier .com/locate/he
CO preferential oxidation on cordierite monoliths coated withCo/CeO2 catalysts
Leticia E. Gomez, Ines S. Tiscornia, Alicia V. Boix, Eduardo E. Miro*
Instituto de Investigaciones en Catalisis y Petroquımica, INCAPE (FIQ UNL-CONICET), Santiago del Estero 2829, (3000) Santa Fe, Argentina
a r t i c l e i n f o
Article history:
Received 7 September 2011
Received in revised form
28 December 2011
Accepted 31 January 2012
Available online 2 March 2012
Keywords:
Co/CeO2
Monolithic catalysts
CO preferential oxidation
Co3O4
* Corresponding author. Tel.: þ54 342 453686E-mail address: [email protected] (E.E
0360-3199/$ e see front matter Copyright ªdoi:10.1016/j.ijhydene.2012.01.159
a b s t r a c t
Cordierite monoliths washcoated with Co/CeO2 catalysts prepared from different methods
were studied for theCOpreferential oxidation reaction. Powder catalystswere also studied for
the sake of comparison and in order to select the best formulations to prepare the catalytic
coatings. HigheCo loaded catalysts resulted in good CO conversions and they showed Co3O4
as the main cobalt containing phase. Consequently, three cordierite e washcoated catalysts
were preparedwith high Co loadings (ca. 10 wt. % of Co in the catalytic layer). C1 and C2were
obtained by CeO2 washcoating followed by cobalt impregnation. In the first case, Ce oxide
particles were obtained from a nitrate solution and in the second, a Nyacol suspension was
used. A third sample was prepared (C3) using a slurry of a co-precipitated Co10(CP) catalyst.
Monolith C3 showed the best CO conversion, although the differencewith the other catalysts
wasnot so evident as theoneobserved for thepowder formulations. Themechanical stability,
measured by ultrasound tests, was good for allmonolithic catalysts andmonolith C1 showed
no-deactivation after 100 h of time-on-stream at 190 �C. The structured catalysts prepared
were characterized by XRD, TPR, LRS, SEM and XPS, showing that their physical-chemistry
features depend on the preparation method and Co loading.
Copyright ª 2012, Hydrogen Energy Publications, LLC. Published by Elsevier Ltd. All rights
reserved.
1. Introduction Due to their redox properties, supported cobalt oxides have
The last few years have witnessed the surge of a renewed
interest in the CO oxidation reaction due to its application to
the purification of hydrogen to be used in power cells [1].
Whilemost studies concerning CO preferential oxidation have
been performed using powder catalysts, it is recognized that
structured catalysts are necessary in this type of reactions for
practical applications [2]. In this vein, the activity and stability
of monolithic catalysts have been topics of recently published
researchwork [3e5]. It is important to study the fundamentals
of this type of catalysts since the powderesupport interac-
tions can give rise to different behaviors if compared to the
powder catalysts [6].
1.. Miro).2012, Hydrogen Energy P
been traditionally studied for CO oxidation applications [7].
Cobalt suported on zirconia, ceria, and themixed oxide CeO2e
ZrO2 resulted efficient catalysts for the CO preferential
oxidation [8,9]. In a previous work [10], we reported results
about CO preferential oxidation over Co/ZrO2 coated mono-
liths. When Nyacol was used as the ZrO2 source, 95% of CO
conversion and 60% of selectivity were reached at 230 �C. Itwas also shown that the open structure of the Nyacol ZrO2
coating favored the diffusion process of the reactives towards
the active sites. However, this catalyst presents a somewhat
low mechanical stability due to the formation of inter-
connected surface cracks with flake-type formations that
favor the detachment of portions of the washcoat.
ublications, LLC. Published by Elsevier Ltd. All rights reserved.
i n t e r n a t i o n a l j o u r n a l o f h y d r o g e n en e r g y 3 7 ( 2 0 1 2 ) 1 4 8 1 2e1 4 8 1 9 14813
On the other hand, it has been shown that the combined
effect of cobalt oxide and ceria strongly influences the
morphological and redox properties of the composite oxides,
by dispersing the Co3O4 phase and promoting the efficiency of
the Co3þeCo2þ redox couple [11]. Thus, taking into account
that practical applications of this catalyst imply the use of
structured systems, the main goal of this work is to prepare
and characterize Co/CeO2 washcoated monoliths using
different preparation strategies in order to develop active,
selective and stable structured catalysts. Powder catalysts
with different Co:Ce ratioswere also prepared in order to carry
out preliminary studies of activity and characterization for
different formulations.
Thestabilityofselectedcatalystswasalsostudied,bothusing
ultrasound tests (to evaluate the mechanical stability of the
coatings)andtime-on-streamexperiments inorder toassess the
catalytic stability of the best catalyst under reaction conditions.
The monolithic catalysts were inspected by scanning electron
microscopy (SEM) in order to analyze both the morphological
characteristics of the films deposited by different washcoating
procedures. Monoliths and powder catalysts were also charac-
terized by Temperature-Programmed Reduction (TPR), X-ray
diffraction (XRD), Laser Raman Spectroscopy (LRS) and X-ray
photoelectron spectroscopy (XPS). The activity and selectivity of
both structured and powder catalysts were evaluated for the
preferential CO oxidation (PROx). Finally, the results were
comparedwith thoseobtained for theCo/ZrO2 systemstudied in
our previous work [10].
2. Experimental
2.1. Powder catalysts preparation
In order to perform preliminary studies, and to compare with
monolithic catalysts, a series of Co/CeO2 catalysts were
prepared using different Co:Ce ratios and preparation
methods. Co10(WI) was prepared by the wet impregnation
method with a load of cobalt of 10 wt. %, using an aqueous
solution of Co(NO3)2 and powder CeO2 obtained by precipita-
tion of Ce(NO3)3 withNH4(OH) as the support. Themixturewas
evaporated under continuous agitation at 50 �C until
achieving a paste, which was placed in the oven overnight.
Co10(CP) and Co1(CP) were prepared by means of the co-
precipitation method carried out by adding NH4(OH) drop by
drop into a solution of Co and Ce nitrates under vigorous
stirring. The resulting precipitate was filtered and washed
several timeswith distilledwater. Then, it was dried overnight
and calcined in air at 500 �C. In this way, samples with 1 and
10 wt. % of cobalt were obtained.
2.2. Monolithic catalysts preparation
Cordierite honeycomb monoliths (Corning, 400 cpi, 0.1 mm
wall thickness), 2MgOe2Al2O3e5SiO2, were used as
substrates. These supports had an average size of
1 cm � 1 cm � 2 cm. The active phases were deposited by the
washcoating method, using different start-up suspensions.
The monolithic samples denoted as C1 and C2 were
prepared from a slurry composed of the CeO2 powder
suspended in distilledwater or from a commercial suspension
(Nyacol) consisting in particles of about 20 nm stabilized in an
acetic acid solution, respectively. A series of impregnations
were carried out until an adequate ceria layer was obtained.
After each immersion cycle, the suspension excess was
removed by blowing air through the channels of themonolith.
After that, cobalt was incorporated by means of successive
impregnations of the monoliths in a Co(NO3)2 solution.
Sample C3 was prepared from an aqueous suspension of the
pre-formed powder Co10(CP).
After the washcoating and air blowing processes, all
monoliths were calcined in air flow at 500 �C. The adherence
of the catalytic films was evaluated using a method described
in the patent literature [12] with an ultrasonic treatment. The
weight of the sample both before and after the ultrasonic
treatment was measured.
2.3. Catalytic tests
Preferential CO oxidation experiments were performed in
a fixed-bed flow reactor. Powder samples were placed in
a tubular quartz reactor (8 mm i.d.) and monolithic samples
were placed in a tubular quartz reactor (19 mm o.d.). The
reaction mixture consisted of CO 1%, O2 1% and H2 40%, He
balance. The weight/total flow ratio was adjusted to
2.1 mg,cm�3 min by means of mass flow controllers.
The CO conversion and the selectivity towards CO2 were
defined as:
CCO ¼ ð1� ½CO�=½CO��Þ$100
S ¼ ½CO2�=2$ð½O2���½O2�Þ$100where [CO], [CO2] and [O2] were reactor exit concentrations
and [CO]�, [O2]� represented feed concentrations, which were
measuredwith a chromatograph GC-2014 Shimadzu equipped
with a TCD cell. All the catalysts were pretreated during 1 h in
oxygen at 300 �C before the catalytic test.
2.4. Catalysts characterization of powder andmonolithic samples
2.4.1. X-ray Diffraction (XRD)Powder and monolithic catalysts were characterized by XRD
in a Shimadzu XD-D1 diffractometer with monochromator
using Cu-Ka (l ¼ 1.542 A) radiation at 30 kV and 40 mA. The
scan rate was 1�,min�1 in the range 2q ¼ 20e80�.
2.4.2. Temperature-programmed reductionH2 - TPR experiments were performed with an OKHURA TP-
2002S instrument equipped with a TCD detector on samples
of 100mg in a 5% H2/Ar gasmixture using a temperature ramp
rate of 10 �Cmin�1. Prior to the TPR analysis, the sampleswere
treated at 300 �C for 30 min under nitrogen flow to clean the
surface.
2.4.3. X-ray Photoelectron SpectroscopyXPS analyses were performed in a multi-technique system
(SPECS) equipped with a dual Mg/Al X-ray source and hemi-
spherical PHOIBOS 150 analyzer operating in the fixed
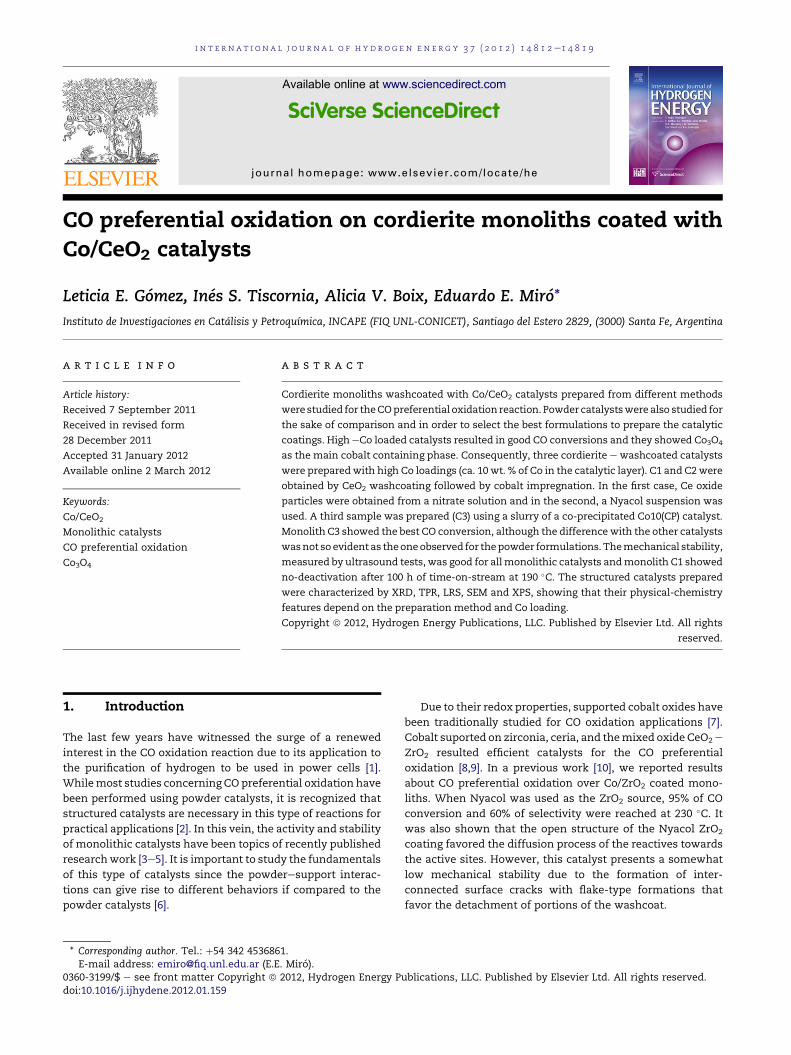
60 80 100 120 140 160 180 200 220 240 260 280
0
20
40
60
80
100
CO
Con
vers
ion
(%)
Temperature (°C)
A
80
100
ds C
O2 (%
)
B
i n t e rn a t i o n a l j o u r n a l o f h y d r o g e n en e r g y 3 7 ( 2 0 1 2 ) 1 4 8 1 2e1 4 8 1 914814
analyzer transmission (FAT) mode. The spectra were obtained
with pass energy of 30 eV, the Al Ka X-ray source
(hn ¼ 1486.6 eV) was operated at 100W. The spectra regions
corresponding to Co 2p, O 1s, Ce 3d and C 1s (reference
284.6 eV) core levels were recorded for each sample. The data
treatment was performed with the Casa XPS program (Casa
Software Ltda., UK).
2.4.4. Laser Raman SpectroscopyLRS spectra were acquired using a Horiba JOBIN YVON Lab
RAM HR instrument. The excitation source was the 514.5 nm
line of a Spectra 9000 Photometrics Ar ion laser with the laser
power set at 30 mW. Spectra were collected under atmo-
spheric conditions on calcined C1 and C2 monoliths.
2.4.5. Microscopic observationsMorphologies of monolithic films were examined using
a scanning electron microscope JEOL JSM-35C instrument
equipped with an electron acquisition imaging system oper-
ated a 20 kV. The samples were covered with a thin gold layer
to improve the images.
60 80 100 120 140 160 180 200 220 240 260 280
40
60
O2
Sele
ctiv
ity to
war
Temperature (°C)
Fig. 1 e Catalytic evaluation of powder catalysts. (A) CO
conversion (B) Selectivity of O2 to CO2. Reaction conditions:
1% CO, 1% O2, 40% H2 in He balance. Catalyst weight/total
flow: 2.1 mg cmL3 min -Co10(WI), CCo10(CP), :Co1(CP),
5 Co10/ZrO2 powder.
3. Results and discussion
3.1. Catalytic evaluations
Three powder catalysts and the same number of monolithic
catalysts were evaluated for the CO preferential oxidation. In
order to select the characteristics of the Co/CeO2 used for the
washcoating of the cordierite monoliths, powder catalysts
were prepared under different conditions and evaluated for
the reaction under study (Table 1).
The threemonolithic catalysts showed good stability of the
coating since a low weight loss was measured after the
ultrasound test. Moreover, in a previous work [10] we showed
that after the washcoating there is some amount of material
that is loosely adhered to the monolith, which is easily lost
after the first ultrasound treatment. However, the remaining
material is firmly attached and is mechanically stable.
Fig. 1A shows CO conversions for the different Co/CeO2
powder samples, and they are compared with a Co/ZrO2 cata-
lyst with a similar Co loading. It can be seen that the co-
precipitated sample (CP) with high-cobalt loading displays the
highest activity, reaching almost total CO conversion at 160 �C,while the impregnated sample (WI) reaches the same conver-
sion but at a somewhat higher temperatrure. For the solid
solution CoOx e CeO2 with low cobalt loading, total CO
Table 1 e Conditions for monolithic catalysts preparation.
Monolith Slurry composition Support weight G
C1 CeO2/H2O (10 wt.%) 10.2
C2 Nyacol CeO2 (20 wt. %) 19.8
C3 Co10(CP)/H2O (10 wt. %) 13.0
a Calculated from Co/CeO2 catalyst film.
b Calculated from total weight of monolith.
conversion is not reached, showing amaximumvalue of 85% at
a considerable higher temperature of about 240 �C. This result
does not mean that segregated Co oxide has a better specific
activity compared with the solid solution. A more rigorous
kinetic study is necessary to gain further insight into this
aspect. Nevertheless, we decided to prepare the monolithic
catalysts with high loadings of Co in order to secure the pres-
ence of the Co3O4 phase. In the same figure it can be observed
that a Co/ZrO2 catalyst with 10wt. % of Co loading reaches 95%
ained (wt.%) Co (wt.%)a Weight loss (wt. %)b
11.2 1.7
10.1 0.7
10.0 1.6
i n t e r n a t i o n a l j o u r n a l o f h y d r o g e n en e r g y 3 7 ( 2 0 1 2 ) 1 4 8 1 2e1 4 8 1 9 14815
of CO conversion at 200 �C, indicating that CeO2 is a better
support than ZrO2 for high loaded Co catalysts. In Fig. 1B, the
selectivities of oxygen towards CO2 are displayed, showing
a value of approximately 50% when CO conversions are at the
maximum value for each sample.
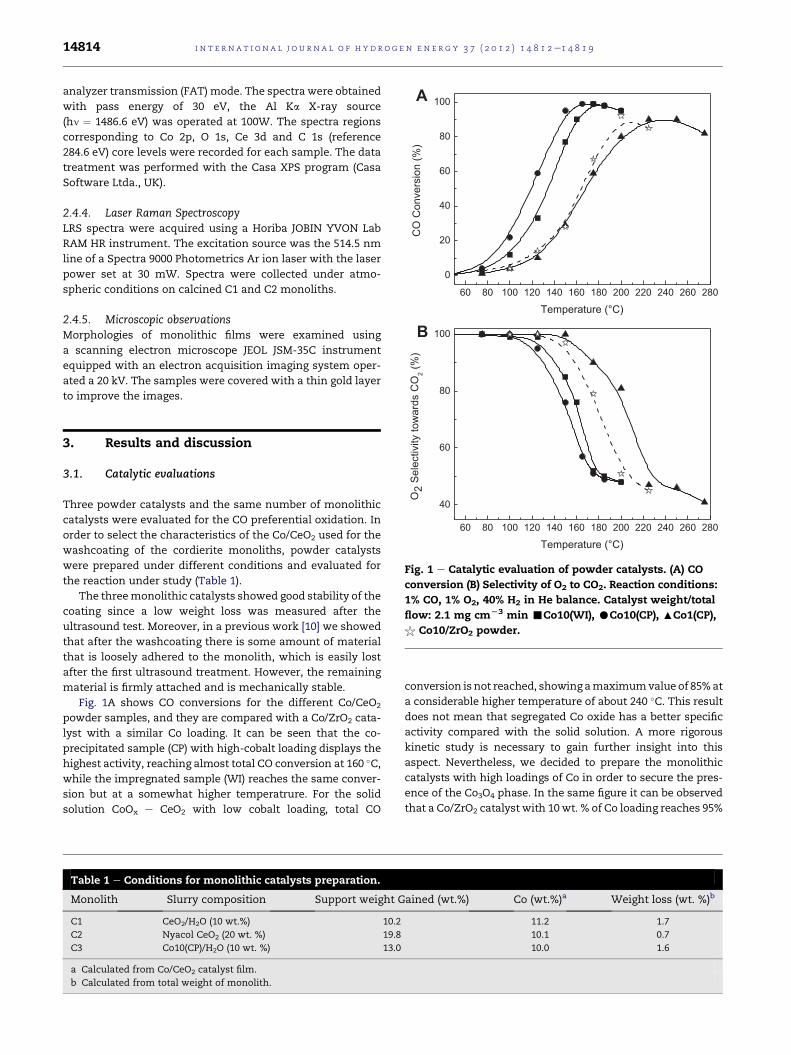
Fig. 2A and B shows the catalytic results obtained with
monolithic catalysts. Surprisingly, the three samples
employed do not differ considerably in CO conversions and
selectivity behaviors. Almost total CO conversion is reached at
200 �C, temperature considerably higher than that obtained
for the powders with high Co loadings. These results would
suggest that mass transfer limitations at the gas-coating
interphase and/or inside the coating layer are playing an
important role. For comparison, CO conversions for a mono-
lith coated with Co/ZrO2 is also depicted in Fig. 2B, showing
that for this sample a high CO conversion is also obtained but
at 240 �C. The selectivity behaviors are totally different, while
the Co/ZrO2 coated monolith shows a vulcano e shaped
behavior, reaching amaximumvalue of about 80%. In the case
of the Co/CeO2 coatings, the selectivities remain constant at
100% until ca. 150 �C and from this value on, as temperature
increases selectivity continuosly decreases.
80 100 120 140 160 180 200 220 240 260 280
0
20
40
60
80
100
CO
Con
vers
ion
(%)
Temperature (°C)
A
80 100 120 140 160 180 200 220 240
40
60
80
100
O2 S
elec
tivity
tow
ards
CO
2 (%)
Temperature (°C)
B
Fig. 2 e Catalytic evaluation of monolithic catalysts. (A) CO
conversion (B)SelectivityofO2 toCO2.Reactionconditions:1%
CO, 1% O2, 40% H2 in He balance. Catalyst weight/total flow:
2.1 mg cmL3 min-C1,CC2,:C3,5 Co/ZrO2 monolith.
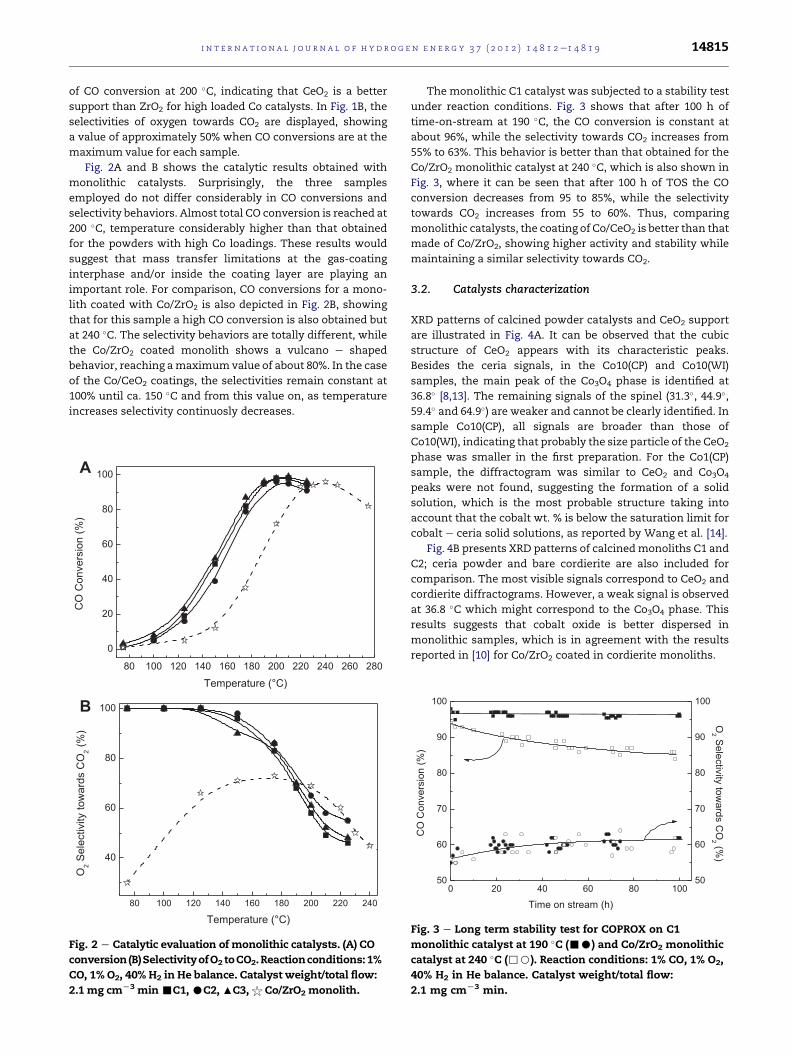
The monolithic C1 catalyst was subjected to a stability test
under reaction conditions. Fig. 3 shows that after 100 h of
time-on-stream at 190 �C, the CO conversion is constant at
about 96%, while the selectivity towards CO2 increases from
55% to 63%. This behavior is better than that obtained for the
Co/ZrO2 monolithic catalyst at 240 �C, which is also shown in
Fig. 3, where it can be seen that after 100 h of TOS the CO
conversion decreases from 95 to 85%, while the selectivity
towards CO2 increases from 55 to 60%. Thus, comparing
monolithic catalysts, the coating of Co/CeO2 is better than that
made of Co/ZrO2, showing higher activity and stability while
maintaining a similar selectivity towards CO2.
3.2. Catalysts characterization
XRD patterns of calcined powder catalysts and CeO2 support
are illustrated in Fig. 4A. It can be observed that the cubic
structure of CeO2 appears with its characteristic peaks.
Besides the ceria signals, in the Co10(CP) and Co10(WI)
samples, the main peak of the Co3O4 phase is identified at
36.8� [8,13]. The remaining signals of the spinel (31.3�, 44.9�,59.4� and 64.9�) are weaker and cannot be clearly identified. In
sample Co10(CP), all signals are broader than those of
Co10(WI), indicating that probably the size particle of the CeO2
phase was smaller in the first preparation. For the Co1(CP)
sample, the diffractogram was similar to CeO2 and Co3O4
peaks were not found, suggesting the formation of a solid
solution, which is the most probable structure taking into
account that the cobalt wt. % is below the saturation limit for
cobalt e ceria solid solutions, as reported by Wang et al. [14].
Fig. 4B presents XRD patterns of calcinedmonoliths C1 and
C2; ceria powder and bare cordierite are also included for
comparison. The most visible signals correspond to CeO2 and
cordierite diffractograms. However, a weak signal is observed
at 36.8 �C which might correspond to the Co3O4 phase. This
results suggests that cobalt oxide is better dispersed in
monolithic samples, which is in agreement with the results
reported in [10] for Co/ZrO2 coated in cordierite monoliths.
0 20 40 60 80 10050
60
70
80
90
100
50
60
70
80
90
100
O2 Selectivity tow
ards CO
2 (%)
CO
Con
vers
ion
(%)
Time on stream (h)
Fig. 3 e Long term stability test for COPROX on C1
monolithic catalyst at 190 �C (-C) and Co/ZrO2 monolithic
catalyst at 240 �C (,B). Reaction conditions: 1% CO, 1% O2,
40% H2 in He balance. Catalyst weight/total flow:
2.1 mg cmL3 min.
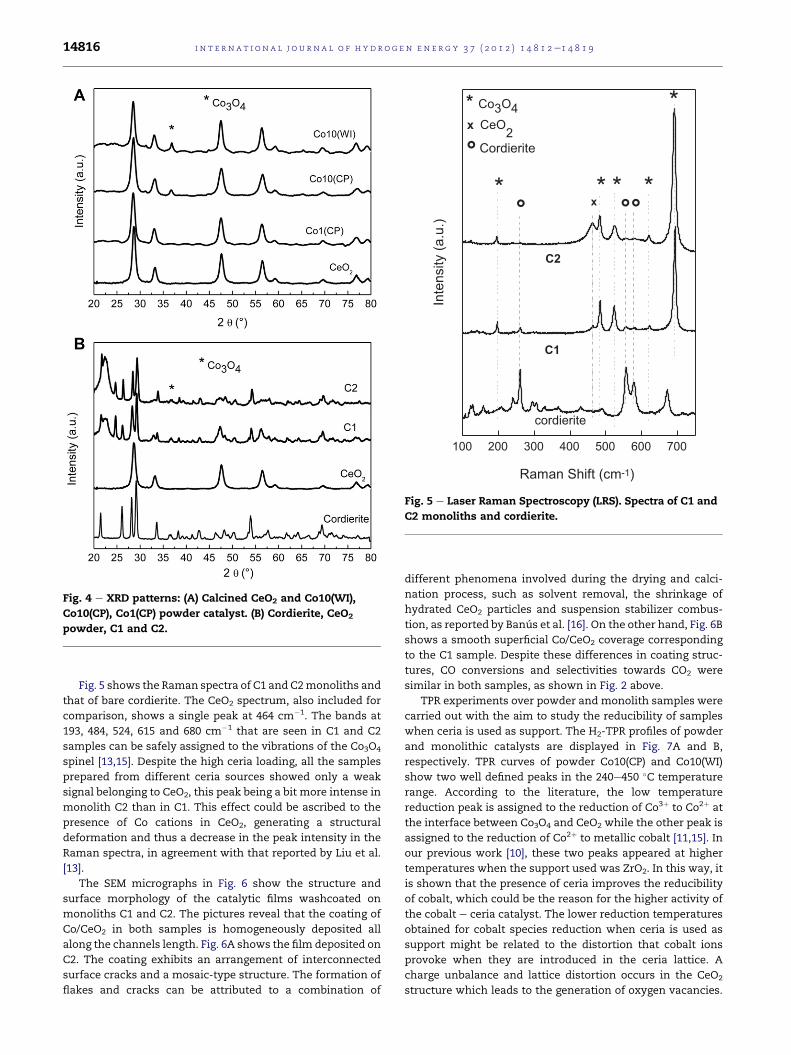
Fig. 4 e XRD patterns: (A) Calcined CeO2 and Co10(WI),
Co10(CP), Co1(CP) powder catalyst. (B) Cordierite, CeO2
powder, C1 and C2.
100 200 300 400 500 600 700
*
***
C1
Inte
nsity
(a.u
.)
Raman Shift (cm-1)
C2
cordierite
*° °°
x
* Co3O4x CeO2
° Cordierite
Fig. 5 e Laser Raman Spectroscopy (LRS). Spectra of C1 and
C2 monoliths and cordierite.
i n t e rn a t i o n a l j o u r n a l o f h y d r o g e n en e r g y 3 7 ( 2 0 1 2 ) 1 4 8 1 2e1 4 8 1 914816
Fig. 5 shows the Raman spectra of C1 and C2monoliths and
that of bare cordierite. The CeO2 spectrum, also included for
comparison, shows a single peak at 464 cm�1. The bands at
193, 484, 524, 615 and 680 cm�1 that are seen in C1 and C2
samples can be safely assigned to the vibrations of the Co3O4
spinel [13,15]. Despite the high ceria loading, all the samples
prepared from different ceria sources showed only a weak
signal belonging to CeO2, this peak being a bit more intense in
monolith C2 than in C1. This effect could be ascribed to the
presence of Co cations in CeO2, generating a structural
deformation and thus a decrease in the peak intensity in the
Raman spectra, in agreement with that reported by Liu et al.
[13].
The SEM micrographs in Fig. 6 show the structure and
surface morphology of the catalytic films washcoated on
monoliths C1 and C2. The pictures reveal that the coating of
Co/CeO2 in both samples is homogeneously deposited all
along the channels length. Fig. 6A shows the film deposited on
C2. The coating exhibits an arrangement of interconnected
surface cracks and a mosaic-type structure. The formation of
flakes and cracks can be attributed to a combination of
different phenomena involved during the drying and calci-
nation process, such as solvent removal, the shrinkage of
hydrated CeO2 particles and suspension stabilizer combus-
tion, as reported by Banus et al. [16]. On the other hand, Fig. 6B
shows a smooth superficial Co/CeO2 coverage corresponding
to the C1 sample. Despite these differences in coating struc-
tures, CO conversions and selectivities towards CO2 were
similar in both samples, as shown in Fig. 2 above.
TPR experiments over powder and monolith samples were
carried out with the aim to study the reducibility of samples
when ceria is used as support. The H2-TPR profiles of powder
and monolithic catalysts are displayed in Fig. 7A and B,
respectively. TPR curves of powder Co10(CP) and Co10(WI)
show two well defined peaks in the 240e450 �C temperature
range. According to the literature, the low temperature
reduction peak is assigned to the reduction of Co3þ to Co2þ at
the interface between Co3O4 and CeO2 while the other peak is
assigned to the reduction of Co2þ to metallic cobalt [11,15]. In
our previous work [10], these two peaks appeared at higher
temperatures when the support used was ZrO2. In this way, it
is shown that the presence of ceria improves the reducibility
of cobalt, which could be the reason for the higher activity of
the cobalt e ceria catalyst. The lower reduction temperatures
obtained for cobalt species reduction when ceria is used as
support might be related to the distortion that cobalt ions
provoke when they are introduced in the ceria lattice. A
charge unbalance and lattice distortion occurs in the CeO2
structure which leads to the generation of oxygen vacancies.
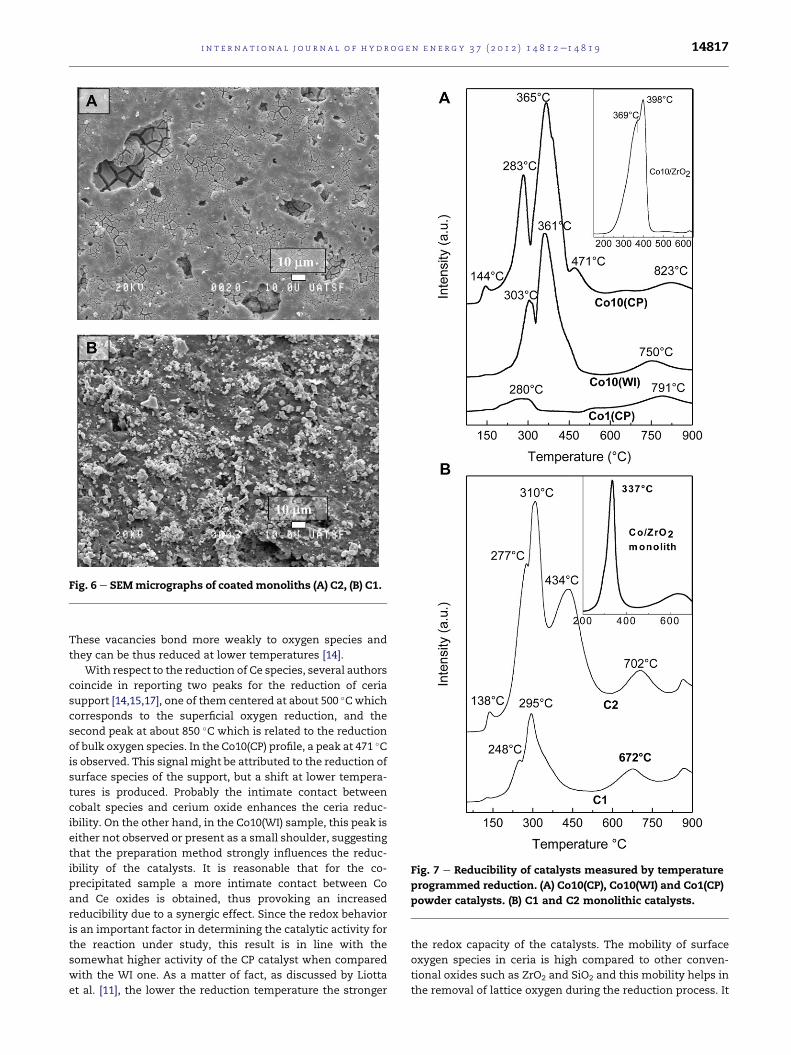
Fig. 6 e SEMmicrographs of coatedmonoliths (A) C2, (B) C1.
Fig. 7 e Reducibility of catalysts measured by temperature
programmed reduction. (A) Co10(CP), Co10(WI) and Co1(CP)
powder catalysts. (B) C1 and C2 monolithic catalysts.
i n t e r n a t i o n a l j o u r n a l o f h y d r o g e n en e r g y 3 7 ( 2 0 1 2 ) 1 4 8 1 2e1 4 8 1 9 14817
These vacancies bond more weakly to oxygen species and
they can be thus reduced at lower temperatures [14].
With respect to the reduction of Ce species, several authors
coincide in reporting two peaks for the reduction of ceria
support [14,15,17], one of them centered at about 500 �Cwhich
corresponds to the superficial oxygen reduction, and the
second peak at about 850 �C which is related to the reduction
of bulk oxygen species. In the Co10(CP) profile, a peak at 471 �Cis observed. This signal might be attributed to the reduction of
surface species of the support, but a shift at lower tempera-
tures is produced. Probably the intimate contact between
cobalt species and cerium oxide enhances the ceria reduc-
ibility. On the other hand, in the Co10(WI) sample, this peak is
either not observed or present as a small shoulder, suggesting
that the preparation method strongly influences the reduc-
ibility of the catalysts. It is reasonable that for the co-
precipitated sample a more intimate contact between Co
and Ce oxides is obtained, thus provoking an increased
reducibility due to a synergic effect. Since the redox behavior
is an important factor in determining the catalytic activity for
the reaction under study, this result is in line with the
somewhat higher activity of the CP catalyst when compared
with the WI one. As a matter of fact, as discussed by Liotta
et al. [11], the lower the reduction temperature the stronger
the redox capacity of the catalysts. The mobility of surface
oxygen species in ceria is high compared to other conven-
tional oxides such as ZrO2 and SiO2 and this mobility helps in
the removal of lattice oxygen during the reduction process. It
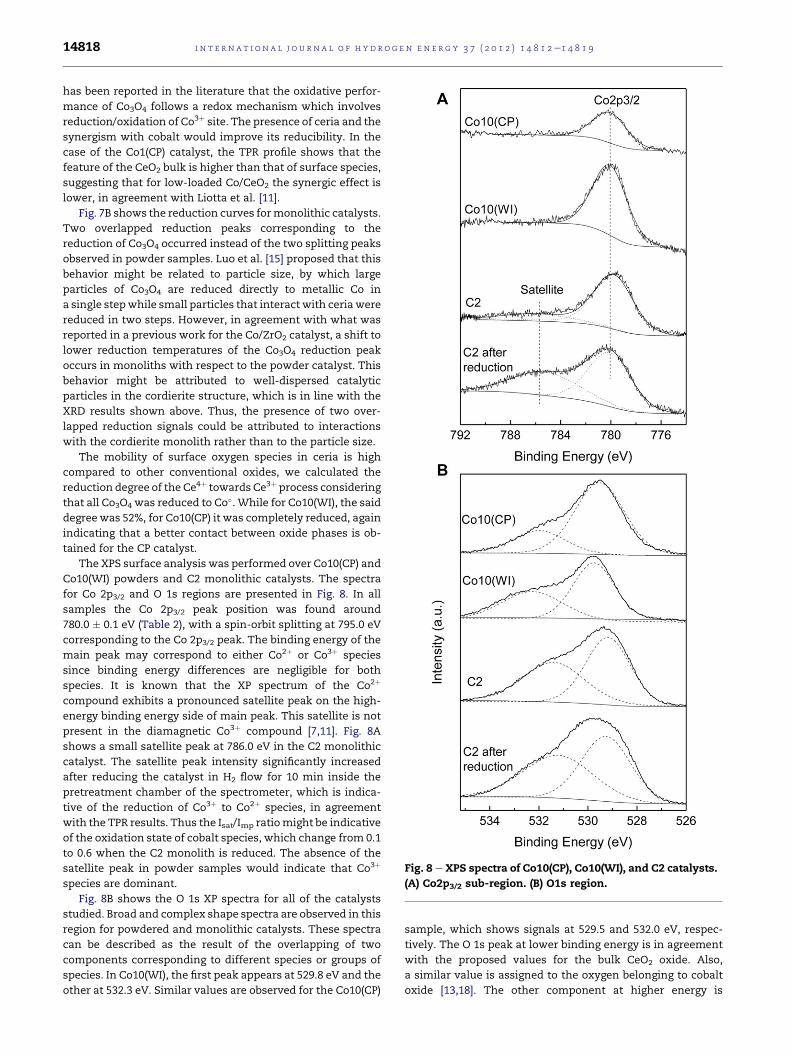
Fig. 8 e XPS spectra of Co10(CP), Co10(WI), and C2 catalysts.
(A) Co2p3/2 sub-region. (B) O1s region.
i n t e rn a t i o n a l j o u r n a l o f h y d r o g e n en e r g y 3 7 ( 2 0 1 2 ) 1 4 8 1 2e1 4 8 1 914818
has been reported in the literature that the oxidative perfor-
mance of Co3O4 follows a redox mechanism which involves
reduction/oxidation of Co3þ site. The presence of ceria and the
synergism with cobalt would improve its reducibility. In the
case of the Co1(CP) catalyst, the TPR profile shows that the
feature of the CeO2 bulk is higher than that of surface species,
suggesting that for low-loaded Co/CeO2 the synergic effect is
lower, in agreement with Liotta et al. [11].
Fig. 7B shows the reduction curves formonolithic catalysts.
Two overlapped reduction peaks corresponding to the
reduction of Co3O4 occurred instead of the two splitting peaks
observed in powder samples. Luo et al. [15] proposed that this
behavior might be related to particle size, by which large
particles of Co3O4 are reduced directly to metallic Co in
a single stepwhile small particles that interact with ceriawere
reduced in two steps. However, in agreement with what was
reported in a previous work for the Co/ZrO2 catalyst, a shift to
lower reduction temperatures of the Co3O4 reduction peak
occurs in monoliths with respect to the powder catalyst. This
behavior might be attributed to well-dispersed catalytic
particles in the cordierite structure, which is in line with the
XRD results shown above. Thus, the presence of two over-
lapped reduction signals could be attributed to interactions
with the cordierite monolith rather than to the particle size.
The mobility of surface oxygen species in ceria is high
compared to other conventional oxides, we calculated the
reduction degree of the Ce4þ towards Ce3þ process considering
that all Co3O4 was reduced to Co�. While for Co10(WI), the said
degreewas 52%, for Co10(CP) it was completely reduced, again
indicating that a better contact between oxide phases is ob-
tained for the CP catalyst.
The XPS surface analysis was performed over Co10(CP) and
Co10(WI) powders and C2 monolithic catalysts. The spectra
for Co 2p3/2 and O 1s regions are presented in Fig. 8. In all
samples the Co 2p3/2 peak position was found around
780.0 � 0.1 eV (Table 2), with a spin-orbit splitting at 795.0 eV
corresponding to the Co 2p3/2 peak. The binding energy of the
main peak may correspond to either Co2þ or Co3þ species
since binding energy differences are negligible for both
species. It is known that the XP spectrum of the Co2þ
compound exhibits a pronounced satellite peak on the high-
energy binding energy side of main peak. This satellite is not
present in the diamagnetic Co3þ compound [7,11]. Fig. 8A
shows a small satellite peak at 786.0 eV in the C2 monolithic
catalyst. The satellite peak intensity significantly increased
after reducing the catalyst in H2 flow for 10 min inside the
pretreatment chamber of the spectrometer, which is indica-
tive of the reduction of Co3þ to Co2þ species, in agreement
with the TPR results. Thus the Isat/Imp ratiomight be indicative
of the oxidation state of cobalt species, which change from 0.1
to 0.6 when the C2 monolith is reduced. The absence of the
satellite peak in powder samples would indicate that Co3þ
species are dominant.
Fig. 8B shows the O 1s XP spectra for all of the catalysts
studied. Broad and complex shape spectra are observed in this
region for powdered and monolithic catalysts. These spectra
can be described as the result of the overlapping of two
components corresponding to different species or groups of
species. In Co10(WI), the first peak appears at 529.8 eV and the
other at 532.3 eV. Similar values are observed for the Co10(CP)
sample, which shows signals at 529.5 and 532.0 eV, respec-
tively. The O 1s peak at lower binding energy is in agreement
with the proposed values for the bulk CeO2 oxide. Also,
a similar value is assigned to the oxygen belonging to cobalt
oxide [13,18]. The other component at higher energy is
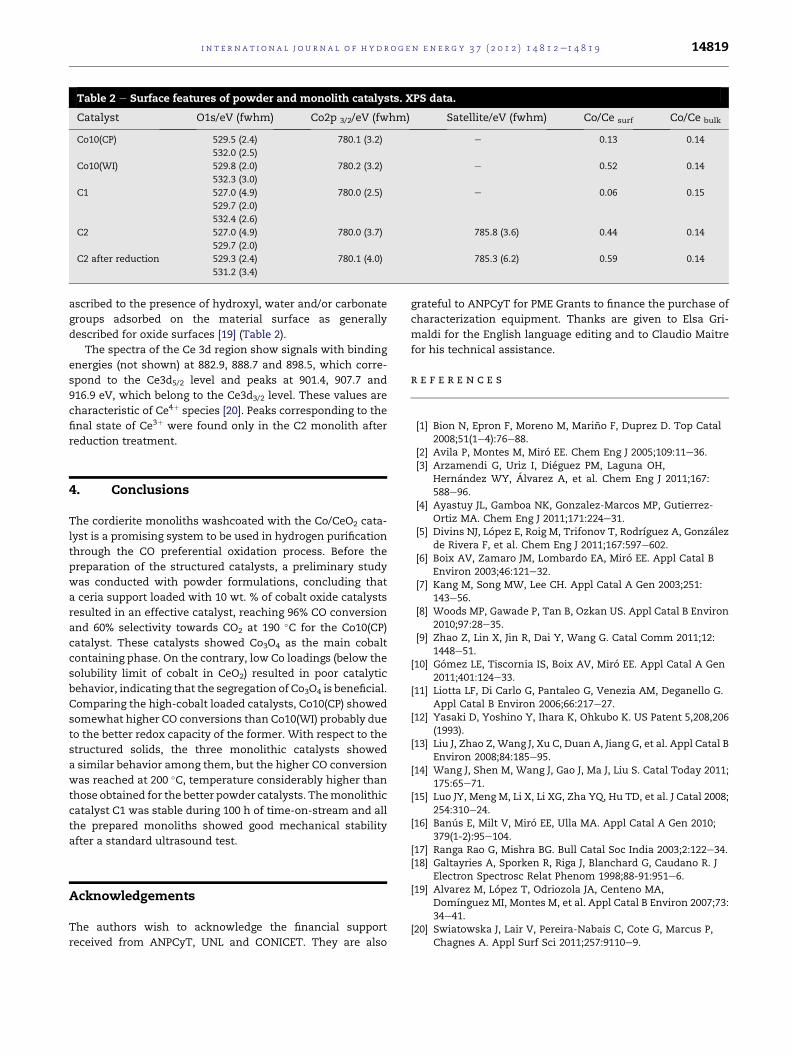
Table 2 e Surface features of powder and monolith catalysts. XPS data.
Catalyst O1s/eV (fwhm) Co2p 3/2/eV (fwhm) Satellite/eV (fwhm) Co/Ce surf Co/Ce bulk
Co10(CP) 529.5 (2.4) 780.1 (3.2) e 0.13 0.14
532.0 (2.5)
Co10(WI) 529.8 (2.0) 780.2 (3.2) e 0.52 0.14
532.3 (3.0)
C1 527.0 (4.9) 780.0 (2.5) e 0.06 0.15
529.7 (2.0)
532.4 (2.6)
C2 527.0 (4.9) 780.0 (3.7) 785.8 (3.6) 0.44 0.14
529.7 (2.0)
C2 after reduction 529.3 (2.4) 780.1 (4.0) 785.3 (6.2) 0.59 0.14
531.2 (3.4)
i n t e r n a t i o n a l j o u r n a l o f h y d r o g e n en e r g y 3 7 ( 2 0 1 2 ) 1 4 8 1 2e1 4 8 1 9 14819
ascribed to the presence of hydroxyl, water and/or carbonate
groups adsorbed on the material surface as generally
described for oxide surfaces [19] (Table 2).
The spectra of the Ce 3d region show signals with binding
energies (not shown) at 882.9, 888.7 and 898.5, which corre-
spond to the Ce3d5/2 level and peaks at 901.4, 907.7 and
916.9 eV, which belong to the Ce3d3/2 level. These values are
characteristic of Ce4þ species [20]. Peaks corresponding to the
final state of Ce3þ were found only in the C2 monolith after
reduction treatment.
4. Conclusions
The cordierite monoliths washcoated with the Co/CeO2 cata-
lyst is a promising system to be used in hydrogen purification
through the CO preferential oxidation process. Before the
preparation of the structured catalysts, a preliminary study
was conducted with powder formulations, concluding that
a ceria support loaded with 10 wt. % of cobalt oxide catalysts
resulted in an effective catalyst, reaching 96% CO conversion
and 60% selectivity towards CO2 at 190 �C for the Co10(CP)
catalyst. These catalysts showed Co3O4 as the main cobalt
containing phase. On the contrary, low Co loadings (below the
solubility limit of cobalt in CeO2) resulted in poor catalytic
behavior, indicating that the segregation of Co3O4 is beneficial.
Comparing the high-cobalt loaded catalysts, Co10(CP) showed
somewhat higher CO conversions than Co10(WI) probably due
to the better redox capacity of the former. With respect to the
structured solids, the three monolithic catalysts showed
a similar behavior among them, but the higher CO conversion
was reached at 200 �C, temperature considerably higher than
those obtained for the better powder catalysts. Themonolithic
catalyst C1 was stable during 100 h of time-on-stream and all
the prepared monoliths showed good mechanical stability
after a standard ultrasound test.
Acknowledgements
The authors wish to acknowledge the financial support
received from ANPCyT, UNL and CONICET. They are also
grateful to ANPCyT for PME Grants to finance the purchase of
characterization equipment. Thanks are given to Elsa Gri-
maldi for the English language editing and to Claudio Maitre
for his technical assistance.
r e f e r e n c e s
[1] Bion N, Epron F, Moreno M, Marino F, Duprez D. Top Catal2008;51(1e4):76e88.
[2] Avila P, Montes M, Miro EE. Chem Eng J 2005;109:11e36.[3] Arzamendi G, Uriz I, Dieguez PM, Laguna OH,
Hernandez WY, Alvarez A, et al. Chem Eng J 2011;167:588e96.
[4] Ayastuy JL, Gamboa NK, Gonzalez-Marcos MP, Gutierrez-Ortiz MA. Chem Eng J 2011;171:224e31.
[5] Divins NJ, Lopez E, Roig M, Trifonov T, Rodrıguez A, Gonzalezde Rivera F, et al. Chem Eng J 2011;167:597e602.
[6] Boix AV, Zamaro JM, Lombardo EA, Miro EE. Appl Catal BEnviron 2003;46:121e32.
[7] Kang M, Song MW, Lee CH. Appl Catal A Gen 2003;251:143e56.
[8] Woods MP, Gawade P, Tan B, Ozkan US. Appl Catal B Environ2010;97:28e35.
[9] Zhao Z, Lin X, Jin R, Dai Y, Wang G. Catal Comm 2011;12:1448e51.
[10] Gomez LE, Tiscornia IS, Boix AV, Miro EE. Appl Catal A Gen2011;401:124e33.
[11] Liotta LF, Di Carlo G, Pantaleo G, Venezia AM, Deganello G.Appl Catal B Environ 2006;66:217e27.
[12] Yasaki D, Yoshino Y, Ihara K, Ohkubo K. US Patent 5,208,206(1993).
[13] Liu J, Zhao Z, Wang J, Xu C, Duan A, Jiang G, et al. Appl Catal BEnviron 2008;84:185e95.
[14] Wang J, Shen M, Wang J, Gao J, Ma J, Liu S. Catal Today 2011;175:65e71.
[15] Luo JY, Meng M, Li X, Li XG, Zha YQ, Hu TD, et al. J Catal 2008;254:310e24.
[16] Banus E, Milt V, Miro EE, Ulla MA. Appl Catal A Gen 2010;379(1-2):95e104.
[17] Ranga Rao G, Mishra BG. Bull Catal Soc India 2003;2:122e34.[18] Galtayries A, Sporken R, Riga J, Blanchard G, Caudano R. J
Electron Spectrosc Relat Phenom 1998;88-91:951e6.[19] Alvarez M, Lopez T, Odriozola JA, Centeno MA,
Domınguez MI, Montes M, et al. Appl Catal B Environ 2007;73:34e41.
[20] Swiatowska J, Lair V, Pereira-Nabais C, Cote G, Marcus P,Chagnes A. Appl Surf Sci 2011;257:9110e9.