clustering of ms spectra for improved protein identification rate and screening for protein variants...
TRANSCRIPT

J O U R N A L O F P R O T E O M I C S 7 4 ( 2 0 1 1 ) 1 1 9 0 – 1 2 0 0
ava i l ab l e a t www.sc i enced i r ec t . com
www.e l sev i e r . com/ loca te / j p ro t
Clustering of MS spectra for improved protein identificationrate and screening for protein variants and modificationsby MALDI-MS/MS
Irene Granlunda,⁎, Thomas Kieselbacha, Rikard Almb,1,Wolfgang P. Schrödera, Cecilia Emanuelssonb
aDepartment of Chemistry, Umeå University, SE-901 87 Umeå, SwedenbDepartment of Biochemistry, Centre for Chemistry and Chemical Engineering, Lund University, P.O. Box 124, SE-221 00 Lund, Sweden
A R T I C L E I N F O
⁎ Corresponding author. Department of PlantE-mail address: Irene.Granlund@plantphy
1 Current address: Syngenta Seeds AB, SE-2
1874-3919/$ – see front matter © 2011 Elsevidoi:10.1016/j.jprot.2011.04.008
A B S T R A C T
Article history:Received 6 December 2010Accepted 8 April 2011Available online 22 April 2011
It is an established fact that allelic variation and post-translationalmodifications create differentvariants of proteins,whichare observedas isoelectric and size subspecies in two-dimensional gelbased proteomics. Here we explore the stromal proteome of spinach andArabidopsis chloroplastand show that clustering of mass spectra is a useful tool for investigating such variants anddetecting modified peptides with amino acid substitutions or post-translational modifications.This study employs data mining by hierarchical clustering of MALDI-MS spectra, using the webversion of the SPECLUST program (http://bioinfo.thep.lu.se/speclust.html). The tool can also beused to removepeaks of contaminating proteins and to improveprotein identification, especiallyfor species without a fully sequenced genome.Mutually exclusive peptide peakswithin a clusterprovide a good starting point for MS/MS investigation of modified peptides, here exemplified bythe identification of an A to E substitution that accounts for the isoelectric heterogeneity inprotein isoforms.
© 2011 Elsevier B.V. All rights reserved.
Keywords:2-DE PAGEHierarchical clusteringMALDI-TOF mass spectrometryMS/MSPost-translational modificationProteomics
1. Introduction
Protein identification by mass spectrometry is central inproteomic studies. Peptide mass fingerprinting (PMF) canidentify proteins to high level of sensitivity, speed andsequence coverage. The masses of peptides derived fromdigestion by sequence specific proteases, such as trypsin, aredetermined by mass spectrometry, so generating MS data thatcan be used to query a sequence database in order to identifyproteins. In conjunction with two-dimensional gel based(2-DE), PMF can be used for high throughput analysis ofcomplex protein mixtures [1]. Although PMF is a very useful
Physiology, Umeå Univers.umu.se (I. Granlund).61 91 Landskrona, Swede
er B.V. All rights reserved
technique for protein identification based on MS data, it islimited in that it can only be used to analyze proteins forwhich genome sequence data are available. For such speciestandem mass spectrometry (MS/MS) is usually required toidentify proteins. This is based on fragment ion MS/MS datagenerated from a few peptides from regions that exhibit a highsequence homology with proteins from species for whichgenomic sequence data are available. Protein identificationbased on such MS/MS data from only a few peptides is,however, not usually sufficient to distinguish among proteinisoforms, alternatively spliced proteins or proteins that havemany post-translational modifications (PTMs) [2–4].
sity, SE-901 87 Umeå, Sweden.
n.
.
1191J O U R N A L O F P R O T E O M I C S 7 4 ( 2 0 1 1 ) 1 1 9 0 – 1 2 0 0
Although genome-sequencing projects have providedthe complete genomes of many species, there is still a largenumber of species whose genomes have not been sequencedand for which PMF is of limited use. As regards plant pro-teomics, the only species with sequenced genomes that arecurrently available and whose proteins can thus be identifiedusing PMF are Arabidopsis, rice and poplar [5–8]. The draftgenomeof the tropical fruit tree, papaya,has also been recentlypublished [9]. Genomic sequence data of many important cropplants, such as spinach (Spinacia oleracea) are not yet available.Spinach is of interest not only because of its importance as acrop, but also because it has been widely used in studies ofplant photosynthesis [10–12]. Spinach leaves are highly suitablefor biochemical preparations because they are large and easy tocultivate or purchase locally and have functionally intactchloroplasts that can easily be isolated. A large amount of bio-chemical data concerning spinach has therefore been accumu-lated, and the study of the proteome of this important plantmodel is a subject of great interest.
Clustering of MS spectra has been shown to be useful inphylognetic analyses of insects, [13,14] and clustering of MS/MS spectra has been used to increase the rate of data analysesespecially in peptidomic studies [15,16]. We have previouslydeveloped the program SPECLUST for the hierarchical clus-tering of MS spectra in order to allow screening for theprobable presence of protein isoforms [17]. The program isavailable as a web tool (http://bioinfo.thep.lu.se/speclust.html) and has been used by others to investigate MS spectraof proteins to identify bacterial species [18,19] involved in foodpoisoning [20] and to monitor the production of recombinantproteins in transformed insect cells [21]. Here we show howthe clustering of MS spectra with the SPECLUST program canbe used to improve the analyses of proteins from spinach andArabidopsis thaliana. We also show that hierarchical clusteringcan increase the rate of identification of spinach proteins andprovide a useful starting point for the detection of proteinvariants and modified peptides.
2. Material and methods
2.1. Plants
Arabidopsis thaliana ecotype Columbia were grown on soil in adark/light cycle of 16 h:8 hwith a light intensity of 150±30 μmolphotons m−2s−1 and a day/night temperature regime of23 °C:18 °C. Fresh leaves of spinach were purchased from thelocal market.
2.2. Preparation of chloroplast stroma proteins
Chloroplasts from Arabidopsis were isolated as described in[22], and chloroplasts from spinach were prepared accordingto [23]. Briefly, the chloroplasts were isolated and disruptedusing a glass homogenizer and diluted to 1 μg Chl/μl withdouble distilled water containing a mix of protease inhibitors(Roche, Mannheim, German). The thylakoids were pelleted bycentrifugation for 6 min at 12,000×g (JA20 rotor, BeckmanCoulter AvantiTM J-25, USA), and the supernatants were then
transferred to ultracentrifuge tubes and centrifuged for 1 h at200,000×g (70Ti fixed-angle rotor, LE-70ultracentrifuge,BeckmanCoulter AB, USA). The supernatant containing the stromafraction was either used directly or frozen at −80 °C.
2.3. Two-dimensional polyacrylamide gel electrophoresis(2-DE)
The stromaproteinswereprecipitatedwith80% ice coldacetoneovernight at −20 °C and solubilized in a buffer with a finalconcentration of 6 M urea, 1.5 M thiourea, 4% CHAPS, 50mMDTT and 1% (v/v) IPG buffer pH 3–11 (GE Healthcare, Uppsala,Sweden). An amount of precipitate, corresponding to 400 μgprotein was then separated by IEF on a 24 cm Immobiline™DryStrips pH 4–7 gel (GE Healthcare, Uppsala, Sweden) and bySDS-PAGE on a 12–20% gradient polyacrylamide gel for thesecond dimension as described in [24].
2.4. Image acquisition, spot excision and in gel digestion
The proteins in the gels were fixed with a solution containing40% (v/v) ethanol and 10% (v/v) acetic acid and then stainedusing hot Coomassie solution (90 °C) consisting of 0.025% (w/v)PlusOne Coommassie PhastGel Blue R-350 (GE Healthcare,Uppsala, Sweden) in 10% (v/v) acetic acid. De-staining wasperformed using 10% (v/v) acetic acid [25]. Gels were scannedwith an ImageScanner (GE Healthcare, Uppsala, Sweden), andgel matching was performed with version 5.0 of the ImageMaster 2-D Platinum program (GE Healthcare, Uppsala,Sweden). Visible spots (>200 each for spinach and Arabidopsis)were manually excised from the gels for in-gel digestion andidentification. The excised gel spot were washed twice withdeionised water and de-stained in 35% (v/v) acetonitrile in20 mM ammonium hydrogen carbonate, the gel pieces werethen dried by vacuum centrifugation. Digestion buffer con-taining 20 mM ammonium hydrogen carbonate and 2 ng/μlsequencing grade modified trypsin (Promega Corporation,Madison WI, USA) was added to the dried gel pieces, whichwere then left on ice for 1 h for rehydration and then digestedat 37 °C overnight.
2.5. MALDI-MS data acquisition
Aliquots (1 μl) of the in-gel digests were dried on the targetplate and co-crystallized with 1 μl of a matrix solution thatcontained 0.5% TFA, 53% (v/v) acetonitrile, 18% (v/v) methanoland 31% (w/v) alpha-cyano-4-hydoxycinnamic acid (AgilentTechnologies G2037A). MALDI-MS spectrawere acquired usinga Voyager-DR™ STR BioSpectrometry™ Workstation AB (ABSciex, Stockholm, Sweden) as previously described [26] andcalibrated using the Sequazyme peptide Mass Standards Kitfrom AB Sciex (Stockholm, Sweden).
2.6. MALDI-MS data analysis
2.6.1. Protein identification with MS dataThe peak list files obtained fromMS spectra of the spinach andArabidopsis samples were subjected to database searching forprotein identification, using an in-houseMascot server (Version2.1) that was licensed to Umeå University by Matrix Science
1192 J O U R N A L O F P R O T E O M I C S 7 4 ( 2 0 1 1 ) 1 1 9 0 – 1 2 0 0
(http://www.matrixscience.com) with the following settings:Database: NCBInr; Taxonomy: Viridiplantae; Enzyme: Trypsin;Search tolerance: 50 ppm; Missed cleavage sites: 2; Fixedmodification:Carbamidomethylation (C);Variablemodification:Oxidation (M). TheGOannotationof theArabidopsis InformationResource (TAIR, www.arabidopsis.org) and the AraCyc databasewereused to classify the functions of theproteins identified andthe biological pathways in which they participate.
2.6.2. Hierarchical clustering of MS dataThe peak list files obtained fromMS spectra of the spinach andArabidopsis samples were subjected to hierarchical clusteringusing the web version of the SPECLUST program (http://bioinfo.thep.lu.se/speclust.html). Before clustering, noise peaks (forexample, trypsin and keratin peaks which were defined asbeing peaks present in >30% of the analyzed spectra) wereremoved using the peaks-in-common function of the SPECLUSTprogram. Peak lists that contained less than five masses aftereliminating the noise peaks were also removed to increase thequality of the clustering. Dendrograms were generated using theclustering function of the SPECLUST program, with the ‘width inpeakmatch’ score (sigma value) set at 0.9 Da, the ‘metric’ param-eter set at ‘liberal,’ and the ‘linkage’ parameter set at ‘average.’ Acut-off value of d=0.75 was chosen for cluster identification andnumbering. The d-value is the distance measure used inclustering for partitioning a data set into subsets within whichdata share some common trait [17]. For those selected spots thatwere subjected to further analyses, potentially modified pep-tides were detected using the peaks-in-common function of theSPECLUST program to find peaks that were either common orunique within a cluster, with the ‘width in peak match’ score(sigma value) set at 0.9 Da, the default pairwise score cut-off setat 0.7, and the multiple score cut-off set at 0.
2.6.3. Other analyses with MS dataThe FindMod tool (http://www.expasy.org/tools/findmod/) wasused to suggest modifications in peaks that did not matchtheoretical peptide mass values in the identified proteins[27,28]. The GPMAW program (Version 7.02, http://www.gpmaw.com)wasused for storingsequencedataandgeneratingtheoretical peak lists.
2.7. MALDI-MS/MS data acquisition
2.7.1. Automated acquisition of MS/MS spectraFor those spinach samples for which only 44% of the proteinshad been identified by MS data, MS/MS spectra were recordedusing a 4700 Proteomics Analyzer (AB Sciex, Framingham, CA,
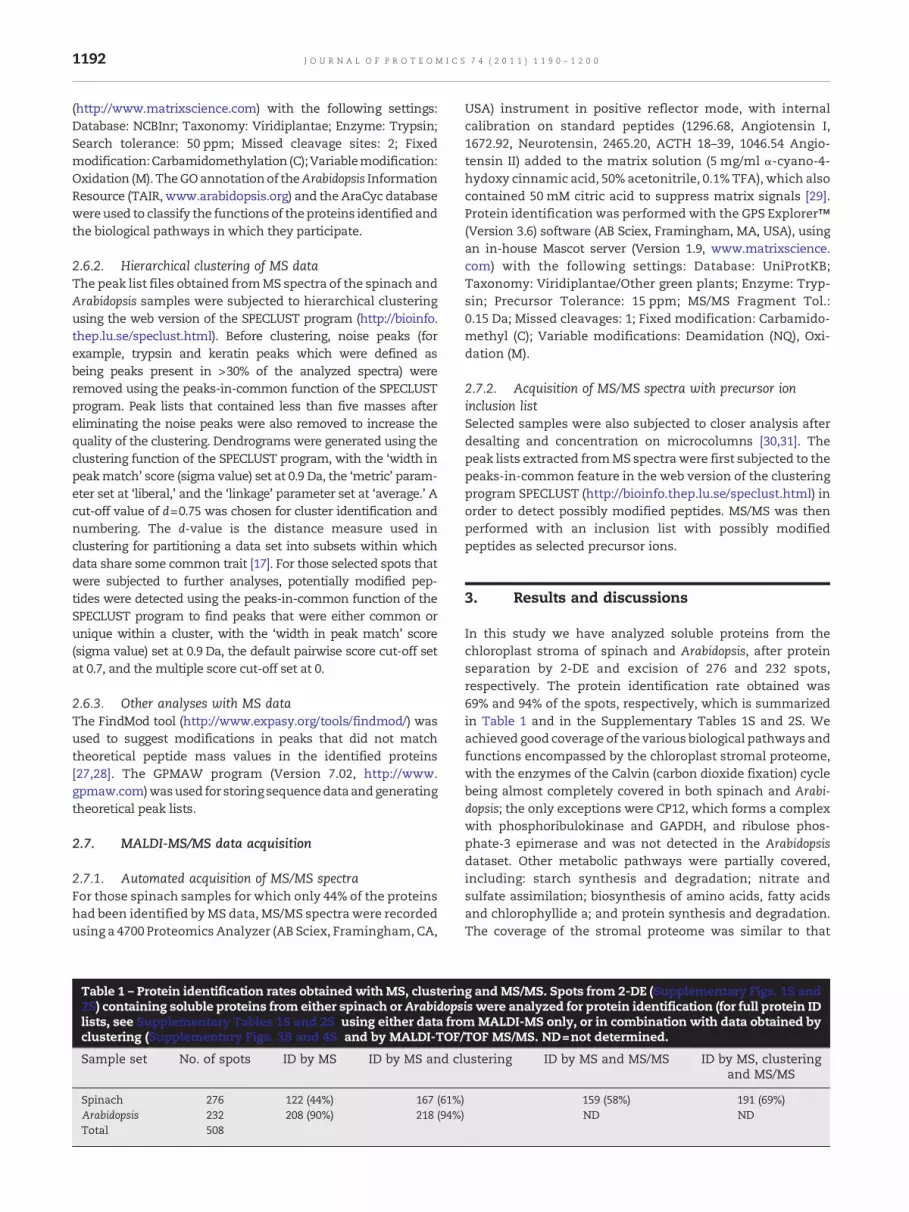
Table 1 – Protein identification rates obtained with MS, clusterin2S) containing soluble proteins from either spinach or Arabidopslists, see Supplementary Tables 1S and 2S) using either data froclustering (Supplementary Figs. 3S and 4S) and by MALDI-TOF
Sample set No. of spots ID by MS ID by MS and cl
Spinach 276 122 (44%) 167 (61%Arabidopsis 232 208 (90%) 218 (94%Total 508
USA) instrument in positive reflector mode, with internalcalibration on standard peptides (1296.68, Angiotensin I,1672.92, Neurotensin, 2465.20, ACTH 18–39, 1046.54 Angio-tensin II) added to the matrix solution (5 mg/ml α-cyano-4-hydoxy cinnamic acid, 50% acetonitrile, 0.1% TFA), which alsocontained 50 mM citric acid to suppress matrix signals [29].Protein identification was performed with the GPS Explorer™(Version 3.6) software (AB Sciex, Framingham, MA, USA), usingan in-house Mascot server (Version 1.9, www.matrixscience.com) with the following settings: Database: UniProtKB;Taxonomy: Viridiplantae/Other green plants; Enzyme: Tryp-sin; Precursor Tolerance: 15 ppm; MS/MS Fragment Tol.:0.15 Da; Missed cleavages: 1; Fixed modification: Carbamido-methyl (C); Variable modifications: Deamidation (NQ), Oxi-dation (M).
2.7.2. Acquisition of MS/MS spectra with precursor ioninclusion listSelected samples were also subjected to closer analysis afterdesalting and concentration on microcolumns [30,31]. Thepeak lists extracted fromMS spectrawere first subjected to thepeaks-in-common feature in the web version of the clusteringprogram SPECLUST (http://bioinfo.thep.lu.se/speclust.html) inorder to detect possibly modified peptides. MS/MS was thenperformed with an inclusion list with possibly modifiedpeptides as selected precursor ions.
3. Results and discussions
In this study we have analyzed soluble proteins from thechloroplast stroma of spinach and Arabidopsis, after proteinseparation by 2-DE and excision of 276 and 232 spots,respectively. The protein identification rate obtained was69% and 94% of the spots, respectively, which is summarizedin Table 1 and in the Supplementary Tables 1S and 2S. Weachieved good coverage of the various biological pathways andfunctions encompassed by the chloroplast stromal proteome,with the enzymes of the Calvin (carbon dioxide fixation) cyclebeing almost completely covered in both spinach and Arabi-dopsis; the only exceptions were CP12, which forms a complexwith phosphoribulokinase and GAPDH, and ribulose phos-phate-3 epimerase and was not detected in the Arabidopsisdataset. Other metabolic pathways were partially covered,including: starch synthesis and degradation; nitrate andsulfate assimilation; biosynthesis of amino acids, fatty acidsand chlorophyllide a; and protein synthesis and degradation.The coverage of the stromal proteome was similar to that
g andMS/MS. Spots from 2-DE (Supplementary Figs. 1S andiswere analyzed for protein identification (for full protein IDm MALDI-MS only, or in combination with data obtained by/TOF MS/MS. ND=not determined.
ustering ID by MS and MS/MS ID by MS, clusteringand MS/MS
) 159 (58%) 191 (69%)) ND ND

1193J O U R N A L O F P R O T E O M I C S 7 4 ( 2 0 1 1 ) 1 1 9 0 – 1 2 0 0
achieved in previous studies of the stromal proteins ofArabidopsis[32,33]. Moreover, it was found that the stromalfraction from spinach was less extensively cross-contaminatedwith material from the thylakoid lumen that had leaked acrossthe thylakoidmembrane than itwas fromArabidopsis, providingfurther support to the suitability of spinach as a model plant instudies of the chloroplast subproteome.
3.1. Clustering MS spectra of proteins homologues fromdifferent species
Dendrograms were generated by the hierarchical cluster-ing of peak list files extracted from MS spectra of spinachand Arabidopsis chloroplast proteins separated by 2-DE(Supplementary Figs. 1S and 2S). A complete dendrogramgenerated by the clustering of samples from spinach and a
Fig. 1 – Dendrograms generated by clustering MS data from protehierarchical clustering of peak list files extracted from MS spectrright-hand side. Samples from spinach are designed S507, S005,Clustering was performed with the web version of SPECLUST (sedendrograms indicates the distance measure, d, used during cluchloroplast proteins separated by 2-DE are presented in Supplemnumbers listed in Supplementary Tables S1 and S2. The selecteddendrogram for the clustering of MS spectra from spinach (Suppleclustering of MS spectra from both spinach and Arabidopsis (Supthis figure (from upper to lower) are Cluster 85 from the combinefrom spinach (S507, S005) and Arabidopsis (A007, A006, A005) thatspinach dendrogram and contain the proteins seduheptulose-1,7carbonic anhydrase and RuBisCo small subunit, respectively.
combined dendrogram generated by the clustering of samplesfrom both spinach and Arabidopsis are given in SupplementaryFigs. 3S and 4S, respectively. Selected clusters thereof arepresented in Fig. 1, giving an example how these related pro-teins might be grouped together on the basis of their MALDI-MS spectra. Cluster 85, at the top, is from the combineddendrogram of spinach and Arabidopsis (SupplementaryFig. 4S) and contains five different forms of the heat shock70 protein. With the cut-off d-value for cluster identificationset at 0.75, we found that 18 of the 101 clusters in thecombined dendrogram were mixed, i.e., contained proteinsfrom both spinach and Arabidopsis, but the majority of theMALDI-MS spectra from spinach and Arabidopsis obviouslydiffered enough from each other for them to form separateclusters. This shows that the majority of unidentifiedspinach proteins do not cluster together with known proteins
in spots in 2-DE. Dendrograms were generated by thea from the corresponding protein spots in 2-DE shown on theetc.; samples from Arabidopsis are designed A007, A006, etc.e Materials and methods), and the scale below thestering. Full images showing the spinach and Arabidopsisentary Figs. 1S and 2S, with protein identities and clusterclusters shown in this figure are subsections of the fullmentary Fig. 3S) and of the full combined dendrogram for theplementary Fig. 4S). The clusters selected for presentation ind dendrogram, contains different forms of the protein HSP70cluster together; Clusters 7, 78, 79, 34, and 65 are all from the-bisphosphatase, acetohydroxy acid isomeroreductase,

Table 2 – Clustering and peaks-in-common analysis. Peak lists from theMS spectra of the four spots in Cluster 65 (see Fig. 1)were investigated by the peaks-in-common function in the SPECLUST program (http://bioinfo.thep.lu.se/speclust.html). Acomplete list of the peaks-in-common analysis is shown in Supplementary Table 3S. Peak lists from duplicate MS spectrawere analyzed. Peak masses found to differ between the two pairs of spots are highlighted in gray boxes. Matching peptidesequences are listed including modifications suggested after uploading peak lists into FindMod (http://expasy.org/tools/findmod/). Sequence data confirmed by MS/MS (Figs. 3 and 4) are shown in bold.
S160a S160b S161a S161b S162a S162b S644a S644b Peptide Modifications suggestedby FindMod
1713.63 1713.65 1713.65 1713.66 QVQCVSFIAYKPAGY Cys CAM; Gln->pyro-Glu(N-term Q)
1730.65 1730.67 1730.67 1730.68 QVQCVSFIAYKPAGY Cys CAM1752.62 1752.64 1752.65 QVQCVSFIAYKPAGY Cys CAM; Na
1771.63 1771.64 QVQCVSFIAYKPAGY Cys CAM; Gln->pyro-Glu(N-term Q); AA sub. A-E
1788.65 1788.66 1788.65 1788.65 QVQCVSFIAYKPAGY Cys CAM; AA sub. A-E1810.64 QVQCVSFIAYKPAGY Cys CAM; AA sub. A-E; Na
2054.69 2054.72 2054.72 WVPCLEFETDHGFVYR Cys CAM2068.71 2068.71 2068.71 WVPCLEFETDHGFVYR Cys CAM; Methyl (N-term)
or AA sub. D-E2632.99 2633.02 IIGFDSNRQVQCVSFIAYKPAGY Cys CAM2633.98 2634.02 2634.03 IIGFDSNRQVQCVSFIAYKPAGY Cys CAM; Deamidated (NQ)
2691.00 2691.00 IIGFDSNRQVQCVSFIAYKPAGY Cys CAM; AA sub. A-E2691.98 2692.02 IIGFDSNRQVQCVSFIAYKPAGY Cys CAM; Deamidated (NQ);
AA sub. A-E
a Sample application by direct spotting.b Sample clean-up using microcolumns prior to application.
1194 J O U R N A L O F P R O T E O M I C S 7 4 ( 2 0 1 1 ) 1 1 9 0 – 1 2 0 0
from Arabidopsis. Hence, the cluster from the Arabidopsisdataset can usually not be used for identification of unknownspinach samples. However, the MS spectra from both uniden-
WVPCLEFETDHGFVYRA
WVPCLEFETDHGFVYRB
C
D
1.1E+4
8767.1
2054.7 1730.7
QVQCVSFIAYKPAGY
2054.7 1730.7
QVQCVSFIAYKPAGY
Fig. 2 – Comparison of MS spectra of samples within a cluster. MB, S161; C, spot S162 and D, S644; see Fig. 1). Highlighted peptidein MS/MS. The peptides differing within Cluster 65 were detecteprogram (see Table 2), which suggested that the peptides detectepairs S160/S161 and S162/S644, respectively, as are the peptides didentified as QVQCVSFIAYKPAGY in S160/S161 and QVQCVSFIAYS160/S161 and modified WVPCLEFETDHGFVYR in S162/S644 (see
tified and identified spinach proteins did indeed clustertogether, which improves the rate of protein identification,as explained below.
QVQCVSFIAYKPEGY WVPCLEFETDHGFVYR
QVQCVSFIAYKPEGY WVPCLEFETDHGFVYR
1.0E+4
6048.9
1788.7 2068.7
2068.7
1788.7
S spectra for the four samples in Cluster 65 (A, spot S160;s differ within the cluster and were selected as precursor ionsd with the peaks-in-common function in the clusteringd at m/z 1730.7 and 1788.7 are mutually exclusive in the spotetected atm/z 2054.7 and 2068.7. ByMS/MS the peptideswereKPEGY in S162/S644 (see Fig. 3), andWVPCLEFETDHGFVYR inFig. 4).
1195J O U R N A L O F P R O T E O M I C S 7 4 ( 2 0 1 1 ) 1 1 9 0 – 1 2 0 0
3.2. Clustering spectra of identified and non-identifiedsamples improves protein identification rate
The clusters below Cluster 85 in Fig. 1 are all from thedendrogram generated by clustering all of the samples fromspinach (Supplementary Fig. 3S). The respective proteinidentifications are summarized in Supplementary Table 1S.The next cluster, Cluster 7, is comprised of five variants thatare all identified by MS data as the Calvin cycle enzymesedoheptulose-1,7-bisphosphatase, with onemajor spot (S084)on the 2-DE gel and several weaker spots nearby illustrating theisoelectricheterogeneity exhibitedbymanychloroplast proteins.
A more complex situation is illustrated in the next twoclusters, 78 and 79. These two distinct clusters in the dendro-gram are comprised of spots on the 2-DE gel that are completelyintermixed in the gel image. Cluster 79 contains three spots,S038, S418 and S037, all of which were identified by MS data asthe protein acetohydroxy acid isomeroreductase. Cluster 78contains four spots, S539, S538, S537, and S541, that could not beidentified, either by MS data or by MS/MS data. Clusters 78 and
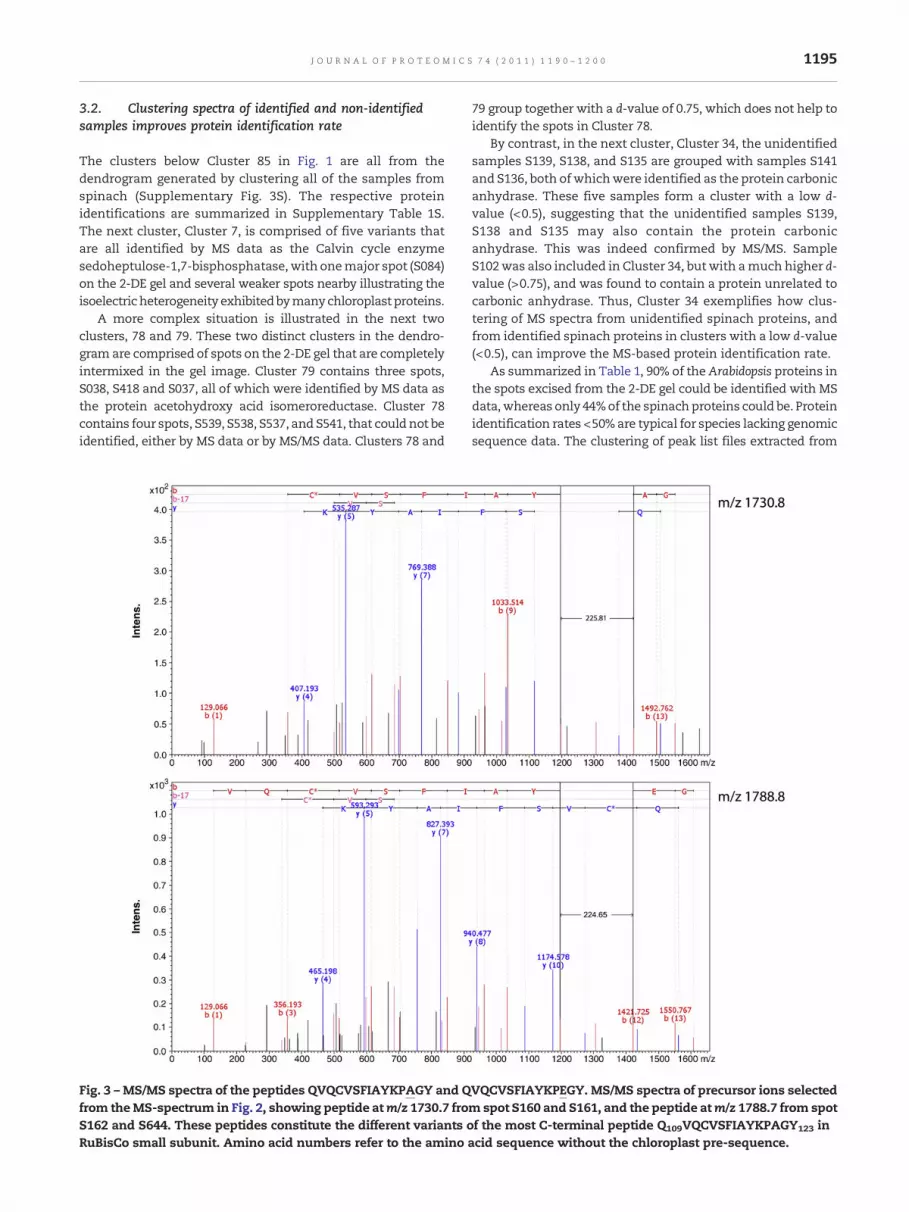
Fig. 3 –MS/MS spectra of the peptides QVQCVSFIAYKPAGY and Qfrom theMS-spectrum in Fig. 2, showing peptide atm/z 1730.7 froS162 and S644. These peptides constitute the different variants oRuBisCo small subunit. Amino acid numbers refer to the amino
79 group together with a d-value of 0.75, which does not help toidentify the spots in Cluster 78.
By contrast, in the next cluster, Cluster 34, the unidentifiedsamples S139, S138, and S135 are grouped with samples S141and S136, both of whichwere identified as the protein carbonicanhydrase. These five samples form a cluster with a low d-value (<0.5), suggesting that the unidentified samples S139,S138 and S135 may also contain the protein carbonicanhydrase. This was indeed confirmed by MS/MS. SampleS102was also included in Cluster 34, butwith amuch higher d-value (>0.75), and was found to contain a protein unrelated tocarbonic anhydrase. Thus, Cluster 34 exemplifies how clus-tering of MS spectra from unidentified spinach proteins, andfrom identified spinach proteins in clusters with a low d-value(<0.5), can improve the MS-based protein identification rate.
As summarized in Table 1, 90% of theArabidopsis proteins inthe spots excised from the 2-DE gel could be identified with MSdata,whereas only 44%of the spinachproteins could be. Proteinidentification rates <50%are typical for species lacking genomicsequence data. The clustering of peak list files extracted from
VQCVSFIAYKPEGY. MS/MS spectra of precursor ions selectedm spot S160 and S161, and the peptide atm/z 1788.7 from spotf the most C-terminal peptide Q109VQCVSFIAYKPAGY123 in
acid sequence without the chloroplast pre-sequence.

1196 J O U R N A L O F P R O T E O M I C S 7 4 ( 2 0 1 1 ) 1 1 9 0 – 1 2 0 0
MS spectra could improve the identification rate to 61%, sinceMS spectra from unidentified and identified spinach proteinsclustered together with d-values <0.75. This increased proteinidentification rate was comparable to and even better than theincreased identification rate obtained by MS/MS (58%). Whenthe information from the clustering andMS/MSwere combined,the identification was increased even further to 69%. Proteinidentification by the clustering of MS data can be used as acomplement to protein identification by MS/MS. The thresholdthat is suitable for cut-off in d-value must be determinedempirically for each dataset. By MS/MS validation of proteinidentity in clusters with different d-values, a threshold canbe selected for clustering of MS data to improve the proteinidentification rate.
3.3. Peaks-in-common analysis as a starting point fordetection of protein variants and modified peptides
As exemplified in the following with Cluster 65 (the lowestcluster in Fig. 1), clustering can be used as a starting point for
Fig. 4 –MS/MS spectra of the peptideWVPCLEFETDHGFVYRwithoselected from the MS spectrum in Fig. 2, showing the peptide at2068.7 from spots S162 and S644. These peptides constitute two dE47 in the peptide W38VPCLEFETDHGFVYR53 in RuBisCo small suwithout the chloroplast pre-sequence.
the detection of modified peptides by utilizing the peaks-in-common feature in the web version of the clustering programSPECLUST (http://bioinfo.thep.lu.se/speclust.html). Cluster 65is comprised of S160, S161, S162 and S644 with a d-value of<0.5. This cluster is separated into two distinct pairs, with thetwo sampleswithin each pair clusteringwith one anotherwitheven lower d-values (0.2 and 0.35). On the gel image, the fourspots corresponding to S160, S161, S162 and S644 also appearas two pairs, separated by 0.6–0.3 pI units. Three of the foursampleswere readily identified by PMF as the protein Ribulose1,5-bisphosphate carboxylase (RuBisCo) small subunit. SampleS160 could not be identified by PMF, but the clusteringsuggested that sample S160 also contained RuBisCo smallsubunit, whichwas indeed confirmed byMS/MS (SupplementaryTable 1S).
To further investigate the four spots in order to find proteinvariants and modified peptides, the peak lists of S160, S161,S162 and S644 were uploaded into the peaks-in-commonfunction in the clustering program, the full output of which ispresented in Supplementary Table 3S. In a selected part of the
ut andwithmodification.MS/MS spectra of the precursor ionsm/z 2054.7 from spots S160 and S161 and the peptide at m/zifferent variants, one without and one with a modification inbunit. Amino acid numbers refer to the amino acid sequence

1197J O U R N A L O F P R O T E O M I C S 7 4 ( 2 0 1 1 ) 1 1 9 0 – 1 2 0 0
peaks-in-common output presented in Table 2, the enboxedpeptides appear to be mutually exclusive in the spot pairsS160/S161 and S162/S644, the m/z 1730.7 peptide in S160/S161is mutually exclusive to the m/z 1788.7 peptide in S162/S644,as is m/z 2054.7 with m/z 2068.7; these can also be seen in thecorresponding MS spectra (Fig. 2).
These peptides were therefore selected as precursor ionsfor a directed sequencing effort with MS/MS. The y-ion seriesof the m/z 1788.7 peptide was up-shifted relative to the m/z1730.7 peptide by 58 Da (Fig. 3), whereas the b-ions wereidentical, except for the b13 ion, whichwas shifted upwards by58 Da. The conclusion is therefore that the peptide at m/z1788.7 Da has an Ala to Glu substitution. Its amino acidsequence is QVQCVSFIAYKPEGY and as for the peptide at m/z1730.7 the sequence is QVQCVSFIAYKPAGY. The additionalnegative charge introduced into the proteins in spots S162 and
Use MS-data for protein identification
Inspect clusters where unidentified samples cluster
with identified samples
Improved PMF protein identification rate
Acquisition of MS/MS-spectra for remaining unidentified samples
Use MS/MS-data for protein identification
Improved protein identification rate
In-gel digested sam
Acquisition of
Fig. 5 – Workflow for data acquisition and cluster analysis to impMALDI-TOF/TOFmass spectrometry. After acquisition of MS specby matching peak lists against data bases, and for clustering (riguploading peak lists into the clustering program SPECLUST (httpdendrograms that are generated by the clustering improves theunidentified samples cluster with identified samples. The peaksprovides a starting point for detection of PTMs and amino acid sspectra with the selected precursor ion in the inclusion lists can bon selected peaks that differ within clusters and are likely to reprepost-translational modifications (PTMs).
S644 by this Ala to Glu substitution may account for therelatively low pI value of these spots: the theoretical pI shiftdue to an Ala to Glu substitution is 0.39, which is consistentwith the pI shift observed in the 2-D experiment. In addition,some other variants of both the 1730.7 and 1788.7 Da peptideswere also observed, including sodium adducts (1752.6 and1810.6 Da), variants presumably derived by the conversion of aGln residue to Pyro-Glu (1713.6 and 1771.6 Da), and two longerpeptides arising from a missed cleavage site (2633.0 Da and2691.0 Da). All of these peptides displayed the same b-ions andy-ions shifts between S160/S161 and S162/S644, which pro-vides further evidence supporting the Ala to Glu substitution.The other two mutually exclusive peptides (Table 2, Fig. 2),with m/z 2054.7 and 2068.7 Da, were identified by MS/MS asWVPCLEFETDHGFVYR in S160/S161 and a modified variant inS162/S644 (Fig. 4), with a 14 Da difference that may be due to
Use MS-data for clustering in SPECLUST
Use MS-data for peaks-in-common analysis in
SPECLUST
Detection of PTMs and amino acid substitutions
ples from 2D-gels
MS-spectra
Use MS/MS-data in small database with multiple
alternatives for modifications
Acquisition of MS/MS-spectra for selected peaks
differing within clusters
Clean the MS-data with peaks-in-common analysis in
SPECLUST
rove protein identification and detect modifications withtra, MS data are used for protein identification (left-hand side)ht-hand side) by matching peak lists against each other by://bioinfo.thep.lu.se/speclust.html). Evaluation of thefinal protein identification rate (lower left-hand side) when-in-common feature of the clustering program SPECLUSTubstitutions (lower right-hand side). Acquisition of MS/MSe focused on samples that are not identified by MS data, andsent peptides that possess single amino acid substitutions or

1198 J O U R N A L O F P R O T E O M I C S 7 4 ( 2 0 1 1 ) 1 1 9 0 – 1 2 0 0
the methylation of an aspartic acid (D) residue, or to thesubstitution of D by glutamic acid (E). By BLAST-searching andthe multiple alignment of sequences of the RuBisCo smallsubunit from several different plant species, it can be shownthat also other plants, including tobacco, tomato, potato andStellaria, have E instead of A in the peptide QVQCVSFIAYKP-EGY that was detected in the spinach proteins in the S162 andS644 spots (data not shown).
The N-terminal peptide MKVWPTQNMK, which containsone missed cleavage site, and MKVWPTQNMKR, which con-tains two, can potentially be modified in several ways,(Table 3S), but no MS/MS spectra were obtained that wouldsupport this assumption. Notably, no peak was detected cor-responding to the mass of the unmodified N-terminal peptide(which would be expected to have a mass value of 1003.2,1262.5, or 1418.7 Da, depending on the number of missedcleavage sites), suggesting that indeed this peptide is subject toa number of PTMs in the cell. The heterogeneity in detectedpeptides may be due to methionine oxidation, which is acommon artifact in mass spectrometry [34,35] and may partlyaccount for the modified N-terminal RuBisCo small subunitpeptides suggested in Supplementary Table S3. There are alsoseveral enzymes that catalyze the modification of RuBisCo ,including methionine aminopeptidases, N-acetyltransferases,methyl-transferases, demethylases, deacetylases and amino-peptidases that also play other critical roles in chloroplastbiology than their important function in the processing of theRuBisCo subunits [36–39]. Chloroplasts harbor a specific light-induced form of the universal enzyme peptide methioninesulfoxide reductase (PMSR), whose role is to reduce oxidizedmethionines [40,41]. Reversible methionine sulfoxidation ofchloroplast proteins is also believed to play a protective aswellas a regulatory role [42,43].
For approximately one third of the spots detected in 2-DE(Supplementary Figs. 1 and 2) and analyzed by MALDI-MS, theMS spectra did not cluster, suggesting that they may repre-sent proteins without isoforms or modifications. The RuBisCosubunits is certainly very abundant in chloroplasts and isknown to have several post-translational modifications [36],which might explains why it was detected in more than 30spots, appearing with both the large (Clusters 99 and 121) andsmall subunits (Cluster 65). The large subunits were alsodetected at a lower mass than expected, which would suggestdegradation products being formed by the action of proteases[44]. The RuBisCo enzyme catalyzes the assimilation of carbondioxide from the biosphere, is the rate-limiting step inphotosynthesis, and is regulated in a complex manner [45,46].Further proteomic resolution of its variants and the dynamicinterconversion of their PTMs can offer new insights into theregulation of this important enzyme.
4. Conclusions
In the present paper we have shown how clustering of MSspectra can be used as a proteomic tool, that is useful forincreasing the MS-based protein identification rate, especiallyin species lacking genomic sequence data, and is useful in MS-based screening for detecting and resolving protein variantsand modified peptides.
An alternative approach for studying proteins of organismslacking genomic sequence data is the chemical modification ofthe peptide N-termini prior to acquisition of MS/MS spectra,followed by de novo sequencing and similarity searches to findhomologous proteins in other species [28,47–49]. These tech-niques can increase the rate of protein identification signifi-cantly but require an additional chemical reaction for eachsample that is to be analyzed. By contrast, the cluster analysesdescribed here can easily be incorporated into any workflowemploying 2-DE and MS.
The workflow is especially suited for the two-step approachtoMS andMS/MS analysis that is possiblewithMALDI-TOF/TOFinstrumentation. As summarized in Fig. 5, a primary round ofMS data acquisition is used both for protein identification andclustering. Inspection of the clustered data can increase theprotein identification rate if unidentified samples cluster withidentified samples. A peaks-in-common analysis offers a goodstarting point for detection of modifications and amino acidsubstitutions. A second round of MS/MS data acquisition can beutilized more efficiently by using inclusion lists. These can beused to prioritize or focus entirely on selected precursor ions insamples yet to be identified samples, and on selected precursorions that are peptides, which prove, according the peaks-in-common analysis, to differ within clusters. Thus samples andMS/MS time can be saved, and the efforts to obtain partial orcomplete sequencing data can be directed to and concentratedonaveritablehotspot ofmodifiedpeptidesandprotein variants.
Supplementary materials related to this article can befound online at doi:10.1016/j.jprot.2011.04.008.
Acknowledgement
This project was supported by grants from the SwedishResearch Council FORMAS (WS) and the Carl Trygger Founda-tion (TK, CE).
R E F E R E N C E S
[1] Henzel WJ, Watanabe C, Stults JT. Protein identification: theorigins of peptide mass fingerprinting. J Am Soc MassSpectrom 2003;14:931–42.
[2] Rappsilber J, Mann M. What does it mean to identify a proteinin proteomics? Trends Biochem Sci 2002;27:74–8.
[3] Jensen ON. Modification-specific proteomics: characterizationof posttranslational modifications by mass spectrometry. CurrOpin Chem Biol 2004;8:33–41.
[4] JensenON. Interpreting the protein language using proteomics.Nat Rev Mol Cell Biol 2006;7:391–403.
[5] Initiative TAG. Analysis of the genome sequence of theflowering plant Arabidopsis thaliana. Nature 2000;408:796–815.
[6] Yu J, Hu S,Wang J, Wong GK-S, Li S, Liu B, Deng Y, et al. A draftsequence of the rice genome (Oryza sativa L. ssp. indica).Science 2002;296:79–92.
[7] Goff SA, Ricke D, Lan T-H, Presting G,Wang R, DunnM, et al. Adraft sequence of the rice genome (Oryza sativa L. ssp.japonica). Science 2002;296:92–100.
[8] Tuskan GA, DiFazio S, Jansson S, Bohlmann J, Grigeriev I,Hellsten U, et al. The genome of black cottonwood, Populustrichocarpa (Torr. & Gray). Science 2006;313:1596–604.

1199J O U R N A L O F P R O T E O M I C S 7 4 ( 2 0 1 1 ) 1 1 9 0 – 1 2 0 0
[9] Ming R, Hou S, Feng Y, Yu Q, Dionne-Laporte A, Saw JH, et al.The draft genome of the transgenic tropical fruit tree papaya(Carica papaya Linnaeus). Nature 2008;452:991–6.
[10] Adams III WW, Watson AM, Mueh KE, Amiard V, Turgeon R,Ebbert V, et al. Photosynthetic acclimation in the context ofstructural constraints to carbonexport from leaves. PhotosynthRes 2007;94:455–66.
[11] Goss R, Oroszi S,WilhelmC. The importance of grana stackingfor xanthophyll cycle-dependent NPQ in the thylakoidmembranes of higher plants. Physiol Plant 2007;131:496–507.
[12] Kirchhoff H, Haferkamp S, Allen JF, Epstein DBA, MullineauxCW. Protein diffusion and macromolecular crowding inthylakoid membranes. Plant Physiol 2008;146:1571–8.
[13] Roth S, Fromm B, Gäde G, Predel RA. Proteomic approach forstudying insect phylogeny: CAPA peptides of ancient insect taxa(Dictoptera, Blattoptera) as a test case. BMC Evol Biol 2009;9:50.
[14] Feltens R, Görner R, Kalkhof S, Gröger-Arndt H, Bergen von M.Discrimination of different species from the genus Drosophilaby intact protein profiling using matrix-assisted laserdesorption ionization mass spectrometry. BMC Evol Biol2010;10:95.
[15] Menschaert G, Vandekerckhove TTM, Landuyt B, Hayakawa E,Schoofs L, Luyten W, et al. Spectral clustering in peptidomicsstudies helps to unravel modification profile of biologicallyactive peptides and enhances peptide identification rate.Proteomics 2009;9:4381–8.
[16] Falkner JA, Falkner JW, Yocum AK, Andrews PC. A spectralclustering approach to MS/MS identification ofpost-translational modifications. J Proteome Res 2008;7:4614–22.
[17] Alm R, Johansson P, Hjernø K, Emanuelsson C, Ringnér M,Häkkinen J. Detection and identification of protein isoformsusing cluster analysis of MALDI-MS mass spectra. J ProteomeRes 2006;5:785–92.
[18] Böhme K, Fernández-No IC, Gallardo JM, Cañas B, Calo-MataP. Safety assessment of fresh and processed seafood productsby MALDI-TOF mass fingerprinting. Food Bioprocess Technol2010, doi:10.1007/s11947-010-0450-1 ISSN 1935–5130.
[19] Böhme K, Fernandez-No IC, Barros-Velazquez J, Gallardo JM,Calo-Mata P, Cañas B. Species differentiation of seafood spoilageand pathogenic gram-negative bacteria byMALDI-TOF mass fingerprinting. J Proteome Res 2010;9:3169–83.
[20] Fenández-No IC, Böhme K, Gallardo JM, Barros-Velázquez J,Cañas B, Calo-Mata P. Differential characterization of biogenicamine-producing bacteria involved in food poisoning usingMALDI-TOF mass fingerprinting. Electrophoresis 2010;31:1116–27.
[21] Franco CF, Mellado MCM, Alves PM, Coelho AV. Monitoringvirus-like particle and viral protein production by intact cellMALDI-TOF mass spectrometry. Talanta 2010;80:1561–8.
[22] Schubert M, Petersson UA, Haas BJ, Funk C, Schröder WP,Kieselbach T. Proteome map of the chloroplast lumen ofArabidopsis thaliana. J Biol Chem 2002;277:8354–65.
[23] Kieselbach T, Hagman Å, Andersson B, Schröder WP. Thethylakoid lumen of chloroplasts. Isolation andcharacterization. J Biol Chem 1998;273:6710–6.
[24] Granlund I, Michael H, Kieselbach T, Schröder WP. Lightinduced changes in protein expression and uniform regulationof transcription in the thylakoid lumen of Arabidopsis thaliana.PLoS One 2009;4:1–11.
[25] Westermeier R, Naven T. Proteomics in practice—a laboratorymanual of proteome analysis. Weinheim: Wiley-VCH; 2002.
[26] Yao D, Kieselbach T, Komenda J, Promnares, Prieto MAH,Tichy M, et al. Localization of the small CAB-like proteins inphotosystem II. J Biol Chem 2007;282:267–76.
[27] Wilkins MR, Gasteiger E, Gooley AA, Herbert BR, Molloy MP, BinzP-A, et al. High-throughput mass spectrometric discovery ofprotein post-translational modifications. J Mol Biol 1999;289:645–57.
[28] Gasteiger E, Hoogland C, Gattiker A, Duvaud S, Wilkins MR,Appel RD, et al, editors. Protein Identification and AnalysisTools on the ExPASy Server, The Proteomics ProtocolsHandbook. University of Hertfordshire, Hatfield, Herts, UK:Hummana Press; 2005. p. 571–607.
[29] Mirgorodskaya E, Braeuer C, Fucini P, Lehrach H, Gobom J.Nanoflow liquid chromatography coupled to matrix-assistedlaser desorption/ionization mass spectrometry: samplepreparation, data analysis, and application to the analysis ofcomplex peptide mixtures. Proteomics 2005;5:399–408.
[30] Gobom J, Nordhoff E, Mirgorodskaya E, Ekman R, Roepstorff P.Sample purification and preparation technique based onnano-scale reversed-phase columns for the sensitive analysisof complex peptide mixtures by matrix-assisted laserdesorption/ionization mass spectrometry. J Mass Spectrom1999;34:105–16.
[31] Rappsilber J, IshihamaY,MannM.Stopandgo extraction tips formatrix-assisted laser desorption/ionization, nanoelectrospray,and LC/MS sample pretreatment in proteomics. Anal Chem2003;75:663–70.
[32] Peltier J-B, Cai Y, Sun Q, Zabrouskov V, Giacomelli L, RudellaA, et al. The oligomeric stromal proteome of Arabidopsisthaliana chloroplasts. Mol Cell Proteomics 2006;5:114–33.
[33] Goulas E, SchubertM,KieselbachT,Kleczkowski LA,GardeströmP, Schröder WP, et al. The chloroplast lumen and stromalproteomes ofArabidopsis thaliana show differential sensitivity toshort- and long-term exposure to low temperature. Plant J2006;47:720–34.
[34] Potgieter HC, Ubbink JB, Bissbort S, Bester MJ, Spies JH,Vermaak WJH. Spontaneous oxidation of methionine: effecton the quantification of plasma methionine levels. AnalBiochem 1997;248:86–93.
[35] Taylor SW, Fahy E, Murray J, Capaldi RA, Ghosh SS. Oxidativepost-translational modification of tryptophan residues incardiac mitochondrial proteins. J Biol Chem 2003;278:19587–90.
[36] Houtz RL, Magnani R, Nayak NR, Dirk LMA. Co- andpost-translational modifications in RuBisCo: unansweredquestions. J Exp Bot 2008;59:1635–45.
[37] Ying Z, Mulligan RM, Janney N, Houtz RL. Rubisco small andlarge subunit N-methyltransferases. Bi- andmono-functionalmethyltransferases that methylate the small and largesubunits of Rubisco. J Biol Chem 1999;274:36750–6.
[38] Grimm R, GrimmM, Eckerskorn C, Pohlmeyer K, Pöhl T, Soll J.Postimport methylation of the small subunit of ribulose-1,5-bisphosphate carboxylase in chloroplasts1. FEBS Lett1997;408:350–4.
[39] Houtz RL, Portis Jr AR. The life of ribulose 1,5-bisphosphatecarboxylase/oxygenase–posttranslational facts and mysteries.Arch Biochem Biophys 2003;414:150–8.
[40] Gustavsson N, Kokke BPA, Härndahl U, Silow M, Bechtold U,Poghosyan Z, et al. A peptide methionine sulfoxide reductasehighly expressed in photosynthetic tissue in Arabidopsisthaliana can protect the chaperone-like activity of achloroplast-localized small heat shock protein. Plant J 2002;29:545–53.
[41] Sadanandom A, Poghosyan Z, Fairbairn DJ, Murphy DJ.Differential regulation of plastidial and cytosolic isoforms ofpeptide methionine sulfoxide reductase in Arabidopsis. PlantPhysiol 2000;123:255–64.
[42] Stadtman ER, Moskovitz J, Berlett BS, Levine RL. Cyclicoxidation and reduction of protein methionine residues is animportant antioxidant mechanism. Mol Cell Biochem2002;234–235:3–9.
[43] Sundby C, Härndahl U, Gustavsson N, Åhrman E, Murphy DJ.Conserved methionines in chloroplasts. Biochim BiophysActa 2005;1703:191–202.
[44] Marín-Navarro J, Moreno J. Modification of the proteolyticfragmentationpatternuponoxidationof cysteines fromribulose

1200 J O U R N A L O F P R O T E O M I C S 7 4 ( 2 0 1 1 ) 1 1 9 0 – 1 2 0 0
1,5-bisphosphate carboxylase/oxygenase. Biochemistry2003;42:14930–8.
[45] Spreitzer RJ, Salvucci ME. RuBisCo: structure, regulatoryinteractions, and possibilities for a better enzyme. Annu RevPlant Biol 2002;53:449–75.
[46] Andersson I, Backlund A. Structure and function of RuBisCo.Plant Physiol Biochem 2008;46:275–91.
[47] Wang D, Kalb SR, Cotter RJ. Improved procedures forN-terminal sulfonation of peptides for matrix-assisted laserdesorption/ionization post-source decay peptide sequencing.Rapid Commun Mass Spectrom 2004;18:96–102.
[48] Leon IR, Neves-Ferreira AC, Valente RH, Mota EM, Lenzi HL,Perales J. Improved protein identification efficiency by massspectrometry using N-terminal chemical derivatization ofpeptides fromAngiostrongylus costaricensis, a nematode withunknown genome. J Mass Spectrom 2007;2:1363–74.
[49] Conrotto P, Hellman U. Lys Tag: an easy and robust chemicalmodification for improved de novo sequencing with amatrix-assisted laser desorption/ionization tandemtime-of-flight mass spectrometer. Rapid CommunMass Spectrom 2008;22:1823–33.