clogging issues associated with managed
TRANSCRIPT
CLOGGING ISSUES ASSOCIATED WITH MANAGED AQUIFER RECHARGE METHODS
Edited by: Russell Martin

1
This work has been undertaken as part of the IAH Commission on Managing Aquifer Recharge. IAH-MAR has its roots in the
Working Group on Artificial Recharge, founded in 1998 by Ivan Johnson of AIJ Consultants in Denver and formerly of USGS, an
activist for more than 30 years in artificial recharge research and practice, and leader of the ASCE/EWRI Standards Committee
for Artificial Recharge. The group had its first meeting in November 2000 at Cape Town (IAH XXX). The change in name from
'Artificial Recharge' to 'Management of Aquifer Recharge' reflects the reality that water banking and bank filtration harness
natural processes to manage and enhance aquifer recharge, a vital tool in the sustainable management of the world's
groundwater resources.
First published October 2013
ISBN 978-0-646-90852-6
Citation for Clogging Monograph:
Martin, R., (ed.) (2013) Clogging issues associated with managed aquifer recharge methods. IAH Commission on Managing
Aquifer Recharge, Australia.
Citation for Chapter in Monograph (example) :
Rinck-Pfeiffer, S., Dillon, P., Ragusa, S., Hutson, J., Fallowfield, H., de Marsily, G., and Pavelic, P., (20130) Reclaimed Water for
Aquifer Storage and Recovery: A Column Study of Well Clogging. In: Martin R (ed.) Clogging issues associated with managed
aquifer recharge methods. IAH Commission on Managing Aquifer Recharge, Australia, 26‒33.
Contacts
Specific enquires about the material contained in this publication should be directed to the respective lead authors. Contact
details are listed at the back of this publication. Anyone wishing to contribute additional papers should contact the editor
Russell Martin via e-mail [email protected]
Production Assistance
Editing by Russell Martin, General Manager at Australian Groundwater Technologies. Layout and design by Gayle Bruggemann
Graphics and GIS Specialist at Australian Groundwater Technologies.

2
FOREWORD Significant advances in the areas of geochemistry, microbiology and aquifer hydraulics regarding the science of recharge of
water to aquifers has been made over the past decade. With the increased uptake of managed aquifer recharge as water
resources management practice that can augment traditional water supplies, or address a variety of legacy issues associated
with overuse, a greater appreciation of how complex the problems associated with aquifer recharge, and in particular
clogging, is becoming apparent.
This monograph presents a collection of papers that highlight the work being carried out within this area. It is intended to
raise the awareness of practitioners and operators alike of how clogging may impact a managed aquifer recharge scheme, but
with the appropriate level of investigation, can be effectively managed.
A MAR scheme will invariably experience clogging of some type, and to some degree, during its operational life. To recognise
the potential for clogging and employ the appropriate mitigation or remediation measures, either through engineering
design or through operational management practices, requires specialist knowledge and skills. It should also be noted that
remediation methods to address clogging are very site specific and what works in one hydrogeological setting may not always
be successful in another location. Indeed remediation approaches may differ between injection bores across the same
scheme. Effective management and remediation of clogging can only come through the effective dissemination of
information and learning from practitioners that have considerable operational experience.
Clogging should not be used as a justification as to why an MAR scheme was unsuccessful in a particular hydrogeological
setting. With the appropriate level of investigation, inclusive of detailed characterisation of the target aquifer, source water
quality, receiving water quality and the implementation of effective operational practices, clogging can be managed. Where
clogging does occur it can also be effectively mitigated using a variety of techniques.
This monograph is not complete and addresses only some of the clogging issues associated with both surface infiltration
basins and injection via bores. It does not address potential clogging issues associated with the various other methods of MAR
such as bank filtration. This monograph is available online and has been structured so that it can be easily added to. The intent
is to continually build on our operating knowledge of clogging and remediation methods and I would encourage all
hydrogeologists practicing in this specialist field to share their experiences regarding clogging by submitting a paper to
myself for review and inclusion within future revisions of this monograph.
Russell R Martin
Editor: Clogging Issues Associated with Managed Aquifer Recharge Methods

3
ACKNOWLEDGEMENTS My thanks to the authors of the various papers contained in this monograph and without their dedication and considerable
time taken to compile their information this publication would not be possible. Special thanks also to Gayle for her invaluable
assistance in preparing the layout and presentation of the monograph. The aim of the monograph is to share with other
practitioners the collective knowledge that has been developed to date in an effort to advance the science in this highly
specialised area of hydrogeology. I trust readers will find some of the information contained in the papers of value and would
encourage others working in this field to contribute their experiences and knowledge to build this into a practical reference
text. The purpose of providing this as a web based document presents the opportunity to continually add relevant text easily.
Anyone wishing to contribute can send their paper to me for review at the e-mail address given in the foreword.
4
INTRODUCTION R. Martin
General Manager, Australian Groundwater Technologies
Managed Aquifer Recharge (MAR) is a collection of water resource management practices employed to
actively store water underground for recovery when needed. The approach used to recharge the water to the
underlying aquifers is typically governed by the local hydrogeological conditions. Intentional aquifer storage,
with the goal of recovering the water at a later date, has been used for hundreds of years, but is being further
developed and refined as demand for fresh water threatens to exceed supply in many parts of the world. One
of the challenges for the sustainable operation of MAR schemes is the management of clogging. Clogging
leads to lost performance and can result in costly workovers or recompletions of bores and infiltration basins,
or expensive stimulation jobs, such as acidisation. In extreame cases clogging may lead to uncontrolled
fracturing of the aquifer formation or overlying confining beds as a result of the induced high bottom hole
pressures.
Physical scarcity of water in many of the arid regions
across the globe and the lack of clean drinking water is a
significant and growing problem. Today, about one third
of the world’s population lives with moderate to high
water stress. By 2025, largely because of population
growth, two out of three of the world’s people will live
under these conditions (Mazur, 2012). Margaret Catley-
Carlson, vice-chair of the World Economic Forum Global
Agenda Council on water security wrote If “business as usual” water management practices continue for another two decades, large parts of the world will face a serious and structural threat to economic growth, human well-being, and national security (2011).
Water resources must be managed and used more
efficiently and wisely if we are to sustain the needs of a
growing world population (Pyne, 2005).
MAR, in its various forms, and related water management
practices are evolving rapidly in response to declining
groundwater levels, increased vulnerability of surface
water supplies to contamination, increasing concerns
regarding climate variability, and numerous other
reasons. There is huge potential for MAR, used in
conjunction with other water management techniques, to
make more efficient use of existing water resources and
capitalise on opportunities, previously overlooked, to
augment traditional water supply sources.
While MAR is maturing as a recognised water
management approach one of the most significant
challenges for the sustainable operation of any MAR
scheme is the potential for clogging (sometimes referred
to as plugging). Physical, biological, and chemical
clogging of infiltrating surfaces and injection bores with
the resulting reduction in infiltration rates is perhaps the
most obvious problem encountered in any MAR scheme.
A MAR scheme will invariably experience clogging and
where the selected MAR method involves an injection
and recovery bore (aquifer storage and recovery) the risk
of clogging is potentially greater.
Two of the most common methods employed for aquifer
recharge include surface infiltration systems and injection
bores and the clogging associated with these two
methods of MAR is the primary focus of this monograph.
The papers prepared by various authors contained within
this monograph present aspects of clogging observed
during column experiments, experience gained from
infiltration basins and the use of recharge bores. The
information is by no means exhaustive and there are still a
number of knowledge gaps and issues not discussed
within this monograph.
Clogging Processes Clogging causes impaired injectivity restricting the
volume of water that can infiltrate or be injected into the
target aquifer. In recharge bores under a constant
injection rate clogging may lead to excessive pressure
heads that result in the failure of either the aquifer
5
formation or the overlying confining beds. More typically
maximum injection heads are preset and the result is a
reduced rate of injection.
Although spreading basins are less prone to serious
clogging than injection bores, recharge water should be
of an adequate quality to avoid clogging the infiltrating
surface. Typically clogging of infiltration basins or
trenches can be caused by precipitation of minerals on
and in the soil, entrapment of gases in the soil, formation
of biofilms and biomass on and in the soil, and by
deposition and accumulation of suspended algae and
sediment. Pre-treatment of the water can greatly reduce
suspended solids and nutrients, but the infiltrating
surfaces usually require periodic cleaning to maintain
infiltration rates.
In recharge bores clogging generally occurs at the bore /
aquifer interface that is, in the gravel pack (if present), the
wall of the bore and in the target formation immediately
surrounding the bore.
Clogging can be divided into four principal types:
1. Chemical which includes precipitation of
elements such as, iron or aluminium, aquifer
matrix dissolution and temperature.
2. Physical which includes suspended solids,
migration of interstitial fines (e.g. illite or
smectite clays), unintentional fracturing of the
aquifer, and formation damage during bore
construction.
3. Mechanical such as entrained air/gas binding. 4. Biological which includes algae growth, iron or
sulphate reducing bacteria.
Table 1 presents a summary of the four principal types of
clogging and the processes that can be ascribed to each
type.
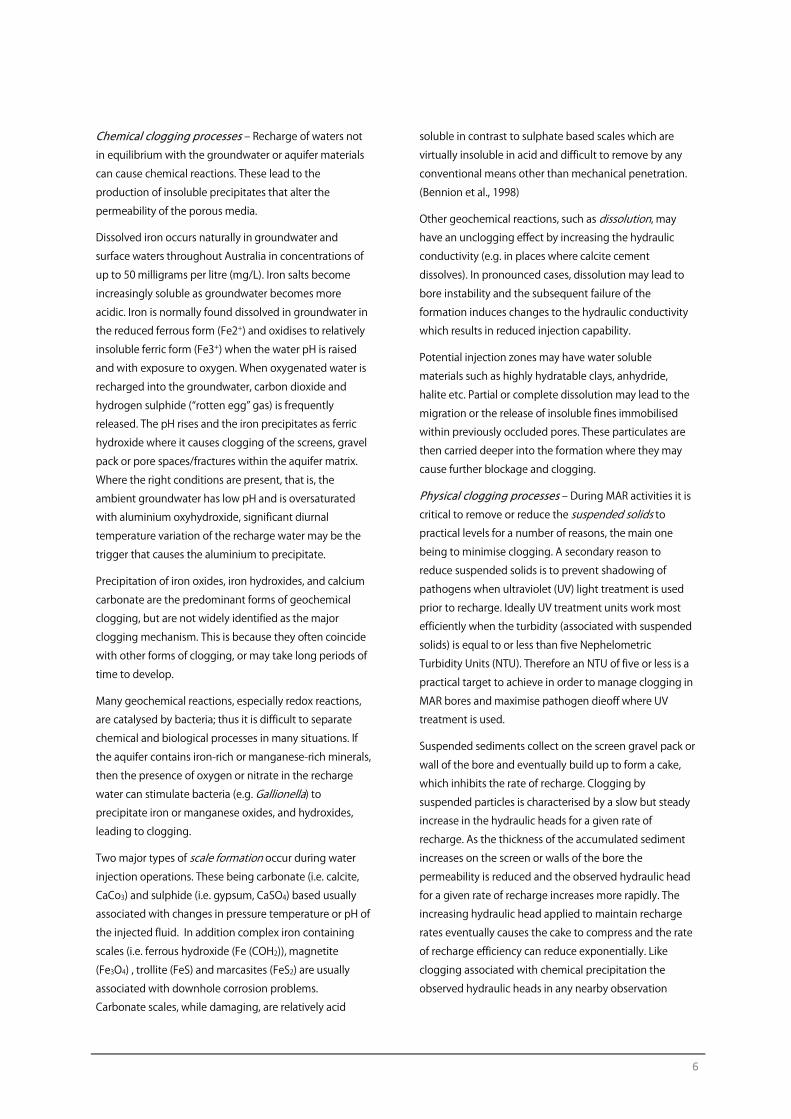
Table 1: Summary of clogging types and processes
Clogging Type Clogging Process
Chemical • Geochemical reactions that result in the precipitation of minerals e.g. iron
aluminium or calcium carbonate growth;
• Aquifer matrix dissolution (can also work to increase hydraulic conductivity);
• Ion exchange;
• Ion adsorption;
• Oxygen reduction.
• Formation of insoluble scales.
• Formation dissolution.
Physical clogging • Accumulation / Injection of organic and inorganic suspended solids.
• Velocity induced damage e.g. migration of interstitial fines such as illite or smectite.
• Clay swelling (e.g. montmorillonite).
• Clay deflocculation.
• Invasion of drilling fluids (emulsifiers) deep into the formation.
• Temperature.
Mechanical • Entrained air/gas binding (includes nitrogen &/or methane from microbiological
activity).
• Hydraulic loading causing formation failure, aquitard failure or failure of casing
around joints or seals.
Biological • Algae growth and accumulation of biological flocs.
• Microbiological production of polysaccharides.
• Bacterial entrainment and growth.
6
Chemical clogging processes ‒ Recharge of waters not
in equilibrium with the groundwater or aquifer materials
can cause chemical reactions. These lead to the
production of insoluble precipitates that alter the
permeability of the porous media.
Dissolved iron occurs naturally in groundwater and
surface waters throughout Australia in concentrations of
up to 50 milligrams per litre (mg/L). Iron salts become
increasingly soluble as groundwater becomes more
acidic. Iron is normally found dissolved in groundwater in
the reduced ferrous form (Fe2+) and oxidises to relatively
insoluble ferric form (Fe3+) when the water pH is raised
and with exposure to oxygen. When oxygenated water is
recharged into the groundwater, carbon dioxide and
hydrogen sulphide (“rotten egg” gas) is frequently
released. The pH rises and the iron precipitates as ferric
hydroxide where it causes clogging of the screens, gravel
pack or pore spaces/fractures within the aquifer matrix.
Where the right conditions are present, that is, the
ambient groundwater has low pH and is oversaturated
with aluminium oxyhydroxide, significant diurnal
temperature variation of the recharge water may be the
trigger that causes the aluminium to precipitate.
Precipitation of iron oxides, iron hydroxides, and calcium
carbonate are the predominant forms of geochemical
clogging, but are not widely identified as the major
clogging mechanism. This is because they often coincide
with other forms of clogging, or may take long periods of
time to develop.
Many geochemical reactions, especially redox reactions,
are catalysed by bacteria; thus it is difficult to separate
chemical and biological processes in many situations. If
the aquifer contains iron-rich or manganese-rich minerals,
then the presence of oxygen or nitrate in the recharge
water can stimulate bacteria (e.g. Gallionella) to precipitate iron or manganese oxides, and hydroxides,
leading to clogging.
Two major types of scale formation occur during water
injection operations. These being carbonate (i.e. calcite,
CaCo3) and sulphide (i.e. gypsum, CaSO4) based usually
associated with changes in pressure temperature or pH of
the injected fluid. In addition complex iron containing
scales (i.e. ferrous hydroxide (Fe (COH2)), magnetite
(Fe3O4) , trollite (FeS) and marcasites (FeS2) are usually
associated with downhole corrosion problems.
Carbonate scales, while damaging, are relatively acid
soluble in contrast to sulphate based scales which are
virtually insoluble in acid and difficult to remove by any
conventional means other than mechanical penetration.
(Bennion et al., 1998)
Other geochemical reactions, such as dissolution, may
have an unclogging effect by increasing the hydraulic
conductivity (e.g. in places where calcite cement
dissolves). In pronounced cases, dissolution may lead to
bore instability and the subsequent failure of the
formation induces changes to the hydraulic conductivity
which results in reduced injection capability.
Potential injection zones may have water soluble
materials such as highly hydratable clays, anhydride,
halite etc. Partial or complete dissolution may lead to the
migration or the release of insoluble fines immobilised
within previously occluded pores. These particulates are
then carried deeper into the formation where they may
cause further blockage and clogging.
Physical clogging processes ‒ During MAR activities it is
critical to remove or reduce the suspended solids to practical levels for a number of reasons, the main one
being to minimise clogging. A secondary reason to
reduce suspended solids is to prevent shadowing of
pathogens when ultraviolet (UV) light treatment is used
prior to recharge. Ideally UV treatment units work most
efficiently when the turbidity (associated with suspended
solids) is equal to or less than five Nephelometric
Turbidity Units (NTU). Therefore an NTU of five or less is a
practical target to achieve in order to manage clogging in
MAR bores and maximise pathogen dieoff where UV
treatment is used.
Suspended sediments collect on the screen gravel pack or
wall of the bore and eventually build up to form a cake,
which inhibits the rate of recharge. Clogging by
suspended particles is characterised by a slow but steady
increase in the hydraulic heads for a given rate of
recharge. As the thickness of the accumulated sediment
increases on the screen or walls of the bore the
permeability is reduced and the observed hydraulic head
for a given rate of recharge increases more rapidly. The
increasing hydraulic head applied to maintain recharge
rates eventually causes the cake to compress and the rate
of recharge efficiency can reduce exponentially. Like
clogging associated with chemical precipitation the
observed hydraulic heads in any nearby observation
7
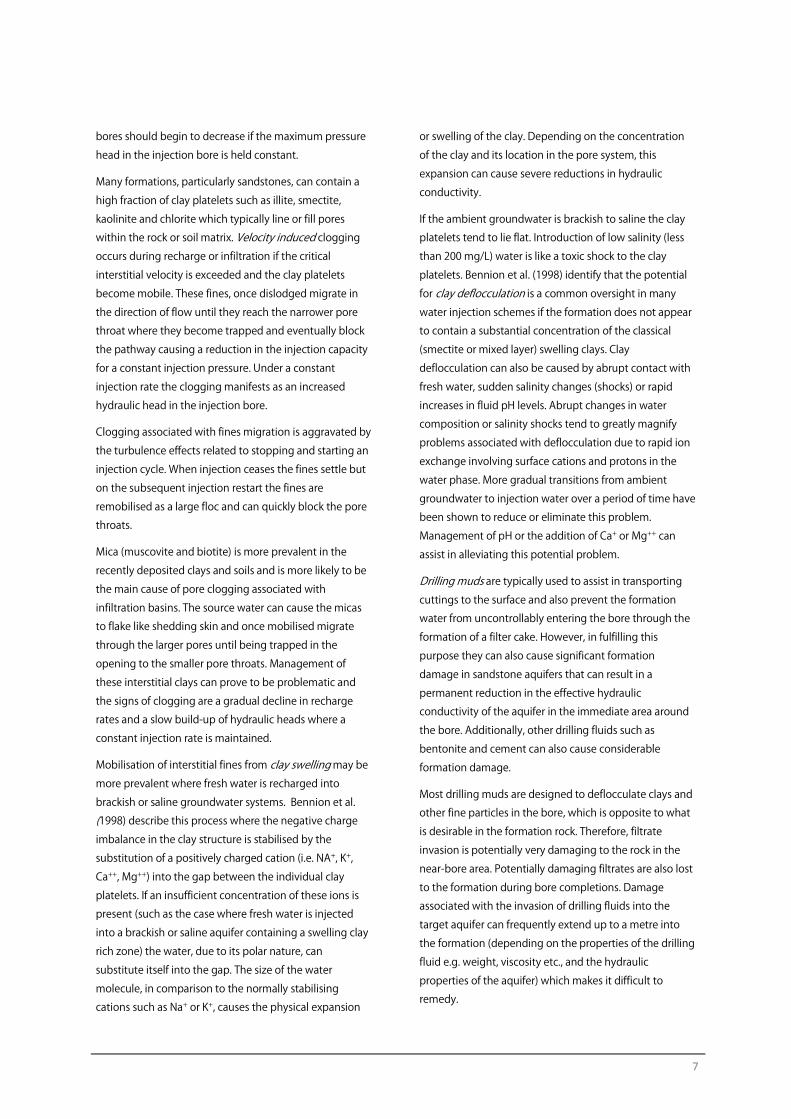
bores should begin to decrease if the maximum pressure
head in the injection bore is held constant.
Many formations, particularly sandstones, can contain a
high fraction of clay platelets such as illite, smectite,
kaolinite and chlorite which typically line or fill pores
within the rock or soil matrix. Velocity induced clogging occurs during recharge or infiltration if the critical
interstitial velocity is exceeded and the clay platelets
become mobile. These fines, once dislodged migrate in
the direction of flow until they reach the narrower pore
throat where they become trapped and eventually block
the pathway causing a reduction in the injection capacity
for a constant injection pressure. Under a constant
injection rate the clogging manifests as an increased
hydraulic head in the injection bore.
Clogging associated with fines migration is aggravated by
the turbulence effects related to stopping and starting an
injection cycle. When injection ceases the fines settle but
on the subsequent injection restart the fines are
remobilised as a large floc and can quickly block the pore
throats.
Mica (muscovite and biotite) is more prevalent in the
recently deposited clays and soils and is more likely to be
the main cause of pore clogging associated with
infiltration basins. The source water can cause the micas
to flake like shedding skin and once mobilised migrate
through the larger pores until being trapped in the
opening to the smaller pore throats. Management of
these interstitial clays can prove to be problematic and
the signs of clogging are a gradual decline in recharge
rates and a slow build-up of hydraulic heads where a
constant injection rate is maintained.
Mobilisation of interstitial fines from clay swelling may be
more prevalent where fresh water is recharged into
brackish or saline groundwater systems. Bennion et al. (1998) describe this process where the negative charge
imbalance in the clay structure is stabilised by the
substitution of a positively charged cation (i.e. NA+, K+,
Ca++, Mg++) into the gap between the individual clay
platelets. If an insufficient concentration of these ions is
present (such as the case where fresh water is injected
into a brackish or saline aquifer containing a swelling clay
rich zone) the water, due to its polar nature, can
substitute itself into the gap. The size of the water
molecule, in comparison to the normally stabilising
cations such as Na+ or K+, causes the physical expansion
or swelling of the clay. Depending on the concentration
of the clay and its location in the pore system, this
expansion can cause severe reductions in hydraulic
conductivity.
If the ambient groundwater is brackish to saline the clay
platelets tend to lie flat. Introduction of low salinity (less
than 200 mg/L) water is like a toxic shock to the clay
platelets. Bennion et al. (1998) identify that the potential for clay deflocculation is a common oversight in many
water injection schemes if the formation does not appear
to contain a substantial concentration of the classical
(smectite or mixed layer) swelling clays. Clay
deflocculation can also be caused by abrupt contact with
fresh water, sudden salinity changes (shocks) or rapid
increases in fluid pH levels. Abrupt changes in water
composition or salinity shocks tend to greatly magnify
problems associated with deflocculation due to rapid ion
exchange involving surface cations and protons in the
water phase. More gradual transitions from ambient
groundwater to injection water over a period of time have
been shown to reduce or eliminate this problem.
Management of pH or the addition of Ca+ or Mg++ can
assist in alleviating this potential problem.
Drilling muds are typically used to assist in transporting cuttings to the surface and also prevent the formation
water from uncontrollably entering the bore through the
formation of a filter cake. However, in fulfilling this
purpose they can also cause significant formation
damage in sandstone aquifers that can result in a
permanent reduction in the effective hydraulic
conductivity of the aquifer in the immediate area around
the bore. Additionally, other drilling fluids such as
bentonite and cement can also cause considerable
formation damage.
Most drilling muds are designed to deflocculate clays and
other fine particles in the bore, which is opposite to what
is desirable in the formation rock. Therefore, filtrate
invasion is potentially very damaging to the rock in the
near-bore area. Potentially damaging filtrates are also lost
to the formation during bore completions. Damage
associated with the invasion of drilling fluids into the
target aquifer can frequently extend up to a metre into
the formation (depending on the properties of the drilling
fluid e.g. weight, viscosity etc., and the hydraulic
properties of the aquifer) which makes it difficult to
remedy.

8
The drilling fluids contain bentonite and also clays and
sands from the upper geological layers that have been
penetrated to reach the target aquifer. The pore openings
are initially blocked by the larger particles and then ever
increasing smaller particles in the drilling fluids to form
the filter cake. However a certain percentage of drilling
fluids migrate into the aquifer. Additives are used to break
down the drilling fluids during redevelopment of the bore
but these may not be entirely effective especially where
the drilling fluids have been left in the bore for an
extended ( three or four days) period of time before final
completion. Inexperienced practitioners may not fully
appreciate the importance of redevelopment and in their
haste to complete the bore, fail to recognise that there is
still a significant volume of drilling mud within the
formation. Once the bore has been screened and gravel
packed then it is impossible to remove the drilling muds
and they act to impede the hydraulic conductivity in the
same manner as the mobilisation of interstitial fines.
Because infiltration rates vary inversely with water
viscosity, temperature also affects infiltration rates. In areas with large differences between winter and summer
temperatures, viscosity effects alone can cause winter
infiltration rates to be as low as about half of that in
summer. Thus if recharge systems need to be based on a
certain capacity, they should be designed on the basis of
winter conditions, when water is coldest and infiltration
rates lowest (Bouwer et al., 2008).
Exchange of cations between the recharge water and the
clays within the aquifer can lead to either swelling or
dispersion. This tends to be most prevalent where
reactive clays (e.g. montmorillonite) are present, and
where there is a large decrease in the salinity of the
recharge waters compared to the ambient groundwater.
Mechanical clogging processes ‒ Gas entrainment (or gas binding) is problematic in both recharge bores and
spreading basins. In spreading basins the air within the
vadose zone may become trapped reducing infiltration
and storage capacity. During recharge via a bore, air may
become entrained where water is allowed to cascade
freely into balancing storage tanks or into the recharge
bore. This may occur in some situations due to poorly
functioning surface equipment or leaks in surface suction
lines. If the downward velocity exceeds 0.3 m/sec
(1.0 feet/sec) then the entrained air can enter the
formation where it lodges in the pore spaces. This
increases the resistance to flow, resulting in higher water
levels (Pyne, 2005).
A secondary consideration is that cavitations generated in
pumps by air entrainment is also potentially damaging to
the injection equipment, increasing both corrosion
potential and potential injected solids content of the
water.
Clogging associated with gas entrainment is
characterised by a sudden rise in the water levels in the
recharge bore immediately upon startup of the injection
cycle.
If the shear strength of the rock matrix is not well
understood or is perhaps weakened through dissolution
hydraulic loading may induce failure of the matrix or
aquitard. Primary clogging by physical, chemical or
microbiological processes will result in increased aquifer
pressures where a constant injection rate is maintained.
As the clogging increases the injection pressure required
to maintain the constant injection rate also increase and
may exceed the shear strength of the aquifer matrix,
especially where dissolution may be occurring
simultaneously. Initial failure of the matrix may result in
increased injection performance but this is likely to be
shortlived as, unlike deliberate hydraulic fracturing, there
is no propping agent available to keep the induced
fractures open.
Permeability decline in hydraulically induced fractures
where no propping agent is used may result from creep
and pressure solution of minerals or migration of insitu
fines from previously occluded pores. Van Poollen (1990)
in his electrical-model study demonstrated the influence
on production of various degrees of damage surrounding
the bore and the fracture. His work identified that the
natural aquifer permeability could be reduced by as much
as one third in the immediate area surrounding the bore
and fracture.
Biological clogging processes ‒ Injection water,
irrespective of its source, usually contains bacterial agents.
Equally the ambient groundwater may host iron or
sulphate reducing bacteria together with a host of
numerous other microorganisms. Bacterial problems
associated with injection can occur with the growth of
both aerobic and anaerobic bacteria in surface
equipment, pumps, tubing, down hole equipment and
within the formation itself.
9
The degree of biological growth is directly related to the
amount of carbon and nutrients present. Although the
concentration of nutrients in the source water may be
low, the process of concentrating the suspended particles
due to filtration near the bore often provides the
substrate needed to foster biological growth. (Pyne,
2005).
Most commonly it is the biofilm produced by the
microorganisms that result in clogging problems. Bacteria
are sensitive to shear and tend to isolate themselves from
fluid shear by the formation of stable biofilms. The
physical adsorption of the growing biofilm on the surface
of the rock matrix can, over a period of time, result in
partial or total occlusion of the pore throats and a
resulting reduction in injectivity (Bennion et al.,1998).
Iron bacteria typically colonise areas of high velocity and
it is not uncommon to see large concretions hanging
from submersible pumps. Sulphate reducing bacteria
produce slimes and release gases (H2S or “rotten egg” gas)
that results in reduced permeability.
The signs of microbiological clogging are an initial slow
increase in the hydraulic head for a given recharge rate
followed by a sudden exponential increase in head
buildup. A corresponding decrease in the hydraulic heads
in adjacent observation bores should also be observed.
Conclusions Prevention is the best, and also the most cost effective,
cure to manage clogging and it starts with the basic
assumption that clogging will occur at some point during
the operational life of the MAR scheme. Clogging should
not be used as a justification as to why an MAR scheme
was unsuccessful in a particular hydrogeological setting
because there are various remediation and management
techniques available to support the sustainable operation
of these schemes.
Understanding the types of clogging that are likely to
occur in a particular hydrogeological setting for the
source water quality that is being recharged influences
the bore design and virtually all other aspects of the
scheme such as, pre-treatment and operational activities.
Controlling the source water quality such as removing
suspended solids, managing the pH or stripping any
dissolved oxygen are obvious measures to minimise the
potential for clogging. Managing the source water quality
addresses perhaps 50% of the potential causes of
clogging but does not minimise the potential for:
• Clogging associated with unintentional fracturing;
• Clogging caused by mobilisation of interstitial fines;
• Clogging caused by microbiological activity;
• Clogging resulting from thermal changes;
• Clogging associated with drilling methods and bore
completion.
When the recharge method is via a bore adequate
characterisation of the aquifer groundwater and aquifer
matrix is critical to the design of the injection bore. The
design should provide sufficient flexibility to be able to
employ a variety of remediation techniques once
clogging occurs. However, practitioners and operators
should be aware that, more often than not, multiple
causes of clogging may be occurring simultaneously, for
example, gas entrainment may induce precipitation of
iron which in turn stimulates an increase in iron bacteria.
What started out as a simple air entrainment problem has
the potential to develop into a significant clogging
problem driven by three different processes. Each
potential clogging cause may now potentially require
individual treatment.
Additionally, the remediation methods to address
clogging are very site specific and what works in one
hydrogeological setting may not always be successful in
another location. Indeed remediation approaches may
differ between injection bores across the same scheme.
Some of the symptoms of clogging are similar e.g.
chemical precipitation or buildup of suspended solids
produces a similar hydraulic response for a given injection
rate. Monitoring the aquifer hydraulic response during
recharge over time in the production and nearby
observation bores can assist in identifying the onset and
type of clogging.
References Bennion, D.B., Bennion, D.W., Thomas, F.B., and Bietz, R.F.,
(1998) Injection Water quality ‒ a key factor to successful waterflooding. Journal of Canadian Petroleum
Technology Vol 37. No. 26
Mazur, L., (2012) Water and Population: Limits to Growth?
http://www.newsecuritybeat.org/2012/02/water-and-
population-limits-to-growth/#.UPCkUqzAqPg Laurie

10
Mazur is a consultant on population and the environment for the Wilson Center’s Environmental Change and Security Program and director of the Population Justice Project.
Pyne, R.D.G., (2005) Aquifer storage and recovery: A guide to groundwater recharge through wells 2nd Edition. ISBN
0-9774337-090000
Van Poollen, H. K. Dr, (1990) Production vs. permeability damage in hydraulically produced fractures. Published in Formation Damage SPE Reprint series No 29 1990.
Waughray, D., (2011) ed. Water Security: the water-food-energy-climate nexus: the world Economic Forum water
initiative.
11
CONTENTS Introduction (R .Martin) 4
Contents 11
OVERVIEW OF CLOGGING PROCESSES DURING MANAGED AQUIFER RECHARGE 13
Clogging in Managed Aquifer Recharge: Flow, Geochemistry and Clay Colloids (D. Mays) 14
CLOGGING STUDIES LABORATORY COLUMN EXPERIMENTS 25
Reclaimed Water for Aquifer Storage and Recovery: A Column Study of Well Clogging (S. Rinck-Pfeiffer, P. Dillon, S. Ragusa, J. Hutson, H. Fallowfield, G. de Marsily and P. Pavelic) 26
Potential for Injection Well Clogging in an Anoxic Sandstone Aquifer Receiving Fresh,
Deoxygenated but Chlorinated Injectant (J Vandersalm, C. Smitt, K. Barry, P. Dillon, S.Davidge, D. Gornall, H.Seear, and D. Ife) 34
Porous Media Filter Test in Order to Prevent Well Clogging during Groundwater Reinjection due to
Ferrous and Ferric Mineral Precipitation (R. Ruemenapp, C. Hartwig, S. Akhatar and M. Nishigaki) 50
Laboratory Experiments in Porous Media in Order to Predict Particle Remobilization (C. Hartwig, M Nishigaki, T. Takuya and R Ruemenapp) 65
CLOGGING ASSOCIATED WITH INFILTRATION BASINS 76
Soil Clogging Phenomena in Vertical Flow (A Benamar) 77
Evaluation of Potential Gas Clogging Associated with Managed Aquifer Recharge from a Spreading
Basin, Southwestern Utah, USA (V. Heilweil and T Marston) 84
Clogging Phenomena Related to Surface Water Recharge Facilities (A. Hutchison, M. Milczarek and M. Banerjee) 95
Surface Spreading Recharge Facility Clogging ‒ The Orange County Water District Experience
(A.Hutchison, D. Phipps, G. Rodriquez, G. Woodside and M. Milczarek) 107
Practical Criteria in the Design and Maintenance of MAR Facilities in Order to Minimise Clogging
Impacts Obtained from Two Different Operative Sites in Spain (FERNÁNDEZ ESCALANTE, A. Enrique) 119
CLOGGING ASSOCIATED WITH WELL INJECTION 155
Application of Large Scale Managed Aquifer Recharge in Mine Water Management, Cloudbreak
Mine, Western Australia (B. Willis-Jones and I Brandes de Roos) 156
12
Clogging of Deep Well Infiltration Recharge Systems in the Netherlands (B Gonzalez) 163
Case Study: Recharge of Potable and Tertiary-treated Wastewater into a Deep, Confined Sandstone
Aquifer in Perth, Western Australia (K Johnston, M Martin and S Higginson) 174
Domestic Scale Rainwater ASR Observations of Clogging and Effectiveness of its Management (K. Barry, P Dillon and P Pavelic) 184
Characterisation of Clogging during Urban Stormwater Aquifer Storage and Recovery Operations in
a low Permeability Fractured Rock Aquifer (D. Page and P. Dillon) 193
Identification and Management of Clogging in a Fractured Rock Aquifer during ASR Operations
(R. Martin) 200
CLOGGING REHABILITATION AND REMEDIATION METHODS 206
Clogging Remediation Methods to Restore Well Injection Capacity (R. Martin) 207

13
OVERVIEW OF CLOGGING PROCESSES DURING MANAGED AQUIFER RECHARGE
14
Clogging in Managed Aquifer Recharge: Flow, Geochemistry and Clay Colloids D.C. Mays, P.E., Ph.D.
Abstract This chapter describes research from the allied fields of water treatment, soil science, and petrology, each of
which sheds light on the mechanisms by which flow and geochemistry influence clogging in managed aquifer
recharge. The primary focus is clogging by suspended solids, especially clay colloids, which are ubiquitous in
natural porous media. When colloids deposit in aquifers, they reduce the effective porosity and alter the pore
space geometry, both of which can inhibit the flow of groundwater. Management of clogging is complicated
by the complexity inherent in this system, in which flow, geochemistry, clay mineralogy, and colloidal effects
each play a role. To address this complexity, this chapter will briefly review colloid filtration, mobilization, and
clogging models, then proceed to highlight the key physical and chemical variables that control clogging. It
will be argued that clogging in managed aquifer recharge is analogous to clogging in soils or hydrocarbon
reservoirs, rather than to granular media filters in water treatment. Based on this analogy, the chapter will
conclude with several provisional recommendations to prevent or manage clogging in managed aquifer
recharge.
1 Introduction Managed aquifer recharge (MAR) is the engineered
process by which water is delivered into an aquifer for
storage, transmission, or treatment̶the latter because
aquifers remove suspended solids, neutralize acids, and
provide beneficial ion exchange. In contrast to surface
reservoirs, MAR essentially prevents evaporation losses,
which consume nearly as much water worldwide as all
municipal use combined (Levine and Asano, 2004). As
such, MAR is the crucial first step in the increasingly
popular water resources technology known as aquifer
storage and recovery (ASR).
Despite its apparent simplicity, MAR requires planning,
design, construction, operation, and maintenance
commensurate with other civil infrastructure. In contrast
to other water systems, however, the reservoirs and
conduits in MAR are not engineered structures, but rather
geologic formations. As such, the full spectrum of natural
processes associated with groundwater flow in aquifers is
relevant in MAR, so the related disciplines of geology, soil
science, and colloid science must be brought to bear for
successful project implementation (U.S. National Research
Council 2008, page 234). Recognizing that the reservoirs
and conduits in MAR are geologic formations also
provides a framework in which to understand perhaps the
most significant technical challenge in MAR, namely
clogging.
Clogging, the detrimental reduction of permeability in
porous media is a major technical challenge in MAR. By
way of illustration, the U.S. National Research Council’s
(2008) report entitled Prospects for Managed Underground Storage of Recoverable Water mentions
clogging 101 times. In the context of MAR, clogging
results from (1) deposition of suspended solids, (2)
rearrangement of deposits, (3) geochemical reactions, (4)
biofilm growth, and (5) air binding (American Society of
Civil Engineers, 2001; §10.7.2; Pyne, 1995; §4.2). Because
clogging by one or more of these mechanisms is
expected during recharge through wells, it is routinely
managed by periodically backwashing wells and
disposing the wash water, by adding a chlorine residual to
injection water (Pyne, 1995; §4.2), or by removing
essentially all suspended solids and organics from the
15
injection water (American Society of Civil Engineers, 2001;
§10.7.2)̶where adding chlorine and removing organics
help to prevent biofilm growth. The focus in this chapter
is clogging by suspended solids, especially clay colloids,
corresponding to mechanisms 1‒3 above. Clogging by
these mechanisms does not require a high concentration
of total suspended solids (TSS): Concentrations as low as
2 mg/L have been shown to be sufficient for clogging
(Pyne, 1995; §5.4). Even without considering biofilm
growth or air binding, clogging by clay colloids comprises
a host of interrelated physical and chemical phenomena
that render a complex linked system (American Society of
Civil Engineers, 2001; Pyne, 1995; U.S. National Research
Council, 2008).
To place these clogging mechanisms in context, this
chapter begins with a brief overview of filtration theory,
highlighting deposition and mobilization of colloids and
models for the resulting clogging. Having established the
relevant context, the chapter then proceeds to an
overview of clogging phenomena, first from the literature
on water treatment engineering, and then from the
literature on soil science and petrology. These two groups
of literature will present something of a paradox, where
the same physical or chemical perturbation either
alleviates or exacerbates clogging, depending on the
context. To resolve this paradox, the chapter discusses
two lines of ongoing research based on the general
concept of deposit morphology. The chapter concludes
with a brief explanation why clogging in MAR is
analogous to soil science and petrology, and in that
context, provides several provisional guidelines for
avoiding or managing clogging in MAR.
2 Deposition, Mobilization, and Clogging Colloidal phenomena are important for flow and
transport in natural porous media̶soils, aquifers, and
fractured rocks. By convention, colloids are defined as
solid particles in the size range of 1 nm to 10 μm,
including clays, weathering and precipitation products,
microbial pathogens, and nanoparticles̶the latter of
which are generally defined as solid particles with at least
one dimension less than or equal to 100 nm. The coupling
between deposition, mobilization, and permeability was
emphasized in the historical filtration literature, for which
the primary motivation was granular media filters for
water treatment, and which was reviewed by McDowell-
Boyer et al. (1986). Later reviews focus on deposition
under clean bed conditions, before significant deposits
have accumulated, with more emphasis on microbial
pathogens and engineered nanoparticles, and less
emphasis on clogging beyond clean bed conditions
(Kretzschmar et al., 1999; Ryan and Elimelech, 1996;
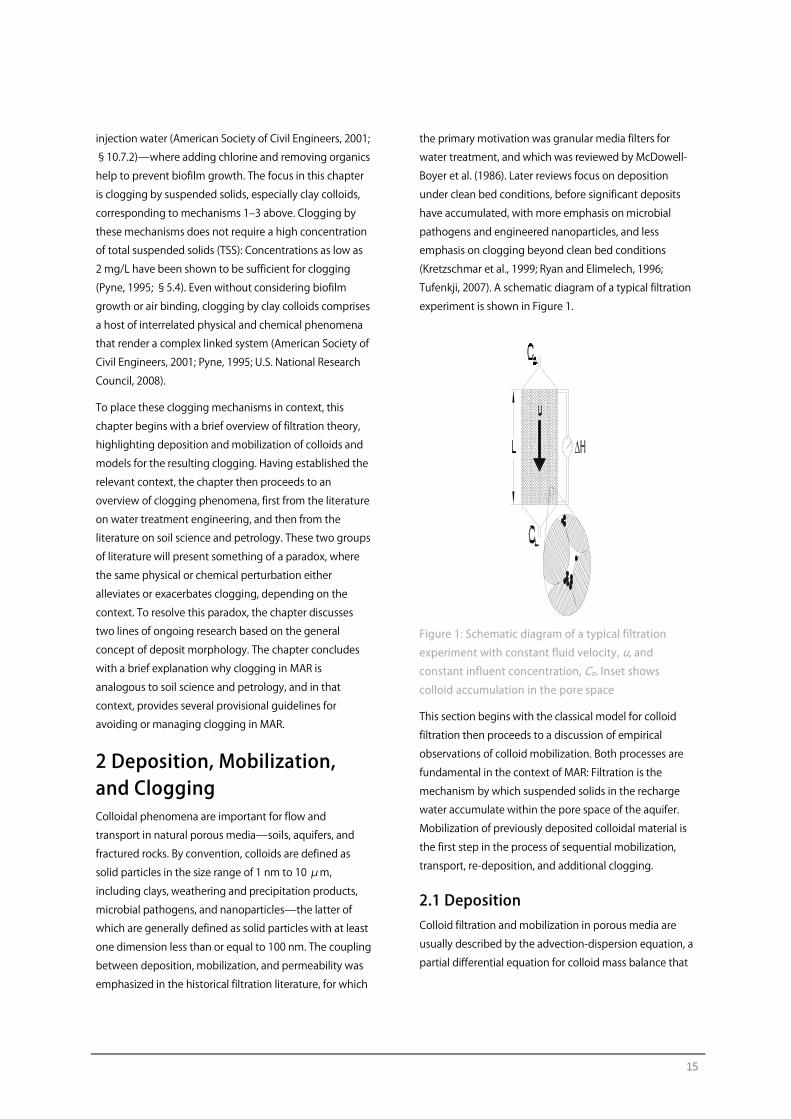
Tufenkji, 2007). A schematic diagram of a typical filtration
experiment is shown in Figure 1.
Figure 1: Schematic diagram of a typical filtration
experiment with constant fluid velocity, u, and constant influent concentration, Co. Inset shows
colloid accumulation in the pore space
This section begins with the classical model for colloid
filtration then proceeds to a discussion of empirical
observations of colloid mobilization. Both processes are
fundamental in the context of MAR: Filtration is the
mechanism by which suspended solids in the recharge
water accumulate within the pore space of the aquifer.
Mobilization of previously deposited colloidal material is
the first step in the process of sequential mobilization,
transport, re-deposition, and additional clogging.
2.1 Deposition Colloid filtration and mobilization in porous media are
usually described by the advection-dispersion equation, a
partial differential equation for colloid mass balance that
16
includes the effects of advection, dispersion (including
molecular diffusion), deposition, and mobilization:
σρϕ smd knCkx
Cu
x
CD
t
C +−∂∂−
∂∂=
∂∂
2
2
(1)
where x is position, t is time, φ is porosity, C is colloid concentration, D is a dispersion coefficient (here assumed
to be homogeneous), u = q/φ is the average pore water
velocity, kd is a first-order deposition rate constant, km is a
first-order mobilization rate constant, ρs is solid density,
and σ is the specific deposit, defined as the volume of
deposited colloids divided by the total volume of porous
media. Volumetric flux q is given by Darcy’s law:
Δ−=L
Hgkq
μρ
(2)
where k is permeability, ρ is fluid density, g is gravitational acceleration, μ is dynamic viscosity, ΔH is
head loss, and L is flow distance.
The deposition rate constant kd can be predicted
theoretically from the DLVO model of Derjaguin, Landau,
Verwey, and Overbeek (Yao et al., 1971), although
empirical correlations are more accurate (Ma et al., 2009;
Nelson and Ginn, 2011; Rajagopalan and Tien, 1976;
Tufenkji and Elimelech, 2004). Equation (1) has also been
modified to account for straining, in which colloids are
retained by size exclusion rather than by physicochemical
effects (Bradford et al. , 2002), although this approach has
recently been called into question (Johnson et al., 2011).
The mobilization rate constant km is typically fitted
empirically, owing to the well-known limitations of
filtration theory (e.g., Ryan and Elimelech, 1996). No
widely accepted model is currently available to predict
the mobilization rate constant km.
2.2 Mobilization In principle, one might expect colloid mobilization to
counteract the deposition described above. But in
practice, colloid mobilization can contribute to additional
clogging when previously deposited colloids are
moved̶sometimes en masse̶to different locations
within the pore space where they cause more clogging
than before. For this reason, clogging has been attributed
to colloid mobilization triggered by physical (Pavelic et al.,
2011) or chemical (Zhou et al., 2009) perturbations.
Although no predictive model is currently available for
colloid mobilization, it has long been recognized that
physical and chemical perturbations can mobilize
deposited colloids. A recent review of the filtration
literature indicates that mobilization results from various
changes in the fluid velocity, including velocity increases
and on-off cycles (Manga et al., 2012, §4.1.1). To
generalize these observations, it is helpful to interpret
conditions in terms of the hydrodynamic shear stress, τ,
applied to the colloid deposits (Ives, 1970; Mays and Hunt,
2007):
21
=L
Hgq
ϕΔμρτ (3)
Equation (3) can also be expressed using a characteristic
pore length scale δ. This can be shown by solving Darcy’s
law (2) for the magnitude of head loss:
gk
LqH
ρμ=Δ (4)
Substituting (4) into (3) gives
k
q
k
q
L
gk
Lqgq
ϕμ
ϕμ
ϕρ
μμρτ =
=
=2122
21
(5)
Equation (5) can also be expressed using fluid velocity
u = q/φ, such that q = φu:
δμ
ϕμ
ϕμϕτ u
k
u
k
u === (6)
which is equation (3) in Manga et al. , (2012), with
characteristic pore length scale ϕδ k= . Using this
framework, several investigators have reported results for
clay deposits in terms of shear strength, that is, the shear
above which mobilization is expected. As summarized by
Manga et al. (2012, §4.1.1), kaolinite deposited in porous
media has a shear strength of τ = 2.7–4 dyn/cm2 (Ives
and Fitzpatrick, 1989); sodium-montmorillonite in a
model fracture has a shear strength of τ = 1‒8 dyn/cm2
17
(Kessler, 1993); and sodium- and calcium-montmorillonite
has a shear strength below τ = 7‒14 dyn/cm2 (Mays and
Hunt 2007). In any particular situation, the critical
hydrodynamic shear would presumably depend on the
details of the porous media, the colloids, the deposits, and
the nature of the hydrodynamic loading. But as a general
statement, laboratory experiments demonstrate that clay
deposits have shear strengths in the range of 1‒
10 dyn/cm2.
Chemical changes provide a second mechanism for
deposit mobilization. Perhaps the most common example
is clogging following pore fluid displacement by an
invading fluid of lower ionic strength. In soil science, this
scenario unfolds when low ionic strength water is used for
irrigation (e.g. Quirk, 1994). In petrology, this scenario
unfolds when fresh water is used to displace
hydrocarbons in saline reservoirs, triggering formation
damage (e.g. Tiab and Donaldson, 1996). In general,
colloid mobilization occurs when the ionic strength, I, drops below the critical coagulation concentration (CCC),
which depends on the colloid, the pH, and the sodium
adsorption ratio (SAR). Thus, when I/CCC > 1, colloid
flocculation is expected, corresponding to enhanced
filtration and good soil structure with high permeability.
Conversely, when I/CCC < 1, colloid dispersion is
expected, corresponding to colloid mobilization and poor
soil structure with low permeability, that is, clogging.
To help conceptualize the related effects of ionic strength,
pH, and SAR on colloid deposition and mobilization, one
can plot the CCC of the primary clay minerals as a function
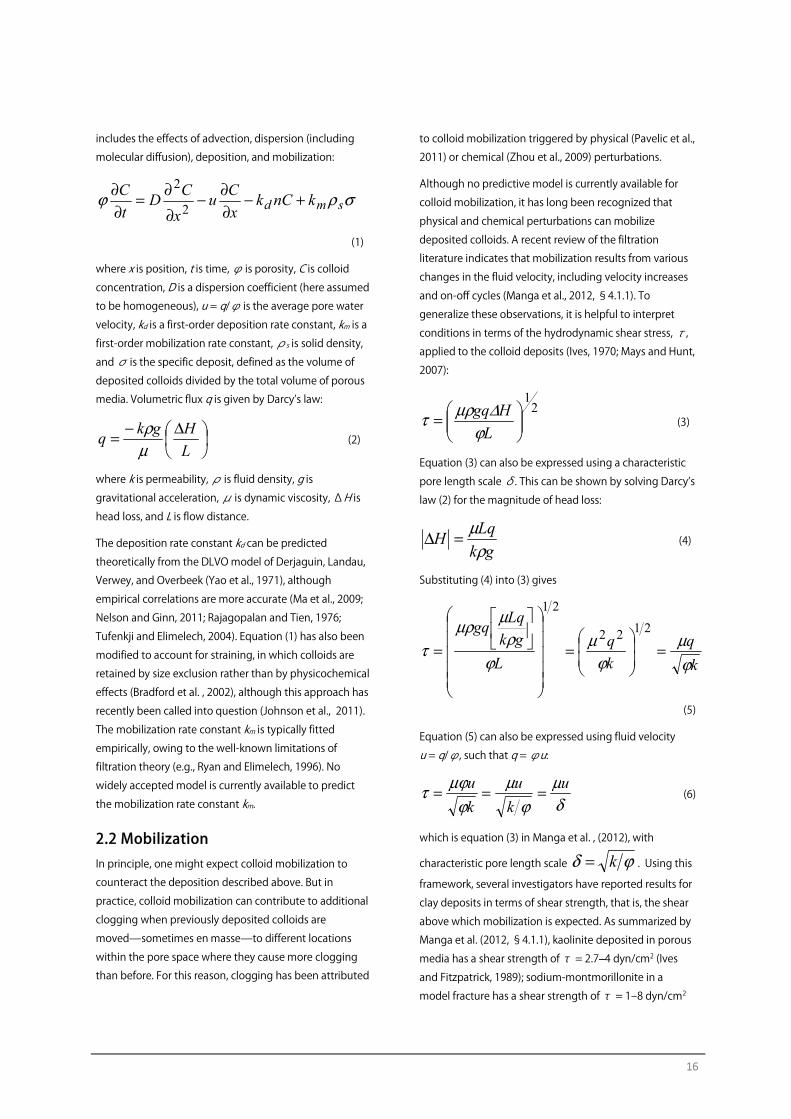
of SAR (Figure 2). Such a plot is called a Quirk-Schofield
diagram (Mays, 2007; Quirk and Schofield, 1955; Sposito,
1989, Chapter 12). When (SAR, I) plots above the relevant CCC curve, colloid flocculation is expected, associated
with high permeability. When (SAR, I) plots below the
relevant CCC curve, colloid dispersion is expected,
associated with colloid mobilization and clogging. Quirk-
Schofield diagrams can also be extended to capture the
effect of pH by plotting a family of CCC curves on the
same (SAR, I) axes, with each curve corresponding to a
given pH. In temperate environments where the pH
exceeds the point of zero charge for the relevant clays,
increasing pH tends to make the clay surface charge more
negative, such that a larger ionic strength is required to
overcome electrostatic repulsion, which corresponds to
larger CCC. Under these conditions, therefore, the
topmost CCC versus SAR curve corresponds to the largest
value of pH (Mays, 2007).
Figure 2: For a given colloid, the Quirk-Schofield
diagram plots the critical coagulation concentration
(CCC) versus sodium adsorption ratio (SAR). The effect
of pH is captured by plotting a family of curves, one for
each pH. When (SAR, I) plots above the relevant curve,
then chemical conditions favor flocculation, which is
associated with good soil structure. Conversely, when
(SAR, I) plots below the relevant curve, then chemical
conditions favor dispersion, which is associated with
poor soil structure. Reproduced from Manga et al.
(2012) with permission from the American Geophysical
Union
2.3 Clogging Although colloidal phenomena have a major effect on
aquifer permeability, no model is currently available to
predict permeability (Babadagli and Al-Salmi, 2004). In
principle, complete knowledge of deposition and
mobilization would allow one to exactly compute the
specific deposit and therefore, by subtraction, the
reduced porosity. But even in such an idealized scenario,
knowing the reduced porosity would not allow one to
predict the permeability. Why? Because clogging depends
not only on the specific deposit by also̶crucially̶on
deposit morphology (Mays, 2010; Wiesner, 1999). To shed
light on the role of deposit morphology, this section
provides a brief review of two contemporary clogging
models that explicitly account for specific deposit and
deposit morphology, with each model using a single
empirical parameter.
18
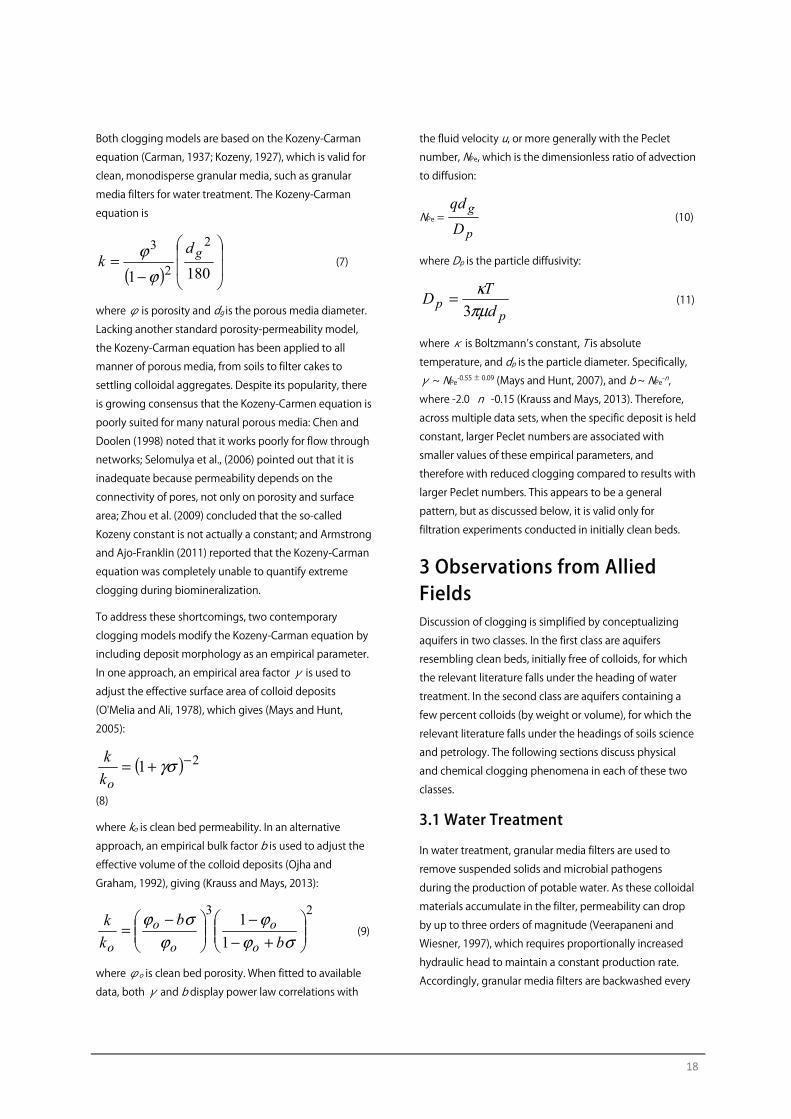
Both clogging models are based on the Kozeny-Carman
equation (Carman, 1937; Kozeny, 1927), which is valid for
clean, monodisperse granular media, such as granular
media filters for water treatment. The Kozeny-Carman
equation is
( )
−=
1801
2
2
3gd
kϕ
ϕ (7)
where φ is porosity and dg is the porous media diameter.
Lacking another standard porosity-permeability model,
the Kozeny-Carman equation has been applied to all
manner of porous media, from soils to filter cakes to
settling colloidal aggregates. Despite its popularity, there
is growing consensus that the Kozeny-Carmen equation is
poorly suited for many natural porous media: Chen and
Doolen (1998) noted that it works poorly for flow through
networks; Selomulya et al., (2006) pointed out that it is
inadequate because permeability depends on the
connectivity of pores, not only on porosity and surface
area; Zhou et al. (2009) concluded that the so-called
Kozeny constant is not actually a constant; and Armstrong
and Ajo-Franklin (2011) reported that the Kozeny-Carman
equation was completely unable to quantify extreme
clogging during biomineralization.
To address these shortcomings, two contemporary
clogging models modify the Kozeny-Carman equation by
including deposit morphology as an empirical parameter.
In one approach, an empirical area factor γ is used to
adjust the effective surface area of colloid deposits
(O'Melia and Ali, 1978), which gives (Mays and Hunt,
2005):
( ) 21 −+= γσok
k
(8)
where ko is clean bed permeability. In an alternative
approach, an empirical bulk factor b is used to adjust the effective volume of the colloid deposits (Ojha and
Graham, 1992), giving (Krauss and Mays, 2013):
23
11
+−
−
−=
σϕϕ
ϕσϕ
b
b
k
k
o
o
o
o
o (9)
where φo is clean bed porosity. When fitted to available
data, both γ and b display power law correlations with
the fluid velocity u, or more generally with the Peclet
number, NPe, which is the dimensionless ratio of advection
to diffusion:
NPe = p
g
D
qd (10)
where Dp is the particle diffusivity:
pp d
TD
πμκ
3= (11)
where κ is Boltzmann’s constant, T is absolute temperature, and dp is the particle diameter. Specifically,
γ ~ NPe-0.55 ± 0.09 (Mays and Hunt, 2007), and b ~ NPe
-n,
where -2.0 n -0.15 (Krauss and Mays, 2013). Therefore,
across multiple data sets, when the specific deposit is held
constant, larger Peclet numbers are associated with
smaller values of these empirical parameters, and
therefore with reduced clogging compared to results with
larger Peclet numbers. This appears to be a general
pattern, but as discussed below, it is valid only for
filtration experiments conducted in initially clean beds.
3 Observations from Allied Fields Discussion of clogging is simplified by conceptualizing
aquifers in two classes. In the first class are aquifers
resembling clean beds, initially free of colloids, for which
the relevant literature falls under the heading of water
treatment. In the second class are aquifers containing a
few percent colloids (by weight or volume), for which the
relevant literature falls under the headings of soils science
and petrology. The following sections discuss physical
and chemical clogging phenomena in each of these two
classes.
3.1 Water Treatment
In water treatment, granular media filters are used to
remove suspended solids and microbial pathogens
during the production of potable water. As these colloidal
materials accumulate in the filter, permeability can drop
by up to three orders of magnitude (Veerapaneni and
Wiesner, 1997), which requires proportionally increased
hydraulic head to maintain a constant production rate.
Accordingly, granular media filters are backwashed every
19
0 1 2 3 40
0.2
0.4
0.6
0.8
1
u = 6.9 m/d
u = 14 m/d
u = 27 m/d
pore volumes
k/k o
PHYSICAL EFFECTS
GR
AN
ULA
R M
ED
IA F
ILT
ER
S
(a)
0 2 4 6 8 10 120
0.2
0.4
0.6
0.8
1
I = 0 mM
I = 1 mM
I = 10 mM
pore volumes
k/k o
CHEMICAL EFFECTS
(b)
1 2 3 4 50
0.2
0.4
0.6
0.8
1
u =
1.6
m/d
u =
3.2
m/d
u =
7.9
m/d
u =
16
m/d
pore volumes
k/k o
SO
ILS
(c)
0 0.5 1 1.50
0.2
0.4
0.6
0.8
1
I = 2
70 m
M
I = 0
mM
pore volumes
k/k o
(d)
1‒4 days (MWH 2005, §11‒2), which entails pumping
treated water upward through the filter at a rate sufficient
to cause complete fluidization (i.e. liquefaction).
Backwashing is usually augmented by simultaneous air
injection, which assists with removal of deposited
colloids, presumably because colloids sorb to air-water
interfaces (Wan and Wilson 1994). Backwashed fluid,
representing 1‒5% of the treatment plant’s production, is
typically recycled to the plant intake (American Water
Works Association, 1990, page 988). After backwashing,
the granular media filter begins its next service cycle,
starting as an essentially clean bed.
Review of data from water treatment plants and from
laboratory columns reveals consistent relationships
between clogging and physical and chemical variables.
With regard to physical variables, as discussed in §2.3, for
a given specific deposit, clogging is more severe at lower
fluid velocity, and less severe at higher fluid velocity
(Krauss and Mays, 2013; Mays and Hunt, 2005). Equivalent
results have also been observed in filtration experiments
compared on the basis of equal pore volumes eluted,
rather than on the basis of equal specific deposit. For
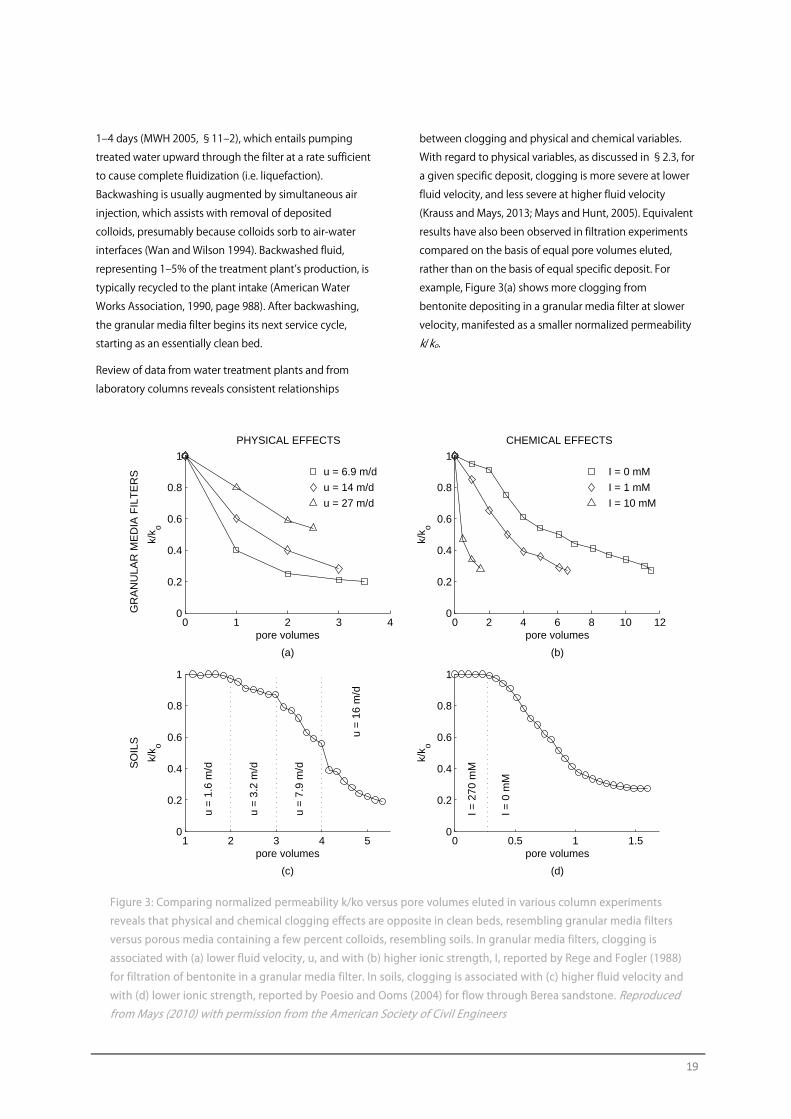
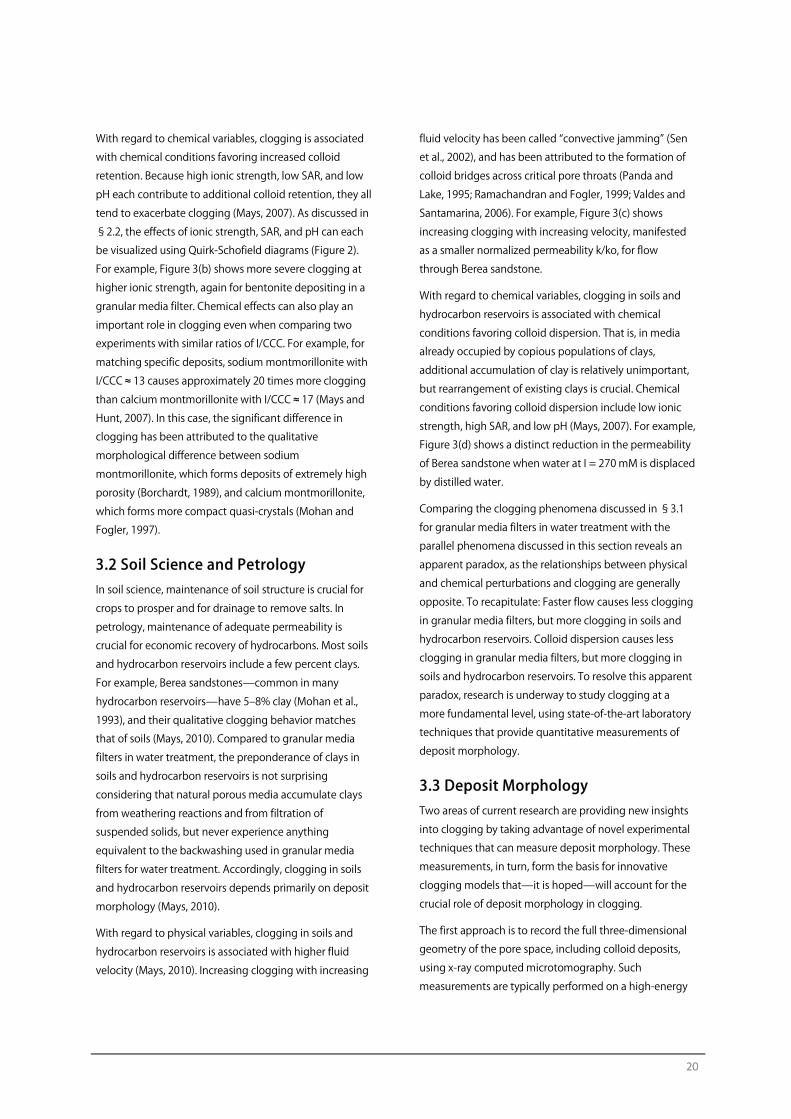
example, Figure 3(a) shows more clogging from
bentonite depositing in a granular media filter at slower
velocity, manifested as a smaller normalized permeability
k/ko.
Figure 3: Comparing normalized permeability k/ko versus pore volumes eluted in various column experiments
reveals that physical and chemical clogging effects are opposite in clean beds, resembling granular media filters
versus porous media containing a few percent colloids, resembling soils. In granular media filters, clogging is
associated with (a) lower fluid velocity, u, and with (b) higher ionic strength, I, reported by Rege and Fogler (1988)
for filtration of bentonite in a granular media filter. In soils, clogging is associated with (c) higher fluid velocity and
with (d) lower ionic strength, reported by Poesio and Ooms (2004) for flow through Berea sandstone. Reproduced from Mays (2010) with permission from the American Society of Civil Engineers
20
With regard to chemical variables, clogging is associated
with chemical conditions favoring increased colloid
retention. Because high ionic strength, low SAR, and low
pH each contribute to additional colloid retention, they all
tend to exacerbate clogging (Mays, 2007). As discussed in
§2.2, the effects of ionic strength, SAR, and pH can each
be visualized using Quirk-Schofield diagrams (Figure 2).
For example, Figure 3(b) shows more severe clogging at
higher ionic strength, again for bentonite depositing in a
granular media filter. Chemical effects can also play an
important role in clogging even when comparing two
experiments with similar ratios of I/CCC. For example, for
matching specific deposits, sodium montmorillonite with
I/CCC ≈ 13 causes approximately 20 times more clogging
than calcium montmorillonite with I/CCC ≈ 17 (Mays and
Hunt, 2007). In this case, the significant difference in
clogging has been attributed to the qualitative
morphological difference between sodium
montmorillonite, which forms deposits of extremely high
porosity (Borchardt, 1989), and calcium montmorillonite,
which forms more compact quasi-crystals (Mohan and
Fogler, 1997).
3.2 Soil Science and Petrology In soil science, maintenance of soil structure is crucial for
crops to prosper and for drainage to remove salts. In
petrology, maintenance of adequate permeability is
crucial for economic recovery of hydrocarbons. Most soils
and hydrocarbon reservoirs include a few percent clays.
For example, Berea sandstones̶common in many
hydrocarbon reservoirs̶have 5‒8% clay (Mohan et al.,
1993), and their qualitative clogging behavior matches
that of soils (Mays, 2010). Compared to granular media
filters in water treatment, the preponderance of clays in
soils and hydrocarbon reservoirs is not surprising
considering that natural porous media accumulate clays
from weathering reactions and from filtration of
suspended solids, but never experience anything
equivalent to the backwashing used in granular media
filters for water treatment. Accordingly, clogging in soils
and hydrocarbon reservoirs depends primarily on deposit
morphology (Mays, 2010).
With regard to physical variables, clogging in soils and
hydrocarbon reservoirs is associated with higher fluid
velocity (Mays, 2010). Increasing clogging with increasing
fluid velocity has been called “convective jamming” (Sen
et al., 2002), and has been attributed to the formation of
colloid bridges across critical pore throats (Panda and
Lake, 1995; Ramachandran and Fogler, 1999; Valdes and
Santamarina, 2006). For example, Figure 3(c) shows
increasing clogging with increasing velocity, manifested
as a smaller normalized permeability k/ko, for flow
through Berea sandstone.
With regard to chemical variables, clogging in soils and
hydrocarbon reservoirs is associated with chemical
conditions favoring colloid dispersion. That is, in media
already occupied by copious populations of clays,
additional accumulation of clay is relatively unimportant,
but rearrangement of existing clays is crucial. Chemical
conditions favoring colloid dispersion include low ionic
strength, high SAR, and low pH (Mays, 2007). For example,
Figure 3(d) shows a distinct reduction in the permeability
of Berea sandstone when water at I = 270 mM is displaced
by distilled water.
Comparing the clogging phenomena discussed in §3.1
for granular media filters in water treatment with the
parallel phenomena discussed in this section reveals an
apparent paradox, as the relationships between physical
and chemical perturbations and clogging are generally
opposite. To recapitulate: Faster flow causes less clogging
in granular media filters, but more clogging in soils and
hydrocarbon reservoirs. Colloid dispersion causes less
clogging in granular media filters, but more clogging in
soils and hydrocarbon reservoirs. To resolve this apparent
paradox, research is underway to study clogging at a
more fundamental level, using state-of-the-art laboratory
techniques that provide quantitative measurements of
deposit morphology.
3.3 Deposit Morphology Two areas of current research are providing new insights
into clogging by taking advantage of novel experimental
techniques that can measure deposit morphology. These
measurements, in turn, form the basis for innovative
clogging models that̶it is hoped̶will account for the
crucial role of deposit morphology in clogging.
The first approach is to record the full three-dimensional
geometry of the pore space, including colloid deposits,
using x-ray computed microtomography. Such
measurements are typically performed on a high-energy
21
photon beamline, for example at Argonne National
Laboratory (Gaillard et al., 2007) or Lawrence Berkeley
National Laboratory (Armstrong and Ajo-Franklin, 2011).
Flow through the 3D pore structure model is then
simulated using techniques from computational fluid
mechanics, most commonly lattice Boltzmann
simulations (Armstrong and Ajo-Franklin, 2011; Gaillard et
al., 2007). The flow simulation is then used to calculate a
macroscopic permeability for the porous media. This
approach has the advantage of capturing the full
geometry of the pore space, but has limited ability to
probe colloid deposits at resolutions less than several
micrometers.
The second approach conceptualizes colloid deposits as
fractals, based on the observation that colloid aggregates
have fractal geometry (Elimelech et al., 1995), and on
simulations of fractal colloid deposits (Veerapaneni and
Wiesner, 1994). Fractals have non-integer fractal
dimensions, Df, where the fractal dimension (formally
defined here as a mass fractal dimension) is:
fDm λ~ (12)
where m is mass and λ is a characteristic length scale.
The fractal dimension of colloid aggregates or deposits is
measured optically, using a technique called static light
scattering. This technique, originally developed to
characterize suspensions of colloid aggregates, can be
extended to characterize colloid deposits inside porous
media either by re-suspending deposits into a traditional
suspension (Veerapaneni and Wiesner, 1997), or within
the pore space itself using refractive index matched (RIM)
porous media (Mays et al., 2011). The RIM study recorded
a fractal dimension of Df = 2.2 for deposits formed with a
hydrodynamic shear stress of τ ≈ 17 dyn/cm2. This fractal
dimension indicates that the deposits were more densely
packed than equivalent suspended aggregates, whose
fractal dimension of Df = 1.8 resulted from hydrodynamic
shear stress of τ ≈ 0.3 dyn/cm2. The RIM study is currently
being extended to simultaneously record clogging,
specific deposit, and deposit fractal dimension in a flow
column, with the goal of linking clogging to this
quantitative measurement of deposit morphology.
4 Discussion and Conclusions The literature reveals contradictory clogging behavior in
the first class of porous media, resembling granular media
filters in water treatment, and the second class of porous
media, resembling soils or hydrocarbon reservoirs. Which
set of phenomena is more likely relevant to MAR? The
second class. Available data indicate that clogging in MAR
is analogous to clogging in soils or hydrocarbon
reservoirs, rather than granular media filters, at least when
the primary clogging mechanism is filtration and
mobilization of suspended solids, especially clay colloids.
This analogy to soils and hydrocarbon reservoirs appears
to be valid for both physical and chemical effects: With
regard to physical effects, aquifer recharge using wells is
“more vulnerable to clogging” than aquifer recharge
using infiltration basins because the fluid velocity is
generally higher with injection through wells (American
Society of Civil Engineers 2001, §10.7.2). Similarly, Pavelic
et al. (2011) reported that recharge rates through
infiltration basins were larger with 30 cm of ponding
depth than with 10 cm, due to the increased head
gradient, but that further increase of the ponding depth
to 50 cm did not increase the recharge rate because
clogging worsened. With regard to chemical effects,
clogging in MAR results from water with low ionic
strength (Pyne, 1995; §5.4) and high SAR (American
Society of Civil Engineers, 2001; §10.7.2.2), both of which
are associated with colloid dispersion (Figure 2). These
results have been corroborated in the laboratory, where a
column of sediments clogged after injecting low-ionic
strength fluid (Zhou et al., 2009), analogous to the results
in Figure 3(d).
In conclusion, the literature on water treatment, soil
science, and petrology highlights several physical and
chemical mechanisms that provide insight into clogging
in MAR. These mechanisms may be summarized as
follows:
• Available studies on hydrodynamic shear suggest a
critical shear stress for colloid mobilization in the
range of 1‒10 dyn/cm2. Colloid mobilization is
associated with clogging in soils and hydrocarbon
reservoirs.
• Colloids flocculate when I/CCC > 1 and disperse
when I/CCC < 1. The transition from flocculated to
22
dispersed colloids triggers a qualitative change in
permeability, in many cases from unclogged to
clogged.
• Aquifers used for MAR are likely to manifest
clogging phenomena analogous to soils or
hydrocarbon reservoirs, rather than granular media
filters in water treatment. Accordingly, during
regular injection and extraction operations, the
available data suggest the following provisional
guidelines to prevent or manage clogging in MAR:
• Injection fluid should have TSS as low as readily
achievable.
• Fluid velocity should be kept as low as possible,
except during backwashing.
• Chemical conditions should favor colloid
aggregation, where I ≥ Io, SAR ≤ SARo, and pH
≤ pHo, where Io, SARo, and pHo refer to pre-MAR
geochemical conditions in the target aquifer.
The results analyzed here pertain only to clogging
resulting from filtration and mobilization of clays and
other suspended colloids. These results should not be
extrapolated to systems in which mineral precipitation or
biofilm growth are the primary clogging mechanisms.
Acknowledgments and Disclaimer Michael Manga graciously provided the graphic in
Figure 2. This material is based, in part, on work supported
by the U.S. Department of Energy under award DE-
SC0006962. Neither the U.S. government nor any agency
thereof, nor any of their employees, makes any warranty,
express or implied, or assumes any legal liability or
responsibility for the accuracy, completeness, or
usefulness of any information, apparatus, product, or
process disclosed, or represents that its use would not
infringe privately owned rights. The views and opinions of
the author do not necessarily state or reflect those of the
U.S. government or any agency thereof.
References American Society of Civil Engineers, (2001) Standard
Guidelines for Artificial Recharge of Ground Water.
EWRI/ASCE 34-01, American Society of Civil Engineers,
Reston, VA.
American Water Works Association, (1990) Water Quality
and Treatment: A Handbook of Community Water
Supplies, 4 Ed., McGraw-Hill, Inc., New York.
Armstrong, R., and Ajo-Franklin, J., (2011) Investigating
biomineralization using synchrotron based X-ray
computed microtomography. Geophys. Res. Lett., 38,
L08406, doi:10.1029/2011GL046916.
Babadagli, T., and Al-Salmi, S., (2004) A review of
permeability-prediction methods for carbonate reservoirs
using well-log data. SPE Reserv. Eval. Eng., 7(2), 75‒88.
Borchardt, G., (1989) Smectites. In: Minerals in Soil
Environments, J. B. Dixon and S. B. Weed, eds., Soil Science
Society of America, Madison, WI.
Bradford, S.A., Yates, S.R., Bettahar, M., and Simunek, J.,
(2002) Physical factors affecting the transport and fate of
colloids in saturated porous media. Water Resour. Res.,
38(12), 1327, doi:10.1029/2002WR001340.
Carman, P. C., (1937) Fluid Flow through Granular Beds.
Trans. Inst. Chem. Eng., 15, 150.
Chen, S., and Doolen, G.D., (1998) Lattice Boltzmann
method for fluid flows. Annu. Rev. Fluid Mech., 30, 329‒
364.
Elimelech, M., Gregory, J., Jia, X., and Williams, R.A., (1995)
Particle Deposition and Aggregation, Butterworth-
Heinemann, Boston.
Gaillard, J.F., Chen, C., Stonedahl, S.H., Lau, B.L.T., Keane,
D.T., and Packman, A.I., (2007) Imaging of colloidal
deposits in granular porous media by X-ray difference
micro-tomography. Geophys. Res. Lett., 34(18), L18404,
doi:10.1029/2007GL030514.
Ives, K., (1970) Rapid filtration. Water Res., 4, 201‒223.
Ives, K.J., and Fitzpatrick, C.S.B., (1989) Detachment of
Deposits from Sand Grains. Colloid. Surface., 39 (1‒3),
239‒253.

23
Johnson, W.P., Ma, H.L., and Pazmino, E., (2011) Straining
Credibility: A General Comment Regarding Common
Arguments Used to Infer Straining As the Mechanism of
Colloid Retention in Porous Media. Environ. Sci. Technol.,
45(9), 3831‒3832.
Kessler, J., (1993) Transport and channeling effects in a
fracture partially clogged with colloidal material, Ph.D.
dissertation, University of California Berkeley, Berkeley, CA.
Kozeny, J., (1927) Über Kapillare Leitung des Wassers im
Boden. Sitzungsber Akad. Wiss., Wien, 136(2a), 271‒306.
Krauss, E. D., and Mays, D.C., (2013) "Modification of the
Kozeny-Carman Equation to Quantify Formation Damage
by Fines in Clean Unconsolidated Porous Media." In:
International Conference and Exhibition on European
Formation Damage, SPE-165148, Society of Petroleum
Engineers, Noordwijk, Netherlands.
Kretzschmar, R., Borkovec, M., Grolimund, D., and
Elimelech, M. (1999) Mobile subsurface colloids and their
role in contaminant transport. Adv. Agron., 66, 121‒193.
Levine, A.D., and Asano, T., (2004) Recovering sustainable
water from wastewater. Environ. Sci. Technol., 38(11),
201a‒208a.
Ma, H.L., Pedel, J., Fife, P., and Johnson, W.P., (2009)
Hemispheres-in-Cell Geometry to Predict Colloid
Deposition in Porous Media. Environ. Sci. Technol., 43(22),
8573‒8579.
Manga, M., Beresnev, I., Brodsky, E.E., Elkhoury, J.E.,
Elsworth, D., Ingebritsen, S.E., Mays, D.C., and Wang, C.Y.,
(2012) Changes in Permeability Caused by Transient
Stresses: Field Observations, Experiments, and
Mechanisms. Rev. Geophys., 50, RG2004,
doi:10.1029/2011RG000382.
Mays, D.C., (2007) Using the Quirk-Schofield diagram to
explain environmental colloid dispersion phenomena. J.
Nat. Resour. Life Sci. Ed., 36, 45‒52.
Mays, D.C. (2010) Contrasting clogging in granular media
filters, soils, and dead-end membranes. J. Environ. Eng.,
136(5), 475‒480.
Mays, D.C., Cannon, O.T., Kanold, A.W., Harris, K.J., Lei, T.C.,
and Gilbert, B., (2011) Static light scattering resolves
colloid structures in index-matched porous media. J.
Colloid Interf. Sci., 363, 418‒424.
Mays, D.C., and Hunt, J.R., (2005) Hydrodynamic aspects of
particle clogging in porous media. Environ. Sci. Technol.,
39(2), 577‒584.
Mays, D.C., and Hunt, J. R., (2007) Hydrodynamic and
chemical factors in clogging by montmorillonite in porous
media. Environ. Sci. Technol., 41(16), 5666‒5671.
McDowell-Boyer, L.M., Hunt, J.R., and Sitar, N., (1986)
Particle transport through porous media. Water Resour.
Res., 22(13), 1901‒1921.
Mohan, K.K., and Fogler, H.S. (1997) Effect of pH and layer
charge on formation damage in porous media containing
swelling clays. Langmuir, 13(10), 2863‒2872.
Mohan, K.K., Vaidya, R.N., Reed, M.G., and Fogler, H.S.,
(1993) Water Sensitivity of Sandstones Containing
Swelling and Non-Swelling Clays. Colloid. Surface. A, 73,
237‒254.
MWH., (2005) Water Treatment: Principles and Design, 2
Ed., John Wiley and Sons, Inc., Hoboken, NJ.
Nelson, K.E., and Ginn, T.R., (2011) New collector efficiency
equation for colloid filtration in both natural and
engineered flow conditions. Water Resour. Res., 47,
W05543, doi:10.1029/2010WR009587.
O'Melia, C.R., and Ali, W., (1978) The role of retained
particles in deep bed filtration. Prog. Water Res., 10(5/6),
167‒182.
Ojha, C.S.P., and Graham, N.J.D., (1992) Appropriate use of
deep-bed filtration models. J. Environ. Eng., 118(6), 964‒
980.
Panda, M.N., and Lake, L.W., (1995) A Physical Model of
Cementation and Its Effects on Single-Phase Permeability.
AAPG Bull., 79(3), 431‒443.
Pavelic, P., Dillon, P.J., Mucha, M., Nakai, T., Barry, K.E., and
Bestland, E., (2011) Laboratory assessment of factors
affecting soil clogging of soil aquifer treatment systems.
Water Res., 45(10), 3153‒3163.
Poesio, P., and Ooms, G., (2004) Formation and ultrasonic
removal of fouling particle structures in a natural porous
material. J. Petrol. Sci. Eng., 45(3‒4), 159‒178.
Pyne, R.D.G., (1995) Groundwater Recharge and Wells: A
Guide to Aquifer Storage Recovery, Lewis Publishers, Boca
Raton, FL.

24
Quirk, J.P., (1994) Interparticle forces: A basis for the
interpretation of soil physical behavior. Adv. Agron., 53,
121‒183.
Quirk, J.P., and Schofield, R.K., (1955) The effect of
electrolyte concentration on soil permeability. J. Soil Sci.,
6(2), 163‒178.
Rajagopalan, R., and Tien, C. (1976) Trajectory Analysis of
Deep-Bed Filtration with Sphere-in-Cell Porous-Media
Model. AIChE J., 22(3), 523‒533.
Ramachandran, V., and Fogler, H.S., (1999) Plugging by
hydrodynamic bridging during flow of stable colloidal
particles within cylindrical pores. J. Fluid Mech., 385, 129‒
156.
Rege, S.D., and Fogler, H.S., (1988) A Network Model for
Deep Bed Filtration of Solid Particles and Emulsion Drops.
AIChE J., 34(11), 1761‒1772.
Ryan, J.N., and Elimelech, M., (1996) Colloid mobilization
and transport in groundwater. Colloid. Surface. A, 107, 1‒
56.
Selomulya, C., Tran, T.M., Jia, X., and Williams, R.A., (2006)
An integrated methodology to evaluate permeability
from measured microstructures. AIChE J., 52(10), 3394‒
3400.
Sen, T.K., Mahajan, S.P., and Khilar, K.C., (2002) Colloid-
associated contaminant transport in porous media: 1.
Experimental studies. AIChE J., 48(10), 2366‒2374.
Sposito, G., (1989) The Chemistry of Soils, Oxford
University Press, New York.
Tiab, D., and Donaldson, E., (1996) Petrophysics. Gulf
Publishing Company, Houston, TX.
Tufenkji, N., (2007) Modeling microbial transport in
porous media: Traditional approaches and recent
developments. Adv. Water Resources., 30, 1455‒1469.
Tufenkji, N., and Elimelech, M., (2004) Correlation
equation for predicting single-collector efficiency in
physicochemical filtration in saturated porous media.
Environ. Sci. Technol., 38(2), 529‒536.
U.S. National Research Council, (2008) Prospects for
Managed Underground Storage of Recoverable Water.
National Academies Press, Washington, DC.
Valdes, J.R., and Santamarina, J.C., (2006) Particle clogging
in radial flow: Microscale mechanisms. SPE J., 11(2), 193‒
198.
Veerapaneni, S., and Wiesner, M.R., (1994) Particle
Deposition on an Infinitely Permeable Surface -
Dependence of Deposit Morphology on Particle-Size. J.
Colloid Interf. Sci., 162(1), 110‒122.
Veerapaneni, S., and Wiesner, M.R., (1997) Deposit
morphology and head loss development in porous media.
Environ. Sci. Technol., 31(10), 2738‒2744.
Wan, J.M., and Wilson, J.L., (1994) Visualization of the Role
of the Gas-Water Interface on the Fate and Transport of
Colloids in Porous-Media. Water Resour. Res., 30(1), 11‒23.
Wiesner, M.R., (1999) Morphology of particle deposits. J.
Environ. Eng., 125(12), 1124‒1132.
Yao, K.-M., Habibian, M.T., and O'Melia, C.R., (1971) Water
and waste water filtration: Concepts and applications.
Environ. Sci. Technol., 5(11), 1105‒1112.
Zhou, J., Zheng, X.L., Flury, M., and Lin, G.Q., (2009)
Permeability changes during remediation of an aquifer
affected by sea-water intrusion: A laboratory column
study. J. Hydrol., 376(3‒4), 557‒566.
Contact Details David C. Mays, P.E., Ph.D.
University of Colorado Denver
Department of Civil Engineering
Campus Box 113
PO Box 173364
Denver, CO 80217-3364
United States of America
Phone: +1-303-352-3933
Fax: +1-303-556-2368
http://carbon.ucdenver.edu/~dmays

25
CLOGGING STUDIES LABORATORY COLUMN EXPERIMENTS
26
Reclaimed Water for Aquifer Storage and Recovery: A Column Study of Well Clogging S. Rinck-Pfeiffer1, P. Dillon2, S. Ragusa3, J. Hutson and H. Fallowfield4, G. de Marsily5, and P. Pavelic2
1 Vivendi-Water Deutschland, Berlin, Germany 2 CSIRO Land & Water, Glen Osmond, South Australia 3 E.M. Biotechnology, Sydney, Australia 4 Flinders University of SA 5 Université Pierre et Marie Curie, Paris VI, France
Abstract The injection of reclaimed water derived from a municipal sewage treatment plant into a brackish aquifer for
recovery and reuse in irrigation is currently being evaluated at Bolivar, South Australia. A primary concern
before the trial was the potential for clogging of the injection well, so laboratory column experiments were
performed to understand and predict bore clogging, and allow the development of management strategies.
This paper describes the methods and results obtained from a series of three laboratory column studies each
run over three weeks, when samples of different qualities of reclaimed water were passed through columns of
repacked limestone aquifer material, and the extent of clogging was observed. Reclaimed water samples with
and without suspended solids and micro-organisms were used. Hydraulic conductivities decreased in all
columns, stabilised, and recovered slightly. The results suggest that physical clogging is the main cause of
clogging in these cases followed by biological clogging which manifests itself at a slower rate as bacterial
biomass and associated polysaccharides accumulate. The extent of clogging was relieved during all column
experiments due to calcite dissolution and the resulting porosity change of the aquifer matrix. A numerical
model was used to scale-up the clogging effects to infer the likely hydraulic impact to be encountered at the
injection well in a field trial.
1 Introduction As the conventional use of water resources in arid parts of
the world approaches the limits of sustainable use, the
need to address water reclamation and appropriate reuse
is becoming critical. Aquifer Storage and Recovery (ASR)
is one of the ways excess surface water can be stored and
treated for future use. This involves injecting water into an
aquifer where it is stored until it is extracted from the
same well for reuse (Pyne, 1995). Since 1993 in South
Australia the practice of storing urban and rural
stormwater runoff over winter in brackish aquifers has
been successful in generating summer landscape and
agricultural irrigation supplies (Dillon et al., 1997). Water
quality improvements were observed and guidelines
written on the quality of stormwater and treated
wastewater for injection into aquifers for storage and
reuse (Dillon and Pavelic, 1996). That work gave evidence
that sustainable water quality improvements in the
subsurface were possible when injecting waters of
impaired quality into aquifers that were otherwise not fit
for drinking or irrigation water supply. The quantity of
stormwater injected into aquifers in arid areas is limited
by the infrequency of rainfall events and the need for
some form of surface storage, such as artificial urban
wetlands, in order to allow time for injection at a much
slower rate than the rate at which water runs off a
catchment.
Consequently, the Bolivar Reclaimed Water ASR Research
Project was launched, to harvest water from a wastewater
reclamation plant built adjacent to the largest sewage
treatment plant of the city of Adelaide. The reclamation

27
plant serves an extensive horticultural area with more
than 20 Gigalitres of irrigation water from a low-pressure
pipeline. However in winter, demand is less than the
supply and water is discharged into the sea. The research
project aims at determining the technical feasibility,
environmental sustainability and economic viability of
ASR using reclaimed water (Dillon et al., 1999). If
successful up to 10 GL of reclaimed water could be stored
in depleted confined aquifers beneath the irrigation area,
and enable expansion of crops, alleviate over-exploitation
and consequent salinisation of groundwater supplies and
reduce discharge of nutrients into the sensitive coastal
environment of the Gulf of St. Vincent.
Clogging is often perceived as a significant barrier to
artificial recharge by well injection, and was monitored at
a research site for stormwater ASR (Pavelic et al., 1998)
and found to be controllable. For nutrient-rich waters, the
constraint was considered to be more severe due to the
enhanced potential for biofilm to grow in the well and
aquifer, so more stringent management practices would
be required to sustain injection rates in the long term.
Hence before conducting the field trial for the Bolivar
Reclaimed Water ASR Research Project, it was decided to
undertake column tests to determine the potential for
clogging.
2 Previous Studies Clogging has frequently been observed in well-injection
studies, and therefore has been extensively studied.
Suspended solids (SS) in injectant have commonly been a
key determinant in injection well performance, despite
advances in injection well technology (Hauser and
Lotspeich, 1967; Harpaz, 1971; Vecchioli, 1972; Olsthoorn,
1982). Previous experimental results (Okubo and
Matsumoto, 1983) have shown that recharge water used
for ASR should have levels of SS < 2mg/L to avoid major
clogging problems, although levels in excess of 150 mg/L
have not caused irreversible clogging in a calcareous
aquifer at a stormwater ASR site in South Australia (Pavelic
et al., 1998). The second most important factor causing
injection well clogging is biological clogging (Oberdorfer
and Peterson, 1985).
Several methods have been used to predict the potential
clogging rates for a given recharge water. These include
the modified fouling index (MFI) (Hutchinson, 1997) the
assimilable and biodegradable dissolved organic carbon
content (AOC, bDOC) of the recharged water (Schippers
et al., 1995), and mathematical, empirical and analytical
models (Taylor et al., 1990; Okubo & Matsumoto, 1979;
Vandevivere et al., 1995). The main disadvantage of these
predictive clogging tools is that they focus on a single
clogging process by assessing either biological, physical,
chemical or mechanical clogging. However, all these
processes are interrelated and there is a need for
improved understanding of these interactions. Column
infiltration studies using treated effluent have previously
been used to study biological clogging (Rebhun and
Schwarz, 1968; Vecchioli, 1970; Ehrlich et al., 1973; Okubo
and Matsumoto, 1983).
Column studies involving the continuous injection of
treated reclaimed water rather than artificial effluent and
using aquifer material from the target aquifer to study
clogging processes have not been performed widely and
no conclusive results have been obtained to date to the
authors' knowledge. Considering the lack of research in
the field of clogging and the relevance of clogging in ASR
systems, it is evident that research on prediction and
minimisation of clogging is warranted.
3 Methods Column experiments were performed to investigate the
effect of continuously injecting recycled water with and
without suspended material and/or microorganisms, into
columns packed with aquifer material. This study
provided a comparison of aquifer clogging by physical
and biological processes both separately and in
combination.
3.1 Packing of laboratory columns Cores of a sandy limestone aquifer (aquifer T2, known as
the Port Willunga Limestone) were taken during
construction of the ASR well at Bolivar on the Northern
Adelaide Plains, South Australia. The recovered core was
packed in PVC tubes, flushed with nitrogen gas on-site
and stored at 4°C. The core was partly sectioned and
analysed for mineralogy and hydraulic properties. X-ray
diffraction showed that the core material was
predominantly quartz and calcite in approximately equal
proportions.
The core material was sub-sampled in an anaerobic
chamber flushed with argon. The edges of the core
material were removed and the inner piece of the core
28
was submerged in groundwater collected at the field site.
The material was crushed, sieved through a 1mm sieve,
and packed into columns (2.5 cm diameter and 16 cm
long), all within the anaerobic chamber. Although intact
samples were considered, it was decided to homogenise
samples to enable replication, and to focus on changes in
permeability as a result of physical, chemical and
biological processes. This avoided confounding due to
random differences in microstructure and permeability.
Microfractures had a significant effect on the permeability
of confined aquifer cores at effective stresses lower than
those within in-situ aquifer material (Dillon et al., 2001), so
homogenisation was an important consideration.
Breakthrough curves were obtained using a bromide
tracer in native groundwater, to check that no preferential
flow occurred, prior to the inoculation of the columns
with additional groundwater. The effective porosity was
found to range from 0.37 to 0.40, similar to that measured
in the field. The columns were shaded from light by using
aluminium foil, and the room temperature was kept at 20
±2°C (the temperature of the groundwater at the depth
of the core), during the experiments. The columns were
flushed with groundwater from the field site to facilitate
inoculation of the columns, and stabilisation and
acclimatisation of native micro-organisms before
introducing reclaimed water. The columns used for
experiment 3 (i.e. physical clogging only) were sterilised
in an autoclave twice before the injection of disinfected
recycled water.
3.2 Column experiments Three column experiments were performed separately
but in the same manner by pumping reclaimed water
through the packed columns at a rate of 5 L/day/column
(Darcian velocity of 10.2 m/d) using a peristaltic pump.
The velocity of recycled water (influent) pumped through
the columns corresponded to that expected at the ASR
site in the vicinity of the injection well.
The development of clogging and the resulting decrease
in hydraulic conductivity was monitored by logging
pressure sensors located in the intake and outflow and
along the column. Daily measurements of flow were
recorded and the permeability calculated. Water quality
of column influent and effluent was monitored daily and
other observations such as bacterial biomass and
polysaccharide production were related to changes in
hydraulic conductivity.
Column experiment 1 (where physical and biological
clogging were possible) involved the use of the water
intended to be injected at the Bolivar ASR site, namely
secondary treated municipal effluent post-treated by
dissolved air flotation/filtration (DAF/F) and containing
suspended solids, nutrients (i.e. organic carbon, N and P)
and microorganisms (see Table 1). Column experiment 2
(where only biological clogging was possible) used micro-
filtered water from a membrane activated sludge process
(Biosep) which contained nutrients (i.e. organic carbon,
N and P) and microorganisms (due to post-filtration
contamination and bacterial regrowth) but no suspended
solids. Column experiment 3 (where physical clogging
was possible) used DAF/F water treated with
formaldehyde. This water contained suspended solids and
nutrients, but the packed columns had been sterilised to
insure that no microbial growth was possible. Triplicate
columns were run concurrently for each experiment.
3.3 Numerical modelling Modelling of flow around the injection well in 2D axi-
symmetric mode was simulated using the finite-element
model FEFLOW (Diersch, 1996). A most important aspect
of the model was that it could handle the time-varying
material properties that occur through clogging. Injection
takes place into a confined aquifer, which is assumed to
be homogeneous and isotropic, at a constant rate of
25 Ls-1 (2160 m3d-1) for a period of 7 days. This period
represents only the beginning of the injection cycle. A
full-cycle simulation would also need to incorporate the
effect of well redevelopment and the effect of calcite
dissolution, which are not taken into account in the
model. The volume of the aquifer around the well
affected by clogging is assumed to extend a radial
distance of 1.0 metre and is uniform. Only the DAF/F
treated water scenario has been considered, as the data
shows that the clogging experienced with this water type
would be most severe. For comparison, a simulation was
performed where there was no clogging.
4 Results and Discussion
4.1 Changes in hydraulic conductivity The changes in hydraulic conductivity (K) along the
columns were calculated from the average of each
triplicate, and the part of the column where most
clogging occurred was within 3 cm of the inlet (Figure 1).
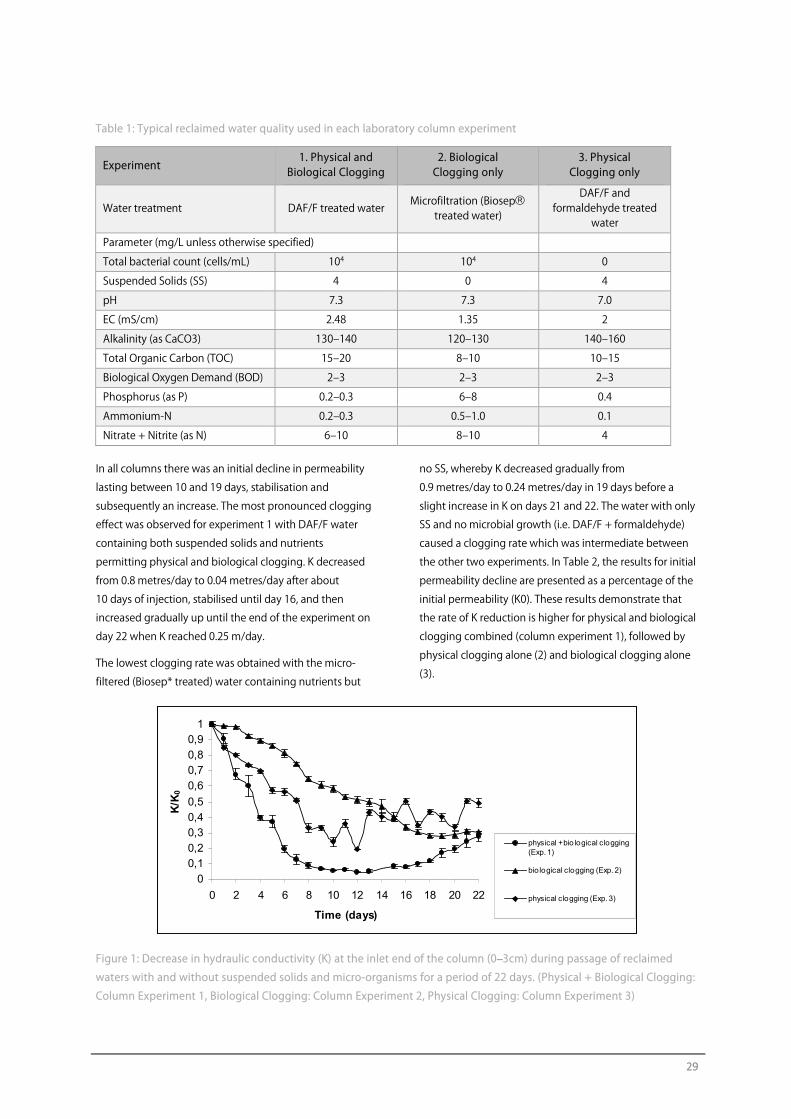
29
00,10,20,30,40,5
0,60,70,80,9
1
0 2 4 6 8 10 12 14 16 18 20 22
Time (days)
K/K
0
physical + bio logical clogging(Exp. 1)
bio logical clogging (Exp. 2)
physical clogging (Exp. 3)
Table 1: Typical reclaimed water quality used in each laboratory column experiment
Experiment 1. Physical and
Biological Clogging 2. Biological
Clogging only 3. Physical
Clogging only
Water treatment DAF/F treated water Microfiltration (Biosep
treated water)
DAF/F and formaldehyde treated
water
Parameter (mg/L unless otherwise specified)
Total bacterial count (cells/mL) 104 104 0
Suspended Solids (SS) 4 0 4
pH 7.3 7.3 7.0
EC (mS/cm) 2.48 1.35 2
Alkalinity (as CaCO3) 130‒140 120‒130 140‒160
Total Organic Carbon (TOC) 15‒20 8‒10 10‒15
Biological Oxygen Demand (BOD) 2‒3 2‒3 2‒3
Phosphorus (as P) 0.2‒0.3 6‒8 0.4
Ammonium-N 0.2‒0.3 0.5‒1.0 0.1
Nitrate + Nitrite (as N) 6‒10 8‒10 4
In all columns there was an initial decline in permeability
lasting between 10 and 19 days, stabilisation and
subsequently an increase. The most pronounced clogging
effect was observed for experiment 1 with DAF/F water
containing both suspended solids and nutrients
permitting physical and biological clogging. K decreased
from 0.8 metres/day to 0.04 metres/day after about
10 days of injection, stabilised until day 16, and then
increased gradually up until the end of the experiment on
day 22 when K reached 0.25 m/day.
The lowest clogging rate was obtained with the micro-
filtered (Biosep* treated) water containing nutrients but
no SS, whereby K decreased gradually from
0.9 metres/day to 0.24 metres/day in 19 days before a
slight increase in K on days 21 and 22. The water with only
SS and no microbial growth (i.e. DAF/F + formaldehyde)
caused a clogging rate which was intermediate between
the other two experiments. In Table 2, the results for initial
permeability decline are presented as a percentage of the
initial permeability (K0). These results demonstrate that
the rate of K reduction is higher for physical and biological
clogging combined (column experiment 1), followed by
physical clogging alone (2) and biological clogging alone
(3).
Figure 1: Decrease in hydraulic conductivity (K) at the inlet end of the column (0–3cm) during passage of reclaimed
waters with and without suspended solids and micro-organisms for a period of 22 days. (Physical + Biological Clogging:
Column Experiment 1, Biological Clogging: Column Experiment 2, Physical Clogging: Column Experiment 3)
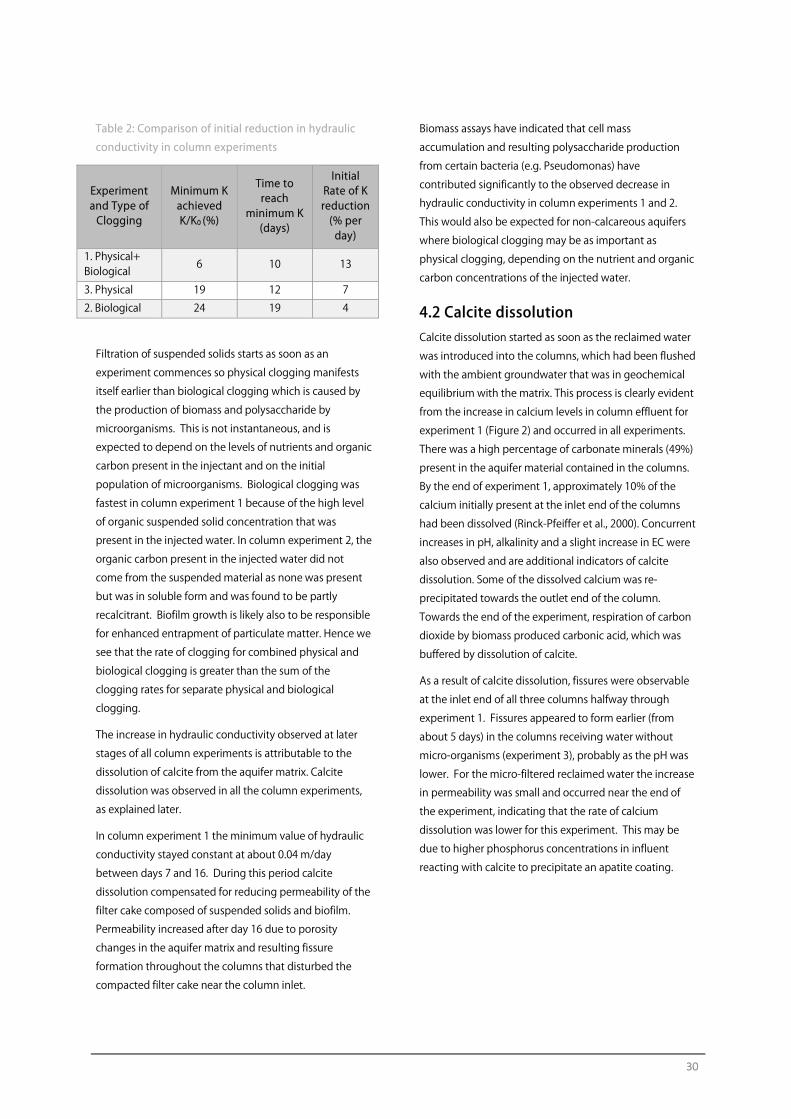
30
Table 2: Comparison of initial reduction in hydraulic
conductivity in column experiments
Experiment and Type of Clogging
Minimum K achieved K/K0 (%)
Time to reach
minimum K (days)
Initial Rate of K reduction (% per day)
1. Physical+ Biological
6 10 13
3. Physical 19 12 7
2. Biological 24 19 4
Filtration of suspended solids starts as soon as an
experiment commences so physical clogging manifests
itself earlier than biological clogging which is caused by
the production of biomass and polysaccharide by
microorganisms. This is not instantaneous, and is
expected to depend on the levels of nutrients and organic
carbon present in the injectant and on the initial
population of microorganisms. Biological clogging was
fastest in column experiment 1 because of the high level
of organic suspended solid concentration that was
present in the injected water. In column experiment 2, the
organic carbon present in the injected water did not
come from the suspended material as none was present
but was in soluble form and was found to be partly
recalcitrant. Biofilm growth is likely also to be responsible
for enhanced entrapment of particulate matter. Hence we
see that the rate of clogging for combined physical and
biological clogging is greater than the sum of the
clogging rates for separate physical and biological
clogging.
The increase in hydraulic conductivity observed at later
stages of all column experiments is attributable to the
dissolution of calcite from the aquifer matrix. Calcite
dissolution was observed in all the column experiments,
as explained later.
In column experiment 1 the minimum value of hydraulic
conductivity stayed constant at about 0.04 m/day
between days 7 and 16. During this period calcite
dissolution compensated for reducing permeability of the
filter cake composed of suspended solids and biofilm.
Permeability increased after day 16 due to porosity
changes in the aquifer matrix and resulting fissure
formation throughout the columns that disturbed the
compacted filter cake near the column inlet.
Biomass assays have indicated that cell mass
accumulation and resulting polysaccharide production
from certain bacteria (e.g. Pseudomonas) have
contributed significantly to the observed decrease in
hydraulic conductivity in column experiments 1 and 2.
This would also be expected for non-calcareous aquifers
where biological clogging may be as important as
physical clogging, depending on the nutrient and organic
carbon concentrations of the injected water.
4.2 Calcite dissolution Calcite dissolution started as soon as the reclaimed water
was introduced into the columns, which had been flushed
with the ambient groundwater that was in geochemical
equilibrium with the matrix. This process is clearly evident
from the increase in calcium levels in column effluent for
experiment 1 (Figure 2) and occurred in all experiments.
There was a high percentage of carbonate minerals (49%)
present in the aquifer material contained in the columns.
By the end of experiment 1, approximately 10% of the
calcium initially present at the inlet end of the columns
had been dissolved (Rinck-Pfeiffer et al., 2000). Concurrent
increases in pH, alkalinity and a slight increase in EC were
also observed and are additional indicators of calcite
dissolution. Some of the dissolved calcium was re-
precipitated towards the outlet end of the column.
Towards the end of the experiment, respiration of carbon
dioxide by biomass produced carbonic acid, which was
buffered by dissolution of calcite.
As a result of calcite dissolution, fissures were observable
at the inlet end of all three columns halfway through
experiment 1. Fissures appeared to form earlier (from
about 5 days) in the columns receiving water without
micro-organisms (experiment 3), probably as the pH was
lower. For the micro-filtered reclaimed water the increase
in permeability was small and occurred near the end of
the experiment, indicating that the rate of calcium
dissolution was lower for this experiment. This may be
due to higher phosphorus concentrations in influent
reacting with calcite to precipitate an apatite coating.
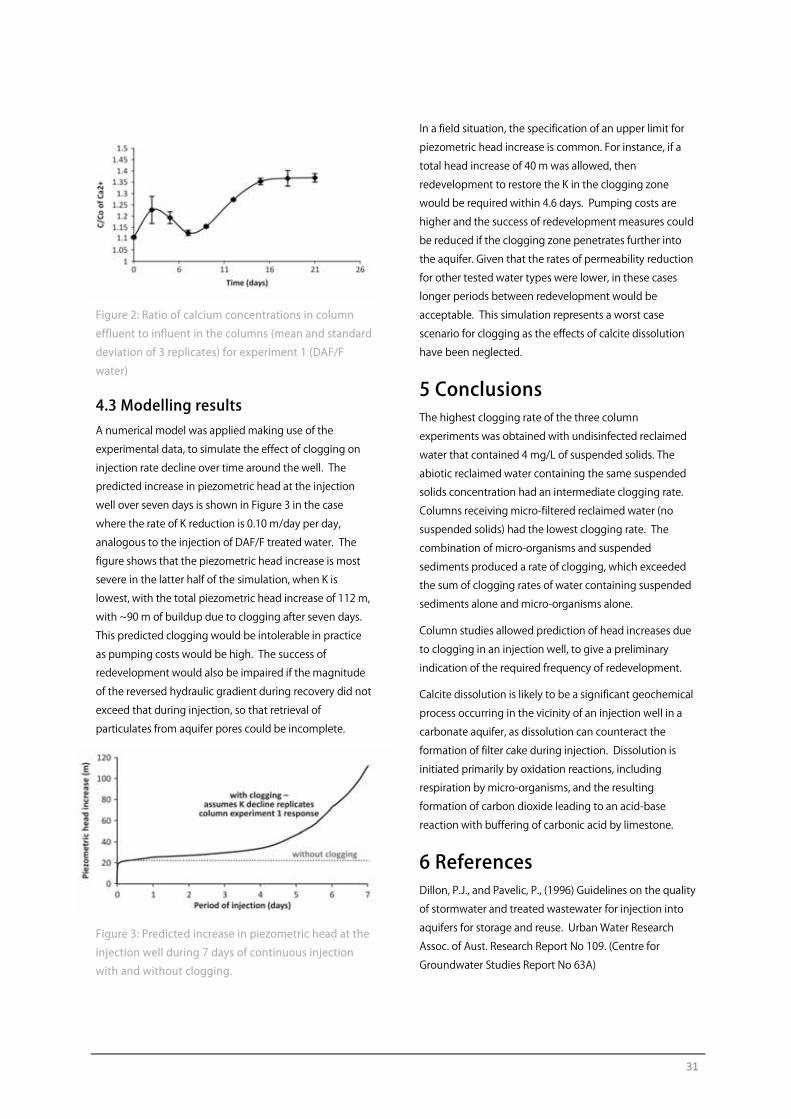
31
Figure 2: Ratio of calcium concentrations in column
effluent to influent in the columns (mean and standard
deviation of 3 replicates) for experiment 1 (DAF/F
water)
4.3 Modelling results A numerical model was applied making use of the
experimental data, to simulate the effect of clogging on
injection rate decline over time around the well. The
predicted increase in piezometric head at the injection
well over seven days is shown in Figure 3 in the case
where the rate of K reduction is 0.10 m/day per day,
analogous to the injection of DAF/F treated water. The
figure shows that the piezometric head increase is most
severe in the latter half of the simulation, when K is
lowest, with the total piezometric head increase of 112 m,
with ~90 m of buildup due to clogging after seven days.
This predicted clogging would be intolerable in practice
as pumping costs would be high. The success of
redevelopment would also be impaired if the magnitude
of the reversed hydraulic gradient during recovery did not
exceed that during injection, so that retrieval of
particulates from aquifer pores could be incomplete.
Figure 3: Predicted increase in piezometric head at the
injection well during 7 days of continuous injection
with and without clogging.
In a field situation, the specification of an upper limit for
piezometric head increase is common. For instance, if a
total head increase of 40 m was allowed, then
redevelopment to restore the K in the clogging zone
would be required within 4.6 days. Pumping costs are
higher and the success of redevelopment measures could
be reduced if the clogging zone penetrates further into
the aquifer. Given that the rates of permeability reduction
for other tested water types were lower, in these cases
longer periods between redevelopment would be
acceptable. This simulation represents a worst case
scenario for clogging as the effects of calcite dissolution
have been neglected.
5 Conclusions The highest clogging rate of the three column
experiments was obtained with undisinfected reclaimed
water that contained 4 mg/L of suspended solids. The
abiotic reclaimed water containing the same suspended
solids concentration had an intermediate clogging rate.
Columns receiving micro-filtered reclaimed water (no
suspended solids) had the lowest clogging rate. The
combination of micro-organisms and suspended
sediments produced a rate of clogging, which exceeded
the sum of clogging rates of water containing suspended
sediments alone and micro-organisms alone.
Column studies allowed prediction of head increases due
to clogging in an injection well, to give a preliminary
indication of the required frequency of redevelopment.
Calcite dissolution is likely to be a significant geochemical
process occurring in the vicinity of an injection well in a
carbonate aquifer, as dissolution can counteract the
formation of filter cake during injection. Dissolution is
initiated primarily by oxidation reactions, including
respiration by micro-organisms, and the resulting
formation of carbon dioxide leading to an acid-base
reaction with buffering of carbonic acid by limestone.
6 References Dillon, P.J., and Pavelic, P., (1996) Guidelines on the quality
of stormwater and treated wastewater for injection into
aquifers for storage and reuse. Urban Water Research
Assoc. of Aust. Research Report No 109. (Centre for
Groundwater Studies Report No 63A)

32
Dillon, P., Pavelic, P., Sibenaler, X., Gerges, N., and Clark, R.,
(1997) Aquifer storage and recovery of stormwater runoff.
AWWA J. Water 24 (4) 7‒11.
Dillon, P., Pavelic, P. Toze, S. Ragusa, S., Wright, M., Peter,
P. Martin, R., Gerges, N., and Rinck-Pfeiffer, S., (1999)
Storing recycled water in an aquifer: benefits and risks.
AWWA J. Water 26(5) 21‒29.
Dillon, P., Pavelic, P., Wright, M., Peter P. and Nefiodovas,
A., (2001) Small-scale heterogeneity and anisotropy of a
confined carbonate aquifer from triaxial tests on core
samples. submitted to Proc IAH XXXI Congress, 'New
Approaches to Characterising Groundwater Flow',
Munich, Sept 2001.
Diersch, H.J., (1996) Feflow: Interactive, graphics-based
finite-element simulation system for modelling
groundwater flow, contaminant mass and heat transport
processes. Feflow User’s Manual Version 4.5. WASY,
institute for Water resources Planning and System
Research Ltd, Berlin, Germany.
Ehrlich, G.G., Ehlke, T.A., and Vecchioli, J., (1973)
Microbiological aspects of ground water recharge
injection of purified unchlorinated sewage effluent at Bay
Park, Long Island, New York. J. Res. U.S. Geol. Surv. 1, 341‒
344.
Harpaz, Y., (1971) Artificial Groundwater Recharge by
means of wells in Israel. Journ. Hydraul. Div. pp 1947‒
1964.
Hauser, V.L., and Lotspeich, F.B.,(1967) Artificial ground
water recharge through wells. Journal of Soil and Water
Conservation, Jan‒Feb 1967, pp 11‒15.
Hutchinson, A.S., (1997) Estimation and quantification of
injection well of injection well clogging. Tucson, AZ. MS
Thesis, University of Arizona.
Oberdorfer, J.A., and Peterson, F.L., (1985) Waste-water
injection : geochemical and biogeochemical clogging
processes. Ground Water 23(6), 753‒761.
Okubo, T., and Matsumoto, J., (1979) Effect of infiltration
rate on biological clogging and water quality changes
during artificial recharge. Wat. Resour. Res. 15, 1536‒1542.
Okubo, T., and Matsumoto, J., (1983) Biological clogging
of sand and changes of organic constituents during
artificial recharge. Water Research 17 (7), 813‒821.
Olsthoorn, T.N., (1982) The clogging of recharge wells,
main subject. KIWA Communications-72, The Netherlands
Testing and Research Institute, Rijswijk, Netherlands.
Pavelic, P., Dillon, P., Barry, K., Herczeg, A., Rattray, K.,
Hekmeijer, P, and Gerges, N., (1998) Well clogging effects
determined from mass balances and hydraulic response
at a stormwater ASR site in Proc 3rd Intl. Symp. Artificial
Recharge, Amsterdam, Sept 1998 (Ed. J.H. Peters),
Balkema, Rotterdam, pp 61‒66.
Pyne, R.D.G., (1995) Groundwater Recharge and Wells: A
Guide to Aquifer Storage Recovery. Lewis Publishers, CRC
Press, 376p.
Rebhun, M., and Schwarz, J., (1968) Clogging and
contamination processes in recharge wells. Wat. Res. 4,
1207‒1217.
Rinck-Pfeiffer, S., Ragusa, S., Sztajnbok, P., and
Vandevelde, T., (2000) Interrelationships between
biological, chemical, and physical processes as an analog
to clogging in Aquifer Storage & Recovery (ASR) wells.
Water Research, 34(7): pp 2110‒2118.
Schippers, J.C., Verdouw, J., and Zweere, G.J., (1995)
Predicting the clogging rate of artificial recharge wells.
J.Wat. SRT-Aqua. 44, 18‒28.
Taylor, S.W., Milly, P.C.D., and Jaffe, P.R., (1990) Biofilm
growth and the related changes in the physical properties
of a porous medium. II. Permeability, Wat. Resour. Res. 26,
2161‒2169.
Vandevivere, P., Baveye, P., Sanchez De Lozada, D., and
DeLeo, P., (1995) Microbial clogging of saturated soils and
aquifer materials: Evaluation of mathematical models.
Water Resour. Res. 31(9): 2173‒2180.
Vecchioli, J., (1970) A note on bacterial growth around a
recharge well at Bay Park, Long Island, New York. Wat. Res.
6, 1415‒1419.
Vecchioli, J., (1972) Experimental injection of tertiary
treated sewage in a deep well at Bay Park, Long Island,
NY. New England Water Works Association 86, 87‒103.
7 Acknowledgments The authors gratefully acknowledge support for this study
by the Bolivar Reclaimed Water ASR Research Project,
composed of Department of Water Resources South

33
Australia (DWR), South Australian Water Corporation,
United Water International Pty Ltd (UWI), CSIRO Land and
Water and S.A. Department of Administrative and
Information Services. We are also grateful to the
“Association Nationale de la Recherche Technique”
(ANRT), Paris, France, for supporting this work through the
grant of a “Convention Industrielle de Formation par la
Recherche” (CIFRE) bursary. We thank DWR staff, notably
Russell Martin, project manager, for collection and storage
of cores. The work was undertaken in the CSIRO Land &
Water Laboratories at Urrbrae, SA and most chemical
analyses were performed at the Australian Water Quality
Centre (AWQC). Chris Bosher (UWI) is acknowledged for
his help in the design and set up of a small post-
secondary treatment pilot plant at the Bolivar Sewage
Treatment Plant. The technical staff at the School of
Physical Chemical and Earth Sciences at the Flinders
University, and Karen Barry of CSIRO Land & Water are
acknowledged for their assistance.
Contact Details Dr. Stéphanie Rinck-Pfeiffer
Vivendi-Water Deutschland, Unter den Linden 21, 10117
Berlin, Germany
Ph: + 49 30 536 53 808, Fax: + 49 30 536 53 888
Email: [email protected]
Dr. Peter James Dillon
(FIEAust.) CSIRO Land & Water and Centre for
Groundwater Studies, PMB2, Glen Osmond, SA 5064,
Australia
Ph: +61 8 8303 8714, Fax: +61 8 8303 8750
Email: [email protected]
Dr. Santo Rosario Ragusa
Environmental and Mining Biotechnology,
20 Peter Crescent, Greenacre, NSW 2190, Sydney,
Australia
Ph: +61 2 9758 7864, Fax: +61 2 9758 7854
Email: [email protected]
Dr. John Hutson
School of Chemical, Physical and Earth Sciences,
Flinders University of SA, GPO Box 2100, Adelaide 5001,
Australia
Ph: +61 8 8201 2616, Fax: +61 8 8201 2676
Email: [email protected]
Associate Professor Howard Fallowfield
Department of Environmental Health, Flinders University
of SA, GPO Box 2100, Adelaide 5001, Australia
Ph: +61 8 8204 5730, Fax: +61 8 8204 5226
Email: [email protected]
Professor Ghislain de Marsily
Université Pierre et Marie Curie, Paris VI,
4 place Jussieu, F-75252 Paris Cedex 05, France
Ph: 01 44 27 43 07, Fax: 01 44 27 49 65
Email: [email protected]
Mr. Paul Pavelic
CSIRO Land & Water and Centre for Groundwater Studies,
PMB2, Glen Osmond, SA 5064, Australia
Ph: +61 8 8303 8772, Fax: +61 8 8303 8750
Email: [email protected]
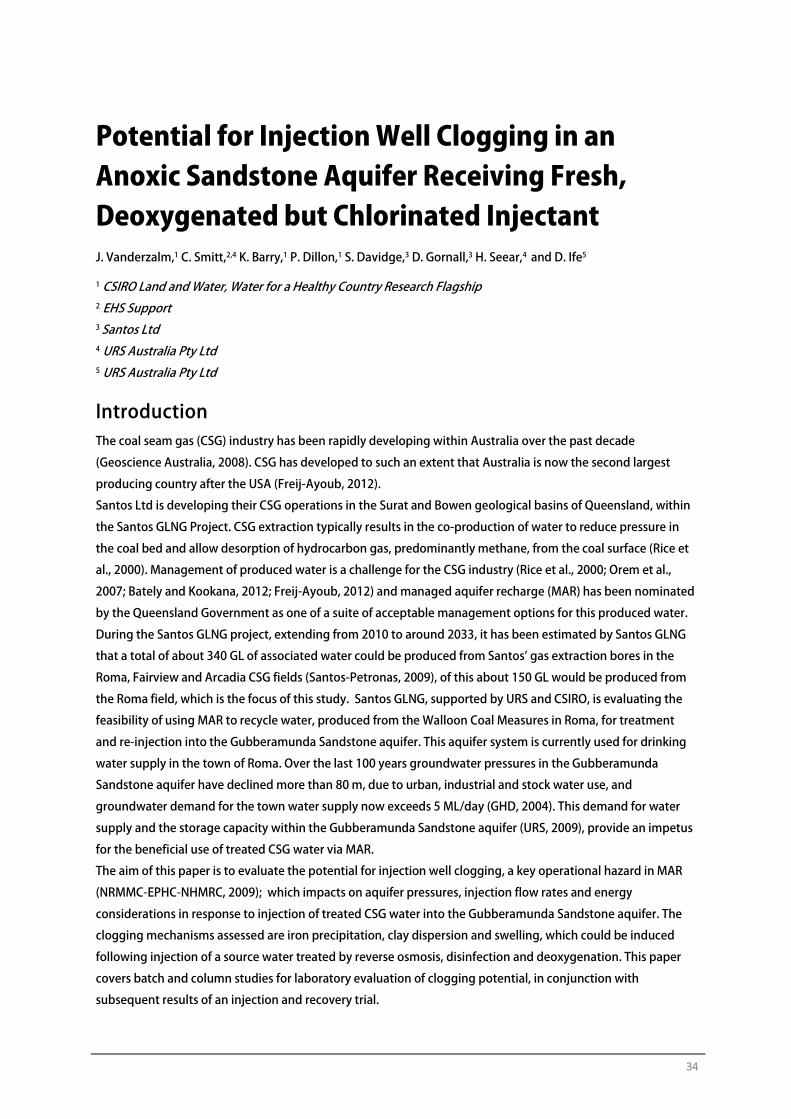
34
Potential for Injection Well Clogging in an Anoxic Sandstone Aquifer Receiving Fresh, Deoxygenated but Chlorinated Injectant J. Vanderzalm,1 C. Smitt,2,4 K. Barry,1 P. Dillon,1 S. Davidge,3 D. Gornall,3 H. Seear,4 and D. Ife5
1 CSIRO Land and Water, Water for a Healthy Country Research Flagship 2 EHS Support 3 Santos Ltd 4 URS Australia Pty Ltd 5 URS Australia Pty Ltd
Introduction The coal seam gas (CSG) industry has been rapidly developing within Australia over the past decade
(Geoscience Australia, 2008). CSG has developed to such an extent that Australia is now the second largest
producing country after the USA (Freij-Ayoub, 2012).
Santos Ltd is developing their CSG operations in the Surat and Bowen geological basins of Queensland, within
the Santos GLNG Project. CSG extraction typically results in the co-production of water to reduce pressure in
the coal bed and allow desorption of hydrocarbon gas, predominantly methane, from the coal surface (Rice et
al., 2000). Management of produced water is a challenge for the CSG industry (Rice et al., 2000; Orem et al.,
2007; Bately and Kookana, 2012; Freij-Ayoub, 2012) and managed aquifer recharge (MAR) has been nominated
by the Queensland Government as one of a suite of acceptable management options for this produced water.
During the Santos GLNG project, extending from 2010 to around 2033, it has been estimated by Santos GLNG
that a total of about 340 GL of associated water could be produced from Santos’ gas extraction bores in the
Roma, Fairview and Arcadia CSG fields (Santos-Petronas, 2009), of this about 150 GL would be produced from
the Roma field, which is the focus of this study. Santos GLNG, supported by URS and CSIRO, is evaluating the
feasibility of using MAR to recycle water, produced from the Walloon Coal Measures in Roma, for treatment
and re-injection into the Gubberamunda Sandstone aquifer. This aquifer system is currently used for drinking
water supply in the town of Roma. Over the last 100 years groundwater pressures in the Gubberamunda
Sandstone aquifer have declined more than 80 m, due to urban, industrial and stock water use, and
groundwater demand for the town water supply now exceeds 5 ML/day (GHD, 2004). This demand for water
supply and the storage capacity within the Gubberamunda Sandstone aquifer (URS, 2009), provide an impetus
for the beneficial use of treated CSG water via MAR.
The aim of this paper is to evaluate the potential for injection well clogging, a key operational hazard in MAR
(NRMMC-EPHC-NHMRC, 2009); which impacts on aquifer pressures, injection flow rates and energy
considerations in response to injection of treated CSG water into the Gubberamunda Sandstone aquifer. The
clogging mechanisms assessed are iron precipitation, clay dispersion and swelling, which could be induced
following injection of a source water treated by reverse osmosis, disinfection and deoxygenation. This paper
covers batch and column studies for laboratory evaluation of clogging potential, in conjunction with
subsequent results of an injection and recovery trial.
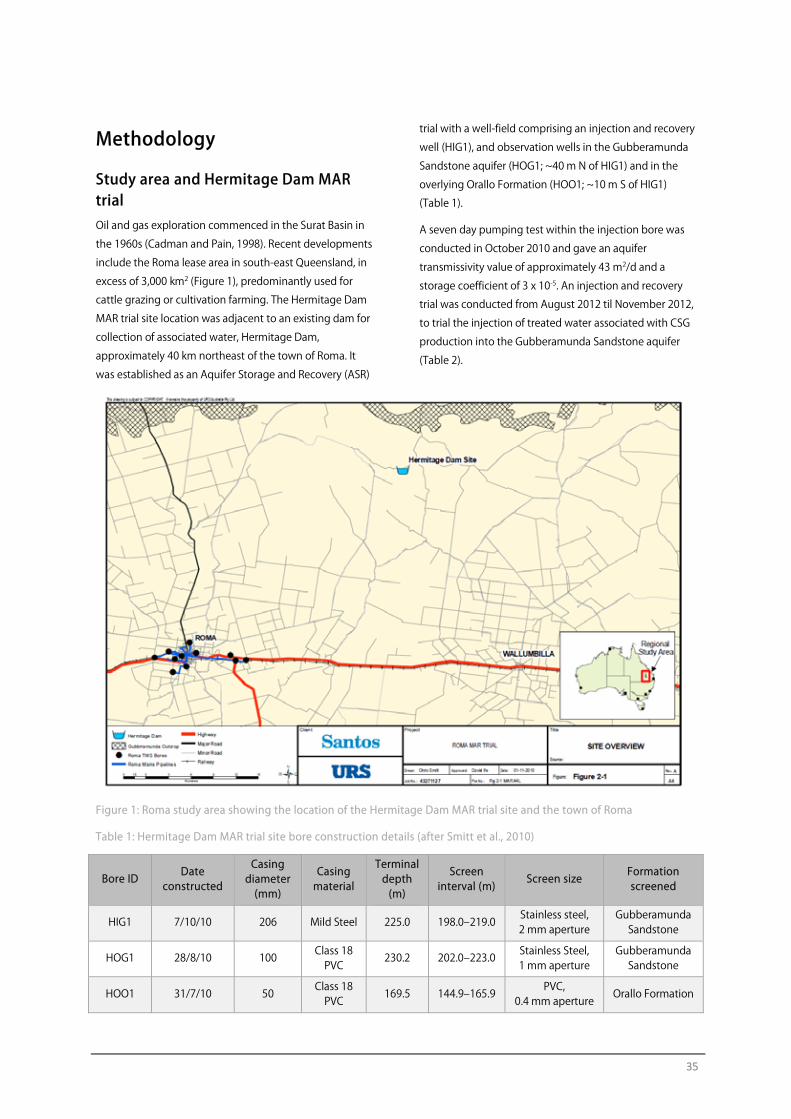
35
Methodology
Study area and Hermitage Dam MAR trial Oil and gas exploration commenced in the Surat Basin in
the 1960s (Cadman and Pain, 1998). Recent developments
include the Roma lease area in south-east Queensland, in
excess of 3,000 km2 (Figure 1), predominantly used for
cattle grazing or cultivation farming. The Hermitage Dam
MAR trial site location was adjacent to an existing dam for
collection of associated water, Hermitage Dam,
approximately 40 km northeast of the town of Roma. It
was established as an Aquifer Storage and Recovery (ASR)
trial with a well-field comprising an injection and recovery
well (HIG1), and observation wells in the Gubberamunda
Sandstone aquifer (HOG1; ~40 m N of HIG1) and in the
overlying Orallo Formation (HOO1; ~10 m S of HIG1)
(Table 1).
A seven day pumping test within the injection bore was
conducted in October 2010 and gave an aquifer
transmissivity value of approximately 43 m2/d and a
storage coefficient of 3 x 10⁻⁵. An injection and recovery
trial was conducted from August 2012 til November 2012,
to trial the injection of treated water associated with CSG
production into the Gubberamunda Sandstone aquifer
(Table 2).
Figure 1: Roma study area showing the location of the Hermitage Dam MAR trial site and the town of Roma
Table 1: Hermitage Dam MAR trial site bore construction details (after Smitt et al., 2010)
Bore ID Date
constructed
Casing diameter (mm)
Casing material
Terminal depth (m)
Screen interval (m)
Screen size Formation screened
HIG1 7/10/10 206 Mild Steel 225.0 198.0‒219.0 Stainless steel, 2 mm aperture
Gubberamunda Sandstone
HOG1 28/8/10 100 Class 18 PVC
230.2 202.0‒223.0 Stainless Steel, 1 mm aperture
Gubberamunda Sandstone
HOO1 31/7/10 50 Class 18
PVC 169.5 144.9‒165.9
PVC, 0.4 mm aperture
Orallo Formation
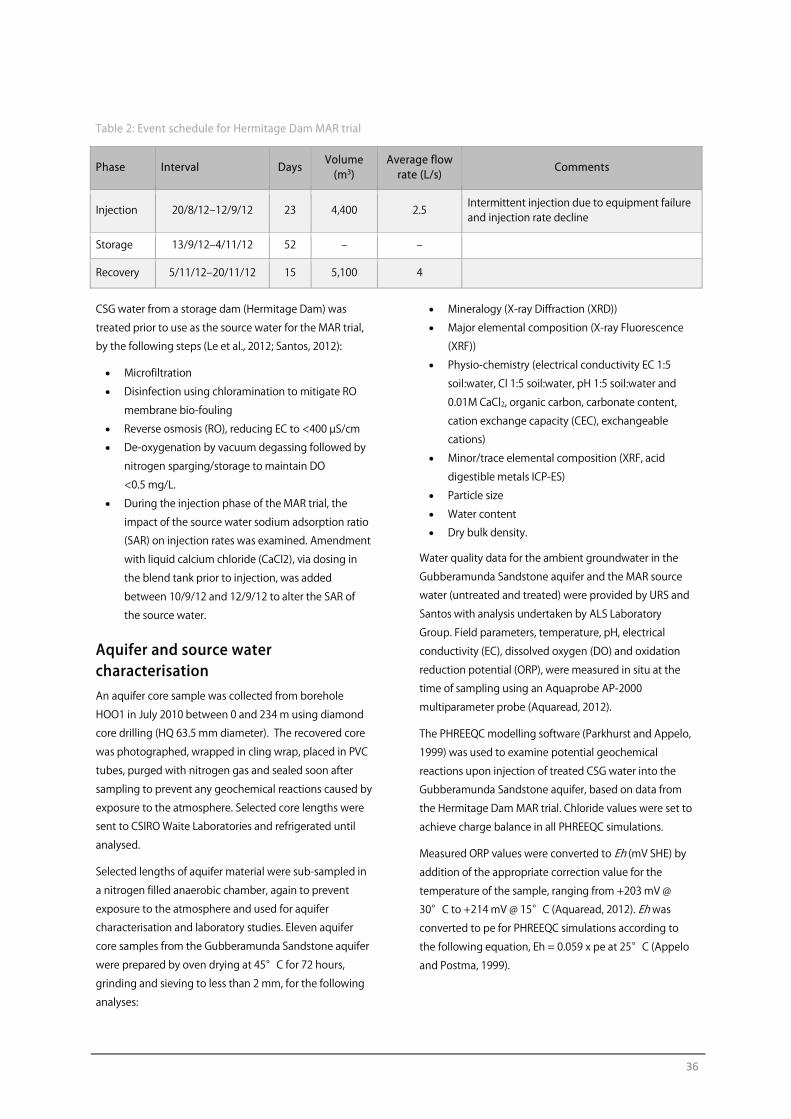
36
Table 2: Event schedule for Hermitage Dam MAR trial
Phase Interval Days Volume (m3)
Average flow rate (L/s)
Comments
Injection 20/8/12‒12/9/12 23 4,400 2.5 Intermittent injection due to equipment failure and injection rate decline
Storage 13/9/12‒4/11/12 52 ‒ ‒
Recovery 5/11/12‒20/11/12 15 5,100 4
CSG water from a storage dam (Hermitage Dam) was
treated prior to use as the source water for the MAR trial,
by the following steps (Le et al., 2012; Santos, 2012):
• Microfiltration
• Disinfection using chloramination to mitigate RO
membrane bio-fouling
• Reverse osmosis (RO), reducing EC to <400 µS/cm
• De-oxygenation by vacuum degassing followed by
nitrogen sparging/storage to maintain DO
<0.5 mg/L.
• During the injection phase of the MAR trial, the
impact of the source water sodium adsorption ratio
(SAR) on injection rates was examined. Amendment
with liquid calcium chloride (CaCl2), via dosing in
the blend tank prior to injection, was added
between 10/9/12 and 12/9/12 to alter the SAR of
the source water.
Aquifer and source water characterisation An aquifer core sample was collected from borehole
HOO1 in July 2010 between 0 and 234 m using diamond
core drilling (HQ 63.5 mm diameter). The recovered core
was photographed, wrapped in cling wrap, placed in PVC
tubes, purged with nitrogen gas and sealed soon after
sampling to prevent any geochemical reactions caused by
exposure to the atmosphere. Selected core lengths were
sent to CSIRO Waite Laboratories and refrigerated until
analysed.
Selected lengths of aquifer material were sub-sampled in
a nitrogen filled anaerobic chamber, again to prevent
exposure to the atmosphere and used for aquifer
characterisation and laboratory studies. Eleven aquifer
core samples from the Gubberamunda Sandstone aquifer
were prepared by oven drying at 45°C for 72 hours,
grinding and sieving to less than 2 mm, for the following
analyses:
• Mineralogy (X-ray Diffraction (XRD))
• Major elemental composition (X-ray Fluorescence
(XRF))
• Physio-chemistry (electrical conductivity EC 1:5
soil:water, Cl 1:5 soil:water, pH 1:5 soil:water and
0.01M CaCl2, organic carbon, carbonate content,
cation exchange capacity (CEC), exchangeable
cations)
• Minor/trace elemental composition (XRF, acid
digestible metals ICP-ES)
• Particle size
• Water content
• Dry bulk density.
Water quality data for the ambient groundwater in the
Gubberamunda Sandstone aquifer and the MAR source
water (untreated and treated) were provided by URS and
Santos with analysis undertaken by ALS Laboratory
Group. Field parameters, temperature, pH, electrical
conductivity (EC), dissolved oxygen (DO) and oxidation
reduction potential (ORP), were measured in situ at the
time of sampling using an Aquaprobe AP-2000
multiparameter probe (Aquaread, 2012).
The PHREEQC modelling software (Parkhurst and Appelo,
1999) was used to examine potential geochemical
reactions upon injection of treated CSG water into the
Gubberamunda Sandstone aquifer, based on data from
the Hermitage Dam MAR trial. Chloride values were set to
achieve charge balance in all PHREEQC simulations.
Measured ORP values were converted to Eh (mV SHE) by
addition of the appropriate correction value for the
temperature of the sample, ranging from +203 mV @
30°C to +214 mV @ 15°C (Aquaread, 2012). Eh was
converted to pe for PHREEQC simulations according to
the following equation, Eh = 0.059 x pe at 25°C (Appelo
and Postma, 1999).
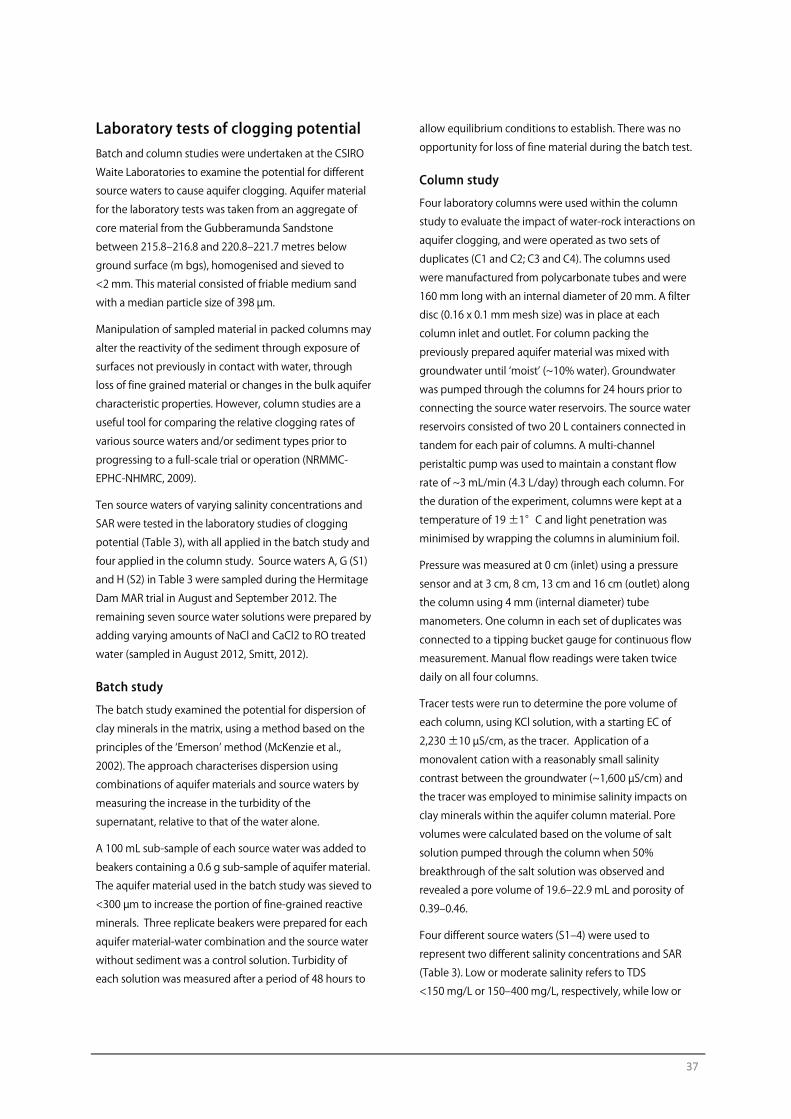
37
Laboratory tests of clogging potential Batch and column studies were undertaken at the CSIRO
Waite Laboratories to examine the potential for different
source waters to cause aquifer clogging. Aquifer material
for the laboratory tests was taken from an aggregate of
core material from the Gubberamunda Sandstone
between 215.8‒216.8 and 220.8‒221.7 metres below
ground surface (m bgs), homogenised and sieved to
<2 mm. This material consisted of friable medium sand
with a median particle size of 398 µm.
Manipulation of sampled material in packed columns may
alter the reactivity of the sediment through exposure of
surfaces not previously in contact with water, through
loss of fine grained material or changes in the bulk aquifer
characteristic properties. However, column studies are a
useful tool for comparing the relative clogging rates of
various source waters and/or sediment types prior to
progressing to a full-scale trial or operation (NRMMC-
EPHC-NHMRC, 2009).
Ten source waters of varying salinity concentrations and
SAR were tested in the laboratory studies of clogging
potential (Table 3), with all applied in the batch study and
four applied in the column study. Source waters A, G (S1)
and H (S2) in Table 3 were sampled during the Hermitage
Dam MAR trial in August and September 2012. The
remaining seven source water solutions were prepared by
adding varying amounts of NaCl and CaCl2 to RO treated
water (sampled in August 2012, Smitt, 2012).
Batch study
The batch study examined the potential for dispersion of
clay minerals in the matrix, using a method based on the
principles of the ‘Emerson’ method (McKenzie et al.,
2002). The approach characterises dispersion using
combinations of aquifer materials and source waters by
measuring the increase in the turbidity of the
supernatant, relative to that of the water alone.
A 100 mL sub-sample of each source water was added to
beakers containing a 0.6 g sub-sample of aquifer material.
The aquifer material used in the batch study was sieved to
<300 µm to increase the portion of fine-grained reactive
minerals. Three replicate beakers were prepared for each
aquifer material-water combination and the source water
without sediment was a control solution. Turbidity of
each solution was measured after a period of 48 hours to
allow equilibrium conditions to establish. There was no
opportunity for loss of fine material during the batch test.
Column study
Four laboratory columns were used within the column
study to evaluate the impact of water-rock interactions on
aquifer clogging, and were operated as two sets of
duplicates (C1 and C2; C3 and C4). The columns used
were manufactured from polycarbonate tubes and were
160 mm long with an internal diameter of 20 mm. A filter
disc (0.16 x 0.1 mm mesh size) was in place at each
column inlet and outlet. For column packing the
previously prepared aquifer material was mixed with
groundwater until ‘moist’ (~10% water). Groundwater
was pumped through the columns for 24 hours prior to
connecting the source water reservoirs. The source water
reservoirs consisted of two 20 L containers connected in
tandem for each pair of columns. A multi-channel
peristaltic pump was used to maintain a constant flow
rate of ~3 mL/min (4.3 L/day) through each column. For
the duration of the experiment, columns were kept at a
temperature of 19 ±1°C and light penetration was
minimised by wrapping the columns in aluminium foil.
Pressure was measured at 0 cm (inlet) using a pressure
sensor and at 3 cm, 8 cm, 13 cm and 16 cm (outlet) along
the column using 4 mm (internal diameter) tube
manometers. One column in each set of duplicates was
connected to a tipping bucket gauge for continuous flow
measurement. Manual flow readings were taken twice
daily on all four columns.
Tracer tests were run to determine the pore volume of
each column, using KCl solution, with a starting EC of
2,230 ±10 µS/cm, as the tracer. Application of a
monovalent cation with a reasonably small salinity
contrast between the groundwater (~1,600 µS/cm) and
the tracer was employed to minimise salinity impacts on
clay minerals within the aquifer column material. Pore
volumes were calculated based on the volume of salt
solution pumped through the column when 50%
breakthrough of the salt solution was observed and
revealed a pore volume of 19.6‒22.9 mL and porosity of
0.39‒0.46.
Four different source waters (S1‒4) were used to
represent two different salinity concentrations and SAR
(Table 3). Low or moderate salinity refers to TDS
<150 mg/L or 150‒400 mg/L, respectively, while low or
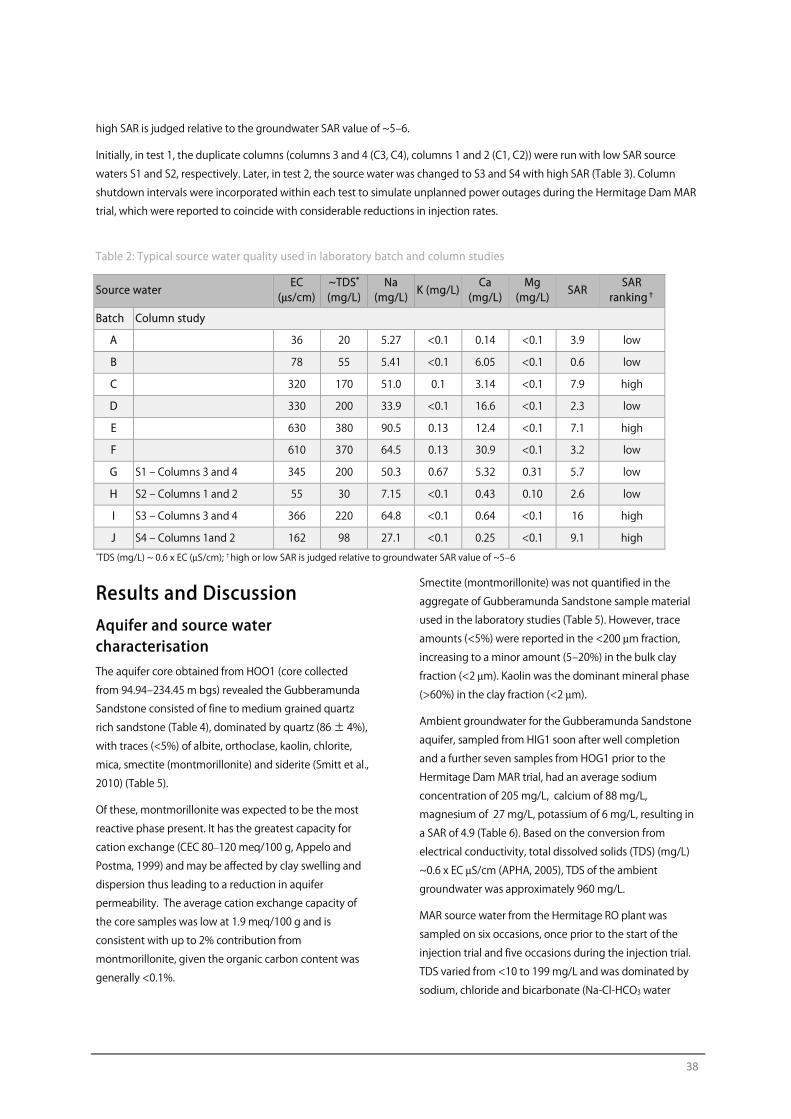
38
high SAR is judged relative to the groundwater SAR value of ~5‒6.
Initially, in test 1, the duplicate columns (columns 3 and 4 (C3, C4), columns 1 and 2 (C1, C2)) were run with low SAR source
waters S1 and S2, respectively. Later, in test 2, the source water was changed to S3 and S4 with high SAR (Table 3). Column
shutdown intervals were incorporated within each test to simulate unplanned power outages during the Hermitage Dam MAR
trial, which were reported to coincide with considerable reductions in injection rates.
Table 2: Typical source water quality used in laboratory batch and column studies
Source water EC
(μs/cm) ~TDS* (mg/L)
Na (mg/L)
K (mg/L)Ca
(mg/L) Mg
(mg/L) SAR
SAR ranking†
Batch Column study
A 36 20 5.27 <0.1 0.14 <0.1 3.9 low
B 78 55 5.41 <0.1 6.05 <0.1 0.6 low
C 320 170 51.0 0.1 3.14 <0.1 7.9 high
D 330 200 33.9 <0.1 16.6 <0.1 2.3 low
E 630 380 90.5 0.13 12.4 <0.1 7.1 high
F 610 370 64.5 0.13 30.9 <0.1 3.2 low
G S1 ‒ Columns 3 and 4 345 200 50.3 0.67 5.32 0.31 5.7 low
H S2 ‒ Columns 1 and 2 55 30 7.15 <0.1 0.43 0.10 2.6 low
I S3 ‒ Columns 3 and 4 366 220 64.8 <0.1 0.64 <0.1 16 high
J S4 ‒ Columns 1and 2 162 98 27.1 <0.1 0.25 <0.1 9.1 high *TDS (mg/L) ~ 0.6 x EC (μS/cm); †high or low SAR is judged relative to groundwater SAR value of ~5‒6
Results and Discussion Aquifer and source water characterisation The aquifer core obtained from HOO1 (core collected
from 94.94‒234.45 m bgs) revealed the Gubberamunda
Sandstone consisted of fine to medium grained quartz
rich sandstone (Table 4), dominated by quartz (86 ± 4%),
with traces (<5%) of albite, orthoclase, kaolin, chlorite,
mica, smectite (montmorillonite) and siderite (Smitt et al.,
2010) (Table 5).
Of these, montmorillonite was expected to be the most
reactive phase present. It has the greatest capacity for
cation exchange (CEC 80–120 meq/100 g, Appelo and
Postma, 1999) and may be affected by clay swelling and
dispersion thus leading to a reduction in aquifer
permeability. The average cation exchange capacity of
the core samples was low at 1.9 meq/100 g and is
consistent with up to 2% contribution from
montmorillonite, given the organic carbon content was
generally <0.1%.
Smectite (montmorillonite) was not quantified in the
aggregate of Gubberamunda Sandstone sample material
used in the laboratory studies (Table 5). However, trace
amounts (<5%) were reported in the <200 μm fraction,
increasing to a minor amount (5‒20%) in the bulk clay
fraction (<2 μm). Kaolin was the dominant mineral phase
(>60%) in the clay fraction (<2 μm).
Ambient groundwater for the Gubberamunda Sandstone
aquifer, sampled from HIG1 soon after well completion
and a further seven samples from HOG1 prior to the
Hermitage Dam MAR trial, had an average sodium
concentration of 205 mg/L, calcium of 88 mg/L,
magnesium of 27 mg/L, potassium of 6 mg/L, resulting in
a SAR of 4.9 (Table 6). Based on the conversion from
electrical conductivity, total dissolved solids (TDS) (mg/L)
~0.6 x EC μS/cm (APHA, 2005), TDS of the ambient
groundwater was approximately 960 mg/L.
MAR source water from the Hermitage RO plant was
sampled on six occasions, once prior to the start of the
injection trial and five occasions during the injection trial.
TDS varied from <10 to 199 mg/L and was dominated by
sodium, chloride and bicarbonate (Na-Cl-HCO3 water
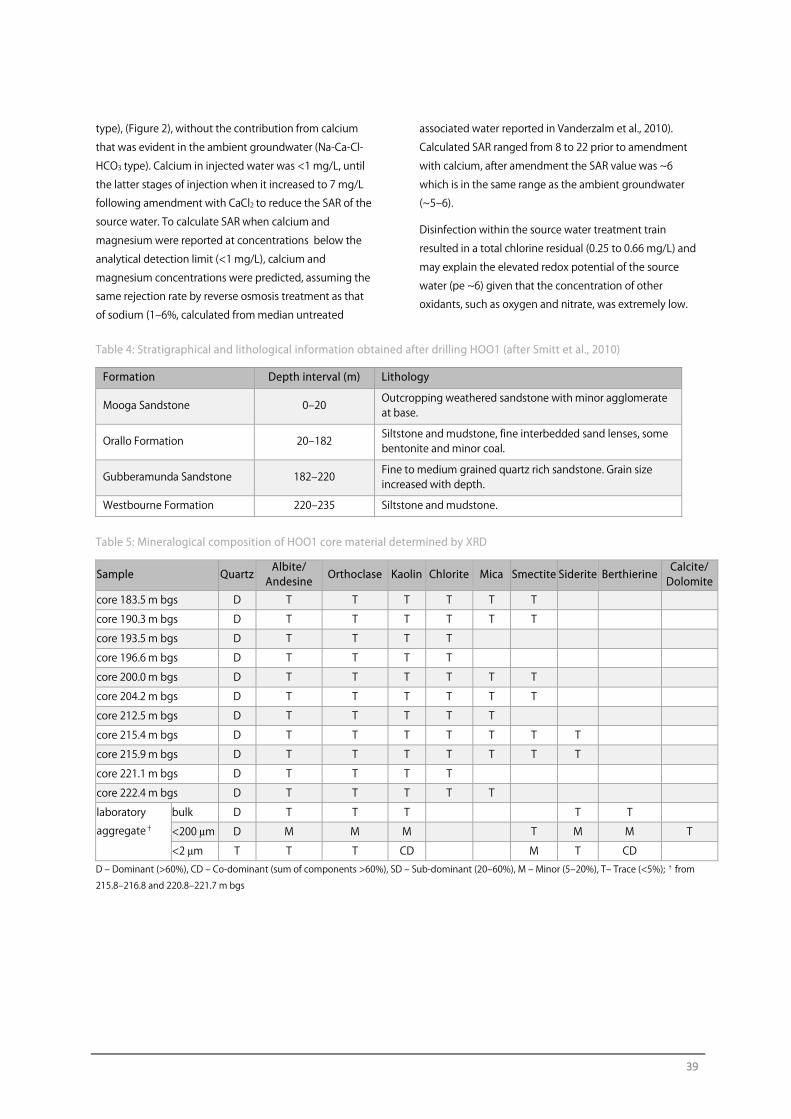
39
type), (Figure 2), without the contribution from calcium
that was evident in the ambient groundwater (Na-Ca-Cl-
HCO3 type). Calcium in injected water was <1 mg/L, until
the latter stages of injection when it increased to 7 mg/L
following amendment with CaCl2 to reduce the SAR of the
source water. To calculate SAR when calcium and
magnesium were reported at concentrations below the
analytical detection limit (<1 mg/L), calcium and
magnesium concentrations were predicted, assuming the
same rejection rate by reverse osmosis treatment as that
of sodium (1‒6%, calculated from median untreated
associated water reported in Vanderzalm et al., 2010).
Calculated SAR ranged from 8 to 22 prior to amendment
with calcium, after amendment the SAR value was ~6
which is in the same range as the ambient groundwater
(~5‒6).
Disinfection within the source water treatment train
resulted in a total chlorine residual (0.25 to 0.66 mg/L) and
may explain the elevated redox potential of the source
water (pe ~6) given that the concentration of other
oxidants, such as oxygen and nitrate, was extremely low.
Table 4: Stratigraphical and lithological information obtained after drilling HOO1 (after Smitt et al., 2010)
Formation Depth interval (m) Lithology
Mooga Sandstone 0‒20 Outcropping weathered sandstone with minor agglomerate at base.
Orallo Formation 20‒182 Siltstone and mudstone, fine interbedded sand lenses, some bentonite and minor coal.
Gubberamunda Sandstone 182‒220 Fine to medium grained quartz rich sandstone. Grain size increased with depth.
Westbourne Formation 220‒235 Siltstone and mudstone.
Table 5: Mineralogical composition of HOO1 core material determined by XRD
Sample Quartz Albite/
Andesine Orthoclase Kaolin Chlorite Mica Smectite Siderite Berthierine
Calcite/ Dolomite
core 183.5 m bgs D T T T T T T
core 190.3 m bgs D T T T T T T
core 193.5 m bgs D T T T T
core 196.6 m bgs D T T T T
core 200.0 m bgs D T T T T T T
core 204.2 m bgs D T T T T T T
core 212.5 m bgs D T T T T T
core 215.4 m bgs D T T T T T T T
core 215.9 m bgs D T T T T T T T
core 221.1 m bgs D T T T T
core 222.4 m bgs D T T T T T
laboratory
aggregate†
bulk D T T T T T
<200 μm D M M M T M M T
<2 μm T T T CD M T CD D ‒ Dominant (>60%), CD ‒ Co-dominant (sum of components >60%), SD ‒ Sub-dominant (20‒60%), M ‒ Minor (5‒20%), T‒ Trace (<5%); † from
215.8‒216.8 and 220.8‒221.7 m bgs
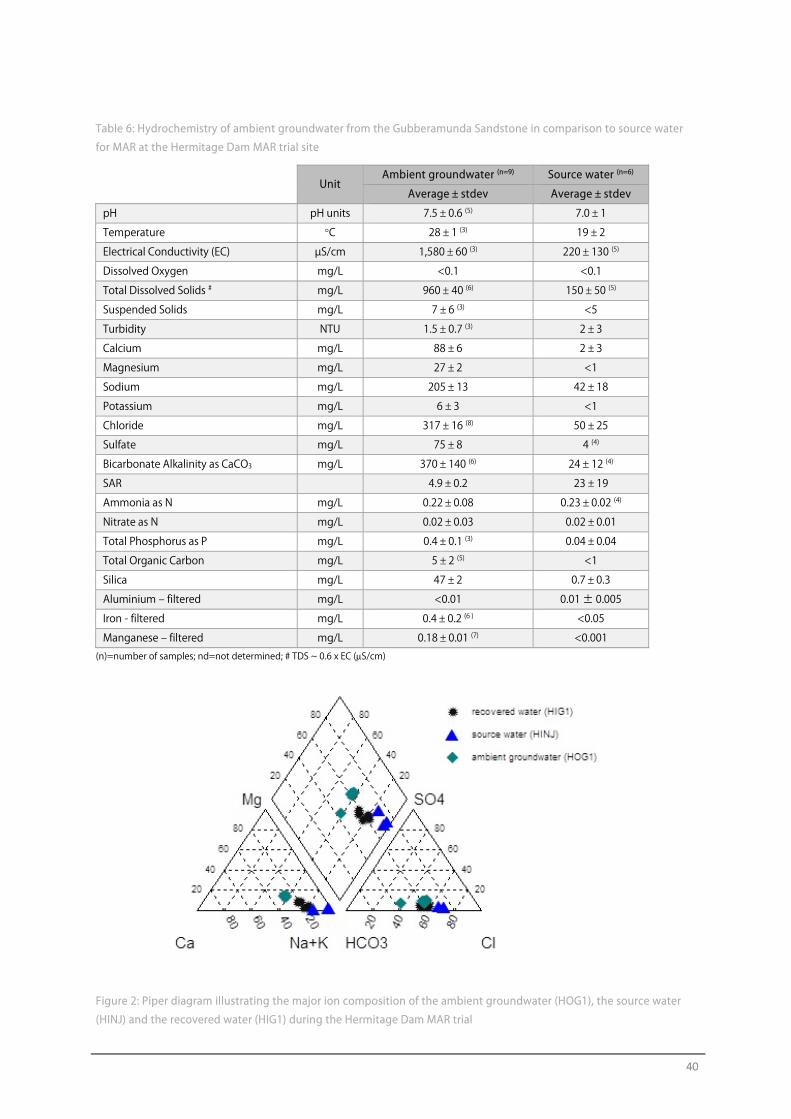
40
Table 6: Hydrochemistry of ambient groundwater from the Gubberamunda Sandstone in comparison to source water
for MAR at the Hermitage Dam MAR trial site
Unit
Ambient groundwater (n=9) Source water (n=6)
Average ± stdev Average ± stdev
pH pH units 7.5 ± 0.6 (5) 7.0 ± 1
Temperature °C 28 ± 1 (3) 19 ± 2
Electrical Conductivity (EC) µS/cm 1,580 ± 60 (3) 220 ± 130 (5)
Dissolved Oxygen mg/L <0.1 <0.1
Total Dissolved Solids # mg/L 960 ± 40 (6) 150 ± 50 (5)
Suspended Solids mg/L 7 ± 6 (3) <5
Turbidity NTU 1.5 ± 0.7 (3) 2 ± 3
Calcium mg/L 88 ± 6 2 ± 3
Magnesium mg/L 27 ± 2 <1
Sodium mg/L 205 ± 13 42 ± 18
Potassium mg/L 6 ± 3 <1
Chloride mg/L 317 ± 16 (8) 50 ± 25
Sulfate mg/L 75 ± 8 4 (4)
Bicarbonate Alkalinity as CaCO3 mg/L 370 ± 140 (6) 24 ± 12 (4)
SAR 4.9 ± 0.2 23 ± 19
Ammonia as N mg/L 0.22 ± 0.08 0.23 ± 0.02 (4)
Nitrate as N mg/L 0.02 ± 0.03 0.02 ± 0.01
Total Phosphorus as P mg/L 0.4 ± 0.1 (3) 0.04 ± 0.04
Total Organic Carbon mg/L 5 ± 2 (5) <1
Silica mg/L 47 ± 2 0.7 ± 0.3
Aluminium ‒ filtered mg/L <0.01 0.01 ± 0.005
Iron - filtered mg/L 0.4 ± 0.2 (6 ) <0.05
Manganese ‒ filtered mg/L 0.18 ± 0.01 (7) <0.001 (n)=number of samples; nd=not determined; # TDS ~ 0.6 x EC (μS/cm)
Figure 2: Piper diagram illustrating the major ion composition of the ambient groundwater (HOG1), the source water
(HINJ) and the recovered water (HIG1) during the Hermitage Dam MAR trial
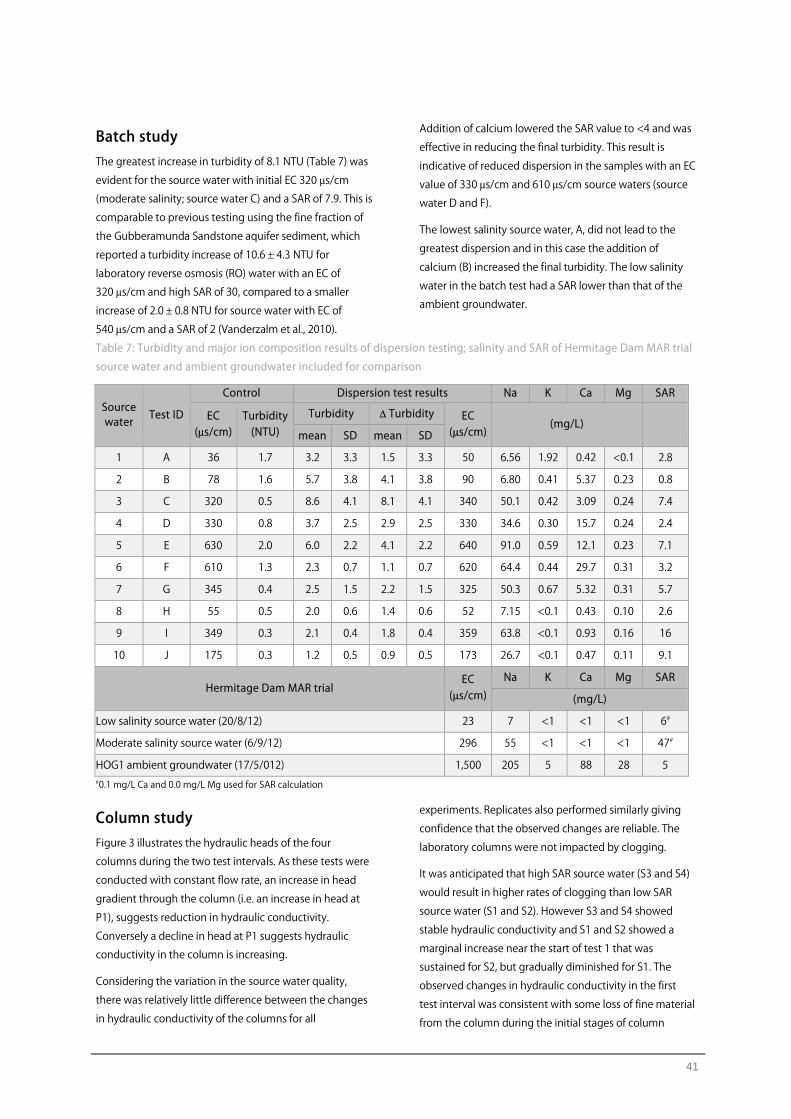
41
Batch study The greatest increase in turbidity of 8.1 NTU (Table 7) was
evident for the source water with initial EC 320 μs/cm
(moderate salinity; source water C) and a SAR of 7.9. This is
comparable to previous testing using the fine fraction of
the Gubberamunda Sandstone aquifer sediment, which
reported a turbidity increase of 10.6 ± 4.3 NTU for
laboratory reverse osmosis (RO) water with an EC of
320 μs/cm and high SAR of 30, compared to a smaller
increase of 2.0 ± 0.8 NTU for source water with EC of
540 μs/cm and a SAR of 2 (Vanderzalm et al., 2010).
Addition of calcium lowered the SAR value to <4 and was
effective in reducing the final turbidity. This result is
indicative of reduced dispersion in the samples with an EC
value of 330 μs/cm and 610 μs/cm source waters (source
water D and F).
The lowest salinity source water, A, did not lead to the
greatest dispersion and in this case the addition of
calcium (B) increased the final turbidity. The low salinity
water in the batch test had a SAR lower than that of the
ambient groundwater.
Table 7: Turbidity and major ion composition results of dispersion testing; salinity and SAR of Hermitage Dam MAR trial
source water and ambient groundwater included for comparison
Source water
Test ID
Control Dispersion test results Na K Ca Mg SAR
EC (μs/cm)
Turbidity (NTU)
Turbidity Δ Turbidity EC (μs/cm)
(mg/L) mean SD mean SD
1 A 36 1.7 3.2 3.3 1.5 3.3 50 6.56 1.92 0.42 <0.1 2.8
2 B 78 1.6 5.7 3.8 4.1 3.8 90 6.80 0.41 5.37 0.23 0.8
3 C 320 0.5 8.6 4.1 8.1 4.1 340 50.1 0.42 3.09 0.24 7.4
4 D 330 0.8 3.7 2.5 2.9 2.5 330 34.6 0.30 15.7 0.24 2.4
5 E 630 2.0 6.0 2.2 4.1 2.2 640 91.0 0.59 12.1 0.23 7.1
6 F 610 1.3 2.3 0.7 1.1 0.7 620 64.4 0.44 29.7 0.31 3.2
7 G 345 0.4 2.5 1.5 2.2 1.5 325 50.3 0.67 5.32 0.31 5.7
8 H 55 0.5 2.0 0.6 1.4 0.6 52 7.15 <0.1 0.43 0.10 2.6
9 I 349 0.3 2.1 0.4 1.8 0.4 359 63.8 <0.1 0.93 0.16 16
10 J 175 0.3 1.2 0.5 0.9 0.5 173 26.7 <0.1 0.47 0.11 9.1
Hermitage Dam MAR trial EC
(μs/cm)
Na K Ca Mg SAR
(mg/L)
Low salinity source water (20/8/12) 23 7 <1 <1 <1 6#
Moderate salinity source water (6/9/12) 296 55 <1 <1 <1 47#
HOG1 ambient groundwater (17/5/012) 1,500 205 5 88 28 5 #0.1 mg/L Ca and 0.0 mg/L Mg used for SAR calculation
Column study Figure 3 illustrates the hydraulic heads of the four
columns during the two test intervals. As these tests were
conducted with constant flow rate, an increase in head
gradient through the column (i.e. an increase in head at
P1), suggests reduction in hydraulic conductivity.
Conversely a decline in head at P1 suggests hydraulic
conductivity in the column is increasing.
Considering the variation in the source water quality,
there was relatively little difference between the changes
in hydraulic conductivity of the columns for all
experiments. Replicates also performed similarly giving
confidence that the observed changes are reliable. The
laboratory columns were not impacted by clogging.
It was anticipated that high SAR source water (S3 and S4)
would result in higher rates of clogging than low SAR
source water (S1 and S2). However S3 and S4 showed
stable hydraulic conductivity and S1 and S2 showed a
marginal increase near the start of test 1 that was
sustained for S2, but gradually diminished for S1. The
observed changes in hydraulic conductivity in the first
test interval was consistent with some loss of fine material
from the column during the initial stages of column
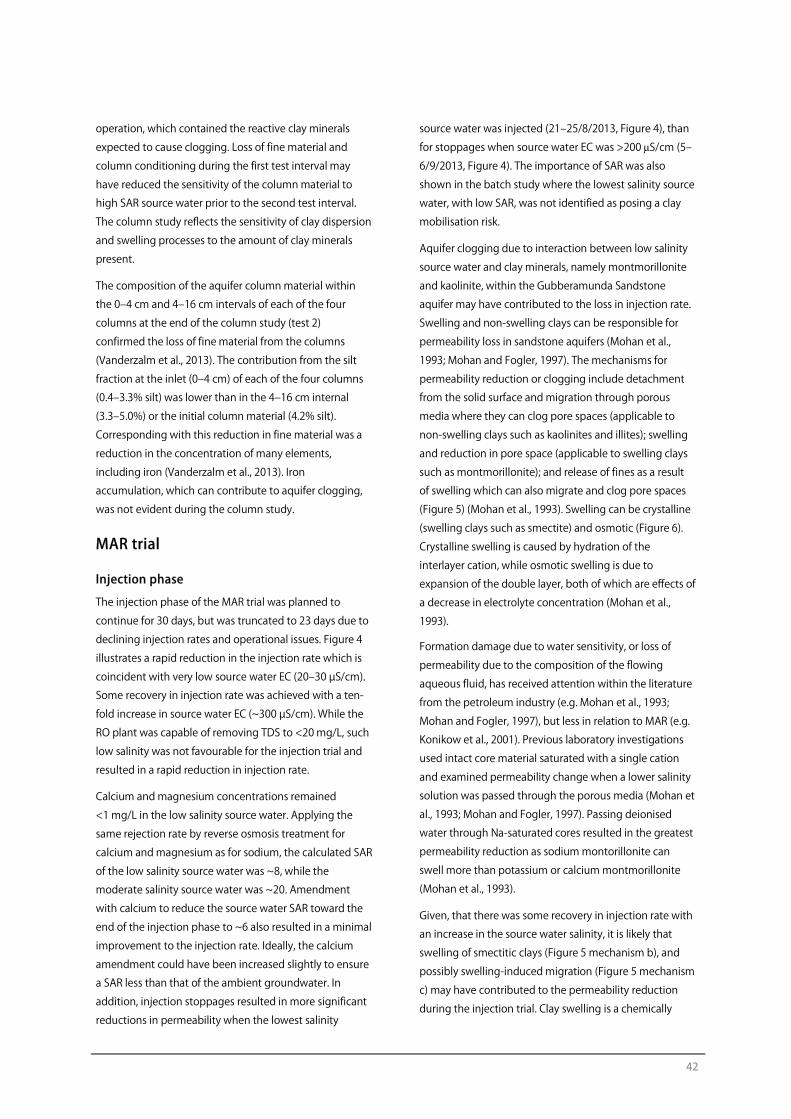
42
operation, which contained the reactive clay minerals
expected to cause clogging. Loss of fine material and
column conditioning during the first test interval may
have reduced the sensitivity of the column material to
high SAR source water prior to the second test interval.
The column study reflects the sensitivity of clay dispersion
and swelling processes to the amount of clay minerals
present.
The composition of the aquifer column material within
the 0‒4 cm and 4‒16 cm intervals of each of the four
columns at the end of the column study (test 2)
confirmed the loss of fine material from the columns
(Vanderzalm et al., 2013). The contribution from the silt
fraction at the inlet (0‒4 cm) of each of the four columns
(0.4‒3.3% silt) was lower than in the 4‒16 cm internal
(3.3‒5.0%) or the initial column material (4.2% silt).
Corresponding with this reduction in fine material was a
reduction in the concentration of many elements,
including iron (Vanderzalm et al., 2013). Iron
accumulation, which can contribute to aquifer clogging,
was not evident during the column study.
MAR trial
Injection phase
The injection phase of the MAR trial was planned to
continue for 30 days, but was truncated to 23 days due to
declining injection rates and operational issues. Figure 4
illustrates a rapid reduction in the injection rate which is
coincident with very low source water EC (20‒30 µS/cm).
Some recovery in injection rate was achieved with a ten-
fold increase in source water EC (~300 µS/cm). While the
RO plant was capable of removing TDS to <20 mg/L, such
low salinity was not favourable for the injection trial and
resulted in a rapid reduction in injection rate.
Calcium and magnesium concentrations remained
<1 mg/L in the low salinity source water. Applying the
same rejection rate by reverse osmosis treatment for
calcium and magnesium as for sodium, the calculated SAR
of the low salinity source water was ~8, while the
moderate salinity source water was ~20. Amendment
with calcium to reduce the source water SAR toward the
end of the injection phase to ~6 also resulted in a minimal
improvement to the injection rate. Ideally, the calcium
amendment could have been increased slightly to ensure
a SAR less than that of the ambient groundwater. In
addition, injection stoppages resulted in more significant
reductions in permeability when the lowest salinity
source water was injected (21‒25/8/2013, Figure 4), than
for stoppages when source water EC was >200 μS/cm (5‒
6/9/2013, Figure 4). The importance of SAR was also
shown in the batch study where the lowest salinity source
water, with low SAR, was not identified as posing a clay
mobilisation risk.
Aquifer clogging due to interaction between low salinity
source water and clay minerals, namely montmorillonite
and kaolinite, within the Gubberamunda Sandstone
aquifer may have contributed to the loss in injection rate.
Swelling and non-swelling clays can be responsible for
permeability loss in sandstone aquifers (Mohan et al.,
1993; Mohan and Fogler, 1997). The mechanisms for
permeability reduction or clogging include detachment
from the solid surface and migration through porous
media where they can clog pore spaces (applicable to
non-swelling clays such as kaolinites and illites); swelling
and reduction in pore space (applicable to swelling clays
such as montmorillonite); and release of fines as a result
of swelling which can also migrate and clog pore spaces
(Figure 5) (Mohan et al., 1993). Swelling can be crystalline
(swelling clays such as smectite) and osmotic (Figure 6).
Crystalline swelling is caused by hydration of the
interlayer cation, while osmotic swelling is due to
expansion of the double layer, both of which are effects of
a decrease in electrolyte concentration (Mohan et al.,
1993).
Formation damage due to water sensitivity, or loss of
permeability due to the composition of the flowing
aqueous fluid, has received attention within the literature
from the petroleum industry (e.g. Mohan et al., 1993;
Mohan and Fogler, 1997), but less in relation to MAR (e.g.
Konikow et al., 2001). Previous laboratory investigations
used intact core material saturated with a single cation
and examined permeability change when a lower salinity
solution was passed through the porous media (Mohan et
al., 1993; Mohan and Fogler, 1997). Passing deionised
water through Na-saturated cores resulted in the greatest
permeability reduction as sodium montorillonite can
swell more than potassium or calcium montmorillonite
(Mohan et al., 1993).
Given, that there was some recovery in injection rate with
an increase in the source water salinity, it is likely that
swelling of smectitic clays (Figure 5 mechanism b), and
possibly swelling-induced migration (Figure 5 mechanism
c) may have contributed to the permeability reduction
during the injection trial. Clay swelling is a chemically
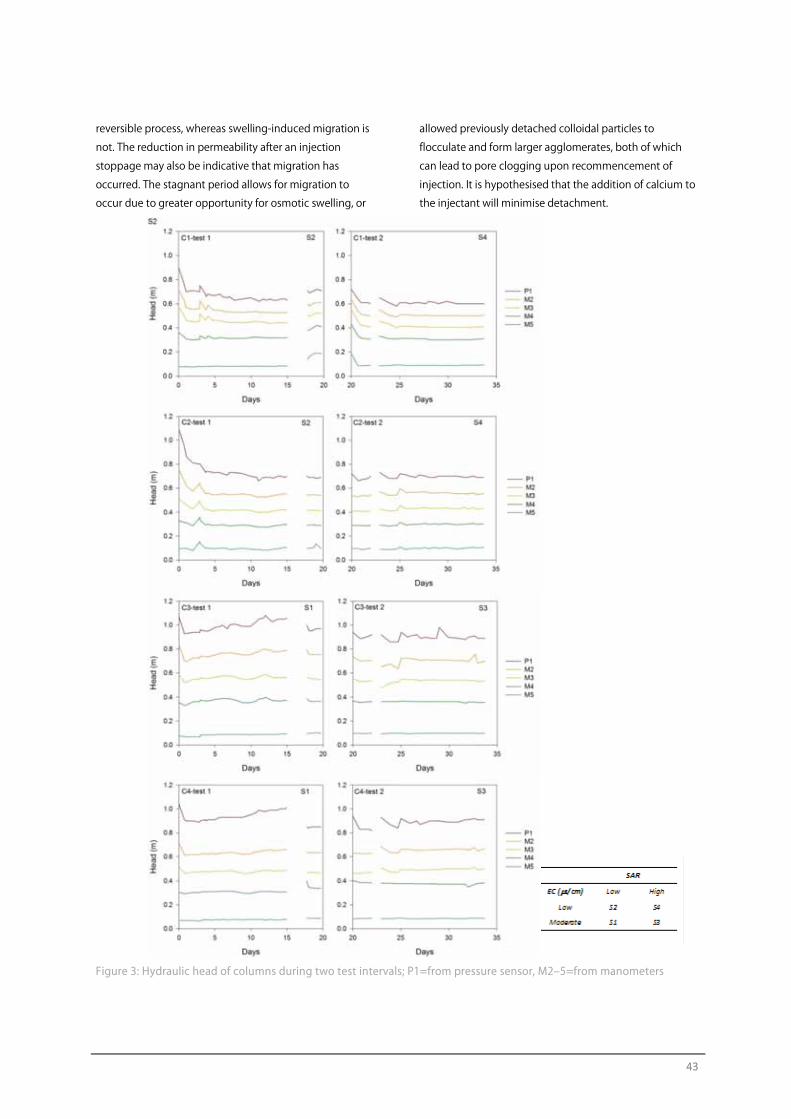
43
reversible process, whereas swelling-induced migration is
not. The reduction in permeability after an injection
stoppage may also be indicative that migration has
occurred. The stagnant period allows for migration to
occur due to greater opportunity for osmotic swelling, or
allowed previously detached colloidal particles to
flocculate and form larger agglomerates, both of which
can lead to pore clogging upon recommencement of
injection. It is hypothesised that the addition of calcium to
the injectant will minimise detachment.
Figure 3: Hydraulic head of columns during two test intervals; P1=from pressure sensor, M2‒5=from manometers
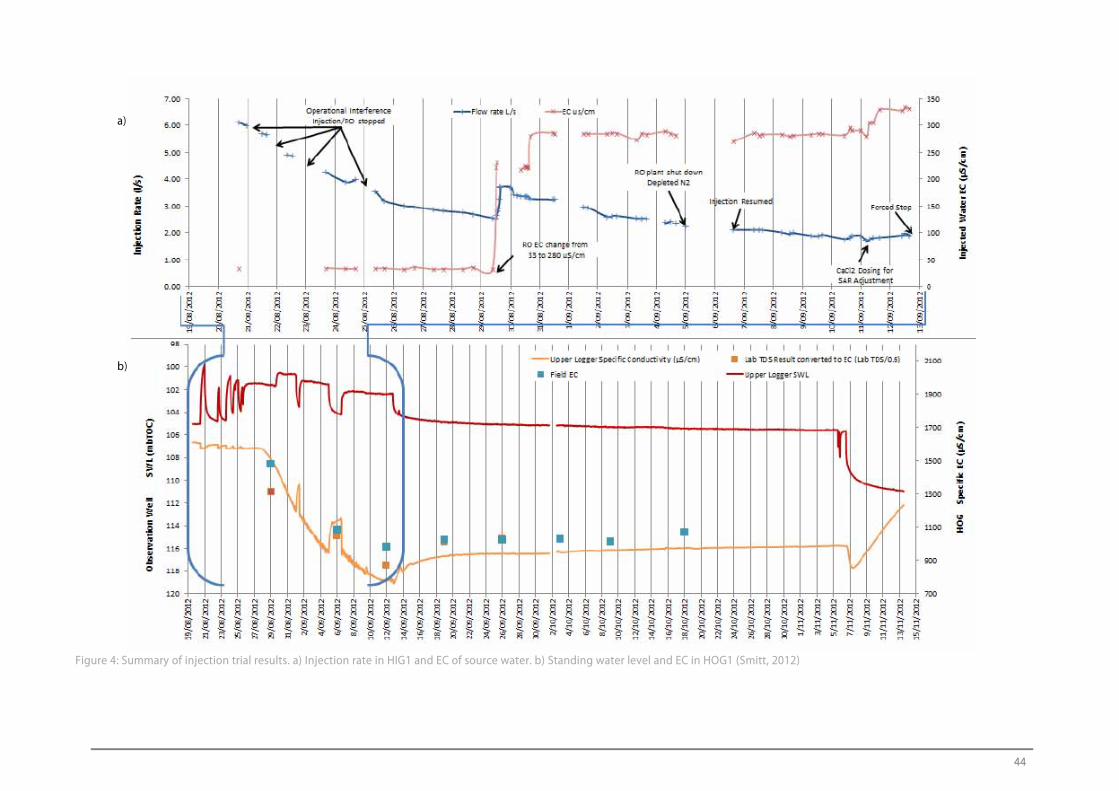
44
Figure 4: Summary of injection trial results. a) Injection rate in HIG1 and EC of source water. b) Standing water level and EC in HOG1 (Smitt, 2012)
a)
b)
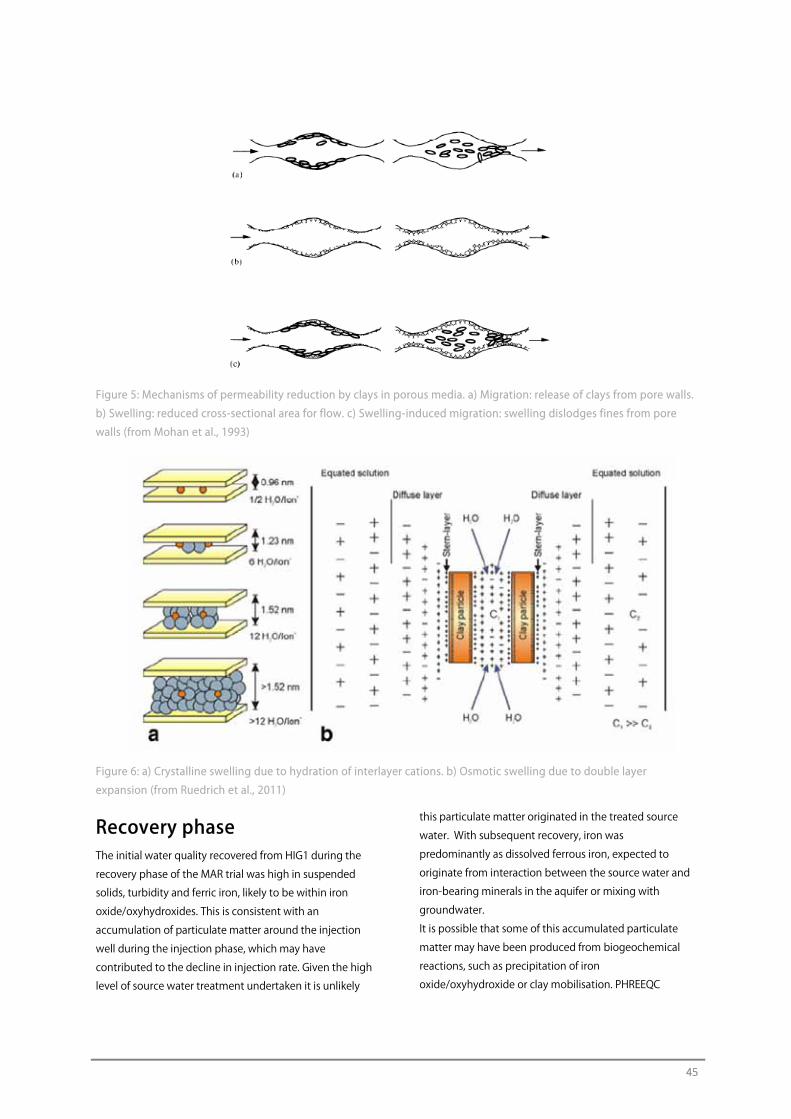
45
Figure 5: Mechanisms of permeability reduction by clays in porous media. a) Migration: release of clays from pore walls.
b) Swelling: reduced cross-sectional area for flow. c) Swelling-induced migration: swelling dislodges fines from pore
walls (from Mohan et al., 1993)
Figure 6: a) Crystalline swelling due to hydration of interlayer cations. b) Osmotic swelling due to double layer
expansion (from Ruedrich et al., 2011)
Recovery phase The initial water quality recovered from HIG1 during the
recovery phase of the MAR trial was high in suspended
solids, turbidity and ferric iron, likely to be within iron
oxide/oxyhydroxides. This is consistent with an
accumulation of particulate matter around the injection
well during the injection phase, which may have
contributed to the decline in injection rate. Given the high
level of source water treatment undertaken it is unlikely
this particulate matter originated in the treated source
water. With subsequent recovery, iron was
predominantly as dissolved ferrous iron, expected to
originate from interaction between the source water and
iron-bearing minerals in the aquifer or mixing with
groundwater.
It is possible that some of this accumulated particulate
matter may have been produced from biogeochemical
reactions, such as precipitation of iron
oxide/oxyhydroxide or clay mobilisation. PHREEQC
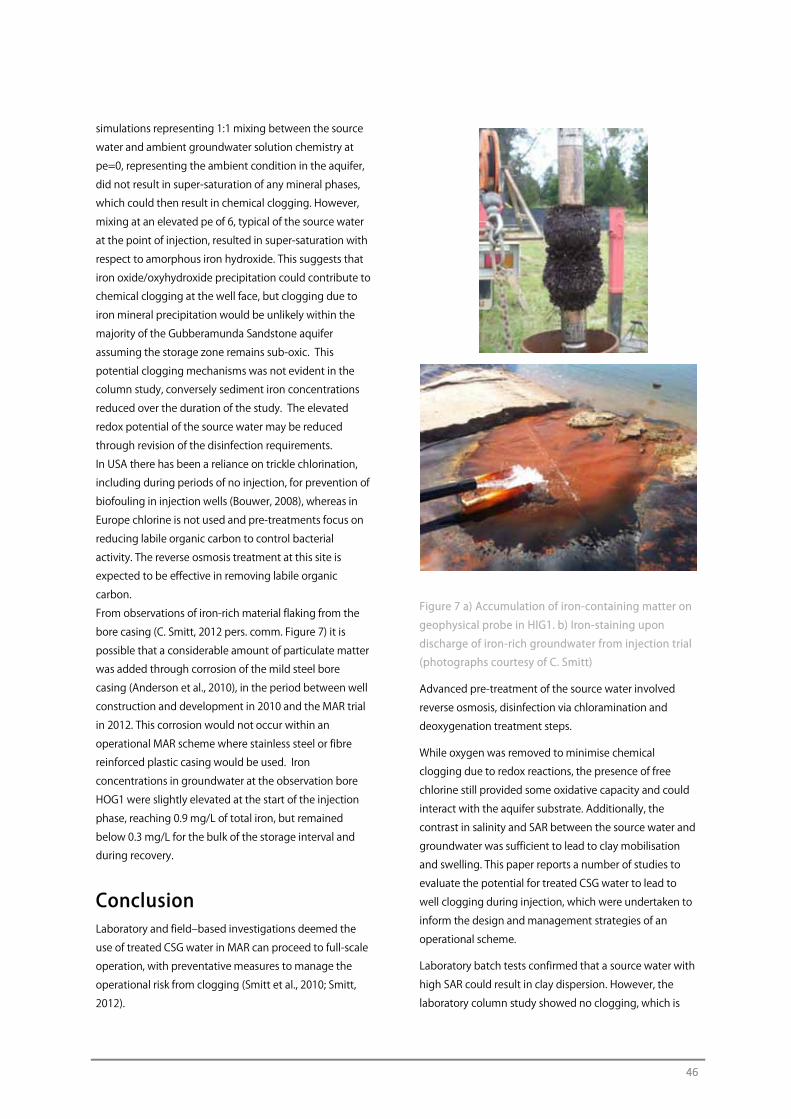
46
simulations representing 1:1 mixing between the source
water and ambient groundwater solution chemistry at
pe=0, representing the ambient condition in the aquifer,
did not result in super-saturation of any mineral phases,
which could then result in chemical clogging. However,
mixing at an elevated pe of 6, typical of the source water
at the point of injection, resulted in super-saturation with
respect to amorphous iron hydroxide. This suggests that
iron oxide/oxyhydroxide precipitation could contribute to
chemical clogging at the well face, but clogging due to
iron mineral precipitation would be unlikely within the
majority of the Gubberamunda Sandstone aquifer
assuming the storage zone remains sub-oxic. This
potential clogging mechanisms was not evident in the
column study, conversely sediment iron concentrations
reduced over the duration of the study. The elevated
redox potential of the source water may be reduced
through revision of the disinfection requirements.
In USA there has been a reliance on trickle chlorination,
including during periods of no injection, for prevention of
biofouling in injection wells (Bouwer, 2008), whereas in
Europe chlorine is not used and pre-treatments focus on
reducing labile organic carbon to control bacterial
activity. The reverse osmosis treatment at this site is
expected to be effective in removing labile organic
carbon.
From observations of iron-rich material flaking from the
bore casing (C. Smitt, 2012 pers. comm. Figure 7) it is
possible that a considerable amount of particulate matter
was added through corrosion of the mild steel bore
casing (Anderson et al., 2010), in the period between well
construction and development in 2010 and the MAR trial
in 2012. This corrosion would not occur within an
operational MAR scheme where stainless steel or fibre
reinforced plastic casing would be used. Iron
concentrations in groundwater at the observation bore
HOG1 were slightly elevated at the start of the injection
phase, reaching 0.9 mg/L of total iron, but remained
below 0.3 mg/L for the bulk of the storage interval and
during recovery.
Conclusion Laboratory and field‒based investigations deemed the
use of treated CSG water in MAR can proceed to full-scale
operation, with preventative measures to manage the
operational risk from clogging (Smitt et al., 2010; Smitt,
2012).
Figure 7 a) Accumulation of iron-containing matter on
geophysical probe in HIG1. b) Iron-staining upon
discharge of iron-rich groundwater from injection trial
(photographs courtesy of C. Smitt)
Advanced pre-treatment of the source water involved
reverse osmosis, disinfection via chloramination and
deoxygenation treatment steps.
While oxygen was removed to minimise chemical
clogging due to redox reactions, the presence of free
chlorine still provided some oxidative capacity and could
interact with the aquifer substrate. Additionally, the
contrast in salinity and SAR between the source water and
groundwater was sufficient to lead to clay mobilisation
and swelling. This paper reports a number of studies to
evaluate the potential for treated CSG water to lead to
well clogging during injection, which were undertaken to
inform the design and management strategies of an
operational scheme.
Laboratory batch tests confirmed that a source water with
high SAR could result in clay dispersion. However, the
laboratory column study showed no clogging, which is
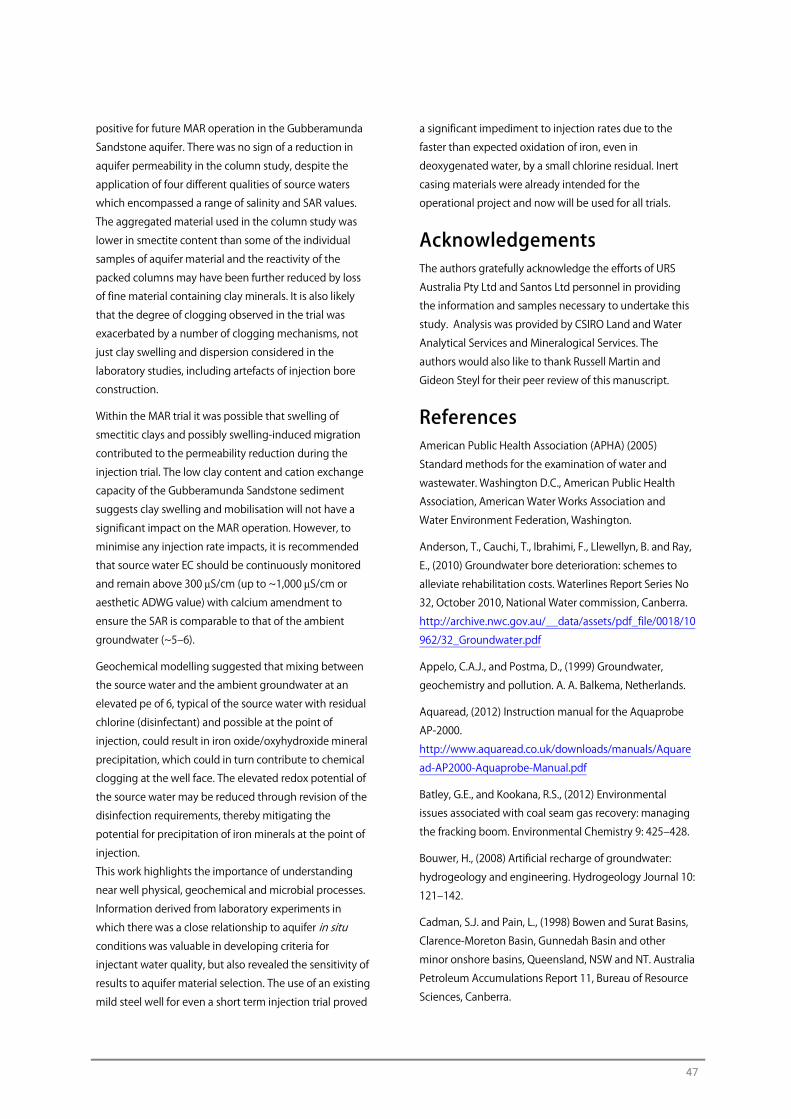
47
positive for future MAR operation in the Gubberamunda
Sandstone aquifer. There was no sign of a reduction in
aquifer permeability in the column study, despite the
application of four different qualities of source waters
which encompassed a range of salinity and SAR values.
The aggregated material used in the column study was
lower in smectite content than some of the individual
samples of aquifer material and the reactivity of the
packed columns may have been further reduced by loss
of fine material containing clay minerals. It is also likely
that the degree of clogging observed in the trial was
exacerbated by a number of clogging mechanisms, not
just clay swelling and dispersion considered in the
laboratory studies, including artefacts of injection bore
construction.
Within the MAR trial it was possible that swelling of
smectitic clays and possibly swelling-induced migration
contributed to the permeability reduction during the
injection trial. The low clay content and cation exchange
capacity of the Gubberamunda Sandstone sediment
suggests clay swelling and mobilisation will not have a
significant impact on the MAR operation. However, to
minimise any injection rate impacts, it is recommended
that source water EC should be continuously monitored
and remain above 300 μS/cm (up to ~1,000 μS/cm or
aesthetic ADWG value) with calcium amendment to
ensure the SAR is comparable to that of the ambient
groundwater (~5‒6).
Geochemical modelling suggested that mixing between
the source water and the ambient groundwater at an
elevated pe of 6, typical of the source water with residual
chlorine (disinfectant) and possible at the point of
injection, could result in iron oxide/oxyhydroxide mineral
precipitation, which could in turn contribute to chemical
clogging at the well face. The elevated redox potential of
the source water may be reduced through revision of the
disinfection requirements, thereby mitigating the
potential for precipitation of iron minerals at the point of
injection.
This work highlights the importance of understanding
near well physical, geochemical and microbial processes.
Information derived from laboratory experiments in
which there was a close relationship to aquifer in situ conditions was valuable in developing criteria for
injectant water quality, but also revealed the sensitivity of
results to aquifer material selection. The use of an existing
mild steel well for even a short term injection trial proved
a significant impediment to injection rates due to the
faster than expected oxidation of iron, even in
deoxygenated water, by a small chlorine residual. Inert
casing materials were already intended for the
operational project and now will be used for all trials.
Acknowledgements The authors gratefully acknowledge the efforts of URS
Australia Pty Ltd and Santos Ltd personnel in providing
the information and samples necessary to undertake this
study. Analysis was provided by CSIRO Land and Water
Analytical Services and Mineralogical Services. The
authors would also like to thank Russell Martin and
Gideon Steyl for their peer review of this manuscript.
References American Public Health Association (APHA) (2005)
Standard methods for the examination of water and
wastewater. Washington D.C., American Public Health
Association, American Water Works Association and
Water Environment Federation, Washington.
Anderson, T., Cauchi, T., Ibrahimi, F., Llewellyn, B. and Ray,
E., (2010) Groundwater bore deterioration: schemes to
alleviate rehabilitation costs. Waterlines Report Series No
32, October 2010, National Water commission, Canberra.
http://archive.nwc.gov.au/__data/assets/pdf_file/0018/10
962/32_Groundwater.pdf
Appelo, C.A.J., and Postma, D., (1999) Groundwater,
geochemistry and pollution. A. A. Balkema, Netherlands.
Aquaread, (2012) Instruction manual for the Aquaprobe
AP-2000.
http://www.aquaread.co.uk/downloads/manuals/Aquare
ad-AP2000-Aquaprobe-Manual.pdf
Batley, G.E., and Kookana, R.S., (2012) Environmental
issues associated with coal seam gas recovery: managing
the fracking boom. Environmental Chemistry 9: 425‒428.
Bouwer, H., (2008) Artificial recharge of groundwater:
hydrogeology and engineering. Hydrogeology Journal 10:
121‒142.
Cadman, S.J. and Pain, L., (1998) Bowen and Surat Basins,
Clarence-Moreton Basin, Gunnedah Basin and other
minor onshore basins, Queensland, NSW and NT. Australia
Petroleum Accumulations Report 11, Bureau of Resource
Sciences, Canberra.

48
Freij-Ayoub, R., (2012) Opportunities and challenges to
coal bed methane production in Australia. Journal of
Petroleum Science and Engineering, 88-89: 1‒4.
Geoscience Australia, (2008) Australia’s Identified Mineral
Resources 2008. Geoscience Australia, Canberra.
GHD, (2004) Roma water supply system planning study
for Roma Town Council. GHD, Brisbane.
Konikow, L.F., August, L.L. and Voss, C.I., (2001) Effects of
clay dispersion on aquifer storage and recovery in coastal
aquifers, Transport in Porous Media 43: 45‒64.
McKenzie, N., Coughlan, K., and Cresswell, H., (2002) Soil
physical measurement and interpretation for land
evaluation, CSIRO, 390pp.
Le, H., Samadi, Y., Innell, W., and Hochman, P., (2012)
Relocatable RO plant treats coal seam gas water. AWA
Journal Water, March: 56‒59.
Mohan, K.K., and Fogler, H.S., (1997) Colloidally induced
smectitic fines migration: existence of microquakes, Fluid
Mechanics and Transport Phenomena 43(3): 565‒578.
Mohan, K.K., Vaidya, N., Reed, M.G., and Fogler, H.S., (1993)
Water sensitivity of sandstones containing swelling and
non-swelling clays, Colloids and Surfaces A:
Physiochemical and Engineering Aspects 73: 237‒254.
NRMMC-EPHC-NHMRC, (2009) Australian Guidelines for
Water Recycling: Managed Aquifer Recharge, National
Resource Management Ministerial Council, Environment
Protection and Heritage Council and National Health and
Medical Research Council, Canberra.
http://www.ephc.gov.au/sites/default/files/WQ_AGWR_G
L__Managed_Aquifer_Recharge_Final_200907.pdf.
NHMRC‒NRMMC, (2011) Australian Drinking Water
Guidelines, National Health and Medical Research Council
and National Resource Management Ministerial Council,
Canberra.
http://www.nhmrc.gov.au/_files_nhmrc/publications/atta
chments/eh52_aust_drinking_water_guidelines_update_
120710_0.pdf.
Orem, W.H., Tatu, C.A., Lerch, H.E., Rice, C.A., Bartos, T.T.,
Bates, A.L., Tewalt, S., and Corum, M.D., (2007) Organic
compounds in produced waters from coalbed natural gas
wells in the Powder River Basin, Wyoming, USA. Applied
Geochemistry 22: 2240‒2256.
Parkhurst, D.L., and Appelo, C.A.J., (1999) User's guide to
PHREEQC (version 2) A computer program for speciation,
reaction path, advective transport, and inverse
geochemical calculations. Report 99-4259, USGS Water
Resources Investigation.
Rice, C.A., Ellis, M.S., and Bullock, J.H., Jr. (2000) Water co-
produced with coalbed methane in the Powder River
Basin, Wyoming: preliminary compositional data. USGS
Open-File Report 00-372, USGS, Denver, Colorado.
Ruedrich, J., Bartelsen, T., Dohrmann, R., and Siegesmund,
S., (2011) Moisture expansion as a deterioration factor for
sandstone used in buildings, Environmental Earth Science
63: 1545‒1564.
Santos, (2012) Santos GLNG project Hermitage Dam MAR
trial injection management plan, document no 020-
GLNG-4-1.3-0141, Santos, Brisbane.
Santos-Petronas, (2009) GLNG associated water
management plan, Santos-Petronas, document no. 3301-
GLNG-3-1.3-0056-DOC.
Smitt, C., (2012) Roma MAR Project Update
Report,commercial-in-confidence report prepared for
Santos GLNG. URS, Melbourne.
Smitt, C.M., Vanderzalm, J.L., Dillon, P.J., Barry, K., Page,
D.W., and Ife, D., (2010) Santos GLNG ‒ Roma MAR study:
Report and pre-trial risk assessment, commercial-in-
confidence report prepared for Santos GLNG. URS,
Melbourne.
URS, (2009) Santos GLNG ‒ Associated water injection
study, report prepared for Santos. URS, Melbourne.
Vanderzalm, J.L., Barry, K.E., and Levett, K.J., (2010) Santos
GLNG ‒ Roma MAR study phase 1‒4 deliverables:
Background data review, core analysis, laboratory batch
studies and risk assessment, commercial-in-confidence
report to URS. CSIRO: Water for a Healthy Country
National Research Flagship, Australia.
Vanderzalm, J.L., Barry, K.E. and Dillon, P.J., (2013) Santos
GLNG ‒ Roma MAR study geochemical evaluation and
pre-commissioning residual risk assessment: Phase 4c-6
deliverables, commercial-in-confidence report to URS.
CSIRO: Water for a Healthy Country National Research
Flagship, Australia.

49
Contact Details J. Vanderzalm, K. Barry and P. Dillon
CSIRO Land and Water
Water for a Healthy Country Research Flagship,
Private Bag No 2, Glen Osmond, SA, 5064, Australia
C. Smitt
EHS Support
907/57 Bay St, Port Melbourne, VIC, 3207, Australia,
previously URS Australia Pty Ltd, VIC.
URS Australia Pty Ltd
Level 17, 240 Queen Street, Brisbane, QLD, 4000, Australia
S. Davidge
Santos Ltd
GPO Box 1010, Brisbane, QLD, 4001, Australia
H. Seear
URS Australia Pty Ltd
Level 17, 240 Queen Street, Brisbane, QLD, 4000, Australia
D. Ife
URS Australia Pty Ltd
Level 6, 1 Southbank Boulevard, Southbank, VIC, 3006,
Australia
50
Porous Media Filter Test in Order to Prevent Well Clogging during Groundwater Reinjection due to Ferrous and Ferric Mineral Precipitation R.U. Ruemenapp, C. Hartwig, S.M. Akhtar and M. Nishigaki
Okayama University Department of Environmental and Civil Design, Okayama, Okayama-Ken, Japan
Abstract Groundwater that is directly used for geothermal heat transport in an open system will be re-injected after its
usage into the aquifer it was taken from. Aqueous mineral species can precipitate in the well or aquifer when
mixed with oxygen during the injection. Cheap and commonly available filter materials can improve the
feasibility of an open geothermal heat exchanger by adsorbing the aqueous bi- and tri-valent iron and
manganese ions under anaerobic conditions. Often used Ferrolite sand filled filter are effective, but expensive.
In order to prevent mineral precipitation in the heat exchanger system as well as in the injection well and
aquifer, three different filter materials were analysed for their adsorption potential of aqueous bi- and tri-
valent iron ions in laboratory experiments. Columns (V= 2.4 (dm3)) were filled each with wooden charcoal (n=
0.59‒0.85, k= 0.103 (cm s-1)), Yamasuna sand (n= 0.38‒0.40, k= 1.0‒0.01 (cm s-1) ), or volcanic ash (n= 0.907, k=
4.99 * 10-2 (cm s-1)). The filter were supplied under constant pressure head with ambient groundwater from a
nearby well with a background concentration of dissolved iron of CFe2+= 7.9 (mg L-1) (± 0.61 (mg L-1). Water
samples were taken every 48 hours, in order to analysis aqueous bi- and tri-valent iron ion concentration in the
solution by atomic absorption spectro-photometry (AAS). Additionally electrical conductivity was measured at
each sampling port, inlet and outlet of the columns and at the well. Furthermore, pH, temperature, and
dissolved oxygen concentration were monitored. In order to estimate the influence of the fluid velocity,
wooden charcoal filter were analysed for their dissolved iron adsorption capacity under various constant fluid
velocities (1.02 (cm min-1), 0.504 (cm min-1), 0.252 (cm min-1)). In an additional field test, with wooden charcoal
and layers of gravel, middle and fine sand at the inlet and the outlet, filled pilot filter (V= 150.9 (dm³)) was
tested under realistic operational conditions with an average flow rate of 10 (L min-1). The treated water was
then used to lower the temperature in a room of 18.9 (m²) (H= 2.55 (m)) and was re-injected into the aquifer.
All three filter materials were capable to adsorb aqueous ferric and ferrous iron ion below the detection limit of
0.1 (mg L-1) with an adsorption capacity of 3.5 (g (kg charcoal)-1). The break-through curves for each test
column and material, as well as temperature, pH, electrical conductivity, changes in hydraulic conductivity,
and dissolved oxygen levels are presented. The field test focused on the practicability of the wooden charcoal
filter as adsorbent. Suggestions are made for installation and maintenance of the filter under field conditions.
1 Introduction This work was accomplished as part of a national project,
in order to estimate the potential of groundwater to be
used as heating and cooling medium for domestic usage
in Japan. In comparison to a closed water cycle system,
that is cooled or heated from the surrounding
groundwater in the well, an open-loop system uses
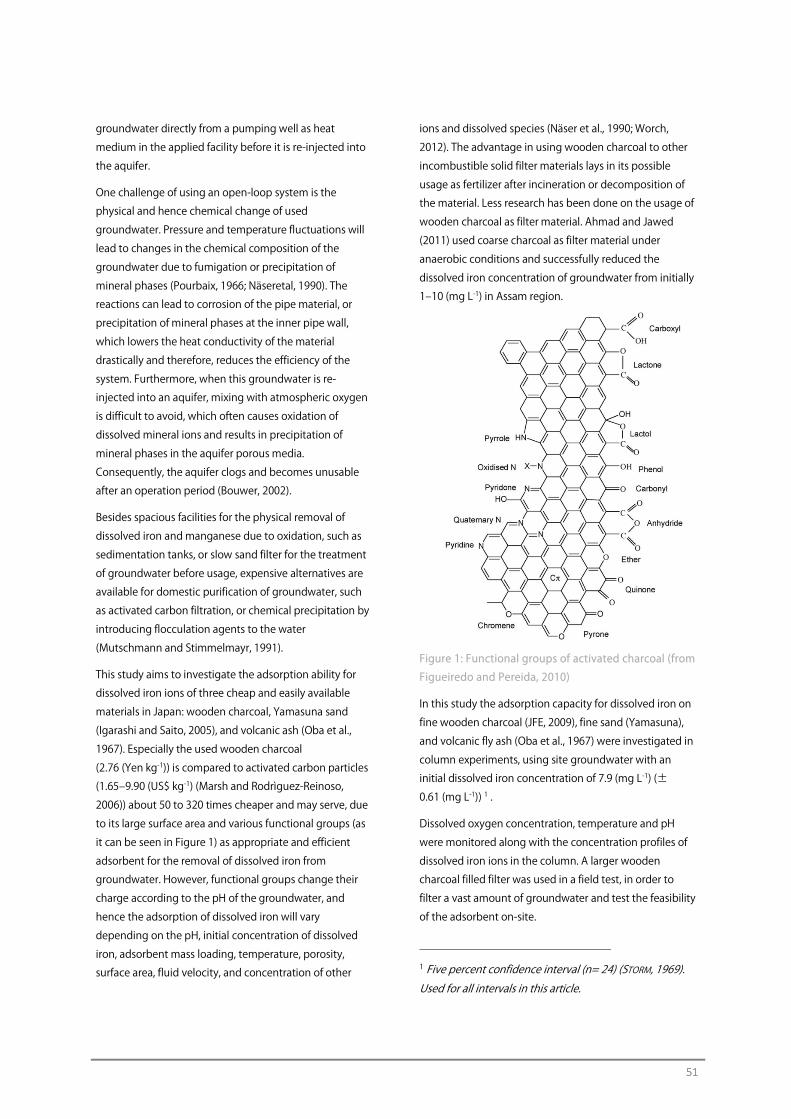
51
groundwater directly from a pumping well as heat
medium in the applied facility before it is re-injected into
the aquifer.
One challenge of using an open-loop system is the
physical and hence chemical change of used
groundwater. Pressure and temperature fluctuations will
lead to changes in the chemical composition of the
groundwater due to fumigation or precipitation of
mineral phases (Pourbaix, 1966; Näseretal, 1990). The
reactions can lead to corrosion of the pipe material, or
precipitation of mineral phases at the inner pipe wall,
which lowers the heat conductivity of the material
drastically and therefore, reduces the efficiency of the
system. Furthermore, when this groundwater is re-
injected into an aquifer, mixing with atmospheric oxygen
is difficult to avoid, which often causes oxidation of
dissolved mineral ions and results in precipitation of
mineral phases in the aquifer porous media.
Consequently, the aquifer clogs and becomes unusable
after an operation period (Bouwer, 2002).
Besides spacious facilities for the physical removal of
dissolved iron and manganese due to oxidation, such as
sedimentation tanks, or slow sand filter for the treatment
of groundwater before usage, expensive alternatives are
available for domestic purification of groundwater, such
as activated carbon filtration, or chemical precipitation by
introducing flocculation agents to the water
(Mutschmann and Stimmelmayr, 1991).
This study aims to investigate the adsorption ability for
dissolved iron ions of three cheap and easily available
materials in Japan: wooden charcoal, Yamasuna sand
(Igarashi and Saito, 2005), and volcanic ash (Oba et al.,
1967). Especially the used wooden charcoal
(2.76 (Yen kg-1)) is compared to activated carbon particles
(1.65‒9.90 (US$ kg-1) (Marsh and Rodrìguez-Reinoso,
2006)) about 50 to 320 times cheaper and may serve, due
to its large surface area and various functional groups (as
it can be seen in Figure 1) as appropriate and efficient
adsorbent for the removal of dissolved iron from
groundwater. However, functional groups change their
charge according to the pH of the groundwater, and
hence the adsorption of dissolved iron will vary
depending on the pH, initial concentration of dissolved
iron, adsorbent mass loading, temperature, porosity,
surface area, fluid velocity, and concentration of other
ions and dissolved species (Näser et al., 1990; Worch,
2012). The advantage in using wooden charcoal to other
incombustible solid filter materials lays in its possible
usage as fertilizer after incineration or decomposition of
the material. Less research has been done on the usage of
wooden charcoal as filter material. Ahmad and Jawed
(2011) used coarse charcoal as filter material under
anaerobic conditions and successfully reduced the
dissolved iron concentration of groundwater from initially
1‒10 (mg L-1) in Assam region.
Figure 1: Functional groups of activated charcoal (from
Figueiredo and Pereida, 2010)
In this study the adsorption capacity for dissolved iron on
fine wooden charcoal (JFE, 2009), fine sand (Yamasuna),
and volcanic fly ash (Oba et al., 1967) were investigated in
column experiments, using site groundwater with an
initial dissolved iron concentration of 7.9 (mg L-1) (±
0.61 (mg L-1)) 1 .
Dissolved oxygen concentration, temperature and pH
were monitored along with the concentration profiles of
dissolved iron ions in the column. A larger wooden
charcoal filled filter was used in a field test, in order to
filter a vast amount of groundwater and test the feasibility
of the adsorbent on-site.
1 Five percent confidence interval (n= 24) (STORM, 1969).
Used for all intervals in this article.
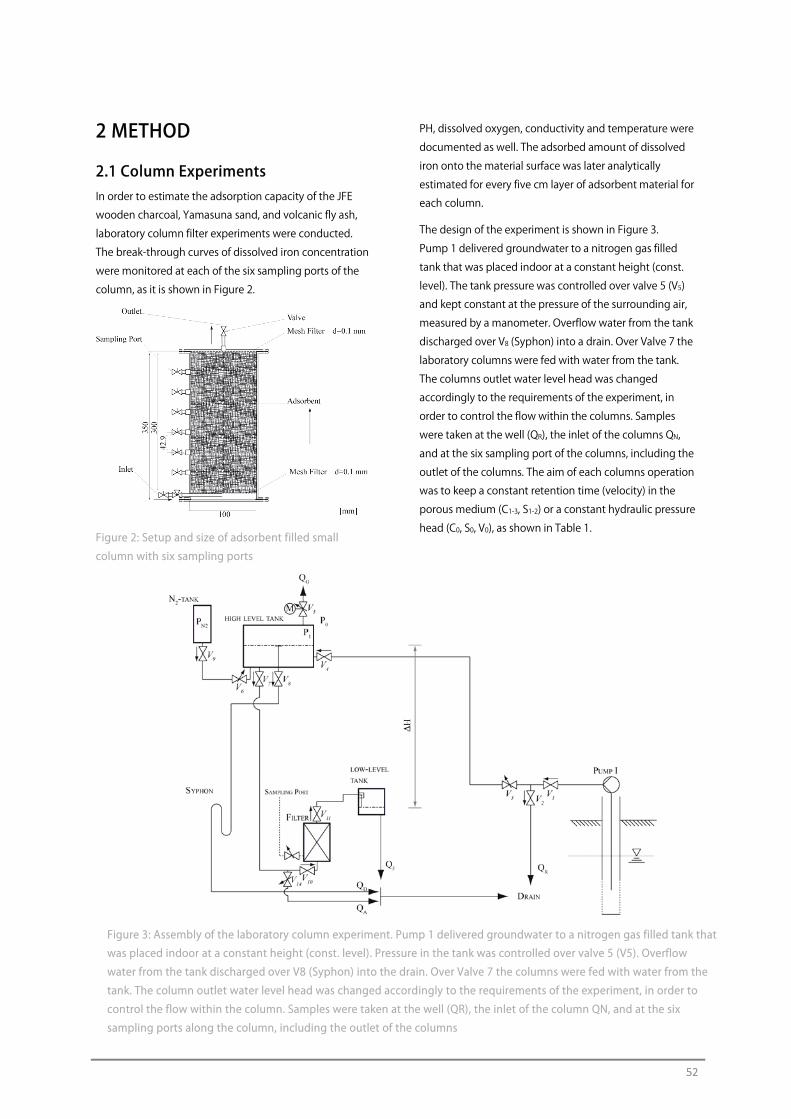
52
Figure 3: Assembly of the laboratory column experiment. Pump 1 delivered groundwater to a nitrogen gas filled tank that
was placed indoor at a constant height (const. level). Pressure in the tank was controlled over valve 5 (V5). Overflow
water from the tank discharged over V8 (Syphon) into the drain. Over Valve 7 the columns were fed with water from the
tank. The column outlet water level head was changed accordingly to the requirements of the experiment, in order to
control the flow within the column. Samples were taken at the well (QR), the inlet of the column QN, and at the six
sampling ports along the column, including the outlet of the columns
2 METHOD
2.1 Column Experiments In order to estimate the adsorption capacity of the JFE
wooden charcoal, Yamasuna sand, and volcanic fly ash,
laboratory column filter experiments were conducted.
The break-through curves of dissolved iron concentration
were monitored at each of the six sampling ports of the
column, as it is shown in Figure 2.
Figure 2: Setup and size of adsorbent filled small
column with six sampling ports
PH, dissolved oxygen, conductivity and temperature were
documented as well. The adsorbed amount of dissolved
iron onto the material surface was later analytically
estimated for every five cm layer of adsorbent material for
each column.
The design of the experiment is shown in Figure 3.
Pump 1 delivered groundwater to a nitrogen gas filled
tank that was placed indoor at a constant height (const.
level). The tank pressure was controlled over valve 5 (V5)
and kept constant at the pressure of the surrounding air,
measured by a manometer. Overflow water from the tank
discharged over V8 (Syphon) into a drain. Over Valve 7 the
laboratory columns were fed with water from the tank.
The columns outlet water level head was changed
accordingly to the requirements of the experiment, in
order to control the flow within the columns. Samples
were taken at the well (QR), the inlet of the columns QN,
and at the six sampling port of the columns, including the
outlet of the columns. The aim of each columns operation
was to keep a constant retention time (velocity) in the
porous medium (C1-3, S1-2) or a constant hydraulic pressure
head (C0, S0, V0), as shown in Table 1.
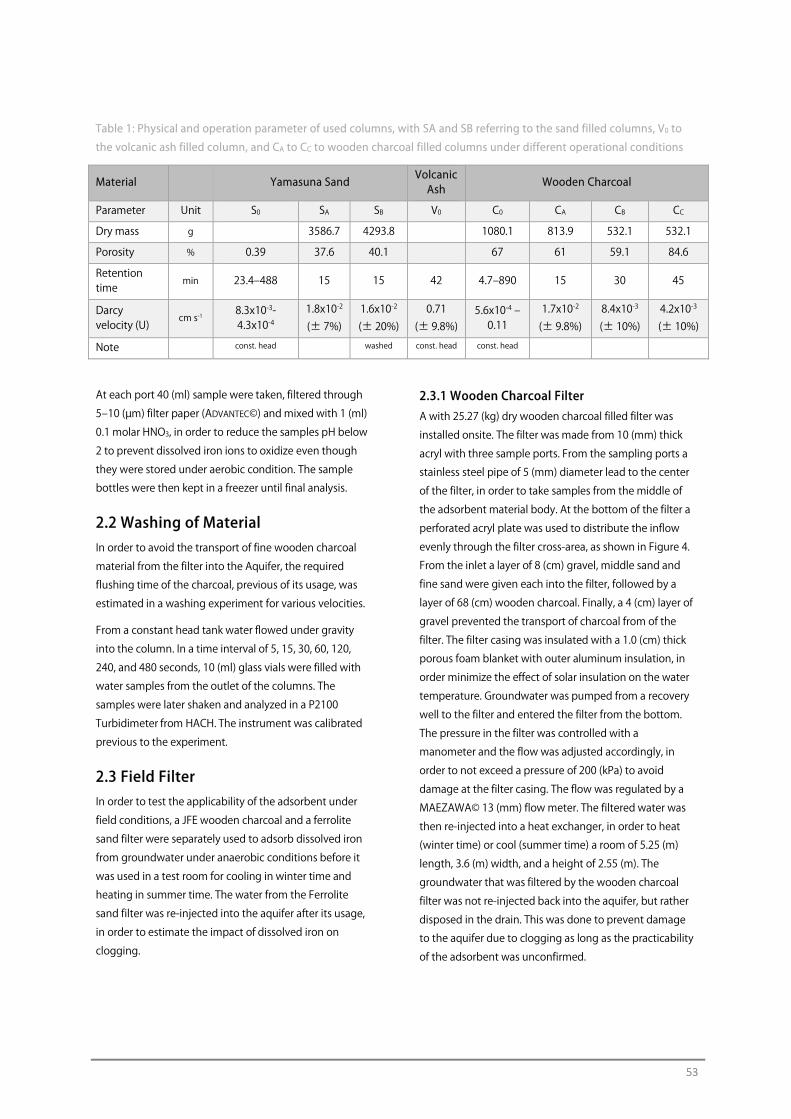
53
Table 1: Physical and operation parameter of used columns, with SA and SB referring to the sand filled columns, V0 to
the volcanic ash filled column, and CA to CC to wooden charcoal filled columns under different operational conditions
Material Yamasuna Sand Volcanic
Ash Wooden Charcoal
Parameter Unit S0 SA SB V0 C0 CA CB CC
Dry mass g 3586.7 4293.8 1080.1 813.9 532.1 532.1
Porosity % 0.39 37.6 40.1 67 61 59.1 84.6
Retention time
min 23.4‒488 15 15 42 4.7‒890 15 30 45
Darcy velocity (U)
cm s-1 8.3x10⁻³-4.3x10⁻⁴
1.8x10⁻²
(± 7%) 1.6x10⁻²
(± 20%) 0.71
(± 9.8%) 5.6x10⁻⁴ ‒
0.11 1.7x10⁻² (± 9.8%)
8.4x10⁻³ (± 10%)
4.2x10⁻³ (± 10%)
Note const. head washed const. head const. head
At each port 40 (ml) sample were taken, filtered through
5‒10 (µm) filter paper (ADVANTEC©) and mixed with 1 (ml)
0.1 molar HNO3, in order to reduce the samples pH below
2 to prevent dissolved iron ions to oxidize even though
they were stored under aerobic condition. The sample
bottles were then kept in a freezer until final analysis.
2.2 Washing of Material In order to avoid the transport of fine wooden charcoal
material from the filter into the Aquifer, the required
flushing time of the charcoal, previous of its usage, was
estimated in a washing experiment for various velocities.
From a constant head tank water flowed under gravity
into the column. In a time interval of 5, 15, 30, 60, 120,
240, and 480 seconds, 10 (ml) glass vials were filled with
water samples from the outlet of the columns. The
samples were later shaken and analyzed in a P2100
Turbidimeter from HACH. The instrument was calibrated
previous to the experiment.
2.3 Field Filter In order to test the applicability of the adsorbent under
field conditions, a JFE wooden charcoal and a ferrolite
sand filter were separately used to adsorb dissolved iron
from groundwater under anaerobic conditions before it
was used in a test room for cooling in winter time and
heating in summer time. The water from the Ferrolite
sand filter was re-injected into the aquifer after its usage,
in order to estimate the impact of dissolved iron on
clogging.
2.3.1 Wooden Charcoal Filter A with 25.27 (kg) dry wooden charcoal filled filter was
installed onsite. The filter was made from 10 (mm) thick
acryl with three sample ports. From the sampling ports a
stainless steel pipe of 5 (mm) diameter lead to the center
of the filter, in order to take samples from the middle of
the adsorbent material body. At the bottom of the filter a
perforated acryl plate was used to distribute the inflow
evenly through the filter cross-area, as shown in Figure 4.
From the inlet a layer of 8 (cm) gravel, middle sand and
fine sand were given each into the filter, followed by a
layer of 68 (cm) wooden charcoal. Finally, a 4 (cm) layer of
gravel prevented the transport of charcoal from of the
filter. The filter casing was insulated with a 1.0 (cm) thick
porous foam blanket with outer aluminum insulation, in
order minimize the effect of solar insulation on the water
temperature. Groundwater was pumped from a recovery
well to the filter and entered the filter from the bottom.
The pressure in the filter was controlled with a
manometer and the flow was adjusted accordingly, in
order to not exceed a pressure of 200 (kPa) to avoid
damage at the filter casing. The flow was regulated by a
MAEZAWA© 13 (mm) flow meter. The filtered water was
then re-injected into a heat exchanger, in order to heat
(winter time) or cool (summer time) a room of 5.25 (m)
length, 3.6 (m) width, and a height of 2.55 (m). The
groundwater that was filtered by the wooden charcoal
filter was not re-injected back into the aquifer, but rather
disposed in the drain. This was done to prevent damage
to the aquifer due to clogging as long as the practicability
of the adsorbent was unconfirmed.
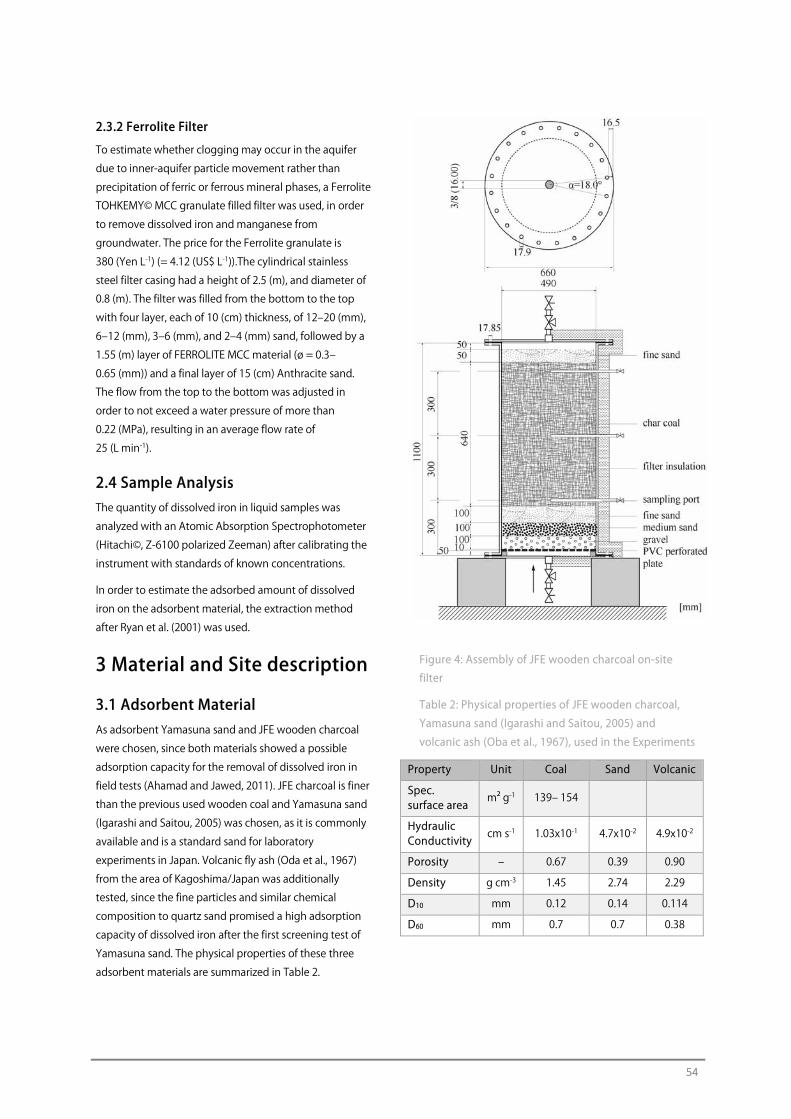
54
2.3.2 Ferrolite Filter
To estimate whether clogging may occur in the aquifer
due to inner-aquifer particle movement rather than
precipitation of ferric or ferrous mineral phases, a Ferrolite
TOHKEMY© MCC granulate filled filter was used, in order
to remove dissolved iron and manganese from
groundwater. The price for the Ferrolite granulate is
380 (Yen L-1) (= 4.12 (US$ L-1)).The cylindrical stainless
steel filter casing had a height of 2.5 (m), and diameter of
0.8 (m). The filter was filled from the bottom to the top
with four layer, each of 10 (cm) thickness, of 12‒20 (mm),
6‒12 (mm), 3‒6 (mm), and 2‒4 (mm) sand, followed by a
1.55 (m) layer of FERROLITE MCC material (ø = 0.3‒
0.65 (mm)) and a final layer of 15 (cm) Anthracite sand.
The flow from the top to the bottom was adjusted in
order to not exceed a water pressure of more than
0.22 (MPa), resulting in an average flow rate of
25 (L min-1).
2.4 Sample Analysis The quantity of dissolved iron in liquid samples was
analyzed with an Atomic Absorption Spectrophotometer
(Hitachi©, Z-6100 polarized Zeeman) after calibrating the
instrument with standards of known concentrations.
In order to estimate the adsorbed amount of dissolved
iron on the adsorbent material, the extraction method
after Ryan et al. (2001) was used.
3 Material and Site description
3.1 Adsorbent Material As adsorbent Yamasuna sand and JFE wooden charcoal
were chosen, since both materials showed a possible
adsorption capacity for the removal of dissolved iron in
field tests (Ahamad and Jawed, 2011). JFE charcoal is finer
than the previous used wooden coal and Yamasuna sand
(Igarashi and Saitou, 2005) was chosen, as it is commonly
available and is a standard sand for laboratory
experiments in Japan. Volcanic fly ash (Oda et al., 1967)
from the area of Kagoshima/Japan was additionally
tested, since the fine particles and similar chemical
composition to quartz sand promised a high adsorption
capacity of dissolved iron after the first screening test of
Yamasuna sand. The physical properties of these three
adsorbent materials are summarized in Table 2.
Figure 4: Assembly of JFE wooden charcoal on-site
filter
Table 2: Physical properties of JFE wooden charcoal,
Yamasuna sand (Igarashi and Saitou, 2005) and
volcanic ash (Oba et al., 1967), used in the Experiments
Property Unit Coal Sand Volcanic
Spec. surface area
m² g-1 139‒ 154
Hydraulic Conductivity
cm s-1 1.03x10⁻¹ 4.7x10⁻² 4.9x10⁻²
Porosity ‒ 0.67 0.39 0.90
Density g cm-3 1.45 2.74 2.29
D10 mm 0.12 0.14 0.114
D60 mm 0.7 0.7 0.38
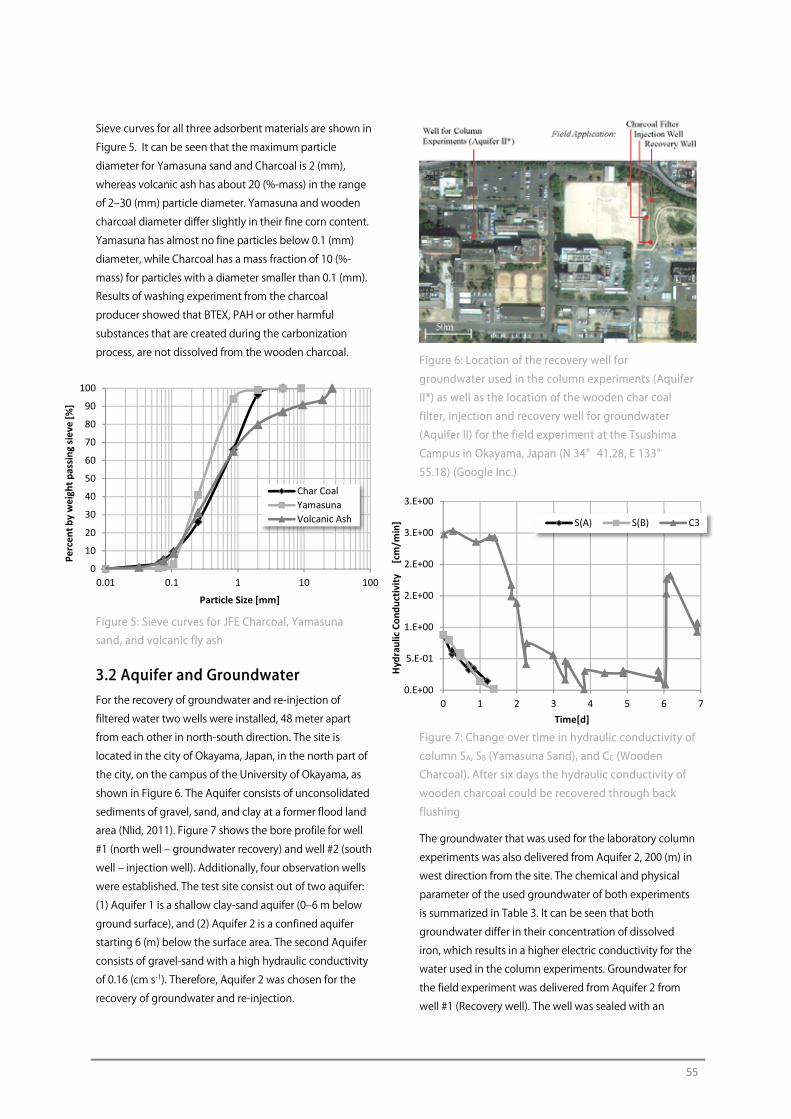
55
Sieve curves for all three adsorbent materials are shown in
Figure 5. It can be seen that the maximum particle
diameter for Yamasuna sand and Charcoal is 2 (mm),
whereas volcanic ash has about 20 (%-mass) in the range
of 2‒30 (mm) particle diameter. Yamasuna and wooden
charcoal diameter differ slightly in their fine corn content.
Yamasuna has almost no fine particles below 0.1 (mm)
diameter, while Charcoal has a mass fraction of 10 (%-
mass) for particles with a diameter smaller than 0.1 (mm).
Results of washing experiment from the charcoal
producer showed that BTEX, PAH or other harmful
substances that are created during the carbonization
process, are not dissolved from the wooden charcoal.
Figure 5: Sieve curves for JFE Charcoal, Yamasuna
sand, and volcanic fly ash
3.2 Aquifer and Groundwater For the recovery of groundwater and re-injection of
filtered water two wells were installed, 48 meter apart
from each other in north-south direction. The site is
located in the city of Okayama, Japan, in the north part of
the city, on the campus of the University of Okayama, as
shown in Figure 6. The Aquifer consists of unconsolidated
sediments of gravel, sand, and clay at a former flood land
area (Nlid, 2011). Figure 7 shows the bore profile for well
#1 (north well ‒ groundwater recovery) and well #2 (south
well ‒ injection well). Additionally, four observation wells
were established. The test site consist out of two aquifer:
(1) Aquifer 1 is a shallow clay-sand aquifer (0‒6 m below
ground surface), and (2) Aquifer 2 is a confined aquifer
starting 6 (m) below the surface area. The second Aquifer
consists of gravel-sand with a high hydraulic conductivity
of 0.16 (cm s-1). Therefore, Aquifer 2 was chosen for the
recovery of groundwater and re-injection.
Figure 6: Location of the recovery well for
groundwater used in the column experiments (Aquifer
II*) as well as the location of the wooden char coal
filter, injection and recovery well for groundwater
(Aquifer II) for the field experiment at the Tsushima
Campus in Okayama, Japan (N 34°41.28, E 133°
55.18) (Google Inc.)
Figure 7: Change over time in hydraulic conductivity of
column SA, SB (Yamasuna Sand), and CC (Wooden
Charcoal). After six days the hydraulic conductivity of
wooden charcoal could be recovered through back
flushing
The groundwater that was used for the laboratory column
experiments was also delivered from Aquifer 2, 200 (m) in
west direction from the site. The chemical and physical
parameter of the used groundwater of both experiments
is summarized in Table 3. It can be seen that both
groundwater differ in their concentration of dissolved
iron, which results in a higher electric conductivity for the
water used in the column experiments. Groundwater for
the field experiment was delivered from Aquifer 2 from
well #1 (Recovery well). The well was sealed with an
0
10
20
30
40
50
60
70
80
90
100
0.01 0.1 1 10 100
Perc
ent b
y w
eigh
t pas
sing
siev
e [%
]
Particle Size [mm]
Char CoalYamasunaVolcanic Ash
0.E+00
5.E-01
1.E+00
2.E+00
2.E+00
3.E+00
3.E+00
0 1 2 3 4 5 6 7
Hydr
aulic
Con
duct
ivity
[cm
/min
]
Time[d]
S(A) S(B) C3
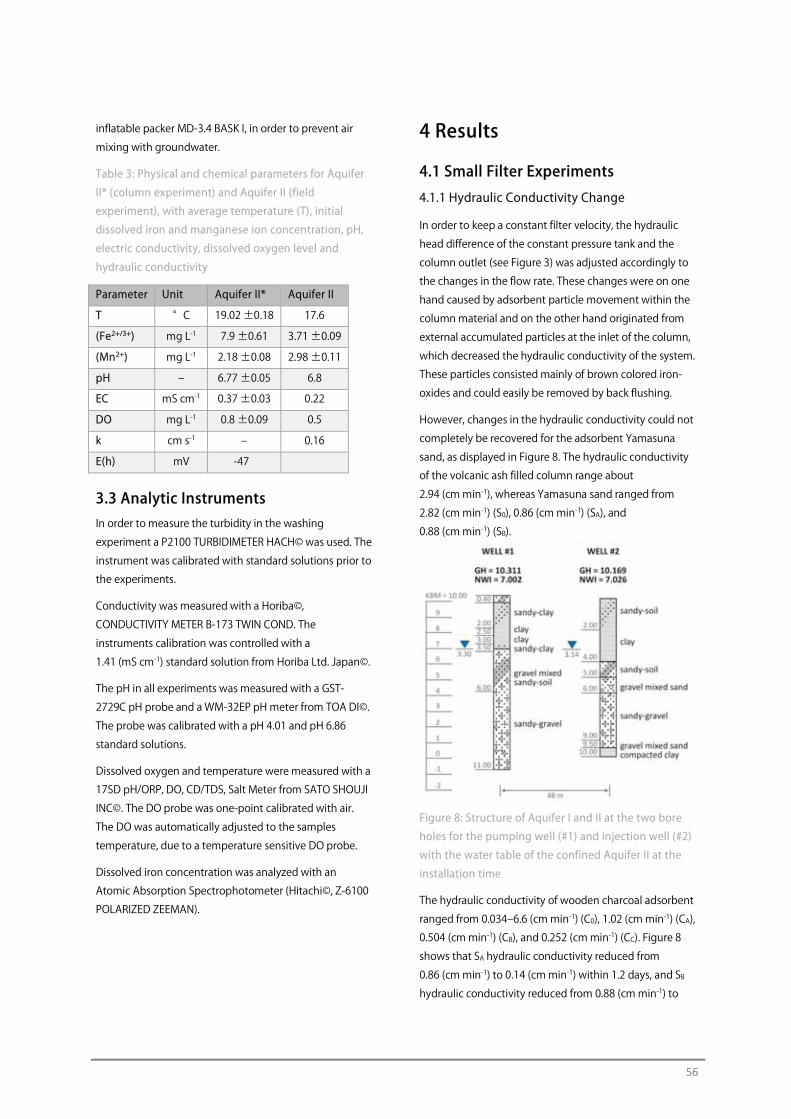
56
inflatable packer MD-3.4 BASK I, in order to prevent air
mixing with groundwater.
Table 3: Physical and chemical parameters for Aquifer
II* (column experiment) and Aquifer II (field
experiment), with average temperature (T), initial
dissolved iron and manganese ion concentration, pH,
electric conductivity, dissolved oxygen level and
hydraulic conductivity
Parameter Unit Aquifer II* Aquifer II
T °C 19.02 ±0.18 17.6
(Fe2+/3+) mg L-1 7.9 ±0.61 3.71 ±0.09
(Mn2+) mg L-1 2.18 ±0.08 2.98 ±0.11
pH ‒ 6.77 ±0.05 6.8
EC mS cm-1 0.37 ±0.03 0.22
DO mg L-1 0.8 ±0.09 0.5
k cm s-1 ‒ 0.16
E(h) mV -47
3.3 Analytic Instruments In order to measure the turbidity in the washing
experiment a P2100 TURBIDIMETER HACH© was used. The
instrument was calibrated with standard solutions prior to
the experiments.
Conductivity was measured with a Horiba©,
CONDUCTIVITY METER B-173 TWIN COND. The
instruments calibration was controlled with a
1.41 (mS cm-1) standard solution from Horiba Ltd. Japan©.
The pH in all experiments was measured with a GST-
2729C pH probe and a WM-32EP pH meter from TOA DI©.
The probe was calibrated with a pH 4.01 and pH 6.86
standard solutions.
Dissolved oxygen and temperature were measured with a
17SD pH/ORP, DO, CD/TDS, Salt Meter from SATO SHOUJI
INC©. The DO probe was one-point calibrated with air.
The DO was automatically adjusted to the samples
temperature, due to a temperature sensitive DO probe.
Dissolved iron concentration was analyzed with an
Atomic Absorption Spectrophotometer (Hitachi©, Z-6100
POLARIZED ZEEMAN).
4 Results
4.1 Small Filter Experiments
4.1.1 Hydraulic Conductivity Change
In order to keep a constant filter velocity, the hydraulic
head difference of the constant pressure tank and the
column outlet (see Figure 3) was adjusted accordingly to
the changes in the flow rate. These changes were on one
hand caused by adsorbent particle movement within the
column material and on the other hand originated from
external accumulated particles at the inlet of the column,
which decreased the hydraulic conductivity of the system.
These particles consisted mainly of brown colored iron-
oxides and could easily be removed by back flushing.
However, changes in the hydraulic conductivity could not
completely be recovered for the adsorbent Yamasuna
sand, as displayed in Figure 8. The hydraulic conductivity
of the volcanic ash filled column range about
2.94 (cm min-1), whereas Yamasuna sand ranged from
2.82 (cm min-1) (S0), 0.86 (cm min-1) (SA), and
0.88 (cm min-1) (SB).
Figure 8: Structure of Aquifer I and II at the two bore
holes for the pumping well (#1) and injection well (#2)
with the water table of the confined Aquifer II at the
installation time
The hydraulic conductivity of wooden charcoal adsorbent
ranged from 0.034‒6.6 (cm min-1) (C0), 1.02 (cm min-1) (CA),
0.504 (cm min-1) (CB), and 0.252 (cm min-1) (CC). Figure 8
shows that SA hydraulic conductivity reduced from
0.86 (cm min-1) to 0.14 (cm min-1) within 1.2 days, and SB
hydraulic conductivity reduced from 0.88 (cm min-1) to
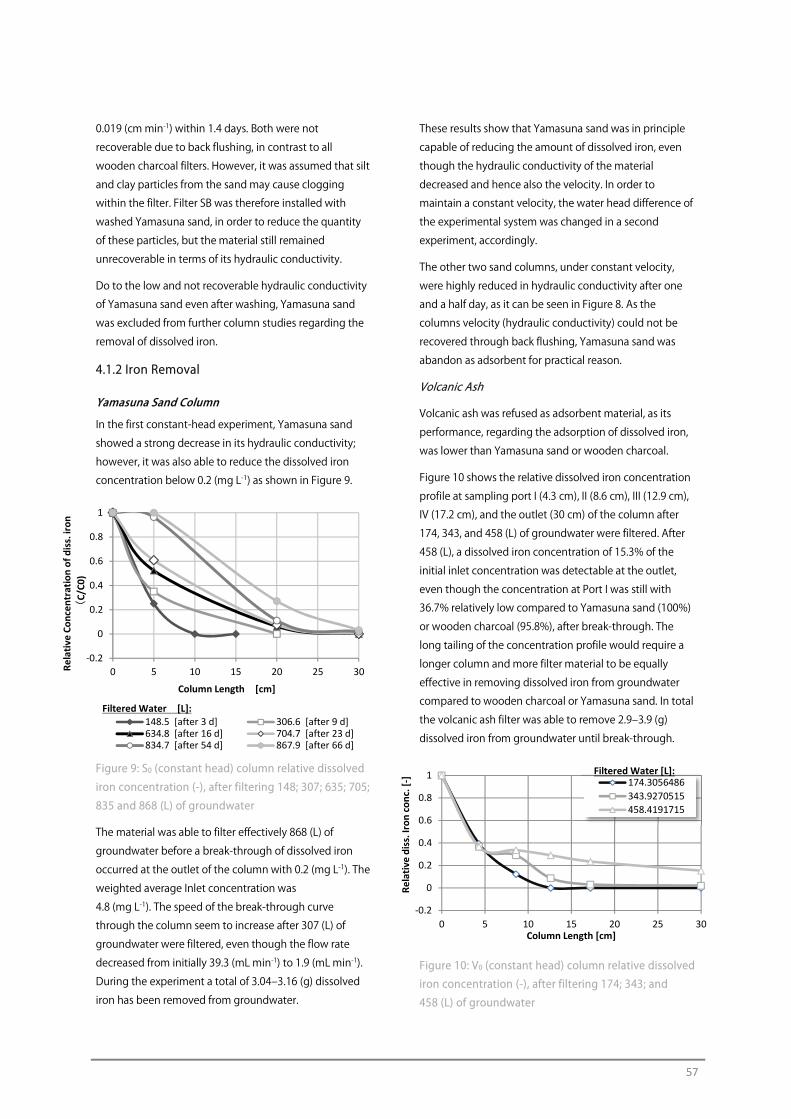
57
0.019 (cm min-1) within 1.4 days. Both were not
recoverable due to back flushing, in contrast to all
wooden charcoal filters. However, it was assumed that silt
and clay particles from the sand may cause clogging
within the filter. Filter SB was therefore installed with
washed Yamasuna sand, in order to reduce the quantity
of these particles, but the material still remained
unrecoverable in terms of its hydraulic conductivity.
Do to the low and not recoverable hydraulic conductivity
of Yamasuna sand even after washing, Yamasuna sand
was excluded from further column studies regarding the
removal of dissolved iron.
4.1.2 Iron Removal
Yamasuna Sand Column
In the first constant-head experiment, Yamasuna sand
showed a strong decrease in its hydraulic conductivity;
however, it was also able to reduce the dissolved iron
concentration below 0.2 (mg L-1) as shown in Figure 9.
Figure 9: S0 (constant head) column relative dissolved
iron concentration (-), after filtering 148; 307; 635; 705;
835 and 868 (L) of groundwater
The material was able to filter effectively 868 (L) of
groundwater before a break-through of dissolved iron
occurred at the outlet of the column with 0.2 (mg L-1). The
weighted average Inlet concentration was
4.8 (mg L-1). The speed of the break-through curve
through the column seem to increase after 307 (L) of
groundwater were filtered, even though the flow rate
decreased from initially 39.3 (mL min-1) to 1.9 (mL min-1).
During the experiment a total of 3.04‒3.16 (g) dissolved
iron has been removed from groundwater.
These results show that Yamasuna sand was in principle
capable of reducing the amount of dissolved iron, even
though the hydraulic conductivity of the material
decreased and hence also the velocity. In order to
maintain a constant velocity, the water head difference of
the experimental system was changed in a second
experiment, accordingly.
The other two sand columns, under constant velocity,
were highly reduced in hydraulic conductivity after one
and a half day, as it can be seen in Figure 8. As the
columns velocity (hydraulic conductivity) could not be
recovered through back flushing, Yamasuna sand was
abandon as adsorbent for practical reason.
Volcanic Ash
Volcanic ash was refused as adsorbent material, as its
performance, regarding the adsorption of dissolved iron,
was lower than Yamasuna sand or wooden charcoal.
Figure 10 shows the relative dissolved iron concentration
profile at sampling port I (4.3 cm), II (8.6 cm), III (12.9 cm),
IV (17.2 cm), and the outlet (30 cm) of the column after
174, 343, and 458 (L) of groundwater were filtered. After
458 (L), a dissolved iron concentration of 15.3% of the
initial inlet concentration was detectable at the outlet,
even though the concentration at Port I was still with
36.7% relatively low compared to Yamasuna sand (100%)
or wooden charcoal (95.8%), after break-through. The
long tailing of the concentration profile would require a
longer column and more filter material to be equally
effective in removing dissolved iron from groundwater
compared to wooden charcoal or Yamasuna sand. In total
the volcanic ash filter was able to remove 2.9‒3.9 (g)
dissolved iron from groundwater until break-through.
Figure 10: V0 (constant head) column relative dissolved
iron concentration (-), after filtering 174; 343; and
458 (L) of groundwater
-0.2
0
0.2
0.4
0.6
0.8
1
0 5 10 15 20 25 30Rela
tive
Conc
entr
atio
n of
dis
s. ir
on(
C/C0
)
Column Length [cm]
148.5 [after 3 d] 306.6 [after 9 d]634.8 [after 16 d] 704.7 [after 23 d]834.7 [after 54 d] 867.9 [after 66 d]
Filtered Water [L]:
-0.2
0
0.2
0.4
0.6
0.8
1
0 5 10 15 20 25 30
Rela
tive
diss
. Iro
n co
nc. [
-]
Column Length [cm]
174.3056486343.9270515458.4191715
Filtered Water [L]:
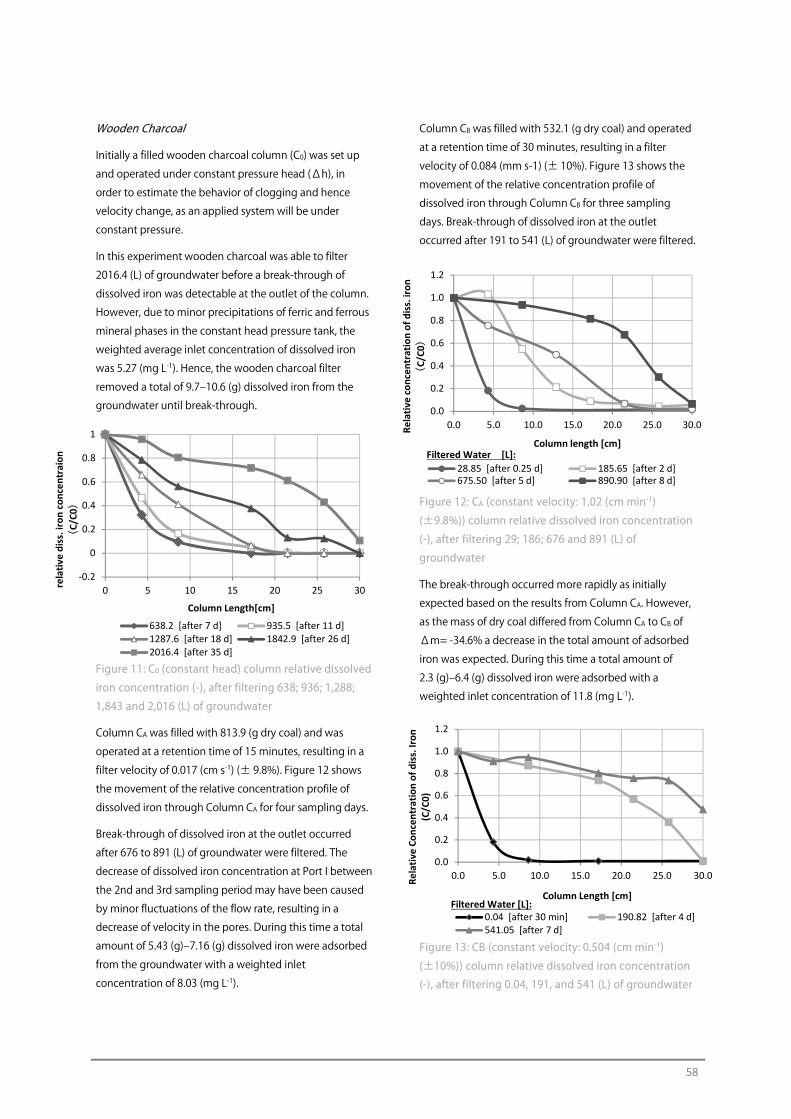
58
Wooden Charcoal
Initially a filled wooden charcoal column (C0) was set up
and operated under constant pressure head (Δh), in
order to estimate the behavior of clogging and hence
velocity change, as an applied system will be under
constant pressure.
In this experiment wooden charcoal was able to filter
2016.4 (L) of groundwater before a break-through of
dissolved iron was detectable at the outlet of the column.
However, due to minor precipitations of ferric and ferrous
mineral phases in the constant head pressure tank, the
weighted average inlet concentration of dissolved iron
was 5.27 (mg L-1). Hence, the wooden charcoal filter
removed a total of 9.7‒10.6 (g) dissolved iron from the
groundwater until break-through.
Figure 11: C0 (constant head) column relative dissolved
iron concentration (-), after filtering 638; 936; 1,288;
1,843 and 2,016 (L) of groundwater
Column CA was filled with 813.9 (g dry coal) and was
operated at a retention time of 15 minutes, resulting in a
filter velocity of 0.017 (cm s-1) (± 9.8%). Figure 12 shows
the movement of the relative concentration profile of
dissolved iron through Column CA for four sampling days.
Break-through of dissolved iron at the outlet occurred
after 676 to 891 (L) of groundwater were filtered. The
decrease of dissolved iron concentration at Port I between
the 2nd and 3rd sampling period may have been caused
by minor fluctuations of the flow rate, resulting in a
decrease of velocity in the pores. During this time a total
amount of 5.43 (g)‒7.16 (g) dissolved iron were adsorbed
from the groundwater with a weighted inlet
concentration of 8.03 (mg L-1).
Column CB was filled with 532.1 (g dry coal) and operated
at a retention time of 30 minutes, resulting in a filter
velocity of 0.084 (mm s-1) (± 10%). Figure 13 shows the
movement of the relative concentration profile of
dissolved iron through Column CB for three sampling
days. Break-through of dissolved iron at the outlet
occurred after 191 to 541 (L) of groundwater were filtered.
Figure 12: CA (constant velocity: 1.02 (cm min-1)
(±9.8%)) column relative dissolved iron concentration
(-), after filtering 29; 186; 676 and 891 (L) of
groundwater
The break-through occurred more rapidly as initially
expected based on the results from Column CA. However,
as the mass of dry coal differed from Column CA to CB of
Δm= -34.6% a decrease in the total amount of adsorbed
iron was expected. During this time a total amount of
2.3 (g)‒6.4 (g) dissolved iron were adsorbed with a
weighted inlet concentration of 11.8 (mg L-1).
Figure 13: CB (constant velocity: 0.504 (cm min-1)
(±10%)) column relative dissolved iron concentration
(-), after filtering 0.04, 191, and 541 (L) of groundwater
-0.2
0
0.2
0.4
0.6
0.8
1
0 5 10 15 20 25 30rela
tive
diss
. iro
n co
ncen
trai
on(
C/C0
)
Column Length[cm]
638.2 [after 7 d] 935.5 [after 11 d]1287.6 [after 18 d] 1842.9 [after 26 d]2016.4 [after 35 d]
0.0
0.2
0.4
0.6
0.8
1.0
1.2
0.0 5.0 10.0 15.0 20.0 25.0 30.0Rela
tive
conc
entr
atio
n of
dis
s. ir
on(
C/C0
)
Column length [cm]
28.85 [after 0.25 d] 185.65 [after 2 d]675.50 [after 5 d] 890.90 [after 8 d]
Filtered Water [L]:
0.0
0.2
0.4
0.6
0.8
1.0
1.2
0.0 5.0 10.0 15.0 20.0 25.0 30.0Rela
tive
Conc
entr
atio
n of
dis
s. Ir
on
(C/C
0)
Column Length [cm]
0.04 [after 30 min] 190.82 [after 4 d]541.05 [after 7 d]
Filtered Water [L]:
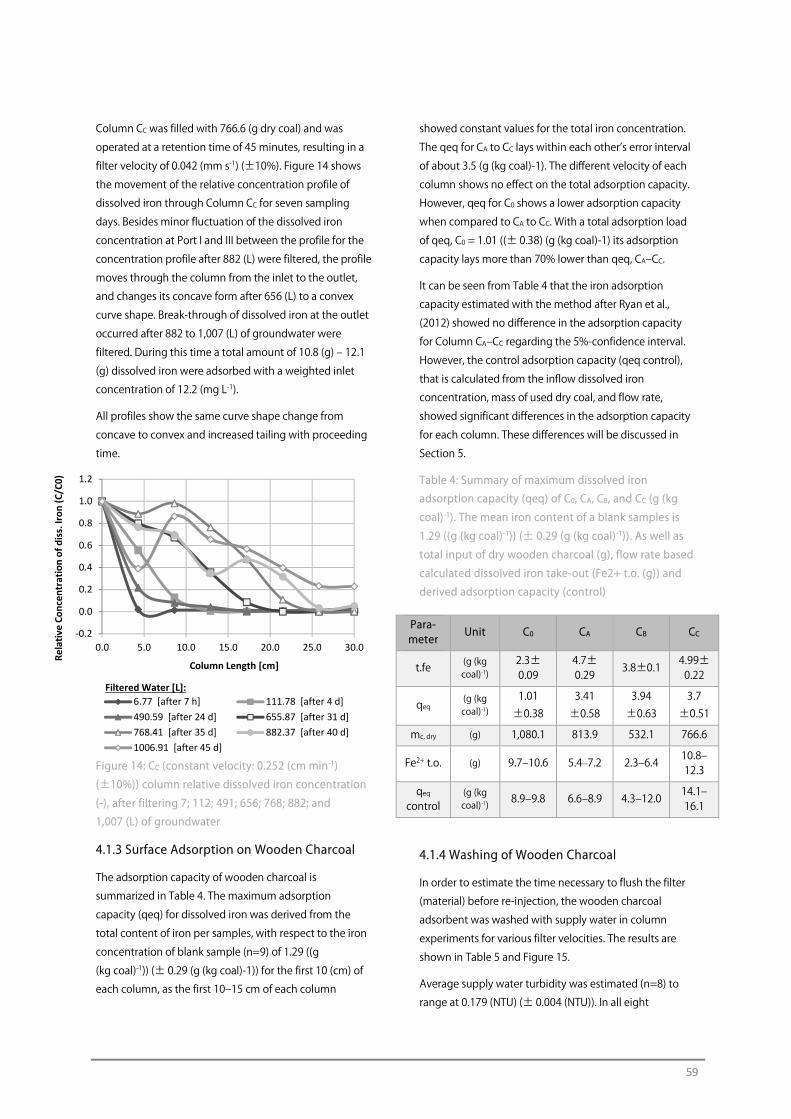
59
Column CC was filled with 766.6 (g dry coal) and was
operated at a retention time of 45 minutes, resulting in a
filter velocity of 0.042 (mm s-1) (±10%). Figure 14 shows
the movement of the relative concentration profile of
dissolved iron through Column CC for seven sampling
days. Besides minor fluctuation of the dissolved iron
concentration at Port I and III between the profile for the
concentration profile after 882 (L) were filtered, the profile
moves through the column from the inlet to the outlet,
and changes its concave form after 656 (L) to a convex
curve shape. Break-through of dissolved iron at the outlet
occurred after 882 to 1,007 (L) of groundwater were
filtered. During this time a total amount of 10.8 (g) ‒ 12.1
(g) dissolved iron were adsorbed with a weighted inlet
concentration of 12.2 (mg L-1).
All profiles show the same curve shape change from
concave to convex and increased tailing with proceeding
time.
Figure 14: CC (constant velocity: 0.252 (cm min-1)
(±10%)) column relative dissolved iron concentration
(-), after filtering 7; 112; 491; 656; 768; 882; and
1,007 (L) of groundwater
4.1.3 Surface Adsorption on Wooden Charcoal
The adsorption capacity of wooden charcoal is
summarized in Table 4. The maximum adsorption
capacity (qeq) for dissolved iron was derived from the
total content of iron per samples, with respect to the iron
concentration of blank sample (n=9) of 1.29 ((g
(kg coal)-1)) (± 0.29 (g (kg coal)-1)) for the first 10 (cm) of
each column, as the first 10‒15 cm of each column
showed constant values for the total iron concentration.
The qeq for CA to CC lays within each other’s error interval
of about 3.5 (g (kg coal)-1). The different velocity of each
column shows no effect on the total adsorption capacity.
However, qeq for C0 shows a lower adsorption capacity
when compared to CA to CC. With a total adsorption load
of qeq, C0 = 1.01 ((± 0.38) (g (kg coal)-1) its adsorption
capacity lays more than 70% lower than qeq, CA‒CC.
It can be seen from Table 4 that the iron adsorption
capacity estimated with the method after Ryan et al.,
(2012) showed no difference in the adsorption capacity
for Column CA‒CC regarding the 5%-confidence interval.
However, the control adsorption capacity (qeq control),
that is calculated from the inflow dissolved iron
concentration, mass of used dry coal, and flow rate,
showed significant differences in the adsorption capacity
for each column. These differences will be discussed in
Section 5.
Table 4: Summary of maximum dissolved iron
adsorption capacity (qeq) of C0, CA, CB, and CC (g (kg
coal)-1). The mean iron content of a blank samples is
1.29 ((g (kg coal)-1)) (± 0.29 (g (kg coal)-1)). As well as
total input of dry wooden charcoal (g), flow rate based
calculated dissolved iron take-out (Fe2+ t.o. (g)) and
derived adsorption capacity (control)
4.1.4 Washing of Wooden Charcoal
In order to estimate the time necessary to flush the filter
(material) before re-injection, the wooden charcoal
adsorbent was washed with supply water in column
experiments for various filter velocities. The results are
shown in Table 5 and Figure 15.
Average supply water turbidity was estimated (n=8) to
range at 0.179 (NTU) (± 0.004 (NTU)). In all eight
Para-meter
Unit C0 CA CB CC
t.fe (g (kg coal)-1)
2.3± 0.09
4.7± 0.29
3.8±0.1 4.99±0.22
qeq (g (kg coal)-1)
1.01 ±0.38
3.41 ±0.58
3.94 ±0.63
3.7 ±0.51
mc, dry (g) 1,080.1 813.9 532.1 766.6
Fe2+ t.o. (g) 9.7‒10.6 5.4–7.2 2.3‒6.4 10.8‒12.3
qeq control
(g (kg coal)-1) 8.9‒9.8 6.6‒8.9 4.3‒12.0
14.1‒16.1
-0.2
0.0
0.2
0.4
0.6
0.8
1.0
1.2
0.0 5.0 10.0 15.0 20.0 25.0 30.0
Rela
tive
Conc
entr
atio
n of
dis
s. Ir
on (C
/C0)
Column Length [cm]
6.77 [after 7 h] 111.78 [after 4 d]490.59 [after 24 d] 655.87 [after 31 d]768.41 [after 35 d] 882.37 [after 40 d]1006.91 [after 45 d]
Filtered Water [L]:
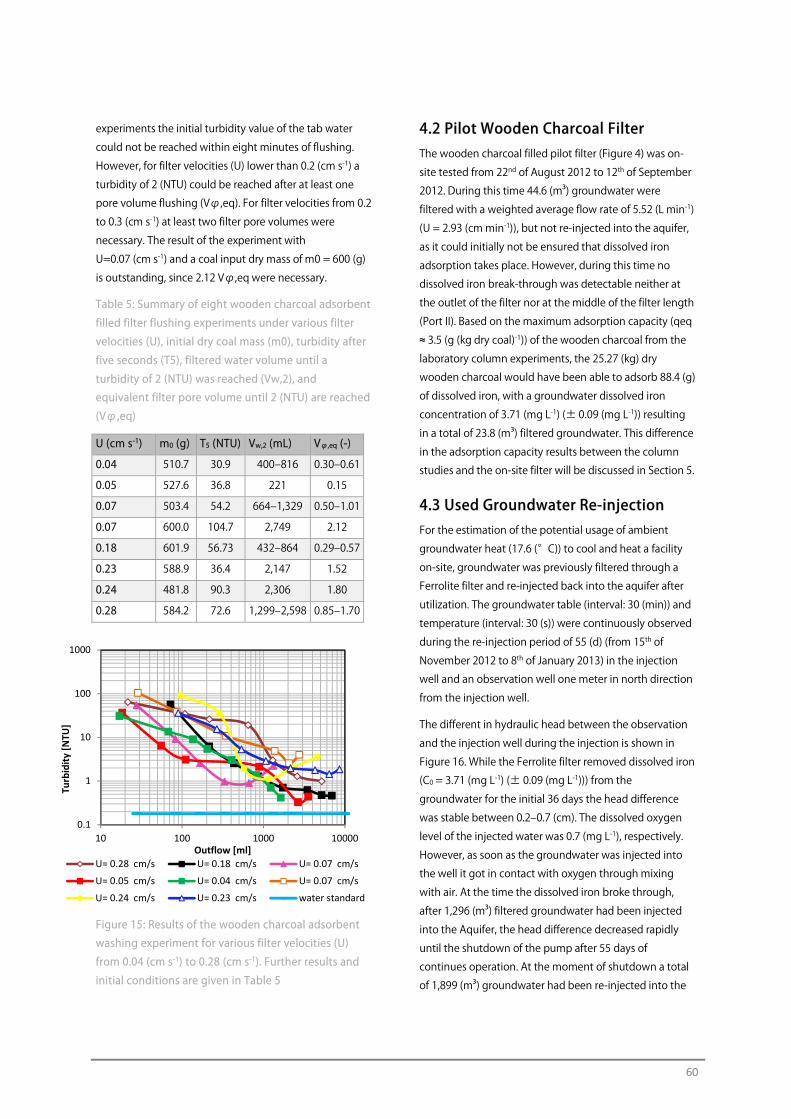
60
experiments the initial turbidity value of the tab water
could not be reached within eight minutes of flushing.
However, for filter velocities (U) lower than 0.2 (cm s-1) a
turbidity of 2 (NTU) could be reached after at least one
pore volume flushing (Vφ,eq). For filter velocities from 0.2
to 0.3 (cm s-1) at least two filter pore volumes were
necessary. The result of the experiment with
U=0.07 (cm s-1) and a coal input dry mass of m0 = 600 (g)
is outstanding, since 2.12 Vφ,eq were necessary.
Table 5: Summary of eight wooden charcoal adsorbent
filled filter flushing experiments under various filter
velocities (U), initial dry coal mass (m0), turbidity after
five seconds (T5), filtered water volume until a
turbidity of 2 (NTU) was reached (Vw,2), and
equivalent filter pore volume until 2 (NTU) are reached
(Vφ,eq)
U (cm s-1) m0 (g) T5 (NTU) Vw,2 (mL) Vφ,eq (-)
0.04 510.7 30.9 400‒816 0.30‒0.61
0.05 527.6 36.8 221 0.15
0.07 503.4 54.2 664‒1,329 0.50‒1.01
0.07 600.0 104.7 2,749 2.12
0.18 601.9 56.73 432‒864 0.29‒0.57
0.23 588.9 36.4 2,147 1.52
0.24 481.8 90.3 2,306 1.80
0.28 584.2 72.6 1,299‒2,598 0.85‒1.70
Figure 15: Results of the wooden charcoal adsorbent
washing experiment for various filter velocities (U)
from 0.04 (cm s-1) to 0.28 (cm s-1). Further results and
initial conditions are given in Table 5
4.2 Pilot Wooden Charcoal Filter The wooden charcoal filled pilot filter (Figure 4) was on-
site tested from 22nd of August 2012 to 12th of September
2012. During this time 44.6 (m³) groundwater were
filtered with a weighted average flow rate of 5.52 (L min-1)
(U = 2.93 (cm min-1)), but not re-injected into the aquifer,
as it could initially not be ensured that dissolved iron
adsorption takes place. However, during this time no
dissolved iron break-through was detectable neither at
the outlet of the filter nor at the middle of the filter length
(Port II). Based on the maximum adsorption capacity (qeq
≈ 3.5 (g (kg dry coal)-1)) of the wooden charcoal from the
laboratory column experiments, the 25.27 (kg) dry
wooden charcoal would have been able to adsorb 88.4 (g)
of dissolved iron, with a groundwater dissolved iron
concentration of 3.71 (mg L-1) (± 0.09 (mg L-1)) resulting
in a total of 23.8 (m³) filtered groundwater. This difference
in the adsorption capacity results between the column
studies and the on-site filter will be discussed in Section 5.
4.3 Used Groundwater Re-injection For the estimation of the potential usage of ambient
groundwater heat (17.6 (°C)) to cool and heat a facility
on-site, groundwater was previously filtered through a
Ferrolite filter and re-injected back into the aquifer after
utilization. The groundwater table (interval: 30 (min)) and
temperature (interval: 30 (s)) were continuously observed
during the re-injection period of 55 (d) (from 15th of
November 2012 to 8th of January 2013) in the injection
well and an observation well one meter in north direction
from the injection well.
The different in hydraulic head between the observation
and the injection well during the injection is shown in
Figure 16. While the Ferrolite filter removed dissolved iron
(C0 = 3.71 (mg L-1) (± 0.09 (mg L-1))) from the
groundwater for the initial 36 days the head difference
was stable between 0.2‒0.7 (cm). The dissolved oxygen
level of the injected water was 0.7 (mg L-1), respectively.
However, as soon as the groundwater was injected into
the well it got in contact with oxygen through mixing
with air. At the time the dissolved iron broke through,
after 1,296 (m³) filtered groundwater had been injected
into the Aquifer, the head difference decreased rapidly
until the shutdown of the pump after 55 days of
continues operation. At the moment of shutdown a total
of 1,899 (m³) groundwater had been re-injected into the
0.1
1
10
100
1000
10 100 1000 10000
Turb
idity
[NTU
]
Outflow [ml]U= 0.28 cm/s U= 0.18 cm/s U= 0.07 cm/s
U= 0.05 cm/s U= 0.04 cm/s U= 0.07 cm/s
U= 0.24 cm/s U= 0.23 cm/s water standard
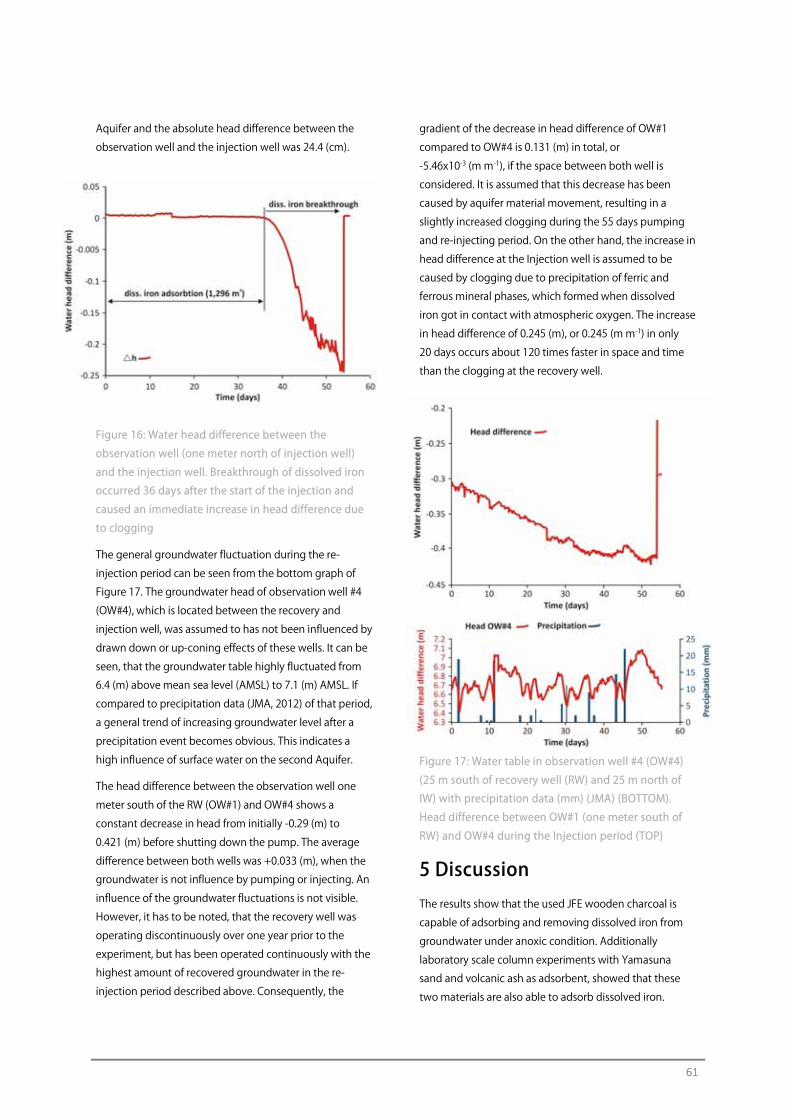
61
Aquifer and the absolute head difference between the
observation well and the injection well was 24.4 (cm).
Figure 16: Water head difference between the
observation well (one meter north of injection well)
and the injection well. Breakthrough of dissolved iron
occurred 36 days after the start of the injection and
caused an immediate increase in head difference due
to clogging
The general groundwater fluctuation during the re-
injection period can be seen from the bottom graph of
Figure 17. The groundwater head of observation well #4
(OW#4), which is located between the recovery and
injection well, was assumed to has not been influenced by
drawn down or up-coning effects of these wells. It can be
seen, that the groundwater table highly fluctuated from
6.4 (m) above mean sea level (AMSL) to 7.1 (m) AMSL. If
compared to precipitation data (JMA, 2012) of that period,
a general trend of increasing groundwater level after a
precipitation event becomes obvious. This indicates a
high influence of surface water on the second Aquifer.
The head difference between the observation well one
meter south of the RW (OW#1) and OW#4 shows a
constant decrease in head from initially -0.29 (m) to
0.421 (m) before shutting down the pump. The average
difference between both wells was +0.033 (m), when the
groundwater is not influence by pumping or injecting. An
influence of the groundwater fluctuations is not visible.
However, it has to be noted, that the recovery well was
operating discontinuously over one year prior to the
experiment, but has been operated continuously with the
highest amount of recovered groundwater in the re-
injection period described above. Consequently, the
gradient of the decrease in head difference of OW#1
compared to OW#4 is 0.131 (m) in total, or
-5.46x10⁻³ (m m-1), if the space between both well is
considered. It is assumed that this decrease has been
caused by aquifer material movement, resulting in a
slightly increased clogging during the 55 days pumping
and re-injecting period. On the other hand, the increase in
head difference at the Injection well is assumed to be
caused by clogging due to precipitation of ferric and
ferrous mineral phases, which formed when dissolved
iron got in contact with atmospheric oxygen. The increase
in head difference of 0.245 (m), or 0.245 (m m-1) in only
20 days occurs about 120 times faster in space and time
than the clogging at the recovery well.
Figure 17: Water table in observation well #4 (OW#4)
(25 m south of recovery well (RW) and 25 m north of
IW) with precipitation data (mm) (JMA) (BOTTOM).
Head difference between OW#1 (one meter south of
RW) and OW#4 during the Injection period (TOP)
5 Discussion
The results show that the used JFE wooden charcoal is
capable of adsorbing and removing dissolved iron from
groundwater under anoxic condition. Additionally
laboratory scale column experiments with Yamasuna
sand and volcanic ash as adsorbent, showed that these
two materials are also able to adsorb dissolved iron.
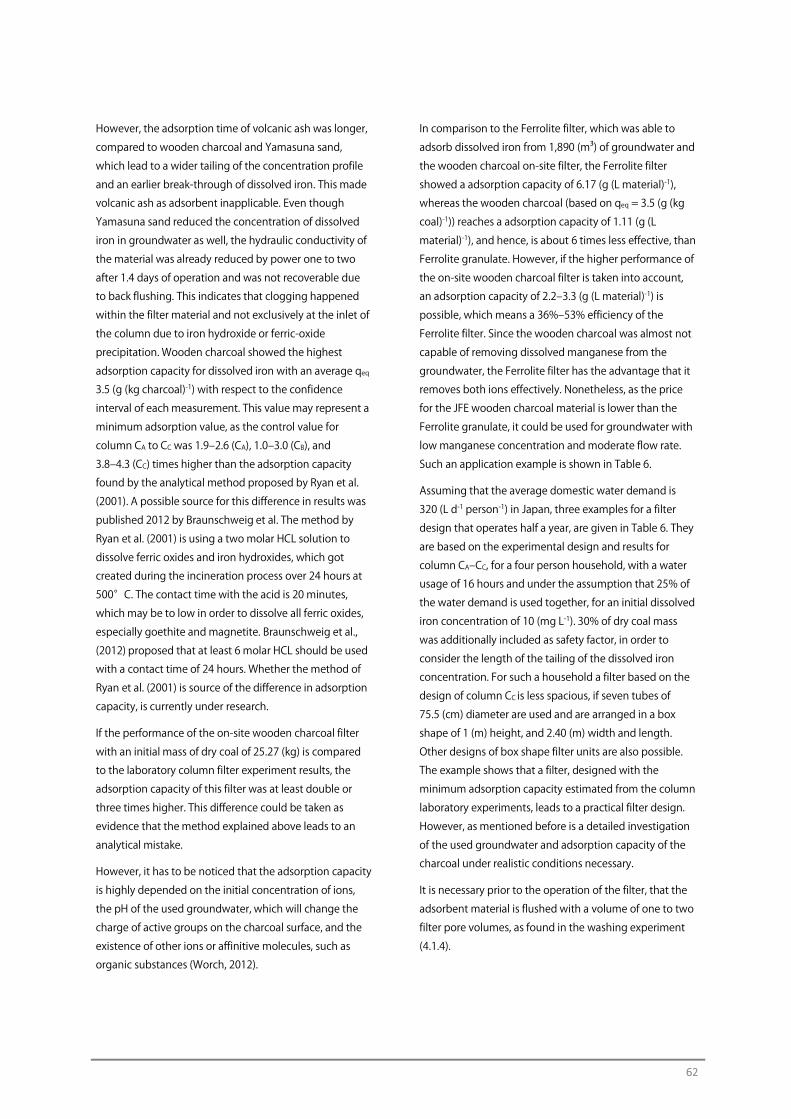
62
However, the adsorption time of volcanic ash was longer,
compared to wooden charcoal and Yamasuna sand,
which lead to a wider tailing of the concentration profile
and an earlier break-through of dissolved iron. This made
volcanic ash as adsorbent inapplicable. Even though
Yamasuna sand reduced the concentration of dissolved
iron in groundwater as well, the hydraulic conductivity of
the material was already reduced by power one to two
after 1.4 days of operation and was not recoverable due
to back flushing. This indicates that clogging happened
within the filter material and not exclusively at the inlet of
the column due to iron hydroxide or ferric-oxide
precipitation. Wooden charcoal showed the highest
adsorption capacity for dissolved iron with an average qeq
3.5 (g (kg charcoal)-1) with respect to the confidence
interval of each measurement. This value may represent a
minimum adsorption value, as the control value for
column CA to CC was 1.9‒2.6 (CA), 1.0‒3.0 (CB), and
3.8‒4.3 (CC) times higher than the adsorption capacity
found by the analytical method proposed by Ryan et al.
(2001). A possible source for this difference in results was
published 2012 by Braunschweig et al. The method by
Ryan et al. (2001) is using a two molar HCL solution to
dissolve ferric oxides and iron hydroxides, which got
created during the incineration process over 24 hours at
500°C. The contact time with the acid is 20 minutes,
which may be to low in order to dissolve all ferric oxides,
especially goethite and magnetite. Braunschweig et al.,
(2012) proposed that at least 6 molar HCL should be used
with a contact time of 24 hours. Whether the method of
Ryan et al. (2001) is source of the difference in adsorption
capacity, is currently under research.
If the performance of the on-site wooden charcoal filter
with an initial mass of dry coal of 25.27 (kg) is compared
to the laboratory column filter experiment results, the
adsorption capacity of this filter was at least double or
three times higher. This difference could be taken as
evidence that the method explained above leads to an
analytical mistake.
However, it has to be noticed that the adsorption capacity
is highly depended on the initial concentration of ions,
the pH of the used groundwater, which will change the
charge of active groups on the charcoal surface, and the
existence of other ions or affinitive molecules, such as
organic substances (Worch, 2012).
In comparison to the Ferrolite filter, which was able to
adsorb dissolved iron from 1,890 (m³) of groundwater and
the wooden charcoal on-site filter, the Ferrolite filter
showed a adsorption capacity of 6.17 (g (L material)-1),
whereas the wooden charcoal (based on qeq = 3.5 (g (kg
coal)-1)) reaches a adsorption capacity of 1.11 (g (L
material)-1), and hence, is about 6 times less effective, than
Ferrolite granulate. However, if the higher performance of
the on-site wooden charcoal filter is taken into account,
an adsorption capacity of 2.2‒3.3 (g (L material)-1) is
possible, which means a 36%‒53% efficiency of the
Ferrolite filter. Since the wooden charcoal was almost not
capable of removing dissolved manganese from the
groundwater, the Ferrolite filter has the advantage that it
removes both ions effectively. Nonetheless, as the price
for the JFE wooden charcoal material is lower than the
Ferrolite granulate, it could be used for groundwater with
low manganese concentration and moderate flow rate.
Such an application example is shown in Table 6.
Assuming that the average domestic water demand is
320 (L d-1 person-1) in Japan, three examples for a filter
design that operates half a year, are given in Table 6. They
are based on the experimental design and results for
column CA‒CC, for a four person household, with a water
usage of 16 hours and under the assumption that 25% of
the water demand is used together, for an initial dissolved
iron concentration of 10 (mg L-1). 30% of dry coal mass
was additionally included as safety factor, in order to
consider the length of the tailing of the dissolved iron
concentration. For such a household a filter based on the
design of column CC is less spacious, if seven tubes of
75.5 (cm) diameter are used and are arranged in a box
shape of 1 (m) height, and 2.40 (m) width and length.
Other designs of box shape filter units are also possible.
The example shows that a filter, designed with the
minimum adsorption capacity estimated from the column
laboratory experiments, leads to a practical filter design.
However, as mentioned before is a detailed investigation
of the used groundwater and adsorption capacity of the
charcoal under realistic conditions necessary.
It is necessary prior to the operation of the filter, that the
adsorbent material is flushed with a volume of one to two
filter pore volumes, as found in the washing experiment
(4.1.4).
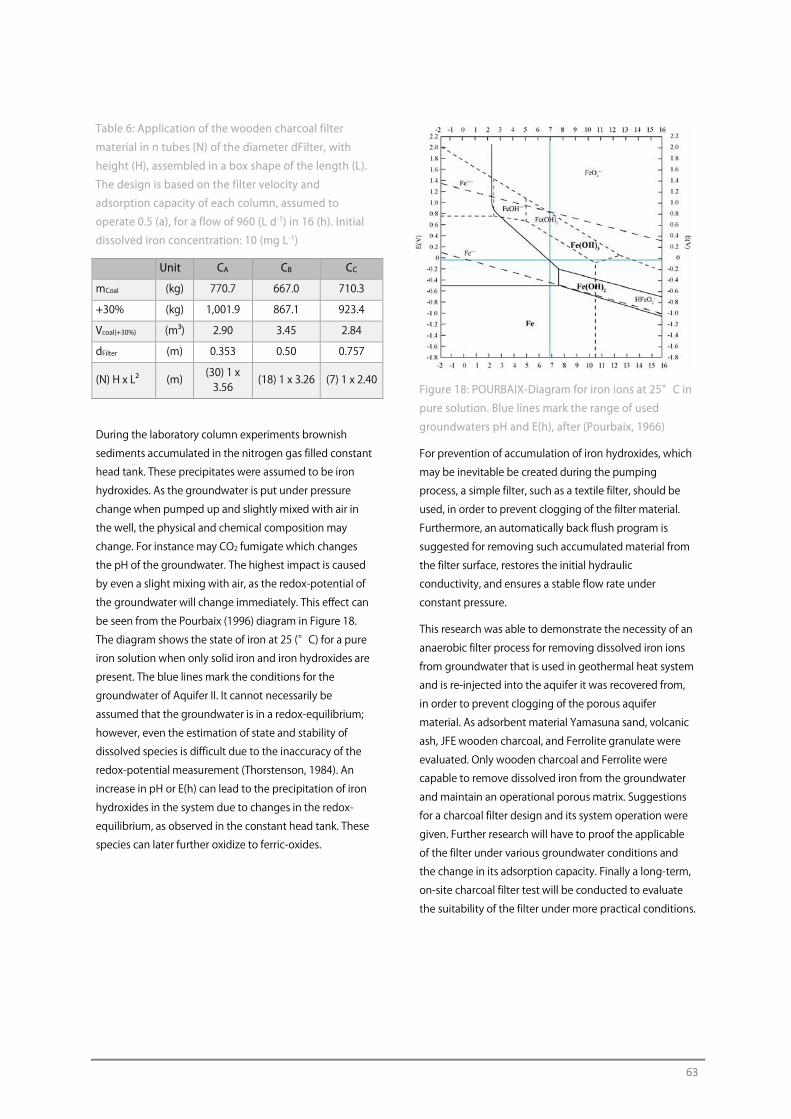
63
Table 6: Application of the wooden charcoal filter
material in n tubes (N) of the diameter dFilter, with
height (H), assembled in a box shape of the length (L).
The design is based on the filter velocity and
adsorption capacity of each column, assumed to
operate 0.5 (a), for a flow of 960 (L d-1) in 16 (h). Initial
dissolved iron concentration: 10 (mg L-1)
Unit CA CB CC
mCoal (kg) 770.7 667.0 710.3
+30% (kg) 1,001.9 867.1 923.4
Vcoal(+30%) (m³) 2.90 3.45 2.84
dFilter (m) 0.353 0.50 0.757
(N) H x L² (m) (30) 1 x 3.56
(18) 1 x 3.26 (7) 1 x 2.40
During the laboratory column experiments brownish
sediments accumulated in the nitrogen gas filled constant
head tank. These precipitates were assumed to be iron
hydroxides. As the groundwater is put under pressure
change when pumped up and slightly mixed with air in
the well, the physical and chemical composition may
change. For instance may CO2 fumigate which changes
the pH of the groundwater. The highest impact is caused
by even a slight mixing with air, as the redox-potential of
the groundwater will change immediately. This effect can
be seen from the Pourbaix (1996) diagram in Figure 18.
The diagram shows the state of iron at 25 (°C) for a pure
iron solution when only solid iron and iron hydroxides are
present. The blue lines mark the conditions for the
groundwater of Aquifer II. It cannot necessarily be
assumed that the groundwater is in a redox-equilibrium;
however, even the estimation of state and stability of
dissolved species is difficult due to the inaccuracy of the
redox-potential measurement (Thorstenson, 1984). An
increase in pH or E(h) can lead to the precipitation of iron
hydroxides in the system due to changes in the redox-
equilibrium, as observed in the constant head tank. These
species can later further oxidize to ferric-oxides.
Figure 18: POURBAIX-Diagram for iron ions at 25°C in
pure solution. Blue lines mark the range of used
groundwaters pH and E(h), after (Pourbaix, 1966)
For prevention of accumulation of iron hydroxides, which
may be inevitable be created during the pumping
process, a simple filter, such as a textile filter, should be
used, in order to prevent clogging of the filter material.
Furthermore, an automatically back flush program is
suggested for removing such accumulated material from
the filter surface, restores the initial hydraulic
conductivity, and ensures a stable flow rate under
constant pressure.
This research was able to demonstrate the necessity of an
anaerobic filter process for removing dissolved iron ions
from groundwater that is used in geothermal heat system
and is re-injected into the aquifer it was recovered from,
in order to prevent clogging of the porous aquifer
material. As adsorbent material Yamasuna sand, volcanic
ash, JFE wooden charcoal, and Ferrolite granulate were
evaluated. Only wooden charcoal and Ferrolite were
capable to remove dissolved iron from the groundwater
and maintain an operational porous matrix. Suggestions
for a charcoal filter design and its system operation were
given. Further research will have to proof the applicable
of the filter under various groundwater conditions and
the change in its adsorption capacity. Finally a long-term,
on-site charcoal filter test will be conducted to evaluate
the suitability of the filter under more practical conditions.

64
References Ahamad, K.U., and Jawed, M., (2011) Breakthrough
Column Studies for Iron(II) Removal from Water by
Wooden Charcoal and Sand: a low cost approach, Int. J.
Environ. Res., 5(1): 127‒138.
Bouwer, H., (2002) Artificial Recharge of Groundwater:
Hydrogeology and Engineering, Hydrogeology Journal, 10: 121‒142.
Braunschweig, J., Bosch, J., Heister, K., Kuebeck, C.,
Meckenstock, R.U.,( 2012) Reevaluation of Colorimetric
Iron Determination Methods commonly used in
Geomicrobiology, Journal of Microbiological Methods, 89:
4 ‒ 48.
Google Inc., (2013) Map of Tsushima Campus, Okayama,
Japan retrieved from Google Maps:
https://maps.google.de/maps?q=japan&hl=en&ll=34.689
982,133.925014&spn=0.002488,0.005284&sll=51.151786,
10.415039&sspn=7.776562,21.643066&t=h&hnear=Japan
&z=18
Igarashi, M., and Saito, K. Estimation of Impervious
Hydraulic Gradient for used Yamasuna Sand, Japanese Society of Civil Engineering (JSCE), 2005(3): 153 ‒ 154.
JFE Recycling Management Japan Inc., http://www.jfe-rmj.co.jp/, 2009.
JMA Japan Meteorology Agenca, http://www.jma.go.jp ,
2012.
Marsh, H., and Rodríguez-Reinoso, F., (2006) Activated
Carbon, 1st ed., ElSevier, Oxford, UK.
Mutschmann, J., and Stimmelmayr, F., (1991)
Taschenbuch der Wasserversorgung, 10th ed., Franckh-Kosmos, Stuttgart, Germany.
Näser, K.-H., Lempe, D., and Regen, O., (1990)
Physikalische Chemie für Techniker und Ingenieure, (in German), 19th ed., VEB Deutscher Verlag für
Grundstoffindustrie Leipzig, Leipzig, Germany.
NLID ‒ National Land and Information Division, National
and Regional Policy Bureau, Tokyo, 2011: National Land
Agency, Okayama Prefecture, Map (Internet): http://nrb-www.mlit.go.jp/kokjo/tochimizu/ F3/ZOOMA/3304/index.html
Oba, N., Tsuyuki, T., and Ebihara, H., (1967) Mineral and
Chemical Composition, and Genesis of the Yamasuna (in
Japanese), Gansekikoubutsukoushougakkukaishi, 58(3): 81‒97.
Pourbaix, M., (1966) Atlas of Electrochemical Equilibria of
Aqueous Solutions: Chapter IV, Pergamon Press, Cebelcor,
Brussels.
Ryan, J., Estefan, G., and Rashid, A., (2001) Soil and Plant
Analysis Laboratory Manual, 2nd Ed., Aleppo, Syria.
Storm, R., (1969) Wahrscheinlichkeitsrechnung,
mathematische Statistik und statistische
Qualitätskontrolle, (in German), 3rd ed., VEB
Fachbuchverlag Leipzig, Leipzig, Germany.
Thorstenson, D.C., (1984) The Concept of Electron Activity
and its Relation to Redox Potentials in Aqueous
Geochemical Systems, U.S. Geological Survey, Report 84 ‒
072.
Worch, E., (2012) Adsorption Technology in Water
Treatment, 1st ed., Walter de Gruyter, Bonn/Bosten,
Germany/USA.
Contact Details Email: [email protected]
65
Laboratory Experiments in Porous Media in Order to Predict Particle Remobilization C. Hartwig1, M. Nishigaki1, T. Takuya2 and R.U. Ruemenapp1 1 Geo-environmental Evaluation Laboratory, Department of Environmental Design and Civil Engineering, Graduate School of Environmental Science, Okayama University, Japan 2 Tokyu Construction Corporation, General Administration of Civil Engineers, Civil Engineering Department, Ground-Foundation Group, Tokyo, Japan
Abstract In several countries pumping of groundwater results in overexploitation, saltwater intrusion, or land
subsidence which can be mitigated by artificial groundwater recharge is a countermeasure for these problems
and/or flooding. Well injection is one of the best method for artificial recharge but also accompanied with
difficulties, such as clogging. In this research, investigation on physical clogging regarding to particle
mobilization was done. A one and two-dimensional laboratory experiment were carried out, in order to
determine the critical hydraulic gradient. The one-dimensional horizontal-flow column experiments showed
that not only fine content of the soil can be mobilized, but also particle sizes between 0.25 and 2 mm moved
by velocity forces. An axisymmetric confined aquifer model (2-dimensional) was constructed to simulate radial
groundwater flow away from an injection well. For the experiment, two types of soils with different
distribution curves were used in order to investigate the problem of fine particle movement and determine the
critical water level rise in the injection well. From the results of the axisymmetric experiment, it is plausible to
conclude that at a critical hydraulic gradient (i) of 0.3, for a content of fine particles in the aquifer below
0.104 mm, was determined for injection in the field, which indicates that clogging does not occur.
1 Introduction Groundwater is used by more than half of the world’s
population, especially in semi-arid areas where water
resources are rare. But unlimited pumping of
groundwater results in overexploitation, saltwater
intrusion, or land subsidence. In order to maintain
sustainable groundwater management artificial recharge
is a practicable technique.
Furthermore, artificial groundwater recharge can be
applied in order to store exceed storm water in the
subsurface or for energy storage such as groundwater
(open-loop) heat pump systems.
However, regarding injection of water into an aquifer,
clogging does often occur which alters the artificial
recharge system in its efficiency. Among the three
clogging types, physical clogging is still an unsolved
problem especially according particle mobilization of soil
particles initially present in the aquifer.
Due to water injection into an aquifer, the hydraulic
gradient decreases with radial distance from the injection
well. When soil particles near the well are moving,
permeability decreases with moving distance resulting in
accumulation of the soil particles and clogging occurs
(Figure 1). Thus, determination of the critical hydraulic
gradient and also the critical velocity are of great
importance.
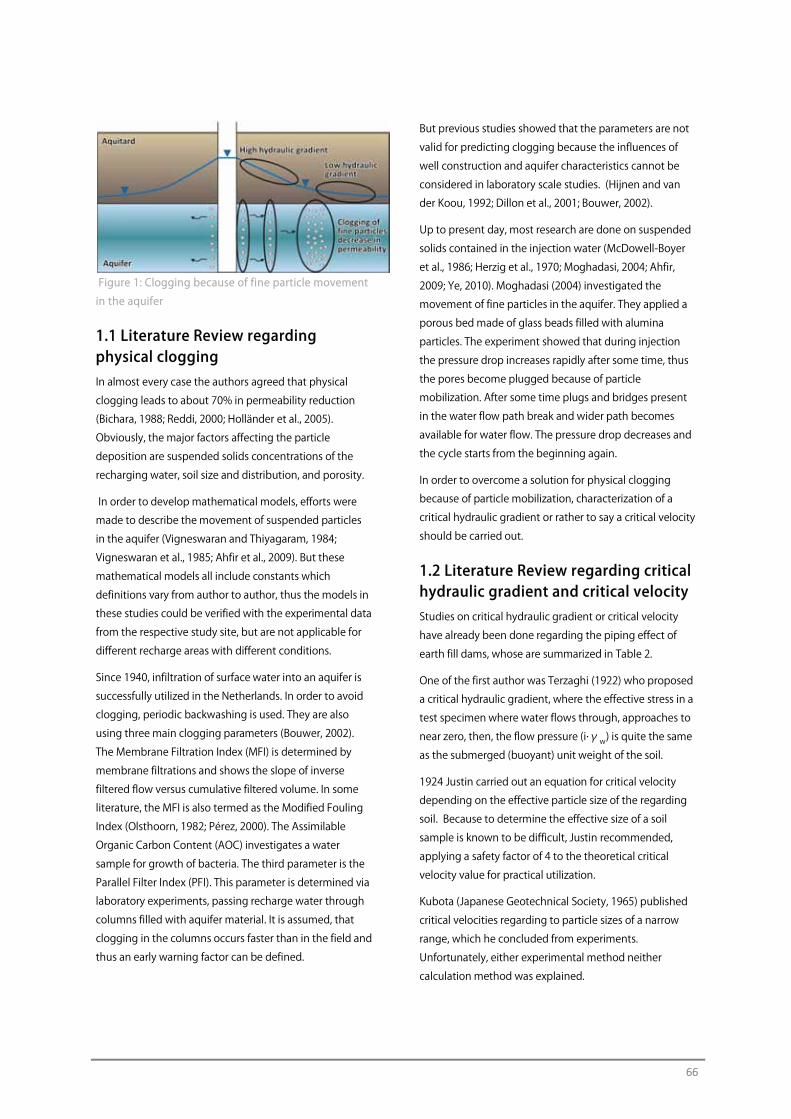
66
Figure 1: Clogging because of fine particle movement
in the aquifer
1.1 Literature Review regarding physical clogging In almost every case the authors agreed that physical
clogging leads to about 70% in permeability reduction
(Bichara, 1988; Reddi, 2000; Holländer et al., 2005).
Obviously, the major factors affecting the particle
deposition are suspended solids concentrations of the
recharging water, soil size and distribution, and porosity.
In order to develop mathematical models, efforts were
made to describe the movement of suspended particles
in the aquifer (Vigneswaran and Thiyagaram, 1984;
Vigneswaran et al., 1985; Ahfir et al., 2009). But these
mathematical models all include constants which
definitions vary from author to author, thus the models in
these studies could be verified with the experimental data
from the respective study site, but are not applicable for
different recharge areas with different conditions.
Since 1940, infiltration of surface water into an aquifer is
successfully utilized in the Netherlands. In order to avoid
clogging, periodic backwashing is used. They are also
using three main clogging parameters (Bouwer, 2002).
The Membrane Filtration Index (MFI) is determined by
membrane filtrations and shows the slope of inverse
filtered flow versus cumulative filtered volume. In some
literature, the MFI is also termed as the Modified Fouling
Index (Olsthoorn, 1982; Pérez, 2000). The Assimilable
Organic Carbon Content (AOC) investigates a water
sample for growth of bacteria. The third parameter is the
Parallel Filter Index (PFI). This parameter is determined via
laboratory experiments, passing recharge water through
columns filled with aquifer material. It is assumed, that
clogging in the columns occurs faster than in the field and
thus an early warning factor can be defined.
But previous studies showed that the parameters are not
valid for predicting clogging because the influences of
well construction and aquifer characteristics cannot be
considered in laboratory scale studies. (Hijnen and van
der Koou, 1992; Dillon et al., 2001; Bouwer, 2002).
Up to present day, most research are done on suspended
solids contained in the injection water (McDowell-Boyer
et al., 1986; Herzig et al., 1970; Moghadasi, 2004; Ahfir,
2009; Ye, 2010). Moghadasi (2004) investigated the
movement of fine particles in the aquifer. They applied a
porous bed made of glass beads filled with alumina
particles. The experiment showed that during injection
the pressure drop increases rapidly after some time, thus
the pores become plugged because of particle
mobilization. After some time plugs and bridges present
in the water flow path break and wider path becomes
available for water flow. The pressure drop decreases and
the cycle starts from the beginning again.
In order to overcome a solution for physical clogging
because of particle mobilization, characterization of a
critical hydraulic gradient or rather to say a critical velocity
should be carried out.
1.2 Literature Review regarding critical hydraulic gradient and critical velocity Studies on critical hydraulic gradient or critical velocity
have already been done regarding the piping effect of
earth fill dams, whose are summarized in Table 2.
One of the first author was Terzaghi (1922) who proposed
a critical hydraulic gradient, where the effective stress in a
test specimen where water flows through, approaches to
near zero, then, the flow pressure (i∙γw) is quite the same
as the submerged (buoyant) unit weight of the soil.
1924 Justin carried out an equation for critical velocity
depending on the effective particle size of the regarding
soil. Because to determine the effective size of a soil
sample is known to be difficult, Justin recommended,
applying a safety factor of 4 to the theoretical critical
velocity value for practical utilization.
Kubota (Japanese Geotechnical Society, 1965) published
critical velocities regarding to particle sizes of a narrow
range, which he concluded from experiments.
Unfortunately, either experimental method neither
calculation method was explained.
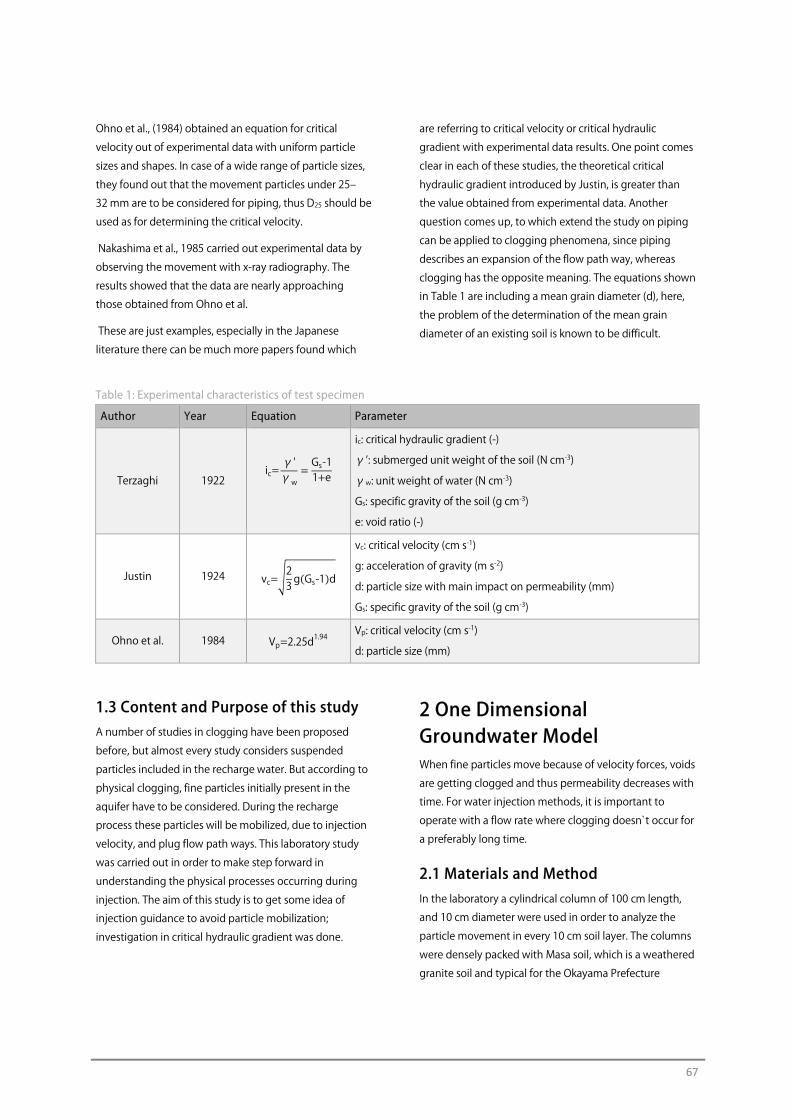
67
Ohno et al., (1984) obtained an equation for critical
velocity out of experimental data with uniform particle
sizes and shapes. In case of a wide range of particle sizes,
they found out that the movement particles under 25‒
32 mm are to be considered for piping, thus D25 should be
used as for determining the critical velocity.
Nakashima et al., 1985 carried out experimental data by
observing the movement with x-ray radiography. The
results showed that the data are nearly approaching
those obtained from Ohno et al.
These are just examples, especially in the Japanese
literature there can be much more papers found which
are referring to critical velocity or critical hydraulic
gradient with experimental data results. One point comes
clear in each of these studies, the theoretical critical
hydraulic gradient introduced by Justin, is greater than
the value obtained from experimental data. Another
question comes up, to which extend the study on piping
can be applied to clogging phenomena, since piping
describes an expansion of the flow path way, whereas
clogging has the opposite meaning. The equations shown
in Table 1 are including a mean grain diameter (d), here,
the problem of the determination of the mean grain
diameter of an existing soil is known to be difficult.
Table 1: Experimental characteristics of test specimen
Author Year Equation Parameter
Terzaghi 1922 ic=
γ'γw
= Gs-11+e
ic: critical hydraulic gradient (-)
γ’: submerged unit weight of the soil (N cm-3)
γw: unit weight of water (N cm-3)
Gs: specific gravity of the soil (g cm-3)
e: void ratio (-)
Justin 1924 vc=23g Gs-1 d
vc: critical velocity (cm s-1)
g: acceleration of gravity (m s-2)
d: particle size with main impact on permeability (mm)
Gs: specific gravity of the soil (g cm-3)
Ohno et al. 1984 Vp=2.25d1.94 Vp: critical velocity (cm s-1)
d: particle size (mm)
1.3 Content and Purpose of this study A number of studies in clogging have been proposed
before, but almost every study considers suspended
particles included in the recharge water. But according to
physical clogging, fine particles initially present in the
aquifer have to be considered. During the recharge
process these particles will be mobilized, due to injection
velocity, and plug flow path ways. This laboratory study
was carried out in order to make step forward in
understanding the physical processes occurring during
injection. The aim of this study is to get some idea of
injection guidance to avoid particle mobilization;
investigation in critical hydraulic gradient was done.
2 One Dimensional Groundwater Model When fine particles move because of velocity forces, voids
are getting clogged and thus permeability decreases with
time. For water injection methods, it is important to
operate with a flow rate where clogging doesn`t occur for
a preferably long time.
2.1 Materials and Method In the laboratory a cylindrical column of 100 cm length,
and 10 cm diameter were used in order to analyze the
particle movement in every 10 cm soil layer. The columns
were densely packed with Masa soil, which is a weathered
granite soil and typical for the Okayama Prefecture
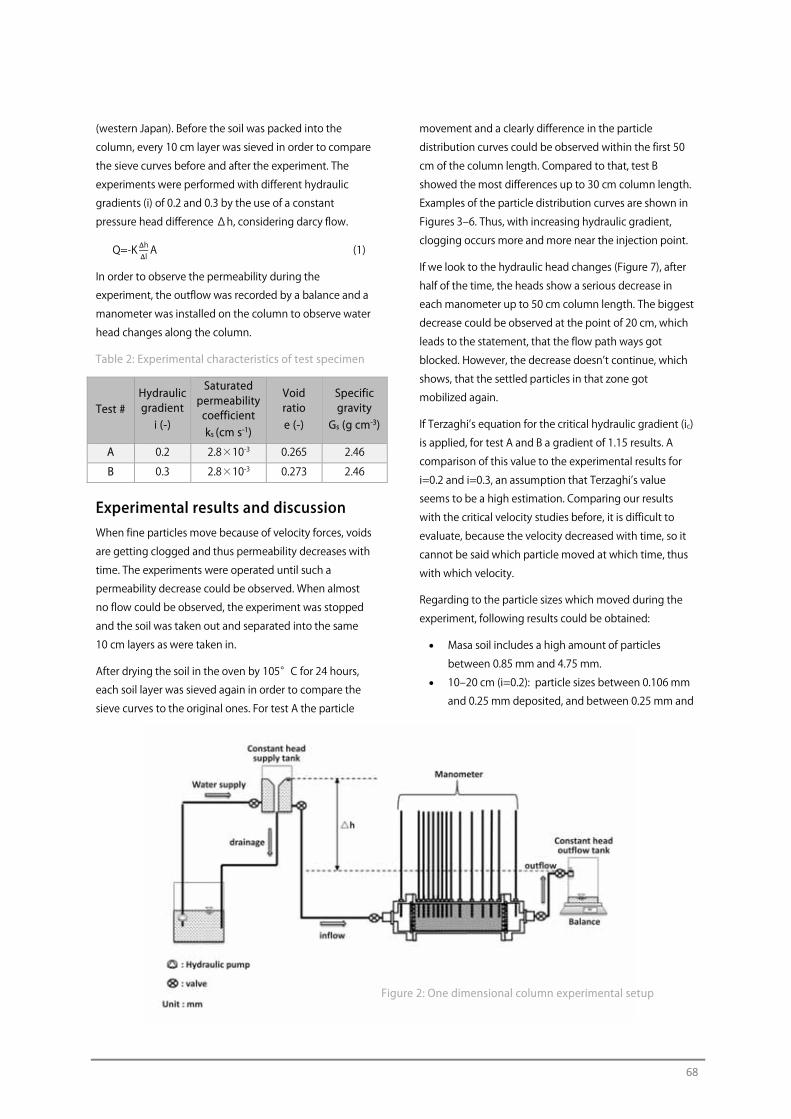
68
(western Japan). Before the soil was packed into the
column, every 10 cm layer was sieved in order to compare
the sieve curves before and after the experiment. The
experiments were performed with different hydraulic
gradients (i) of 0.2 and 0.3 by the use of a constant
pressure head difference Δh, considering darcy flow.
Q=-K hlA (1)
In order to observe the permeability during the
experiment, the outflow was recorded by a balance and a
manometer was installed on the column to observe water
head changes along the column.
Table 2: Experimental characteristics of test specimen
Test # Hydraulic gradient
i (-)
Saturated permeability coefficient ks (cm s-1)
Void ratio e (-)
Specific gravity
Gs (g cm-3)
A 0.2 2.8×10⁻³ 0.265 2.46
B 0.3 2.8×10⁻³ 0.273 2.46
Experimental results and discussion When fine particles move because of velocity forces, voids
are getting clogged and thus permeability decreases with
time. The experiments were operated until such a
permeability decrease could be observed. When almost
no flow could be observed, the experiment was stopped
and the soil was taken out and separated into the same
10 cm layers as were taken in.
After drying the soil in the oven by 105°C for 24 hours,
each soil layer was sieved again in order to compare the
sieve curves to the original ones. For test A the particle
movement and a clearly difference in the particle
distribution curves could be observed within the first 50
cm of the column length. Compared to that, test B
showed the most differences up to 30 cm column length.
Examples of the particle distribution curves are shown in
Figures 3‒6. Thus, with increasing hydraulic gradient,
clogging occurs more and more near the injection point.
If we look to the hydraulic head changes (Figure 7), after
half of the time, the heads show a serious decrease in
each manometer up to 50 cm column length. The biggest
decrease could be observed at the point of 20 cm, which
leads to the statement, that the flow path ways got
blocked. However, the decrease doesn’t continue, which
shows, that the settled particles in that zone got
mobilized again.
If Terzaghi’s equation for the critical hydraulic gradient (ic)
is applied, for test A and B a gradient of 1.15 results. A
comparison of this value to the experimental results for
i=0.2 and i=0.3, an assumption that Terzaghi’s value
seems to be a high estimation. Comparing our results
with the critical velocity studies before, it is difficult to
evaluate, because the velocity decreased with time, so it
cannot be said which particle moved at which time, thus
with which velocity.
Regarding to the particle sizes which moved during the
experiment, following results could be obtained:
• Masa soil includes a high amount of particles
between 0.85 mm and 4.75 mm.
• 10‒20 cm (i=0.2): particle sizes between 0.106 mm
and 0.25 mm deposited, and between 0.25 mm and
Figure 2: One dimensional column experimental setup
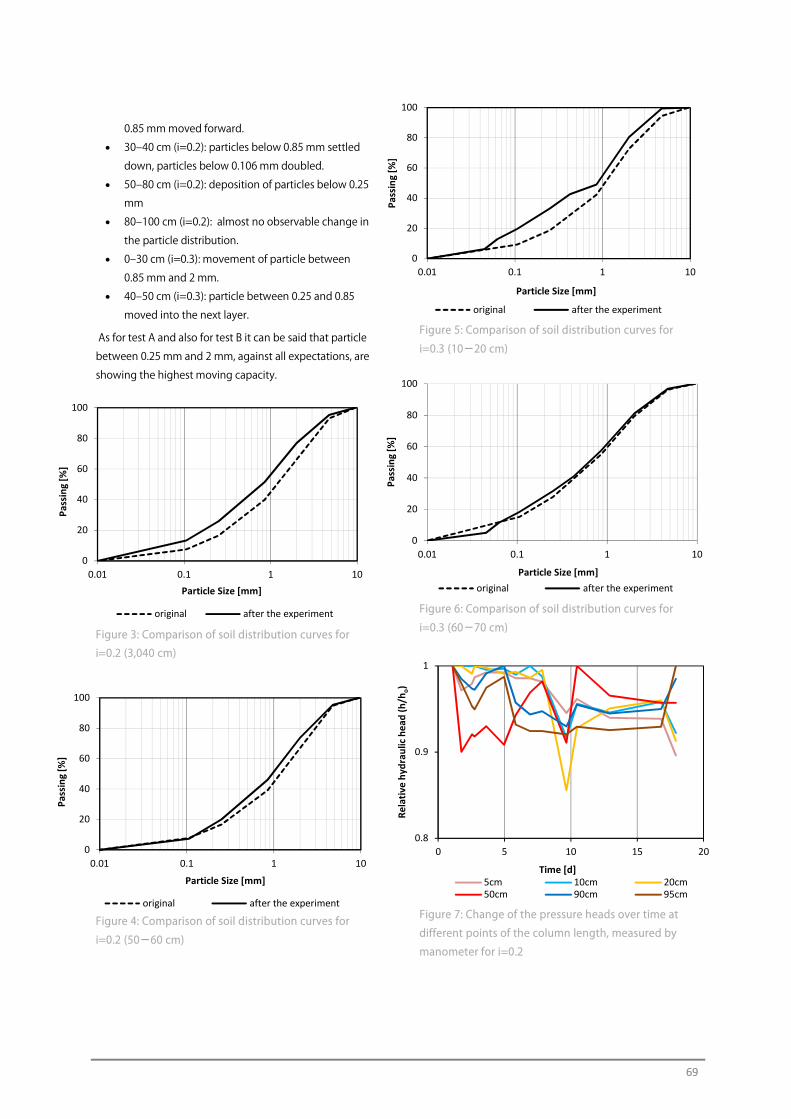
69
0.85 mm moved forward.
• 30‒40 cm (i=0.2): particles below 0.85 mm settled
down, particles below 0.106 mm doubled.
• 50‒80 cm (i=0.2): deposition of particles below 0.25
mm
• 80‒100 cm (i=0.2): almost no observable change in
the particle distribution.
• 0‒30 cm (i=0.3): movement of particle between
0.85 mm and 2 mm.
• 40‒50 cm (i=0.3): particle between 0.25 and 0.85
moved into the next layer.
As for test A and also for test B it can be said that particle
between 0.25 mm and 2 mm, against all expectations, are
showing the highest moving capacity.
Figure 3: Comparison of soil distribution curves for
i=0.2 (3,040 cm)
Figure 4: Comparison of soil distribution curves for
i=0.2 (50-60 cm)
Figure 5: Comparison of soil distribution curves for
i=0.3 (10-20 cm)
Figure 6: Comparison of soil distribution curves for
i=0.3 (60-70 cm)
Figure 7: Change of the pressure heads over time at
different points of the column length, measured by
manometer for i=0.2
0
20
40
60
80
100
0.01 0.1 1 10
Pass
ing
[%]
Particle Size [mm]
original after the experiment
0
20
40
60
80
100
0.01 0.1 1 10
Pass
ing
[%]
Particle Size [mm]
original after the experiment
0
20
40
60
80
100
0.01 0.1 1 10
Pass
ing
[%]
Particle Size [mm]
original after the experiment
0
20
40
60
80
100
0.01 0.1 1 10
Pass
ing
[%]
Particle Size [mm]original after the experiment
0.8
0.9
1
0 5 10 15 20
Rela
tive
hydr
aulic
hea
d (h
/ho)
Time [d]5cm 10cm 20cm50cm 90cm 95cm
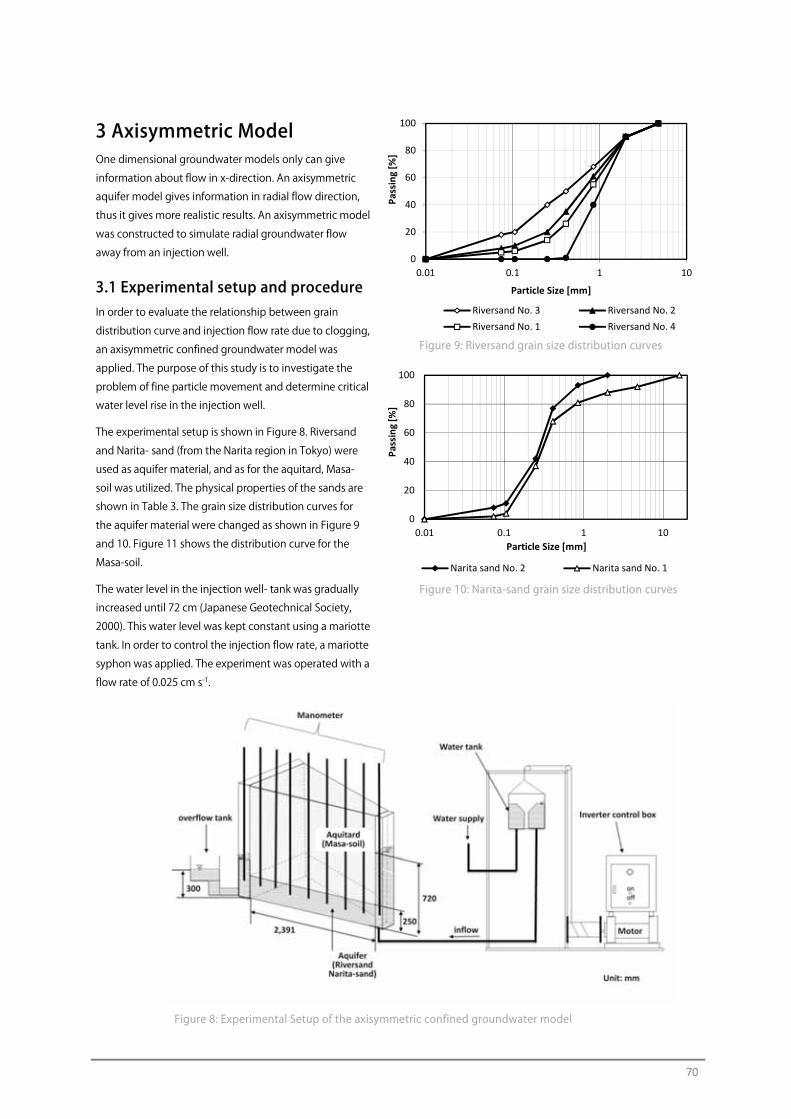
70
3 Axisymmetric Model One dimensional groundwater models only can give
information about flow in x-direction. An axisymmetric
aquifer model gives information in radial flow direction,
thus it gives more realistic results. An axisymmetric model
was constructed to simulate radial groundwater flow
away from an injection well.
3.1 Experimental setup and procedure In order to evaluate the relationship between grain
distribution curve and injection flow rate due to clogging,
an axisymmetric confined groundwater model was
applied. The purpose of this study is to investigate the
problem of fine particle movement and determine critical
water level rise in the injection well.
The experimental setup is shown in Figure 8. Riversand
and Narita- sand (from the Narita region in Tokyo) were
used as aquifer material, and as for the aquitard, Masa-
soil was utilized. The physical properties of the sands are
shown in Table 3. The grain size distribution curves for
the aquifer material were changed as shown in Figure 9
and 10. Figure 11 shows the distribution curve for the
Masa-soil.
The water level in the injection well- tank was gradually
increased until 72 cm (Japanese Geotechnical Society,
2000). This water level was kept constant using a mariotte
tank. In order to control the injection flow rate, a mariotte
syphon was applied. The experiment was operated with a
flow rate of 0.025 cm s-1.
Figure 9: Riversand grain size distribution curves
Figure 10: Narita-sand grain size distribution curves
Figure 8: Experimental Setup of the axisymmetric confined groundwater model
0
20
40
60
80
100
0.01 0.1 1 10
Pass
ing
[%]
Particle Size [mm]
Riversand No. 3 Riversand No. 2Riversand No. 1 Riversand No. 4
0
20
40
60
80
100
0.01 0.1 1 10
Pass
ing
[%]
Particle Size [mm]
Narita sand No. 2 Narita sand No. 1
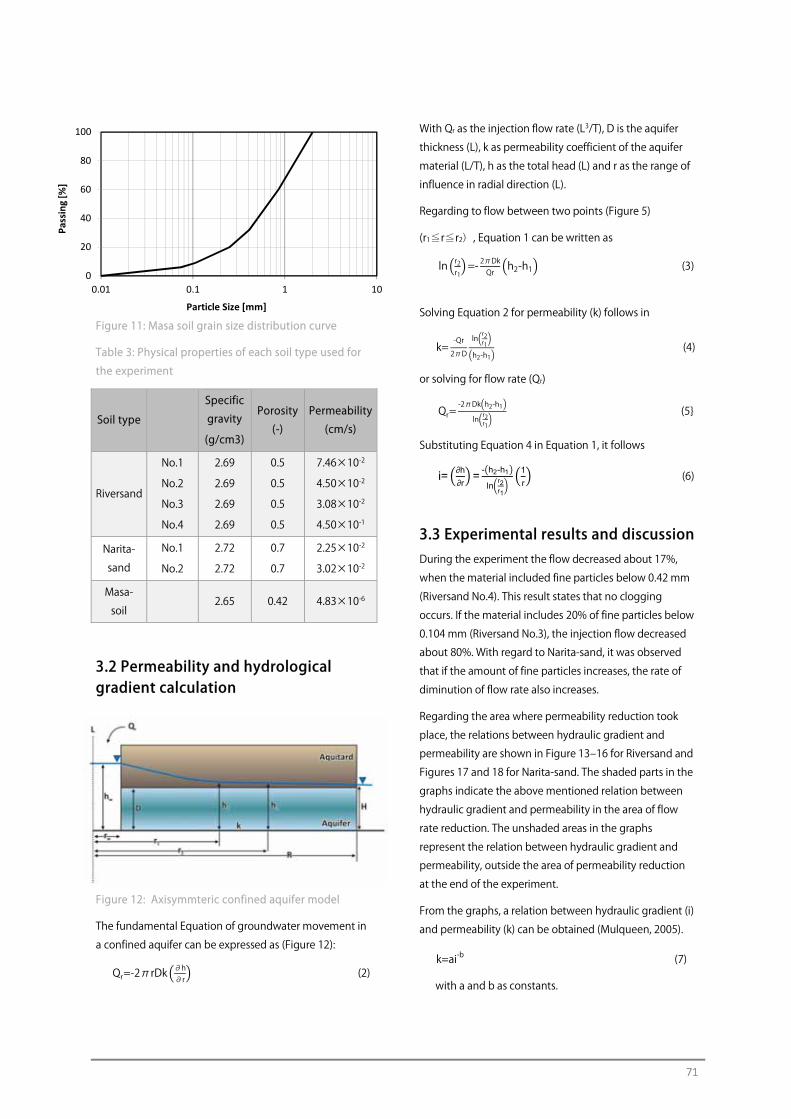
71
Figure 11: Masa soil grain size distribution curve
Table 3: Physical properties of each soil type used for
the experiment
Soil type
Specific
gravity
(g/cm3)
Porosity
(-)
Permeability
(cm/s)
Riversand
No.1
No.2
No.3
No.4
2.69
2.69
2.69
2.69
0.5
0.5
0.5
0.5
7.46×10⁻²
4.50×10⁻²
3.08×10⁻²
4.50×10⁻¹
Narita-
sand
No.1
No.2
2.72
2.72
0.7
0.7
2.25×10⁻²
3.02×10⁻²
Masa-
soil 2.65 0.42 4.83×10⁻⁶
3.2 Permeability and hydrological gradient calculation
Figure 12: Axisymmteric confined aquifer model
The fundamental Equation of groundwater movement in
a confined aquifer can be expressed as (Figure 12):
Qr=-2πrDk ∂h∂r
(2)
With Qr as the injection flow rate (L3/T), D is the aquifer
thickness (L), k as permeability coefficient of the aquifer
material (L/T), h as the total head (L) and r as the range of
influence in radial direction (L).
Regarding to flow between two points (Figure 5)
(r1≦r≦r2), Equation 1 can be written as ln r2r1
=- 2πDkQr
h2-h1 (3)
Solving Equation 2 for permeability (k) follows in
k=-Qr
2πD
lnr2r1
h2-h1 (4)
or solving for flow rate (Qr)
Qr=-2πDk h2-h1
lnr2r1
(5}
Substituting Equation 4 in Equation 1, it follows
i=∂h
∂r=
- h2-h1
lnr2r1
1
r (6)
3.3 Experimental results and discussion During the experiment the flow decreased about 17%,
when the material included fine particles below 0.42 mm
(Riversand No.4). This result states that no clogging
occurs. If the material includes 20% of fine particles below
0.104 mm (Riversand No.3), the injection flow decreased
about 80%. With regard to Narita-sand, it was observed
that if the amount of fine particles increases, the rate of
diminution of flow rate also increases.
Regarding the area where permeability reduction took
place, the relations between hydraulic gradient and
permeability are shown in Figure 13‒16 for Riversand and
Figures 17 and 18 for Narita-sand. The shaded parts in the
graphs indicate the above mentioned relation between
hydraulic gradient and permeability in the area of flow
rate reduction. The unshaded areas in the graphs
represent the relation between hydraulic gradient and
permeability, outside the area of permeability reduction
at the end of the experiment.
From the graphs, a relation between hydraulic gradient (i)
and permeability (k) can be obtained (Mulqueen, 2005).
k=ai-b (7)
with a and b as constants.
0
20
40
60
80
100
0.01 0.1 1 10
Pass
ing
[%]
Particle Size [mm]
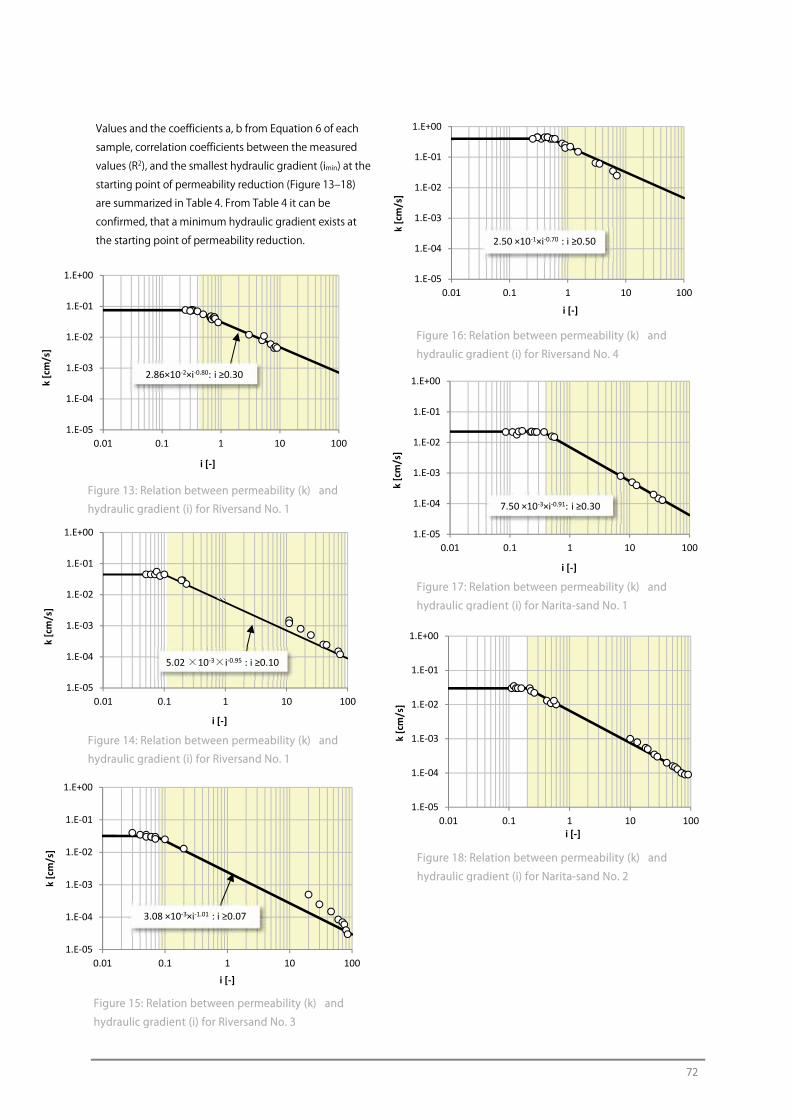
72
1.E-05
1.E-04
1.E-03
1.E-02
1.E-01
1.E+00
0.01 0.1 1 10 100
k [c
m/s
]
i [-]
3.08 ×10⁻³×i-1.01 : i ≥0.07
1.E-05
1.E-04
1.E-03
1.E-02
1.E-01
1.E+00
0.01 0.1 1 10 100
k [c
m/s
]
i [-]
7.50 ×10⁻³×i-0.91: i ≥0.30
1.E-05
1.E-04
1.E-03
1.E-02
1.E-01
1.E+00
0.01 0.1 1 10 100
k [c
m/s
]
i [-]
5.02 ×10⁻³×i-0.95 : i ≥0.10
Values and the coefficients a, b from Equation 6 of each
sample, correlation coefficients between the measured
values (R2), and the smallest hydraulic gradient (imin) at the
starting point of permeability reduction (Figure 13‒18)
are summarized in Table 4. From Table 4 it can be
confirmed, that a minimum hydraulic gradient exists at
the starting point of permeability reduction.
1.E-05
1.E-04
1.E-03
1.E-02
1.E-01
1.E+00
0.01 0.1 1 10 100
k [c
m/s
]
i [-]
2.86×10⁻²×i-0.80: i ≥0.30
1.E-05
1.E-04
1.E-03
1.E-02
1.E-01
1.E+00
0.01 0.1 1 10 100
k [c
m/s
]
i [-]
2.50 ×10⁻¹×i-0.70 : i ≥0.50
1.E-05
1.E-04
1.E-03
1.E-02
1.E-01
1.E+00
0.01 0.1 1 10 100
k [c
m/s
]
i [-]
Figure 13: Relation between permeability (k) and
hydraulic gradient (i) for Riversand No. 1
Figure 15: Relation between permeability (k) and
hydraulic gradient (i) for Riversand No. 3
Figure 14: Relation between permeability (k) and
hydraulic gradient (i) for Riversand No. 1
Figure 16: Relation between permeability (k) and
hydraulic gradient (i) for Riversand No. 4
Figure 17: Relation between permeability (k) and
hydraulic gradient (i) for Narita-sand No. 1
Figure 18: Relation between permeability (k) and
hydraulic gradient (i) for Narita-sand No. 2
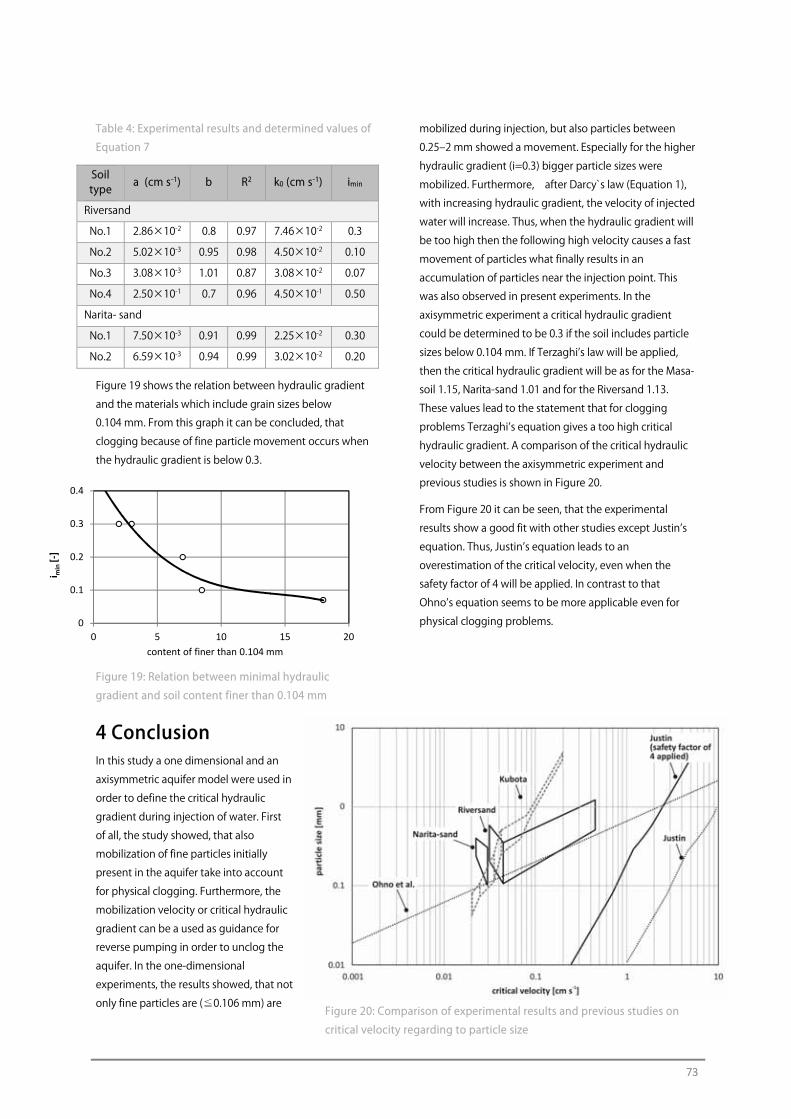
73
Table 4: Experimental results and determined values of
Equation 7
Soil type
a (cm s-1) b R2 k0 (cm s-1) imin
Riversand
No.1 2.86×10⁻² 0.8 0.97 7.46×10⁻² 0.3
No.2 5.02×10⁻³ 0.95 0.98 4.50×10⁻² 0.10
No.3 3.08×10⁻³ 1.01 0.87 3.08×10⁻² 0.07
No.4 2.50×10⁻¹ 0.7 0.96 4.50×10⁻¹ 0.50
Narita- sand
No.1 7.50×10⁻³ 0.91 0.99 2.25×10⁻² 0.30
No.2 6.59×10⁻³ 0.94 0.99 3.02×10⁻² 0.20
Figure 19 shows the relation between hydraulic gradient
and the materials which include grain sizes below
0.104 mm. From this graph it can be concluded, that
clogging because of fine particle movement occurs when
the hydraulic gradient is below 0.3.
Figure 19: Relation between minimal hydraulic
gradient and soil content finer than 0.104 mm
4 Conclusion In this study a one dimensional and an
axisymmetric aquifer model were used in
order to define the critical hydraulic
gradient during injection of water. First
of all, the study showed, that also
mobilization of fine particles initially
present in the aquifer take into account
for physical clogging. Furthermore, the
mobilization velocity or critical hydraulic
gradient can be a used as guidance for
reverse pumping in order to unclog the
aquifer. In the one-dimensional
experiments, the results showed, that not
only fine particles are (≦0.106 mm) are
mobilized during injection, but also particles between
0.25‒2 mm showed a movement. Especially for the higher
hydraulic gradient (i=0.3) bigger particle sizes were
mobilized. Furthermore, after Darcy`s law (Equation 1),
with increasing hydraulic gradient, the velocity of injected
water will increase. Thus, when the hydraulic gradient will
be too high then the following high velocity causes a fast
movement of particles what finally results in an
accumulation of particles near the injection point. This
was also observed in present experiments. In the
axisymmetric experiment a critical hydraulic gradient
could be determined to be 0.3 if the soil includes particle
sizes below 0.104 mm. If Terzaghi’s law will be applied,
then the critical hydraulic gradient will be as for the Masa-
soil 1.15, Narita-sand 1.01 and for the Riversand 1.13.
These values lead to the statement that for clogging
problems Terzaghi’s equation gives a too high critical
hydraulic gradient. A comparison of the critical hydraulic
velocity between the axisymmetric experiment and
previous studies is shown in Figure 20.
From Figure 20 it can be seen, that the experimental
results show a good fit with other studies except Justin’s
equation. Thus, Justin’s equation leads to an
overestimation of the critical velocity, even when the
safety factor of 4 will be applied. In contrast to that
Ohno’s equation seems to be more applicable even for
physical clogging problems.
0
0.1
0.2
0.3
0.4
0 5 10 15 20
i min
[-]
content of finer than 0.104 mm
Figure 20: Comparison of experimental results and previous studies on
critical velocity regarding to particle size
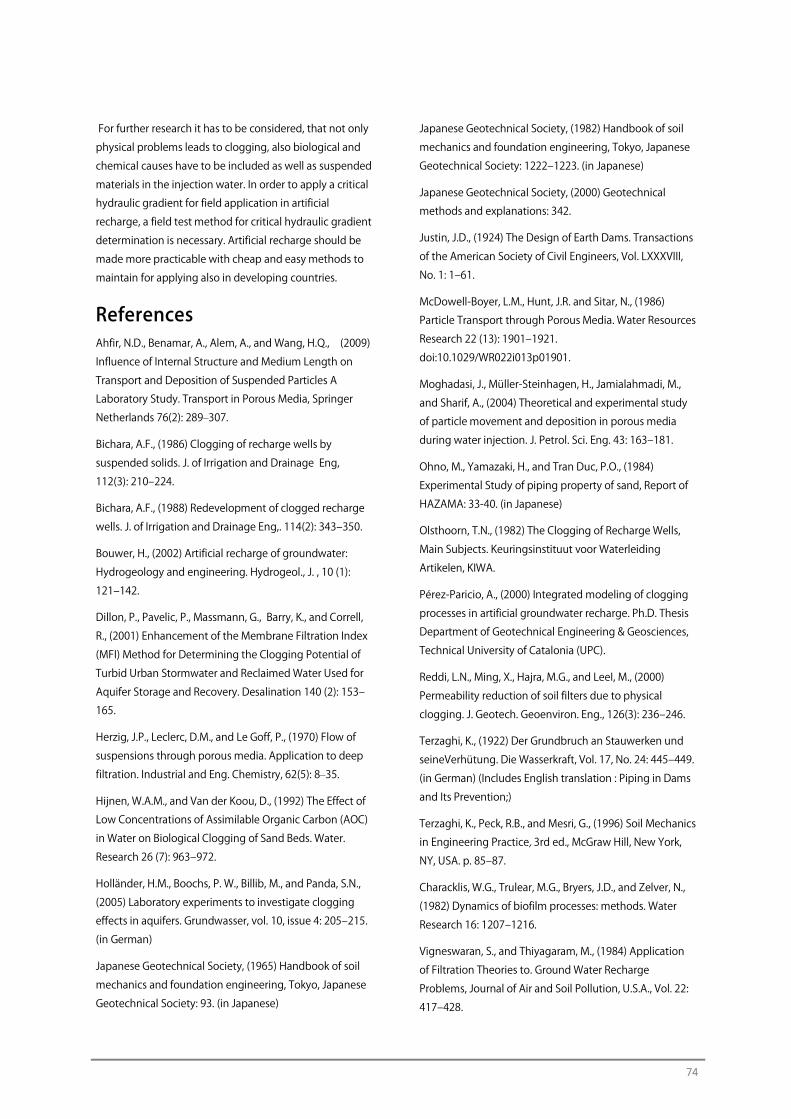
74
For further research it has to be considered, that not only
physical problems leads to clogging, also biological and
chemical causes have to be included as well as suspended
materials in the injection water. In order to apply a critical
hydraulic gradient for field application in artificial
recharge, a field test method for critical hydraulic gradient
determination is necessary. Artificial recharge should be
made more practicable with cheap and easy methods to
maintain for applying also in developing countries.
References Ahfir, N.D., Benamar, A., Alem, A., and Wang, H.Q., (2009)
Influence of Internal Structure and Medium Length on
Transport and Deposition of Suspended Particles A
Laboratory Study. Transport in Porous Media, Springer
Netherlands 76(2): 289–307.
Bichara, A.F., (1986) Clogging of recharge wells by
suspended solids. J. of Irrigation and Drainage Eng,
112(3): 210‒224.
Bichara, A.F., (1988) Redevelopment of clogged recharge
wells. J. of Irrigation and Drainage Eng,. 114(2): 343‒350.
Bouwer, H., (2002) Artificial recharge of groundwater:
Hydrogeology and engineering. Hydrogeol., J. , 10 (1):
121‒142.
Dillon, P., Pavelic, P., Massmann, G., Barry, K., and Correll,
R., (2001) Enhancement of the Membrane Filtration Index
(MFI) Method for Determining the Clogging Potential of
Turbid Urban Stormwater and Reclaimed Water Used for
Aquifer Storage and Recovery. Desalination 140 (2): 153‒
165.
Herzig, J.P., Leclerc, D.M., and Le Goff, P., (1970) Flow of
suspensions through porous media. Application to deep
filtration. Industrial and Eng. Chemistry, 62(5): 8–35.
Hijnen, W.A.M., and Van der Koou, D., (1992) The Effect of
Low Concentrations of Assimilable Organic Carbon (AOC)
in Water on Biological Clogging of Sand Beds. Water.
Research 26 (7): 963‒972.
Holländer, H.M., Boochs, P. W., Billib, M., and Panda, S.N.,
(2005) Laboratory experiments to investigate clogging
effects in aquifers. Grundwasser, vol. 10, issue 4: 205‒215.
(in German)
Japanese Geotechnical Society, (1965) Handbook of soil
mechanics and foundation engineering, Tokyo, Japanese
Geotechnical Society: 93. (in Japanese)
Japanese Geotechnical Society, (1982) Handbook of soil
mechanics and foundation engineering, Tokyo, Japanese
Geotechnical Society: 1222‒1223. (in Japanese)
Japanese Geotechnical Society, (2000) Geotechnical
methods and explanations: 342.
Justin, J.D., (1924) The Design of Earth Dams. Transactions
of the American Society of Civil Engineers, Vol. LXXXVIII,
No. 1: 1‒61.
McDowell-Boyer, L.M., Hunt, J.R. and Sitar, N., (1986)
Particle Transport through Porous Media. Water Resources
Research 22 (13): 1901‒1921.
doi:10.1029/WR022i013p01901.
Moghadasi, J., Müller-Steinhagen, H., Jamialahmadi, M.,
and Sharif, A., (2004) Theoretical and experimental study
of particle movement and deposition in porous media
during water injection. J. Petrol. Sci. Eng. 43: 163‒181.
Ohno, M., Yamazaki, H., and Tran Duc, P.O., (1984)
Experimental Study of piping property of sand, Report of
HAZAMA: 33-40. (in Japanese)
Olsthoorn, T.N., (1982) The Clogging of Recharge Wells,
Main Subjects. Keuringsinstituut voor Waterleiding
Artikelen, KIWA.
Pérez-Paricio, A., (2000) Integrated modeling of clogging
processes in artificial groundwater recharge. Ph.D. Thesis Department of Geotechnical Engineering & Geosciences,
Technical University of Catalonia (UPC).
Reddi, L.N., Ming, X., Hajra, M.G., and LeeI, M., (2000)
Permeability reduction of soil filters due to physical
clogging. J. Geotech. Geoenviron. Eng., 126(3): 236‒246.
Terzaghi, K., (1922) Der Grundbruch an Stauwerken und
seineVerhütung. Die Wasserkraft, Vol. 17, No. 24: 445‒449.
(in German) (Includes English translation : Piping in Dams
and Its Prevention;)
Terzaghi, K., Peck, R.B., and Mesri, G., (1996) Soil Mechanics
in Engineering Practice, 3rd ed., McGraw Hill, New York,
NY, USA. p. 85‒87.
Characklis, W.G., Trulear, M.G., Bryers, J.D., and Zelver, N.,
(1982) Dynamics of biofilm processes: methods. Water
Research 16: 1207‒1216.
Vigneswaran, S., and Thiyagaram, M., (1984) Application
of Filtration Theories to. Ground Water Recharge
Problems, Journal of Air and Soil Pollution, U.S.A., Vol. 22:
417‒428.

75
Vigneswaran, S., Jeyaseelan, S., and Das Gupta, S., (1985)
A Pilot-Scale Investigation of Particle Retention During
Artificial Recharge , Water, Air, and Soil Pollution, 25: 1‒13.
Ye, X., Du, X., Li, S., and Yang, Y., (2010) Study on Clogging
Mechanism and Control Methods of Artificial Recharge. In
2010 International Conference on Challenges in
Environmental Science and Computer Engineering
(CESCE), 2:29‒32.
Contact Details Email: [email protected]

76
CLOGGING ASSOCIATED WITH INFILTRATION BASINS
77
Soil Clogging Phenomena in Vertical Flow A. Benamar
LOMC UMR 6294 CNRS-Université du Havre, Franc
Abstract Particle movement and deposition are known to be serious problems for filtration systems. Dramatic
reductions in filter permeability are observed in such cases as consequence of deposition of fine particles
transported by fluid in the porous media. Accumulation and deposition of suspended solids in porous media
can ultimately lead to clogging. The main purpose of this paper is to assess some relations governing filtration
behaviour. Packed sand columns were used to investigate soil clogging, focusing on the questions of
identification and the description of porosity damage. Some laboratory filtration tests were carried out using
various granular sizes of filters and changes in soil water retention, pore size distribution, and saturated
hydraulic conductivity due particle deposition were investigated. The results obtained show that filtration and
likely clogging depend on particle concentration and flow conditions. The research results clearly show under
what conditions soil clogging occurs and how to mitigate this problem. This potential for clogging has been
expressed in terms of soil-type parameters used in soil physics, such as a pore damage index, which gives
engineers and geo-hydrologists a tool to assess the potential for clogging in a specific soil condition. Maximum
clogging occurs mainly in the upper lay of the bed and is dependent on the suspension concentration, pore
structure and flow rate.
1 Introduction Permeability reduction caused by particle deposition
(physical clogging) in porous media is important in filter
beds. Soil filters, which are commonly used to provide
stability and drainage in dams and dykes, are prone to
long-term accumulation of fine micron-sized particles.
This causes reduction in the permeability, which in turn
may lead to intolerable decreases in their drainage
capacity and uplift pressures in the core. Soil bed layers
operating as filters are also prone to clogging since the
flow involves suspended particles. The operation of deep-
bed filters for water treatment is constrained by the
available head loss. In natural aquifers, controlling
permeability is essential for the operation of injection or
extraction wells and in quantifying contaminant mobility
(Kretzschmar et al., 1999). Clogging is relevant to
enhanced bioremediation, since microbial growth alters
flow and transport. The flow of suspended particles
through a filter is a complex phenomenon owing to
define two mechanisms in deep filtration: a mechanical
filtration for large particles and a physicochemical
filtration for small particles (Herzig et al., 1970). When
flowing through porous medium, the particles are
brought in contact with retention sites; they stop there or
are carried away by the stream. The deep filtration is
therefore the result of several mechanisms: the contacting
of particles with the retention sites, the fixing of particles
on sites, and eventually the breaking away of previously
retained particles.
During the flow of suspended particles through a porous
medium, particle transport and retention derived from
several forces and mechanisms depending on particle
size, pore distribution and flow rate (Ahfir et al., 2009),
(Benamar et al., 2007), (Silliman et al., 1995). The particle
retention may reduce the permeability of the porous
medium as observed during the artificial recharge of
aquifers or the exploitation of oil wells (Moghadasi et al.,
2004). The flow results obtained by Khilar et al. (1987)
elucidate the interaction of colloid chemistry and
hydrodynamics in entrapment and release of fine
particles. They do not distinguish between size
distributions of particles in suspension, and assume that
78
particle trapping does not occur until the concentration
of clay particles in suspension reaches a certain threshold
value. The release occurs below a critical salt
concentration and above a critical flow velocity. The
capture of fines at the pore constrictions is partly due to
direct interception and partly due to size exclusion.
Several studies have noted that, for a given mass of
deposited material, experiments conducted at greater
fluid velocity show greater permeability (Mays et al.,
2005). Previous researchers have recognized the
importance of deposit morphology during long-term
particle retention in saturated porous media. The different
mechanisms leading to permeability damages due to
particle deposition were analysed under various situations
by Chauveteau et al. (1998). They noted the influence of
hydrodynamic forces and the effects of the location
where the particles are deposited on permeability. Recent
researches indicate that the rate of particle straining
within saturated porous media is sensitive to the ratio of
particle diameter (dp) to sand-grain diameter (dg), the
shape of surface roughness of the solid matrix, particle
size non uniformity, pore-scale hydrodynamics and pore
water chemistry (Bradford et al., 2007), (Xu et al., 2006),
(Xu et al., 2009), (Porubcan et al., 2011). The flow of
suspended particles through a filter is a process owing to
define two mechanisms in deep filtration: a mechanical
filtration for large particles and a physicochemical
filtration for small particles. When flowing through porous
medium, the particles are brought in contact with
retention sites; they stop there or are carried away by the
stream. The deep filtration is therefore the result of
several mechanisms: the contacting of particles with the
retention sites, the fixing of particles on sites, and
eventually the breaking away of previously retained
particles. The capture of fines at the pore constrictions is
partly due to direct interception and partly due to size
exclusion (Benamar et al., 2007). Previous researchers
have recognized the importance of deposit morphology
during long-term particle retention in saturated porous
media. The physicochemical filtration of colloidal particles
in saturated porous media was studied by Tufenkji et al.
(2004) and a new equation for predicting the single-
collector contact efficiency is presented. The correlation
equation is developed using the sum of the contributions
of the transport mechanisms.
This work identifies the main phenomena that control the
transport and deposition of clay particles in a sand core
and likely clogging. The reduction in the vertical
permeability as a result of clogging has been analysed.
Under constant flow conditions, clogging is observed
through a head loss and the amount of deposited
particles. An experimental investigation was undertaken
to look into the possible causes of permeability damage
and clogging. Sand and glass beds were used to study the
general behaviour of fine particles movement and
deposition in porous media. The experiments were firstly
conducted with constant flow rate and secondly with
fixed head condition. An investigation was used to
quantify the amount of particles retained in the medium.
2 Description of filtration test In general, the experiments performed in order to
investigate the soil filtration mainly fall in two categories:
those using slurry of fine soil forced against the filter by
high pressure water, or those having the fine soil
compacted against the filter and often simulating the
formation of a crack by a pinhole through the base soil.
The results reported here are dealing with the first
category of laboratory experiments (Figure 1). Fine
particles (kaolinite clay) and several filter grain sizes are
used. Laboratory flow tests were performed in a vertical
column under constant flow conditions in the first part
and under constant head conditions in the second part.
The column is 400 mm length and 40 mm diameter and
packed in 5 cm increment by pouring the material (sand)
into the pre-filled column with fresh water. Six
piezometers are installed along the column in order to
carry out the permeability reduction during the filtration
tests. The column is fed by two reservoirs containing
degassed water (pH of 6.8) and suspended particles, using
a peristaltic pump (for tests under constant flow rate). As
the porous medium is saturated the flow toward the
column is switched to particle suspension. Figure 1 shows
the configuration of the experimental device under
constant flow conditions. The detection system consists
of a Fisher Instrument turbidity meter which determines
the turbidity level by measuring the amount of light
scattered at 90° by the suspended particles. The particle
concentrations in the effluent were determined with the
help of correlations made a priori between suspended
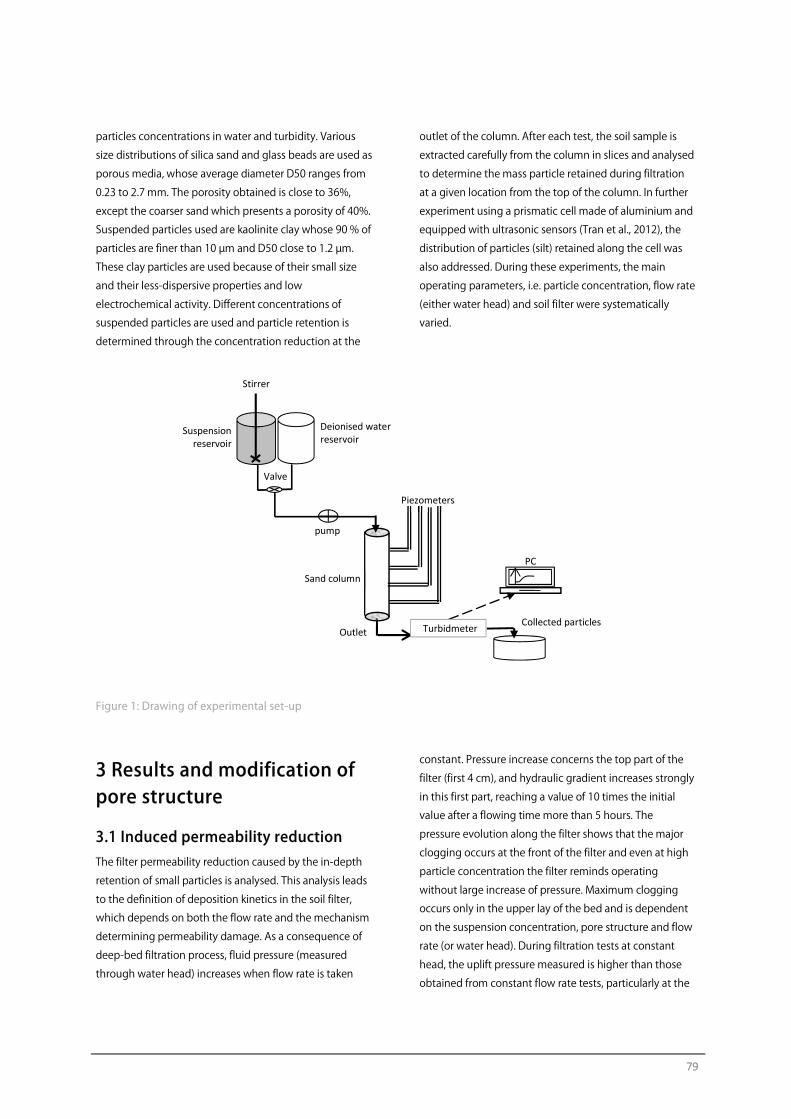
79
particles concentrations in water and turbidity. Various
size distributions of silica sand and glass beads are used as
porous media, whose average diameter D50 ranges from
0.23 to 2.7 mm. The porosity obtained is close to 36%,
except the coarser sand which presents a porosity of 40%.
Suspended particles used are kaolinite clay whose 90 % of
particles are finer than 10 µm and D50 close to 1.2 µm.
These clay particles are used because of their small size
and their less-dispersive properties and low
electrochemical activity. Different concentrations of
suspended particles are used and particle retention is
determined through the concentration reduction at the
outlet of the column. After each test, the soil sample is
extracted carefully from the column in slices and analysed
to determine the mass particle retained during filtration
at a given location from the top of the column. In further
experiment using a prismatic cell made of aluminium and
equipped with ultrasonic sensors (Tran et al., 2012), the
distribution of particles (silt) retained along the cell was
also addressed. During these experiments, the main
operating parameters, i.e. particle concentration, flow rate
(either water head) and soil filter were systematically
varied.
Figure 1: Drawing of experimental set-up
3 Results and modification of pore structure
3.1 Induced permeability reduction The filter permeability reduction caused by the in-depth
retention of small particles is analysed. This analysis leads
to the definition of deposition kinetics in the soil filter,
which depends on both the flow rate and the mechanism
determining permeability damage. As a consequence of
deep-bed filtration process, fluid pressure (measured
through water head) increases when flow rate is taken
constant. Pressure increase concerns the top part of the
filter (first 4 cm), and hydraulic gradient increases strongly
in this first part, reaching a value of 10 times the initial
value after a flowing time more than 5 hours. The
pressure evolution along the filter shows that the major
clogging occurs at the front of the filter and even at high
particle concentration the filter reminds operating
without large increase of pressure. Maximum clogging
occurs only in the upper lay of the bed and is dependent
on the suspension concentration, pore structure and flow
rate (or water head). During filtration tests at constant
head, the uplift pressure measured is higher than those
obtained from constant flow rate tests, particularly at the
Collected particles
pump
Piezometers
Turbidmeter
PC
Deionised waterreservoir
Suspension reservoir
Stirrer
Outlet
Valve
Sand column
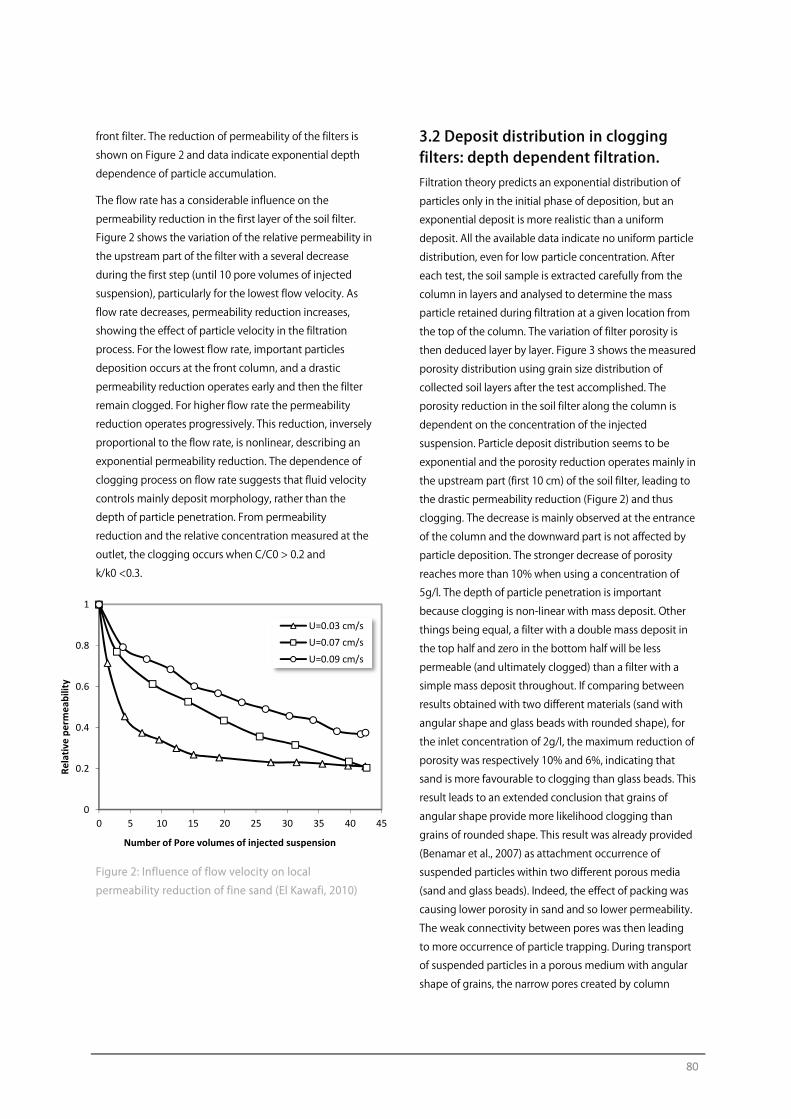
80
0
0.2
0.4
0.6
0.8
1
0 5 10 15 20 25 30 35 40 45
Rela
tive
perm
eabi
lity
Number of Pore volumes of injected suspension
U=0.03 cm/sU=0.07 cm/sU=0.09 cm/s
front filter. The reduction of permeability of the filters is
shown on Figure 2 and data indicate exponential depth
dependence of particle accumulation.
The flow rate has a considerable influence on the
permeability reduction in the first layer of the soil filter.
Figure 2 shows the variation of the relative permeability in
the upstream part of the filter with a several decrease
during the first step (until 10 pore volumes of injected
suspension), particularly for the lowest flow velocity. As
flow rate decreases, permeability reduction increases,
showing the effect of particle velocity in the filtration
process. For the lowest flow rate, important particles
deposition occurs at the front column, and a drastic
permeability reduction operates early and then the filter
remain clogged. For higher flow rate the permeability
reduction operates progressively. This reduction, inversely
proportional to the flow rate, is nonlinear, describing an
exponential permeability reduction. The dependence of
clogging process on flow rate suggests that fluid velocity
controls mainly deposit morphology, rather than the
depth of particle penetration. From permeability
reduction and the relative concentration measured at the
outlet, the clogging occurs when C/C0 > 0.2 and
k/k0 <0.3.
Figure 2: Influence of flow velocity on local
permeability reduction of fine sand (El Kawafi, 2010)
3.2 Deposit distribution in clogging filters: depth dependent filtration. Filtration theory predicts an exponential distribution of
particles only in the initial phase of deposition, but an
exponential deposit is more realistic than a uniform
deposit. All the available data indicate no uniform particle
distribution, even for low particle concentration. After
each test, the soil sample is extracted carefully from the
column in layers and analysed to determine the mass
particle retained during filtration at a given location from
the top of the column. The variation of filter porosity is
then deduced layer by layer. Figure 3 shows the measured
porosity distribution using grain size distribution of
collected soil layers after the test accomplished. The
porosity reduction in the soil filter along the column is
dependent on the concentration of the injected
suspension. Particle deposit distribution seems to be
exponential and the porosity reduction operates mainly in
the upstream part (first 10 cm) of the soil filter, leading to
the drastic permeability reduction (Figure 2) and thus
clogging. The decrease is mainly observed at the entrance
of the column and the downward part is not affected by
particle deposition. The stronger decrease of porosity
reaches more than 10% when using a concentration of
5g/l. The depth of particle penetration is important
because clogging is non-linear with mass deposit. Other
things being equal, a filter with a double mass deposit in
the top half and zero in the bottom half will be less
permeable (and ultimately clogged) than a filter with a
simple mass deposit throughout. If comparing between
results obtained with two different materials (sand with
angular shape and glass beads with rounded shape), for
the inlet concentration of 2g/l, the maximum reduction of
porosity was respectively 10% and 6%, indicating that
sand is more favourable to clogging than glass beads. This
result leads to an extended conclusion that grains of
angular shape provide more likelihood clogging than
grains of rounded shape. This result was already provided
(Benamar et al., 2007) as attachment occurrence of
suspended particles within two different porous media
(sand and glass beads). Indeed, the effect of packing was
causing lower porosity in sand and so lower permeability.
The weak connectivity between pores was then leading
to more occurrence of particle trapping. During transport
of suspended particles in a porous medium with angular
shape of grains, the narrow pores created by column
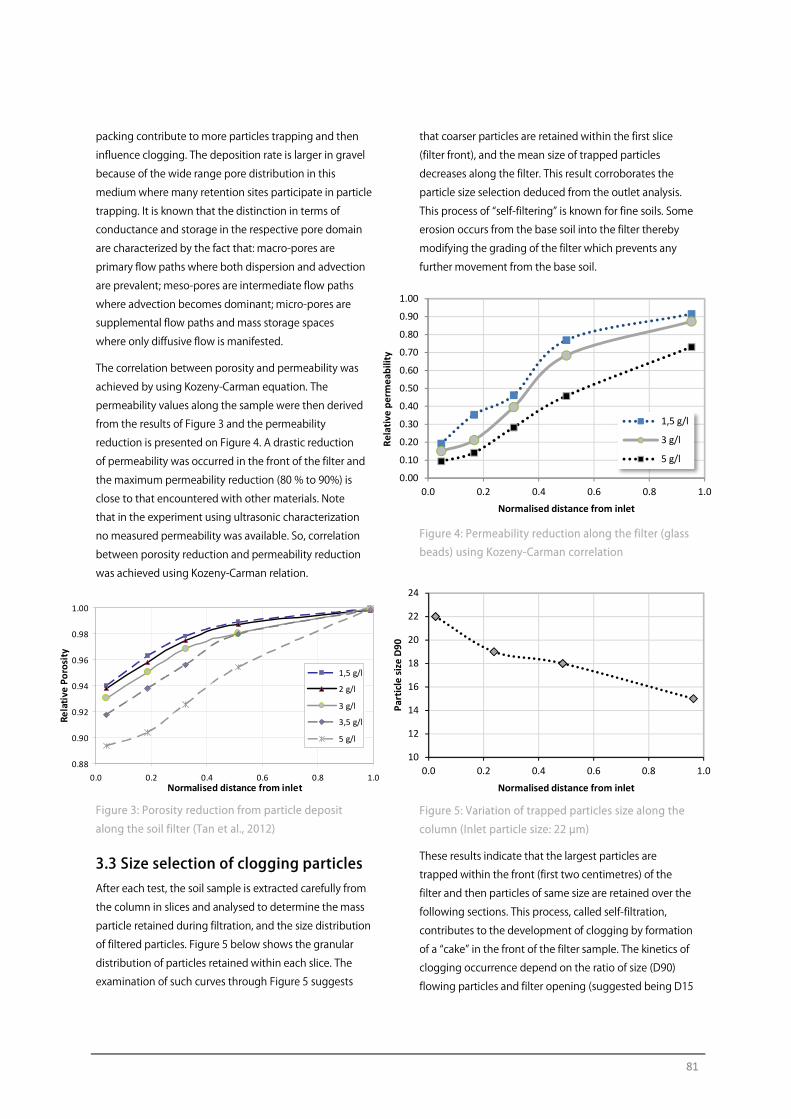
81
0.00
0.10
0.20
0.30
0.40
0.50
0.60
0.70
0.80
0.90
1.00
0.0 0.2 0.4 0.6 0.8 1.0
Rela
tive
perm
eabi
lity
Normalised distance from inlet
1,5 g/l
3 g/l
5 g/l
packing contribute to more particles trapping and then
influence clogging. The deposition rate is larger in gravel
because of the wide range pore distribution in this
medium where many retention sites participate in particle
trapping. It is known that the distinction in terms of
conductance and storage in the respective pore domain
are characterized by the fact that: macro-pores are
primary flow paths where both dispersion and advection
are prevalent; meso-pores are intermediate flow paths
where advection becomes dominant; micro-pores are
supplemental flow paths and mass storage spaces
where only diffusive flow is manifested.
The correlation between porosity and permeability was
achieved by using Kozeny-Carman equation. The
permeability values along the sample were then derived
from the results of Figure 3 and the permeability
reduction is presented on Figure 4. A drastic reduction
of permeability was occurred in the front of the filter and
the maximum permeability reduction (80 % to 90%) is
close to that encountered with other materials. Note
that in the experiment using ultrasonic characterization
no measured permeability was available. So, correlation
between porosity reduction and permeability reduction
was achieved using Kozeny-Carman relation.
Figure 3: Porosity reduction from particle deposit
along the soil filter (Tan et al., 2012)
3.3 Size selection of clogging particles After each test, the soil sample is extracted carefully from
the column in slices and analysed to determine the mass
particle retained during filtration, and the size distribution
of filtered particles. Figure 5 below shows the granular
distribution of particles retained within each slice. The
examination of such curves through Figure 5 suggests
that coarser particles are retained within the first slice
(filter front), and the mean size of trapped particles
decreases along the filter. This result corroborates the
particle size selection deduced from the outlet analysis.
This process of “self-filtering” is known for fine soils. Some
erosion occurs from the base soil into the filter thereby
modifying the grading of the filter which prevents any
further movement from the base soil.
Figure 4: Permeability reduction along the filter (glass
beads) using Kozeny-Carman correlation
Figure 5: Variation of trapped particles size along the
column (Inlet particle size: 22 µm)
These results indicate that the largest particles are
trapped within the front (first two centimetres) of the
filter and then particles of same size are retained over the
following sections. This process, called self-filtration,
contributes to the development of clogging by formation
of a “cake” in the front of the filter sample. The kinetics of
clogging occurrence depend on the ratio of size (D90)
flowing particles and filter opening (suggested being D15
10
12
14
16
18
20
22
24
0.0 0.2 0.4 0.6 0.8 1.0
Part
icle
size
D90
Normalised distance from inlet
0.88
0.90
0.92
0.94
0.96
0.98
1.00
0.0 0.2 0.4 0.6 0.8 1.0Normalised distance from inlet
Rela
tive
Poro
sity
1,5 g/l
2 g/l
3 g/l
3,5 g/l
5 g/l
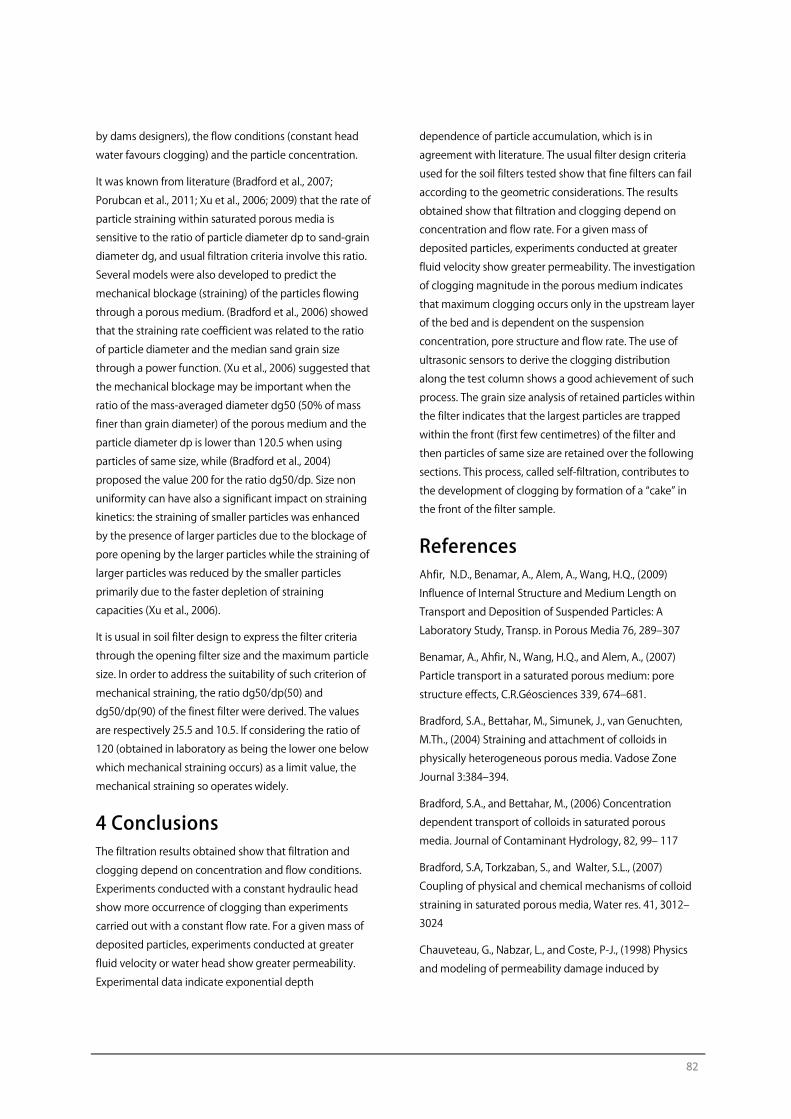
82
by dams designers), the flow conditions (constant head
water favours clogging) and the particle concentration.
It was known from literature (Bradford et al., 2007;
Porubcan et al., 2011; Xu et al., 2006; 2009) that the rate of
particle straining within saturated porous media is
sensitive to the ratio of particle diameter dp to sand-grain
diameter dg, and usual filtration criteria involve this ratio.
Several models were also developed to predict the
mechanical blockage (straining) of the particles flowing
through a porous medium. (Bradford et al., 2006) showed
that the straining rate coefficient was related to the ratio
of particle diameter and the median sand grain size
through a power function. (Xu et al., 2006) suggested that
the mechanical blockage may be important when the
ratio of the mass-averaged diameter dg50 (50% of mass
finer than grain diameter) of the porous medium and the
particle diameter dp is lower than 120.5 when using
particles of same size, while (Bradford et al., 2004)
proposed the value 200 for the ratio dg50/dp. Size non
uniformity can have also a significant impact on straining
kinetics: the straining of smaller particles was enhanced
by the presence of larger particles due to the blockage of
pore opening by the larger particles while the straining of
larger particles was reduced by the smaller particles
primarily due to the faster depletion of straining
capacities (Xu et al., 2006).
It is usual in soil filter design to express the filter criteria
through the opening filter size and the maximum particle
size. In order to address the suitability of such criterion of
mechanical straining, the ratio dg50/dp(50) and
dg50/dp(90) of the finest filter were derived. The values
are respectively 25.5 and 10.5. If considering the ratio of
120 (obtained in laboratory as being the lower one below
which mechanical straining occurs) as a limit value, the
mechanical straining so operates widely.
4 Conclusions The filtration results obtained show that filtration and
clogging depend on concentration and flow conditions.
Experiments conducted with a constant hydraulic head
show more occurrence of clogging than experiments
carried out with a constant flow rate. For a given mass of
deposited particles, experiments conducted at greater
fluid velocity or water head show greater permeability.
Experimental data indicate exponential depth
dependence of particle accumulation, which is in
agreement with literature. The usual filter design criteria
used for the soil filters tested show that fine filters can fail
according to the geometric considerations. The results
obtained show that filtration and clogging depend on
concentration and flow rate. For a given mass of
deposited particles, experiments conducted at greater
fluid velocity show greater permeability. The investigation
of clogging magnitude in the porous medium indicates
that maximum clogging occurs only in the upstream layer
of the bed and is dependent on the suspension
concentration, pore structure and flow rate. The use of
ultrasonic sensors to derive the clogging distribution
along the test column shows a good achievement of such
process. The grain size analysis of retained particles within
the filter indicates that the largest particles are trapped
within the front (first few centimetres) of the filter and
then particles of same size are retained over the following
sections. This process, called self-filtration, contributes to
the development of clogging by formation of a “cake” in
the front of the filter sample.
References Ahfir, N.D., Benamar, A., Alem, A., Wang, H.Q., (2009)
Influence of Internal Structure and Medium Length on
Transport and Deposition of Suspended Particles: A
Laboratory Study, Transp. in Porous Media 76, 289‒307
Benamar, A., Ahfir, N., Wang, H.Q., and Alem, A., (2007)
Particle transport in a saturated porous medium: pore
structure effects, C.R.Géosciences 339, 674‒681.
Bradford, S.A., Bettahar, M., Simunek, J., van Genuchten,
M.Th., (2004) Straining and attachment of colloids in
physically heterogeneous porous media. Vadose Zone
Journal 3:384‒394.
Bradford, S.A., and Bettahar, M., (2006) Concentration
dependent transport of colloids in saturated porous
media. Journal of Contaminant Hydrology, 82, 99‒ 117
Bradford, S.A, Torkzaban, S., and Walter, S.L., (2007)
Coupling of physical and chemical mechanisms of colloid
straining in saturated porous media, Water res. 41, 3012‒
3024
Chauveteau, G., Nabzar, L., and Coste, P-J., (1998) Physics
and modeling of permeability damage induced by

83
particle deposition. Society of Petroleum Engineers, SPE
39463, 409‒419.
El Kawafi, A., (2010) Colmatage d’un milieu poreux saturé
soumis à un écoulement chargé de particules. Thèse de
Doctorat, université du Havre
Khilar, K.C.,and Fogler H.S., (1987) Colloidally induced fines
in porous media, Review in chemical engineering, vol. 4
N° 1& 2
Kretzschmar, R., and Borkovec, M., (1999) Grolimund, D.;
Elimelech, M. Mobile subsurface colloids and their role in
contaminant transport. Adv. Agron., 66, 121‒193.
Mays, D.C., and Hunt, J.R., (2005) Hydrodynamic aspects of
particle clogging in porous media, Environ. Sci. Technol.,
N° 39, pp. 577‒584.
Moghadasi, J., Jamialahmadi, M., and Sharif, A., (2004)
«Theoretical and experimental study of particle
movement and deposition in porous media during water
injection», Journal of Petroleum Science and Engineering,
vol. 43, 2004, 163‒181.
Nabzar, L., and Chauveteau, G., (1997) Permeability
damage by deposition of colloidal particles. Society of
Petroleum Engineers, SPE 38160. 161‒171.
Porubcan, Alexis A., and Xu, S.P., (2011) Colloid straining
within saturated heterogeneous porous media, water
Research 45 (2011) 1796‒1806
Silliman, S.E., (1995) Particle transport through two-
dimensional, saturated porous media: influence of
physical structure of the medium, Hydrology J., Vol. 167,
pp 79‒98.
Tran, D.H., Derible, S., Franklin, H., Benamar, A., and Wang,
H., (2012) Ultrasonic measurements of particle retention
by a porous medium, Ultrasonics 52, pp. 62-68.
Tufenkji, N.G.F., Miller, J.N., Ryan, R.W., Hervey, M., and
Elimelech, (2004) Transport of Cryptosporidium Oocysts in
porous media: Role of straining and physicochemical
filtration. Environ. Sci. Technol. 38: 5932‒5938
Xu, S.P., Gao, B., and Saiers, J.E., (2006) Straining of
colloidal particles in saturated in porous media; Water
Resources Research, VOL.42, doi:10.1029/2006
WR004948,2006
Xu, S.P., and Saiers, J.E., (2009) Colloid straining within
water-saturated porous media : effect of colloid size
nonuniformity, Water Resources Res. 45, W05501,
doi:10.1029/2008WR007258
Contact Details Email: [email protected]
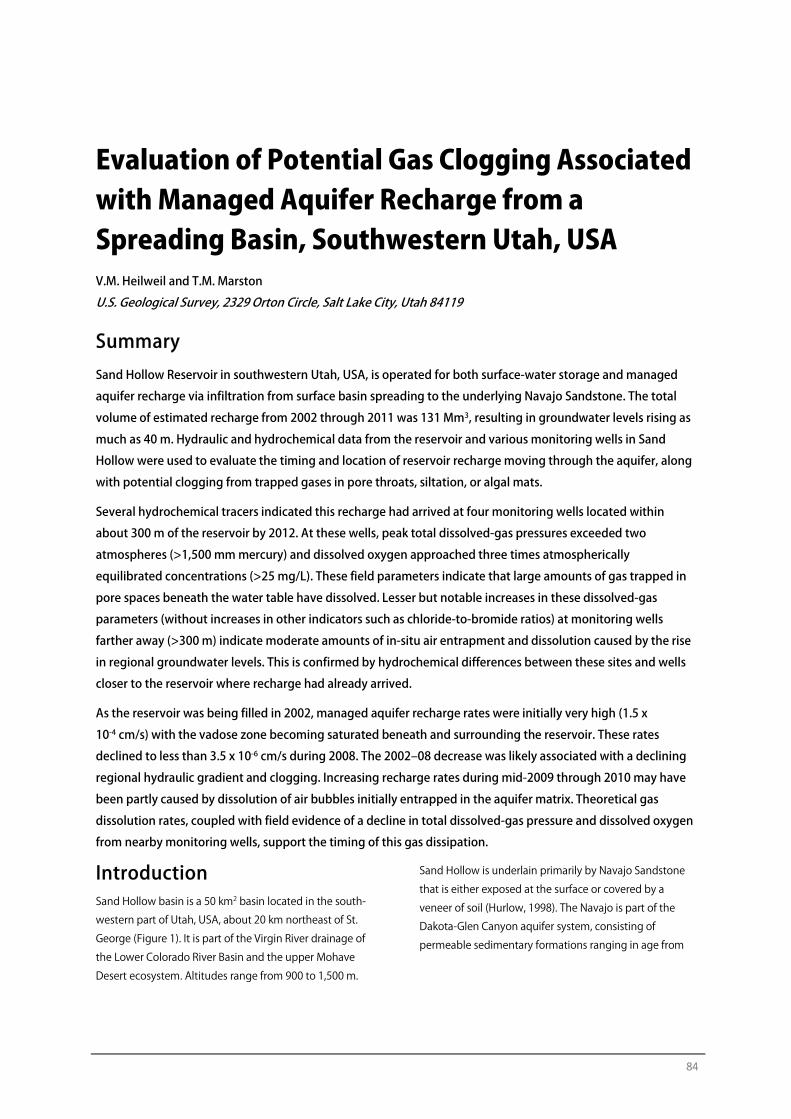
84
Evaluation of Potential Gas Clogging Associated with Managed Aquifer Recharge from a Spreading Basin, Southwestern Utah, USA V.M. Heilweil and T.M. Marston
U.S. Geological Survey, 2329 Orton Circle, Salt Lake City, Utah 84119
Summary Sand Hollow Reservoir in southwestern Utah, USA, is operated for both surface-water storage and managed
aquifer recharge via infiltration from surface basin spreading to the underlying Navajo Sandstone. The total
volume of estimated recharge from 2002 through 2011 was 131 Mm3, resulting in groundwater levels rising as
much as 40 m. Hydraulic and hydrochemical data from the reservoir and various monitoring wells in Sand
Hollow were used to evaluate the timing and location of reservoir recharge moving through the aquifer, along
with potential clogging from trapped gases in pore throats, siltation, or algal mats.
Several hydrochemical tracers indicated this recharge had arrived at four monitoring wells located within
about 300 m of the reservoir by 2012. At these wells, peak total dissolved-gas pressures exceeded two
atmospheres (>1,500 mm mercury) and dissolved oxygen approached three times atmospherically
equilibrated concentrations (>25 mg/L). These field parameters indicate that large amounts of gas trapped in
pore spaces beneath the water table have dissolved. Lesser but notable increases in these dissolved-gas
parameters (without increases in other indicators such as chloride-to-bromide ratios) at monitoring wells
farther away (>300 m) indicate moderate amounts of in-situ air entrapment and dissolution caused by the rise
in regional groundwater levels. This is confirmed by hydrochemical differences between these sites and wells
closer to the reservoir where recharge had already arrived.
As the reservoir was being filled in 2002, managed aquifer recharge rates were initially very high (1.5 x
10-4 cm/s) with the vadose zone becoming saturated beneath and surrounding the reservoir. These rates
declined to less than 3.5 x 10⁻⁶ cm/s during 2008. The 2002‒08 decrease was likely associated with a declining
regional hydraulic gradient and clogging. Increasing recharge rates during mid-2009 through 2010 may have
been partly caused by dissolution of air bubbles initially entrapped in the aquifer matrix. Theoretical gas
dissolution rates, coupled with field evidence of a decline in total dissolved-gas pressure and dissolved oxygen
from nearby monitoring wells, support the timing of this gas dissipation.
Introduction Sand Hollow basin is a 50 km2 basin located in the south-
western part of Utah, USA, about 20 km northeast of St.
George (Figure 1). It is part of the Virgin River drainage of
the Lower Colorado River Basin and the upper Mohave
Desert ecosystem. Altitudes range from 900 to 1,500 m.
Sand Hollow is underlain primarily by Navajo Sandstone
that is either exposed at the surface or covered by a
veneer of soil (Hurlow, 1998). The Navajo is part of the
Dakota-Glen Canyon aquifer system, consisting of
permeable sedimentary formations ranging in age from
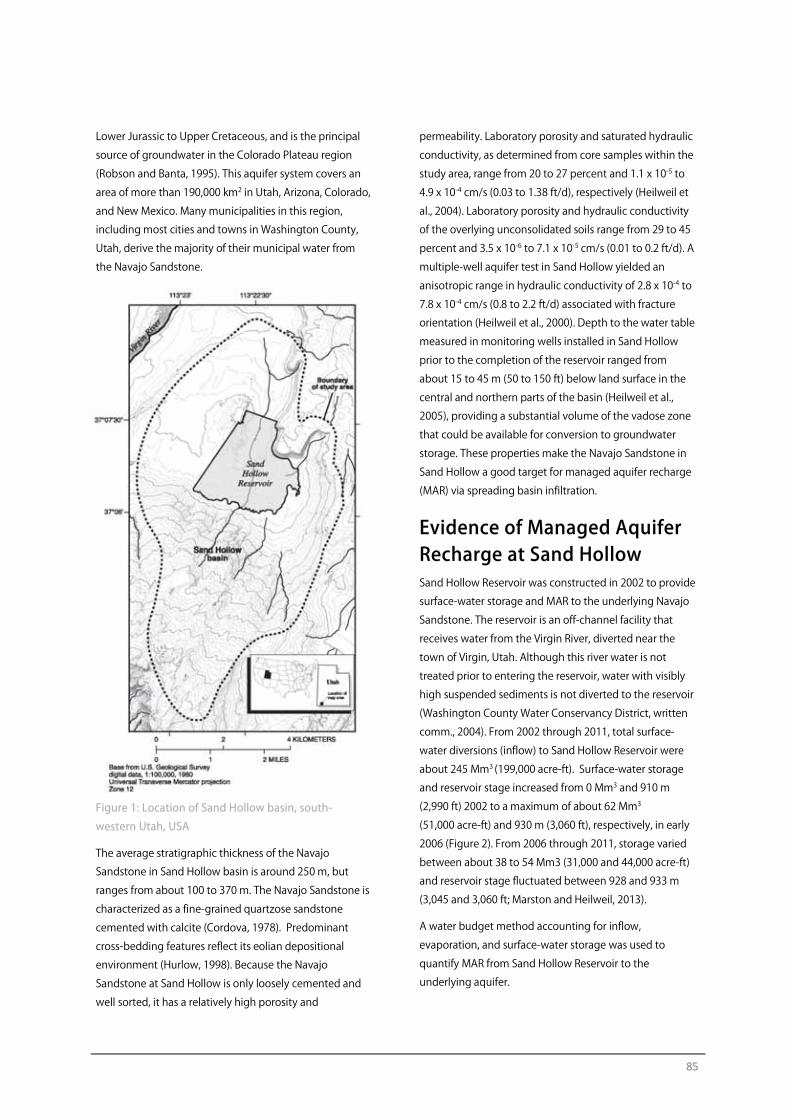
85
Lower Jurassic to Upper Cretaceous, and is the principal
source of groundwater in the Colorado Plateau region
(Robson and Banta, 1995). This aquifer system covers an
area of more than 190,000 km2 in Utah, Arizona, Colorado,
and New Mexico. Many municipalities in this region,
including most cities and towns in Washington County,
Utah, derive the majority of their municipal water from
the Navajo Sandstone.
Figure 1: Location of Sand Hollow basin, south-
western Utah, USA
The average stratigraphic thickness of the Navajo
Sandstone in Sand Hollow basin is around 250 m, but
ranges from about 100 to 370 m. The Navajo Sandstone is
characterized as a fine-grained quartzose sandstone
cemented with calcite (Cordova, 1978). Predominant
cross-bedding features reflect its eolian depositional
environment (Hurlow, 1998). Because the Navajo
Sandstone at Sand Hollow is only loosely cemented and
well sorted, it has a relatively high porosity and
permeability. Laboratory porosity and saturated hydraulic
conductivity, as determined from core samples within the
study area, range from 20 to 27 percent and 1.1 x 10⁻⁵ to
4.9 x 10⁻⁴ cm/s (0.03 to 1.38 ft/d), respectively (Heilweil et
al., 2004). Laboratory porosity and hydraulic conductivity
of the overlying unconsolidated soils range from 29 to 45
percent and 3.5 x 10⁻⁶ to 7.1 x 10⁻⁵ cm/s (0.01 to 0.2 ft/d). A
multiple-well aquifer test in Sand Hollow yielded an
anisotropic range in hydraulic conductivity of 2.8 x 10⁻⁴ to
7.8 x 10⁻⁴ cm/s (0.8 to 2.2 ft/d) associated with fracture
orientation (Heilweil et al., 2000). Depth to the water table
measured in monitoring wells installed in Sand Hollow
prior to the completion of the reservoir ranged from
about 15 to 45 m (50 to 150 ft) below land surface in the
central and northern parts of the basin (Heilweil et al.,
2005), providing a substantial volume of the vadose zone
that could be available for conversion to groundwater
storage. These properties make the Navajo Sandstone in
Sand Hollow a good target for managed aquifer recharge
(MAR) via spreading basin infiltration.
Evidence of Managed Aquifer Recharge at Sand Hollow Sand Hollow Reservoir was constructed in 2002 to provide
surface-water storage and MAR to the underlying Navajo
Sandstone. The reservoir is an off-channel facility that
receives water from the Virgin River, diverted near the
town of Virgin, Utah. Although this river water is not
treated prior to entering the reservoir, water with visibly
high suspended sediments is not diverted to the reservoir
(Washington County Water Conservancy District, written
comm., 2004). From 2002 through 2011, total surface-
water diversions (inflow) to Sand Hollow Reservoir were
about 245 Mm3 (199,000 acre-ft). Surface-water storage
and reservoir stage increased from 0 Mm3 and 910 m
(2,990 ft) 2002 to a maximum of about 62 Mm3
(51,000 acre-ft) and 930 m (3,060 ft), respectively, in early
2006 (Figure 2). From 2006 through 2011, storage varied
between about 38 to 54 Mm3 (31,000 and 44,000 acre-ft)
and reservoir stage fluctuated between 928 and 933 m
(3,045 and 3,060 ft; Marston and Heilweil, 2013).
A water budget method accounting for inflow,
evaporation, and surface-water storage was used to
quantify MAR from Sand Hollow Reservoir to the
underlying aquifer.
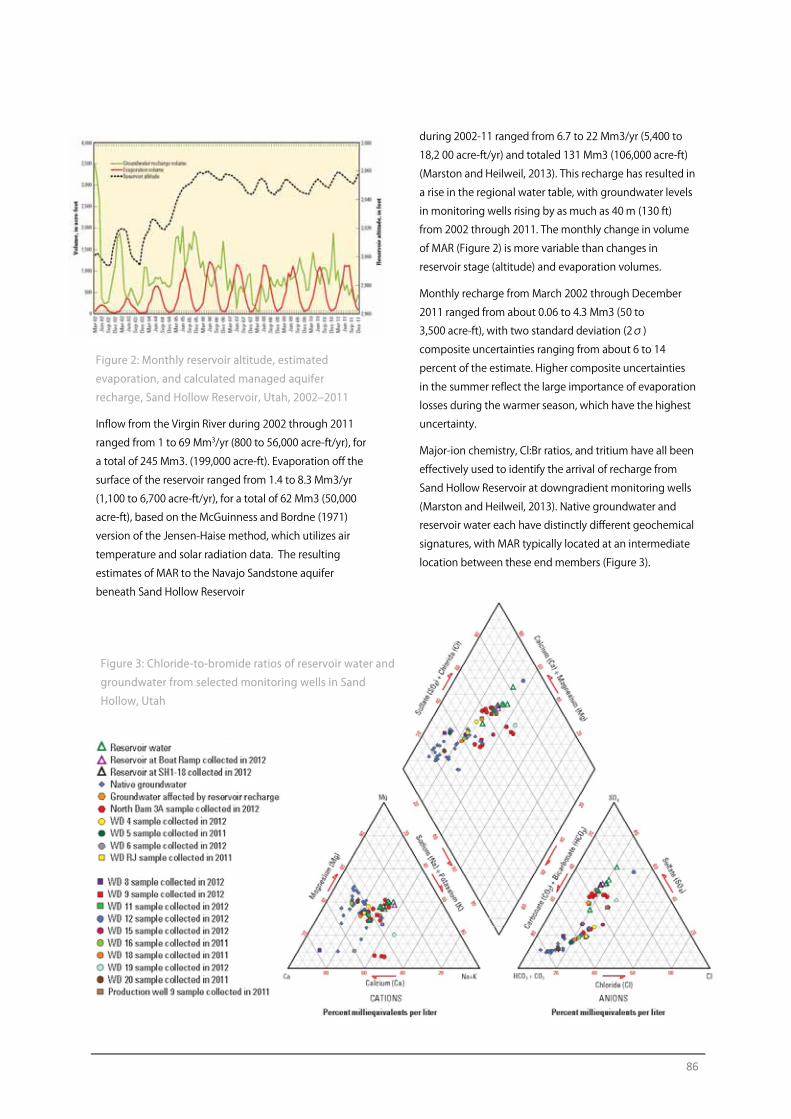
86
Figure 2: Monthly reservoir altitude, estimated
evaporation, and calculated managed aquifer
recharge, Sand Hollow Reservoir, Utah, 2002‒2011
Inflow from the Virgin River during 2002 through 2011
ranged from 1 to 69 Mm3/yr (800 to 56,000 acre-ft/yr), for
a total of 245 Mm3. (199,000 acre-ft). Evaporation off the
surface of the reservoir ranged from 1.4 to 8.3 Mm3/yr
(1,100 to 6,700 acre-ft/yr), for a total of 62 Mm3 (50,000
acre-ft), based on the McGuinness and Bordne (1971)
version of the Jensen-Haise method, which utilizes air
temperature and solar radiation data. The resulting
estimates of MAR to the Navajo Sandstone aquifer
beneath Sand Hollow Reservoir
during 2002-11 ranged from 6.7 to 22 Mm3/yr (5,400 to
18,2 00 acre-ft/yr) and totaled 131 Mm3 (106,000 acre-ft)
(Marston and Heilweil, 2013). This recharge has resulted in
a rise in the regional water table, with groundwater levels
in monitoring wells rising by as much as 40 m (130 ft)
from 2002 through 2011. The monthly change in volume
of MAR (Figure 2) is more variable than changes in
reservoir stage (altitude) and evaporation volumes.
Monthly recharge from March 2002 through December
2011 ranged from about 0.06 to 4.3 Mm3 (50 to
3,500 acre-ft), with two standard deviation (2σ)
composite uncertainties ranging from about 6 to 14
percent of the estimate. Higher composite uncertainties
in the summer reflect the large importance of evaporation
losses during the warmer season, which have the highest
uncertainty.
Major-ion chemistry, Cl:Br ratios, and tritium have all been
effectively used to identify the arrival of recharge from
Sand Hollow Reservoir at downgradient monitoring wells
(Marston and Heilweil, 2013). Native groundwater and
reservoir water each have distinctly different geochemical
signatures, with MAR typically located at an intermediate
location between these end members (Figure 3).
Figure 3: Chloride-to-bromide ratios of reservoir water and
groundwater from selected monitoring wells in Sand
Hollow, Utah
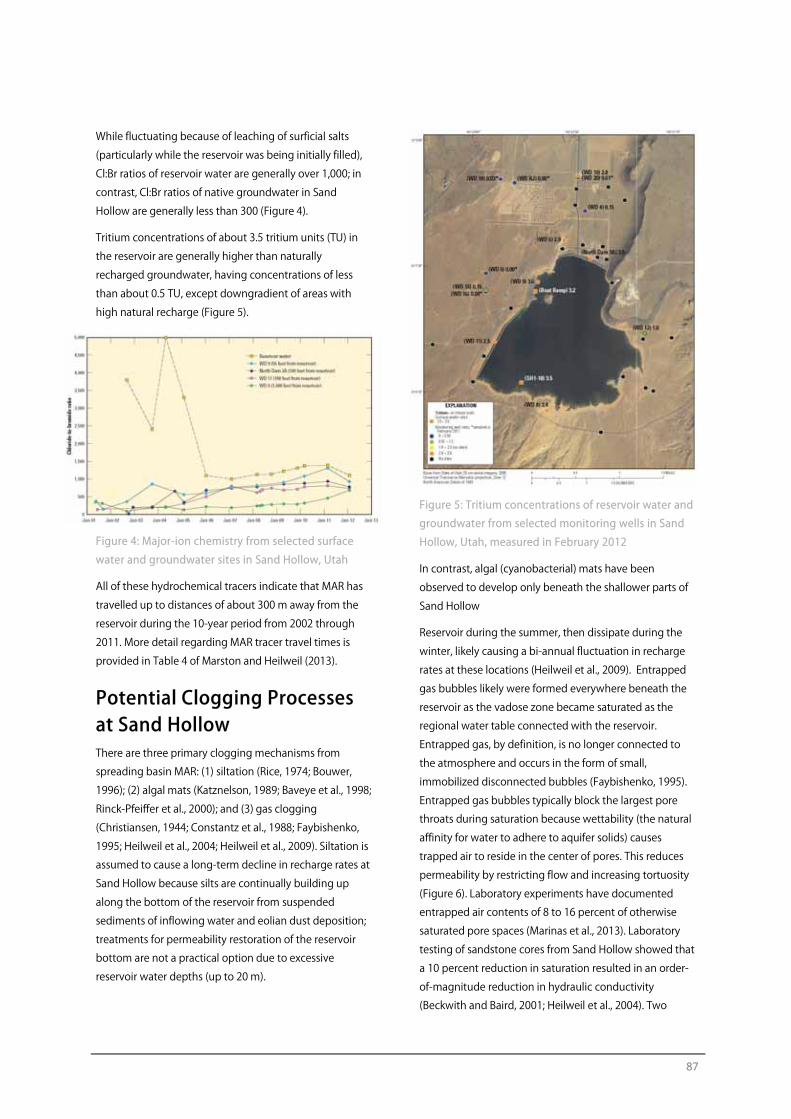
87
While fluctuating because of leaching of surficial salts
(particularly while the reservoir was being initially filled),
Cl:Br ratios of reservoir water are generally over 1,000; in
contrast, Cl:Br ratios of native groundwater in Sand
Hollow are generally less than 300 (Figure 4).
Tritium concentrations of about 3.5 tritium units (TU) in
the reservoir are generally higher than naturally
recharged groundwater, having concentrations of less
than about 0.5 TU, except downgradient of areas with
high natural recharge (Figure 5).
Figure 4: Major-ion chemistry from selected surface
water and groundwater sites in Sand Hollow, Utah
All of these hydrochemical tracers indicate that MAR has
travelled up to distances of about 300 m away from the
reservoir during the 10-year period from 2002 through
2011. More detail regarding MAR tracer travel times is
provided in Table 4 of Marston and Heilweil (2013).
Potential Clogging Processes at Sand Hollow There are three primary clogging mechanisms from
spreading basin MAR: (1) siltation (Rice, 1974; Bouwer,
1996); (2) algal mats (Katznelson, 1989; Baveye et al., 1998;
Rinck-Pfeiffer et al., 2000); and (3) gas clogging
(Christiansen, 1944; Constantz et al., 1988; Faybishenko,
1995; Heilweil et al., 2004; Heilweil et al., 2009). Siltation is
assumed to cause a long-term decline in recharge rates at
Sand Hollow because silts are continually building up
along the bottom of the reservoir from suspended
sediments of inflowing water and eolian dust deposition;
treatments for permeability restoration of the reservoir
bottom are not a practical option due to excessive
reservoir water depths (up to 20 m).
Figure 5: Tritium concentrations of reservoir water and
groundwater from selected monitoring wells in Sand
Hollow, Utah, measured in February 2012
In contrast, algal (cyanobacterial) mats have been
observed to develop only beneath the shallower parts of
Sand Hollow
Reservoir during the summer, then dissipate during the
winter, likely causing a bi-annual fluctuation in recharge
rates at these locations (Heilweil et al., 2009). Entrapped
gas bubbles likely were formed everywhere beneath the
reservoir as the vadose zone became saturated as the
regional water table connected with the reservoir.
Entrapped gas, by definition, is no longer connected to
the atmosphere and occurs in the form of small,
immobilized disconnected bubbles (Faybishenko, 1995).
Entrapped gas bubbles typically block the largest pore
throats during saturation because wettability (the natural
affinity for water to adhere to aquifer solids) causes
trapped air to reside in the center of pores. This reduces
permeability by restricting flow and increasing tortuosity
(Figure 6). Laboratory experiments have documented
entrapped air contents of 8 to 16 percent of otherwise
saturated pore spaces (Marinas et al., 2013). Laboratory
testing of sandstone cores from Sand Hollow showed that
a 10 percent reduction in saturation resulted in an order-
of-magnitude reduction in hydraulic conductivity
(Beckwith and Baird, 2001; Heilweil et al., 2004). Two
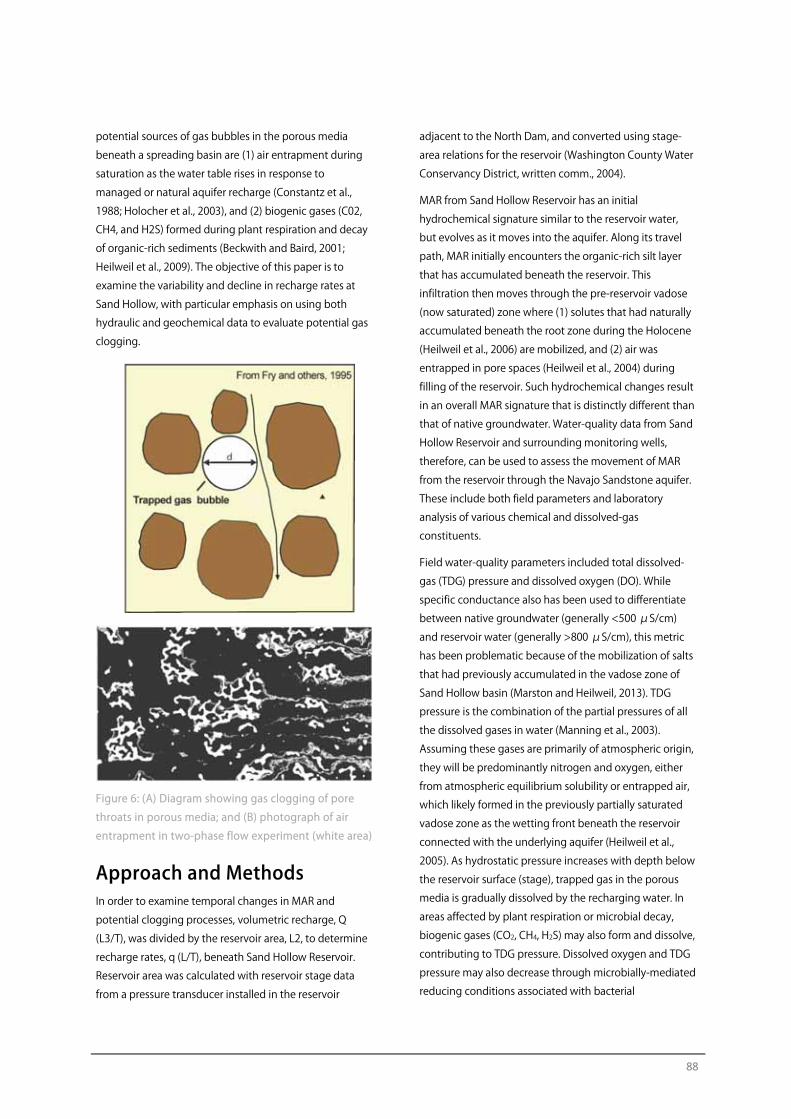
88
potential sources of gas bubbles in the porous media
beneath a spreading basin are (1) air entrapment during
saturation as the water table rises in response to
managed or natural aquifer recharge (Constantz et al.,
1988; Holocher et al., 2003), and (2) biogenic gases (C02,
CH4, and H2S) formed during plant respiration and decay
of organic-rich sediments (Beckwith and Baird, 2001;
Heilweil et al., 2009). The objective of this paper is to
examine the variability and decline in recharge rates at
Sand Hollow, with particular emphasis on using both
hydraulic and geochemical data to evaluate potential gas
clogging.
Figure 6: (A) Diagram showing gas clogging of pore
throats in porous media; and (B) photograph of air
entrapment in two-phase flow experiment (white area)
Approach and Methods In order to examine temporal changes in MAR and
potential clogging processes, volumetric recharge, Q
(L3/T), was divided by the reservoir area, L2, to determine
recharge rates, q (L/T), beneath Sand Hollow Reservoir.
Reservoir area was calculated with reservoir stage data
from a pressure transducer installed in the reservoir
adjacent to the North Dam, and converted using stage-
area relations for the reservoir (Washington County Water
Conservancy District, written comm., 2004).
MAR from Sand Hollow Reservoir has an initial
hydrochemical signature similar to the reservoir water,
but evolves as it moves into the aquifer. Along its travel
path, MAR initially encounters the organic-rich silt layer
that has accumulated beneath the reservoir. This
infiltration then moves through the pre-reservoir vadose
(now saturated) zone where (1) solutes that had naturally
accumulated beneath the root zone during the Holocene
(Heilweil et al., 2006) are mobilized, and (2) air was
entrapped in pore spaces (Heilweil et al., 2004) during
filling of the reservoir. Such hydrochemical changes result
in an overall MAR signature that is distinctly different than
that of native groundwater. Water-quality data from Sand
Hollow Reservoir and surrounding monitoring wells,
therefore, can be used to assess the movement of MAR
from the reservoir through the Navajo Sandstone aquifer.
These include both field parameters and laboratory
analysis of various chemical and dissolved-gas
constituents.
Field water-quality parameters included total dissolved-
gas (TDG) pressure and dissolved oxygen (DO). While
specific conductance also has been used to differentiate
between native groundwater (generally <500 μS/cm)
and reservoir water (generally >800 μS/cm), this metric
has been problematic because of the mobilization of salts
that had previously accumulated in the vadose zone of
Sand Hollow basin (Marston and Heilweil, 2013). TDG
pressure is the combination of the partial pressures of all
the dissolved gases in water (Manning et al., 2003).
Assuming these gases are primarily of atmospheric origin,
they will be predominantly nitrogen and oxygen, either
from atmospheric equilibrium solubility or entrapped air,
which likely formed in the previously partially saturated
vadose zone as the wetting front beneath the reservoir
connected with the underlying aquifer (Heilweil et al.,
2005). As hydrostatic pressure increases with depth below
the reservoir surface (stage), trapped gas in the porous
media is gradually dissolved by the recharging water. In
areas affected by plant respiration or microbial decay,
biogenic gases (CO2, CH4, H2S) may also form and dissolve,
contributing to TDG pressure. Dissolved oxygen and TDG
pressure may also decrease through microbially-mediated
reducing conditions associated with bacterial
89
consumption of dissolved organic carbon in the organic-
rich sediments beneath the reservoir. TDG pressure also
has been analyzed since 2009 in the laboratory using
advanced diffusion samplers (Gardner and Solomon,
2009) for selected monitoring wells with high TDG
pressures. Unfortunately, this technique was not used
prior to 2009, so measurements of 1,500 to
2,250 millimeters mercury (mm Hg) during 2003–08 have
a higher but unknown amount of uncertainty and
pressures greater than 2,250 mm Hg could not be
measured.
Along with these field parameters, laboratory
hydrochemical analyses of surface water and
groundwater from Sand Hollow were used for evaluating
potential gas clogging. This included chlorofluorocarbons
(CFCs) and sulfur hexafluoride (SF6). Chlorofluorocarbons
(CFC‒11, CFC‒12, and CFC‒113) and SF6 are industrial
gases found in trace amounts in the atmosphere, and
thus are found in well-aerated surface-water bodies such
as Sand Hollow Reservoir (as governed by their Henry’s
Law solubility). CFC‒12 is considered the most stable of
the three chlorofluorocarbons; both CFC‒11 and CFC‒113
are more likely to be affected by microbial decay.
Dissolved CFC‒12 concentrations in Sand Hollow
Reservoir gradually increased from about 1.5 to
3.0 pmol/kg between 2008 and 2010 and then remained
relatively stable during 2011‒12 (Marston and Heilweil,
2013). The measured SF6 concentrations in the reservoir
increased from about 1.5 to 1.9 fmol/kg in 2008-09 up to
2.9 fmol/kg in 2011‒12. CFC-12 and SF6 concentrations in
native groundwater are generally small (< about
1 pmol/kg and 1 fmol/kg, respectively) indicating natural
recharge in Sand Hollow basin moves along slow (>50-
year) pathways through the vadose zone to the water
table. In addition to being used as tracers of MAR from
Sand Hollow, CFCs and SF6 were also used to evaluate
trapped gas processes. If large amounts of trapped air
bubbles are dissolved into infiltrating MAR, this excess air
will cause increases above atmospheric equilibrium of
CFCs and SF6.
Data Collection Methods Field parameters were measured with a multi-parameter
sonde placed at the bottom of each 50-mm diameter
(2-in) monitoring well within the screened interval, and in
the reservoir at water depths of approximately 0.6 m (2 ft).
Because the multi-parameter sonde was too large to enter
the 25-mm (1-in) monitoring wells (North Dam 3A, WD 1,
WD 4, WD 5, WD RJ, and WD 12), field measurements
(except for TDG pressure) from these wells were made
onsite with a flow-through chamber connected to the
discharge line from either a Waterra hand pump or
peristaltic pump.
The multi-parameter sonde used for TDG pressure
measurements relies on a 5 psi transducer; measurements
of less than 1,500 mm Hg have errors of less than 5
percent. The sonde could not measure pressures greater
than 2,250 mm Hg and is not within its linear calibration
range above about 1,500 mm Hg. Because of this non-
linearity of in-situ measurements greater than 1,500 mm
Hg, are only considered qualitative. Additional details
regarding field parameter methods are given in Heilweil
et al., 2005.
Hydrochemical samples were collected from 50-mm (2-in)
monitoring wells using either a Grunfos or Bennett
sample pump; 25-mm (1-in) wells were sampled with the
Waterra pump; production wells were sampled utilizing
installed turbine pumps. Prior to water chemistry sample
collection, each monitoring well was purged until field
parameters had stabilized and a minimum of three casing
volumes were removed. Since 2009, a set of replicates for
all constituents has been separately analyzed yearly at
one randomly selected sampling site for quality
assurance. CFC and SF6 samples were collected without
head space in 250-ml and 1-L glass bottles, respectively,
according to procedures described at
http://water.usgs.gov/lab/ and were analyzed by the U.S.
Geological Survey at the Chlorofluorocarbon Laboratory
in Reston, Virginia.
Results
Variability in Managed Aquifer Recharge Rates Estimated average monthly recharge rates beneath Sand
Hollow Reservoir have generally declined from about 1.5 x
10-4 cm/s in March 2002 to about 3.5 x 10⁻⁶ cm/s in
December 2011 (Figure 7). Three general periods can be
observed, with Period 1 (March 2002 through mid-2003)
beginning with very high initial rates that rapidly decrease
as the vadose zone of the Navajo Sandstone becomes
saturated and a hydraulic connection between the
reservoir and aquifer is established (causing an abrupt
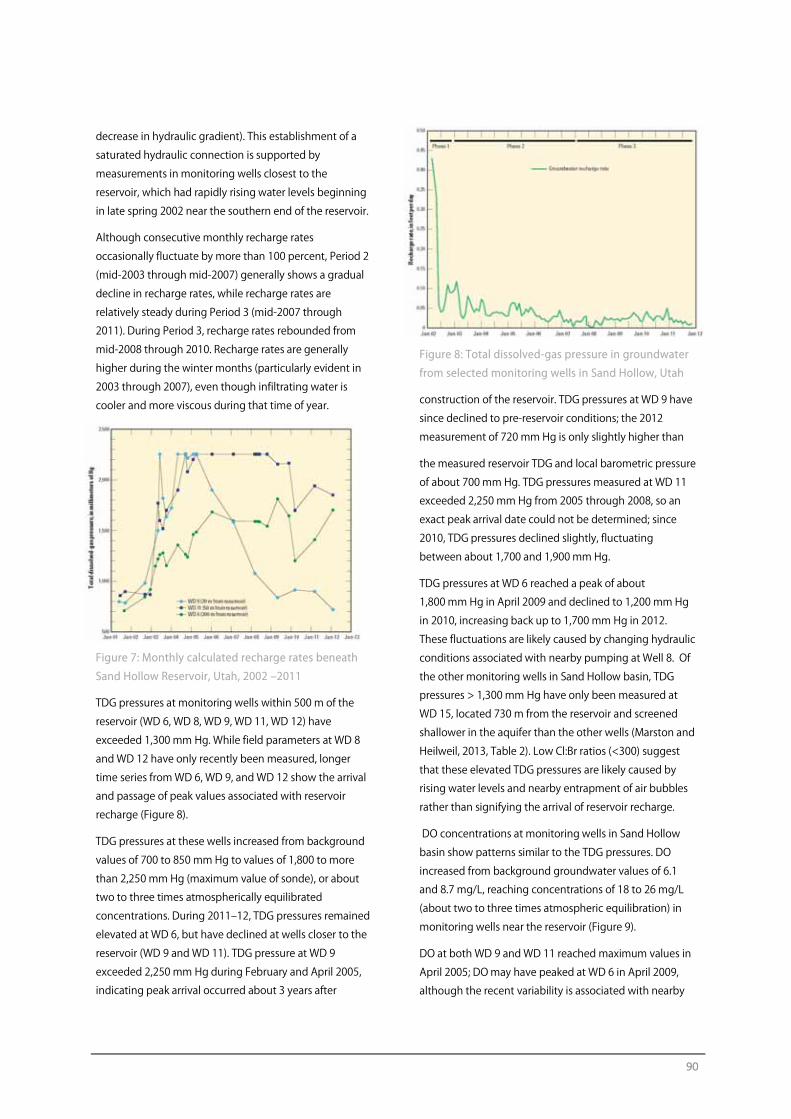
90
decrease in hydraulic gradient). This establishment of a
saturated hydraulic connection is supported by
measurements in monitoring wells closest to the
reservoir, which had rapidly rising water levels beginning
in late spring 2002 near the southern end of the reservoir.
Although consecutive monthly recharge rates
occasionally fluctuate by more than 100 percent, Period 2
(mid-2003 through mid-2007) generally shows a gradual
decline in recharge rates, while recharge rates are
relatively steady during Period 3 (mid-2007 through
2011). During Period 3, recharge rates rebounded from
mid-2008 through 2010. Recharge rates are generally
higher during the winter months (particularly evident in
2003 through 2007), even though infiltrating water is
cooler and more viscous during that time of year.
Figure 7: Monthly calculated recharge rates beneath
Sand Hollow Reservoir, Utah, 2002 ‒2011
TDG pressures at monitoring wells within 500 m of the
reservoir (WD 6, WD 8, WD 9, WD 11, WD 12) have
exceeded 1,300 mm Hg. While field parameters at WD 8
and WD 12 have only recently been measured, longer
time series from WD 6, WD 9, and WD 12 show the arrival
and passage of peak values associated with reservoir
recharge (Figure 8).
TDG pressures at these wells increased from background
values of 700 to 850 mm Hg to values of 1,800 to more
than 2,250 mm Hg (maximum value of sonde), or about
two to three times atmospherically equilibrated
concentrations. During 2011‒12, TDG pressures remained
elevated at WD 6, but have declined at wells closer to the
reservoir (WD 9 and WD 11). TDG pressure at WD 9
exceeded 2,250 mm Hg during February and April 2005,
indicating peak arrival occurred about 3 years after
Figure 8: Total dissolved-gas pressure in groundwater
from selected monitoring wells in Sand Hollow, Utah
construction of the reservoir. TDG pressures at WD 9 have
since declined to pre-reservoir conditions; the 2012
measurement of 720 mm Hg is only slightly higher than
the measured reservoir TDG and local barometric pressure
of about 700 mm Hg. TDG pressures measured at WD 11
exceeded 2,250 mm Hg from 2005 through 2008, so an
exact peak arrival date could not be determined; since
2010, TDG pressures declined slightly, fluctuating
between about 1,700 and 1,900 mm Hg.
TDG pressures at WD 6 reached a peak of about
1,800 mm Hg in April 2009 and declined to 1,200 mm Hg
in 2010, increasing back up to 1,700 mm Hg in 2012.
These fluctuations are likely caused by changing hydraulic
conditions associated with nearby pumping at Well 8. Of
the other monitoring wells in Sand Hollow basin, TDG
pressures > 1,300 mm Hg have only been measured at
WD 15, located 730 m from the reservoir and screened
shallower in the aquifer than the other wells (Marston and
Heilweil, 2013, Table 2). Low Cl:Br ratios (<300) suggest
that these elevated TDG pressures are likely caused by
rising water levels and nearby entrapment of air bubbles
rather than signifying the arrival of reservoir recharge.
DO concentrations at monitoring wells in Sand Hollow
basin show patterns similar to the TDG pressures. DO
increased from background groundwater values of 6.1
and 8.7 mg/L, reaching concentrations of 18 to 26 mg/L
(about two to three times atmospheric equilibration) in
monitoring wells near the reservoir (Figure 9).
DO at both WD 9 and WD 11 reached maximum values in
April 2005; DO may have peaked at WD 6 in April 2009,
although the recent variability is associated with nearby
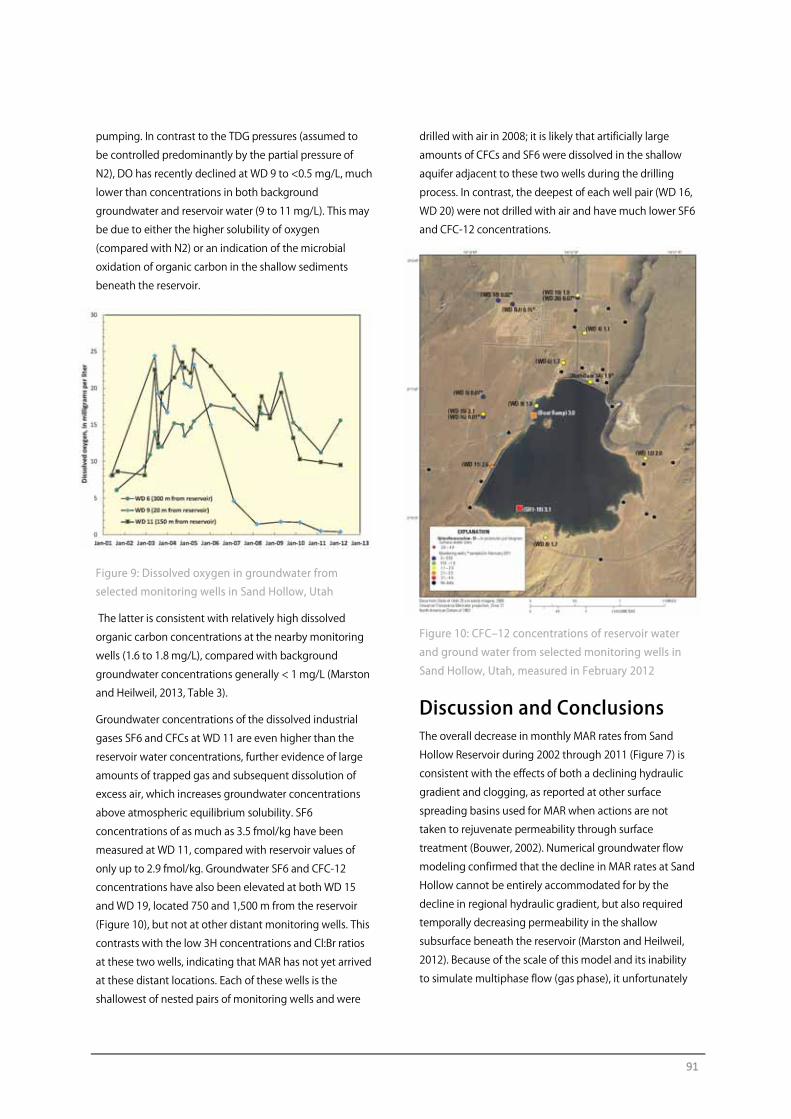
91
pumping. In contrast to the TDG pressures (assumed to
be controlled predominantly by the partial pressure of
N2), DO has recently declined at WD 9 to <0.5 mg/L, much
lower than concentrations in both background
groundwater and reservoir water (9 to 11 mg/L). This may
be due to either the higher solubility of oxygen
(compared with N2) or an indication of the microbial
oxidation of organic carbon in the shallow sediments
beneath the reservoir.
Figure 9: Dissolved oxygen in groundwater from
selected monitoring wells in Sand Hollow, Utah
The latter is consistent with relatively high dissolved
organic carbon concentrations at the nearby monitoring
wells (1.6 to 1.8 mg/L), compared with background
groundwater concentrations generally < 1 mg/L (Marston
and Heilweil, 2013, Table 3).
Groundwater concentrations of the dissolved industrial
gases SF6 and CFCs at WD 11 are even higher than the
reservoir water concentrations, further evidence of large
amounts of trapped gas and subsequent dissolution of
excess air, which increases groundwater concentrations
above atmospheric equilibrium solubility. SF6
concentrations of as much as 3.5 fmol/kg have been
measured at WD 11, compared with reservoir values of
only up to 2.9 fmol/kg. Groundwater SF6 and CFC-12
concentrations have also been elevated at both WD 15
and WD 19, located 750 and 1,500 m from the reservoir
(Figure 10), but not at other distant monitoring wells. This
contrasts with the low 3H concentrations and Cl:Br ratios
at these two wells, indicating that MAR has not yet arrived
at these distant locations. Each of these wells is the
shallowest of nested pairs of monitoring wells and were
drilled with air in 2008; it is likely that artificially large
amounts of CFCs and SF6 were dissolved in the shallow
aquifer adjacent to these two wells during the drilling
process. In contrast, the deepest of each well pair (WD 16,
WD 20) were not drilled with air and have much lower SF6
and CFC-12 concentrations.
Figure 10: CFC‒12 concentrations of reservoir water
and ground water from selected monitoring wells in
Sand Hollow, Utah, measured in February 2012
Discussion and Conclusions The overall decrease in monthly MAR rates from Sand
Hollow Reservoir during 2002 through 2011 (Figure 7) is
consistent with the effects of both a declining hydraulic
gradient and clogging, as reported at other surface
spreading basins used for MAR when actions are not
taken to rejuvenate permeability through surface
treatment (Bouwer, 2002). Numerical groundwater flow
modeling confirmed that the decline in MAR rates at Sand
Hollow cannot be entirely accommodated for by the
decline in regional hydraulic gradient, but also required
temporally decreasing permeability in the shallow
subsurface beneath the reservoir (Marston and Heilweil,
2012). Because of the scale of this model and its inability
to simulate multiphase flow (gas phase), it unfortunately
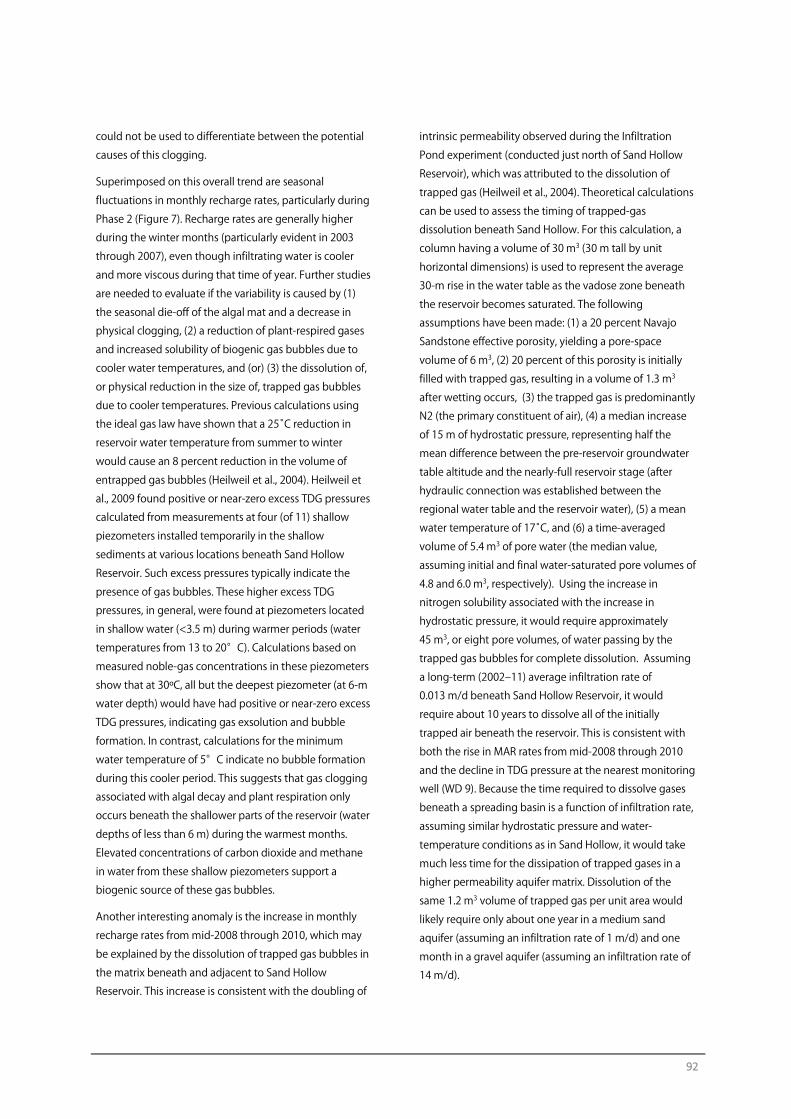
92
could not be used to differentiate between the potential
causes of this clogging.
Superimposed on this overall trend are seasonal
fluctuations in monthly recharge rates, particularly during
Phase 2 (Figure 7). Recharge rates are generally higher
during the winter months (particularly evident in 2003
through 2007), even though infiltrating water is cooler
and more viscous during that time of year. Further studies
are needed to evaluate if the variability is caused by (1)
the seasonal die-off of the algal mat and a decrease in
physical clogging, (2) a reduction of plant-respired gases
and increased solubility of biogenic gas bubbles due to
cooler water temperatures, and (or) (3) the dissolution of,
or physical reduction in the size of, trapped gas bubbles
due to cooler temperatures. Previous calculations using
the ideal gas law have shown that a 25̊C reduction in
reservoir water temperature from summer to winter
would cause an 8 percent reduction in the volume of
entrapped gas bubbles (Heilweil et al., 2004). Heilweil et
al., 2009 found positive or near-zero excess TDG pressures
calculated from measurements at four (of 11) shallow
piezometers installed temporarily in the shallow
sediments at various locations beneath Sand Hollow
Reservoir. Such excess pressures typically indicate the
presence of gas bubbles. These higher excess TDG
pressures, in general, were found at piezometers located
in shallow water (<3.5 m) during warmer periods (water
temperatures from 13 to 20°C). Calculations based on
measured noble-gas concentrations in these piezometers
show that at 30ºC, all but the deepest piezometer (at 6-m
water depth) would have had positive or near-zero excess
TDG pressures, indicating gas exsolution and bubble
formation. In contrast, calculations for the minimum
water temperature of 5°C indicate no bubble formation
during this cooler period. This suggests that gas clogging
associated with algal decay and plant respiration only
occurs beneath the shallower parts of the reservoir (water
depths of less than 6 m) during the warmest months.
Elevated concentrations of carbon dioxide and methane
in water from these shallow piezometers support a
biogenic source of these gas bubbles.
Another interesting anomaly is the increase in monthly
recharge rates from mid-2008 through 2010, which may
be explained by the dissolution of trapped gas bubbles in
the matrix beneath and adjacent to Sand Hollow
Reservoir. This increase is consistent with the doubling of
intrinsic permeability observed during the Infiltration
Pond experiment (conducted just north of Sand Hollow
Reservoir), which was attributed to the dissolution of
trapped gas (Heilweil et al., 2004). Theoretical calculations
can be used to assess the timing of trapped-gas
dissolution beneath Sand Hollow. For this calculation, a
column having a volume of 30 m3 (30 m tall by unit
horizontal dimensions) is used to represent the average
30-m rise in the water table as the vadose zone beneath
the reservoir becomes saturated. The following
assumptions have been made: (1) a 20 percent Navajo
Sandstone effective porosity, yielding a pore-space
volume of 6 m3, (2) 20 percent of this porosity is initially
filled with trapped gas, resulting in a volume of 1.3 m3
after wetting occurs, (3) the trapped gas is predominantly
N2 (the primary constituent of air), (4) a median increase
of 15 m of hydrostatic pressure, representing half the
mean difference between the pre-reservoir groundwater
table altitude and the nearly-full reservoir stage (after
hydraulic connection was established between the
regional water table and the reservoir water), (5) a mean
water temperature of 17̊C, and (6) a time-averaged
volume of 5.4 m3 of pore water (the median value,
assuming initial and final water-saturated pore volumes of
4.8 and 6.0 m3, respectively). Using the increase in
nitrogen solubility associated with the increase in
hydrostatic pressure, it would require approximately
45 m3, or eight pore volumes, of water passing by the
trapped gas bubbles for complete dissolution. Assuming
a long-term (2002‒11) average infiltration rate of
0.013 m/d beneath Sand Hollow Reservoir, it would
require about 10 years to dissolve all of the initially
trapped air beneath the reservoir. This is consistent with
both the rise in MAR rates from mid-2008 through 2010
and the decline in TDG pressure at the nearest monitoring
well (WD 9). Because the time required to dissolve gases
beneath a spreading basin is a function of infiltration rate,
assuming similar hydrostatic pressure and water-
temperature conditions as in Sand Hollow, it would take
much less time for the dissipation of trapped gases in a
higher permeability aquifer matrix. Dissolution of the
same 1.2 m3 volume of trapped gas per unit area would
likely require only about one year in a medium sand
aquifer (assuming an infiltration rate of 1 m/d) and one
month in a gravel aquifer (assuming an infiltration rate of
14 m/d).
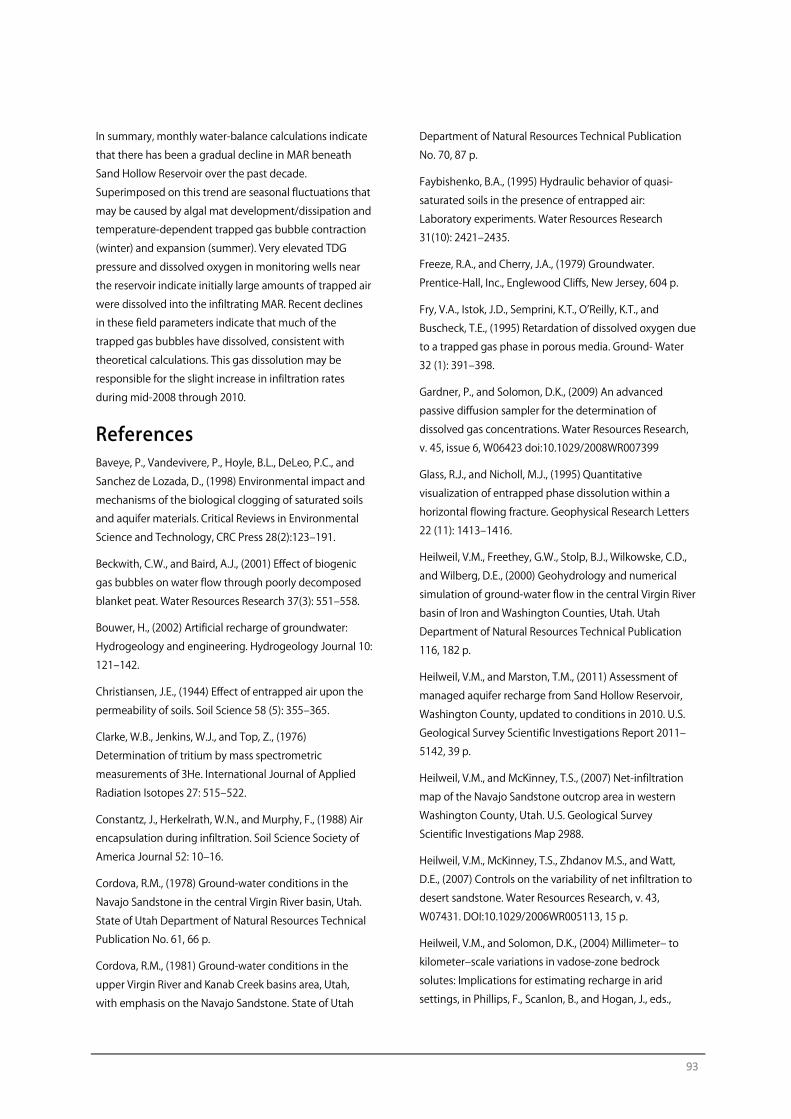
93
In summary, monthly water-balance calculations indicate
that there has been a gradual decline in MAR beneath
Sand Hollow Reservoir over the past decade.
Superimposed on this trend are seasonal fluctuations that
may be caused by algal mat development/dissipation and
temperature-dependent trapped gas bubble contraction
(winter) and expansion (summer). Very elevated TDG
pressure and dissolved oxygen in monitoring wells near
the reservoir indicate initially large amounts of trapped air
were dissolved into the infiltrating MAR. Recent declines
in these field parameters indicate that much of the
trapped gas bubbles have dissolved, consistent with
theoretical calculations. This gas dissolution may be
responsible for the slight increase in infiltration rates
during mid-2008 through 2010.
References Baveye, P., Vandevivere, P., Hoyle, B.L., DeLeo, P.C., and
Sanchez de Lozada, D., (1998) Environmental impact and
mechanisms of the biological clogging of saturated soils
and aquifer materials. Critical Reviews in Environmental
Science and Technology, CRC Press 28(2):123‒191.
Beckwith, C.W., and Baird, A.J., (2001) Effect of biogenic
gas bubbles on water flow through poorly decomposed
blanket peat. Water Resources Research 37(3): 551‒558.
Bouwer, H., (2002) Artificial recharge of groundwater:
Hydrogeology and engineering. Hydrogeology Journal 10:
121‒142.
Christiansen, J.E., (1944) Effect of entrapped air upon the
permeability of soils. Soil Science 58 (5): 355‒365.
Clarke, W.B., Jenkins, W.J., and Top, Z., (1976)
Determination of tritium by mass spectrometric
measurements of 3He. International Journal of Applied
Radiation Isotopes 27: 515‒522.
Constantz, J., Herkelrath, W.N., and Murphy, F., (1988) Air
encapsulation during infiltration. Soil Science Society of
America Journal 52: 10‒16.
Cordova, R.M., (1978) Ground-water conditions in the
Navajo Sandstone in the central Virgin River basin, Utah.
State of Utah Department of Natural Resources Technical
Publication No. 61, 66 p.
Cordova, R.M., (1981) Ground-water conditions in the
upper Virgin River and Kanab Creek basins area, Utah,
with emphasis on the Navajo Sandstone. State of Utah
Department of Natural Resources Technical Publication
No. 70, 87 p.
Faybishenko, B.A., (1995) Hydraulic behavior of quasi-
saturated soils in the presence of entrapped air:
Laboratory experiments. Water Resources Research
31(10): 2421‒2435.
Freeze, R.A., and Cherry, J.A., (1979) Groundwater.
Prentice-Hall, Inc., Englewood Cliffs, New Jersey, 604 p.
Fry, V.A., Istok, J.D., Semprini, K.T., O’Reilly, K.T., and
Buscheck, T.E., (1995) Retardation of dissolved oxygen due
to a trapped gas phase in porous media. Ground- Water
32 (1): 391‒398.
Gardner, P., and Solomon, D.K., (2009) An advanced
passive diffusion sampler for the determination of
dissolved gas concentrations. Water Resources Research,
v. 45, issue 6, W06423 doi:10.1029/2008WR007399
Glass, R.J., and Nicholl, M.J., (1995) Quantitative
visualization of entrapped phase dissolution within a
horizontal flowing fracture. Geophysical Research Letters
22 (11): 1413‒1416.
Heilweil, V.M., Freethey, G.W., Stolp, B.J., Wilkowske, C.D.,
and Wilberg, D.E., (2000) Geohydrology and numerical
simulation of ground-water flow in the central Virgin River
basin of Iron and Washington Counties, Utah. Utah
Department of Natural Resources Technical Publication
116, 182 p.
Heilweil, V.M., and Marston, T.M., (2011) Assessment of
managed aquifer recharge from Sand Hollow Reservoir,
Washington County, updated to conditions in 2010. U.S.
Geological Survey Scientific Investigations Report 2011‒
5142, 39 p.
Heilweil, V.M., and McKinney, T.S., (2007) Net-infiltration
map of the Navajo Sandstone outcrop area in western
Washington County, Utah. U.S. Geological Survey
Scientific Investigations Map 2988.
Heilweil, V.M., McKinney, T.S., Zhdanov M.S., and Watt,
D.E., (2007) Controls on the variability of net infiltration to
desert sandstone. Water Resources Research, v. 43,
W07431. DOI:10.1029/2006WR005113, 15 p.
Heilweil, V.M., and Solomon, D.K., (2004) Millimeter‒ to
kilometer‒scale variations in vadose-zone bedrock
solutes: Implications for estimating recharge in arid
settings, in Phillips, F., Scanlon, B., and Hogan, J., eds.,

94
Ground-water recharge in a desert environment: the
southwestern United States, Water Science and
Application 9. American Geophysical Union, Washington,
D.C., p. 49‒67.
Heilweil, V.M., Solomon, D.K., and Gardner, P.M., (2006)
Borehole environmental tracers for evaluating net
infiltration and recharge through desert bedrock. Vadose
Zone Journal, v. 5, p. 98‒120.
Heilweil, V.M., Solomon, D.K., and Ortiz, G., (2009) Silt and
gas accumulation beneath an artificial recharge spreading
basin, southwestern Utah, U.S.A. Boletin Geologico y
Minero, v. 120 (2), p. 185‒195.
Heilweil, V.M., Solomon, D.K., Perkins, K.S., and Ellett, K.M.,
(2004) Gas-partitioning tracer test to quantify trapped gas
during recharge. Ground Water, v. 42, no. 4, p. 589‒600.
Heilweil, V.M., Susong, D.D., Gardner, P.M., and Watt, D.E,
(2005) Pre- and post-reservoir ground-water conditions
and assessment of artificial recharge at Sand Hollow,
Washington County, Utah, 1995‒2005. U.S. Geological
Survey Scientific Investigations Report 2005‒5185, 74 p.
Heilweil, V.M., and Watt, D.E., (2011) Trench infiltration for
managed aquifer recharge to permeable bedrock.
Hydrological Processes 25, DOI: 10.1002/hyp.7833, p. 141‒
151.
Holocher, J., Peeters, F., Aeschbach-Hertig, W., Hofer, M.,
Brennwald, M., Kinzelbach, W., and Kipfer, R., (2002)
Experimental investigations on the formation of excess air
in quasi-saturated porous media. Geochemica et
Cosmochimica Acta 66(23): 4103‒4117.
Holocher, J., Peeters, F., Aeschbach-Hertig, W., Kinzelbach,
W., and Kipfer, R., (2003) Kinetic model of gas bubble
dissolution in groundwater and its implications for the
dissolved gas composition. Environmental Science and
Technology 37: 1337‒1343.
Hurlow, H.A., (1998) The geology of the central Virgin
River basin, southwestern Utah, and its relation to
ground-water conditions. State of Utah Water Resources
Bulletin 26, 53 p.
Manning, A.H., Solomon, D.K., and Sheldon, A.L.,( 2003)
Applications of a total dissolved gas pressure probe in
groundwater studies. Ground Water 41 (4): 440‒448.
Marinas, M., Roy, J.W., and Smith, J.E., (2013) Changes in
entrapped gas content and hydraulic conductivity with
pressure. Ground Water 51 (10: 41‒50).
Marston, T.M., and Heilweil, V.M., (2012) Numerical
simulation of groundwater movement and managed
aquifer recharge from Sand Hollow Reservoir, Hurricane
Bench area, Washington County, Utah. U.S. Geological
Survey Scientific Investigations Report 2012‒5236, 34 p.
Marston, T.M., and Heilweil, V.M., (2013) Assessment of
managed aquifer recharge from Sand Hollow Reservoir,
Washington County, updated to conditions in 2012. U.S.
Geological Survey Scientific Investigations Report 2013‒
5057, 40 p.
McGuinness, J.L., and Bordne, E.F., (1971) A comparison of
lysimeter-derived potential evapotranspiration with
computed values. U.S. Department of Agriculture
Technical Bulletin 1472, Agricultural Research Service,
Washington, D.C., 71 p.
Robson, S.G., and Banta, E.R., (1995) Ground-water atlas of
the United States, Segment 2: Arizona, Colorado, New
Mexico, Utah. U.S. Geological Survey Hydrologic
Investigations Atlas 730-C., 32 p.
Sheldon, A., (2002) Diffusion of radiogenic helium in
shallow ground water: Implications for crustal degassing.
Salt Lake City, Utah, University of Utah, Ph.D. Dissertation,
185 p.
95
Clogging Phenomena Related to Surface Water Recharge Facilities A. Hutchison1, M. Milczarek2 and M. Banerjee2 1 Recharge Planning Manager Orange County Water District 2 GeoSystems Analysis, Inc.
1 Introduction Dr. Herman Bouwer once wrote:
“Clogging of the infiltration surface and resulting reductions in infiltration rates are the bane of all artificial recharge systems.” (added emphasis) (Bouwer, 2002).
In many cases, clogging is what limits the capacity of managed aquifer recharge (MAR) facilities, whether they
be injection wells, subsurface recharge galleries or surface spreading facilities. Needless to say, in order to
maximize the capacity of MAR facilities, understanding clogging and developing successful mitigation
strategies are critical. This section of the clogging monograph focuses on clogging of surface spreading
facilities and is divided into two parts. Part I presents a summary of literature reviewed on this topic Part II
presents surface spreading performance data for Orange County Water District (OCWD or District), located in
southern California, USA. The purpose of Part I of the Clogging Monograph is to present a literature review of
the mechanisms that control clogging.
2 Clogging of Surface Spreading Facilities Over time, all surface water spreading facilities will clog
(Baveye et al., 2001; Bouwer et al., 2001; Bouwer and Rice,
2001; Schubert, 2004). Surface waters used for recharge
often contain significant quantities of suspended
sediments and microorganisms, which lead to clogging
(Bouwer and Rice, 1989; Behnke, 1969). It must be noted
that the clogging seen in spreading basins is different
than in rivers and stream channels due to the self-
cleaning potential of rivers and stream channels (e.g., bed
sediment transport), which can reduce clogging
depending on the timing and magnitude of runoff events
(Rehg, 2005; Schubert, 2004, Lacher, 1996).
Clogging can be caused by physical, biological and
chemical processes. Each of these processes can work
individually or collectively to reduce infiltration rates.
Factors that influence the development and extent of a
clogging layer include the effluent water quality, basin
soil texture, ponding depth, hydraulic loading rate and
cycle, and vegetation. Moreover, due to changes in water
quality, water depth, and basin bottom conditions, these
processes can be active at different times and in different
locations (Becker et al., 2012; Racz et al., 2012). Thus
obtaining a detailed understanding of how clogging
affects infiltration rates is challenging because it involves
multiple processes that are changing in importance in
time and space.
Clogging of the infiltration surface has multiple effects,
including:
1. Reducing infiltration rates (Duryea, 1996; Bouwer
and Rice, 1989; Behnke, 1969; Allison, 1947);
2. Diminishing the effectiveness of soil aquifer
treatment (Siegrist, 1987);
3. Necessitating regular maintenance (e.g., draining
and scraping basin floors); and,
4. Potentially leading to site abandonment in extreme
cases (Grischek, 2006).
The clogging layer is often thin (millimeters to
4 centimeters) and may consist of suspended solids,
96
algae, microbes, dust, and salts. As defined by Houston et
al. (1999), the clogging layer is the zone of material over
which a sharp drop in hydraulic head occurs as water
infiltrates into a sedimentary profile. That is, the clogging
layer reduces the hydraulic conductivity of the sediment
such that the underlying material below the basin bottom
will eventually become unsaturated. Hydraulic
conductivity is a quantitative measure of sediment’s
ability to transmit water when subjected to a given
hydraulic gradient. The effective hydraulic conductivity
(Ke) is the overall hydraulic conductivity of an infiltrative
zone that includes the clogging layer and the sediment
below (Beach, 2005). Ke will be used in this paper to
discuss the hydraulic conductivity of sediments except if
specified otherwise.
Two distinct types of clogging layers typically exist:
1. Upper Layer ‒ is an accumulation of particulate
matter, algae, and/or microbes above the original
sediment surface (outer blockage); and,
2. Lower Layer ‒ the native sediment with organic and
inorganic solids trapped in the pore space (inner
blockage).
Consolidation from overburden pressure caused by the
depth of ponding typically controls the conductivity of
the upper layer (outer blockage). Loss of high
conductivity pore space in the native soil controls the
conductivity of the lower layer (inner blockage).
The water quality components that primarily influence
the formation of a clogging layer are physical
(accumulation of suspended solids) and biological
(blockage by microorganisms and their byproducts). In
addition, extended ponding periods enhance soil
clogging, whereas wetting and drying cycles tend to
destroy the clogging layer; under long-term ponding
conditions, the hydraulics of an infiltration basin is often
controlled by the clogging layer, regardless of the native
soil media (Beach, 2005; Houston, 1999; Duryea, 1996).
2.1 Physical Clogging Physical clogging is caused by the deposition and
accumulation of organic and inorganic solids (such as clay
and silt particles, algae cells, and microorganisms) at the
water-sediment interface, leading to the formation of a
filter cake (outer blockage). The rate of clogging is
determined by the rate of suspended solids deposition,
the size distribution of the suspended solids and the size
distribution of the receiving sediments. Larger
suspended solids will tend to accumulate on the
sediment surface, but smaller suspended solids can
potentially migrate into the pore space of the receiving
sediment and cause inner blockage (Bouwer, 2002;
McDowell-Boyer et al., 1986). If deep penetration of
particles occurs, it can reduce the effectiveness of surface
cleaning, thus potentially leading to irrecoverable losses
in infiltration capacities (Rehg, 2005).
Additional suspended solids can be introduced to a
spreading facility by erosion, wave action, and windborne
dust. When suspended solids in the influent water are
relatively high, the clogging caused by these additional
factors is secondary to the clogging caused by the
accumulation of solids in the influent water. When
recharging water with low suspended solids, these factors
dominate physical clogging processes. To address this, it
is recommended to design recharge facilities to minimize
the impact of erosion or wave action (Bouwer, 2002).
2.2 Biological Clogging Microbial cells and their metabolic byproducts (gas
entrapped in pores or exopolymers that clog pores) can
alter a number of sediment properties such as pore size,
pore volume, and flow path interconnectedness, which in
turn affect the hydraulic conductivity of the media
(Baveye et al., 1998). Water quality, in particular the
nutrient load, is the most important factor that influences
the development of the microbial component of the
clogging layer (Winter and Goetz, 2003). Elevated
concentrations of carbon and macro-nutrients (i.e.
nitrogen and phosphorus), commonly found in treated
sewage effluent, stimulate microbial growth such that
biological clogging rates correlate to the biological
oxygen demand. Clogging from algal blooms may also
occur even in relatively low nutrient waters and may need
to be actively managed via herbicides or algal feeders
(fish). Nonetheless, biological clogging can be reversed,
typically by allowing the facility to dry, which causes the
extracellular polysaccharides and microbes that cause
clogging to biodegrade (Houston et al., 1999; Magesan et
al., 1999; Duryea, 1996).
97
2.3 Other Clogging Factors Other factors that play a minor role in clogging include
chemical precipitation and deposition in the pores
(Bouwer, 2002; Platzer and Mauch, 1997), growth of plant-
rhizomes and roots (Vymazal et al., 1998; Brix, 1994, 1997;
McIntyre and Riha, 1991), formation and accumulation of
humic substances (Siegrist et al., 1991), generation of gas
(Langergraber et al., 2003), and compaction of the
clogging layer (Houston et al., 1999; McDowell-Boyer et
al., 1986). Chemical properties of soil particles and the
infiltrating water, such as electrolyte concentration, pH,
redox potential, and mineralogical composition of the
sediment may influence the geometry of the pore space
and may affect the shape and stability of the pores, which
in turn determines the hydraulic conductivity of the
media (Baveye et al., 1998).
3 Parameters that Influence Clogging Achievable infiltration rates in surface spreading
operations, or the bulk Ke, is controlled by four main
factors (Beach, 2005):
1) Hydraulic conductivity of the infiltrative surface,
including the clogging layer;
2) Height of ponding above the infiltrative surface;
3) Thickness of the clogging layer; and,
4) Moisture pressure potential (tension) of the
subsurface sediments.
Nonetheless, many studies show that the bulk Ke, is
generally controlled by the characteristics of the clogging
layer (Phipps et al., 2007; Beach, 2005; Houston, 1999;
Duryea, 1996). Moreover, total suspended solids and the
nutrient load, typically characterized by Biological Oxygen
Demand (BOD), appear to be the most important
components that influence the formation of a clogging
layer.
Physical clogging has been observed to depend on the
total mass of suspended solids and particle size
distribution of the porous media with reduction in basin
recharge rates well described by an exponential decay
function (Phipps et al., 2007). Microbial clogging has
been observed to reduce hydraulic conductivity and
eventually stabilize to a constant value (Taylor and Jaffe,
1990; Frankenberger et al., 1979). Clogging usually occurs
on or near the surface except in two instances: when a soil
has hydraulic properties similar to those of the clogging
material or when fines migrate and accumulate in a soil at
a depth significantly below the surface, thereby resulting
in a deeper restricting zone (Duryea 1996).
The following parameters influence the extent of
clogging:
1) Water quality. The reduction and/ or prevention of
clogging, is largely dependent on the quality of the
infiltrated water (e.g. Hollander et al., 2005; Bouwer, 2002).
Bouwer (2002) and EWRI/ASCE (2001) recommend
treating recharge water to “drinking water quality” to
reduce or eliminate clogging. Attempts to develop
guidelines on the quality of water suitable for aquifer
recharge are often based on sparse data, and have not
been reliably validated (Alvarez 2008; Pavelic 2007). To
date, models to predict theoretical clogging time due to
physical clogging have been limited in real-world
application (e.g. Langergraber et al., 2003; Aaltomaa and
Joy, 2002), or not fully tested at the field scale (e.g. Phipps
et al., 2007). The extent of soil clogging is closely
correlated to total suspended solids (TSS), biological
oxygen demand (BOD), and carbon to nitrogen (C:N) ratio.
Following are more detailed descriptions of water quality
impacts on clogging.
a. Total suspended solids (TSS). Clogging resulting
from the deposition of TSS is typically the key
determinant in recharge performance (Hutchinson,
2007; Winter and Goetz, 2003; Siegrist and Boyle,
1987; Vecchioli, 1972; Harpaz, 1971; Hauser and
Lotspeich, 1967). The direct relationship between
TSS load and recharge performance, however, is
typically site specific. TSS consisting of primarily
fine-grained (clay) particles may result in greater
recharge reduction than a coarser particle load.
Recharge facilities in the Netherlands and Great
Britain do not allow recharge water with turbidity of
more than 2 to 5 NTU (Hollander, 2005); most
recharge facilities appear to develop their own
turbidity criteria. Although turbidity measures
approximately the same water quality property as
TSS, direct conversion between turbidity and TSS is
typically not possible. Turbidity is caused by
suspended matter or impurities that interfere with
the clarity of the water; whereas larger light weight

98
particles (e.g. algae) can cause greater turbidity
than smaller, heavier inorganic particles.
b. BOD and C:N ratio. Soil irrigated with water that has
a high C:N ratio (i.e. 50:1) and/or high BOD exhibits
significant increases in soil microbial biomass and
extracellular carbon deposition, with a subsequent
decrease in hydraulic conductivity (Aaltomaa and
Joy, 2002; Jnad, 2001, Magesan et al., 1999;
Vandeviere and Baveye, 1992a).
c. Other water quality parameters. Soil clogging layer
development is loosely associated with total
nitrogen and total phosphorous content, which also
contribute to biological growth (Magesan et al.,
1999). Bouwer (1988) also proposed the Sodium
Adsorption Ratio (SAR) as a parameter for water
quality assessment, due to the influence of sodium
on the hydraulic property of clays.
2) Particle-size of sediment media. The importance of
particle size on the extent of clogging varies. In the short
term, clogging layer formation is accelerated in fine-
grained sediments and reduction of infiltration rates
occurs faster in these sediments than in coarse-grained
sediments (Aaltomaa and Joy, 2002). However, there is
potentially a greater relative reduction in Ke in coarse-
grained sediments than in fine-grained soils. Where the
Ke may be similar to that of the clogging material, the
clogging layer may not govern the Ke of the soil profile,
whereas, sandier sediments may experience reductions of
0.5 to 5 orders of magnitude in hydraulic conductivity (i.e.
from 10-2 cm/sec up to 10-7 cm/sec, Duryea, 1996; Rinck-
Pfeiffer, 2000; Beach, 2005; Taylor and Jaffe, 1990;
Magesan, 2000; Jnad et al., 2001; Rodgers et al., 2004).
Soil particle-size can impact the depth of the clogging
layer with sandy sediments having shallower (up to a few
cm) clogging layers, and gravels clogging deeper (more
than 100 cm) (Blazejewski and Murat-Blazejewski, 1997).
3) Ponding depth. Depending on clogging conditions,
ponding depth may increase, decrease, or not affect the
infiltration rate and Ke (Houston et al., 1999; Duryea,
1996). Two opposing factors result from ponding water
depth: an increased hydraulic gradient versus increased
compaction of the clogging layer. Increasing the water
ponding depth increases the infiltration rate if all other
factors remain the same. However, increasing the water
ponding depth causes the loose clogging layer to
compact which can then cause a reduction in the
infiltration rate (Bouwer and Rice, 1989). In general, field
studies have found that infiltration rates decrease as
clogging layer thickness and ponding depth increases
(Houston et al., 1999).
4) Hydraulic loading rate. Loading rate, the rate at
which water is applied to the soil surface, also affects the
extent of clogging. Lower loading rates may reduce the
formation of a clogging layer (Siegrist, 1987). However, in
the long-term, for a given media and application method,
the clogging layer may reach a maximum reduction in
hydraulic conductivity independent of loading rate
(Beach, 2005). In practice, a lower hydraulic loading rate is
best achieved through loading cycles (see below).
5) Loading cycles. Techniques such as cycles of flooding
and drying can restore hydraulic conductivity to higher
levels by disturbing the clogging layer (Houston et al.,
1999; Duryea, 1996). Many managed aquifer recharge
operations use 1:1 on-off cycle ratios where basins are
allowed to dry for 50 percent of the time.
6) Vegetation. Vegetation may contribute to a decrease
in soil hydraulic conductivity in wetland environments
(Winter and Goetz, 2003; Dahab and Surampalli, 2001;
Blazejewski, 1997; Jiang, 1995; Brix, 1994; McIntyre and
Riha, 1991). Production of root exudates by plants may
cause soil clogging, resulting in a decrease in hydraulic
conductivity (McIntyre and Riha, 1991). Leaf litter may
also contribute to surface clogging (Batchelor and Loots,
1997) whereas certain plants (i.e. Phragmites australis)
may reduce soil clogging via penetration by plant roots
and rhizomes which loosens the soil and increases the
hydraulic conductivity (Cooper et al., 2005). Dead roots
and rhizomes may create large pores or channels for
water movement (Brix, 1997).
Tables 1 and 2 present an overview of published data
showing the influence of various parameters on extent of
clogging. Table 1 gives actual Ke values with particular
soil types and water quality. For studies where the actual
Ke was not published, Table 2 shows the relative
reductions in Ke due to clogging parameters. Table 3
provides water quality data from research where clogging
was limited or absent.
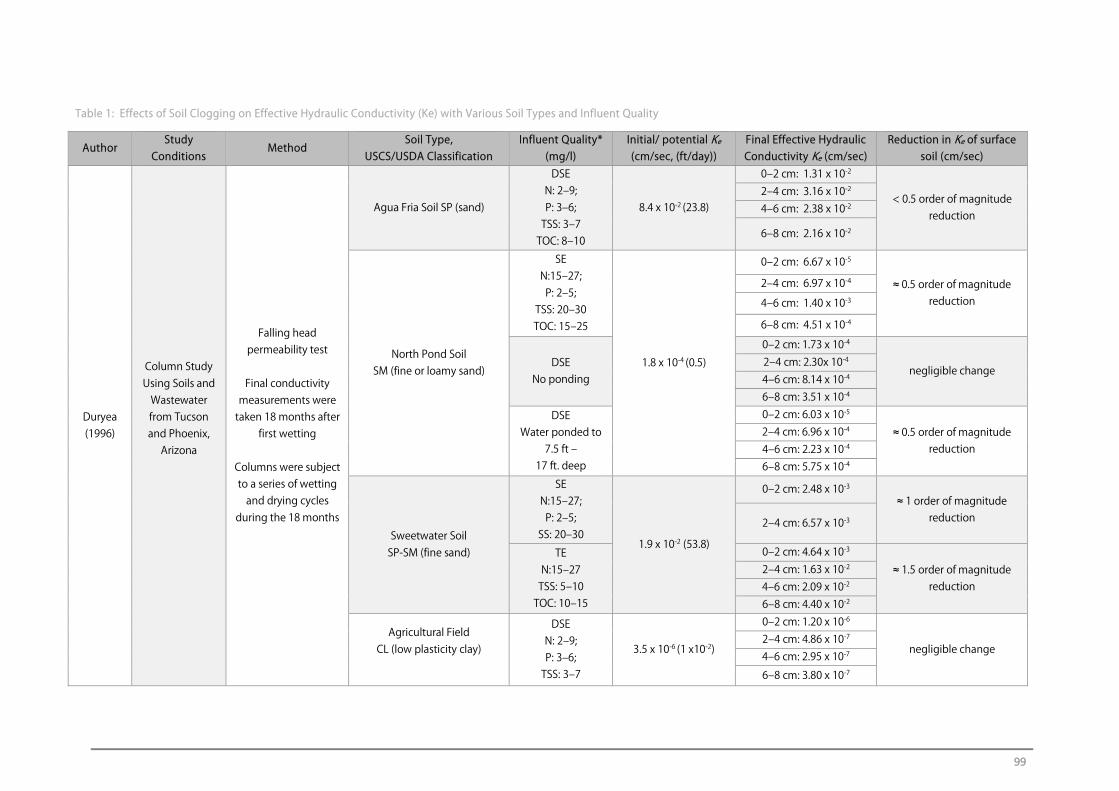
99
Table 1: Effects of Soil Clogging on Effective Hydraulic Conductivity (Ke) with Various Soil Types and Influent Quality
Author Study
Conditions Method
Soil Type, USCS/USDA Classification
Influent Quality*(mg/l)
Initial/ potential Ke (cm/sec, (ft/day))
Final Effective Hydraulic Conductivity Ke (cm/sec)
Reduction in Ke of surface soil (cm/sec)
Duryea (1996)
Column Study Using Soils and Wastewater from Tucson and Phoenix,
Arizona
Falling head permeability test
Final conductivity
measurements were taken 18 months after
first wetting
Columns were subject to a series of wetting and drying cycles
during the 18 months
Agua Fria Soil SP (sand)
DSE N: 2‒9; P: 3‒6; TSS: 3‒7 TOC: 8‒10
8.4 x 10⁻² (23.8)
0‒2 cm: 1.31 x 10⁻²
< 0.5 order of magnitude reduction
2‒4 cm: 3.16 x 10⁻² 4‒6 cm: 2.38 x 10⁻²
6‒8 cm: 2.16 x 10⁻²
North Pond Soil SM (fine or loamy sand)
SE N:15‒27; P: 2‒5;
TSS: 20‒30 TOC: 15‒25
1.8 x 10⁻⁴ (0.5)
0‒2 cm: 6.67 x 10⁻⁵
≈ 0.5 order of magnitude reduction
2‒4 cm: 6.97 x 10⁻⁴
4‒6 cm: 1.40 x 10⁻³
6‒8 cm: 4.51 x 10⁻⁴
DSE No ponding
0‒2 cm: 1.73 x 10⁻⁴
negligible change 2‒4 cm: 2.30x 10⁻⁴ 4‒6 cm: 8.14 x 10⁻⁴ 6‒8 cm: 3.51 x 10⁻⁴
DSE Water ponded to
7.5 ft ‒ 17 ft. deep
0‒2 cm: 6.03 x 10⁻⁵
≈ 0.5 order of magnitude reduction
2‒4 cm: 6.96 x 10⁻⁴ 4‒6 cm: 2.23 x 10⁻⁴ 6‒8 cm: 5.75 x 10⁻⁴
Sweetwater Soil SP-SM (fine sand)
SE N:15‒27; P: 2‒5;
SS: 20‒30 1.9 x 10⁻² (53.8)
0‒2 cm: 2.48 x 10⁻³ ≈ 1 order of magnitude
reduction 2‒4 cm: 6.57 x 10⁻³
TE N:15‒27 TSS: 5‒10 TOC: 10‒15
0‒2 cm: 4.64 x 10⁻³ ≈ 1.5 order of magnitude
reduction 2‒4 cm: 1.63 x 10⁻² 4‒6 cm: 2.09 x 10⁻² 6‒8 cm: 4.40 x 10⁻²
Agricultural Field CL (low plasticity clay)
DSE N: 2‒9; P: 3‒6; TSS: 3‒7
3.5 x 10⁻⁶ (1 x10⁻²)
0‒2 cm: 1.20 x 10⁻⁶
negligible change 2‒4 cm: 4.86 x 10⁻⁷ 4‒6 cm: 2.95 x 10⁻⁷
6‒8 cm: 3.80 x 10⁻⁷
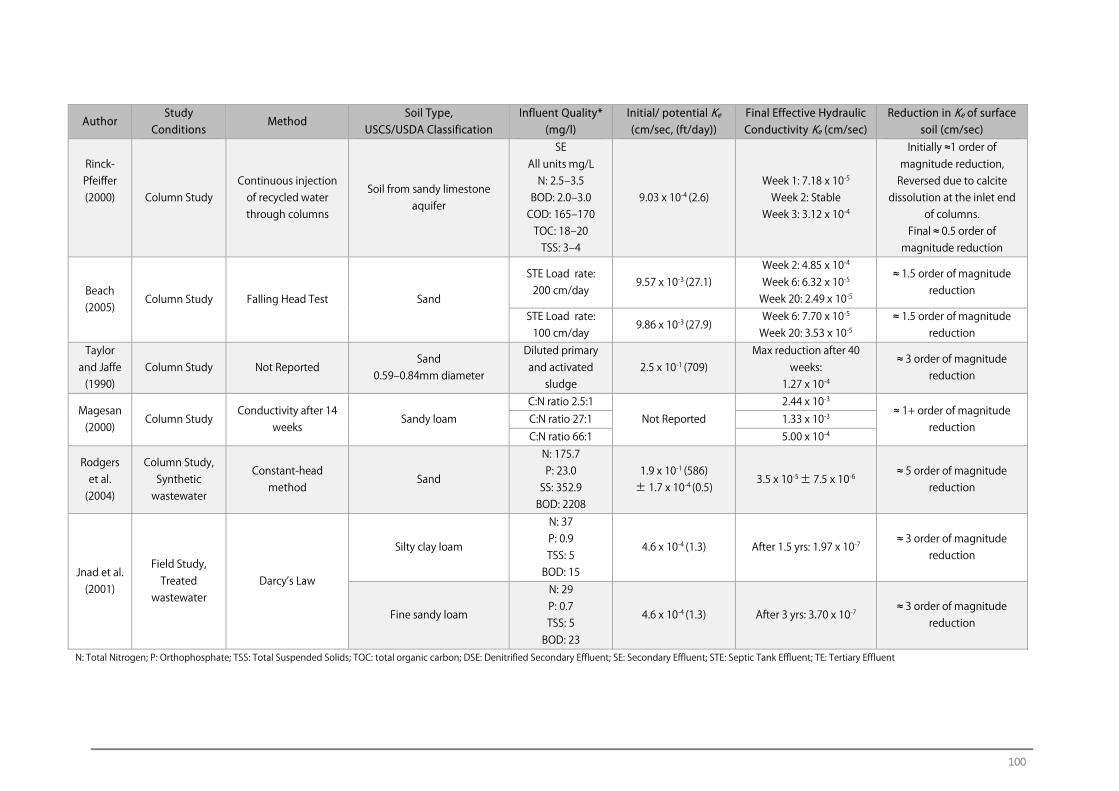
100
Author Study
Conditions Method
Soil Type, USCS/USDA Classification
Influent Quality*(mg/l)
Initial/ potential Ke (cm/sec, (ft/day))
Final Effective Hydraulic Conductivity Ke (cm/sec)
Reduction in Ke of surface soil (cm/sec)
Rinck-Pfeiffer (2000)
Column Study Continuous injection of recycled water through columns
Soil from sandy limestone aquifer
SE All units mg/L
N: 2.5‒3.5 BOD: 2.0‒3.0 COD: 165‒170 TOC: 18‒20 TSS: 3‒4
9.03 x 10⁻⁴ (2.6) Week 1: 7.18 x 10⁻⁵
Week 2: Stable Week 3: 3.12 x 10⁻⁴
Initially ≈1 order of magnitude reduction, Reversed due to calcite
dissolution at the inlet end of columns.
Final ≈ 0.5 order of magnitude reduction
Beach (2005)
Column Study Falling Head Test Sand
STE Load rate: 200 cm/day
9.57 x 10⁻³ (27.1) Week 2: 4.85 x 10⁻⁴
Week 6: 6.32 x 10⁻⁵
Week 20: 2.49 x 10⁻⁵
≈ 1.5 order of magnitude reduction
STE Load rate: 100 cm/day
9.86 x 10⁻³ (27.9) Week 6: 7.70 x 10⁻⁵
Week 20: 3.53 x 10⁻⁵ ≈ 1.5 order of magnitude
reduction Taylor
and Jaffe (1990)
Column Study Not Reported Sand
0.59‒0.84mm diameter
Diluted primary and activated
sludge 2.5 x 10⁻¹ (709)
Max reduction after 40 weeks:
1.27 x 10⁻⁴
≈ 3 order of magnitude reduction
Magesan (2000)
Column Study Conductivity after 14
weeks Sandy loam
C:N ratio 2.5:1 Not Reported
2.44 x 10⁻³ ≈ 1+ order of magnitude
reduction C:N ratio 27:1 1.33 x 10⁻³ C:N ratio 66:1 5.00 x 10⁻⁴
Rodgers et al. (2004)
Column Study, Synthetic
wastewater
Constant-head method
Sand
N: 175.7 P: 23.0
SS: 352.9 BOD: 2208
1.9 x 10⁻¹ (586)
± 1.7 x 10⁻⁴ (0.5) 3.5 x 10⁻⁵ ± 7.5 x 10⁻⁶
≈ 5 order of magnitude reduction
Jnad et al. (2001)
Field Study, Treated
wastewater Darcy’s Law
Silty clay loam
N: 37 P: 0.9 TSS: 5
BOD: 15
4.6 x 10⁻⁴ (1.3) After 1.5 yrs: 1.97 x 10⁻⁷ ≈ 3 order of magnitude
reduction
Fine sandy loam
N: 29 P: 0.7 TSS: 5
BOD: 23
4.6 x 10⁻⁴ (1.3) After 3 yrs: 3.70 x 10⁻⁷ ≈ 3 order of magnitude
reduction
N: Total Nitrogen; P: Orthophosphate; TSS: Total Suspended Solids; TOC: total organic carbon; DSE: Denitrified Secondary Effluent; SE: Secondary Effluent; STE: Septic Tank Effluent; TE: Tertiary Effluent
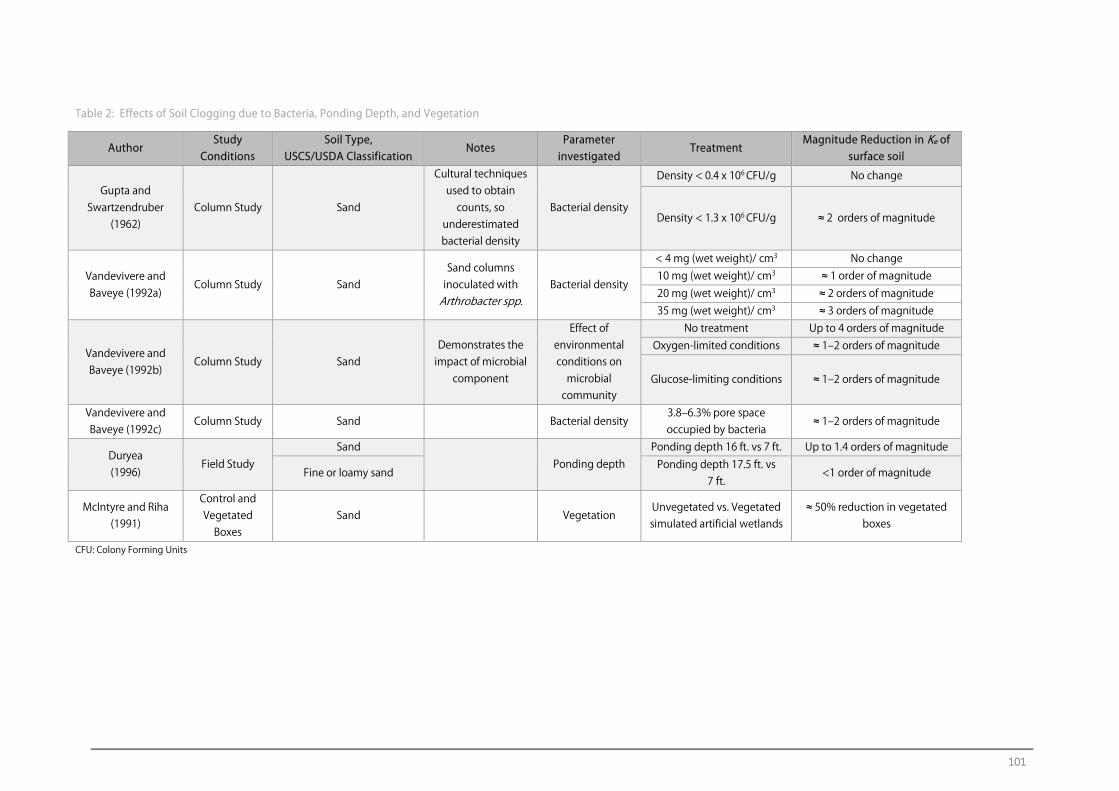
101
Table 2: Effects of Soil Clogging due to Bacteria, Ponding Depth, and Vegetation
Author Study
Conditions Soil Type,
USCS/USDA Classification Notes
Parameter investigated
Treatment Magnitude Reduction in Ke of
surface soil
Gupta and Swartzendruber
(1962) Column Study Sand
Cultural techniques used to obtain
counts, so underestimated bacterial density
Bacterial density
Density < 0.4 x 10⁶ CFU/g No change
Density < 1.3 x 10⁶ CFU/g ≈ 2 orders of magnitude
Vandevivere and Baveye (1992a)
Column Study Sand Sand columns inoculated with Arthrobacter spp.
Bacterial density
< 4 mg (wet weight)/ cm3 No change 10 mg (wet weight)/ cm3 ≈ 1 order of magnitude 20 mg (wet weight)/ cm3 ≈ 2 orders of magnitude 35 mg (wet weight)/ cm3 ≈ 3 orders of magnitude
Vandevivere and Baveye (1992b)
Column Study Sand Demonstrates the impact of microbial
component
Effect of environmental conditions on
microbial community
No treatment Up to 4 orders of magnitude Oxygen-limited conditions ≈ 1‒2 orders of magnitude
Glucose-limiting conditions ≈ 1‒2 orders of magnitude
Vandevivere and Baveye (1992c)
Column Study Sand Bacterial density 3.8‒6.3% pore space occupied by bacteria
≈ 1‒2 orders of magnitude
Duryea (1996)
Field Study Sand
Ponding depth Ponding depth 16 ft. vs 7 ft. Up to 1.4 orders of magnitude
Fine or loamy sand Ponding depth 17.5 ft. vs
7 ft. <1 order of magnitude
McIntyre and Riha (1991)
Control and Vegetated
Boxes Sand Vegetation
Unvegetated vs. Vegetated simulated artificial wetlands
≈ 50% reduction in vegetated boxes
CFU: Colony Forming Units
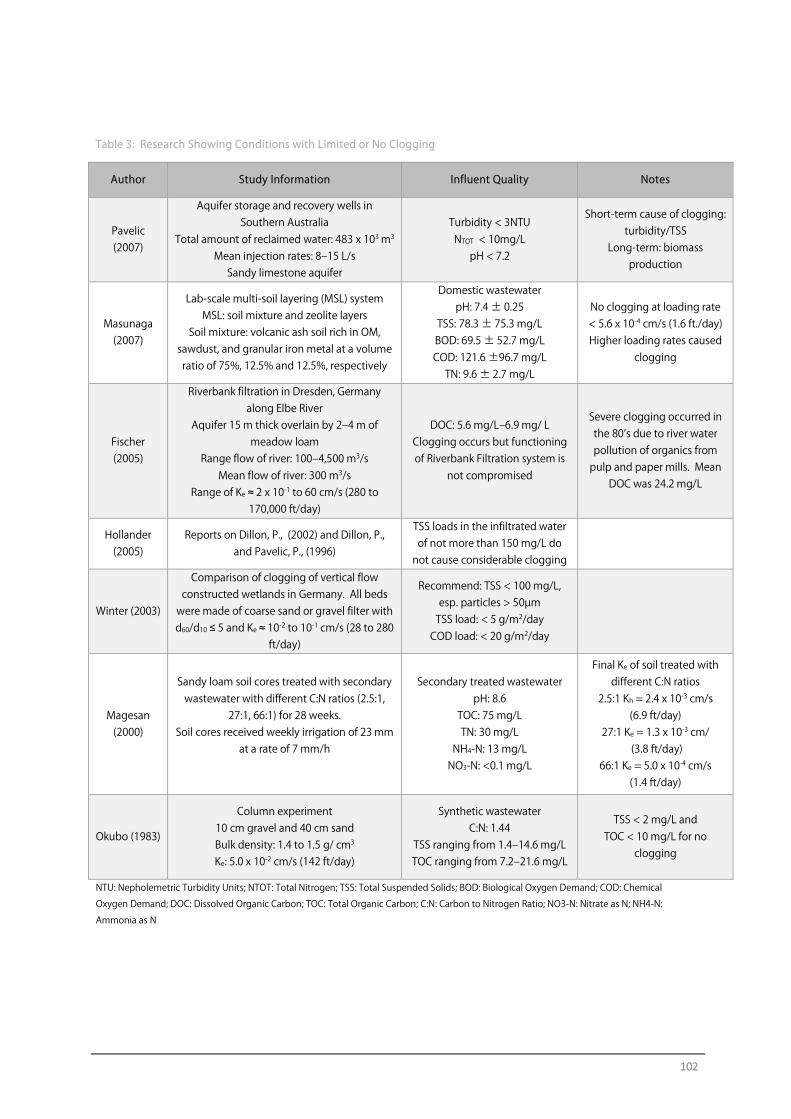
102
Table 3: Research Showing Conditions with Limited or No Clogging
Author Study Information Influent Quality Notes
Pavelic (2007)
Aquifer storage and recovery wells in Southern Australia
Total amount of reclaimed water: 483 x 103 m3
Mean injection rates: 8‒15 L/s Sandy limestone aquifer
Turbidity < 3NTU NTOT < 10mg/L
pH < 7.2
Short-term cause of clogging: turbidity/TSS
Long-term: biomass production
Masunaga (2007)
Lab-scale multi-soil layering (MSL) system MSL: soil mixture and zeolite layers
Soil mixture: volcanic ash soil rich in OM, sawdust, and granular iron metal at a volume ratio of 75%, 12.5% and 12.5%, respectively
Domestic wastewater pH: 7.4 ± 0.25
TSS: 78.3 ± 75.3 mg/L BOD: 69.5 ± 52.7 mg/L COD: 121.6 ±96.7 mg/L
TN: 9.6 ± 2.7 mg/L
No clogging at loading rate < 5.6 x 10⁻⁴ cm/s (1.6 ft./day)Higher loading rates caused
clogging
Fischer (2005)
Riverbank filtration in Dresden, Germany along Elbe River
Aquifer 15 m thick overlain by 2‒4 m of meadow loam
Range flow of river: 100‒4,500 m3/s Mean flow of river: 300 m3/s
Range of Ke ≈ 2 x 10⁻¹ to 60 cm/s (280 to 170,000 ft/day)
DOC: 5.6 mg/L‒6.9 mg/ L Clogging occurs but functioning of Riverbank Filtration system is
not compromised
Severe clogging occurred in the 80’s due to river water pollution of organics from pulp and paper mills. Mean
DOC was 24.2 mg/L
Hollander (2005)
Reports on Dillon, P., (2002) and Dillon, P., and Pavelic, P., (1996)
TSS loads in the infiltrated water of not more than 150 mg/L do
not cause considerable clogging
Winter (2003)
Comparison of clogging of vertical flow constructed wetlands in Germany. All beds
were made of coarse sand or gravel filter with d60/d10 ≤ 5 and Ke ≈ 10-2 to 10-1 cm/s (28 to 280
ft/day)
Recommend: TSS < 100 mg/L, esp. particles > 50µm TSS load: < 5 g/m2/day
COD load: < 20 g/m2/day
Magesan (2000)
Sandy loam soil cores treated with secondary wastewater with different C:N ratios (2.5:1,
27:1, 66:1) for 28 weeks. Soil cores received weekly irrigation of 23 mm
at a rate of 7 mm/h
Secondary treated wastewater pH: 8.6
TOC: 75 mg/L TN: 30 mg/L
NH4-N: 13 mg/L NO3-N: <0.1 mg/L
Final Ke of soil treated with different C:N ratios
2.5:1 Kh = 2.4 x 10⁻³ cm/s (6.9 ft/day)
27:1 Ke = 1.3 x 10⁻³ cm/ (3.8 ft/day)
66:1 Ke = 5.0 x 10⁻⁴ cm/s (1.4 ft/day)
Okubo (1983)
Column experiment 10 cm gravel and 40 cm sand Bulk density: 1.4 to 1.5 g/ cm3
Ke: 5.0 x 10⁻² cm/s (142 ft/day)
Synthetic wastewater C:N: 1.44
TSS ranging from 1.4‒14.6 mg/L TOC ranging from 7.2‒21.6 mg/L
TSS < 2 mg/L and
TOC < 10 mg/L for no clogging
NTU: Nepholemetric Turbidity Units; NTOT: Total Nitrogen; TSS: Total Suspended Solids; BOD: Biological Oxygen Demand; COD: Chemical
Oxygen Demand; DOC: Dissolved Organic Carbon; TOC: Total Organic Carbon; C:N: Carbon to Nitrogen Ratio; NO3-N: Nitrate as N; NH4-N:
Ammonia as N
103
4 Conclusions The hydraulic properties of infiltration basins used to
recharge surface water and wastewater effluent typically
become dominated by a low conductivity clogging layer
which forms at the water-soil interface. The clogging
layer is often thin (millimeters to 4 centimeters) and may
consist of suspended solids, algae, microbes, dust, and
salts. Clogging layer formation has been observed to
reduce the hydraulic conductivity of soil materials by as
much as five orders of magnitude.
There are physical, chemical, and biological causes of
clogging. Factors that influence the development and
extent of a clogging layer include water quality, basin soil
texture, ponding depth, hydraulic loading rate and cycle,
and vegetation. Research has found that biological
oxygen demand and total suspended solids are the most
important components of water quality that influence the
formation of a clogging layer. In addition, extended
ponding periods enhance soil clogging, whereas wetting
and drying cycles tend to destroy the clogging layer.
5 References Aaltomaa, T. and Joy, D.J., (2002) Field testing of
absorption bed clogging. CSCE/ EWRI of ASCE
Environmental Engineering Conference, Niagara Falls.
Allison, L.E., (1947) Effect of microorganisms on
permeability of soil under prolonged submergence. Soil
Science. 63:439‒450.
Alvarez, J.A., Ruiz, I. Soto, M., (2008) Anaerobic digesters
as a pretreatment for constructed wetlands. Ecological
Engineering. 33: 54‒67.
Batchelor, A. and Loots, P., (1997) A critical evaluation of a
pilot scale subsurface flow wetland: 10 years after
commissioning. Water Science and Technology 35: 337‒
343.
Baveye, P., Vandevivere, P. Hoyle, B.L., DeLeo, P.C., and de
Lozada, D.S., (1998) Environmental impact and
mechanisms of the biological clogging of saturated soils
and aquifer materials. Critical Reviews in Environmental
Science and Technology. 28:123‒191.
Beach, D. N.H., McCray, J., Lowe, K. S., and Siegrist, R. L.,
(2005) Temporal changes in hydraulic conductivity of
sand porous media biofilters during wastewater
infiltration due to biomat formation. Journal of
Hydrology. (article in press, online)
Becker, M.W., Bauer, B. and Hutchinson, A.S., (2012)
Measuring Percolation from an Artificial Recharge Basin
using Fiber Optic Distributed Temperature Sensing.
Ground Water (In press).
Behnke, J.J., (1969) Clogging in surface spreading
operations for artificial groundwater recharge. Water
Resources Research. 5(4): 870‒876
Berend, J.E., An analytical approach to the clogging effect
of suspended matter, Tahal, Water Planning for Israel Ltd.
(Tel Aviv).
Blazejewski, R. and Murat-Blazejewski, S., (1997) Soil
clogging phenomena in constructed wetlands with
subsurface flow. Water Science and Technology. 35: 183‒
188.
Bouwer, H., (1988) Design and management of infiltration
basin for artificial recharge of groundwater. In
Proceedings of the 32nd annual New Mexico conference
on groundwater management, Albuquerque, New
Mexico, November 5-6, 1987, pp. 111‒123.
Bouwer, H. and Rice, R.C., (1989) Effect of water depth in
groundwater recharge basins on infiltration. Journal of
Irrigation and Drainage Engineering, ASCE, 115: 556‒567.
Bouwer, H., Ludke, J., and Rice, R.C., (2001) Sealing pond
bottoms with muddy water. Ecological Engineering.
18:233‒238.
Bouwer, H. and Rice, R.C., (2001) Capturing flood waters
for artificial recharge of groundwater. Proceedings of
10th Biennial Symp. Artificial Recharge of Groundwater,
Tucson, AZ, AZ Hydroglogical Society, pp 99‒106.
Bouwer, H., (2002) Artificial recharge of groundwater:
hydrogeology and engineering. Hydrogeology Journal.
10:121‒142.
Brix, H., (1994) Functions of macrophytes in constructed
wetlands. Water Science and Technology 29: 71‒78.

104
Brix, H., (1997) Do macrophytes play a role in constructed
treatment wetlands? Water Science and Technology. 35:
11‒17.
Cooper, D., Griffin, P., and Cooper, P., (2005) Factors
affecting the longevity of sub-surface horizontal flow
systems operating as tertiary treatment for sewage
effluent. Water Science and Technology 51: 127‒135.
Dahab, M.F., and Surampalli, R.Y., (2001) Subsurface-flow
constructed wetlands treatment in the plains: five years of
experience. Water Science and Technology 44: 375‒380.
Daniel, T.C., and Bouma, J., (1974) Column studies of soil
clogging in a slowly permeable soil as a function of
effluent quality. Journal of Environmental Quality. 3 (4):
321‒326.
Dillon, P., and Pavelic, P., (1996) Guidelines on the quality
of stormwater and treated wastewater for injection into
aquifers for storage and reuse, Urban Water Research
Association of Australian Research, Report No. 109.
Dillon, P., (2002) Banking of stormwater, reclaimed water
and potable water in aquifers, Proceedings of IGWC,
Dindigul, India.
Duryea, P.D., (1996) Clogging Layer Development and
Behavior in Infiltration Basins used for Soil Aquifer
Treatment of Wastewater. Doctoral Dissertation. Arizona
State University, Tempe, Arizona.
EPA (U.S. Environmental Protection Agency), (1999)
Guidance Manual Turbidity Provisions. Accessed on-line:
http://www.epa.gov/OGWDW/mdbp/pdf/turbidity/chap_
07.pdf. June 29, 2008.
EWRI/ASCE. (2001) Standard guidelines for artificial
recharge of groundwater, Environmental and Water
Resources Institute, American Society of Civil Engineers
EWRI/ASCE 34-01.
Frankenberger, W.T. ,Troeh, F.R., and Dumenil, L.C., (1979)
Bacterial effects on hydraulic conductivity of soils. Soil
Science Society of America Journal. 43:333‒338.
Grischek, T., Schubert, J., Jasperse, J.L., Stowe, S.M., Collins,
M.R., (2007) What is the appropriate site for RBF? In
Proceedings of the 6th International Symposium on
Managed Aquifer Recharge. ISMAR 6, Phoenix, Arizona,
October 29‒ November 2, 2007.
Gupta, R.P., and Swartzendruber, D., (1962) Entrapped air
content and hydraulic conductivity of quartz sand. Soil
Science Society of America Proceedings. 26:6‒10.
Harpaz, Y., (1971) Artificial groundwater recharge by
means of wells in Israel. Proceedings of the Journal of the
Hydraulic Division. 1947‒1964.
Hauser, V.L., and Lotspeich, F.B., (1967) Artificial ground
water recharge through wells. Journal of Soil and Water
Conservation, 11‒15.
Holländer, H.M., Hinz, I., Boochs, P.W., and Billib, M., (2005)
Experiments to determine clogging and redevelopment
effects of ASR-wells at laboratory scale. In: Proceedings of
the 5th International Symposium on Managed Aquifer
Recharge ISMAR 5, Berlin, Germany, June 10‒16, 2005.
Houston, S.L., Duryea, P.D., and Hong, R., (1999)
Infiltration considerations for ground-water recharge with
waste effluent. Journal of Irrigation and Drainage
Engineering. 125(5): 264‒272.
Hutchinson, A.S., (2007) Challenges in optimizing a large-
scale managed aquifer recharge operation in an
urbanized area. In Proceedings of the 6th International
Symposium on Managed Aquifer Recharge. ISMAR 6,
Phoenix, Arizona, October 29‒ November 2, 2007.
Jiang, Y., and Matsumoto, S., (1995) Change in
microstructure of clogged soil in soil waste-water
treatment under prolonged submergence. Soil Science
and Plant Nutrition. 41: 20‒213.
Jnad, I., Lesikar, B., Kenimer, A., and Sabbagh, G., (2001)
Subsurface drip dispersal of residential effluent. II. Soil
hydraulic characteristics. Transactions of the American
Society of Agricultural Engineers. 44(5): 1159‒1165.
Lacher, L.J., (1996) Recharge Characteristics of an Effluent
Dominated Stream near Tucson, Arizona. Doctoral
Dissertation. University of Arizona, Tucson, Arizona.
Langergraber, G., Haberl, R., Laber, J., and Pressl, A., (2003)
Evaluation of substrate clogging processes in vertical flow
constructed wetlands. Water Science and Technology.
48:25‒34.
Magesan, G. N., Williamson, J.C., Yeates, G. W., and Lloyd-
Jones, A. Rh., (2000) Wastewater C:N ratio effects on solid
hydraulic conductivity and potential mechanisms for
recovery. Bioresource Technology. 71: 21‒27.

105
Magesan, G.N., Williamson, J.C., Sparling, G.P., Schipper,
L.A., and Lloyd-Jones, A. 1999. Hydraulic conductivity in
soils irrigated with wastewaters of differing strengths:
Field and laboratory studies. Australian Journal of Soil
Research. 37:391‒402.
Masunaga, T., Sato, K., Mori, J., Shirahama, M., Kudo, H.,
and Wakatsuki, T. 2007. Characteristics of wastewater
treatment using a multi-soil-layering system in relation to
wastewater contamination levels and hydraulic loading
rates. Soil Science and Plant Nutrition. 53: 215‒223.
McDowell-Boyer, L.M., Hunt, J.L., and Sitar, N. 1986.
Particle transport through porous media. Water Resources
Research. 22:1901‒1921.
McIntyre, B.D. and Riha, S.J. 1991. Hydraulic conductivity
and nitrogen removal in an artificial wetland system.
Journal of Environmental Quality. 20:259‒263.
Milczarek, M., Woodside, G., Hutchinson, A., Keller, J., Rice,
R., and Canfield, A. 2009. The Orange County Water
District Riverbed Filtration Pilot Project: Water Quality and
Recharge Improvements Using Induced Riverbed
Filtration. In Proceedings of the 7th International
Symposium on Managed Aquifer Recharge. ISMAR 7, Abu
Dhabi (UAE), October 9 ‒ 13, 2009.
Mohanty, B.P., T.H. Skaggs, and M.Th. van Genuchten.
1998. Impact of saturated hydraulic conductivity on the
prediction of tile flow. Soil Science Society of America
Journal. 62:1522‒1529.
Natural Resources Conservation Service, United States
Department of Agriculture, 2005. Saturated Hydraulic
Conductivity: Water Movement Concepts and Class
History.
http://soils.usda.gov/technical/technotes/note6.html.
Natural Resources Conservation Service, United States
Department of Agriculture, 1977. Soil Survey of Maricopa
County, Central Part. NRCS: see Natural Resources
Conservation Service.
Okubo, T. and Matsumoto, J. 1983. Biological clogging of
sand and changes of organic constituents during artificial
recharge. Water Research. 17: 813‒821.
Pavelic, P., Dillon, P.J., Barrya, K.,E., Vanderzalma, J.L.,.
Corrella, R.L., and Rinck-Pfeiffer, S.M. 2007. Water quality
effects on clogging rates during reclaimed water ASR in a
carbonate aquifer. Journal of Hydrology. 334:1‒16.
Pavelic, P., Dillon, P.J., Barry, K.W., Herczeg, A.L., Rattray,
K.J., Hekmeijer, P., and Gerges, N.Z., (1998) Well clogging
effects determined from mass balances and hydraulic
response at a stormwater ASR site. TISAR’98 In the
Proceedings of the Third Symposium on Artificial
Recharge of Groundwater, September 21‒25, 1998,
Amsterdam, pp 61‒66.
Phipps, D., Lyon, S., Hutchinson, A. 2007. Development of
a percolation decay model to guide future optimization of
surface water recharge basins. In Proceedings of the 6th
International Symposium on Managed Aquifer Recharge.
ISMAR 6, Phoenix, Arizona, October 29 ‒ November 2,
2007.
Platzer, C. and Mauch, K. 1997. Soil clogging in vertical
flow reed beds ‒ mechanisms, parameters, consequences,
and solutions? Water Science and Technology. 35: 175‒
181.
Racz, A.J., Fisher, A.T., Schmidt, C.M., Lockwood, B.S., and
Los Huertos, M. 2012. Spatial and Temporal Infiltration
Dynamics During Managed Aquifer Recharge. Ground
Water 50, No. 4, pp 562‒570.
Rehg, K.J., Packman, A.I. and Ren, J. 2005. Effects of
suspended sediment characteristics and bed sediment
transport on streambed clogging. Hydrological Processes.
19:413‒427.
Rinck-Pfeiffer, S, Ragusa, S., Sztajnbok, P., and
Vandevelde, T. 2000. Interrelationships between
biological, chemical, and physical processes as an analog
to clogging in aquifer storage and recovery (ASR) wells.
Water Research. 34:2110‒2118.
Rodgers, M., Mulqueen, J., and Healy, M.G. 2004. Surface
clogging in an intermittent stratified sand filter. Soil
Science Society of America. 68: 1827‒1832.
Sakthivadivel, R. 1966. Theory and mechanism of filtration
of non-colloidal fines through a porous medium. Tech.
Rep. HEL 15‒5, Hydr. Engerg. Lab., University of California,
Berkeley, CA.
Schubert, J 2004. Significance of hydrologic aspects on
RBF performance. NATO Advanced Research Workshop,
Samorin, Slovakia. September 7‒10, 2004.
http://www.soulstatic.com/NATORBF/papers/schubert/hy
drology.pdf (accessed 6.16.2008).

106
Siegrist, R.L., (1987) Soil clogging during subsurface
wastewater infiltration as affected by effluent
composition and loading rate. Journal of Environmental
Quality. 16(2): 181‒187.
Siegrist, R.L., and Boyle, W.C., (1987) Wastewater-induced
soil clogging development. Journal of Environmental
Engineering. 113(3): 550‒566
Siegrist, R.L., Smed-Hildmann, R., Filip, Z.K., and Jenssen,
P.D., 1991. Humic substance formation during wastewater
infiltration. In: Conference Proceedings, On-site
wastewater treatment. ASAE Publication 10-91, Chicago,
IL, USA, pp. 223‒232.
Taylor, S., and Jaffe, P.R., (1990) Substrate and Biomass
Transport in a Porous Medium. Water Resources
Research. 26(9): 2181‒2194.
Taylor, S., and Jaffe, P.R., (1990a) Biofilm growth and the
related changes in the physical properties of a porous
medium. 1. Experimental investigation. Water Resources
Research. 26(9): 2153‒2159.
Vandevivere, P., and Baveye, P., (1992a) Saturated
hydraulic conductivity reduction caused by aerobic
bacteria in sand columns. Soil Science Society of America
Journal. 56: 1‒13.
Vandevivere, P., and Baveye, P., (1992b) Effect of bacterial
extracellular polymers on the saturated hydraulic
conductivity of sand columns. Applied and Environmental
Microbiology. 58: 1690‒1698.
Vandevivere, P., and Baveye, P., (1992c) Relationship
between transport of bacteria and their clogging
efficiency in sand columns. Soil Science Society of
America Journal. 58: 2523‒2530.
Vecchioli, J., (1972) Experimental injection of tertiary
treated sewage in a deep well at Bay Park, Long Island,
NY. New England Water Works Association. 86:87‒103.
Vyzamal, J., Brix, H., Cooper, P.F., Green, M.B., and Haberl R.
(eds.) (1998) Constructed wetlands for wastewater
treatment in Europe. Bachhuys Publishers, Leiden, The
Netherlands.
Winter, K.J., and Goetz, D., (2003) The impact of sewage
composition on the soil clogging phenomena of vertical
flow constructed wetlands. Water Science and
Technology 48: 9‒14.
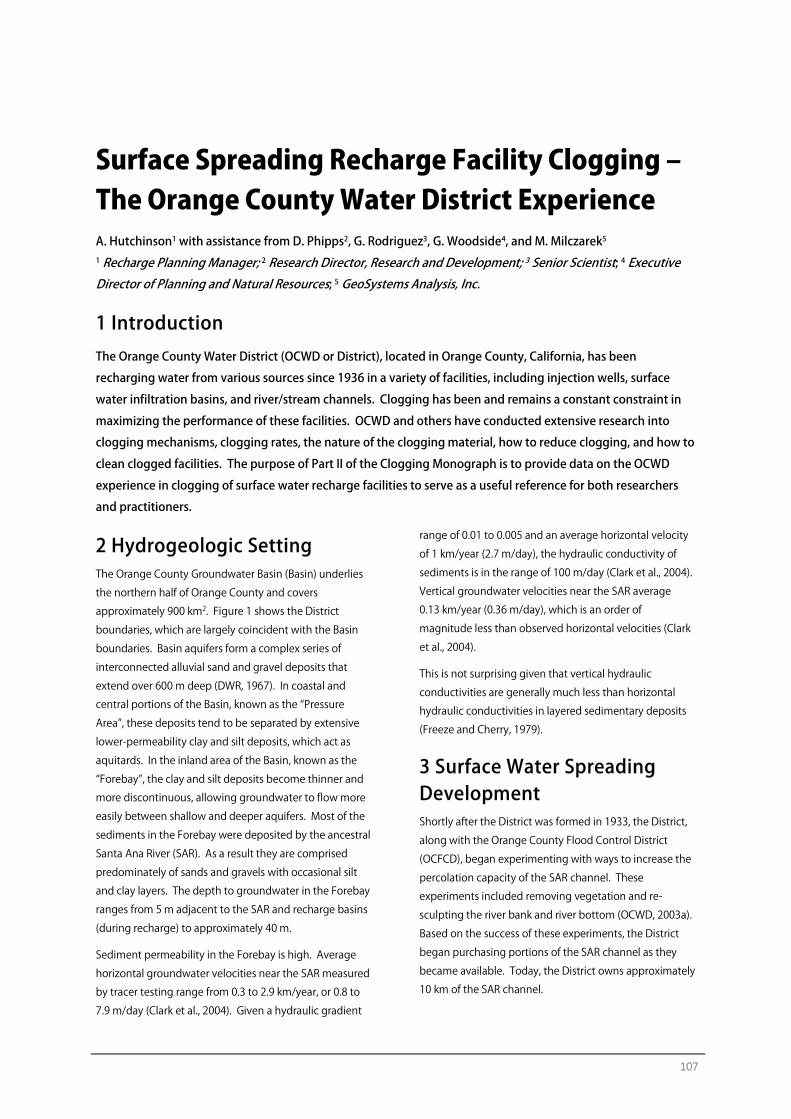
107
Surface Spreading Recharge Facility Clogging ‒ The Orange County Water District Experience A. Hutchinson1 with assistance from D. Phipps2, G. Rodriguez3, G. Woodside4, and M. Milczarek5 1 Recharge Planning Manager; 2 Research Director, Research and Development; 3 Senior Scientist; 4 Executive Director of Planning and Natural Resources; 5 GeoSystems Analysis, Inc.
1 Introduction The Orange County Water District (OCWD or District), located in Orange County, California, has been
recharging water from various sources since 1936 in a variety of facilities, including injection wells, surface
water infiltration basins, and river/stream channels. Clogging has been and remains a constant constraint in
maximizing the performance of these facilities. OCWD and others have conducted extensive research into
clogging mechanisms, clogging rates, the nature of the clogging material, how to reduce clogging, and how to
clean clogged facilities. The purpose of Part II of the Clogging Monograph is to provide data on the OCWD
experience in clogging of surface water recharge facilities to serve as a useful reference for both researchers
and practitioners.
2 Hydrogeologic Setting The Orange County Groundwater Basin (Basin) underlies
the northern half of Orange County and covers
approximately 900 km2. Figure 1 shows the District
boundaries, which are largely coincident with the Basin
boundaries. Basin aquifers form a complex series of
interconnected alluvial sand and gravel deposits that
extend over 600 m deep (DWR, 1967). In coastal and
central portions of the Basin, known as the “Pressure
Area”, these deposits tend to be separated by extensive
lower-permeability clay and silt deposits, which act as
aquitards. In the inland area of the Basin, known as the
“Forebay”, the clay and silt deposits become thinner and
more discontinuous, allowing groundwater to flow more
easily between shallow and deeper aquifers. Most of the
sediments in the Forebay were deposited by the ancestral
Santa Ana River (SAR). As a result they are comprised
predominately of sands and gravels with occasional silt
and clay layers. The depth to groundwater in the Forebay
ranges from 5 m adjacent to the SAR and recharge basins
(during recharge) to approximately 40 m.
Sediment permeability in the Forebay is high. Average
horizontal groundwater velocities near the SAR measured
by tracer testing range from 0.3 to 2.9 km/year, or 0.8 to
7.9 m/day (Clark et al., 2004). Given a hydraulic gradient
range of 0.01 to 0.005 and an average horizontal velocity
of 1 km/year (2.7 m/day), the hydraulic conductivity of
sediments is in the range of 100 m/day (Clark et al., 2004).
Vertical groundwater velocities near the SAR average
0.13 km/year (0.36 m/day), which is an order of
magnitude less than observed horizontal velocities (Clark
et al., 2004).
This is not surprising given that vertical hydraulic
conductivities are generally much less than horizontal
hydraulic conductivities in layered sedimentary deposits
(Freeze and Cherry, 1979).
3 Surface Water Spreading Development Shortly after the District was formed in 1933, the District,
along with the Orange County Flood Control District
(OCFCD), began experimenting with ways to increase the
percolation capacity of the SAR channel. These
experiments included removing vegetation and re-
sculpting the river bank and river bottom (OCWD, 2003a).
Based on the success of these experiments, the District
began purchasing portions of the SAR channel as they
became available. Today, the District owns approximately
10 km of the SAR channel.
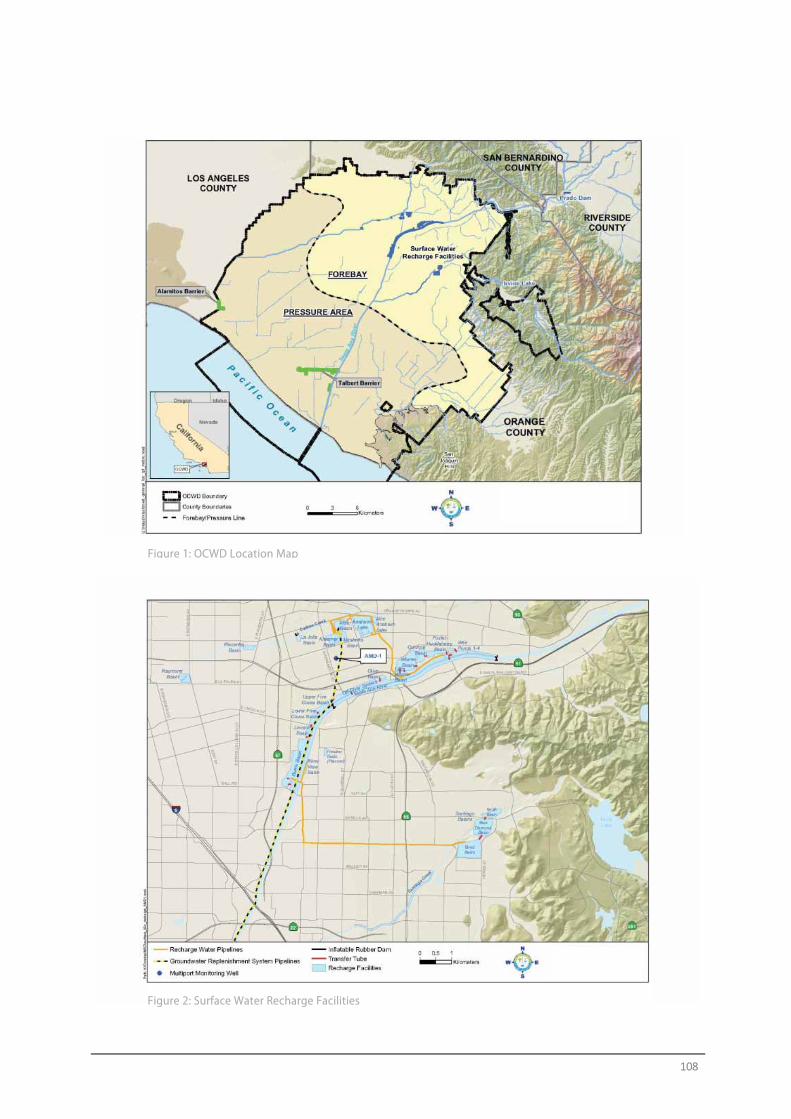
108
Figure 2: Surface Water Recharge Facilities
Figure 1: OCWD Location Map
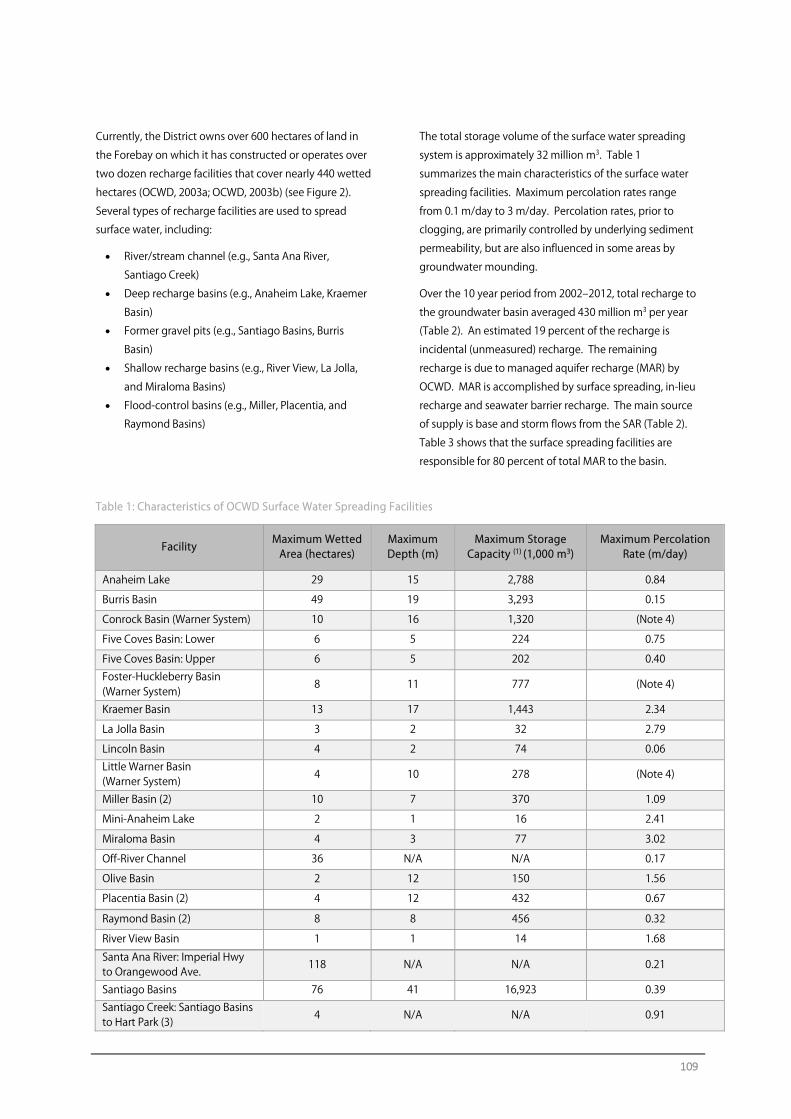
109
Currently, the District owns over 600 hectares of land in
the Forebay on which it has constructed or operates over
two dozen recharge facilities that cover nearly 440 wetted
hectares (OCWD, 2003a; OCWD, 2003b) (see Figure 2).
Several types of recharge facilities are used to spread
surface water, including:
• River/stream channel (e.g., Santa Ana River,
Santiago Creek)
• Deep recharge basins (e.g., Anaheim Lake, Kraemer
Basin)
• Former gravel pits (e.g., Santiago Basins, Burris
Basin)
• Shallow recharge basins (e.g., River View, La Jolla,
and Miraloma Basins)
• Flood-control basins (e.g., Miller, Placentia, and
Raymond Basins)
The total storage volume of the surface water spreading
system is approximately 32 million m3. Table 1
summarizes the main characteristics of the surface water
spreading facilities. Maximum percolation rates range
from 0.1 m/day to 3 m/day. Percolation rates, prior to
clogging, are primarily controlled by underlying sediment
permeability, but are also influenced in some areas by
groundwater mounding.
Over the 10 year period from 2002‒2012, total recharge to
the groundwater basin averaged 430 million m3 per year
(Table 2). An estimated 19 percent of the recharge is
incidental (unmeasured) recharge. The remaining
recharge is due to managed aquifer recharge (MAR) by
OCWD. MAR is accomplished by surface spreading, in-lieu
recharge and seawater barrier recharge. The main source
of supply is base and storm flows from the SAR (Table 2).
Table 3 shows that the surface spreading facilities are
responsible for 80 percent of total MAR to the basin.
Table 1: Characteristics of OCWD Surface Water Spreading Facilities
Facility Maximum Wetted Area (hectares)
Maximum Depth (m)
Maximum Storage Capacity (1) (1,000 m3)
Maximum Percolation Rate (m/day)
Anaheim Lake 29 15 2,788 0.84
Burris Basin 49 19 3,293 0.15
Conrock Basin (Warner System) 10 16 1,320 (Note 4)
Five Coves Basin: Lower 6 5 224 0.75
Five Coves Basin: Upper 6 5 202 0.40 Foster-Huckleberry Basin (Warner System)
8 11 777 (Note 4)
Kraemer Basin 13 17 1,443 2.34
La Jolla Basin 3 2 32 2.79
Lincoln Basin 4 2 74 0.06 Little Warner Basin (Warner System)
4 10 278 (Note 4)
Miller Basin (2) 10 7 370 1.09
Mini-Anaheim Lake 2 1 16 2.41
Miraloma Basin 4 3 77 3.02
Off-River Channel 36 N/A N/A 0.17
Olive Basin 2 12 150 1.56
Placentia Basin (2) 4 12 432 0.67
Raymond Basin (2) 8 8 456 0.32
River View Basin 1 1 14 1.68
Santa Ana River: Imperial Hwy to Orangewood Ave.
118 N/A N/A 0.21
Santiago Basins 76 41 16,923 0.39 Santiago Creek: Santiago Basins to Hart Park (3)
4 N/A N/A 0.91
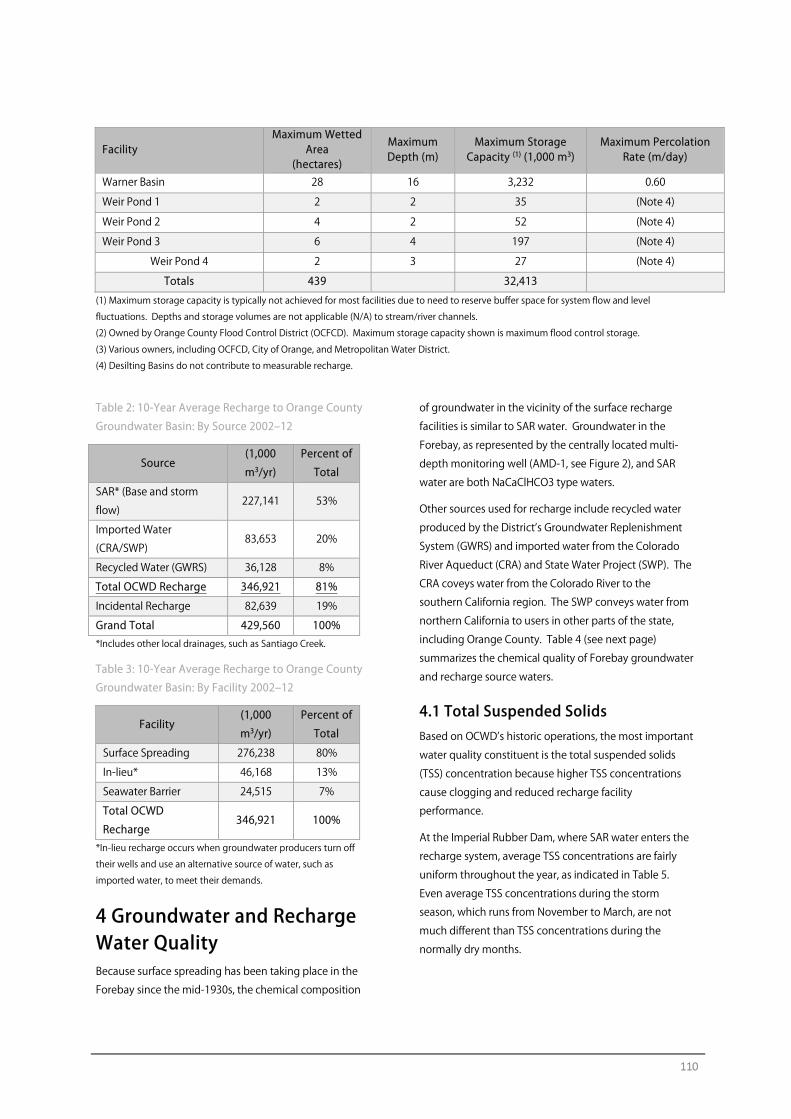
110
Facility Maximum Wetted
Area (hectares)
Maximum Depth (m)
Maximum Storage Capacity (1) (1,000 m3)
Maximum Percolation Rate (m/day)
Warner Basin 28 16 3,232 0.60
Weir Pond 1 2 2 35 (Note 4)
Weir Pond 2 4 2 52 (Note 4)
Weir Pond 3 6 4 197 (Note 4)
Weir Pond 4 2 3 27 (Note 4)
Totals 439 32,413
(1) Maximum storage capacity is typically not achieved for most facilities due to need to reserve buffer space for system flow and level
fluctuations. Depths and storage volumes are not applicable (N/A) to stream/river channels.
(2) Owned by Orange County Flood Control District (OCFCD). Maximum storage capacity shown is maximum flood control storage.
(3) Various owners, including OCFCD, City of Orange, and Metropolitan Water District.
(4) Desilting Basins do not contribute to measurable recharge.
Table 2: 10-Year Average Recharge to Orange County
Groundwater Basin: By Source 2002‒12
Source (1,000
m3/yr)
Percent of
Total
SAR* (Base and storm
flow) 227,141 53%
Imported Water
(CRA/SWP) 83,653 20%
Recycled Water (GWRS) 36,128 8%
Total OCWD Recharge 346,921 81%
Incidental Recharge 82,639 19%
Grand Total 429,560 100% *Includes other local drainages, such as Santiago Creek.
Table 3: 10-Year Average Recharge to Orange County
Groundwater Basin: By Facility 2002‒12
Facility (1,000
m3/yr)
Percent of
Total
Surface Spreading 276,238 80%
In-lieu* 46,168 13%
Seawater Barrier 24,515 7%
Total OCWD
Recharge 346,921 100%
*In-lieu recharge occurs when groundwater producers turn off
their wells and use an alternative source of water, such as
imported water, to meet their demands.
4 Groundwater and Recharge Water Quality Because surface spreading has been taking place in the
Forebay since the mid-1930s, the chemical composition
of groundwater in the vicinity of the surface recharge
facilities is similar to SAR water. Groundwater in the
Forebay, as represented by the centrally located multi-
depth monitoring well (AMD-1, see Figure 2), and SAR
water are both NaCaClHCO3 type waters.
Other sources used for recharge include recycled water
produced by the District’s Groundwater Replenishment
System (GWRS) and imported water from the Colorado
River Aqueduct (CRA) and State Water Project (SWP). The
CRA coveys water from the Colorado River to the
southern California region. The SWP conveys water from
northern California to users in other parts of the state,
including Orange County. Table 4 (see next page)
summarizes the chemical quality of Forebay groundwater
and recharge source waters.
4.1 Total Suspended Solids Based on OCWD’s historic operations, the most important
water quality constituent is the total suspended solids
(TSS) concentration because higher TSS concentrations
cause clogging and reduced recharge facility
performance.
At the Imperial Rubber Dam, where SAR water enters the
recharge system, average TSS concentrations are fairly
uniform throughout the year, as indicated in Table 5.
Even average TSS concentrations during the storm
season, which runs from November to March, are not
much different than TSS concentrations during the
normally dry months.
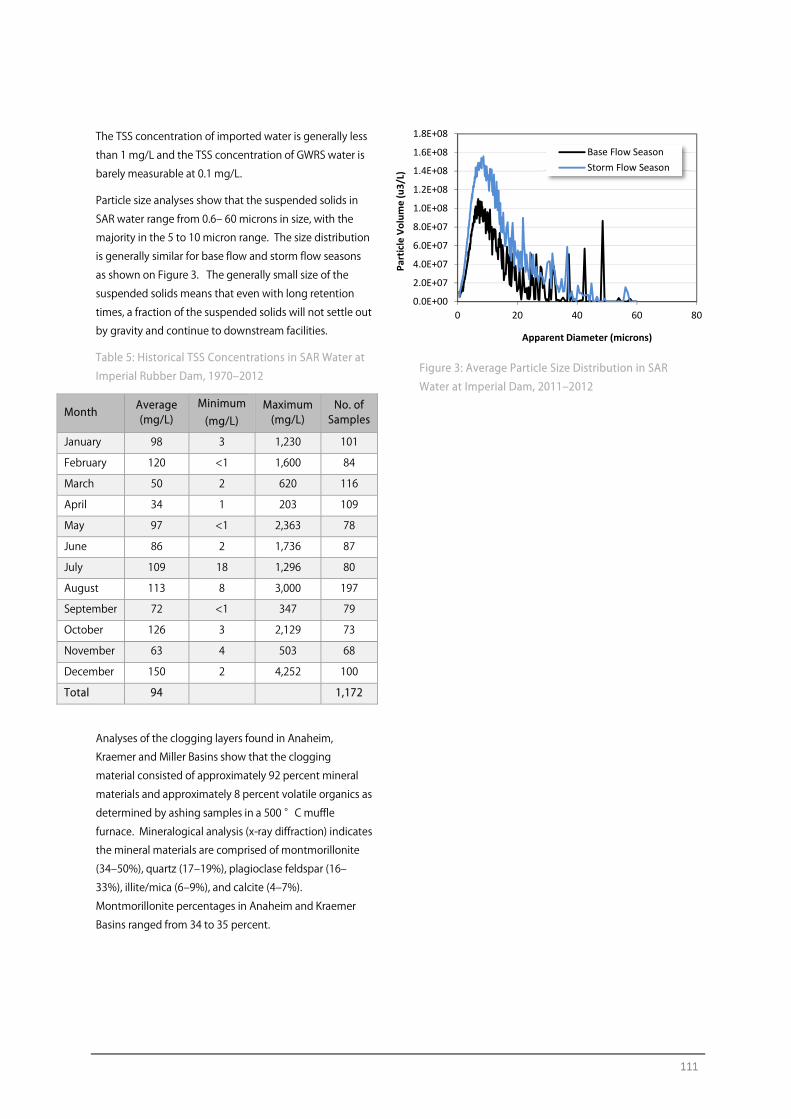
111
The TSS concentration of imported water is generally less
than 1 mg/L and the TSS concentration of GWRS water is
barely measurable at 0.1 mg/L.
Particle size analyses show that the suspended solids in
SAR water range from 0.6‒ 60 microns in size, with the
majority in the 5 to 10 micron range. The size distribution
is generally similar for base flow and storm flow seasons
as shown on Figure 3. The generally small size of the
suspended solids means that even with long retention
times, a fraction of the suspended solids will not settle out
by gravity and continue to downstream facilities.
Table 5: Historical TSS Concentrations in SAR Water at
Imperial Rubber Dam, 1970‒2012
Month Average (mg/L)
Minimum (mg/L)
Maximum (mg/L)
No. of Samples
January 98 3 1,230 101
February 120 <1 1,600 84
March 50 2 620 116
April 34 1 203 109
May 97 <1 2,363 78
June 86 2 1,736 87
July 109 18 1,296 80
August 113 8 3,000 197
September 72 <1 347 79
October 126 3 2,129 73
November 63 4 503 68
December 150 2 4,252 100
Total 94 1,172
Analyses of the clogging layers found in Anaheim,
Kraemer and Miller Basins show that the clogging
material consisted of approximately 92 percent mineral
materials and approximately 8 percent volatile organics as
determined by ashing samples in a 500 °C muffle
furnace. Mineralogical analysis (x-ray diffraction) indicates
the mineral materials are comprised of montmorillonite
(34‒50%), quartz (17‒19%), plagioclase feldspar (16‒
33%), illite/mica (6‒9%), and calcite (4‒7%).
Montmorillonite percentages in Anaheim and Kraemer
Basins ranged from 34 to 35 percent.
Figure 3: Average Particle Size Distribution in SAR
Water at Imperial Dam, 2011‒2012
0.0E+00
2.0E+07
4.0E+07
6.0E+07
8.0E+07
1.0E+08
1.2E+08
1.4E+08
1.6E+08
1.8E+08
0 20 40 60 80
Part
icle
Vol
ume
(u3/
L)
Apparent Diameter (microns)
Base Flow SeasonStorm Flow Season
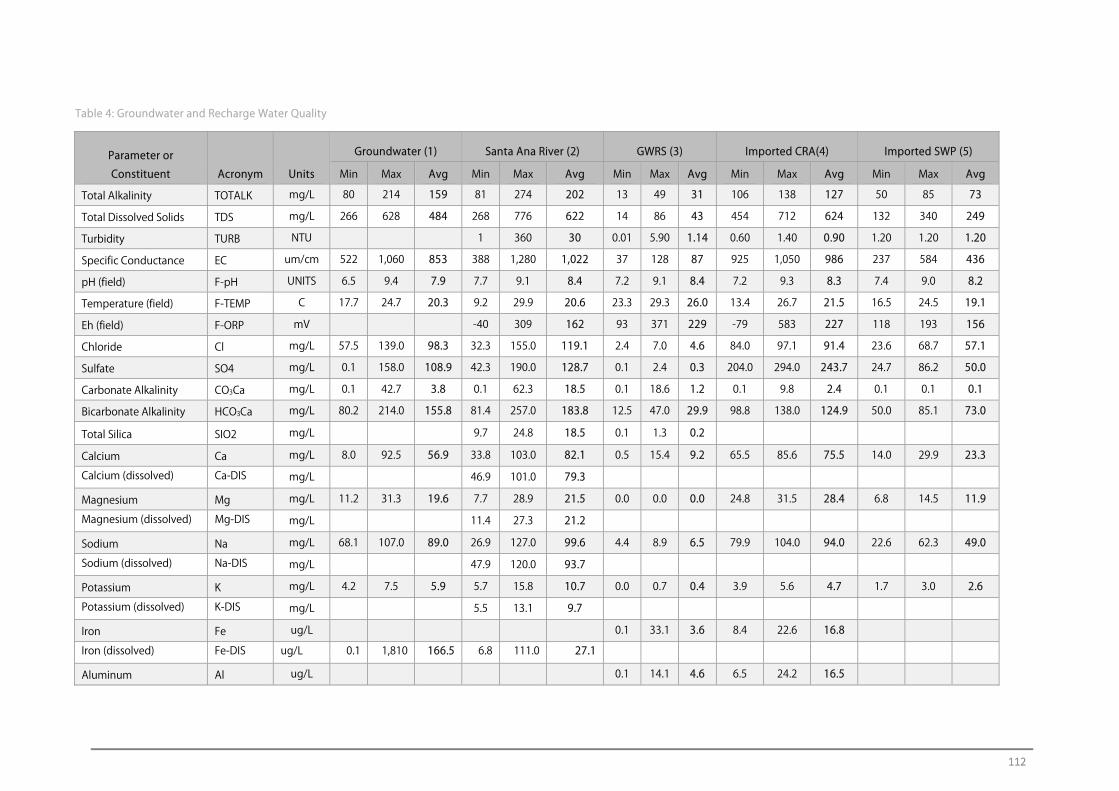
112
Table 4: Groundwater and Recharge Water Quality
Parameter or
Constituent Acronym Units
Groundwater (1) Santa Ana River (2) GWRS (3) Imported CRA(4) Imported SWP (5)
Min Max Avg Min Max Avg Min Max Avg Min Max Avg Min Max Avg
Total Alkalinity TOTALK mg/L 80 214 159 81 274 202 13 49 31 106 138 127 50 85 73
Total Dissolved Solids TDS mg/L 266 628 484 268 776 622 14 86 43 454 712 624 132 340 249
Turbidity TURB NTU 1 360 30 0.01 5.90 1.14 0.60 1.40 0.90 1.20 1.20 1.20
Specific Conductance EC um/cm 522 1,060 853 388 1,280 1,022 37 128 87 925 1,050 986 237 584 436
pH (field) F-pH UNITS 6.5 9.4 7.9 7.7 9.1 8.4 7.2 9.1 8.4 7.2 9.3 8.3 7.4 9.0 8.2
Temperature (field) F-TEMP C 17.7 24.7 20.3 9.2 29.9 20.6 23.3 29.3 26.0 13.4 26.7 21.5 16.5 24.5 19.1
Eh (field) F-ORP mV -40 309 162 93 371 229 -79 583 227 118 193 156
Chloride Cl mg/L 57.5 139.0 98.3 32.3 155.0 119.1 2.4 7.0 4.6 84.0 97.1 91.4 23.6 68.7 57.1
Sulfate SO4 mg/L 0.1 158.0 108.9 42.3 190.0 128.7 0.1 2.4 0.3 204.0 294.0 243.7 24.7 86.2 50.0
Carbonate Alkalinity CO3Ca mg/L 0.1 42.7 3.8 0.1 62.3 18.5 0.1 18.6 1.2 0.1 9.8 2.4 0.1 0.1 0.1
Bicarbonate Alkalinity HCO3Ca mg/L 80.2 214.0 155.8 81.4 257.0 183.8 12.5 47.0 29.9 98.8 138.0 124.9 50.0 85.1 73.0
Total Silica SIO2 mg/L 9.7 24.8 18.5 0.1 1.3 0.2
Calcium Ca mg/L 8.0 92.5 56.9 33.8 103.0 82.1 0.5 15.4 9.2 65.5 85.6 75.5 14.0 29.9 23.3
Calcium (dissolved) Ca-DIS mg/L 46.9 101.0 79.3
Magnesium Mg mg/L 11.2 31.3 19.6 7.7 28.9 21.5 0.0 0.0 0.0 24.8 31.5 28.4 6.8 14.5 11.9
Magnesium (dissolved) Mg-DIS mg/L 11.4 27.3 21.2
Sodium Na mg/L 68.1 107.0 89.0 26.9 127.0 99.6 4.4 8.9 6.5 79.9 104.0 94.0 22.6 62.3 49.0
Sodium (dissolved) Na-DIS mg/L 47.9 120.0 93.7
Potassium K mg/L 4.2 7.5 5.9 5.7 15.8 10.7 0.0 0.7 0.4 3.9 5.6 4.7 1.7 3.0 2.6
Potassium (dissolved) K-DIS mg/L 5.5 13.1 9.7
Iron Fe ug/L 0.1 33.1 3.6 8.4 22.6 16.8
Iron (dissolved) Fe-DIS ug/L 0.1 1,810 166.5 6.8 111.0 27.1
Aluminum Al ug/L 0.1 14.1 4.6 6.5 24.2 16.5
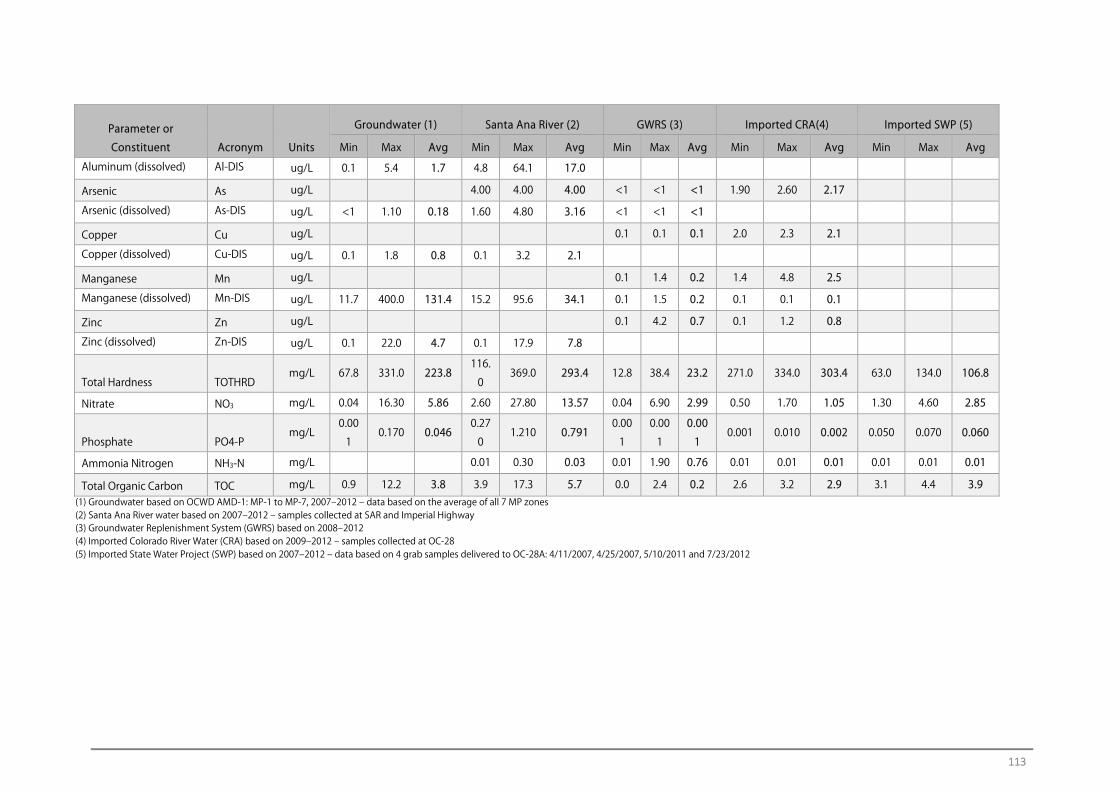
113
Parameter or
Constituent Acronym Units
Groundwater (1) Santa Ana River (2) GWRS (3) Imported CRA(4) Imported SWP (5)
Min Max Avg Min Max Avg Min Max Avg Min Max Avg Min Max Avg
Aluminum (dissolved) Al-DIS ug/L 0.1 5.4 1.7 4.8 64.1 17.0
Arsenic As ug/L 4.00 4.00 4.00 <1 <1 <1 1.90 2.60 2.17
Arsenic (dissolved) As-DIS ug/L <1 1.10 0.18 1.60 4.80 3.16 <1 <1 <1
Copper Cu ug/L 0.1 0.1 0.1 2.0 2.3 2.1
Copper (dissolved) Cu-DIS ug/L 0.1 1.8 0.8 0.1 3.2 2.1
Manganese Mn ug/L 0.1 1.4 0.2 1.4 4.8 2.5
Manganese (dissolved) Mn-DIS ug/L 11.7 400.0 131.4 15.2 95.6 34.1 0.1 1.5 0.2 0.1 0.1 0.1
Zinc Zn ug/L 0.1 4.2 0.7 0.1 1.2 0.8
Zinc (dissolved) Zn-DIS ug/L 0.1 22.0 4.7 0.1 17.9 7.8
Total Hardness TOTHRD mg/L 67.8 331.0 223.8
116.
0 369.0 293.4 12.8 38.4 23.2 271.0 334.0 303.4 63.0 134.0 106.8
Nitrate NO3 mg/L 0.04 16.30 5.86 2.60 27.80 13.57 0.04 6.90 2.99 0.50 1.70 1.05 1.30 4.60 2.85
Phosphate PO4-P mg/L
0.00
1 0.170 0.046
0.27
0 1.210 0.791
0.00
1
0.00
1
0.00
1 0.001 0.010 0.002 0.050 0.070 0.060
Ammonia Nitrogen NH3-N mg/L 0.01 0.30 0.03 0.01 1.90 0.76 0.01 0.01 0.01 0.01 0.01 0.01
Total Organic Carbon TOC mg/L 0.9 12.2 3.8 3.9 17.3 5.7 0.0 2.4 0.2 2.6 3.2 2.9 3.1 4.4 3.9 (1) Groundwater based on OCWD AMD-1: MP-1 to MP-7, 2007‒2012 ‒ data based on the average of all 7 MP zones (2) Santa Ana River water based on 2007‒2012 ‒ samples collected at SAR and Imperial Highway (3) Groundwater Replenishment System (GWRS) based on 2008‒2012(4) Imported Colorado River Water (CRA) based on 2009‒2012 ‒ samples collected at OC-28 (5) Imported State Water Project (SWP) based on 2007‒2012 ‒ data based on 4 grab samples delivered to OC-28A: 4/11/2007, 4/25/2007, 5/10/2011 and 7/23/2012
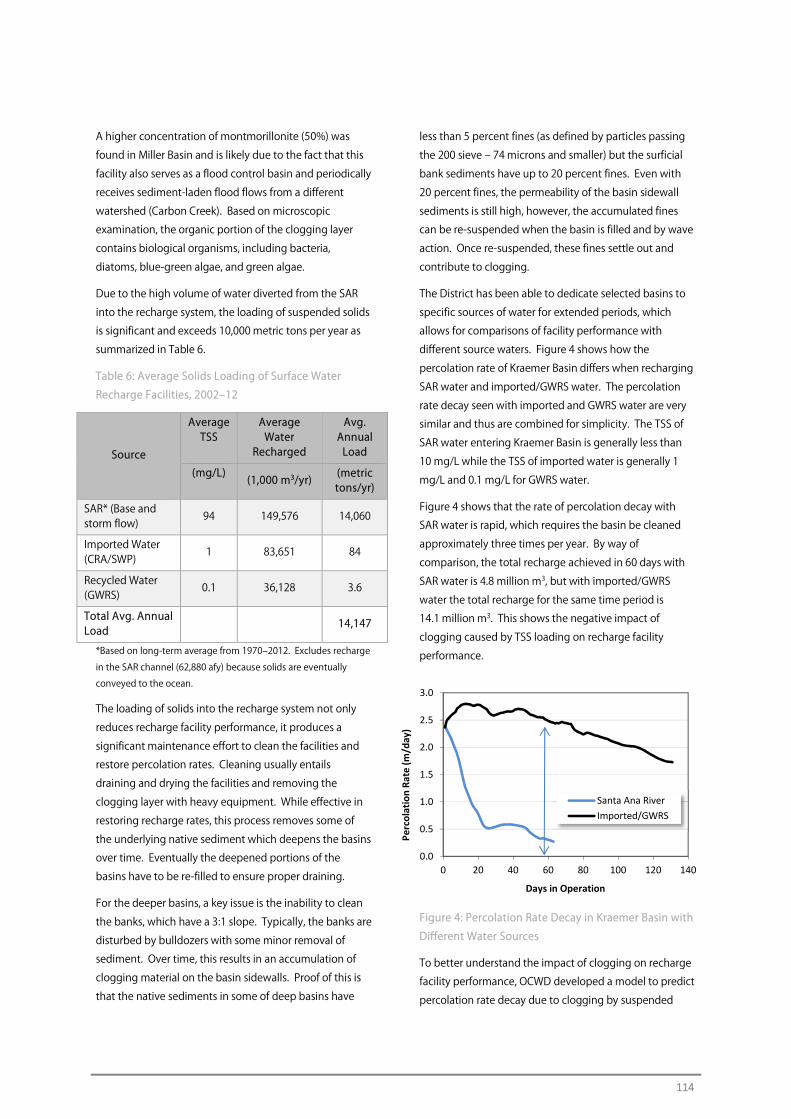
114
0.0
0.5
1.0
1.5
2.0
2.5
3.0
0 20 40 60 80 100 120 140
Perc
olat
ion
Rate
(m/d
ay)
Days in Operation
Santa Ana RiverImported/GWRS
A higher concentration of montmorillonite (50%) was
found in Miller Basin and is likely due to the fact that this
facility also serves as a flood control basin and periodically
receives sediment-laden flood flows from a different
watershed (Carbon Creek). Based on microscopic
examination, the organic portion of the clogging layer
contains biological organisms, including bacteria,
diatoms, blue-green algae, and green algae.
Due to the high volume of water diverted from the SAR
into the recharge system, the loading of suspended solids
is significant and exceeds 10,000 metric tons per year as
summarized in Table 6.
Table 6: Average Solids Loading of Surface Water
Recharge Facilities, 2002‒12
Source
Average TSS
Average Water
Recharged
Avg. Annual Load
(mg/L) (1,000 m3/yr) (metric
tons/yr)
SAR* (Base and storm flow)
94 149,576 14,060
Imported Water (CRA/SWP)
1 83,651 84
Recycled Water (GWRS)
0.1 36,128 3.6
Total Avg. Annual Load
14,147
*Based on long-term average from 1970‒2012. Excludes recharge
in the SAR channel (62,880 afy) because solids are eventually
conveyed to the ocean.
The loading of solids into the recharge system not only
reduces recharge facility performance, it produces a
significant maintenance effort to clean the facilities and
restore percolation rates. Cleaning usually entails
draining and drying the facilities and removing the
clogging layer with heavy equipment. While effective in
restoring recharge rates, this process removes some of
the underlying native sediment which deepens the basins
over time. Eventually the deepened portions of the
basins have to be re-filled to ensure proper draining.
For the deeper basins, a key issue is the inability to clean
the banks, which have a 3:1 slope. Typically, the banks are
disturbed by bulldozers with some minor removal of
sediment. Over time, this results in an accumulation of
clogging material on the basin sidewalls. Proof of this is
that the native sediments in some of deep basins have
less than 5 percent fines (as defined by particles passing
the 200 sieve ‒ 74 microns and smaller) but the surficial
bank sediments have up to 20 percent fines. Even with
20 percent fines, the permeability of the basin sidewall
sediments is still high, however, the accumulated fines
can be re-suspended when the basin is filled and by wave
action. Once re-suspended, these fines settle out and
contribute to clogging.
The District has been able to dedicate selected basins to
specific sources of water for extended periods, which
allows for comparisons of facility performance with
different source waters. Figure 4 shows how the
percolation rate of Kraemer Basin differs when recharging
SAR water and imported/GWRS water. The percolation
rate decay seen with imported and GWRS water are very
similar and thus are combined for simplicity. The TSS of
SAR water entering Kraemer Basin is generally less than
10 mg/L while the TSS of imported water is generally 1
mg/L and 0.1 mg/L for GWRS water.
Figure 4 shows that the rate of percolation decay with
SAR water is rapid, which requires the basin be cleaned
approximately three times per year. By way of
comparison, the total recharge achieved in 60 days with
SAR water is 4.8 million m3, but with imported/GWRS
water the total recharge for the same time period is
14.1 million m3. This shows the negative impact of
clogging caused by TSS loading on recharge facility
performance.
Figure 4: Percolation Rate Decay in Kraemer Basin with
Different Water Sources
To better understand the impact of clogging on recharge
facility performance, OCWD developed a model to predict
percolation rate decay due to clogging by suspended
115
solids loading (Phipps et al., 2007). The model is able to
replicate percolation decay trends seen in facilities using
source waters that have different TSS concentrations (e.g.,
SAR, imported water). This model allows OCWD to
evaluate the economic viability of projects to reduce TSS
concentrations in SAR water using different pre-treatment
methods. The model is based on the following simple
log-decay expression:
Q= Qoe-rL,
Where Qo= the initial percolation rate, L = the total
foulant deposited at the sediment/water interface and
Q = percolation observed at L solids loading. The value of
r represents a sediment/foulant interaction coefficient
and it is presumed to be unique to the nature of the
sediment and foulants. The model could be applied to
other areas where the accumulation of TSS is the
dominant form of clogging; however, site specific testing
would have to be done to establish the appropriate
sediment/foulant interaction coefficient (r).
5 Clogging Mitigation Strategies Mitigation strategies to address clogging of surface water
recharge facilities fall into several categories:
1. Design strategies
2. Proactive removal strategies
3. Reactive removal strategies
5.1 Design Strategies It is important to consider ways to minimize the impact of
clogging when designing a surface spreading facility,
particularly if fine-grained sediments are present (Bouwer,
2002). Key things to consider include:
1. Inflow designed to minimize erosion as basin fills
2. Basin banks protected from erosion/wave action
3. Shallow ponding depths to reduce pressure on the
clogging layer
4. Ability to rapidly drain and dry the basin once
clogged
5. Ability to operate multiple basins independently to
provide maintenance flexibility
Originally, OCWD constructed recharge basins ranging in
depth from 15 to 17 meters. The deep basins provided
both storage and percolation capacity. In recent years,
OCWD has constructed all of its basins to be less than
2 meters deep because storage is not as important as
percolation capacity. The shallow basins can be quickly
drained, dried and cleaned and thus have a greater on-
line efficiency compared to the deep basins.
Many of the above design considerations are not
applicable when spreading water in river or creek
channels because the constantly moving water and
periodic storm events tends to reduce the impact of
clogging on the channel bottom. In wide channels, it may
be necessary to construct small dikes to force the water to
spread and cover the entire channel bottom, which
maximizes the percolation potential of the channel. The
OCWD constructs “T” and “L” dikes in the SAR in the
winter months because they can be constructed quickly
and do not require the river channel to be level. The “T”
and “L” name refers to the shapes of the dikes when
looking at them from above. The disadvantage to “T” and
“L” dikes is that they form localized areas of slow moving
water where clogging takes place. At the end of the
storm season when there is no risk of storm flows washing
out the sand dikes, the “T” and “L” dikes are replaced with
“runners” which are small dikes that parallel the river
channel. When the runners are installed, additional work
is required to level the channel bottom to ensure it is
completely submerged. The runners allow the water to
run continuously downstream and thus do not cause as
much clogging as the “T” and “L” dikes. Typically two
runners are installed so that sections of the river can be
periodically dried up to minimize insect breeding.
5.2 Proactive Removal Strategies Proactive removal strategies to reduce clogging fall into
two categories:
1. Removing suspended solids
2. Removing nutrients
Suspended solids can be removed naturally using
desilting basins or they can be removed artificially. The
District has several desilting basins that are capable of
reducing TSS concentrations by 75 to 80 percent, but
there is a fraction of TSS that will always remain in
suspension and resist gravity settling. Moreover, desilting
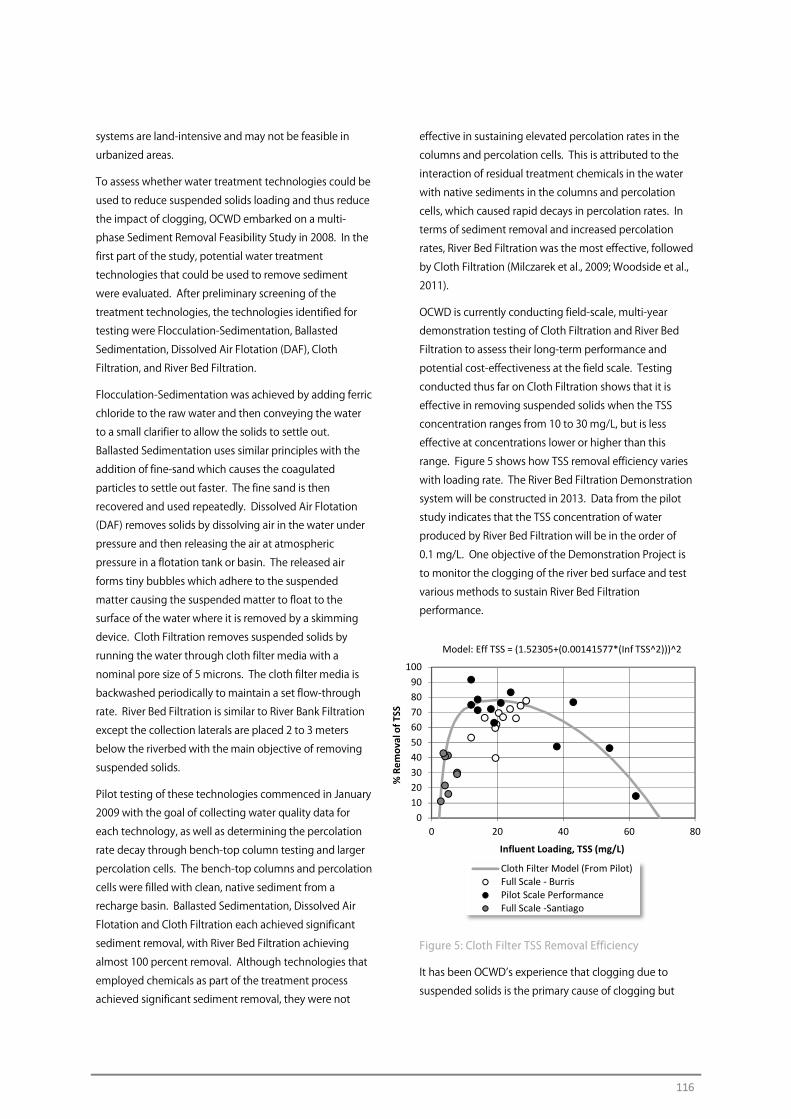
116
0102030405060708090
100
0 20 40 60 80
% R
emov
al o
f TSS
Influent Loading, TSS (mg/L)
Model: Eff TSS = (1.52305+(0.00141577*(Inf TSS^2)))^2
Cloth Filter Model (From Pilot)Full Scale - BurrisPilot Scale PerformanceFull Scale -Santiago
systems are land-intensive and may not be feasible in
urbanized areas.
To assess whether water treatment technologies could be
used to reduce suspended solids loading and thus reduce
the impact of clogging, OCWD embarked on a multi-
phase Sediment Removal Feasibility Study in 2008. In the
first part of the study, potential water treatment
technologies that could be used to remove sediment
were evaluated. After preliminary screening of the
treatment technologies, the technologies identified for
testing were Flocculation-Sedimentation, Ballasted
Sedimentation, Dissolved Air Flotation (DAF), Cloth
Filtration, and River Bed Filtration.
Flocculation-Sedimentation was achieved by adding ferric
chloride to the raw water and then conveying the water
to a small clarifier to allow the solids to settle out.
Ballasted Sedimentation uses similar principles with the
addition of fine-sand which causes the coagulated
particles to settle out faster. The fine sand is then
recovered and used repeatedly. Dissolved Air Flotation
(DAF) removes solids by dissolving air in the water under
pressure and then releasing the air at atmospheric
pressure in a flotation tank or basin. The released air
forms tiny bubbles which adhere to the suspended
matter causing the suspended matter to float to the
surface of the water where it is removed by a skimming
device. Cloth Filtration removes suspended solids by
running the water through cloth filter media with a
nominal pore size of 5 microns. The cloth filter media is
backwashed periodically to maintain a set flow-through
rate. River Bed Filtration is similar to River Bank Filtration
except the collection laterals are placed 2 to 3 meters
below the riverbed with the main objective of removing
suspended solids.
Pilot testing of these technologies commenced in January
2009 with the goal of collecting water quality data for
each technology, as well as determining the percolation
rate decay through bench-top column testing and larger
percolation cells. The bench-top columns and percolation
cells were filled with clean, native sediment from a
recharge basin. Ballasted Sedimentation, Dissolved Air
Flotation and Cloth Filtration each achieved significant
sediment removal, with River Bed Filtration achieving
almost 100 percent removal. Although technologies that
employed chemicals as part of the treatment process
achieved significant sediment removal, they were not
effective in sustaining elevated percolation rates in the
columns and percolation cells. This is attributed to the
interaction of residual treatment chemicals in the water
with native sediments in the columns and percolation
cells, which caused rapid decays in percolation rates. In
terms of sediment removal and increased percolation
rates, River Bed Filtration was the most effective, followed
by Cloth Filtration (Milczarek et al., 2009; Woodside et al.,
2011).
OCWD is currently conducting field-scale, multi-year
demonstration testing of Cloth Filtration and River Bed
Filtration to assess their long-term performance and
potential cost-effectiveness at the field scale. Testing
conducted thus far on Cloth Filtration shows that it is
effective in removing suspended solids when the TSS
concentration ranges from 10 to 30 mg/L, but is less
effective at concentrations lower or higher than this
range. Figure 5 shows how TSS removal efficiency varies
with loading rate. The River Bed Filtration Demonstration
system will be constructed in 2013. Data from the pilot
study indicates that the TSS concentration of water
produced by River Bed Filtration will be in the order of
0.1 mg/L. One objective of the Demonstration Project is
to monitor the clogging of the river bed surface and test
various methods to sustain River Bed Filtration
performance.
Figure 5: Cloth Filter TSS Removal Efficiency
It has been OCWD’s experience that clogging due to
suspended solids is the primary cause of clogging but

117
biological oxygen demand and nitrates and phosphates
in recharge water may also serve to facilitate the growth
of algae and microrganisms within the recharge facilities,
potentially causing clogging. To minimize the potential
impact of biological clogging and to improve the quality
of the recharge water, the District constructed a 188
hectare wetlands treatment system that is comprised of
50 shallow ponds. The wetland system removes
approximately 18 metric tons of nitrate a month from SAR
water, and during the summer months reduces nitrate
concentrations from 10 mg/L to less than 1 mg/L. This
system has successfully improved the overall quality of
water being recharged to the basin, however, it is unclear
if the wetlands treatment process has reduced biological
clogging and positively impacted recharge facility
performance.
5.3 Reactive Removal Strategies Reactive removal strategies, which refers to removing the
clogging layer after it has formed, falls into two
categories:
1. On-line removal
2. Off-line removal
On-line removal refers to removing the clogging layer
after it has formed and while the recharge facility remains
in service. The advantage to this approach is that the
facility remains on-line during cleaning. The District
tested this approach using a Basin Cleaning Vehicle (BCV)
(OCWD, 2010). Several generations of BCVs were
manufactured, including a fully submersible device as
well as a floating device. The concept behind the BCV is
to vacuum up the clogging layer and leave the underlying
clean sand behind. The fourth generation BCV (BCV-4),
which was a floating version, was placed in four recharge
facilities and tested over an 8 year period. Test results
showed that the BCV was able to sustain elevated
recharge rates in a basin that received relatively clean
water with TSS concentrations less than 10 mg/L. The
BCVs placed in the other three facilities were not as
successful due to a number of factors, including high TSS
loading rates, poor contact of the BCV with the basin
bottom, and slow BCV coverage rate. Although the
concept of in-situ removal was found to be a valid
approach, the BCVs as designed were not found to be
cost-effective. Pending the outcome of the proactive
treatment method tests (Cloth/River Bed Filtration), this
approach may be revisited in the future.
Off-line removal refers to taking a recharge facility off-line
and removing the clogging layer with no water present.
This is the most common method of basin cleaning.
Depending on the facility it may take from 2 to 45 days to
drain, and then another 5 to 25 days to allow drying.
Basins are then either refilled after the clogging layer has
dried and cracked, or equipment is used to scarify or
remove the clogging layer before it is placed back into
service. This method is very effective in restoring
percolation rates; however, it can be expensive and
reduces the overall recharge capacity of the facility.
OCWD has refrained from ripping or scarifying the basin
bottoms because this approach can create a deep layer of
native sediment mixed with clogging material. One
recharge facility in southern California used to provide
tertiary treatment of wastewater routinely scarifies the
basin bottoms. As performance declines, the near-surface
sediments must be overexcavated and then washed in an
on-site sand washing operation before being placed back
into the basin. Without this process, the recharge
capacity of the facility would degrade to unacceptable
levels. (Personal Communication, San Bernardino
Operations Staff, http://www.ci.san-
bernardino.ca.us/sbmwd_divisions/water_reclamation/d
efault.asp.).
Currently, OCWD uses a motor-grader to push the
clogging layer into long windrows so it can be picked up
by a paddle-wheel scraper. This process is analogous to
sweeping the dirt on a floor to a corner and then using a
broom to sweep the dirt into a dustpan. This process
minimizes, but does not prevent, the removal of the
underlying clean sediment. As a result, OCWD has to
import clean sand to fill in low spots every two to five
cleaning cycles.
Generally, a recharge facility is taken off-line for cleaning
when the percolation rate has declined to approximately
30 percent of the initial rate. Sometimes system
constraints prevent this from happening and the facility is
taken off-line later. Depending on the cost and time it
takes to clean a facility, it is possible to clean a facility too
frequently. Figure 6 shows, for Anaheim Lake, that the
maximum net water value is obtained when the basin is
cleaned no more than three times per year. While
additional cleanings would increase the overall amount of
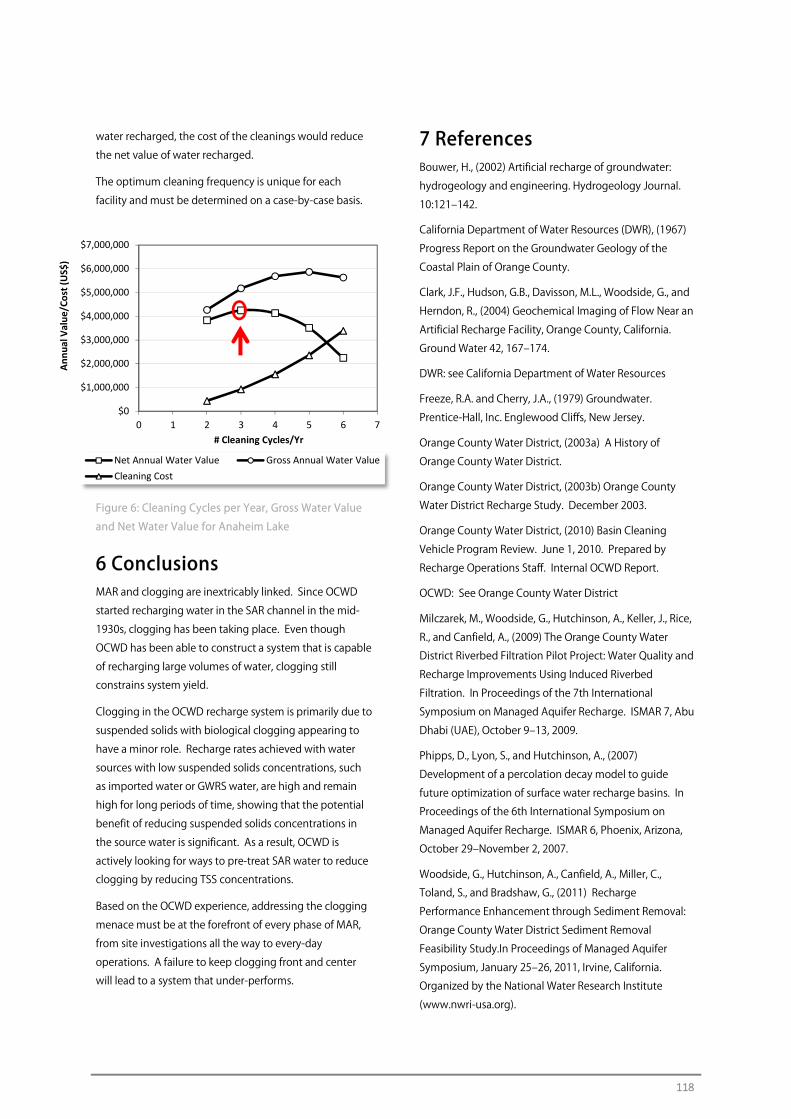
118
water recharged, the cost of the cleanings would reduce
the net value of water recharged.
The optimum cleaning frequency is unique for each
facility and must be determined on a case-by-case basis.
Figure 6: Cleaning Cycles per Year, Gross Water Value
and Net Water Value for Anaheim Lake
6 Conclusions MAR and clogging are inextricably linked. Since OCWD
started recharging water in the SAR channel in the mid-
1930s, clogging has been taking place. Even though
OCWD has been able to construct a system that is capable
of recharging large volumes of water, clogging still
constrains system yield.
Clogging in the OCWD recharge system is primarily due to
suspended solids with biological clogging appearing to
have a minor role. Recharge rates achieved with water
sources with low suspended solids concentrations, such
as imported water or GWRS water, are high and remain
high for long periods of time, showing that the potential
benefit of reducing suspended solids concentrations in
the source water is significant. As a result, OCWD is
actively looking for ways to pre-treat SAR water to reduce
clogging by reducing TSS concentrations.
Based on the OCWD experience, addressing the clogging
menace must be at the forefront of every phase of MAR,
from site investigations all the way to every-day
operations. A failure to keep clogging front and center
will lead to a system that under-performs.
7 References Bouwer, H., (2002) Artificial recharge of groundwater:
hydrogeology and engineering. Hydrogeology Journal.
10:121‒142.
California Department of Water Resources (DWR), (1967)
Progress Report on the Groundwater Geology of the
Coastal Plain of Orange County.
Clark, J.F., Hudson, G.B., Davisson, M.L., Woodside, G., and
Herndon, R., (2004) Geochemical Imaging of Flow Near an
Artificial Recharge Facility, Orange County, California.
Ground Water 42, 167‒174.
DWR: see California Department of Water Resources
Freeze, R.A. and Cherry, J.A., (1979) Groundwater.
Prentice-Hall, Inc. Englewood Cliffs, New Jersey.
Orange County Water District, (2003a) A History of
Orange County Water District.
Orange County Water District, (2003b) Orange County
Water District Recharge Study. December 2003.
Orange County Water District, (2010) Basin Cleaning
Vehicle Program Review. June 1, 2010. Prepared by
Recharge Operations Staff. Internal OCWD Report.
OCWD: See Orange County Water District
Milczarek, M., Woodside, G., Hutchinson, A., Keller, J., Rice,
R., and Canfield, A., (2009) The Orange County Water
District Riverbed Filtration Pilot Project: Water Quality and
Recharge Improvements Using Induced Riverbed
Filtration. In Proceedings of the 7th International
Symposium on Managed Aquifer Recharge. ISMAR 7, Abu
Dhabi (UAE), October 9‒13, 2009.
Phipps, D., Lyon, S., and Hutchinson, A., (2007)
Development of a percolation decay model to guide
future optimization of surface water recharge basins. In
Proceedings of the 6th International Symposium on
Managed Aquifer Recharge. ISMAR 6, Phoenix, Arizona,
October 29‒November 2, 2007.
Woodside, G., Hutchinson, A., Canfield, A., Miller, C.,
Toland, S., and Bradshaw, G., (2011) Recharge
Performance Enhancement through Sediment Removal:
Orange County Water District Sediment Removal
Feasibility Study.In Proceedings of Managed Aquifer
Symposium, January 25‒26, 2011, Irvine, California.
Organized by the National Water Research Institute
(www.nwri-usa.org).
$0
$1,000,000
$2,000,000
$3,000,000
$4,000,000
$5,000,000
$6,000,000
$7,000,000
0 1 2 3 4 5 6 7
Annu
al V
alue
/Cos
t (U
S$)
# Cleaning Cycles/Yr
Net Annual Water Value Gross Annual Water ValueCleaning Cost

119
Practical Criteria in the Design and Maintenance of MAR Facilities in Order to Minimise Clogging Impacts Obtained from Two Different Operative Sites in Spain FERNÁNDEZ ESCALANTE, A. Enrique. TRAGSA I+D+i
Edited by R. Martin
1 Abstract According to the experiments carried out under a research and development framework to address the
objectives of the DINA-MAR Project (Depth Investigation of New Areas for Managed Aquifer Recharge) which focuses on the management of aquifer recharge in the context of sustainable development, we have
conducted investigations of clogging in managed aquifer recharge facilities, specifically focusing on detection
and distribution of physical (including air), chemical and biological clogging processes. Synergistic
combinations have been studied by means of core sampling, analysis, and field photographs at different
scales, from aerial to microscopic, and the use of serial radiometric images.
These studies have been carried out at three experimental sites where other investigations are being carried
out including chemical analysis, interaction models, sequential gauging tests, infiltration tests, etc.
Results from three distributed pilot sites have been used to design and implement a practical specific
methodology for cleaning and maintenance of infiltration ponds, canals and wells; as well as design
recommendations prior to construction work designed to be extrapolated to other analogous scenarios.
This chapter summarises most of the practical rules reached during the project’s development.
2 Introduction The DINA-MAR project has been financed by the Tragsa
Group and the Spanish Government. Following ten years
of trials and analyses to improve the design of Managed
Aquifer Recharge (MAR) facilities, operative techniques
have been developed in order to avoid or minimise the
clogging processes affecting these schemes.
These operational rules have resulted from three test
sites; two are from the Arenales aquifer (Santiuste Basin,
Carracillo region) and the third study is in the Guadiana
Channel, in the Guadiana Basin (Central Spain). All
schemes divert water from rivers in the wet period to
recharge the aquifers primarily through a combination of
infiltration and recharge bores. The stored water is
recovered in the summer mainly for irrigation and
environmental purposes.
Studies have focussed on permanent design
improvements and implementation of Soil and Aquifer
Treatment Techniques (SATs) applied to source water (in
both quantity and quality), to the receiving medium and
to a combination of both. The practical measures to be
taken into account have been classified according to
which part of the annual MAR cycle that they occur
within: winter recharge, summer recovery, and non-
operational periods.
This paper presents the study areas, the main clogging
types detected and the actions designed to remediate
clogging in all its various forms. This paper is a summary
of several years of research, and due to space limitations,

120
interested readers are advised to consult the specific
references for more detailed descriptions.
3 Objectives The main objective of the studies undertaken was to
propose various “problem-solution” binomials in order to
improve the effectiveness of the studied MAR facilities
(based on SATs, engineering criteria, risk assessment and
environmental impact). In this way the generation of a
continuous ‘detect ‒ improve’ loop was intended: detect
new deficiencies ‒ develop new improvements; thus the
understanding of the clogging processes and remediation
actions was improved.
The techniques commonly employed at the research sites
were:
• Identification of the dominant clogging mechanism
affecting the MAR facility through characterisation
of physical, chemical and biological factors.
Technologies including underwater video-camera
and thermographic imaging were used to this end.
• Design improvements applied to the site-specific
MAR recharge infrastructure (ASR wells, channels
and infiltration ponds).
• Source water pre-treatment.
• Observation of the influence of the active MAR
operational period; wet/dry periods and the
activities performed during each.
• Determination of optimal site-specific MAR flow
rates for channels, wells and infiltration ponds.
• Practical interventions ad hoc in order to reduce the
clogging genesis and to increase the effectiveness
of the facilities.
• Reduction of air entrainment into the aquifer during
MAR operations.
• Cleaning and maintenance operations.
The investigation of these common techniques and their
efficacy is ongoing.
The investigated activities were grouped according to
which part of the annual MAR cycle that they occur
within: winter recharge, summer recovery and non-
operational periods.
4 Methods Data collection has focussed on permeability and
infiltration rate determined in situ. These data have been
generated using a range of methodologies including
double-ring infiltrometers, Lugeon tests, Lambe tests, and
laboratory tri-axial permeameter testing. Sequential flow
gauges were also monitored along channels. Site-specific
clogging remediation activities were driven by changes in
these collected data over the observation periods at the
various sites (10 years for Arenales aquifer schemes and
four years at the Guadiana canal scheme).
The variation in storage within each studied aquifer was
established using the Water Table Fluctuation (WTF)
method (Schict and Walton, 1961, in Healy and Cook,
2002), with input data from control networks comprised
of more than 50 observation points at each MAR site. This
input data was treated with algebraic mapping functions
within a Geographic Information Systems (GIS)
environment.
Assessment of the proportion of aquifer recharge volume
attributed to managed recharge and that attributed to
rainfall seepage was achieved by means of the
Hydrological Evaluation Landfill Performance (HELP)
model (Gogolev and Ostrander, 2000) and by water
balances conducted in isolated zones.
Additionally, thermographic camera imagery has been
implemented since 2010 for the detection and
characterisation of clogging processes. The Therma-Cam
E2, developed by Flir systems, has been employed in
order to study the distribution of clogging through
temperature differences between clogged and non-
clogged zones. These zones show different thermal
profiles when visualised; background information is
presented in Fernández and Prieto (2013).
Gas clogging was investigated using various indirect
methods, allowing estimations rather than direct
determinations. Air held in ground pores was estimated
through dissolved oxygen changes between MAR water
and groundwater in sealed observation wells; with
seepage capacity evolution monitored throughout a full
MAR cycle. The evolution of air trapped in the aquifer was
also estimated using the techniques of Blaxejewski (1979),
with sequential infiltration testing during a complete MAR
cycle utilising a specifically designed bench-ditch.
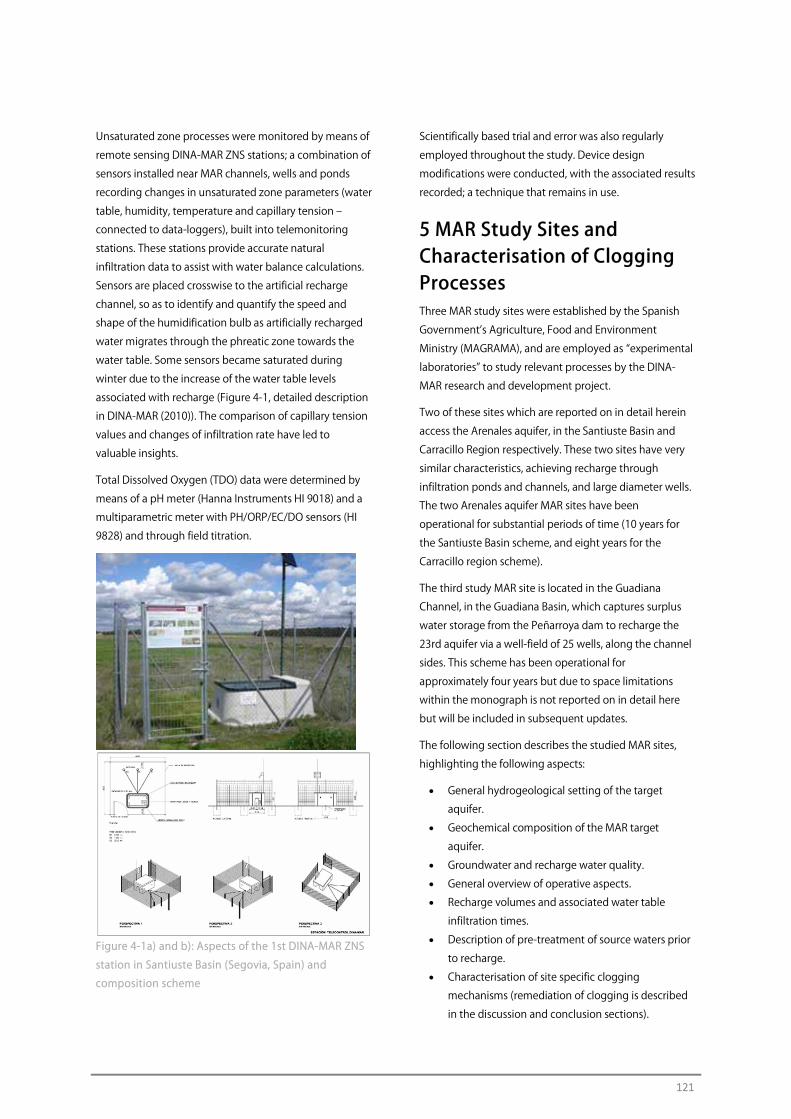
121
Unsaturated zone processes were monitored by means of
remote sensing DINA-MAR ZNS stations; a combination of
sensors installed near MAR channels, wells and ponds
recording changes in unsaturated zone parameters (water
table, humidity, temperature and capillary tension ‒
connected to data-loggers), built into telemonitoring
stations. These stations provide accurate natural
infiltration data to assist with water balance calculations.
Sensors are placed crosswise to the artificial recharge
channel, so as to identify and quantify the speed and
shape of the humidification bulb as artificially recharged
water migrates through the phreatic zone towards the
water table. Some sensors became saturated during
winter due to the increase of the water table levels
associated with recharge (Figure 4-1, detailed description
in DINA-MAR (2010)). The comparison of capillary tension
values and changes of infiltration rate have led to
valuable insights.
Total Dissolved Oxygen (TDO) data were determined by
means of a pH meter (Hanna Instruments HI 9018) and a
multiparametric meter with PH/ORP/EC/DO sensors (HI
9828) and through field titration.
Figure 4-1a) and b): Aspects of the 1st DINA-MAR ZNS
station in Santiuste Basin (Segovia, Spain) and
composition scheme
Scientifically based trial and error was also regularly
employed throughout the study. Device design
modifications were conducted, with the associated results
recorded; a technique that remains in use.
5 MAR Study Sites and Characterisation of Clogging Processes Three MAR study sites were established by the Spanish
Government’s Agriculture, Food and Environment
Ministry (MAGRAMA), and are employed as “experimental
laboratories” to study relevant processes by the DINA-
MAR research and development project.
Two of these sites which are reported on in detail herein
access the Arenales aquifer, in the Santiuste Basin and
Carracillo Region respectively. These two sites have very
similar characteristics, achieving recharge through
infiltration ponds and channels, and large diameter wells.
The two Arenales aquifer MAR sites have been
operational for substantial periods of time (10 years for
the Santiuste Basin scheme, and eight years for the
Carracillo region scheme).
The third study MAR site is located in the Guadiana
Channel, in the Guadiana Basin, which captures surplus
water storage from the Peñarroya dam to recharge the
23rd aquifer via a well-field of 25 wells, along the channel
sides. This scheme has been operational for
approximately four years but due to space limitations
within the monograph is not reported on in detail here
but will be included in subsequent updates.
The following section describes the studied MAR sites,
highlighting the following aspects:
• General hydrogeological setting of the target
aquifer.
• Geochemical composition of the MAR target
aquifer.
• Groundwater and recharge water quality.
• General overview of operative aspects.
• Recharge volumes and associated water table
infiltration times.
• Description of pre-treatment of source waters prior
to recharge.
• Characterisation of site specific clogging
mechanisms (remediation of clogging is described
in the discussion and conclusion sections).
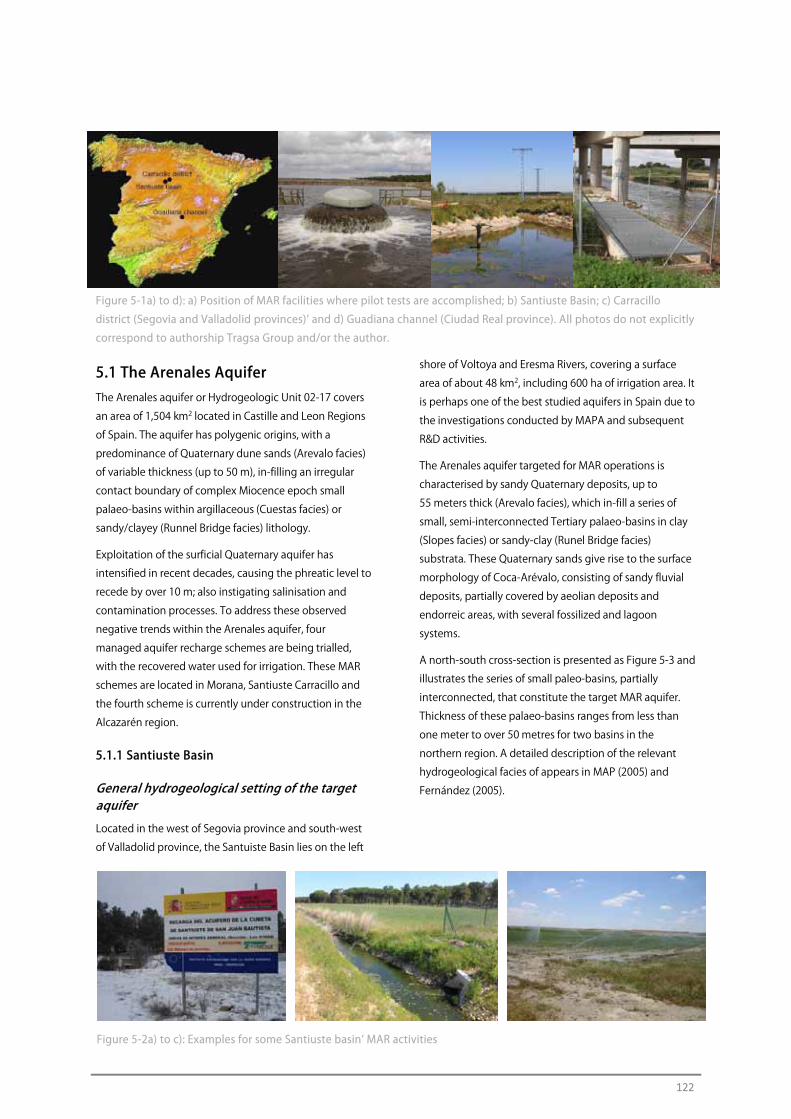
122
Figure 5-1a) to d): a) Position of MAR facilities where pilot tests are accomplished; b) Santiuste Basin; c) Carracillo
district (Segovia and Valladolid provinces)’ and d) Guadiana channel (Ciudad Real province). All photos do not explicitly
correspond to authorship Tragsa Group and/or the author.
5.1 The Arenales Aquifer The Arenales aquifer or Hydrogeologic Unit 02-17 covers
an area of 1,504 km2 located in Castille and Leon Regions
of Spain. The aquifer has polygenic origins, with a
predominance of Quaternary dune sands (Arevalo facies)
of variable thickness (up to 50 m), in-filling an irregular
contact boundary of complex Miocence epoch small
palaeo-basins within argillaceous (Cuestas facies) or
sandy/clayey (Runnel Bridge facies) lithology.
Exploitation of the surficial Quaternary aquifer has
intensified in recent decades, causing the phreatic level to
recede by over 10 m; also instigating salinisation and
contamination processes. To address these observed
negative trends within the Arenales aquifer, four
managed aquifer recharge schemes are being trialled,
with the recovered water used for irrigation. These MAR
schemes are located in Morana, Santiuste Carracillo and
the fourth scheme is currently under construction in the
Alcazarén region.
5.1.1 Santiuste Basin
General hydrogeological setting of the target aquifer
Located in the west of Segovia province and south-west
of Valladolid province, the Santuiste Basin lies on the left
shore of Voltoya and Eresma Rivers, covering a surface
area of about 48 km2, including 600 ha of irrigation area. It
is perhaps one of the best studied aquifers in Spain due to
the investigations conducted by MAPA and subsequent
R&D activities.
The Arenales aquifer targeted for MAR operations is
characterised by sandy Quaternary deposits, up to
55 meters thick (Arevalo facies), which in-fill a series of
small, semi-interconnected Tertiary palaeo-basins in clay
(Slopes facies) or sandy-clay (Runel Bridge facies)
substrata. These Quaternary sands give rise to the surface
morphology of Coca-Arévalo, consisting of sandy fluvial
deposits, partially covered by aeolian deposits and
endorreic areas, with several fossilized and lagoon
systems.
A north-south cross-section is presented as Figure 5-3 and
illustrates the series of small paleo-basins, partially
interconnected, that constitute the target MAR aquifer.
Thickness of these palaeo-basins ranges from less than
one meter to over 50 metres for two basins in the
northern region. A detailed description of the relevant
hydrogeological facies of appears in MAP (2005) and
Fernández (2005).
Figure 5-2a) to c): Examples for some Santiuste basin’ MAR activities
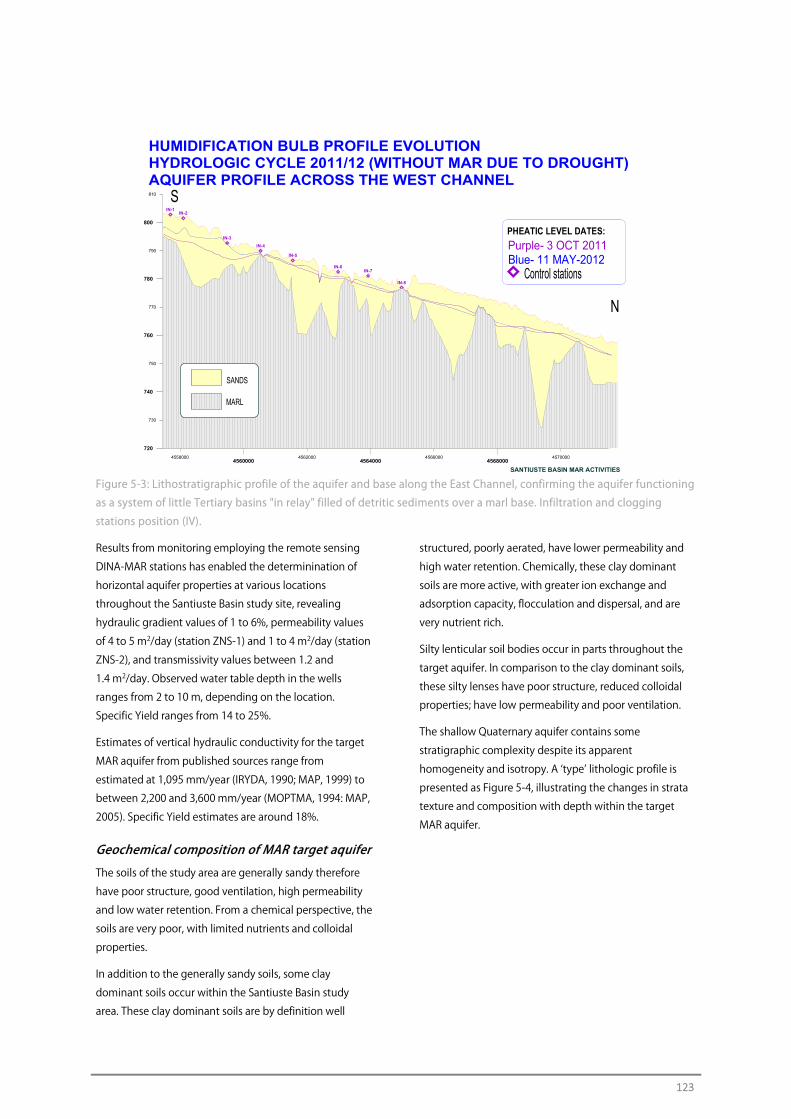
123
Figure 5-3: Lithostratigraphic profile of the aquifer and base along the East Channel, confirming the aquifer functioning
as a system of little Tertiary basins "in relay" filled of detritic sediments over a marl base. Infiltration and clogging
stations position (IV).
Results from monitoring employing the remote sensing
DINA-MAR stations has enabled the determinination of
horizontal aquifer properties at various locations
throughout the Santiuste Basin study site, revealing
hydraulic gradient values of 1 to 6%, permeability values
of 4 to 5 m2/day (station ZNS-1) and 1 to 4 m2/day (station
ZNS-2), and transmissivity values between 1.2 and
1.4 m2/day. Observed water table depth in the wells
ranges from 2 to 10 m, depending on the location.
Specific Yield ranges from 14 to 25%.
Estimates of vertical hydraulic conductivity for the target
MAR aquifer from published sources range from
estimated at 1,095 mm/year (IRYDA, 1990; MAP, 1999) to
between 2,200 and 3,600 mm/year (MOPTMA, 1994: MAP,
2005). Specific Yield estimates are around 18%.
Geochemical composition of MAR target aquifer
The soils of the study area are generally sandy therefore
have poor structure, good ventilation, high permeability
and low water retention. From a chemical perspective, the
soils are very poor, with limited nutrients and colloidal
properties.
In addition to the generally sandy soils, some clay
dominant soils occur within the Santiuste Basin study
area. These clay dominant soils are by definition well
structured, poorly aerated, have lower permeability and
high water retention. Chemically, these clay dominant
soils are more active, with greater ion exchange and
adsorption capacity, flocculation and dispersal, and are
very nutrient rich.
Silty lenticular soil bodies occur in parts throughout the
target aquifer. In comparison to the clay dominant soils,
these silty lenses have poor structure, reduced colloidal
properties; have low permeability and poor ventilation.
The shallow Quaternary aquifer contains some
stratigraphic complexity despite its apparent
homogeneity and isotropy. A ‘type’ lithologic profile is
presented as Figure 5-4, illustrating the changes in strata
texture and composition with depth within the target
MAR aquifer.
SIN-1
IN-2
IN-3
IN-4
IN-5
IN-6IN-7
IN-8
4560000 4564000 45680004558000 4562000 4566000 4570000
720
740
760
780
800
730
750
770
790
810
HUMIDIFICATION BULB PROFILE EVOLUTIONHYDROLOGIC CYCLE 2011/12 (WITHOUT MAR DUE TO DROUGHT)AQUIFER PROFILE ACROSS THE WEST CHANNEL
SANDS
MARL
SANTIUSTE BASIN MAR ACTIVITIES
N
Purple- 3 OCT 2011
Control stations
PHEATIC LEVEL DATES:
Blue- 11 MAY-2012
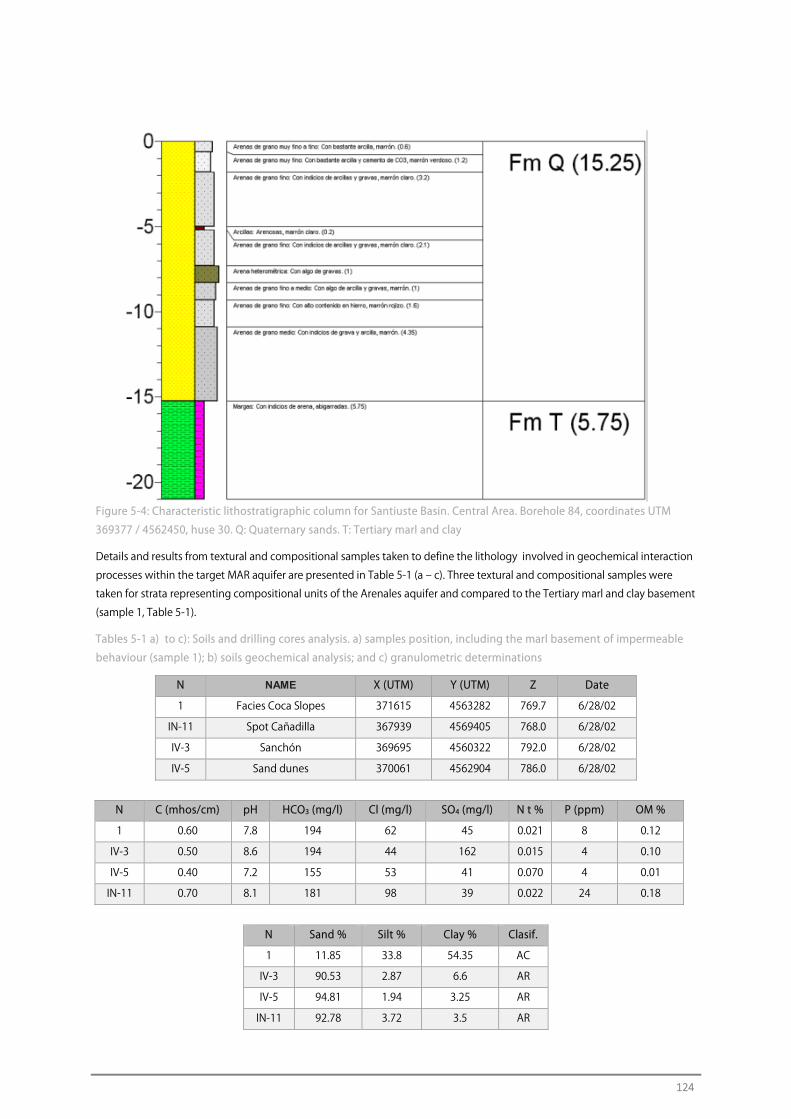
124
Figure 5-4: Characteristic lithostratigraphic column for Santiuste Basin. Central Area. Borehole 84, coordinates UTM
369377 / 4562450, huse 30. Q: Quaternary sands. T: Tertiary marl and clay
Details and results from textural and compositional samples taken to define the lithology involved in geochemical interaction
processes within the target MAR aquifer are presented in Table 5-1 (a ‒ c). Three textural and compositional samples were
taken for strata representing compositional units of the Arenales aquifer and compared to the Tertiary marl and clay basement
(sample 1, Table 5-1).
Tables 5-1 a) to c): Soils and drilling cores analysis. a) samples position, including the marl basement of impermeable
behaviour (sample 1); b) soils geochemical analysis; and c) granulometric determinations
N NAME X (UTM) Y (UTM) Z Date
1 Facies Coca Slopes 371615 4563282 769.7 6/28/02
IN-11 Spot Cañadilla 367939 4569405 768.0 6/28/02
IV-3 Sanchón 369695 4560322 792.0 6/28/02
IV-5 Sand dunes 370061 4562904 786.0 6/28/02
N C (mhos/cm) pH HCO3 (mg/l) Cl (mg/l) SO4 (mg/l) N t % P (ppm) OM %
1 0.60 7.8 194 62 45 0.021 8 0.12
IV-3 0.50 8.6 194 44 162 0.015 4 0.10
IV-5 0.40 7.2 155 53 41 0.070 4 0.01
IN-11 0.70 8.1 181 98 39 0.022 24 0.18
N Sand % Silt % Clay % Clasif.
1 11.85 33.8 54.35 AC
IV-3 90.53 2.87 6.6 AR
IV-5 94.81 1.94 3.25 AR
IN-11 92.78 3.72 3.5 AR
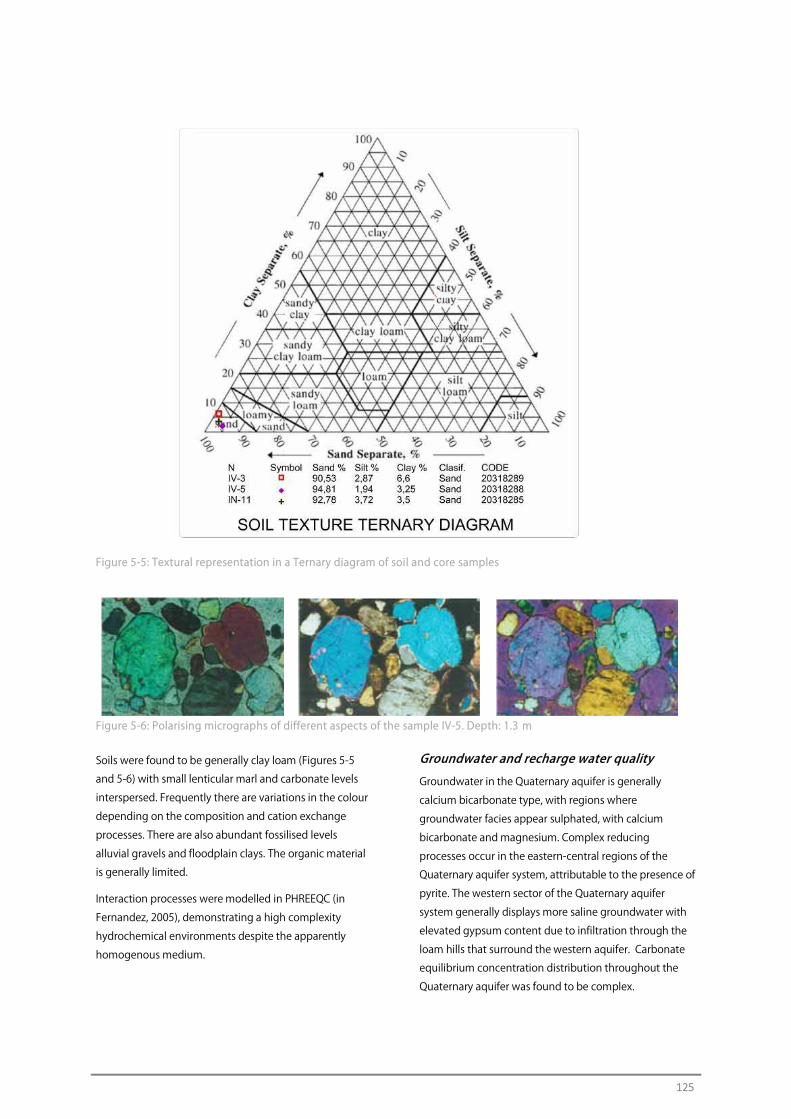
125
Figure 5-5: Textural representation in a Ternary diagram of soil and core samples
Figure 5-6: Polarising micrographs of different aspects of the sample IV-5. Depth: 1.3 m
Soils were found to be generally clay loam (Figures 5-5
and 5-6) with small lenticular marl and carbonate levels
interspersed. Frequently there are variations in the colour
depending on the composition and cation exchange
processes. There are also abundant fossilised levels
alluvial gravels and floodplain clays. The organic material
is generally limited.
Interaction processes were modelled in PHREEQC (in
Fernandez, 2005), demonstrating a high complexity
hydrochemical environments despite the apparently
homogenous medium.
Groundwater and recharge water quality
Groundwater in the Quaternary aquifer is generally
calcium bicarbonate type, with regions where
groundwater facies appear sulphated, with calcium
bicarbonate and magnesium. Complex reducing
processes occur in the eastern-central regions of the
Quaternary aquifer system, attributable to the presence of
pyrite. The western sector of the Quaternary aquifer
system generally displays more saline groundwater with
elevated gypsum content due to infiltration through the
loam hills that surround the western aquifer. Carbonate
equilibrium concentration distribution throughout the
Quaternary aquifer was found to be complex.
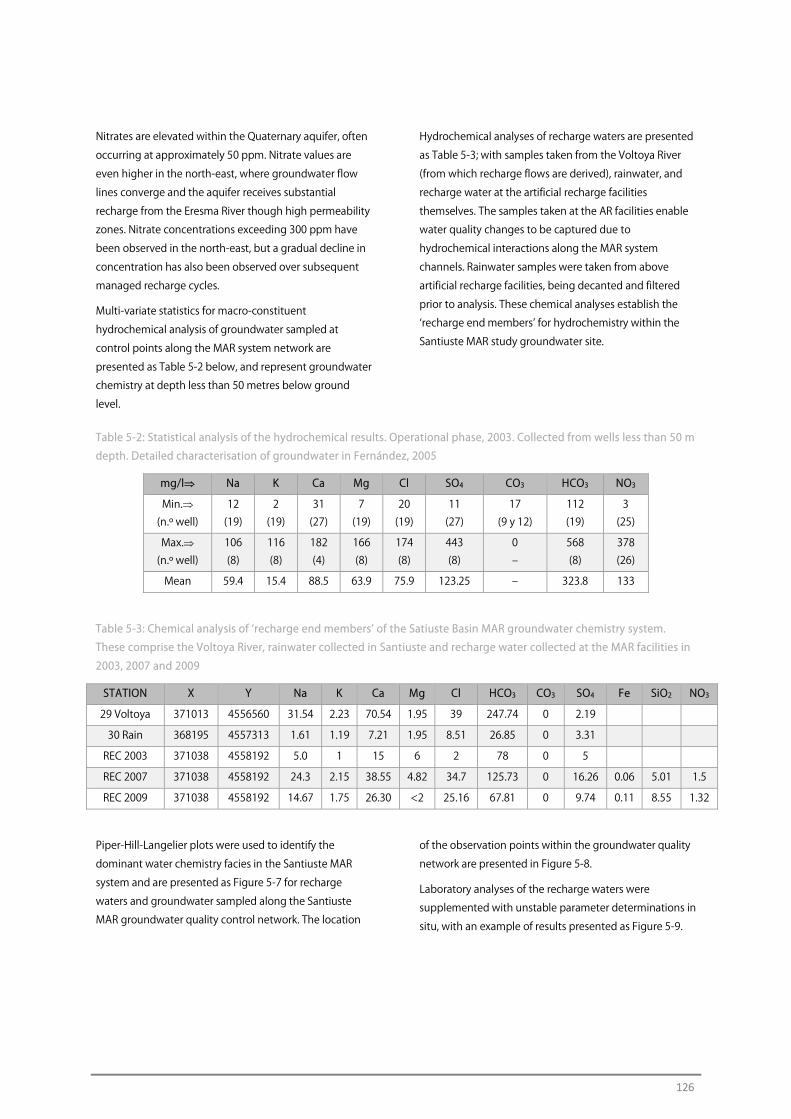
126
Nitrates are elevated within the Quaternary aquifer, often
occurring at approximately 50 ppm. Nitrate values are
even higher in the north-east, where groundwater flow
lines converge and the aquifer receives substantial
recharge from the Eresma River though high permeability
zones. Nitrate concentrations exceeding 300 ppm have
been observed in the north-east, but a gradual decline in
concentration has also been observed over subsequent
managed recharge cycles.
Multi-variate statistics for macro-constituent
hydrochemical analysis of groundwater sampled at
control points along the MAR system network are
presented as Table 5-2 below, and represent groundwater
chemistry at depth less than 50 metres below ground
level.
Hydrochemical analyses of recharge waters are presented
as Table 5-3; with samples taken from the Voltoya River
(from which recharge flows are derived), rainwater, and
recharge water at the artificial recharge facilities
themselves. The samples taken at the AR facilities enable
water quality changes to be captured due to
hydrochemical interactions along the MAR system
channels. Rainwater samples were taken from above
artificial recharge facilities, being decanted and filtered
prior to analysis. These chemical analyses establish the
‘recharge end members’ for hydrochemistry within the
Santiuste MAR study groundwater site.
Table 5-2: Statistical analysis of the hydrochemical results. Operational phase, 2003. Collected from wells less than 50 m
depth. Detailed characterisation of groundwater in Fernández, 2005
mg/l Na K Ca Mg Cl SO4 CO3 HCO3 NO3
Min. (n.º well)
12 (19)
2 (19)
31 (27)
7 (19)
20 (19)
11 (27)
17 (9 y 12)
112 (19)
3 (25)
Max. (n.º well)
106 (8)
116 (8)
182 (4)
166 (8)
174 (8)
443 (8)
0 ‒
568 (8)
378 (26)
Mean 59.4 15.4 88.5 63.9 75.9 123.25 ‒ 323.8 133
Table 5-3: Chemical analysis of ‘recharge end members’ of the Satiuste Basin MAR groundwater chemistry system.
These comprise the Voltoya River, rainwater collected in Santiuste and recharge water collected at the MAR facilities in
2003, 2007 and 2009
STATION X Y Na K Ca Mg Cl HCO3 CO3 SO4 Fe SiO2 NO3
29 Voltoya 371013 4556560 31.54 2.23 70.54 1.95 39 247.74 0 2.19
30 Rain 368195 4557313 1.61 1.19 7.21 1.95 8.51 26.85 0 3.31
REC 2003 371038 4558192 5.0 1 15 6 2 78 0 5
REC 2007 371038 4558192 24.3 2.15 38.55 4.82 34.7 125.73 0 16.26 0.06 5.01 1.5
REC 2009 371038 4558192 14.67 1.75 26.30 <2 25.16 67.81 0 9.74 0.11 8.55 1.32
Piper-Hill-Langelier plots were used to identify the
dominant water chemistry facies in the Santiuste MAR
system and are presented as Figure 5-7 for recharge
waters and groundwater sampled along the Santiuste
MAR groundwater quality control network. The location
of the observation points within the groundwater quality
network are presented in Figure 5-8.
Laboratory analyses of the recharge waters were
supplemented with unstable parameter determinations in
situ, with an example of results presented as Figure 5-9.
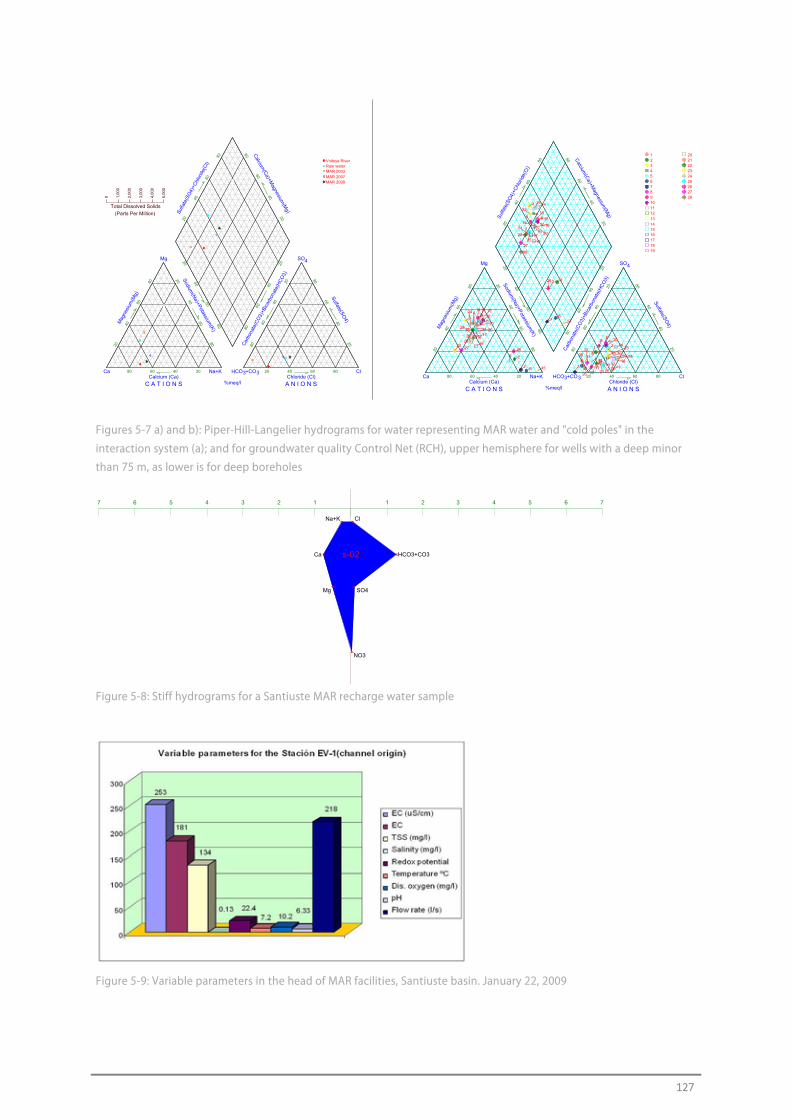
127
Figures 5-7 a) and b): Piper-Hill-Langelier hydrograms for water representing MAR water and "cold poles" in the
interaction system (a); and for groundwater quality Control Net (RCH), upper hemisphere for wells with a deep minor
than 75 m, as lower is for deep boreholes
Figure 5-8: Stiff hydrograms for a Santiuste MAR recharge water sample
Figure 5-9: Variable parameters in the head of MAR facilities, Santiuste basin. January 22, 2009
C A T I O N S A N I O N S%meq/l
Na+K HCO +CO3 3 Cl
Mg SO4
CaCalcium (Ca) Chloride (Cl)
Sul
fate
(SO
4)+C
hlor
ide(
Cl)
Calcium
(Ca)+M
agnesium(M
g)
Car
bona
te(C
O3)
+Bic
arbo
nate
(HC
O3)
Sodium
(Na)+P
otassium(K
)
Sulfate(S
O4)M
agne
sium
(Mg)
80 60 40 20 20 40 60 80
80
60
40
20
20
40
60
80
20
40
60
80
80
60
40
20
20
40
60
80
20
40
60
80
80
60
40
20
80
60
40
20
Total Dissolved Solids
(Parts Per Million)
0 1,00
0
2,00
0
3,00
0
4,00
0
5,00
0Voltoya RiverRain waterMAR 2003MAR 2007MAR 2009
C A T I O N S A N I O N S%meq/l
Na+K HCO +CO3 3 Cl
Mg SO4
CaCalcium (Ca) Chloride (Cl)
Sul
fate
(SO
4)+C
hlor
ide(
Cl)
Calcium
(Ca)+M
agnesium(M
g)
Car
bona
te(C
O3)
+Bic
arbo
nate
(HC
O3)
Sodium
(Na)+P
otassium(K
)
Sulfate(S
O4)M
agne
sium
(Mg)
80 60 40 20 20 40 60 80
80
60
40
20
20
40
60
80
20
40
60
80
80
60
40
20
20
40
60
80
20
40
60
80
80
60
40
20
80
60
40
20
1
1
1
22
2
3
3
3
4
4
4
55
5
6
6
6
7 7
78
8
8
9
9
9
10
10
10
11
11
11
12
12
12
13
13
13
14
14
14
15
15
15
16
16
16
17
17
17
18
18
18
19
19
19
20
20
20
21
21
21
22
22
22
2323
23
24
24
24
25
25
25
26
26
26
27 27
27
28
28
28
12345678910111213141516171819
202122232425262728
7 6 5 4 3 2 1 1 2 3 4 5 6 7
Cl
HCO3+CO3
SO4
NO3
Mg
Ca
Na+K
s-02
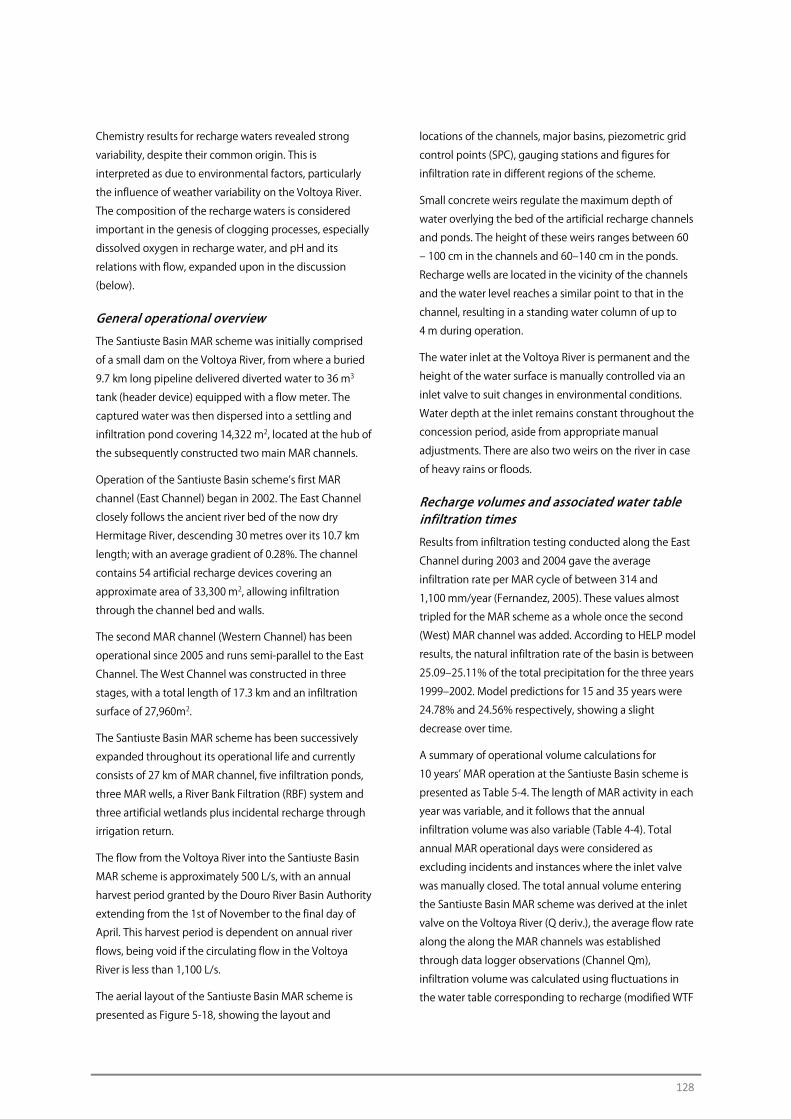
128
Chemistry results for recharge waters revealed strong
variability, despite their common origin. This is
interpreted as due to environmental factors, particularly
the influence of weather variability on the Voltoya River.
The composition of the recharge waters is considered
important in the genesis of clogging processes, especially
dissolved oxygen in recharge water, and pH and its
relations with flow, expanded upon in the discussion
(below).
General operational overview
The Santiuste Basin MAR scheme was initially comprised
of a small dam on the Voltoya River, from where a buried
9.7 km long pipeline delivered diverted water to 36 m3
tank (header device) equipped with a flow meter. The
captured water was then dispersed into a settling and
infiltration pond covering 14,322 m2, located at the hub of
the subsequently constructed two main MAR channels.
Operation of the Santiuste Basin scheme’s first MAR
channel (East Channel) began in 2002. The East Channel
closely follows the ancient river bed of the now dry
Hermitage River, descending 30 metres over its 10.7 km
length; with an average gradient of 0.28%. The channel
contains 54 artificial recharge devices covering an
approximate area of 33,300 m2, allowing infiltration
through the channel bed and walls.
The second MAR channel (Western Channel) has been
operational since 2005 and runs semi-parallel to the East
Channel. The West Channel was constructed in three
stages, with a total length of 17.3 km and an infiltration
surface of 27,960m2.
The Santiuste Basin MAR scheme has been successively
expanded throughout its operational life and currently
consists of 27 km of MAR channel, five infiltration ponds,
three MAR wells, a River Bank Filtration (RBF) system and
three artificial wetlands plus incidental recharge through
irrigation return.
The flow from the Voltoya River into the Santiuste Basin
MAR scheme is approximately 500 L/s, with an annual
harvest period granted by the Douro River Basin Authority
extending from the 1st of November to the final day of
April. This harvest period is dependent on annual river
flows, being void if the circulating flow in the Voltoya
River is less than 1,100 L/s.
The aerial layout of the Santiuste Basin MAR scheme is
presented as Figure 5-18, showing the layout and
locations of the channels, major basins, piezometric grid
control points (SPC), gauging stations and figures for
infiltration rate in different regions of the scheme.
Small concrete weirs regulate the maximum depth of
water overlying the bed of the artificial recharge channels
and ponds. The height of these weirs ranges between 60
‒ 100 cm in the channels and 60‒140 cm in the ponds.
Recharge wells are located in the vicinity of the channels
and the water level reaches a similar point to that in the
channel, resulting in a standing water column of up to
4 m during operation.
The water inlet at the Voltoya River is permanent and the
height of the water surface is manually controlled via an
inlet valve to suit changes in environmental conditions.
Water depth at the inlet remains constant throughout the
concession period, aside from appropriate manual
adjustments. There are also two weirs on the river in case
of heavy rains or floods.
Recharge volumes and associated water table infiltration times
Results from infiltration testing conducted along the East
Channel during 2003 and 2004 gave the average
infiltration rate per MAR cycle of between 314 and
1,100 mm/year (Fernandez, 2005). These values almost
tripled for the MAR scheme as a whole once the second
(West) MAR channel was added. According to HELP model
results, the natural infiltration rate of the basin is between
25.09‒25.11% of the total precipitation for the three years
1999‒2002. Model predictions for 15 and 35 years were
24.78% and 24.56% respectively, showing a slight
decrease over time.
A summary of operational volume calculations for
10 years’ MAR operation at the Santiuste Basin scheme is
presented as Table 5-4. The length of MAR activity in each
year was variable, and it follows that the annual
infiltration volume was also variable (Table 4-4). Total
annual MAR operational days were considered as
excluding incidents and instances where the inlet valve
was manually closed. The total annual volume entering
the Santiuste Basin MAR scheme was derived at the inlet
valve on the Voltoya River (Q deriv.), the average flow rate
along the along the MAR channels was established
through data logger observations (Channel Qm),
infiltration volume was calculated using fluctuations in
the water table corresponding to recharge (modified WTF
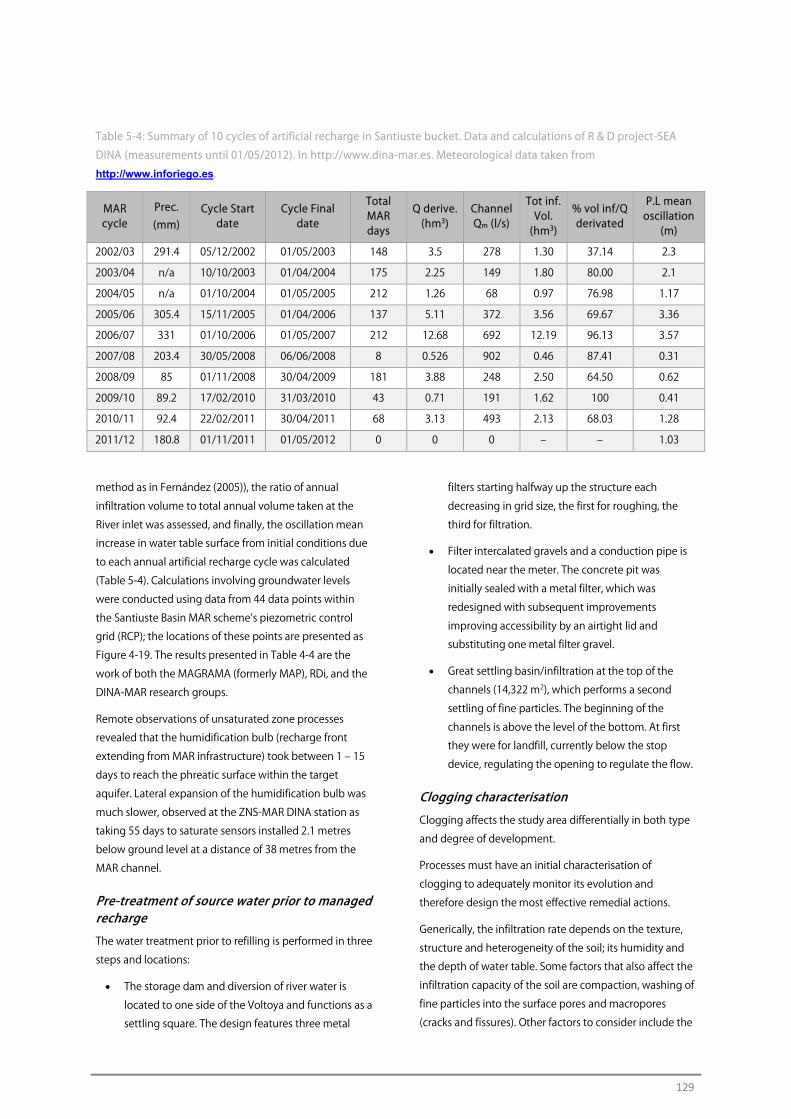
129
Table 5-4: Summary of 10 cycles of artificial recharge in Santiuste bucket. Data and calculations of R & D project-SEA
DINA (measurements until 01/05/2012). In http://www.dina-mar.es. Meteorological data taken from
http://www.inforiego.es.
MAR cycle
Prec. (mm)
Cycle Start date
Cycle Final date
Total MAR days
Q derive. (hm3)
Channel Qm (l/s)
Tot inf. Vol. (hm3)
% vol inf/Q derivated
P.L mean oscillation
(m)
2002/03 291.4 05/12/2002 01/05/2003 148 3.5 278 1.30 37.14 2.3
2003/04 n/a 10/10/2003 01/04/2004 175 2.25 149 1.80 80.00 2.1
2004/05 n/a 01/10/2004 01/05/2005 212 1.26 68 0.97 76.98 1.17
2005/06 305.4 15/11/2005 01/04/2006 137 5.11 372 3.56 69.67 3.36
2006/07 331 01/10/2006 01/05/2007 212 12.68 692 12.19 96.13 3.57
2007/08 203.4 30/05/2008 06/06/2008 8 0.526 902 0.46 87.41 0.31
2008/09 85 01/11/2008 30/04/2009 181 3.88 248 2.50 64.50 0.62
2009/10 89.2 17/02/2010 31/03/2010 43 0.71 191 1.62 100 0.41
2010/11 92.4 22/02/2011 30/04/2011 68 3.13 493 2.13 68.03 1.28
2011/12 180.8 01/11/2011 01/05/2012 0 0 0 ‒ ‒ 1.03
method as in Fernández (2005)), the ratio of annual
infiltration volume to total annual volume taken at the
River inlet was assessed, and finally, the oscillation mean
increase in water table surface from initial conditions due
to each annual artificial recharge cycle was calculated
(Table 5-4). Calculations involving groundwater levels
were conducted using data from 44 data points within
the Santiuste Basin MAR scheme’s piezometric control
grid (RCP); the locations of these points are presented as
Figure 4-19. The results presented in Table 4-4 are the
work of both the MAGRAMA (formerly MAP), RDi, and the
DINA-MAR research groups.
Remote observations of unsaturated zone processes
revealed that the humidification bulb (recharge front
extending from MAR infrastructure) took between 1 ‒ 15
days to reach the phreatic surface within the target
aquifer. Lateral expansion of the humidification bulb was
much slower, observed at the ZNS-MAR DINA station as
taking 55 days to saturate sensors installed 2.1 metres
below ground level at a distance of 38 metres from the
MAR channel.
Pre-treatment of source water prior to managed recharge
The water treatment prior to refilling is performed in three
steps and locations:
• The storage dam and diversion of river water is
located to one side of the Voltoya and functions as a
settling square. The design features three metal
filters starting halfway up the structure each
decreasing in grid size, the first for roughing, the
third for filtration.
• Filter intercalated gravels and a conduction pipe is
located near the meter. The concrete pit was
initially sealed with a metal filter, which was
redesigned with subsequent improvements
improving accessibility by an airtight lid and
substituting one metal filter gravel.
• Great settling basin/infiltration at the top of the
channels (14,322 m2), which performs a second
settling of fine particles. The beginning of the
channels is above the level of the bottom. At first
they were for landfill, currently below the stop
device, regulating the opening to regulate the flow.
Clogging characterisation
Clogging affects the study area differentially in both type
and degree of development.
Processes must have an initial characterisation of
clogging to adequately monitor its evolution and
therefore design the most effective remedial actions.
Generically, the infiltration rate depends on the texture,
structure and heterogeneity of the soil; its humidity and
the depth of water table. Some factors that also affect the
infiltration capacity of the soil are compaction, washing of
fine particles into the surface pores and macropores
(cracks and fissures). Other factors to consider include the
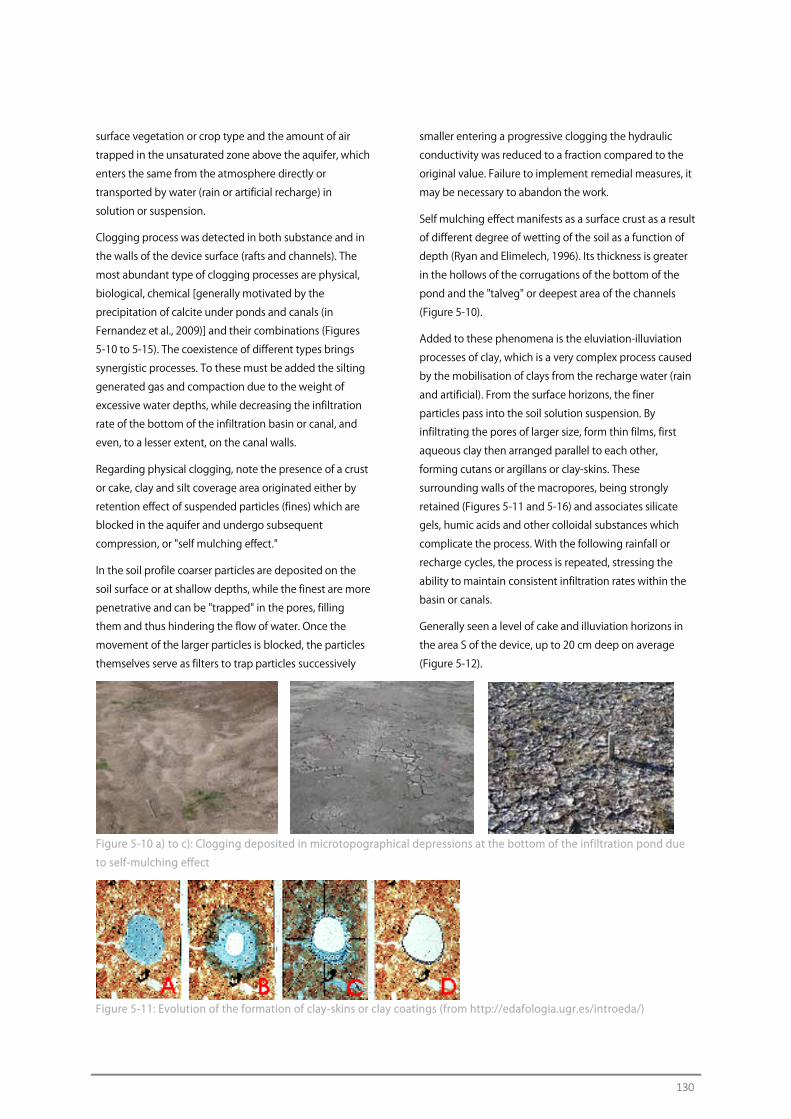
130
surface vegetation or crop type and the amount of air
trapped in the unsaturated zone above the aquifer, which
enters the same from the atmosphere directly or
transported by water (rain or artificial recharge) in
solution or suspension.
Clogging process was detected in both substance and in
the walls of the device surface (rafts and channels). The
most abundant type of clogging processes are physical,
biological, chemical [generally motivated by the
precipitation of calcite under ponds and canals (in
Fernandez et al., 2009)] and their combinations (Figures
5-10 to 5-15). The coexistence of different types brings
synergistic processes. To these must be added the silting
generated gas and compaction due to the weight of
excessive water depths, while decreasing the infiltration
rate of the bottom of the infiltration basin or canal, and
even, to a lesser extent, on the canal walls.
Regarding physical clogging, note the presence of a crust
or cake, clay and silt coverage area originated either by
retention effect of suspended particles (fines) which are
blocked in the aquifer and undergo subsequent
compression, or "self mulching effect."
In the soil profile coarser particles are deposited on the
soil surface or at shallow depths, while the finest are more
penetrative and can be "trapped" in the pores, filling
them and thus hindering the flow of water. Once the
movement of the larger particles is blocked, the particles
themselves serve as filters to trap particles successively
smaller entering a progressive clogging the hydraulic
conductivity was reduced to a fraction compared to the
original value. Failure to implement remedial measures, it
may be necessary to abandon the work.
Self mulching effect manifests as a surface crust as a result
of different degree of wetting of the soil as a function of
depth (Ryan and Elimelech, 1996). Its thickness is greater
in the hollows of the corrugations of the bottom of the
pond and the "talveg" or deepest area of the channels
(Figure 5-10).
Added to these phenomena is the eluviation-illuviation
processes of clay, which is a very complex process caused
by the mobilisation of clays from the recharge water (rain
and artificial). From the surface horizons, the finer
particles pass into the soil solution suspension. By
infiltrating the pores of larger size, form thin films, first
aqueous clay then arranged parallel to each other,
forming cutans or argillans or clay-skins. These
surrounding walls of the macropores, being strongly
retained (Figures 5-11 and 5-16) and associates silicate
gels, humic acids and other colloidal substances which
complicate the process. With the following rainfall or
recharge cycles, the process is repeated, stressing the
ability to maintain consistent infiltration rates within the
basin or canals.
Generally seen a level of cake and illuviation horizons in
the area S of the device, up to 20 cm deep on average
(Figure 5-12).
Figure 5-10 a) to c): Clogging deposited in microtopographical depressions at the bottom of the infiltration pond due
to self-mulching effect
Figure 5-11: Evolution of the formation of clay-skins or clay coatings (from http://edafologia.ugr.es/introeda/)
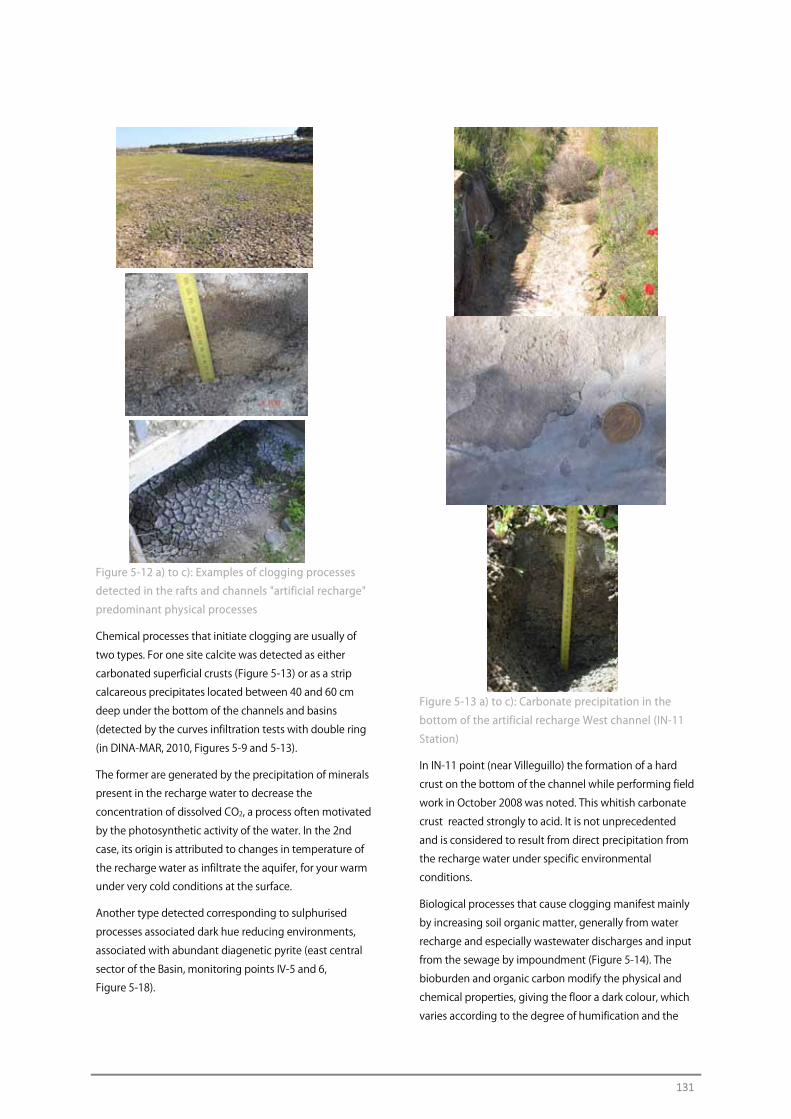
131
Figure 5-12 a) to c): Examples of clogging processes
detected in the rafts and channels "artificial recharge"
predominant physical processes
Chemical processes that initiate clogging are usually of
two types. For one site calcite was detected as either
carbonated superficial crusts (Figure 5-13) or as a strip
calcareous precipitates located between 40 and 60 cm
deep under the bottom of the channels and basins
(detected by the curves infiltration tests with double ring
(in DINA-MAR, 2010, Figures 5-9 and 5-13).
The former are generated by the precipitation of minerals
present in the recharge water to decrease the
concentration of dissolved CO2, a process often motivated
by the photosynthetic activity of the water. In the 2nd
case, its origin is attributed to changes in temperature of
the recharge water as infiltrate the aquifer, for your warm
under very cold conditions at the surface.
Another type detected corresponding to sulphurised
processes associated dark hue reducing environments,
associated with abundant diagenetic pyrite (east central
sector of the Basin, monitoring points IV-5 and 6,
Figure 5-18).
Figure 5-13 a) to c): Carbonate precipitation in the
bottom of the artificial recharge West channel (IN-11
Station)
In IN-11 point (near Villeguillo) the formation of a hard
crust on the bottom of the channel while performing field
work in October 2008 was noted. This whitish carbonate
crust reacted strongly to acid. It is not unprecedented
and is considered to result from direct precipitation from
the recharge water under specific environmental
conditions.
Biological processes that cause clogging manifest mainly
by increasing soil organic matter, generally from water
recharge and especially wastewater discharges and input
from the sewage by impoundment (Figure 5-14). The
bioburden and organic carbon modify the physical and
chemical properties, giving the floor a dark colour, which
varies according to the degree of humification and the
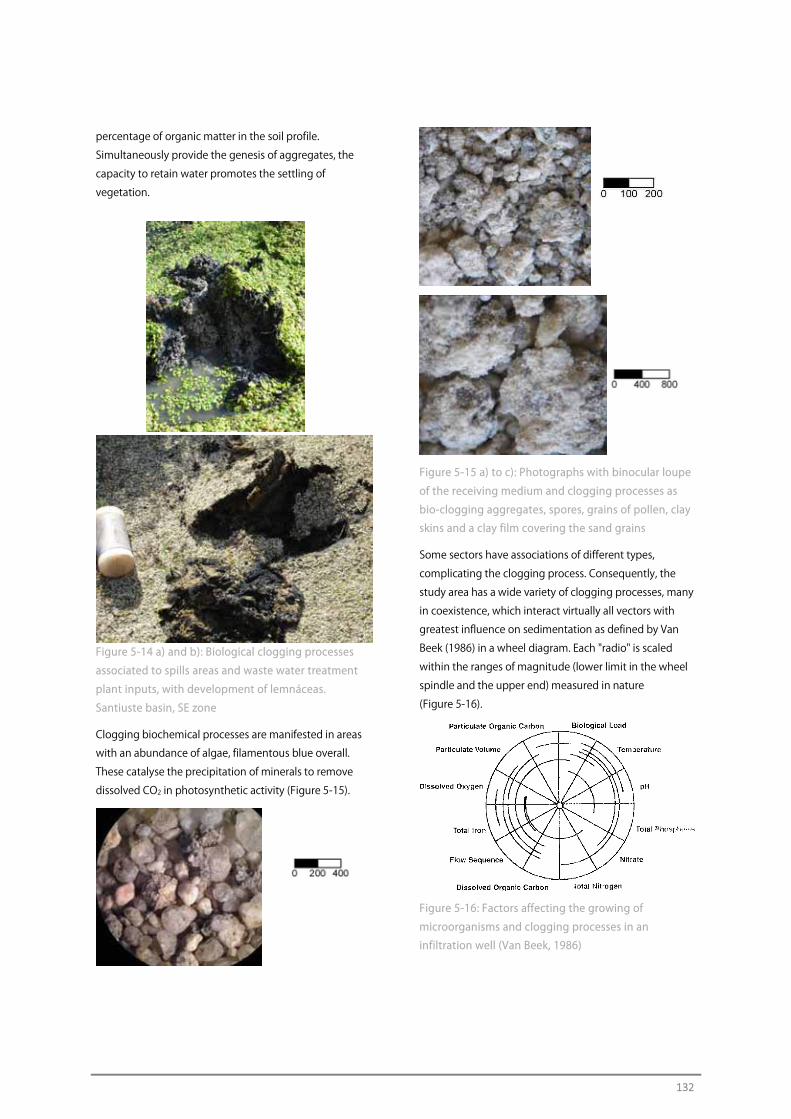
132
percentage of organic matter in the soil profile.
Simultaneously provide the genesis of aggregates, the
capacity to retain water promotes the settling of
vegetation.
Figure 5-14 a) and b): Biological clogging processes
associated to spills areas and waste water treatment
plant inputs, with development of lemnáceas.
Santiuste basin, SE zone
Clogging biochemical processes are manifested in areas
with an abundance of algae, filamentous blue overall.
These catalyse the precipitation of minerals to remove
dissolved CO2 in photosynthetic activity (Figure 5-15).
Figure 5-15 a) to c): Photographs with binocular loupe
of the receiving medium and clogging processes as
bio-clogging aggregates, spores, grains of pollen, clay
skins and a clay film covering the sand grains
Some sectors have associations of different types,
complicating the clogging process. Consequently, the
study area has a wide variety of clogging processes, many
in coexistence, which interact virtually all vectors with
greatest influence on sedimentation as defined by Van
Beek (1986) in a wheel diagram. Each "radio" is scaled
within the ranges of magnitude (lower limit in the wheel
spindle and the upper end) measured in nature
(Figure 5-16).
Figure 5-16: Factors affecting the growing of
microorganisms and clogging processes in an
infiltration well (Van Beek, 1986)
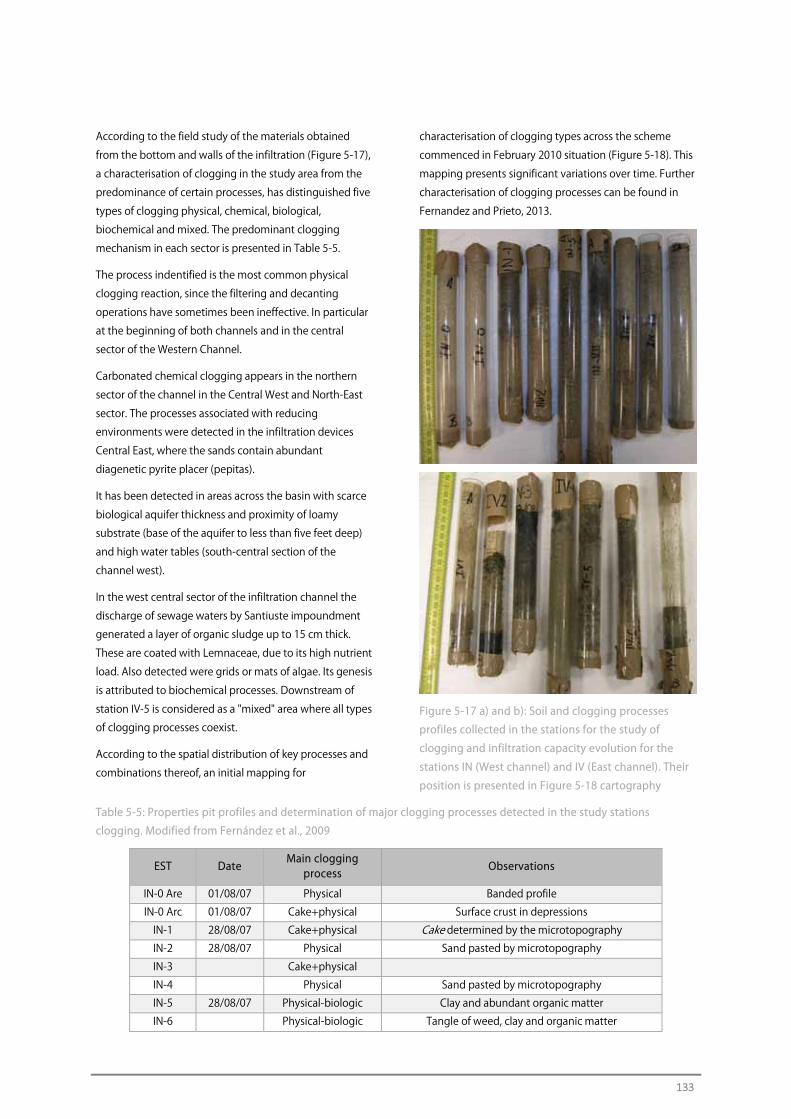
133
According to the field study of the materials obtained
from the bottom and walls of the infiltration (Figure 5-17),
a characterisation of clogging in the study area from the
predominance of certain processes, has distinguished five
types of clogging physical, chemical, biological,
biochemical and mixed. The predominant clogging
mechanism in each sector is presented in Table 5-5.
The process indentified is the most common physical
clogging reaction, since the filtering and decanting
operations have sometimes been ineffective. In particular
at the beginning of both channels and in the central
sector of the Western Channel.
Carbonated chemical clogging appears in the northern
sector of the channel in the Central West and North-East
sector. The processes associated with reducing
environments were detected in the infiltration devices
Central East, where the sands contain abundant
diagenetic pyrite placer (pepitas).
It has been detected in areas across the basin with scarce
biological aquifer thickness and proximity of loamy
substrate (base of the aquifer to less than five feet deep)
and high water tables (south-central section of the
channel west).
In the west central sector of the infiltration channel the
discharge of sewage waters by Santiuste impoundment
generated a layer of organic sludge up to 15 cm thick.
These are coated with Lemnaceae, due to its high nutrient
load. Also detected were grids or mats of algae. Its genesis
is attributed to biochemical processes. Downstream of
station IV-5 is considered as a "mixed" area where all types
of clogging processes coexist.
According to the spatial distribution of key processes and
combinations thereof, an initial mapping for
characterisation of clogging types across the scheme
commenced in February 2010 situation (Figure 5-18). This
mapping presents significant variations over time. Further
characterisation of clogging processes can be found in
Fernandez and Prieto, 2013.
Figure 5-17 a) and b): Soil and clogging processes
profiles collected in the stations for the study of
clogging and infiltration capacity evolution for the
stations IN (West channel) and IV (East channel). Their
position is presented in Figure 5-18 cartography
Table 5-5: Properties pit profiles and determination of major clogging processes detected in the study stations
clogging. Modified from Fernández et al., 2009
EST Date Main clogging
process Observations
IN-0 Are 01/08/07 Physical Banded profile
IN-0 Arc 01/08/07 Cake+physical Surface crust in depressions
IN-1 28/08/07 Cake+physical Cake determined by the microtopography
IN-2 28/08/07 Physical Sand pasted by microtopography
IN-3 Cake+physical
IN-4 Physical Sand pasted by microtopography
IN-5 28/08/07 Physical-biologic Clay and abundant organic matter
IN-6 Physical-biologic Tangle of weed, clay and organic matter
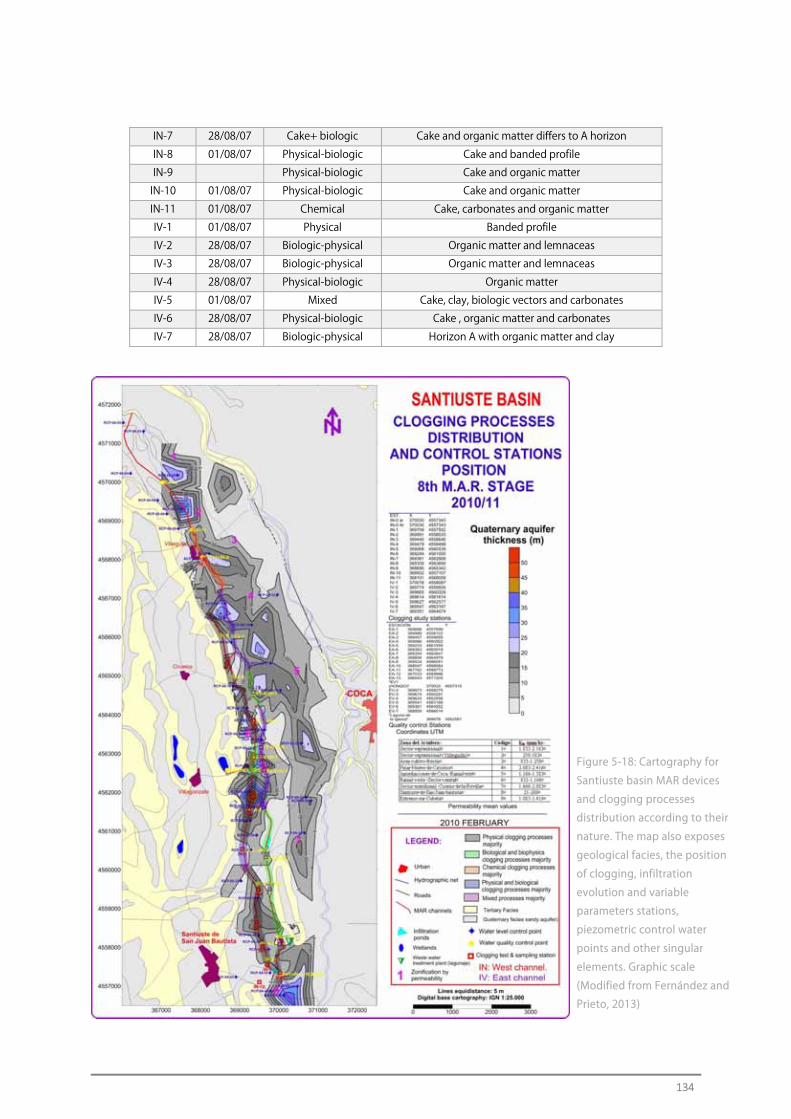
134
IN-7 28/08/07 Cake+ biologic Cake and organic matter differs to A horizon
IN-8 01/08/07 Physical-biologic Cake and banded profile
IN-9 Physical-biologic Cake and organic matter
IN-10 01/08/07 Physical-biologic Cake and organic matter
IN-11 01/08/07 Chemical Cake, carbonates and organic matter
IV-1 01/08/07 Physical Banded profile
IV-2 28/08/07 Biologic-physical Organic matter and lemnaceas
IV-3 28/08/07 Biologic-physical Organic matter and lemnaceas
IV-4 28/08/07 Physical-biologic Organic matter
IV-5 01/08/07 Mixed Cake, clay, biologic vectors and carbonates
IV-6 28/08/07 Physical-biologic Cake , organic matter and carbonates
IV-7 28/08/07 Biologic-physical Horizon A with organic matter and clay
Figure 5-18: Cartography for
Santiuste basin MAR devices
and clogging processes
distribution according to their
nature. The map also exposes
geological facies, the position
of clogging, infiltration
evolution and variable
parameters stations,
piezometric control water
points and other singular
elements. Graphic scale
(Modified from Fernández and
Prieto, 2013)

135
6 Discussion The selected working method consists of a series of
problem-solution pairs (once clogging has occurred what
are the methods employed for unclogging) for
subsequent comprehensive treatment.
The solutions proposed for the environmental impacts
and dysfunctions mentioned have involved several years
of research and progressive improvements. Generally
speaking, the initiatives have been a reiterative process,
up to the point that there are still several problems that
are not adequately resolved and designs are pending
construction. However, the current devices present
notable quantitative and qualitative improvements over
the initial design built ten years ago.
The main activities undertaken and proposed solutions,
presented in chronological order, include:
6.1 Preoperational Stage
6.1.1 MAR Water Pretreatment
In agreement with Bouwer (1999 and 2002) we consider
that pretreatment of the water to be recharged is the
most important factor in producing optimal and
sustainable MAR operations. Four main pre-treatment
methods were applied:
1. River bank filtration (RBF),
2. Dam filtration,
3. Pre-treatment In Itinere, and
4. The use of run-off traps and stagnation/decantation
structures.
These methods are individually discussed below.
1. River Bank Filtration (RBF)
A Ranney well is installed in the Voltoya River bed itself in
the northern region of the Santiuste Basin MAR scheme.
This process leads to natural filtration (river bank filtration)
as the river water is filtered through the alluvium on its
way to the lateral screens within the river bed that extend
from the central well structure (Figure 6-1). After the
water is filtered through the river bank, it is pumped and
used for urban supply (after ozone treatment). Any
surplus is sent to the MAR scheme.
After 10 years of operation, the system is providing good
results, indicating that the RBF technique is a suitable
method for pre-treatment of water recharge when the
conditions are conducive. This being said, RBF is not
generally employed throughout the Santiuste Basin MAR
scheme because it usually requires pumping. The majority
of filtration devices throughout this MAR scheme are
gravity driven so as to remove the energy costs.
Figure 6-1 a) and b): Ranney well using a River Bank
Filtration (RBF) system for water supply from which
surpluses are applied for MAR in Santiuste Basin
2. Dam Filtration
Dam filtration is a source water pre-treatment method
employed throughout the Santiuste Basin MAR scheme.
Interleaving reservoirs are placed in the same channel,
with filtering devices in the dam wall and settling on the
downstream side. Filters are also installed prior to the
bypass valve for the dam. This option has been applied in
the intake of all the Arenales Aquifer devices (Figure 6-2).
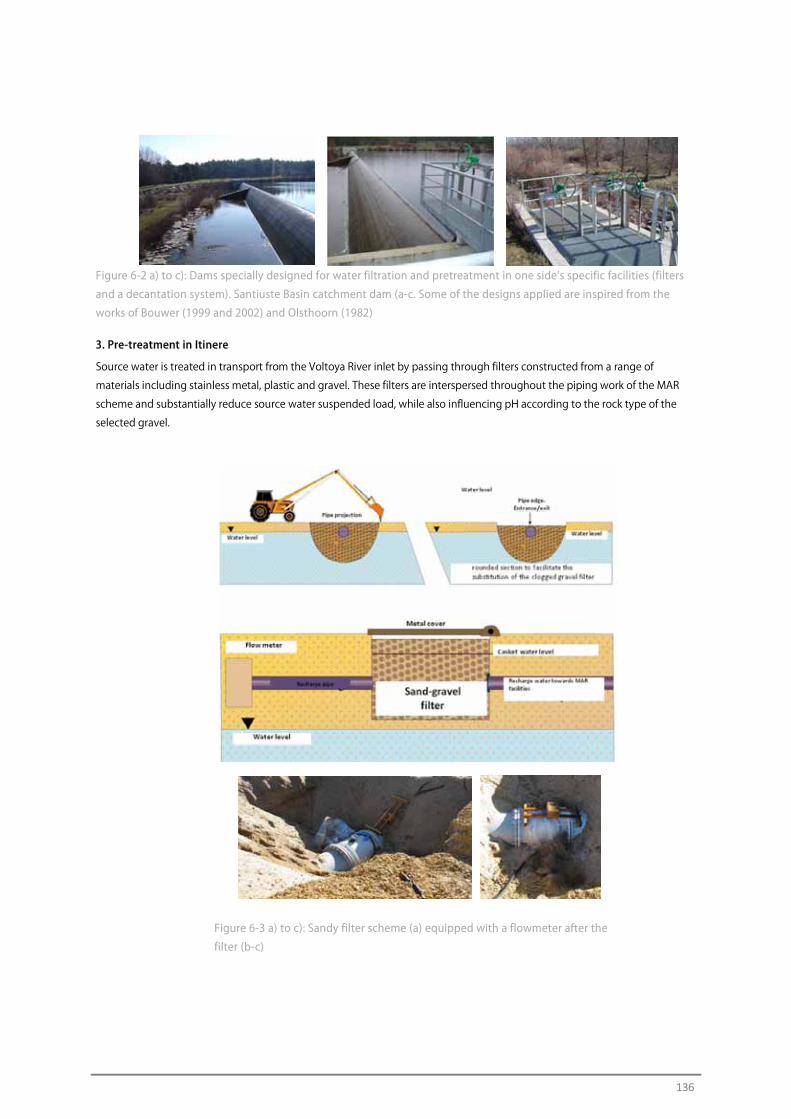
136
Figure 6-2 a) to c): Dams specially designed for water filtration and pretreatment in one side’s specific facilities (filters
and a decantation system). Santiuste Basin catchment dam (a-c. Some of the designs applied are inspired from the
works of Bouwer (1999 and 2002) and Olsthoorn (1982)
3. Pre-treatment in Itinere
Source water is treated in transport from the Voltoya River inlet by passing through filters constructed from a range of
materials including stainless metal, plastic and gravel. These filters are interspersed throughout the piping work of the MAR
scheme and substantially reduce source water suspended load, while also influencing pH according to the rock type of the
selected gravel.
Figure 6-3 a) to c): Sandy filter scheme (a) equipped with a flowmeter after the
filter (b-c)
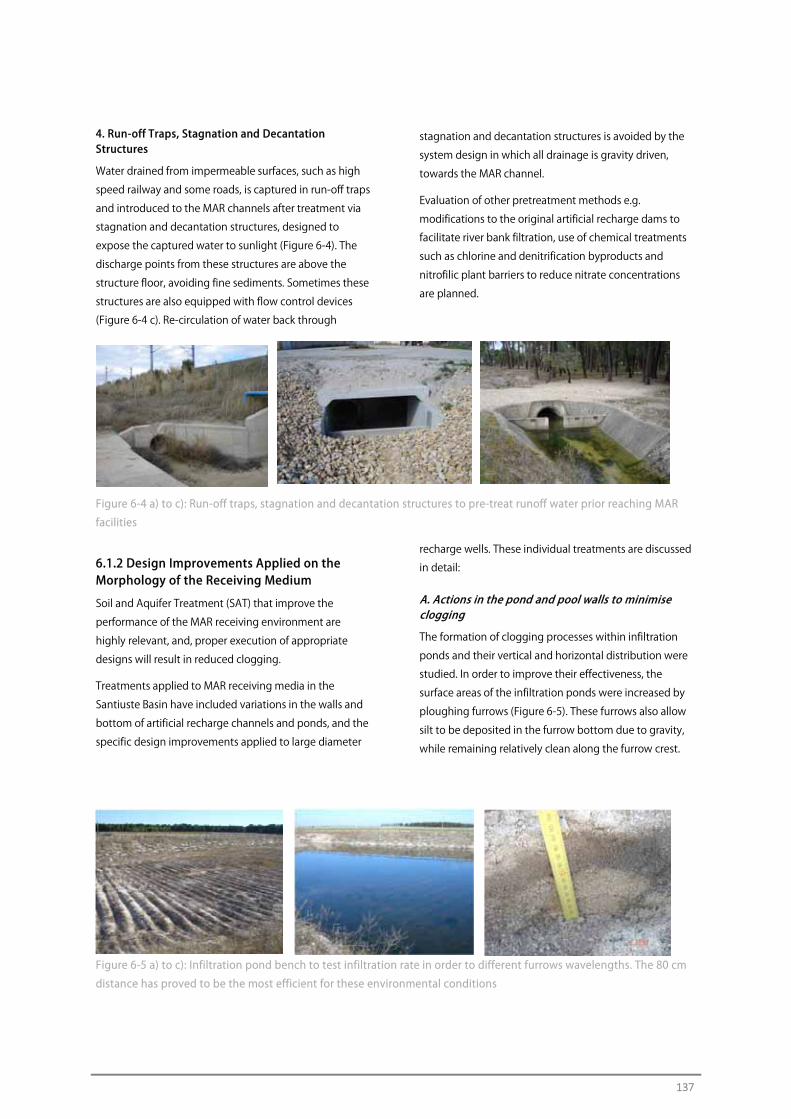
137
4. Run-off Traps, Stagnation and Decantation Structures
Water drained from impermeable surfaces, such as high
speed railway and some roads, is captured in run-off traps
and introduced to the MAR channels after treatment via
stagnation and decantation structures, designed to
expose the captured water to sunlight (Figure 6-4). The
discharge points from these structures are above the
structure floor, avoiding fine sediments. Sometimes these
structures are also equipped with flow control devices
(Figure 6-4 c). Re-circulation of water back through
stagnation and decantation structures is avoided by the
system design in which all drainage is gravity driven,
towards the MAR channel.
Evaluation of other pretreatment methods e.g.
modifications to the original artificial recharge dams to
facilitate river bank filtration, use of chemical treatments
such as chlorine and denitrification byproducts and
nitrofilic plant barriers to reduce nitrate concentrations
are planned.
Figure 6-4 a) to c): Run-off traps, stagnation and decantation structures to pre-treat runoff water prior reaching MAR
facilities
6.1.2 Design Improvements Applied on the Morphology of the Receiving Medium
Soil and Aquifer Treatment (SAT) that improve the
performance of the MAR receiving environment are
highly relevant, and, proper execution of appropriate
designs will result in reduced clogging.
Treatments applied to MAR receiving media in the
Santiuste Basin have included variations in the walls and
bottom of artificial recharge channels and ponds, and the
specific design improvements applied to large diameter
recharge wells. These individual treatments are discussed
in detail:
A. Actions in the pond and pool walls to minimise clogging
The formation of clogging processes within infiltration
ponds and their vertical and horizontal distribution were
studied. In order to improve their effectiveness, the
surface areas of the infiltration ponds were increased by
ploughing furrows (Figure 6-5). These furrows also allow
silt to be deposited in the furrow bottom due to gravity,
while remaining relatively clean along the furrow crest.
Figure 6-5 a) to c): Infiltration pond bench to test infiltration rate in order to different furrows wavelengths. The 80 cm
distance has proved to be the most efficient for these environmental conditions
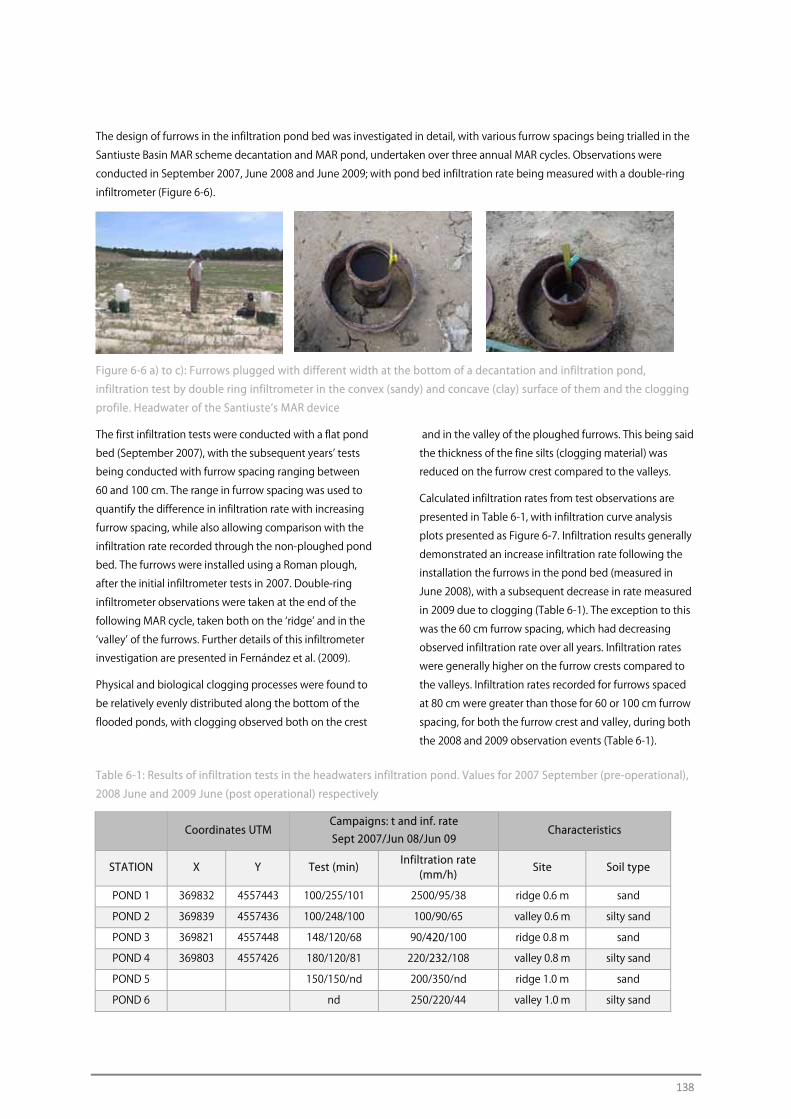
138
The design of furrows in the infiltration pond bed was investigated in detail, with various furrow spacings being trialled in the
Santiuste Basin MAR scheme decantation and MAR pond, undertaken over three annual MAR cycles. Observations were
conducted in September 2007, June 2008 and June 2009; with pond bed infiltration rate being measured with a double-ring
infiltrometer (Figure 6-6).
Figure 6-6 a) to c): Furrows plugged with different width at the bottom of a decantation and infiltration pond,
infiltration test by double ring infiltrometer in the convex (sandy) and concave (clay) surface of them and the clogging
profile. Headwater of the Santiuste’s MAR device
The first infiltration tests were conducted with a flat pond
bed (September 2007), with the subsequent years’ tests
being conducted with furrow spacing ranging between
60 and 100 cm. The range in furrow spacing was used to
quantify the difference in infiltration rate with increasing
furrow spacing, while also allowing comparison with the
infiltration rate recorded through the non-ploughed pond
bed. The furrows were installed using a Roman plough,
after the initial infiltrometer tests in 2007. Double-ring
infiltrometer observations were taken at the end of the
following MAR cycle, taken both on the ‘ridge’ and in the
‘valley’ of the furrows. Further details of this infiltrometer
investigation are presented in Fernández et al. (2009).
Physical and biological clogging processes were found to
be relatively evenly distributed along the bottom of the
flooded ponds, with clogging observed both on the crest
and in the valley of the ploughed furrows. This being said
the thickness of the fine silts (clogging material) was
reduced on the furrow crest compared to the valleys.
Calculated infiltration rates from test observations are
presented in Table 6-1, with infiltration curve analysis
plots presented as Figure 6-7. Infiltration results generally
demonstrated an increase infiltration rate following the
installation the furrows in the pond bed (measured in
June 2008), with a subsequent decrease in rate measured
in 2009 due to clogging (Table 6-1). The exception to this
was the 60 cm furrow spacing, which had decreasing
observed infiltration rate over all years. Infiltration rates
were generally higher on the furrow crests compared to
the valleys. Infiltration rates recorded for furrows spaced
at 80 cm were greater than those for 60 or 100 cm furrow
spacing, for both the furrow crest and valley, during both
the 2008 and 2009 observation events (Table 6-1).
Table 6-1: Results of infiltration tests in the headwaters infiltration pond. Values for 2007 September (pre-operational),
2008 June and 2009 June (post operational) respectively
Coordinates UTM Campaigns: t and inf. rate Sept 2007/Jun 08/Jun 09
Characteristics
STATION X Y Test (min) Infiltration rate
(mm/h) Site Soil type
POND 1 369832 4557443 100/255/101 2500/95/38 ridge 0.6 m sand
POND 2 369839 4557436 100/248/100 100/90/65 valley 0.6 m silty sand
POND 3 369821 4557448 148/120/68 90/420/100 ridge 0.8 m sand
POND 4 369803 4557426 180/120/81 220/232/108 valley 0.8 m silty sand
POND 5 150/150/nd 200/350/nd ridge 1.0 m sand
POND 6 nd 250/220/44 valley 1.0 m silty sand
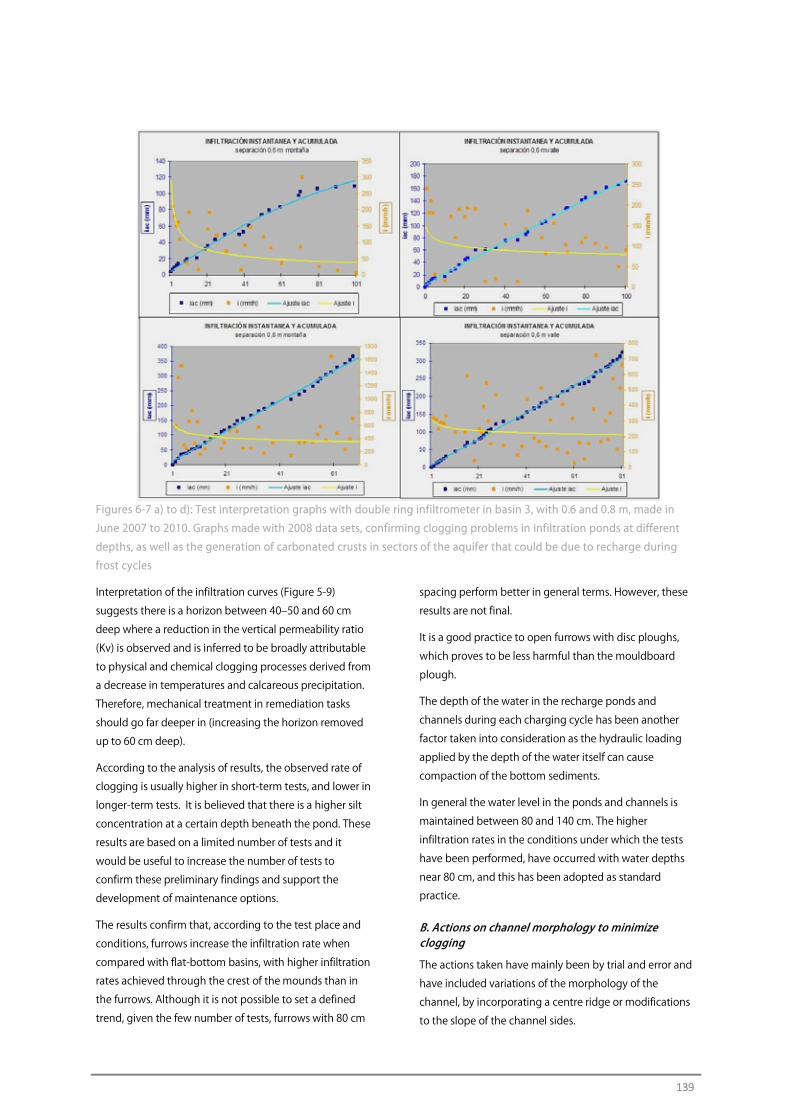
139
Figures 6-7 a) to d): Test interpretation graphs with double ring infiltrometer in basin 3, with 0.6 and 0.8 m, made in
June 2007 to 2010. Graphs made with 2008 data sets, confirming clogging problems in infiltration ponds at different
depths, as well as the generation of carbonated crusts in sectors of the aquifer that could be due to recharge during
frost cycles
Interpretation of the infiltration curves (Figure 5-9)
suggests there is a horizon between 40‒50 and 60 cm
deep where a reduction in the vertical permeability ratio
(Kv) is observed and is inferred to be broadly attributable
to physical and chemical clogging processes derived from
a decrease in temperatures and calcareous precipitation.
Therefore, mechanical treatment in remediation tasks
should go far deeper in (increasing the horizon removed
up to 60 cm deep).
According to the analysis of results, the observed rate of
clogging is usually higher in short-term tests, and lower in
longer-term tests. It is believed that there is a higher silt
concentration at a certain depth beneath the pond. These
results are based on a limited number of tests and it
would be useful to increase the number of tests to
confirm these preliminary findings and support the
development of maintenance options.
The results confirm that, according to the test place and
conditions, furrows increase the infiltration rate when
compared with flat-bottom basins, with higher infiltration
rates achieved through the crest of the mounds than in
the furrows. Although it is not possible to set a defined
trend, given the few number of tests, furrows with 80 cm
spacing perform better in general terms. However, these
results are not final.
It is a good practice to open furrows with disc ploughs,
which proves to be less harmful than the mouldboard
plough.
The depth of the water in the recharge ponds and
channels during each charging cycle has been another
factor taken into consideration as the hydraulic loading
applied by the depth of the water itself can cause
compaction of the bottom sediments.
In general the water level in the ponds and channels is
maintained between 80 and 140 cm. The higher
infiltration rates in the conditions under which the tests
have been performed, have occurred with water depths
near 80 cm, and this has been adopted as standard
practice.
B. Actions on channel morphology to minimize clogging
The actions taken have mainly been by trial and error and
have included variations of the morphology of the
channel, by incorporating a centre ridge or modifications
to the slope of the channel sides.
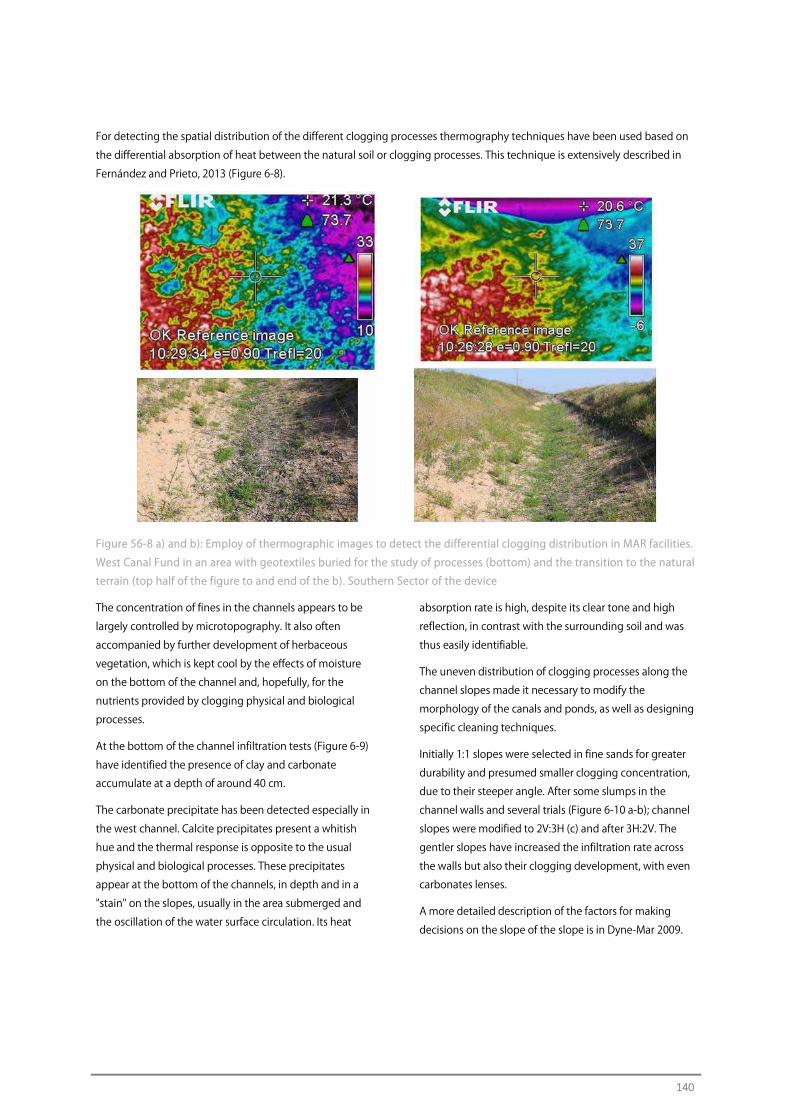
140
For detecting the spatial distribution of the different clogging processes thermography techniques have been used based on
the differential absorption of heat between the natural soil or clogging processes. This technique is extensively described in
Fernández and Prieto, 2013 (Figure 6-8).
Figure 56-8 a) and b): Employ of thermographic images to detect the differential clogging distribution in MAR facilities.
West Canal Fund in an area with geotextiles buried for the study of processes (bottom) and the transition to the natural
terrain (top half of the figure to and end of the b). Southern Sector of the device
The concentration of fines in the channels appears to be
largely controlled by microtopography. It also often
accompanied by further development of herbaceous
vegetation, which is kept cool by the effects of moisture
on the bottom of the channel and, hopefully, for the
nutrients provided by clogging physical and biological
processes.
At the bottom of the channel infiltration tests (Figure 6-9)
have identified the presence of clay and carbonate
accumulate at a depth of around 40 cm.
The carbonate precipitate has been detected especially in
the west channel. Calcite precipitates present a whitish
hue and the thermal response is opposite to the usual
physical and biological processes. These precipitates
appear at the bottom of the channels, in depth and in a
"stain" on the slopes, usually in the area submerged and
the oscillation of the water surface circulation. Its heat
absorption rate is high, despite its clear tone and high
reflection, in contrast with the surrounding soil and was
thus easily identifiable.
The uneven distribution of clogging processes along the
channel slopes made it necessary to modify the
morphology of the canals and ponds, as well as designing
specific cleaning techniques.
Initially 1:1 slopes were selected in fine sands for greater
durability and presumed smaller clogging concentration,
due to their steeper angle. After some slumps in the
channel walls and several trials (Figure 6-10 a-b); channel
slopes were modified to 2V:3H (c) and after 3H:2V. The
gentler slopes have increased the infiltration rate across
the walls but also their clogging development, with even
carbonates lenses.
A more detailed description of the factors for making
decisions on the slope of the slope is in Dyne-Mar 2009.
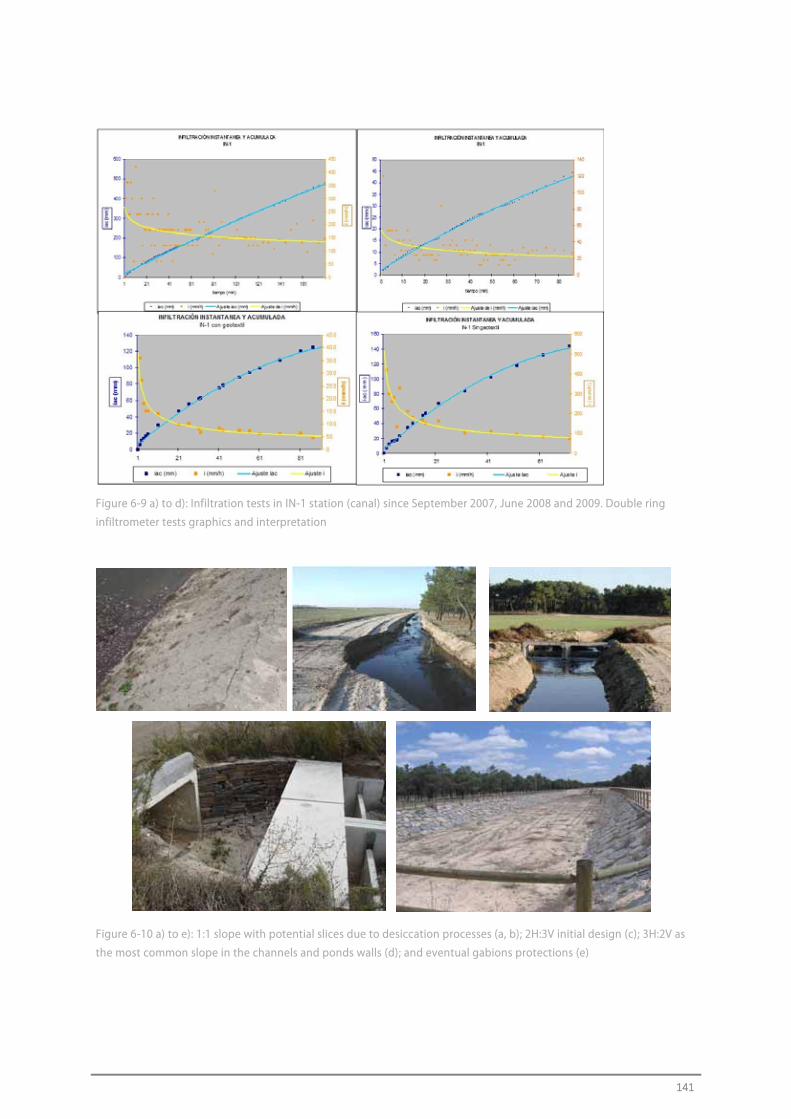
141
Figure 6-9 a) to d): Infiltration tests in IN-1 station (canal) since September 2007, June 2008 and 2009. Double ring
infiltrometer tests graphics and interpretation
Figure 6-10 a) to e): 1:1 slope with potential slices due to desiccation processes (a, b); 2H:3V initial design (c); 3H:2V as
the most common slope in the channels and ponds walls (d); and eventual gabions protections (e)
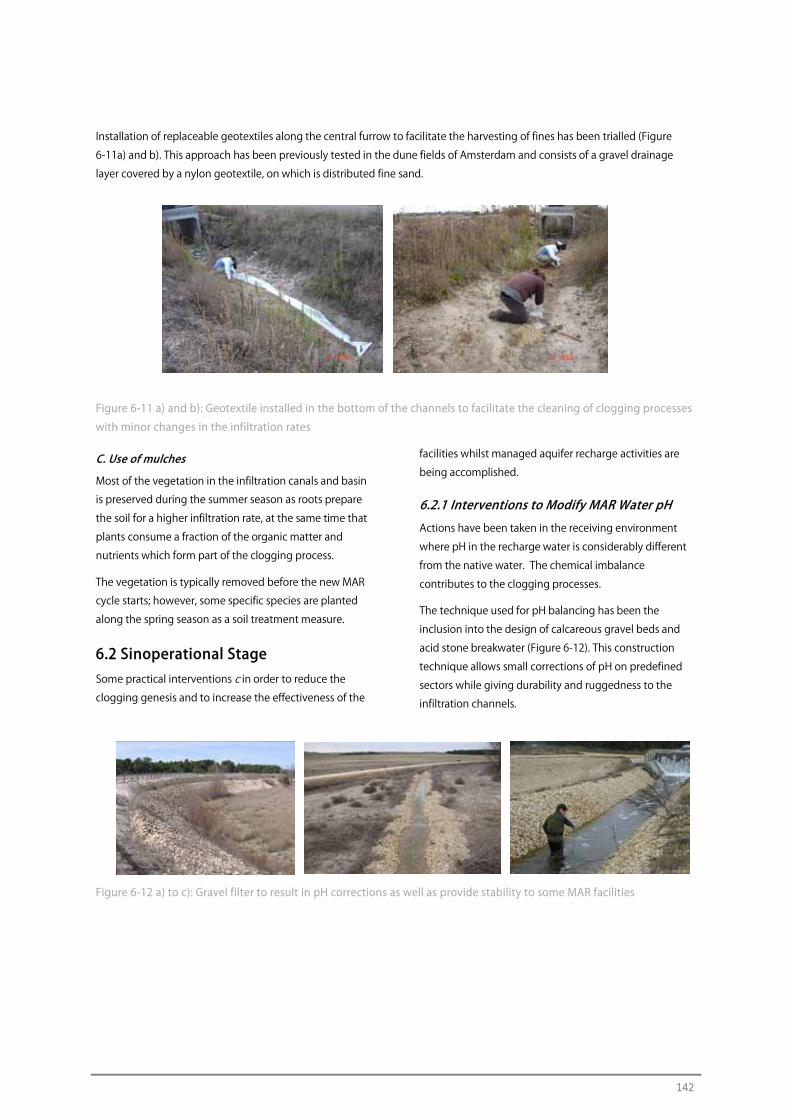
142
Installation of replaceable geotextiles along the central furrow to facilitate the harvesting of fines has been trialled (Figure
6-11a) and b). This approach has been previously tested in the dune fields of Amsterdam and consists of a gravel drainage
layer covered by a nylon geotextile, on which is distributed fine sand.
Figure 6-11 a) and b): Geotextile installed in the bottom of the channels to facilitate the cleaning of clogging processes
with minor changes in the infiltration rates
C. Use of mulches
Most of the vegetation in the infiltration canals and basin
is preserved during the summer season as roots prepare
the soil for a higher infiltration rate, at the same time that
plants consume a fraction of the organic matter and
nutrients which form part of the clogging process.
The vegetation is typically removed before the new MAR
cycle starts; however, some specific species are planted
along the spring season as a soil treatment measure.
6.2 Sinoperational Stage Some practical interventions c in order to reduce the clogging genesis and to increase the effectiveness of the
facilities whilst managed aquifer recharge activities are
being accomplished.
6.2.1 Interventions to Modify MAR Water pH
Actions have been taken in the receiving environment
where pH in the recharge water is considerably different
from the native water. The chemical imbalance
contributes to the clogging processes.
The technique used for pH balancing has been the
inclusion into the design of calcareous gravel beds and
acid stone breakwater (Figure 6-12). This construction
technique allows small corrections of pH on predefined
sectors while giving durability and ruggedness to the
infiltration channels.
Figure 6-12 a) to c): Gravel filter to result in pH corrections as well as provide stability to some MAR facilities
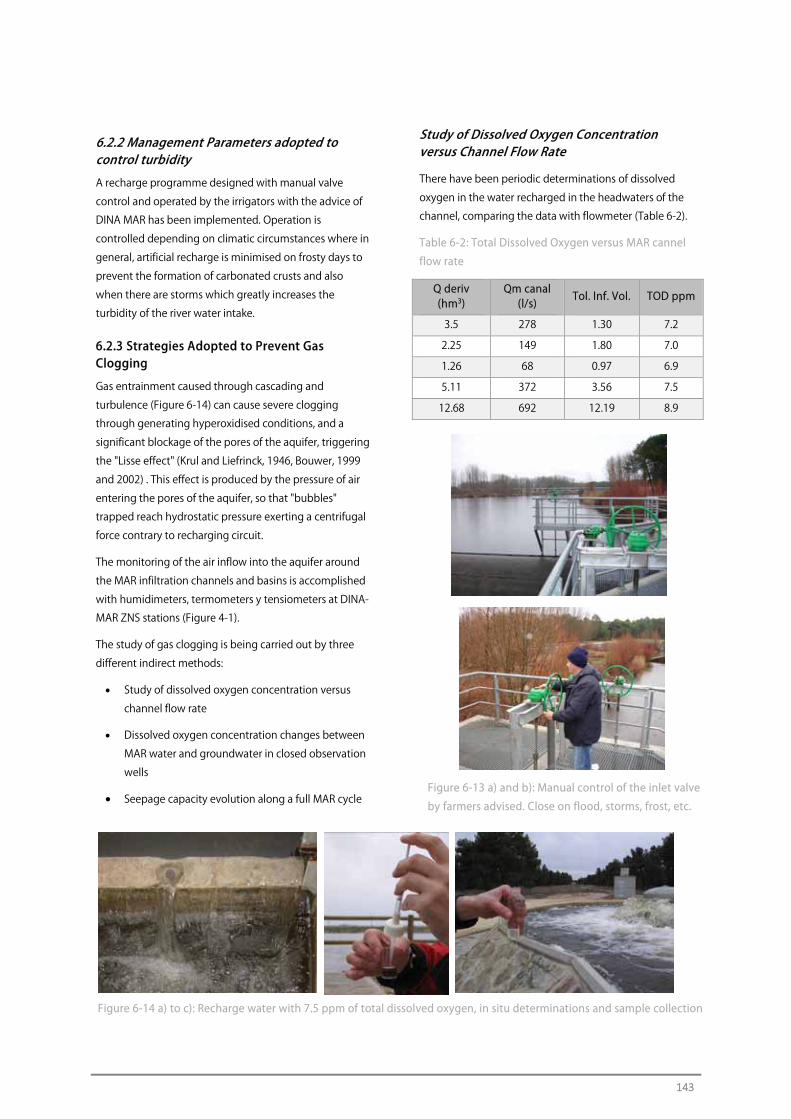
143
6.2.2 Management Parameters adopted to control turbidity
A recharge programme designed with manual valve
control and operated by the irrigators with the advice of
DINA MAR has been implemented. Operation is
controlled depending on climatic circumstances where in
general, artificial recharge is minimised on frosty days to
prevent the formation of carbonated crusts and also
when there are storms which greatly increases the
turbidity of the river water intake.
6.2.3 Strategies Adopted to Prevent Gas Clogging
Gas entrainment caused through cascading and
turbulence (Figure 6-14) can cause severe clogging
through generating hyperoxidised conditions, and a
significant blockage of the pores of the aquifer, triggering
the "Lisse effect" (Krul and Liefrinck, 1946, Bouwer, 1999
and 2002) . This effect is produced by the pressure of air
entering the pores of the aquifer, so that "bubbles"
trapped reach hydrostatic pressure exerting a centrifugal
force contrary to recharging circuit.
The monitoring of the air inflow into the aquifer around
the MAR infiltration channels and basins is accomplished
with humidimeters, termometers y tensiometers at DINA-
MAR ZNS stations (Figure 4-1).
The study of gas clogging is being carried out by three
different indirect methods:
• Study of dissolved oxygen concentration versus
channel flow rate
• Dissolved oxygen concentration changes between
MAR water and groundwater in closed observation
wells
• Seepage capacity evolution along a full MAR cycle
Study of Dissolved Oxygen Concentration versus Channel Flow Rate
There have been periodic determinations of dissolved
oxygen in the water recharged in the headwaters of the
channel, comparing the data with flowmeter (Table 6-2).
Table 6-2: Total Dissolved Oxygen versus MAR cannel
flow rate
Q deriv (hm3)
Qm canal (l/s)
Tol. Inf. Vol. TOD ppm
3.5 278 1.30 7.2
2.25 149 1.80 7.0
1.26 68 0.97 6.9
5.11 372 3.56 7.5
12.68 692 12.19 8.9
Figure 6-14 a) to c): Recharge water with 7.5 ppm of total dissolved oxygen, in situ determinations and sample collection
Figure 6-13 a) and b): Manual control of the inlet valve
by farmers advised. Close on flood, storms, frost, etc.
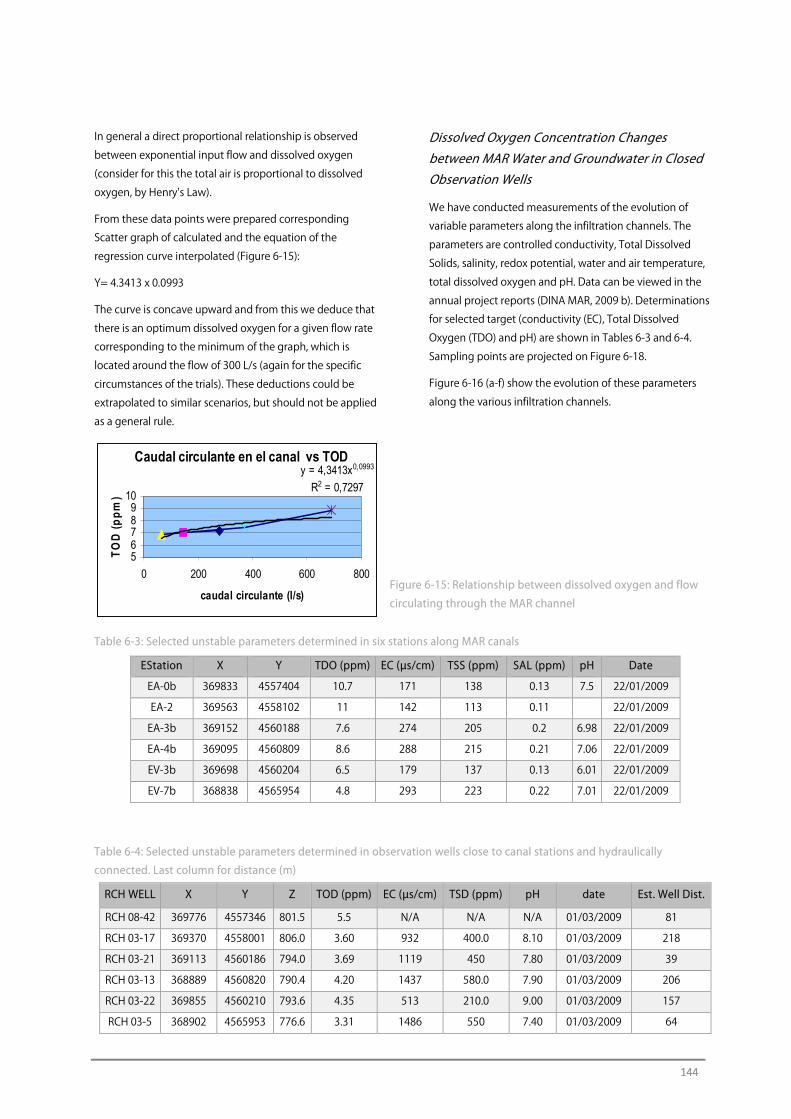
144
In general a direct proportional relationship is observed
between exponential input flow and dissolved oxygen
(consider for this the total air is proportional to dissolved
oxygen, by Henry's Law).
From these data points were prepared corresponding
Scatter graph of calculated and the equation of the
regression curve interpolated (Figure 6-15):
Y= 4.3413 x 0.0993
The curve is concave upward and from this we deduce that
there is an optimum dissolved oxygen for a given flow rate
corresponding to the minimum of the graph, which is
located around the flow of 300 L/s (again for the specific
circumstances of the trials). These deductions could be
extrapolated to similar scenarios, but should not be applied
as a general rule.
Dissolved Oxygen Concentration Changes between MAR Water and Groundwater in Closed Observation Wells
We have conducted measurements of the evolution of
variable parameters along the infiltration channels. The
parameters are controlled conductivity, Total Dissolved
Solids, salinity, redox potential, water and air temperature,
total dissolved oxygen and pH. Data can be viewed in the
annual project reports (DINA MAR, 2009 b). Determinations
for selected target (conductivity (EC), Total Dissolved
Oxygen (TDO) and pH) are shown in Tables 6-3 and 6-4.
Sampling points are projected on Figure 6-18.
Figure 6-16 (a-f) show the evolution of these parameters
along the various infiltration channels.
EStation X Y TDO (ppm) EC (µs/cm) TSS (ppm) SAL (ppm) pH Date
EA-0b 369833 4557404 10.7 171 138 0.13 7.5 22/01/2009
EA-2 369563 4558102 11 142 113 0.11 22/01/2009
EA-3b 369152 4560188 7.6 274 205 0.2 6.98 22/01/2009
EA-4b 369095 4560809 8.6 288 215 0.21 7.06 22/01/2009
EV-3b 369698 4560204 6.5 179 137 0.13 6.01 22/01/2009
EV-7b 368838 4565954 4.8 293 223 0.22 7.01 22/01/2009
RCH WELL X Y Z TOD (ppm) EC (µs/cm) TSD (ppm) pH date Est. Well Dist.
RCH 08-42 369776 4557346 801.5 5.5 N/A N/A N/A 01/03/2009 81
RCH 03-17 369370 4558001 806.0 3.60 932 400.0 8.10 01/03/2009 218
RCH 03-21 369113 4560186 794.0 3.69 1119 450 7.80 01/03/2009 39
RCH 03-13 368889 4560820 790.4 4.20 1437 580.0 7.90 01/03/2009 206
RCH 03-22 369855 4560210 793.6 4.35 513 210.0 9.00 01/03/2009 157
RCH 03-5 368902 4565953 776.6 3.31 1486 550 7.40 01/03/2009 64
Caudal circulante en el canal vs TOD y = 4,3413x0,0993
R2 = 0,7297
56789
10
0 200 400 600 800
caudal circulante (l/s)
TO
D (
pp
m)
Table 6-3: Selected unstable parameters determined in six stations along MAR canals
Table 6-4: Selected unstable parameters determined in observation wells close to canal stations and hydraulically
connected. Last column for distance (m)
Figure 6-15: Relationship between dissolved oxygen and flow
circulating through the MAR channel
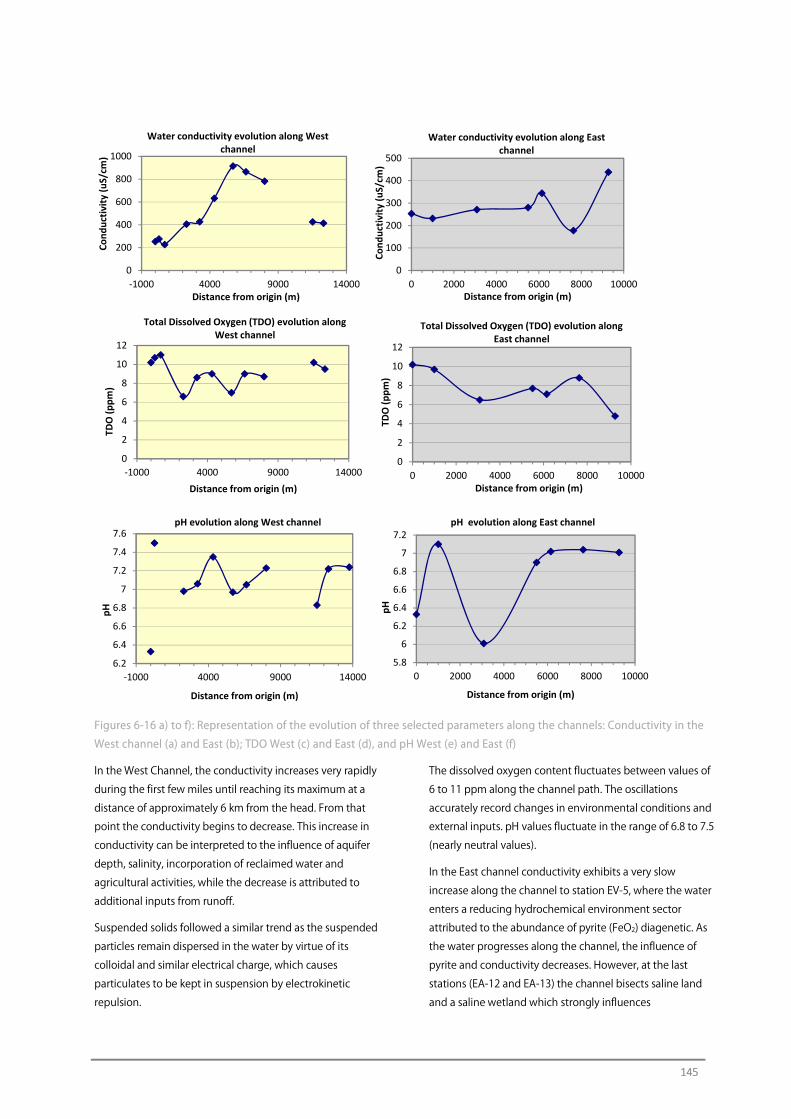
145
Figures 6-16 a) to f): Representation of the evolution of three selected parameters along the channels: Conductivity in the
West channel (a) and East (b); TDO West (c) and East (d), and pH West (e) and East (f)
In the West Channel, the conductivity increases very rapidly
during the first few miles until reaching its maximum at a
distance of approximately 6 km from the head. From that
point the conductivity begins to decrease. This increase in
conductivity can be interpreted to the influence of aquifer
depth, salinity, incorporation of reclaimed water and
agricultural activities, while the decrease is attributed to
additional inputs from runoff.
Suspended solids followed a similar trend as the suspended
particles remain dispersed in the water by virtue of its
colloidal and similar electrical charge, which causes
particulates to be kept in suspension by electrokinetic
repulsion.
The dissolved oxygen content fluctuates between values of
6 to 11 ppm along the channel path. The oscillations
accurately record changes in environmental conditions and
external inputs. pH values fluctuate in the range of 6.8 to 7.5
(nearly neutral values).
In the East channel conductivity exhibits a very slow
increase along the channel to station EV-5, where the water
enters a reducing hydrochemical environment sector
attributed to the abundance of pyrite (FeO2) diagenetic. As
the water progresses along the channel, the influence of
pyrite and conductivity decreases. However, at the last
stations (EA-12 and EA-13) the channel bisects saline land
and a saline wetland which strongly influences
0
200
400
600
800
1000
-1000 4000 9000 14000
Cond
uctiv
ity (u
S/cm
)
Distance from origin (m)
Water conductivity evolution along West channel
0
100
200
300
400
500
0 2000 4000 6000 8000 10000
Cond
uctiv
ity (u
S/cm
)
Distance from origin (m)
Water conductivity evolution along East channel
0
2
4
6
8
10
12
-1000 4000 9000 14000
TDO
(ppm
)
Distance from origin (m)
Total Dissolved Oxygen (TDO) evolution along West channel
0
2
4
6
8
10
12
0 2000 4000 6000 8000 10000
TDO
(ppm
)
Distance from origin (m)
Total Dissolved Oxygen (TDO) evolution along East channel
6.2
6.4
6.6
6.8
7
7.2
7.4
7.6
-1000 4000 9000 14000
pH
Distance from origin (m)
pH evolution along West channel
5.8
6
6.2
6.4
6.6
6.8
7
7.2
0 2000 4000 6000 8000 10000
pH
Distance from origin (m)
pH evolution along East channel
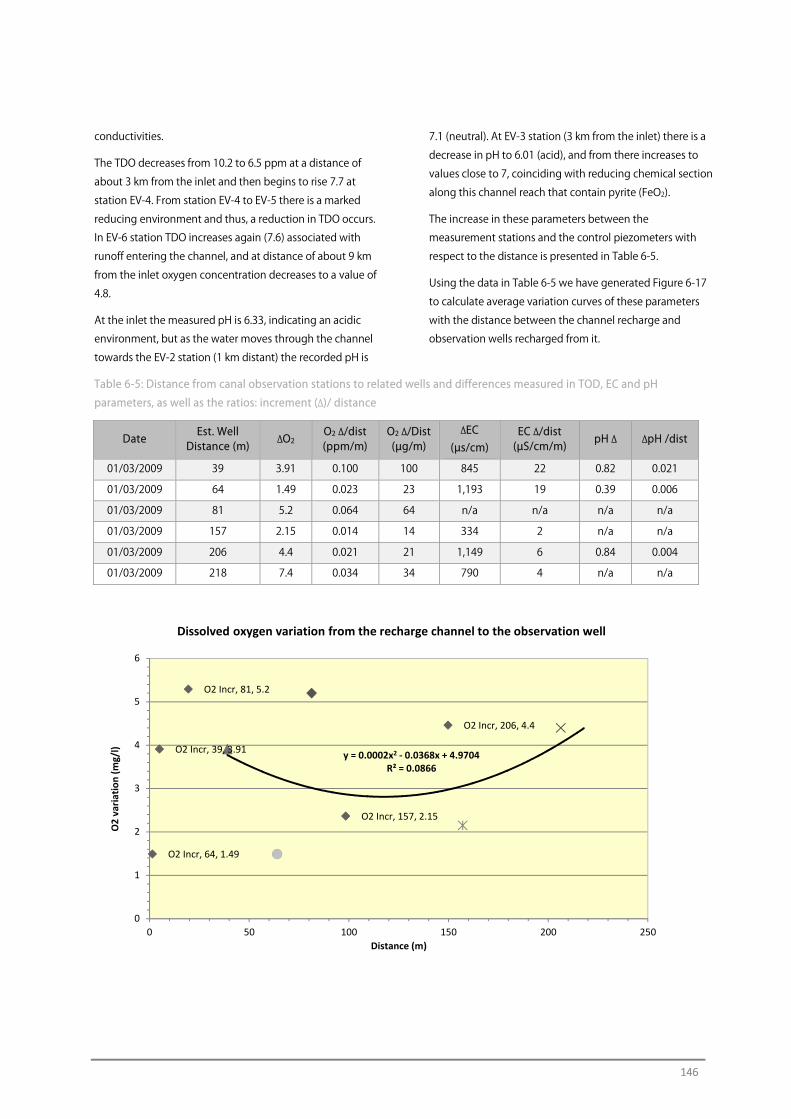
146
conductivities.
The TDO decreases from 10.2 to 6.5 ppm at a distance of
about 3 km from the inlet and then begins to rise 7.7 at
station EV-4. From station EV-4 to EV-5 there is a marked
reducing environment and thus, a reduction in TDO occurs.
In EV-6 station TDO increases again (7.6) associated with
runoff entering the channel, and at distance of about 9 km
from the inlet oxygen concentration decreases to a value of
4.8.
At the inlet the measured pH is 6.33, indicating an acidic
environment, but as the water moves through the channel
towards the EV-2 station (1 km distant) the recorded pH is
7.1 (neutral). At EV-3 station (3 km from the inlet) there is a
decrease in pH to 6.01 (acid), and from there increases to
values close to 7, coinciding with reducing chemical section
along this channel reach that contain pyrite (FeO2).
The increase in these parameters between the
measurement stations and the control piezometers with
respect to the distance is presented in Table 6-5.
Using the data in Table 6-5 we have generated Figure 6-17
to calculate average variation curves of these parameters
with the distance between the channel recharge and
observation wells recharged from it.
Table 6-5: Distance from canal observation stations to related wells and differences measured in TOD, EC and pH
parameters, as well as the ratios: increment (∆)/ distance
Date Est. Well
Distance (m) ∆O2
O2 ∆/dist (ppm/m)
O2 ∆/Dist (µg/m)
∆EC (µs/cm)
EC ∆/dist (µS/cm/m)
pH ∆ ∆pH /dist
01/03/2009 39 3.91 0.100 100 845 22 0.82 0.021
01/03/2009 64 1.49 0.023 23 1,193 19 0.39 0.006
01/03/2009 81 5.2 0.064 64 n/a n/a n/a n/a
01/03/2009 157 2.15 0.014 14 334 2 n/a n/a
01/03/2009 206 4.4 0.021 21 1,149 6 0.84 0.004
01/03/2009 218 7.4 0.034 34 790 4 n/a n/a
O2 Incr, 81, 5.2
O2 Incr, 39, 3.91
O2 Incr, 206, 4.4
O2 Incr, 157, 2.15
O2 Incr, 64, 1.49
y = 0.0002x2 - 0.0368x + 4.9704R² = 0.0866
0
1
2
3
4
5
6
0 50 100 150 200 250
O2
varia
tion
(mg/
l)
Distance (m)
Dissolved oxygen variation from the recharge channel to the observation well
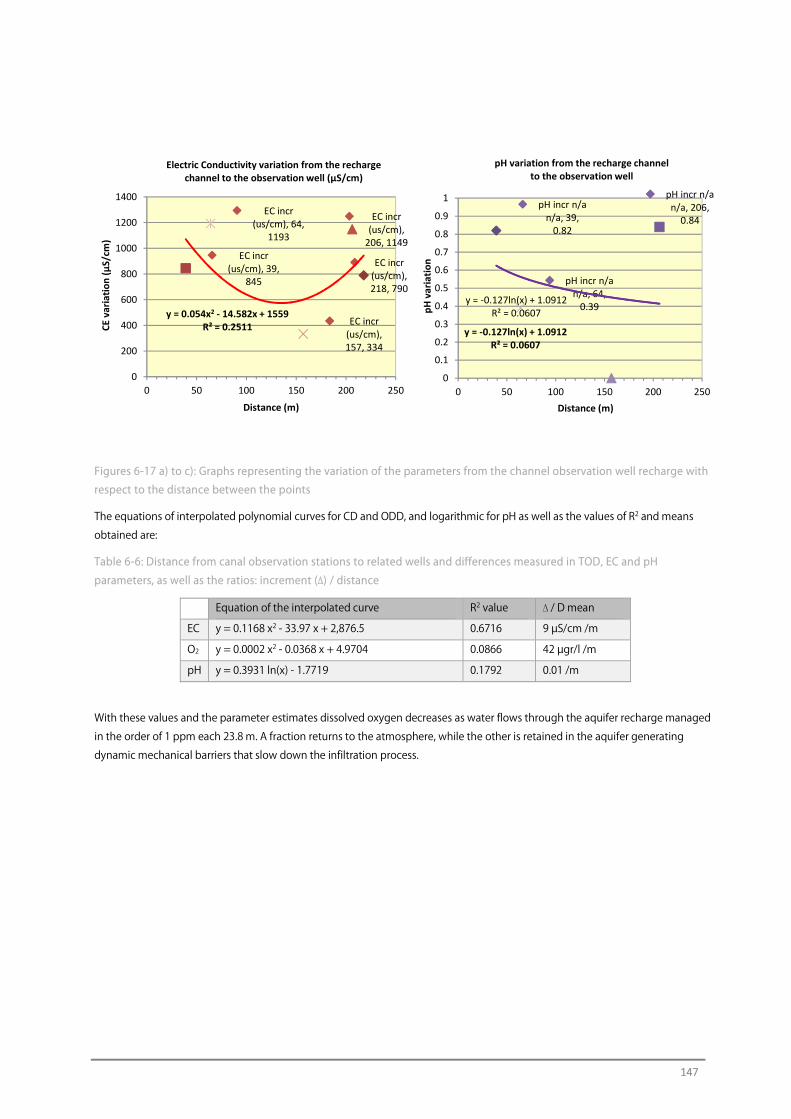
147
Figures 6-17 a) to c): Graphs representing the variation of the parameters from the channel observation well recharge with
respect to the distance between the points
The equations of interpolated polynomial curves for CD and ODD, and logarithmic for pH as well as the values of R2 and means
obtained are:
Table 6-6: Distance from canal observation stations to related wells and differences measured in TOD, EC and pH
parameters, as well as the ratios: increment (∆) / distance
Equation of the interpolated curve R2 value ∆ / D mean
EC y = 0.1168 x2 - 33.97 x + 2,876.5 0.6716 9 µS/cm /m
O2 y = 0.0002 x2 - 0.0368 x + 4.9704 0.0866 42 µgr/l /m
pH y = 0.3931 ln(x) - 1.7719 0.1792 0.01 /m
With these values and the parameter estimates dissolved oxygen decreases as water flows through the aquifer recharge managed
in the order of 1 ppm each 23.8 m. A fraction returns to the atmosphere, while the other is retained in the aquifer generating
dynamic mechanical barriers that slow down the infiltration process.
EC incr(us/cm), 218, 790
EC incr(us/cm), 39,
845
EC incr(us/cm),
206, 1149
EC incr(us/cm), 157, 334
EC incr(us/cm), 64,
1193
y = 0.054x2 - 14.582x + 1559R² = 0.2511
0
200
400
600
800
1000
1200
1400
0 50 100 150 200 250
CE v
aria
tion
(µS/
cm)
Distance (m)
Electric Conductivity variation from the recharge channel to the observation well (µS/cm)
pH incr n/a n/a, 39,
0.82
pH incr n/a n/a, 206,
0.84
pH incr n/a n/a, 64,
0.39
y = -0.127ln(x) + 1.0912R² = 0.0607
y = -0.127ln(x) + 1.0912R² = 0.0607
0
0.1
0.2
0.3
0.4
0.5
0.6
0.7
0.8
0.9
1
0 50 100 150 200 250
pH v
aria
tion
Distance (m)
pH variation from the recharge channel to the observation well
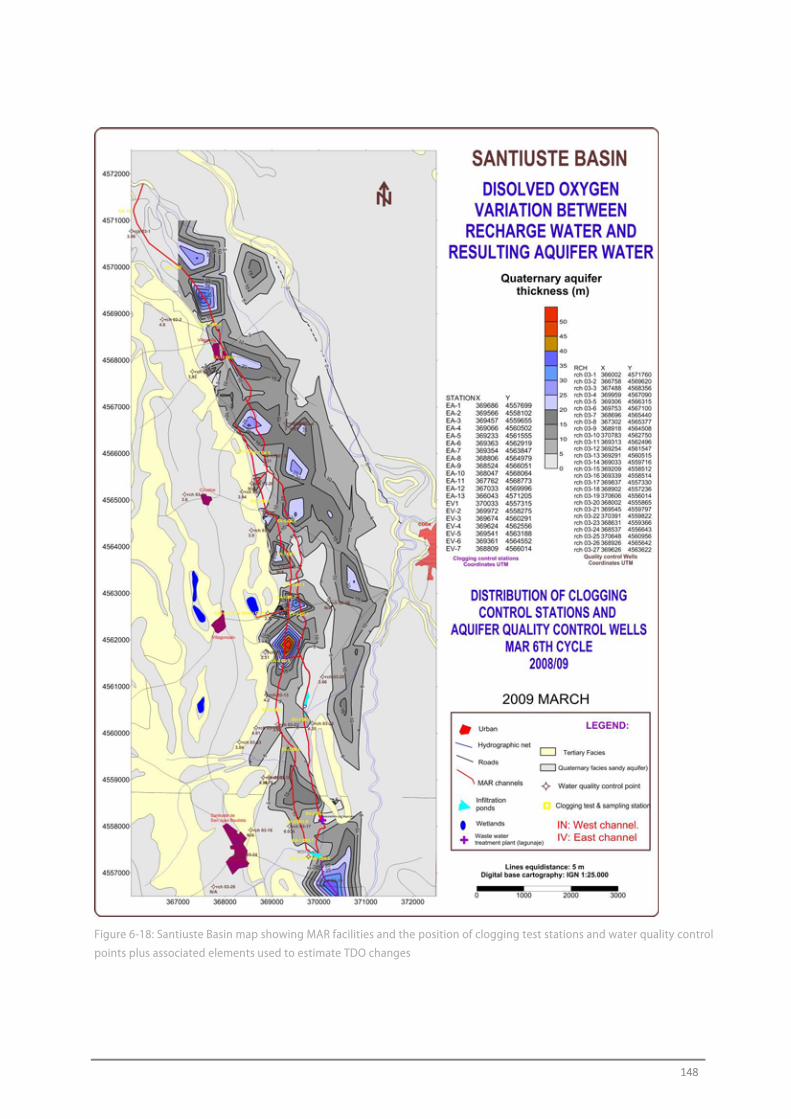
148
Figure 6-18: Santiuste Basin map showing MAR facilities and the position of clogging test stations and water quality control
points plus associated elements used to estimate TDO changes
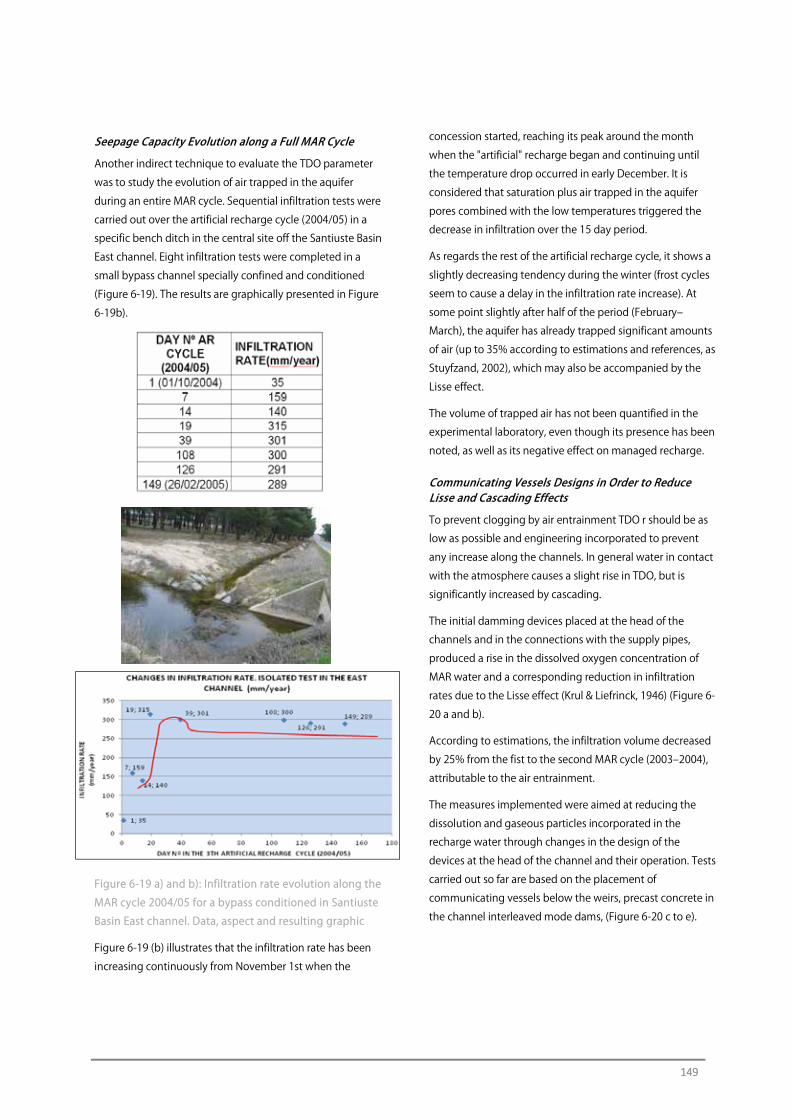
149
Seepage Capacity Evolution along a Full MAR Cycle
Another indirect technique to evaluate the TDO parameter
was to study the evolution of air trapped in the aquifer
during an entire MAR cycle. Sequential infiltration tests were
carried out over the artificial recharge cycle (2004/05) in a
specific bench ditch in the central site off the Santiuste Basin
East channel. Eight infiltration tests were completed in a
small bypass channel specially confined and conditioned
(Figure 6-19). The results are graphically presented in Figure
6-19b).
Figure 6-19 a) and b): Infiltration rate evolution along the
MAR cycle 2004/05 for a bypass conditioned in Santiuste
Basin East channel. Data, aspect and resulting graphic
Figure 6-19 (b) illustrates that the infiltration rate has been
increasing continuously from November 1st when the
concession started, reaching its peak around the month
when the "artificial" recharge began and continuing until
the temperature drop occurred in early December. It is
considered that saturation plus air trapped in the aquifer
pores combined with the low temperatures triggered the
decrease in infiltration over the 15 day period.
As regards the rest of the artificial recharge cycle, it shows a
slightly decreasing tendency during the winter (frost cycles
seem to cause a delay in the infiltration rate increase). At
some point slightly after half of the period (February‒
March), the aquifer has already trapped significant amounts
of air (up to 35% according to estimations and references, as
Stuyfzand, 2002), which may also be accompanied by the
Lisse effect.
The volume of trapped air has not been quantified in the
experimental laboratory, even though its presence has been
noted, as well as its negative effect on managed recharge.
Communicating Vessels Designs in Order to Reduce Lisse and Cascading Effects
To prevent clogging by air entrainment TDO r should be as
low as possible and engineering incorporated to prevent
any increase along the channels. In general water in contact
with the atmosphere causes a slight rise in TDO, but is
significantly increased by cascading.
The initial damming devices placed at the head of the
channels and in the connections with the supply pipes,
produced a rise in the dissolved oxygen concentration of
MAR water and a corresponding reduction in infiltration
rates due to the Lisse effect (Krul & Liefrinck, 1946) (Figure 6-
20 a and b).
According to estimations, the infiltration volume decreased
by 25% from the fist to the second MAR cycle (2003‒2004),
attributable to the air entrainment.
The measures implemented were aimed at reducing the
dissolution and gaseous particles incorporated in the
recharge water through changes in the design of the
devices at the head of the channel and their operation. Tests
carried out so far are based on the placement of
communicating vessels below the weirs, precast concrete in
the channel interleaved mode dams, (Figure 6-20 c to e).
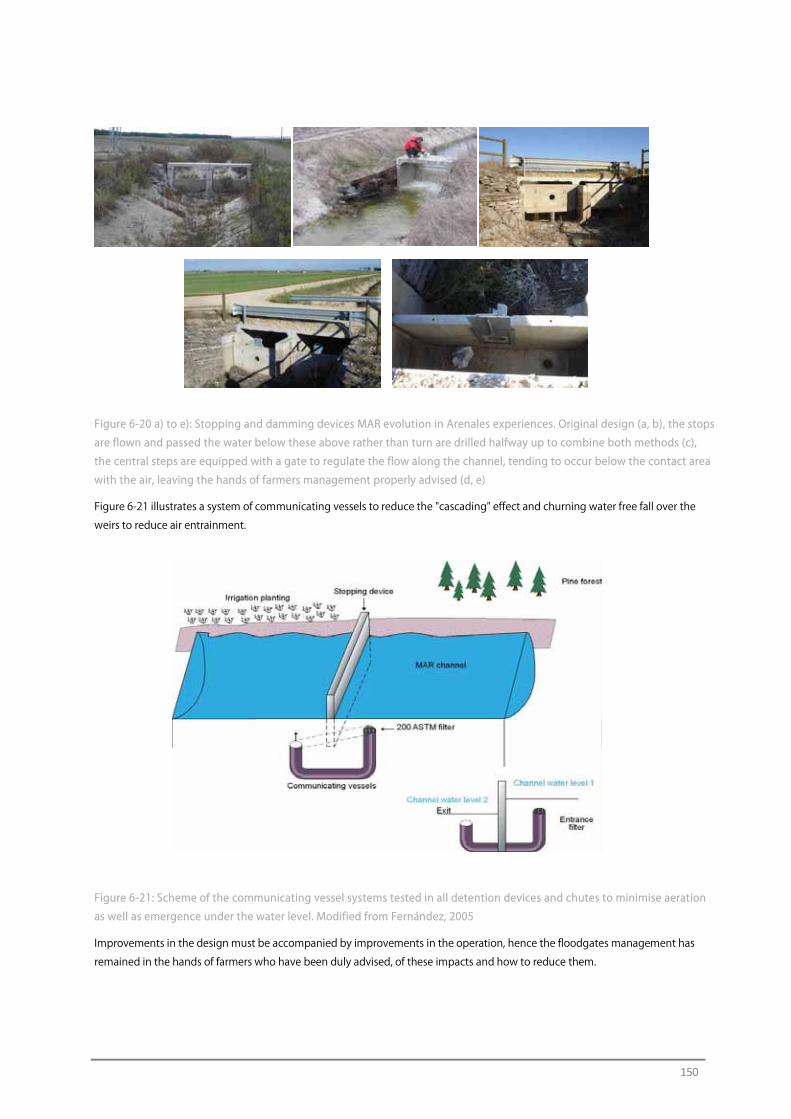
150
Figure 6-20 a) to e): Stopping and damming devices MAR evolution in Arenales experiences. Original design (a, b), the stops
are flown and passed the water below these above rather than turn are drilled halfway up to combine both methods (c),
the central steps are equipped with a gate to regulate the flow along the channel, tending to occur below the contact area
with the air, leaving the hands of farmers management properly advised (d, e)
Figure 6-21 illustrates a system of communicating vessels to reduce the "cascading" effect and churning water free fall over the
weirs to reduce air entrainment.
Figure 6-21: Scheme of the communicating vessel systems tested in all detention devices and chutes to minimise aeration
as well as emergence under the water level. Modified from Fernández, 2005
Improvements in the design must be accompanied by improvements in the operation, hence the floodgates management has
remained in the hands of farmers who have been duly advised, of these impacts and how to reduce them.
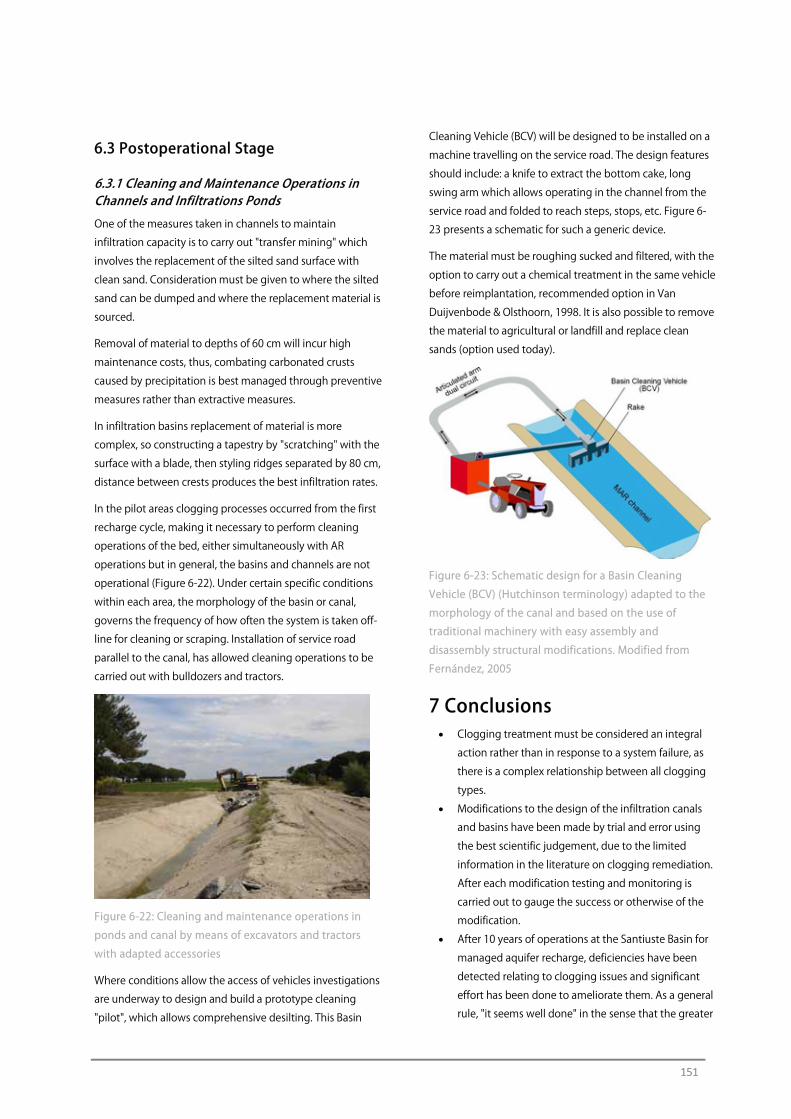
151
6.3 Postoperational Stage
6.3.1 Cleaning and Maintenance Operations in Channels and Infiltrations Ponds One of the measures taken in channels to maintain
infiltration capacity is to carry out "transfer mining" which
involves the replacement of the silted sand surface with
clean sand. Consideration must be given to where the silted
sand can be dumped and where the replacement material is
sourced.
Removal of material to depths of 60 cm will incur high
maintenance costs, thus, combating carbonated crusts
caused by precipitation is best managed through preventive
measures rather than extractive measures.
In infiltration basins replacement of material is more
complex, so constructing a tapestry by "scratching" with the
surface with a blade, then styling ridges separated by 80 cm,
distance between crests produces the best infiltration rates.
In the pilot areas clogging processes occurred from the first
recharge cycle, making it necessary to perform cleaning
operations of the bed, either simultaneously with AR
operations but in general, the basins and channels are not
operational (Figure 6-22). Under certain specific conditions
within each area, the morphology of the basin or canal,
governs the frequency of how often the system is taken off-
line for cleaning or scraping. Installation of service road
parallel to the canal, has allowed cleaning operations to be
carried out with bulldozers and tractors.
Figure 6-22: Cleaning and maintenance operations in
ponds and canal by means of excavators and tractors
with adapted accessories
Where conditions allow the access of vehicles investigations
are underway to design and build a prototype cleaning
"pilot", which allows comprehensive desilting. This Basin
Cleaning Vehicle (BCV) will be designed to be installed on a
machine travelling on the service road. The design features
should include: a knife to extract the bottom cake, long
swing arm which allows operating in the channel from the
service road and folded to reach steps, stops, etc. Figure 6-
23 presents a schematic for such a generic device.
The material must be roughing sucked and filtered, with the
option to carry out a chemical treatment in the same vehicle
before reimplantation, recommended option in Van
Duijvenbode & Olsthoorn, 1998. It is also possible to remove
the material to agricultural or landfill and replace clean
sands (option used today).
Figure 6-23: Schematic design for a Basin Cleaning
Vehicle (BCV) (Hutchinson terminology) adapted to the
morphology of the canal and based on the use of
traditional machinery with easy assembly and
disassembly structural modifications. Modified from
Fernández, 2005
7 Conclusions • Clogging treatment must be considered an integral
action rather than in response to a system failure, as
there is a complex relationship between all clogging
types.
• Modifications to the design of the infiltration canals
and basins have been made by trial and error using
the best scientific judgement, due to the limited
information in the literature on clogging remediation.
After each modification testing and monitoring is
carried out to gauge the success or otherwise of the
modification.
• After 10 years of operations at the Santiuste Basin for
managed aquifer recharge, deficiencies have been
detected relating to clogging issues and significant
effort has been done to ameliorate them. As a general
rule, "it seems well done" in the sense that the greater

152
the MAR canal or basin efficiency, the smaller is the
clogging development. Many of these are being
resolved by adopting SAT techniques, new structural
designs, management parameters or governance
changes The preferred working method consists of a
series of problem-solution pairs.
• The majority of impacts detected correspond to
clogging processes (greater scale and intensity),
excessive fine particles, insufficient pre-treatment and
intake of air into the aquifer from the recharge water.
• The design changes and management parameters
must be created “a la carte”, depending on the
intricacies, climate and characteristics of each system.
• A vast list of actions has been proposed with the
primary objective of presenting a series of options to
be considered when implementing a solution for a
problem that affects the superficial type of recharge
management mechanisms or injection wells
(corollary), as an instrument for decision making.
• Pre-treatment is consolidated as the most effective
alternative for the correct operation of the canals and
basins to prolong their efficiency and average service
life, as long as cleaning and maintenance operations
are continued at appropriate intervals.
• To minimize clogging, pretreatment and maintenance
of the canals and basins, combinations of filter gravel,
pebbles and sand combined with metal and plastic
filters have been employed and have yielded good
results.
• The downward trend in channel infiltration rates has
been reduced by applying flow control techniques (at
flow rates below 300 L/s), fine filtering and air
reduction in the recharge water.
• The pH of the recharge water is neutralized by
interaction with rocks opposite areas along the
channels where reactive soils have been identified to
provide pH buffering. Although changes are modest,
the results are good in general.
• The gas binding is a large-scale impact and intensity.
The recharged water from canals is losing about
1 ppm of dissolved oxygen circulate through the
aquifer after 25 m in the horizontal. Much of this
increase is trapped in the pores of the aquifer. It is
advisable to recharge t at slow rates, since air entering
the aquifer occupies about 25% of the temporarily
effective porosity (estimated by indirect methods)..
• Communicating vessels have been incorporated into
designs to minimise water cascading, sand filters and
buried channel sections with pipe filters are delivering
good outcomes.
• Manual control valve placed on the inlet to the
channels that are operated by farmers, supported by
continuous technical advice from DINA MAR, is giving
progressively better infiltration results. It is minimising
the volume of artificial recharge cycles during frosts
and prevents high turbidity water from entering the
scheme.
• The gradients of the slopes of the channel walls, after
trialling with 1:1 and 2:3, we have opted for the
stability of the 3:2, provided that there is sufficient
space. Where slopes cannot be installed at 3:2
gradients riprap walls are installed to prevent bank
erosion of the canal walls.
• Furrowing ridges on the bottom of the basins and
canals doubled the infiltration rate. After trial and
error it was found that the optimum distance between
ridge crests to maximise infiltration rates was 80 cm
with an equal depth (80 cm) of water above the base
of the channel or basin bed.
• A design aspect must be added to operational costs
for cleaning and maintenance "on demand" for each
canal or basin case.
• The proposed generic prototypes for basin and canal
design require further development to meet the
criteria, which basically are: minimize losses
(evapotranspiration, clogging, etc.). The designs
should provide ease of access for desilting, and
reduced transportation costs to dispose of spoil
removed.
• The initiated looping process (trial and error) is open.
Each improvement becomes a new element to
improve upon. That is why any modifications must be
complemented with ongoing monitoring to evaluate
the success or otherwise of the modification and allow
adoption of the best methods.
• It should be noted that one drawback of this approach
is that the outcomes are slow since the reaction to
any immediate action sometimes takes years to assess
its effectiveness. The effectiveness of any action may
also potentially be masked by other factors that come
153
into play as a consequence of the change.
Consequently, sedimentation studies require large
doses of "patience" and high "hydroimagination" as
solutions can often be outside the traditional realms
of thinking.
• Consideration of climate change and possible adverse
effects, has added a ‘new’ variable into the mix which
also requires management.
8 Acknowledgements The mentioned tasks and the article itself have been carried
out and written within the framework of R&D DINA-MAR
project, www.dina-mar.es, code 30/13.053, financed by
Tragsa Group and the help of Santiuste and Carracillo
Irrigation communities as well as Guadiana water basin
authorities (CHG).
9 References Blaxejewski, M,. (1979) Gases in the ground and their effect
during artificial recharge of groundwater Int. Symp. On
Artificial Groundwater Recharge. Dortmund. Vol IV, paper VI.
4. DVWK, Bull. 14. Verlag Paul Parey. Hamburg-Berlín, pg. 59-
70.
Bouwer, H., (1999) Artificial recharge of groundwater:
Systems, design, and management. In: Mays LW (ed.)
Hydraulic design handbook. McGraw-Hill, New York, pg
24.1‒24.44
Bouwer, H., (2002) Artificial recharge of groundwater:
hydrogeology and engineering. Hidrogeology Journal,
Volume 10, nº 2, April 2002.
Custodio Gimena, E., (1986) Recarga artificial de acuíferos.
Boletín de Informaciones y Estudios, nº 45. Servicio
Geológico, Ministerio de Obras Públicas y Urbanismo
(MOPU). Madrid. 148 pg.
Custodio Gimena, E., (2013) Groundwater governance.
Synthesis of thematic papers/case studies. Preparing the
ground for Regional Consultations and Global Diagnosis
Report. GEF-FAO Groundwater Governance. Thematic Paper
1.
Denudt, H., and Ricour, J., (1990) Vieillissement du parc de
forages et conditions d'abandon des ouvrages de
production d'eau dans la Region Nord Pas de Calais. Ann.
Soc. Géol. Nord. CIX. B.R.G.M. France.
Dillon, P., Fernández, E., and Twinhof, A., (2012)
Management of recharge/discharge processes and aquifer
equilibrium states. GEF-FAO Groundwater Governance. T.P.
4. In
http://www.groundwatergovernance.org/resources/themat
ic-papers/en/.
DINA-MAR (2010) Gestión de la recarga artificial de acuíferos
en el marco del desarrollo sostenible. November 2010. ISBN
978-84-614-5123-4, 496 pg.
Driscoll, (1987) Groundwater & Wells. Johnson div. Publ. S.
Paul, Minnesota. USA.
Fernández Escalante, E., (2005) Recarga artificial de acuíferos
en cuencas fluviales. Aspectos cualitativos y
medioambientales. Criterios técnicos derivados de la
experiencia en la Cubeta de Santiuste, Segovia. Thesys.
Universidad Complutense de Madrid. ISBN 13: 978-84-669-
2800-7.
Fernández Escalante, E., (2006) Técnicas de tratamiento de
suelo y acuífero (S.A.T.) aplicadas a la gestión de la recarga
artificial. Serie Hidrogeología Hoy. Grafinat, Noviembre de
2006. http://www.metodografico.com/publicaciones.htm
Fernández Escalante, E., García Asensio, J.M. y Minaya
Ovejero, M.J., (2009) Propuestas para la detección y
corrección de impactos producidos por procesos
colmatantes en el dispositivo de recarga artificial de la
cubeta de Santiuste (Segovia). Boletín Geológico y Minero,
vol 120, nº 2, 2009. Pg. 215‒234.
Fernández Escalante, E., and García Merino, A., (2009)
Estudio sobre la evolución de la zona no saturada en las
inmediaciones de dispositivos de tipo superficial de gestión
de la recarga de acuíferos. Las estaciones DINA-MAR ZNS.
Estudios de la ZNS del suelo. Vol. IX, ZNS´09. Barcelona
2009. pg. 271‒280. ISBN: 978-84-96736-83-2.
Fernández Escalante, E., and Senent Del Álamo, M.W., (2009)
Implementation of Techniques for Soil and Aquifer
Treatment (SAT) in Spain. Contributions to the state of the
art. Achieving groundwater supply sustainability & reliability
through managed aquifer recharge. Proceedings book of
the symposium ISMAR 7. Abu Dhabi, 2009 October 9-13th.
IAH. Edited by DINA-MAR. pg 624‒631.
Fernández Escalante E., and San Sebastián Sauto, J., (2012)
Rechargeable sustainability. The key is the Storage. Book
written in Spanish and English. Ed. Tragsa. May 2012. ISBN:
13:978-84-615-8704-9. 126 pg.

154
Fernández Escalante E., and Prieto Leache, I., (2013) Los
procesos colmatantes en dispositivos de gestión de la
recarga de acuíferos y empleo de la termografía para su
detección y estudio. Un ensayo metodológico en el acuífero
Los Arenales, España. Número especial Geología Ambiental
del Boletín de la Sociedad Geológica Mexicana. Volume 65,
nº 1. SCI. Pg. 51‒69. 2013 April. ISSN 1405-3322.
Galán, R., López, F., Martínez, J., Macías, C., Galán, G., y Fdez.
Escalante, E., (2001) Recarga artificial del acuífero de los
Arenales en la comarca de El Carracillo (Segovia). Soporte
físico. VII Simposio de hidrogeología, AEH, Murcia.
García Rodríguez, M., y Llamas Madurga, R., (1992) Aspectos
hidrogeológicos en relación con la génesis y combustión
espontánea de las turbas de los Ojos del Guadiana. Actas del
III Congreso geológico de España. 1992 June. T-2. 285‒289
pp.
Gogolev, M., and Ostrander, M., (2000) Estimating
groundwater recharge with Visual HELP model Proceedings
of the IAH 2000 Congress in South Africa, Nov. 2000.
Healy, R., and Cook, P., (2002) Using groundwater levels to
estimate recharge. Hydrogeology Journal Vol 10, nº 1. Feb
2002. AIH-Springer.
Woodside, G., and Hutchinson, A., (2001) Use of shallow
probes to understand water level, temperature and water
quality changes directly beneath a large recharge facility.
Proceedings of the 10th Biennial Symposium on the
Artificial Recharge of Groundwater, Tucson, Arizona, June 7‒
9, 2001.
Ingebritsen, S., and Sanford, W., (1998) Groundwater in
Geologic Processes. Cambridge University Press.
Krul, W., and Liefrinck, F., (1946) Recent groundwater
investigations in the Netherlands. Monograph on the
progress of research in Holland. Elsevier, New York, 78 pp.
Langmuir, D., (1997) Aqueous environmental geochemistry.
Prentice Hall, 1997.
MAPA (2005) Asistencia técnica para el seguimiento y
modelización de la recarga artificial en la cubeta de
Santiuste de S. Juan Bautista (Segovia). DGDR-Tragsatec.
Martin, R., and Dillon, P.J., (2002) Aquifer Storage and
Recovery. Future directions for South Australia. Department
of water, Land and Biodiversity conservation. CSIRO Land
and Water. Report 2002/04. August 2002. Australia.
Olsthoorn, T.N., (1982) The clogging of recharge wells, main
subjects. KIWA-communications 72, WG on recharge wells
(Rijswijk, The Netherlands), 136 pp.
Pyne, D., (1995) Groundwater recharge and wells. A Guide to
Aquifer Storage Recovery. Lewis Publishers. CRC Press. Boca
Ratón, Florida, USA. 376 pp.
Ryan, J.N., y Elimelech, M., (1996) Colloid mobilization and
transport in groundwater. Colloids and Surfaces. A:
Physicochemical and Engineering Aspects, 107: 1‒56.
Schicht, R.J., and Walton, W.C., (1961) Hydrologic budgets
for three small watersheds in Illinois. Illinois State Water
Survey Rep Invest 40, 40 p.
Stuyfzand, P.J., (2002) Quantifying the hydrogeochemical
impact and sustainability of artificial recharge systems.
Management of Aquifer Recharge for Sustainability, Dillon,
P.J. (ed). Proceedings of ISAR 4, Adelaide, SA, Sept. 2002.
Balkema Publishers-AIH, The Netherlands.
Tragsatec (2010) Informe del registro óptico de vídeo-tv
realizado en sondeos de recarga en el Canal del Guadiana
(Ciudad Real). CHG-Tragsatec, 2010 February.
Van Beek, C., (1986) Clogging of discharge wells in the
Netherlands II: Causes and prevention. International
Symposium of biofouled aquifers: prevention and
restoration. American Water Works Association. Denver. P.
42‒56.
Van Duijvenbode, S.W., and Olsthoorn, T.N., (2002) A pilot
study of deep-well recharge by Amsterdam Water Supply.
Management of Aquifer Recharge for Sustainability, Dillon,
P.J. (ed). Proceedings of ISAR 4, Adelaide, SA, 22‒26
September 2002. Balkema Publishers-AIH, The Netherlands.
http://edafologia.ugr.es/introeda
http://www.inforiego.es
http://www.dina-mar.es DINA-MAR, Depth Investigation of
New Areas for Managed Aquifer Recharge. Grupo Tragsa,
Madrid, 05/2010.
Contact Details Conde Peñalver 84. 28006 Madrid.
Email: [email protected]

155
CLOGGING ASSOCIATED WITH WELL INJECTION

156
Application of Large Scale Managed Aquifer Recharge in Mine Water Management, Cloudbreak Mine, Western Australia B. Willis-Jones and I. Brandes de Roos
Fortescue Metals Group Limited
Introduction The Cloudbreak iron ore mine is located in the Pilbara region of Western Australia. The iron ore resource is
substantially below the water table and located within a regional groundwater system with contrasting brackish
and saline aquifers.
Groundwater management is an integral part of the mining operation. Abstraction is required to meet mine
dewatering and water supply requirements and Managed Aquifer Recharge (MAR) is employed to both conserve
brackish water and mitigate environmental impacts associated with discharge of saline water and groundwater
level drawdown (Figure 1).
In operation since 2008, the Cloudbreak water management system has steadily increased its capacity. In 2012 the
total abstraction and injection volumes were around 30 GL and 20 GL respectively. In this period injection
comprised approximately 13 GL of saline groundwater and 7 GL of brackish groundwater. Abstraction and
injection volumes for 2013 are forecast to be around 70 GL and 60 GL respectively.
A major challenge for both design and operation of large-scale MAR projects is aquifer clogging and the
Cloudbreak MAR scheme is an example of the application of pragmatic clogging-control measures.
Figure 1: A simplified schematic of the Cloudbreak MAR scheme
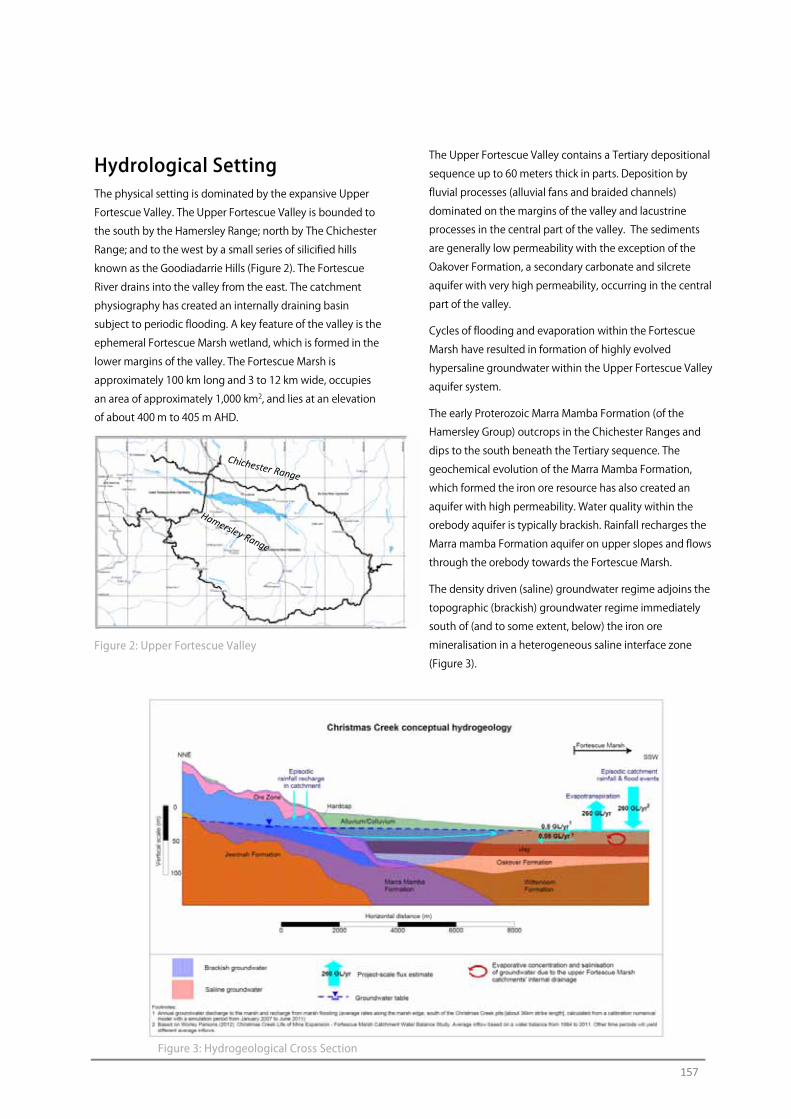
157
Hydrological Setting The physical setting is dominated by the expansive Upper
Fortescue Valley. The Upper Fortescue Valley is bounded to
the south by the Hamersley Range; north by The Chichester
Range; and to the west by a small series of silicified hills
known as the Goodiadarrie Hills (Figure 2). The Fortescue
River drains into the valley from the east. The catchment
physiography has created an internally draining basin
subject to periodic flooding. A key feature of the valley is the
ephemeral Fortescue Marsh wetland, which is formed in the
lower margins of the valley. The Fortescue Marsh is
approximately 100 km long and 3 to 12 km wide, occupies
an area of approximately 1,000 km2, and lies at an elevation
of about 400 m to 405 m AHD.
Figure 2: Upper Fortescue Valley
The Upper Fortescue Valley contains a Tertiary depositional
sequence up to 60 meters thick in parts. Deposition by
fluvial processes (alluvial fans and braided channels)
dominated on the margins of the valley and lacustrine
processes in the central part of the valley. The sediments
are generally low permeability with the exception of the
Oakover Formation, a secondary carbonate and silcrete
aquifer with very high permeability, occurring in the central
part of the valley.
Cycles of flooding and evaporation within the Fortescue
Marsh have resulted in formation of highly evolved
hypersaline groundwater within the Upper Fortescue Valley
aquifer system.
The early Proterozoic Marra Mamba Formation (of the
Hamersley Group) outcrops in the Chichester Ranges and
dips to the south beneath the Tertiary sequence. The
geochemical evolution of the Marra Mamba Formation,
which formed the iron ore resource has also created an
aquifer with high permeability. Water quality within the
orebody aquifer is typically brackish. Rainfall recharges the
Marra mamba Formation aquifer on upper slopes and flows
through the orebody towards the Fortescue Marsh.
The density driven (saline) groundwater regime adjoins the
topographic (brackish) groundwater regime immediately
south of (and to some extent, below) the iron ore
mineralisation in a heterogeneous saline interface zone
(Figure 3).
Figure 3: Hydrogeological Cross Section
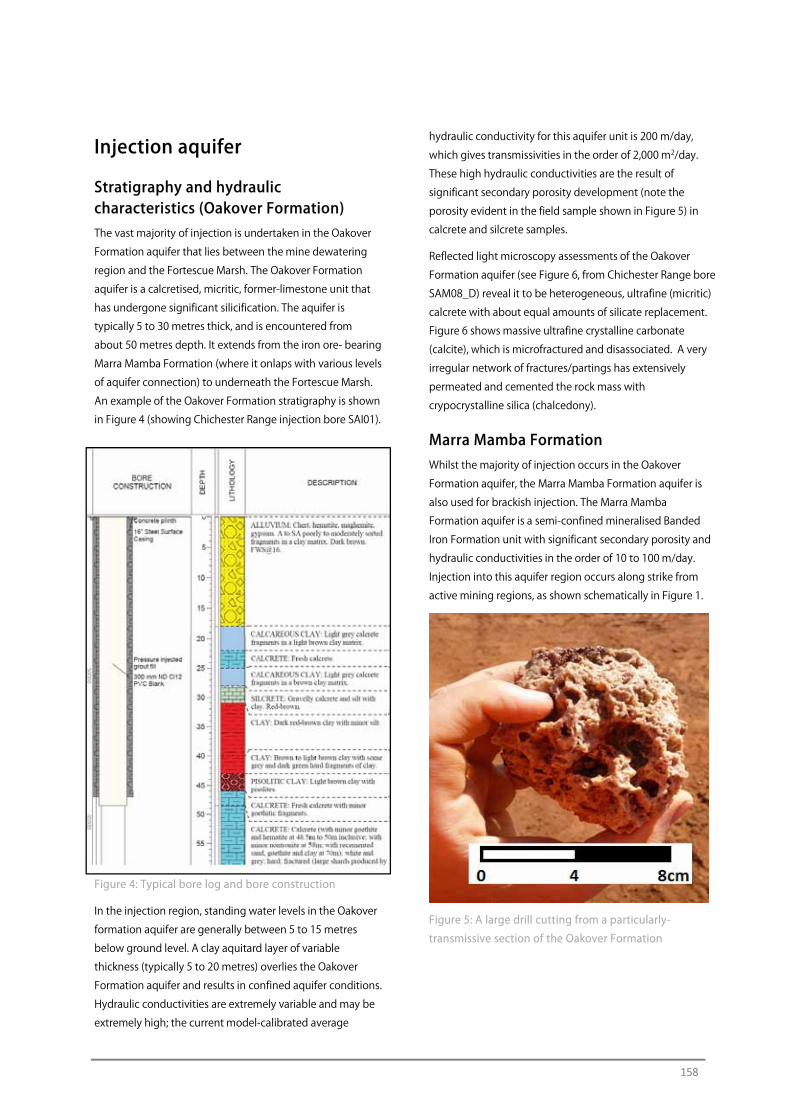
158
Injection aquifer
Stratigraphy and hydraulic characteristics (Oakover Formation) The vast majority of injection is undertaken in the Oakover
Formation aquifer that lies between the mine dewatering
region and the Fortescue Marsh. The Oakover Formation
aquifer is a calcretised, micritic, former-limestone unit that
has undergone significant silicification. The aquifer is
typically 5 to 30 metres thick, and is encountered from
about 50 metres depth. It extends from the iron ore- bearing
Marra Mamba Formation (where it onlaps with various levels
of aquifer connection) to underneath the Fortescue Marsh.
An example of the Oakover Formation stratigraphy is shown
in Figure 4 (showing Chichester Range injection bore SAI01).
Figure 4: Typical bore log and bore construction
In the injection region, standing water levels in the Oakover
formation aquifer are generally between 5 to 15 metres
below ground level. A clay aquitard layer of variable
thickness (typically 5 to 20 metres) overlies the Oakover
Formation aquifer and results in confined aquifer conditions.
Hydraulic conductivities are extremely variable and may be
extremely high; the current model-calibrated average
hydraulic conductivity for this aquifer unit is 200 m/day,
which gives transmissivities in the order of 2,000 m2/day.
These high hydraulic conductivities are the result of
significant secondary porosity development (note the
porosity evident in the field sample shown in Figure 5) in
calcrete and silcrete samples.
Reflected light microscopy assessments of the Oakover
Formation aquifer (see Figure 6, from Chichester Range bore
SAM08_D) reveal it to be heterogeneous, ultrafine (micritic)
calcrete with about equal amounts of silicate replacement.
Figure 6 shows massive ultrafine crystalline carbonate
(calcite), which is microfractured and disassociated. A very
irregular network of fractures/partings has extensively
permeated and cemented the rock mass with
crypocrystalline silica (chalcedony).
Marra Mamba Formation Whilst the majority of injection occurs in the Oakover
Formation aquifer, the Marra Mamba Formation aquifer is
also used for brackish injection. The Marra Mamba
Formation aquifer is a semi-confined mineralised Banded
Iron Formation unit with significant secondary porosity and
hydraulic conductivities in the order of 10 to 100 m/day.
Injection into this aquifer region occurs along strike from
active mining regions, as shown schematically in Figure 1.
Figure 5: A large drill cutting from a particularly-
transmissive section of the Oakover Formation
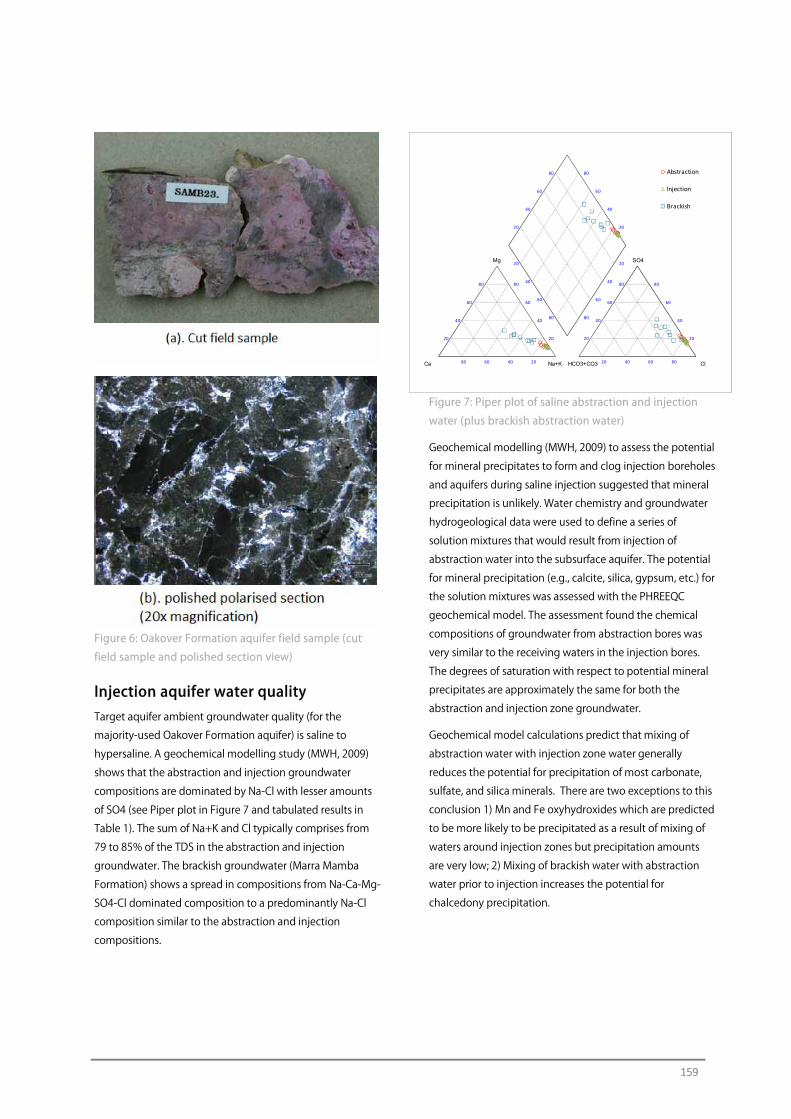
159
Figure 6: Oakover Formation aquifer field sample (cut
field sample and polished section view)
Injection aquifer water quality Target aquifer ambient groundwater quality (for the
majority-used Oakover Formation aquifer) is saline to
hypersaline. A geochemical modelling study (MWH, 2009)
shows that the abstraction and injection groundwater
compositions are dominated by Na-Cl with lesser amounts
of SO4 (see Piper plot in Figure 7 and tabulated results in
Table 1). The sum of Na+K and Cl typically comprises from
79 to 85% of the TDS in the abstraction and injection
groundwater. The brackish groundwater (Marra Mamba
Formation) shows a spread in compositions from Na-Ca-Mg-
SO4-Cl dominated composition to a predominantly Na-Cl
composition similar to the abstraction and injection
compositions.
Figure 7: Piper plot of saline abstraction and injection
water (plus brackish abstraction water)
Geochemical modelling (MWH, 2009) to assess the potential
for mineral precipitates to form and clog injection boreholes
and aquifers during saline injection suggested that mineral
precipitation is unlikely. Water chemistry and groundwater
hydrogeological data were used to define a series of
solution mixtures that would result from injection of
abstraction water into the subsurface aquifer. The potential
for mineral precipitation (e.g., calcite, silica, gypsum, etc.) for
the solution mixtures was assessed with the PHREEQC
geochemical model. The assessment found the chemical
compositions of groundwater from abstraction bores was
very similar to the receiving waters in the injection bores.
The degrees of saturation with respect to potential mineral
precipitates are approximately the same for both the
abstraction and injection zone groundwater.
Geochemical model calculations predict that mixing of
abstraction water with injection zone water generally
reduces the potential for precipitation of most carbonate,
sulfate, and silica minerals. There are two exceptions to this
conclusion 1) Mn and Fe oxyhydroxides which are predicted
to be more likely to be precipitated as a result of mixing of
waters around injection zones but precipitation amounts
are very low; 2) Mixing of brackish water with abstraction
water prior to injection increases the potential for
chalcedony precipitation.
20
40
60
80
20
40
60
80
20
40
60
80
80
60
40
20
80
60
40
20
80
60
40
20
80 60 40 20 20 40 60 80
20
40
60
80 80
60
40
20
Abstraction
Injection
Brackish
Ca
Mg
Na+K HCO3+CO3 Cl
SO4
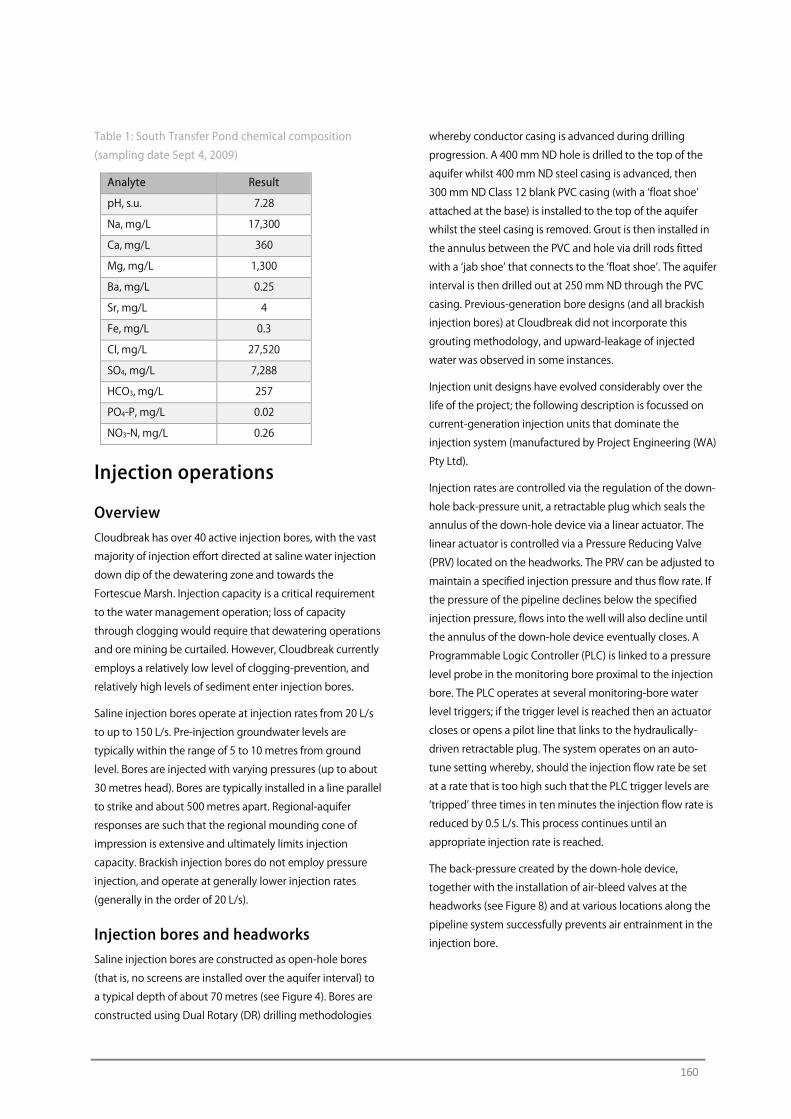
160
Table 1: South Transfer Pond chemical composition
(sampling date Sept 4, 2009)
Analyte Result
pH, s.u. 7.28
Na, mg/L 17,300
Ca, mg/L 360
Mg, mg/L 1,300
Ba, mg/L 0.25
Sr, mg/L 4
Fe, mg/L 0.3
Cl, mg/L 27,520
SO4, mg/L 7,288
HCO3, mg/L 257
PO4-P, mg/L 0.02
NO3-N, mg/L 0.26
Injection operations
Overview Cloudbreak has over 40 active injection bores, with the vast
majority of injection effort directed at saline water injection
down dip of the dewatering zone and towards the
Fortescue Marsh. Injection capacity is a critical requirement
to the water management operation; loss of capacity
through clogging would require that dewatering operations
and ore mining be curtailed. However, Cloudbreak currently
employs a relatively low level of clogging-prevention, and
relatively high levels of sediment enter injection bores.
Saline injection bores operate at injection rates from 20 L/s
to up to 150 L/s. Pre-injection groundwater levels are
typically within the range of 5 to 10 metres from ground
level. Bores are injected with varying pressures (up to about
30 metres head). Bores are typically installed in a line parallel
to strike and about 500 metres apart. Regional-aquifer
responses are such that the regional mounding cone of
impression is extensive and ultimately limits injection
capacity. Brackish injection bores do not employ pressure
injection, and operate at generally lower injection rates
(generally in the order of 20 L/s).
Injection bores and headworks Saline injection bores are constructed as open-hole bores
(that is, no screens are installed over the aquifer interval) to
a typical depth of about 70 metres (see Figure 4). Bores are
constructed using Dual Rotary (DR) drilling methodologies
whereby conductor casing is advanced during drilling
progression. A 400 mm ND hole is drilled to the top of the
aquifer whilst 400 mm ND steel casing is advanced, then
300 mm ND Class 12 blank PVC casing (with a ‘float shoe’
attached at the base) is installed to the top of the aquifer
whilst the steel casing is removed. Grout is then installed in
the annulus between the PVC and hole via drill rods fitted
with a ‘jab shoe’ that connects to the ‘float shoe’. The aquifer
interval is then drilled out at 250 mm ND through the PVC
casing. Previous-generation bore designs (and all brackish
injection bores) at Cloudbreak did not incorporate this
grouting methodology, and upward-leakage of injected
water was observed in some instances.
Injection unit designs have evolved considerably over the
life of the project; the following description is focussed on
current-generation injection units that dominate the
injection system (manufactured by Project Engineering (WA)
Pty Ltd).
Injection rates are controlled via the regulation of the down-
hole back-pressure unit, a retractable plug which seals the
annulus of the down-hole device via a linear actuator. The
linear actuator is controlled via a Pressure Reducing Valve
(PRV) located on the headworks. The PRV can be adjusted to
maintain a specified injection pressure and thus flow rate. If
the pressure of the pipeline declines below the specified
injection pressure, flows into the well will also decline until
the annulus of the down-hole device eventually closes. A
Programmable Logic Controller (PLC) is linked to a pressure
level probe in the monitoring bore proximal to the injection
bore. The PLC operates at several monitoring-bore water
level triggers; if the trigger level is reached then an actuator
closes or opens a pilot line that links to the hydraulically-
driven retractable plug. The system operates on an auto-
tune setting whereby, should the injection flow rate be set
at a rate that is too high such that the PLC trigger levels are
‘tripped’ three times in ten minutes the injection flow rate is
reduced by 0.5 L/s. This process continues until an
appropriate injection rate is reached.
The back-pressure created by the down-hole device,
together with the installation of air-bleed valves at the
headworks (see Figure 8) and at various locations along the
pipeline system successfully prevents air entrainment in the
injection bore.
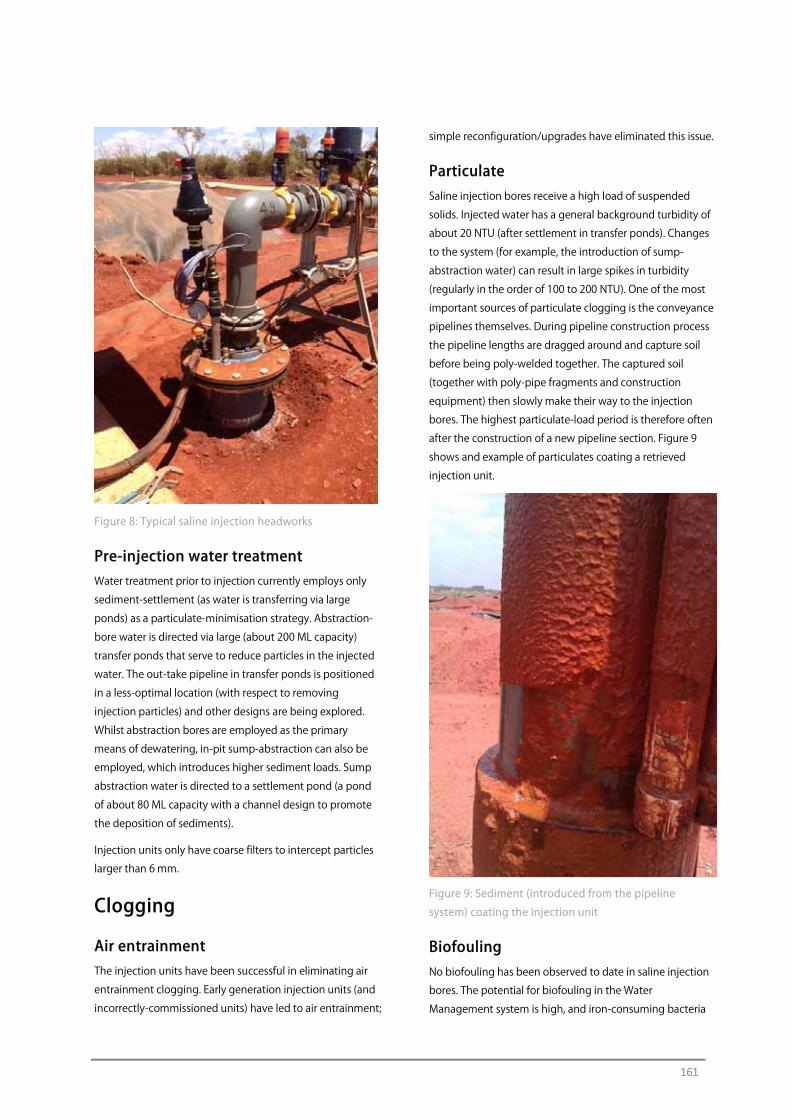
161
Figure 8: Typical saline injection headworks
Pre-injection water treatment Water treatment prior to injection currently employs only
sediment-settlement (as water is transferring via large
ponds) as a particulate-minimisation strategy. Abstraction-
bore water is directed via large (about 200 ML capacity)
transfer ponds that serve to reduce particles in the injected
water. The out-take pipeline in transfer ponds is positioned
in a less-optimal location (with respect to removing
injection particles) and other designs are being explored.
Whilst abstraction bores are employed as the primary
means of dewatering, in-pit sump-abstraction can also be
employed, which introduces higher sediment loads. Sump
abstraction water is directed to a settlement pond (a pond
of about 80 ML capacity with a channel design to promote
the deposition of sediments).
Injection units only have coarse filters to intercept particles
larger than 6 mm.
Clogging
Air entrainment The injection units have been successful in eliminating air
entrainment clogging. Early generation injection units (and
incorrectly-commissioned units) have led to air entrainment;
simple reconfiguration/upgrades have eliminated this issue.
Particulate Saline injection bores receive a high load of suspended
solids. Injected water has a general background turbidity of
about 20 NTU (after settlement in transfer ponds). Changes
to the system (for example, the introduction of sump-
abstraction water) can result in large spikes in turbidity
(regularly in the order of 100 to 200 NTU). One of the most
important sources of particulate clogging is the conveyance
pipelines themselves. During pipeline construction process
the pipeline lengths are dragged around and capture soil
before being poly-welded together. The captured soil
(together with poly-pipe fragments and construction
equipment) then slowly make their way to the injection
bores. The highest particulate-load period is therefore often
after the construction of a new pipeline section. Figure 9
shows and example of particulates coating a retrieved
injection unit.
Figure 9: Sediment (introduced from the pipeline
system) coating the injection unit
Biofouling No biofouling has been observed to date in saline injection
bores. The potential for biofouling in the Water
Management system is high, and iron-consuming bacteria
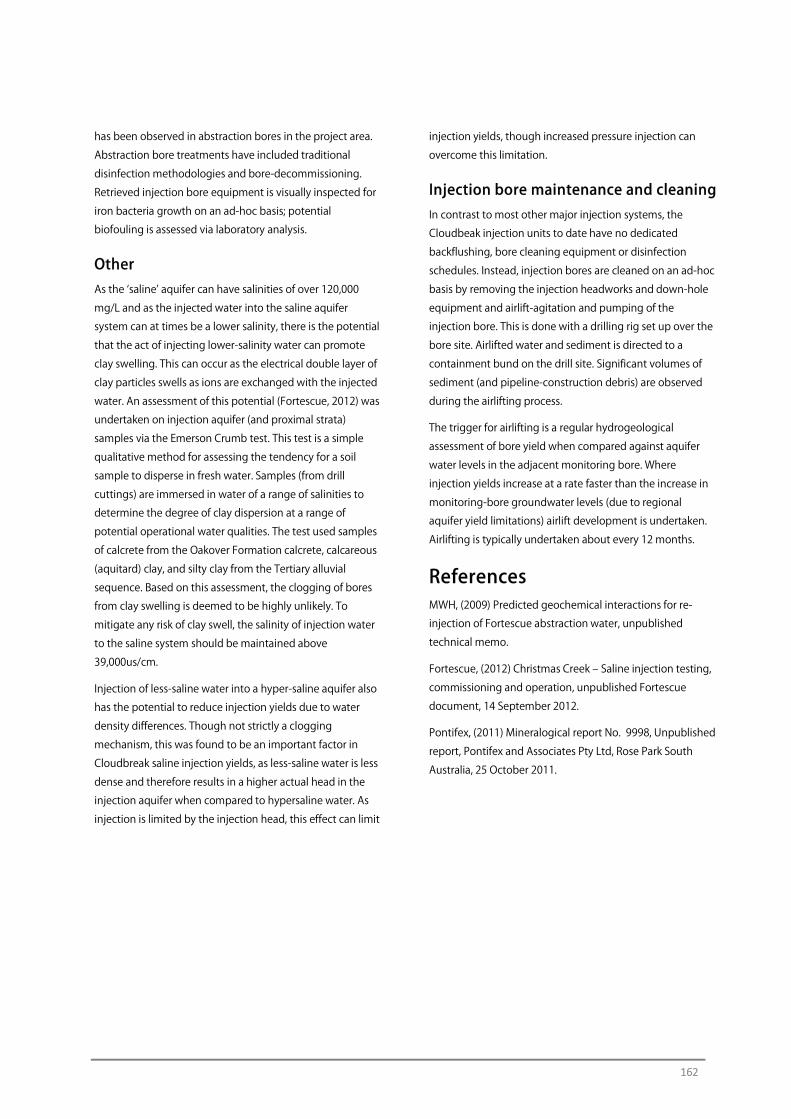
162
has been observed in abstraction bores in the project area.
Abstraction bore treatments have included traditional
disinfection methodologies and bore-decommissioning.
Retrieved injection bore equipment is visually inspected for
iron bacteria growth on an ad-hoc basis; potential
biofouling is assessed via laboratory analysis.
Other As the ‘saline’ aquifer can have salinities of over 120,000
mg/L and as the injected water into the saline aquifer
system can at times be a lower salinity, there is the potential
that the act of injecting lower-salinity water can promote
clay swelling. This can occur as the electrical double layer of
clay particles swells as ions are exchanged with the injected
water. An assessment of this potential (Fortescue, 2012) was
undertaken on injection aquifer (and proximal strata)
samples via the Emerson Crumb test. This test is a simple
qualitative method for assessing the tendency for a soil
sample to disperse in fresh water. Samples (from drill
cuttings) are immersed in water of a range of salinities to
determine the degree of clay dispersion at a range of
potential operational water qualities. The test used samples
of calcrete from the Oakover Formation calcrete, calcareous
(aquitard) clay, and silty clay from the Tertiary alluvial
sequence. Based on this assessment, the clogging of bores
from clay swelling is deemed to be highly unlikely. To
mitigate any risk of clay swell, the salinity of injection water
to the saline system should be maintained above
39,000us/cm.
Injection of less-saline water into a hyper-saline aquifer also
has the potential to reduce injection yields due to water
density differences. Though not strictly a clogging
mechanism, this was found to be an important factor in
Cloudbreak saline injection yields, as less-saline water is less
dense and therefore results in a higher actual head in the
injection aquifer when compared to hypersaline water. As
injection is limited by the injection head, this effect can limit
injection yields, though increased pressure injection can
overcome this limitation.
Injection bore maintenance and cleaning In contrast to most other major injection systems, the
Cloudbeak injection units to date have no dedicated
backflushing, bore cleaning equipment or disinfection
schedules. Instead, injection bores are cleaned on an ad-hoc
basis by removing the injection headworks and down-hole
equipment and airlift-agitation and pumping of the
injection bore. This is done with a drilling rig set up over the
bore site. Airlifted water and sediment is directed to a
containment bund on the drill site. Significant volumes of
sediment (and pipeline-construction debris) are observed
during the airlifting process.
The trigger for airlifting is a regular hydrogeological
assessment of bore yield when compared against aquifer
water levels in the adjacent monitoring bore. Where
injection yields increase at a rate faster than the increase in
monitoring-bore groundwater levels (due to regional
aquifer yield limitations) airlift development is undertaken.
Airlifting is typically undertaken about every 12 months.
References MWH, (2009) Predicted geochemical interactions for re-
injection of Fortescue abstraction water, unpublished
technical memo.
Fortescue, (2012) Christmas Creek ‒ Saline injection testing,
commissioning and operation, unpublished Fortescue
document, 14 September 2012.
Pontifex, (2011) Mineralogical report No. 9998, Unpublished
report, Pontifex and Associates Pty Ltd, Rose Park South
Australia, 25 October 2011.
163
Clogging of Deep Well Infiltration Recharge Systems in the Netherlands B. de la Loma González
KWR Watercycle Research Institute, Nieuwegein, Netherlands
Overview In this chapter we review data of three deep well artificial recharge systems in the Netherlands to describe their
clogging behaviour over a 23 year period. The overall conclusion from this assessment is that managed aquifer
recharge using deep well injection (aquifer storage transfer and recovery) can provide a sustainable method to
store and treat water. Key aspects to successful operation of deep well MAR systems are: i) pre-treatment of the
feed water, ii) monitoring injecting well pressure and iii) tailored back flushing and/or rehabilitation. Special
emphasis is given to the effectiveness of the different rehabilitation techniques and suggestions are given to
improve the future use of these types of systems. To our knowledge, these systems provide a unique dataset and
the comparison of the different systems (well field operation and pre-treatment) is useful for engineers designing
future MAR systems that use deep well injection. Some of the results from this comparison are that periodic
abstractions with high flows and adequate pre-treatment diminish the clogging rate. In addition, from the
chemical regeneration methods the use of hydrogen peroxide and chlorine bleach proved to be the most effective.
Finally, the observed tendency to expand the pre-treatment due to quality guidelines with the use of UV/H2O2
could result in an increase of biological clogging.
1 Introduction Managed aquifer recharge (MAR) is widely applied in the
Netherlands to produce drinking water, making up 20% of
the total Dutch water supply of 1250 Mm3/year (Stuyfzand,
2010). The various MAR techniques employed in the
Netherlands offer the prospect of treating unreliable,
polluted surface water into good quality safe raw water by
infiltrating it into an aquifer and recovering it after a certain
residence time in the subsurface. This aquifer passage not
only enhances the water quality and decreases the input
quality fluctuations, but also protects the water from
evaporation losses, algae blooms, atmospheric fallouts of
pollutants (Stuyfzand, 2010). There are however some
disadvantages to this method as well, such as a
cumbersome clogging phenomena, which is the subject of
this chapter, water losses due to mixing with brackish
groundwater and natural reactions with the porous medium
which can result in unwanted water quality changes such as
increasing arsenic levels.
The three MAR systems presented in this chapter are Aquifer
Storage Transfer Recovery (ASTR) systems where separate
injection and recovery wells are used. The advantage of
deep infiltration systems compared to open artificial
recharge (infiltration) ponds, which are more frequently
used in the Netherlands, is their footprint, lower impact on
the terrestrial ecosystems and greater protection against
contaminants. On the other hand, the open infiltration
systems are easier to build, easier to maintain and have
lower operational costs. Moreover, infiltration wells are
more susceptible to clogging by a combination of particles,
biomass and chemical precipitates than open infiltration
systems. Clogging is the most important factor in the
degeneration, abandonment and replacement of wells
often associated with additional and unexpected costs
(Houben and Treskatis, 2007).
Clogging of deep wells systems results in less efficient
systems resulting in higher energy and maintenance costs.
Here, the experiences with clogging at three different water
companies (see Figure 1 1) that use ASTR systems are
described. The companies, Dunea, PWN and Waternet are
located in the coastal dune systems of Waalsdorp, Watervlak
(Castricum) and Amsterdam water supply dunes,
respectively. Two of them: Dunea ‒formerly called DZH- and
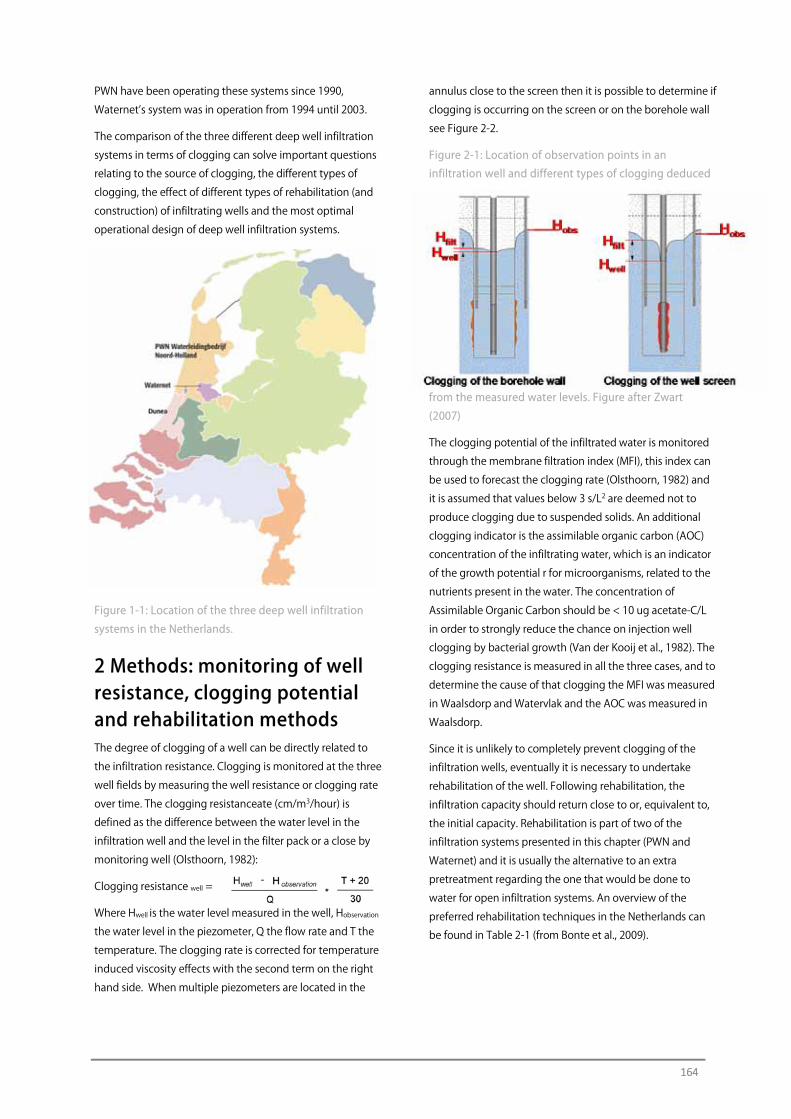
164
PWN have been operating these systems since 1990,
Waternet’s system was in operation from 1994 until 2003.
The comparison of the three different deep well infiltration
systems in terms of clogging can solve important questions
relating to the source of clogging, the different types of
clogging, the effect of different types of rehabilitation (and
construction) of infiltrating wells and the most optimal
operational design of deep well infiltration systems.
Figure 1-1: Location of the three deep well infiltration
systems in the Netherlands.
2 Methods: monitoring of well resistance, clogging potential and rehabilitation methods The degree of clogging of a well can be directly related to
the infiltration resistance. Clogging is monitored at the three
well fields by measuring the well resistance or clogging rate
over time. The clogging resistanceate (cm/m3/hour) is
defined as the difference between the water level in the
infiltration well and the level in the filter pack or a close by
monitoring well (Olsthoorn, 1982):
Clogging resistance well =
Where Hwell is the water level measured in the well, Hobservation
the water level in the piezometer, Q the flow rate and T the
temperature. The clogging rate is corrected for temperature
induced viscosity effects with the second term on the right
hand side. When multiple piezometers are located in the
annulus close to the screen then it is possible to determine if
clogging is occurring on the screen or on the borehole wall
see Figure 2-2.
Figure 2-1: Location of observation points in an
infiltration well and different types of clogging deduced
from the measured water levels. Figure after Zwart
(2007)
The clogging potential of the infiltrated water is monitored
through the membrane filtration index (MFI), this index can
be used to forecast the clogging rate (Olsthoorn, 1982) and
it is assumed that values below 3 s/L2 are deemed not to
produce clogging due to suspended solids. An additional
clogging indicator is the assimilable organic carbon (AOC)
concentration of the infiltrating water, which is an indicator
of the growth potential r for microorganisms, related to the
nutrients present in the water. The concentration of
Assimilable Organic Carbon should be < 10 ug acetate-C/L
in order to strongly reduce the chance on injection well
clogging by bacterial growth (Van der Kooij et al., 1982). The
clogging resistance is measured in all the three cases, and to
determine the cause of that clogging the MFI was measured
in Waalsdorp and Watervlak and the AOC was measured in
Waalsdorp.
Since it is unlikely to completely prevent clogging of the
infiltration wells, eventually it is necessary to undertake
rehabilitation of the well. Following rehabilitation, the
infiltration capacity should return close to or, equivalent to,
the initial capacity. Rehabilitation is part of two of the
infiltration systems presented in this chapter (PWN and
Waternet) and it is usually the alternative to an extra
pretreatment regarding the one that would be done to
water for open infiltration systems. An overview of the
preferred rehabilitation techniques in the Netherlands can
be found in Table 2-1 (from Bonte et al., 2009).
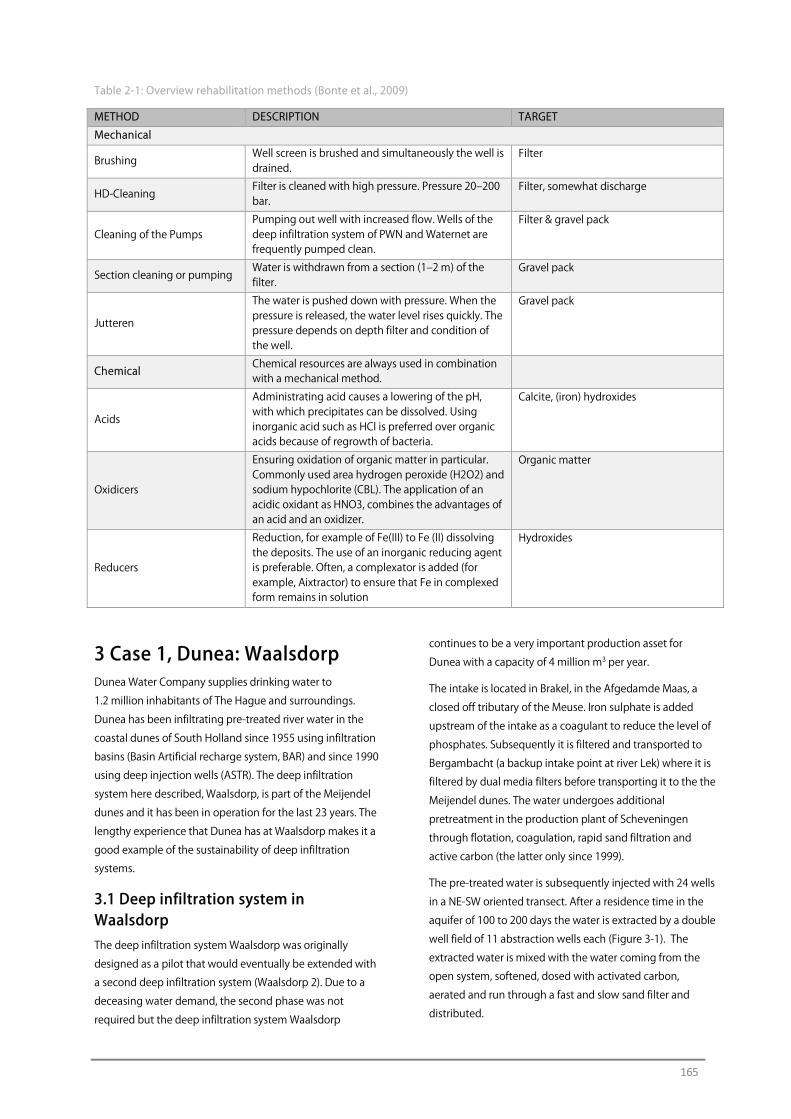
165
Table 2-1: Overview rehabilitation methods (Bonte et al., 2009)
METHOD DESCRIPTION TARGET
Mechanical
Brushing Well screen is brushed and simultaneously the well is drained.
Filter
HD-Cleaning Filter is cleaned with high pressure. Pressure 20‒200 bar.
Filter, somewhat discharge
Cleaning of the Pumps Pumping out well with increased flow. Wells of the deep infiltration system of PWN and Waternet are frequently pumped clean.
Filter & gravel pack
Section cleaning or pumping Water is withdrawn from a section (1‒2 m) of the filter.
Gravel pack
Jutteren
The water is pushed down with pressure. When the pressure is released, the water level rises quickly. The pressure depends on depth filter and condition of the well.
Gravel pack
Chemical Chemical resources are always used in combination with a mechanical method.
Acids
Administrating acid causes a lowering of the pH, with which precipitates can be dissolved. Using inorganic acid such as HCl is preferred over organic acids because of regrowth of bacteria.
Calcite, (iron) hydroxides
Oxidicers
Ensuring oxidation of organic matter in particular. Commonly used area hydrogen peroxide (H2O2) and sodium hypochlorite (CBL). The application of an acidic oxidant as HNO3, combines the advantages of an acid and an oxidizer.
Organic matter
Reducers
Reduction, for example of Fe(III) to Fe (II) dissolving the deposits. The use of an inorganic reducing agent is preferable. Often, a complexator is added (for example, Aixtractor) to ensure that Fe in complexed form remains in solution
Hydroxides
3 Case 1, Dunea: Waalsdorp Dunea Water Company supplies drinking water to
1.2 million inhabitants of The Hague and surroundings.
Dunea has been infiltrating pre-treated river water in the
coastal dunes of South Holland since 1955 using infiltration
basins (Basin Artificial recharge system, BAR) and since 1990
using deep injection wells (ASTR). The deep infiltration
system here described, Waalsdorp, is part of the Meijendel
dunes and it has been in operation for the last 23 years. The
lengthy experience that Dunea has at Waalsdorp makes it a
good example of the sustainability of deep infiltration
systems.
3.1 Deep infiltration system in Waalsdorp The deep infiltration system Waalsdorp was originally
designed as a pilot that would eventually be extended with
a second deep infiltration system (Waalsdorp 2). Due to a
deceasing water demand, the second phase was not
required but the deep infiltration system Waalsdorp
continues to be a very important production asset for
Dunea with a capacity of 4 million m3 per year.
The intake is located in Brakel, in the Afgedamde Maas, a
closed off tributary of the Meuse. Iron sulphate is added
upstream of the intake as a coagulant to reduce the level of
phosphates. Subsequently it is filtered and transported to
Bergambacht (a backup intake point at river Lek) where it is
filtered by dual media filters before transporting it to the the
Meijendel dunes. The water undergoes additional
pretreatment in the production plant of Scheveningen
through flotation, coagulation, rapid sand filtration and
active carbon (the latter only since 1999).
The pre-treated water is subsequently injected with 24 wells
in a NE-SW oriented transect. After a residence time in the
aquifer of 100 to 200 days the water is extracted by a double
well field of 11 abstraction wells each (Figure 3-1). The
extracted water is mixed with the water coming from the
open system, softened, dosed with activated carbon,
aerated and run through a fast and slow sand filter and
distributed.
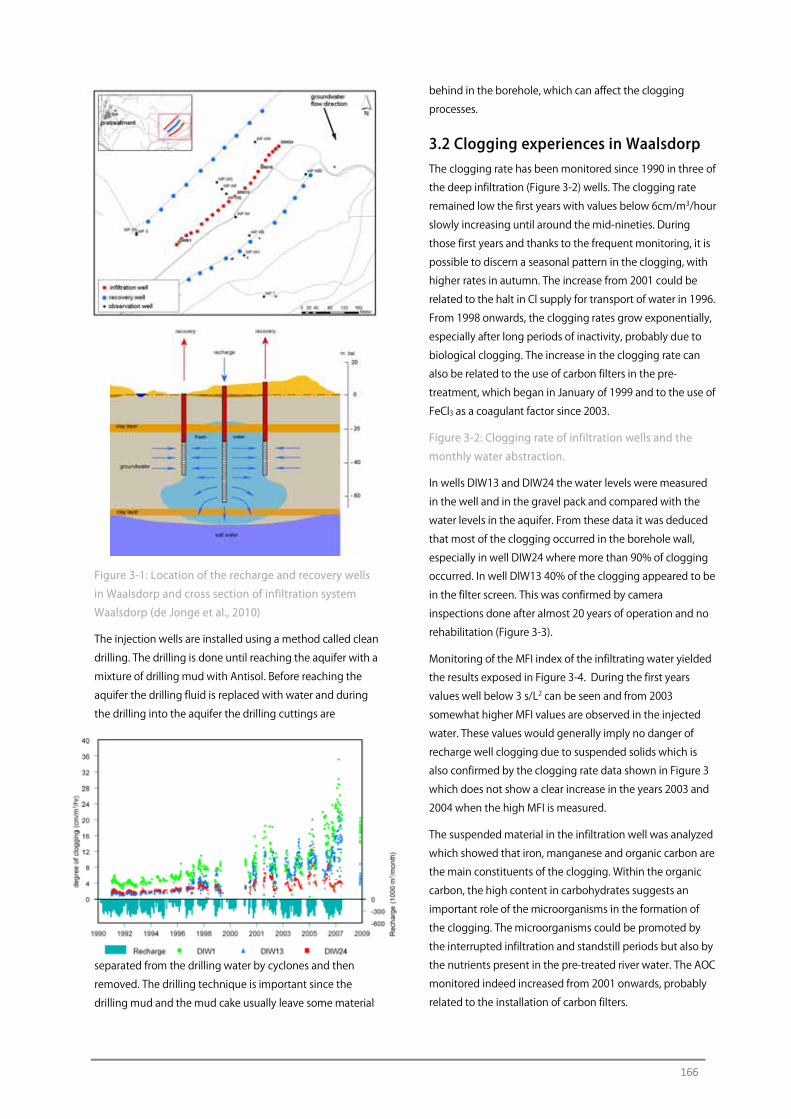
166
Figure 3-1: Location of the recharge and recovery wells
in Waalsdorp and cross section of infiltration system
Waalsdorp (de Jonge et al., 2010)
The injection wells are installed using a method called clean
drilling. The drilling is done until reaching the aquifer with a
mixture of drilling mud with Antisol. Before reaching the
aquifer the drilling fluid is replaced with water and during
the drilling into the aquifer the drilling cuttings are
separated from the drilling water by cyclones and then
removed. The drilling technique is important since the
drilling mud and the mud cake usually leave some material
behind in the borehole, which can affect the clogging
processes.
3.2 Clogging experiences in Waalsdorp The clogging rate has been monitored since 1990 in three of
the deep infiltration (Figure 3-2) wells. The clogging rate
remained low the first years with values below 6cm/m3/hour
slowly increasing until around the mid-nineties. During
those first years and thanks to the frequent monitoring, it is
possible to discern a seasonal pattern in the clogging, with
higher rates in autumn. The increase from 2001 could be
related to the halt in Cl supply for transport of water in 1996.
From 1998 onwards, the clogging rates grow exponentially,
especially after long periods of inactivity, probably due to
biological clogging. The increase in the clogging rate can
also be related to the use of carbon filters in the pre-
treatment, which began in January of 1999 and to the use of
FeCl3 as a coagulant factor since 2003.
Figure 3-2: Clogging rate of infiltration wells and the
monthly water abstraction.
In wells DIW13 and DIW24 the water levels were measured
in the well and in the gravel pack and compared with the
water levels in the aquifer. From these data it was deduced
that most of the clogging occurred in the borehole wall,
especially in well DIW24 where more than 90% of clogging
occurred. In well DIW13 40% of the clogging appeared to be
in the filter screen. This was confirmed by camera
inspections done after almost 20 years of operation and no
rehabilitation (Figure 3-3).
Monitoring of the MFI index of the infiltrating water yielded
the results exposed in Figure 3-4. During the first years
values well below 3 s/L2 can be seen and from 2003
somewhat higher MFI values are observed in the injected
water. These values would generally imply no danger of
recharge well clogging due to suspended solids which is
also confirmed by the clogging rate data shown in Figure 3
which does not show a clear increase in the years 2003 and
2004 when the high MFI is measured.
The suspended material in the infiltration well was analyzed
which showed that iron, manganese and organic carbon are
the main constituents of the clogging. Within the organic
carbon, the high content in carbohydrates suggests an
important role of the microorganisms in the formation of
the clogging. The microorganisms could be promoted by
the interrupted infiltration and standstill periods but also by
the nutrients present in the pre-treated river water. The AOC
monitored indeed increased from 2001 onwards, probably
related to the installation of carbon filters.
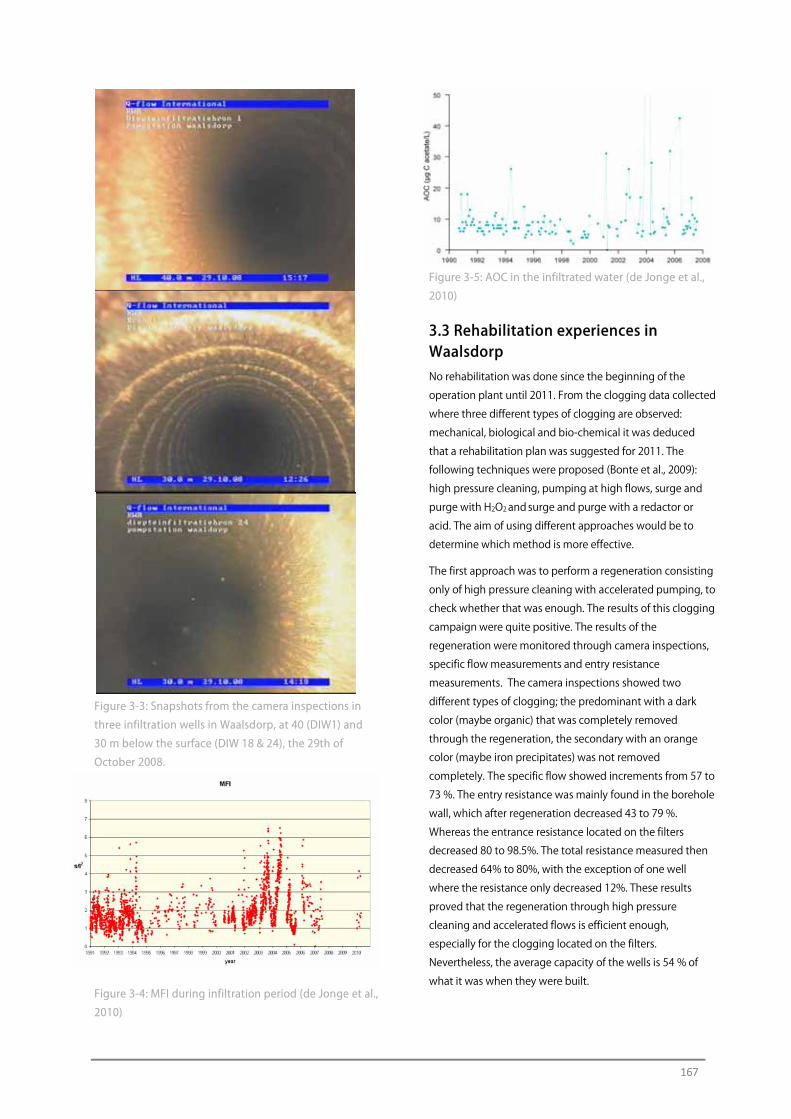
167
Figure 3-3: Snapshots from the camera inspections in
three infiltration wells in Waalsdorp, at 40 (DIW1) and
30 m below the surface (DIW 18 & 24), the 29th of
October 2008.
Figure 3-4: MFI during infiltration period (de Jonge et al.,
2010)
Figure 3-5: AOC in the infiltrated water (de Jonge et al.,
2010)
3.3 Rehabilitation experiences in Waalsdorp No rehabilitation was done since the beginning of the
operation plant until 2011. From the clogging data collected
where three different types of clogging are observed:
mechanical, biological and bio-chemical it was deduced
that a rehabilitation plan was suggested for 2011. The
following techniques were proposed (Bonte et al., 2009):
high pressure cleaning, pumping at high flows, surge and
purge with H2O2 and surge and purge with a redactor or
acid. The aim of using different approaches would be to
determine which method is more effective.
The first approach was to perform a regeneration consisting
only of high pressure cleaning with accelerated pumping, to
check whether that was enough. The results of this clogging
campaign were quite positive. The results of the
regeneration were monitored through camera inspections,
specific flow measurements and entry resistance
measurements. The camera inspections showed two
different types of clogging; the predominant with a dark
color (maybe organic) that was completely removed
through the regeneration, the secondary with an orange
color (maybe iron precipitates) was not removed
completely. The specific flow showed increments from 57 to
73 %. The entry resistance was mainly found in the borehole
wall, which after regeneration decreased 43 to 79 %.
Whereas the entrance resistance located on the filters
decreased 80 to 98.5%. The total resistance measured then
decreased 64% to 80%, with the exception of one well
where the resistance only decreased 12%. These results
proved that the regeneration through high pressure
cleaning and accelerated flows is efficient enough,
especially for the clogging located on the filters.
Nevertheless, the average capacity of the wells is 54 % of
what it was when they were built.
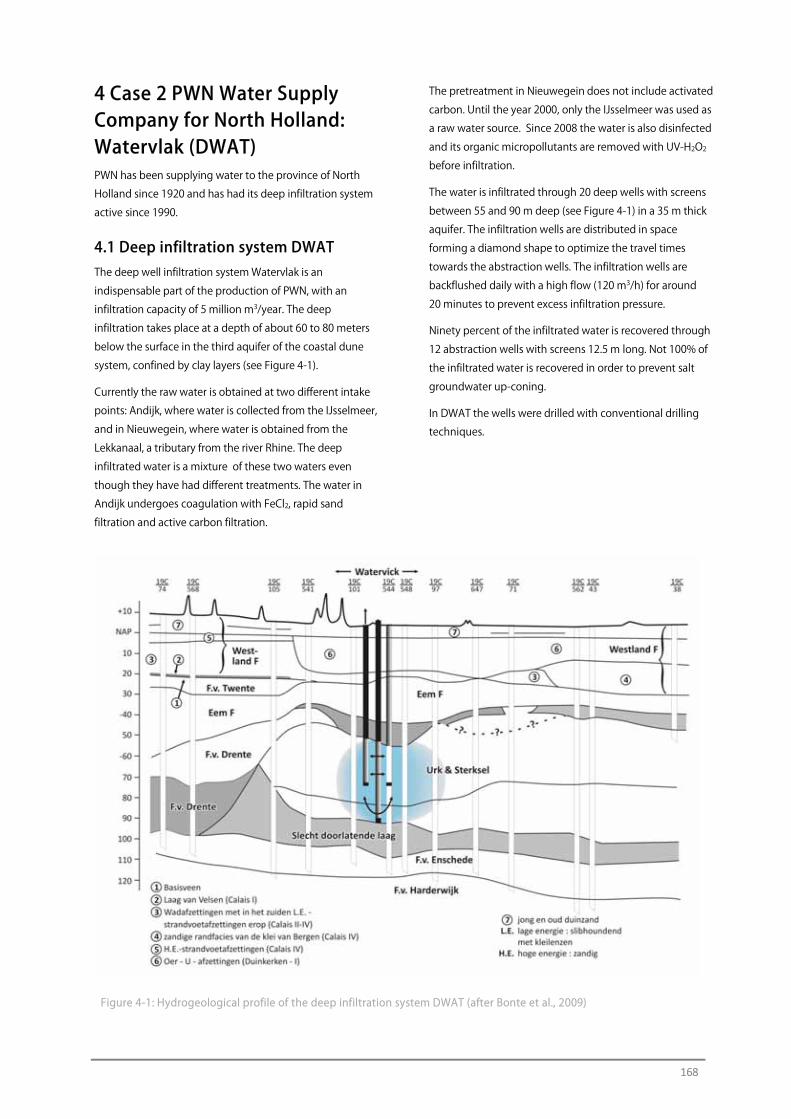
168
4 Case 2 PWN Water Supply Company for North Holland: Watervlak (DWAT) PWN has been supplying water to the province of North
Holland since 1920 and has had its deep infiltration system
active since 1990.
4.1 Deep infiltration system DWAT The deep well infiltration system Watervlak is an
indispensable part of the production of PWN, with an
infiltration capacity of 5 million m3/year. The deep
infiltration takes place at a depth of about 60 to 80 meters
below the surface in the third aquifer of the coastal dune
system, confined by clay layers (see Figure 4-1).
Currently the raw water is obtained at two different intake
points: Andijk, where water is collected from the IJsselmeer,
and in Nieuwegein, where water is obtained from the
Lekkanaal, a tributary from the river Rhine. The deep
infiltrated water is a mixture of these two waters even
though they have had different treatments. The water in
Andijk undergoes coagulation with FeCl2, rapid sand
filtration and active carbon filtration.
The pretreatment in Nieuwegein does not include activated
carbon. Until the year 2000, only the IJsselmeer was used as
a raw water source. Since 2008 the water is also disinfected
and its organic micropollutants are removed with UV-H2O2
before infiltration.
The water is infiltrated through 20 deep wells with screens
between 55 and 90 m deep (see Figure 4-1) in a 35 m thick
aquifer. The infiltration wells are distributed in space
forming a diamond shape to optimize the travel times
towards the abstraction wells. The infiltration wells are
backflushed daily with a high flow (120 m3/h) for around
20 minutes to prevent excess infiltration pressure.
Ninety percent of the infiltrated water is recovered through
12 abstraction wells with screens 12.5 m long. Not 100% of
the infiltrated water is recovered in order to prevent salt
groundwater up-coning.
In DWAT the wells were drilled with conventional drilling
techniques.
Figure 4-1: Hydrogeological profile of the deep infiltration system DWAT (after Bonte et al., 2009)
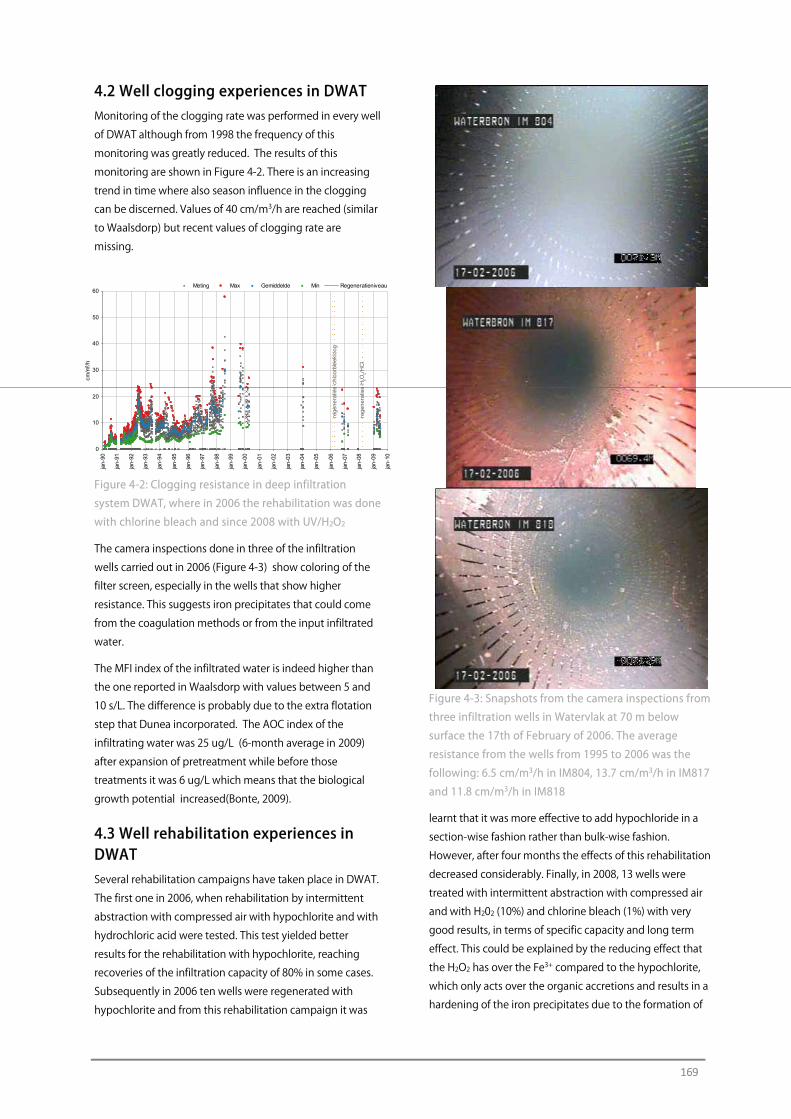
169
4.2 Well clogging experiences in DWAT Monitoring of the clogging rate was performed in every well
of DWAT although from 1998 the frequency of this
monitoring was greatly reduced. The results of this
monitoring are shown in Figure 4-2. There is an increasing
trend in time where also season influence in the clogging
can be discerned. Values of 40 cm/m3/h are reached (similar
to Waalsdorp) but recent values of clogging rate are
missing.
Figure 4-2: Clogging resistance in deep infiltration
system DWAT, where in 2006 the rehabilitation was done
with chlorine bleach and since 2008 with UV/H2O2
The camera inspections done in three of the infiltration
wells carried out in 2006 (Figure 4-3) show coloring of the
filter screen, especially in the wells that show higher
resistance. This suggests iron precipitates that could come
from the coagulation methods or from the input infiltrated
water.
The MFI index of the infiltrated water is indeed higher than
the one reported in Waalsdorp with values between 5 and
10 s/L. The difference is probably due to the extra flotation
step that Dunea incorporated. The AOC index of the
infiltrating water was 25 ug/L (6-month average in 2009)
after expansion of pretreatment while before those
treatments it was 6 ug/L which means that the biological
growth potential increased(Bonte, 2009).
4.3 Well rehabilitation experiences in DWAT Several rehabilitation campaigns have taken place in DWAT.
The first one in 2006, when rehabilitation by intermittent
abstraction with compressed air with hypochlorite and with
hydrochloric acid were tested. This test yielded better
results for the rehabilitation with hypochlorite, reaching
recoveries of the infiltration capacity of 80% in some cases.
Subsequently in 2006 ten wells were regenerated with
hypochlorite and from this rehabilitation campaign it was
Figure 4-3: Snapshots from the camera inspections from
three infiltration wells in Watervlak at 70 m below
surface the 17th of February of 2006. The average
resistance from the wells from 1995 to 2006 was the
following: 6.5 cm/m3/h in IM804, 13.7 cm/m3/h in IM817
and 11.8 cm/m3/h in IM818
learnt that it was more effective to add hypochloride in a
section-wise fashion rather than bulk-wise fashion.
However, after four months the effects of this rehabilitation
decreased considerably. Finally, in 2008, 13 wells were
treated with intermittent abstraction with compressed air
and with H202 (10%) and chlorine bleach (1%) with very
good results, in terms of specific capacity and long term
effect. This could be explained by the reducing effect that
the H2O2 has over the Fe3+ compared to the hypochlorite,
which only acts over the organic accretions and results in a
hardening of the iron precipitates due to the formation of
0
10
20
30
40
50
60
jan-
90
jan-
91
jan-
92
jan-
93
jan-
94
jan-
95
jan-
96
jan-
97
jan-
98
jan-
99
jan-
00
jan-
01
jan-
02
jan-
03
jan-
04
jan-
05
jan-
06
jan-
07
jan-
08
jan-
09
jan-
10
cm/m
3/h
Meting Max Gemiddelde Min Regeneratieniveau
rege
nera
ties
chlo
orbl
eekl
oog
rege
nera
ties
H2O
2/H
Cl
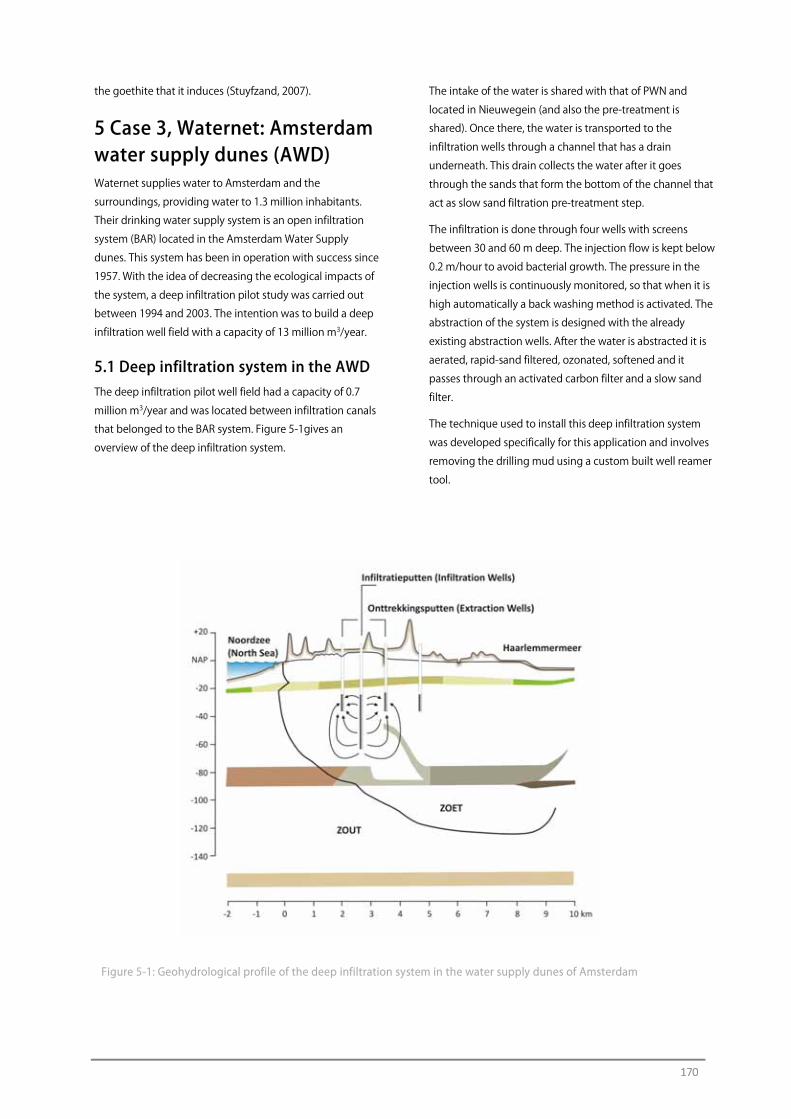
170
the goethite that it induces (Stuyfzand, 2007).
5 Case 3, Waternet: Amsterdam water supply dunes (AWD) Waternet supplies water to Amsterdam and the
surroundings, providing water to 1.3 million inhabitants.
Their drinking water supply system is an open infiltration
system (BAR) located in the Amsterdam Water Supply
dunes. This system has been in operation with success since
1957. With the idea of decreasing the ecological impacts of
the system, a deep infiltration pilot study was carried out
between 1994 and 2003. The intention was to build a deep
infiltration well field with a capacity of 13 million m3/year.
5.1 Deep infiltration system in the AWD The deep infiltration pilot well field had a capacity of 0.7
million m3/year and was located between infiltration canals
that belonged to the BAR system. Figure 5-1gives an
overview of the deep infiltration system.
The intake of the water is shared with that of PWN and
located in Nieuwegein (and also the pre-treatment is
shared). Once there, the water is transported to the
infiltration wells through a channel that has a drain
underneath. This drain collects the water after it goes
through the sands that form the bottom of the channel that
act as slow sand filtration pre-treatment step.
The infiltration is done through four wells with screens
between 30 and 60 m deep. The injection flow is kept below
0.2 m/hour to avoid bacterial growth. The pressure in the
injection wells is continuously monitored, so that when it is
high automatically a back washing method is activated. The
abstraction of the system is designed with the already
existing abstraction wells. After the water is abstracted it is
aerated, rapid-sand filtered, ozonated, softened and it
passes through an activated carbon filter and a slow sand
filter.
The technique used to install this deep infiltration system
was developed specifically for this application and involves
removing the drilling mud using a custom built well reamer
tool.
Figure 5-1: Geohydrological profile of the deep infiltration system in the water supply dunes of Amsterdam
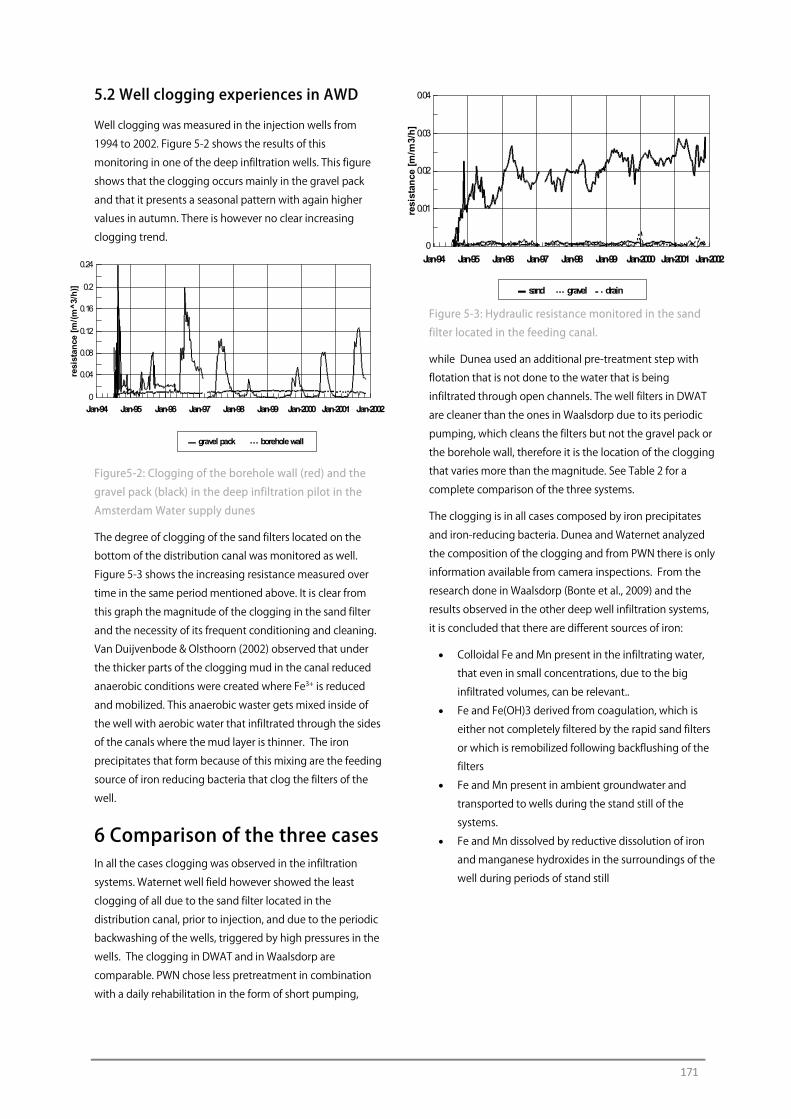
171
Jan-94 Jan-95 Jan-96 Jan-97 Jan-98 Jan-99 Jan-2000 Jan-2001 Jan-20020
0.04
0.08
0.12
0.16
0.2
0.24
resi
stan
ce [
m/(
m^
3/h
)]
gravel pack borehole wall
Jan-94 Jan-95 Jan-96 Jan-97 Jan-98 Jan-99 Jan-2000 Jan-2001 Jan-20020
0.01
0.02
0.03
0.04
resi
stan
ce [
m/m
3/h
]
sand gravel drain
5.2 Well clogging experiences in AWD
Well clogging was measured in the injection wells from
1994 to 2002. Figure 5-2 shows the results of this
monitoring in one of the deep infiltration wells. This figure
shows that the clogging occurs mainly in the gravel pack
and that it presents a seasonal pattern with again higher
values in autumn. There is however no clear increasing
clogging trend.
Figure5-2: Clogging of the borehole wall (red) and the
gravel pack (black) in the deep infiltration pilot in the
Amsterdam Water supply dunes
The degree of clogging of the sand filters located on the
bottom of the distribution canal was monitored as well.
Figure 5-3 shows the increasing resistance measured over
time in the same period mentioned above. It is clear from
this graph the magnitude of the clogging in the sand filter
and the necessity of its frequent conditioning and cleaning.
Van Duijvenbode & Olsthoorn (2002) observed that under
the thicker parts of the clogging mud in the canal reduced
anaerobic conditions were created where Fe3+ is reduced
and mobilized. This anaerobic waster gets mixed inside of
the well with aerobic water that infiltrated through the sides
of the canals where the mud layer is thinner. The iron
precipitates that form because of this mixing are the feeding
source of iron reducing bacteria that clog the filters of the
well.
6 Comparison of the three cases In all the cases clogging was observed in the infiltration
systems. Waternet well field however showed the least
clogging of all due to the sand filter located in the
distribution canal, prior to injection, and due to the periodic
backwashing of the wells, triggered by high pressures in the
wells. The clogging in DWAT and in Waalsdorp are
comparable. PWN chose less pretreatment in combination
with a daily rehabilitation in the form of short pumping,
Figure 5-3: Hydraulic resistance monitored in the sand
filter located in the feeding canal.
while Dunea used an additional pre-treatment step with
flotation that is not done to the water that is being
infiltrated through open channels. The well filters in DWAT
are cleaner than the ones in Waalsdorp due to its periodic
pumping, which cleans the filters but not the gravel pack or
the borehole wall, therefore it is the location of the clogging
that varies more than the magnitude. See Table 2 for a
complete comparison of the three systems.
The clogging is in all cases composed by iron precipitates
and iron-reducing bacteria. Dunea and Waternet analyzed
the composition of the clogging and from PWN there is only
information available from camera inspections. From the
research done in Waalsdorp (Bonte et al., 2009) and the
results observed in the other deep well infiltration systems,
it is concluded that there are different sources of iron:
• Colloidal Fe and Mn present in the infiltrating water,
that even in small concentrations, due to the big
infiltrated volumes, can be relevant..
• Fe and Fe(OH)3 derived from coagulation, which is
either not completely filtered by the rapid sand filters
or which is remobilized following backflushing of the
filters
• Fe and Mn present in ambient groundwater and
transported to wells during the stand still of the
systems.
• Fe and Mn dissolved by reductive dissolution of iron
and manganese hydroxides in the surroundings of the
well during periods of stand still
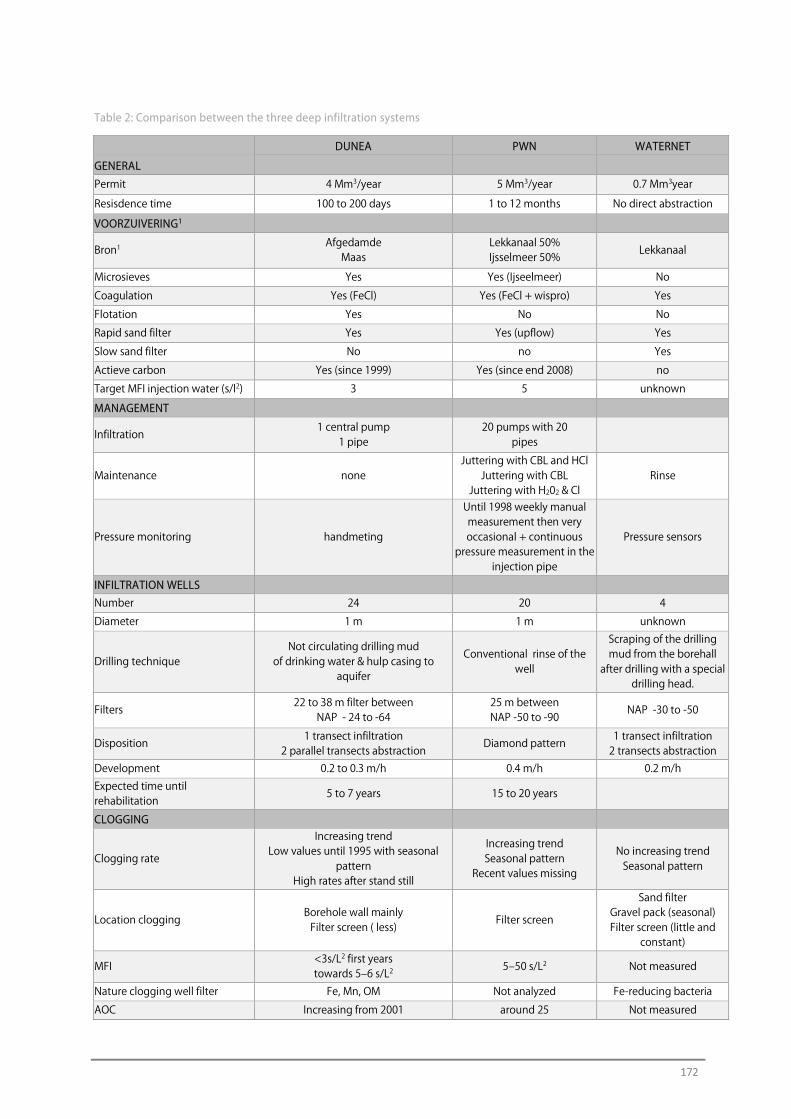
172
Table 2: Comparison between the three deep infiltration systems
DUNEA PWN WATERNET
GENERAL
Permit 4 Mm3/year 5 Mm3/year 0.7 Mm3year
Resisdence time 100 to 200 days 1 to 12 months No direct abstraction
VOORZUIVERING1
Bron1 Afgedamde
Maas Lekkanaal 50% Ijsselmeer 50%
Lekkanaal
Microsieves Yes Yes (Ijseelmeer) No
Coagulation Yes (FeCl) Yes (FeCl + wispro) Yes
Flotation Yes No No
Rapid sand filter Yes Yes (upflow) Yes
Slow sand filter No no Yes
Actieve carbon Yes (since 1999) Yes (since end 2008) no
Target MFI injection water (s/l2) 3 5 unknown
MANAGEMENT
Infiltration 1 central pump
1 pipe 20 pumps with 20
pipes
Maintenance none Juttering with CBL and HCl
Juttering with CBL Juttering with H202 & Cl
Rinse
Pressure monitoring handmeting
Until 1998 weekly manual measurement then very occasional + continuous
pressure measurement in the injection pipe
Pressure sensors
INFILTRATION WELLS
Number 24 20 4
Diameter 1 m 1 m unknown
Drilling technique Not circulating drilling mud
of drinking water & hulp casing to aquifer
Conventional rinse of the well
Scraping of the drilling mud from the borehall
after drilling with a special drilling head.
Filters 22 to 38 m filter between
NAP - 24 to -64 25 m between NAP -50 to -90
NAP -30 to -50
Disposition 1 transect infiltration
2 parallel transects abstraction Diamond pattern
1 transect infiltration2 transects abstraction
Development 0.2 to 0.3 m/h 0.4 m/h 0.2 m/h Expected time until rehabilitation
5 to 7 years 15 to 20 years
CLOGGING
Clogging rate
Increasing trendLow values until 1995 with seasonal
pattern High rates after stand still
Increasing trend Seasonal pattern
Recent values missing
No increasing trend Seasonal pattern
Location clogging Borehole wall mainly Filter screen ( less)
Filter screen
Sand filterGravel pack (seasonal) Filter screen (little and
constant)
MFI <3s/L2 first yearstowards 5‒6 s/L2
5‒50 s/L2 Not measured
Nature clogging well filter Fe, Mn, OM Not analyzed Fe-reducing bacteria
AOC Increasing from 2001 around 25 Not measured

173
Conclusions Clogging in deep infiltration systems under investigation
here is mainly caused by iron precipitates and iron reducing
bacteria. There should be more attention paid to the input
of iron in the system, while as clogging indicators MFI and
AOC indexes proved to be useful. The deep well infiltration
systems here reviewed have worked for the last 20 years
successfully. The conclusion is that with the appropriate
optimization of the pre-treatment and periodic
rehabilitation it can last an indefinite time.
Clogging can be prevented through a combination of
periodic maintenance abstractions with high flows and
good pretreatment with MFI vales below 5s/L2 and AOC
<10ug/L2, but these case studies have shown that systems
function without significant clogging for years with greater
MFI and AOC values Also, management of drilling fluids
during well construction helps to prevent formation
damage and clogging. Using help-casing, removing the
drilling mud from the borehole wall with a reaming drilling
head, and using degradable additives in the drilling mud are
ways to manage formation damage during the drilling
process to reduce the impact of future clogging.
The most successful rehabilitations were the ones using
mechanical and chemical methods, and as for chemical, the
use of hydrogen peroxide with chlorine bleach turned out
to be very successful. An early rehabilitation, before the
clogging has become too severe gives better results. It is
important therefore to perform an accurate and continuous
monitoring.
An aspect that is not sufficiently clear currently is the source
of the iron forming the precipitates in the infiltration wells.
Key to controlling the clogging by the observed
combination of biological and chemical (iron(III) rich)
clogging layers is understanding the source of iron.
An aspect that is expected to become more important for
future maintenance of MAR systems, is that infiltration water
quality guidelines will become more stringent and more
focus will be put on removing organic micro-pollutants. This
could lead to expansion of pretreatment facilities with UV/
H2O2, which could result in a higher fraction of AOC in
infiltration water and a subsequent increased biological
clogging. Combining MAR with UV/ H2O2 treatment may be
desirable when aiming for a multiple barrier approach
against contaminants. However, the formation of AOC and
the role of this in well clogging show stacking different
treatment steps can lead to unwanted side effects
negatively impacting on the overall efficiency.
Bibliography Bonte, M., Raat, K.J., and Dammers, P., (2009a) Analyse
putverstopping en voorstel voor regeneratie diepinfiltratie
Waalsdorp. KWR Rapport, kenmerk KWR 09.001
Bonte, M., (2009 b) Regeneratie en verstoping van
infiltratieputten. KWR Rapport, kenmerk KWR09.028
Duijvenbode, S.W., and Olsthoorn, T.N., (2002) A pilot study
of deep-well recharge by Amsterdam Water Supply. Proc.
Management of Aquifer Recharge for Sustainability ‒ Dillon
(ed) 2002, 447‒451.
Jonge, H.G., Dammers, P.H., and Bonte, M., (2010) Managed
deep well aquifer recharge in the Coastal dunes of South
Holland: 20 years of experience. ISMAR-7, Abu Dhabi.
Olsthoorn, T.N., (1982) Verstopping van persputten, Kiwa
mededelingen #72
Stuyfzand, P.J., (2007) Naar een effectievere diagnose,
therapie en preventie van chemische put- en
drainverstopping. H2O 2007 #8.
Stuyfzand, P. J., (2010) Hydrogeochemical Processes during
river Bank filtration and artificial recharge of polluted surface
waters: zonation, identification and quantification.
Riverbank Filtration for Water Security in Desert Countries,
Nato Science for Peace and Security Series C: Environmental
Secuity, 91‒128
Stuyfzand, P. J., (2011) Monitoring van effecten van
uitbreiding van de voorzuivering met H2O2/UV/AKF op
waterkwaliteitsveranderingen tijdens duininfiltratie door
PWN. KWR Rapport, kenmerk KWR 2011.003
Zwart, B-R., (2007) Investigation of Clogging processes in
Unconsolidated Aquifers near Water Supply Wells.
Proefschrift Technische Universiteit Delft. The Netherlands.
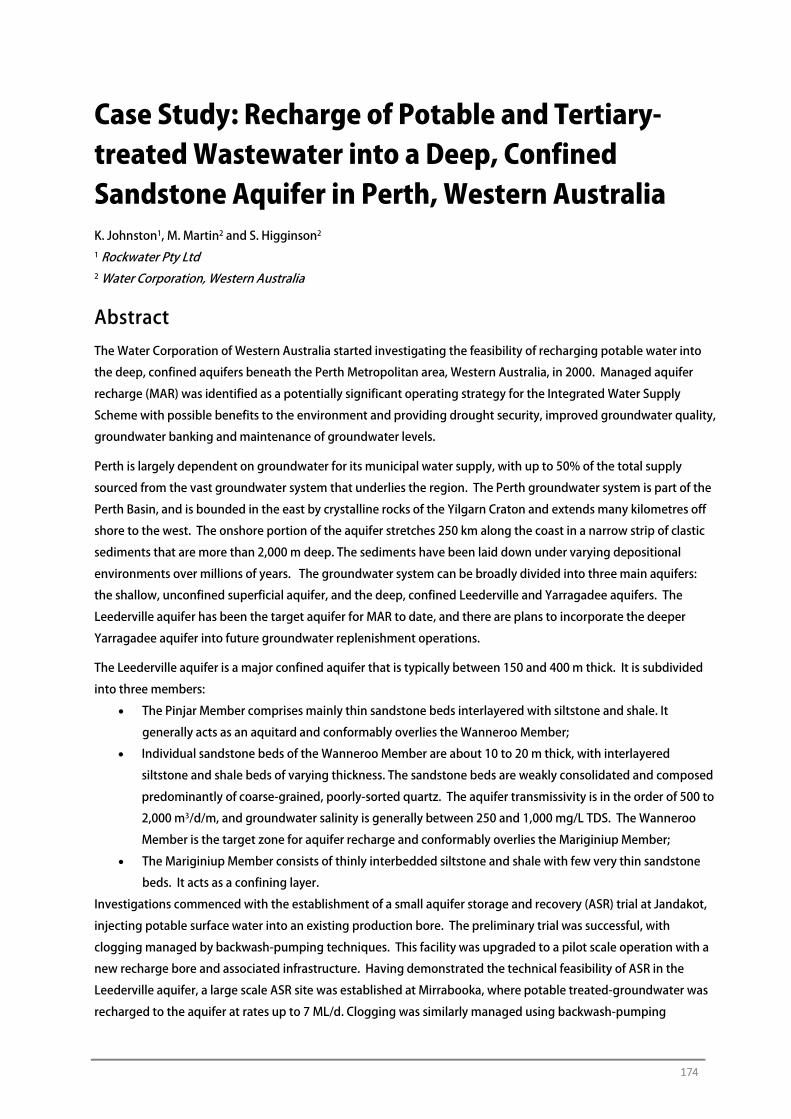
174
Case Study: Recharge of Potable and Tertiary-treated Wastewater into a Deep, Confined Sandstone Aquifer in Perth, Western Australia K. Johnston1, M. Martin2 and S. Higginson2 1 Rockwater Pty Ltd 2 Water Corporation, Western Australia
Abstract The Water Corporation of Western Australia started investigating the feasibility of recharging potable water into
the deep, confined aquifers beneath the Perth Metropolitan area, Western Australia, in 2000. Managed aquifer
recharge (MAR) was identified as a potentially significant operating strategy for the Integrated Water Supply
Scheme with possible benefits to the environment and providing drought security, improved groundwater quality,
groundwater banking and maintenance of groundwater levels.
Perth is largely dependent on groundwater for its municipal water supply, with up to 50% of the total supply
sourced from the vast groundwater system that underlies the region. The Perth groundwater system is part of the
Perth Basin, and is bounded in the east by crystalline rocks of the Yilgarn Craton and extends many kilometres off
shore to the west. The onshore portion of the aquifer stretches 250 km along the coast in a narrow strip of clastic
sediments that are more than 2,000 m deep. The sediments have been laid down under varying depositional
environments over millions of years. The groundwater system can be broadly divided into three main aquifers:
the shallow, unconfined superficial aquifer, and the deep, confined Leederville and Yarragadee aquifers. The
Leederville aquifer has been the target aquifer for MAR to date, and there are plans to incorporate the deeper
Yarragadee aquifer into future groundwater replenishment operations.
The Leederville aquifer is a major confined aquifer that is typically between 150 and 400 m thick. It is subdivided
into three members:
• The Pinjar Member comprises mainly thin sandstone beds interlayered with siltstone and shale. It
generally acts as an aquitard and conformably overlies the Wanneroo Member;
• Individual sandstone beds of the Wanneroo Member are about 10 to 20 m thick, with interlayered
siltstone and shale beds of varying thickness. The sandstone beds are weakly consolidated and composed
predominantly of coarse-grained, poorly-sorted quartz. The aquifer transmissivity is in the order of 500 to
2,000 m3/d/m, and groundwater salinity is generally between 250 and 1,000 mg/L TDS. The Wanneroo
Member is the target zone for aquifer recharge and conformably overlies the Mariginiup Member;
• The Mariginiup Member consists of thinly interbedded siltstone and shale with few very thin sandstone
beds. It acts as a confining layer.
Investigations commenced with the establishment of a small aquifer storage and recovery (ASR) trial at Jandakot,
injecting potable surface water into an existing production bore. The preliminary trial was successful, with
clogging managed by backwash-pumping techniques. This facility was upgraded to a pilot scale operation with a
new recharge bore and associated infrastructure. Having demonstrated the technical feasibility of ASR in the
Leederville aquifer, a large scale ASR site was established at Mirrabooka, where potable treated-groundwater was
recharged to the aquifer at rates up to 7 ML/d. Clogging was similarly managed using backwash-pumping
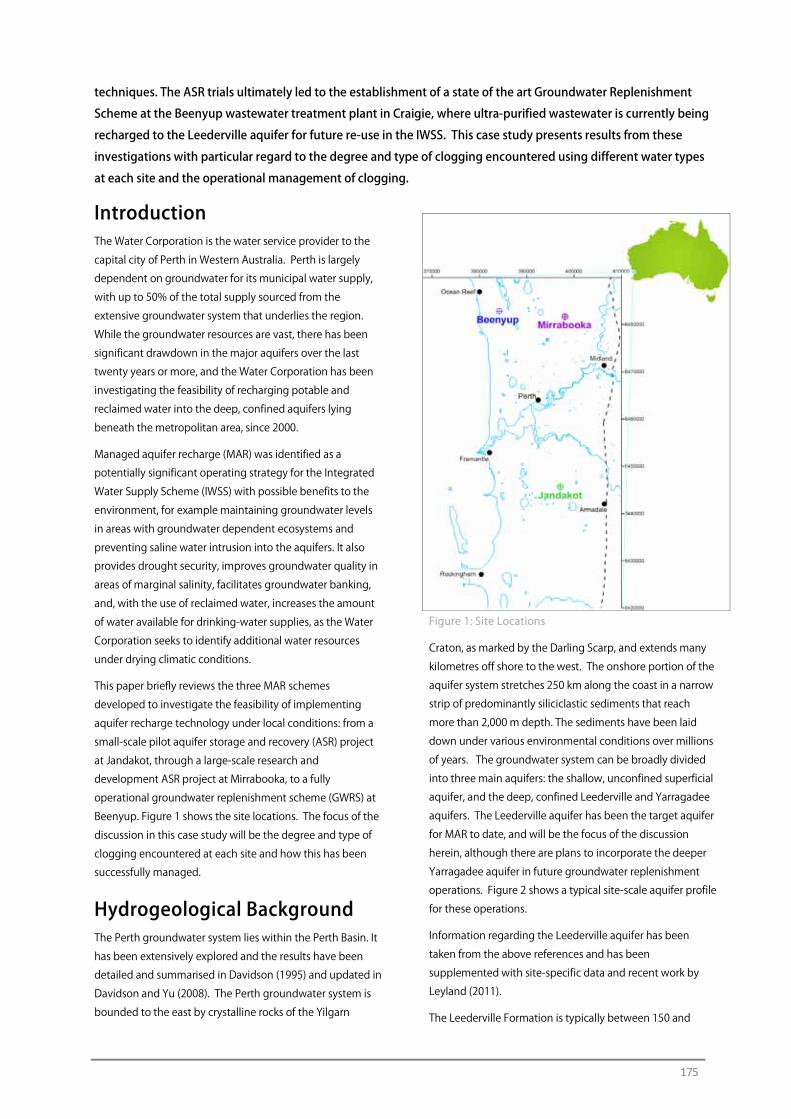
175
techniques. The ASR trials ultimately led to the establishment of a state of the art Groundwater Replenishment
Scheme at the Beenyup wastewater treatment plant in Craigie, where ultra-purified wastewater is currently being
recharged to the Leederville aquifer for future re-use in the IWSS. This case study presents results from these
investigations with particular regard to the degree and type of clogging encountered using different water types
at each site and the operational management of clogging.
Introduction The Water Corporation is the water service provider to the
capital city of Perth in Western Australia. Perth is largely
dependent on groundwater for its municipal water supply,
with up to 50% of the total supply sourced from the
extensive groundwater system that underlies the region.
While the groundwater resources are vast, there has been
significant drawdown in the major aquifers over the last
twenty years or more, and the Water Corporation has been
investigating the feasibility of recharging potable and
reclaimed water into the deep, confined aquifers lying
beneath the metropolitan area, since 2000.
Managed aquifer recharge (MAR) was identified as a
potentially significant operating strategy for the Integrated
Water Supply Scheme (IWSS) with possible benefits to the
environment, for example maintaining groundwater levels
in areas with groundwater dependent ecosystems and
preventing saline water intrusion into the aquifers. It also
provides drought security, improves groundwater quality in
areas of marginal salinity, facilitates groundwater banking,
and, with the use of reclaimed water, increases the amount
of water available for drinking-water supplies, as the Water
Corporation seeks to identify additional water resources
under drying climatic conditions.
This paper briefly reviews the three MAR schemes
developed to investigate the feasibility of implementing
aquifer recharge technology under local conditions: from a
small-scale pilot aquifer storage and recovery (ASR) project
at Jandakot, through a large-scale research and
development ASR project at Mirrabooka, to a fully
operational groundwater replenishment scheme (GWRS) at
Beenyup. Figure 1 shows the site locations. The focus of the
discussion in this case study will be the degree and type of
clogging encountered at each site and how this has been
successfully managed.
Hydrogeological Background The Perth groundwater system lies within the Perth Basin. It
has been extensively explored and the results have been
detailed and summarised in Davidson (1995) and updated in
Davidson and Yu (2008). The Perth groundwater system is
bounded to the east by crystalline rocks of the Yilgarn
Figure 1: Site Locations
Craton, as marked by the Darling Scarp, and extends many
kilometres off shore to the west. The onshore portion of the
aquifer system stretches 250 km along the coast in a narrow
strip of predominantly siliciclastic sediments that reach
more than 2,000 m depth. The sediments have been laid
down under various environmental conditions over millions
of years. The groundwater system can be broadly divided
into three main aquifers: the shallow, unconfined superficial
aquifer, and the deep, confined Leederville and Yarragadee
aquifers. The Leederville aquifer has been the target aquifer
for MAR to date, and will be the focus of the discussion
herein, although there are plans to incorporate the deeper
Yarragadee aquifer in future groundwater replenishment
operations. Figure 2 shows a typical site-scale aquifer profile
for these operations.
Information regarding the Leederville aquifer has been
taken from the above references and has been
supplemented with site-specific data and recent work by
Leyland (2011).
The Leederville Formation is typically between 150 and
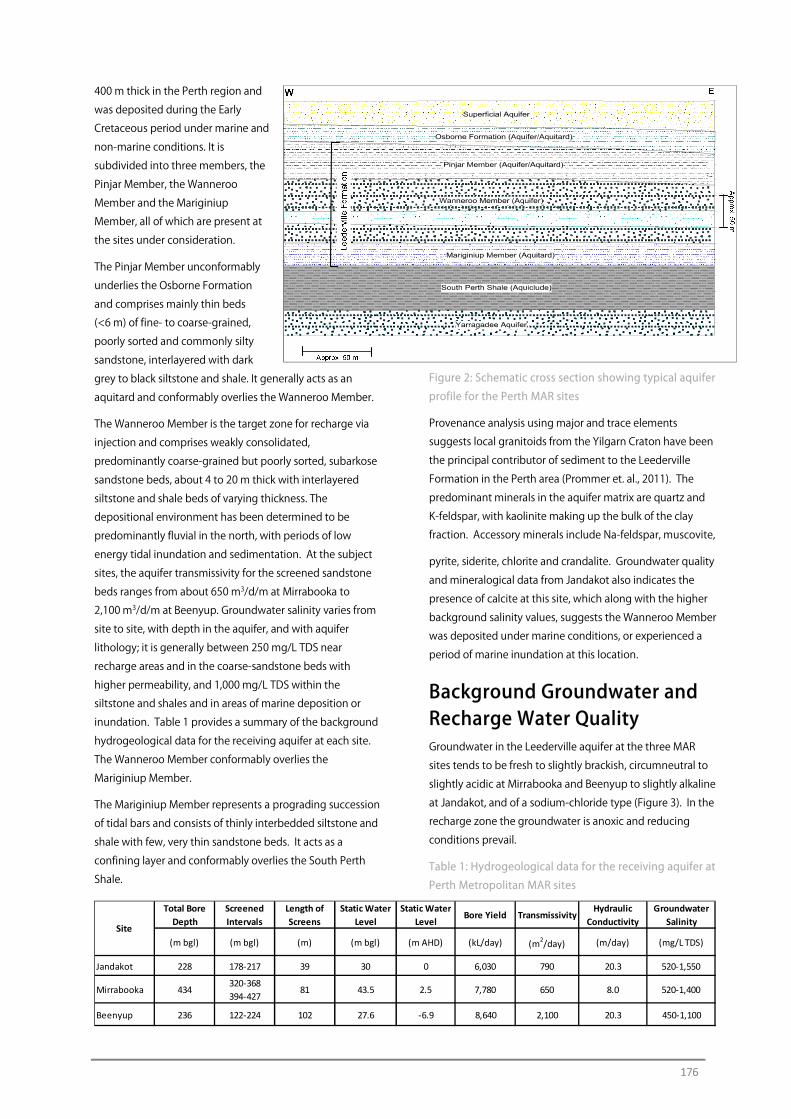
176
400 m thick in the Perth region and
was deposited during the Early
Cretaceous period under marine and
non-marine conditions. It is
subdivided into three members, the
Pinjar Member, the Wanneroo
Member and the Mariginiup
Member, all of which are present at
the sites under consideration.
The Pinjar Member unconformably
underlies the Osborne Formation
and comprises mainly thin beds
(<6 m) of fine- to coarse-grained,
poorly sorted and commonly silty
sandstone, interlayered with dark
grey to black siltstone and shale. It generally acts as an
aquitard and conformably overlies the Wanneroo Member.
The Wanneroo Member is the target zone for recharge via
injection and comprises weakly consolidated,
predominantly coarse-grained but poorly sorted, subarkose
sandstone beds, about 4 to 20 m thick with interlayered
siltstone and shale beds of varying thickness. The
depositional environment has been determined to be
predominantly fluvial in the north, with periods of low
energy tidal inundation and sedimentation. At the subject
sites, the aquifer transmissivity for the screened sandstone
beds ranges from about 650 m3/d/m at Mirrabooka to
2,100 m3/d/m at Beenyup. Groundwater salinity varies from
site to site, with depth in the aquifer, and with aquifer
lithology; it is generally between 250 mg/L TDS near
recharge areas and in the coarse-sandstone beds with
higher permeability, and 1,000 mg/L TDS within the
siltstone and shales and in areas of marine deposition or
inundation. Table 1 provides a summary of the background
hydrogeological data for the receiving aquifer at each site.
The Wanneroo Member conformably overlies the
Mariginiup Member.
The Mariginiup Member represents a prograding succession
of tidal bars and consists of thinly interbedded siltstone and
shale with few, very thin sandstone beds. It acts as a
confining layer and conformably overlies the South Perth
Shale.
Figure 2: Schematic cross section showing typical aquifer
profile for the Perth MAR sites
Provenance analysis using major and trace elements
suggests local granitoids from the Yilgarn Craton have been
the principal contributor of sediment to the Leederville
Formation in the Perth area (Prommer et. al., 2011). The
predominant minerals in the aquifer matrix are quartz and
K-feldspar, with kaolinite making up the bulk of the clay
fraction. Accessory minerals include Na-feldspar, muscovite,
pyrite, siderite, chlorite and crandalite. Groundwater quality
and mineralogical data from Jandakot also indicates the
presence of calcite at this site, which along with the higher
background salinity values, suggests the Wanneroo Member
was deposited under marine conditions, or experienced a
period of marine inundation at this location.
Background Groundwater and Recharge Water Quality Groundwater in the Leederville aquifer at the three MAR
sites tends to be fresh to slightly brackish, circumneutral to
slightly acidic at Mirrabooka and Beenyup to slightly alkaline
at Jandakot, and of a sodium-chloride type (Figure 3). In the
recharge zone the groundwater is anoxic and reducing
conditions prevail.
Table 1: Hydrogeological data for the receiving aquifer at
Perth Metropolitan MAR sites
(m bgl) (m bgl) (m) (m bgl) (m AHD) (kL/day) (m2/day) (m/day) (mg/L TDS)
Jandakot 228 178-217 39 30 0 6,030 790 20.3 520-1,550
Mirrabooka 434320-368 394-427
81 43.5 2.5 7,780 650 8.0 520-1,400
Beenyup 236 122-224 102 27.6 -6.9 8,640 2,100 20.3 450-1,100
Hydraulic Conductivity
Groundwater Salinity
TransmissivityTotal Bore
DepthStatic Water
LevelSite
Static Water Level
Bore YieldLength of Screens
Screened Intervals
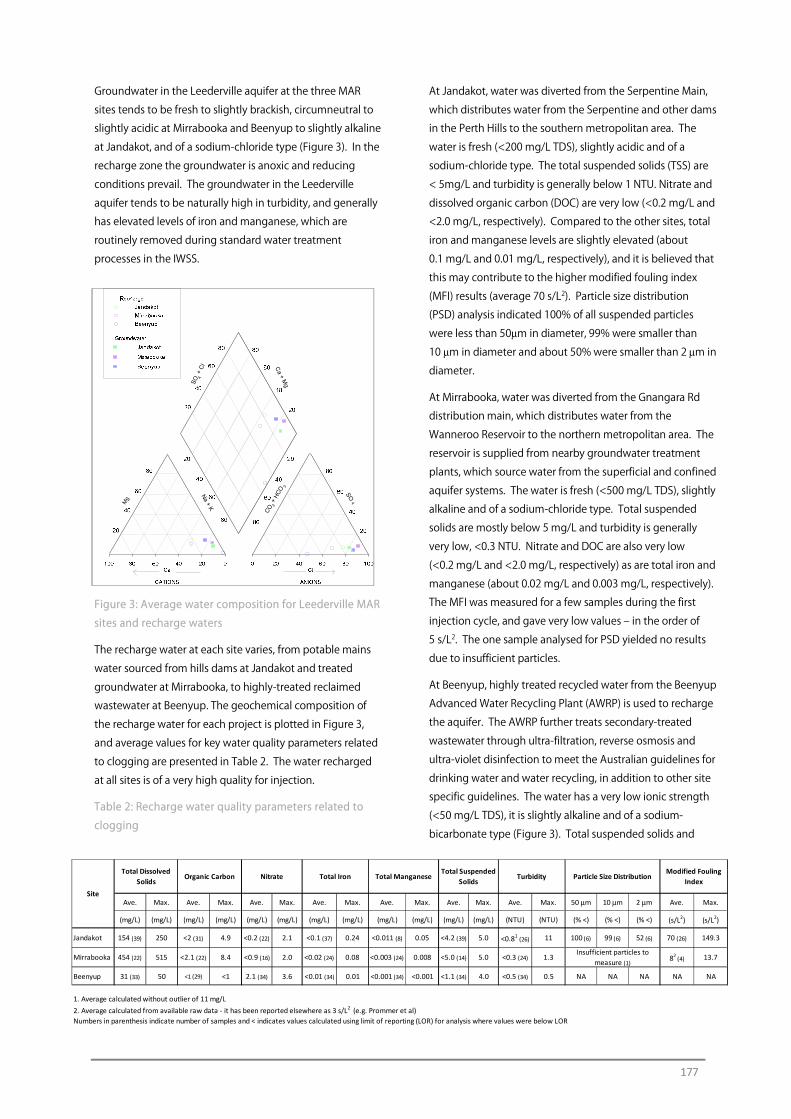
177
Groundwater in the Leederville aquifer at the three MAR
sites tends to be fresh to slightly brackish, circumneutral to
slightly acidic at Mirrabooka and Beenyup to slightly alkaline
at Jandakot, and of a sodium-chloride type (Figure 3). In the
recharge zone the groundwater is anoxic and reducing
conditions prevail. The groundwater in the Leederville
aquifer tends to be naturally high in turbidity, and generally
has elevated levels of iron and manganese, which are
routinely removed during standard water treatment
processes in the IWSS.
Figure 3: Average water composition for Leederville MAR
sites and recharge waters
The recharge water at each site varies, from potable mains
water sourced from hills dams at Jandakot and treated
groundwater at Mirrabooka, to highly-treated reclaimed
wastewater at Beenyup. The geochemical composition of
the recharge water for each project is plotted in Figure 3,
and average values for key water quality parameters related
to clogging are presented in Table 2. The water recharged
at all sites is of a very high quality for injection.
Table 2: Recharge water quality parameters related to
clogging
At Jandakot, water was diverted from the Serpentine Main,
which distributes water from the Serpentine and other dams
in the Perth Hills to the southern metropolitan area. The
water is fresh (<200 mg/L TDS), slightly acidic and of a
sodium-chloride type. The total suspended solids (TSS) are
< 5mg/L and turbidity is generally below 1 NTU. Nitrate and
dissolved organic carbon (DOC) are very low (<0.2 mg/L and
<2.0 mg/L, respectively). Compared to the other sites, total
iron and manganese levels are slightly elevated (about
0.1 mg/L and 0.01 mg/L, respectively), and it is believed that
this may contribute to the higher modified fouling index
(MFI) results (average 70 s/L2). Particle size distribution
(PSD) analysis indicated 100% of all suspended particles
were less than 50μm in diameter, 99% were smaller than
10 μm in diameter and about 50% were smaller than 2 μm in
diameter.
At Mirrabooka, water was diverted from the Gnangara Rd
distribution main, which distributes water from the
Wanneroo Reservoir to the northern metropolitan area. The
reservoir is supplied from nearby groundwater treatment
plants, which source water from the superficial and confined
aquifer systems. The water is fresh (<500 mg/L TDS), slightly
alkaline and of a sodium-chloride type. Total suspended
solids are mostly below 5 mg/L and turbidity is generally
very low, <0.3 NTU. Nitrate and DOC are also very low
(<0.2 mg/L and <2.0 mg/L, respectively) as are total iron and
manganese (about 0.02 mg/L and 0.003 mg/L, respectively).
The MFI was measured for a few samples during the first
injection cycle, and gave very low values ‒ in the order of
5 s/L2. The one sample analysed for PSD yielded no results
due to insufficient particles.
At Beenyup, highly treated recycled water from the Beenyup
Advanced Water Recycling Plant (AWRP) is used to recharge
the aquifer. The AWRP further treats secondary-treated
wastewater through ultra-filtration, reverse osmosis and
ultra-violet disinfection to meet the Australian guidelines for
drinking water and water recycling, in addition to other site
specific guidelines. The water has a very low ionic strength
(<50 mg/L TDS), it is slightly alkaline and of a sodium-
bicarbonate type (Figure 3). Total suspended solids and
Na + K
SO
4
CO
+ H
CO
3
3
SO
+ C
l4
Ca + M
g
Ave. Max. Ave. Max. Ave. Max. Ave. Max. Ave. Max. Ave. Max. Ave. Max. 50 μm 10 μm 2 μm Ave. Max.
(mg/L) (mg/L) (mg/L) (mg/L) (mg/L) (mg/L) (mg/L) (mg/L) (mg/L) (mg/L) (mg/L) (mg/L) (NTU) (NTU) (% <) (% <) (% <) (s/L2) (s/L2)
Jandakot 154 (39) 250 <2 (31) 4.9 <0.2 (22) 2.1 <0.1 (37) 0.24 <0.011 (8) 0.05 <4.2 (39) 5.0 <0.81 (26) 11 100 (6) 99 (6) 52 (6) 70 (26) 149.3
Mirrabooka 454 (22) 515 <2.1 (22) 8.4 <0.9 (16) 2.0 <0.02 (24) 0.08 <0.003 (24) 0.008 <5.0 (14) 5.0 <0.3 (24) 1.3 82 (4) 13.7
Beenyup 31 (33) 50 <1 (29) <1 2.1 (34) 3.6 <0.01 (34) 0.01 <0.001 (34) <0.001 <1.1 (34) 4.0 <0.5 (34) 0.5 NA NA NA NA NA
1. Average calculated without outlier of 11 mg/L2. Average calculated from available raw data - it has been reported elsewhere as 3 s/L2 (e.g. Prommer et al) Numbers in parenthesis indicate number of samples and < indicates values calculated using limit of reporting (LOR) for analysis where values were below LOR
Insufficient particles to measure (1)
Total Dissolved Solids
Total IronNitrateOrganic Carbon
Site
Modified Fouling Index
Particle Size DistributionTotal Suspended
SolidsTurbidityTotal Manganese
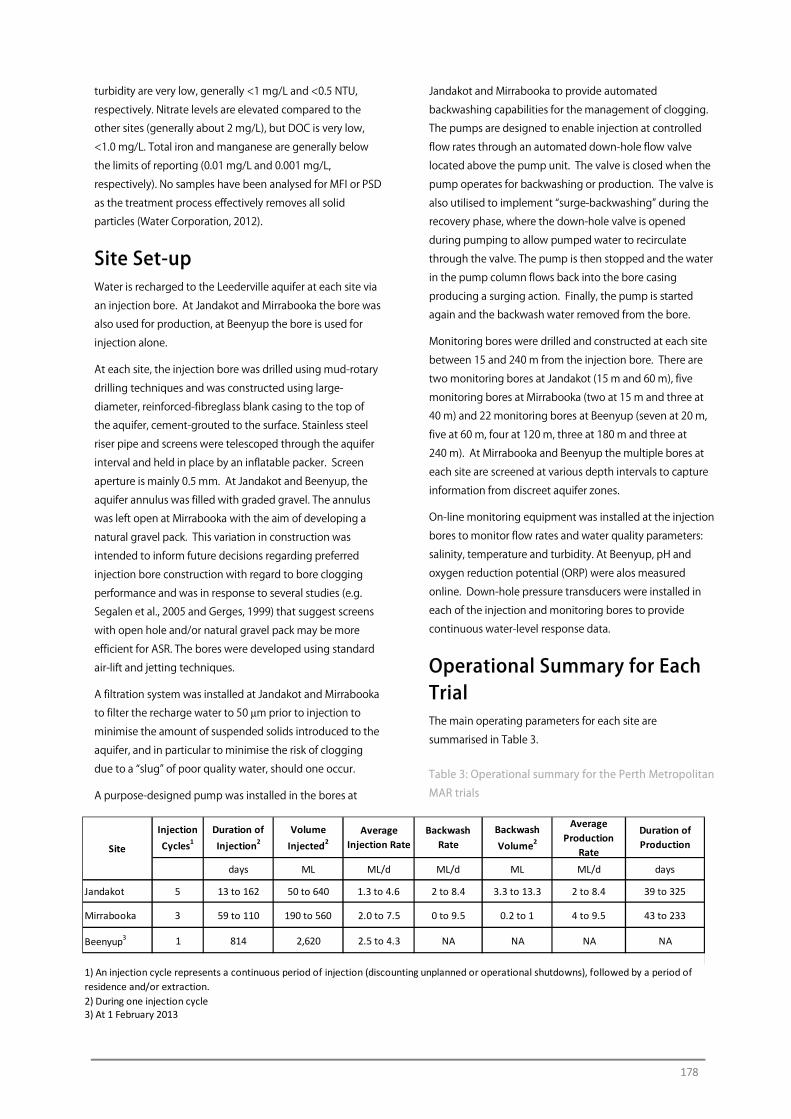
178
turbidity are very low, generally <1 mg/L and <0.5 NTU,
respectively. Nitrate levels are elevated compared to the
other sites (generally about 2 mg/L), but DOC is very low,
<1.0 mg/L. Total iron and manganese are generally below
the limits of reporting (0.01 mg/L and 0.001 mg/L,
respectively). No samples have been analysed for MFI or PSD
as the treatment process effectively removes all solid
particles (Water Corporation, 2012).
Site Set-up Water is recharged to the Leederville aquifer at each site via
an injection bore. At Jandakot and Mirrabooka the bore was
also used for production, at Beenyup the bore is used for
injection alone.
At each site, the injection bore was drilled using mud-rotary
drilling techniques and was constructed using large-
diameter, reinforced-fibreglass blank casing to the top of
the aquifer, cement-grouted to the surface. Stainless steel
riser pipe and screens were telescoped through the aquifer
interval and held in place by an inflatable packer. Screen
aperture is mainly 0.5 mm. At Jandakot and Beenyup, the
aquifer annulus was filled with graded gravel. The annulus
was left open at Mirrabooka with the aim of developing a
natural gravel pack. This variation in construction was
intended to inform future decisions regarding preferred
injection bore construction with regard to bore clogging
performance and was in response to several studies (e.g.
Segalen et al., 2005 and Gerges, 1999) that suggest screens
with open hole and/or natural gravel pack may be more
efficient for ASR. The bores were developed using standard
air-lift and jetting techniques.
A filtration system was installed at Jandakot and Mirrabooka
to filter the recharge water to 50 μm prior to injection to
minimise the amount of suspended solids introduced to the
aquifer, and in particular to minimise the risk of clogging
due to a “slug” of poor quality water, should one occur.
A purpose-designed pump was installed in the bores at
Jandakot and Mirrabooka to provide automated
backwashing capabilities for the management of clogging.
The pumps are designed to enable injection at controlled
flow rates through an automated down-hole flow valve
located above the pump unit. The valve is closed when the
pump operates for backwashing or production. The valve is
also utilised to implement “surge-backwashing” during the
recovery phase, where the down-hole valve is opened
during pumping to allow pumped water to recirculate
through the valve. The pump is then stopped and the water
in the pump column flows back into the bore casing
producing a surging action. Finally, the pump is started
again and the backwash water removed from the bore.
Monitoring bores were drilled and constructed at each site
between 15 and 240 m from the injection bore. There are
two monitoring bores at Jandakot (15 m and 60 m), five
monitoring bores at Mirrabooka (two at 15 m and three at
40 m) and 22 monitoring bores at Beenyup (seven at 20 m,
five at 60 m, four at 120 m, three at 180 m and three at
240 m). At Mirrabooka and Beenyup the multiple bores at
each site are screened at various depth intervals to capture
information from discreet aquifer zones.
On-line monitoring equipment was installed at the injection
bores to monitor flow rates and water quality parameters:
salinity, temperature and turbidity. At Beenyup, pH and
oxygen reduction potential (ORP) were alos measured
online. Down-hole pressure transducers were installed in
each of the injection and monitoring bores to provide
continuous water-level response data.
Operational Summary for Each Trial The main operating parameters for each site are
summarised in Table 3.
Table 3: Operational summary for the Perth Metropolitan
MAR trials
days ML ML/d ML/d ML ML/d days
Jandakot 5 13 to 162 50 to 640 1.3 to 4.6 2 to 8.4 3.3 to 13.3 2 to 8.4 39 to 325
Mirrabooka 3 59 to 110 190 to 560 2.0 to 7.5 0 to 9.5 0.2 to 1 4 to 9.5 43 to 233
Beenyup3 1 814 2,620 2.5 to 4.3 NA NA NA NA
2) During one injection cycle3) At 1 February 2013
1) An injection cycle represents a continuous period of injection (discounting unplanned or operational shutdowns), followed by a period of residence and/or extraction.
Backwash Volume2
Average Production
Rate
Duration of ProductionSite
Injection Cycles1
Duration of Injection2
Volume Injected2
Average Injection Rate
Backwash Rate
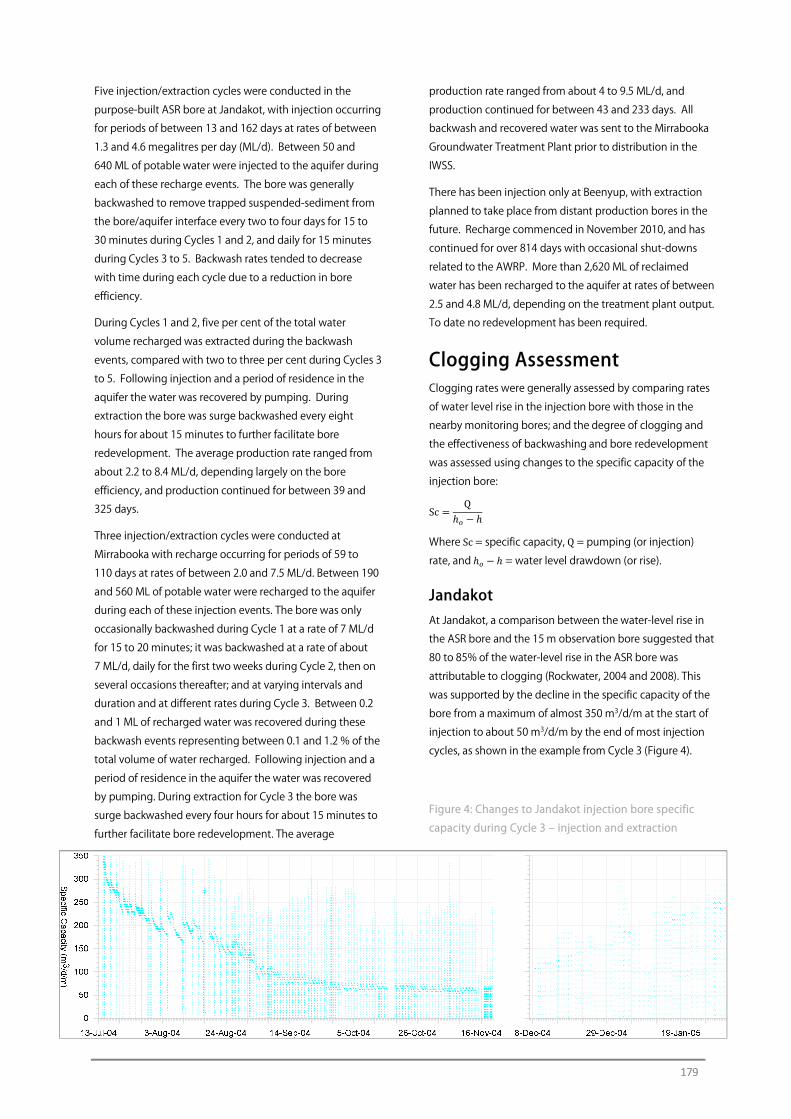
179
Five injection/extraction cycles were conducted in the
purpose-built ASR bore at Jandakot, with injection occurring
for periods of between 13 and 162 days at rates of between
1.3 and 4.6 megalitres per day (ML/d). Between 50 and
640 ML of potable water were injected to the aquifer during
each of these recharge events. The bore was generally
backwashed to remove trapped suspended-sediment from
the bore/aquifer interface every two to four days for 15 to
30 minutes during Cycles 1 and 2, and daily for 15 minutes
during Cycles 3 to 5. Backwash rates tended to decrease
with time during each cycle due to a reduction in bore
efficiency.
During Cycles 1 and 2, five per cent of the total water
volume recharged was extracted during the backwash
events, compared with two to three per cent during Cycles 3
to 5. Following injection and a period of residence in the
aquifer the water was recovered by pumping. During
extraction the bore was surge backwashed every eight
hours for about 15 minutes to further facilitate bore
redevelopment. The average production rate ranged from
about 2.2 to 8.4 ML/d, depending largely on the bore
efficiency, and production continued for between 39 and
325 days.
Three injection/extraction cycles were conducted at
Mirrabooka with recharge occurring for periods of 59 to
110 days at rates of between 2.0 and 7.5 ML/d. Between 190
and 560 ML of potable water were recharged to the aquifer
during each of these injection events. The bore was only
occasionally backwashed during Cycle 1 at a rate of 7 ML/d
for 15 to 20 minutes; it was backwashed at a rate of about
7 ML/d, daily for the first two weeks during Cycle 2, then on
several occasions thereafter; and at varying intervals and
duration and at different rates during Cycle 3. Between 0.2
and 1 ML of recharged water was recovered during these
backwash events representing between 0.1 and 1.2 % of the
total volume of water recharged. Following injection and a
period of residence in the aquifer the water was recovered
by pumping. During extraction for Cycle 3 the bore was
surge backwashed every four hours for about 15 minutes to
further facilitate bore redevelopment. The average
production rate ranged from about 4 to 9.5 ML/d, and
production continued for between 43 and 233 days. All
backwash and recovered water was sent to the Mirrabooka
Groundwater Treatment Plant prior to distribution in the
IWSS.
There has been injection only at Beenyup, with extraction
planned to take place from distant production bores in the
future. Recharge commenced in November 2010, and has
continued for over 814 days with occasional shut-downs
related to the AWRP. More than 2,620 ML of reclaimed
water has been recharged to the aquifer at rates of between
2.5 and 4.8 ML/d, depending on the treatment plant output.
To date no redevelopment has been required.
Clogging Assessment Clogging rates were generally assessed by comparing rates
of water level rise in the injection bore with those in the
nearby monitoring bores; and the degree of clogging and
the effectiveness of backwashing and bore redevelopment
was assessed using changes to the specific capacity of the
injection bore:
Sc = Qℎ − ℎ Where Sc = specific capacity, Q = pumping (or injection)
rate, and ℎ − ℎ = water level drawdown (or rise).
Jandakot At Jandakot, a comparison between the water-level rise in
the ASR bore and the 15 m observation bore suggested that
80 to 85% of the water-level rise in the ASR bore was
attributable to clogging (Rockwater, 2004 and 2008). This
was supported by the decline in the specific capacity of the
bore from a maximum of almost 350 m3/d/m at the start of
injection to about 50 m3/d/m by the end of most injection
cycles, as shown in the example from Cycle 3 (Figure 4).
Figure 4: Changes to Jandakot injection bore specific
capacity during Cycle 3 ‒ injection and extraction
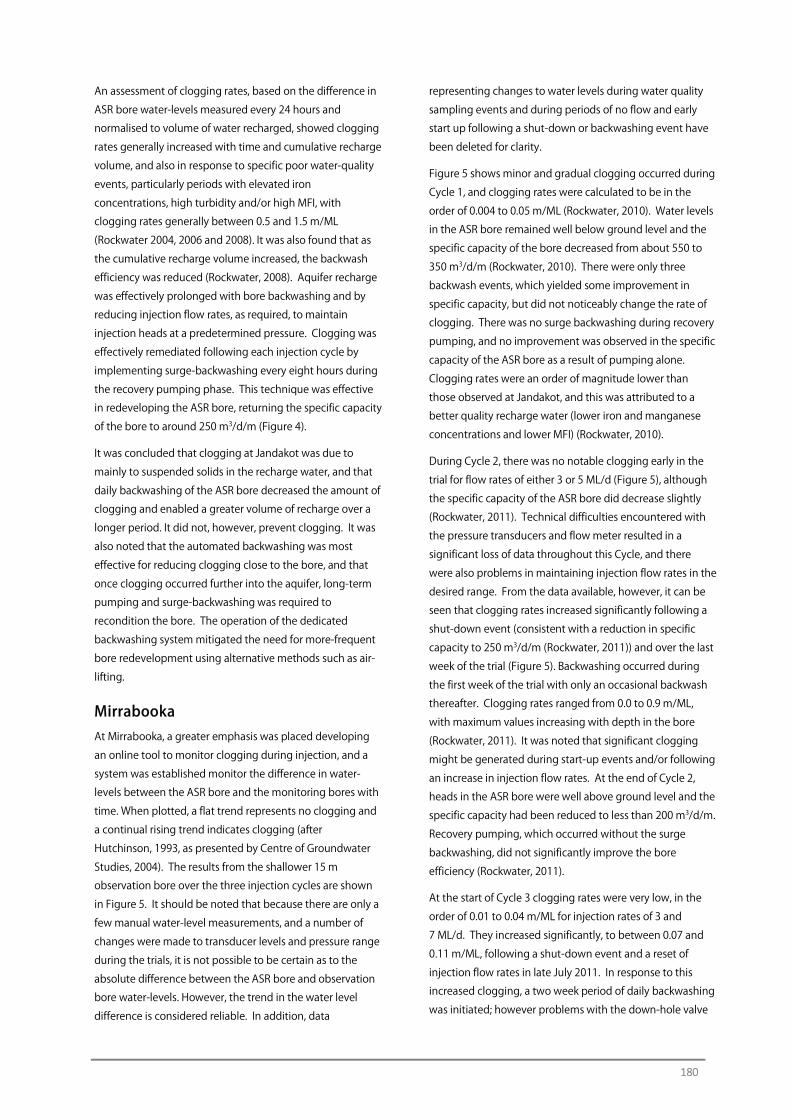
180
An assessment of clogging rates, based on the difference in
ASR bore water-levels measured every 24 hours and
normalised to volume of water recharged, showed clogging
rates generally increased with time and cumulative recharge
volume, and also in response to specific poor water-quality
events, particularly periods with elevated iron
concentrations, high turbidity and/or high MFI, with
clogging rates generally between 0.5 and 1.5 m/ML
(Rockwater 2004, 2006 and 2008). It was also found that as
the cumulative recharge volume increased, the backwash
efficiency was reduced (Rockwater, 2008). Aquifer recharge
was effectively prolonged with bore backwashing and by
reducing injection flow rates, as required, to maintain
injection heads at a predetermined pressure. Clogging was
effectively remediated following each injection cycle by
implementing surge-backwashing every eight hours during
the recovery pumping phase. This technique was effective
in redeveloping the ASR bore, returning the specific capacity
of the bore to around 250 m3/d/m (Figure 4).
It was concluded that clogging at Jandakot was due to
mainly to suspended solids in the recharge water, and that
daily backwashing of the ASR bore decreased the amount of
clogging and enabled a greater volume of recharge over a
longer period. It did not, however, prevent clogging. It was
also noted that the automated backwashing was most
effective for reducing clogging close to the bore, and that
once clogging occurred further into the aquifer, long-term
pumping and surge-backwashing was required to
recondition the bore. The operation of the dedicated
backwashing system mitigated the need for more-frequent
bore redevelopment using alternative methods such as air-
lifting.
Mirrabooka At Mirrabooka, a greater emphasis was placed developing
an online tool to monitor clogging during injection, and a
system was established monitor the difference in water-
levels between the ASR bore and the monitoring bores with
time. When plotted, a flat trend represents no clogging and
a continual rising trend indicates clogging (after
Hutchinson, 1993, as presented by Centre of Groundwater
Studies, 2004). The results from the shallower 15 m
observation bore over the three injection cycles are shown
in Figure 5. It should be noted that because there are only a
few manual water-level measurements, and a number of
changes were made to transducer levels and pressure range
during the trials, it is not possible to be certain as to the
absolute difference between the ASR bore and observation
bore water-levels. However, the trend in the water level
difference is considered reliable. In addition, data
representing changes to water levels during water quality
sampling events and during periods of no flow and early
start up following a shut-down or backwashing event have
been deleted for clarity.
Figure 5 shows minor and gradual clogging occurred during
Cycle 1, and clogging rates were calculated to be in the
order of 0.004 to 0.05 m/ML (Rockwater, 2010). Water levels
in the ASR bore remained well below ground level and the
specific capacity of the bore decreased from about 550 to
350 m3/d/m (Rockwater, 2010). There were only three
backwash events, which yielded some improvement in
specific capacity, but did not noticeably change the rate of
clogging. There was no surge backwashing during recovery
pumping, and no improvement was observed in the specific
capacity of the ASR bore as a result of pumping alone.
Clogging rates were an order of magnitude lower than
those observed at Jandakot, and this was attributed to a
better quality recharge water (lower iron and manganese
concentrations and lower MFI) (Rockwater, 2010).
During Cycle 2, there was no notable clogging early in the
trial for flow rates of either 3 or 5 ML/d (Figure 5), although
the specific capacity of the ASR bore did decrease slightly
(Rockwater, 2011). Technical difficulties encountered with
the pressure transducers and flow meter resulted in a
significant loss of data throughout this Cycle, and there
were also problems in maintaining injection flow rates in the
desired range. From the data available, however, it can be
seen that clogging rates increased significantly following a
shut-down event (consistent with a reduction in specific
capacity to 250 m3/d/m (Rockwater, 2011)) and over the last
week of the trial (Figure 5). Backwashing occurred during
the first week of the trial with only an occasional backwash
thereafter. Clogging rates ranged from 0.0 to 0.9 m/ML,
with maximum values increasing with depth in the bore
(Rockwater, 2011). It was noted that significant clogging
might be generated during start-up events and/or following
an increase in injection flow rates. At the end of Cycle 2,
heads in the ASR bore were well above ground level and the
specific capacity had been reduced to less than 200 m3/d/m.
Recovery pumping, which occurred without the surge
backwashing, did not significantly improve the bore
efficiency (Rockwater, 2011).
At the start of Cycle 3 clogging rates were very low, in the
order of 0.01 to 0.04 m/ML for injection rates of 3 and
7 ML/d. They increased significantly, to between 0.07 and
0.11 m/ML, following a shut-down event and a reset of
injection flow rates in late July 2011. In response to this
increased clogging, a two week period of daily backwashing
was initiated; however problems with the down-hole valve
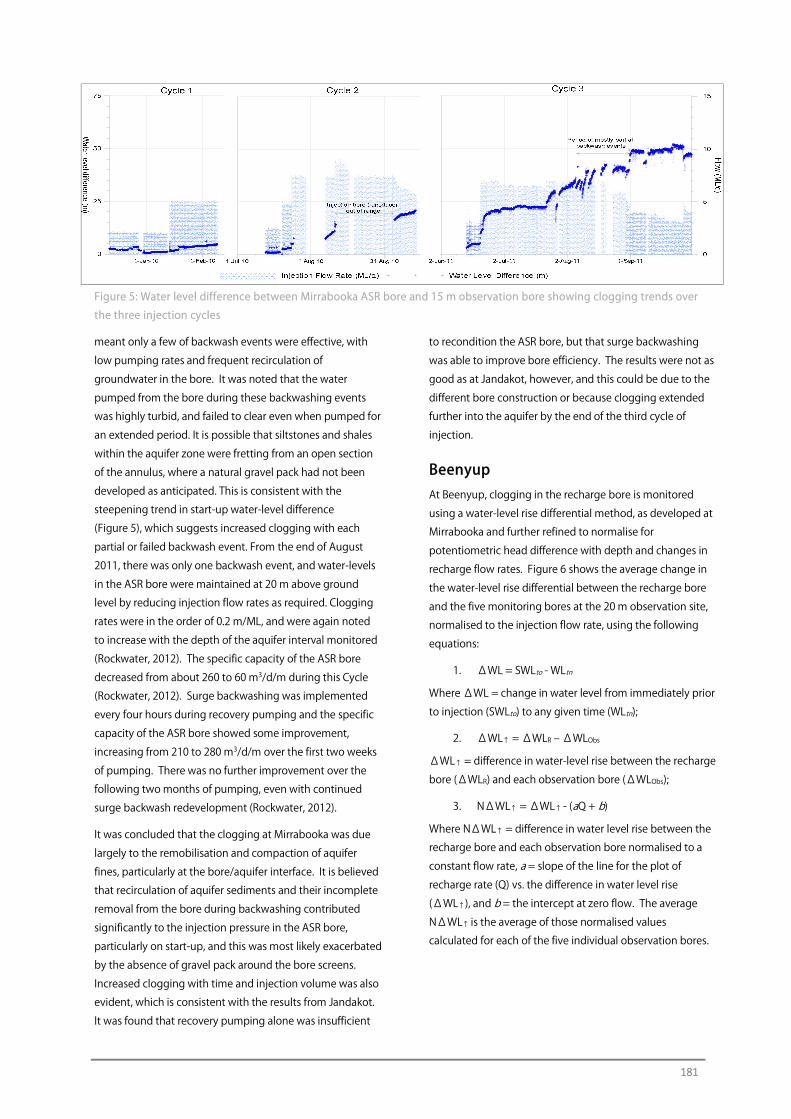
181
Figure 5: Water level difference between Mirrabooka ASR bore and 15 m observation bore showing clogging trends over
the three injection cycles
meant only a few of backwash events were effective, with
low pumping rates and frequent recirculation of
groundwater in the bore. It was noted that the water
pumped from the bore during these backwashing events
was highly turbid, and failed to clear even when pumped for
an extended period. It is possible that siltstones and shales
within the aquifer zone were fretting from an open section
of the annulus, where a natural gravel pack had not been
developed as anticipated. This is consistent with the
steepening trend in start-up water-level difference
(Figure 5), which suggests increased clogging with each
partial or failed backwash event. From the end of August
2011, there was only one backwash event, and water-levels
in the ASR bore were maintained at 20 m above ground
level by reducing injection flow rates as required. Clogging
rates were in the order of 0.2 m/ML, and were again noted
to increase with the depth of the aquifer interval monitored
(Rockwater, 2012). The specific capacity of the ASR bore
decreased from about 260 to 60 m3/d/m during this Cycle
(Rockwater, 2012). Surge backwashing was implemented
every four hours during recovery pumping and the specific
capacity of the ASR bore showed some improvement,
increasing from 210 to 280 m3/d/m over the first two weeks
of pumping. There was no further improvement over the
following two months of pumping, even with continued
surge backwash redevelopment (Rockwater, 2012).
It was concluded that the clogging at Mirrabooka was due
largely to the remobilisation and compaction of aquifer
fines, particularly at the bore/aquifer interface. It is believed
that recirculation of aquifer sediments and their incomplete
removal from the bore during backwashing contributed
significantly to the injection pressure in the ASR bore,
particularly on start-up, and this was most likely exacerbated
by the absence of gravel pack around the bore screens.
Increased clogging with time and injection volume was also
evident, which is consistent with the results from Jandakot.
It was found that recovery pumping alone was insufficient
to recondition the ASR bore, but that surge backwashing
was able to improve bore efficiency. The results were not as
good as at Jandakot, however, and this could be due to the
different bore construction or because clogging extended
further into the aquifer by the end of the third cycle of
injection.
Beenyup At Beenyup, clogging in the recharge bore is monitored
using a water-level rise differential method, as developed at
Mirrabooka and further refined to normalise for
potentiometric head difference with depth and changes in
recharge flow rates. Figure 6 shows the average change in
the water-level rise differential between the recharge bore
and the five monitoring bores at the 20 m observation site,
normalised to the injection flow rate, using the following
equations:
1. ΔWL = SWLto - WLtn
Where ΔWL = change in water level from immediately prior
to injection (SWLto) to any given time (WLtn);
2. ΔWL↑ = ΔWLR ‒ ΔWLObs
ΔWL↑ = difference in water-level rise between the recharge
bore (ΔWLR) and each observation bore (ΔWLObs);
3. NΔWL↑ = ΔWL↑ - (aQ + b)
Where NΔWL↑ = difference in water level rise between the
recharge bore and each observation bore normalised to a
constant flow rate, a = slope of the line for the plot of
recharge rate (Q) vs. the difference in water level rise
(ΔWL↑), and b = the intercept at zero flow. The average
NΔWL↑ is the average of those normalised values
calculated for each of the five individual observation bores.
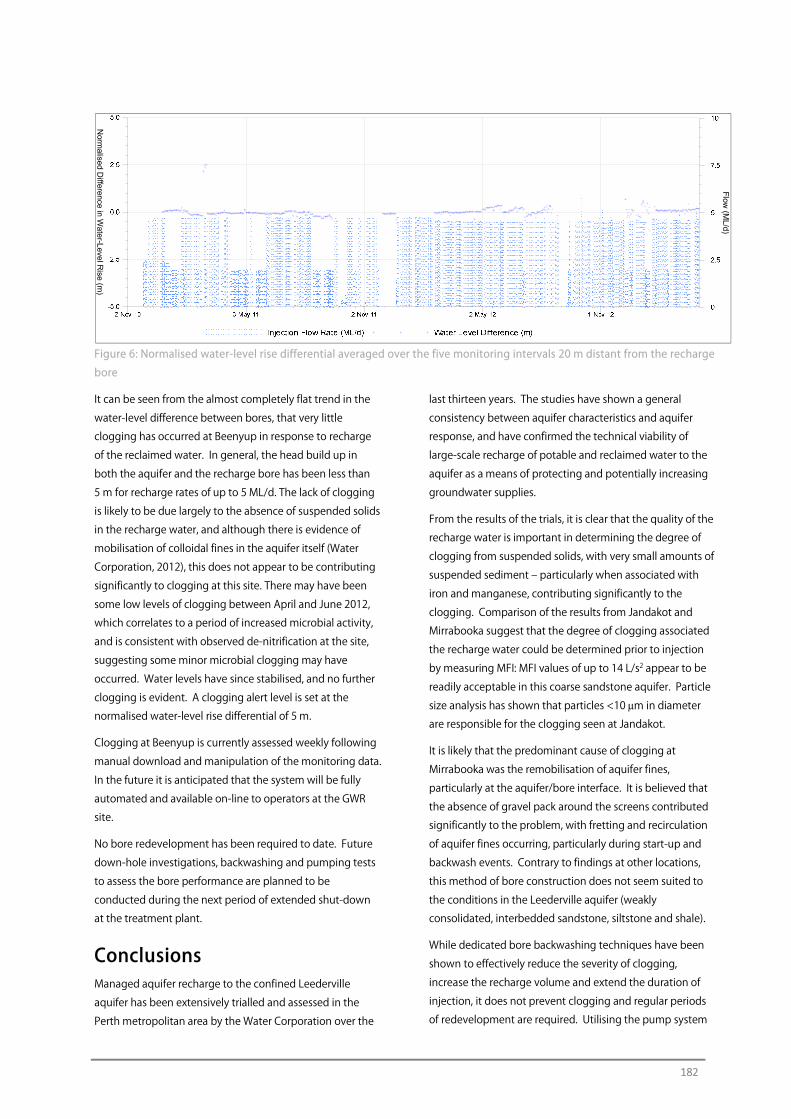
182
Figure 6: Normalised water-level rise differential averaged over the five monitoring intervals 20 m distant from the recharge
bore
It can be seen from the almost completely flat trend in the
water-level difference between bores, that very little
clogging has occurred at Beenyup in response to recharge
of the reclaimed water. In general, the head build up in
both the aquifer and the recharge bore has been less than
5 m for recharge rates of up to 5 ML/d. The lack of clogging
is likely to be due largely to the absence of suspended solids
in the recharge water, and although there is evidence of
mobilisation of colloidal fines in the aquifer itself (Water
Corporation, 2012), this does not appear to be contributing
significantly to clogging at this site. There may have been
some low levels of clogging between April and June 2012,
which correlates to a period of increased microbial activity,
and is consistent with observed de-nitrification at the site,
suggesting some minor microbial clogging may have
occurred. Water levels have since stabilised, and no further
clogging is evident. A clogging alert level is set at the
normalised water-level rise differential of 5 m.
Clogging at Beenyup is currently assessed weekly following
manual download and manipulation of the monitoring data.
In the future it is anticipated that the system will be fully
automated and available on-line to operators at the GWR
site.
No bore redevelopment has been required to date. Future
down-hole investigations, backwashing and pumping tests
to assess the bore performance are planned to be
conducted during the next period of extended shut-down
at the treatment plant.
Conclusions Managed aquifer recharge to the confined Leederville
aquifer has been extensively trialled and assessed in the
Perth metropolitan area by the Water Corporation over the
last thirteen years. The studies have shown a general
consistency between aquifer characteristics and aquifer
response, and have confirmed the technical viability of
large-scale recharge of potable and reclaimed water to the
aquifer as a means of protecting and potentially increasing
groundwater supplies.
From the results of the trials, it is clear that the quality of the
recharge water is important in determining the degree of
clogging from suspended solids, with very small amounts of
suspended sediment ‒ particularly when associated with
iron and manganese, contributing significantly to the
clogging. Comparison of the results from Jandakot and
Mirrabooka suggest that the degree of clogging associated
the recharge water could be determined prior to injection
by measuring MFI: MFI values of up to 14 L/s2 appear to be
readily acceptable in this coarse sandstone aquifer. Particle
size analysis has shown that particles <10 μm in diameter
are responsible for the clogging seen at Jandakot.
It is likely that the predominant cause of clogging at
Mirrabooka was the remobilisation of aquifer fines,
particularly at the aquifer/bore interface. It is believed that
the absence of gravel pack around the screens contributed
significantly to the problem, with fretting and recirculation
of aquifer fines occurring, particularly during start-up and
backwash events. Contrary to findings at other locations,
this method of bore construction does not seem suited to
the conditions in the Leederville aquifer (weakly
consolidated, interbedded sandstone, siltstone and shale).
While dedicated bore backwashing techniques have been
shown to effectively reduce the severity of clogging,
increase the recharge volume and extend the duration of
injection, it does not prevent clogging and regular periods
of redevelopment are required. Utilising the pump system
Norm
alisedD
ifferencein
Water-LevelR
ise(m
)
Flow
(ML/d)
183
to facilitate surge backwashing during recovery pumping
has also been shown to be an effective method of bore
redevelopment, significantly increasing the time between
more traditional bore development methods, such as air-
lifting. It should be noted, however, that this method has
been difficult to implement at an operational level, with
common technical difficulties and the additional
requirement to dispose of sometimes large amounts of very
poor quality backwash water. Neither of the trial schemes
has continued to a fully operational site.
The most successful site has been Beenyup, where the
recharge water has been of such high quality that significant
clogging has not occurred, and recharge operations are set
to continue into the foreseeable future.
References Centre for Groundwater Studies, (2004) 4th ASR national
workshop: management of aquifer recharge. Notes and
PowerPoint presentations, October 2004.
Segalen, A-S., Pavelic P. and Dillon P., (2005) Review of
drilling, completion and remediation methods for ASR wells
in unconsolidated aquifers. CSIRO Land and Water
Technical Report No. 04/05. March 2005.
Davidson, W. A., (1995) Hydrogeology and groundwater
resources of the Perth Region, Western Australia: Western
Australian Geological Survey, Bulletin 142.
Davidson, W.A., and Yu, X., (2008) Perth regional aquifer
modelling system (PRAMS) model development:
Hydrogeology and groundwater modelling, Western
Australia Department of Water, Hydrogeological record
series HG 20.
Gerges N.Z., (1999) Methods of well completion for ASR
wells and injection testing. Centre for Groundwater Studies,
4th ASR national workshop: management of aquifer
recharge. Notes and PowerPoint presentations, October
2004.
Leyland, L., (2011) Hydrogeology of the Leederville Aquifer,
Central Perth Basin, Western Australia. Thesis presented for
the degree of PhD. University of Western Australia, School
of Earth and Environment, July 2011.
NHMRC, (2011) Australian drinking water guidelines Paper 6
National water quality management strategy. National
Health and Medical Research Council and the Natural
Resource Management Ministerial Council, Canberra.
Prommer, H., Descourvieres C.D., Handyside, M., Johnston,
K., Harris, B., Li, Q., Costello, P., and Martin, M., (2011) Interim
Report ‒ Aquifer storage and recovery of potable water in
the Leederville Aquifer. CSIRO: Water for a Healthy Country
National Research Flagship
Rockwater, (2004) Jandakot aquifer storage and recovery
project. Results of Cycles 1 & 2: operational pilot.
Unpublished report to Water Corporation of Western
Australia, November 2004.
Rockwater, (2006) Jandakot aquifer storage and recovery
project. Results of Cycles 3 & 4: operational pilot.
Unpublished report to Water Corporation of Western
Australia, July 2006.
Rockwater, (2008) Jandakot aquifer storage and recovery
project. Results of Cycle 5: operational pilot. Unpublished
report to Water Corporation of Western Australia, November
2008.
Rockwater, (2010) Mirrabooka aquifer storage and recovery
trial. Results of Cycle 1: December 2009‒ April 2010.
Unpublished report to Water Corporation of Western
Australia, October 2010.
Rockwater, (2011) Mirrabooka aquifer storage and recovery
trial. Results and technical review for Cycle 2: July 2010 to
January 2011. Unpublished report to Water Corporation of
Western Australia, October 2011.
Rockwater, (2012) Mirrabooka aquifer storage and recovery
trial. Results and technical review for Cycle 3: June 2011 to
January 2012. Unpublished report to Water Corporation of
Western Australia, December 2012.
Water Corporation, (2012) Groundwater Report 2012.
Groundwater Replenishment Trial. Published by the Water
Corporation of Western Australia, ISBN 1 74043 810 8,
October 2012.
184
Domestic Scale Rainwater ASR Observations of Clogging and Effectiveness of its Management K. Barry1, P. Dillon1 and P. Pavelic2 1CSIRO Land and Water, 2 International Water Management Institute
1 Introduction Rainwater derived from roof surfaces may offer useful quantities of good quality water if it can be successfully
harvested and stored. Climate variability in more seasonally arid climates makes surface water storage risky and
viable alternatives are sought. Aquifer Storage and Recovery (ASR) is a technology whereby water is collected,
stored below ground and later recovered using a single well (Pyne, 2005). This can be effective in urban areas
where above ground storage is limited and the hydrogeology is favourable. An evaluation of a shallow Quaternary
system of alluvial aquifers of the Adelaide Plains (Pavelic et al., 1992) revealed that much of the metropolitan area
has potential for storage of water on a smaller scale in brackish aquifers. For example, by recharging domestic roof
runoff for use in garden watering in summer to further reduce demand on a stressed water supply system. This was
one of the activities explored in support of improved stormwater management as part of plans by the
Patawalonga Catchment Water Management Board (2002) and which also conformed to the 2004 South Australian
Government draft strategy ‘Water Proofing Adelaide’, now incorporated into the ‘Water for Good’ plan (2009).
However, one of the key measures of the success of the project would be whether clogging in the alluvial aquifer
could be managed with regular backwash/recovery events. Clogging of wells remains a major operational issue for
injection wells and aquifer storage and recovery (ASR) wells and can limit the quantity of water that can be stored
within the aquifer and may necessitate regular well redevelopment or even lead to site abandonment in extreme
cases (Pérez-Paricio and Carrera, 1999; Rinck-Pfeiffer et al., 2000). There are different causes of clogging in wells,
which can be driven by physical, chemical and biological processes that may act individually or collectively in-fill
pore spaces at or near the well-aquifer interface and thereby decrease aquifer permeability (Olsthoorn, 1982;
Baveye et al., 1998).
The primary objective of this study was to assess the operational performance of domestic-scale ASR with roof-
runoff (rainwater), determine causes for departures from predicted performance, and identify solutions to any
problems that arise, so that evidence-based advice can be given in the event that regulators wish to license such
installations. Various aspects of this project have been reported on previously in Barry et al (2005, 2007), Dillon and
Barry (2005) and this paper focuses largely on clogging and its management.
2 Site Description and Operation In June 2003 a domestic scale ASR demonstration trial
commenced in the rear garden of a residential dwelling at
Kingswood, South Australia, 6 km south-east of the city of
Adelaide. Establishment of the site began in April 2002
when two boreholes were drilled, located 5 m apart with
respective diameters of 100 mm for the northern well
(#6628-20967), and 125 mm for the southern well (#6628-
20968). These were installed to a depth of 24 m in the upper
Quaternary alluvial aquifer by rotary drilling with mud.
Although this form of drilling has been found to be
problematic for ASR in clay-rich alluvial profiles by Segalen
et al. (2005) and Pavelic et al. (2005), alternative methods
were not available due to constraints on access to the site
and limited budget. Each well was cased to the full 24 m
depth below ground, with slotted casing over the bottom
12 m interval. Below the surficial clay layer the profile is a
mixture of clay, sand and gravel to 21 m depth underlain by
185
a stiff clay base. The annulus around the slotted casing was
backfilled with washed gravel and the upper part of the
casing was sealed with a mixture of clay slurry and
bentonite. On completion of construction each well was ‘air
lifted’ until the discharging water appeared clear.
Pumping tests were conducted at a constant flow rate on
12th December 2002, and based on steady-state analysis
well yields of 95 m3/d (1.1 L/s) in the 100 mm well and
34 m3/d (0.4 L/s) in the 125 mm well were calculated. Depth
to static groundwater level was 12 m below ground surface
and ambient groundwater salinity was 2,500 mg/L.
Groundwater flows in a north-westerly direction with an
average hydraulic gradient of ~ 0.007. From these initial
results it was decided in June 2003 to install the injection
pipe in the 100 mm well with the higher hydraulic
conductivity (inferred from the well yield) and hence greater
capacity to receive injected water. The recovery pipe fitted
in the same well was connected to a pump and installed to a
depth of 18 m. The roof area of 285 m2 was connected to a
4 m3 surface tank (3 m3 active storage). At the inlet on the
top of the tank was a 0.12 m2, 1 mm strainer. An off-take
approximately 0.5 m above the base of the tank was
connected to the ASR well via a 100 µm filter, allowing
gravity feed when the volume of the water in the tank rose
above the outlet level. There was no other pre-treatment of
the injected rainwater.
ASR operations commenced 29 June 2003. Initial flow rates
were slow until air was expelled from the line, then flow
accelerated due to the hydraulic gradient between the tank
and the aquifer. Between June 2003 and August 2004 two
low-head flow meters monitored inflows and outflows to
and from the ASR well. Monitoring of groundwater levels at
hourly intervals was carried out using a pressure transducer
in the ASR well and a capacitance probe in the observation
well, as well as occasional manual measurements. On 30 July
2003 a water quality sonde was installed in the ASR well at
16 m depth and programmed to continuously monitor the
electrical conductivity (EC) and temperature at a half hourly
rate. Daily rainfall was read manually using a rain gauge.
Domestic water consumption within the house from
reticulated potable water supplies was determined from
monthly water meter readings.
Sampling of ambient water quality for each well was done in
December 2002, prior to the start of any injection. Periodic
samples of the roof run-off were collected before, during
and after the recharge season (winter months), with
samples submitted to the CSIRO Analytical Chemistry Unit
(ACU) for analyses of majors ions, nutrients and metals.
Monthly gutter clearing was carried out (from April 2004)
and the collections of leaf and gutter detritus were dried
and weighed, with one collection being analysed for
nutrient organic content. The 100 µm filter also required
regular cleaning out due to the loads introduced by the
decomposing leaf litter and fine sediment in runoff. Once
recharge commenced, an average 0.6 m3 was recovered per
month to purge the ASR well of any accumulated biofilm or
sediments and to assess the quality of the stored water.
Samples collected were analysed for electrical conductivity
(EC) and turbidity. Recovered sediment material from one of
these events, was also submitted for X-ray diffraction (XRD),
major and trace X-ray fluorescence (XRF) to the CSIRO XRF
laboratory and particle size analysis was carried out by the
ACU.
Although 142 m3 of rainwater was injected during this first
year of operation (29th June 2003 to 21st July 2004) the water
recovered during purging events showed the salinity of
water was still close to background level and hence not
suitable for garden irrigation. Following assessment of the
recovered water quality data collected to date, a second set
of pumping tests was carried out on 21st/22nd July 2004 to
assess the transmissivity changes and it was decided to
move the injection pipe to the lower yielding 125 mm
diameter well, to determine if the lower aquifer
transmissivity would retain the fresh injectant closer to the
well and thereby produce recovered water of lower salinity.
In September 2004, to further automate the monitoring of
the ASR site, a logger unit was connected to pressure
transducers, to monitor water levels in the ASR well and the
house rainwater tank, a pluviometer was connected to
monitor rainfall. The unit also had the capability to monitor
the volumes and temperature of inflow and outflow and the
electrical conductivity (EC) of recovered water. The sensors
for these parameters were installed in August 2005. The
logger unit recorded data in three modes; (i) event data
collection was triggered at 20 L volume increments during
injection and 10 L volume increments during recovery and
readings of depth, EC, temperature and volume were
recorded, (ii) two hourly readings of all sensors were
collected on an ongoing basis and (iii) daily volumes were
calculated from the monitored flowmeters. The rainfall
catchment was increased partially between August‒
December 2005 when the runoff from a neighbouring roof
(78 m2) was connected. Figure 1 summarises the final site
layout as of September 2005.
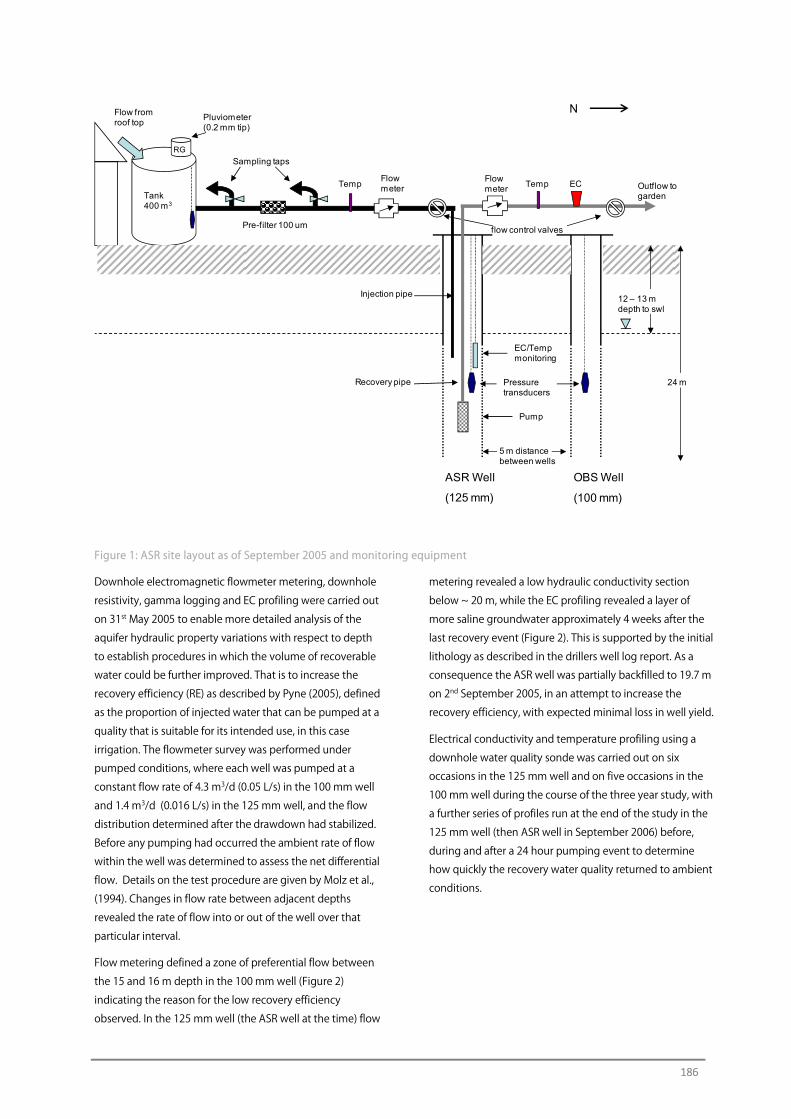
186
Figure 1: ASR site layout as of September 2005 and monitoring equipment
Downhole electromagnetic flowmeter metering, downhole
resistivity, gamma logging and EC profiling were carried out
on 31st May 2005 to enable more detailed analysis of the
aquifer hydraulic property variations with respect to depth
to establish procedures in which the volume of recoverable
water could be further improved. That is to increase the
recovery efficiency (RE) as described by Pyne (2005), defined
as the proportion of injected water that can be pumped at a
quality that is suitable for its intended use, in this case
irrigation. The flowmeter survey was performed under
pumped conditions, where each well was pumped at a
constant flow rate of 4.3 m3/d (0.05 L/s) in the 100 mm well
and 1.4 m3/d (0.016 L/s) in the 125 mm well, and the flow
distribution determined after the drawdown had stabilized.
Before any pumping had occurred the ambient rate of flow
within the well was determined to assess the net differential
flow. Details on the test procedure are given by Molz et al.,
(1994). Changes in flow rate between adjacent depths
revealed the rate of flow into or out of the well over that
particular interval.
Flow metering defined a zone of preferential flow between
the 15 and 16 m depth in the 100 mm well (Figure 2)
indicating the reason for the low recovery efficiency
observed. In the 125 mm well (the ASR well at the time) flow
metering revealed a low hydraulic conductivity section
below ~ 20 m, while the EC profiling revealed a layer of
more saline groundwater approximately 4 weeks after the
last recovery event (Figure 2). This is supported by the initial
lithology as described in the drillers well log report. As a
consequence the ASR well was partially backfilled to 19.7 m
on 2nd September 2005, in an attempt to increase the
recovery efficiency, with expected minimal loss in well yield.
Electrical conductivity and temperature profiling using a
downhole water quality sonde was carried out on six
occasions in the 125 mm well and on five occasions in the
100 mm well during the course of the three year study, with
a further series of profiles run at the end of the study in the
125 mm well (then ASR well in September 2006) before,
during and after a 24 hour pumping event to determine
how quickly the recovery water quality returned to ambient
conditions.
flow control valvesPre-filter 100 um
Pressure transducers
EC/Temp monitoring
Flow meter
Flow meter
Temp Temp EC
Pump
Tank 400 m3
Sampling taps
Outflow to garden
Flow from roof top
RG
Pluviometer(0.2 mm tip)
24 m
Injection pipe
Recovery pipe
12 – 13 m depth to swl
ASR Well
(125 mm)
OBS Well
(100 mm)
5 m distance between wells
N
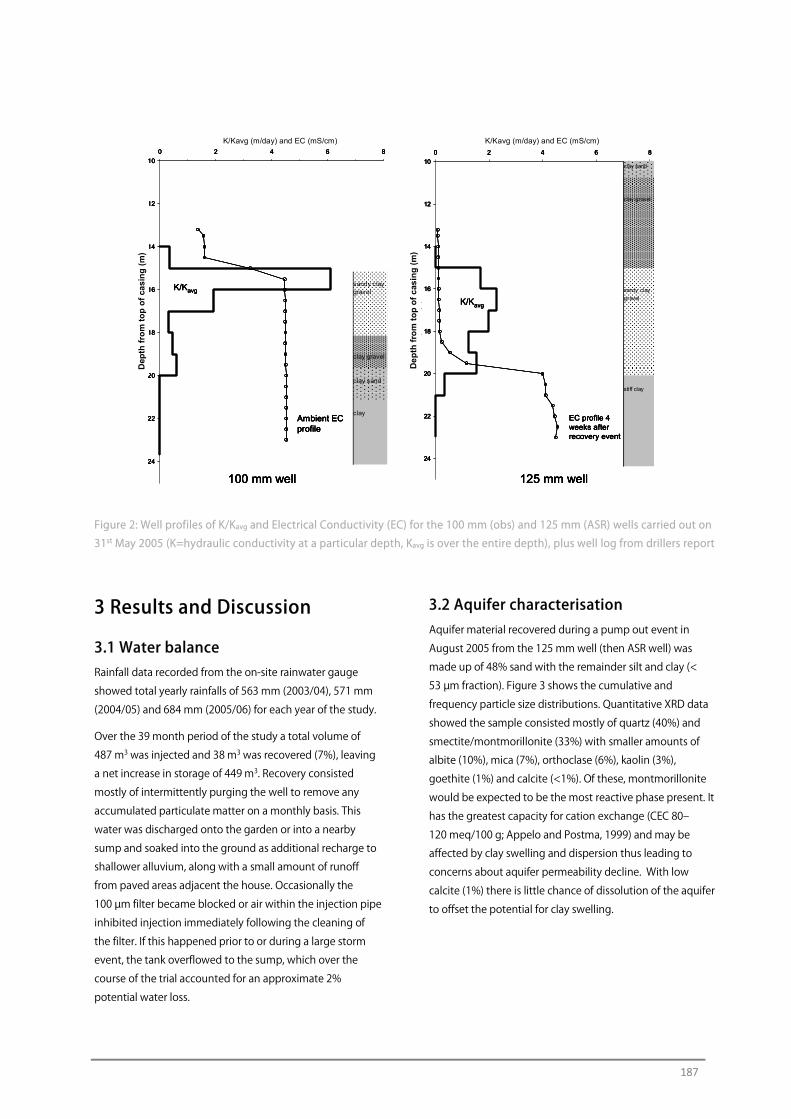
187
Figure 2: Well profiles of K/Kavg and Electrical Conductivity (EC) for the 100 mm (obs) and 125 mm (ASR) wells carried out on
31st May 2005 (K=hydraulic conductivity at a particular depth, Kavg is over the entire depth), plus well log from drillers report
3 Results and Discussion
3.1 Water balance Rainfall data recorded from the on-site rainwater gauge
showed total yearly rainfalls of 563 mm (2003/04), 571 mm
(2004/05) and 684 mm (2005/06) for each year of the study.
Over the 39 month period of the study a total volume of
487 m3 was injected and 38 m3 was recovered (7%), leaving
a net increase in storage of 449 m3. Recovery consisted
mostly of intermittently purging the well to remove any
accumulated particulate matter on a monthly basis. This
water was discharged onto the garden or into a nearby
sump and soaked into the ground as additional recharge to
shallower alluvium, along with a small amount of runoff
from paved areas adjacent the house. Occasionally the
100 µm filter became blocked or air within the injection pipe
inhibited injection immediately following the cleaning of
the filter. If this happened prior to or during a large storm
event, the tank overflowed to the sump, which over the
course of the trial accounted for an approximate 2%
potential water loss.
3.2 Aquifer characterisation Aquifer material recovered during a pump out event in
August 2005 from the 125 mm well (then ASR well) was
made up of 48% sand with the remainder silt and clay (<
53 µm fraction). Figure 3 shows the cumulative and
frequency particle size distributions. Quantitative XRD data
showed the sample consisted mostly of quartz (40%) and
smectite/montmorillonite (33%) with smaller amounts of
albite (10%), mica (7%), orthoclase (6%), kaolin (3%),
goethite (1%) and calcite (<1%). Of these, montmorillonite
would be expected to be the most reactive phase present. It
has the greatest capacity for cation exchange (CEC 80‒
120 meq/100 g; Appelo and Postma, 1999) and may be
affected by clay swelling and dispersion thus leading to
concerns about aquifer permeability decline. With low
calcite (1%) there is little chance of dissolution of the aquifer
to offset the potential for clay swelling.
10
12
14
16
18
20
22
24
0 2 4 6 8
K/Kavg and EC (mS/cm)
Dep
th T
OC
(m
)
10
12
14
16
18
20
22
24
0 2 4 6 8
K/Kavg and EC (mS/cm)D
epth
TO
C (
m)
Ambient EC profile
EC profile 4 weeks after recovery event
100 mm well 125 mm well
K/Kavg
K/Kavg
K/Kavg (m/day) and EC (mS/cm) K/Kavg (m/day) and EC (mS/cm)D
epth
fro
m t
op
of
cas
ing
(m
)
De
pth
fro
m t
op
of
cas
ing
(m
)
10
12
14
16
18
20
22
24
0 2 4 6 8
K/Kavg and EC (mS/cm)
Dep
th T
OC
(m
)
10
12
14
16
18
20
22
24
0 2 4 6 8
K/Kavg and EC (mS/cm)D
epth
TO
C (
m)
Ambient EC profile
EC profile 4 weeks after recovery event
100 mm well 125 mm well
K/Kavg
K/Kavg
K/Kavg (m/day) and EC (mS/cm) K/Kavg (m/day) and EC (mS/cm)
10
12
14
16
18
20
22
24
0 2 4 6 8
K/Kavg and EC (mS/cm)
Dep
th T
OC
(m
)
10
12
14
16
18
20
22
24
0 2 4 6 8
K/Kavg and EC (mS/cm)D
epth
TO
C (
m)
Ambient EC profile
EC profile 4 weeks after recovery event
100 mm well 125 mm well
K/Kavg
K/Kavg
10
12
14
16
18
20
22
24
0 2 4 6 8
K/Kavg and EC (mS/cm)
Dep
th T
OC
(m
)
10
12
14
16
18
20
22
24
0 2 4 6 8
K/Kavg and EC (mS/cm)D
epth
TO
C (
m)
Ambient EC profile
EC profile 4 weeks after recovery event
100 mm well 125 mm well
K/Kavg
K/Kavg
K/Kavg (m/day) and EC (mS/cm) K/Kavg (m/day) and EC (mS/cm)D
epth
fro
m t
op
of
cas
ing
(m
)
De
pth
fro
m t
op
of
cas
ing
(m
)
clay sand
clay gravel
sandy clay
gravel
stiff clay
sandy claygravel
clay gravel
clay sand
clay
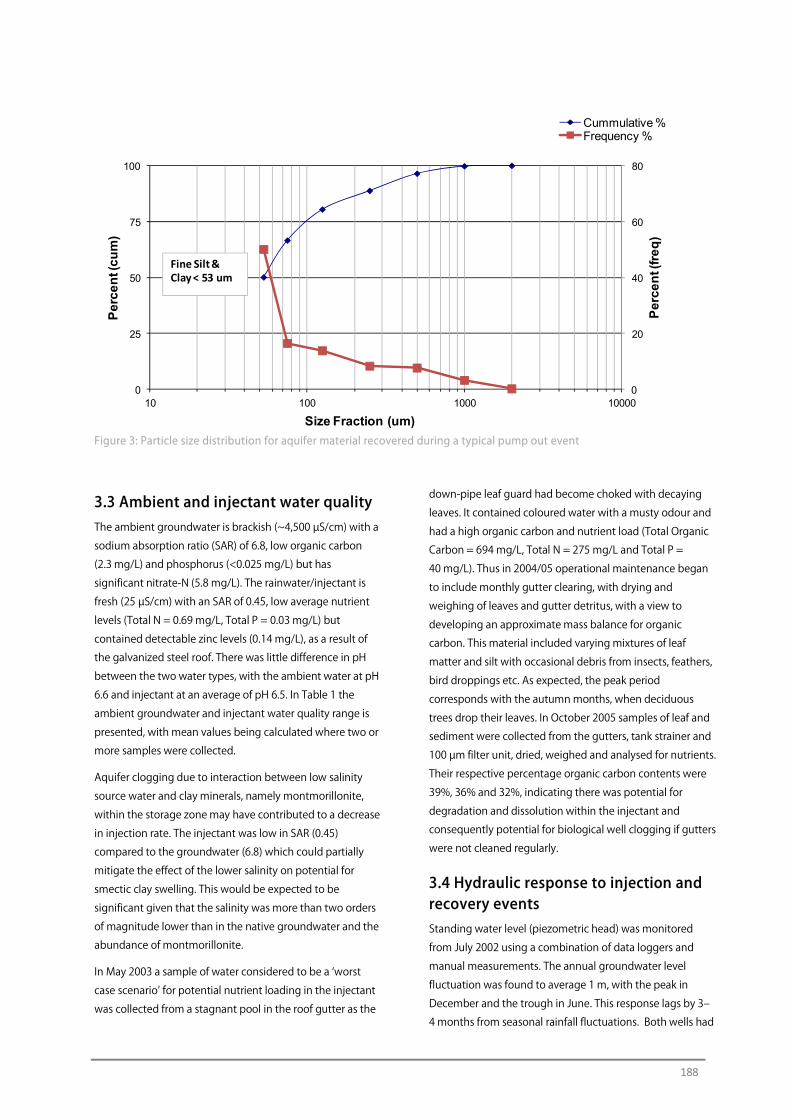
188
Figure 3: Particle size distribution for aquifer material recovered during a typical pump out event
3.3 Ambient and injectant water quality The ambient groundwater is brackish (~4,500 µS/cm) with a
sodium absorption ratio (SAR) of 6.8, low organic carbon
(2.3 mg/L) and phosphorus (<0.025 mg/L) but has
significant nitrate-N (5.8 mg/L). The rainwater/injectant is
fresh (25 µS/cm) with an SAR of 0.45, low average nutrient
levels (Total N = 0.69 mg/L, Total P = 0.03 mg/L) but
contained detectable zinc levels (0.14 mg/L), as a result of
the galvanized steel roof. There was little difference in pH
between the two water types, with the ambient water at pH
6.6 and injectant at an average of pH 6.5. In Table 1 the
ambient groundwater and injectant water quality range is
presented, with mean values being calculated where two or
more samples were collected.
Aquifer clogging due to interaction between low salinity
source water and clay minerals, namely montmorillonite,
within the storage zone may have contributed to a decrease
in injection rate. The injectant was low in SAR (0.45)
compared to the groundwater (6.8) which could partially
mitigate the effect of the lower salinity on potential for
smectic clay swelling. This would be expected to be
significant given that the salinity was more than two orders
of magnitude lower than in the native groundwater and the
abundance of montmorillonite.
In May 2003 a sample of water considered to be a ‘worst
case scenario’ for potential nutrient loading in the injectant
was collected from a stagnant pool in the roof gutter as the
down-pipe leaf guard had become choked with decaying
leaves. It contained coloured water with a musty odour and
had a high organic carbon and nutrient load (Total Organic
Carbon = 694 mg/L, Total N = 275 mg/L and Total P =
40 mg/L). Thus in 2004/05 operational maintenance began
to include monthly gutter clearing, with drying and
weighing of leaves and gutter detritus, with a view to
developing an approximate mass balance for organic
carbon. This material included varying mixtures of leaf
matter and silt with occasional debris from insects, feathers,
bird droppings etc. As expected, the peak period
corresponds with the autumn months, when deciduous
trees drop their leaves. In October 2005 samples of leaf and
sediment were collected from the gutters, tank strainer and
100 µm filter unit, dried, weighed and analysed for nutrients.
Their respective percentage organic carbon contents were
39%, 36% and 32%, indicating there was potential for
degradation and dissolution within the injectant and
consequently potential for biological well clogging if gutters
were not cleaned regularly.
3.4 Hydraulic response to injection and recovery events Standing water level (piezometric head) was monitored
from July 2002 using a combination of data loggers and
manual measurements. The annual groundwater level
fluctuation was found to average 1 m, with the peak in
December and the trough in June. This response lags by 3‒
4 months from seasonal rainfall fluctuations. Both wells had
0
20
40
60
80
0
25
50
75
100
10 100 1000 10000
Pe
rce
nt (
fre
q)
Pe
rce
nt (
cu
m)
Size Fraction (um)
Cummulative %Frequency %
Fine Silt & Clay < 53 um
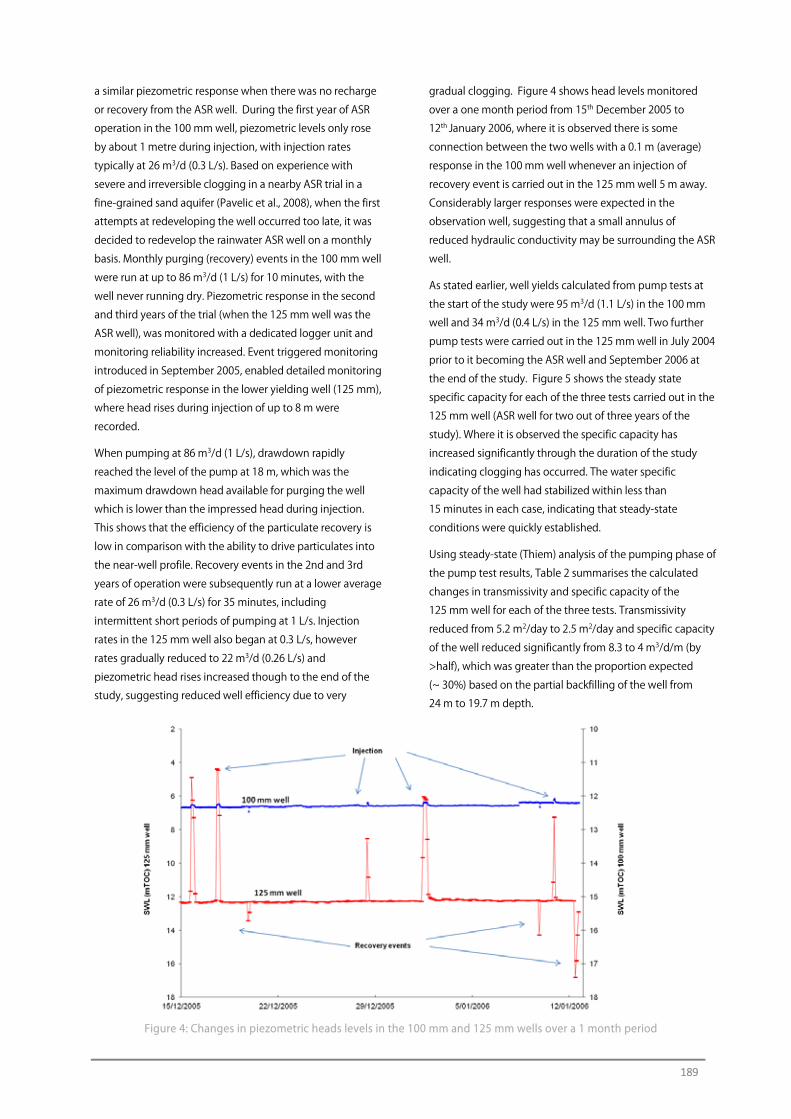
189
a similar piezometric response when there was no recharge
or recovery from the ASR well. During the first year of ASR
operation in the 100 mm well, piezometric levels only rose
by about 1 metre during injection, with injection rates
typically at 26 m3/d (0.3 L/s). Based on experience with
severe and irreversible clogging in a nearby ASR trial in a
fine-grained sand aquifer (Pavelic et al., 2008), when the first
attempts at redeveloping the well occurred too late, it was
decided to redevelop the rainwater ASR well on a monthly
basis. Monthly purging (recovery) events in the 100 mm well
were run at up to 86 m3/d (1 L/s) for 10 minutes, with the
well never running dry. Piezometric response in the second
and third years of the trial (when the 125 mm well was the
ASR well), was monitored with a dedicated logger unit and
monitoring reliability increased. Event triggered monitoring
introduced in September 2005, enabled detailed monitoring
of piezometric response in the lower yielding well (125 mm),
where head rises during injection of up to 8 m were
recorded.
When pumping at 86 m3/d (1 L/s), drawdown rapidly
reached the level of the pump at 18 m, which was the
maximum drawdown head available for purging the well
which is lower than the impressed head during injection.
This shows that the efficiency of the particulate recovery is
low in comparison with the ability to drive particulates into
the near-well profile. Recovery events in the 2nd and 3rd
years of operation were subsequently run at a lower average
rate of 26 m3/d (0.3 L/s) for 35 minutes, including
intermittent short periods of pumping at 1 L/s. Injection
rates in the 125 mm well also began at 0.3 L/s, however
rates gradually reduced to 22 m3/d (0.26 L/s) and
piezometric head rises increased though to the end of the
study, suggesting reduced well efficiency due to very
gradual clogging. Figure 4 shows head levels monitored
over a one month period from 15th December 2005 to
12th January 2006, where it is observed there is some
connection between the two wells with a 0.1 m (average)
response in the 100 mm well whenever an injection of
recovery event is carried out in the 125 mm well 5 m away.
Considerably larger responses were expected in the
observation well, suggesting that a small annulus of
reduced hydraulic conductivity may be surrounding the ASR
well.
As stated earlier, well yields calculated from pump tests at
the start of the study were 95 m3/d (1.1 L/s) in the 100 mm
well and 34 m3/d (0.4 L/s) in the 125 mm well. Two further
pump tests were carried out in the 125 mm well in July 2004
prior to it becoming the ASR well and September 2006 at
the end of the study. Figure 5 shows the steady state
specific capacity for each of the three tests carried out in the
125 mm well (ASR well for two out of three years of the
study). Where it is observed the specific capacity has
increased significantly through the duration of the study
indicating clogging has occurred. The water specific
capacity of the well had stabilized within less than
15 minutes in each case, indicating that steady-state
conditions were quickly established.
Using steady-state (Thiem) analysis of the pumping phase of
the pump test results, Table 2 summarises the calculated
changes in transmissivity and specific capacity of the
125 mm well for each of the three tests. Transmissivity
reduced from 5.2 m2/day to 2.5 m2/day and specific capacity
of the well reduced significantly from 8.3 to 4 m3/d/m (by
>half), which was greater than the proportion expected
(~ 30%) based on the partial backfilling of the well from
24 m to 19.7 m depth.
Figure 4: Changes in piezometric heads levels in the 100 mm and 125 mm wells over a 1 month period
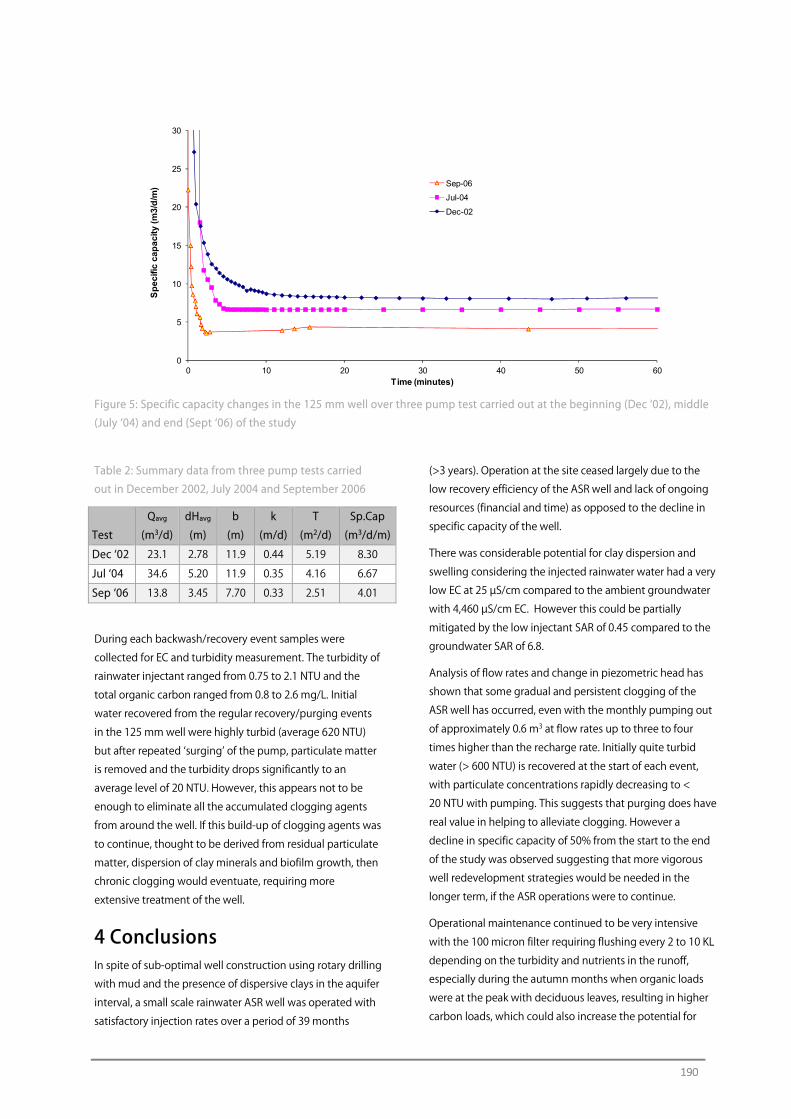
190
Figure 5: Specific capacity changes in the 125 mm well over three pump test carried out at the beginning (Dec ‘02), middle
(July ‘04) and end (Sept ‘06) of the study
Table 2: Summary data from three pump tests carried
out in December 2002, July 2004 and September 2006
Test
Qavg
(m3/d)
dHavg
(m)
b
(m)
k
(m/d)
T
(m2/d)
Sp.Cap
(m3/d/m)
Dec ‘02 23.1 2.78 11.9 0.44 5.19 8.30
Jul ‘04 34.6 5.20 11.9 0.35 4.16 6.67
Sep ‘06 13.8 3.45 7.70 0.33 2.51 4.01
During each backwash/recovery event samples were
collected for EC and turbidity measurement. The turbidity of
rainwater injectant ranged from 0.75 to 2.1 NTU and the
total organic carbon ranged from 0.8 to 2.6 mg/L. Initial
water recovered from the regular recovery/purging events
in the 125 mm well were highly turbid (average 620 NTU)
but after repeated ‘surging’ of the pump, particulate matter
is removed and the turbidity drops significantly to an
average level of 20 NTU. However, this appears not to be
enough to eliminate all the accumulated clogging agents
from around the well. If this build-up of clogging agents was
to continue, thought to be derived from residual particulate
matter, dispersion of clay minerals and biofilm growth, then
chronic clogging would eventuate, requiring more
extensive treatment of the well.
4 Conclusions In spite of sub-optimal well construction using rotary drilling
with mud and the presence of dispersive clays in the aquifer
interval, a small scale rainwater ASR well was operated with
satisfactory injection rates over a period of 39 months
(>3 years). Operation at the site ceased largely due to the
low recovery efficiency of the ASR well and lack of ongoing
resources (financial and time) as opposed to the decline in
specific capacity of the well.
There was considerable potential for clay dispersion and
swelling considering the injected rainwater water had a very
low EC at 25 µS/cm compared to the ambient groundwater
with 4,460 µS/cm EC. However this could be partially
mitigated by the low injectant SAR of 0.45 compared to the
groundwater SAR of 6.8.
Analysis of flow rates and change in piezometric head has
shown that some gradual and persistent clogging of the
ASR well has occurred, even with the monthly pumping out
of approximately 0.6 m3 at flow rates up to three to four
times higher than the recharge rate. Initially quite turbid
water (> 600 NTU) is recovered at the start of each event,
with particulate concentrations rapidly decreasing to <
20 NTU with pumping. This suggests that purging does have
real value in helping to alleviate clogging. However a
decline in specific capacity of 50% from the start to the end
of the study was observed suggesting that more vigorous
well redevelopment strategies would be needed in the
longer term, if the ASR operations were to continue.
Operational maintenance continued to be very intensive
with the 100 micron filter requiring flushing every 2 to 10 KL
depending on the turbidity and nutrients in the runoff,
especially during the autumn months when organic loads
were at the peak with deciduous leaves, resulting in higher
carbon loads, which could also increase the potential for
0
5
10
15
20
25
30
0 10 20 30 40 50 60
Sp
ecifi
c c
apa
city
(m
3/d
/m)
Time (minutes)
Sep-06
Jul-04
Dec-02

191
clogging of the injection well if not managed by regular
gutter cleaning.
Determining which mechanism; (i) well construction, (ii)
aquifer lithology, (iii) low injectant salinity, (iv) particulates
or (v) organic carbon load, was the primary reason for
gradual reduction in specific capacity of the well is difficult.
However given that the salinity was more than two orders of
magnitude lower than in the native groundwater and with
the abundance of montmorillonite (33%) in the profile and
with minimal calcite (<1%) available for dissolution, there
was a significant risk that clogging would occur in the ASR
well. Turbidity and carbon loads in the injectant were kept
at a minimum with the regular maintenance regime.
No other water treatments were considered during this field
trial. With minimal difference in pH between the ambient
and rainwater and low calcite in the aquifer material, pH
buffering of the rainwater was not considered, but other
options which could have been investigated had the project
continued would be; (a) disinfection of the well to kill off any
polysaccharide producing bacteria and (b) further
decreasing the SAR value of the water by adding a divalent
cation solution, though in this case the injectant was already
low in SAR.
5 Acknowledgements The monitoring reported in this paper was made possible
through the support of the Patawalonga Catchment Water
Management Board now incorporated within the Adelaide
and Mt Lofty Ranges Natural Resources Management Board.
Flow meters were provided by SA Water Corporation.
Downhole flowmetering was performed by Don Freebairn
and Vic Freschi from the Geophysics Section of the
Department of Water, Land and Biodiversity Conservation,
SA. James Ward from Flinders University of South Australia
assisted with a level survey of local wells. Water quality and
sediment analysis was provided by CSIRO Land and Water
Analytical Services and Mineralogical Services.
6 References Appelo, C.A.J., and Postma, D., (1999) Groundwater,
geochemistry and pollution. A. A. Balkema, Netherlands.
Barry, K., and Dillon, P., (2005) Domestic-scale ASR with
rainwater at Kingswood, South Australia. Proceedings of the
5th International Symposium on Management of Aquifer
Recharge. ISMAR5, Berlin, Germany. 11‒16 June 2005.
Barry, K., Dillon, P., and Pavelic, P., Mixing and clogging
constraints on domestic-scale ASR at Kingswood, South
Australia (2007). Procs ISMAR6, Phoenix 28 Oct‒2 Nov 2007.
Baveye, P., Vandevivere, P., Hoyle, B.L., DeLeo, P.C., and
Sanchez de Lozada, D., (1998) Environmental impact and
mechanisms of the biological clogging of saturated soils
and aquifer materials. Critical Reviews in Environmental
Science and Technology 28(2):123‒191.
Dillon, P., and Barry, K., (2005) Domestic Scale Rainwater ASR
Demonstration Project. Progress Status Report July 2003 ‒
June 2005. CSIRO Land and Water Report to Adelaide and
Mount Lofty Ranges Natural Resources Management Board.
Molz, F.J., Boman, G.K., Young, S.C., and Waldrop, W.R.,
(1994) Borehole flowmeters: field application and data
analysis. Journal of Hydrology 163:347‒371.
Olsthoorn, T.N., (1982) The clogging of recharge wells, main
subjects, KIWA-Communications 72, 150p.
Patawalonga Catchment Water Management Board, (2002)
Catchment Water Management Plan 2002‒2007.
http://www.cwmb.sa.gov.au/patawalonga/plans/Pat01_Cov
er.pdf
Pavelic P., Gerges N.Z., Dillon P.J., and Armstrong D., (1992)
The potential for storage and re-use of Adelaide stormwater
runoff using the upper Quaternary groundwater system.
Centre for Groundwater Studies Report No. 40.
Pavelic, P., Dillon P., and Barry, K., (2005) Results from the
Drilling of Two Wells in the Upper Quaternary Aquifer at the
Urrbrae Wetland Site. CSIRO Client Report, Dec 2005, 16p.
Pavelic, P., Dillon, P., Barry, K., Armstrong, D., Hodson, A.,
Callaghan, J., and Gerges, N., (2008) Lessons Drawn from
Attempts to Unclog an ASR Well in an Unconsolidated Sand
Aquifer. February 2008. CSIRO Water for a Healthy Country
Report, Feb 2008.
http://www.clw.csiro.au/publications/waterforahealthycoun
try/2008/wfhc_ASRwell.pdf
Pérez-Paricio, A., and Carrera, J., (1999) Clogging Handbook.
EU Project on Artificial Recharge of Groundwater, Research
program on Environment and Climate, Contract ENV-CT95-
0071.
Pyne, R.D.G., (2005) Aquifer Storage Recovery: A Guide to
Groundwater Recharge Through Wells. 2nd edition. ASR
Systems.
Rinck-Pfeiffer, S.M., (2000) Physical and biochemical
clogging processes arising from Aquifer Storage and
Recovery (ASR) with treated wastewater. PhD Thesis, School
of Chemistry, Physics and Earth Sciences, Flinders University
of SA, September 2000.

192
Segalen, A-S., Pavelic, P., and Dillon, P., (2005) Review of
drilling, completion and remediation methods for ASR wells
in unconsolidated aquifers. CSIRO Land and Water Tech
Report 04/05, March 2005.
http://www.clw.csiro.au/publications/technical2005/tr4-
05.pdf
South Australian Government, (2004) Water Proofing
Adelaide Draft Strategy: A thirst for change.
http://www.waterproofingadelaide.sa.gov.au/pdf/Strategy_
full.pdf
South Australian Government, (2009) Water for good: a plan
to ensure our water future to 2050
http://www.waterforgood.sa.gov.au/water-planning/the-
plan/
193
Characterisation of Clogging during Urban Stormwater Aquifer Storage and Recovery Operations in a low Permeability Fractured Rock Aquifer D. Page and P. Dillon
Commonwealth Scientific and Industrial Research Organisation (CSIRO)
1 Introduction A variety of clogging processes may arise during ASR when fresh, high turbidity and nutrient rich stormwater is
injected into a brackish anoxic aquifer. Clogging of injection wells is a commonly reported problem, particularly
when waters of low quality are used (Olsthoorn, 1982; Pérez-Paricio and Carrera, 1999; Pavelic et al., 2006).
However, there have been few reports of full scale field studies on well clogging (Schubert, 2002; Pavelic et al.,
2006; 2008) that have identified processes of clogging or the success of any remedial or preventative measures
(Olsthoorn, 1982; Pavelic et al., 2008). The lack of any defined water quality targets for injection in fractured rock
aquifers (and subsequent evaluation of pre-treatment options) continues to remain a limitation for the uptake of
ASR. Hence the aims of this study were to establish localised water quality targets for injection of urban
stormwater into a low transmissivity fractured rock aquifer and to assess the clogging that occurs during treated
stormwater ASR as compared to a higher quality potable water.
2 Materials and Methods
2.1 Site description A full-scale ASR trial was conducted at the Rossdale Golf
Course in Aspendale, a southeast suburb of Melbourne,
approximately 1.2 km from Port Philip Bay. Rossdale Golf
Club was selected as it was located in an area identified as
having moderate potential for ASR; had obtained a diversion
licence for harvesting stormwater from the Centre Swamp
Drain, and had an existing stormwater storage dam. Full
details of the site are given in Page et al. (2011)
2.2 Aquifer characterisation The ASR well targets the Siluro-Devonian formation of the
Melbourne Trough (Garrat 1983) which is encountered at a
depth of ~75 m below sea level. The formation consists of
interbedded and fractured shale, siltstone and sandstone
layers. The Siluro-Devonian formation is overlaid by clastic
sediments and basalts of Cainozoic (Paleogene, Neogene
and Quaternary) age. The aquifer is confined with
piezometric surface at an elevation ~4 m above sea level
(1 m below ground surface). Regional hydraulic gradients
are low due and there is no extraction from the aquifer
within several kilometres. All wells were completed as “open
hole” and developed until groundwater turbidity dissipated.
Further pumping tests prior to ASR operation implied
transmissivity values in the range of 1.2‒1.85 m2/d, which
corresponds to an average hydraulic conductivity of 0.035‒
0.054 m/d. Further hydrogeological information is
presented in Dillon et al. (2010).
Slumping initially occurred in weathered shale and siltstone
of both wells drilled in the fractured bedrock. High
particulate concentrations in the extracted waters during
pumping tests indicate that the Silurian aquifer is
susceptible to erosion, and reveal a risk of mechanical
clogging by particle mobilisation and re-deposition.
During drilling of the observation well intact cores of aquifer
material were collected between 102.8 and 110.5 m bgs
using a 63.5 mm diameter core barrel. The recovered core
sample was analysed by quantitative XRD analysis on a
ground, 1 g sub-sample using a Philips PW1710
microprocessor-controlled diffractometer and the software
package SIROQUANT.
194
2.3 Groundwater and stormwater characterisation Water-quality testing of the potable water, stormwater,
recovered water and ambient groundwater injected into
and withdrawn from the ASR well was performed for a suite
of physico-chemical parameters according to APHA (2005).
A number of water quality parameters were assessed for
each treatment option including: pH, turbidity, total
suspended solids (TSS), total nitrogen (TN), total
phosphorous (TP), dissolved organic carbon (DOC) and
biodegradable dissolved organic carbon (BDOC) using the
standard methods described in APHA (2005).
In addition to the water quality analyses, tests were
performed to assess the potential for the various types of
ASR source water to cause clogging of the pore spaces
within the Silurian aquifer due to dispersion of clay minerals
using a modified version of the ‘Emerson’ method
(Standards Association of Australia 1980) and more fully
described by Page et al. (2010).
The membrane filtration index (MFI) first developed by
Schippers and Verdouw (1980) to measure fouling
potentials of membranes and documented in the MAR
context by Dillon et al. (2001) was also measured to
determine the physical clogging potential. The method
involves passing water through a 0.45 µm membrane and
measuring change in flux.
2.4 Quantification of ASR well clogging The most significant risk of ASR operational failure over the
short-term was considered to be excessive deterioration in
the hydraulic performance of the ASR well (BH3) due to
near-well clogging or well slumping (Olsthoorn, 1982).
Aquifer clogging can be assessed using various methods for
evaluation in both steady (Pavelic et al. 2006) and unsteady
flow conditions (Hunt, 1999; Mucha et al., 2006). Two
methods were used to characterise the change in hydraulic
performance of the ASR well. These were:
1. change in well efficiency during recovery after
calibrating a Dupuit analytical model on the second
potable water cycle, and
2. change in specific capacity during recovery in each
cycle.
The coefficient of linear formation loss (A0) derived from
Dupuit formula states as follows (Kresic, 2006):
w
D
r
R
TA ln
21
0 π= (1)
where T is the transmissivity of the aquifer (L2/T), RD is the
radius of well influence (L), and rw is the radius of a well (L).
The radius of well influence in transient conditions is
calculated from the formula:
S
tTRD
*5.1 ×= (2)
where t is time of pumping (T) and S is the storage
coefficient of the aquifer (-). Consequently the theoretical
drawdown (s0) recorded at the end of recovery period for a
given pumping rate Q (L2/T) is calculated:
wrS
tT
T
Qs
*5.1ln
20
×=
π (3)
If a clogging layer develops around the ASR well, the
difference between s0 and measured drawdown will
increase, as neither the transmissivity or storativity of the
aquifer do not change over time.
Finally in assessing ASR well clogging, the efficiency of the
ASR system is often characterised using the concept of
specific capacity (Pyne, 2005; Pavelic et al., 2006). When
steady-state conditions prevail in an aquifer, specific
capacity of the well may be given as:
s
QSC = (4)
where SC is the specific capacity (m2/d), Q is the injection or
pumping rate (m3/d) and s is the drawdown in the ASR well
(m). SC is used to measure well performance i.e. clogging
development since this parameter is particularly sensitive to
the well-loss component of piezometric head build-up or
drawdown.
3 Results and Discussion
3.1 Aquifer characterisation XRD analysis of aquifer core indicated that the mineralogical
composition of the sandstone is dominated by quartz, SiO2
(48‒73%), with lesser amounts of kaolinite, Al2Si2O5(OH)4
(13‒23%) and muscovite, KAl2(AlSi3O10)(F,OH)2 (7‒18%),
and trace amounts of siderite, FeCO3 (0‒11%), chlorite,
(Fe,Mg,Al)6(Si,Al)4O10(OH)8 (0‒ 6%) and pyrite, FeS2 (0.3‒
1.3%). Sandstone samples are associated with higher levels
of quartz (>70%) and lower levels of kaolinite (<20%),
muscovite (<10%) and siderite (<2%). The organic carbon
content of the aquifer matrix is < 0.3%.
The average cation exchange capacity for the storage zone
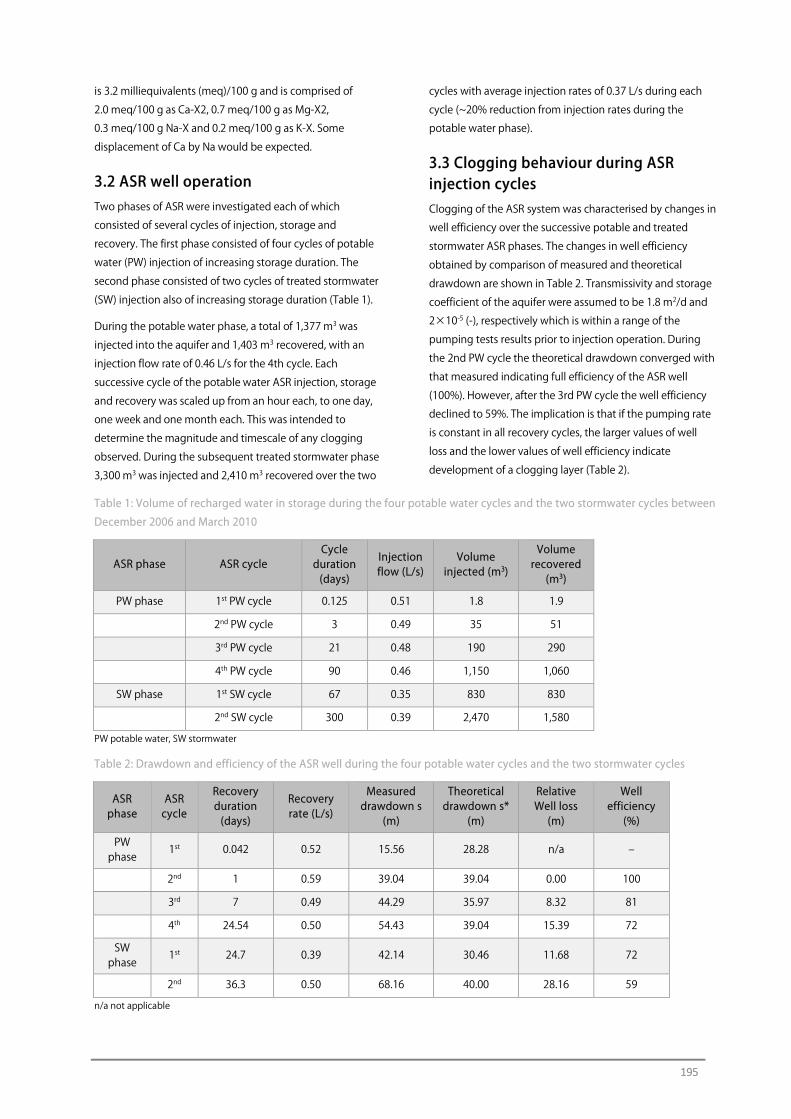
195
is 3.2 milliequivalents (meq)/100 g and is comprised of
2.0 meq/100 g as Ca-X2, 0.7 meq/100 g as Mg-X2,
0.3 meq/100 g Na-X and 0.2 meq/100 g as K-X. Some
displacement of Ca by Na would be expected.
3.2 ASR well operation Two phases of ASR were investigated each of which
consisted of several cycles of injection, storage and
recovery. The first phase consisted of four cycles of potable
water (PW) injection of increasing storage duration. The
second phase consisted of two cycles of treated stormwater
(SW) injection also of increasing storage duration (Table 1).
During the potable water phase, a total of 1,377 m3 was
injected into the aquifer and 1,403 m3 recovered, with an
injection flow rate of 0.46 L/s for the 4th cycle. Each
successive cycle of the potable water ASR injection, storage
and recovery was scaled up from an hour each, to one day,
one week and one month each. This was intended to
determine the magnitude and timescale of any clogging
observed. During the subsequent treated stormwater phase
3,300 m3 was injected and 2,410 m3 recovered over the two
cycles with average injection rates of 0.37 L/s during each
cycle (~20% reduction from injection rates during the
potable water phase).
3.3 Clogging behaviour during ASR injection cycles Clogging of the ASR system was characterised by changes in
well efficiency over the successive potable and treated
stormwater ASR phases. The changes in well efficiency
obtained by comparison of measured and theoretical
drawdown are shown in Table 2. Transmissivity and storage
coefficient of the aquifer were assumed to be 1.8 m2/d and
2×10⁻⁵ (-), respectively which is within a range of the
pumping tests results prior to injection operation. During
the 2nd PW cycle the theoretical drawdown converged with
that measured indicating full efficiency of the ASR well
(100%). However, after the 3rd PW cycle the well efficiency
declined to 59%. The implication is that if the pumping rate
is constant in all recovery cycles, the larger values of well
loss and the lower values of well efficiency indicate
development of a clogging layer (Table 2).
Table 1: Volume of recharged water in storage during the four potable water cycles and the two stormwater cycles between
December 2006 and March 2010
ASR phase ASR cycle Cycle
duration (days)
Injection flow (L/s)
Volume injected (m3)
Volume recovered
(m3)
PW phase 1st PW cycle 0.125 0.51 1.8 1.9
2nd PW cycle 3 0.49 35 51
3rd PW cycle 21 0.48 190 290
4th PW cycle 90 0.46 1,150 1,060
SW phase 1st SW cycle 67 0.35 830 830
2nd SW cycle 300 0.39 2,470 1,580
PW potable water, SW stormwater
Table 2: Drawdown and efficiency of the ASR well during the four potable water cycles and the two stormwater cycles
ASR phase
ASR cycle
Recovery duration (days)
Recovery rate (L/s)
Measured drawdown s
(m)
Theoretical drawdown s*
(m)
Relative Well loss
(m)
Well efficiency
(%)
PW phase
1st 0.042 0.52 15.56 28.28 n/a ‒
2nd 1 0.59 39.04 39.04 0.00 100
3rd 7 0.49 44.29 35.97 8.32 81
4th 24.54 0.50 54.43 39.04 15.39 72
SW phase
1st 24.7 0.39 42.14 30.46 11.68 72
2nd 36.3 0.50 68.16 40.00 28.16 59
n/a not applicable
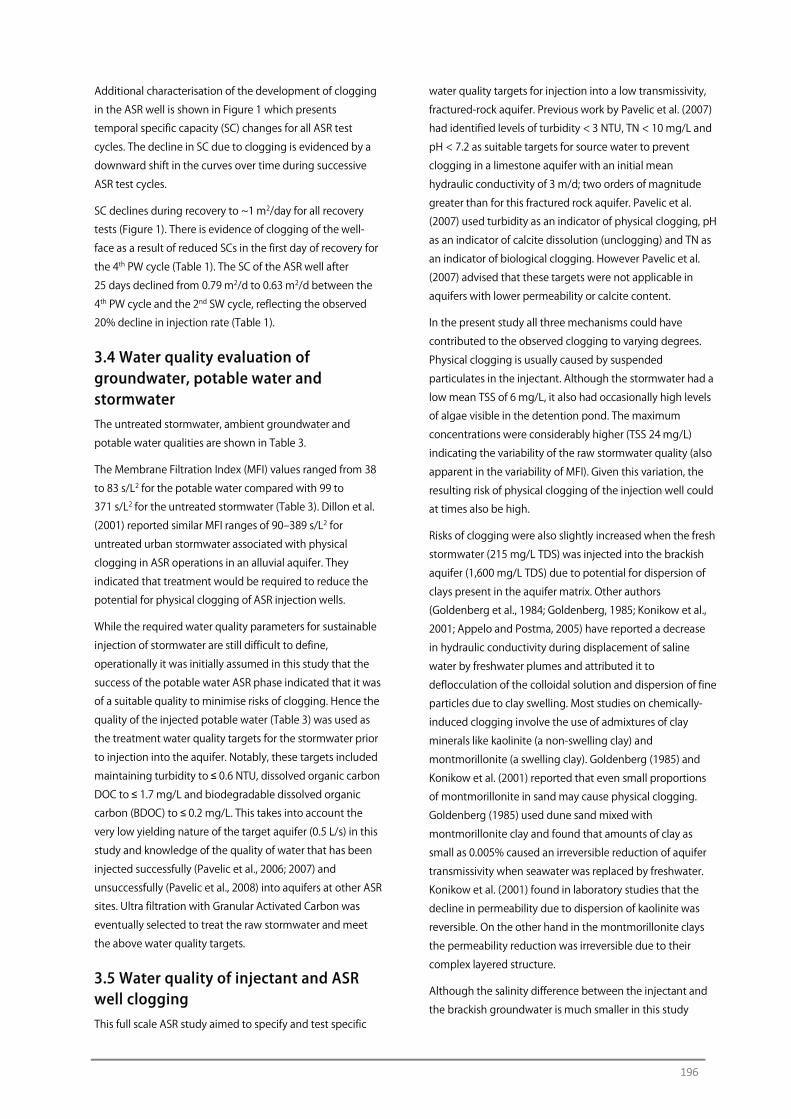
196
Additional characterisation of the development of clogging
in the ASR well is shown in Figure 1 which presents
temporal specific capacity (SC) changes for all ASR test
cycles. The decline in SC due to clogging is evidenced by a
downward shift in the curves over time during successive
ASR test cycles.
SC declines during recovery to ~1 m2/day for all recovery
tests (Figure 1). There is evidence of clogging of the well-
face as a result of reduced SCs in the first day of recovery for
the 4th PW cycle (Table 1). The SC of the ASR well after
25 days declined from 0.79 m2/d to 0.63 m2/d between the
4th PW cycle and the 2nd SW cycle, reflecting the observed
20% decline in injection rate (Table 1).
3.4 Water quality evaluation of groundwater, potable water and stormwater The untreated stormwater, ambient groundwater and
potable water qualities are shown in Table 3.
The Membrane Filtration Index (MFI) values ranged from 38
to 83 s/L2 for the potable water compared with 99 to
371 s/L2 for the untreated stormwater (Table 3). Dillon et al.
(2001) reported similar MFI ranges of 90‒389 s/L2 for
untreated urban stormwater associated with physical
clogging in ASR operations in an alluvial aquifer. They
indicated that treatment would be required to reduce the
potential for physical clogging of ASR injection wells.
While the required water quality parameters for sustainable
injection of stormwater are still difficult to define,
operationally it was initially assumed in this study that the
success of the potable water ASR phase indicated that it was
of a suitable quality to minimise risks of clogging. Hence the
quality of the injected potable water (Table 3) was used as
the treatment water quality targets for the stormwater prior
to injection into the aquifer. Notably, these targets included
maintaining turbidity to ≤ 0.6 NTU, dissolved organic carbon
DOC to ≤ 1.7 mg/L and biodegradable dissolved organic
carbon (BDOC) to ≤ 0.2 mg/L. This takes into account the
very low yielding nature of the target aquifer (0.5 L/s) in this
study and knowledge of the quality of water that has been
injected successfully (Pavelic et al., 2006; 2007) and
unsuccessfully (Pavelic et al., 2008) into aquifers at other ASR
sites. Ultra filtration with Granular Activated Carbon was
eventually selected to treat the raw stormwater and meet
the above water quality targets.
3.5 Water quality of injectant and ASR well clogging This full scale ASR study aimed to specify and test specific
water quality targets for injection into a low transmissivity,
fractured-rock aquifer. Previous work by Pavelic et al. (2007)
had identified levels of turbidity < 3 NTU, TN < 10 mg/L and
pH < 7.2 as suitable targets for source water to prevent
clogging in a limestone aquifer with an initial mean
hydraulic conductivity of 3 m/d; two orders of magnitude
greater than for this fractured rock aquifer. Pavelic et al.
(2007) used turbidity as an indicator of physical clogging, pH
as an indicator of calcite dissolution (unclogging) and TN as
an indicator of biological clogging. However Pavelic et al.
(2007) advised that these targets were not applicable in
aquifers with lower permeability or calcite content.
In the present study all three mechanisms could have
contributed to the observed clogging to varying degrees.
Physical clogging is usually caused by suspended
particulates in the injectant. Although the stormwater had a
low mean TSS of 6 mg/L, it also had occasionally high levels
of algae visible in the detention pond. The maximum
concentrations were considerably higher (TSS 24 mg/L)
indicating the variability of the raw stormwater quality (also
apparent in the variability of MFI). Given this variation, the
resulting risk of physical clogging of the injection well could
at times also be high.
Risks of clogging were also slightly increased when the fresh
stormwater (215 mg/L TDS) was injected into the brackish
aquifer (1,600 mg/L TDS) due to potential for dispersion of
clays present in the aquifer matrix. Other authors
(Goldenberg et al., 1984; Goldenberg, 1985; Konikow et al.,
2001; Appelo and Postma, 2005) have reported a decrease
in hydraulic conductivity during displacement of saline
water by freshwater plumes and attributed it to
deflocculation of the colloidal solution and dispersion of fine
particles due to clay swelling. Most studies on chemically-
induced clogging involve the use of admixtures of clay
minerals like kaolinite (a non-swelling clay) and
montmorillonite (a swelling clay). Goldenberg (1985) and
Konikow et al. (2001) reported that even small proportions
of montmorillonite in sand may cause physical clogging.
Goldenberg (1985) used dune sand mixed with
montmorillonite clay and found that amounts of clay as
small as 0.005% caused an irreversible reduction of aquifer
transmissivity when seawater was replaced by freshwater.
Konikow et al. (2001) found in laboratory studies that the
decline in permeability due to dispersion of kaolinite was
reversible. On the other hand in the montmorillonite clays
the permeability reduction was irreversible due to their
complex layered structure.
Although the salinity difference between the injectant and
the brackish groundwater is much smaller in this study
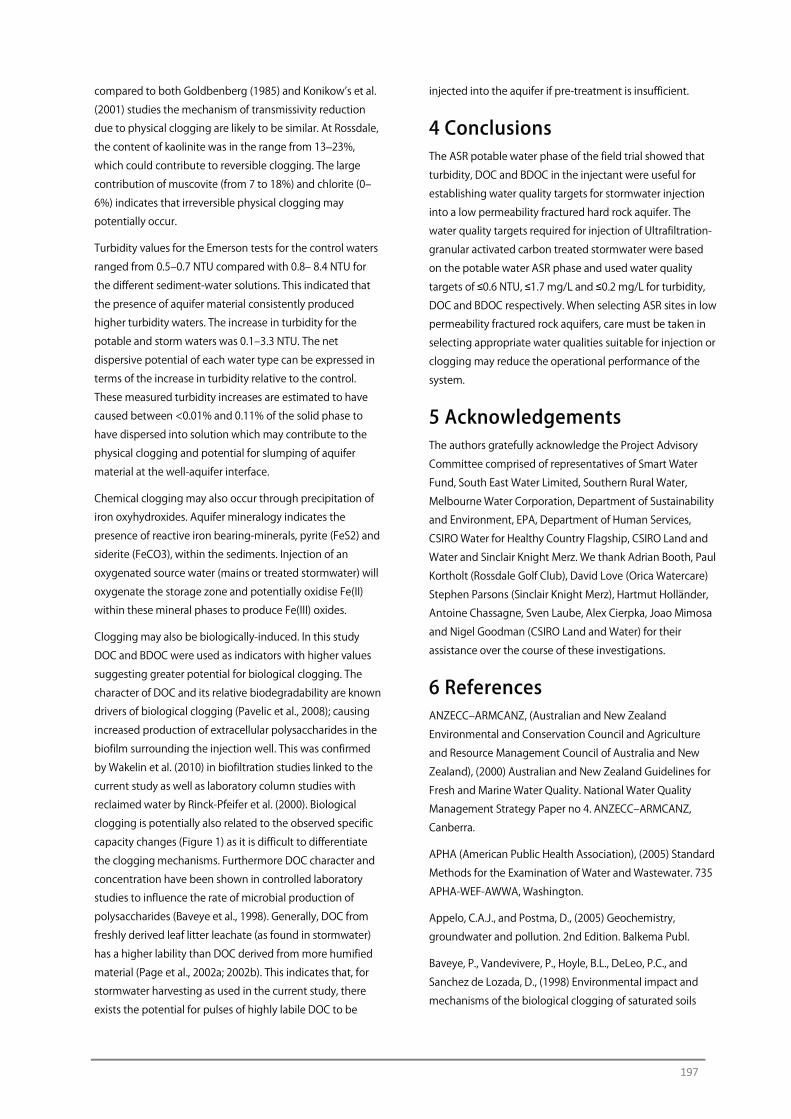
197
compared to both Goldbenberg (1985) and Konikow’s et al.
(2001) studies the mechanism of transmissivity reduction
due to physical clogging are likely to be similar. At Rossdale,
the content of kaolinite was in the range from 13–23%,
which could contribute to reversible clogging. The large
contribution of muscovite (from 7 to 18%) and chlorite (0‒
6%) indicates that irreversible physical clogging may
potentially occur.
Turbidity values for the Emerson tests for the control waters
ranged from 0.5‒0.7 NTU compared with 0.8‒ 8.4 NTU for
the different sediment-water solutions. This indicated that
the presence of aquifer material consistently produced
higher turbidity waters. The increase in turbidity for the
potable and storm waters was 0.1‒3.3 NTU. The net
dispersive potential of each water type can be expressed in
terms of the increase in turbidity relative to the control.
These measured turbidity increases are estimated to have
caused between <0.01% and 0.11% of the solid phase to
have dispersed into solution which may contribute to the
physical clogging and potential for slumping of aquifer
material at the well-aquifer interface.
Chemical clogging may also occur through precipitation of
iron oxyhydroxides. Aquifer mineralogy indicates the
presence of reactive iron bearing-minerals, pyrite (FeS2) and
siderite (FeCO3), within the sediments. Injection of an
oxygenated source water (mains or treated stormwater) will
oxygenate the storage zone and potentially oxidise Fe(II)
within these mineral phases to produce Fe(III) oxides.
Clogging may also be biologically-induced. In this study
DOC and BDOC were used as indicators with higher values
suggesting greater potential for biological clogging. The
character of DOC and its relative biodegradability are known
drivers of biological clogging (Pavelic et al., 2008); causing
increased production of extracellular polysaccharides in the
biofilm surrounding the injection well. This was confirmed
by Wakelin et al. (2010) in biofiltration studies linked to the
current study as well as laboratory column studies with
reclaimed water by Rinck-Pfeifer et al. (2000). Biological
clogging is potentially also related to the observed specific
capacity changes (Figure 1) as it is difficult to differentiate
the clogging mechanisms. Furthermore DOC character and
concentration have been shown in controlled laboratory
studies to influence the rate of microbial production of
polysaccharides (Baveye et al., 1998). Generally, DOC from
freshly derived leaf litter leachate (as found in stormwater)
has a higher lability than DOC derived from more humified
material (Page et al., 2002a; 2002b). This indicates that, for
stormwater harvesting as used in the current study, there
exists the potential for pulses of highly labile DOC to be
injected into the aquifer if pre-treatment is insufficient.
4 Conclusions The ASR potable water phase of the field trial showed that
turbidity, DOC and BDOC in the injectant were useful for
establishing water quality targets for stormwater injection
into a low permeability fractured hard rock aquifer. The
water quality targets required for injection of Ultrafiltration-
granular activated carbon treated stormwater were based
on the potable water ASR phase and used water quality
targets of ≤0.6 NTU, ≤1.7 mg/L and ≤0.2 mg/L for turbidity,
DOC and BDOC respectively. When selecting ASR sites in low
permeability fractured rock aquifers, care must be taken in
selecting appropriate water qualities suitable for injection or
clogging may reduce the operational performance of the
system.
5 Acknowledgements The authors gratefully acknowledge the Project Advisory
Committee comprised of representatives of Smart Water
Fund, South East Water Limited, Southern Rural Water,
Melbourne Water Corporation, Department of Sustainability
and Environment, EPA, Department of Human Services,
CSIRO Water for Healthy Country Flagship, CSIRO Land and
Water and Sinclair Knight Merz. We thank Adrian Booth, Paul
Kortholt (Rossdale Golf Club), David Love (Orica Watercare)
Stephen Parsons (Sinclair Knight Merz), Hartmut Holländer,
Antoine Chassagne, Sven Laube, Alex Cierpka, Joao Mimosa
and Nigel Goodman (CSIRO Land and Water) for their
assistance over the course of these investigations.
6 References ANZECC‒ARMCANZ, (Australian and New Zealand
Environmental and Conservation Council and Agriculture
and Resource Management Council of Australia and New
Zealand), (2000) Australian and New Zealand Guidelines for
Fresh and Marine Water Quality. National Water Quality
Management Strategy Paper no 4. ANZECC‒ARMCANZ,
Canberra.
APHA (American Public Health Association), (2005) Standard
Methods for the Examination of Water and Wastewater. 735
APHA-WEF-AWWA, Washington.
Appelo, C.A.J., and Postma, D., (2005) Geochemistry,
groundwater and pollution. 2nd Edition. Balkema Publ.
Baveye, P., Vandevivere, P., Hoyle, B.L., DeLeo, P.C., and
Sanchez de Lozada, D., (1998) Environmental impact and
mechanisms of the biological clogging of saturated soils

198
and aquifer materials. Crit. Rev. Env. Sci. Tec. 28, 123‒191.
Dillon, P., Pavelic, P., Massmann, G., Barry, K., and Correll, R.,
(2001) Enhancement of the membrane filtration index (MFI)
method for determining the clogging potential of turbid
urban stormwater and reclaimed water used for aquifer
storage and recovery, Desalination. 140, 153‒165.
Dillon, P., Pavelic, P., Page, D., Miotlinski, K., Levett, K., Barry,
K., Taylor, R., Wakelin, S., Vanderzalm, J., Chassagne A.,
Molloy, R., Lennon, L., Parsons, S., Dudding, M., and Goode,
A., (2010) Developing Aquifer Storage and Recovery (ASR)
Opportunities in Melbourne ‒ Rossdale ASR demonstration
project final report, CSIRO Water for a Healthy Country
Flagship Report
http://www.clw.csiro.au/publications/waterforahealthycoun
try/2010/wfhc-Rossdale-ASR-demonstration.pdf
Garrat, M.J., (1983) Silurian to Early Devonian facies and
biofacies patterns for the Melbourne trough, central Victoria.
J. Geol. Soc. Aust. 30, 121‒147.
Goldenberg, L.C., Magaritz, M., Amiel, A.J., and Mandel, S.,
(1984) Changes in hydraulic conductivity of laboratory sand-
clay mixtures caused by a seawater-freshwater interface. J.
Hydrol. 70, 329‒336.
Goldenberg, L.C., (1985) Decrease in hydraulic conductivity
in sand at the interface between seawater and dilute clay
suspensions. J. Hydrol. 78, 183‒199
Harrington, G.A., Love, A.J., Sanford, W.E., (2002) Aquifer
Storage and Recovery in a fractured rock aquifer of the Clare
Valley, South Australia. In Dillon (ed). Management of
Aquifer Recharge for Sustainability, 315-318, A. A. Balkema.
Hunt, B., (1999) Unsteady stream depletion from ground
water pumping. Ground Water, 37, 98‒102.
Konikow, L.F., August, L.L., and Voss, C.I., (2001) Effects of
clay dispersion on aquifer storage and recovery in coastal
aquifers. Transport Porous Med. 43, 45‒64.
Kresic, N., (2006) Hydrogeology and groundwater
modelling. Second edition. CRC Press.
Levett, K. J., Page, D. W., Dillon, P. J., Taylor, R., Booth, A., and
Kortholt, P., (2009) Pre-treatment of urban stormwater prior
to aquifer storage and recovery (ASR) in a fractured rock
aquifer. Proceedings of the 7th IWA World Congress on
Water Reclamation and Reuse, Reuse09, 21‒25 September
2009, Brisbane, Australia
Lin, E., Page, D., and Pavelic, P., (2008) A new method to
evaluate polydisperse kaolinite clay particle removal in
roughing filtration using colloid filtration theory, Wat. Res.
42, 669‒ 676.
Mirecki, J.E., Campbell, B.G., Conlon, K.J., and Petkevich, M.D.,
(1998) Solute changes during aquifer storage recovery
testing in a limestone/clastic aquifer. Ground Water, 36,
394‒403.
Mucha, I., Bansky, L., Hlavaty, Z., and Rodak, D., (2006) Impact
of riverbed clogging ‒ colmatation ‒ on groundwater. In:
Hubbs, S.A. (ed) Riverbank Filtration Hydrology, 43-72.
Springer.
Murray, E. C., Tredoux, G., (2002) Borehole injection tests in
Windhoek’s fractured quartzite aquifer. In Dillon (ed).
Management of Aquifer Recharge for Sustainability, 251‒
256, A. A. Balkema.
NRMMC‒EPHC‒NHMRC, (Natural Resource Management
Ministerial Council, Environment Protection and Heritage
Council, National Health and Medical Research Council)
(2009) Australian Guidelines for Water Recycling: Managed
Aquifer Recharge (Phase 2), Natural Resource Ministerial
Management Council, Environment Protection and Heritage
Council and National Health and Medical Research Council,
Canberra.
http://www.ephc.gov.au/sites/default/files/WQ_AGWR_GL_
_Managed_Aquifer_Recharge_Final_200907.pdf
Olsthoorn, T.N., (1982) The clogging of recharge wells, main
subjects. KIWA-Communications 72, p 150
Page, D.W., van Leeuwen, J.A., Spark, K.M., Drikas, M., and
Mulcahy, D.E., (2002a) Effect of alum treatment on the
trihalomethane formation and bacterial regrowth potentials
of natural and synthetic waters. Wat. Res. 36, 4884-4892.
Page, D.W., van Leeuwen, J.A., Spark, K.M., Mulcahy, D.E.,
(2002b) Pyrolysis characterisation of soil, litter and
vegetation extracts from Australian catchments. J. Anal.
App. Pyrol. 65, 249‒265.
Page, D.W., Miotlinski, K., Dillon, P., Taylor, R.J., Wakelin, S.,
Levett, K., Barry, K., and Pavelic, P., (2011) Stormwater pre-
treatment options for sustaining aquifer storage and
recovery in low permeability fractured rock aquifer, Journal
of Environmental Management, 92, 2410‒2418.
Pavelic, P. and Dillon, P., (1997) Guidelines on the quality of
stormwater and treated wastewater for injection into
aquifers for storage and reuse. Centre for Groundwater
Studies Report No. 74.
Pavelic, P., Dillon, P., Barry, K., and Gerges, N., (2006)
Hydraulic evaluation of aquifer storage and recovery (ASR)
with urban stormwater in a brackish limestone aquifer,
Hydrogeol. J. 14. 1544‒1555

199
Pavelic, P., Dillon, P., Barry, K., Vanderzalm, J., Correll, R., and
Rinck-Pfeiffer, S., (2007) Water quality effects on clogging
rates during reclaimed water ASR in a carbonate aquifer. J.
Hydrol. 334, 1‒ 16.
Pavelic, P., Dillon, P., Barry, K., Armstrong, D., Hodson, A.,
Callaghan, J., and Gerges, N., (2008) Lessons drawn from
attempts to unclog an ASR well in an unconsolidated sand
aquifer, CSIRO Water for a Healthy Country Flagship Report.
http://www.clw.csiro.au/publications/waterforahealthycoun
try/2008/wfhc_ASRwell.pdf
Pérez-Paricio, A., and Carrera, J., (1999) Clogging handbook.
EU Project on Artificial Recharge of Groundwater, Research
program on Environment and Climate, Contract ENV-CT95-
0071, European Commonwealth, Brussels.
Petkewich, M.D., Parkhurst, D.L., Conlon, K.J., Campbell, B.G.,
and Mirecki, J.E., (2004) Hydrologic and geochemical
evaluation of aquifer storage and recovery in the Santee
Limestone/Black Mingo aquifer, Charleston, South Carolina,
1998‒2002. USGS Scientific Investigation Report 2004-5046.
Pyne, R.D.G., (2005) Aquifer Storage Recovery: A guide to
groundwater recharge through wells. ASR Press, USA.
Rinck-Pfeiffer, S.M., Ragusa, S.R., Sztajnbok, P., and
Vandevelde, T., (2000) Interrelationships between biological,
chemical and physical processes as an analog to clogging in
aquifer storage and recovery (ASR) wells. Wat. Res. 34, 2110‒
2118.
Schippers, J.C., and Verdouw, J., (1980) The modified fouling
index, a method of determining the fouling characteristics
of water. Desalination, 32, 137‒148.
Schubert, J., (2002) Hydraulic aspects of riverbank filtration -
field studies. J. Hydrol. 266, 145‒161.
Standards Association of Australia, (1980) Determination of
Emerson Class Number of a Soil. AS 1289.C8.1.
Vanderzalm, J., Page, D., Barry, K., and Dillon, P., (2010) A
comparison of the geochemical response to different
managed aquifer recharge operations for injection of urban
storm water in a carbonate aquifer. Appl. Geochem. 25,
1350‒1360.
Wakelin, S.A., Page, D.W., Pavelic, P., Gregg, A.L., and Dillon,
P.J., (2010) Rich microbial communities that inhabit water
treatment biofilters are differentially affected by filter type
and sampling depth. Wa. Sci. Technol. 10, 145‒156.
200
Identification and Management of Clogging in a Fractured Rock Aquifer during ASR Operations R. Martin (General Manager, Australian Groundwater Technologies)
Abstract Control of clogging is a key consideration for the long-term sustainable operation of managed aquifer recharge
(MAR) schemes. Control of the source water quality is the first and most obvious measure to minimise the
potential for clogging. However, over time, loss of injection or infiltration performance due to clogging which can
manifest from; the accumulation of suspended solids; biological growth; microbiological activity; geochemical
reactions; dissolved or entrained air from turbulence; mobilisation of interstitial clays or a temperature differential
between the injected water and ambient groundwater, is not uncommon. Often multiple cause of clogging may be
occurring simultaneously, for example, gas entrainment may induce precipitation of iron which can stimulate an
increase in iron bacteria. What started out as a simple air entrainment problem has the potential to develop into a
significant clogging problem driven by three different processes. Each potential clogging cause may now require
individual treatment. This paper discusses some of the clogging mechanisms encountered when the injection to,
and recovery from, the aquifer utilises bores, more commonly referred to as aquifer storage and recovery (ASR).
Results of a case study and the approach to identification of clogging using the aquifer hydraulic response are
presented and the corrective measure adopted are discussed.
The City of Tea Tree Gully has an integrated MAR system comprising four individual aquifer storage and recovery
(ASR) sites linked by a common pipeline. Collectively the schemes harvest, treat and recharge, to the underlying
fractured rock aquifer, approximately 300 megalitres per year (ML/yr) of urban stormwater runoff. A further two
schemes, outside of the linear pipeline, harvest up to 80 ML/yr each. Integration of the schemes through the single
pipeline has enabled greater operating flexibility and the servicing of many smaller open spaces that may
otherwise have had to continue to be irrigated with potable mains water. During pre-commissioning one of the
schemes, Tilley Reserve, experienced significant head build up beyond the pre-selected trigger limits set for safe
operation of the scheme. Investigations into the origin of the greater than expected head buildup identified gas
entrainment at the onset of injection followed shortly thereafter by colonisation of the drillhole by iron bacteria as
the causes of the clogging. Gas entrainment resulted from an oversight in the overall engineering design when the
scheme was linked into the common pipeline. The air entrainment encouraged the growth of iron bacteria which
have a propensity to colonise areas of highest velocity, that is, pump intakes, or in this case, the fracture zones
within the bore.
Introduction Physical scarcity of water, in terms of limited availability in
many of the arid regions across the globe and the
availability of clean drinking water, is a significant and
growing problem. Today, about one third of the world’s
population lives in countries with moderate to high water
stress; by 2025, largely because of population growth, fully
two out of three of the world’s people will live under those
conditions (Mazur, 2012). Managed Aquifer Recharge (MAR),
in its many forms, and related water management practices
are evolving rapidly. There is immense potential for MAR,
used in conjunction with other water management
techniques, to make more efficient use of existing water
resources and to reuse more water now that in many cases
is discarded after a single use or channelled rapidly away
from urban areas to be discharged into rivers or the sea
(Martin, 2002).
One of the challenges for the sustainable operation of MAR
schemes is the management of clogging. Physical,
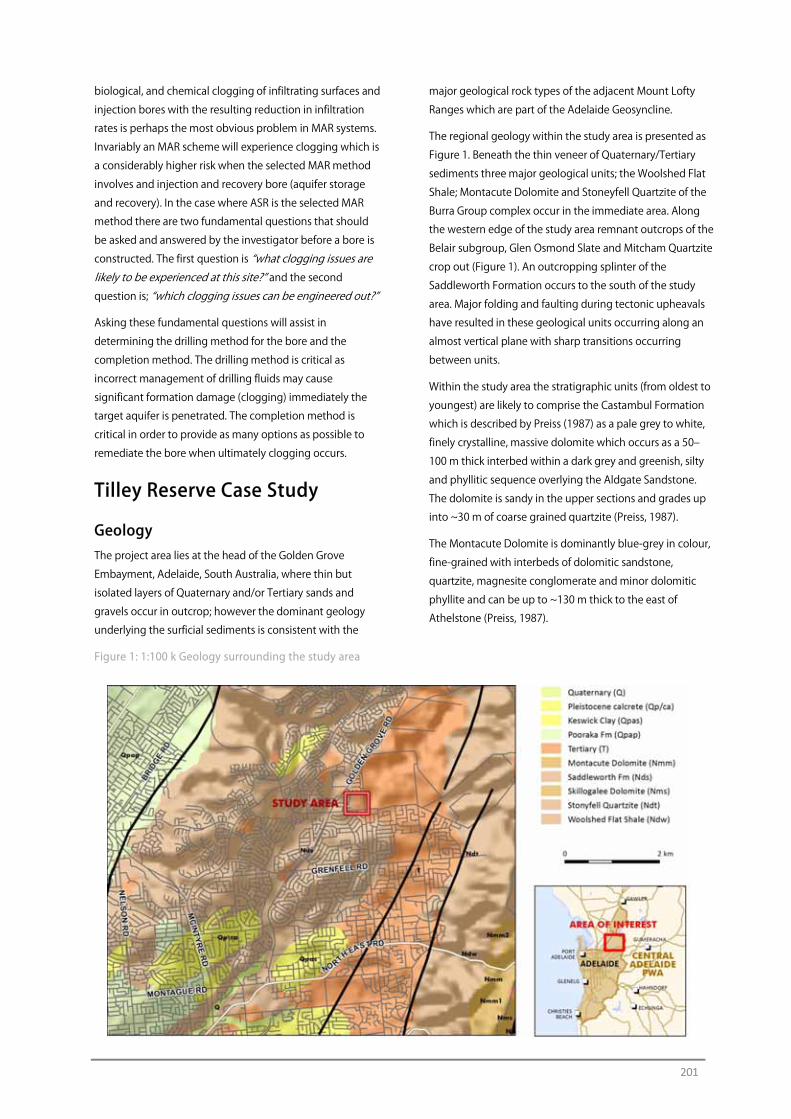
201
biological, and chemical clogging of infiltrating surfaces and
injection bores with the resulting reduction in infiltration
rates is perhaps the most obvious problem in MAR systems.
Invariably an MAR scheme will experience clogging which is
a considerably higher risk when the selected MAR method
involves and injection and recovery bore (aquifer storage
and recovery). In the case where ASR is the selected MAR
method there are two fundamental questions that should
be asked and answered by the investigator before a bore is
constructed. The first question is “what clogging issues are likely to be experienced at this site?” and the second question is; “which clogging issues can be engineered out?”
Asking these fundamental questions will assist in
determining the drilling method for the bore and the
completion method. The drilling method is critical as
incorrect management of drilling fluids may cause
significant formation damage (clogging) immediately the
target aquifer is penetrated. The completion method is
critical in order to provide as many options as possible to
remediate the bore when ultimately clogging occurs.
Tilley Reserve Case Study
Geology The project area lies at the head of the Golden Grove
Embayment, Adelaide, South Australia, where thin but
isolated layers of Quaternary and/or Tertiary sands and
gravels occur in outcrop; however the dominant geology
underlying the surficial sediments is consistent with the
Figure 1: 1:100 k Geology surrounding the study area
major geological rock types of the adjacent Mount Lofty
Ranges which are part of the Adelaide Geosyncline.
The regional geology within the study area is presented as
Figure 1. Beneath the thin veneer of Quaternary/Tertiary
sediments three major geological units; the Woolshed Flat
Shale; Montacute Dolomite and Stoneyfell Quartzite of the
Burra Group complex occur in the immediate area. Along
the western edge of the study area remnant outcrops of the
Belair subgroup, Glen Osmond Slate and Mitcham Quartzite
crop out (Figure 1). An outcropping splinter of the
Saddleworth Formation occurs to the south of the study
area. Major folding and faulting during tectonic upheavals
have resulted in these geological units occurring along an
almost vertical plane with sharp transitions occurring
between units.
Within the study area the stratigraphic units (from oldest to
youngest) are likely to comprise the Castambul Formation
which is described by Preiss (1987) as a pale grey to white,
finely crystalline, massive dolomite which occurs as a 50‒
100 m thick interbed within a dark grey and greenish, silty
and phyllitic sequence overlying the Aldgate Sandstone.
The dolomite is sandy in the upper sections and grades up
into ~30 m of coarse grained quartzite (Preiss, 1987).
The Montacute Dolomite is dominantly blue-grey in colour,
fine-grained with interbeds of dolomitic sandstone,
quartzite, magnesite conglomerate and minor dolomitic
phyllite and can be up to ~130 m thick to the east of
Athelstone (Preiss, 1987).
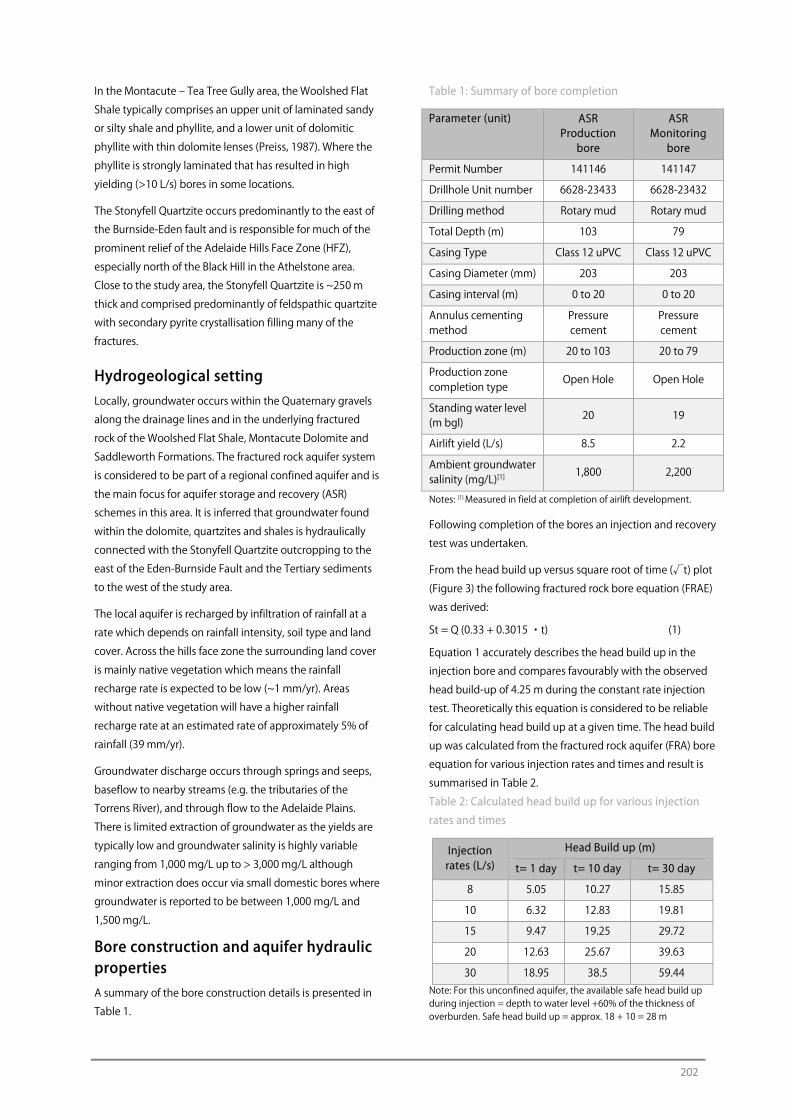
202
In the Montacute ‒ Tea Tree Gully area, the Woolshed Flat
Shale typically comprises an upper unit of laminated sandy
or silty shale and phyllite, and a lower unit of dolomitic
phyllite with thin dolomite lenses (Preiss, 1987). Where the
phyllite is strongly laminated that has resulted in high
yielding (>10 L/s) bores in some locations.
The Stonyfell Quartzite occurs predominantly to the east of
the Burnside-Eden fault and is responsible for much of the
prominent relief of the Adelaide Hills Face Zone (HFZ),
especially north of the Black Hill in the Athelstone area.
Close to the study area, the Stonyfell Quartzite is ~250 m
thick and comprised predominantly of feldspathic quartzite
with secondary pyrite crystallisation filling many of the
fractures.
Hydrogeological setting Locally, groundwater occurs within the Quaternary gravels
along the drainage lines and in the underlying fractured
rock of the Woolshed Flat Shale, Montacute Dolomite and
Saddleworth Formations. The fractured rock aquifer system
is considered to be part of a regional confined aquifer and is
the main focus for aquifer storage and recovery (ASR)
schemes in this area. It is inferred that groundwater found
within the dolomite, quartzites and shales is hydraulically
connected with the Stonyfell Quartzite outcropping to the
east of the Eden-Burnside Fault and the Tertiary sediments
to the west of the study area.
The local aquifer is recharged by infiltration of rainfall at a
rate which depends on rainfall intensity, soil type and land
cover. Across the hills face zone the surrounding land cover
is mainly native vegetation which means the rainfall
recharge rate is expected to be low (~1 mm/yr). Areas
without native vegetation will have a higher rainfall
recharge rate at an estimated rate of approximately 5% of
rainfall (39 mm/yr).
Groundwater discharge occurs through springs and seeps,
baseflow to nearby streams (e.g. the tributaries of the
Torrens River), and through flow to the Adelaide Plains.
There is limited extraction of groundwater as the yields are
typically low and groundwater salinity is highly variable
ranging from 1,000 mg/L up to > 3,000 mg/L although
minor extraction does occur via small domestic bores where
groundwater is reported to be between 1,000 mg/L and
1,500 mg/L.
Bore construction and aquifer hydraulic properties A summary of the bore construction details is presented in
Table 1.
Table 1: Summary of bore completion
Parameter (unit) ASR Production
bore
ASR Monitoring
bore
Permit Number 141146 141147
Drillhole Unit number 6628-23433 6628-23432
Drilling method Rotary mud Rotary mud
Total Depth (m) 103 79
Casing Type Class 12 uPVC Class 12 uPVC
Casing Diameter (mm) 203 203
Casing interval (m) 0 to 20 0 to 20
Annulus cementing method
Pressure cement
Pressure cement
Production zone (m) 20 to 103 20 to 79
Production zone completion type
Open Hole Open Hole
Standing water level (m bgl)
20 19
Airlift yield (L/s) 8.5 2.2
Ambient groundwater salinity (mg/L)[1]
1,800 2,200
Notes: [1] Measured in field at completion of airlift development.
Following completion of the bores an injection and recovery
test was undertaken.
From the head build up versus square root of time (√t) plot
(Figure 3) the following fractured rock bore equation (FRAE)
was derived:
St = Q (0.33 + 0.3015 ・t) (1)
Equation 1 accurately describes the head build up in the
injection bore and compares favourably with the observed
head build-up of 4.25 m during the constant rate injection
test. Theoretically this equation is considered to be reliable
for calculating head build up at a given time. The head build
up was calculated from the fractured rock aquifer (FRA) bore
equation for various injection rates and times and result is
summarised in Table 2.
Table 2: Calculated head build up for various injection
rates and times
Injection rates (L/s)
Head Build up (m)
t= 1 day t= 10 day t= 30 day
8 5.05 10.27 15.85
10 6.32 12.83 19.81
15 9.47 19.25 29.72
20 12.63 25.67 39.63
30 18.95 38.5 59.44 Note: For this unconfined aquifer, the available safe head build up during injection = depth to water level +60% of the thickness of overburden. Safe head build up = approx. 18 + 10 = 28 m
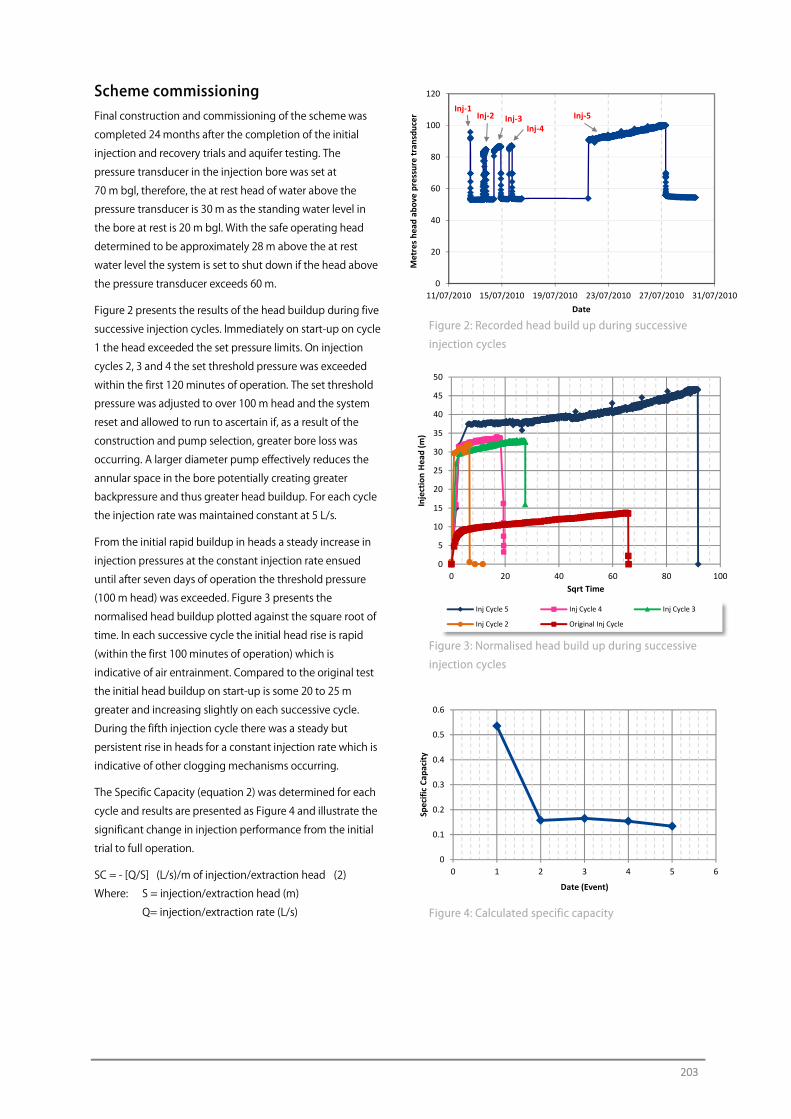
203
0
20
40
60
80
100
120
11/07/2010 15/07/2010 19/07/2010 23/07/2010 27/07/2010 31/07/2010
Met
res h
ead
abov
e pr
essu
re tr
ansd
ucer
Date
Inj-5Inj-4
Inj-3Inj-2Inj-1
Scheme commissioning Final construction and commissioning of the scheme was
completed 24 months after the completion of the initial
injection and recovery trials and aquifer testing. The
pressure transducer in the injection bore was set at
70 m bgl, therefore, the at rest head of water above the
pressure transducer is 30 m as the standing water level in
the bore at rest is 20 m bgl. With the safe operating head
determined to be approximately 28 m above the at rest
water level the system is set to shut down if the head above
the pressure transducer exceeds 60 m.
Figure 2 presents the results of the head buildup during five
successive injection cycles. Immediately on start-up on cycle
1 the head exceeded the set pressure limits. On injection
cycles 2, 3 and 4 the set threshold pressure was exceeded
within the first 120 minutes of operation. The set threshold
pressure was adjusted to over 100 m head and the system
reset and allowed to run to ascertain if, as a result of the
construction and pump selection, greater bore loss was
occurring. A larger diameter pump effectively reduces the
annular space in the bore potentially creating greater
backpressure and thus greater head buildup. For each cycle
the injection rate was maintained constant at 5 L/s.
From the initial rapid buildup in heads a steady increase in
injection pressures at the constant injection rate ensued
until after seven days of operation the threshold pressure
(100 m head) was exceeded. Figure 3 presents the
normalised head buildup plotted against the square root of
time. In each successive cycle the initial head rise is rapid
(within the first 100 minutes of operation) which is
indicative of air entrainment. Compared to the original test
the initial head buildup on start-up is some 20 to 25 m
greater and increasing slightly on each successive cycle.
During the fifth injection cycle there was a steady but
persistent rise in heads for a constant injection rate which is
indicative of other clogging mechanisms occurring.
The Specific Capacity (equation 2) was determined for each
cycle and results are presented as Figure 4 and illustrate the
significant change in injection performance from the initial
trial to full operation.
SC = - [Q/S] (L/s)/m of injection/extraction head (2)
Where: S = injection/extraction head (m)
Q= injection/extraction rate (L/s)
Figure 2: Recorded head build up during successive
injection cycles
Figure 3: Normalised head build up during successive
injection cycles
Figure 4: Calculated specific capacity
0
5
10
15
20
25
30
35
40
45
50
0 20 40 60 80 100
Inje
ctio
n He
ad (m
)
Sqrt Time
Inj Cycle 5 Inj Cycle 4 Inj Cycle 3
Inj Cycle 2 Original Inj Cycle
0
0.1
0.2
0.3
0.4
0.5
0.6
0 1 2 3 4 5 6
Spec
ific
Capa
city
Date (Event)
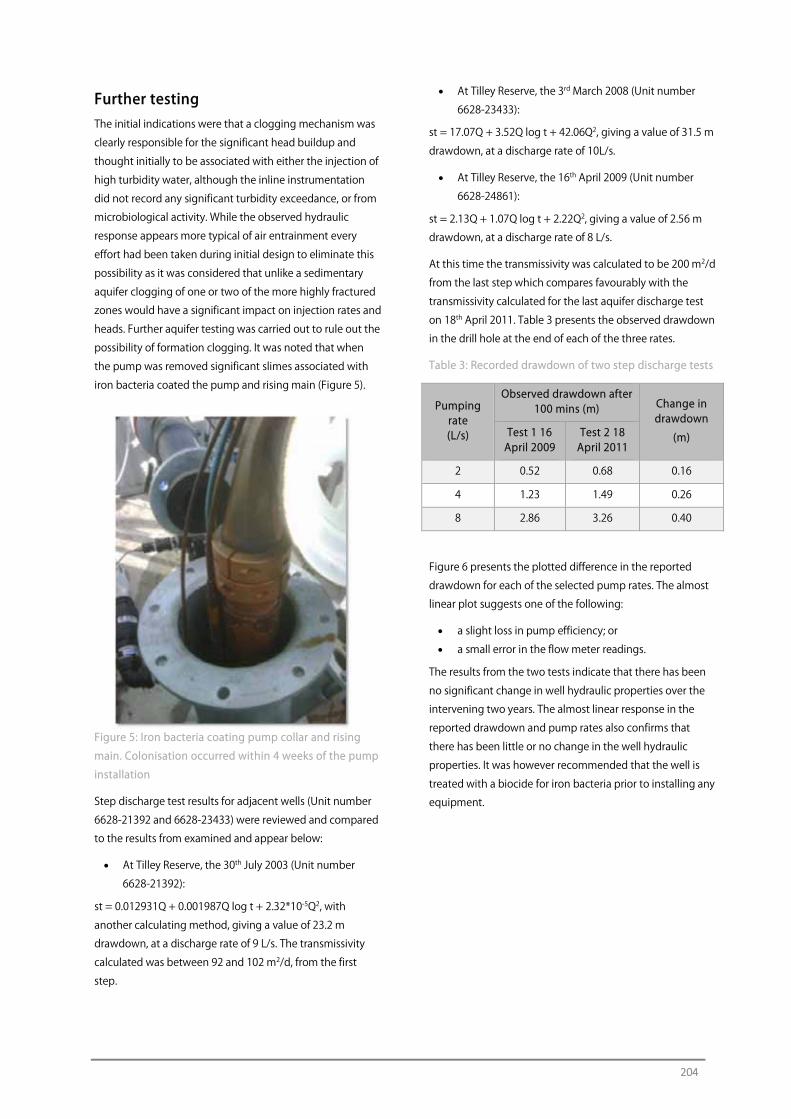
204
Further testing The initial indications were that a clogging mechanism was
clearly responsible for the significant head buildup and
thought initially to be associated with either the injection of
high turbidity water, although the inline instrumentation
did not record any significant turbidity exceedance, or from
microbiological activity. While the observed hydraulic
response appears more typical of air entrainment every
effort had been taken during initial design to eliminate this
possibility as it was considered that unlike a sedimentary
aquifer clogging of one or two of the more highly fractured
zones would have a significant impact on injection rates and
heads. Further aquifer testing was carried out to rule out the
possibility of formation clogging. It was noted that when
the pump was removed significant slimes associated with
iron bacteria coated the pump and rising main (Figure 5).
Figure 5: Iron bacteria coating pump collar and rising
main. Colonisation occurred within 4 weeks of the pump
installation
Step discharge test results for adjacent wells (Unit number
6628-21392 and 6628-23433) were reviewed and compared
to the results from examined and appear below:
• At Tilley Reserve, the 30th July 2003 (Unit number
6628-21392):
st = 0.012931Q + 0.001987Q log t + 2.32*10-5Q2, with
another calculating method, giving a value of 23.2 m
drawdown, at a discharge rate of 9 L/s. The transmissivity
calculated was between 92 and 102 m2/d, from the first
step.
• At Tilley Reserve, the 3rd March 2008 (Unit number
6628-23433):
st = 17.07Q + 3.52Q log t + 42.06Q2, giving a value of 31.5 m
drawdown, at a discharge rate of 10L/s.
• At Tilley Reserve, the 16th April 2009 (Unit number
6628-24861):
st = 2.13Q + 1.07Q log t + 2.22Q2, giving a value of 2.56 m
drawdown, at a discharge rate of 8 L/s.
At this time the transmissivity was calculated to be 200 m2/d
from the last step which compares favourably with the
transmissivity calculated for the last aquifer discharge test
on 18th April 2011. Table 3 presents the observed drawdown
in the drill hole at the end of each of the three rates.
Table 3: Recorded drawdown of two step discharge tests
Pumping rate (L/s)
Observed drawdown after 100 mins (m) Change in
drawdown
(m) Test 1 16 April 2009
Test 2 18 April 2011
2 0.52 0.68 0.16
4 1.23 1.49 0.26
8 2.86 3.26 0.40
Figure 6 presents the plotted difference in the reported
drawdown for each of the selected pump rates. The almost
linear plot suggests one of the following:
• a slight loss in pump efficiency; or
• a small error in the flow meter readings.
The results from the two tests indicate that there has been
no significant change in well hydraulic properties over the
intervening two years. The almost linear response in the
reported drawdown and pump rates also confirms that
there has been little or no change in the well hydraulic
properties. It was however recommended that the well is
treated with a biocide for iron bacteria prior to installing any
equipment.
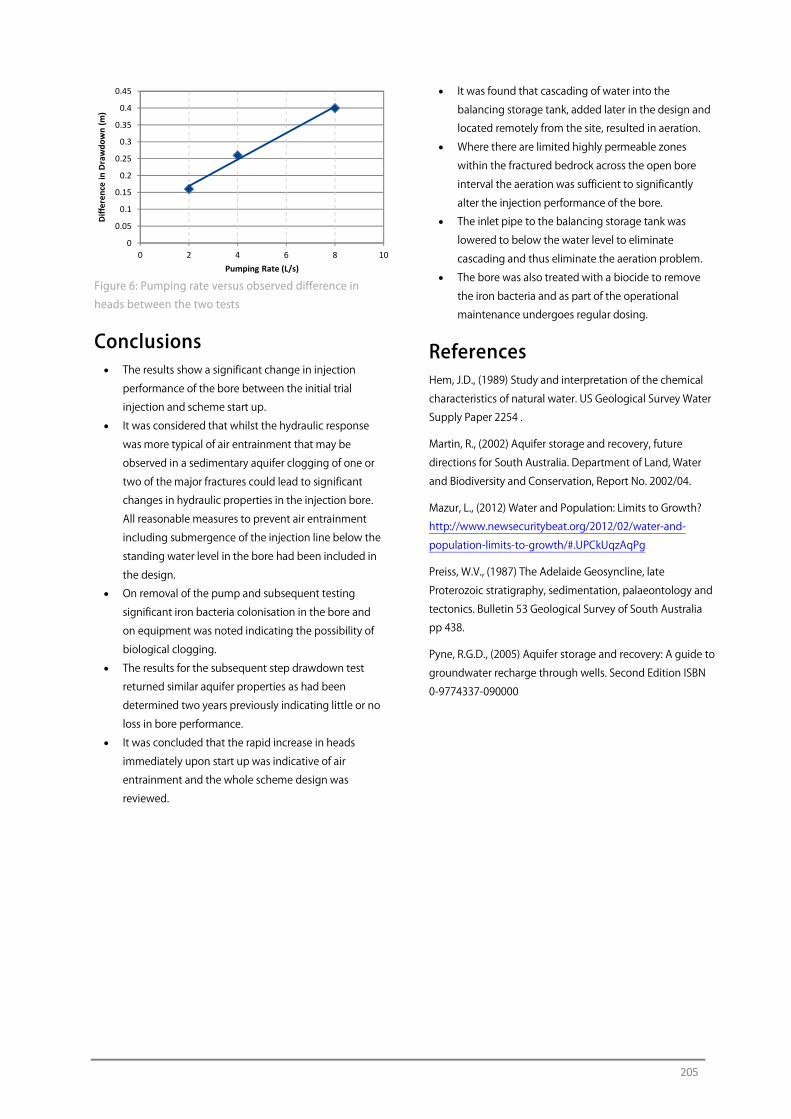
205
0
0.05
0.1
0.15
0.2
0.25
0.3
0.35
0.4
0.45
0 2 4 6 8 10
Diffe
renc
e in
Dra
wdo
wn
(m)
Pumping Rate (L/s)
Figure 6: Pumping rate versus observed difference in
heads between the two tests
Conclusions • The results show a significant change in injection
performance of the bore between the initial trial
injection and scheme start up.
• It was considered that whilst the hydraulic response
was more typical of air entrainment that may be
observed in a sedimentary aquifer clogging of one or
two of the major fractures could lead to significant
changes in hydraulic properties in the injection bore.
All reasonable measures to prevent air entrainment
including submergence of the injection line below the
standing water level in the bore had been included in
the design.
• On removal of the pump and subsequent testing
significant iron bacteria colonisation in the bore and
on equipment was noted indicating the possibility of
biological clogging.
• The results for the subsequent step drawdown test
returned similar aquifer properties as had been
determined two years previously indicating little or no
loss in bore performance.
• It was concluded that the rapid increase in heads
immediately upon start up was indicative of air
entrainment and the whole scheme design was
reviewed.
• It was found that cascading of water into the
balancing storage tank, added later in the design and
located remotely from the site, resulted in aeration.
• Where there are limited highly permeable zones
within the fractured bedrock across the open bore
interval the aeration was sufficient to significantly
alter the injection performance of the bore.
• The inlet pipe to the balancing storage tank was
lowered to below the water level to eliminate
cascading and thus eliminate the aeration problem.
• The bore was also treated with a biocide to remove
the iron bacteria and as part of the operational
maintenance undergoes regular dosing.
References Hem, J.D., (1989) Study and interpretation of the chemical
characteristics of natural water. US Geological Survey Water
Supply Paper 2254 .
Martin, R., (2002) Aquifer storage and recovery, future
directions for South Australia. Department of Land, Water
and Biodiversity and Conservation, Report No. 2002/04.
Mazur, L., (2012) Water and Population: Limits to Growth?
http://www.newsecuritybeat.org/2012/02/water-and-
population-limits-to-growth/#.UPCkUqzAqPg
Preiss, W.V., (1987) The Adelaide Geosyncline, late
Proterozoic stratigraphy, sedimentation, palaeontology and
tectonics. Bulletin 53 Geological Survey of South Australia
pp 438.
Pyne, R.G.D., (2005) Aquifer storage and recovery: A guide to
groundwater recharge through wells. Second Edition ISBN
0-9774337-090000

CLOGGING REHABILITATION AND REMEDIATION METHODS
207
Clogging Remediation Methods to Restore Well Injection Capacity R. Martin
General Manager, Australian Groundwater Technologies
Abstract A MAR scheme will invariably experience clogging of some type, and to some degree, during its operational life. To
recognise the potential for clogging and employ the appropriate mitigation or remediation measures, either
through engineering design or through operational management practices, requires specialist knowledge and
skills. It should also be noted that remediation methods to address clogging are very site specific and what works
in one hydrogeological setting may not always be successful in another location. Indeed remediation approaches
may differ between injection bores across the same scheme. This paper presents an overview of some of the
approaches that can be adopted to remediate bores once clogging has occurred.
Introduction Clogging is an ever present issue facing many operators of
managed aquifer recharge (MAR) schemes and can result in
lost harvesting opportunities where the scheme is shut
down for extended periods to carry out remediation
activities, often at significant cost.
Frequently, clogging that leads to the failure of a MAR
scheme occurs from a lack of proper aquifer characterisation
resulting from 1) poor data collection and organization; 2)
little or no integrated analysis of existing data by
experienced geological and engineering personnel; 3)
failure due to inexperience of practitioners to consider
remediation methods; 4) engagement of multiple sub-
contractors by the proponent during the various stages of
investigation, design, construction and operation that
typically results in problems at the interface of each work
package; and 5) not identifying optimum management
techniques to prevent clogging or allow for remediation in
the event of it occurring.
This section deals primarily with remediation methods that
can be employed to restore and improve injection capability
within recharge wells. It should be noted that the well
remediation methods presented herein are not exhaustive,
for example, there are proprietary techniques developed by
experienced ASR practitioners that are not discussed.
To adopt the correct remediation method requires
adequate and detailed aquifer characterisation during the
initial site investigations followed by reliable monitoring
during operation. It is becoming increasingly apparent that
inexperienced practitioners are failing to adequately
characterise the target aquifer which is leading to poor well
design and poor selection of casing materials thereby
limiting the options for well remediation when clogging
arises. There is a real risk that poor practice increasingly puts
at risk the uptake of MAR as a viable and effective water
resources management tool.
There are various measures that can be incorporated to
minimise clogging and prolong the operational life of the
well ranging from engineering through to operational
controls. These preventative measures include:
• Selection of appropriate drilling methods and drilling
fluids to avoid formation damage.
• Appropriate development of the well on completion
of drilling and casing installation.
• Selection of the appropriate well design for the target
aquifer.
• Periodic backwashing of the recharge wells at
specified times or volumes recharged.
• Removal of air from the recharge water using
dissolved oxygen scrubbers or through the addition of
carbon dioxide.
• Eliminating as much as reasonably possible the
potential for air entrainment in the recharge water
within the MAR scheme infrastructure.
• Periodic or constant chemical dosing to treat for algae
and microbiological activity.
• Ultra filtration (membrane and Ultra Violet treatment)
prior to recharge via the well.
• Reverse osmosis pre-treatment and ultra-filtration if
wastewater is the primary recharge water source.
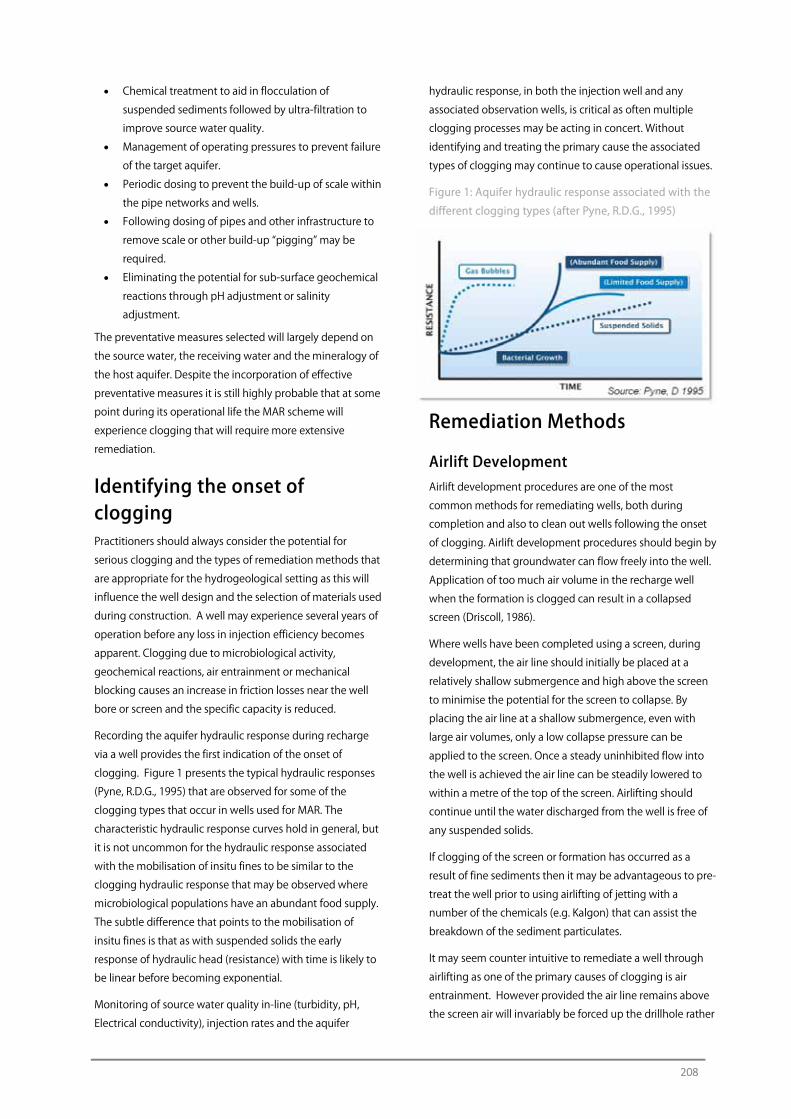
208
• Chemical treatment to aid in flocculation of
suspended sediments followed by ultra-filtration to
improve source water quality.
• Management of operating pressures to prevent failure
of the target aquifer.
• Periodic dosing to prevent the build-up of scale within
the pipe networks and wells.
• Following dosing of pipes and other infrastructure to
remove scale or other build-up “pigging” may be
required.
• Eliminating the potential for sub-surface geochemical
reactions through pH adjustment or salinity
adjustment.
The preventative measures selected will largely depend on
the source water, the receiving water and the mineralogy of
the host aquifer. Despite the incorporation of effective
preventative measures it is still highly probable that at some
point during its operational life the MAR scheme will
experience clogging that will require more extensive
remediation.
Identifying the onset of clogging Practitioners should always consider the potential for
serious clogging and the types of remediation methods that
are appropriate for the hydrogeological setting as this will
influence the well design and the selection of materials used
during construction. A well may experience several years of
operation before any loss in injection efficiency becomes
apparent. Clogging due to microbiological activity,
geochemical reactions, air entrainment or mechanical
blocking causes an increase in friction losses near the well
bore or screen and the specific capacity is reduced.
Recording the aquifer hydraulic response during recharge
via a well provides the first indication of the onset of
clogging. Figure 1 presents the typical hydraulic responses
(Pyne, R.D.G., 1995) that are observed for some of the
clogging types that occur in wells used for MAR. The
characteristic hydraulic response curves hold in general, but
it is not uncommon for the hydraulic response associated
with the mobilisation of insitu fines to be similar to the
clogging hydraulic response that may be observed where
microbiological populations have an abundant food supply.
The subtle difference that points to the mobilisation of
insitu fines is that as with suspended solids the early
response of hydraulic head (resistance) with time is likely to
be linear before becoming exponential.
Monitoring of source water quality in-line (turbidity, pH,
Electrical conductivity), injection rates and the aquifer
hydraulic response, in both the injection well and any
associated observation wells, is critical as often multiple
clogging processes may be acting in concert. Without
identifying and treating the primary cause the associated
types of clogging may continue to cause operational issues.
Figure 1: Aquifer hydraulic response associated with the
different clogging types (after Pyne, R.D.G., 1995)
Remediation Methods
Airlift Development Airlift development procedures are one of the most
common methods for remediating wells, both during
completion and also to clean out wells following the onset
of clogging. Airlift development procedures should begin by
determining that groundwater can flow freely into the well.
Application of too much air volume in the recharge well
when the formation is clogged can result in a collapsed
screen (Driscoll, 1986).
Where wells have been completed using a screen, during
development, the air line should initially be placed at a
relatively shallow submergence and high above the screen
to minimise the potential for the screen to collapse. By
placing the air line at a shallow submergence, even with
large air volumes, only a low collapse pressure can be
applied to the screen. Once a steady uninhibited flow into
the well is achieved the air line can be steadily lowered to
within a metre of the top of the screen. Airlifting should
continue until the water discharged from the well is free of
any suspended solids.
If clogging of the screen or formation has occurred as a
result of fine sediments then it may be advantageous to pre-
treat the well prior to using airlifting of jetting with a
number of the chemicals (e.g. Kalgon) that can assist the
breakdown of the sediment particulates.
It may seem counter intuitive to remediate a well through
airlifting as one of the primary causes of clogging is air
entrainment. However provided the air line remains above
the screen air will invariably be forced up the drillhole rather
209
than into the formation. Cleaning of the screen is achieved
by the sudden inrush of water from the aquifer to replace
the water expelled out of the top of the well.
Air lift development should be avoided in aquifers that are
prone to “air locking” such as stratified formations
consisting of coarse sand or gravel lenses separated by thin,
impermeable clay layers. “Air locking”, as with air
entrainment in general may impede the flow of water into
and from the well, while also increasing the potential for
iron precipitation within the formation thus creating a
secondary clogging issue.
High Velocity Jetting Jetting involves injection of compressed air or water at the
bottom of the well, and the accumulated sediment is forced
out the top. The frequency with which recharge wells
should be cleaned will vary greatly depending on the
sediment load from the site and the depth of the well.
The jetting procedure consists of operating a horizontal
water jet inside the well screen so that high velocity streams
of water shoot out through the screen openings. Jetting is
extremely successful in developing highly stratified,
unconsolidated formations. The equipment required for jet
development includes a jetting tool with two or more
equally spaced nozzles, high pressure pump, high pressure
hose and connections, pipe, and water tank or other water
supply. Material loosened from the screen or formation
accumulates at the bottom of the screen (or in the sump if
included in the well completion design) as the jetting tool is
raised slowly. This material is removed later by airlift
pumping (Driscoll, 1986).
Vacuum Pumping Vacuum pumping involves a dual pipe system. Air is forced
down the inner tube and returns up the annular space
between the inner and outer tubing. As the outer tubing
extends past the inner tube outlet a vacuum is created and
sucks up the fine material that has accumulated on the walls
of the formation. It is an extremely effective method if there
are concerns about introducing air into the formation.
Vacuum pumping is only suitable for wells where there is no
gravel pack or screen. As in some cases the high inflow
velocity generated is higher than the average calculated for
a screen dimension and slot size, and a concentration of
clogging can be induced behind the screen in this high-
velocity zone.
Acidisation Acidising is typically performed to increase formation
permeability in undamaged wells; however, it can be
applied to improve injection performance in wells that have
become clogged by either particulate matter or through
microbiological activity. Care needs to be taken when
acidising as sometimes additional fines are mobilised
through the dissolution process. Furthermore a propping
agent may need to be used to maintain the stability of the
aquifer matrix and keep the formation open after
dissolution.
An ideal acidising fluid is able to penetrate long distances,
etch fracture faces, increase the permeability of the matrix
where the fluid enters the formation by diffusion, and
remove any existing formation damage.
A number of different acids are used in conventional
acidising treatments. The most common are:
• Hydrochloric, HCl
• Hydrofluoric, HF
• Acetic, CH3COOH
• Formic, HCOOH
• Sulfamic, H2NSO3H
• Chloroacetic, ClCH2COOH.
These acids differ in their characteristics. Choice of the acid
and any additives for a given situation depends on the
aquifer matrix characteristics and the specific intention of
the treatment, for example, near well damage removal,
dissolution of scale in fractures, etc.
Portier et al. (2007) outline a number of factors controlling
the reaction rate of acid:
• area of contact per unit volume of acid;
• formation temperature;
• pressure;
• acid concentration;
• acid type;
• physical and chemical properties of formation rock;
and
• flow velocity of acid.
Hydrochloric acid and hydrofluoric acid are the two most
common acidizing treatments. However, the very fast
reaction rate of hydrochloric acid, and other acids listed
above, can limit their effectiveness in a number of
applications. All conventional acids including HCl and
organic acids react very rapidly on contact with acid
sensitive material in the well or formation. “Worm-holing” is
a common phenomenon. The rapid reaction means the acid
does not penetrate very far into the formation before it is
spent. Conventional acid systems are therefore of limited
effectiveness in treatments where deep acid penetration is
210
needed.
Portier et al. (2007) discuss acid stimulation in significant
detail including the addition of polymers and surfactants to
retard acid reaction rates and achieve deeper formation
penetration of the acid before it is spent.
Less known and less used than either HCL or sulfamic acid,
hydroxyacetic acid is safer to use and has the benefit of
being a bactericide and will directly attack and kill iron
bacteria. It works the slowest of the HCL, Sulfamic or
Hydrofluoric acids, so its contact time in the well will be the
longest to achieve the desired effect. Hydroxyacetic acid is
relatively non-corrosive and produces no fumes.
Biocides Where Environmental Protection Agency regulations permit,
shock chlorination may be used to limit the growth of iron
bacteria and other microorganisms. The shock chlorination
approach is widely used in the rehabilitation of wells
severely plugged by biofouling bacteria. Concentrations as
high as 500 to 2,000 ppm are used. Once injected into the
well, water is added to force the chlorine mixture out into
the formation. Agitation is always recommended to increase
surface contact between the biofouling agents and the high
concentration chlorine solution. Mechanical brushing,
agitation, surging and jetting are all used to increase the
turbulence of the chlorine solution in the well. Shock
chlorination may be used as the first step, then acidisation
of the well (note- the well must be fully purged of the
chlorine solution before acidisation) with agitation to
improve removal of encrustation, and thirdly another shock
chlorination treatment.
Chlorine based approaches are more effective the longer
the contact time between the chlorine solution and the
biofouling agents. Disposal of the waste water after both
the shock chlorination and the acidisation must be done
with awareness of safe disposal procedures.
Under-reaming Where a well hole has been completed as an open hole
construction and under-reamer can be used to enlarge the
well beyond bit diameter. Assuming that the clogging has
occurred primarily within the first few centimetres of the
aquifer matrix the under-reamer can be used to effectively
create a fresh well face by removing the clogged section of
the aquifer. An under reamer can be opened and closed
several times down hole, making it easy to enlarge the well
hole over specific sections.
This approach is useful where jetting or airlift development
have failed to improve the injection capacity of the well.
Scrubbing Wire brushing and scraping are effective means for
removing encrustations from inside the casing and well
screen. The loosened material can be removed by air lifted,
bailing, or other means. This approach may be a good first
step in rehabilitation as it may allow greater access to the
formation for chemicals to be introduced later if the
scrubbing fails to improve well injection capacity.
In some cases it may be difficult to find a drilling contractor
that has the appropriate tools necessary to scrub the casing
and screens. Where such an activity is undertaken it may be
necessary to shut down or scale back the injection
operations in any nearby wells so that the bore can be
effectively worked on.
Heating Heat can be used to increase the effectiveness of chemical
treatments in well rehabilitation. Water is withdrawn from
the well, heated and recirculated into the well to increase
the action of chemical solutions. Several specialists in
rehabilitation routinely employ heated chemical treatments
as part a blended of a multi-step approach to well
remediation. Heat alone can also be an effective biofouling
removal method where chemicals cannot be used.
Summary A rule of thumb is that if the injection capacity of a well has
declined by about 25%, it is time to begin rehabilitation
efforts. The earlier the rehabilitation commences the more
efficient and cost effective the remediation will be. Down
time of the scheme and thus lost harvesting opportunities
can also be kept to a minimum. The approach to be adopted
for the well remediation will be determined by the clogging
type, well construction and target aquifer mineralogy. Not
all remediation methods are suitable for every site and
indeed different remediation methods may need to be
adopted for different wells within the same well field.
A multi-step or blended approach to rehabilitation that
involves combinations of mechanical brushing, agitation,
surging and/or jetting produces a superior result.
Acidisation and other remediation methods such as shock
chlorination should only be carried out by experienced
practitioners. In some cases this may present a barrier to the
implementation of an ASR scheme as there may be an
insufficient number of experienced practitioners available
that have the skills or the equipment necessary to carry out
211
the remediation work. Therefore, this presents a potential
risk to the sustainable operation of the schemes when
significant capital may have been invested and there are
insufficient local skills to effectively rehabilitate the wells
when required.
To determine the effectiveness of the adopted remediation
action some reference point is needed. Typically this is the
aquifer hydraulic properties in particular specific capacity,
prior to the commencement of injection. It is recommended
as a minimum to undertake a step drawdown aquifer
discharge test on all injection wells that can then be used as
the performance baseline against which clogging and
remediation effectiveness can be assessed.
References Bennion, D.B., Bennion, D.W., Thomas, F.B. and Bietz, R.F.,
(1998) Injection Water quality ‒ a key factor to successful waterflooding. Journal of Canadian Petroleum Technology
Vol 37. No. 26
Driscoll, F.G., (1986) Groundwater and wells second edition. Published by Johnson Screens, St Paul, Minnesota 55112
ISBN 0-9616456-0-1 Eighth printing
Portier, S., André, L. and Vuataz, F.D., (2007), Review on chemical stimulation techniques in oil industry and applications to geothermal systems by CREGE ‒ Centre for
Geothermal Research, Neuchâtel, Switzerland
Pyne, R.D.G., (1995) Groundwater recharge and wells: A guide to aquifer storage and recovery: A. ISBN 1-56670-097-
3
Pyne, R. D.G., (2005) Aquifer storage and recovery: A guide to groundwater recharge through wells 2nd Edition. ISBN 0-
9774337-090000

212
Contact Details of Authors
Name Co-contributors e-mail
Russell MARTIN [email protected]
Peter DILLON [email protected]
Saeed TORKZABAN [email protected]
Adam HUTCHINSON [email protected]
Don PHIPPS [email protected]
Grizel RODRIGUEZ [email protected]
Greg WOODSIDE [email protected]
Michael MARTIN [email protected]
Karen JOHNSTON [email protected]
David MAYS [email protected]
Bobak Willis-Jones [email protected]
Ian Brandes de Roos [email protected]
Sahmed Benamar [email protected]
Ray RUEMENAPP [email protected]
Claudia HARTWIG [email protected]
Makoto NISHIGAKI [email protected]
Beatriz de la Loma González [email protected]
Pieter Stuyfzand
Victor HEILWEIL [email protected]
Declan Page [email protected]
Joanne VANDERZALM Vanderzalm [email protected]

213
[THIS PAGE INTENTIONALLY LEFT BLANK]