climate change and viticulture. informing the decision making at a regional level
TRANSCRIPT
WATER
Peter Hayman
Peter Leske
Uday nidUmoLU

How to cite this document:
Hayman, P.T., Leske, P., and Nidumolu, U. (2009)
Climate change and Viticulture. Informing the decision making at a regional level. South Australian Wine Industry Association and South Australian Research and Development Institute.
GWRDC Project SAW 06/01
Version 1.0, October 2009
Design and production by Marcia Burnett and Mark Gishen, South Australian Wine Industry Association Inc
More infomation, comments or suggestions: [email protected]
Photo courtesy of SARDI

1
Climate Change and Viticulture - Informing the decision making at a regional level
10. References . . . . . . . . . . . . . . . . . . . . . . . . . . . . . . . . . . . . . . . . . . . . . . . . . . . . . . . . . . . . . . . . . . . . . . . . . . . . . . . . . . . . . . . . . . . . . . . . . . . . . . . . . . . . . . Inside back cover
This information kit was developed as part of a Grape and Wine Research and Development Corporation (GWRDC) funded project. It has been prepared by Peter Hayman an agricultural scientist working in climate applications with South Australian Research and Development Institute (SARDI), Peter Leske, a wine maker who worked as technical manager for South Australian Wine Industry Association Incorporated (SAWIA) and Uday Nidumolu a spatial scientist working on integrating land use and climate information with SARDI. The kit was developed through interaction with the SA Riverland viticultural technical group and Clare Valley Wine Makers Inc.. Mike McCarthy (Principal Scientist - Viticulture, SARDI) provided guidance throughout the project and along with Chris Soar (Research Scientist - Viticulture, SARDI) provided valuable feedback on the document. Leanne Webb (CSIRO & University of Melbourne) made a series of useful suggestions on a draft version.
CONTENTS
1. Introduction . . . . . . . . . . . . . . . . . . . . . . . . . . . . . . . . . . . . . . . . . . . . . . . . . . . . . . . . . . . . . . . . . . . . . . . . . . . . . . . . . . . . . . . . . . . . . . . . . . . . . . . . . . . . . . . . . . . . . . . . . . . . . . . . . . . . . . . . . . . 2
How does the kit work . . . . . . . . . . . . . . . . . . . . . . . . . . . . . . . . . . . . . . . . . . . . . . . . . . . . . . . . . . . . . . . . . . . . . . . . . . . . . . . . . . . . . . . . . . . . . . . . . . . . . . . . . . . . . . . . . . . . . . . 3
2. Climate Change Impacts . . . . . . . . . . . . . . . . . . . . . . . . . . . . . . . . . . . . . . . . . . . . . . . . . . . . . . . . . . . . . . . . . . . . . . . . . . . . . . . . . . . . . . . . . . . . . . . . . . . . . . . . . . . . . . . . . . . 5
3. Climate Change Projections . . . . . . . . . . . . . . . . . . . . . . . . . . . . . . . . . . . . . . . . . . . . . . . . . . . . . . . . . . . . . . . . . . . . . . . . . . . . . . . . . . . . . . . . . . . . . . . . . . . . . . . . . . . 11
4. STOCkTakE 20
5. ClimaTE 22
6. WaTEr 30
7. SOilS 35
8. VariETiES 40
9. ChECkliST 43
2
Climate Change and Viticulture - Informing the decision making at a regional level
1. iNTrOduCTiON
This information kit is designed to assist you, the members of the Australian grape growing and winemaking industry, understand what climate change may mean for your grape growing region.
Vineyards are a long-term asset, with a productive life of at least 30 years. Traditionally, we have made our decisions regarding which piece of land to use, which variety to plant, and which management practices to apply, on the understanding that while much will change in that time, the climate is pretty-much constant. Of course there are cool vintages and warmer vintages, but this season-to-season variation is understood within an envelope of a constant climate.
Now with the mounting evidence of accelerated climate change, it appears that this is no longer the case… but how do we get information on what might happen in our region?
This information kit sets out a step-by-step process to evaluate your current regional resources (climate, water, soils, varieties and other natural assets) and assess how they might change – and interact – in the future. At the end of the process you will have a clearer idea of the effects of possible climate change, and how you might adapt to it, either at an individual vineyard level, or as a member of a regional group.
it is not a manual on climate and viticulture. it does not intend to explain what climate change is all about, or its causes; nor is it a viticultural management textbook.
however, using ‘rules of thumb’ backed up by science, it will assist you to understand how possible climate change will affect vine phenology as well as your ‘viticultural resources’, including water demand and supply, and soil health. how you respond to any possible change is up to you, but the kit provides some general information on what actions you may consider.
It seeks to help you answer several basic questions:
What have we currently got? (• we call this “The Stocktake”)
What information is needed to assess the potential changes – and where do we get it?•
Is this information good enough? •
What’s the level of uncertainty? •
How do we feed all this into our decision-making?•

3
Climate Change and Viticulture - Informing the decision making at a regional level
hOW dOES ThE iNfOrmaTiON kiT WOrk?
We are inevitably tempted to consider only the climatic impacts of ‘climate change’. However, the real impact of changes in climate on our businesses will be felt through our assets: our vines, and the essentials on which they rely: water, soil, and so on. And growing grapes and making wine is pointless without a market for our products, which often depends in part on our natural resources, be they climate or varieties grown.
The interactions between each of these ‘essentials’ are numerous and complex, and if we ignore one or the other we may miss an important and potentially damaging change coming our way.
We suggest you consider each ‘essential’ in turn, through several stages of a specific process.
Stage 1: define your region – is it one, or several?
Some regions are largely homogenous, without great variation in (for example) rainfall distribution, soil types, or landscape. One such example is the Riverland in South Australia. Others, such as Clare, include hills and valleys leading to diversity in altitude (i.e. temperature), soil type, and rainfall.
Stage 2: define the key indicators – what is important to you?
We all agree about the impact of a serious spring frost, or deluge in February. However, the effect of other climatic events depends on regional factors.
For example, one attribute considered important to quality and style in the Clare Valley is the daily variation in temperature – even after a hot day, it normally cools off well at night. An increased likelihood of hot nights is therefore a problem in Clare – but what is the definition of a “hot night”? A minimum of 23° – or 18°C?
You may face similar issues in deciding what is a risk factor for your region. This section will assist you define which climatic variables you most need to consider.

4
Climate Change and Viticulture - Informing the decision making at a regional level
Stage 3: The ‘Stocktake’. What are your current viticultural resources?
Where is the information that you need to work out what you currently have?
All regions will have access to a variety of sources of information regarding climate, soils and water: most people have the long term average rainfall and temperature for their region, but what else is available? In a word: plenty! We’ll help you find and understand it.
Many people also have their own localised data which is of special relevance to frost, for example. But how good is this information? And can it be used to help build a regional picture? A few rules of thumb will help you decide.
Finally, it may be helpful to get an accurate picture of what is currently grown in the region, where – and how old the plantings are.
Stage 4: how might these stocks might be affected?
We all know that things are projected to get warmer, but real changes in climate are likely to be much more complex and diverse than that. Rainfall, runoff, evaporation and transpiration, frost incidence, wind, hail… all may be affected. Some of these have been modelled by science; others we know little about.
We help you to use, and understand the limitations of global climate models to review what might happen in your region.
Stage 5: how might we respond?
It all depends on what you are facing! Is it heat? Drought? Flood?
We present some generic responses to climate change. They go further than the simplistic response of possibly planting varieties that are regarded as more heat tolerant. However, the kit does not seek to provide specific answers to the problem; rather, by helping you to understand what you have and how it might change, it aims to assist you to determine whether or not you need to act – and if so, how.
5
Climate Change and Viticulture - Informing the decision making at a regional level
ClimaTE ChaNgE – frOm Talk TO Walk
Only a few years ago climate change was seen as an ‘over the horizon’ issue for viticulture. If questions were asked about climate change more people were asking “what is climate change?” or “is climate change real?”.
Recent events have changed many people’s thinking. The run of warmer years, some serious heatwaves and most notably a major drought have led to reduced crops, and a series of early and compressed vintages. Many of us are now seeking answers as to the likely impacts of climate change – and following from that, asking “what can we do about it?”.
Five key climate change questions emerge from practical viticulturists.
What are the risks and opportunities presented by government policies to reduce 1. greenhouse gases (ghgs)?
What is the carbon footprint of my enterprise?2.
What are the projections for key variables such as temperature and rainfall for my region?3.
What do these changes mean for grapegrowing?4.
how can we adapt grapegrowing to manage these changes? 5.
The first two questions relate to greenhouse gas reduction or mitigation.
With the Federal Government set to introduce a carbon trading scheme in the near future, we will all need to either reduce our emissions, or expect to pay to continue emitting as we always have.
This document does not deal with emission reduction issues, nor explain jargon such as “carbon footprints”, “life cycle analysis”, or “food miles”.
A variety of bodies can help if you want to know more. These range from Government groups such as the Department of Climate Change, to commercial entities who market emissions counting and reduction tools and carbon credits. Importantly, industry bodies such as the Winemakers’ Federation of Australia (WFA) and the South Australian Wine Industry Association (SAWIA) are also active.
WFA have collaborated with their corresponding international partners in the USA, NZ and South Africa to manage the development of an industry-specific emissions calculator.
In partnership with the Winegrape Growers’ Council of SA, SAWIA have entered into an agreement with the State Government to assist the industry meet state-wide emissions reduction targets. All three organisations thus provide practical assistance to their members.
6
Climate Change and Viticulture - Informing the decision making at a regional level
Key contacts for more information in this area are as follows:
mark gishen, SaWia• 08 8222 9277 [email protected]
Jonathon green, Wfa• 08 8222 9255 [email protected]
Questions 3-5 relate to adapting to climate change; and this kit focuses primarily on Question 4: what climate change means for grapegrowing.
While we will lead you to consider adaptation strategies, these are best developed on a regional basis. Why?
Consider two hypothetical and climatically similar regions, both exposed to a likely future decrease in water availability of 20% in the foreseeable future.
One, due to the presence of phylloxera since the 1950s, has most of its vines on drought-tolerant rootstocks, and well-established nurseries to propagate graftlings cheaply and quickly; the other has the vast majority of vines on their own roots, and limited access to grafted material.
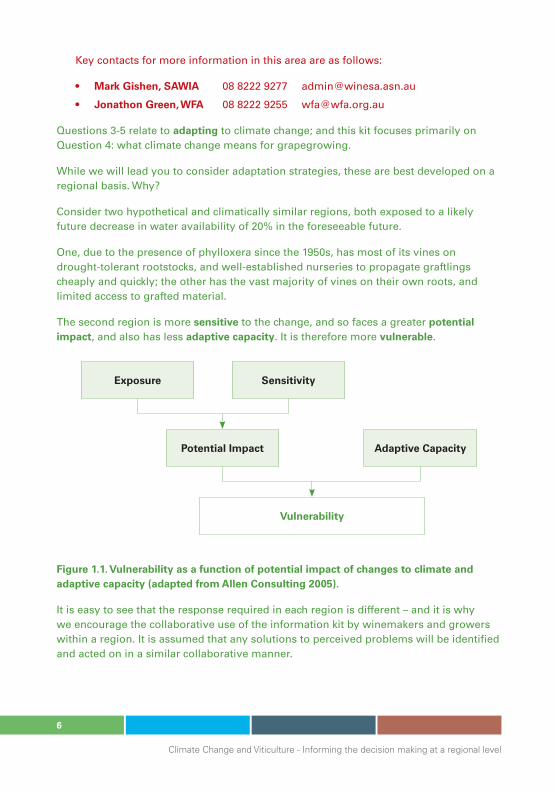
The second region is more sensitive to the change, and so faces a greater potential impact, and also has less adaptive capacity. It is therefore more vulnerable.
figure 1.1. Vulnerability as a function of potential impact of changes to climate and adaptive capacity (adapted from allen Consulting 2005).
It is easy to see that the response required in each region is different – and it is why we encourage the collaborative use of the information kit by winemakers and growers within a region. It is assumed that any solutions to perceived problems will be identified and acted on in a similar collaborative manner.
Exposure Sensitivity
Potential impact adaptive Capacity
Vulnerability
7
Climate Change and Viticulture - Informing the decision making at a regional level
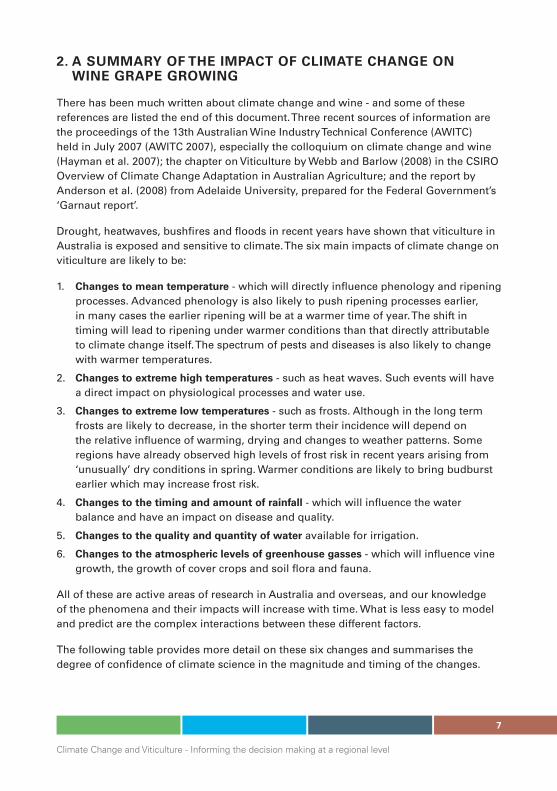
2. a Summary Of ThE imPaCT Of ClimaTE ChaNgE ON WiNE graPE grOWiNg
There has been much written about climate change and wine - and some of these references are listed the end of this document. Three recent sources of information are the proceedings of the 13th Australian Wine Industry Technical Conference (AWITC) held in July 2007 (AWITC 2007), especially the colloquium on climate change and wine (Hayman et al. 2007); the chapter on Viticulture by Webb and Barlow (2008) in the CSIRO Overview of Climate Change Adaptation in Australian Agriculture; and the report by Anderson et al. (2008) from Adelaide University, prepared for the Federal Government’s ‘Garnaut report’.
Drought, heatwaves, bushfires and floods in recent years have shown that viticulture in Australia is exposed and sensitive to climate. The six main impacts of climate change on viticulture are likely to be:
Changes to mean temperature1. - which will directly influence phenology and ripening processes. Advanced phenology is also likely to push ripening processes earlier, in many cases the earlier ripening will be at a warmer time of year. The shift in timing will lead to ripening under warmer conditions than that directly attributable to climate change itself. The spectrum of pests and diseases is also likely to change with warmer temperatures.
Changes to extreme high temperatures2. - such as heat waves. Such events will have a direct impact on physiological processes and water use.
Changes to extreme low temperatures3. - such as frosts. Although in the long term frosts are likely to decrease, in the shorter term their incidence will depend on the relative influence of warming, drying and changes to weather patterns. Some regions have already observed high levels of frost risk in recent years arising from ‘unusually’ dry conditions in spring. Warmer conditions are likely to bring budburst earlier which may increase frost risk.
Changes to the timing and amount of rainfall4. - which will influence the water balance and have an impact on disease and quality.
Changes to the quality and quantity of water5. available for irrigation.
Changes to the atmospheric levels of greenhouse gasses6. - which will influence vine growth, the growth of cover crops and soil flora and fauna.
All of these are active areas of research in Australia and overseas, and our knowledge of the phenomena and their impacts will increase with time. What is less easy to model and predict are the complex interactions between these different factors.
The following table provides more detail on these six changes and summarises the degree of confidence of climate science in the magnitude and timing of the changes.
8
Climate Change and Viticulture - Informing the decision making at a regional level
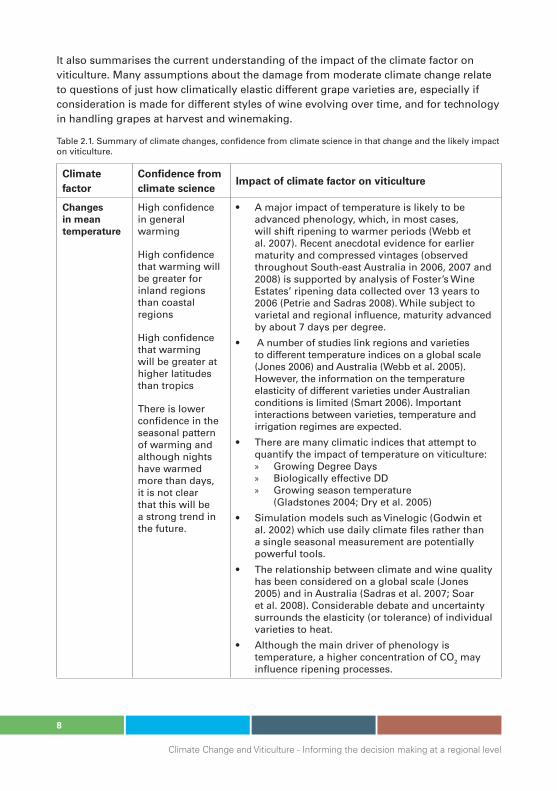
It also summarises the current understanding of the impact of the climate factor on viticulture. Many assumptions about the damage from moderate climate change relate to questions of just how climatically elastic different grape varieties are, especially if consideration is made for different styles of wine evolving over time, and for technology in handling grapes at harvest and winemaking.
Table 2.1. Summary of climate changes, confidence from climate science in that change and the likely impact on viticulture.
Climate factor
Confidence from climate science
impact of climate factor on viticulture
Changes in mean temperature
High confidence in general warming
High confidence that warming will be greater for inland regions than coastal regions
High confidence that warming will be greater at higher latitudes than tropics
There is lower confidence in the seasonal pattern of warming and although nights have warmed more than days, it is not clear that this will be a strong trend in the future.
A major impact of temperature is likely to be •advanced phenology, which, in most cases, will shift ripening to warmer periods (Webb et al. 2007). Recent anecdotal evidence for earlier maturity and compressed vintages (observed throughout South-east Australia in 2006, 2007 and 2008) is supported by analysis of Foster’s Wine Estates’ ripening data collected over 13 years to 2006 (Petrie and Sadras 2008). While subject to varietal and regional influence, maturity advanced by about 7 days per degree.
A number of studies link regions and varieties •to different temperature indices on a global scale (Jones 2006) and Australia (Webb et al. 2005). However, the information on the temperature elasticity of different varieties under Australian conditions is limited (Smart 2006). Important interactions between varieties, temperature and irrigation regimes are expected.
There are many climatic indices that attempt to •quantify the impact of temperature on viticulture:
Growing Degree Days »Biologically effective DD »Growing season temperature »(Gladstones 2004; Dry et al. 2005)
Simulation models such as Vinelogic (Godwin et •al. 2002) which use daily climate files rather than a single seasonal measurement are potentially powerful tools.
The relationship between climate and wine quality •has been considered on a global scale (Jones 2005) and in Australia (Sadras et al. 2007; Soar et al. 2008). Considerable debate and uncertainty surrounds the elasticity (or tolerance) of individual varieties to heat.
Although the main driver of phenology is •temperature, a higher concentration of CO2 may influence ripening processes.
9
Climate Change and Viticulture - Informing the decision making at a regional level
Climate factor
Confidence from climate science
impact of climate factor on viticulture
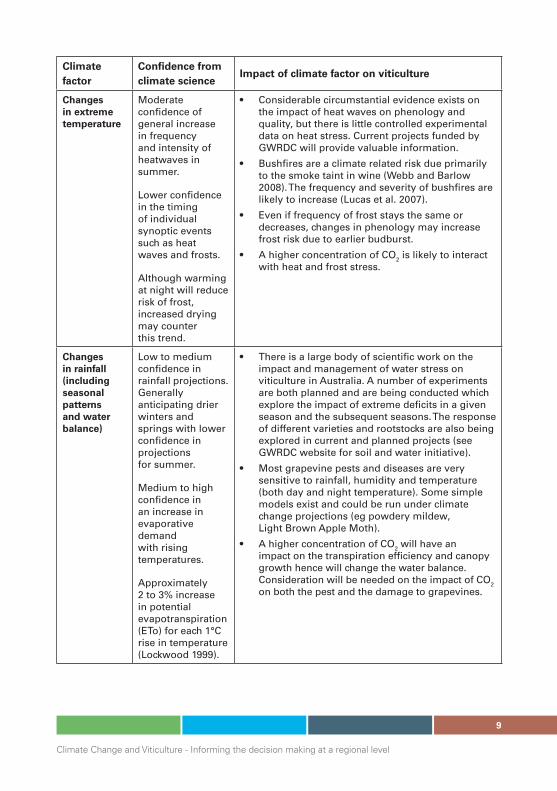
Changes in extreme temperature
Moderate confidence of general increase in frequency and intensity of heatwaves in summer.
Lower confidence in the timing of individual synoptic events such as heat waves and frosts.
Although warming at night will reduce risk of frost, increased drying may counter this trend.
Considerable circumstantial evidence exists on •the impact of heat waves on phenology and quality, but there is little controlled experimental data on heat stress. Current projects funded by GWRDC will provide valuable information.
Bushfires are a climate related risk due primarily •to the smoke taint in wine (Webb and Barlow 2008). The frequency and severity of bushfires are likely to increase (Lucas et al. 2007).
Even if frequency of frost stays the same or •decreases, changes in phenology may increase frost risk due to earlier budburst.
A higher concentration of CO• 2 is likely to interact with heat and frost stress.
Changes in rainfall (including seasonal patterns and water balance)
Low to medium confidence in rainfall projections. Generally anticipating drier winters and springs with lower confidence in projections for summer.
Medium to high confidence in an increase in evaporative demand with rising temperatures.
Approximately 2 to 3% increase in potential evapotranspiration (ETo) for each 1°C rise in temperature (Lockwood 1999).
There is a large body of scientific work on the •impact and management of water stress on viticulture in Australia. A number of experiments are both planned and are being conducted which explore the impact of extreme deficits in a given season and the subsequent seasons. The response of different varieties and rootstocks are also being explored in current and planned projects (see GWRDC website for soil and water initiative).
Most grapevine pests and diseases are very •sensitive to rainfall, humidity and temperature (both day and night temperature). Some simple models exist and could be run under climate change projections (eg powdery mildew, Light Brown Apple Moth).
A higher concentration of CO• 2 will have an impact on the transpiration efficiency and canopy growth hence will change the water balance. Consideration will be needed on the impact of CO2 on both the pest and the damage to grapevines.
10
Climate Change and Viticulture - Informing the decision making at a regional level
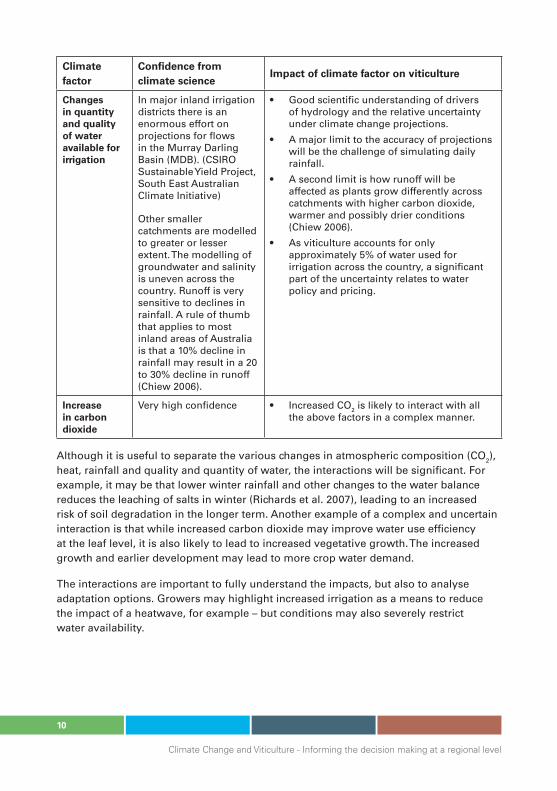
Climate factor
Confidence from climate science
impact of climate factor on viticulture
Changes in quantity and quality of water available for irrigation
In major inland irrigation districts there is an enormous effort on projections for flows in the Murray Darling Basin (MDB). (CSIRO Sustainable Yield Project, South East Australian Climate Initiative)
Other smaller catchments are modelled to greater or lesser extent. The modelling of groundwater and salinity is uneven across the country. Runoff is very sensitive to declines in rainfall. A rule of thumb that applies to most inland areas of Australia is that a 10% decline in rainfall may result in a 20 to 30% decline in runoff (Chiew 2006).
Good scientific understanding of drivers •of hydrology and the relative uncertainty under climate change projections.
A major limit to the accuracy of projections •will be the challenge of simulating daily rainfall.
A second limit is how runoff will be •affected as plants grow differently across catchments with higher carbon dioxide, warmer and possibly drier conditions (Chiew 2006).
As viticulture accounts for only •approximately 5% of water used for irrigation across the country, a significant part of the uncertainty relates to water policy and pricing.
increase in carbon dioxide
Very high confidence Increased CO• 2 is likely to interact with all the above factors in a complex manner.
Although it is useful to separate the various changes in atmospheric composition (CO2), heat, rainfall and quality and quantity of water, the interactions will be significant. For example, it may be that lower winter rainfall and other changes to the water balance reduces the leaching of salts in winter (Richards et al. 2007), leading to an increased risk of soil degradation in the longer term. Another example of a complex and uncertain interaction is that while increased carbon dioxide may improve water use efficiency at the leaf level, it is also likely to lead to increased vegetative growth. The increased growth and earlier development may lead to more crop water demand.
The interactions are important to fully understand the impacts, but also to analyse adaptation options. Growers may highlight increased irrigation as a means to reduce the impact of a heatwave, for example – but conditions may also severely restrict water availability.
11
Climate Change and Viticulture - Informing the decision making at a regional level
3. ClimaTE ChaNgE PrOJECTiONS
It is not uncommon for people to say “Unless you can tell me what is going to happen on my vineyard or at least my region by 2030, I can’t take any steps to adapt”. How precise can we be in response? The answer is “not very” – but there are good reasons for this uncertainty.
First: Uncertainty in future levels of greenhouse gasses. Future warming is driven by the concentration of CO2 (and other greenhouse gases; “emission scenarios”) in the atmosphere at a certain time. While we are all agreed that CO2 levels will increase, we do not know how quickly, or to what level. This contributes to about half the uncertainty for global temperatures in 2100.
Second: Uncertainty due to different models of global climate. Climate research centres around the world have different models. These models do not all agree. One of the main differences is the ‘sensitivity’ of the climate – or the change in global temperatures for a given change in greenhouse gasses.
Third: What impact will global warming have on the climate of a given region. While the wine grape industry wants to know about changes to temperature and rainfall at a local scale, the information from climate science is at a much broader scale.
Although there will be improvements in climate modelling there will always be a mismatch between the level of accuracy needed by decision makers, and what can be delivered by climate science. What is relatively certain is that we know enough to plan for a warmer future, and that it is prudent to consider a water constrained future.
A technical summary of the current understanding of trends and projections for Australia can be found in the report Climate Change in Australia (CSIRO and Bureau of Meteorology 2007) released October 2007. This report and the associated interactive website address in detail the issues of emission uncertainty and model uncertainty.
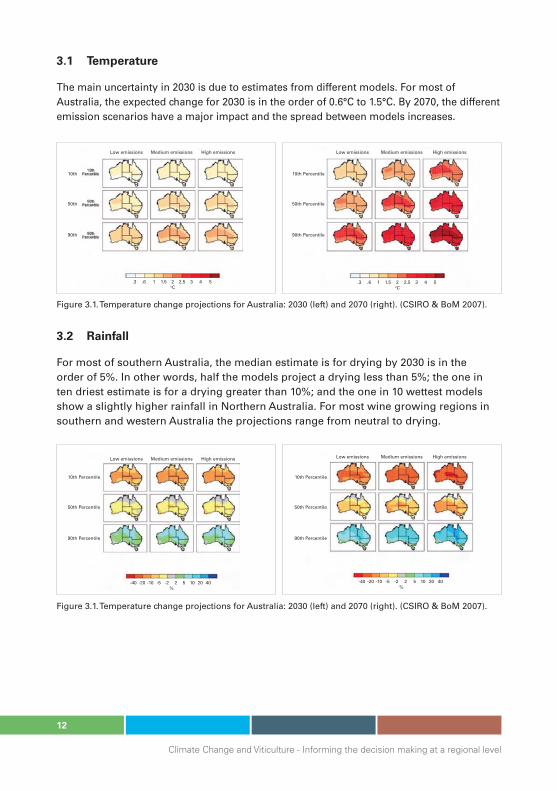
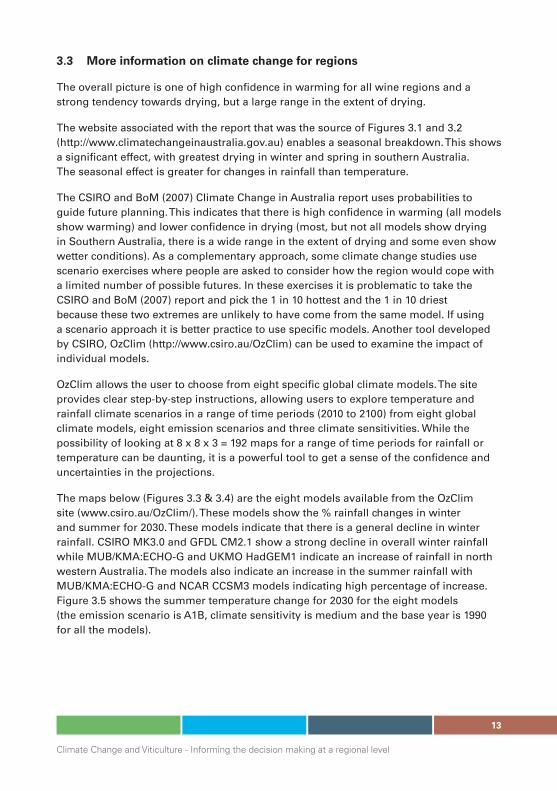
One of the clear ways of showing the sources of uncertainty (emissions and science or model uncertainty) is in a panel of 9 maps reproduced in Figure 3.1 and 3.2. which show the change from a baseline climate of 1980 to 2000.
The three columns represent the different emission scenarios (low, medium, high); the rows represent the range in model outcomes. A percentile is found by ranking the 23 models from lowest to highest (or coolest estimate to hottest estimate, driest estimate to wettest estimate). The 50th percentile is the middle of the range of models (11 were cooler and 11 warmer). The 10th percentile is the estimate from the 1 in 10 coolest model, while the 90th percentile is the 1 in 10 warmest model. A useful way of interpreting the grids in figures 3.1 and 3.2 is that 80% of the model results lie between the 10th and 90th percentiles.
12
Climate Change and Viticulture - Informing the decision making at a regional level
3.1 Temperature
The main uncertainty in 2030 is due to estimates from different models. For most of Australia, the expected change for 2030 is in the order of 0.6°C to 1.5°C. By 2070, the different emission scenarios have a major impact and the spread between models increases.
3.2 rainfall
For most of southern Australia, the median estimate is for drying by 2030 is in the order of 5%. In other words, half the models project a drying less than 5%; the one in ten driest estimate is for a drying greater than 10%; and the one in 10 wettest models show a slightly higher rainfall in Northern Australia. For most wine growing regions in southern and western Australia the projections range from neutral to drying.
Figure 3.1. Temperature change projections for Australia: 2030 (left) and 2070 (right). (CSIRO & BoM 2007).
Low emissions Medium emissions High emissions
10th Percentile
50th Percentile
90th Percentile
Low emissions Medium emissions High emissions
10th Percentile
50th Percentile
90th Percentile
-40 -20 -10 -5 -2 2 5 10 20 40%
-40 -20 -10 -5 -2 2 5 10 20 40%
10th Percentile
50th Percentile
90th Percentile
Figure 3.1. Temperature change projections for Australia: 2030 (left) and 2070 (right). (CSIRO & BoM 2007).
Low emissions Medium emissions High emissions Low emissions Medium emissions High emissions
10th Percentile
50th Percentile
90th Percentile
.3 .6 1 1.5 2 2.5 3 4 5oC
.3 .6 1 1.5 2 2.5 3 4 5oC
13
Climate Change and Viticulture - Informing the decision making at a regional level
3.3 more information on climate change for regions
The overall picture is one of high confidence in warming for all wine regions and a strong tendency towards drying, but a large range in the extent of drying.
The website associated with the report that was the source of Figures 3.1 and 3.2 (http://www.climatechangeinaustralia.gov.au) enables a seasonal breakdown. This shows a significant effect, with greatest drying in winter and spring in southern Australia. The seasonal effect is greater for changes in rainfall than temperature.
The CSIRO and BoM (2007) Climate Change in Australia report uses probabilities to guide future planning. This indicates that there is high confidence in warming (all models show warming) and lower confidence in drying (most, but not all models show drying in Southern Australia, there is a wide range in the extent of drying and some even show wetter conditions). As a complementary approach, some climate change studies use scenario exercises where people are asked to consider how the region would cope with a limited number of possible futures. In these exercises it is problematic to take the CSIRO and BoM (2007) report and pick the 1 in 10 hottest and the 1 in 10 driest because these two extremes are unlikely to have come from the same model. If using a scenario approach it is better practice to use specific models. Another tool developed by CSIRO, OzClim (http://www.csiro.au/OzClim) can be used to examine the impact of individual models.
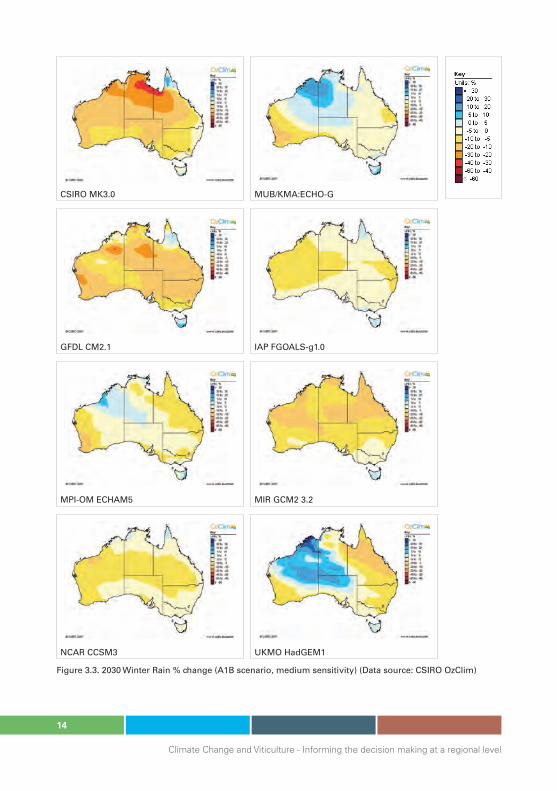
OzClim allows the user to choose from eight specific global climate models. The site provides clear step-by-step instructions, allowing users to explore temperature and rainfall climate scenarios in a range of time periods (2010 to 2100) from eight global climate models, eight emission scenarios and three climate sensitivities. While the possibility of looking at 8 x 8 x 3 = 192 maps for a range of time periods for rainfall or temperature can be daunting, it is a powerful tool to get a sense of the confidence and uncertainties in the projections.
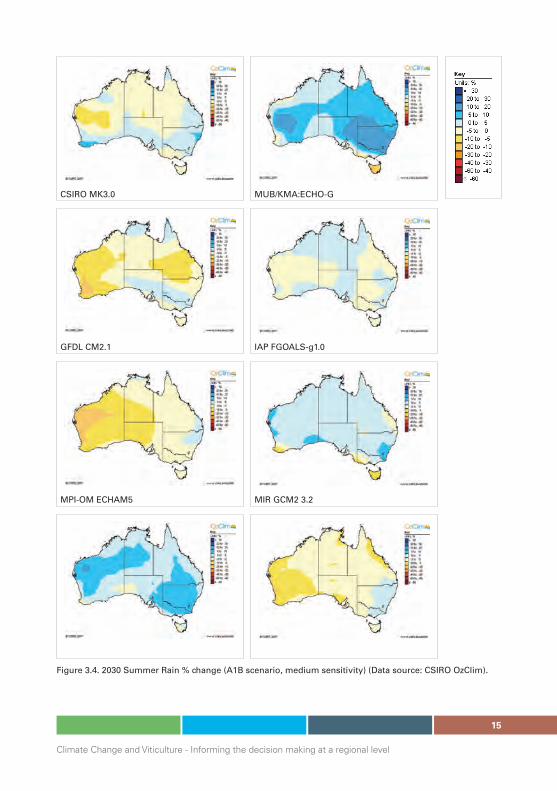
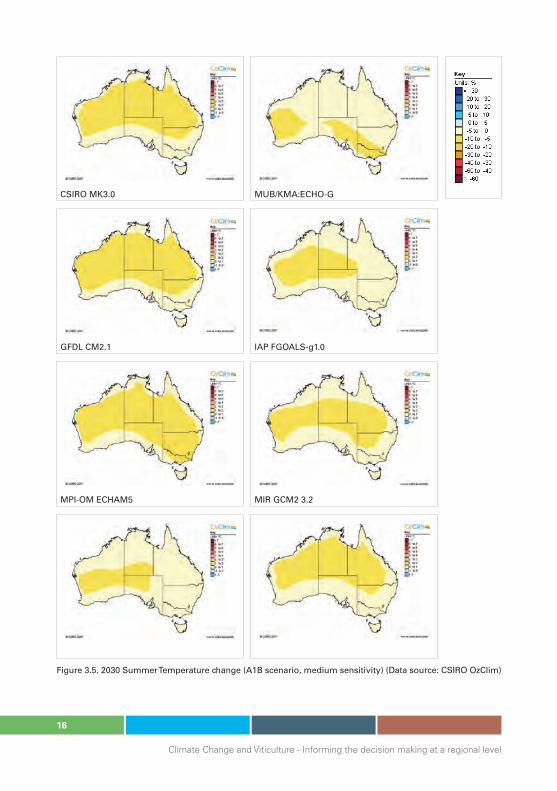
The maps below (Figures 3.3 & 3.4) are the eight models available from the OzClim site (www.csiro.au/OzClim/). These models show the % rainfall changes in winter and summer for 2030. These models indicate that there is a general decline in winter rainfall. CSIRO MK3.0 and GFDL CM2.1 show a strong decline in overall winter rainfall while MUB/KMA:ECHO-G and UKMO HadGEM1 indicate an increase of rainfall in north western Australia. The models also indicate an increase in the summer rainfall with MUB/KMA:ECHO-G and NCAR CCSM3 models indicating high percentage of increase. Figure 3.5 shows the summer temperature change for 2030 for the eight models (the emission scenario is A1B, climate sensitivity is medium and the base year is 1990 for all the models).
14
Climate Change and Viticulture - Informing the decision making at a regional level
Figure 3.3. 2030 Winter Rain % change (A1B scenario, medium sensitivity) (Data source: CSIRO OzClim)
CSIRO MK3.0
GFDL CM2.1
MPI-OM ECHAM5
NCAR CCSM3
MUB/KMA:ECHO-G
IAP FGOALS-g1.0
MIR GCM2 3.2
UKMO HadGEM1
15
Climate Change and Viticulture - Informing the decision making at a regional level
Figure 3.4. 2030 Summer Rain % change (A1B scenario, medium sensitivity) (Data source: CSIRO OzClim).
CSIRO MK3.0
GFDL CM2.1
MPI-OM ECHAM5
MUB/KMA:ECHO-G
IAP FGOALS-g1.0
MIR GCM2 3.2
16
Climate Change and Viticulture - Informing the decision making at a regional level
Figure 3.5. 2030 Summer Temperature change (A1B scenario, medium sensitivity) (Data source: CSIRO OzClim)
CSIRO MK3.0
GFDL CM2.1
MPI-OM ECHAM5
MUB/KMA:ECHO-G
IAP FGOALS-g1.0
MIR GCM2 3.2
17
Climate Change and Viticulture - Informing the decision making at a regional level
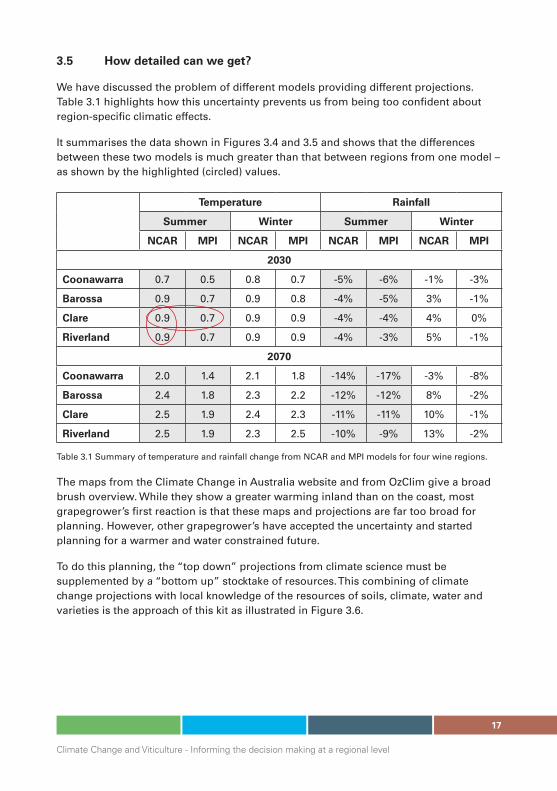
3.5 how detailed can we get?
We have discussed the problem of different models providing different projections. Table 3.1 highlights how this uncertainty prevents us from being too confident about region-specific climatic effects.
It summarises the data shown in Figures 3.4 and 3.5 and shows that the differences between these two models is much greater than that between regions from one model – as shown by the highlighted (circled) values.
Temperature rainfall
Summer Winter Summer Winter
NCar mPi NCar mPi NCar mPi NCar mPi
2030
Coonawarra 0.7 0.5 0.8 0.7 -5% -6% -1% -3%
Barossa 0.9 0.7 0.9 0.8 -4% -5% 3% -1%
Clare 0.9 0.7 0.9 0.9 -4% -4% 4% 0%
riverland 0.9 0.7 0.9 0.9 -4% -3% 5% -1%
2070
Coonawarra 2.0 1.4 2.1 1.8 -14% -17% -3% -8%
Barossa 2.4 1.8 2.3 2.2 -12% -12% 8% -2%
Clare 2.5 1.9 2.4 2.3 -11% -11% 10% -1%
riverland 2.5 1.9 2.3 2.5 -10% -9% 13% -2%
Table 3.1 Summary of temperature and rainfall change from NCAR and MPI models for four wine regions.
The maps from the Climate Change in Australia website and from OzClim give a broad brush overview. While they show a greater warming inland than on the coast, most grapegrower’s first reaction is that these maps and projections are far too broad for planning. However, other grapegrower’s have accepted the uncertainty and started planning for a warmer and water constrained future.
To do this planning, the “top down” projections from climate science must be supplemented by a “bottom up” stocktake of resources. This combining of climate change projections with local knowledge of the resources of soils, climate, water and varieties is the approach of this kit as illustrated in Figure 3.6.
18
Climate Change and Viticulture - Informing the decision making at a regional level
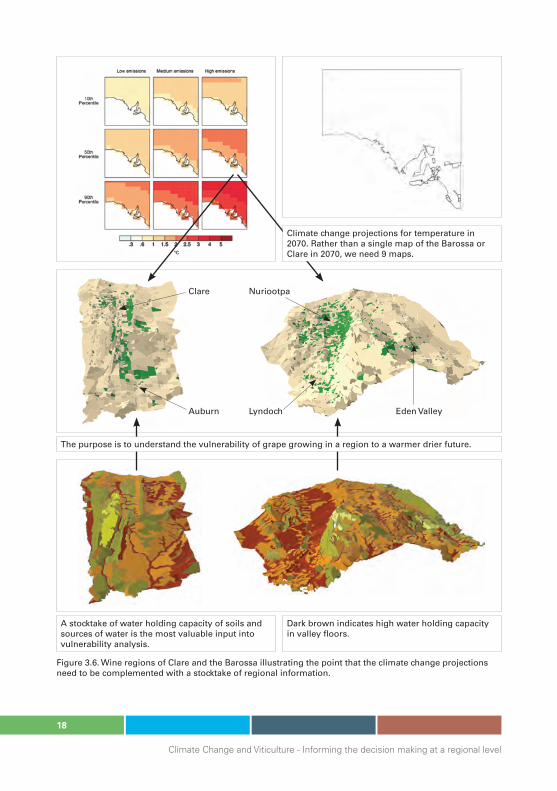
Figure 3.6. Wine regions of Clare and the Barossa illustrating the point that the climate change projections need to be complemented with a stocktake of regional information.
Clare
Auburn
Nuriootpa
Eden ValleyLyndoch
A stocktake of water holding capacity of soils and sources of water is the most valuable input into vulnerability analysis.
Dark brown indicates high water holding capacity in valley floors.
Climate change projections for temperature in 2070. Rather than a single map of the Barossa or Clare in 2070, we need 9 maps.
The purpose is to understand the vulnerability of grape growing in a region to a warmer drier future.
19
Climate Change and Viticulture - Informing the decision making at a regional level
WhErE TO gO fOr iNfOrmaTiON ON ClimaTE ChaNgE PrOJECTiONS?
The primary source of information on climate change projections is the report released in October 2007 by CSIRO and the Bureau of Meteorology, and is available at: http://www.climatechangeinaustralia.gov.au
A similar source of data on climate change projections is reports prepared for most states by CSIRO available from: http://www.dar.csiro.au/impacts/consult.html.
The state reports and the BoM and CSIRO (2007) “Climate change in Australia” report are based on the large international modelling effort conducted for the Intergovernmental on Panel Climate Change (IPCC). When using IPCC data, it is worth checking whether it is derived from the Third Assessment Round (based on models in the late 1990s), or the Fourth Assessment Round released in 2007. The general conclusion is the same (high confidence in warming and worrying but uncertain projections for drying). It is worth checking with the national and state departments dealing with climate change for the most recent report. A range of relevant websites are listed below.
National The Australian Government Department of Climate Change http://www.climatechange.gov.au/index.html
Queensland The Queensland Government Office of Climate Change http://www.climatechange.qld.gov.au/response/office.html
Victoria Victorian Climate Change Program – Department of Sustainability and Environment http://www.climatechange.vic.gov.au/index.html
Western australia The Office of Climate Change – Department of Environment and Conservation WA http://www.dec.wa.gov.au/our-environment/climate-change/index.html
South australia Sustainability and Climate Change Division – Department of the Premier and Cabinet http://www.premcab.sa.gov.au/dpc/department_sustainability.html
NSW The Department of Environment and Climate Change http://www.environment.nsw.gov.au/
Tasmania The Tasmanian Climate Change Office – Department of Premier and Cabinet http://www.climatechange.tas.gov.au/
20
Climate Change and Viticulture - Informing the decision making at a regional level
STOCkTakE
4. ThE NEEd fOr a STOCkTakE Of CurrENT rESOurCES iN aSSESSiNg fuTurE ClimaTE ChaNgE
The rest of this document focuses on a stocktake of existing resources. Most of the discussion about climate change refers to dates well into the future: frequently 2030 or 2050. However, without a stocktake of current assets, we cannot successfully consider the future, for a number of reasons:
future vulnerabilities are likely to be strongly linked to current strengths and •weaknesses;
a stocktake helps to identify the features that will be important to future adaptation; •and
a stocktake helps avoids focussing on any one aspect of future climate change •(for example, overly simplistic thinking about temperature ‘shifts’ of regions.)
A word about ‘shifts’. Comparisons are sometimes made in this style: “In terms of Mean January Temperature, Nuriootpa will become like Renmark”. We need to be careful describing future climate change in terms of one region ‘shifting’ to become like another. While possibly useful to start discussion on climate change, these comparisons are too simplistic, and are potentially misleading.
It is a mistake to suggest that the Barossa will face the same challenges in future as the Riverland faces today; the topography, soils and water resources of the Barossa will never resemble the Riverland – nor will those of Coonawarra resemble the Barossa, or Margaret River the Swan Valley.
The picture is far too complex to assume that a projected increase in temperature means broader similarity in conditions.
A stocktake involves asking the following questions, all relevant to a changed climatic future:
Regional climate stocktake• Which features of the current climate are particularly relevant to viticulture? Do problems arise now, during warm years or hot spells?
Regional soil stocktake• What is the moisture-holding capacity of the soils in the region; how spatially restricted are the soils for viticulture. For example, is there room to move up hill to cooler sites, and still have adequate soil depth and/or access to water?
Regional water stocktake• What are the sources of water available for viticulture in the region; what are the likely pressures on these sources in the future; and what are the policy implications? A water budget is a useful tool, and needs to be conducted at a block, vineyard and regional level.
21
Climate Change and Viticulture - Informing the decision making at a regional level
STOCkTakE
Regional variety stocktake• Which varieties are being grown in the region; how sensitive are they to climate change, and how close are they already to the edge of their adaptive range?
Regional asset stocktake• Which other features of the region are assets – such as strong tourism, close transport links, cellar door markets…?
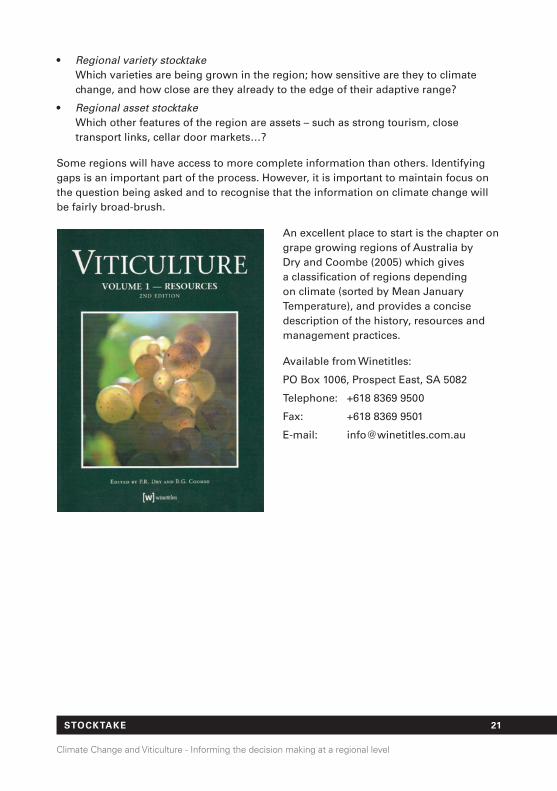
Some regions will have access to more complete information than others. Identifying gaps is an important part of the process. However, it is important to maintain focus on the question being asked and to recognise that the information on climate change will be fairly broad-brush.
An excellent place to start is the chapter on grape growing regions of Australia by Dry and Coombe (2005) which gives a classification of regions depending on climate (sorted by Mean January Temperature), and provides a concise description of the history, resources and management practices.
Available from Winetitles:
PO Box 1006, Prospect East, SA 5082
Telephone: +618 8369 9500
Fax: +618 8369 9501
E-mail: [email protected]

22
Climate Change and Viticulture - Informing the decision making at a regional level
ClimaTE
5. CONduCTiNg a rEgiONal ClimaTE STOCkTakE
5.1 information requirements for a climate stocktake
Information on climate change is in the form of degrees warmer and percent change to the rainfall. This raises the question, warmer or drier than what? Knowledge of current climate for a region and subregions is important in any consideration of climate change. Not only is the average temperature and rainfall important, but historical monthly data will allow an understanding of the year to year variability. For extreme events, daily data is important as well as monthly data.
5.2 Where to get information for a climate stocktake
For some regions the greatest challenge is to find representative long term climate data. The primary source of all climate information is the Bureau of Meteorology. Australia has excellent rainfall records dating back over 100 years for many locations. However, temperature records are more limited, and date back prior to 1957 for only a relatively small number of stations. Temperature records, especially minimum temperatures, are very sensitive to any movement of the recording site.
The Bureau of Meteorology has a network of high quality temperature recording stations www.bom.gov.au/silo/products/cli_chg/; see Figure 5.1. Some grapegrowers are fortunate to be close to a recording station, but finding representative stations for a parameter as location specific as temperature will always be challenging. It is important to seek advice on the quality of the data, especially if conducting trend analysis or comparing sub-regions.
Figure 5.1. Locations of Bureau of Meteorology high quality temperature stations.
Many grapegrowers have installed automatic weather stations, which provide valuable data to assist in making disease and spraying decisions. However, if detailed comparisons are to be made, any monitoring equipment must have had regular calibration for its outputs to be considered valid.
Gladstones (2004) provides a list of climate stations for all viticultural regions, but it is important to check for continuity, especially if studying trends. Good data interpolation techniques make it possible to fill gaps in
23
Climate Change and Viticulture - Informing the decision making at a regional level
ClimaTE
observations as well as extend the data back to provide longer records. However, when accessing data it is important to understand the length of real observations as opposed to data that has been filled in from surrounding stations.
A quick and freely available way to check data observation records for sites around Australia is through the Bureau of Meteorology’s Weather Station Directory at www.bom.gov.au/climate/cdo/about/sitedata.shtml
Drop-down menus allow you to select the weather element you’re after, such as evaporation or air temperature, as well as confining the search to a specific state, and searching via place name (useful if you have a location in mind) or station number (useful if you want to look at sites in a particular region). The lists provide the dates within which the observations have been recorded at each site, along with the percentage complete as a crude guide to the quality of the data (where 50% would suggest only half of the observations during the recording period were actual recordings from that station). For further information click on “About Weather Station Directory” on the search page.
For many regions, the lack of long term local data will be a limitation; nearby stations can be used as a guide, but need to be used carefully. Technically the maps of climate change projections should be compared to the period from 1980 to 2000 as that is the baseline period used by CSIRO and BoM in the Climate Change in Australia report.
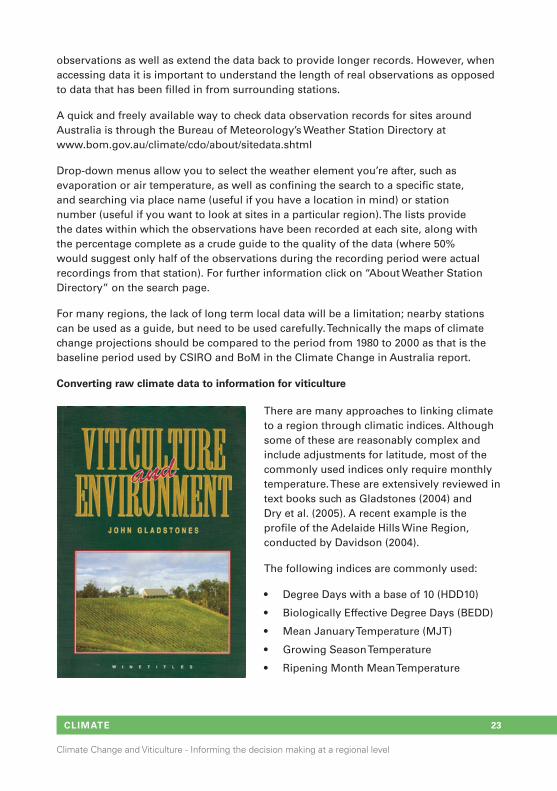
Converting raw climate data to information for viticulture
There are many approaches to linking climate to a region through climatic indices. Although some of these are reasonably complex and include adjustments for latitude, most of the commonly used indices only require monthly temperature. These are extensively reviewed in text books such as Gladstones (2004) and Dry et al. (2005). A recent example is the profile of the Adelaide Hills Wine Region, conducted by Davidson (2004).
The following indices are commonly used:
Degree Days with a base of 10 (HDD10)•
Biologically Effective Degree Days (BEDD)•
Mean January Temperature (MJT)•
Growing Season Temperature •
Ripening Month Mean Temperature •
24
Climate Change and Viticulture - Informing the decision making at a regional level
ClimaTE
Of these, the most common are Mean January Temperature and Growing Season Temperature. These are broad approximations – nevertheless they are the basis of characterising a region and used in climate change studies in Australia (Webb et al. 2007) and internationally including USA (Jones et al. 2005).
The index favoured by Gladstones (2004) and used by Davidson 2004 is biologically effective degree days, however this is problematic for studying trends and projections in warming because it only considers temperature between 10 and 19°C – and thus excludes extremes of heat.
looking at monthly and daily temperatures from any vintage from 1957 to present
Our discussions with growers and winemakers indicate that we tend to characterise a season as “warm”, “dry”, or “cold” based on the general conditions in the later stages of the season – approaching harvest. Some supplement their general impressions with HDD data; others rely solely on their own weather stations; others characterise the season through the general conditions at other important phenological stages, such as budburst, flowering, and veraison.
However, as recent seasons have shown dramatically, extreme weather events also have a major impact on our recollections of what a given season was like: the frosts of spring 2006 affected vintage in 2007; the heatwave of March 2008 shaped that season irrevocably.
For that reason we believe that aggregated measures of temperature such as HDD, or ‘spot measures’ such as MJT, often hide the specific events which dictate our fortunes. Any averaging process ‘smooths’ a curve – and thus hides the extremes.
for this reason we consider it essential that we track the temperature of any given season as follows:
from month to month (with monthly mean maxima and minima), 1.
plus: from day to day.2.
To assist this process, we have designed a simple spreadsheet which allows us to look at how a single year compares with the long term climate data. It also allows us to add a given temperature increase to these data to see how the future may compare with recent history.
The results are interpreted by grouping the data into percentiles. To assist in understanding what this means:
“90th percentile” result can be considered a “nine years in ten” result;•
“10th percentile” result can be considered a “one year in ten” result; and•
“50th percentile” result can be considered a “five years in ten” – or ‘median’ - result. •For a given period, half the years are warmer and half cooler than the median.
25
Climate Change and Viticulture - Informing the decision making at a regional level
ClimaTE
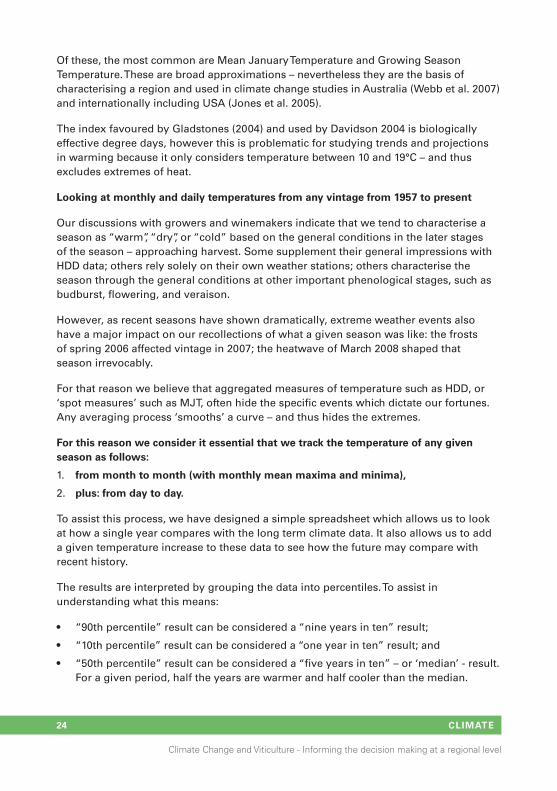
The graph below (Figure 5.2) is an example of the output of the spreadsheet. It shows the maximum and minimum temperatures for the spring, summer and autumn months of 2008 in Nuriootpa, compared with the range experienced in the period from the base 30 year period 1961 to 1990.
The blue line represents the 10th percentile, grey the median, and red the 90th percentile. In other words, for the 1960 to 1990 period, 10% of years (3 out of 30) were cooler than the blue line and 10% hotter than the red line. The median is the middle point, from which half of the years are warmer, and half cooler.
Clearly, in 2008 all months were warmer than normal with the exception of February, which was cooler than normal. March was especially hot. Minimum temperatures were near the upper end of experience.
Figure 5.2 Monthly maximum (closed circles) and minimum (open circles) temperature for Nuriootpa in 2008 vintage. The median (grey lines), 10th (blue lines) and 90th (red lines) are for the base period of 1960 to 1990.
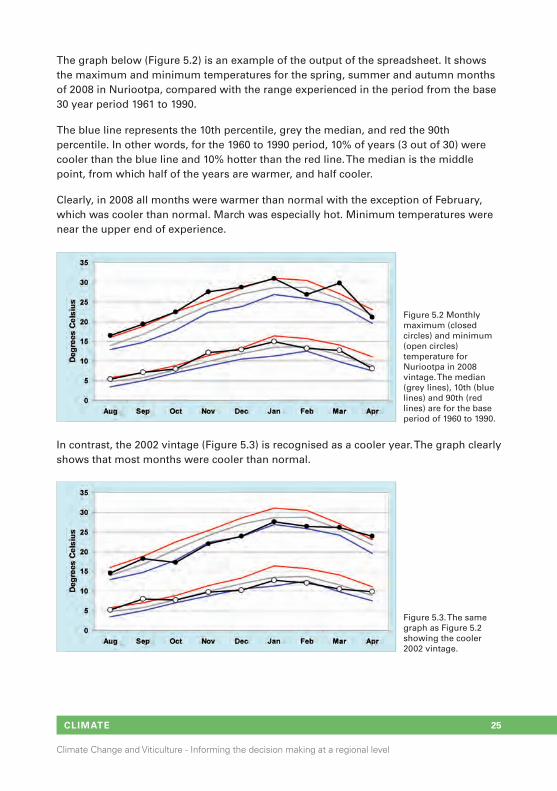
In contrast, the 2002 vintage (Figure 5.3) is recognised as a cooler year. The graph clearly shows that most months were cooler than normal.
Figure 5.3. The same graph as Figure 5.2 showing the cooler 2002 vintage.
26
Climate Change and Viticulture - Informing the decision making at a regional level
ClimaTE
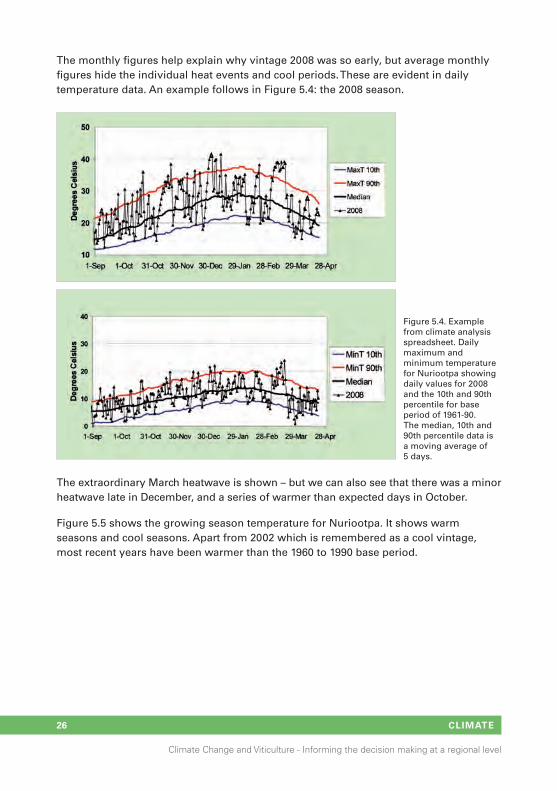
The monthly figures help explain why vintage 2008 was so early, but average monthly figures hide the individual heat events and cool periods. These are evident in daily temperature data. An example follows in Figure 5.4: the 2008 season.
Figure 5.4. Example from climate analysis spreadsheet. Daily maximum and minimum temperature for Nuriootpa showing daily values for 2008 and the 10th and 90th percentile for base period of 1961-90. The median, 10th and 90th percentile data is a moving average of 5 days.
The extraordinary March heatwave is shown – but we can also see that there was a minor heatwave late in December, and a series of warmer than expected days in October.
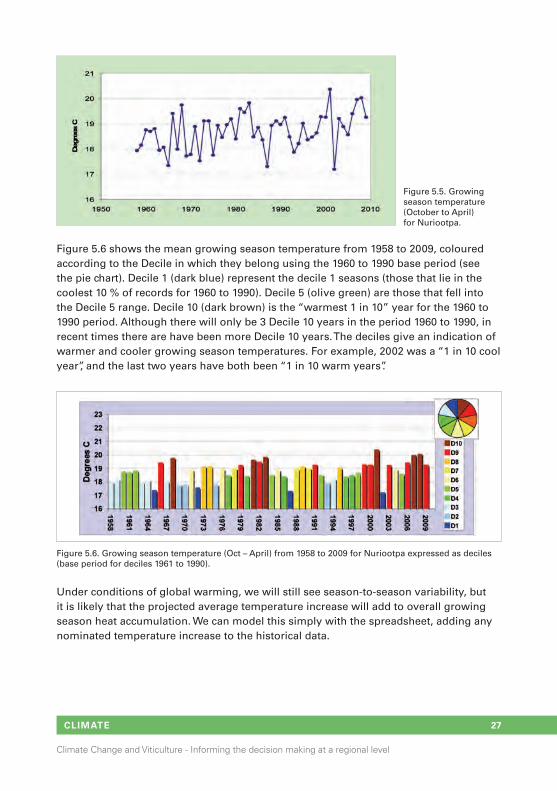
Figure 5.5 shows the growing season temperature for Nuriootpa. It shows warm seasons and cool seasons. Apart from 2002 which is remembered as a cool vintage, most recent years have been warmer than the 1960 to 1990 base period.
27
Climate Change and Viticulture - Informing the decision making at a regional level
ClimaTE
Figure 5.6 shows the mean growing season temperature from 1958 to 2009, coloured according to the Decile in which they belong using the 1960 to 1990 base period (see the pie chart). Decile 1 (dark blue) represent the decile 1 seasons (those that lie in the coolest 10 % of records for 1960 to 1990). Decile 5 (olive green) are those that fell into the Decile 5 range. Decile 10 (dark brown) is the “warmest 1 in 10” year for the 1960 to 1990 period. Although there will only be 3 Decile 10 years in the period 1960 to 1990, in recent times there are have been more Decile 10 years. The deciles give an indication of warmer and cooler growing season temperatures. For example, 2002 was a “1 in 10 cool year”, and the last two years have both been “1 in 10 warm years”.
Figure 5.5. Growing season temperature (October to April) for Nuriootpa.
Figure 5.6. Growing season temperature (Oct – April) from 1958 to 2009 for Nuriootpa expressed as deciles (base period for deciles 1961 to 1990).
Under conditions of global warming, we will still see season-to-season variability, but it is likely that the projected average temperature increase will add to overall growing season heat accumulation. We can model this simply with the spreadsheet, adding any nominated temperature increase to the historical data.
28
Climate Change and Viticulture - Informing the decision making at a regional level
ClimaTE
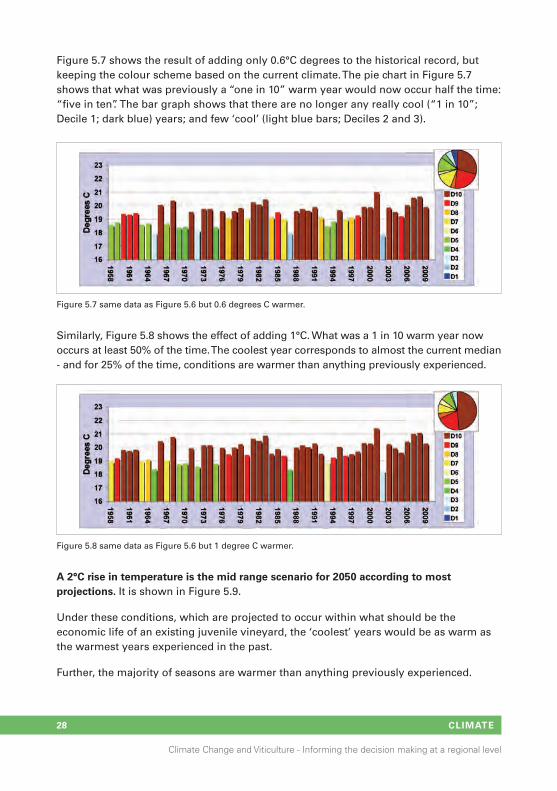
Figure 5.7 shows the result of adding only 0.6°C degrees to the historical record, but keeping the colour scheme based on the current climate. The pie chart in Figure 5.7 shows that what was previously a “one in 10” warm year would now occur half the time: “five in ten”. The bar graph shows that there are no longer any really cool (“1 in 10”; Decile 1; dark blue) years; and few ‘cool’ (light blue bars; Deciles 2 and 3).
Figure 5.7 same data as Figure 5.6 but 0.6 degrees C warmer.
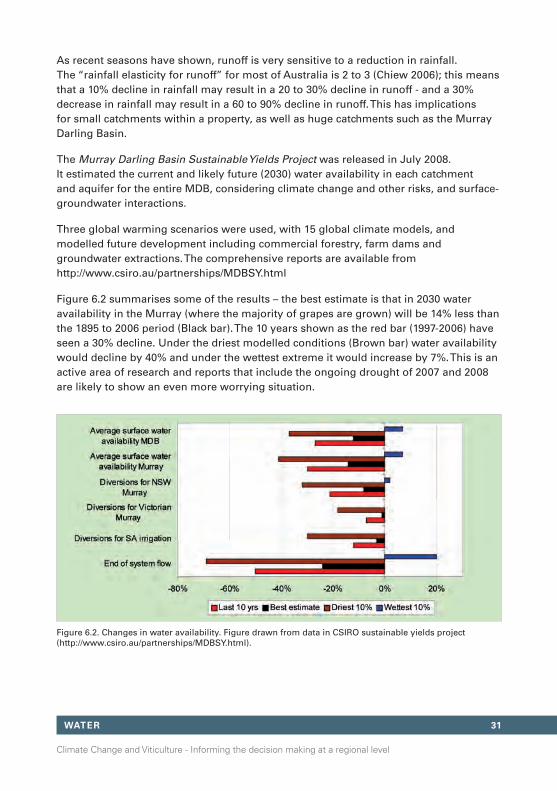
Figure 5.8 same data as Figure 5.6 but 1 degree C warmer.
Similarly, Figure 5.8 shows the effect of adding 1°C. What was a 1 in 10 warm year now occurs at least 50% of the time. The coolest year corresponds to almost the current median - and for 25% of the time, conditions are warmer than anything previously experienced.
a 2°C rise in temperature is the mid range scenario for 2050 according to most projections. It is shown in Figure 5.9.
Under these conditions, which are projected to occur within what should be the economic life of an existing juvenile vineyard, the ‘coolest’ years would be as warm as the warmest years experienced in the past.
Further, the majority of seasons are warmer than anything previously experienced.

29
Climate Change and Viticulture - Informing the decision making at a regional level
ClimaTE
This tool can be applied to any regional data. It assists us to think about future conditions in terms of what we have experienced in the recent past. From discussion with growers, this has been one of the more useful ways to intuitively ‘model’ future conditions.
Figure 5.9 same data as Figure 5.6 but 2 degrees C warmer.

30
Climate Change and Viticulture - Informing the decision making at a regional level
WaTEr
6. CONduCTiNg a rEgiONal WaTEr STOCkTakE
6.1 information requirements for a stocktake of water resources
Almost all wine grapes in Australia are irrigated, at least in some years. The majority of vineyards, being located in ‘Mediterranean climate’ regions, are characterised by high evapotranspiration and low rainfall during the growing season.
There are up to five sources of water that may be available for most viticultural regions:
rainfall which falls in the growing season and can be stored in the rootzone;1.
water stored in local dams and reservoirs, usually adjacent the vineyard;2.
groundwater which is pumped to the surface and applied as irrigation;3.
water imported from outside of the region (typically via a river, channel or pipeline); 4. and
water which is recycled from wineries or from other uses. (For example, water from 5. Adelaide’s wastewater treatment facilities, piped to McLaren Vale).
The Murray Darling Basin (MDB) is the main source of irrigation for almost two thirds of Australian winegrape production. Figure 6.1 shows that in 2005/6, only 7% of water extracted from the MDB for irrigation was applied to grapes (515 GL of a total of 7720 GL; Pink 2008).
Figure 6.1. Water extractions for the Murray Darling Basin in 2005/6 (from data in Pink 2008).
31
Climate Change and Viticulture - Informing the decision making at a regional level
WaTEr
As recent seasons have shown, runoff is very sensitive to a reduction in rainfall. The “rainfall elasticity for runoff” for most of Australia is 2 to 3 (Chiew 2006); this means that a 10% decline in rainfall may result in a 20 to 30% decline in runoff - and a 30% decrease in rainfall may result in a 60 to 90% decline in runoff. This has implications for small catchments within a property, as well as huge catchments such as the Murray Darling Basin.
The Murray Darling Basin Sustainable Yields Project was released in July 2008. It estimated the current and likely future (2030) water availability in each catchment and aquifer for the entire MDB, considering climate change and other risks, and surface-groundwater interactions.
Three global warming scenarios were used, with 15 global climate models, and modelled future development including commercial forestry, farm dams and groundwater extractions. The comprehensive reports are available from http://www.csiro.au/partnerships/MDBSY.html
Figure 6.2 summarises some of the results – the best estimate is that in 2030 water availability in the Murray (where the majority of grapes are grown) will be 14% less than the 1895 to 2006 period (Black bar). The 10 years shown as the red bar (1997-2006) have seen a 30% decline. Under the driest modelled conditions (Brown bar) water availability would decline by 40% and under the wettest extreme it would increase by 7%. This is an active area of research and reports that include the ongoing drought of 2007 and 2008 are likely to show an even more worrying situation.
Figure 6.2. Changes in water availability. Figure drawn from data in CSIRO sustainable yields project (http://www.csiro.au/partnerships/MDBSY.html).

32
Climate Change and Viticulture - Informing the decision making at a regional level
WaTEr
One of the reasons that wine grapegrowing is one of the most efficient uses of irrigation water in Australia is that many grapegrowers and their advisers have a sound working knowledge of the water budget. A water budget can be calculated for a block, a vineyard, a region, or river basin.
Figure 6.3. The main components of the water balance in a vineyard
6.2 The value of a water budget
A water balance is not only a useful way to conduct a stocktake, it is a good framework to consider the impact of climate change, by considering the changes on the different terms.
Potential Evapotranspiration (ETo)
Evapotranspiration is the water evaporated into the atmosphere from the soil and transpired through plants. It is driven by climate. For inland wine regions ETo changes from about 2 mm per day in winter to 9 or 11 mm per day in the middle of summer. As a rule of thumb, potential evapotranspiration will increase by about 2 to 3% per degree of warming (Lockwood 1999). The increase is likely to be slightly greater if there is a decline in rainfall (and hence a decline in the incidence of overcast days). Evaporation from any open water storage can be a significant loss especially over summer.
Crop coefficient
The Crop coefficient (Kc) is affected by the type and stage of the crop; principally the leaf area.
Evapotranspiration rain
runoffdrainage
irrigation
33
Climate Change and Viticulture - Informing the decision making at a regional level
WaTEr
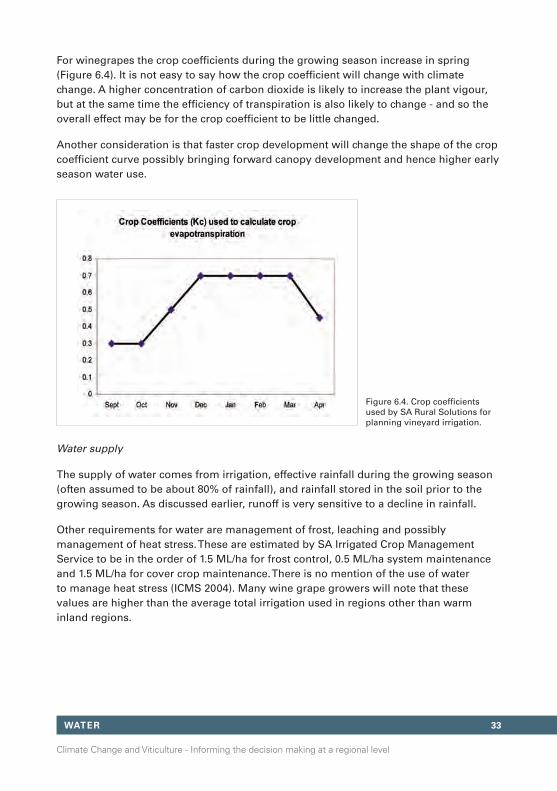
For winegrapes the crop coefficients during the growing season increase in spring (Figure 6.4). It is not easy to say how the crop coefficient will change with climate change. A higher concentration of carbon dioxide is likely to increase the plant vigour, but at the same time the efficiency of transpiration is also likely to change - and so the overall effect may be for the crop coefficient to be little changed.
Another consideration is that faster crop development will change the shape of the crop coefficient curve possibly bringing forward canopy development and hence higher early season water use.
Figure 6.4. Crop coefficients used by SA Rural Solutions for planning vineyard irrigation.
Water supply
The supply of water comes from irrigation, effective rainfall during the growing season (often assumed to be about 80% of rainfall), and rainfall stored in the soil prior to the growing season. As discussed earlier, runoff is very sensitive to a decline in rainfall.
Other requirements for water are management of frost, leaching and possibly management of heat stress. These are estimated by SA Irrigated Crop Management Service to be in the order of 1.5 ML/ha for frost control, 0.5 ML/ha system maintenance and 1.5 ML/ha for cover crop maintenance. There is no mention of the use of water to manage heat stress (ICMS 2004). Many wine grape growers will note that these values are higher than the average total irrigation used in regions other than warm inland regions.
34
Climate Change and Viticulture - Informing the decision making at a regional level
WaTEr
6.3 Sources of information for a regional water stocktake
The GWRDC has an initiative to assist in meeting the challenge of a water-constrained future: “Water and vine - managing the challenge”. It is best accessed at: http://waterandvine.gwrdc.com.au/
The “Winegrape water monitor” is prepared by the Australian Wine and Brandy Corporation and is updated monthly. It is available free from the Winefacts website: https://www.awbc.com.au/winefacts/data/free.asp?subcatid=241
Potential ETo can be obtained from the Bureau of Meteorology. In a number of major irrigation regions local networks of weather stations are used to compile and distribute these data.
The best source for field and farm level data are consultants and staff of state government departments of primary industries. For regional budgets, the state departments of water resources are most appropriate. The Bureau of Meteorology (BoM) will play an increasingly central role on the much of the water information as part of the ‘Improving Water Information Program’ http://www.bom.gov.au/hydro/
This $450 M new program will include:
Issuing national water information standards •
Collecting and publishing water information •
Conducting regular national water resources assessments •
Publishing an annual National Water Account •
Providing regular water availability forecasts •
Giving advice on matters relating to water information •
Enhancing understanding of Australia’s water resources•

35
Climate Change and Viticulture - Informing the decision making at a regional level
SOilS
7. CONduCTiNg a rEgiONal SOilS STOCkTakE
7.1 What information do we want?
One common response to a possible change in climate is to change site – from one region to another, or within a region. However, this option not only has a significant cost, but also comes with the complication of finding suitable soils.
According to Maschmedt (2005), the most significant soil characteristic is its water-holding capacity:
“In Australia, the most important characteristic of a soil for growing grapevines is the capacity to supply moisture, whilst at the same time remaining sufficiently well drained to avoid periodic oxygen deficiency arising from waterlogging of the rootzone.” Maschmedt (2005; p 56).
Soil types are significantly affected by topography, and so in any region with hills and valleys, there is likely to be significant variation in soil depth, water-holding capacity, and fertility. This topographical variation also brings variation in site (or meso) climate due to the effects of altitude and aspect.
In response to the threat of increased temperature it may perhaps seem logical to move up by 100m from a warm valley floor to a hillside, but changes in soil depth and water-holding capacity may require greater supplementary irrigation – but access to water may also be reduced by climate change. These two – and other – factors must be considered before any decision is made to ‘shift’.
7.2 What scale is appropriate?
Because of the cost of establishing vineyards, many vineyards have detailed soil analyses at a field level. Regional soil mapping data is usually compiled at scales of 1:50,000 or 1:100,000.
Sample maps depicting Available Water Holding Capacity (AWHC) in the Clare and Barossa regions are shown in Figures 7.3 and 7.4. These maps illustrate the heterogeneity of the soils across these wine regions. Maps 7.1 and 7.2 show the vineyards overlaid on the Digital Elevation Model (DEM) data from Shuttle Radar Topography Mission (SRTM) obtained elevation data. This kind of visualisation is useful, for example, to identify areas prone to frost risk (in very general terms, vineyards in the valleys are more prone than those on the slope).

36
Climate Change and Viticulture - Informing the decision making at a regional level
SOilS
(data source Soils: DWLBC, 2005; Digital Elevation model SRTM (NASA))
Figure 7.3. Digital Elevation Model of Clare region with Available Water Holding Capacity (AWHC) layer overlaid
Figure 7.1. Digital Elevation Model of Clare region with vineyards overlaid
Figure 7.2. Digital Elevation Model of Barossa-Eden region with vineyards overlaid
Figure 7.4. Digital Elevation Model of Barossa-Eden region with Available Water Holding Capacity (AWHC) layer overlaid
legend
High > 100mm
Moderate 70-100mm
Moderately Low 40-70mm
Low 20-40mm
37
Climate Change and Viticulture - Informing the decision making at a regional level
SOilS
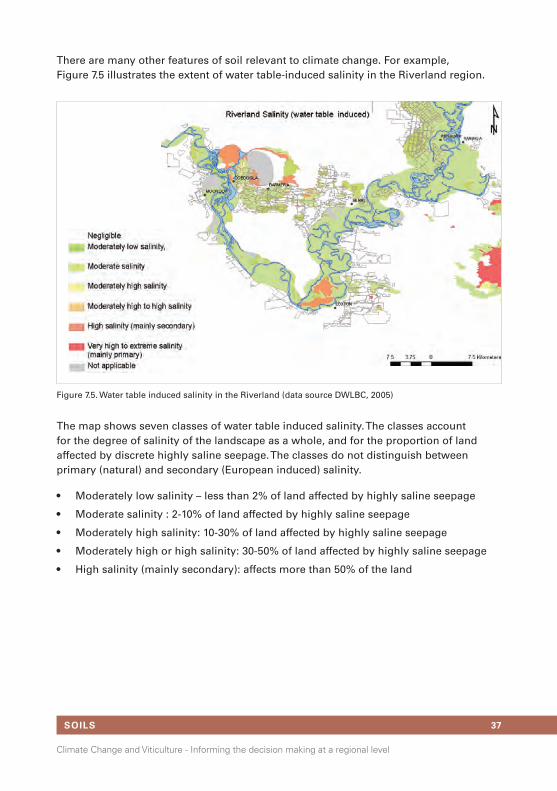
There are many other features of soil relevant to climate change. For example, Figure 7.5 illustrates the extent of water table-induced salinity in the Riverland region.
The map shows seven classes of water table induced salinity. The classes account for the degree of salinity of the landscape as a whole, and for the proportion of land affected by discrete highly saline seepage. The classes do not distinguish between primary (natural) and secondary (European induced) salinity.
Moderately low salinity – less than 2% of land affected by highly saline seepage•
Moderate salinity : 2-10% of land affected by highly saline seepage•
Moderately high salinity: 10-30% of land affected by highly saline seepage•
Moderately high or high salinity: 30-50% of land affected by highly saline seepage•
High salinity (mainly secondary): affects more than 50% of the land•
Figure 7.5. Water table induced salinity in the Riverland (data source DWLBC, 2005)

38
Climate Change and Viticulture - Informing the decision making at a regional level
SOilS
7.3 Where to get information for a regional soil stocktake?
National
ASRIS (the Australian Soil Resource Information System) provides online access to the best publicly-available information on soil and land resources in a consistent format across Australia. http://www.asris.csiro.au/index_ie.html#
It provides information at seven different scales.
The upper-three scales provide general descriptions of soil types, landforms and •regolith (source material for soil formation) across the continent.
The lower scales provide more detailed information in regions where mapping is •complete. Information relates to soil depth, water storage, permeability, fertility, carbon and erodibility. Most soil information is recorded at five depths.
The lowest scale consists of a soil profile database with fully characterised sites that •are known to be representative of significant areas and environments.
All states and territories also have databases including soil profile information, soil analyses, and various forms of mapping where the focus is on the delineation of areas with specific associations of soils and soil properties (Maschmedt, 2005). A brief description of the sources of such data in different states is given below, with links to the web pages where more detailed information is provided.
South Australia
In SA, the soil and land programme of the Department of Water, Land and Biodiversity Conservation is responsible for the database.
http://www.dwlbc.sa.gov.au/land/soil/index.html
Victoria
Victorian Resources Online presents a wide range of soil information. A number of broad-scale soil maps of Victoria are presented. More detailed soil maps and information are planned.
http://www.dpi.vic.gov.au/dpi/vro/vrosite.nsf/pages/soil-home

39
Climate Change and Viticulture - Informing the decision making at a regional level
SOilS
New South Wales
Soil Profile Attribute Data Environment–Professional (SPADE Pro) is a website provided by the Department of Natural Resources (DNR) to help users to conveniently find the particular data they need.
Using SPADE, users can zoom into the area of interest, click on one of the soil profile points displayed on a map of New South Wales, and retrieve a report with details about the landform and soil at that site. The information accessed by SPADE Pro comes from Soil And Land Information System (SALIS), a centralised database that compiles descriptions of soils, landscapes and other geographic features from more than 58,000 collection points across NSW.
http://www.naturalresources.nsw.gov.au/soils/data.shtml
Western Australia
Information on soils and land resources in Western Australia can be accessed http://www.agric.wa.gov.au/search/search.cgi?collection=external&form=custom&meta_y_and=0LWE0LAND0&sort=date
Queensland
Information on soils and land resources in Queensland can be accessed at: http://www.nrw.qld.gov.au/science/slr/index.html
Tasmania
The ‘Reconnaissance Soil Maps of Tasmania’ are the primary resource. They are available digitally as clickable maps through the DPIW LIST server, or from Service Tasmania shopfronts. Other soil maps, including more detailed surveys, may be accessed through the DPIW libraries at Mt Pleasant laboratories (Launceston) or New Town offices (Hobart).
http://www.dpiw.tas.gov.au/inter.nsf/WebPages/EGIL-53E2YX?open

40
Climate Change and Viticulture - Informing the decision making at a regional level
VariETiES
8. CONduCTiNg a rEgiONal VariETy STOCkTakE
8.1 What information do we need on varieties?
For a climate change perspective, it is useful to know the distribution and extent of plantings of ‘icon’ varieties in any given region, and the relative proportions of all varieties grown.
A useful source of information is the Winefacts website of The Australian Wine and Brandy Corporation: https://www.awbc.com.au/winefacts/data/default.asp
There is a substantial number of free reports. For a fee it is possible to get the latest data on varieties in each region for a range of recent vintages.
With recent trends for the reputations of specific regions to become more closely connected to individual grape varieties, there may be considerable risk if that combination of variety and region is sensitive to a shift in climate. Most varieties are very versatile and perform well in diverse conditions; some, such as Pinot noir, however, are widely regarded as being better suited to specific conditions – in this case, cooler-than-average growing season temperatures.
A given region will be at greater risk if:
a significant proportion of the plantings in that region are of a sensitive variety; or •
it has a strong reputation in the marketplace for a sensitive variety; •
if those plantings are restricted to a soil type that is limited to sub-regions exposed •to climate variation (e.g. high frost risk...); or
if those vines and/or sites are particularly exposed to a particular climatic attribute •which is likely to change (e.g. sensitive to heatwaves...).
Our work suggests that some regional growers and makers are well aware of their strengths or weaknesses with respect to specific varieties, from both a production and marketing viewpoint. However, if they lack up-to-date knowledge of the extent and/or location of the producing areas of a given variety on which they are reliant, they may not fully appreciate the risk to their region.
8.2 how tolerant (‘elastic’) are different varieties?
Various commentators have made assertions regarding the optimum conditions for each variety, but there are many notable exceptions to these ‘rules’. However, it is generally accepted that once the ‘acceptable range’ is exceeded for any given climate attribute for a certain variety, performance will decline (Figure 8.1).

41
Climate Change and Viticulture - Informing the decision making at a regional level
VariETiES
The following table was prepared by Jones et al. (2005). It is based on an assessment of the temperature for high to premium quality wine production in the world’s benchmark region(s) for each variety.
growing Season Temp (oC)
Varieties 13 14 15 16 17 18 19 20 21 22 23 24
Pinot Gris X X X
Riesling X X X X X
Pinot Noir X X X
Chardonnay X X X X
Sauvignon Blanc X X X X
Semillon X X X X
Cabernet Franc X X X X X
Tempranillo X X X X
Merlot X X X X
Malbec X X X X
Viognier X X X X
Shiraz X X X X X
Table Grapes X X X X X X X X X
Cabernet Sauvignon X X X X X
Grenache X X X X X
Carignane X X X X
Zinfandel X X X X X
Nebbiolo X X X X X
Raisins X X X X X X X
Table 8.1 Range of growing season temperatures for quality wine production in benchmark regions
Figure 8.1 Each variety has an ideal temperature range. Warming will benefit some varieties and lead to problems for other varieties (modified from Jones et al. 2005).

42
Climate Change and Viticulture - Informing the decision making at a regional level
VariETiES
This table can be questioned in the Australian context, as there is little doubt that Chardonnay, for example, performs well across a wider range than that shown; and that successful commercial production of most of the varieties listed occurs outside the ranges noted, across the country. However, it is a guide to determine the relative versatility of each variety, and the relative range of suitable temperatures for these varieties.
Commercial nurseries that service viticultural regions have information on a range of new varieties. A glance at the information from these nurseries will indicate that rootsctocks are an important source of adaptation to harsher conditions. There are a range of sources on rootstocks, a recent publication by Dry (2007) is available from the Phylloxera and Grape Industry Board of South Australia (46 Nelson Street, Stepney SA 5069, Tel: (08) 8362 0488, Fax: (08) 8362 0499, Email: [email protected]).
43
Climate Change and Viticulture - Informing the decision making at a regional level
ChECkliST
9. Summary ChECkliST ON ClimaTE ChaNgE
Section 1
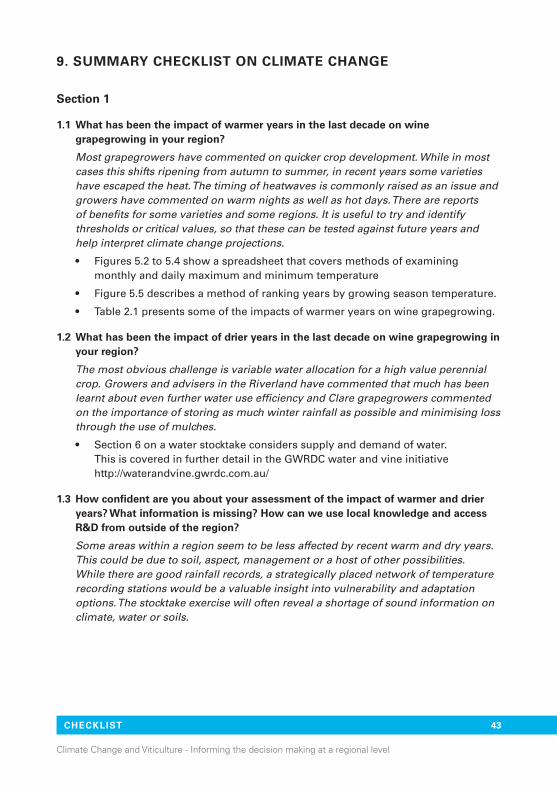
1.1 What has been the impact of warmer years in the last decade on wine grapegrowing in your region?
Most grapegrowers have commented on quicker crop development. While in most cases this shifts ripening from autumn to summer, in recent years some varieties have escaped the heat. The timing of heatwaves is commonly raised as an issue and growers have commented on warm nights as well as hot days. There are reports of benefits for some varieties and some regions. It is useful to try and identify thresholds or critical values, so that these can be tested against future years and help interpret climate change projections.
Figures 5.2 to 5.4 show a spreadsheet that covers methods of examining •monthly and daily maximum and minimum temperature
Figure 5.5 describes a method of ranking years by growing season temperature. •
Table 2.1 presents some of the impacts of warmer years on wine grapegrowing.•
1.2 What has been the impact of drier years in the last decade on wine grapegrowing in your region?
The most obvious challenge is variable water allocation for a high value perennial crop. Growers and advisers in the Riverland have commented that much has been learnt about even further water use efficiency and Clare grapegrowers commented on the importance of storing as much winter rainfall as possible and minimising loss through the use of mulches.
Section 6 on a water stocktake considers supply and demand of water. •This is covered in further detail in the GWRDC water and vine initiative http://waterandvine.gwrdc.com.au/
1.3 how confident are you about your assessment of the impact of warmer and drier years? What information is missing? how can we use local knowledge and access r&d from outside of the region?
Some areas within a region seem to be less affected by recent warm and dry years. This could be due to soil, aspect, management or a host of other possibilities. While there are good rainfall records, a strategically placed network of temperature recording stations would be a valuable insight into vulnerability and adaptation options. The stocktake exercise will often reveal a shortage of sound information on climate, water or soils.

44
Climate Change and Viticulture - Informing the decision making at a regional level
ChECkliST
Section 2
2.1 how is climate likely to change in your region in coming decades, by 2030, 2050 and 2070?
There is an avalanche of information about climate change, much of it in the form of newspaper headlines. While any projections of the future are difficult, it is worth establishing what the projections for changes in temperature and rainfall are for different time periods. It is nonsense to say that climate change will lead to a say a 2 degrees warming and 15% drying without giving some indication of which decade you are referring to.
Section 3 provides details on sources of information for climate change •projections for Australia.
2.2 What are the most important impacts of these changes in climate on wine grapegrowing in your region?
A given level of warming and drying will have an impact on grapegrowing in a region. Some ideas of thresholds and impacts of recent hot dry conditions will help in thinking through and ranking some of the impacts and identifying areas that are especially vulnerable.
Table 2.1 gives an overview of the impact of changes in climate. •
Figures 5.5 to 5.8 presents a simple, but effective way of considering what a •change in average temperature does for the deciles.
2.3 how confident are you about your assessment on the climate change projections for your region. What information is missing? are there more recent sources of information?
There is much higher confidence in the trends and projections for temperature than rainfall. The impact of global warming on rainfall and stream flow in Australia is an area of active research. Likewise, there is a range of research projects in Australia and overseas investigating the impact of climate change on grapevines.
3.1 What action do we need to take and when? how confident are we in our assessment of the next steps?
There are quite different actions to be taken, depending on who is considering adaptation: a large company, a small/medium enterprise, or a regional body. This information kit will work best when used at a regional level
Wine regions which succeed in the future are likely to be those which have:access to information;•taken steps to match production to key resources such as water; •started to consider the risks, and their attitude to the risks;•started to consider their adaptation options; and•a timetable of actions.•
10. reFerenCes
Allen Consulting Group (2005) Climate Change: Risk and Vulnerability Promoting an Efficient Adaptation Response in Australia. Report to the Australian Greenhouse Office, Department of the Environment and Heritage.
Anderson K, Findlay C, Fuentes S, Tyerman S (2008) 'Viticulture, wine and climate change. Commissioned to Garnaut Climate Change Review. www.garnautreview.org.au.
AWITC (2007) Proceedings of the Thirteenth Australian Wine Industry Technical Conference (AWITC). Eds. Blair, R.J.; Williams, P.J.; Pretorius, I.S., Adelaide, South Australia: 28 July-2 August. 400 pp.
Chiew FHS (2006) An overview of methods for estimating climate change impact on runoff. In 3rd Hydrology and Water Resources Symposium, 4-7 December 2006 Launceston, Tasmania, Australia.
CSIRO and Bureau of Meteorology (2007) Climate Change in Australia. Technical Report 2007. (CSIRO: Melbourne).Davidson D (2004) 'Adelaide Hills Wine Region Profile.’ (Report to GWRDC prepared by Davidson Viticultural
Consulting Services).Department of Water, Land and Biodiversity Conservation (2005). Land an Soil Spatial data for Southern South
Australia – GIS format. DLWBC Soil and Land program. Dry N (2007) Grapevine rootstocks: selection and management for South Australian vineyards. Available from
www.phylloxera.com.au/resources. Dry PR, Coombe BG (2005) Viticulture Volume 1- Resources 2nd Edition. WinetitlesDry PR, Maschmedt CJ, Anderson CJ, Riley E, Bell S-J, Goodchild WS (2005) The Grapegrowing regions of Australia.
In 'Viticulture. Volume 1 - resources'. (Eds Dry PR, Coombe BG). Winetitles: Adelaide.Gladstones JS (2004) Climate and Australian Viticulture. In 'Viticulture. Volume 1-Resources'. (Eds Dry PR, Coombe
BG) pp. 90-118. (Winetitles: Adelaide).Godwin DC, White RJG, Sommer KJ, Walker RR, Goodwin I, Clingeleffer PR (2002) VineLogic a model of grapevine
growth, development and water use. In 'Managing Water'. (Eds C Dundon, R Hamilton, R Johnstone, S Partridge) pp. 46-50. (Australian Society of Viticulture and Oenology Inc.: Adelaide).
Hayman PT, Soar CJ, Sadras VO, McCarthy MG. (2007). Can we identify dangerous climate change for Australian viticulture? Invited paper to the 13th Australian Wine Industry Technical Conference, Adelaide July 2007.
Irrigated Crop Management Service (2004) Definition of Irrigation Requirements in the Mallee Prescribed Well Area. Rural Solutions, South Australia.
Jones GV (2006) Climate change and wine: Observations, impacts and future implications. Australian and New Zealand Wine Industry Journal 21, 21-26.
Jones GV, White MA, Cooper O, Storchmann K (2005) Climate change and global wine quality. Climatic Change 73, 319-343.
Lockwood JG (1999) Is potential evapotranspiration and its relationship with actual evapotranspiration sensitive to elevated atmospheric carbon dioxide levels? Climatic Change 41, 193-212.
Lucas C, Hennessy K, Mills G, Bathols J (2007) 'Bushfire weather in southeast Australia: recent trends and projected climate change impacts. Consultancy report prepared for the Climate Institute of Australia ' (Bushfire CRC, the Australian Bureau of Meteorology and CSIRO Marine and Atmospheric Research.).
Maschmedt, DJ. (2005). Soils and Australian Viticulture. In: Viticulture. Volume 1- Resources 2nd Edition. (Eds Dry PR and Coombe, BG) Pp 56-89. Winetitles.
Petrie PR, Sadras VO (2008) Advancement of grapevine maturity in Australia between 1993 and 2006: putative causes, magnitude of trends and viticultural consequences. Australian Journal of Grape and Wine Research 14, 33-45.
Pink B (2008) 'Water and the Murray Darling Basin - A statistical profile. Catalogue No. 4610.0.55.007.' (Australian Bureau of Statistics: Canberra).
Richards AL, Hutson JL, McCarthy MG (2007) Monitoring and modelling transient rootzone salinity in drip irrigated viticulture. In Proceedings of the Thirteenth Australian Wine Industry Technical Conference. Adelaide, South Australia: 28 July-2 August. (Eds. R Blair, P Williams, S Pretorius) pp. 212-217.
Sadras VO, Soar CJ, Petrie PR (2007) Quantification of time trends in vintage scores and their variability for major wine regions of Australia. Australian Journal of Grape and Wine Research, 14: 78-90.
Smart RE (2006) Global warming: an appropriate response strategy for the wine sector. Wine Industry Journal 21, 27-28.
Soar CJ, Sadras VO, Petrie PR (2007) Climate-drivers of red wine quality in four contrasting Australian wine regions. Australian Journal of Grape and Wine Research 14, 78-90.
Suppiah R, Preston B, Whetton PH, McInnes KL, Jones RN, Macadam I, Bathols J, Kirono D (2006) Climate change under enhanced greenhouse conditions in South Australia. Climate Impacts and Risk Group, CSIRO Marine and Atmospheric Research.
Webb LB, Barlow EWR (2008) Viticulture. In 'An overview of climate change adaptation in the Australian agricultural sector. ' (Eds CJ Stokes, SM Howden) pp. 158-171. CSIRO. Prepared for Land and Water Australia. www.csiro.au/resources/AgricultureAdaptationReport2008
Webb LB, Whetton PH, Barlow EWR (2005) Impact on Australian Viticulture from Greenhouse Induced Temperature Change. In 'Modsim 05 Advances and applications for management and decision making' Melbourne.
Webb LB, Whetton PH, Barlow EWR (2007) Modelled impact of future climate change on the phenology winegrapes in Australia. Australian Journal of Grape and Wine Research 13, 165-175.
