climate change and biotic invasions: a case history of a tropical woody vine
TRANSCRIPT

# 2003 Kluwer Academic Publishers. Printed in the Netherlands.
Climate change and biotic invasions: a case history of a tropicalwoody vinew
D.J. Kriticos1,4,5,*, R.W. Sutherst2, J.R. Brown3, S.W. Adkins4 and G.F. Maywald2
1CSIRO Entomology and CRC for Australian Weed Management, Canberra, ACT, Australia; 2CSIRO
Entomology, Brisbane, QLD, Australia; 3USDA/NRCS Jornada Range, Las Cruces, New Mexico,
USA; 4University of Queensland, St. Lucia, QLD, Australia 4072; 5Current address: Forest
Research, Private Bag 3020, Rotorua, New Zealand; *Author for correspondence
(e-mail: [email protected]; fax: þ64-7-343-5333)
Received 7 September 2001; accepted in revised form 28 March 2003
Key words: biological control, climate change, CLIMEX, Cryptostegia, global change, invasion, modelling,
range shifts, weed
Abstract
The impacts of climate change in the potential distribution and relative abundance of a C3 shrubby vine,
Cryptostegia grandiflora, were investigated using the CLIMEX modelling package. Based upon its current
naturalised distribution, C. grandiflora appears to occupy only a small fraction of its potential distribution in
Australia under current climatic conditions; mostly in apparently sub-optimal habitat. The potential
distribution of C. grandiflora is sensitive towards changes in climate and atmospheric chemistry in theexpected range of this century, particularly those that result in increased temperature and water use
efficiency. Climate change is likely to increase the potential distribution and abundance of the plant, further
increasing the area at risk of invasion, and threatening the viability of current control strategies markedly.
By identifying areas at risk of invasion, and vulnerabilities of control strategies, this analysis demonstrates
the utility of climate models for providing information suitable to help formulate large-scale, long-term
strategic plans for controlling biotic invasions. The effects of climate change upon the potential distribution
of C. grandiflora are sufficiently great that strategic control plans for biotic invasions should routinely
include their consideration. Whilst the effect of climate change upon the efficacy of introduced biologicalcontrol agents remain unknown, their possible effect in the potential distribution of C. grandiflora will likely
depend not only upon their effects on the population dynamics of C. grandiflora, but also on the gradient of
climatic suitability adjacent to each segment of the range boundary.
Abbreviations: GCM – global climate model; WUE – water use efficiency
Introduction
Those charged with managing biotic invasions
require a synoptic view of the invasions in order
to formulate the large-scale, long-term control
strategies called for by Mack et al. (2000). The
ideal synoptic view would include the potential
distribution and abundance of the organism so
that the cultural and native ecosystems at risk of
invasion can be assessed in terms of their vulner-
ability and potential for cultural adaptation to theinvasion threat (e.g., establishing quarantine
procedures or modifying agricultural productionwCSIRO’s right to retain a non-exclusive, royalty-free licence inand to any copyright is acknowledged.
147Biological Invasions 145–165, 2003.5:

systems so as to disadvantage the biotic invader or
minimise its impacts). Such knowledge can affect
the set of nations, agencies, industries and indivi-
duals concerned with managing the invasion, and
their respective levels of interest in controlling theinvasion; those who perceive they are unlikely to
be directly and strongly affected may have little
interest in contributing resources to resist the
invasion.
Paradoxically, the best time to act against an
invader is at the earliest stages of invasion, when
the least is known about its invasion potential in its
new range (Moody and Mack 1988; Mack et al.2000). Land managers confronted with a biotic
invasion do not have the luxury of waiting for the
results of unambiguous tests of the invasive poten-
tial of an organism such as waiting for the invasion
velocity to approach zero as the potential range
becomes fully-occupied. Questions regarding the
potential distribution and abundance of an invader
are therefore ‘trans-scientific’ insofar as they can-not be directly answered by science. In such cases it
is desirable to employ modelling tools to synthesise
indirect scientific information to provide the requi-
site synoptic view in a timely manner (Rastetter
1996). CLIMEX (Sutherst et al. 1999) is a modell-
ing tool designed to explore the potential distribu-
tion and relative abundance of species, and is well
suited to the task of assessing the invasion potentialof exotic organisms (Kriticos and Randall 2001).
The large scale of some biotic invasions, their
impacts and the lack of effective policies to prevent
or control them, has prompted their addition to the
list of major factors that constitute global change
(Mack et al. 2000). This list includes other factors
such as changes in land use, atmospheric com-
position, biogeochemistry, and climate. Whilst thepotential for biotic invasions to influence other
global change factors is now being recognised
(Mack et al. 2000), little detailed attention has
been paid to the potential for climate change to
affect the rate or potential extent of biotic inva-
sions on a geographic scale. Paleogeographic ana-
lyses have demonstrated that species’ range can
change dramatically in response to changes in cli-mate such as those associated with the Pleistocene–
Holocene transition (Cole 1982; Davis et al. 1986;
Hengeveld 1990). More recent historical examples
demonstrate how rapidly some biotic invasions can
proceed (Roberts 1989; Hengeveld 1989; van den
Bosch et al. 1992). In the context of an active biotic
invasion, changes in climate may significantly alter
the area at risk of invasion (potential range) and
the spatial pattern of abundance of the invader.
Where climate change results in an expansion ofthe potential range of an invasive organism com-
pared with that under current climate, the set of
agencies that are concerned with managing the
invasion may also expand as the regions for which
the additional agencies are responsible for pest
management that comes under greater risk of inva-
sion. Likewise, cultural adaptation techniques and
strategies based on the estimated potential distribu-tion under current climate may be rendered less
effective under climate change.
In order to explore the effects of climate change
on the potential distribution of an invasive organ-
ism, it is perhaps best to start with an organism that
has a widespread, well known, and climate limited
distribution, i.e., not a cosmopolitan distribution.
A good knowledge of the current native and intro-duced distribution is necessary in order to formu-
late and validate a reliable climate model under
current climatic conditions. A widespread distribu-
tion means that there are likely to be several differ-
ent climatic mechanisms limiting the organisms’
distribution that each could be affected by climate
change (Brown et al. 1996), and makes for a more
interesting analysis.Cryptostegia grandiflora Roxb. ex R. Br.
(Asclepiadaceae) was introduced to Australia,
prior to 1875, as a garden ornamental in several
mining towns of north Queensland (Parsons and
Cuthbertson 1992). The plant spread rapidly,
and by the early 1900s had established large
populations near the towns of Charters Towers
(20�040 S 146�190 E), Chillagoe (17�080 S 144�340 E),Georgetown(18�150S143�310E),andRockhampton
(23�230 S 150�340 E) (Parsons and Cuthbertson
1992; Mackey 1996). It continued to spread and
now occurs throughout most of Queensland. In
moist regions, it can form extensive infestations,
smothering native vegetation. At xeric southern
and western locations, it is generally found in iso-
lated clumps in moist microsites, or as a deliber-ately cultivated plant.
Cryptostegia grandiflora has attained prominent
weed status due to its ability to form dense mono-
specific stands, especially in riparian habitats.
The presumed resulting reduction in native plant
148

biodiversity has raised concern from a conserva-
tion perspective. The dense infestations of C.
grandiflora also cause reductions in domestic live-
stock production by restricting access to the rela-
tively productive riparian habitat in semi-aridregions. There are also concerns about the poten-
tial for stock poisoning because C. grandiflora
contains glycosides with toxic effects on cardiac
systems (Mackey 1996). Previous analyses of the
potential distribution of C. grandiflora under cur-
rent climatic conditions indicate that it has not yet
invaded all of the climatically suitable areas of
Australia (Chippendale 1991; Kriticos 1996). Themagnitude of the perceived threat posed by
C. grandiflora has resulted in it being listed as one
of Australia’s Weeds of National Significance
(Anonymous 1997).
The Queensland Government has developed
a strategic response to the threat posed by
C. grandiflora to northern Australia (Mackey
1996). Generally, this involves a campaign of che-mical eradication of the plant to the south and west
of a defined strategic control line, and the introduc-
tion of biological control agents to reduce the
potential invasiveness and impact of the plant.
This strategy is based upon the results of climate
modelling analyses using current climate scenarios
(Chippendale 1991; Mackey 1996). From a policy
perspective, it is worth considering the likely effectof climate change upon the potential distribution
of C. grandiflora to understand the expected future
areas at risk of invasion and the likely sustain-
ability of the current strategy.
In this paper, we seek to explore the impact
of climate change on the potential distribution of
C. grandiflora (ignoring issues regarding the rate of
spread of the plant). The first step in assessing thelikely impacts of climate change on C. grandiflora is
to compare its potential distribution and relative
abundance under current climatic conditions with
the potential distribution under future climate
conditions (Parry and Carter 1998). The difference
between these scenarios indicate the potential
biophysical impacts of climate change on the dis-
tribution and relative abundance of this species.This constitutes the ‘sensitivity’ to climate change.
However, it is unrealistic to ignore the potential
effects of human cultural adaptation strategies
when assessing the impacts of climate change
(Parry and Carter 1998).
The aims of this analysis are to: (1) estimate the
potential distribution and relative abundance of
C. grandiflora under current climatic conditions,
(2) assess the sensitivity of these factors to expected
climate changes in Australia, and (3) examine thescope for human cultural adaptation to the effects
of climate change.
Methodology
An earlier climate change analysis (Kriticos 1996)
that employed a set of regional climate change
surfaces generated from the CSIRO Division of
Atmospheric Research Global Climate Model(GCM) was abandoned in favour of a sensitivity
analysis following an examination of sequential
sets of GCM output (Climate Impact Group
1992, 1996). The two sets of climate change projec-
tions contrasted strongly enough to raise doubts as
to whether the state of climate change science was
sufficiently mature to currently support reliable
regional scale climate projections.This analysis used CLIMEX version 1.1 for
Windows (Sutherst et al. 1999) to model the
potential distribution and relative abundance of
C. grandiflora under current climate. Using the
standard meteorological database supplied with
CLIMEX, we investigated the mechanisms that
limit the range of C. grandiflora, and derived para-
meters for population growth and stress functionsbased upon its geographic distribution outside
Australia. The derived population response para-
meters were first used to project the potential dis-
tribution of C. grandiflora under current climatic
conditions. This distribution was visually compared
with the known distribution (including Australia) to
check the goodness-of-fit of the model and to assess
the invasion threat posed by the plant under currentclimate. This comparison was achieved by running
the model with the enhanced world 0.5� climate grid
(New et al. 1999) and the Australian 0.5� grid
created using ESOCLIM (Hutchinson et al. n.d.).
The population response parameters were then
employed in a series of model runs where the climate
surfaces were modified using greenhouse scenarios
within CLIMEX to reflect the range of conditionsexpected to occur during the mid-to-late 21st cen-
tury. The results were then mapped using a corre-
sponding regular 0.5� polygon lattice clipped to
149

a global coastline. By using the greenhouse sce-
narios within CLIMEX, we are implicitly assum-
ing that the effects of climate change will be
uniform across the climate surface. The GCM
research results suggest that in reality, the climateresponse to global warming will vary on a regio-
nal scale in terms of both magnitude and direc-
tion of change (CSIRO Division of Atmospheric
Research 1988).
Present distribution of C. grandiflora
The four sources of information on the bioclimatic
preferences of C. grandiflora that are useful for
predicting its performance in Australia are its
published distribution in the country of origin,
Madagascar; published data on its worldwide dis-
tribution; its current distribution in Australia and
a small amount of published information on the
ecophysiology of C. grandiflora. Of these sources ofinformation, the native range of an organism is
normally the most important for CLIMEX ana-
lyses. By comparing the range, relative abundance
and phenology of the organism with climate
response surfaces, it is possible to directly infer
population responses to climate variables, as
opposed to short-term responses to weather
sequences (Sutherst et al. 1999).The native range of an organism is assumed to
include climatically suitable areas within any geo-
graphic dispersal barriers (e.g., sea) and areas of
biotic exclusion (e.g., competitive exclusion).
Including distribution records from exotic ranges
in an analysis provides an opportunity to identify
additional suitable climatic conditions that are not
represented in the native range due to dispersalbarriers or biotic exclusion, and often markedly
increases the predicted climatically suitable range
(Kriticos and Randall 2001).
Due to its coarse geographic scale, the world
distribution by country can only be used for a
crude verification of the model. Ideally, the
Australian distribution would be used only to
validate the model. However, because of thelack of knowledge of the climate preferences of
C. grandiflora to some climate variables, it was
necessary to include consideration of the
Australian distribution of the plant in building
the model.
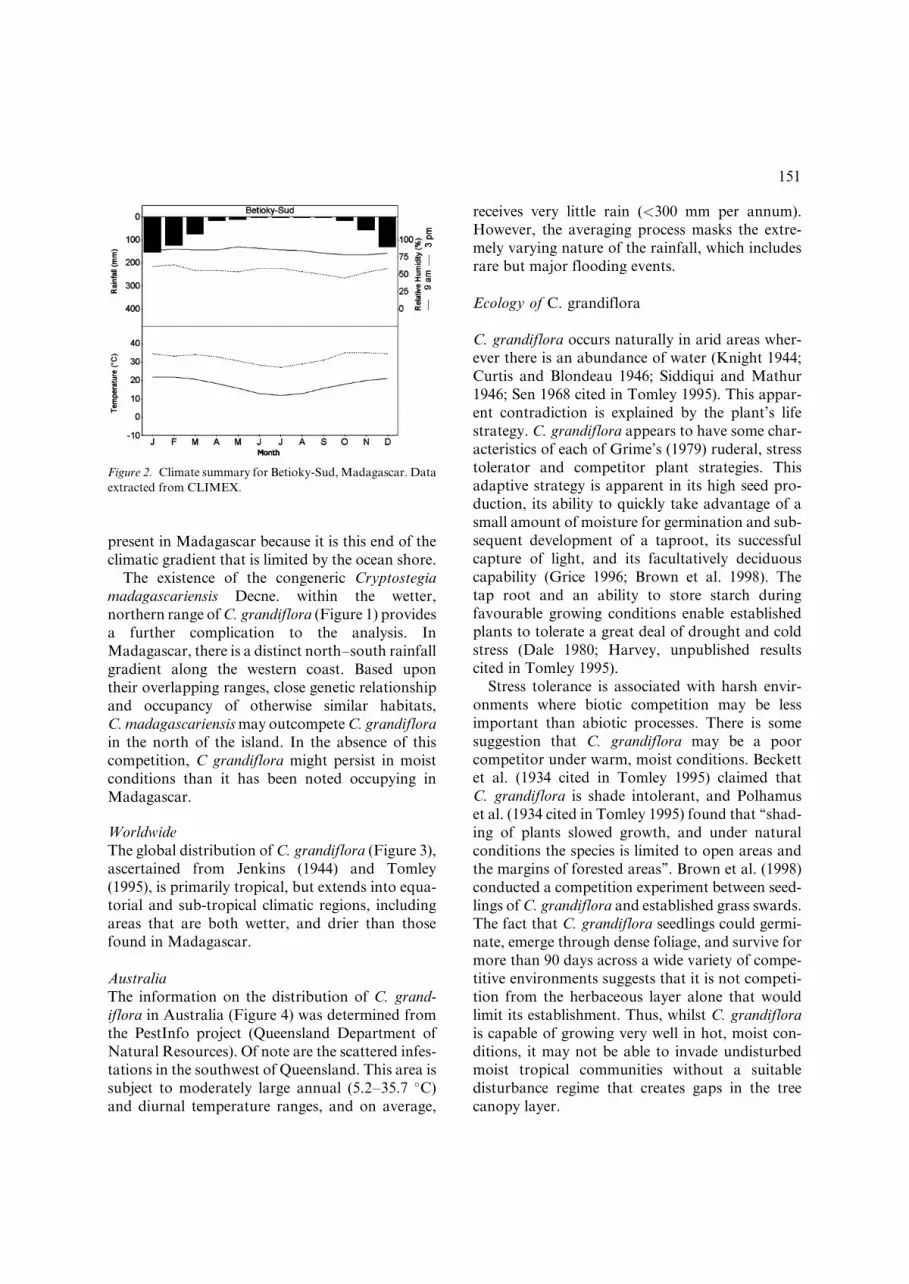
Madagascar
The distribution of C. grandiflora in its country
of origin, Madagascar (Figure 1) has been
described by McFadyen and Harvey (1990), basedon a work by Marohasy and McFadyen (unpub-
lished data). The climate within the natural range
of C. grandiflora is characteristically dry tropical
with a highly pronounced summer bias in rainfall.
The climatic conditions at Betioky-Sud, near the
centre of the C. grandiflora distribution in
Madagascar, are typical (Figure 2).
Madagascar is a relatively small landmass, witha limited amount of climatic variation, where
C. grandiflora may not be able to fully express
its climatic preferences. This potential limitation
is most likely to be significant in the ability of
C. grandiflora to survive drier climates than are
Figure 1. The distribution of C. grandiflora and C. madaga-
scariensis in Madagascar (McFadyen and Harvey 1990).
150
present in Madagascar because it is this end of the
climatic gradient that is limited by the ocean shore.
The existence of the congeneric Cryptostegia
madagascariensis Decne. within the wetter,
northern range of C. grandiflora (Figure 1) provides
a further complication to the analysis. In
Madagascar, there is a distinct north–south rainfall
gradient along the western coast. Based upon
their overlapping ranges, close genetic relationship
and occupancy of otherwise similar habitats,
C. madagascariensis may outcompete C. grandiflora
in the north of the island. In the absence of this
competition, C grandiflora might persist in moist
conditions than it has been noted occupying in
Madagascar.
Worldwide
The global distribution of C. grandiflora (Figure 3),
ascertained from Jenkins (1944) and Tomley
(1995), is primarily tropical, but extends into equa-
torial and sub-tropical climatic regions, including
areas that are both wetter, and drier than thosefound in Madagascar.
Australia
The information on the distribution of C. grand-
iflora in Australia (Figure 4) was determined from
the PestInfo project (Queensland Department of
Natural Resources). Of note are the scattered infes-tations in the southwest of Queensland. This area is
subject to moderately large annual (5.2–35.7 �C)
and diurnal temperature ranges, and on average,
receives very little rain (<300 mm per annum).
However, the averaging process masks the extre-
mely varying nature of the rainfall, which includes
rare but major flooding events.
Ecology of C. grandiflora
C. grandiflora occurs naturally in arid areas wher-
ever there is an abundance of water (Knight 1944;
Curtis and Blondeau 1946; Siddiqui and Mathur
1946; Sen 1968 cited in Tomley 1995). This appar-
ent contradiction is explained by the plant’s life
strategy. C. grandiflora appears to have some char-
acteristics of each of Grime’s (1979) ruderal, stress
tolerator and competitor plant strategies. Thisadaptive strategy is apparent in its high seed pro-
duction, its ability to quickly take advantage of a
small amount of moisture for germination and sub-
sequent development of a taproot, its successful
capture of light, and its facultatively deciduous
capability (Grice 1996; Brown et al. 1998). The
tap root and an ability to store starch during
favourable growing conditions enable establishedplants to tolerate a great deal of drought and cold
stress (Dale 1980; Harvey, unpublished results
cited in Tomley 1995).
Stress tolerance is associated with harsh envir-
onments where biotic competition may be less
important than abiotic processes. There is some
suggestion that C. grandiflora may be a poor
competitor under warm, moist conditions. Beckettet al. (1934 cited in Tomley 1995) claimed that
C. grandiflora is shade intolerant, and Polhamus
et al. (1934 cited in Tomley 1995) found that ‘‘shad-
ing of plants slowed growth, and under natural
conditions the species is limited to open areas and
the margins of forested areas’’. Brown et al. (1998)
conducted a competition experiment between seed-
lings of C. grandiflora and established grass swards.The fact that C. grandiflora seedlings could germi-
nate, emerge through dense foliage, and survive for
more than 90 days across a wide variety of compe-
titive environments suggests that it is not competi-
tion from the herbaceous layer alone that would
limit its establishment. Thus, whilst C. grandiflora
is capable of growing very well in hot, moist con-
ditions, it may not be able to invade undisturbedmoist tropical communities without a suitable
disturbance regime that creates gaps in the tree
canopy layer.
Figure 2. Climate summary for Betioky-Sud, Madagascar. Data
extracted from CLIMEX.
151

Some authors maintain that C. grandiflora is frost
sensitive (Bonner and Galston 1947). However,Polhamus et al. (1934) claimed that �6.7 �C is the
lower limit for growth, whereas Trumbell (1942
cited in Caltabiano 1972) claimed that�7.8 �C is the
lower limit for growth. Considering that this plant is
of tropical origin, the veracity of these claims must
be questioned. Chippendale (1991) states that
C. grandiflora has existed in Gatton, to the west of
Brisbane, for many years, and that Gatton receives
a great deal of frost. He also states that this patch of
C. grandiflora is confined to a creek. The microcli-
matic effects of the creek may have protected thispatch from significant frost damage. In this model,
we assume that C. grandiflora is frost sensitive, but
that it can tolerate the climatic conditions found
at Gatton.
Fitting parameters
The overall goal of the modelling exercise in
this study was to fit parameters for CLIMEX
climate response functions to the native distribu-
tion of C. grandiflora. In order to achieve this,
stress functions were adjusted so that the cold,
dry, heat, and wet stresses largely constrained the
population from expanding beyond its present dis-tribution limits in areas where it has had an oppor-
tunity to fully expand its range. Each of the model
parameters was adjusted until maps of the stress
indices compared favourably with the known distri-
bution of the organism in its native and introduced
range outside Australia. Several mechanisms of
cold stress and thermal accumulation in the range
of temperatures suitable for growth were investi-gated. Those mechanisms that provided the best fit
Figure 3. Worldwide distribution of C. grandiflora according to Jenkins (1944) and Tomley (1995). The shaded areas indicate countries
with C. grandiflora and not actual territory occupied by this species. Rectangles contain small countries where C. grandiflora is present.
Figure 4. Australian distribution of C. grandiflora (adapted
from Queensland Department of Natural Resources, PestInfo
database 1999).
152

to the known distribution of C. grandiflora were
retained (Table 1).
After the stress indices were fitted, the growth
indices were adjusted in a similar iterative process,taking into account physiological growth data (see
below). Wherever possible, the parameters were
derived from the distribution of C. grandiflora in
Madagascar. However, the density of weather
recording stations on Madagascar is low (�22,000
km2 per station), and most of the stations are
located on the coastal margin of the island. The
climate database therefore provides little informa-tion on the climatic gradients within the island.
Madagascar also lacks the extreme xeric conditions
such as those found in central Australia. This
meant that some parameters had to be inferred
from physiological information, and some from
knowledge of the plant’s distribution in Australia.
While this means that the model could not be prop-
erly validated using the Australian distribution ofthe plant, it is likely that the model is more accurate
than one created without the use of Australian data
(Kriticos and Randall 2001). The known world
distribution by country was also used as a coarse,
but independent source of model validation.
There are no reports on the effect of photoperiod
on growth or reproductive phenology, and a satis-factory model fit was obtained without the use of
any photoperiod indices.
Stress indices
The stress indices are scaled from 0 to 100, with0 indicating no stress and 100 indicating lethal
conditions.
Cold stress. The cold stress function was used to
simulate a susceptibility to frost damage.
According to the Department of Science andConsumer Affairs (1975), a value of 2.5 �C for the
long-term monthly average for daily minimum
temperature includes a significant number of frost
days per week. Accordingly, the temperature
threshold at which cold stress starts to accumulate
(TTCS) was set at 2.5 �C, and the weekly stress
accumulation rate (THCS) was set at 0.2 �C per
week below the threshold (Table 1). The resultingglobal pattern of modelled cold stress for C. grand-
iflora indicates that most high altitude regions are
unsuitable for C. grandiflora due to excessive cold
temperatures.
Heat stress. Heat stress is likely to accumulate
rapidly as temperatures exceed approximately 45�C, the temperature at which unprotected proteins
start to denature (Larcher 1975). The heat stressthreshold (TTHS) was set at 43 �C (Table 1), to
account for the moderate effect of the long term
averaging process used to create climate variables
from weather sequences. Few locations in the
world experience such conditions. It is included
here for completeness, and because of the possibi-
lity that increasing temperatures accompanying cli-
mate change could significantly increase the areawhere heat stress could become a significant factor
limiting the distribution of C. grandiflora.
Dry stress. The dry stress threshold (SMDS) was
set at 0.1, a figure that equates to 10% of plantavailable soil moisture. This value was selected
because it is close to the limit at which plants can
extract moisture from the soil (Daubenmire 1974).
Table 1. CLIMEX parameter values used for C. grandiflora.
Parameter mnemonics taken from Sutherst et al. (1999).
Index Parameter Value
Temperature DV0 ¼ lower threshold 15
DV1 ¼ lower optimum
temperature
25
DV2 ¼ upper optimum
temperature
37
DV3 ¼ upper threshold 43
PDD ¼ degree-day threshold
(minimum annual total number
of degree-days above 15 �C
(DV0) needed for population
persistence
1985
Moisture SM0 ¼ lower soil moisture
threshold
0.1
SM1 ¼ lower optimum soil
moisture
0.3
SM2 ¼ upper optimum soil
moisture
1
SM3 ¼ upper soil moisture
threshold
1.3
Cold stress TTCS ¼ temperature threshold 2.5
THCS ¼ stress accumulation rate 0.2
Heat stress TTHS ¼ temperature threshold 43
THHS ¼ stress accumulation rate 0.25
Dry stress SMDS ¼ threshold soil moisture 0.1
HDS ¼ stress accumulation rate 0.0025
Wet stress SMWS ¼ threshold soil moisture 1.35
HWS ¼ stress accumulation rate 0.017
153

This value was also selected because at higher
threshold levels, C. grandiflora is projected to be
unable to persist at Hungerford or Boulia, from
where it has been reported (Figure 4). Both loca-
tions have an average annual rainfall of approxi-mately 260 mm and average modelled soil moisture
levels never exceed 0.1. The rate of stress accumu-
lation was adjusted such that Boulia and
Hungerford were barely suitable for the plant
(Table 1). The resulting global pattern of modelled
dry stress for C. grandiflora coincides with areas
noted for their extreme aridity.
Wet stress. Curtis (1946) states that the growth of
C. grandiflora is severely retarded by high rainfall.
Accordingly, the wet stress threshold (SMWS) was
set at 1.35 and the stress accumulation rate (HWS)
was set at 0.017 (Table 1). Using these values,
C. grandiflora is projected to be unable to persistat the wet coastal sites in eastern Madagascar that
McFadyen and Harvey (1990) described as unsui-
table. C. grandiflora is found in the drier south
western corner of Madagascar; north of the
Tropic of Capricorn and it is progressively replaced
by its congener, C. madagascariensis. This replace-
ment coincides with an increase in precipitation
and soil moisture availability. The model para-meters were adjusted so that wet stress progres-
sively increased as conditions became wetter than
those found at the edge of its native range. Records
of occurrence of C. grandiflora in Cooktown
(Figure 4) provided a basis for limiting the rate of
wet stress accumulation. The resulting global pat-
tern of modelled wet stress for C. grandiflora
includes the wet tropical regions of the world andsome relatively small wet temperate areas in wes-
tern North and South America.
Growth indices
The growth indices are scaled from 0 to 100, with a
value of 0 indicating no growth, and 100 indicatingthat optimal growing conditions prevail through-
out the year.
Temperature index. The temperature index was
adjusted so that the upper limit for growth (DV3)
coincides with the heat stress threshold. Notingthat C. grandiflora defoliates during winter in
Charters Towers (Mackey 1996), the lower limit
(DV0) was set to 15 �C (Table 1). This value is
slightly higher than the long-term winter daily
minimum of around 12 �C at Charters Towers.
However, plant growth is likely to cease at a higher
temperature than that which triggers defoliation.
The upper and lower optimum temperature para-meters (DV1 and DV2) were adjusted to biologi-
cally realistic values for tropical C3 plants
(Fitzpatrick and Nix 1970). The resulting global
distribution of temperature index indicates that
the temperature conditions favourable for plant
growth are very widely distributed.
Thermal accumulation. C. grandiflora produces
large seedpods. Because pods are created using a
series of biochemical reactions, this is presumablyan energy-demanding process. That is, the devel-
opment of pods requires energy to proceed, and so
its procession can be modelled as a function of
thermal time through the accumulation of degree-
days. Further evidence lies in the fact that previous
models (Chippendale 1991; Kriticos 1996) did not
employ a thermal accumulation mechanism in
CLIMEX, and were unable to satisfactorilymodel the potential distribution of this plant. The
threshold minimum heat accumulation parameter
(PDD) was adjusted upward until the conditions at
the three climate stations in the central highlands
of Madagascar (Antananarivo, Antsirabe, and
Fianarantsoa) became too cool for C. grandiflora
(1540 degree-days above 15 �C). According
to McFadyen and Harvey (1990), C. grandiflora isrestricted to below 500 m elevation in Madagascar.
An unrealistically high heat requirement (2590
degree-days above 15 �C) is needed to eliminate
C. grandiflora from the remaining climate stations
higher than 500 m above sea level (a.s.l.) (Ihosy,
800 m a.s.l. and Betroka, 795 m a.s.l.). This thresh-
old value would prevent C. grandiflora from
persisting in many coastal Queensland sites whereit has been noted growing and reproducing.
The true threshold annual heat requirement for
C. grandiflora should lie somewhere between these
two extremes. The threshold chosen for the model
was 1985 degree-days. This value is the maximum
heat requirement that would still enable C. grand-
iflora to persist in Gatton, and reflects the fact that
Gatton appears to be climatically marginal for C.
grandiflora (G.J. Harvey, pers. comm.). The effect
of the uncertainty of this parameter upon the pre-
dicted potential distribution in Australia is rela-
154

tively minor, ranging 400 km along a narrow
coastal belt of northern New South Wales from
Taree (152�290 E, 31�530 S) to the Queensland border.
The modelled thermal accumulation threshold
restricts the distribution within the area of tem-perature index values favourable for growth. The
poleward boundaries of this threshold have a shape
that is easily distinguished from other indicators
of cold stress such as threshold temperatures or
number of frost days.
Moisture index. The moisture index was adjusted
to maximise the growth potential between the two
moisture stress thresholds, whilst still maintaining
a plausible range between the minimum level for
growth (SM0) and the lower bound for optimum
growth (SM1), and between the maximum levelfor growth (SM3) and the upper bound for
optimum growth (SM2). The global distribution
of the modelled moisture index indicates that whilst
the soil moisture conditions conducive to growth
are very extensive, they do not coincide closely with
the distribution of thermal conditions most condu-
cive to growth.
Climate change scenarios
After the CLIMEX parameters were fitted under
the present climate averages, seven climate scenar-
ios were chosen to reflect the range of possible
future climatic conditions in the mid-to-late 21stcentury supported by the IPCC (Table 2). Global
average daily temperatures are likely to rise in
the order of 2 �C sometime during this period
(Houghton et al. 1995; Climate Impact Group
1996). Therefore, all of the climate change scenar-
ios include a 2 �C increase in daily minimum and
maximum temperatures. There is much greater
uncertainty surrounding the effect of climatechange upon rainfall. To account for this uncer-
tainty, rainfall is altered in the range �10%. There
is considerable evidence that increased (CO2) can
lead to increased plant growth and a reduction in
water use (Morison 1993; Farquhar 1997). The
effect of this may be to reduce the rate at which
soil moisture is depleted, prolonging the growth
period in seasonally dry climates. Alternatively,the soil moisture could be depleted at a similar
rate, but the plant community could produce
more biomass per unit of water transpired. It is
not possible within the present version of
CLIMEX to directly simulate an increase in plant
water use efficiency (WUE). However, by reducing
the evapotranspiration coefficient Et (constant pro-portion of class-A pan evaporation that is actually
lost to evapotranspiration), the rate of simulated
soil moisture depletion is decreased. This poten-
tially extends the simulated growth period, with
the net effect that the plant is able to increase its
annual growth. Whilst the net effect of increased
plant WUE at the stand level is equivocal, this
mechanism adequately simulates the necessaryeffects. The default value of 0.8 for Et was reduced
in steps of 0.2 to account for a range of potential
increase in plant WUE. The value of 0.4 for Et is
considered extreme, though Farquhar (1997) states
that a doubling of (CO2) can act like a doubling
of rainfall if all other constraints to growth are
removed. This value is included to provide an
extreme context for the other scenarios.The first six scenarios in Table 2 are used to
explore the sensitivity of the range of C. grandiflora
in some detail within Australia; where there is
abundant, detailed information on the current dis-
tribution, and for which there is ample scope for
climate change to modify range boundaries with-
out encountering geographic dispersal barriers
such as marine coastlines. The seventh scenario isincluded to provide a mid-range indication of the
sensitivity of the potential distribution to climate
change on a global scale.
Model assumptions
Genetic homogeneity
It is assumed that C. grandiflora is genetically
homogeneous with respect to its response to
Table 2. Selected climate change scenarios used in CLIMEX
analyses. Et is the evapotranspiration rate expressed as the
proportion of class A pan evaporation.
Scenario number Temperature Rainfall Et
1 þ2 �C þ10% 0.8
2 0.6
3 0.4
4 �10% 0.8
5 0.6
6 0.4
7 No change 0.6
155

climatic factors. According to Knight (1944),
C. grandiflora introduced to Haiti is entirely
pollinated by insects. However, Blake (1942, cited
in Tomley 1995) finds no evidence of insect pollina-
tion of C. grandiflora in Australia, suggesting thatin Australia at least, it self-pollinates. The lack of
out-crossing opportunities afforded by insect polli-
nation may ensure that a high degree of genetic
homogeneity is maintained in the Australian popu-
lation, as adapted genotypes are likely to be rapidly
fixed and multiplied (Stebbins 1957; Allard 1965).
As there is no indication to the contrary in
the literature, the assumption of genetic homo-geneity with respect to the climate response of
C. grandiflora seems valid.
Climate is the primary determinant of potential
distribution
The CLIMEX model assumes that the long-term
average climate is a major factor controlling the
distribution of plants and poikilothermal animals.
Whether the predicted distributions exceed the
actual distribution of an organism depends largelyupon how range outliers are classified. Generally,
the climatic range will include areas that are other-
wise unsuitable due to non-climatic factors.
The main problems with this assumption have to
do with microclimatic factors that enable a species
to survive unfavourable conditions, or favourable
microsites that enable it to grow when the macro-
climate would indicate otherwise. For example,local hydrographic effects could concentrate
rainfall runoff, perhaps increasing soil moisture
availability above critical thresholds. Another
important factor influencing the ability of a plant
to persist at a given site is soils. The soil type
(particularly the moisture holding capacity) has a
large bearing upon the ability of a terrestrial plant
to access moisture, especially during summer whenevaporation rates may be high. Other edaphic
properties such as pH and nutrient status can also
affect the ability of a plant to persist.
Translating ecophysiological information into
CLIMEX is problematic. CLIMEX uses long-
term monthly averages of maximum and minimum
temperature and rainfall. This smooths out much
of the weekly and daily variation in the tempera-ture and rainfall extremes, and makes it difficult to
predict precise borders for phenomena such as frost
tolerance.
Results
Caution is required when interpreting the results of
the bioclimatic analysis presented below. Whilst
the predicted climatic suitability is based upon thebest available knowledge, there is also a consider-
able amount of uncertainty regarding this species’
tolerance to some climatic factors. Additionally,
the projection is based upon long-term average
climate data, which introduces complications and
uncertainties to the modelling process. Finally, cli-
mate surfaces used in the analysis are a spatial
interpolation of long-term climate data, therebyintroducing additional uncertainty.
Current climate
The fitted potential global distribution of
C. grandiflora is characteristically tropical, extend-
ing into sub-tropical, semi-arid and equatorial
areas (Figure 5). It compares favourably with the
known distribution of the plant by country from
published sources, correctly predicting suitablehabitat for all known occurrences of the plant at
the country level of resolution (Figure 3). This
indicates that the predicted distribution is probably
not too restricted.
The predicted bioclimatic limits to C. grandiflora
distribution in its country of origin, Madagascar,
are presented in Figure 6. All known sites where
C. grandiflora had naturalised were used in theparameter-fitting exercise. It is noteworthy that
this has resulted in the predicted bioclimatic limits
of C. grandiflora in Madagascar exceeding its
known natural distribution in that country.
Logically, there are three possible reasons for this:
(1) the existence of non-climatic factors restricting
its distribution in Madagascar (e.g., dispersal
barriers, soil types, cultural (disturbance regimes),microclimate, competition, or pests or pathogens),
(2) genetic drift of exported sub-populations, or
(3) incorrect model formulation.
The short period since introduction into
Australia and the apparent absence of strong selec-
tive forces suggest that the second reason is
unlikely. The strong agreement between the model
and the known distribution of the plant else-where suggests that the model formulation is
reasonable. Each new climate to which the plant
was introduced provides a test of the model’s
156

validity. A successful establishment without cul-
tural assistance in an area predicted to be climati-
cally unsuitable would invalidate the model
provided it was not in unrepresentative microcli-matic conditions. A failure to establish in an area
predicted to be suitable, however, would require
consideration of whether the failure to establish
was due to a lack of adequate opportunity before
it could be concluded that the model was invalid;
i.e., whether establishment failure was due to envir-
onmental stochasticity, small numbers of dissemi-
nules etc. or whether the climate was genuinelyunsuitable for long-term population persistence. It
is most likely that non-climatic factors, such as
competitive exclusion, explain the discrepancy
between the observed and the predicted distribu-
tions in Madagascar. The fact that C. grandiflora
does occur in an area predicted to be climatically
favourable in Madagascar, but outside of its
recorded distribution, gives some credence to thisassertion. J. Marohasy (pers. comm.) has noted C.
grandiflora growing in Tolanaro in the southeast of
Madagascar (Figure 1). Tolanaro is outside of the
known natural distribution, and in an area pre-
viously considered too wet for C. grandiflora
(Curtis 1946; Chippendale 1991). The possibility
that moderate to high amounts of rainfall do not
directly limit C. grandiflora is supported by studies
by Symontowne (1943) and J.R. Brown (CSIRO,
pers. comm.). The natural distribution could be
limited by indirect effects of higher rainfall, such
Figure 5. World map showing climatic suitability (ecoclimatic index) for C. grandiflora modelled using CLIMEX.
Figure 6. Climatic suitability (ecoclimatic index) for C.
grandiflora in Madagascar modelled using CLIMEX.
157

as added seedling competition for light in estab-
lished undisturbed forests, or the added virulence
of pathogens. The existence of the congener C.
madagascariensis in Madagascar, with its overlap-
ping range may also be restricting the range of C.
grandiflora to less than its climatic limits through
competitive exclusion in that region.
The predicted potential distribution of
C. grandiflora in Australia is presented in Figure 7.
This differs somewhat from a previous analysis by
Chippendale (1991, Figure 4.14), primarily in the
extension of the southern and south-western bor-
ders. Chippendale (1991) inferred his boundariesbased on assumptions of frost intolerance and
a requirement for a minimum of 300 mm of annual
precipitation (Figure 8). These assumptions are
challenged by the discovery of several healthy spe-
cimens in the frost-prone Quilpie Shire, and in the
towns of Charleville and Roma. Specimens have
also been discovered in the arid towns of Boulia
near the central western border of Queensland,and in Hungerford on the southern border of
Queensland. The specimen at Boulia has not been
observed to produce viable seed and has not spread
(D. Akers, Queensland Department of Natural
Resources, personal communication). The speci-
men at Hungerford was in the Paroo River prior
to being destroyed. The average annual precipita-
tion at Hungerford is very low (<250 mm) andnon-seasonal. However, the Paroo River floods
periodically during rains in the northern part of
the catchment. It is likely that these large, infre-
quent floods may have allowed C. grandiflora to
germinate and survive despite the adverse long-
term climatic conditions.
In order to model the bioclimatic limits of
C. grandiflora, it was necessary to take into accountthe performance of the plant in these marginal
climates. Based upon information provided by
field staff of the Queensland Department of
Natural Resources, it was decided that Boulia
represented the most arid conditions in which
C. grandiflora might occur adventitiously. In such
climates, its distribution will be restricted to
riparian and other, more mesic microhabitats.In these sub-marginal areas, it is likely that this
plant will not take on excessively weedy character-
istics, posing little threat to conservation or pro-
duction values. The existence of C. grandiflora at
Hungerford is most likely due to a combination of
cultural and other non-climatic effects. Whilst the
plant can survive there, it is unlikely that it could
significantly expand its population due to an
inability to complete its lifecycle.The specimens of C. grandiflora found in Quilpie
Shire and in the towns of Charleville and Roma
were vigorous and were obviously more suited to
the climate than the plant at Hungerford. These
vines have given rise to sporadic recruitment in
years of milder or wetter than average conditions,
or where there was disturbance (B. Toms, pers.
comm.). Whilst these vines were restricted tomore mesic sites such as creek banks, it is note-
worthy that these sites are of disproportionate eco-
logical importance in these xeric regions. The
threat that this organism poses in these regions,
whilst low in spatial terms, may still be significant
from a conservation and agricultural production
perspective.
The predicted performance of C. grandiflora
in Australia indicates that it may become more
of a problem in the coastal region around
Rockhampton (23� S, Figure 4), and further
south. Early distribution maps of C. grandiflora
(e.g., Caltabiano 1972) indicated that the most
extensive and intensive infestations were north of
around Bowen (148�100 E, 20�000 S). The area
infested by 1990 extended much further south andincluded particularly bad infestations around
Rockhampton (Hynes et al. 1992). This indicates
that whilst the plant may initially have been spread
Figure 7. CLIMEX Climatic suitability (ecoclimatic index) for
C. grandiflora in Australia under current climate.
158

further north, it has the potential to become more
of a pest further south. Further evidence for this
claim lies in the fact that Rockhampton lies on the
Tropic of Capricorn (23� S), the same latitude as
the middle of the natural distribution of C. grand-
iflora in Madagascar (Figure 1).
Climate change sensitivity
The impacts of climate change are assessed here in
terms of the relative sensitivity of the potential
distribution to a set of conditions that represent
the range of IPCC scenarios. Thus, the results
should not be viewed as predictions, but rather as
projections, based on the stated assumptions about
the plant’s climatic preferences and the chosen cli-mate scenarios. In interpreting these results, it must
be remembered that the climate change scenarios
are being applied evenly across the current long-
term average climate surfaces. The real effects of
climate change are likely to vary considerably on a
regional basis (CSIRO Division of Atmospheric
Research 1988). In particular, the effects of climate
change upon precipitation are likely to vary in bothdirection and magnitude.
Australia
The overall impact of climate change upon the
distribution of C. grandiflora in Australia will be
to increase its range poleward (south) and inland
(west), potentially invading all mainland states
except Victoria (Figure 9). The area of ‘highly sui-
table’ habitat extends further northward and west-
ward under the wetter and more water-use efficientscenarios (Figures 9E–G). This signals that the
southern margins of the Wet Tropics World
Heritage Area and the northern section of the
Great Dividing Range may come under more
intense invasion pressure from C. grandiflora in
the future.
The potential distribution of C. grandiflora is
very sensitive to alterations in WUE due to increas-ing [CO2]. All scenarios show a poleward increase
in range. Compared with present climatic condi-
tions, increasing temperatures with decreasing
rainfall, and no increase in WUE (Figure 9B)
results in a contraction of the highly suitable habi-
tat towards the coast around Rockhampton.
Increase in WUE (Figures 9B–G) has a very large
effect on the distribution of different habitat suit-ability zones, increasing the range towards the arid
interior of Australia.
The distribution of the growth index for
C. grandiflora indicates where it can grow in the
absence of climatic stresses and minimum thermal
accumulation requirements for population persis-
tence. In Australia, the zone of highest growth
potential under current conditions is centred nearRockhampton. It increases in a predominantly
southerly, and westward direction as temperatures,
rainfall and WUE increase. Under these climate
scenarios, there is an increase in the growth poten-
tial in the centre of the continent. These findings
are reflected in the two components of the growth
index, the moisture index and the temperature
index.Cold stress due to frost intolerance is restricted
to the southern highlands of the Great Dividing
Range. The area of this zone is slightly reduced
by a 2 �C increase in global temperatures. The
area that receives sufficient heat for pod develop-
ment is increased in a poleward direction. The
change is fairly uniform along the southern bound-
ary of the threshold, except for the highlands of theGreat Dividing Range where frost occurrence also
prevents the plant from persisting.
There appears to be a small amount of wet stress
in northern Australia under current climatic condi-
tions. There is little impact of climate change on the
Figure 8. Modelled climate suitability of C. grandiflora
according to Chippendale (1991).
159

Figure 9. Modelled CLIMEX climate suitability (ecoclimatic index) for C. grandiflora under different climate scenarios. (A) current
climate; (B) þ2 �C, �10% rainfall, Et ¼ 0.8; (C) þ2 �C, �10% rainfall, Et ¼ 0.6; (D) þ2 �C, �10% rainfall, Et ¼ 0.4; (E) þ2 �C, þ10%
rainfall, Et ¼ 0.8; (F) þ2 �C, þ10% rainfall, Et ¼ 0.6; (G) þ2 �C, þ10% rainfall, Et ¼ 0.4.
160

distribution of this stress. The combination of
slight increase in wet stress and a coincident reduc-
tion in the moisture index is enough to reduce the
climatic suitability of small patches of northern
Australia under each of the scenarios that includea 10% precipitation increase. A similar result was
found for the scenario with the highest WUE and
reduced precipitation.
Under current climate conditions, intense dry
stress in combination with low moisture availability
for growth appears to limit the area within
central Australia that is suitable for invasion by
C. grandiflora. The effect of climate change is tocause this region of high dry stress to contract
markedly in all cases except for the two driest sce-
narios. In the wettest scenario, C. grandiflora would
not suffer intense dry stress anywhere in Australia.
Worldwide
A comparison of Figures 5 and 10 indicates that
the results of the climate change simulations in
Australia are reflected in the global pattern
of change in the potential distribution ofC. grandiflora, with an increase in range towards
the poles, and towards more xeric regions.
Globally, the areas of greatest increase in the eco-
climatic index as a result of climate change are in
the southeastern seaboard regions of the United
States of America, southern Brazil, northern
Argentina, central and southern Africa, a thin
band along the southern Meditteranean coastline,eastern India and southern China.
Discussion
It is apparent from this analysis that C. grandiflora
occupies only a small portion of its potential range
under current climatic conditions. Projected cli-
matic changes may expand this potential range
even further. The large proportion of the potentialrange currently unoccupied, and the high costs of
invasion impact and control (Chippendale 1991;
Mackey 1996) may justify the implementation of
strategic containment and biological control pro-
grams against C. grandiflora, without reference to
climate change. In Australia, a strategic control
line (Figure 4) to protect some of the threatened,
but as yet uninvaded habitat is attractive as it canfocus scarce control resources on those regions that
offer the greatest strategic benefits. It must be
recognised, however, that depending upon their
Figure 10. World map showing climatic suitability (ecoclimatic index) for C. grandiflora modelled using CLIMEX with a climate change
scenario with 2 �C increase in temperature, no change in rainfall and an Et value of 0.6.
161

location, climate change could place more invasion
pressure on such strategic control lines. That is,
climate change may increase the suitability of
habitat for C. grandiflora in areas adjacent to the
strategic control line. This will likely increase thenumber of disseminules and their probability of
successfully establishing (Dale 1980). It is unclear
whether the requisite levels of surveillance and
control necessary to maintain this line can be
marshalled effectively in the relatively sparsely
populated regions of rural Queensland through
which this containment line runs (Figure 4).
Efforts that reduce the rate of seed production,particularly near the periphery of the range of an
invading plant, may significantly reduce the inva-
sion velocity (Hoffmann and Moran 1998). Two
biological control agents have been introduced to
Australia in an effort to control C. grandiflora: a rust
fungus Maravalia cyptostegiae and a leaf-feeding
moth Euclasta whalleyi (Pyralidae) (Mackey 1996).
Whilst neither agent appears to kill the plant, it ishoped that they will reduce the fecundity of C.
grandiflora, and hence its invasion velocity, per-
haps reducing the invasion pressure on the strategic
control line (i.e., likelihood of establishment adja-
cent to the control line). To our knowledge, no
analyses have been published on the potential
distribution of these agents under current climatic
conditions, or the likely impacts of climate changeon these agents. It therefore remains unclear as to
what level of control they are likely to exert upon
C. grandiflora under future climate scenarios.
Climatic conditions are thought to determine
the ultimate potential distribution of a plant
(Woodward 1987). Interactions with biological
control agents may affect the density and distri-
bution of a species within that range, but may notsignificantly reduce its potential range. Two
strands of argument support this notion. First, as
Carter and Prince (1981, 1988) showed, epidemic
dynamics can be used to explain species’ distribu-
tion limits. Using the terminology of Carter and
Prince, biotic population factors such as biological
control interactions will possibly reduce the infec-
tion rate (plant fecundity or disseminule produc-tion) and the number of infective sites (adult
plants). These biotic factors would tend to
reduce the density and fecundity of plants near
the distribution limits. However, in the absence of
competitive exclusion, it is abiotic factors such as
climate and disturbance pattern that determine the
number of susceptible sites and their susceptibility
(i.e., habitat suitability).
The second supporting argument comes from
predator prey interactions, which dictate that asthe plant density decreases, the density of the
agent should decrease, and in turn, the agents’
effects on the plant population should also dimin-
ish. The successful introduction of a biological
control agent should result in a reduction of the
dynamic equilibrium population level of the con-
trol target (White 1997). However, it is unlikely to
lead to widespread population extinction, and theultimate distribution limits may remain largely
unaffected by biological control agents.
The outcome of the interplay between the biotic
and abiotic factors in terms of the potential
geographic range of the plant will be sensitive to
the gradient of habitat suitability near the range
margin. If the gradient is shallow as in the region of
marginally suitable habitat for C. grandiflora insouth-western Queensland (Figure 7), then there
is scope for the control agents to reduce the plants
density and fecundity below critical levels for popu-
lation persistence across large areas. Conversely,
abrupt range boundaries such as those in
south-west China (Figure 5) and south-eastern
Queensland (Figure 7) would require major
impacts upon population processes to modifythe range boundary, and would still be unlikely
to shift the potential range markedly.
The close agreement between the predicted and
Australian distribution under current climate pro-
vides some degree of model validation. However,
comprehensive validation would require a network
of study sites arranged along the periphery of the
predicted distribution, straddling the boundary.Seeds and plants of C. grandiflora would need to
be carefully observed through time to ascertain
that the plant was capable of completing its life-
cycle at each site. Such validation exercises could
be expensive and time consuming for a perennial
plant in a marginal environment where the oppor-
tunities for recruitment might occur very infre-
quently. Under such circumstances, this form ofvalidation is likely to be of academic interest rather
than serve any practical use.
The apparent conflict between the amount of
heat accumulation necessary for reproduction in
Gatton and that necessary to limit C. grandiflora
162

to below the 500 m contour in Madagascar may
warrant investigation.
Conclusion
Even without the possibility of climate change
there is potential for C. grandiflora to become an
even more problematic weed in more mesic regions.On a regional scale, climate change may increase
the area of suitable habitat further poleward and
inland. It is also likely that on a local scale, the
increase in the carbon fertilisation effect and WUE
will enable C. grandiflora to invade further away
from mesic sites such as natural drainage channels
in xeric regions as upland plants grow better and
become more fecund, fuelling greater invasionpotential from these upland foci. This makes the
early detection and treatment of outlying popula-
tions of prime importance. Whilst climate change
may markedly increase the potential distribution of
C. grandiflora, this effect may be less than the
potential for expansion under current climatic
conditions.
The increased potential for invasion because ofclimate change reinforces the status of this plant in
Australia as a weed of national significance. It also
indicates that a concerted effort should be made to
contain the spread of C. grandiflora and prevent it
invading new jurisdictions. Measures should there-
fore be taken to alert the public, the horticulture
industries and weed professionals in those threa-
tened regions about the increased potential forinvasion by C. grandiflora as a result of climate
change, the costs of invasion, and techniques to
identify and eradicate outliers that could become
foci for further invasion (Mack et al. 2000).
The potential effects of climate change on the
potential distribution and abundance of C. grand-
iflora presented here highlight the desirability of
considering the effects of altered climate andatmospheric chemistry when undertaking risk
assessments for biotic invaders.
Acknowledgements
The Rural Industries Research and Development
Corporation provided funding for this work under
project UQ-42A. Thanks to Drs Richard Mack,
Roger Cousens, Andy Sheppard, and Mark
Howden for reviewing early drafts of the manu-
script. Thanks also to Dr Jim Carlton and an
anonymous referee for helpful suggestions.
References
Allard RW (1965) Genetic systems associated with colonizing
ability in predominantly self-pollinated species. In: Baker HG
and Stebbins GL (eds) The Genetics of Colonizing Species, pp
49–75. Academic Press, London
Anonymous (1997) The National Weeds Strategy: a Strategic
Approach to Weed Problems of National Significance.
Commonwealth of Australia, Australia, 52 pp
Beckett RE, Stitt RS and Duncan EN (1934) Growth and
Rubber Content of Cryptostegia, Guayule, and
Miscellaneous Plants Investigated at the United States
Acclimatization Garden, Bard, California, 1923–1934.
United States Department of Agriculture, Sacramento,
California
Bonner J and Galston AW (1947) The physiology and bio-
chemistry of rubber formation in plants. Botanical Review
13: 543–596
Brown JH, Stevens GC and Kaufman DM (1996) The geo-
graphic range: size, shape, boundaries, and internal structure.
Annual Review of Ecology and Systematics 27: 597–623
Brown JR, Scanlan JC and McIvor JG (1998) Competition
by herbs as a limiting factor in shrub increase: a test with
different growth forms. Journal of Vegetation Science 9(6):
829–836
Bureau of Meteorology (1975) Climatic Averages Australia,
Australian Government Publishing Service, Canberra, 499 pp
Caltabiano G (1972) Rubber Vine (Cryptostegia grandiflora) in
North Queensland. Queensland Department of Lands,
Australia
Carter RN and Prince SD (1981) Epidemic models used to explain
biogeographical distribution limits. Nature 293: 644–645
Carter RN and Prince SD (1988) Distribution limits from a
demographic viewpoint. In: Davy AJ, Hutchings MJ and
Watkinson AR (eds) The 28th Symposium of the British
Ecological Society, Sussex. Blackwell Scientific Publications,
Oxford
Chippendale JF (1991) The potential economic returns to
research into rubber vine (Cryptostegia Grandiflora R. Br.)
in North Queensland. Unpublished Master of Agri-
cultural Studies Thesis, University of Queensland, Brisbane,
Australia
Climate Impact Group (1992) Climate Change Scenarios for
the Australian Region. CSIRO Division of Atmospheric
Research, Melbourne, Australia
Climate Impact Group (1996) Climate Change Scenarios for
the Australian Region. CSIRO Division of Atmospheric
Research, Melbourne, Australia
Cole K (1982) Late Quaternary zonation of vegetation in the
eastern Grand Canyon. Science 217: 1142–1145
163

CSIRO Division of Atmospheric Research (1988) Appendix:
climate change in Australia to the year 2030 AD. In:
Pearman GI (ed) Greenhouse: Planning for Climate Change,
pp 737–740. CSIRO Publishing, Melbourne, Australia
Curtis JT (1946) Some factors affecting fruit production by
Cryptostegia. American Journal of Botany 33: 763–769
Curtis JT and Blondeau R (1946) Influence of the time of day on
latex flow from Cryptostegia grandiflora. American Journal of
Botany 33: 264–270
Dale IJ (1980) Factors Affecting the Distribution of Rubber
Vine (Cryptostegia grandiflora R. Br.) in North Queensland,
Brisbane, Australia
Daubenmire RF (1974) Plants and Environment: a Textbook of
Plant Autecology. John Wiley & Sons Ltd., Sydney, Australia
Davis MB, Woods KD, Webb SL and Futyama RP (1986)
Dispersal versus climate: expansion of Fagus and Tsuga into
the upper Great Lakes Region. Vegetatio 67: 93–104
Farquhar GD (1997) Carbon dioxide and vegetation. Science
278: 1411
Fitzpatrick EA and Nix HA (1970) The climatic factor in
Australian grassland ecology. In: Moore RM (ed)
Australian Grasslands, pp 3–26. Australian National
University Press, Sydney, Australia
Grice AC (1996) Seed production, dispersal and germination in
Cryptostegia grandiflora and Ziziphus mauritiana, two inva-
sive shrubs in tropical woodlands of northern Australia.
Australian Journal of Ecology 21(3): 324–331
Grime JP (1979) Primary strategies in the established phase. In:
Grime JP (ed) Plant Strategies and Vegetation Processes, pp
7–55. John Wiley & Sons, Chichester, UK
Hengeveld R (1989) Dynamics of Biological Invasions.
Chapman and Hall, London, 160 pp
Hengeveld R (1990) Theories on species responses to variable
climates. In: Boer MM and De Groot RS (eds) Landscape-
Ecological Impact of Climate Change, Lunteren, The
Netherlands, pp 274–289. IOS Press, Amsterdam
Hoffmann JH and Moran VC (1998) The population dynamics
of an introduced tree, Sesbania punicea, in South Africa, in
response to long-term damage caused by different combina-
tions of three species of biological control agents. Oecologia
114: 343–348
Houghton JT, Meira Filho LG, Callender BA, Harris N,
Kattenberg A and Maskell K (1995) The Science of Climate
Change: Contribution of Working Group I to the Second
Assessment of the Intergovernmental Panel on Climate
Change. Cambridge University Press, Cambridge, UK,
572 pp
Hutchinson MF, Houlder D, Nix HA and McMahon P (n.d.)
ANUCLIM Version. Retrieved from http://cres.anu.
edu.au/software/anuclim.html in August 2002
Hynes R, Akers D, Csurhes S, Tomley A and Sparkes E (1992)
Fitzroy Catchment Symposium: Weed Invasion, Potential
Invasion and Integrated Control of Weeds in the Fitzroy
River Catchment Area. Land Protection Branch,
Queensland Department of Lands, Australia
Jenkins DW (1944) Cryptostegia as an Emergency Source of
Rubber. United States Board of Economic Warfare,
Washington, DC
Knight P (1944) Insects associated with the Palay rubber vine in
Haiti. Journal of Economic Entomology 37(1): 100–102
Kriticos DJ (1996) The role of modelling in weed management.
In: Shepherd RCH (ed) Proceedings of the Eleventh
Australian Weeds Conference, Monash University, pp 560–
569. Weed Science Society of Victoria, Melbourne,
Australia
Kriticos DJ and Randall RP (2001) A comparison of systems to
analyse potential weed distributions. In: Groves RH, Panetta
FD and Virtue JG (eds) Weed Risk Assessment, pp 61–79.
CSIRO Publishing, Melbourne, Australia
Larcher W (1975) Physiological Plant Ecology. Springer-Verlag,
Berlin
Mack RN, Simberloff D, Lonsdale WM, Evans H, Clout M and
Bazzaz FA (2000) Biotic invasions: causes, epidemiology,
global consequences, and control. Ecological Applications
10(3): 689–710
Mackey AP (1996) Rubber vine (Cryptostegia grandiflora) in
Queensland. Queensland Department of Natural Resources,
Brisbane, Australia
McFadyen RE and Harvey GJ (1990) Distribution and control
of rubber vine, Cryptostegia grandiflora, a major weed
in northern Queensland. Plant Protection Quarterly 5(4):
152–155
Moody ME and Mack RN (1988) Controlling the spread of
plant invasions: the importance of nascent foci. Journal of
Applied Ecology 25: 1009–1021
Morison JIL (1993) Response of plants to CO2 under water
limited conditions. Vegetatio 104/105: 193–209
New MG, Hulme M and Jones PD (1999) Representing 20th
century space–time climate variability. I: development of a
1961–1990 mean monthly terrestrial climatology. Journal of
Climate 12(3): 829–856
Parry M and Carter T (1998) Climate impact and adaptation
assessment: a guide to the IPCC Approach. Earthscan,
London
Parsons WT and Cuthbertson EG (1992) Noxious Weeds of
Australia. Inkata Press, Melbourne, Australia
Polhamus RG, Hill HH and Elder JA (1934) The Rubber
Content of Two Species of Cryptostegia and of an
Interspecific Hybrid in Florida. USDA, Washington, DC
Rastetter EB (1996) Validating models of ecosystem response to
global change. BioScience 46: 190–197
Roberts L (1989) How fast can trees migrate? Science 243:
735–737
Sen DN (1968) Ecology of desert plants and observations on
their seedlings. II. Germination of seeds in Asclepiadacea.€OOsterreichische Botanische Zeitschrift 115: 18–27
Siddiqui RH and Mathur ML (1946) Cryptostegia grandiflora:
suitability of the plant for composts and other purposes.
Indian Farming 7(9): 397–401
Stebbins GL (1957) Self-fertilisation and population variability
in the higher plants. American Naturalist 91: 337–354
Sutherst RW, Maywald GF, Yonow T and Stevens PM (1999)
CLIMEX. Predicting the Effects of Climate on Plants and
Animals. User Guide. CSIRO Publishing, Melbourne,
Australia, 88 pp
Symontowne R (1943) Notes on the Cryptostegia plant. Tropical
Agriculture 20: 195–197
Tomley AJ (1995) The biology of australian weeds 26.
Cryptostegia grandiflora R. Br. Plant Protection Quarterly
10(4): 122–130
164

van den Bosch F, Hengeveld R and Metz JAJ (1992) Analyzing
the velocity of range expansion. Journal of Biogeography 19:
135–150
White G (1997) Population ecology and biological control of
weeds. In: Julien M and White G (eds) Biological Control of
Weeds: Theory and Practical Application, pp 39–45.
Australian Centre for International Agricultural Research,
Canberra, Australia
Woodward FI (1987) Climate and Plant Distribution.
Cambridge University Press, Cambridge, UK, 174 pp
165