citibank europe plc (registered number
TRANSCRIPT
CITIBANK EUROPE PLC
(Registered Number: 132781)
ANNUAL REPORT AND FINANCIAL STATEMENTS
For the year ended 31 December 2011
CITIBANK EUROPE PLC
2
CONTENTS
REPORT OF THE DIRECTORS ................................................................................................................................... 4 Independent Auditor‟s Report to the Members of Citibank Europe plc ......................................................................... 9 INCOME STATEMENT .............................................................................................................................................. 11 STATEMENT OF OTHER COMPREHENSIVE INCOME ....................................................................................... 12 STATEMENT OF FINANCIAL POSITION ............................................................................................................... 13 STATEMENT OF CHANGES IN EQUITY ................................................................................................................ 14 STATEMENT OF CASH FLOWS .............................................................................................................................. 15 NOTES TO THE FINANCIAL STATEMENTS ......................................................................................................... 16
1. Principal accounting policies ........................................................................................................................... 16 2. Use of estimates and judgements ..................................................................................................................... 24 3. Net interest income .......................................................................................................................................... 25 4. Net fee and commission income ...................................................................................................................... 26 5. Net trading income .......................................................................................................................................... 26 6. Other operating income ................................................................................................................................... 26 7. Personnel expenses .......................................................................................................................................... 26 8. Other expenses................................................................................................................................................. 27 9. Directors‟ emoluments .................................................................................................................................... 27 10. Tax on profit on ordinary activities ................................................................................................................. 27 11. Cash and cash equivalents ............................................................................................................................... 28 12. Trading assets .................................................................................................................................................. 29 13. Financial instruments and risk management .................................................................................................... 29 14. Financial assets and liabilities ......................................................................................................................... 46 15. Investment securities ....................................................................................................................................... 50 16. Derivative financial instruments ...................................................................................................................... 50 17. Other liabilities ................................................................................................................................................ 51 18. Shares in subsidiary undertakings ................................................................................................................... 51 19. Property and equipment ................................................................................................................................... 52 20. Goodwill and Intangible assets ........................................................................................................................ 53 21. Non current assets – held for sale .................................................................................................................... 54 22. Deferred tax assets ........................................................................................................................................... 54 23. Called up share capital ..................................................................................................................................... 55 24. Share-based incentive plans ............................................................................................................................. 55 25. Contingent liabilities and commitments .......................................................................................................... 59 26. Operating lease commitments ......................................................................................................................... 60 27. Related party transactions ................................................................................................................................ 60 28. Reserves........................................................................................................................................................... 63 29. Parent companies ............................................................................................................................................. 63 30. Subsequent events ........................................................................................................................................... 63 31. Approval of financial statements ..................................................................................................................... 63

CITIBANK EUROPE PLC
3
BOARD OF DIRECTORS AND OTHER INFORMATION
DIRECTORS Francesco Vanni d'Archirafi - Chairman
Aidan Brady - Chief Executive Officer
Jim Farrell* - Independent Non-Executive
Mark Fitzgerald
Bo J. Hammerich - Non-Executive
Brian Hayes
Mary Lambkin* - Independent Non-Executive
Frank McCabe* - Independent Non-Executive
Terence O‟Leary - Non-Executive
Cecilia Ronan
Patrick Scally* - Non-Executive
Christopher Teano - Non-Executive
Tony Woods
COMPANY SECRETARY Deirdre Pepper
* Denotes Audit Committee Members
REGISTERED OFFICE 1 North Wall Quay, Dublin 1
SOLICITORS Matheson Ormsby Prentice
70 Sir John Rogersons Quay, Dublin 2
A&L Goodbody
International Financial Services Centre, North Wall Quay, Dublin 1
Arthur Cox Solicitors
Earlsfort Centre, Earlsfort Terrace, Dublin 2, Ireland
AUDITOR KPMG
Chartered Accountants
1 Harbourmaster Place, IFSC, Dublin 1
BANKERS Citibank NA, London Branch
Citigroup Centre, Canada Square,
Canary Wharf, London, E14 5LB
CITIBANK EUROPE PLC
4
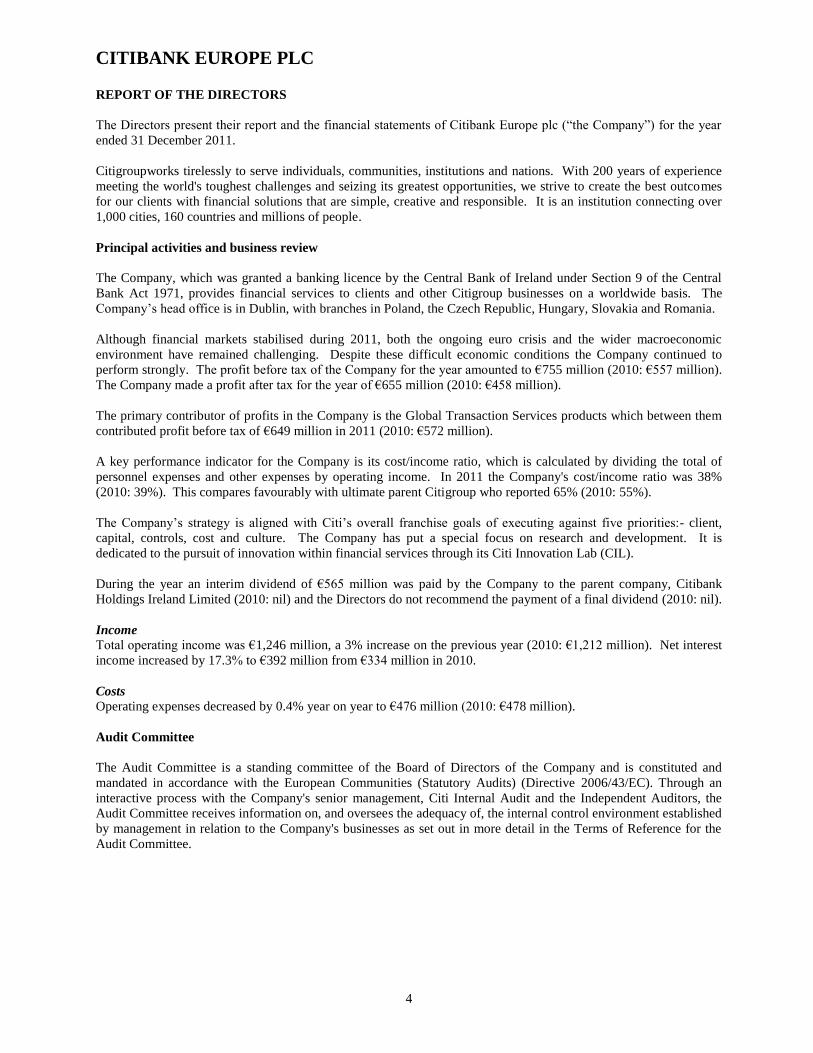
REPORT OF THE DIRECTORS
The Directors present their report and the financial statements of Citibank Europe plc (“the Company”) for the year
ended 31 December 2011.
Citigroupworks tirelessly to serve individuals, communities, institutions and nations. With 200 years of experience
meeting the world's toughest challenges and seizing its greatest opportunities, we strive to create the best outcomes
for our clients with financial solutions that are simple, creative and responsible. It is an institution connecting over
1,000 cities, 160 countries and millions of people.
Principal activities and business review
The Company, which was granted a banking licence by the Central Bank of Ireland under Section 9 of the Central
Bank Act 1971, provides financial services to clients and other Citigroup businesses on a worldwide basis. The
Company‟s head office is in Dublin, with branches in Poland, the Czech Republic, Hungary, Slovakia and Romania.
Although financial markets stabilised during 2011, both the ongoing euro crisis and the wider macroeconomic
environment have remained challenging. Despite these difficult economic conditions the Company continued to
perform strongly. The profit before tax of the Company for the year amounted to €755 million (2010: €557 million).
The Company made a profit after tax for the year of €655 million (2010: €458 million).
The primary contributor of profits in the Company is the Global Transaction Services products which between them
contributed profit before tax of €649 million in 2011 (2010: €572 million).
A key performance indicator for the Company is its cost/income ratio, which is calculated by dividing the total of
personnel expenses and other expenses by operating income. In 2011 the Company's cost/income ratio was 38%
(2010: 39%). This compares favourably with ultimate parent Citigroup who reported 65% (2010: 55%).
The Company‟s strategy is aligned with Citi‟s overall franchise goals of executing against five priorities:- client,
capital, controls, cost and culture. The Company has put a special focus on research and development. It is
dedicated to the pursuit of innovation within financial services through its Citi Innovation Lab (CIL).
During the year an interim dividend of €565 million was paid by the Company to the parent company, Citibank
Holdings Ireland Limited (2010: nil) and the Directors do not recommend the payment of a final dividend (2010: nil).
Income
Total operating income was €1,246 million, a 3% increase on the previous year (2010: €1,212 million). Net interest
income increased by 17.3% to €392 million from €334 million in 2010.
Costs
Operating expenses decreased by 0.4% year on year to €476 million (2010: €478 million).
Audit Committee
The Audit Committee is a standing committee of the Board of Directors of the Company and is constituted and
mandated in accordance with the European Communities (Statutory Audits) (Directive 2006/43/EC). Through an
interactive process with the Company's senior management, Citi Internal Audit and the Independent Auditors, the
Audit Committee receives information on, and oversees the adequacy of, the internal control environment established
by management in relation to the Company's businesses as set out in more detail in the Terms of Reference for the
Audit Committee.
CITIBANK EUROPE PLC
5
REPORT OF THE DIRECTORS (continued)
Corporate Governance Code for Credit Institutions and Insurance undertakings
The Company is subject to the Central Bank of Ireland‟s Corporate Governance Code for Credit Institutions and
Insurance undertakings (“the Code”). Having been classified by the Central Bank of Ireland as a major institution,
the Company is subject to the requirements in Appendix 1 of the Code (Annual Compliance Statement).
Regulatory capital requirements
The Company‟s lead regulator, the Central Bank of Ireland, sets and monitors capital requirements for the Company.
Please refer to note 13 for more detailed information. Further information on the Company‟s capital requirements
and risk management (“Pillar 3 Disclosures”) can be found in the other regulatory findings section at
www.citigroup.com/citi/fin.
Financial instruments
The financial risk management objectives and policies and the exposure to market risk, credit risk, and liquidity risk
of the Company and its subsidiary undertakings have been disclosed in note 13 about Financial instruments and risk
management.
Research & development
The Company is actively pursuing research and development (“R&D”) opportunities in all aspects of financial
services business and is a centre of excellence through its CIL for the development of innovative financial products
and solutions.
Overseas branches and subsidiaries
The Company operates branches in Poland, the Czech Republic, Hungary, Slovakia and Romania and has a
subsidiary in Hungary. The Company‟s branches contributed €143 million (2010: €105 million) to the profit before
tax.
Political donations
During the year the Company made no political donations (2010: nil).
Post balance sheet events
On 1st January 2012, to further enhance its Investor Services offering, the Company acquired the assets, liabilities
and business of group companies Citi Fund Services (Ireland), Limited and of Citi Hedge Fund Services (Ireland),
Limited by way of a scheme of arrangement pursuant to Sections 201 - 203 of the Companies Act 1963.
On 1st March 2012, the Company changed its functional accounting currency from Euro to US dollar to better align
its assets and liabilities.
CITIBANK EUROPE PLC
6
REPORT OF THE DIRECTORS (continued)
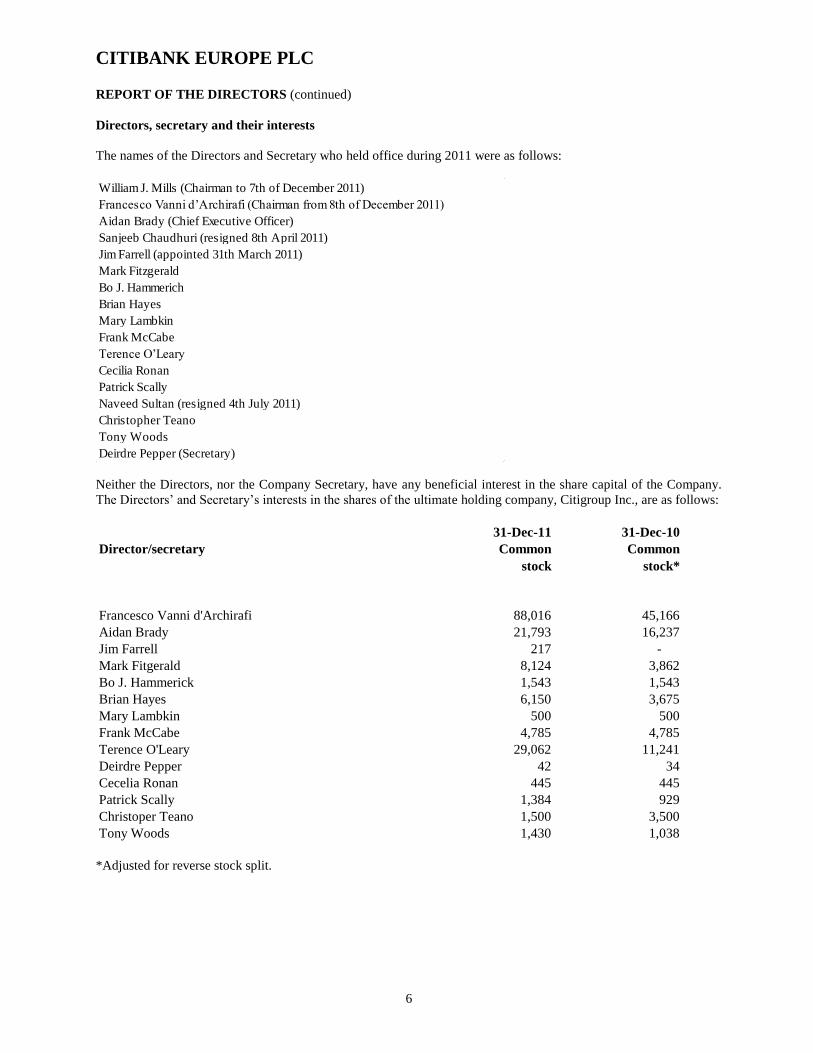
Directors, secretary and their interests
The names of the Directors and Secretary who held office during 2011 were as follows:
William J. Mills (Chairman to 7th of December 2011)
Francesco Vanni d‟Archirafi (Chairman from 8th of December 2011)
Aidan Brady (Chief Executive Officer)
Sanjeeb Chaudhuri (resigned 8th April 2011)
Jim Farrell (appointed 31th March 2011)
Mark Fitzgerald
Bo J. Hammerich
Brian Hayes
Mary Lambkin
Frank McCabe
Terence O‟Leary
Cecilia Ronan
Patrick Scally
Naveed Sultan (resigned 4th July 2011)
Christopher Teano
Tony Woods
Deirdre Pepper (Secretary)
Neither the Directors, nor the Company Secretary, have any beneficial interest in the share capital of the Company.
The Directors‟ and Secretary‟s interests in the shares of the ultimate holding company, Citigroup Inc., are as follows:
31-Dec-11 31-Dec-10
Director/secretary Common
stock
Common
stock*
Francesco Vanni d'Archirafi 88,016 45,166
Aidan Brady 21,793 16,237
Jim Farrell 217 -
Mark Fitgerald 8,124 3,862
Bo J. Hammerick 1,543 1,543
Brian Hayes 6,150 3,675
Mary Lambkin 500 500
Frank McCabe 4,785 4,785
Terence O'Leary 29,062 11,241
Deirdre Pepper 42 34
Cecelia Ronan 445 445
Patrick Scally 1,384 929
Christoper Teano 1,500 3,500
Tony Woods 1,430 1,038
*Adjusted for reverse stock split.
CITIBANK EUROPE PLC
7
REPORT OF THE DIRECTORS (continued)
Directors, secretary and their interests (continued)
The Company forms part of Citigroup Inc. (“the Group”). The Group operates a staff share option scheme and, in
addition to the interests disclosed above, certain Directors of the Company have options to acquire shares in the
ultimate parent holding company, Citigroup Inc. Full details are as follows:
Stock options over common stock of Citigroup Inc. (notes (a) and (b))
Director/secretary
at 31
December
2010*
Granted Exercised/
lapsed
at 31
December
2011
Exercise Price
US$
Francesco Vanni d'Archirafi 2,680 75,000 2,680 75,000 $49.1
Aidan Brady 14,400 - - 14,400 $40.8
Jim Farrell - - - - -
Mark Fitgerald 2,691 - - 2,691 $40.8 - $414.5
Bo J. Hammerick 1,543 - - 1,543 $40.8
Brian Hayes 8,059 - - 8,059 $40.8
Mary Lambkin - - - - -
Frank McCabe - - - - -
Terence O'Leary 7,358 - 1,971 5,387 $40.8 - $552
Deirdre Pepper 46 - - 46 $40.8
Cecelia Ronan 77 - - 77 $40.8 -$495.4
Patrick Scally 754 - - 754 $40.8
Christoper Teano 4,977 - - 4,977 $40.8 - $495
Tony Woods 4,172 - - 4,172 $40.8 - $495
During the year
Notes:
(a) Options outstanding, once vested, are exercisable at the discretion of the holders.
(b) Details of the Share Option Scheme are contained in the financial statements of Citigroup Inc. The
middle market price of Citigroup Inc. common stock at 31 December 2011 was US$26.54 (2010:
US$47.3*) and during the calendar year ended 31 December 2011, the closing price ranged from a low
of US$24.50 (2010: US$31.5*) to a high of US$51.44 (2010: US$49.7*).
*Adjusted for reverse stock split.
CITIBANK EUROPE PLC
8
REPORT OF THE DIRECTORS (continued)
Directors’ responsibilities for financial statements
The Directors are responsible for preparing the Directors‟ Report and financial statements in accordance with
applicable law and regulations.
Company law requires the Directors to prepare financial statements for each financial year. Under that law the
Directors have elected to prepare the company financial statements in accordance with International Financial
Reporting Standards (“IFRSs”) as adopted by the E.U.
The Company‟s financial statements are required by law and IFRSs as adopted by the E.U. to give a true and fair
view of the state of affairs of the Company and of its profit or loss for that period.
In preparing each of the financial statements, the Directors are required to:
select suitable accounting policies and then apply them consistently;
make judgements and estimates that are reasonable and prudent;
state whether they have been prepared in accordance with IFRSs as adopted by the E.U.; and
prepare the financial statements on the going concern basis unless it is inappropriate to presume that the
company will continue in business.
The Directors are responsible for keeping proper books of account that disclose with reasonable accuracy at any time
the financial position of the Company and enable them to ensure that the financial statements comply with the
Companies Acts, 1963 to 2009. They are also responsible for taking such steps as are reasonably open to them to
safeguard the assets of the company and to prevent and detect fraud and other irregularities.
The directors are also responsible for preparing a Directors‟ Report that complies with the requirements of the
Companies Acts, 1963 to 2009.
Accounting records The Directors believe that they have complied with the requirement of Section 202 of the Companies Act, 1990 with
regard to books of account by employing accounting personnel with appropriate expertise and by providing adequate
resources to the financial function. The books of account of the Company are maintained at 1 North Wall Quay,
Dublin 1.
Auditors In accordance with Section 160(2) of the Companies Act 1963, the auditors, KPMG, Chartered Accountants, will
continue in office. On behalf of the board: 22
nd March 2012
Aidan Brady Frank McCabe Mary Lambkin Deirdre Pepper Director Director Director Secretary
CITIBANK EUROPE PLC
9
Independent Auditor’s Report to the Members of Citibank Europe plc
We have audited the financial statements of Citibank Europe plc for the year ended 31 December 2011 which
comprise of the Income statement, Statement of other comprehensive income, Statement of financial position,
Statement of changes in equity, Statement of cash flows and the related notes. These financial statements have been
prepared under the accounting policies set out therein.
This report is made solely to the Company‟s members, as a body, in accordance with section 193 of the Companies
Act, 1990. Our audit work has been undertaken so that we might state to the Company‟s members those matters we
are required to state to them in an auditor‟s report and for no other purpose. To the fullest extent permitted by law,
we do not accept or assume responsibility to anyone other than the Company and the Company‟s members, as a
body, for our audit work, for this report, or for the opinions we have formed.
Respective responsibilities of Directors and independent auditors
The Directors‟ responsibilities for preparing the Directors‟ Report and the financial statements in accordance with
applicable law and International Financial Reporting Standards as adopted by the E.U. are set out in the Statement of
Directors‟ Responsibilities on page 8.
Our responsibility is to audit the financial statements in accordance with relevant legal and regulatory requirements
and International Standards on Auditing (UK and Ireland).
We report to you our opinion as to whether the financial statements give a true and fair view and have been properly
prepared in accordance with the Companies Acts 1963 to 2009. We also report to you whether, in our opinion:
proper books of account have been kept by the company; whether at the statement of financial position date, there
exists a financial situation requiring the convening of an extraordinary general meeting of the company; and whether
the information given in the Directors‟ Report is consistent with the financial statements. In addition, we state
whether we have obtained all the information and explanations necessary for the purposes of our audit, and whether
the company‟s financial statements are in agreement with the books of account.
We also report to you if, in our opinion, any information specified by law regarding directors‟ remuneration and
directors‟ transactions is not disclosed and, where practicable, include such information in our report.
We read the Directors‟ Report and consider implications for our report if we become aware of any apparent
misstatements within it.
Basis of audit opinion
We conducted our audit in accordance with International Standards on Auditing (UK and Ireland) issued by the
Auditing Practices Board. An audit includes examination, on a test basis, of evidence relevant to the amounts and
disclosures in the financial statements. It also includes an assessment of the significant estimates and judgements
made by the Directors in the preparation of the financial statements, and of whether the accounting policies are
appropriate to the Company‟s circumstances, consistently applied and adequately disclosed.
We planned and performed our audit so as to obtain all the information and explanations which we considered
necessary in order to provide us with sufficient evidence to give reasonable assurance that the financial statements
are free from material misstatement, whether caused by fraud or other irregularity or error. In forming our opinion
we also evaluated the overall adequacy of the presentation of information in the financial statements.
CITIBANK EUROPE PLC
10
Independent Auditor’s Report to the Members of Citibank Europe plc (continued)
Opinion
In our opinion:
the financial statements give a true and fair view, in accordance with International Financial Reporting Standards
of the state of the company‟s affairs as at 31 December 2011 and of its profit for the year then ended;
the financial statements have been properly prepared in accordance with the Companies Acts 1963 to 2009.
We have obtained all the information and explanations which we consider necessary for the purposes of our audit. In
our opinion proper books of account have been kept by the company. The financial statements are in agreement with
the books of account.
In our opinion the information given in the Directors‟ Report is consistent with the financial statements.
The net assets of the Company, as stated in the Company statement of financial position are more than half of the
amount of its called-up share capital and, in our opinion, on that basis there did not exist at 31 December 2011 a
financial situation which under Section 40 (1) of the Companies (Amendment) Act, 1983 would require the
convening of an extraordinary general meeting of the company.
Jonathan Lew
for and on behalf of
KPMG
Chartered Accountants, Statutory Audit firm,
22nd
March 2012
1 Harbourmaster Place
IFSC
Dublin 1

CITIBANK EUROPE PLC
11
INCOME STATEMENT
For the years ended 31 December 2011 and 31 December 2010
Note
2011
€ 000
2010
€ 000
Interest income 494,182 414,472
Interest expense (102,503) (80,631)
Net interest income 3 391,679 333,841
Net fee and commission income 4 779,193 772,683
Net trading income 5 65,780 89,699
Other operating income 6 9,688 15,759
Dividend income 111 431
Operating income 1,246,451 1,212,413
Net credit losses 13 (15,501) (79,990)
Personnel expenses 7 (199,390) (192,081)
Other expenses 8 (276,923) (285,546)
Impairment on goodwill 20 - (98,000)
Profit before income tax 754,637 556,796
Income tax expense 10 (99,579) (98,612)
Profit for the year 655,058 458,184
The current year profit arises solely from continuing operations.
The financial statements were approved by the Board of Directors on 22nd
March 2012 and signed on their behalf by:
Aidan Brady Frank McCabe Mary Lambkin Deirdre Pepper Director Director Director Secretary
CITIBANK EUROPE PLC
12
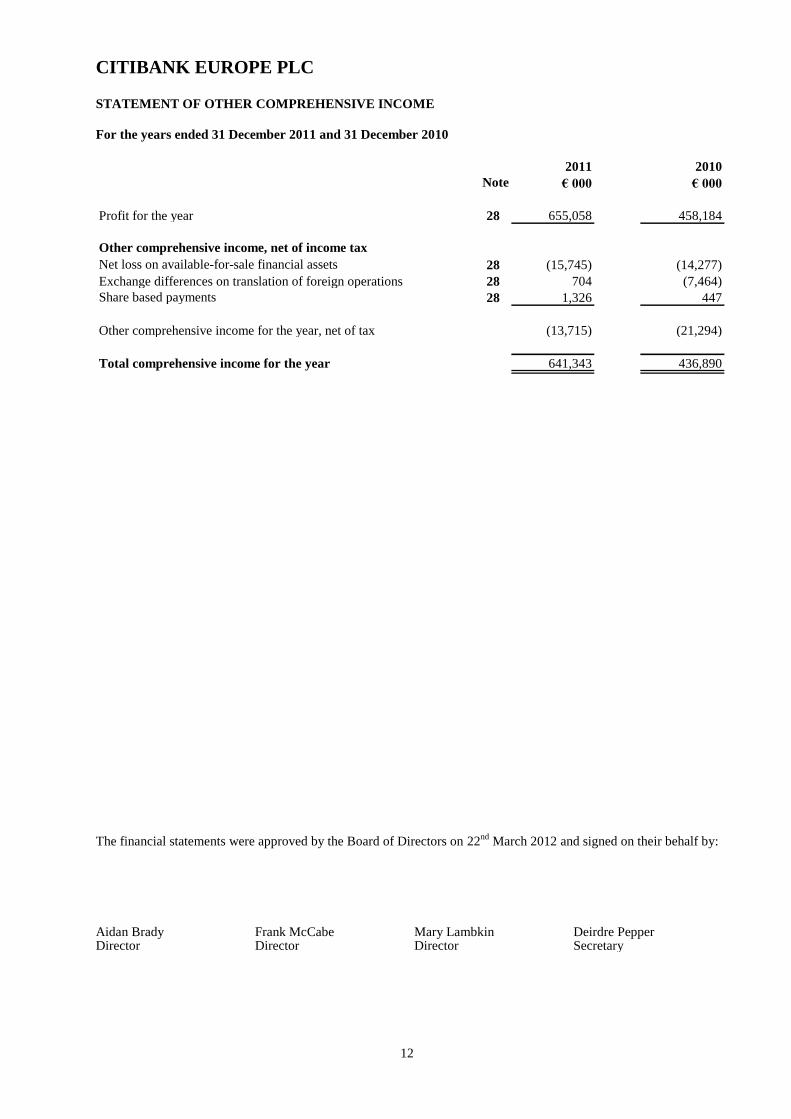
STATEMENT OF OTHER COMPREHENSIVE INCOME
For the years ended 31 December 2011 and 31 December 2010
Note
2011
€ 000
2010
€ 000
Profit for the year 28 655,058 458,184
Other comprehensive income, net of income tax
Net loss on available-for-sale financial assets 28 (15,745) (14,277)
Exchange differences on translation of foreign operations 28 704 (7,464)
Share based payments 28 1,326 447
Other comprehensive income for the year, net of tax (13,715) (21,294)
Total comprehensive income for the year 641,343 436,890
The financial statements were approved by the Board of Directors on 22nd
March 2012 and signed on their behalf by:
Aidan Brady Frank McCabe Mary Lambkin Deirdre Pepper Director Director Director Secretary

CITIBANK EUROPE PLC
13
STATEMENT OF FINANCIAL POSITION
As at 31 December 2011 and 31 December 2010
Note
2011
€ 000
2010
€ 000
Assets
Cash and balances at central bank 11 1,225,567 996,999
Trading assets 12,14 573,375 235,762
Derivative financial instruments 14,16 2,060,616 1,539,872
Loans and advances to banks 14 7,786,983 7,465,615
Loans and advances to customers 14 6,504,151 4,866,231
Investment securities 14,15 2,039,222 1,605,485
Shares in subsidiary undertakings 18 1,272 1,295
Property and equipment 19 21,572 26,193
Goodwill and intangible assets 20 219,213 206,806
Non current assets - held for sale 21 - 53,912
Current income tax 5,095 -
Deferred tax assets 22 11,324 10,453
Prepayments and accrued income 106,022 109,706
Other assets 14 384,839 230,677
Total assets 20,939,251 17,349,006
Liabilities
Deposits by banks 14 6,267,703 3,690,517
Customer accounts 14 6,651,448 6,592,415
Derivative financial instruments 14,16 2,139,233 1,583,466
Accruals and deferred income 136,704 140,010
Current income tax 5,175 2,617
Other liabilities 17 1,700,451 1,377,787
Total liabilities 16,900,714 13,386,812
Equity shareholders' funds
Share capital 23, 28 9,318 9,318
Share premium account 28 1,111,484 1,111,484
Capital reserves 28 279,538 279,538
Other reserves 28 (36,890) (23,174)
Retained earnings 28 2,675,087 2,585,028
Total equity attributable to equity holders 4,038,537 3,962,194
Total liabilities and equity shareholders' funds 20,939,251 17,349,006
The financial statements were approved by the Board of Directors on 22nd
March 2012 and signed on their
behalf by:
Aidan Brady Frank McCabe Mary Lambkin Deirdre Pepper Director Director Director Secretary
CITIBANK EUROPE PLC
14
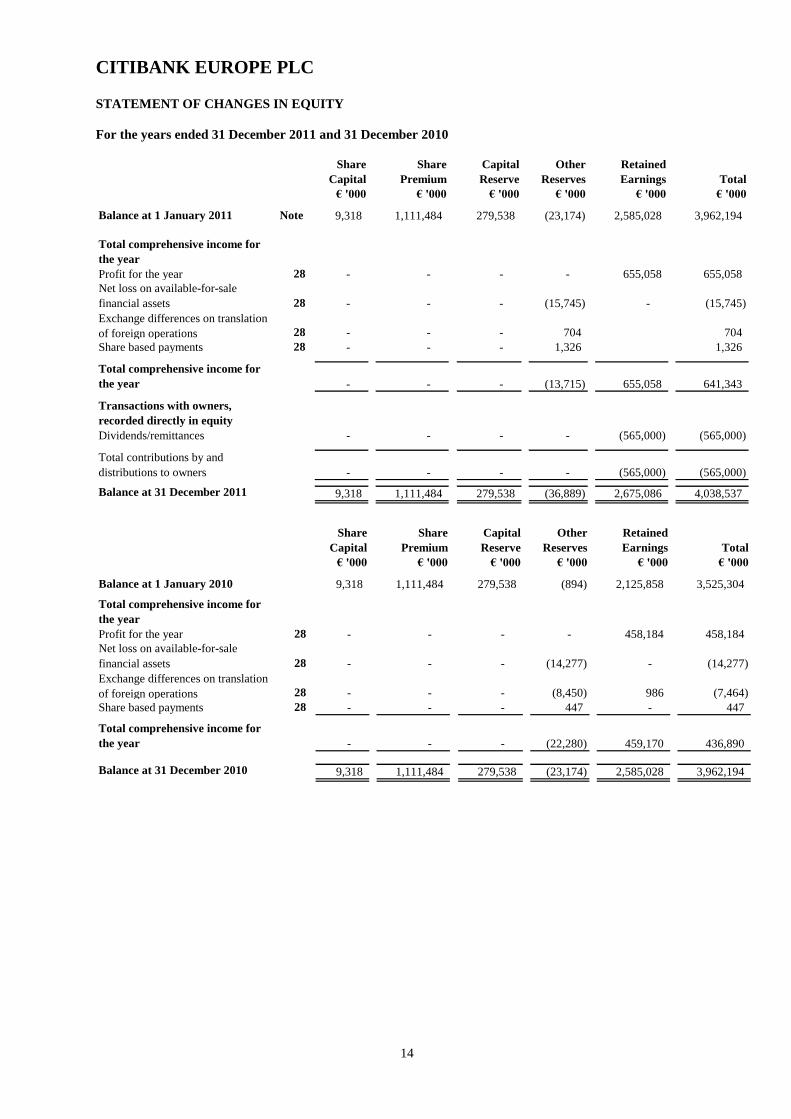
STATEMENT OF CHANGES IN EQUITY
For the years ended 31 December 2011 and 31 December 2010
Share
Capital
Share
Premium
Capital
Reserve
Other
Reserves
Retained
Earnings Total
€ '000 € '000 € '000 € '000 € '000 € '000
Balance at 1 January 2011 Note 9,318 1,111,484 279,538 (23,174) 2,585,028 3,962,194
Total comprehensive income for
the year
Profit for the year 28 - - - - 655,058 655,058
Net loss on available-for-sale
financial assets 28 - - - (15,745) - (15,745)
Exchange differences on translation
of foreign operations 28 - - - 704 704
Share based payments 28 - - - 1,326 1,326
Total comprehensive income for
the year - - - (13,715) 655,058 641,343
Transactions with owners,
recorded directly in equity
Dividends/remittances - - - - (565,000) (565,000)
Total contributions by and
distributions to owners - - - - (565,000) (565,000)
Balance at 31 December 2011 9,318 1,111,484 279,538 (36,889) 2,675,086 4,038,537
Share
Capital
Share
Premium
Capital
Reserve
Other
Reserves
Retained
Earnings Total
€ '000 € '000 € '000 € '000 € '000 € '000
Balance at 1 January 2010 9,318 1,111,484 279,538 (894) 2,125,858 3,525,304
Total comprehensive income for
the year
Profit for the year 28 - - - - 458,184 458,184
Net loss on available-for-sale
financial assets 28 - - - (14,277) - (14,277)
Exchange differences on translation
of foreign operations 28 - - - (8,450) 986 (7,464)
Share based payments 28 - - - 447 - 447
Total comprehensive income for
the year - - - (22,280) 459,170 436,890
Balance at 31 December 2010 9,318 1,111,484 279,538 (23,174) 2,585,028 3,962,194
CITIBANK EUROPE PLC
15
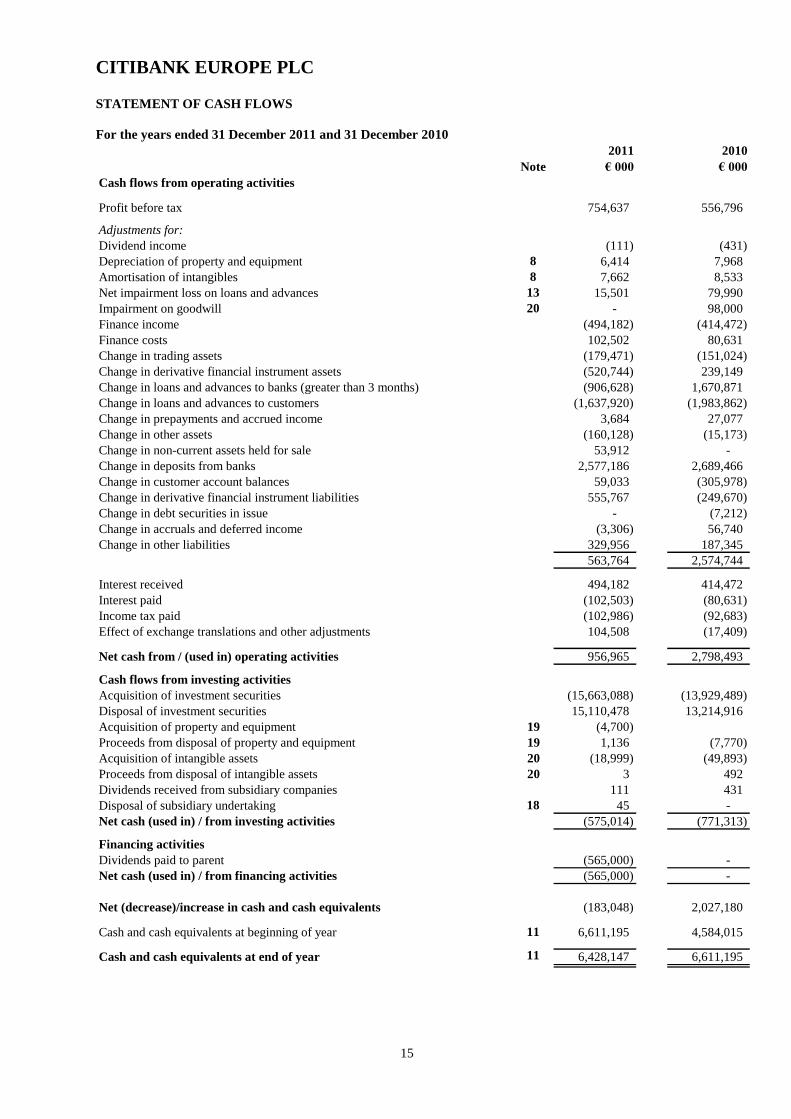
STATEMENT OF CASH FLOWS
For the years ended 31 December 2011 and 31 December 2010
Note
2011
€ 000
2010
€ 000
Cash flows from operating activities
Profit before tax 754,637 556,796
Adjustments for:
Dividend income (111) (431)
Depreciation of property and equipment 8 6,414 7,968
Amortisation of intangibles 8 7,662 8,533
Net impairment loss on loans and advances 13 15,501 79,990
Impairment on goodwill 20 - 98,000
Finance income (494,182) (414,472)
Finance costs 102,502 80,631
Change in trading assets (179,471) (151,024)
Change in derivative financial instrument assets (520,744) 239,149
Change in loans and advances to banks (greater than 3 months) (906,628) 1,670,871
Change in loans and advances to customers (1,637,920) (1,983,862)
Change in prepayments and accrued income 3,684 27,077
Change in other assets (160,128) (15,173)
Change in non-current assets held for sale 53,912 -
Change in deposits from banks 2,577,186 2,689,466
Change in customer account balances 59,033 (305,978)
Change in derivative financial instrument liabilities 555,767 (249,670)
Change in debt securities in issue - (7,212)
Change in accruals and deferred income (3,306) 56,740
Change in other liabilities 329,956 187,345
563,764 2,574,744
Interest received 494,182 414,472
Interest paid (102,503) (80,631)
Income tax paid (102,986) (92,683)
Effect of exchange translations and other adjustments 104,508 (17,409)
Net cash from / (used in) operating activities 956,965 2,798,493
Cash flows from investing activities
Acquisition of investment securities (15,663,088) (13,929,489)
Disposal of investment securities 15,110,478 13,214,916
Acquisition of property and equipment 19 (4,700)
Proceeds from disposal of property and equipment 19 1,136 (7,770)
Acquisition of intangible assets 20 (18,999) (49,893)
Proceeds from disposal of intangible assets 20 3 492
Dividends received from subsidiary companies 111 431
Disposal of subsidiary undertaking 18 45 -
Net cash (used in) / from investing activities (575,014) (771,313)
Financing activities
Dividends paid to parent (565,000) -
Net cash (used in) / from financing activities (565,000) -
Net (decrease)/increase in cash and cash equivalents (183,048) 2,027,180
Cash and cash equivalents at beginning of year 11 6,611,195 4,584,015
Cash and cash equivalents at end of year 11 6,428,147 6,611,195

CITIBANK EUROPE PLC
16
NOTES TO THE FINANCIAL STATEMENTS
1. Principal accounting policies
The accounting policies which have been applied are set out below:
a) Reporting entity
Citibank Europe Plc (the “Company”) is a company domiciled in Ireland. The address of the Company‟s
registered office is 1 North Wall Quay, Dublin 1. The Company is involved in the provision of banking
services on a worldwide basis.
b) Basis of presentation
The financial statements have been prepared in accordance with International Financial Reporting
Standards (IFRSs) as adopted by the E.U.
These financial statements are prepared on a going concern basis and have been prepared under the
historical cost convention as modified to include the fair value of certain financial instruments to the extent
required or permitted under the accounting standards and as set out in the relevant accounting policies.
The Company‟s single subsidiary undertaking has not been consolidated within the Company accounts as it
is not deemed material in accordance with European Communities (Credit Institutions : Account)
Regulations, S.I. No. 294/1992, Regulation 7, Part 2, Par. 2(2).
There are a number of accounting standards and interpretations that have been issued by the International
Accounting Standards Board (IASB), but which are not yet been adopted by the E.U. so are not effective
for the Company and Group financial statements, these include:
The first phase of IFRS 9 „Financial Instruments‟ covering the requirements for the classification
and measurement of financial assets is effective for annual periods beginning on or after 1
January 2015 with early adoption permitted. IFRS 9 does not require the restatement of
comparative-period financial statements for the initial application, but instead require modified
disclosures on the effect of transition. As the standard is subject to EU endorsement, the timing of
which is uncertain the Group is unable to provide a date by which it plans to apply the standard.
In addition, the IASB is in the process of considering limited improvements to the classification
and measurement model in IFRS 9 in an attempt to align closer with the US GAAP model. An
exposure draft is expected in the second half of 2012.
The second and third phases in the IASB‟s project to replace IAS 39 will address the impairment
of financial assets measured at amortised cost and hedge accounting. The original expected
completion date has been extended, with exposure drafts for the second and third phases expected
by the end of 2012. In addition, the IASB is working with the US Financial Accounting
Standards Board to reduce inconsistencies between US GAAP and IFRS in accounting for
financial instruments. The impact of IFRS 9 may change as a consequence of further
developments resulting from the IASB‟s project to replace IAS 39. As a result, it is impracticable
to quantify the impact of IFRS 9 at this time.
The Group is currently assessing the impact of the following standards due in 2013.
IFRS 10 „Consolidated Financial Statements‟ is effective for periods beginning after 1 January
2013. Under IFRS 10 there will be one approach for determining consolidation for all entities,
based on the concept of power, variability of returns and their linkage, replacing the current
approach which emphasis legal control or exposure to risks and rewards, depending on the nature
of the entity.
IFRS 11 „Joint Arrangements‟ is effective from 1 January 2013. IFRS 12 „Disclosures of interest
in other entities‟ is effective from 1 January 2013. In IFRS 11 more emphasis is placed on the
investors‟ rights and obligations than on structure of the arrangement, introducing the concept of
a joint operation.
CITIBANK EUROPE PLC
17
NOTES TO THE FINANCIAL STATEMENTS
1. Principal accounting policies (continued)
b) Basis of presentation (continued)
IFRS 12 „Disclosure of Interests in Other Entities‟ is effective for periods beginning after 1
January 2013. IFRS 12 includes the disclosure requirements for subsidiaries, joint arrangements
and associates, introducing new requirements for unconsolidated structured entities.
IFRS 13 „Fair Value Measurements‟ is effective for periods beginning after 1 January 2013.
IFRS 13 establishes a single source of guidance for all fair value measurements required or
permitted by IFRSs.
IAS 19 „Employee Benefits‟ revised. The revised standard is effective for periods beginning on
or after 1 January 2013.
The IASB issued amendments to IAS 32 „Offsetting Financial Assets and Financial Liabilities‟ in
December 2011. The revised standard clarifies the requirements for offsetting financial instruments and
addressed inconsistencies in current practice when applying the offsetting criteria in IAS32 „Financial
Instruments: Presentation‟ and is effective for periods beginning on or after 1 January 2014.
c) Functional and presentation currency
These financial statements are presented in Euro, which is the Company‟s functional currency. In some
cases as indicated, financial information presented in Euro has been rounded to the nearest thousand or
million as deemed appropriate.
d) Net interest income
Interest income and expense on financial assets and liabilities is recognised in the income statement using
the effective interest rate method. Under this method, fees and direct costs relating to loan origination, re-
financing or restructuring and to loan commitments are deferred and amortised to interest earned on loans
and advances over the life of the instrument. When calculating the effective interest rate, the Company
estimates future cashflows considering all contracted terms of the financial instrument, but no future credit
losses.
Interest income and expense presented in the income statement include:
Interest on financial assets and liabilities at amortised cost on an effective interest rate basis.
Interest on available-for-sale investment securities.
Interest on cash balances
e) Net fee and commission income
Fees and commission income and expenses that are integral to the effective interest rate on a financial asset
or liability are included in the measurement of the effective interest rate.
Other fees and commission income, including transaction processing fees, account servicing fees,
transaction processing fees, sales commission, placement fees and syndication fees, are recognised as the
related services are performed. Maintenance fees are applied to certain pre-paid card balances if the account
suffers an extended period of inactivity. These fees are recorded in fee income as they are earned. To the
extent that upfront fees are capitalised but subsequently there is a partial sell down of the related asset, the
fees are released to the income statement in proportion to the amount of the loan sold down.
Other fees and commission expense relate mainly to transaction and service fees, which are expensed as the
services are received.
f) Net trading income
Net trading income on items at fair value through profit and loss comprises all gains and losses related to
trading assets and liabilities and financial instruments designated at fair value through profit or loss, and
include all realised and unrealised fair value changes, together with related interest, dividends and foreign
exchange differences.
CITIBANK EUROPE PLC
18
NOTES TO THE FINANCIAL STATEMENTS
1. Principal accounting policies (continued)
g) Dividend income
Dividend income is recognised when the right to receive income is established.
h) Financial assets and liabilities
Recognition
The company initially recognises loans and advances and deposits on the date at which cashflow occurs.
All other financial assets and liabilities are initially recognised on the trade date at which the Company
becomes a party to the contractual provisions of the instrument.
Trading assets
The trading book of the Company consists of all positions in financial instruments and commodities held
either with trading intent or in order to hedge other elements of the trading book and which are free from
any restrictive covenants on their tradability or are able to be hedged. Positions held with trading intent are
those held intentionally for short-term resale and / or with the intention of benefiting from actual or
expected short-term price differences between buying and selling prices or from other price or interest rate
variations. The term „positions‟ shall include proprietary positions and positions arising from client
servicing and market making.
Trading intent is evidenced on the basis of the strategies, policies and procedures established by the
Company to manage the position or portfolio.
Loans and receivables and other assets
Loans and receivables and other assets are non-derivative financial assets with fixed or determinable
payments that are not quoted in an active market and that the Company does not intend to sell immediately
or in the near term. They comprise Loans and Advances to Banks, Loans and Advances to Customers and
Other Assets.
Loans and advances are initially recognised at fair value, which is the cash given to originate the loan, and
subsequently measured at amortised cost using the effective interest rate method, less any impairment
charges. Where substantially all the risk and rewards relating to amounts receivable under loan agreements
are transferred to another party, neither the amounts receivable under the loans nor the amounts payable to
the other party are recognised in the financial statements as assets and liabilities and only the excess of
interest received over interest paid is dealt with in the income statement.
Financial assets at fair value through the profit and loss
During 2010, the Company acquired a group of loans at fair value. At the same time, the Company entered
into interest rate swaps to manage the interest rate risk of the acquired loans. The loans have been
designated at fair value through the profit and loss in order to avoid any accounting mismatch between an
accrual basis loan and a fair valued derivative. Any mark-to-market gains or losses on the loans and the
swaps are taken directly to the income statement.
Other assets primarily comprise amounts receivable in relation to non pre-funded payments and are
measured at cost.
Derivative contracts
Derivatives are initially recognised at fair value on the date on which a derivative contract is entered into
and are subsequently re-measured at their fair value. Fair values are obtained from quoted market prices in
active markets and using valuation techniques, including discounted cash flow models and options pricing
models, as appropriate. All derivatives are carried as assets when fair value is positive and as liabilities
when fair value is negative. Changes in fair value are recognised in the income statement.
Derivatives may be embedded in another contractual arrangement (a “host contract”). The Company
accounts for embedded derivatives separately from the host contract when the host contract is not itself
carried at fair value through profit or loss, and the characteristics of the embedded derivative are not clearly
and closely related to the host contract. Separated embedded derivatives are accounted for depending on
CITIBANK EUROPE PLC
19
NOTES TO THE FINANCIAL STATEMENTS
1. Principal accounting policies (continued)
h) Financial assets and liabilities (continued)
their classification, and are presented in the statement of financial position together with the host contract.
In 2011 the Company had no embedded derivatives (2010: nil).
Investment securities
Investment securities are recognised on a trade date basis and are classified as available-for-sale.
Available-for-sale investment securities are those intended to be held for an indefinite period of time,
which may be sold in response to needs for liquidity or changes in interest rates, exchange rates or equity
prices. Available-for-sale investment securities are initially recognised at fair value and subsequently
measured at fair value with the changes in the fair value reported as a separate component of equity except
for impairment charges which are recognised directly in the income statement.
The translation of gains and losses on foreign currency debt securities is taken directly through the income
statement. When available-for-sale investment securities are sold or impaired the cumulative gain or loss
previously recognised in equity is transferred to the income statement and disclosed within net trading
income.
When the Company sells a financial asset and simultaneously enters into an agreement to repurchase the
asset (or a similar asset) at a fixed price on a future date, the arrangement is accounted for as a deposit, and
the underlying asset continues to be recognised in the Company‟s financial statement.
Financial liabilities
Deposits by banks, customer accounts, accruals and deferred income, investment securities in issue and
other liabilities are measured at amortised cost. Other liabilities are primarily made up of amounts payable
to both intercompany and third party organisations.
Offsetting
Financial assets and liabilities are offset and the net amount presented in the statement of financial position
when, and only when, the Company has a legal right to set off the recognised amounts and it intends either
to settle on a net basis, or to realise the asset and settle the liability simultanously. Income and expenses are
presented on a net basis only when permitted under IFRSs, or for gains and losses arising from a group of
similar transactions such as in the Company‟s trading activity.
i) Impairment of financial assets
The Company assesses at each statement of financial position date whether there is objective evidence that
a financial asset or a portfolio of financial assets is impaired. A financial asset or portfolio of financial
assets is impaired and impairment losses are incurred if, and only if, there is objective evidence of
impairment as a result of one or more loss events that occurred after the initial recognition of the asset prior
to the statement of financial position date (“a loss event”) and that loss event or events has had an impact
on the estimated future cash flows of the financial asset or the portfolio that can be reliably estimated.
Objective evidence that a financial asset or a portfolio is impaired includes observable data that comes to
the attention of the Company about the following loss events:
Significant financial difficulty of the issuer or obligor;
A breach of contract, such as a default or delinquency in interest or principal payments;
It becomes probable that the borrower will enter bankruptcy or other financial reorganisation;
The disappearance of an active market for that financial asset because of financial difficulties; or
Observable data indicating that there is a measurable decrease in the estimated future cash flows
from a portfolio of financial assets since the initial recognition of those assets, although the
decrease cannot yet be identified with the individual financial assets in the portfolio, including:
- adverse changes in the payment status of borrowers in the portfolio; and
- national or local economic conditions that correlate with defaults on the assets in the portfolio.
CITIBANK EUROPE PLC
20
NOTES TO THE FINANCIAL STATEMENTS
1. Principal accounting policies (continued)
i) Impairment of financial assets (continued)
The Company first assesses whether objective evidence of impairment exists individually for financial
assets that are individually significant and individually or collectively for financial assets that are not
individually significant. If the Company determines that no objective evidence of impairment exists for an
individually assessed financial asset, whether significant or not, it includes the asset in a group of financial
assets with similar credit risk characteristics and collectively assesses them for impairment. Financial
assets that are individually assessed for impairment and for which an impairment loss is or continues to be
recognised are not included in a collective assessment of impairment.
Impairment losses on available-for-sale investment securities are recognised by transferring the cumulative
loss that has been recognised directly in equity to income statement. The cumulative loss that is removed
from equity and recognised in income statement is the difference between the acquisition cost, net of any
principal repayment and amortisation, and the current fair value, less any impairment loss previously
recognised in the income statement. Changes in impairment provisions attributable to time value are
reflected as a component of interest income.
If, in a subsequent period, the fair value of an impaired available-for-sale investment security increases and
the increase can be objectively related to an event occurring after the impairment loss was recognised in
income statement, the impairment loss is reversed, with the amount of the reversal recognised in profit or
loss. However, any other subsequent recovery in the fair value of an impaired available-for-sale investment
security is recognised directly in equity.
For loans and advances the amount of impairment loss is measured as the difference between the asset's
carrying amount and the present value of estimated future cash flows considering collateral, discounted at
the asset's original effective interest rate. The amount of the loss is recognised using an allowance account
or offsetted against the loan balance and the amount of the loss is included in the income statement.
Following impairment, interest income is recognised using the original effective interest rate. The
Company discounts future cash flows for the purpose of measuring the impairment loss, using the original
effective interest rate, applied to the revised carrying amount.
When a loan is un-collectable, it is written off against the related provision for loan impairment. Such
loans are written off after all the necessary procedures have been completed and the amount of the loss has
been determined. Subsequent recoveries of amounts previously written off are recorded against net credit
losses in the income statement.
If, in a subsequent period, the amount of the impairment loss decreases and the decrease can be related
objectively to an event occurring after the impairment was recognised, the previously recognised
impairment loss is reversed by adjusting the allowance account. The amount of the reversal is recognised
against net credit losses in the income statement.
j) De-recognition of financial assets and liabilities
Financial assets are derecognised when the right to receive cash flow from assets has expired or the
Company has transferred substantially all the risks and rewards of ownership. Financial liabilities are
derecognised when they are extinguished, that is, when the obligation is discharged, cancelled or expires.
CITIBANK EUROPE PLC
21
NOTES TO THE FINANCIAL STATEMENTS
1. Principal accounting policies (continued)
k) Property and equipment
Items of property and equipment are stated at cost, less accumulated depreciation and impairment losses
(see below). Depreciation is provided to write off the cost, less the estimated residual value of each asset,
on a straight-line basis over their estimated useful lives. Estimated useful lives of vehicles, furniture and
equipment are between one and seven years.
Subsequent costs are included in the asset‟s carrying amount or recognised as a separate asset, as
appropriate, only when it is probable that future economic benefits associated with the item will flow to the
Company and the cost of the item can be measured reliably. All other repairs and maintenance are charged
to the income statement during the financial period in which they are incurred.
l) Goodwill and intangible assets
(i) Goodwill
Acquired goodwill represents the excess of the cost of an acquisition over the net fair value of the
Company„s share of the net identifiable assets, liabilities and contingent liabilities of the acquired
undertaking at the date of acquisition. Gains and losses on the disposal of an entity include the carrying
amount of goodwill relating to the entity sold. Goodwill is stated at cost less any accumulated impairment
losses. Goodwill with an indefinite life is tested for impairment at least annually.
(ii) Other intangible assets
Expenditure on internally developed software is recognised as an asset when the Company is able to
demonstrate its intention and ability to complete the development and use the software in a manner that will
generate future economic benefits, and can reliably measure the costs to complete the development. The
capitalised cost of internally developed software includes all internal and external costs directly attributable
to developing the software and are amortised over its useful life.
Amortisation is charged to the income statement using the methods that best reflect the economic benefits
over their estimated useful economic lives. The estimated useful life of software is three to seven years.
Amortisation methods, useful lives and residual values are reviewed at each financial year end and adjusted
if appropriate.
m) Impairment of non-financial assets
At each reporting date, the Company assesses whether there is any indication that its goodwill and
intangible assets or property and equipment are impaired. These non-financial assets are tested for
impairment annually or more frequently if events or changes in circumstance indicate that it might be
impaired. Goodwill is allocated to cash-generating units for the purpose of impairment testing. Impairment
losses in respect of goodwill are not reversed. Impairment losses are recognised in the income statement.
Note 2 provides additional details of estimates and judgements related to impairment on non-financial
assets.
n) Income taxes
Income tax payable on profits is recognised as an expense based on the applicable tax laws in each
jurisdiction in the period in which profits arise. The tax effects of income tax losses available for carry-
forward are recognised as a deferred tax asset if it is probable that future taxable profit will be available
against which the losses can be utilised.
Deferred tax assets and liabilities are recognised for taxable and deductible temporary differences between
the tax base of assets and liabilities and their carrying amounts in the financial statements. Deferred tax
assets are recognised to the extent that it is probable that there will be suitable profits available against
which these differences can be utilised. Deferred tax assets and liabilities are measured at the tax rates that
are expected to apply in the period in which the asset will be realised or the liability will be settled based on
tax rates that are enacted or substantively enacted at the statement of financial position date.
CITIBANK EUROPE PLC
22
NOTES TO THE FINANCIAL STATEMENTS
1. Principal accounting policies (continued)
n) Income taxes (continued)
Deferred tax assets are reviewed at each reporting date and are reduced to the extent that it is no longer
probable that the related tax benefit will be realised. Current and deferred taxes are recognised as income
tax benefit or expense in the income statement.
o) Foreign currencies
Transactions in foreign currencies are translated to Euro at exchange rates at the date of the transactions.
Monetary assets and liabilities denominated in foreign currencies at the reporting date are retranslated to
Euro at the exchange rate at that date. The foreign currency gain or loss on monetary items is the difference
between amortised cost in the functional currency of each branch at the beginning of the period, adjusted
for effective interest and payments during the period, and the amortised cost in foreign currency of each
branch translated at the exchange rate at the end of the period. Non-monetary assets and liabilities
denominated in foreign currencies that are measured at fair value are retranslated to the functional currency
at the exchange rate at the date that the fair value was determined. Foreign currency differences arising on
retranslation are recognised in the income statement.
The assets and liabilities of overseas branches are translated into the Company‟s presentation currency at
the rate of exchange as at the statement of financial position date, and their income statements are
translated at the weighted average exchange rates for the year. Exchange differences arising on translation
are taken directly to a separate component of equity.
p) Employee benefits
Defined contribution plans
The Company operates a number of defined contribution pension schemes. The Company‟s annual
contributions are charged to the income statement in the period to which they relate. The pension scheme‟s
assets are held in separate trustee administered funds.
Short term benefits
Short-term employee benefit obligations are measured on an undiscounted basis and are expensed as the
related service is provided. A provision is recognised for the amount expected to be paid under short-term
cash bonus if the Company has a present legal or constructive obligation to pay this amount as a result of
past service provided by the employee and the obligation can be estimated reliably.
Termination benefits
Termination benefits are recognised as an expense when the Company is demonstrably committed, without
realistic possibility of withdrawal, to a formal detailed plan to either terminate employment before the
normal retirement date, or to provide termination benefits as a result of the offer made to encourage
voluntary redundancy. Termination benefits for voluntary redundancies are recognised if the Company has
made an offer of voluntary redundancy, it is probable that the offer will be accepted, and the number of
acceptances can be estimated reliably.
CITIBANK EUROPE PLC
23
NOTES TO THE FINANCIAL STATEMENTS
1. Principal accounting policies (continued)
q) Share based incentive plans
The Company participates in a number of Citigroup Inc. (“Citigroup”) share-based incentive plans under
which Citigroup grants shares to the Company‟s employees. Pursuant to a separate Stock Plans Affiliate
Participation Agreement (“SPAPA”) the Company makes a cash settlement to Citigroup for the fair value
of the share-based incentive awards delivered to the Company‟s employees under these plans.
The Company recognises the fair value of the awards at the grant date as compensation expense over the
vesting period with a corresponding credit in equity as a capital contribution from Citigroup. All amounts
paid to Citigroup. and the associated obligation under the SPAPA are recognised in equity over the vesting
period. Subsequent changes in the fair value of all unexercised awards and the SPAPA are reviewed
annually and any changes in value are recognised in equity, again over the vesting period.
r) Accounting for government grants
Grants are credited to the income statement to offset the matching expenditure. Where grants are repayable,
should the Company cease to meet certain conditions over a defined period, such amounts are credited to
the income statement account on a straight-line basis over that period.
s) Accounting for business combinations
Goodwill represents the excess of the cost of the acquisition over the Company‟s interest in the recognised
amount (generally fair value) of the identifiable assets, liabilities and contingent liabilities of the acquiree.
t) Cash and cash equivalents
For the purposes of the cash flow statement, cash and cash equivalents comprise balances with original
maturity of less than three months, including: cash and non-restricted balances with central banks, treasury
bills and other eligible bills, loans and advances to banks, loans and advances to customers and short-term
trading assets.
u) Provisions
Provisions are recognised when it is probable that an outflow of economic resources will be required to
settle a current legal or constructive obligation as a result of past events, and a reliable estimate can be
made of the amount of the obligation.
v) Operating leases
Rentals payable under operating leases are charged to the income statement on a straight-line basis over the
lease term and are included within “Other expenses”.
w) Subsidiary undertakings
Shares in subsidiary undertakings, comprising unlisted securities, are shown at cost less allowance for
impairment.
CITIBANK EUROPE PLC
24
NOTES TO THE FINANCIAL STATEMENTS
2. Use of estimates and judgements
The results of the Company are sensitive to the accounting policies, assumptions and estimates that
underlie the preparation of its financial statements. The accounting policies used in the preparation of the
financial statements are described in detail above.
The preparation of financial statements requires management to make judgements, estimates and
assumptions that affect the application of accounting policies and the reported amounts of assets, liabilities,
income and expenses. Actual results may differ from these estimates.
Estimates and underlying assumptions are reviewed on an ongoing basis. Revisions to accounting
estimates are recognised in the period in which the estimate is revised and in any future periods affected.
When preparing the financial statements, it is the Directors‟ responsibility under Irish company law to
select suitable accounting policies and to make judgments and estimates that are reasonable and prudent.
The accounting policies that are deemed critical to the Company‟s IFRSs results and financial position, in
terms of the materiality of the items to which the policy is applied, or which involve a high degree of
judgment or estimation are:
Impairment of loans
The Company‟s accounting policy for losses in relation to the impairment of customer loans and advances
is described in Note 1(i). In determining whether an impairment loss should be recorded in the income
statement, the Company makes judgements as to whether there is any observable data indicating that there
is a measurable decrease in the estimated future cash flows from individually significant loans or from a
loan portfolio. Management uses estimates based on historical loss experience for assets with credit risk
characteristics and objective evidence of impairment similar to those in the portfolio when estimating its
future cash flows.
Impairment testing of goodwill
Management used judgement in determining whether there was an impairment loss on goodwill recognised
as part of the Czech branch conversion on 1 January 2008. A value in use calculation is used to determine
if any impairment of the assets and liabilities of the Czech branch had occurred.
The carry value brought forward to 2011 was €182mm (€280mm as originally calculated less €98mm
impairment charge 2010). In the current year, the value in use calculation did not give rise to an
impairment of the assets and liabilities of the Czech branch (2010: €98mm).
The value in use calculation was based on forecasted EBIT for the next three years and financial
projections based on macroeconomic indicators and future business strategies were extrapolated out to a
total of 15 years. The forecasted EBIT growth used in the current year was 3% (2010: 5%). The value in
use calculation of discounted cash flows resulted in higher net present value of discounted cashflows than
the carrying amount of goodwill, thus giving rise to no impairment losses (2010: €98mm) being recognised
during 2011. The current year discount rate was 13.35% (2010: 12.37%). Note 20 further discusses
"Impairment testing on goodwill".
There was no reduction in the value of goodwill from prior year primarily driven by a better current base
year in 2011 than in 2010 with increased revenues and lower Cost of Credit charges.
The key assumptions described above may change as economic and market conditions change.
Valuation of intangible assets
Management may be required to use estimates on the valuation of certain material intangible assets and
may use external professional advice to assist with this process. Note 20 further discusses "Valuation of
intangible assets".
CITIBANK EUROPE PLC
25
NOTES TO THE FINANCIAL STATEMENTS
2. Use of estimates and judgements (continued)
Valuation of financial instruments
The Company‟s accounting policy for valuation of financial instruments is included in Note 1(h). The fair
values of financial instruments that are not quoted in active markets are determined by using valuation
techniques. To the extent practical, models use only observable data, where this is not possible
management may be required to make estimates. Note 14 further outlines the valuation of financial
instruments.
Share-based incentive plans
The Company participates in a number of Citigroup share-based incentive plans. Awards granted through
Citigroup's Stock Option Program are measured by applying an option pricing model, taking into account
the terms and conditions of the program. Analysis of past exercise behaviour, Citigroup's dividend history
and historical volatility are inputs to the valuation model. Note 24 further discusses “Share-based incentive
plans”.
Deferred tax assets
A deferred tax asset is recognised to the extent that it is probable that suitable future taxable profits will be
available against which deductible temporary differences can be utilised. The recognition of a deferred tax
asset relies on management‟s judgements surrounding the probability and sufficiency of suitable future
taxable profits, future reversals of existing taxable temporary differences and planning strategies. Note 12
further discusses "Deferred tax assets".
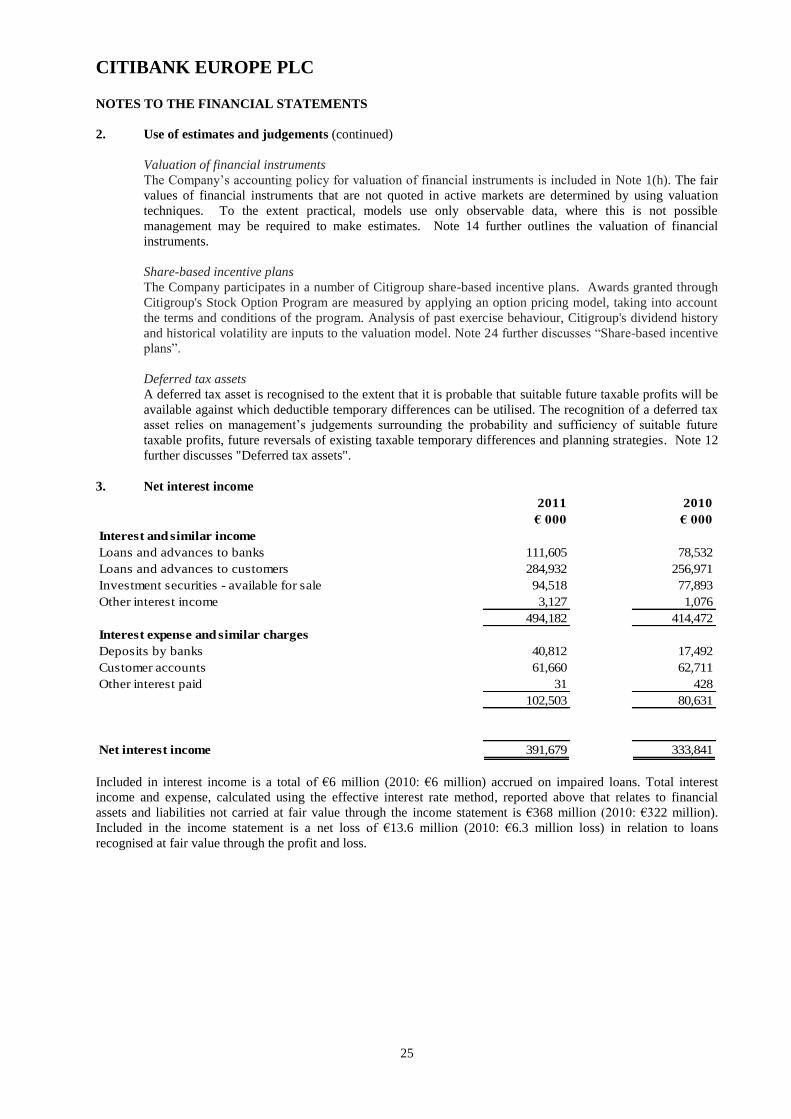
3. Net interest income
2011
€ 000
2010
€ 000
Interest and similar income
Loans and advances to banks 111,605 78,532
Loans and advances to customers 284,932 256,971
Investment securities - available for sale 94,518 77,893
Other interest income 3,127 1,076
494,182 414,472
Interest expense and similar charges
Deposits by banks 40,812 17,492
Customer accounts 61,660 62,711
Other interest paid 31 428
102,503 80,631
Net interest income 391,679 333,841
Included in interest income is a total of €6 million (2010: €6 million) accrued on impaired loans. Total interest
income and expense, calculated using the effective interest rate method, reported above that relates to financial
assets and liabilities not carried at fair value through the income statement is €368 million (2010: €322 million).
Included in the income statement is a net loss of €13.6 million (2010: €6.3 million loss) in relation to loans
recognised at fair value through the profit and loss.
CITIBANK EUROPE PLC
26
NOTES TO THE FINANCIAL STATEMENTS
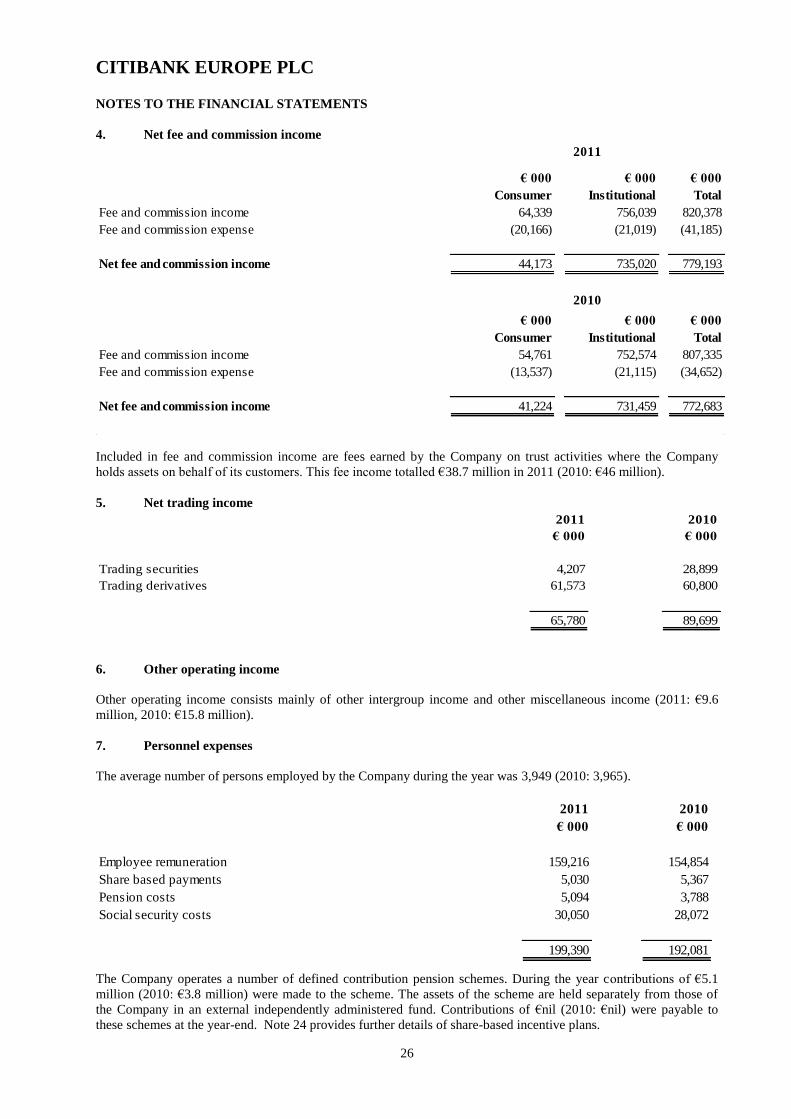
4. Net fee and commission income
€ 000 € 000 € 000
Consumer Institutional Total
Fee and commission income 64,339 756,039 820,378
Fee and commission expense (20,166) (21,019) (41,185)
Net fee and commission income 44,173 735,020 779,193
€ 000 € 000 € 000
Consumer Institutional Total
Fee and commission income 54,761 752,574 807,335
Fee and commission expense (13,537) (21,115) (34,652)
Net fee and commission income 41,224 731,459 772,683
2011
2010
Included in fee and commission income are fees earned by the Company on trust activities where the Company
holds assets on behalf of its customers. This fee income totalled €38.7 million in 2011 (2010: €46 million).
5. Net trading income
2011
€ 000
2010
€ 000
Trading securities 4,207 28,899
Trading derivatives 61,573 60,800
65,780 89,699
6. Other operating income
Other operating income consists mainly of other intergroup income and other miscellaneous income (2011: €9.6
million, 2010: €15.8 million).
7. Personnel expenses
The average number of persons employed by the Company during the year was 3,949 (2010: 3,965).
2011
€ 000
2010
€ 000
Employee remuneration 159,216 154,854
Share based payments 5,030 5,367
Pension costs 5,094 3,788
Social security costs 30,050 28,072
199,390 192,081
The Company operates a number of defined contribution pension schemes. During the year contributions of €5.1
million (2010: €3.8 million) were made to the scheme. The assets of the scheme are held separately from those of
the Company in an external independently administered fund. Contributions of €nil (2010: €nil) were payable to
these schemes at the year-end. Note 24 provides further details of share-based incentive plans.
CITIBANK EUROPE PLC
27
NOTES TO THE FINANCIAL STATEMENTS
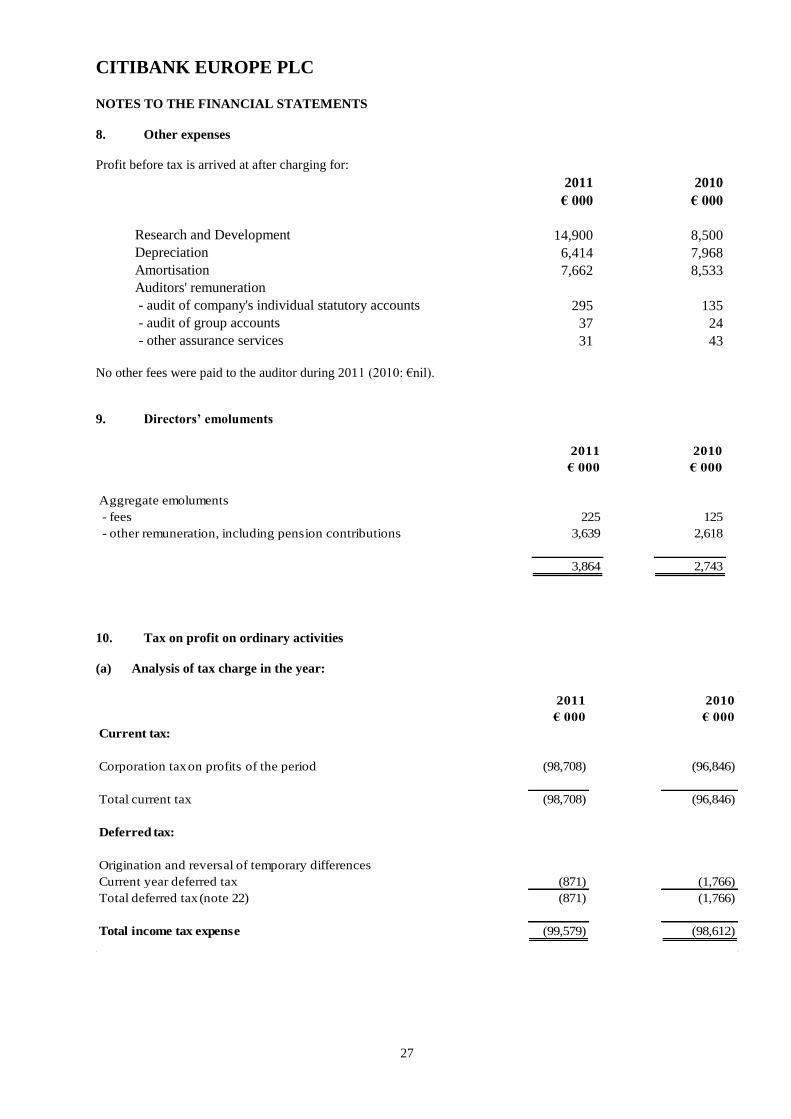
8. Other expenses
Profit before tax is arrived at after charging for:
2011
€ 000
2010
€ 000
Research and Development 14,900 8,500
Depreciation 6,414 7,968
Amortisation 7,662 8,533
Auditors' remuneration
- audit of company's individual statutory accounts 295 135
- audit of group accounts 37 24
- other assurance services 31 43
No other fees were paid to the auditor during 2011 (2010: €nil).
9. Directors’ emoluments
2011
€ 000
2010
€ 000
Aggregate emoluments
- fees 225 125
- other remuneration, including pension contributions 3,639 2,618
3,864 2,743
10. Tax on profit on ordinary activities
(a) Analysis of tax charge in the year:
2011
€ 000
2010
€ 000
Current tax:
Corporation tax on profits of the period (98,708) (96,846)
Total current tax (98,708) (96,846)
Deferred tax:
Origination and reversal of temporary differences
Current year deferred tax (871) (1,766)
Total deferred tax (note 22) (871) (1,766)
Total income tax expense (99,579) (98,612)
CITIBANK EUROPE PLC
28
NOTES TO THE FINANCIAL STATEMENTS
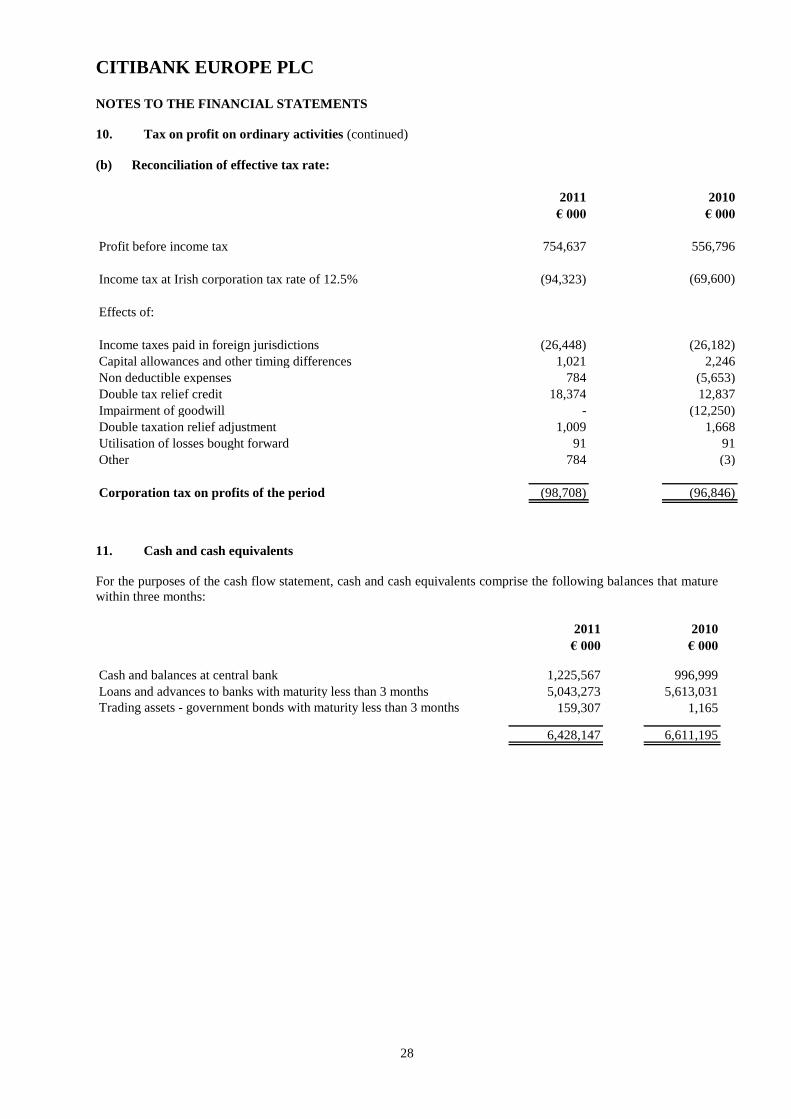
10. Tax on profit on ordinary activities (continued)
(b) Reconciliation of effective tax rate:
2011
€ 000
2010
€ 000
Profit before income tax 754,637 556,796
Income tax at Irish corporation tax rate of 12.5% (94,323) (69,600)
Effects of:
Income taxes paid in foreign jurisdictions (26,448) (26,182)
Capital allowances and other timing differences 1,021 2,246
Non deductible expenses 784 (5,653)
Double tax relief credit 18,374 12,837
Impairment of goodwill - (12,250)
Double taxation relief adjustment 1,009 1,668
Utilisation of losses bought forward 91 91
Other 784 (3)
Corporation tax on profits of the period (98,708) (96,846)
11. Cash and cash equivalents
For the purposes of the cash flow statement, cash and cash equivalents comprise the following balances that mature
within three months:
2011
€ 000
2010
€ 000
Cash and balances at central bank 1,225,567 996,999
Loans and advances to banks with maturity less than 3 months 5,043,273 5,613,031
Trading assets - government bonds with maturity less than 3 months 159,307 1,165
6,428,147 6,611,195
CITIBANK EUROPE PLC
29
NOTES TO THE FINANCIAL STATEMENTS
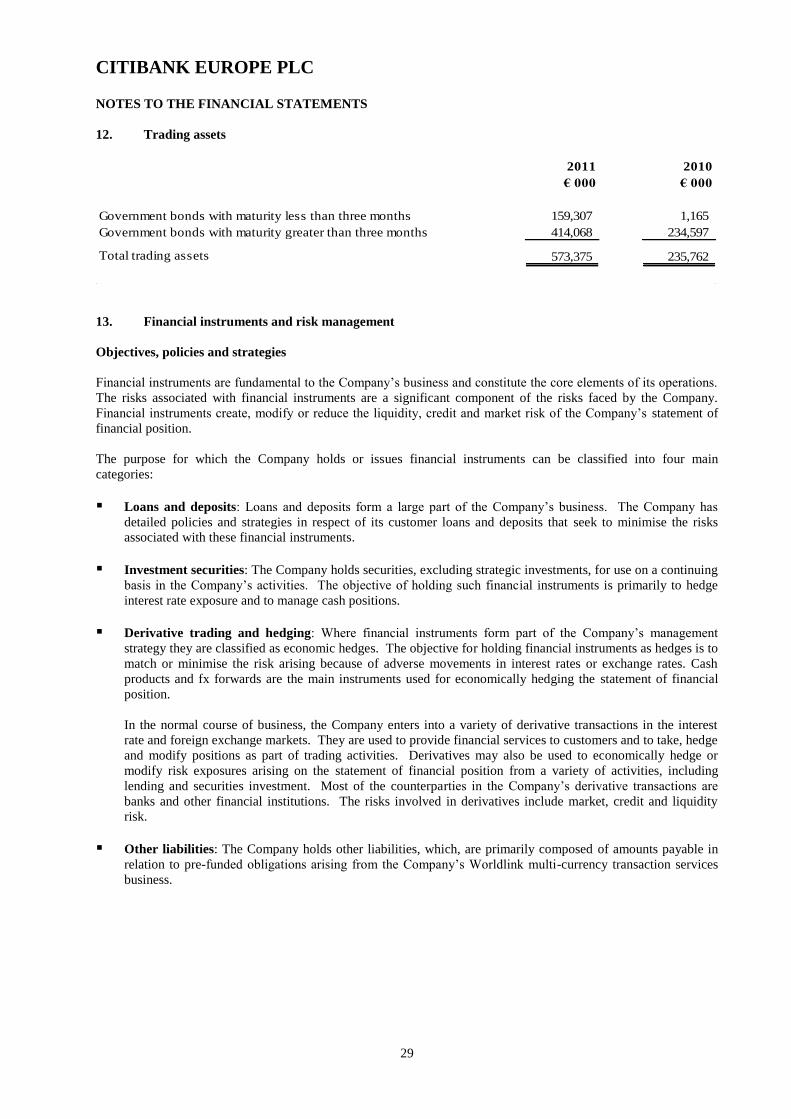
12. Trading assets
2011
€ 000
2010
€ 000
Government bonds with maturity less than three months 159,307 1,165
Government bonds with maturity greater than three months 414,068 234,597
Total trading assets 573,375 235,762
13. Financial instruments and risk management
Objectives, policies and strategies
Financial instruments are fundamental to the Company‟s business and constitute the core elements of its operations.
The risks associated with financial instruments are a significant component of the risks faced by the Company.
Financial instruments create, modify or reduce the liquidity, credit and market risk of the Company‟s statement of
financial position.
The purpose for which the Company holds or issues financial instruments can be classified into four main
categories:
Loans and deposits: Loans and deposits form a large part of the Company‟s business. The Company has
detailed policies and strategies in respect of its customer loans and deposits that seek to minimise the risks
associated with these financial instruments.
Investment securities: The Company holds securities, excluding strategic investments, for use on a continuing
basis in the Company‟s activities. The objective of holding such financial instruments is primarily to hedge
interest rate exposure and to manage cash positions.
Derivative trading and hedging: Where financial instruments form part of the Company‟s management
strategy they are classified as economic hedges. The objective for holding financial instruments as hedges is to
match or minimise the risk arising because of adverse movements in interest rates or exchange rates. Cash
products and fx forwards are the main instruments used for economically hedging the statement of financial
position.
In the normal course of business, the Company enters into a variety of derivative transactions in the interest
rate and foreign exchange markets. They are used to provide financial services to customers and to take, hedge
and modify positions as part of trading activities. Derivatives may also be used to economically hedge or
modify risk exposures arising on the statement of financial position from a variety of activities, including
lending and securities investment. Most of the counterparties in the Company‟s derivative transactions are
banks and other financial institutions. The risks involved in derivatives include market, credit and liquidity
risk.
Other liabilities: The Company holds other liabilities, which, are primarily composed of amounts payable in
relation to pre-funded obligations arising from the Company‟s Worldlink multi-currency transaction services
business.

CITIBANK EUROPE PLC
30
NOTES TO THE FINANCIAL STATEMENTS
13. Financial instruments and risk management (continued)
Risk management
Each of the major business groups within Citigroup has a Business Chief Risk Officer who is the focal point for risk
decisions (such as setting risk limits or approving transactions) in the business.
There are also Regional Chief Risk Officers accountable for the risks in their geographic area and also the primary
risk contact for the regional business heads and local regulators. In addition, the position of Product Chief Risk
Officer was created for those areas of critical importance to Citigroup such as real estate, structured credit products
and fundamental credit. The Product Risk Officers are accountable for the risks within their specialty. The Product
Risk Officers serve as a resource to the Chief Risk Officer, as well as to the Business and Regional Chief Risk
Officers.
In addition to changing the risk management organisation to facilitate the management of risk across these three
dimensions, the Citigroup risk organisation also includes the Business Management team to ensure that the risk
organisation has the appropriate infrastructure, processes and management reporting. This team which supports risk
management within the Company includes:
the risk capital group, which continues to enhance the risk capital model and ensure that it is consistent
across all our business activities;
the risk architecture group, which ensures we have integrated systems and common metrics and thereby
allows us to aggregate and stress exposures across the institution;
the infrastructure risk group, which focuses on improving our operational processes across businesses and
regions.
Credit, Market and Operational risk are managed, monitored and controlled through the Company‟s Credit, Market
and Operational Risk Committees. Each of these committees reports to the Risk Management Committee.
Risk aggregation and stress testing
The Company‟s Chief Risk Officer, as noted above, monitors and controls major risk exposures and concentrations
across the organisation. This means aggregating risks, within and across businesses, as well as subjecting those
risks to alternative stress scenarios in order to assess the potential economic impact they may have on the Company.
Comprehensive stress tests take place across Citigroup mark-to-market, available-for-sale and accrual portfolios.
These firm-wide stress reports measure the potential impact to the Group and its component businesses including the
risk within the Group of very large changes in various types of key risk factors (e.g., interest rates, credit spreads), as
well as the potential impact of a number of historical and hypothetical forward-looking systemic stress scenarios.
Supplementing the stress testing described above, Risk Management, working with input from the businesses and
Finance, provides periodic updates to senior management and the Citigroup Board of Directors on significant
potential exposures across Citigroup arising from risk concentrations, financial market participants and other
systemic issues. These risk assessments are forward-looking exercises, intended to inform senior management and
the Citigroup Board of Directors about the potential economic impacts to Citigroup that may occur, directly or
indirectly, as a result of hypothetical scenarios, based on judgmental analysis from independent risk managers.
The stress testing and risk assessment exercises are a supplement to the standard limit-setting as these processes
incorporate events in the marketplace and within Citigroup that impact our outlook on the form, magnitude,
correlation and timing of identified risks that may arise. In addition to enhancing awareness and understanding of
potential exposures within the Company, the results of these processes then serve as the starting point for developing
risk management and mitigation strategies.
The Company also conducts stress testing and concentration risk testing from the individual legal vehicle
perspective and the results are built into the future capital plans of the entity.

CITIBANK EUROPE PLC
31
NOTES TO THE FINANCIAL STATEMENTS
13. Financial instruments and risk management (continued)
Operational risk
Operational risk is the risk of loss resulting from inadequate or failed internal processes, human factors or systems or
from external events. It includes the reputation and franchise risk associated with business practices or market
conduct that the Company undertakes. Operational risk is inherent in the Company‟s business activities and, as with
other risk types is managed through an overall framework with checks and balances that includes;
Recognized ownership of the risk by the businesses;
Oversight by independent risk management; and
Independent review by Citi Internal Audit.
Framework
The Company follows the approach to operational risk as defined by in the Citigroup Risk and Control Self –
Assessment (RCSA)/Operational Risk Policy. The objective of the Policy is to establish a consistent value – added
framework for assessing and communicating operational risk and the overall effectiveness of the internal control
environment across Citigroup. Information about operational risk, historical losses and the control environment, is
reported and summarized for the Audit committee, senior management and for the Directors.
Market risk
Market risk encompasses a number of components, currency risk, interest rate risk and other price risk. Currency
risk is the risk that the fair value or future cash flows of a financial instrument will fluctuate because of changes in
foreign exchange rates. Interest rate risk is the risk that the fair value or future cash flows of a financial instrument
will fluctuate because of changes in market interest rates. Other price risk is the risk to fair value or future cash
flows because of changes in market prices other than currency risk and interest rate risk.
Market risk management
Within each business, a process is in place to control market risk exposure. The risk management process includes
the establishment of appropriate market risk controls and limits, policies and procedures and appropriate senior
management risk oversight with a risk management function independent from the business. Management of this
process begins with the professionals nearest to the Group‟s customers, products, and markets, and extends up to the
senior executives who manage these businesses and to the country level. Periodic reviews are conducted by Citi
Internal Audit to ensure compliance with institutional policies and procedures for the assessment, management and
control of market risk.
Price risk is measured using Interest Rate Exposure (“IRE”) limits, stress and scenario analysis, which are applied to
interest rate risk arising in the non-trading portfolios. Sensitivity limits and Value-at Risk (“VaR”), stress and
scenario analysis, are applied to the trading portfolios.
Trading price risk
Overall objectives
The Company uses a daily VaR measure, in conjunction with factor sensitivity and stress reporting, as a mechanism
for monitoring and controlling market risk for the trading portfolio. The VaR is calculated at a 99% confidence
level assuming a one-day liquidation horizon. Daily losses are expected to exceed the VaR, on an average, once
every one hundred business days.
VaR Methodology
The VaR engine is based on a structured Monte-Carlo approach where 5,000 scenarios of market rates/prices are
simulated. The covariance of volatility and correlation is updated, at least quarterly, based on three years‟ worth of
market data.
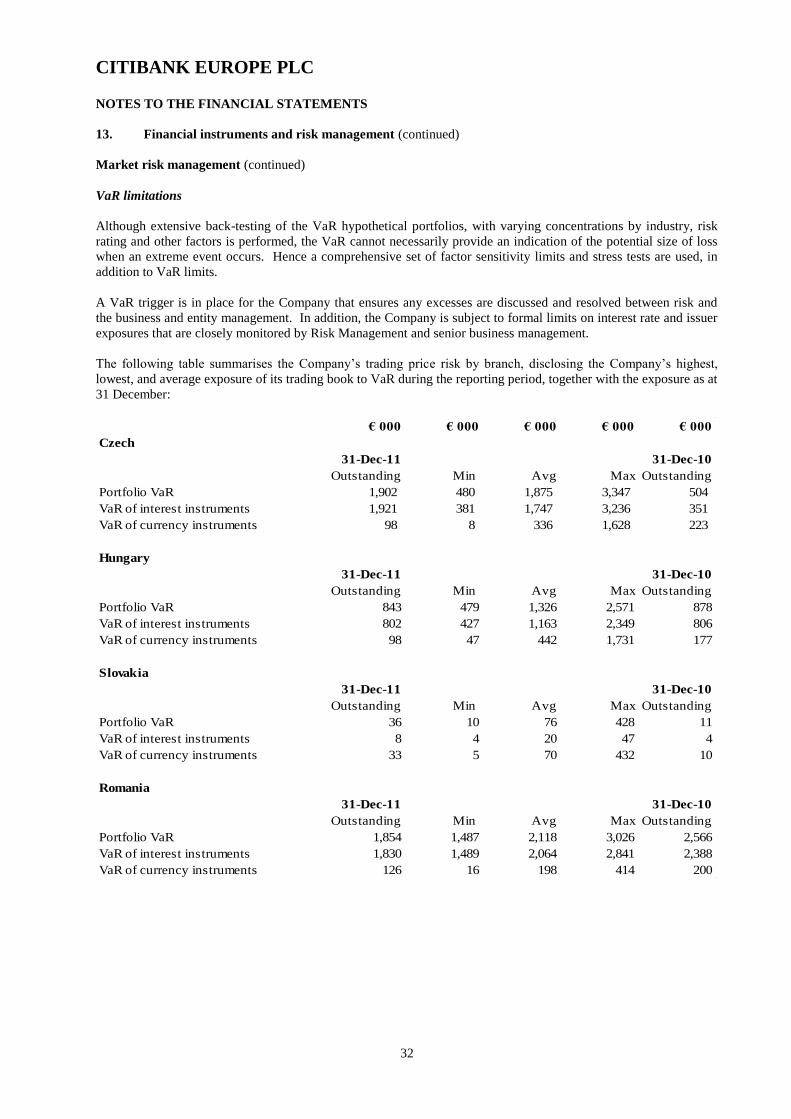
CITIBANK EUROPE PLC
32
NOTES TO THE FINANCIAL STATEMENTS
13. Financial instruments and risk management (continued)
Market risk management (continued)
VaR limitations
Although extensive back-testing of the VaR hypothetical portfolios, with varying concentrations by industry, risk
rating and other factors is performed, the VaR cannot necessarily provide an indication of the potential size of loss
when an extreme event occurs. Hence a comprehensive set of factor sensitivity limits and stress tests are used, in
addition to VaR limits.
A VaR trigger is in place for the Company that ensures any excesses are discussed and resolved between risk and
the business and entity management. In addition, the Company is subject to formal limits on interest rate and issuer
exposures that are closely monitored by Risk Management and senior business management.
The following table summarises the Company‟s trading price risk by branch, disclosing the Company‟s highest,
lowest, and average exposure of its trading book to VaR during the reporting period, together with the exposure as at
31 December:
€ 000 € 000 € 000 € 000 € 000
Czech
31-Dec-11 31-Dec-10
Outstanding Min Avg Max Outstanding
Portfolio VaR 1,902 480 1,875 3,347 504
VaR of interest instruments 1,921 381 1,747 3,236 351
VaR of currency instruments 98 8 336 1,628 223
Hungary
31-Dec-11 31-Dec-10
Outstanding Min Avg Max Outstanding
Portfolio VaR 843 479 1,326 2,571 878
VaR of interest instruments 802 427 1,163 2,349 806
VaR of currency instruments 98 47 442 1,731 177
Slovakia
31-Dec-11 31-Dec-10
Outstanding Min Avg Max Outstanding
Portfolio VaR 36 10 76 428 11
VaR of interest instruments 8 4 20 47 4
VaR of currency instruments 33 5 70 432 10
Romania
31-Dec-11 31-Dec-10
Outstanding Min Avg Max Outstanding
Portfolio VaR 1,854 1,487 2,118 3,026 2,566
VaR of interest instruments 1,830 1,489 2,064 2,841 2,388
VaR of currency instruments 126 16 198 414 200
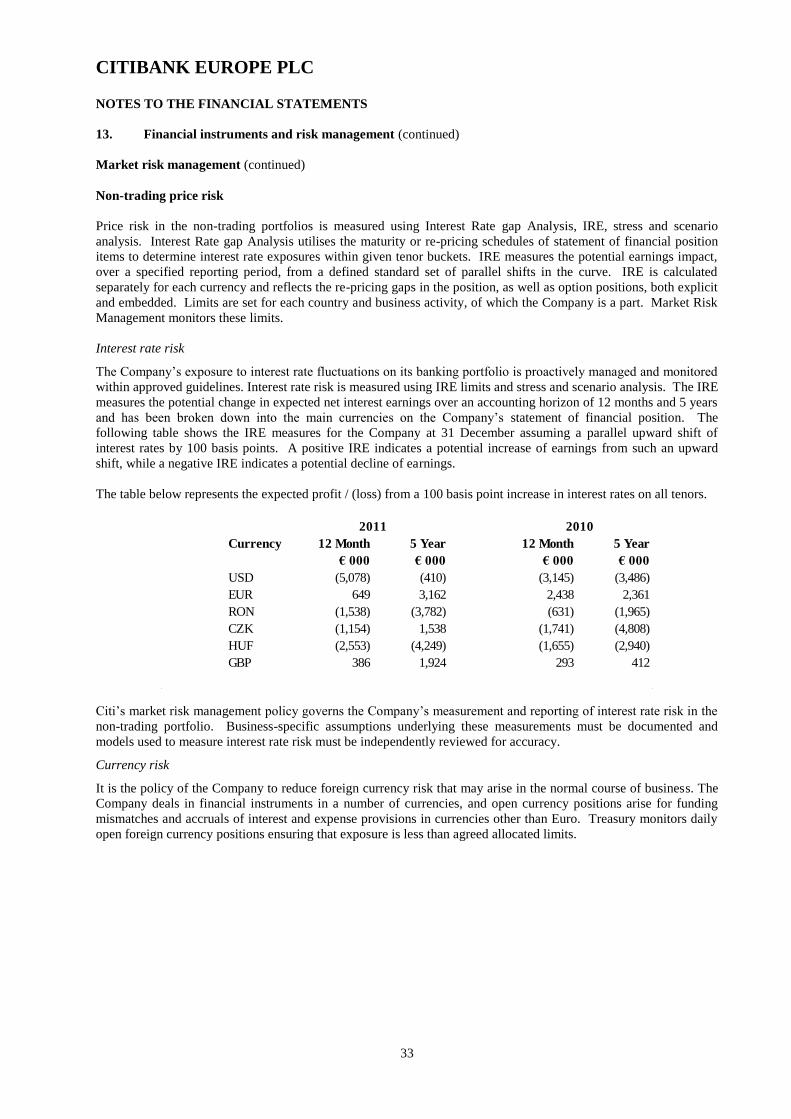
CITIBANK EUROPE PLC
33
NOTES TO THE FINANCIAL STATEMENTS
13. Financial instruments and risk management (continued)
Market risk management (continued)
Non-trading price risk
Price risk in the non-trading portfolios is measured using Interest Rate gap Analysis, IRE, stress and scenario
analysis. Interest Rate gap Analysis utilises the maturity or re-pricing schedules of statement of financial position
items to determine interest rate exposures within given tenor buckets. IRE measures the potential earnings impact,
over a specified reporting period, from a defined standard set of parallel shifts in the curve. IRE is calculated
separately for each currency and reflects the re-pricing gaps in the position, as well as option positions, both explicit
and embedded. Limits are set for each country and business activity, of which the Company is a part. Market Risk
Management monitors these limits.
Interest rate risk
The Company‟s exposure to interest rate fluctuations on its banking portfolio is proactively managed and monitored
within approved guidelines. Interest rate risk is measured using IRE limits and stress and scenario analysis. The IRE
measures the potential change in expected net interest earnings over an accounting horizon of 12 months and 5 years
and has been broken down into the main currencies on the Company‟s statement of financial position. The
following table shows the IRE measures for the Company at 31 December assuming a parallel upward shift of
interest rates by 100 basis points. A positive IRE indicates a potential increase of earnings from such an upward
shift, while a negative IRE indicates a potential decline of earnings.
The table below represents the expected profit / (loss) from a 100 basis point increase in interest rates on all tenors.
Currency 12 Month 5 Year 12 Month 5 Year
€ 000 € 000 € 000 € 000
USD (5,078) (410) (3,145) (3,486)
EUR 649 3,162 2,438 2,361
RON (1,538) (3,782) (631) (1,965)
CZK (1,154) 1,538 (1,741) (4,808)
HUF (2,553) (4,249) (1,655) (2,940)
GBP 386 1,924 293 412
2011 2010
Citi‟s market risk management policy governs the Company‟s measurement and reporting of interest rate risk in the
non-trading portfolio. Business-specific assumptions underlying these measurements must be documented and
models used to measure interest rate risk must be independently reviewed for accuracy.
Currency risk
It is the policy of the Company to reduce foreign currency risk that may arise in the normal course of business. The
Company deals in financial instruments in a number of currencies, and open currency positions arise for funding
mismatches and accruals of interest and expense provisions in currencies other than Euro. Treasury monitors daily
open foreign currency positions ensuring that exposure is less than agreed allocated limits.
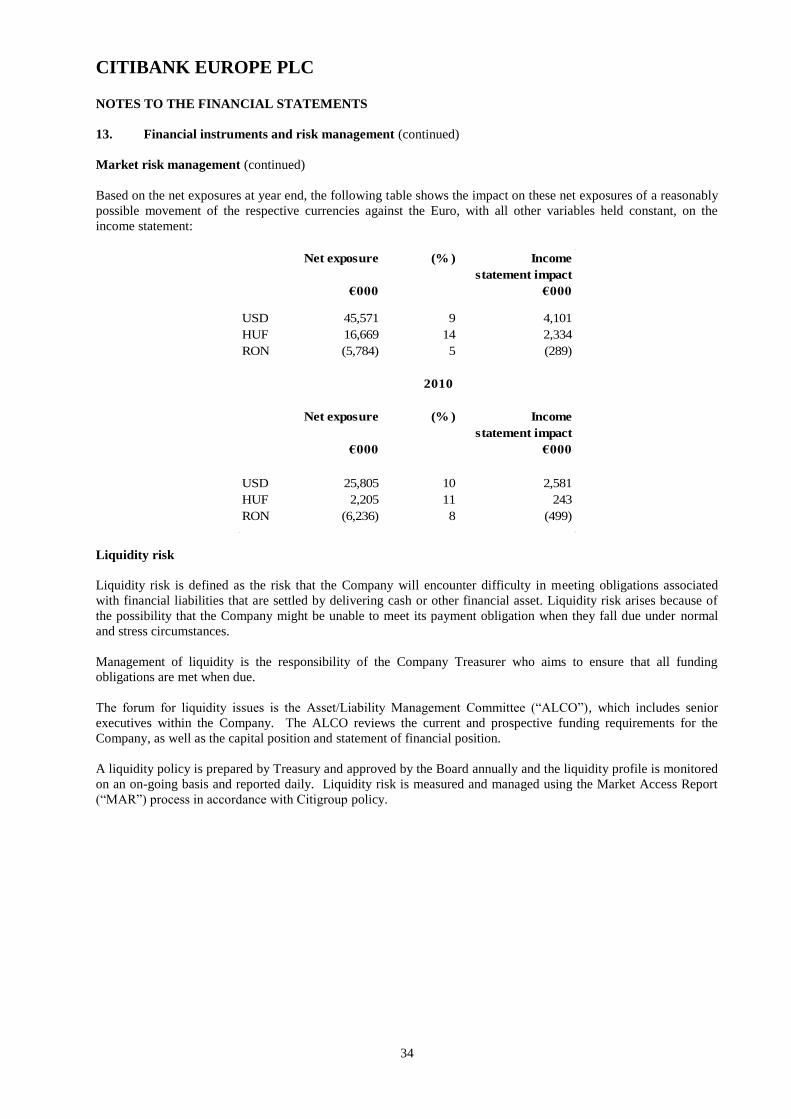
CITIBANK EUROPE PLC
34
NOTES TO THE FINANCIAL STATEMENTS
13. Financial instruments and risk management (continued)
Market risk management (continued)
Based on the net exposures at year end, the following table shows the impact on these net exposures of a reasonably
possible movement of the respective currencies against the Euro, with all other variables held constant, on the
income statement:
Net exposure
€000
(% ) Income
statement impact
€000
USD 45,571 9 4,101
HUF 16,669 14 2,334
RON (5,784) 5 (289)
Net exposure
€000
(% ) Income
statement impact
€000
USD 25,805 10 2,581
HUF 2,205 11 243
RON (6,236) 8 (499)
2010
Liquidity risk
Liquidity risk is defined as the risk that the Company will encounter difficulty in meeting obligations associated
with financial liabilities that are settled by delivering cash or other financial asset. Liquidity risk arises because of
the possibility that the Company might be unable to meet its payment obligation when they fall due under normal
and stress circumstances.
Management of liquidity is the responsibility of the Company Treasurer who aims to ensure that all funding
obligations are met when due.
The forum for liquidity issues is the Asset/Liability Management Committee (“ALCO”), which includes senior
executives within the Company. The ALCO reviews the current and prospective funding requirements for the
Company, as well as the capital position and statement of financial position.
A liquidity policy is prepared by Treasury and approved by the Board annually and the liquidity profile is monitored
on an on-going basis and reported daily. Liquidity risk is measured and managed using the Market Access Report
(“MAR”) process in accordance with Citigroup policy.
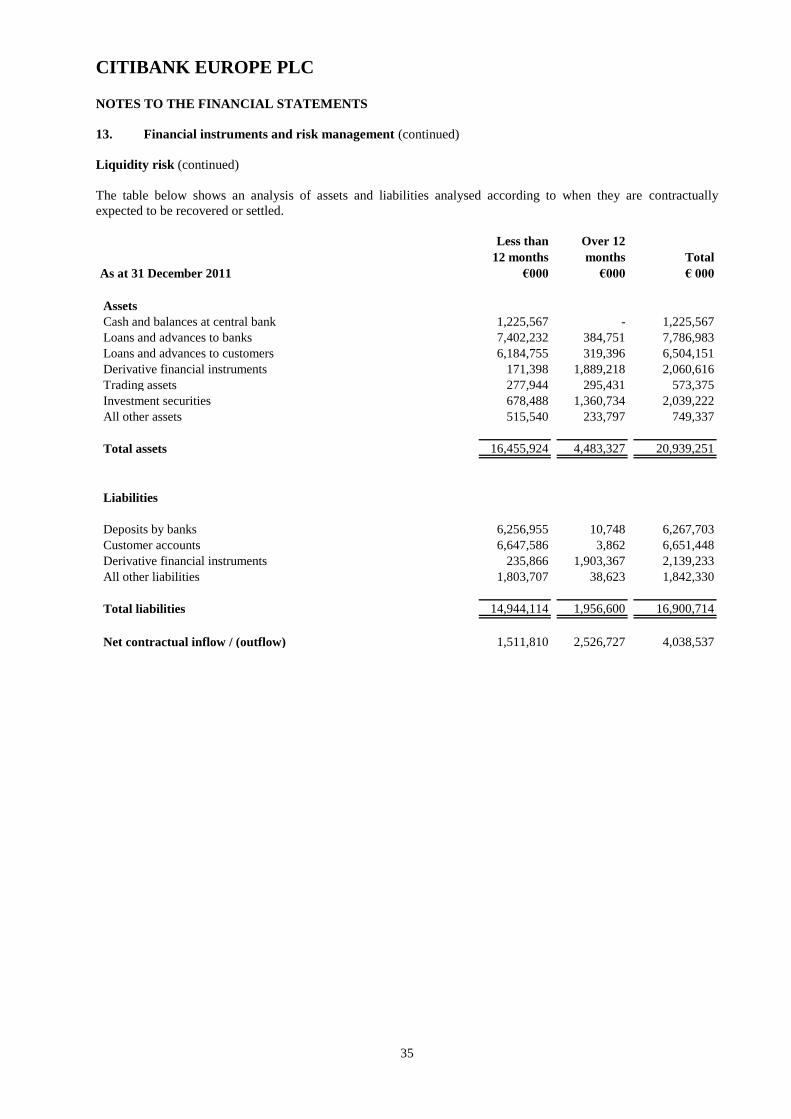
CITIBANK EUROPE PLC
35
NOTES TO THE FINANCIAL STATEMENTS
13. Financial instruments and risk management (continued)
Liquidity risk (continued)
The table below shows an analysis of assets and liabilities analysed according to when they are contractually
expected to be recovered or settled.
As at 31 December 2011
Less than
12 months
€000
Over 12
months
€000
Total
€ 000
Assets
Cash and balances at central bank 1,225,567 - 1,225,567
Loans and advances to banks 7,402,232 384,751 7,786,983
Loans and advances to customers 6,184,755 319,396 6,504,151
Derivative financial instruments 171,398 1,889,218 2,060,616
Trading assets 277,944 295,431 573,375
Investment securities 678,488 1,360,734 2,039,222
All other assets 515,540 233,797 749,337
Total assets 16,455,924 4,483,327 20,939,251
Liabilities
Deposits by banks 6,256,955 10,748 6,267,703
Customer accounts 6,647,586 3,862 6,651,448
Derivative financial instruments 235,866 1,903,367 2,139,233
All other liabilities 1,803,707 38,623 1,842,330
Total liabilities 14,944,114 1,956,600 16,900,714
Net contractual inflow / (outflow) 1,511,810 2,526,727 4,038,537

CITIBANK EUROPE PLC
36
NOTES TO THE FINANCIAL STATEMENTS
13. Financial instruments and risk management (continued)
Liquidity risk (continued)
As at 31 December 2010
Less than
12 months
€000
Over 12
months
€000
Total
€ 000
Assets
Cash and balances at central bank 996,999 - 996,999
Loans and advances to banks 6,977,460 488,155 7,465,615
Loans and advances to customers 4,490,351 375,880 4,866,231
Derivative financial instruments* 432,763 1,107,109 1,539,872
Trading assets 162,451 73,311 235,762
Investment securities 710,724 894,761 1,605,485
All other assets 403,453 235,589 639,042
Total assets 14,174,201 3,174,805 17,349,006
Liabilities
Deposits by banks 3,674,700 15,817 3,690,517
Customer accounts 6,590,095 2,320 6,592,415
Derivative financial instruments* 456,211 1,127,255 1,583,466
All other liabilities 1,476,322 44,092 1,520,414
Total liabilities 12,197,328 1,189,484 13,386,812
Net contractual inflow / (outflow) 1,976,873 1,985,321 3,962,194
*Reclassified of derivative instruments from less than 12 months to over 12 months
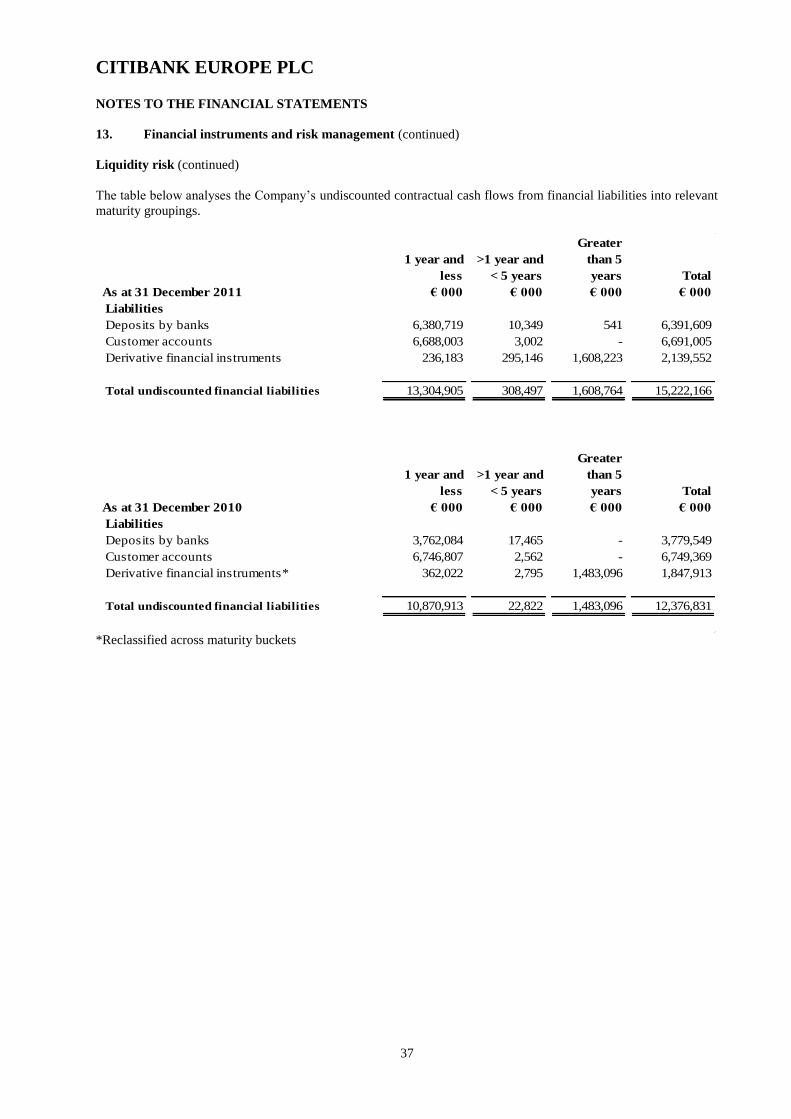
CITIBANK EUROPE PLC
37
NOTES TO THE FINANCIAL STATEMENTS
13. Financial instruments and risk management (continued)
Liquidity risk (continued)
The table below analyses the Company‟s undiscounted contractual cash flows from financial liabilities into relevant
maturity groupings.
As at 31 December 2011
1 year and
less
€ 000
>1 year and
< 5 years
€ 000
Greater
than 5
years
€ 000
Total
€ 000
Liabilities
Deposits by banks 6,380,719 10,349 541 6,391,609
Customer accounts 6,688,003 3,002 - 6,691,005
Derivative financial instruments 236,183 295,146 1,608,223 2,139,552
Total undiscounted financial liabilities 13,304,905 308,497 1,608,764 15,222,166
As at 31 December 2010
1 year and
less
€ 000
>1 year and
< 5 years
€ 000
Greater
than 5
years
€ 000
Total
€ 000
Liabilities
Deposits by banks 3,762,084 17,465 - 3,779,549
Customer accounts 6,746,807 2,562 - 6,749,369
Derivative financial instruments* 362,022 2,795 1,483,096 1,847,913
Total undiscounted financial liabilities 10,870,913 22,822 1,483,096 12,376,831
*Reclassified across maturity buckets
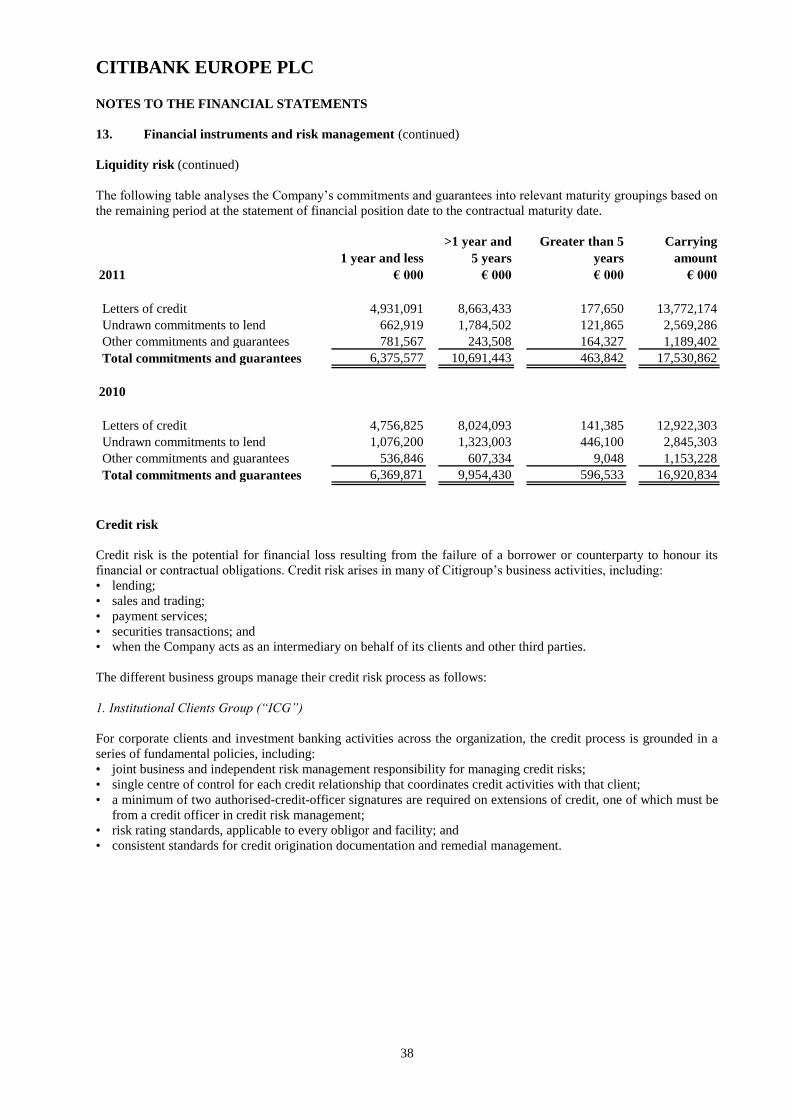
CITIBANK EUROPE PLC
38
NOTES TO THE FINANCIAL STATEMENTS
13. Financial instruments and risk management (continued)
Liquidity risk (continued)
The following table analyses the Company‟s commitments and guarantees into relevant maturity groupings based on
the remaining period at the statement of financial position date to the contractual maturity date.
2011
1 year and less
€ 000
>1 year and
5 years
€ 000
Greater than 5
years
€ 000
Carrying
amount
€ 000
Letters of credit 4,931,091 8,663,433 177,650 13,772,174
Undrawn commitments to lend 662,919 1,784,502 121,865 2,569,286
Other commitments and guarantees 781,567 243,508 164,327 1,189,402
Total commitments and guarantees 6,375,577 10,691,443 463,842 17,530,862
2010
Letters of credit 4,756,825 8,024,093 141,385 12,922,303
Undrawn commitments to lend 1,076,200 1,323,003 446,100 2,845,303
Other commitments and guarantees 536,846 607,334 9,048 1,153,228
Total commitments and guarantees 6,369,871 9,954,430 596,533 16,920,834
Credit risk
Credit risk is the potential for financial loss resulting from the failure of a borrower or counterparty to honour its
financial or contractual obligations. Credit risk arises in many of Citigroup‟s business activities, including:
• lending;
• sales and trading;
• payment services;
• securities transactions; and
• when the Company acts as an intermediary on behalf of its clients and other third parties.
The different business groups manage their credit risk process as follows:
1. Institutional Clients Group (“ICG”)
For corporate clients and investment banking activities across the organization, the credit process is grounded in a
series of fundamental policies, including:
• joint business and independent risk management responsibility for managing credit risks;
• single centre of control for each credit relationship that coordinates credit activities with that client;
• a minimum of two authorised-credit-officer signatures are required on extensions of credit, one of which must be
from a credit officer in credit risk management;
• risk rating standards, applicable to every obligor and facility; and
• consistent standards for credit origination documentation and remedial management.
CITIBANK EUROPE PLC
39
NOTES TO THE FINANCIAL STATEMENTS
13. Financial instruments and risk management (continued)
Credit risk (continued)
The Company has established processes for the consistent calculation, measurement, monitoring and reporting of
credit risk across all ICG businesses globally. At the most granular level, credit is extended under a credit limit
approved by a unit aligned with the obligor. As part of the approval or subsequent renewal process, Independent
Risk Management is responsible for assigning a risk rating to the obligor. The risk rating refers to an expected
probability of default of the obligor and is therefore part of the expression of the credit risk associated with
extending credit. Each credit limit is assigned a facility risk rating, taking the obligor risk rating and including any
facility level characteristics (security, collateral, etc) to assign a rating that is an expression of the expected loss on a
facility (the product of probability of default and loss given default). The final component of credit risk is the
amount of exposure and here measures vary from the most simple (e.g. value of the asset) to complex (e.g.
estimating potential replacement cost on a derivative contract). The processes required for these measurements
therefore also vary considerably - from a simple feed of balances to a complex simulation engine.
Credit risk is therefore measured at a number of levels, including:
At a facility level which may include one or more contracts, availments or transactions.
At an obligor level if there are multiple facilities approved for an obligor - where the risk associated with an
obligor default can be assessed
At a group level - considering the implications of a group structure of multiple obligors with common
ownership.
Obligor probability of default is monitored by having independent risk analysts and managers aligned to the obligor,
who maintain current information about the obligor's condition and revisit the risk rating and approved limits in the
event of material new information coming to light.
Exposure is monitored against the approved limits and excesses are automatically identified to an appropriate
member of Independent Risk Management. Escalation processes ensure that larger and aged exceptions are raised to
an appropriately Senior Credit Officer.
The Company has a Credit risk reporting system (Global Risk Reporting - GRR), to which all material exposures are
reported on a daily basis by numerous underlying product processors and other feeder systems. An analyst or risk
manager can, therefore, obtain a snapshot as at close of business previous day of all material exposures to his/her
obligor(s), whether or not exposure has exceeded a limit.
2. Global Cards and Consumer Banking (“Consumer”)
Country Business Managers have ownership of portfolios and are accountable for managing the risk/return trade-
offs in their businesses. In cooperation with Senior/Country Credit Officers they implement policies, procedures
and risk management practices in their businesses that are compliant with global consumer credit risk policies.
Consumer risk officers regularly review the performance of the consumer businesses and ensure that appropriate
control is exercised. A risk differentiated approach is employed, such that critical activities, for example collection
and fraud, are reviewed with greater frequency.
Credit authority levels, the delegation process, approval processes for portfolios, product approvals, and other types
of required approvals, as well as credit authority levels and responsibilities are defined in Global Consumer Credit
and Fraud Risk Policies. These policies establish a consistent set of standards for the appointment of Credit Officers
and Senior Credit Officers, streamline the approval process, create auditable policies, and ensure the accountability
and responsibility of risk management staff. The Country Credit Officer prepares credit strategy in collaboration
with the Country Business Manager, which is reviewed by the Regional Senior Credit Officer.

CITIBANK EUROPE PLC
40
NOTES TO THE FINANCIAL STATEMENTS
13. Financial instruments and risk management (continued)
Credit risk (continued)
There is an established set of measures, procedures and policies that aims at monitoring results of retail portfolios
that ensures internal control. These include:
Comparison of indicators to past performance
Country Credit Officer reviews
Stress tests
Mandates and approval authorities
In addition to these procedures each business has credit benchmarks that set out its short and long-term expectations.
Exposure to credit risk - Loans and advances to third parties
2011
Charge and
credit card
debtors
Commercial
loans
Consumer
loans Total
€ 000 € 000 € 000 € 000
Gross Amount 362,152 8,072,482 137,283 8,571,917
Individually impaired
Current - 47,501 - 47,501
1 - 119 days past due - 408 - 408
120 - 179 days past due - - - -
180 days or more past due - 3,539 - 3,539
Gross Amount - 51,448 - 51,448
Impairment provision on individually impaired loans - (18,051) - (18,051)
Carrying amount of individually impaired loans - 33,397 - 33,397
Collectively assessed
Current 339,226 7,969,088 121,317 8,429,631
1 - 119 days past due 20,255 46,723 15,892 82,870
120 - 179 days past due 2,671 111 5 2,787
180 days or more past due - 5,112 69 5,181
Gross Amount 362,152 8,021,034 137,283 8,520,469
Impairment provision on collectively assessed loans (21,227) (36,341) (11,874) (69,442)
Carrying amount of collectively assessed loans 340,925 7,984,693 125,409 8,451,027
Total impairment provision (21,227) (54,392) (11,874) (87,492)
Total carrying amount 340,925 8,018,090 125,409 8,484,424
Impairment on undrawn commitments - (18,020) - (18,020)
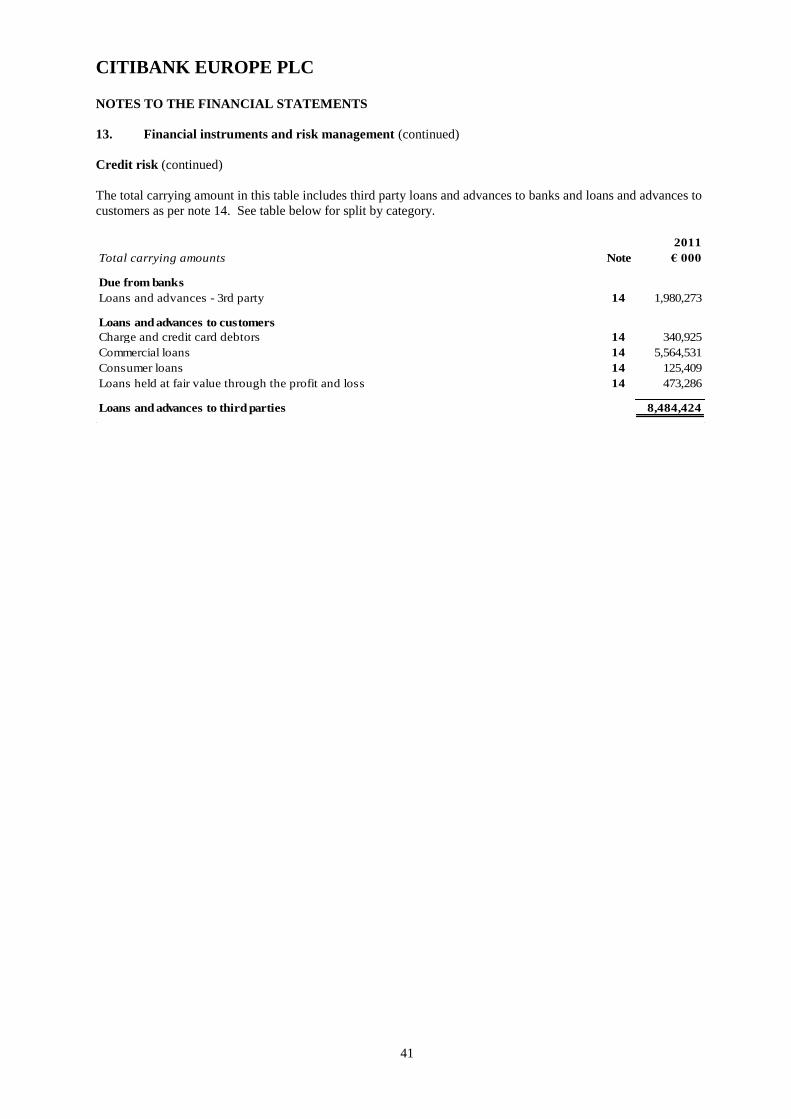
CITIBANK EUROPE PLC
41
NOTES TO THE FINANCIAL STATEMENTS
13. Financial instruments and risk management (continued)
Credit risk (continued)
The total carrying amount in this table includes third party loans and advances to banks and loans and advances to
customers as per note 14. See table below for split by category.
2011
Total carrying amounts Note € 000
Due from banks
Loans and advances - 3rd party 14 1,980,273
Loans and advances to customers
Charge and credit card debtors 14 340,925
Commercial loans 14 5,564,531
Consumer loans 14 125,409
Loans held at fair value through the profit and loss 14 473,286
Loans and advances to third parties 8,484,424
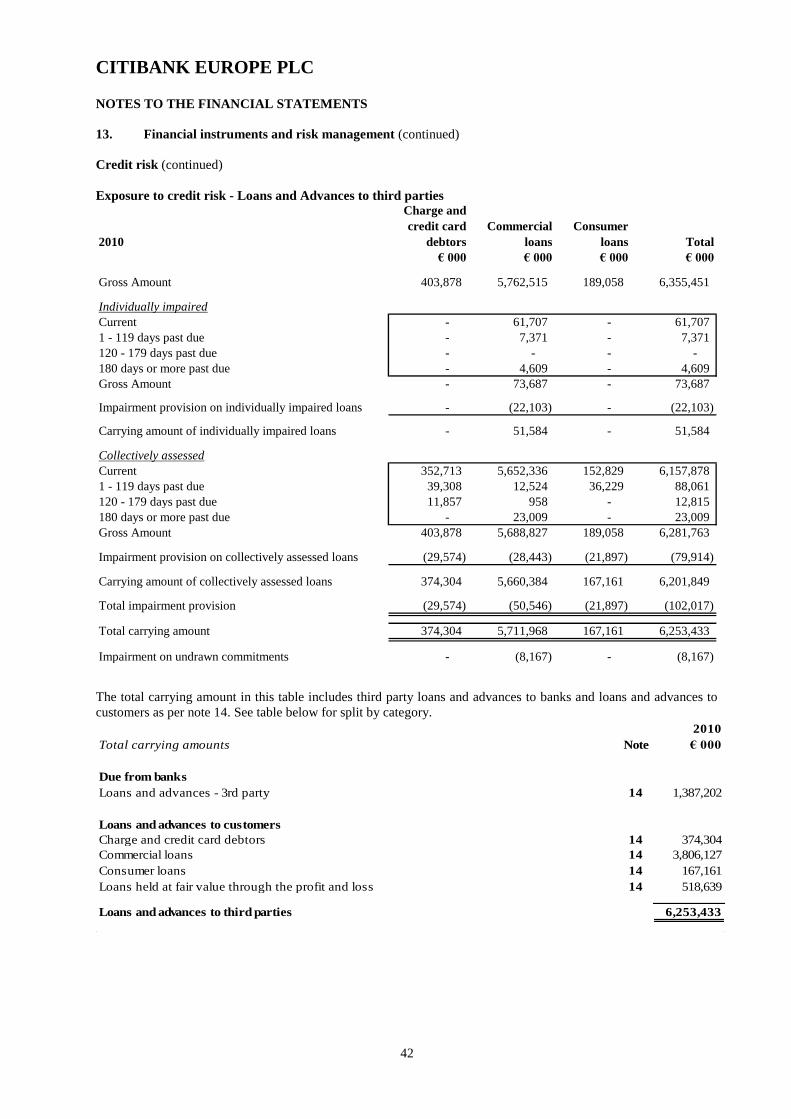
CITIBANK EUROPE PLC
42
NOTES TO THE FINANCIAL STATEMENTS
13. Financial instruments and risk management (continued)
Credit risk (continued)
Exposure to credit risk - Loans and Advances to third parties
2010
Charge and
credit card
debtors
Commercial
loans
Consumer
loans Total
€ 000 € 000 € 000 € 000
Gross Amount 403,878 5,762,515 189,058 6,355,451
Individually impaired
Current - 61,707 - 61,707
1 - 119 days past due - 7,371 - 7,371
120 - 179 days past due - - - -
180 days or more past due - 4,609 - 4,609
Gross Amount - 73,687 - 73,687
Impairment provision on individually impaired loans - (22,103) - (22,103)
Carrying amount of individually impaired loans - 51,584 - 51,584
Collectively assessed
Current 352,713 5,652,336 152,829 6,157,878
1 - 119 days past due 39,308 12,524 36,229 88,061
120 - 179 days past due 11,857 958 - 12,815
180 days or more past due - 23,009 - 23,009
Gross Amount 403,878 5,688,827 189,058 6,281,763
Impairment provision on collectively assessed loans (29,574) (28,443) (21,897) (79,914)
Carrying amount of collectively assessed loans 374,304 5,660,384 167,161 6,201,849
Total impairment provision (29,574) (50,546) (21,897) (102,017)
Total carrying amount 374,304 5,711,968 167,161 6,253,433
Impairment on undrawn commitments - (8,167) - (8,167)
The total carrying amount in this table includes third party loans and advances to banks and loans and advances to
customers as per note 14. See table below for split by category.
2010
Total carrying amounts Note € 000
Due from banks
Loans and advances - 3rd party 14 1,387,202
Loans and advances to customers
Charge and credit card debtors 14 374,304
Commercial loans 14 3,806,127
Consumer loans 14 167,161
Loans held at fair value through the profit and loss 14 518,639
Loans and advances to third parties 6,253,433

CITIBANK EUROPE PLC
43
NOTES TO THE FINANCIAL STATEMENTS
13. Financial instruments and risk management (continued)
Credit risk (continued)
Net credit losses charged to the current year income statement
2011 2010
€'000 €'000
Individual provisions taken in the year 11,199 12,793
Net change to portfolio provisions in the year (7,530) (2,531)
Credit write-offs 55,659 113,358
Credit recoveries (43,827) (43,630)
Net credit losses/recoveries total 15,501 79,990
Movement in provisions for impairment balances
Charge and
credit card
debtors
Commercial
loans
Consumer
loans Total
€ 000 € 000 € 000 € 000
Balance at 1 January 2010* 31,820 65,215 29,035 126,070
Individual provisions taken in the year - 12,793 - 12,793
Net change to portfolio provisions in the year (1,922) (392) (217) (2,531)
Provisions released due to Credit write-offs - (9,278) (2,953) (12,231)
Provisions released due to Credit recoveries (878) (11,168) (3,099) (15,145)
Foreign exchange adjustments 554 1,544 (869) 1,229
Balance at 31 December 2010 29,574 58,714 21,897 110,185
Individual provisions taken in the year - 11,199 - 11,199
Net change to portfolio provisions in the year (6,996) 8,523 (9,057) (7,530)
Provisions released due to Credit write-offs - (1,335) - (1,335)
Provisions released due to Credit recoveries - (3,512) - (3,512)
Foreign exchange adjustments (1,351) (1,176) (968) (3,495)
Balance at 31 December 2011 21,227 72,413 11,872 105,512
*Opening balance as at 1 January 2010 includes prior year reclassification between business lines
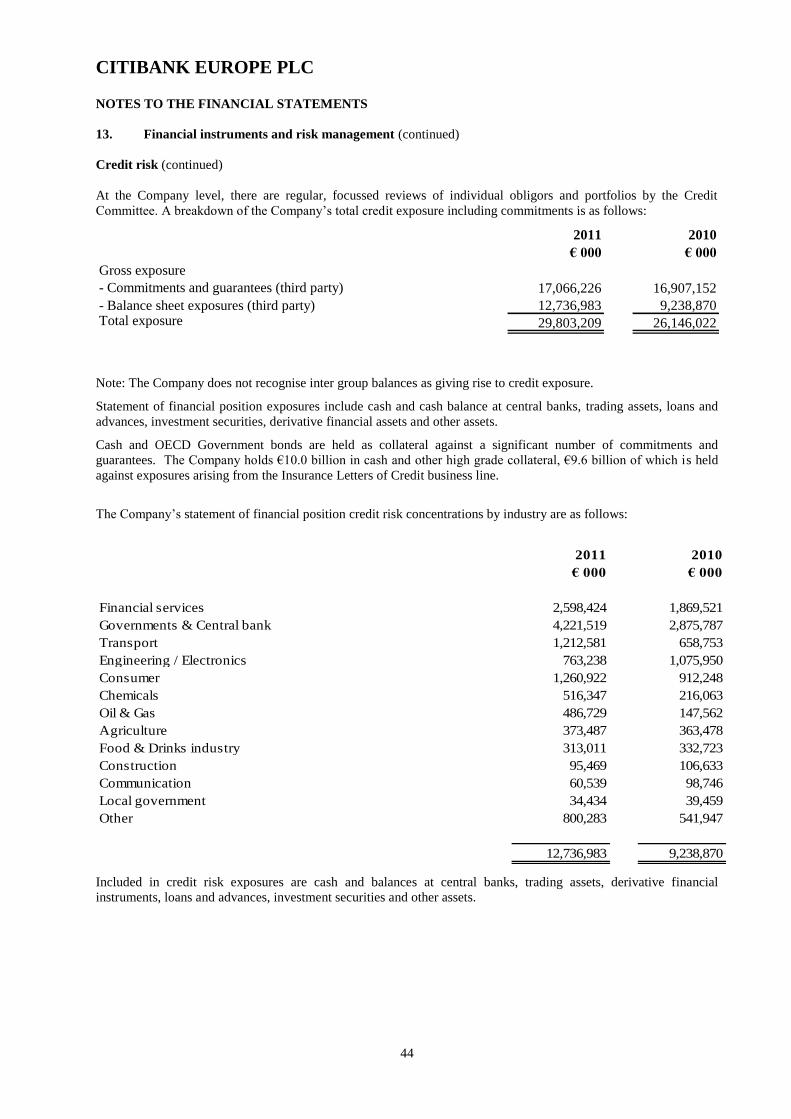
CITIBANK EUROPE PLC
44
NOTES TO THE FINANCIAL STATEMENTS
13. Financial instruments and risk management (continued)
Credit risk (continued)
At the Company level, there are regular, focussed reviews of individual obligors and portfolios by the Credit
Committee. A breakdown of the Company‟s total credit exposure including commitments is as follows:
2011
€ 000
2010
€ 000
Gross exposure
- Commitments and guarantees (third party) 17,066,226 16,907,152
- Balance sheet exposures (third party) 12,736,983 9,238,870 Total exposure 29,803,209 26,146,022
Note: The Company does not recognise inter group balances as giving rise to credit exposure.
Statement of financial position exposures include cash and cash balance at central banks, trading assets, loans and
advances, investment securities, derivative financial assets and other assets.
Cash and OECD Government bonds are held as collateral against a significant number of commitments and
guarantees. The Company holds €10.0 billion in cash and other high grade collateral, €9.6 billion of which is held
against exposures arising from the Insurance Letters of Credit business line.
The Company‟s statement of financial position credit risk concentrations by industry are as follows:
2011
€ 000
2010
€ 000
Financial services 2,598,424 1,869,521
Governments & Central bank 4,221,519 2,875,787
Transport 1,212,581 658,753
Engineering / Electronics 763,238 1,075,950
Consumer 1,260,922 912,248
Chemicals 516,347 216,063
Oil & Gas 486,729 147,562
Agriculture 373,487 363,478
Food & Drinks industry 313,011 332,723
Construction 95,469 106,633
Communication 60,539 98,746
Local government 34,434 39,459
Other 800,283 541,947
12,736,983 9,238,870
Included in credit risk exposures are cash and balances at central banks, trading assets, derivative financial
instruments, loans and advances, investment securities and other assets.
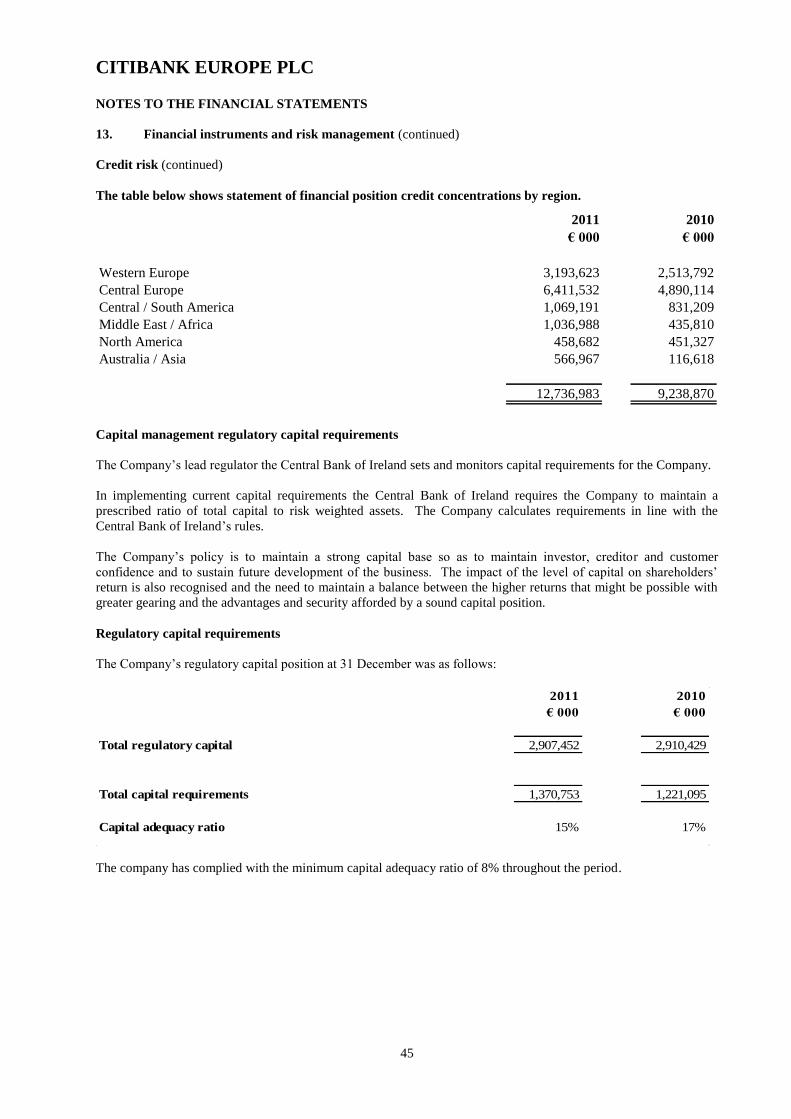
CITIBANK EUROPE PLC
45
NOTES TO THE FINANCIAL STATEMENTS
13. Financial instruments and risk management (continued)
Credit risk (continued)
The table below shows statement of financial position credit concentrations by region.
2011
€ 000
2010
€ 000
Western Europe 3,193,623 2,513,792
Central Europe 6,411,532 4,890,114
Central / South America 1,069,191 831,209
Middle East / Africa 1,036,988 435,810
North America 458,682 451,327
Australia / Asia 566,967 116,618
12,736,983 9,238,870
Capital management regulatory capital requirements
The Company‟s lead regulator the Central Bank of Ireland sets and monitors capital requirements for the Company.
In implementing current capital requirements the Central Bank of Ireland requires the Company to maintain a
prescribed ratio of total capital to risk weighted assets. The Company calculates requirements in line with the
Central Bank of Ireland‟s rules.
The Company‟s policy is to maintain a strong capital base so as to maintain investor, creditor and customer
confidence and to sustain future development of the business. The impact of the level of capital on shareholders‟
return is also recognised and the need to maintain a balance between the higher returns that might be possible with
greater gearing and the advantages and security afforded by a sound capital position.
Regulatory capital requirements
The Company‟s regulatory capital position at 31 December was as follows:
2011
€ 000
2010
€ 000
Total regulatory capital 2,907,452 2,910,429
Total capital requirements 1,370,753 1,221,095
Capital adequacy ratio 15% 17%
The company has complied with the minimum capital adequacy ratio of 8% throughout the period.

CITIBANK EUROPE PLC
46
NOTES TO THE FINANCIAL STATEMENTS
14. Financial assets and liabilities
The below tables outline the total financial assets and liabilities held as at 31 December 2011 and 31 December
2010.
2011
€ 000
2010
€ 000
Total financial assets held at fair value 5,146,499 3,899,758
Total financial assets not held at fair value 15,428,254 13,040,883
Total financial assets 20,574,753 16,940,641
2011
€ 000
2010
€ 000
Total financial liabilities held at fair value 2,184,778 1,583,466
Total financial liabilities not held at fair value 14,574,057 11,660,719
Total financial liabilities 16,758,835 13,244,185
In accordance with IFRS 7, Financial Instruments: Disclosures, the Company has adopted the fair value hierarchy
classification of financial instruments. This requires the Company to classify its financial instruments held at fair
value according to a hierarchy based on the significance of the inputs used to arrive at the overall fair value of these
instruments.
The fair value hierarchy is determined as follows:
Level 1: Quoted market price (unadjusted) in an active market for an identical instrument.
Level 2: Valuation techniques based on observable inputs, either directly (i.e. as prices) or indirectly (i.e.
derived from prices). This category includes instruments valued using: quoted market prices in active
markets for similar instruments; quoted for identical or similar instruments in markets that are considered
less than active; or other valuation techniques where all significant inputs are directly or indirectly
observable from market data.
Level 3: Valuation techniques using significant unobservable inputs. This category includes all instruments
where the valuation technique includes inputs not based on observable data and the unobservable inputs
have a significant effect on the instrument‟s valuation. This category includes instruments that are valued
based on quoted prices for similar instruments where significant unobservable adjustments or assumptions
are required to reflect differences between the instruments.
There have been no transfers between levels 1 and 2 and no level 3 financial instruments were held during the year
ended 31 December 2011.
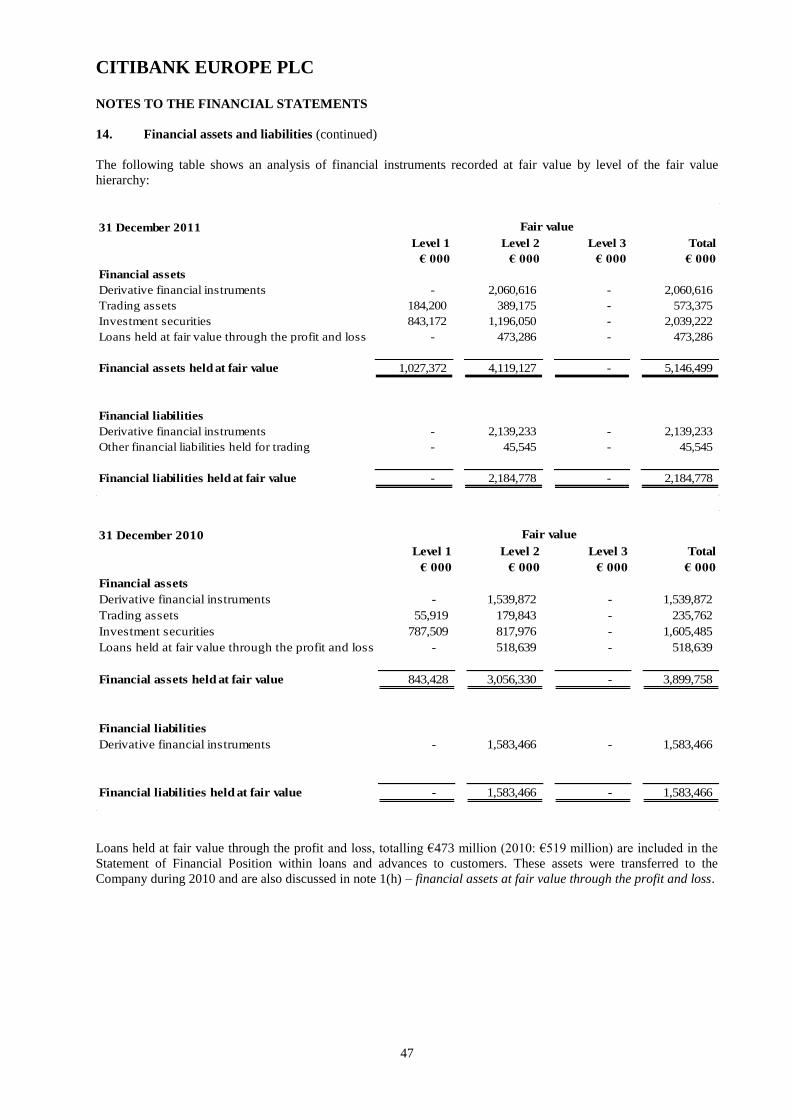
CITIBANK EUROPE PLC
47
NOTES TO THE FINANCIAL STATEMENTS
14. Financial assets and liabilities (continued)
The following table shows an analysis of financial instruments recorded at fair value by level of the fair value
hierarchy:
31 December 2011
Level 1 Level 2 Level 3 Total
€ 000 € 000 € 000 € 000
Financial assets
Derivative financial instruments - 2,060,616 - 2,060,616
Trading assets 184,200 389,175 - 573,375
Investment securities 843,172 1,196,050 - 2,039,222
Loans held at fair value through the profit and loss - 473,286 - 473,286
Financial assets held at fair value 1,027,372 4,119,127 - 5,146,499
Financial liabilities
Derivative financial instruments - 2,139,233 - 2,139,233
Other financial liabilities held for trading - 45,545 - 45,545
Financial liabilities held at fair value - 2,184,778 - 2,184,778
Fair value
31 December 2010
Level 1 Level 2 Level 3 Total
€ 000 € 000 € 000 € 000
Financial assets
Derivative financial instruments - 1,539,872 - 1,539,872
Trading assets 55,919 179,843 - 235,762
Investment securities 787,509 817,976 - 1,605,485
Loans held at fair value through the profit and loss - 518,639 - 518,639
Financial assets held at fair value 843,428 3,056,330 - 3,899,758
Financial liabilities
Derivative financial instruments - 1,583,466 - 1,583,466
Financial liabilities held at fair value - 1,583,466 - 1,583,466
Fair value
Loans held at fair value through the profit and loss, totalling €473 million (2010: €519 million) are included in the
Statement of Financial Position within loans and advances to customers. These assets were transferred to the
Company during 2010 and are also discussed in note 1(h) – financial assets at fair value through the profit and loss.
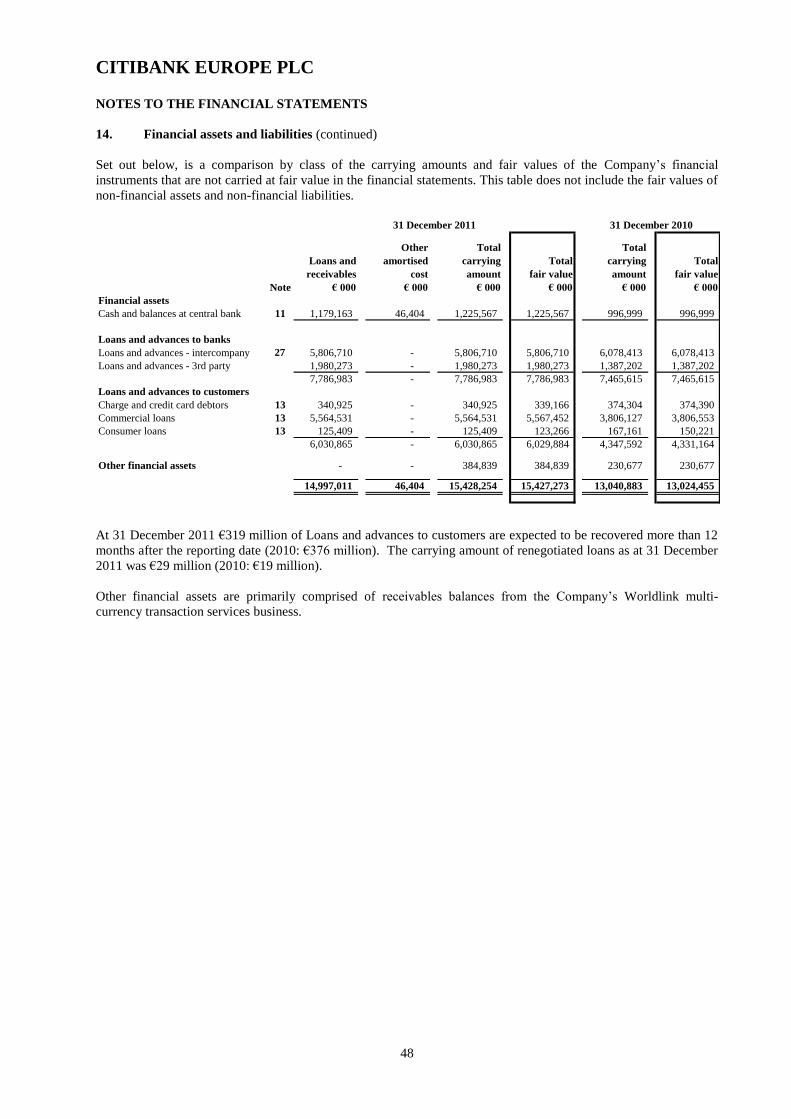
CITIBANK EUROPE PLC
48
NOTES TO THE FINANCIAL STATEMENTS
14. Financial assets and liabilities (continued)
Set out below, is a comparison by class of the carrying amounts and fair values of the Company‟s financial
instruments that are not carried at fair value in the financial statements. This table does not include the fair values of
non-financial assets and non-financial liabilities.
Loans and
receivables
Other
amortised
cost
Total
carrying
amount
Total
fair value
Total
carrying
amount
Total
fair value
Note € 000 € 000 € 000 € 000 € 000 € 000
Financial assets
Cash and balances at central bank 11 1,179,163 46,404 1,225,567 1,225,567 996,999 996,999
Loans and advances to banks
Loans and advances - intercompany 27 5,806,710 - 5,806,710 5,806,710 6,078,413 6,078,413
Loans and advances - 3rd party 1,980,273 - 1,980,273 1,980,273 1,387,202 1,387,202
7,786,983 - 7,786,983 7,786,983 7,465,615 7,465,615
Loans and advances to customers
Charge and credit card debtors 13 340,925 - 340,925 339,166 374,304 374,390
Commercial loans 13 5,564,531 - 5,564,531 5,567,452 3,806,127 3,806,553
Consumer loans 13 125,409 - 125,409 123,266 167,161 150,221
6,030,865 - 6,030,865 6,029,884 4,347,592 4,331,164
Other financial assets - - 384,839 384,839 230,677 230,677
14,997,011 46,404 15,428,254 15,427,273 13,040,883 13,024,455
31 December 201031 December 2011
At 31 December 2011 €319 million of Loans and advances to customers are expected to be recovered more than 12
months after the reporting date (2010: €376 million). The carrying amount of renegotiated loans as at 31 December
2011 was €29 million (2010: €19 million).
Other financial assets are primarily comprised of receivables balances from the Company‟s Worldlink multi-
currency transaction services business.
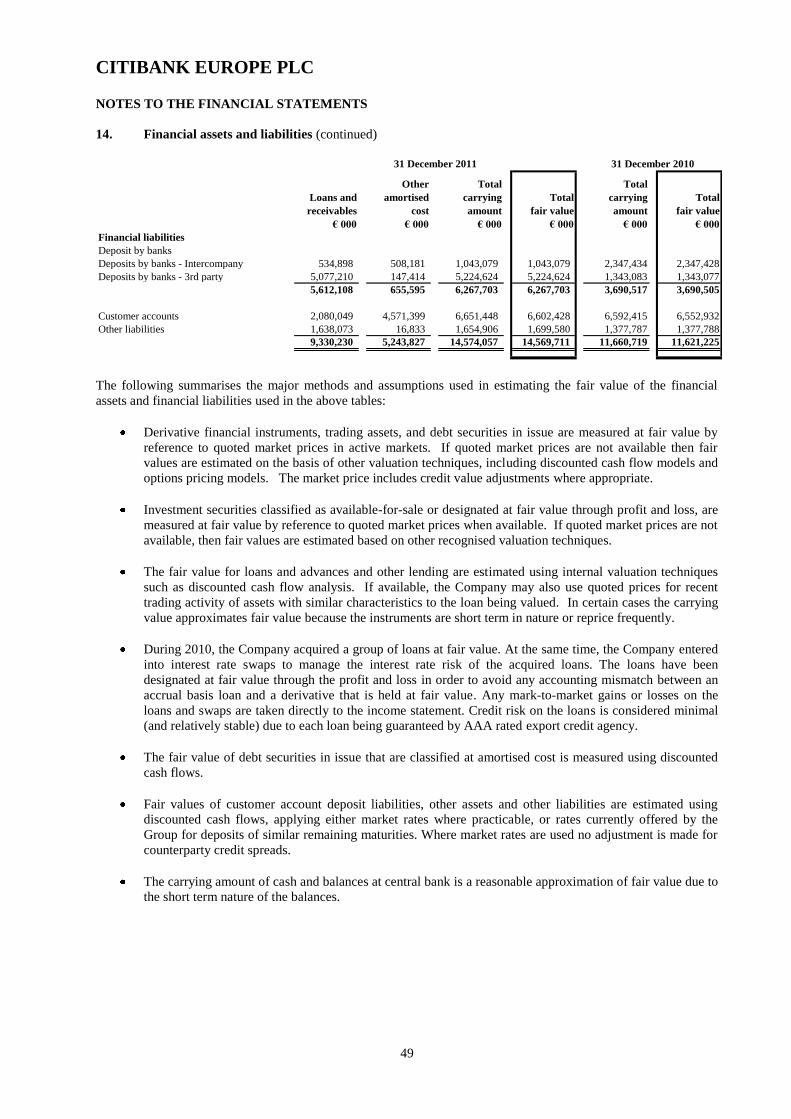
CITIBANK EUROPE PLC
49
NOTES TO THE FINANCIAL STATEMENTS
14. Financial assets and liabilities (continued)
Loans and
receivables
Other
amortised
cost
Total
carrying
amount
Total
fair value
Total
carrying
amount
Total
fair value
€ 000 € 000 € 000 € 000 € 000 € 000
Financial liabilities
Deposit by banks
Deposits by banks - Intercompany 534,898 508,181 1,043,079 1,043,079 2,347,434 2,347,428
Deposits by banks - 3rd party 5,077,210 147,414 5,224,624 5,224,624 1,343,083 1,343,077
5,612,108 655,595 6,267,703 6,267,703 3,690,517 3,690,505
Customer accounts 2,080,049 4,571,399 6,651,448 6,602,428 6,592,415 6,552,932
Other liabilities 1,638,073 16,833 1,654,906 1,699,580 1,377,787 1,377,788
9,330,230 5,243,827 14,574,057 14,569,711 11,660,719 11,621,225
31 December 201031 December 2011
The following summarises the major methods and assumptions used in estimating the fair value of the financial
assets and financial liabilities used in the above tables:
Derivative financial instruments, trading assets, and debt securities in issue are measured at fair value by
reference to quoted market prices in active markets. If quoted market prices are not available then fair
values are estimated on the basis of other valuation techniques, including discounted cash flow models and
options pricing models. The market price includes credit value adjustments where appropriate.
Investment securities classified as available-for-sale or designated at fair value through profit and loss, are
measured at fair value by reference to quoted market prices when available. If quoted market prices are not
available, then fair values are estimated based on other recognised valuation techniques.
The fair value for loans and advances and other lending are estimated using internal valuation techniques
such as discounted cash flow analysis. If available, the Company may also use quoted prices for recent
trading activity of assets with similar characteristics to the loan being valued. In certain cases the carrying
value approximates fair value because the instruments are short term in nature or reprice frequently.
During 2010, the Company acquired a group of loans at fair value. At the same time, the Company entered
into interest rate swaps to manage the interest rate risk of the acquired loans. The loans have been
designated at fair value through the profit and loss in order to avoid any accounting mismatch between an
accrual basis loan and a derivative that is held at fair value. Any mark-to-market gains or losses on the
loans and swaps are taken directly to the income statement. Credit risk on the loans is considered minimal
(and relatively stable) due to each loan being guaranteed by AAA rated export credit agency.
The fair value of debt securities in issue that are classified at amortised cost is measured using discounted
cash flows.
Fair values of customer account deposit liabilities, other assets and other liabilities are estimated using
discounted cash flows, applying either market rates where practicable, or rates currently offered by the
Group for deposits of similar remaining maturities. Where market rates are used no adjustment is made for
counterparty credit spreads.
The carrying amount of cash and balances at central bank is a reasonable approximation of fair value due to
the short term nature of the balances.
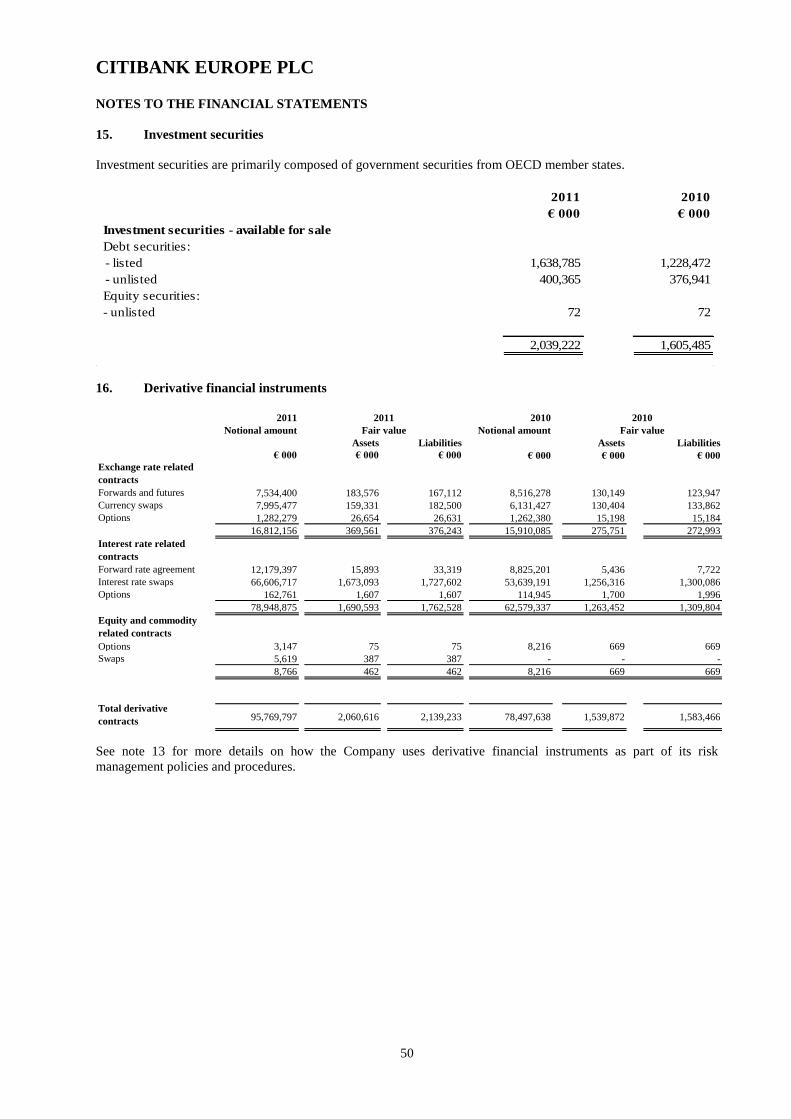
CITIBANK EUROPE PLC
50
NOTES TO THE FINANCIAL STATEMENTS
15. Investment securities
Investment securities are primarily composed of government securities from OECD member states.
2011 2010
€ 000 € 000
Investment securities - available for sale
Debt securities:
- listed 1,638,785 1,228,472
- unlisted 400,365 376,941
Equity securities:
- unlisted 72 72
2,039,222 1,605,485
16. Derivative financial instruments
2011 2010
Notional amount Notional amount
Assets Liabilities Assets Liabilities
€ 000 € 000 € 000 € 000 € 000 € 000
Exchange rate related
contracts
Forwards and futures 7,534,400 183,576 167,112 8,516,278 130,149 123,947
Currency swaps 7,995,477 159,331 182,500 6,131,427 130,404 133,862
Options 1,282,279 26,654 26,631 1,262,380 15,198 15,184
16,812,156 369,561 376,243 15,910,085 275,751 272,993
Interest rate related
contracts
Forward rate agreement 12,179,397 15,893 33,319 8,825,201 5,436 7,722
Interest rate swaps 66,606,717 1,673,093 1,727,602 53,639,191 1,256,316 1,300,086
Options 162,761 1,607 1,607 114,945 1,700 1,996
78,948,875 1,690,593 1,762,528 62,579,337 1,263,452 1,309,804
Equity and commodity
related contracts
Options 3,147 75 75 8,216 669 669
Swaps 5,619 387 387 - - -
8,766 462 462 8,216 669 669
Total derivative
contracts 95,769,797 2,060,616 2,139,233 78,497,638 1,539,872 1,583,466
Fair value Fair value
2011 2010
See note 13 for more details on how the Company uses derivative financial instruments as part of its risk
management policies and procedures.

CITIBANK EUROPE PLC
51
NOTES TO THE FINANCIAL STATEMENTS
17. Other liabilities
2011
€ 000
2010
€ 000
Accounts payable 1,253,544 1,031,357
Other balances 446,907 346,430
1,700,451 1,377,787
Accounts payable predominantly comprises amounts payable in relation to pre–funded obligations arising from the
Company‟s Worldlink multi–currency transaction services business. The other balances include amounts payable to
other financial institutions, corporates and other group entities, primarily relating to prepaid risk participations, items
in the process of settlement and supplier finance transactions.
18. Shares in subsidiary undertakings
2011
€ 000
2010
€ 000
At 1 January 1,295 1,295
Movements in year (23) -
At 31 December 1,272 1,295
The Company has an investment in the following subsidiary:
Name
Country of
incorporation Nature of business Year end Registered office
Percentage
ownership
Citibank Kereskedelmi
és Szolgáltató Kft. Hungary
Purchase and rental
of fixed assets 31 December
Hegyalja út 7-13., 1016,
Budapest, Hungary
100 percent of
ordinary share capital
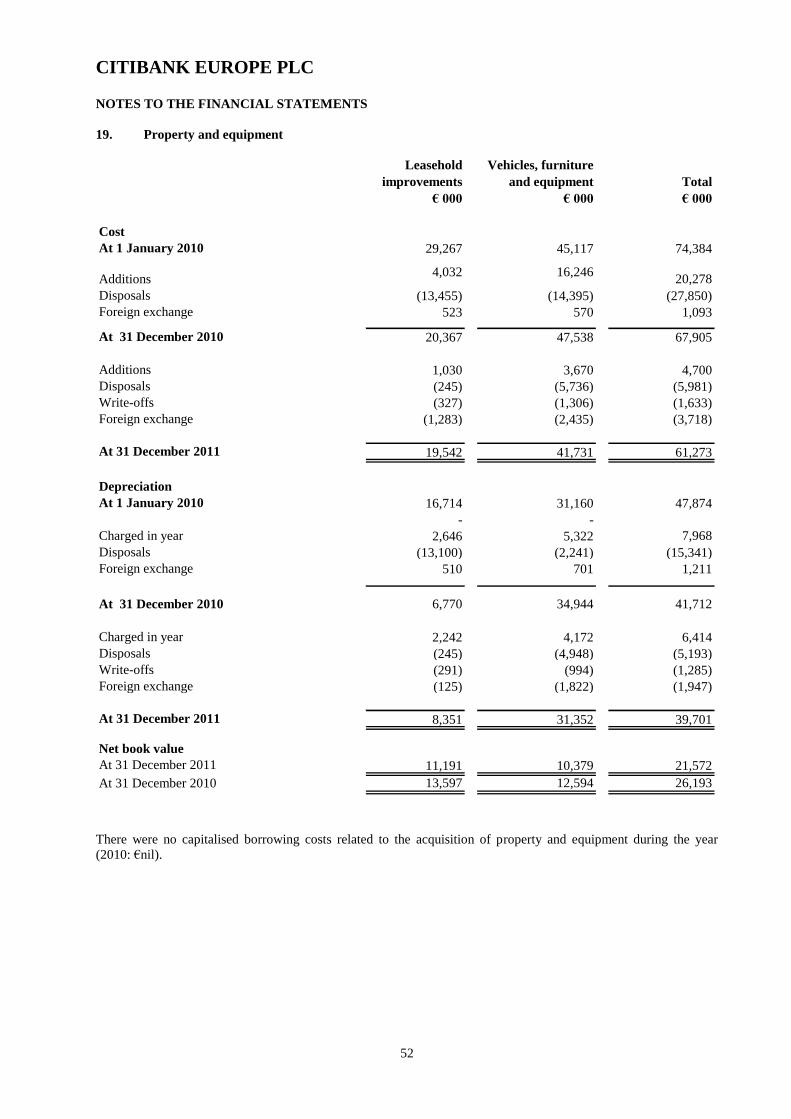
CITIBANK EUROPE PLC
52
NOTES TO THE FINANCIAL STATEMENTS
19. Property and equipment
Leasehold
improvements
€ 000
Vehicles, furniture
and equipment
€ 000
Total
€ 000
Cost
At 1 January 2010 29,267 45,117 74,384
Additions 4,032 16,246
20,278
Disposals (13,455) (14,395) (27,850)
Foreign exchange 523 570 1,093
At 31 December 2010 20,367 47,538 67,905
Additions 1,030 3,670 4,700
Disposals (245) (5,736) (5,981)
Write-offs (327) (1,306) (1,633)
Foreign exchange (1,283) (2,435) (3,718)
At 31 December 2011 19,542 41,731 61,273
Depreciation
At 1 January 2010 16,714 31,160 47,874
- -
Charged in year 2,646 5,322 7,968
Disposals (13,100) (2,241) (15,341)
Foreign exchange 510 701 1,211
At 31 December 2010 6,770 34,944 41,712
Charged in year 2,242 4,172 6,414
Disposals (245) (4,948) (5,193)
Write-offs (291) (994) (1,285)
Foreign exchange (125) (1,822) (1,947)
At 31 December 2011 8,351 31,352 39,701
Net book value
At 31 December 2011 11,191 10,379 21,572
At 31 December 2010 13,597 12,594 26,193
There were no capitalised borrowing costs related to the acquisition of property and equipment during the year
(2010: €nil).
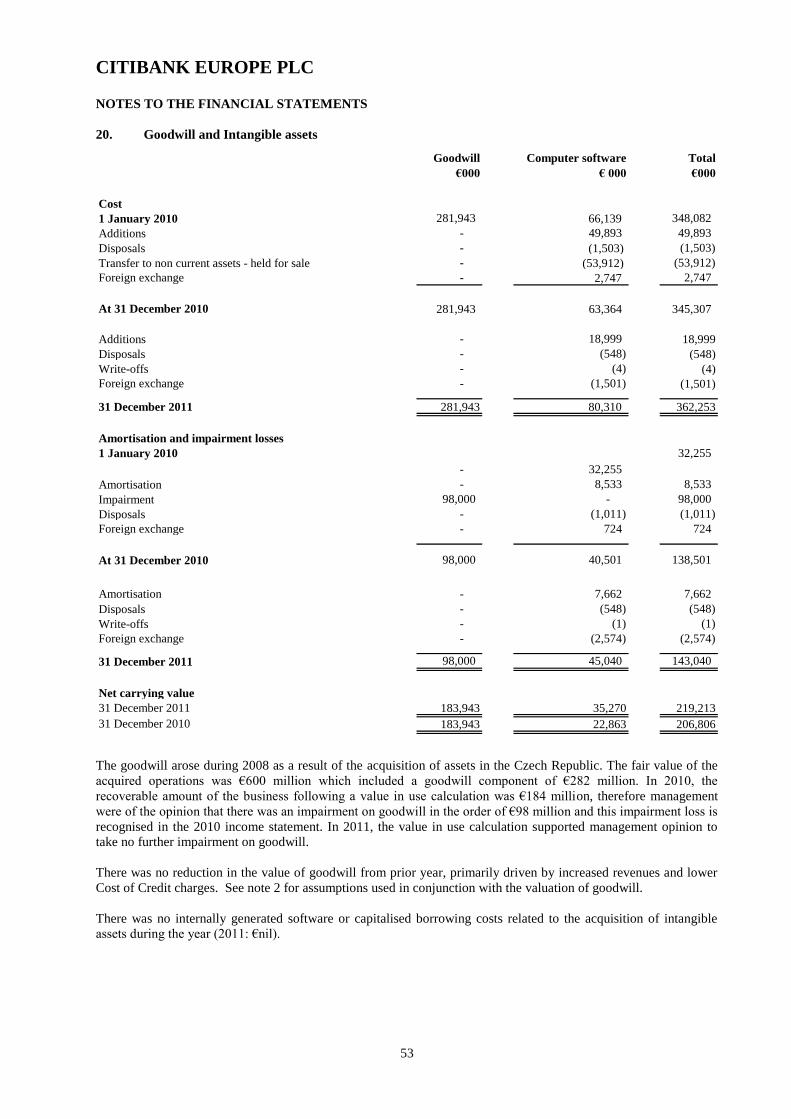
CITIBANK EUROPE PLC
53
NOTES TO THE FINANCIAL STATEMENTS
20. Goodwill and Intangible assets
Goodwill
€000
Computer software
€ 000
Total
€000
Cost
1 January 2010 281,943 66,139 348,082
Additions - 49,893 49,893
Disposals - (1,503) (1,503)
Transfer to non current assets - held for sale - (53,912) (53,912)
Foreign exchange - 2,747 2,747
At 31 December 2010 281,943 63,364 345,307
Additions - 18,999 18,999
Disposals - (548) (548)
Write-offs - (4) (4)
Foreign exchange - (1,501) (1,501)
31 December 2011 281,943 80,310 362,253
Amortisation and impairment losses
1 January 2010
- 32,255
32,255
Amortisation - 8,533 8,533
Impairment 98,000 - 98,000
Disposals - (1,011) (1,011)
Foreign exchange - 724 724
At 31 December 2010 98,000 40,501 138,501
Amortisation - 7,662 7,662
Disposals - (548) (548)
Write-offs - (1) (1)
Foreign exchange - (2,574) (2,574)
31 December 2011 98,000 45,040 143,040
Net carrying value
31 December 2011 183,943 35,270 219,213
31 December 2010 183,943 22,863 206,806
The goodwill arose during 2008 as a result of the acquisition of assets in the Czech Republic. The fair value of the
acquired operations was €600 million which included a goodwill component of €282 million. In 2010, the
recoverable amount of the business following a value in use calculation was €184 million, therefore management
were of the opinion that there was an impairment on goodwill in the order of €98 million and this impairment loss is
recognised in the 2010 income statement. In 2011, the value in use calculation supported management opinion to
take no further impairment on goodwill.
There was no reduction in the value of goodwill from prior year, primarily driven by increased revenues and lower
Cost of Credit charges. See note 2 for assumptions used in conjunction with the valuation of goodwill.
There was no internally generated software or capitalised borrowing costs related to the acquisition of intangible
assets during the year (2011: €nil).

CITIBANK EUROPE PLC
54
NOTES TO THE FINANCIAL STATEMENTS
21. Non current assets – held for sale
2011 2010
€'000 €'000
Intangible assets
Computer software - 53,912
- 53,912
During 2011, software amounting to €54 million was sold to an affiliated company.
22. Deferred tax assets
The movement on the deferred tax is as follows:
Balance at 1
January 2011
Recognised in the
Income statement
Recognised in other
comprehensive
income
Balance at 31
December 2011
Property / equipment and software 2,647 (2,371) - 276
Available for sale securities (366) 148 - (218)
Allowances for loan losses 2,915 2,681 - 5,596
Tax Loss carry-forward 560 (90) - 470
Share based payment transactions (408) 1,003 - 595
Other 5,105 (500) - 4,605
Total Asset 10,453 871 - 11,324
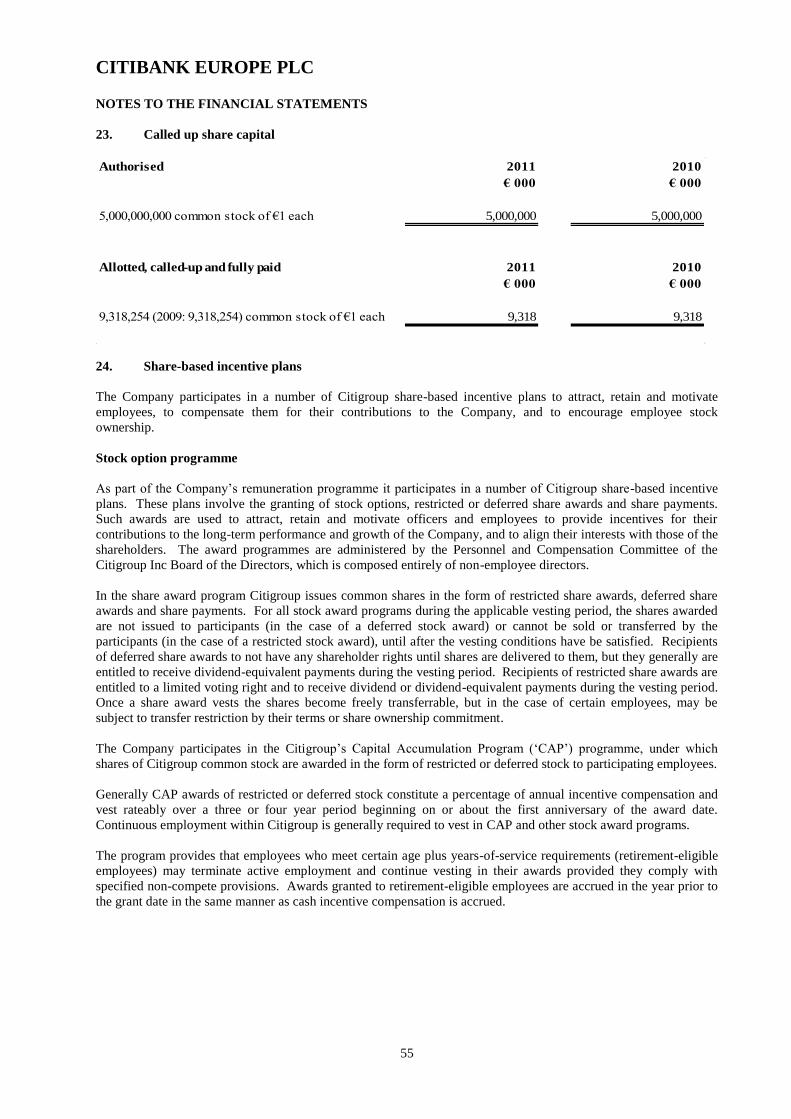
CITIBANK EUROPE PLC
55
NOTES TO THE FINANCIAL STATEMENTS
23. Called up share capital
Authorised 2011
€ 000
2010
€ 000
5,000,000,000 common stock of €1 each 5,000,000 5,000,000
Allotted, called-up and fully paid 2011
€ 000
2010
€ 000
9,318,254 (2009: 9,318,254) common stock of €1 each 9,318 9,318
24. Share-based incentive plans
The Company participates in a number of Citigroup share-based incentive plans to attract, retain and motivate
employees, to compensate them for their contributions to the Company, and to encourage employee stock
ownership.
Stock option programme
As part of the Company‟s remuneration programme it participates in a number of Citigroup share-based incentive
plans. These plans involve the granting of stock options, restricted or deferred share awards and share payments.
Such awards are used to attract, retain and motivate officers and employees to provide incentives for their
contributions to the long-term performance and growth of the Company, and to align their interests with those of the
shareholders. The award programmes are administered by the Personnel and Compensation Committee of the
Citigroup Inc Board of the Directors, which is composed entirely of non-employee directors.
In the share award program Citigroup issues common shares in the form of restricted share awards, deferred share
awards and share payments. For all stock award programs during the applicable vesting period, the shares awarded
are not issued to participants (in the case of a deferred stock award) or cannot be sold or transferred by the
participants (in the case of a restricted stock award), until after the vesting conditions have be satisfied. Recipients
of deferred share awards to not have any shareholder rights until shares are delivered to them, but they generally are
entitled to receive dividend-equivalent payments during the vesting period. Recipients of restricted share awards are
entitled to a limited voting right and to receive dividend or dividend-equivalent payments during the vesting period.
Once a share award vests the shares become freely transferrable, but in the case of certain employees, may be
subject to transfer restriction by their terms or share ownership commitment.
The Company participates in the Citigroup‟s Capital Accumulation Program („CAP‟) programme, under which
shares of Citigroup common stock are awarded in the form of restricted or deferred stock to participating employees.
Generally CAP awards of restricted or deferred stock constitute a percentage of annual incentive compensation and
vest rateably over a three or four year period beginning on or about the first anniversary of the award date.
Continuous employment within Citigroup is generally required to vest in CAP and other stock award programs.
The program provides that employees who meet certain age plus years-of-service requirements (retirement-eligible
employees) may terminate active employment and continue vesting in their awards provided they comply with
specified non-compete provisions. Awards granted to retirement-eligible employees are accrued in the year prior to
the grant date in the same manner as cash incentive compensation is accrued.
CITIBANK EUROPE PLC
56
NOTES TO THE FINANCIAL STATEMENTS
24. Share-based incentive plans (continued)
Stock award programme
For all stock award programmes, during the applicable vesting period, the shares awarded cannot be sold or
transferred by the participant, and the award is subject to cancellation if the participant‟s employment is terminated.
After the award vests, the shares become freely transferable (subject to the stock ownership commitment of senior
employees). From the date of award, the recipient of a restricted stock award can direct the vote of the shares and
receive regular dividends to the extent dividends are paid on Citigroup common stock. Recipients of deferred stock
awards receive dividend equivalents to the extent dividends are paid on Citigroup common stock, but cannot vote.
Stock awards granted from 2005 generally vest 25% per year over four years. CAP participants were able until
recently to elect to receive all or part of their award in stock options. The figures presented in the stock option
programme table include options granted under CAP.
In 2010 the Company award Deferred Cash stock Unit‟s (“DCSU”) however none were issued in 2011. This award
consists of a deferred cash award that is denominated in units of Citigroup common stock, with each stock unit
having a value equal to one share of Citigroupcommon stock reported on the NYSE. The award vests over a two
year period and earns a notional return that tracks the price of Citigroupcommon stock during the vesting period.
The DCSU has been accounted for as a cash settled liability.
As part of the 2010 and 2011 remuneration the Company entered into an arrangement referred to as an “EU Short
Term” award. The award will be delivered in the form of immediately vested restricted shares subject to a six
month sale restriction.
Citigroupparticipated in a 1-for-10 reverse stock split of Citigroup common stock effective after the close of trading
on 6 May 2011. Every ten shares of issued and outstanding Citigroup common stock was automatically combined
into one issued and outstanding share of common stock without any change in the par value per share. No fractional
shares were issued in connection with the reverse stock split.
Information with respect to current year stock awards is as follows:
2011 2010*
83,680 142,905
$49.92 $35.20
EUR EUR
5,030,816 5,366,947
1,325,788 447,144
3,705,027 4,919,803
Shares awarded
Fair value adjustments recorded to equity
Total carrying amount of equity-settled transaction liability
Weighted average fair market value per share
Compensation cost charged to earnings
* adjusted for reverse stock split
Stock option programme
The Company also participates in a number of Citigroup stock option programmes for its employees. Generally,
since January 2005, stock options have been granted only to CAP participants who elect to receive stock options in
lieu of restricted or deferred stock awards and to non-employee directors who elect to receive their compensation in
the form of a stock option grant.
All stock options are granted on Citigroup common stock with exercise prices equal to the fair market value at the
time of grant.
Options granted since January 2005 typically vest 25% each year over four years and have six-year terms. Options
granted in 2004 and 2003 typically also have six-year terms but vest in thirds each year over three years, with the
first vesting date occurring 17 months after the grant date. The sale of underlying shares acquired through the
exercise of employee stock options granted since 2003 is restricted for a two-year period (and the shares are subject
to stock ownership commitment of senior employees thereafter).
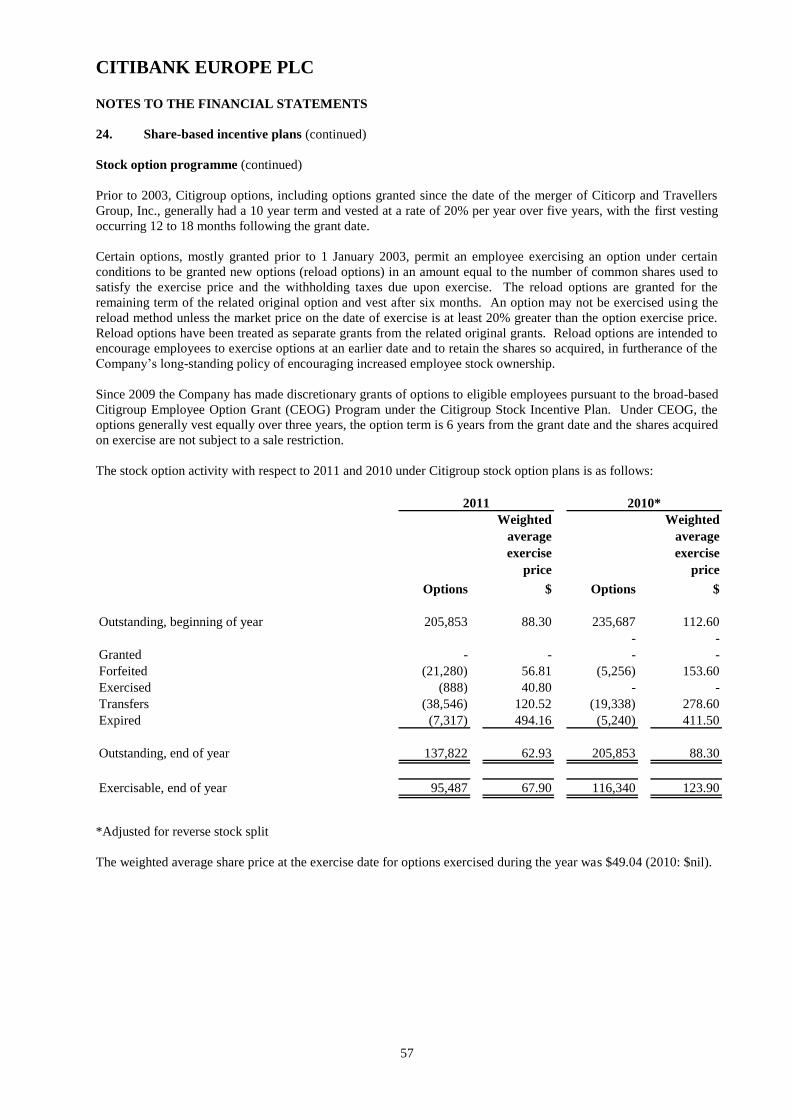
CITIBANK EUROPE PLC
57
NOTES TO THE FINANCIAL STATEMENTS
24. Share-based incentive plans (continued)
Stock option programme (continued)
Prior to 2003, Citigroup options, including options granted since the date of the merger of Citicorp and Travellers
Group, Inc., generally had a 10 year term and vested at a rate of 20% per year over five years, with the first vesting
occurring 12 to 18 months following the grant date.
Certain options, mostly granted prior to 1 January 2003, permit an employee exercising an option under certain
conditions to be granted new options (reload options) in an amount equal to the number of common shares used to
satisfy the exercise price and the withholding taxes due upon exercise. The reload options are granted for the
remaining term of the related original option and vest after six months. An option may not be exercised using the
reload method unless the market price on the date of exercise is at least 20% greater than the option exercise price.
Reload options have been treated as separate grants from the related original grants. Reload options are intended to
encourage employees to exercise options at an earlier date and to retain the shares so acquired, in furtherance of the
Company‟s long-standing policy of encouraging increased employee stock ownership.
Since 2009 the Company has made discretionary grants of options to eligible employees pursuant to the broad-based
Citigroup Employee Option Grant (CEOG) Program under the Citigroup Stock Incentive Plan. Under CEOG, the
options generally vest equally over three years, the option term is 6 years from the grant date and the shares acquired
on exercise are not subject to a sale restriction.
The stock option activity with respect to 2011 and 2010 under Citigroup stock option plans is as follows:
Weighted
average
exercise
price
Weighted
average
exercise
price
Options $ Options $
205,853 88.30 235,687 112.60
- -
- - - -
(21,280) 56.81 (5,256) 153.60
(888) 40.80 - -
(38,546) 120.52 (19,338) 278.60
(7,317) 494.16 (5,240) 411.50
137,822 62.93 205,853 88.30
95,487 67.90 116,340 123.90
Forfeited
Exercised
Transfers
Expired
Outstanding, end of year
Exercisable, end of year
2011 2010*
Outstanding, beginning of year
Granted
*Adjusted for reverse stock split
The weighted average share price at the exercise date for options exercised during the year was $49.04 (2010: $nil).
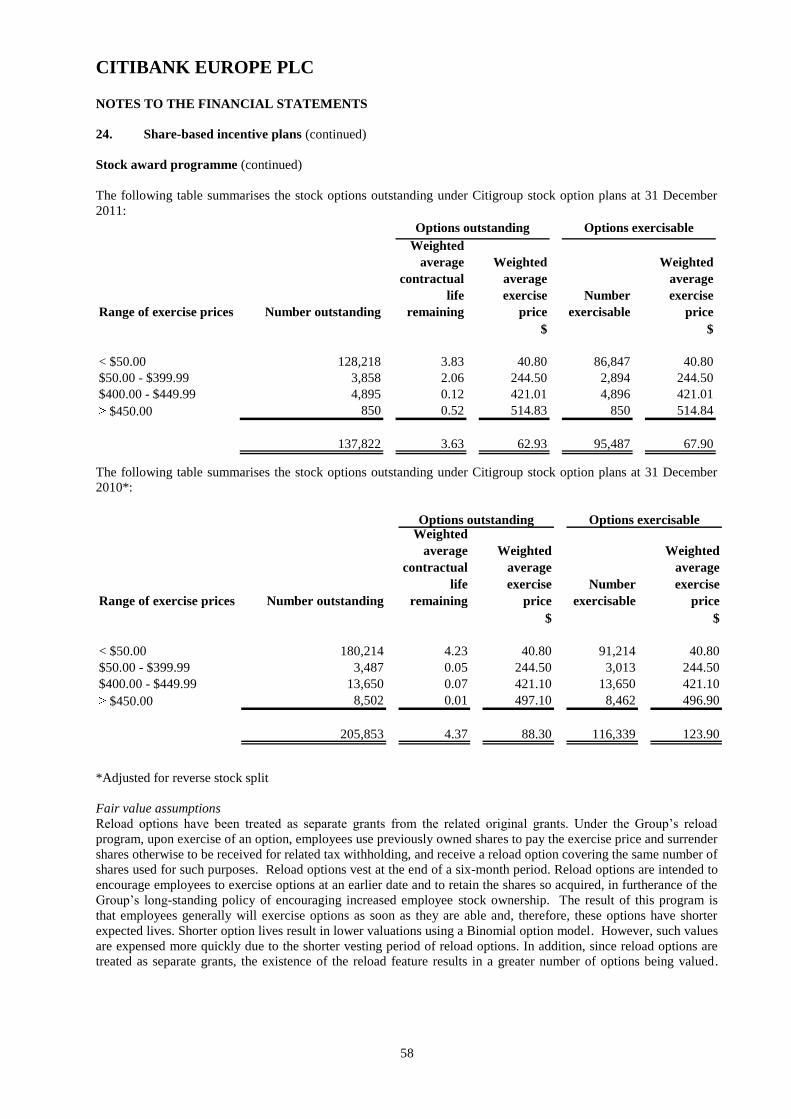
CITIBANK EUROPE PLC
58
NOTES TO THE FINANCIAL STATEMENTS
24. Share-based incentive plans (continued)
Stock award programme (continued)
The following table summarises the stock options outstanding under Citigroup stock option plans at 31 December
2011:
Range of exercise prices Number outstanding
Weighted
average
contractual
life
remaining
Weighted
average
exercise
price
Number
exercisable
Weighted
average
exercise
price
$ $
< $50.00 128,218 3.83 40.80 86,847 40.80
$50.00 - $399.99 3,858 2.06 244.50 2,894 244.50
$400.00 - $449.99 4,895 0.12 421.01 4,896 421.01
$450.00 850 0.52 514.83 850 514.84
137,822 3.63 62.93 95,487 67.90
Options outstanding Options exercisable
The following table summarises the stock options outstanding under Citigroup stock option plans at 31 December
2010*:
Range of exercise prices Number outstanding
Weighted
average
contractual
life
remaining
Weighted
average
exercise
price
Number
exercisable
Weighted
average
exercise
price
$ $
< $50.00 180,214 4.23 40.80 91,214 40.80
$50.00 - $399.99 3,487 0.05 244.50 3,013 244.50
$400.00 - $449.99 13,650 0.07 421.10 13,650 421.10
$450.00 8,502 0.01 497.10 8,462 496.90
205,853 4.37 88.30 116,339 123.90
Options outstanding Options exercisable
*Adjusted for reverse stock split
Fair value assumptions
Reload options have been treated as separate grants from the related original grants. Under the Group‟s reload
program, upon exercise of an option, employees use previously owned shares to pay the exercise price and surrender
shares otherwise to be received for related tax withholding, and receive a reload option covering the same number of
shares used for such purposes. Reload options vest at the end of a six-month period. Reload options are intended to
encourage employees to exercise options at an earlier date and to retain the shares so acquired, in furtherance of the
Group‟s long-standing policy of encouraging increased employee stock ownership. The result of this program is
that employees generally will exercise options as soon as they are able and, therefore, these options have shorter
expected lives. Shorter option lives result in lower valuations using a Binomial option model. However, such values
are expensed more quickly due to the shorter vesting period of reload options. In addition, since reload options are
treated as separate grants, the existence of the reload feature results in a greater number of options being valued.

CITIBANK EUROPE PLC
59
NOTES TO THE FINANCIAL STATEMENTS
24. Share-based incentive plans (continued)
Stock award programme (continued)
Shares received through option exercises under the reload program, as well as certain other options granted, are subject to
restrictions on sale. Discounts have been applied to the fair value of options granted to reflect these sale restrictions.
Additional valuation and related assumption information for Citigroup option plans is presented below. Citigroup used a
binomial model to value stock options. Volatility has been estimated by taking the historical volatility in traded Citigroup
options and adjusting where there are known factors that may affect future volatility.
2011 2010
Weighted average fair value at year end of options granted during the year $0.00 $0.00
4 years 4 years
0 years 1 years
4 years 4 years
41.10% 37.05%
0.60% 1.73%
0.10% 0.00%
9.60% 9.62%Expected annual forfeitures
Weighted average expected life
Original grants
Reload grants
Option life
Valuation assumptions
Expected volatility
Risk-free interest rate
Expected dividend yield
25. Contingent liabilities and commitments
The following tables give the nominal principal amounts and risk weighted amounts of contingent liabilities and
commitments. The nominal principal amounts indicate the volume of business outstanding at the statement of financial
position date and do not represent amounts at risk. The risk weighted amounts have been calculated in accordance with the
guidelines on capital adequacy issued by Central Bank of Ireland.
Contract
amount
Risk
weighted
amount
Contract
amount
Risk
weighted
amount
2011
€000
2011
€000
2010
€000
2010
€000
Undrawn Credit lines 2,569,285 1,019,653 2,715,620 899,427
Other commitments
- less than 1 yr 5,489,143 1,608,001 5,341,953 1,586,786
- 1 yr and over 9,303,179 1,349,281 8,639,261 1,463,423
Extended rate commitment 169,256 169,256 224,000 224,000
Total 17,530,862 4,146,191 16,920,834 4,173,636
Other commitments primarily relate to the Insurance Letters of Credit business.
CITIBANK EUROPE PLC
60
NOTES TO THE FINANCIAL STATEMENTS
25. Contingent liabilities and commitments (continued)
The Company held an impairment provision of €18 million as at 31 December 2011 (2010: €8.2 million), with respect to
its commitments.
The extended rate commitment is a facility providing fixed foreign exchange rates against clients operational cashflows for
a set number of days after the rate is fixed.
26. Operating lease commitments
2011
€ 000
2010
€ 000
Expiring:
- within one year 2,777 3,668
- between one and five years 21,127 23,941
- in five years or more 14,305 16,166
38,209 43,775
27. Related party transactions
The Company is a wholly owned subsidiary undertaking of Citibank Holdings Ireland Limited, which is incorporated in
Ireland. The largest Company in which the results of the Company are consolidated is that headed by Citigroup Inc.,
which is incorporated in the United States of America. The Company defines related parties as the Board of Directors,
senior management, their close family members, parent and fellow subsidiaries and associated companies. The Company
considers the key management of the Company to be the Board of Directors. Directors‟ remuneration is disclosed in note 9.
At 31 December 2011 there were no outstanding exposures to Directors including loans (2010: €nil).
A number of arms‟ length transactions are entered into with other Group companies. These include loans and deposits that
provide funding to Group companies as well as derivative contracts used to hedge residual risks that are included in the
other assets and other liabilities balances. Various services are provided between related parties and these are all also
provided at arm‟s length. The table below summarises balances with related parties.
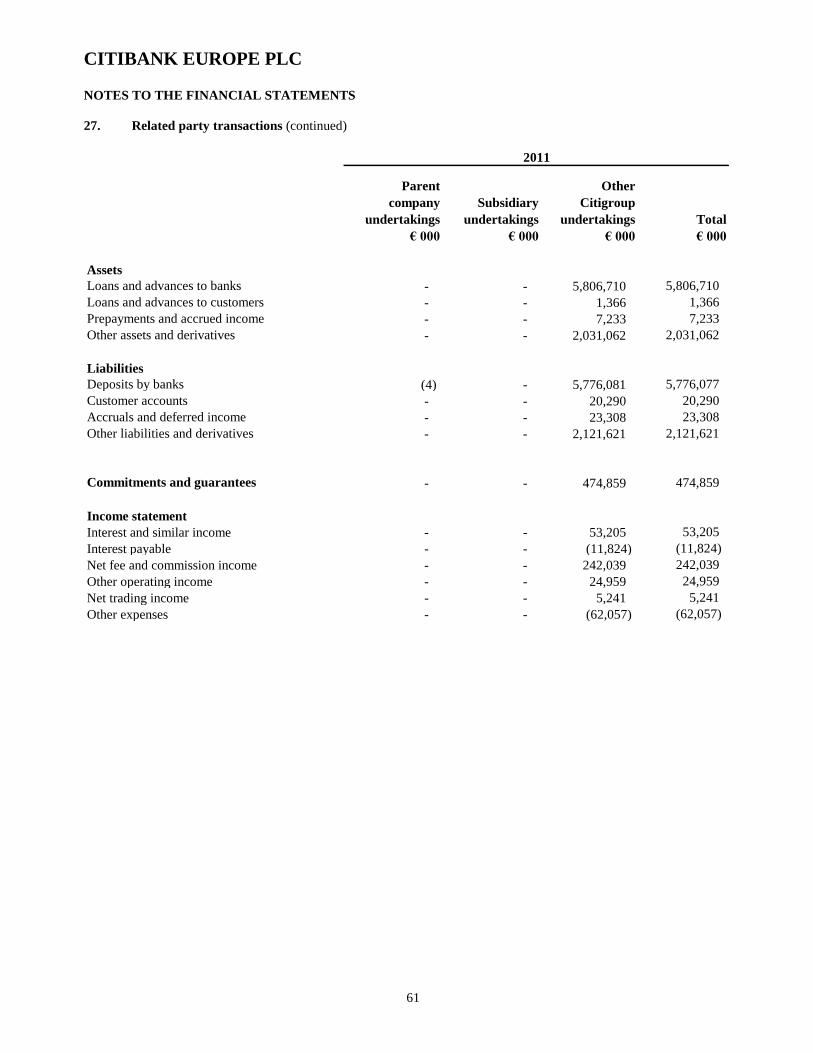
CITIBANK EUROPE PLC
61
NOTES TO THE FINANCIAL STATEMENTS
27. Related party transactions (continued)
Parent
company
undertakings
€ 000
Subsidiary
undertakings
€ 000
Other
Citigroup
undertakings
€ 000
Total
€ 000
Assets
Loans and advances to banks - - 5,806,710 5,806,710
Loans and advances to customers - - 1,366 1,366
Prepayments and accrued income - - 7,233 7,233
Other assets and derivatives - - 2,031,062 2,031,062
Liabilities
Deposits by banks (4) - 5,776,081 5,776,077
Customer accounts - - 20,290 20,290
Accruals and deferred income - - 23,308 23,308
Other liabilities and derivatives - - 2,121,621 2,121,621
Commitments and guarantees - - 474,859 474,859
Income statement
Interest and similar income - - 53,205 53,205
Interest payable - - (11,824) (11,824)
Net fee and commission income - - 242,039 242,039
Other operating income - - 24,959 24,959
Net trading income - - 5,241 5,241
Other expenses - - (62,057) (62,057)
2011
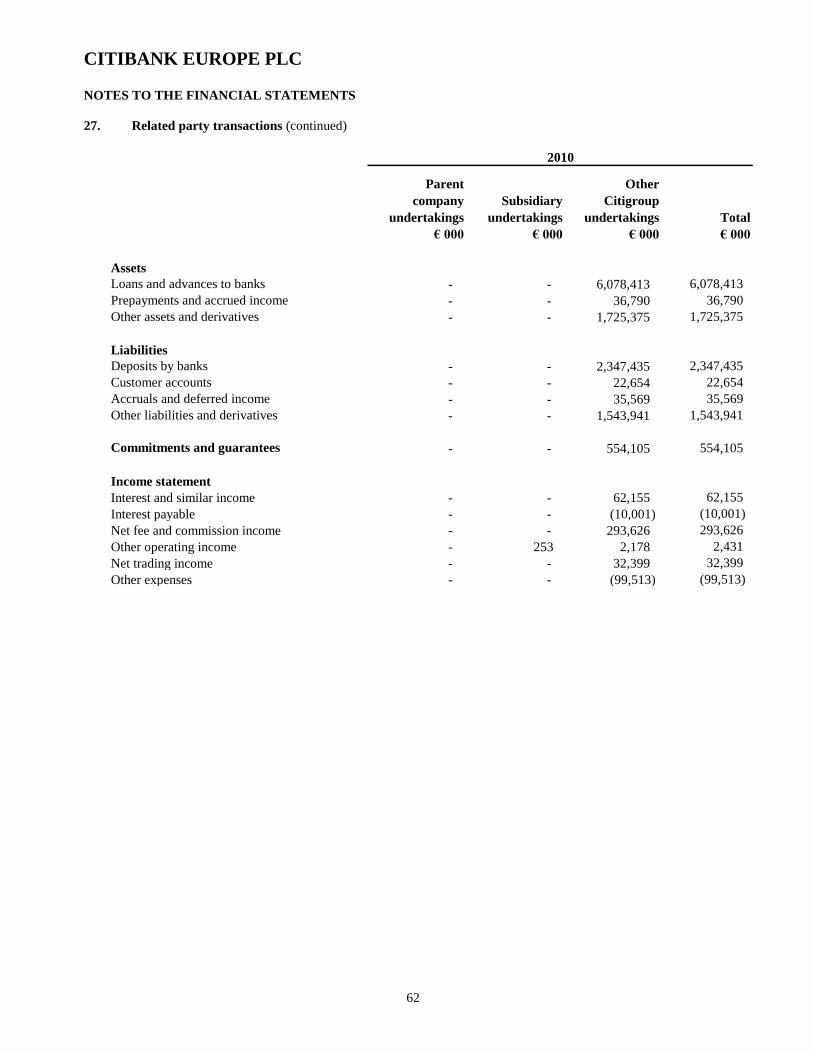
CITIBANK EUROPE PLC
62
NOTES TO THE FINANCIAL STATEMENTS
27. Related party transactions (continued)
Parent
company
undertakings
€ 000
Subsidiary
undertakings
€ 000
Other
Citigroup
undertakings
€ 000
Total
€ 000
Assets
Loans and advances to banks - - 6,078,413 6,078,413
Prepayments and accrued income - - 36,790 36,790
Other assets and derivatives - - 1,725,375 1,725,375
Liabilities
Deposits by banks - - 2,347,435 2,347,435
Customer accounts - - 22,654 22,654
Accruals and deferred income - - 35,569 35,569
Other liabilities and derivatives - - 1,543,941 1,543,941
Commitments and guarantees - - 554,105 554,105
Income statement
Interest and similar income - - 62,155 62,155
Interest payable - - (10,001) (10,001)
Net fee and commission income - - 293,626 293,626
Other operating income - 253 2,178 2,431
Net trading income - - 32,399 32,399
Other expenses - - (99,513) (99,513)
2010
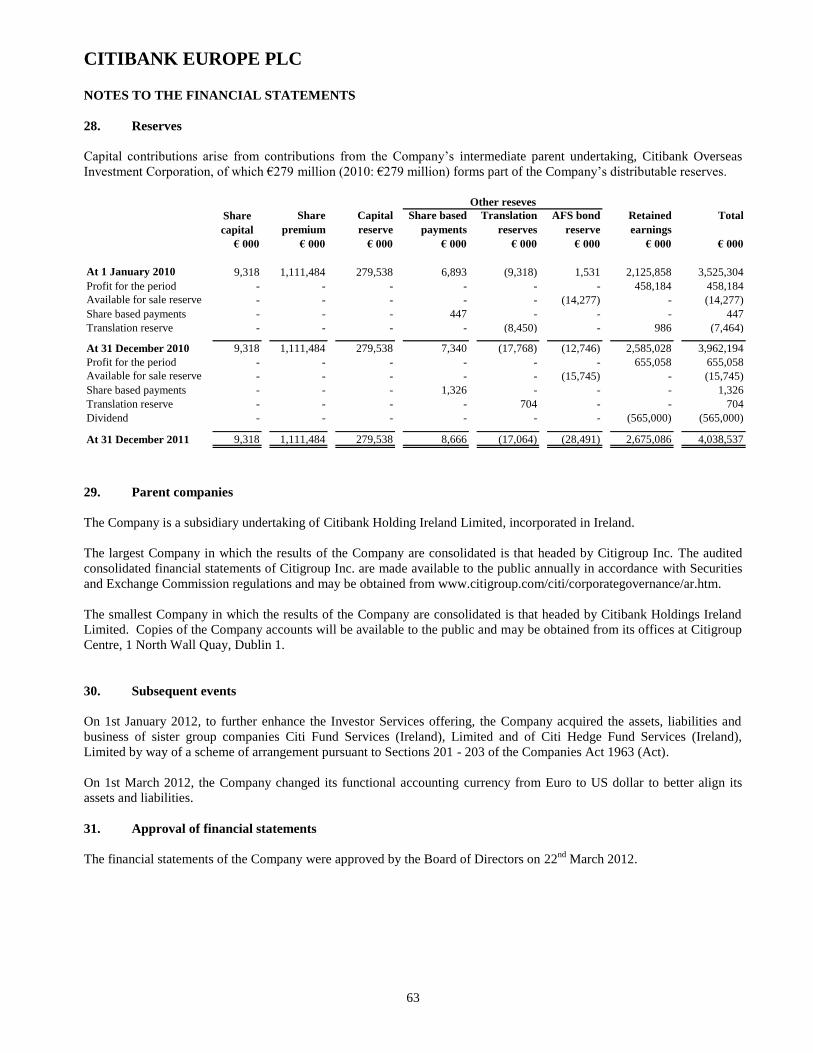
CITIBANK EUROPE PLC
63
NOTES TO THE FINANCIAL STATEMENTS
28. Reserves
Capital contributions arise from contributions from the Company‟s intermediate parent undertaking, Citibank Overseas
Investment Corporation, of which €279 million (2010: €279 million) forms part of the Company‟s distributable reserves.
Share
premium
Capital
reserve
Share based
payments
Translation
reserves
AFS bond
reserve
Retained
earnings
Total
€ 000 € 000 € 000 € 000 € 000 € 000 € 000 € 000
At 1 January 2010 9,318 1,111,484 279,538 6,893 (9,318) 1,531 2,125,858 3,525,304
Profit for the period - - - - - - 458,184 458,184
Available for sale reserve - - - - - (14,277) - (14,277)
Share based payments - - - 447 - - - 447
Translation reserve - - - - (8,450) - 986 (7,464)
At 31 December 2010 9,318 1,111,484 279,538 7,340 (17,768) (12,746) 2,585,028 3,962,194
Profit for the period - - - - - - 655,058 655,058
Available for sale reserve - - - - - (15,745) - (15,745)
Share based payments - - - 1,326 - - - 1,326
Translation reserve - - - - 704 - - 704
Dividend - - - - - - (565,000) (565,000)
At 31 December 2011 9,318 1,111,484 279,538 8,666 (17,064) (28,491) 2,675,086 4,038,537
Share
capital
Other reseves
29. Parent companies
The Company is a subsidiary undertaking of Citibank Holding Ireland Limited, incorporated in Ireland.
The largest Company in which the results of the Company are consolidated is that headed by Citigroup Inc. The audited
consolidated financial statements of Citigroup Inc. are made available to the public annually in accordance with Securities
and Exchange Commission regulations and may be obtained from www.citigroup.com/citi/corporategovernance/ar.htm.
The smallest Company in which the results of the Company are consolidated is that headed by Citibank Holdings Ireland
Limited. Copies of the Company accounts will be available to the public and may be obtained from its offices at Citigroup
Centre, 1 North Wall Quay, Dublin 1.
30. Subsequent events
On 1st January 2012, to further enhance the Investor Services offering, the Company acquired the assets, liabilities and
business of sister group companies Citi Fund Services (Ireland), Limited and of Citi Hedge Fund Services (Ireland),
Limited by way of a scheme of arrangement pursuant to Sections 201 - 203 of the Companies Act 1963 (Act).
On 1st March 2012, the Company changed its functional accounting currency from Euro to US dollar to better align its
assets and liabilities.
31. Approval of financial statements
The financial statements of the Company were approved by the Board of Directors on 22nd
March 2012.