chromatographic evaluation of resolution and secondary mechanisms of pure and mixed sets of sec...
TRANSCRIPT

Chromatographic Evaluation of Resolutionand Secondary Mechanisms of Pureand Mixed Sets of SEC Columns:TSK-Gel HHR and TSK-Gel HXL
R. Garcıa-Lopera1, C. M. Gomez1, M. Falo1, C. Abad2, A. Campos1,&
1 Institut de Ciencia dels Materials, Departament de Quımica Fısica; 46100 Burjassot, Valencia, Spain;E-Mail: [email protected] Departament de Bioquımica i Biologia Molecular. Universitat de Valencia; 46100 Burjassot, Valencia, Spain;E-Mail: [email protected]
Received: 5 March 2003 / Revised: 11 June and 15 September 2003 / Accepted: 11 November 2003Online publication: 6 February 2004
Abstract
Size exclusion chromatographic (SEC) evaluation of secondary mechanisms and column spe-cific resolution, of five solvent/polymer systems in four sets of pure and mixed organic columnspackings based on polystyrene/divinylbenzene copolymer, TSK-Gel HHR and TSK-Gel HXL, hasbeen carried out. The combination of columns employed has been: (i) three HHR columns (set A);(ii) two HHR and one HXL column (set B); (iii) one HHR and two HXL columns (set C) and (iv) threeHXL columns (set D). Both packings offer similar characteristics (pore size, particle size, effi-ciency) but some differences have been found when eluting the same systems in differentcombination of both of them. Values of the chromatographic partition coefficient, Kp, of thevolume fraction of the network in the swollen state, /3, and the concentration effect onthe retention volume have been related. It can be concluded that the higher the /3, the higherthe crosslinking degree and Kp, and the higher the concentration effect on the retention volumefor a given solvent/polymer system. We also observe that, in general, a decrease of Kp comesalong with an increase of specific resolution, RS, and that the sets of mixed columns show lowersecondary effects different from pure size exclusion (lower Kp) and higher RS than the two sets ofpure HHR or HXL columns.
Keywords
Size exclusion chromatographyColumn packingUniversal calibrationSpecific resolution
Introduction
Size-exclusion chromatography (SEC) is
a widely employed method for polymer
molar mass determination [1]. Recent
developments in polymer characteriza-
tion through the SEC technique involve
modern columns and combination of
different detectors to obtain a better
resolution [2–10]. Instrumentation for
on-line molecular size determinations
such as light scattering and viscosity
detectors, in addition to a typical con-
centration detector (refractive index),
allow to obtain more accurate determi-
nations of molar mass distributions
(MMDs) and average molar masses
[3, 8], and also to correct the concen-
tration effect on the retention volume [3,
4]. However, in the cases where a unique
concentration detector is available, it is
desirable that size exclusion should be
the only mechanism governing the sep-
aration process inside the column, and
that secondary mechanisms such as
partition or adsorption will be negligible
[11, 12]. The size exclusion mechanism is
solely controlled by the solute hydrody-
namic volume and the average molar
mass determined from calibration
curves. In order to obtain accurate re-
sults, some chromatographic parameters
influencing the retention profile have to
be controlled. Among them, it deserves
to be mentioned the characteristics of
the packing material (particle and pore
size), the flow rate, the molar mass of
the eluting polymers, the injected
polymer concentration and the specific
resolution, RS, which measures the sep-
aration efficiency of the columns and is
related with the number of theoretical
plates [13].
Summarizing, minima secondary ef-
fects represented by the chromato-
graphic partition coefficient, Kp, and
maxima RS values, are desirable for a
better performance of a SEC column.
Moreover, the lower the concentration
effect on the retention volume the better
accuracy in the determination of
MMDs.
DOI: 10.1365/s10337-003-0181-9
Presented at: International Symposium on Se-paration and Characterization of Natural andSynthetic Macromolecules, Amsterdam, TheNetherlands, February 5–7, 2003
2004, 59, 355–360
0009-5893/04/03 � 2004 Friedr. Vieweg & Sohn Verlagsgesellschaft mbH
Original Chromatographia 2004, 59, March (No. 5/6) 355
In this respect, SEC research in our
group has been focussed on determining
the characteristic chromatographic para-
meters of different SEC columns such as
TSK-Gel HHR [12] and TSK-Gel HXL
[14]. These works revealed that, in gen-
eral, the HXL packings posses higher
crosslinking degree and lower swelling
degree than the HHR ones, for the same
solvent/polymer systems elution. Also, we
observed that, in general, the columns
with higher crosslinking degree induce
increasing secondary effects, mainly
polymer-gel matrix attractive interactions
quantified by Kp. These effects have also
been related with the preferential solva-
tion phenomenon of the polymer sample
onto the gel matrix [15]. In order to better
clarify the applicability of these packings,
we have aimed our investigations to elu-
cidate the chromatographic response of
four sets of columns, each one formed by
three columns in series. In the four sets of
columns analysed we have gradually
changed from pure HR to pure XL
columns by mixing both packings in
series. Thus, the assayed column sets
have been: (i) HR + HR + HR (set A),
(ii) HR + XL + HR (set B), (iii)
XL + HR + XL (set C) and (iv)
XL + XL + XL (set D). For each set,
the raw data are the universal calibration
plots, log(hydrodynamic volume) against
retention volume, of five solvent/polymer
systems, from which the Kp values have
been determined. Furthermore, some
equations previously reported from ther-
modynamic studies [16] have served to
obtain the volume fraction of the network
in the swollen state, /3, for the four sets.
The specific resolution of each set of col-
umns has been evaluated from the reten-
tion volumes and polydispersity index of
the eluted samples. Finally, the concen-
tration effects have been analysed by
quantifying the change on the retention
volume with the injected concentration,
DVR/Dc. Therefore, in this paper, we
compare the parameters /3, Kp, RS and
the concentration effects for the four sets
of pure and mixed TSK-Gel HHR and
HXL columns.
Experimental
Chemicals
Narrow standard polymer samples of
polybutadiene (PBD) (polydispersity
index, I ¼ 1.03–1.15) purchased from
Polymer Source Inc. (Dorval, Canada)
and poly(dimethyl siloxane) (PDMS)
(I ¼ 1.06–1.23) from Polymer Laborato-
ries (Shropshire, UK) and Polymer
Source Inc. (Dorval, Canada) were
used as polymeric solutes. Their weight-
average molar masses are compiled in
Table 1. Tetrahydrofuran (THF), ben-
zene (Bz), toluene (Tol) and 1–4 dioxane
(Diox) of chromatographic grade from
Scharlau (Barcelona, Spain) were used as
solvents or eluents.
Chromatography
A Waters liquid chromatography equip-
ment with refractive index detector was
used for SEC experiments as previously
described [17–19]. Four sets of three col-
umns (each one of 7.8 mm ID · 300 mm)
based on a polystyrene/divinylbenzene,
(PS/DVB) crosslinked copolymer TSK-
Gel from Tosohaas, Tosoh Corp.
(Tokyo, Japan) have been compared. In
the four sets of columns analysed we have
gradually changed from pure HR to pure
XL columns by mixing both packings in
series. Thus, the assayed column sets
have been: (i) HR + HR + HR (set A),
(ii) HR + XL + HR (set B), (iii)
XL + HR + XL (set C) and (iv)
XL + XL + XL (set D). Their packing
characteristics as particle size, nominal
pore size, pore and total exclusion vol-
umes (Vp and V0) are summarised in
Table 2 for the individual columns and in
Table 3 for the column sets.
All the solvents used as eluents were
previously degassed and filtered by pass-
ing them under vacuum through a
0.45 lm regenerated cellulose filter from
Micro Filtration Systems (Dublin, CA,
USA). All chromatographic experiments
were performed at 25 �C and the columns
were equilibrated overnight prior to
starting any experiment. Chromatograms
were obtained at a flow rate of 1 mL
min)1 by injection of 100 lL of sample
solution. To avoid concentration effects
[1] on the retention volumes, VR, all sol-
ute samples were injected at four con-
centrations and extrapolated to zero
concentration. The concentration effect
on VR was evaluated for every system as
DVR/Dc (mL2 g)1). The elution behaviour
was analysed in terms of the ‘‘universal
calibration’’ curves made by plotting the
hydrodynamic volumes, Vh (as log M[g])versus VR. The five systems assayed
were: THF/PBD, Bz/PBD, Diox/PBD,
Bz/PDMS and Tol/PDMS.
Viscometry
An automatic AVS 440 Ubbehlode-type
capillary viscometer from Schott Gerate
(Hofheim, Germany) at (25.0 ± 0.1) �Cwas used to perform viscometric mea-
surements. The stock solution was made
by dissolving the polymer samples in the
corresponding solvent up to a concen-
tration of approximately 1.0 g dL)1. At
least six dilutions were obtained by add-
ing the appropriate aliquots of solvent.
Efflux time of the solvent was always
above 100 s. For each solution, a 12 mL
sample, to minimize drainage errors, was
loaded into the viscometer and placed in
the thermostated bath. Measurements
started after an equilibration time of ca.
5–10 min and were continued until sev-
eral flow time readings agreed to within
0.5%. The elution time of each solution is
then determined as the average of several
readings. The dilution and measurements
are stopped when the viscosity difference
of the sample solution and pure solvent
drops below 10%.
The intrinsic viscosity, [g], for the
different solvent-polymer pairs was eval-
uated by extrapolation to infinite dilution
(zero solute concentration) of Huggins
plots: gsp/c ¼ [g] + bc , i.e. gsp/c vs. c,
being gsp the specific viscosity, c the
Table 1. Weight-average molar masses ( �Mw) of the narrow standard polymers used for the SECmeasurements in each set of columns
PDBa PBDb PBDc PDMSa PDMSb PDMSc
5950 920 6250 8100 1140 114013400 6250 12600 41500 8100 810047000 12600 42300 76030 33500 3350067300 34000 60700 188400 123000 8050086500 60700 105700 681600 188000 12300094250 105700 323000 188000268000 323000 3600001120000 360000
a used in set A; b used in set D and c used in sets B and C
356 Chromatographia 2004, 59, March (No. 5/6) Original
concentration of the solution and b a
viscosimetric parameter. All the polymer
samples yielded good linear correlations
(r > 0.99) when plotting log[g] vs.
log M from which the Mark-Houwink-
Sakurada (MHS) equation, [g] ¼ KMa,
with K and a constants for each polymer-
solvent-temperature system, were evalu-
ated [20].
Results and Discussion
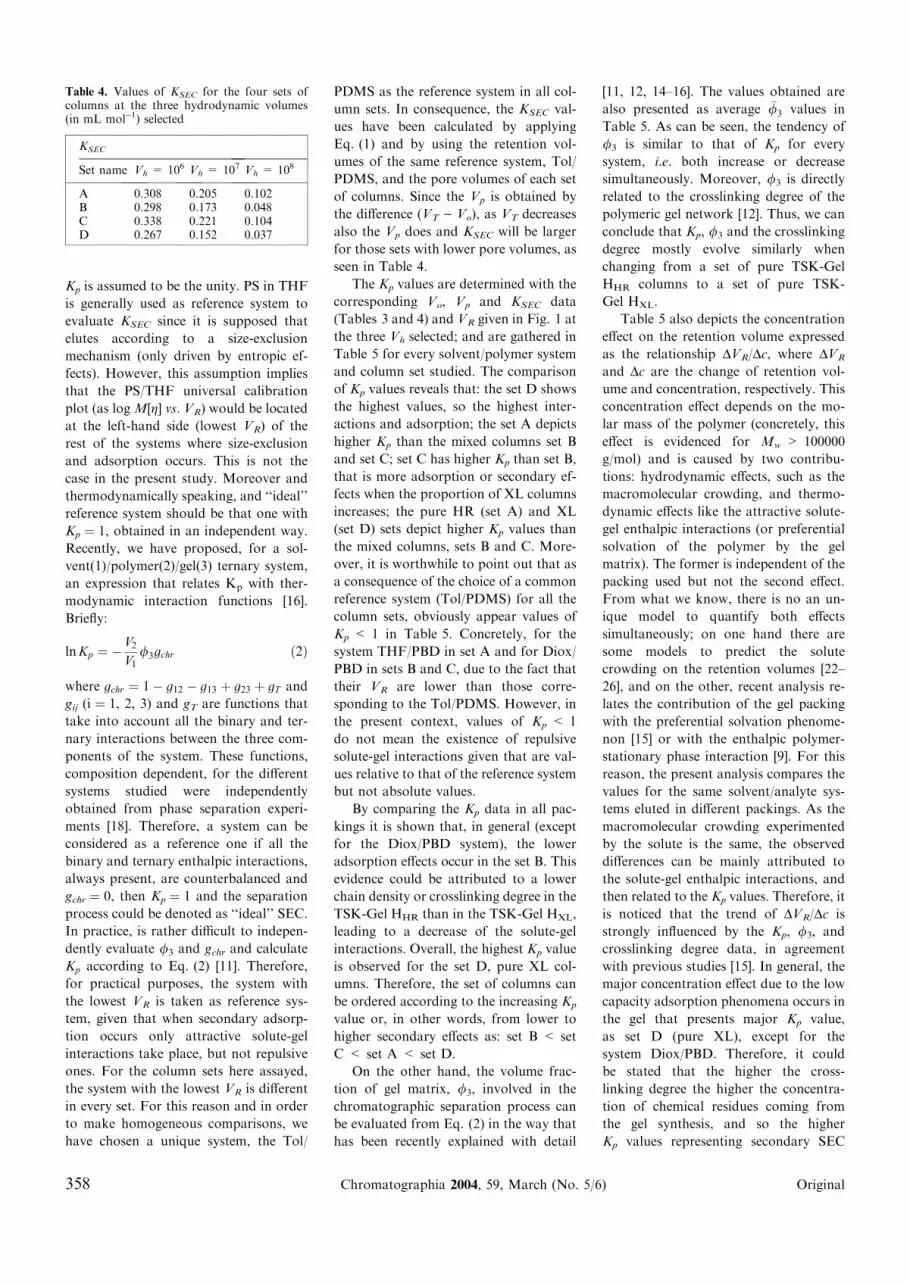
Figure 1 shows the universal calibration
curves log M[g] against VR obtained with
PBD and PDMS in different eluents for
the four sets of TSK-Gel columns anal-
ysed. In the hydrodynamic volume range
here studied all the ‘‘universal calibra-
tion’’ plots were lineal (with correlation
coefficient, R > 0.998). As can be seen,
some differences arise in the elution of the
same solvent/polymer systems in the
different sets of columns. The highest
difference in retention volumes among
the different systems is observed for the
set D formed by pure TSK-Gel HXL
columns (Fig. 1d). Surprisingly, the
mixed TSK-Gel columns, set B (Fig. 1b)
and set C (Fig. 1c) show similar universal
calibration plots. It seems, a priori, that
the set D will present more secondary
effects different from pure size exclusion.
In order to better explain the observed
elution behaviour, we have selected
three values of the hydrodynamic vol-
ume (M[g] ¼ Vh ¼ 106, 107 and 108 mL
mol)1) which are representative of the
most effective mass separation range. The
retention volumes, VR, for non-ideal SEC
(when secondary mechanisms as adsorp-
tion appear) are given by [21]:
VR ¼ V0 þ KSECKpVp ð1Þ
where KSEC is the size distribution coef-
ficient for ideal SEC and Kp the coeffi-
cient accounting for interactions between
the components of the chromatographic
system, such as solute-solvent, solvent-gel
and solute-gel. In this regard, values of
Kp ¼ 1 signify the absence of secondary
polymer-gel interactions; Kp < 1 would
imply solute-gel repulsions while Kp > 1
denotes attractive interactions. The KSEC
data compiled in Table 4 have been ob-
tained with a reference system for which
Table 2. Individual column characteristics
Column Particlesize (lm)a
Effective Mw
rangea
Number oftheoretical plates, n
Asymmetryfactor
V0 (mL)b
Vp (mL) VT (mL)c
HHR G2500 5 200–40000 22700 1.16 5.90 5.10 11.00HHR G4000 5 1000–600000 20000 0.97 4.80 5.60 10.40HHR G6000 5 10000–4 · 106 28200 1.00 5.30 5.00 10.30HXL G2500 5 200–40000 17100 1.24 5.65 5.45 11.10HXL G4000 6 1000–600000 18300 1.12 6.50 5.00 11.50HXL G6000 9 10000–4 · 106 18600 1.17 7.65 3.95 11.60
a Supplied by the manufacturer;b Determined with a PS standard of molar mass higher than the exclusion limit;c Determined with a solution of Bz in THF (1 lL mL)1)
Table 3. Column sets characteristics
Column set Set name Effective Mw
rangeaV0 (mL)b Vp (mL) VT (mL)c
HHR G2500HHR G4000 A 200–4 · 106 16.40 16.80 33.20HHR G6000HHR G2500HXL G4000 B 200–4 · 106 15.83 16.17 32.00HHR G6000HXL G2500HHR G4000 C 200–4 · 106 15.68 15.32 31.00HXL G6000HXL G2500HXL G4000 D 200–4 · 106 17.07 16.63 33.70HXL G6000
a Supplied by the manufacturer;b Determined with a PS standard of high molar mass (Mw = 3800000);c Determined with small molecules such as Tol or Bz in THF (1 lL mL)1)
Fig. 1. Universal Calibration plots for different solvent/polymer systems eluted in: (a) set A ; (b) setB; (c) set C; (d) set D
Original Chromatographia 2004, 59, March (No. 5/6) 357
Kp is assumed to be the unity. PS in THF
is generally used as reference system to
evaluate KSEC since it is supposed that
elutes according to a size-exclusion
mechanism (only driven by entropic ef-
fects). However, this assumption implies
that the PS/THF universal calibration
plot (as log M[g] vs. VR) would be located
at the left-hand side (lowest VR) of the
rest of the systems where size-exclusion
and adsorption occurs. This is not the
case in the present study. Moreover and
thermodynamically speaking, and ‘‘ideal’’
reference system should be that one with
Kp ¼ 1, obtained in an independent way.
Recently, we have proposed, for a sol-
vent(1)/polymer(2)/gel(3) ternary system,
an expression that relates Kp with ther-
modynamic interaction functions [16].
Briefly:
lnKp ¼ �V2
V1/3gchr ð2Þ
where gchr ¼ 1� g12 � g13 þ g23 þ gT and
gij (i ¼ 1, 2, 3) and gT are functions that
take into account all the binary and ter-
nary interactions between the three com-
ponents of the system. These functions,
composition dependent, for the different
systems studied were independently
obtained from phase separation experi-
ments [18]. Therefore, a system can be
considered as a reference one if all the
binary and ternary enthalpic interactions,
always present, are counterbalanced and
gchr ¼ 0, then Kp ¼ 1 and the separation
process could be denoted as ‘‘ideal’’ SEC.
In practice, is rather difficult to indepen-
dently evaluate /3 and gchr and calculate
Kp according to Eq. (2) [11]. Therefore,
for practical purposes, the system with
the lowest VR is taken as reference sys-
tem, given that when secondary adsorp-
tion occurs only attractive solute-gel
interactions take place, but not repulsive
ones. For the column sets here assayed,
the system with the lowest VR is different
in every set. For this reason and in order
to make homogeneous comparisons, we
have chosen a unique system, the Tol/
PDMS as the reference system in all col-
umn sets. In consequence, the KSEC val-
ues have been calculated by applying
Eq. (1) and by using the retention vol-
umes of the same reference system, Tol/
PDMS, and the pore volumes of each set
of columns. Since the Vp is obtained by
the difference (VT ) Vo), as VT decreases
also the Vp does and KSEC will be larger
for those sets with lower pore volumes, as
seen in Table 4.
The Kp values are determined with the
corresponding Vo, Vp and KSEC data
(Tables 3 and 4) and VR given in Fig. 1 at
the three Vh selected; and are gathered in
Table 5 for every solvent/polymer system
and column set studied. The comparison
of Kp values reveals that: the set D shows
the highest values, so the highest inter-
actions and adsorption; the set A depicts
higher Kp than the mixed columns set B
and set C; set C has higher Kp than set B,
that is more adsorption or secondary ef-
fects when the proportion of XL columns
increases; the pure HR (set A) and XL
(set D) sets depict higher Kp values than
the mixed columns, sets B and C. More-
over, it is worthwhile to point out that as
a consequence of the choice of a common
reference system (Tol/PDMS) for all the
column sets, obviously appear values of
Kp < 1 in Table 5. Concretely, for the
system THF/PBD in set A and for Diox/
PBD in sets B and C, due to the fact that
their VR are lower than those corre-
sponding to the Tol/PDMS. However, in
the present context, values of Kp < 1
do not mean the existence of repulsive
solute-gel interactions given that are val-
ues relative to that of the reference system
but not absolute values.
By comparing the Kp data in all pac-
kings it is shown that, in general (except
for the Diox/PBD system), the lower
adsorption effects occur in the set B. This
evidence could be attributed to a lower
chain density or crosslinking degree in the
TSK-Gel HHR than in the TSK-Gel HXL,
leading to a decrease of the solute-gel
interactions. Overall, the highest Kp value
is observed for the set D, pure XL col-
umns. Therefore, the set of columns can
be ordered according to the increasing Kp
value or, in other words, from lower to
higher secondary effects as: set B < set
C < set A < set D.
On the other hand, the volume frac-
tion of gel matrix, /3, involved in the
chromatographic separation process can
be evaluated from Eq. (2) in the way that
has been recently explained with detail
[11, 12, 14–16]. The values obtained are
also presented as average �/3 values in
Table 5. As can be seen, the tendency of
/3 is similar to that of Kp for every
system, i.e. both increase or decrease
simultaneously. Moreover, /3 is directly
related to the crosslinking degree of the
polymeric gel network [12]. Thus, we can
conclude that Kp, /3 and the crosslinking
degree mostly evolve similarly when
changing from a set of pure TSK-Gel
HHR columns to a set of pure TSK-
Gel HXL.
Table 5 also depicts the concentration
effect on the retention volume expressed
as the relationship DVR/Dc, where DVR
and Dc are the change of retention vol-
ume and concentration, respectively. This
concentration effect depends on the mo-
lar mass of the polymer (concretely, this
effect is evidenced for Mw > 100000
g/mol) and is caused by two contribu-
tions: hydrodynamic effects, such as the
macromolecular crowding, and thermo-
dynamic effects like the attractive solute-
gel enthalpic interactions (or preferential
solvation of the polymer by the gel
matrix). The former is independent of the
packing used but not the second effect.
From what we know, there is no an un-
ique model to quantify both effects
simultaneously; on one hand there are
some models to predict the solute
crowding on the retention volumes [22–
26], and on the other, recent analysis re-
lates the contribution of the gel packing
with the preferential solvation phenome-
non [15] or with the enthalpic polymer-
stationary phase interaction [9]. For this
reason, the present analysis compares the
values for the same solvent/analyte sys-
tems eluted in different packings. As the
macromolecular crowding experimented
by the solute is the same, the observed
differences can be mainly attributed to
the solute-gel enthalpic interactions, and
then related to the Kp values. Therefore, it
is noticed that the trend of DVR/Dc is
strongly influenced by the Kp, /3, and
crosslinking degree data, in agreement
with previous studies [15]. In general, the
major concentration effect due to the low
capacity adsorption phenomena occurs in
the gel that presents major Kp value,
as set D (pure XL), except for the
system Diox/PBD. Therefore, it could
be stated that the higher the cross-
linking degree the higher the concentra-
tion of chemical residues coming from
the gel synthesis, and so the higher
Kp values representing secondary SEC
Table 4. Values of KSEC for the four sets ofcolumns at the three hydrodynamic volumes(in mL mol)1) selected
KSEC
Set name Vh = 106 Vh = 107 Vh = 108
A 0.308 0.205 0.102B 0.298 0.173 0.048C 0.338 0.221 0.104D 0.267 0.152 0.037
358 Chromatographia 2004, 59, March (No. 5/6) Original
effects such as solute-gel attractive inter-
actions. Thus, when comparing the con-
centration effect among systems where
only the gel matrix changes, the Kp values
are directly related with the concentration
effect.
In SEC chromatography, two factors
are of equal importance in order to
achieve a better efficiency: i) minima
secondary effects, and ii) maximum res-
olution of the gel matrix. Regarding the
separation efficiency, when the injected
sample is formed by different species, it is
important that the respective elution
peaks appear at clear well different times.
In this sense, another important feature
of a SEC gel matrix is the resolution, R,
or column capacity to separate species 1
and 2 of molar masses M1 and M2, which
is defined as [13]:
R ¼ 2ðVR;2 � VR;1Þw1 þ w2
ð3Þ
where VR,1 and VR,2 are the retention
volumes of species 1 and 2, and w1 and w2
are the widths of peaks 1 and 2 at base-
line. Since R depends on the pair of
polymers to be eluted, it is convenient to
use a parameter independent of the molar
mass. To do that, the specific resolution,
RS, is defined as [13, 27]:
RS ¼2ðVR;2 � VR;1Þ
ðw1I1 þ w2I2Þ logðMw;2=Mw;1Þð4Þ
being the polydispersity index, Ii ¼(Mw,i/Mn,i) (i ¼ 1, 2), and Mw and Mn the
weight and number average molar mas-
ses, respectively. Values of RS measure
the separation efficiency of the columns
and the higher the RS value, the better the
column resolution. The RS data compiled
in Table 6 and calculated for the four sets
of columns are very high when compared
with old polystyrene gels [28] where val-
ues of RS between 0.43 and 0.60 were
found. Inspection of Table 6 reveals that:
the set B has better resolution than the
sets A, C and D; the set A has better
resolution than the sets C and D; the set
D has better resolution than the set C. In
general, these results indicate that the
columns TSK-Gel HHR have higher res-
olution than the columns TSK-Gel HXL,
and that the mixed columns with HHR as
major component show the best resolu-
tion of any other combination of col-
umns, in good accord with the universal
calibration plots (Fig. 1). Moreover and
from data of individual columns gathered
in Table 2, it is noticeable that the col-
umn HXL-G6000 posses a low number of
theoretical plates, the lowest pore volume
and the highest particle size. All theses
characteristics imply a poorer specific
resolution, specially the particle size
[13, 28]. Therefore, the specific resolution
will decrease more markedly in those
column sets where the HXL-G6000
column take part, that is, in sets C
and D as observed in Table 6. Summa-
rizing, the column sets can be ordered
according to their decreasing specific
resolution capacity as: set B > set A >
set D > set C.
Table 5. Values of Kp, /3, DVR/Dc for the different systems studied in the four sets of columns at the three hydrodynamic volumes
System Column set Vh = 106 (mL mol)1) Vh = 107 (mL mol)1) Vh = 108 (mL mol)1) DVR/Dca(mL2 g)1)
Kp 102�/3 Kp 102�/3 Kp 102�/3
THF/PBD A 0.981 3.10 0.966 3.08 0.935 2.62 50B 1.011 3.04 1.080 3.16 1.285 3.18 50C 1.015 3.05 1.080 3.16 1.513 3.15 150D 1.307 3.45 1.515 3.38 3.013 3.43 125
Bz/PBD A 1.205 7.18 1.160 4.96 1.038 4.99 85B 1.131 6.09 1.206 6.13 1.450 6.12 75C 1.163 6.07 1.249 6.13 1.785 6.11 75D 1.876 6.72 2.466 6.73 6.726 6.73 150
Diox/PBD A 1.265 3.50 1.364 3.57 1.659 3.55 125B 0.959 2.27 0.968 3.44 1.024 3.79 50C 0.890 2.21 0.855 2.30 0.738 3.40 50D 1.056 3.11 1.004 3.30 0.628 3.25 25
Bz/PDMS A 1.246 9.20 1.244 9.2 1.246 9.20 100B 0.996 9.20 0.984 7.4 0.911 9.20 50C 1.004 9.20 1.000 9.2 0.988 6.10 50D 1.557 18.6 1.886 18.6 4.257 18.60 75
Tol/PDMS A 1.097 15.86 1.095 15.86 1.113 15.86 75B 1.000 8.7·10)7 1.001 1.1·10)4 1.113 1.12·10)4 75C 1.000 1.000 1.000 75D 1.003 17.60 1.008 17.60 1.001 17.50 75
a The concentration effect was evaluated with a PBD of Mw= 360000 g mol)1 and PDMS of Mw= 188000 g mol)1
Table 6. Values of the specific resolution, RS, and of the magnitudes involved in equation 4
Column set Systema VR,1 (mL) w1 (mL) VR,2 (mL) w2 (mL) RS
Bz/PBD 22.80 1.30 20.45 1.30 2.10A Bz/PDMS 22.60 1.80 20.75 1.30 1.80
Tol/PDMS 22.75 1.90 20.70 1.30 1.94
Bz/PBD 23.35 1.20 20.85 1.30 2.32B Bz/PDMS 23.00 1.90 21.00 1.30 1.89
Tol/PDMS 23.40 2.10 20.80 1.30 2.31
Bz/PBD 23.00 1.60 20.90 1.50 1.57C Bz/PDMS 22.80 2.30 21.00 1.70 1.36
Tol/PDMS 22.80 2.30 21.00 1.60 1.40
Bz/PBD 23.10 1.70 20.80 1.30 1.78D Bz/PDMS 23.00 2.60 21.00 1.40 1.51
Tol/PDMS 23.00 2.20 21.10 1.10 1.74
a PDB samples: Mw1= 6250, Mw2 = 42300, Mn1 = 6000, Mn2 = 41000 (in g mol)1)PDMS samples: Mw1 = 8100, Mw2 = 33500, Mn1 = 7500, Mn2 = 31600 (in g mol)1)
Original Chromatographia 2004, 59, March (No. 5/6) 359
By comparing the Kp and RS values
compiled in Tables 5 and 6 for Bz/PBD,
Bz/PDMS and Tol/PDMS, we notice an
increase of RS at the same time that a
decrease of Kp values. By looking to-
gether all the systems, RS increase and Kp
decrease when changing from set D (pure
XL) to set A (pure HR) to set B (HR in
major percentage), but the set C gives an
anomalous trend specially concerning the
specific resolution. It could be attributed
to the highest KSEC value (Table 4) or the
lowest Vp value (see Table 3), since a low
pore volume also tends to diminish the
resolution.
Finally to conclude we can say that:
– the set with three TSK-Gel HHR col-
umns, set A, has better resolution and
less secondary effects than the set with
three TSK-Gel HXL columns, set D.
– The mixed set of columns with gel HR
as major component (set B) shows
better resolution and less secondary
effects than any other of the two pure
HHR or HXL sets (sets A and D).
– The behaviour of the set C (with XL
as major contribution) is unclear
since, on one hand it shows less sec-
ondary effects than the two sets of
pure HHR and HXL columns, but on
the other it has the worst specific res-
olution. This behaviour could be
attributed to their highest KSEC values
and lowest pore volume, and as a
consequence, less volume to permeate
the solute would affect the resolution.
– We have found for the five solvent/
polymer systems a good agreement
among the trend of �/3, Kp and
DVR/Dc values, inferring that the
higher the gel crosslinking degree the
higher the secondary effects, and also
the higher the concentration effect due
to preferential solvation of the poly-
mer by the gel (adsorption) when
comparing the same solvent/polymer
system (i.e. constant macromolecular
crowding effect) in the different sets of
columns. The set B depicts, in general,
the lowest adsorption influence on the
total concentration effect.
– We have found that the mixed set B
has better chromatographic charac-
teristics than the non-mixed ones (set
A or D) or the mixed C with XL as
major component. This fact encour-
ages us to continue investigating more
different combination of gel packings.
– Finally, we also think that the good
chromatographic properties evidenced
by the mixed set B are due to the
individual response of each column
that forms the set. For this reason,
measurements of different chromato-
graphic parameters (Kp, RS, DVR/Dc)in isolated columns are currently in
progress.
Acknowledgements
Financial support from Direccion Gen-
eral de Investigacion (Ministerio de
Ciencia y Tecnologıa) under Grants No.
MAT2000-1781 and PB98-1435 is grate-
fully acknowledged.
References
1. Berek D (1999) In Column Handbookfor Size Exclusion Chromatography, Wu,C.-S., Ed., Academic Press, London
2. Lou X, van Dongen JLJ, Meijer EW (2000)J Chromatogr A 896:19–30
3. Netopilık M, Podzimek S, Kratochvıl P(2001) J Chromatogr A 922:25–36
4. Shi Song M, XianHu G, Yu Li X, Zhao B(2002) J Chromatogr A 961:155–170
5. Kaur M, Jumel K, Hardie KR, HardmanA, Meadows J, Melia CD (2002) J Chro-matogr A 957:139–148
6. Chaidedgumjorn A, Suzuki A, Toyoda H,Toida T, Imanari T, Linhardt RJ (2002)J Chromatogr A 959:95–102
7. Nassivera T, Eklund AG, Landry CC(2002) J Chromatogr A 973:97–101
8. Van der Heyden Y, Poporici ST, Schoen-makers PJ (2002) J Chromatogr A957:127–137
9. Strlic M, Kolenc J, Kolar J, Pihlar B (2002)J Chromatogr A 964:47–54
10. Guillaume YC, Robert JF, Guinchard C(2001) Anal Chem 73:3059–3064
11. Garcıa R, Gomez CM, Figueruelo JE,Campos A (2001) Macromol Chem. Phys202:1889–1901
12. Garcıa R, Recalde IB, Figueruelo JE,Campos A (2001) Macromol Chem Phys202:3352–3362
13. Campos A, Borque L, Figueruelo JE(1978) An Quim 74:701–707
14. Garcıa R, Gomez CM, Codoner A, AbadC, Campos A (2003) J Biochem BiophysMethods 56:53–67
15. Garcıa-Lopera R, Gomez CM, Abad C,Campos A (2002) Macromol Chem Phys203:2551–2559
16. Gomez CM, Garcıa R, Figueruelo JE,Campos A (2000) Macromol Chem Phys201:2354–2364
17. Gomez CM, Verdejo E, Figueruelo JE,Campos A, Soria V (1995) Polymer36:1487–1498
18. Gomez CM, Figueruelo JE, Campos A(1998) Polymer 39:4023–4032
19. Gomez CM, Figueruelo JE, Campos A(1999) Macromol Chem Phys 200:246–255
20. Gomez CM, Garcıa R, Recalde I, CodonerA, Campos A (2001) Int J Polym AnalCharact 6:365–377
21. Dawkins JV, Hemming M (1975) Makro-mol Chem 176:1795–1813
22. Figueruelo JE, Campos A, Soria V, TejeroR (1984) J Liq Chromatogr 7:1061
23. Song MS, Hu GX (1985) J Liq Chroma-togr 8:2543
24. Tejero R, Soria V, Campos A, FiguerueloJE, Abad C (1986) J Liq Chromatogr 9:711
25. Song MS, Hu GX (1988) J Liq Chroma-togr 11:363
26. Song MS, Hu GX, Li XY, Zhao B (2002)J Chromatogr A 961:155–170
27. Bly DD (1971) Polym Lett 9:401–40728. Cooper AR (1974) J Polym Sci Polym Phys
Ed. 12:1969–1973
360 Chromatographia 2004, 59, March (No. 5/6) Original