chen et al mouse model online material
TRANSCRIPT

CIRCRES/2013/301562D/R1
1
Supplemental Material Online Material and Methods Numerical simulation of computational fluid dynamic (CFD) The computational domain comprising the aortic arch and the artery with artificially created stenoses was constructed based on physiological and medical imaging data using the ANSYS Design Modeler 11. The computational grid consisted of approximately 150,000 tetrahedral/hexagonal elements grid refinement near the wall. The fluid medium was assumed to be Newtonian and have a constant density and viscosity equal to 1060 kg/m3 and 0.0036 Pa·s, respectively. The blood flow was considered as three dimensional and pulsatile with the flow inlet boundary conditions simulated as mouse cardiac output. To obtain the flow velocity and pressure distributions in this model, the flow (Navier-Stokes) equations were solved with use of the finite-element commercial CFD software ANSYS CFX 11. Mice Male ApoE-deficient (ApoE-/-) mice on a C57BL/6J background were obtained from the Animal Resource Centre in Western Australia. The ApoE-/- mice were backcrossed to C57BL/6J for at least 10x. In total, 250 ApoE-/- mice were used in this study and allocated into each group e.g. 150µm TS, 450µm TS, sham TS, 150µm TS plus atorvastatin, 150µm SS). Mice at 6 weeks of age were assigned randomly to one of these groups. Mice then fed a HFD containing 22% fat and 0.15% cholesterol (SF00-219, Specialty Feeds, Western Australia) for 6 weeks before TS surgery. At 12 weeks of age, TS were introduced into the mice. For the atorvastatin group, 8 mice were given Lipitor® (Atorvastatin 10 mg/kg B.W., Pfizer, USA) by daily gavage. All experiments were approved by the Alfred Medical Research Education Precinct (AMREP) Animal Ethics Committee (E/0998/2010/B). Tissue processing and histological analysis Animals were sacrificed using Euthal (10mg/kg, Delvet Limited, Seven Hills, Australia). After blood samples were collected, a catheter was placed in the left ventricle for perfusion with 10 ml PBS, pH 7.4 under physiological pressure. After perfusion, the entire aortic arch with the brachiocephalic artery and the right and left carotid artery was embedded in optimal cutting temperature compound (Sakura Finetechnical), frozen over liquid nitrogen and stored at -20°C until sectioning. 6µm thick longitudinal and transversal cryosections were prepared using a cryostat (Zeiss MICROM HM 550). For longitudinal sections, section angles were adjusted until they revealed a maximum vessel lumen from the brachiocephalic artery to the common carotid artery. Sections were histologically stained with either standard Mayer’s hematoxylin/eosin, Oil red O to detect lipids or Picro-sirius Red to detect collagen. Quantification of histological samples for each segment was performed on sequential 6 um sections obtained at 120µm intervals. The percentage of the various plaque components was quantified as the positive area for each specific parameter divided by the total intimal plaque area. The necrotic core was defined as the total plaque area devoid of cellular tissue. Relative cap thickness was defined as the ratio of the cap thickness at the shoulder and mid-plaque region divided by maximal intimal thickness.1 Lipid concentrations in mouse serum Blood samples (0.5-1 ml) were taken by cardiac puncture at the time of sacrifice and placed at room temperature for one hour to clot before being centrifuged at 2000 g for 15 min. Serum was removed and stored at -80°C until analysis. Total serum cholesterol concentrations were measured with a Cobas Integra ® 400 plus Autoanalyzer using the following kits: Cholesterol Gen.2, HDL-Cholesterol plus 2nd generation, LDL-Cholesterol plus 2nd generation, and Triglycerides (Roche Diagnostics, Mannheim, Germany). Colorimetric changes were measured at 512nm for cholesterol and triglycerides or at 583nm for HDL and LDL. Carotid endarterectomy specimens Atherosclerotic plaque samples were collected from routinely performed carotid endarterectomies at

CIRCRES/2013/301562D/R1
2
the Alfred Hospital and conducted in accordance to ethics approval by the Alfred Hospital Ethics Committee (Project 130/11). Immunohistochemistry Frozen sections were thawed and incubated with primary antibodies for one hour at room temperature. The primary antibodies used were anti-CD31 (clone MEC13.3; 1:100 dilution, BD); anti-CD41 (clone MWReg30; 1:100 dilution, Ebioscience); anti-MCP-1 (cat AF479; 1:100 dilution; R&D Systems); anti-ubiquitin (cat U5379; 1:50 dilution; Sigma Aldrich); rabbit anti-mouse fibrin2 (1:10,000 dilution); anti-MOMA-2 (MCA-519G; 1:100 dilution, Serotec); anti-SMA (clone 1A4; 1:100 dilution. Sigma Aldrich); anti-CD45 (30-F11; 1:50, Ebioscience); anti-CD3 (17A2; 1:50, eBioscience). Detection was achieved by Vectastain ABC kit and DAB substrate. Rat IgG2B control antibodies were used to validate the staining specificity of Rat antibody. Other isotype control antibodies (Goat IgG, rabbit IgG) were used for the validation of each immunostaining according to the primary antibodies. Expression of antigens was quantified using Optimus 6.2 VideoPro-32 and the stained segments were expressed as a percentage of the total plaque area as described previously.3 mRNA and miR quantitative polymerase chain reaction (qRT-PCR) To obtain sufficient quantities of RNA, identical vessel segments from 20 mice were pooled for each sample. Each sample was obtained in triplicate. Overall, 60 ApoE-/- mice on HFD were used 7 weeks after the TS surgical procedure. Total RNA was extracted from freshly isolated vessel segments using 5:1 saturated phenol/chloroform (AMRESCO). After RNA extraction, RNA purity was checked by 260/280 nm ratio. The ratio from each segment was in the range between 1.8 and 2.06, which indicates a high purity RNA extraction. Further confirmation of RNA quality by 1% denaturing agarose gel stained with ethidium bromide, demonstrating clear bands of the 28S and 18S rRNAs. RNA was reverse transcribed into cDNA using TaqMan Reverse Transcription Reagents (Applied Biosystems). To quantify miR, we used the miScript Reverse Transcription kit (Qiagen) follow by miSCript Primer Assays kit (Qiagen). Subsequently, qRT-PCR was conducted using a standard SYBR Green detection on an Applied Biosystem 7500 system (Applied Biosystem). Gene expression was normalized relative to the expression of the housekeeping gene 18S ribosomal RNA using the formula 2-∆∆CT. Illumina gene expression and miR expression analysis Total RNA isolation was the same as was performed for qRT-PCR. For gene expression, biotin-labeled cRNA was produced by means of a linear amplification kit (AMIL1791; Ambion, Austin, TX) using 250ng of quality checked total RNA as input. Hybridization to the Illumina Mouse WG-6 v2 BeadChip was for 16 hours at 58ºC on a BeadChip Hyb Wheel using 1,500ng biotin-labeled cRNA as input. Afterwards, the chip was washed, blocked and stained with Cy3-streptavidin (Amersham Bioscience) according to manufacturer’s protocols (Illumina). Scanning used the iScan Control Software V1.6.20.7 (Illumina) together with the Illumina iSCAN platform (Illumina). Annotation information for the individual chip formats is publicly available from Illumina. Measurement of miR expression was performed according to Illumina standard protocols for the cDNA-mediated annealing, selection, extension and ligation (DASL) procedure (Illumina). Briefly, 200ng of total RNA was polyadenylated using Poly-A polymerase and converted to cDNA using a biotinylated oligo-dT primer. The cDNA was hybridized to the Illumina Mouse MicroRNA Expression Beadchip (version 2; MI-202-1124) containing probes for 1,146 miR species, extended, ligated and washed according to standard protocols. The beadchips were scanned using the Illumina iScan platform (Illumina). Processing and analysis of the microarray data were performed with the Illumina Beadstudio 3.1.3.0 software. Raw data were background subtracted and normalized using the “Quantile” algorithm. Quantile normalization assumes that all samples have similar distribution of transcript abundance and make the distribution, median and means of probe intensities the same for every sample. Further analysis was performed in a R-bioconductor environment (Using BRB ArrayTool 4.1.0) and Partek GS 6.10.0915® tool. Images and result lists are shown from Partek, since there was no significant

CIRCRES/2013/301562D/R1
3
difference. Selection for differentially expressed genes was performed on the basis of reference to a healthy vessel (vessel segment IV), which did not reveal atherosclerotic plaques, as thresholds for fold changes plus statistical significance according to an Illumina custom model (p<0.05) and fold change of greater than 2 or less than 0.5 fold. Pathway analysis on mRNA and miR expression data was performed using Ingenuity Pathway Analysis (IPA) and GeneGo Inc.. Only annotated genes with a P-value <0.05 and predicted target genes of miR with a fold change greater than 2, or less than 0.5 fold and p-value <0.05 were considered. Target prediction was performed with TargetScan 6.2 and only unique target genes were used for subsequent analysis. Cell culture and miRNA inhibition RAW 264.7 macrophages were maintained in Dulbecco’s modified medium (Invitrogen) containing 10% FBS (HyClone, South Logan, UT) at 37°C in a 5%CO2 atmosphere. For inhibition of miR-322, RAW 264.7 macrophages were transfected with anti-miR-322 (miR-322: ACATGAATTGCTGC) and anti-miR-scramble (miR-scramble: ACGTCTATACGCCCA) (Exiqon, meRCURY LNATM) at a final concentration of 50nM using LipofectamineTM, according to manufacturer’s instructions (Invitrogen). RAW 264.7 macrophages were stimulated with TNF-α at final concentration 5ng/ml for 4 hours before cells were harvested for RNA extraction. To measure the transfection efficiency, the miR-322 target gene FGF7 served as a reporter.

CIRCRES/2013/301562D/R1
4
Online Tables
Online Table I: Total cholesterol, Triglyceride, HDL, VLDL/LDL in mouse plasma
Plasma lipid levels in mice subjected to different treatments as depicted.
Data shown as mean ± SEM in mmol/L; n=12 mice per group

CIRCRES/2013/301562D/R1
5
Online Table II : List of up- or downregulated miR in vessel segments I & II compared
to IV & V ranked by fold change
* Complementary sequence
** Solexa Illumina chip array microRNA ID

CIRCRES/2013/301562D/R1
6
Online Table III: Ingenuity pathway analysis of dysregulated genes in mRNA
expression analysis comparing vessel segments I & II to III, IV & V

CIRCRES/2013/301562D/R1
7
Online Table IV : Ingenuity pathway analysis combining gene expression profiling and
target prediction of dysregulated miRs

CIRCRES/2013/301562D/R1
8
Online Table V: List of upregulated genes (>5-fold) in vessel segments I & II in
comparison to vessel segments III, IV, and V
CIRCRES/2013/301562D/R1
9
Online Figures and Figure legends
Online Figure I
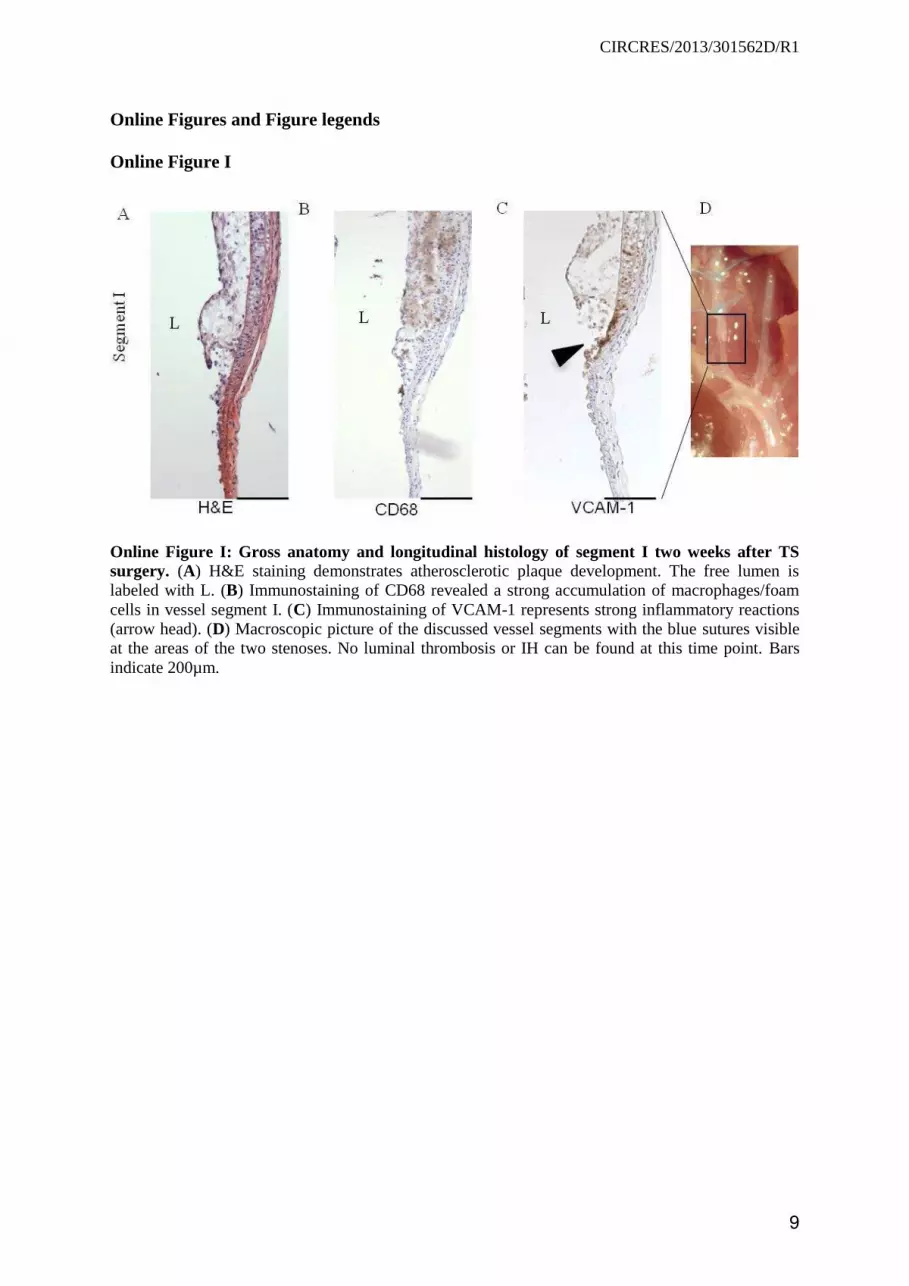
Online Figure I: Gross anatomy and longitudinal histology of segment I two weeks after TS surgery. (A) H&E staining demonstrates atherosclerotic plaque development. The free lumen is labeled with L. (B) Immunostaining of CD68 revealed a strong accumulation of macrophages/foam cells in vessel segment I. (C) Immunostaining of VCAM-1 represents strong inflammatory reactions (arrow head). (D) Macroscopic picture of the discussed vessel segments with the blue sutures visible at the areas of the two stenoses. No luminal thrombosis or IH can be found at this time point. Bars indicate 200µm.

CIRCRES/2013/301562D/R1
10
Online Figure II
Online Figure II : Histological examples of unstable atherosclerotic plaques from vessel segment I 11 weeks after TS surgery. H&E (A) and Trichrome staining (B) depict intraplaque hemorrhage (IH; white arrow heads), which is often associated with intraluminal hemorrhage (black arrow heads). Large cholesterol crystals can be seen. The dashed lines encircle the vessel lumen. RBCs present in bright red in H&E and dark red in trichrome staining. Bars indicate 250µm.

CIRCRES/2013/301562D/R1
11
Online Figure III
Online Figure III: Examples of macroscopically visible intraplaque hemorrhages (IH) upstream (proximal) of the proximal stenosis (vessel segment I) in the TS mouse model at 7 weeks after surgery. Photos were taken with a 10x dissecting microscope. The proximal blue sutures are visible.

CIRCRES/2013/301562D/R1
12
Online Figure IV
Online Figure IV: Controls for the TS model: (A) non-constrictive stenosis (450µm) and (B) sham operated mice. Gross anatomy and H&E staining of longitudinally sectioned vessel at 11 weeks after surgery demonstrate that the sutures and the operation on their own do not induce the atherosclerotic plaque build-up or intraplaque hemorrhage as seen in the TS (150µm) surgery model.
CIRCRES/2013/301562D/R1
13
Online Figure V
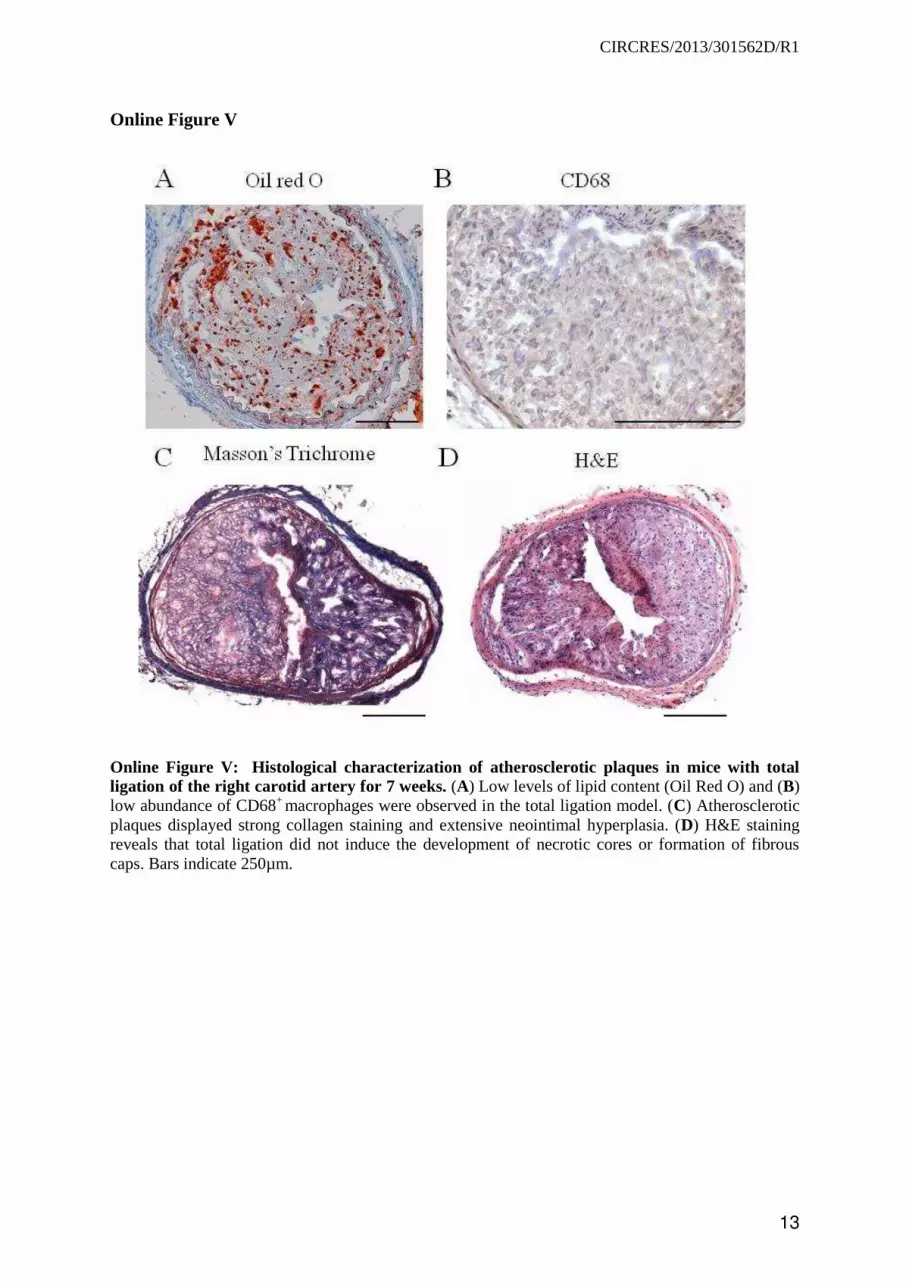
Online Figure V: Histological characterization of atherosclerotic plaques in mice with total ligation of the right carotid artery for 7 weeks. (A) Low levels of lipid content (Oil Red O) and (B) low abundance of CD68+ macrophages were observed in the total ligation model. (C) Atherosclerotic plaques displayed strong collagen staining and extensive neointimal hyperplasia. (D) H&E staining reveals that total ligation did not induce the development of necrotic cores or formation of fibrous caps. Bars indicate 250µm.

CIRCRES/2013/301562D/R1
14
A B C D E
Online Figure VI
Online Figure VI: Neo vasa vasora as typical features of plaque instability in segment I of the TS mouse model. (A) Neo vasa vasora in the adventitia were visible macroscopically (arrow indicates a new vessel adjacent to IH, which is depicted by a dotted circle). (B) Staining of adventitia with anti-CD31 antibody also indicates a newly formed vessel. (C) Intraplaque microvessels could be found adjacent to the original lumen (arrows indicate intraplaque microvessels). (D) Notably, newly formed vessels with single layers of endothelial CD31-positive cells and Perls’ iron staining (E) were often found adjacent, which indicates the presence of old hemorrhage. L: Lumen. Bars indicate 500µm in A and 50µm in B, C, D, and E. C is stained with H&E.

CIRCRES/2013/301562D/R1
15
Online Figure VI I
Online Figure VII : Histological analysis of the TS model 7 weeks after surgery. Representative staining of (A) collagen (Picro-Sirius Red), (B) CD31, (C) lipid (Oil Red O), (D) SMCs (anti-SMC α-actin), (E) MOMA-2 (Isotype control in the insert) in segment I, II, III and V. L: Lumen. Bars indicate 50µm.
A
B
C
D
E

CIRCRES/2013/301562D/R1
16
Online Figure VI II
Online Figure VIII: Network map of experimentally validated miR-322 target genes differentially expressed in unstable (segment I) and stable (segment V) atherosclerotic plaques. Upregulated genes are marked with red circles. Downregulated genes are marked with blue circles. The network map was generated using GeneGo.

CIRCRES/2013/301562D/R1
17
Online Figure IX
Online Figure IX: GeneGo pathway analysis of combined mRNA and miR data sets. (A) Main gene ontologies of differentially expressed genes and validated miR target genes. (B) Main gene ontologies of differentially expressed genes overlapping with predicted and validated miR target genes.
CIRCRES/2013/301562D/R1
18
Online Figure X
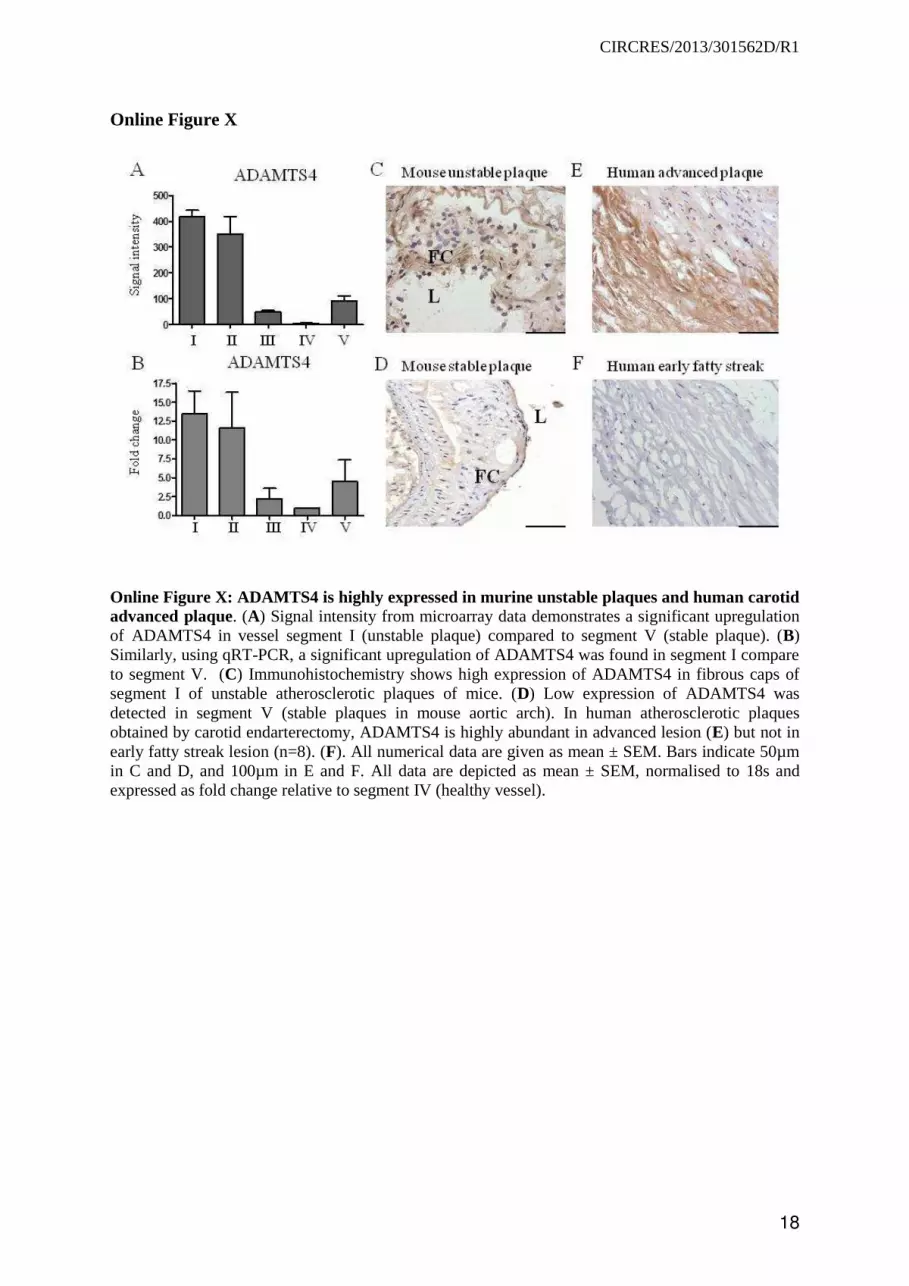
Online Figure X: ADAMTS4 is highly expressed in murine unstable plaques and human carotid advanced plaque. (A) Signal intensity from microarray data demonstrates a significant upregulation of ADAMTS4 in vessel segment I (unstable plaque) compared to segment V (stable plaque). (B) Similarly, using qRT-PCR, a significant upregulation of ADAMTS4 was found in segment I compare to segment V. (C) Immunohistochemistry shows high expression of ADAMTS4 in fibrous caps of segment I of unstable atherosclerotic plaques of mice. (D) Low expression of ADAMTS4 was detected in segment V (stable plaques in mouse aortic arch). In human atherosclerotic plaques obtained by carotid endarterectomy, ADAMTS4 is highly abundant in advanced lesion (E) but not in early fatty streak lesion (n=8). (F). All numerical data are given as mean ± SEM. Bars indicate 50µm in C and D, and 100µm in E and F. All data are depicted as mean ± SEM, normalised to 18s and expressed as fold change relative to segment IV (healthy vessel).

CIRCRES/2013/301562D/R1
19
Online References
1. Cheng C, Tempel D, Den Dekker WK, Haasdijk R, Chrifi I, Bos FL, Wagtmans K, van de Kamp EH, Blonden L, Biessen EA, Moll F, Pasterkamp G, Serruys PW, Schulte-Merker S, Duckers HJ. Ets2 determines the inflammatory state of endothelial cells in advanced atherosclerotic lesions. Circ Res. 2011;109:382-395.
2. Drew AF, Tucker HL, Liu H, Witte DP, Degen JL, Tipping PG. Crescentic glomerulonephritis is diminished in fibrinogen-deficient mice. Am J Physiol Renal Physiol. 2001;281:F1157-1163.
3. To K, Agrotis A, Besra G, Bobik A, Toh BH. Nkt cell subsets mediate differential proatherogenic effects in apoe-/- mice. Arterioscler Thromb Vasc Biol. 2009;29:671-677.