chemical modification of nucleic acids. methylation of calf thymus dna investigated by mass...
TRANSCRIPT
Chemical Modification of Nucleic Acids. Methylation of Calf Thymus DNA Investigated by Mass Spectrometry and Liquid Chromatography
Dennis J. Ashworth, William M. Baird and Ching-jer Changt Department of Medicinal Chemistry and Pharmacognosy, School of Pharmacy and Pharmacal Sciences, Purdue University, West Lafayette, Indiana 47907, USA
James D. Ciupek, Kenneth L. Busch and R. Graham Cooks Department of Chemistry, Purdue University, West Lafayette, Indiana 47907, USA
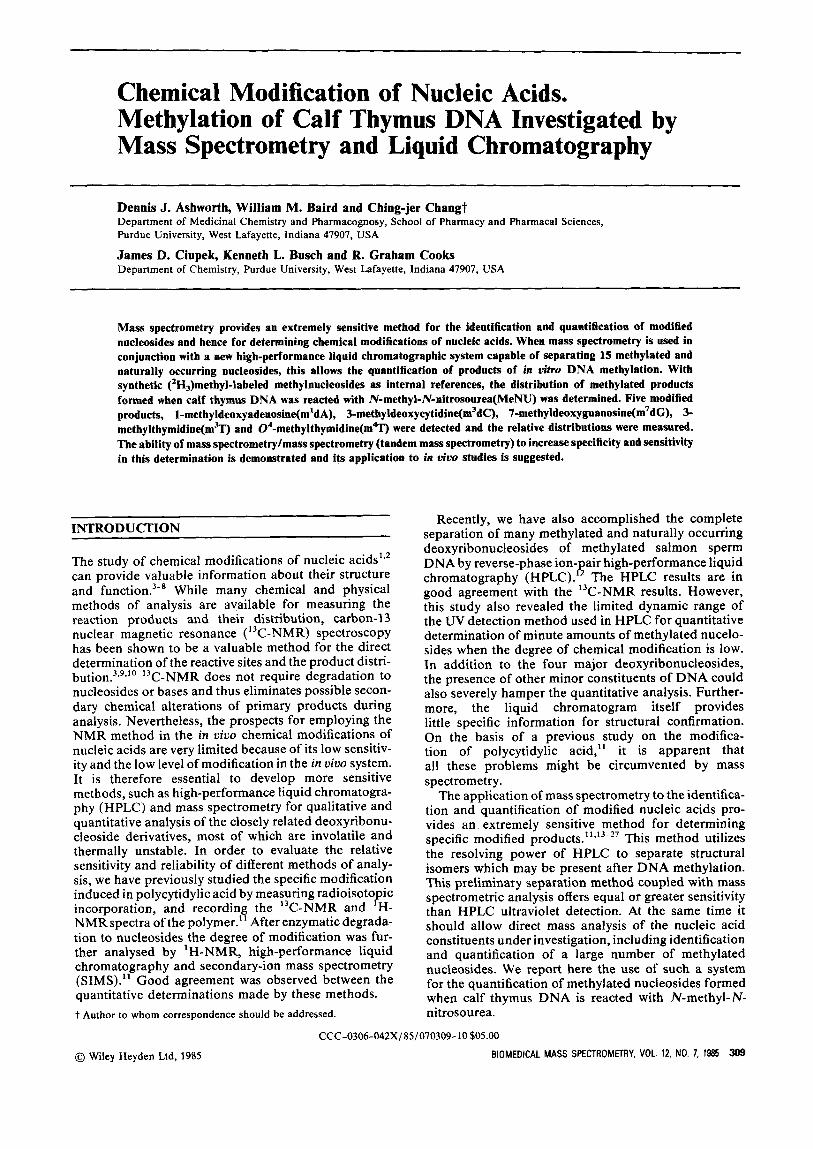
Mass spectrometry provides an extremely sensitive method for the identification and quantification of modified nucleosides and hence for determining chemical modifications of nucleic acids. When mass spectrometry is used in conjunction with a new high-performance liquid chromatographic system capable of separating 15 methylated and naturally occurring nucleosides, this allows the quantification of products of in vitro DNA methylation. With synthetic (2H,)methyl-labeled methylnucleosides as internal references, the distribution of methylated products formed when calf thymus DNA was reacted with N-methyl-N-nitrosourea(MeNU) was determined. Five modified products, 1-methyldeoxyadenosine(m'dA), 3-methyldeoxycytidine(m3dC), 7-methyldeoxyguanosine(m7dG), 3- methylthymidine(mw and O"-methylthymidine(m~ were detected and the relative distributions were measured. The ability of mass spectrometryhass spectrometry (tandem mass spectrometry) to increase specificity and sensitivity in this determination is demonstrated and its application to in vivo studies is suggested.
INTRODUCTION
The study of chemical modifications of nucleic acids',' can provide valuable information about their structure and While many chemical and physical methods of analysis are available for measuring the reaction products and their distribution, carbon-13 nuclear magnetic resonance (I3C-NMR) spectroscopy has been shown to be a valuable method for the direct determination of the reactive sites and the product distri- bution.3.9,'0 13 C-NMR does not require degradation to nucleosides or bases and thus eliminates possible secon- dary chemical alterations of primary products during analysis. Nevertheless, the prospects for employing the NMR method in the in vivo chemical modifications of nucleic acids are very limited because of its low sensitiv- ity and the low level of modification in the in vivo system. It is therefore essential to develop more sensitive methods, such as high-performance liquid chromatogra- phy (HPLC) and mass spectrometry for qualitative and quantitative analysis of the closely related deoxyribonu- cleoside derivatives, most of which are involatile and thermally unstable. In order to evaluate the relative sensitivity and reliability of different methods of analy- sis, we have previously studied the specific modification induced in polycytidylic acid by measuring radioisotopic incorporation, and recording the I3C-NMR and 'H- NMR spectra of the polymer." After enzymatic degrada- tion to nucleosides the degree of modification was fur- ther analysed by 'H-NMR, high-performance liquid chromatography and secondary-ion mass spectrometry (SIMS)." Good agreement was observed between the quantitative determinations made by these methods. t Author to whom correspondence should be addressed.
Recently, we have also accomplished the complete separation of many methylated and naturally occurring deoxyribonucleosides of methylated salmon sperm DNA by reverse-phase ion-pair high-performance liquid chromatography (HPLC).I2 The HPLC results are in good agreement with the 13C-NMR results. However, this study also revealed the limited dynamic range of the UV detection method used in HPLC for quantitative determination of minute amounts of methylated nucelo- sides when the degree of chemical modification is low. In addition to the four major deoxyribonucleosides, the presence of other minor constituents of DNA could also severely hamper the quantitative analysis. Further- more, the liquid chromatogram itself provides little specific information for structural confirmation. On the basis of a previous study on the modifica- tion of polycytidylic acid," it is apparent that all these problems might be circumvented by mass spectrometry.
The application of mass spectrometry to the identifica- tion and quantification of modified nucleic acids pro- vides an extremely sensitive method for determining specific modified p r o d u ~ t s . ~ ' ~ ' ~ - ~ ~ This method utilizes the resolving power of HPLC to separate structural isomers which may be present after DNA methylation. This preliminary separation method coupled with mass spectrometric analysis offers equal or greater sensitivity than HPLC ultraviolet detection. At the same time it should allow direct mass analysis of the nucleic acid constituents under investigation, including identification and quantification of a large number of methylated nucleosides. We report here the use of such a system for the quantification of methylated nucleosides formed when calf thymus DNA is reacted with N-methyl-N- nitrosourea.
@ Wiley Heyden Ltd, 1985
CCC-0306-042X/85/070309-10 $05.00
BIOMEDICAL MASS SPECTROMETRY, VOL. 12, NO. 7, 1985 309
D. J. ASHWORTH ET AL.
0 +If
'T"" ' NANH2
""-52 3-rnethyl-2'-deoxycytidine 04-rnethylthymid me
EXPERIMENTAL
Materials
Thymidine(T), 2'-deoxyuridine(dU), 2'-deoxy- cytidine(dC), 5-methyl-2'-deoxycytidine(m5dC), 2'- deoxyguanosine(dG), 2'-deoxyinosine(dI), 2'- deoxyadenosine( dA), ('H3)methyl iodide and ((2H,)methyl) methanol used in the synthesis of (2H3) methyl reference compounds were purchased from Sigma Chemical Company. N-Methyl-N-nitrosourea was purchased from ICN Company and (['*C] methyl) N-methyl- N-nitrosourea was prepared from (['*C]methyl) methylamine [Research Product Inter- national I ~ c . ] . ~ ~ " Calf thymus DNA, deoxyribonuclease I (type 111, 1500 units mg-'), phosphodiesterase I (type VII, 0.2 units mg-') and alkaline phosphatase (type 111, 25 units mg-') were all obtained from Sigma Chemical Company. Proteinase K (20 units mg-') was purchased from Boehringer Mannheim. Spectra/Por 2 and 4 dialy- sis membranes (mol. wt cutoff 12 000-14 000) were pur- chased from Spectrum Medical Industries and all dialy- sis procedures and enzymatic degradations utilized double distilled water.
NMR spectroscopy
All I3C-NMR spectra with the exception of 04-methyl- thymidine were obtained on a Jeol PFT-100 spectrometer operating at 25 MHz, interfaced with a Jeol EC-100 Fourier-transform computer. Spectra were recorded at ambient temperature with a deuterium lock using 10 mm sample tubes, the chemical shifts being measured for a 5 kHz sweep width. Pulse widths of 22.2 ps (90") and repetition times of 2 s were used. The proton-coupled and decoupled spectra of 04-methylthymidine were run on a Varian XL-200 spectrometer operating at 50 MHz, interfaced with a Varian computer with 32K memory. The chemical shifts were measured for a 11 kHz sweep width. Spectra of reference mononucleosides were run
06-met hyl-2'-deoxyguanosine 3-methylthymidine
either in 2H20 with a dioxane (66.6 ppm) or methanol (49.0 ppm) reference or in (2H6) DMSO (39.6 ppm rela- tive to TMS at 0.0ppm).
The 'H-NMR spectra of synthesized reference com- pounds were recorded on a Varian FT-80 instrument operating at 79.54 MHz. Spectra width of 800 Hz, pulse widths of 25 ps and pulse delays of 6 s were generally used. The 'H-NMR spectrum of 04-methylthymidine was run on a Nicolet 470 MHz ('H) spectrometer using a 5 ps pulse width and a pulse delay of 3 s. The 5000 Hz spectrum was recorded in a 32K memory and processed by a Nicolet computer.
High-performance liquid chromatography
Instrumentation consisted of a Waters Associates system composed of a M-45 solvent delivery system and a 6000A solvent delivery system interfaced to a model 660 solvent programmer. A UK6 universal injector and a model 440 UV detector (254 and 280 nm) completed the system. Separations were achieved with Radial-Pak 10 c18 cart- ridges protected by c18 radial compression Guard-Paks.
Mass spectrometry
The mass spectral data which appear in Fig. 1 were obtained on a DuPont 21-492B mass spectrometer by chemical ionization with isobutane as reagent gas. Mass spectral analysis of the methylated nucleosides (HPLC fractions) was performed on a Finnigan 4000 mass spec- trometer. Chemical ionization was employed with isobutane as reagent gas at a pressure of CU. 0.3 Torr. The dried methylated fractions were dissolved in cu. 9 p1 water in a microcapillary tube and introduced via the solids probe. Fast heating of the probe (50 + 350 "C in <1 min) optimized detection of the nucleosides. One scan was recorded every 2 s as the probe was heated. Twenty scans were then summed corresponding to 10 scans on each side of the maximum relative ion current. Tandem mass spectra were obtained in a similar manner
310 BIOMEDICAL MASS SPECTROMETRY, VOL. 12, NO. 7, 1985
METHYLATION OF CALF THYMUS DNA
with a Finnigan triple quadrupole mass spectrometer. Isobutane was used as chemical ionization reagent gas at a pressure of ca. 0.3 Torr and argon as collision gas at a pressure of ca. 2.4 mTorr. The collision energy, as determined by the voltage difference between the ion source and second quadrupole, was set at a nominal value of 20 eV.
3-Methylthymidine(mw and 3-(2H3)methylthymidine ((2H)mfi3
Thymidine (200 mg, 0.826 mmol) was dissolved in 3 ml freshly distilled dimethylsulfoxide (DMSO). To this was added 1.45 mmol (2001mg) ground K2C03 in a 15 ml round bottom flask under an atmosphere of nitrogen. To this solution was added either 200 ~1 (3.21 mmol) of either CH31 or C2H31 dissolved in 2 ml of DMSO. Stirring was continued for 1 h at room temperature and monitored by thin layer chromatography (TLC) on silica [MeOH:CHC13:NH40H = 2.7:2.7:0.1; Rf=0.69(T) and 0.77 (m3T)]. After 1 h the reaction mixture was filtered through a sintered glass filter coated with a thin layer of Celite and the filtrate transferred to a 50ml round bottom flask. The DMSO was removed at room tem- perature under reduced pressure and the remaining syrup dissolved in a minimum amount of ethanol. The solution was again filtered to remove any remaining potassium carbonate, and chloroform added to the fil- trate to induce turbidity. After refrigeration for 24 h the precipitate was filtered and dried under vacuum, while the filtrate was again induced to turbidity by the addition of additional chloroform followed by refrigeration. This procedure was repeated until no further precipitate was formed by the addition of CHCI,. The combined, dried precipitates of m3T were dissolved in a minimum of hot ethyl acetate, filtered and refrigerated. The resulting crystals were then dissolved in a minimum amount of absolute ethanol. A 50: 50 mixture of chloroform+ hexane was then added until a very slight turbidity appeared. The solution was allowed to stand at room temperature for 2 h and then kept in a freezer (-20 "C) for 24 h. The resulting fluffy precipitate was filtered and dried under high vacuum at room temperature to yield 0.72 mmol (75% yield) of pure 3-methylthymidine (mol. wt 256, m.p. 128 "C. The deuterium-labeled com- pound was precipitated one additional time (mol. wt 259). 'H-NMR and 13C-NMR data agreed with the reported data.28,29 Analysis calculated for 3-methyl- thymidine: C, 50.96; 'H + 2H, 7.38; N, 10.80. Found: C, 50.83; 'H+2H, 7.43; N, 10.71.
04-Methylthymidine (m4T) and O4-(*H,)methyl- thymidine (m4('H)T)
Two grams (8.3 mmol) thymidine in 50 ml of freshly distilled pyridine were treated with 16.6 mmol (1.93 ml) of benzoyl chloride with stirring for 3 days at 55°C. After three days the contents of the reaction flask were poured into 190 ml of ice water and stirred vigorously for 15 min. The precipitate was filtered and added to 250 ml of ice water and stirred for 30 min. The white precipitate was filtered, washed with 50 ml ofdiethyl ether and dried under vacuum for 3 h. The solid was then
dissolved in 400 ml of boiling absolute ethanol, filtered and yielded 2.19 g of 03', 05'-dibenzoylthymidine upon cooling (m.p. 195-196 "C).
Two grams (4.44 mmol) of 03', 05'-dibenzoylthymi- dine was dissolved in 20 ml of CHCI, and 3.25 ml (44.4 mmol) of thionyl chloride and 0.45 ml of N,N-dimethyl- formamide was added. The solution was refluxed for 1 h at 75 "C and then cooled for 4 h. The solution was evaporated to dryness, 20 ml of dry benzene added and the solution concentrated again. The remaining solid was then dried under vacuum at room temperature for 3 h. The resulting syrup was dissolved in 25 ml of dry tetrahydrofuran (THF). To this solution was added 10 ml of CH30H or C2H302H containing 300 mg dissol- ved sodium metal. The solution was then refluxed at 75 "C for 1 h and cooled. Amberlite IRC-50 (3.45 g) was then added to the stirring solution until the solution was neutralized. The solution was filtered, concentrated and applied to 75 g of silica equilibrated with 5% of methanol in chloroform and eluted with the same mobile phase. Nine hundred drops per fraction were collected and pure m4T appeared in fractions 130- 160. The solvent was removed and the compound crystallized from 25 ml of hot ethyl acetate to yield 85 mg of pure m? (7.4%). M.p. 168-170°C (lit.3o 166-168 "C). 13C-NMR (6, 50 MHz, (2H6)DMSO): C4 = 170.0 (m) C2 = 154.8 [dd; 6.7(Hg], 1.3(H,,)]; c g = 141.0 [dqd; 180.9(Hg), 5.8(CH3), 3.3(H,)]; C.j= 103.0 [qd; 6.5(CH3), 2.4(Hg)]; C4fz87.7 [dm; 147.0(H4,)]; C,,=85.5 [dm; 170.2(Hlt)]; C3.= 70.1 [dm; 148.8(H3.)]; C5'=61.1 [dm; 140.8(H5,)]; 0 C H 3 = 5 4 . 1 [ q ; 1 4 7 . 7 ( C H 3 ) ] ; c2 ,=40.7 [ d m ;
NMR (6, 470 MHz (*H6)DMS0) : H6 = 8.0[s]; HI.= 6.2
5.2(H5,)]; H4.=4.2[m]; OCH3=3.9[s]; H3,=3.8[m]; H5, = 3.6[m]; HZ' = 2.l[m]. Analysis calculated for 04- methylthymidine: C, 50.96; 'H+.H, 7.38; N, 10.8. Found: C, 51.02; 'H+2H, 7.56; N, 10.62.
133.1(H2,)]; CH3= 12.0 [qd; 128.7(CH3), 4.0(&)]. 'H-
[ti 6.3(H2,)]; 3-OH=5.2 [d; 4.3(H3,)]; 5'-OH=5.1 [ti
1-Methyl-2'-deoxyadenosine(m1dA) and l-('H,)methyl- 2'-deoxyadenosine ((2H)m'dA)
To a 10 ml conical flhsk was added 500 mg (2.0 mmol) of 2'-deoxyadenosine, 1.67 ml of freshly distilled N,N- dimethylacetamide and either 0.5 ml of CH,I or C2H31. The deoxyadenosine dissolved slowly with stirring and after 10 h 1-methyldeoxyadenosine began to precipitate. After 20 h, 8 ml of acetone was added and stirring con- tinued for an additional hour. The suspension was then transferred to a beaker containing 30 ml of acetone and stirring continued for 1 h before filtering.
The residue was then applied to 75g of silica that had been equilibrated with CHC:,:MeOH:NH,OH (75 : 25 : 1). Pure m'dA began to appear in fraction 38 (900 drops/fraction). Fractions 38-87 were combined, evaporated to dryness and the compound recrystallized from 30ml of hot absolute ethanol to yield 350mg of l-(2H3)methyldeoxyadenosine (44.4%). M.p. 300 "C (decomp). 'H-NMR and 13C-NMR data were in agree- ment with the reported Analysis calculated for l-(2H,)methyl-2'-deoxyadenosine: C, 33.35; 'H +'H, 4.83; N, 17.68; I, 32.03. Found: C, 33.15; 'H+2H, 4.61; N, 17.51; I, 32.00.
BIOMEDICAL MASS SPECTROMETRY, VOL. 12, NO. 7, 1985 311
D. J. ASHWORTH E T A L .
l-Methyl-2'-deoxyguanosine (m'dG) and l-(2H3)methyl- 2'-deoxyguanosine ((2H)m'dG)
To 4 ml of freshly distilled dimethylsulfoxide was added 1 g (7.24 mmol) of K&03 (ground in a mortar). To this solution was added 1 g (3.74 mmol) of 2'-deoxy- guanosine (dG) and the solution stirred for 15 min to allow the dG to dissolve. Either CH31 or C2H31 (300 p1, 4.82 mmol) dissolved in 400 pI of DMSO was then added dropwise to the dG solution and allowed to react for 15 min. The excess methyl iodide was removed by a water aspirator and the solution filtered through Celite.
The filtrate was applied to 100 g of silica equilibrated with CHCI, + MeOH + NH40H (75 : 25 : 1) and eluted with the same mobile phase. Nine hundred drops per fraction were collected and the product appeared in fractions 67- 100. The fractions were combined, evapor- ated to dryness and slurried with 20ml of absolute ethanol. The suspension was then filtered to yield 76 mg of pure l-('H,) methyl-2'-deoxyguanosine (7.15%). Rf= 0.44 (dG), 0.62 (m'dG) (silica, CHC1,:MeOH: NH40H = 6 : 4 : 1). 'H-NMR and ',C-NMR spectra agreed with the reported data.28329 Analysis calculated for l-(2H,)methyl-2'-deoxyguanosine: C, 46.48 ; 'H + 'H, 6.38; N, 24.63. Found: C, 46.56; 'H+2H, 6.49; N, 24.68.
7-Methyl-2'-deoxyguanosine (m7dG) and 7-('H3)methyl- 2'-deoxyguanosine (('H)m7dG)
To 500 mg (1.87 mmol) of dry 2'-deoxyguanosine was added 4 ml of freshly distilled dimethylsulfoxide, the flask was stoppered with a rubber septum, the solution stirred and placed in a refrigerator at 4 "C. Five hundred microliters of either CH31 or C2H,I was then added and the reaction monitored by TLC [silica, MeOH CHC1,:NH40H 50: 50: 1; Rf=0.32 (dG) and 0.15 (m'dG)]. After 6 h virtually all dG was converted to m'dG. The excess methyl iodide was removed by water aspiration and high vacuum applied to reduce the volume to 2.0 ml. The m7dG/DMS0 solution was then applied to a column of 75 g of silica equilibrated with CHCI, + MeOH + NH40H (50 : 50 : 1). The column was eluted initially with 500ml of the equilibrated mobile phase and finally with 70ml of MeOH+CHCI,+ NH40H (70: 50: 1). Nine hundred drops/fraction were collected and m7dG appeared in fractions 50-100. Frac- tions 55-95 were concentrated under high vacuum. Fifty milliliters of dry methanol was added, the suspension heated at 55 "C and then filtered. The filtrate was placed in a freezer (-20 "C) overnight. The resulting crystals were filtered, washed with 50 ml of acetone followed by 50 ml of ether to yield 63.6 mg (11.25% yield) of pure 7-(2H,) methyl-2'-deoxyguanosine. 'H-NMR and I3C- NMR data were in accordance with reported ~ p e c t r a . ~ * * ~ ~ Analysis calculated for 7-(2H,) methyl-2'-deoxy- guanosine: C, 43.7; 'H+'H, 6.67; N, 23.16. Found: C, 43.98; 'H+*H, 6.60; N, 23.03.
06-Methyl-2'-deoxyguanosine (m"dG) and 06-('H3)methyl-2'-deoxyguanosine ((2H)m6dG)
Ten grams (37.4 mmol) of deoxyguanosine was added to a stirred solution of 500 ml of freshly distilled pyridine
and 100 ml of acetic anhydride and allowed to react at room temperature for 3 days. The suspension was filtered and washed with 1 I of warm pyridine followed by 100 ml of diethyl ether. The solid was dried under vacuum for 2 days to yield 12.0g (34.2 mmol) of 03 ' ,05-di- acetyl-2'-deoxyguanosine (91.4%), Rf = 0.40 (silica, CHCI,+ MeOH = 9: 1).
Three grams (8.45 mmol) of the diacetyl compound was added to a stirred solution of 125ml of freshly distilled phosphoryl chloride and 2 ml of freshly distilled N,N-diethylaniline at room temperature. The SUS- pension was quickly heated to 110 "C and the diacetyl compound dissolved. The oil bath was removed and the solution allowed to cool for 10 min. The flask was placed on a rotary evaporator and the excess POCI, removed until 4ml remained in the 250ml round bottom flask. To 150 ml of vigorously stirred ice water the POCI, syrup was added dropwise and stirring continued for 5 min. The aqueous solution was transferred to a 250 mi separa- tory funnel and extracted with 4 ~ 1 0 0 m l portions of methylene chloride. The methylene chloride was then dried with anhydrous MgS04 for 4 h, filtered and con- centrated. The 6-chloro-3',5'-diacetyl-2'-deoxy- guanosine residue was dried overnight under high vacuum to yield a pale yellow sticky residue which was used without further purification, Rf = 0.67 (silica, CHCl, + MeOH = 9 : 1).
To 25 ml of (('H,) methyl) methanol or (('H3) methyl) methanol was added 125mg of sodium metal and the solid was allowed to dissolve. The sodium methoxide solution was then added to the flask containing the chloro compound and stirred at 50 "C for 1.5 h. The reaction flask was cooled in an ice-water bath for 112 h and the basic solution neutralized with cold 6 N HCI (0.5 ml conc. HCl in 0.5 ml methanol). The precipitated NaCl was removed by filtration and the filtrate concen- trated under high vacuum for 1 h. Ten milliliters of additional methanol was added to the syrup to precipi- tate any remaining NaCl and the filtrate again concen- trated.
The residue was dissolved in 3 ml of methanol and applied to 50 g of silica equilibrated with chloroform. Two hundred milliliters of CHCI, was passed through the column to remove the remaining diethylaniline and then eluted with 10% methanol in chloroform. Nine hundred drops/ fraction were collected and O6 -methyl- 2'-deoxyguanosine appeared in fractions 42-57. The fractions were pooled and concentrated. The solid was dissolved in 15ml of hot ethyl acetate, filtered and allowed to crystallize at room temperature. The resulting crystals were dried under vacuum and yielded 402 mg (1.42 mmol) of pure product (3.8% overall), m.p. 127- 128 "C (lit.,' 127-132 "C), Rf=0.33 (silica, CHCI,+ MeOH = 9: 1). 'H-NMR and I3C-NMR data were in agreement with the reported Analysis calculated for 06-(2H3)methyl-2'-deoxyguanosine: C, 46.48 ; 'H + 'H, 6.38; N, 24.63. Found: C, 46.53; 'H+'H, 6.60; N, 24.47.
3-Methyl-2'-deoxycytidine (m3dC) and 3-(2H3)methyl-2'- deoxycytidine (('H)m'dC)
To 3 ml of freshly distilled dimethylsulfoxide was added 495 mg (2.18 mmol) of 2'-deoxycytidine. To this solution was added 2.18 mmol of ('H3)- or (2H,)methyl iodide.
312 BIOMEDICAL MASS SPECTROMETRY, VOL. 12, NO. 7, 1985
METHYLATION OF CALF THYMUS DNA
The solution was stirred at room temperature for 6 h. The excess methyl iodide was removed by a water aspirator and the DMSO removed under high vacuum. The syrup was dissolved in a minimum amount of methanol and chloroform added to the point of slight turbidity. The solution was stored for 2 days at -20 “C and yielded 724 mg of pure product (goyo), m.p. 145 “C, Rf= 0.78 (silica, 2-propanol:NH,OH:H,O = 6: 3 : 1). ‘H-NMR and ‘,C-NMR data agreed with the reported data?8*29 Analysis calculated for 3-(’H3) methyl-2‘- deoxycytidine: C,32.27; ‘H+’H, 5.14; N, 11.29; I,34.10. Found: C, 32.45; ’H+’H, 5.16; N, 11.09; I, 33.90.
Methylation of calf thymus DNA with N-methyl-N-nitrosourea
Calf thymus DNA (type 1, Sigma Chemical Co. #D- 1501) was purified before alkylation by extensive dialysis against double distilled water and was found to be 75-80% double stranded by agarose electrophoresis.’0328 Twenty milligrams of purified calf thymus DNA were dissolved in 10 ml of water, pH 7.0. To this solution was added 5.9 mg (5.7 X lo-’ mmol) of ‘’C/l4C N-methyl-N- nitrosourea and the reaction was run for 3 h on the pH-stat (pH 7.0*0.1) at room temperature. After 3 h the contents of the reaction vessel were transferred to a dialysis membrane and dialysed for 20 h (until no radio- activity was detectable in the outside solution). After dialysis the contents of the dialysis bag were adjusted to 25 ml and 0.5 ml removed for final DNA concentration determination (UV) and radioactivity determination. The remaining DNA solution was freeze dried. The percentage of methylated nucleotides was calculated to be 2.43’/0, based on the ‘‘C-incorporation.
Enzymatic degradation and HPLC separation of calf thymus DNA reacted with N-methyl-N-nitrosourea
To 2.53 x lo-’ mmol of freeze-dried DNA was added 0.5 ml of 0.1 M Tris buffer, pH 7.3 in a 10 ml screw top test tube. Sixty units of DNase I (type 111, 1500 units mg-’, Sigma), 3.06 units of alkaline phosphatase (type 111, 25 units mg-’, Sigma) and 0.0303 units of phos- phodiesterase (snake venom, type 111, 0.2 units mg-’, Sigma) were then added in a total volume of 0.15 ml.
The following amounts of deuterium-labeled refer- ence nucleoside were then added:
m3dC - 11.0 pg (2.96 x lo-’ pmol) m’dA- 11.2 pg (2.83 x lo-’ pmol) m7dG- 8.5 pg (2.81 x lo-’ mol)
m3T - 10.0 pg (3.86 x lo-’ pmol) m4T - 12.5 pg (4.82 x lo-* pmol) m6dG- 9.7 pg (3.41 X
m’dG- 11.8 pg (4.15 x 10- P pmol)
pmol) Degradation was allowed to continue for 18 h at 37 “C in a shaker bath, at which time the degraded sample was filtered through a 0.4 pm filter and freeze dried.
The dry nucleosides were then dissolved in 330 p1 of water and 100 p1 of the solution injected onto the HPLC (three times). Mobile phase: 0.05 M ammonium formate, 3.0 M tetraethylammonium chloride with a gradient elu- tion (Waters 660 programmer, program #7) of 0-15% methanol in 25 min. As each peak corresponding to a
nucleoside was observed by UV, that peak was collected and lyophilized.
Due to the large amount of buffer and ion-pair reagent present in each of the nucleoside fractions, an additional purification step of the nucleosides was necessary.
To purify m3dC, m’dA and m’dG, the positively charged nucleosides, the compounds were dissolved in 100 p1 of water and applied to 1 g AGLX8 cation exchange resin (OH- form) equilibrated with double distilled water. After application of the sample, the column was washed with 5 ml of water to remove formate and chloride ions and the nucleosides eluted with 1% NH40H. The nucleosides usually appeared in fractions 22-25 (40 drops (1 ml)/fraction). The compounds were freeze dried before mass spectral analysis.
Purification of the neutral nucleosides m6dG, m’dG, m4T and m3T was performed by reinjecting the dry, buffer containing fraction, back onto the HPLC using a pure water+ methanol mobile phase with the same gradient elution profile as in the initial separation, fol- lowed by lyophilization.
RESULTS AND DISCUSSION
By the methodology described here, the quantification of the five major methylated nucleosides formed in calf thymus DNA upon methylation with MeNU is possible. The synthetic C’H, analogs of the particular methyl- ated products under investigation are added, at a known concentration, to a solution containing an unknown concentration of the methylated nucleosides. The labeled and unlabeled compounds, being of nearly iden- tical molecular structure and volatility, are then sub- jected to mass spectral analysis. By comparing the mass spectral peak intensity resulting from the CH, com- pound with the correspondin peak (three mass units higher) resulting from the C H3 compound, one can directly determine the concentration of the methylation product present initially in the reaction solution.
4
(*H3) Methyl reference compounds
Implicit in the design of this methodology using mass spectral quantification is the requirement for the syn- thesis of deuterium-labeled nucleosides. The methyl- ated nucleosides examined in this investigation were 3-methyl-2’-deoxycytidine(m3dC), l-methyl-2’- deoxyadenosine (m’dA), 7-methyl-2’-deoxyguanosine (m7dG), l-methy1-2’-deoxyguanosine (m’dG), 3-methyl- thymidine (m3T), 04-methylthymidine (m?) and 06- methyl-2’-deoxyguanosine (m6dG). All compounds were synthesized as the (’H,) methyl nucleoside, as well as the unlabeled methyl compound, and the purity of each deuterium-labeled compound was determined by elemental and spectral analyses. Other methylated nucleosides (7-methyl-2’-deoxyadenosine, 3-methyl-2’- deoxyadenosine, 02-methyl-2’-deoxycytidine, 0’- methylthymidine and 3-methyl-2’-deoxyguanosine) were not sought in this experiment due to the unavail- ability of highly purified nucleosides because of their instability.
BIOMEDICAL MASS SPECTROMETRY, VOL. 12. NO. 7, 1985 313

D. J. ASHWORTH E T A L .
ION ABUNDANCE Ratio [CH,]/[C2H,l
Figure 1. Calibration curve for quantification using C’H, nucleosides as internal standards. Calibrations based on protonated 3-methyl- thymidine and its ionized free base are both shown.
Mass spectral calibration curve for quantitative analysis
In order to determine the reliability of using the deuter- ated internal reference method for quantifying the alkylation products formed in reactions between alkylat- ing agents and polynucleotides, the following experi- ment was performed. The synthesized C2H3 analog of each methylated alkylation product under investigation was added, at a known concentration, to a solution containing a known concentration of the CH, methy- lated product. These compounds, being of nearly iden- tical molecular structures and hence equal volatility and fragmentation, were then subjected to mass spectral analysis. By comparing mass spectral peaks resulting from the CH, compound to the corresponding peaks (three mass units higher) resulting from the C2H3 com- pound, it was possible to determine a calibration curve. Typical data for the nucleoside ions and those based on the much more abundant peaks due to the free bases themselves are both given in Fig. 1. Both experiments show excellent linearity over the range of relative con- centrations used in the later experiments.
HPLC separation
To enable the accurate determination by chemical ioniz- ation of the amounts of methylated nucleosides present relative to deuterium-labeled internal references, it was necessary to develop an HPLC system capable of separating these nucleosides. Collection of each peak, which contained the deuterium standard as well as the CH, form of the nucleoside, followed by mass spectrometric analysis, provided an appropriate quan- tification procedure. Although absolute resolution of each peak in the chromatographic system was not rigorously required, an initial requirement of the system was the complete resolution of all structural isomers under analysis. This follows because structural isomers, being of equal molecular weight and all generating the same free base fragments used for quantification, would have given erroneous data about particular nucleoside concentrations if there were any overlap of these isomers in the HPLC separation. The separation achieved with the high-pressure liquid chromatographic system is shown in Fig. 2.
The system indeed allows the separation of all struc- tural isomers present. The guanosine isomers, m’dG, m’dG and m6dG, as well as the thymidine isomers m’T and m4T all have sufficiently different retention times so as not to allow any peak overlap to occur. The charged nucleosides, m3dC, m’dA and m7dG, all elute relatively early in the chromatogram due to the presence of the positive ion-pair reagent, tetraethylammonium chloride. The subject of ion-pair reagents in HPLC systems has recently been d i sc~ssed ,~ and the early elution of these positively charged compounds in this system occurs apparently due to the hydrophobic interactions between the quaternary ammonium ethyl groups and the C,8 resin thus generating positive charges along the resin bed by repulsion, and so favoring elution of the positively charged nucleosides. The elution pattern of the neutral compounds appears to correlate with their polarity; the N-methyl compounds elute prior to the O-methylnu- cleosides. The one exception to this is N6-methyl-2’- deoxyadenosine which might have been predicted, in view of the increased hydrophobicity resulting from methyl attachment to the N-6 atom of adenosine, to elute later than all deoxynucleosides. Apart from the seven methylated nucleosides under investigation here, eight other 2’-deoxynucleosides are also potentially present. Separation of two of the four major naturally occurring nucleosides, 2’-deoxycytidine and 2’- deoxyadenosine, is evident in Fig. 2, while separation of 2’-deoxyguanosine and thymidine could not be achieved in this system without sacrificing resolution of the three charged nucleosides. Furthermore, 5-methyl-2‘- deoxycytidine (a naturally occurring modified nucleo- side present in DNA) does not always separate from m7dG. This overlap is of no consequence here due to the differences in the molecular weights of the two compounds. The three remaining minor naturally occurring nucleosides ; 2‘-deoxyuridine (dU), 2‘- deoxyinosine (dI) and N6-methyl-2’-deoxyadenosine (m6dA), are all resolved.
Methylation of calf thymus DNA with N-methyl-N-nitrosourea
Alkylation of purified calf thymus DNA with MeNU resulted in 2.43% methyl incorporation as determined by 14C analysis. Addition of deuterium-labeled nucleo- sides followed by enzymatic degradation of the methy- lated DNA and then HPLC separation of the individual methylated nucleosides provided the samples used for quantitative analysis by mass spectrometry (Fig. 3). The results of this experiment are presented in Table 1. It can be seen that the N-7 position of deoxyguanosine is the predominant site of modification (99%) by MeNU, which is in accordance with previous studies using the radioisotopic tracing technique and the chemical degra- dation In addition to 7-methyldeoxy- guanosine (m7dG), four other minor reaction products, 1-methyldeoxyadenosine (m’dA, 0.1?40), 3-methyl- deoxycytidine (m3dC, 0.4% ), 3-methylthymidine (m3T, 0.5%) and 04-methylthymidine (m4T, 0.1 YO), have been determined from the corresponding HPLC fractions. The chemical ionization mass spectra of these HPLC fractions are shown in Fig. 3. All reaction products are detected as methylated bases due to the facile breakdown
314 BIOMEDICAL MASS SPECTROMETRY, VOL. 12, NO. 7, 1985

METHYLATION OF CALF THYMUS DNA
dC
1
C
1u
m'dG
r 1 I I I I I 0 5 10 15 20 25 30 rnin
Figure 2. High-pressure liquid chromatographic separation of 2'-deoxynu- cleosides. Mobile phase: 0.05 M ammoniumformate; 3.0 mM tetraethylammonium chloride; methanol gradient, 6 1 5 % in 25 rnin (Waters Assoc. model 660 solvent programmer, program #7). Column: Waters Assoc. Radial-compression C,, (10) cartridge. Flow rate: 4 ml min-'. Chart speed: 0.5 cm min-'. UV absorbance: 254 nm.
of the deoxyribosyl moiety. The amount of modified product is directly calculated on the basis of the peak ratio of the C2H3 compound and the CH3 compound, and the known concentration of the C2H3 reference compound. In all of the above cases, the peak due to the CH3 compound appears at a relative abundance well above the noise background.
The mass spectrum of the quantified m'dA fraction appears in Fig. 3(a). One can observe that, although the percentage of this product relative to the total methyl incorporation is small (<< 1 YO ), the mass spectrum clearly indicates a significant peak at m / z 150 corresponding to the methyladenine peak of m'dA. In addition to the methyladenine peaks, two other strong peaks can be clearly seen. The m / z 166 peak may be attributable to the fragment of 7-methyldeoxyguanosine, which is the predominant reaction product (Fig. 3(c) and Table 1). The m / z 126 peaks may be ascribed to fragments of naturally occurring 5-methyldeoxycytosine and 3- methyldeoxycytidine. These extraneous methylnucleo- sides may jeopardize the quantitative determination of 1-methyldeoxyadenosine by HPLC alone. However, using the mass spectral method, these interferences can be readily eliminated because of the difference in their masses. The mass spectra of m3T and m4T are shown in Figs 3(d) and 3(e) respectively. The formation of these
compounds during in vitro reactions of n u c l e o ~ i d e s ~ ~ and p o l y n u ~ l e o t i d e s ~ ~ ~ ~ ~ - ~ ~ with MeNU has clearly been demonstrated. Fox and Brennand4O have suggested that 06-methylation of deoxyguanosine may not alone explain the differences in the carcinogenicity of various methylating agents and that 04-methylthymidine may have a role. The formation of m4T is supported by the results of this experiment. An attempt was also made
Table 1. Mass spectral quantification of methylnucleoside for- mation in calf thymus DNA reacted with N-methyl-N- nitrosourea
('H,)Methyl Relative ratio of ('HJMethyl nucleoside ('H,)methyl/ nucleoside reference ('H,)rnethyl formed % of total
Nucleoside (nmol) nucleosides' (nmol)b reaction
m'dA 28.3 0.1 1 3.1 1 0.1 m3dC 29.6 0.32 9.47 0.4 m7dG 28.1 80.5 2.26 x lo3 98.9 m3T 38.6 0.29 11.2 0.5 m4T 48.2 0.04 1.94 0.1
a Measured directly from the mass spectral peak intensity of the ('H,)methyl base (analyte) and ('H,)methyl base (reference) peak.
Precision of these determinations varies with signal-to-noise ratios and is estimated to range from 5% for m7dG to 50% for m4T.
BIOMEDICAL MASS SPECTROMETRY, VOL. 12, NO. 7, 1985 315

(a 1 m
ldA
126 ,,lj,,
l, j,,,iJll;,,,j
,,; . ,
120
140
160
180
166 I
(C 1 m
7dG
m /I
129
(b)
m3d
C
166
126
,'
I
120
140
160
180
144
(d 1
m3T
I4 I
120
140
160
I€
Fig
ure
3. M
ass
spec
tral
qua
ntifi
catio
n of
met
hyln
ucle
osid
es i
sola
ted
fro
m c
alf t
hym
us
DN
A r
eact
ed w
ith
N-m
ethy
l-N
-nitr
osou
rea:
(a)
1 -m
ethy
ldeo
xyad
enos
ine:
('H
,)met
hyl
base
(an
alyt
e) p
eak
at
m/z
150,
('H
Jmet
hyl
base
(re
fere
nce)
pea
k at
m/z
153
; (b
) 3-
met
hyld
eoxy
cytid
ine:
('H
,)met
hyl
base
(an
alyt
e) p
eak
at m
/z 1
26, (
*H,)m
ethy
l ba
se
(ref
eren
ce)
peak
at
m/z
129
; (c
) 7-
met
hyld
eoxy
guan
osin
e: (
'HJm
ethy
l ba
se (
anal
yte)
pe
ak a
t m
/z 1
66, (
'HJm
ethy
l ba
se (r
efer
ence
) pe
ak a
t m
/z 1
69; (
d) 3
-rne
thyl
thym
idin
e:
('H,)m
ethy
l ba
se (
anal
yte)
pea
k at
m/z
141,
('H
3)
met
hyl
base
(re
fere
nce)
pea
k at
m
/z 1
44;
(e)
04-m
ethy
ithym
idin
e: (
'H,)m
ethy
t ba
se
(ana
lyte
) pe
ak
at
m/z
141,
('H
,)met
hyl
base
(re
fere
nce)
pea
k at
m/z
144
; (f
) 06
-met
hyld
eoxy
guan
osin
e: (
'H3)
m
ethy
l bas
e (a
naly
te)
peak
at
m/z
166
, ('H
Jmet
hyl
base
(ref
eren
ce) p
eak
at m
/z 1
69.
MA
SS
S
PE
CTR
UM
I '7' I '9'
TAN
DEM
MA
SS S
PEC
TRU
M
(b)
5'
If S 'I i I
r
170 I
134 I
m/z
2
0
40
6
0
80
10
0 I2
0
140
110
I '3 I 1 17
II 160 180 F
igur
e 4.
M
ass
spec
tra
of O
'-met
hyld
eoxy
guan
osin
e (1
0 ng
) m
easu
red
by:
(a)
sing
le
mas
s sp
ectr
omet
ry;
(b) t
ande
m m
ass
spec
trom
etry
.

METHYLATION OF CALF THYMUS DNA
107
12 I 67 42 55 I 82 94 I
I.. I . . I
to determine 06-methyldeoxyguanosine; however, the signal due to the analyte was indistinguishable from the noise and quantification was not possible (Fig. 3(f)).
As noted above, m6dG could not be quantified because of poor signal-to-noise in the mass spectrum. Figure 4 shows the ability of tandem mass spectrometry to increase the specificity and sensitivity of such a determi- nation. Figure 4(a) shows the mass spectrum of l o n g (36pmol) of m6dG and Fig. 4(b) shows the daughter spectrum of 10 ng of m6dG. Note that the mass spectrum consists virtually entirely of background noise peaks with the signal due to m6dG at m/z 166 being indistin- guishable from the noise peaks. However, the tandem mass spectrum shows much better specificity and sensi- tivity, and consists primarily of ions due to m6dG at an improved signal-to-noise ratio. These data indicate a striking enhancement in specificity and sensitivity for tandem mass spectrometry over the single mass spec- trometric experiment. Furthermore, tandem mass spec- trometry provides an added dimension of information by showing the fragmentation pattern of a mass selected ion. These fragmentation patterns (daughter spectra) contain a great deal of structural information and there- fore are useful for compound identification4'--
Quantification is possible with tandem mass spec- trometry by standard addition or by using internal stan- dard labeled with stable isotopes. Figure 5 illustrates how tandem mass spectrometry could be used in the quantification of methylated nucleosides. Figure 5( a) shows the daughter spectrum of 06-('H,)methyl-2'- deoxyguanosine (m6dG) and Fig. 5(b) shows the daugh- ter spectrum of the deuterium-labeled analog. Figure 5(c) shows the daughter spectra for equal amounts of m6dG (CH,) and m6dG (C2H,). Note that the peaks m / z 166 and 169 are of essentially equal intensity, as demanded for quantitative analysis using internal stan- dards. The fragmentation peaks observed in the daughter spectra are characteristic of m6dG (CH,) and m6dG (C'H,) and serve as an additional check on the identity of the 166 and 169 ions.
The sensitivity of the tandem mass spectrometric experiment can be enhanced even more by a technique known as selected reaction monitoring.44 In this method, instead of scanning the entire mass range of the tandem mass spectrum, a few selected ions are monitored; they are chosen to correspond to a few highly diagnostic fragmentation reactions in much the same way as selec. ted ion monitoring is used to detect targeted compounds in gas chromatography/mass spectrometry. The selected reaction monitoring technique has less specificity than scanning an entire tandem mass spectrum because only a few peaks are monitored; however, it has the important advantage of substantially increased sensitivity due to the fact that all of the analysis time is spent monitoring reactions of interest.
The above observations clearly illustrate that tandem mass spectrometric techniques should be extremely use- ful for analyses where high specificity and sensitivity are necessary. Such is the case in the quantitative deter- mination of modified nucleosides obtained from in vivo methylations in which small quantities of methylated products are formed in a complex matrix. The applica- tion of tandem mass spectrometric techniques to in vivo studies is currently being investigated.
110
70 124
42 55 It I l l
166 I69
I , ,
Figure 5. Tandem mass Spectrometry daughter spectra of: (a) 500 ng ma dG (CH,); (b) 500 ng of madG (C'H,); (c) 500 ng of medG (CH,) +500 ng medG (C'H,) (20 eVcollision energy.2.2 mTorrargon).
In summary, the approach presented has clCarly shown the ability of mass spectrometry, in combination with HPLC, to qualitatively and quantitatively deter- mine small amounts of chemically modified nucleosides obtained from in vitro methylation of calf thymus DNA. Further refinements of the mass spectral methodology, including tandem mass spectrometry: and the implementation of desorption ionization methods (laser desorption, fast atom bombardment, secondary ion mass spectrometry, field desorption or plasma desorp-
BIOMEDICAL MASS SPECTROMETRY, VOL. 12, NO. 7, 1985 317

D. J. ASHWORTH ET AL.
t i ~ n ) ~ ~ - ’ ’ should permit study of the in vivo systems, and hopefully provide the molecular basis for correlating the biological end points with some specific modifica- tions of nucleic acids.
Acknowledgement
This work was supported by PHS Grant Number CA35904, awarded by the National Cancer Institute, DHHS.
REFERENCES
1. 0. M. Brown (1974) in BasicPrinciplesinNocleicAcidChemistry, Vol. 2, edited by P.O.P. Ts’o, pp. 1-90. Academic Press, New York (1974). (1979).
2. N. K. Kochetkov and E. 1. Budowsky, Prog. Nucleic Acid Res. Mol. Biol. 9, 403 (1969).
3. C.-j. Chang and C.-G. Lee, Cancer Res. 38, 3734 (1978). 4. R. A. lkeda and P. B. Dervan, J. Am. Chem. SOC. 104,296 (1982). 5. A. E. Czarnik and N. J. Leonard, J. Am. Chem. Soc. 104. 2624
25. E. lnstitoris and J. Tamas, Biochem. J. 185, 659 (1980). 26. A. E. Schoen, J. L. Wiebers and R. G. Cooks, Science 203. 1249
27. P. 8. Farmer, A. B. Foster, M. Jarman and M. J. Tisdale, Biochem. J. 135, 203 (1973).
28. (a) J. DaSilva Gomes, Ph.D. Thesis, Purdue University, West Lafayette, Indiana (1981). (b) C.-j. Chang, J. DaSilva Gomes and S. R. Byrn, J. Org. Chem. 48. 5151 (1983).
(1982). 6. D. C. Fritzinger and M. J. Fournier, Biochemistry 21.21 18 (1982). 7. D. J. Kaplan and M. Tomasz, Biochemistry 21, 3006 (1982). 8. S. Mong, D. C. Eubanks, A. W. Prestayko and S. T. Crooke,
9. C.-j. Chang and C.-G Lee, Biochemistry 20, 2657 (1981). Biochemistry 21, 31 74 (1 982).
10. C.-j. Chang, J. DaSilva Gomes and S. R. Byrn, J. Am. Chem. SOC. 103. 2892 (1981).
11. D. J. Ashworth, C.-j. Chang, S. E. Unger and R. G. Cooks, J. Org. Chem. 46,4770 (1981).
12. J. DaSilva Gomes and C.-j. Chang, Anal. Biochem. 129, 387 (1 983).
13 L. K. Liu, S. E. Unger and R. G. Cooks. Tetrahedron 37, 1067 (1 981 ).
14. S. E. Unger, A. E. Schoen, R. G. Cooks, D. J. Ashworth. J. DaSilva Gomes and C.-j. Chang, J. Org. Chem. 46,4765 (1981).
15. P. F. Crain, H. Yamamoto. J. A. McCloskey, 2. Yomaizumi, S. Nishimura, K. Limbury, M. Raba and H. J. Gross, Adv. Mass Spectrom. 8, 1 135 (1 980).
16. V. T. Vu, C. C. Fenselau and 0. M. Colvin, J. Am. Chem. Soc. 103, 7362 (1981).
17. C. Fenselau. M.-N. N. Kan, G. H. Sack Jr, G. W. Wood, D. E. Schmidt and P.-Y. Lau, Adv. Mass Spectrom. 7, 1572 (1978).
18. M. Linscheid, G. Feistner and H. Budzikiewicz. Israel J. Chem. 17, 163 (1978).
19. K. M. Straub and A. L. Burlingame, in Soft lonization Biological Mass Spectrometry, edited by H. R. Morris, pp. 39-53. Heyden, London (1981).
20. F. A. Beland, D. L. Tullis, F. F. Kadlubar, K. M. Straub and F. E. Evans, Chem. Biol. Interact. 31, 1 (1980).
21. F. F. Kadlubar. L. E. Unruh, F. A. Beland, K. M. Straub and F. E. Evans, Carcinogenesis 1, 139 (1 980).
22. K. M. Straub, D. Kanne, J. E. Hearst and H. Rapoport. J. Am. Chem. SOC. 103, 2347 (1981).
23. J. L. Wiebers, P. J. Abbott, M. M. Coombs and D. C. Livingston, Carcinogenesis 2, 637 (1 981 ).
24. I. N. Maruyama. N. Tanaka, S. Kondon and H. Umezawa, Bio- chem. Biophys. Res. Commun. 98, 970 (1 981 ).
29. C.-j. Chang, D. J.Ashworth, L.-J. Chern, J. DaSilva Gomes. C.-G. Lee, P. W. Mou and R. Narayan, Org. Magn. Reson.22,671 (1984).
30. P. D. Lawley, D. J. Orr, S. A. Shah, P. B. Farmer and M. Jarman, Biochem. J. 135, 193 (1973).
31. J. R. Mehta and D. 8. Ludlum, Biochim. Biophys. Acta 521, 770 (1978).
32. B. A. Bidlingmeyer, Liquid Chromatogr. 1, 344 (1983). 33. P. D. Lawley and P. Brookes, Biochem. J. 89, 127 (1963). 34. R. F. Newbold, W. Warren, A. S. C. Medcalf and J. Amos, Nature
253, 596 (1 980). 35. B. Singer and D. Grunberger, Molecular Biology of Mutagens
and Carcinogens. Plenum, New York (1983). 36. P. J. Abbott and R. Saffhill, Nucleic Acids Res. 4, 761 (1977). 37. D. E. Jensen, Biochemistry 17, 5108 (1978). 38. R. Saffhill and P. J. Abbott, Nudeic Acids Res. 5, 1971 (1978). 39. P. D. Lawley and W. Warren, in DNA Repair, Vol. 1, edited by
E. C. Friedberg and P. C. Hanawalt, pp. 129-143. Marcel Dekker, New York (1981).
40. M. Fox and J. Brennand, Carcinogenesis 1, 795 (1980). 41. R. A. Yost and C. G. Enke, Anal. Chem. 51,1251A-l252A, 1256A.
1258A. 1260A, 1262A. 1264A (1 979). 42. T. H. Maugh, Science 209, 675 (1980). 43. F. W. McLafferty. Science 214, 280 (1981). 44. R. G. Cooks and G. L. Glish, Chem. Eng. News 59.40 (1981). 45. F. W. McLafferty, Tandem Mass Spectrometry. Wiley, New York
46. K. L. Busch and R. G. Cooks, Science 218, 247 (1982). 47. K. L. Rinehart, Jr, Science 218, 254 (1981). 48. H. M. Schiebel and H.-R. Schulten, Z. Naturforsch, B, 368, 967
49. C. J. McNeal and R. D. Macfarlane, J. Am. Chem. SOC. 103,1609
50. W. Aberth, K. M. Straub and A. L. Burlingame. Anal Chem. 54,
(1983).
(1981).
(1981).
2029 (1982).
Received 2 October 1984; accepted (revised) 11 January 1985
318 BIOMEDICAL MASS SPECTROMETRY, VOL. 12, NO. 7, 1985