characterizing perchlorate exposure - citeseerx
TRANSCRIPT
CHARACTERIZING PERCHLORATE EXPOSURE
AND EFFECTS IN MAMMALS
by
QIUQIONG CHENG, B.S., M.S.
A DISSERTATION
IN
ENVIRONMENTAL TOXICOLOGY
Submitted to the Graduate Faculty of Texas Tech University in
Partial Fulfillment of the Requirements for
the Degree of
DOCTOR OF PHILOSOPHY
Approved
Todd T. Anderson Chairperson of the Committee
Michael J. Hooper
W. Andrew Jackson
Scott T. McMurry
Ernest E. Smith
Accepted
John Borrelli
Dean of the Graduate School
May, 2006

ACKNOWLEDGMENTS
I would like to express my sincerest gratitude here to many people who
provided help, guidance, and encouragement not only in my academic study, but
also in my everyday life over the last three and half years. Their help, patience,
guidance, and encouragement made it possible for me to complete this
dissertation as well as my education in Environmental Toxicology at The Institute
of Environmental and Human Health, Texas Tech University. I am deeply
grateful to each of them for the great help.
Firstly, I would like to thank my committee members: Drs. Todd Anderson,
Ernest Smith, Andrew Jackson, Michael Hooper, and Scott McMurry, for their
expert advice and mentorship. I really appreciate Dr. Todd Anderson, my
advisor, for providing space, time, and financial support for me to conduct
experiments relevant to my dissertation, letting me have the opportunity to work
independently, and giving me advice and encouragement when I had trouble with
my experiments. Todd is not only a mentor for me during studying and working
in the lab and classes, he is also a good friend in my everyday life. He made my
life in Lubbock colorful and exciting by inviting us to watch many sport games
such as college football and Cotton King hockey. I would like to sincerely thank
Todd for all his time, guidance, support, encouragement, and help over the
years.
Dr. Ernest Smith also provided space and support for me to work in his
lab, and I am particularly grateful for his generosity and kindness. I especially
appreciate his patience, guidance, and encouragement while training me in
molecular biology. I want to thank Dr. Andrew Jackson for his guidance, support,
and help over the years, particularly in the qualifying exams and providing an IC-
MS/MS for sample analysis; Dr. Hooper, for his enthusiasm and help to solve
and discuss problems in inside and outside of the classroom, and for providing
deer mice for my research; and Dr. McMurry for his kindness, impressive science
ii
attitude, and personality. Dr. McMurry also provided a lot of help and support for
perchlorate exposure assessment in beef cattle and the distribution experiment.
I appreciate all my committee members for dedicating their time, ideas, and
advice on my dissertation.
Secondly, I would like to thank all my Anderson lab mates over the last
three and half years for their help, support, encouragement, and advice: Lu Yu,
Jaclyn Cañas, Baohong Zhang, and Christina Freitag. Especially, I would like to
thank Lu Yu and Jaclyn Cañas for teaching me how to use instruments in the lab,
making me comfortable in the lab, and maintaining the lab neat and organized. I
would also like to thank them for their encouragement, support, suggestions, and
friendship in my research and life.
I would also like to thank all my colleagues out of the Anderson lab for
their friendship and help over the years. I would like to thank Bharath Ram,
Norka Malpartida, Jingqiu Zhu, Rene Viñas, and Colton Wilson in Dr. Smith’s lab
for their help, encouragement, and friendship. I had a very good time working
with them in the same lab. I would also like to thank Dr. Wang’s lab for their help
in both research and life. I would like especially to thank Fujun Liu, Haitao Luo,
and Hongmei Wu for their help during animal exposure studies, Toby McBride for
providing deer mice, and Jordan Smith for providing information about deer mice.
Thirdly, I would like to thank all those people who provided samples and
technical training for my dissertation research: Joanna Johnson and Dr. Leon
Glass from United Chemical Technologies, Inc (Bristol, PA) for providing SPE
cartridge samples; Cassie Abney and Dr. Michael Galyean from the Department
of Animal and Food Science, Texas Tech University, for cow urine samples, and
Dr. Sam Jackson for sheep urine samples; Dr. Michael McCarty and Linxia Dong
from the Department of Human Development and Family Studies, Texas Tech
University for providing human breast milk samples; Lisa Perlmutter, Scott
Severt, and John Isanhart for field sample collection; Andrew Kirk for providing
goat milk samples; Brad Thornhill from the Department of Civil Engineering for
iii

training on IC-MS/MS operation; and Dr. Kang Tian for
preconcentration/preelution IC and LC-MS/MS training. I also want to thank Drs.
Benjamin Blount and Liza Valentin from the Centers for Disease Control and
Prevention for help in urine sample analysis using IC-MS/MS.
I would like to thank all the faculty and stuff at The Institute of
Environmental and Human Health for providing a supportive and rich
environment during my research. Especially I would like to Dr. Angela Gentles
for her kindness and technical support during my time in Dr. Smith’s lab; Dr.
Jaclyn Cañas for reviewing my dissertation draft; Dr. George Cobb for his
knowledge and guidance in analytical instrumentation, allowing me to access to
the LC-ESI-MS, attending my defense, and reading my dissertation; Dr. Steven
Cox for his advice on statistical analysis; Dr. Phil Smith for his support and help
in the cattle study and vole distribution experiment; Kimberly Pruitt for patience
and help during ordering and purchasing supplies; and Tammy Henricks for the
help with international student paperwork.
Finally, I would like to thank my husband and family. Without their love,
support, and understanding, I would not be where I am today, and my
dissertation and education would not have been possible. I am grateful for the
love and support from my husband: Fujun Liu. We learned to take care of each
other and cherish each other over the years. Fujun also provided a lot of help,
encouragement, advice, and confidence in my research over the last years. I
deeply appreciate having him in my life. I am sincerely grateful for the love and
understanding of my great parents. They have always been supportive and
understanding of my decisions and desires. I always feel guilty not being able to
stay with them and take care of them, especially over the last three and half
years. I would like to thank my younger sisters and brother for being so
supportive of my board education, for taking care of our parents, and for being
my best sisters and brother. I am very proud of them and grateful to have them
iv
as family. I would like to dedicate this work to my great husband, parents,
sisters, and brother.
This research was supported in part by the U.S. Department of Defense
contract CU1141, through the Strategic Environmental Research and
Development Program (SERDP) under a Cooperative Agreement IERA-99-001
with the USAF, Institute for Environment, Safety, and Occupational Health,
Brooks AFB, TX
v
TABLE OF CONTENTS
ACKNOWLEDGMENTS ........................................................................................ii
ABSTRACT .......................................................................................................... x
LIST OF TABLES ............................................................................................... xiii
LIST OF FIGURES ..............................................................................................xv
CHAPTER
I. GENERAL INTRODUCTION................................................................ 1
Perchlorate Occurrence and Fate ................................................... 1 Potential Health Effects of Perchlorate Exposure............................ 3 Study Objectives, Background, and Hypotheses ............................ 7 Dissertation Format and Contents................................................. 10
II. PERCHLORATE DETERMINATION IN PLASMA, URINE,
AND MILK – METHOD DEVELOPMENT ........................................... 12
Introduction ................................................................................... 12 Cleanup Method for Perchlorate Determination in Plasma and urine .......................................................................... 17
Materials and Method .............................................................. 17 Chemicals........................................................................... 17 Sample sources and treatment........................................... 17 Sample preparation procedure for urine cleanup ............... 18 Sample analysis ................................................................. 19
Results and Discussion ........................................................... 20 Recovery and precision of alumina-neutral plus C18 as a cleanup method for plasma................................. 20 Efficiency of various cleanup procedures for urine ............. 20 Accuracy and precision of NAX plus Al-N for cleanup of different sources of urine .................................. 23 Application of cleanup method (NAX plus Al-N) to urine samples from field and laboratory studies ................. 24
Conclusions ............................................................................. 27 Perchlorate Determination in Urine, Milk, and Plasma Using Liquid Chromatography Electrospray Ionization Mass Spectrometry (LC-ESI-MS) and Comparison with Suppressed Conductivity Detection (IC-SCD)............................... 32
Materials and Method .............................................................. 32
vi
Reagents and standards .................................................... 32 Sample sources and preparation........................................ 32 IC-SCD analysis ................................................................. 34 LC-ESI-MS analysis ........................................................... 34
Results and Discussion ........................................................... 35 Linearity of response and detection limit for LC-ESI-MS ......................................................................... 35 Comparison of LC-ESI-MS with IC-SCD ............................ 37
Conclusions ............................................................................. 39 Perchlorate Determination in Urine Using Ion Chromatography Couples with Atmospheric Pressure Ionization Tandem Mass Spectrometry (IC-MS/MS) ..................... 48
Materials and Method .............................................................. 48 Reagents and standards .................................................... 48 Ion chromatography ........................................................... 48 Mass spectrometry ............................................................. 49 Samples preparation .......................................................... 50 Quality control .................................................................... 50
Results and Discussion ........................................................... 50 Selectivity and sensitivity of IC-MS/MS .............................. 50 Linearity of calibration curves ............................................. 52 Accuracy and precision of the IC-MS/MS method .............. 53
Conclusions ............................................................................. 53
III. ASSESSING PERCHLORATE EXPOSURE TO
MAMMALS IN THE FIELD ................................................................. 61
Introduction ................................................................................... 61 Materials and Methods.................................................................. 63
Study description and sample collection in TX......................... 63 Determination of perchlorate.................................................... 64
Results and Discussion................................................................. 66 Perchlorate in drinking water, blood plasma, and tissues of beef cattle in TX....................................................... 66 Perchlorate in contaminated water, blood plasma, and urine from cattle in Kansas ............................................... 67
Conclusions .................................................................................. 69
IV. PERCHLORATE DISTRIBUTION AND EXCRETION IN
LABORATORY ANIMALS .................................................................. 71
vii
Introduction ................................................................................... 71 Materials and Methods.................................................................. 73
Chemicals ................................................................................ 73 Animals .................................................................................... 74 Distribution experiment ............................................................ 74 Excretion experiment ............................................................... 75 Depuration experiment ............................................................ 76 Perchlorate determination method........................................... 76 Statistical analysis ................................................................... 79
Results and Discussion................................................................. 80 Perchlorate distribution in voles ............................................... 80 Perchlorate excretion pattern via urine in deer mice................ 82 Perchlorate depuration via urine in deer mice ......................... 86
Conclusions .................................................................................. 89
V. EFFECTS OF PERCHLORATE EXPOSURE ON
SODIUM-IODIDE SYMPORTER (NIS) AND PENDRIN
GENE EXPRESSION IN DEER MICE................................................ 97
Introduction ................................................................................... 97 Materials and Methods................................................................ 102
Animal exposure to perchlorate ............................................. 102 Partial deer mice NIS cDNA sequence development............. 103 Characterization of gene expression in deer mice with real-time PCR................................................................. 106 Statistical analysis ................................................................. 109
Results and Discussion............................................................... 109 Partial sequence of NIS gene ................................................ 109 NIS gene expression pattern in deer mice............................. 110 Effects of perchlorate exposure on NIS gene expression in deer mice......................................................... 113 Effects of perchlorate exposure on pendrin gene expression in deer mice......................................................... 115
Conclusions ................................................................................ 117
VI. PERCHLORATE EFFECTS ON FATTY ACID
PROFILES IN MILK.......................................................................... 126
Introduction ................................................................................. 126 Materials and Methods................................................................ 129
viii
Experimental design and samples collection ......................... 129 Fatty acid analysis in milk ...................................................... 130 Perchlorate determination in human milk............................... 131 Statistical analysis ................................................................. 132
Results and Discussion............................................................... 132 Fatty acids profile in goat milk dosed with perchlorate........... 132 Human milk survey ................................................................ 137
Conclusions ................................................................................ 139
VII. CONCLUSIONS AND FUTURE RESEARCH .................................. 147
Study Summary and Conclusions ............................................... 147 Future Studies............................................................................. 150
REFERENCES................................................................................................. 153
APPENDEX...................................................................................................... 171
ix
ABSTRACT
Perchlorate contamination in the U.S. appears to be more widespread
than originally thought. Perchlorate is naturally occurring, in addition to its
anthropogenic sources. Animals including humans have been exposed to
perchlorate through drinking water and/or trophic transfer; perchlorate has been
detected in dairy milk, some food items, human milk, and urine. Perchlorate
exposure and effects in mammals were characterized in the current study.
The ability to detect perchlorate in exposed animals is critical for effects
studies and risk assessments; perchlorate residues in biological fluids such as
plasma, urine, and milk can serve as biomarkers for perchlorate exposure. A
well-developed method for perchlorate determination in these matrices would
contribute greatly to perchlorate exposure assessment. In this study, analytical
methods for perchlorate determination in these matrices were explored.
Alumina-neutral cartridges combined with C18 cartridges and NAX combined
with alumina-neutral provided the best cleanup with significantly reduced
background signal of plasma and urine, respectively, and relatively high recovery
of perchlorate using conventional ion chromatography with suppressed
conductivity detection (IC-SCD). However, the cleanup method was not robust
enough to be used on some urine matrices such as deer mouse urine collected
in perchlorate excretion and elimination experiments. As an alternative to IC-
SCD, IC-MS/MS provides an excellent method with high selectivity and sensitivity
for part per trillion perchlorate determination in both aqueous and deer mice urine
matrices.
A study on perchlorate exposure and absorption in beef cattle showed that
constant exposure to 25 ng/mL perchlorate in water over 14 weeks did not result
in measurable residues in blood plasma or edible tissues of cattle at the first test
site (McLennan County, Texas). However, perchlorate was detected in 4 of 33
and 17 of 26 cattle at the two Kansas farms with the highest plasma perchlorate
x
concentrations of 43 and 32 ng/mL, respectively. Compared to perchlorate
residues in urine, perchlorate residues in plasma may not be a proper biomarker
for perchlorate exposure assessment.
A study on perchlorate distribution, excretion, and depuration in rodents
showed that urine was the major pathway for perchlorate fate in the body.
Higher levels of perchlorate exposure corresponded well to high levels of
perchlorate excreted in the urine. Perchlorate excretion via urine reached a
steady state after one day in the 28-day exposure experiment. An average of 46,
46, and 61 % of perchlorate was recovered in urine over the exposure period in
high, medium, and low dose groups, respectively. Metabolism of perchlorate
may occur in the body based in part on the 40% perchlorate unaccounted for in
this study. Endogenous perchlorate may also exist. Perchlorate exposure
through dosed drinking water for 28 days increased sodium-iodide symporter
(NIS) gene expression in the kidney and stomach, and pendrin gene expression
in the kidney, without significant difference. No significant difference was
observed neither between the low and high dose groups in the depuration
experiment regarding either gene expression in the kidney or stomach. No
significant linear relationship was found between perchlorate urinary excretion
and either gene expressions in the kidney.
A partial sequence of deer mice NIS gene cDNA with 425 bps was
discovered in the current study for the first time. Quantitative analysis of NIS
mRNA expression in various tissues was also studied for the first time in the
current study with expression levels from highest to lowest in deer mice tissues in
the following order: stomach, testes, brain, large intestine, and barely expression
in the lung, kidney, heart, and liver.
The effect of perchlorate exposure on the fatty acid profile in milk was
observed in lactating goats dosed with perchlorate from Monday to Friday each
week for 4.5 weeks. ω-6 fatty acids and total polyunsaturated fatty acids (PUFA)
at the 1 mg/kg treatment were significantly reduced at day 10 (p = 0.0113 and
xi
0.0053, respectively), day 17 (p < 0.001), and day 24 (p < 0.05), but not at day 2
and 31. Monounsaturated fatty acid (MUFA) was significantly reduced only at
day 17 (p = 0.0130). Significant reductions in short- and long-chain fatty acids
were observed at day 24 only (p = 0.0431 and 0.0097, respectively) in the high
and low dose groups, respectively. Additionally, a weak negative correlation
between milk perchlorate concentrations and total PUFA levels was found in
human breast milk samples collected from Lubbock, TX or nearby counties. To
our knowledge, this is the first report on the effect of perchlorate exposure on
fatty acid profiles in milk. Further study is urged to investigate mechanistic
aspects of the effect. This work will contribute to the human risk assessment of
perchlorate, particularly for the development of infants with maternal exposure to
perchlorate.
xii
LIST OF TABLES
2.1 Accuracy and precision of perchlorate determination in cow plasma using ion chromatography with suppressed conductivity detection .................................................................................................. 28
2.2 Recoveries of perchlorate in perchlorate-spiked cow urine
(100 ng/mL) cleaned using various solid phase extraction (SPE) Cartridges ................................................................................................ 29
2.3 Accuracy and precision for NAX combined with Al-N as cleanup
cartridges for perchlorate determination in different types of urine using ion chromatography............................................................... 31
2.4 Physical properties (pH and conductivity) of the different
sources of urine ....................................................................................... 31 2.5 Limit of detection and method detection limit for perchlorate
in standard solutions, sheep urine, dairy milk, and cow plasma analyzed by LC-ESI-MS........................................................................... 42
2.6 Accuracy and precision of perchlorate determination using
LC-ESI-MS in sheep urine, dairy milk, and cow plasma matrices............ 42 2.7 Precision of perchlorate determination in spiked Milli-Q water,
dairy milk, and cow plasma matrices using IC-SCD and LC-ESI-MS ...... 47 2.8 Method detection limit study for perchlorate using IC-MS/MS ................. 55 2.9 Accuracy and precision of the IC-MS/MS method ................................... 60 4.1 Changes in perchlorate recovery in different tissues of prairie
voles (Microtus ochrogaster) after 4- or 8-h exposure ............................. 91 5.1 Sequence of sense and antisense primers designed by
VectorNTI based on Mus musculus NIS mRNA for PCR amplification of deer mice NIS cDNA..................................................... 119
5.2 Sequence of sense primers, antisense primers, and
TaqMan probes designed for real-time PCR amplification of pendrin and NIS mRNA equivalents in deer mouse............................... 119
6.1 Results of two-way ANOVA test for fatty acid contents
xiii
in lactation goats dosed with perchlorate ............................................... 141
A.1 Perchlorate uptake and distribution in various studies........................... 172 A.2 Perchlorate excretion in various studies ................................................ 173
xiv
LIST OF FIGURES
2.1 Chromatograms of water contaminated with perchlorate and plasma spiked with 100 μg/L perchlorate using ion chromatography with suppressed conductivity detection (IC-SCD) .................................... 28
2.2 Ion chromatography analysis of cow urine samples (with
no perchlorate) after being processed via various cleanup procedures ................................................................................. 29
2.3 Efficiencies of four cleanup procedures (NAX combined with Al-N,
NAX with PSA, C18 with Al-N, and PSA with Al-N) for perchlorate determination in urine spiked with and without perchlorate...................... 30
2.4 Linearity of MS response to perchlorate in prepared standard
solutions and spiked biological matrices, including dairy milk, cow plasma, and sheep urine .................................................................. 41
2.5 Comparison of the analysis of dairy milk by IC-SCD and LC-ESI-MS ..... 43 2.6 Comparison of the determination of perchlorate in cow plasma
by IC-SCD and LC-ESI-MS...................................................................... 44 2.7 Comparison of the determination of perchlorate in sheep
urine by IC-SCD and LC-ESI-MS............................................................. 45 2.8 Calibration curves of perchlorate spiked into Milli-Q water and
milk matrices analyzed by IC-SCD and LC-ESI-MS ................................ 46 2.9 IC-MS/MS analysis of standard solution with 0.02 ng/mL perchlorate ..... 56 2.10 IC-MS/MS analysis of deer mice urine (diluted 500-fold) ......................... 57 2.11 Analysis of a standard solution and deer mice urine diluted
500-fold by ion chromatograph with suppressed conductivity detection (IC-SCD) .................................................................................. 58
2.12 Calibration curves for the two MRM transitions of perchlorate
in IC-MS/MS ............................................................................................ 59 3.1 The relationship between perchlorate exposure in drinking
water and perchlorate in heifer plasma.................................................... 70
xv
4.1 Perchlorate concentrations in tissues in prairie voles (Microtus ochrogaster) after 4- or 8-h exposure ...................................................... 91
4.2 Perchlorate excretion patterns in deer mice (Peromyscus
maniculatus) exposed to perchlorate through drinking water for 28 days ............................................................................................... 92
4.3 Perchlorate (% of total perchlorate intake through dosed drinking
water) excreted via urine over the 28-day exposure period ..................... 93 4.4 Perchlorate concentration in urine in the depuration experiment ............. 94 4.5 Exponential non-linear regression models for the depuration patterns .... 95 4.6 Comparison of perchlorate excretion and elimination patterns
over a 96-h exposure period in deer mice (Peromyscus maniculatus) .... 96 5.1 RNA integrity test on a 1% denaturing formaldehyde agarose gel......... 119 5.2 PCR product (more than 500 bp) from small intestine and
stomach mixture cDNA samples with primers shown in Table 5.1......... 120 5.3 Partial sequence of deer mouse NIS gene cDNA (425 bps) .................. 120 5.4 NIS gene expression pattern in various deer mice tissues .................... 121 5.5 Effect of perchlorate exposure through drinking water on
NIS gene expression in the stomach of deer mice................................. 122 5.6 Effect of perchlorate exposure through drinking water on
NIS gene expression in the kidney of deer mice.................................... 123
5.7 Effect of perchlorate exposure through drinking water on pendrin gene expression in the stomach of deer mice........................... 124
5.8 Effect of perchlorate exposure through drinking water on pendrin gene expression in the kidney of deer mice.............................. 125
6.1 Proposed relationship between perchlorate and fatty acid
composition in milk fat............................................................................ 140 6.2 The content of total polyunsaturated fatty acids (PUFA) in goat
milk during perchlorate exposure........................................................... 141
xvi
6.3 The content of ω-6 fatty acids in goat milk during perchlorate Exposure................................................................................................ 142
6.4 The content of mono-unsaturated fatty acids (MUFA) in goat
milk during perchlorate exposure........................................................... 142 6.5 The content of medium-chain fatty acids in goat milk during
perchlorate exposure ............................................................................. 143 6.6 The content of long-chain fatty acids in goat milk during
perchlorate exposure ............................................................................. 144 6.7 Changes in PUFA and ω-6 fatty acid content with time
in the three different dosing groups ....................................................... 145 6.8 Correlation between polyunsaturated fatty acid (PUFA) and
perchlorate concentrations in human breast milk from mothers in Lubbock; Texas or nearby counties ................................................... 146
6.8 Plot for docosahexaenoic acid (DHA; C22:6n3) as a function of
perchlorate concentration in human milk from Lubbock, Texas or nearby counties ................................................................................. 146
A.1 Linear relationships between gene expression (NIS and pendrin) at day 28 and perchlorate urinary excretion........................................... 174
xvii
CHAPTER I
GENERAL INTRODUCTION
1.1 Perchlorate Occurrence and Fate
Perchlorate (ClO4-) is a tetrahedral anion with four oxygen atoms oriented
around a central chlorine atom (VII) (Urbansky and Schock, 1999). It is
commonly associated with the solid salts of ammonium, potassium, and sodium.
Perchlorate salts are widely used as ingredients in pyrotechnics, matches,
blasting agents, automobile air bag inflators, nuclear reactors, lubricating oils,
textile dye fixing, electronic tubes, tanning and finishing leather, rubber
manufacturing, electroplating, aluminum refinishing, paint and enamel
production, and pharmaceuticals (Motzer, 2001). However, the majority of
manufactured perchlorate is used as a solid oxidizer for propellants in military
munitions items such as rockets and missiles (Urbansky, 1998; Motzer, 2001).
Large-scale production of perchlorate salts began in the mid-1940s and large
volumes have been disposed of in various states since the 1950s (Urbansky,
1998; Fisher et al., 2000; Motzer, 2001; Winkler et al., 2004).
In addition to anthropogenic sources of perchlorate, it may also naturally
occur. As early as 1958, perchlorate was detected in seawater (Bass Becking et
al., 1958). Four decades later, around 1% perchlorate was found in fertilizers
derived from the well-known naturally occurring Chilean caliche (Susarla et al.,
1999; Urbansky et al., 2001; Urbansky and Collette, 2001). Recently,
perchlorate was found in the Texas southern high plains aquifer system
(Dasgupta et al., 2005; Jackson et al., 2005a), where there is no historical record
or evidence of manufacturing or use of perchlorate salts or known sources of
fertilizers derived from Chilean caliche. Perchlorate was also reported to be
present in many rain and snow samples collected in Lubbock, TX, and Cocoa
Beach, FL with hurricane Frances (Dasgupta et al., 2005). In situ
electrochemical production of perchlorate within a public water distribution
1
system has also been documented (Jackson et al., 2004). It also has been
shown that perchlorate is readily formed by a variety of stimulated atmospheric
processes such as from chloride aerosol by electrical discharge and by exposing
aqueous chloride to high concentrations of ozone (Dasgupta et al., 2005).
Once released into the environment, perchlorate can persist for decades
in aquatic systems under normal conditions because it is extremely water soluble
and kinetically stable. Perchlorate contamination in water was discovered as
early as 1985 in wells located at California superfund sites; however, nationwide
contamination of perchlorate in water was not recognized until 1997 with the
development of new analytical methods. Today, perchlorate contamination in the
environment is widespread in the U.S. and has been found in water and/or soil
samples from over 35 states to date (EPA, 2005a)
In most aqueous systems perchlorate concentrations are low, but there
are also some highly contaminated sites across the U.S. In the Las Vegas,
Nevada area (near Henderson), perchlorate concentrations ranged from 630 to
3,700 µg/mL in contaminated groundwater (Motzer, 2001) with concentrations up
to 1,700 ng/mL in Lake Mead inlet surface water (EWG, 2001). At the Naval
Weapons Industrial Reserve Plant (NWIRP) in McGregor, Texas, perchlorate
was detected at concentrations ranging from 4 to 97,000 ng/mL in the
groundwater and 5,600 ng/mL in tributary surface water (Motzer, 2001). In
California, the maximum perchlorate level detected in contaminated drinking
water reached 820 ng/mL (EWG, 2003). It has been estimated that more than 11
million people could be exposed to perchlorate through public drinking water
supplies at concentrations of at least 4 ng/mL (NAS, 2005).
It has been well reported that perchlorate can be taken up and
accumulated by plants and edible vegetation (in both the laboratory and the
field), including salt cedar (Urbansky et al., 2000b); bulrush, crabgrass, cupgrass,
and goldenrod (Smith et al., 2001), tobacco plants (Ellington et al., 2001);
smartweed, watercress, ash, chinaberry, elm, willow, mulberry, and hackberry
2
(Tan et al., 2004); cucumber, lettuce, and soybean (Yu et al., 2004); soybean,
alfalfa, wheat, cucumber, cantaloupe, and tomato (Jackson et al., 2005b); lettuce
(Sanchez et al., 2005). Therefore, there are concerns regarding the potential
exposure of animals and humans to perchlorate through trophic transfer such as
ingestion of plants or food containing perchlorate in addition to drinking water.
Perchlorate has been detected in tissues of aquatic plants and animals in
the vicinity of contaminated sites. Aquatic organisms have been found to be at a
relatively high risk for perchlorate exposure. In streams and ponds near the
Longhorn Army Ammunition Plant (LHAAP) near Karnack, Texas, perchlorate
was detected in aquatic insects, fish, and frogs at concentrations ranging from
811 to 2038 µg/kg, below detection to 207 µg/kg, and below detection to 580
µg/kg, respectively (Smith et al., 2001). Smith et al. (2001) also reported
perchlorate concentrations ranging from below detection to 2328 µg/kg in small
mammals (e.g., rodents) collected from LHAAP. In addition, perchlorate
contamination has been found in supermarket milk samples, human breast milk,
and human urine (Kirk et al., 2003; Krynitsky et al., 2004; Kirk et al., 2005;
Valentin-Blasini et al., 2005), which indicates that perchlorate exposure and
environmental contamination in the U.S. are much more widespread than
originally thought.
1.2 Potential Health Effects of Perchlorate Exposure
Perchlorate has the same ionic charge and a similar ionic radius as iodide,
which allows perchlorate to competitively inhibit iodide uptake by the thyroid via
the sodium-iodide symporter (NIS) (Wolff, 1998; Motzer, 2001; Soldin et al.,
2001). The inhibitory effects of perchlorate on thyroidal uptake of iodide have
been reported in laboratory animals (Yu et al., 2002; Merrill et al., 2003; Merrill et
al., 2005) and humans (Lawrence et al., 2000; Greer et al., 2002; Clewell et al.,
2004). Perchlorate is also known to reduce the transfer of radioiodine from
plasma to milk (Cline et al., 1969; Djurdjevic and Lengemann, 1970), and
3
recently, perchlorate concentrations in milk above 10 ng/mL were reported to be
associated with low iodine content in human milk samples (Kirk et al., 2005). In
addition, perchlorate can reduce the deposition of iodine in the chicken egg
(Peña et al., 1976). Less iodine in milk and/or egg may eventually cause iodide
deficiency in the thyroid, especially for infants using milk as the only food source.
As an essential element for thyroid hormone production, iodide deficiency in
the thyroid caused by perchlorate exposure may eventually result in disruption of
normal thyroid function: reduced production of thyroid hormones, triiodothyronine
(T3) and thyroxine (T4), and increased production of thyroid stimulating hormone
(TSH) via a negative feedback mechanism triggered by the hypothalamus-
pituitary-thyroid axis. Based on this rationale, perchlorate was once clinically
used to treat Grave’s disease (hyperthyroidism) (Wolff, 1998; Soldin et al., 2001).
However, perchlorate is no longer used therapeutically in the U.S. because of its
potential adverse effects and toxicity (Wolff, 1998).
Many studies have shown the effects of perchlorate exposure on thyroid
functions. Following perchlorate exposure, increased levels of thyroid stimulating
hormone and/or decreased levels of thyroid hormones were reported in rats
(Siglin et al., 2000; Yu et al., 2002), deer mice (Thuett et al., 2002), quail chicks
(McNabb et al., 2004), fish (Bradford et al., 2005; Crane et al., 2005), and
humans (Lamm et al., 1999; Brechner et al., 2000; Lawrence et al., 2000; Greer
et al., 2002; Braverman et al., 2005). Alteration of thyroid gland morphology,
such as thyroid follicle hypertrophy, colloid depletion, and angiogenesis, was also
assessed in many studies and was reported as a biomarker for perchlorate
exposure and effect in animals (Thuett et al., 2002; Patino et al., 2003; York et
al., 2003; Bradford et al., 2005; Gentles et al., 2005; Mukhi et al., 2005). On the
other hand, the absence of an effect of perchlorate exposure on thyroid
hormones was also observed in some epidemiology (Crump et al., 2000; Li et al.,
2000a; Li et al., 2000b) and occupational (Gibbs et al., 1998; Lamm and
Doemland, 1999) studies.
4
Thyroid hormones are essential for many physiological processes,
including development, growth, and metabolism. Therefore, concerns about
potential effects of perchlorate exposure include carcinogenic, developmental,
neurodevelopmental, reproductive, and immunotoxic effects. In some studies,
perchlorate exposure did produce adverse effects during critical periods of
development, such as alteration of gonadal differentiation during amphibian
metamorphosis (Goleman et al., 2002a); precocious metamorphosis (Manzon
and Youson, 1997); delay in metamorphosis (Goleman et al., 2002b; Tietge et
al., 2005); and developmental retardation in the early life stages of fish (Crane et
al., 2005). Developmental toxicity of perchlorate was also investigated in rabbits
(York et al., 2001a) and rats (York et al., 2003) with no observable adverse
developmental effect at the test concentrations. The developmental no-
observable-adverse-effect-level (NOAEL) was set at 100 mg/kg-day for rabbits,
which was the highest dose tested in the study; the NOAEL was 1.0 mg/kg-day in
the rat study with developmental delays in ossification occurred in the 30.0
mg/kg-day group.
Neurodevelopmental effects are also a consideration for perchlorate
exposure because normal production of thyroid hormones is integrally involved in
the development of brain, central nervous system, and neurobehavioral
capacities (Bekkedal et al., 2004). Neurodevelopmental toxicity of perchlorate
exposure was evaluated in rats with no behavioral effects in the offspring
exposed as high as 10.0 mg/kg-day (the highest dose) as evaluated by passive
avoidance, swimming watermaze, motor activity, and auditory startle, but with
effects on thyroid hormone (T3, T4, and TSH) levels and thyroid morphometric
and histopathology (York et al., 2004). Pediatric neurobehavioral diseases (i.e.,
attention deficit-hyperactivity disorder (ADHD) and autism) and school
performance were also evaluated in an ecological study (Chang et al., 2003), but
no evidence was found that children from an area with perchlorate in drinking
5
water (up to 24 ng/mL) had either an increase in pediatric neurobehavioral
diseases or a decrease in school performance.
The reproductive toxicity of perchlorate has also been assessed.
Perchlorate exposure during a critical period of development was found to disrupt
ovarian follicle maturation and reduce the number of preantral and antral follicles
in certain size classes of rats (Baldridge et al., 2004). Perchlorate did show
adverse effects on cocoon production and hatch in earthworm (Landrum et al.,
2005). Perchlorate was also found to accumulate in quail eggs (Gentles et al.,
2005). In fish, 18 µg/mL perchlorate, which is a high environmentally relevant
concentration, affected the histological condition of adult zebrafish thyroid
follicles but not their reproductive performance, although 677 µg/mL perchlorate
reduced spawn volume within one week and the effect became negligible after
four weeks (Patino et al., 2003). On the other hand, perchlorate was suggested
as not a reproductive toxicant in rats with doses up to 30 mg/kg-day through
drinking water (York et al., 2001b).
There is concern about the potential human health effects of low-level
perchlorate exposure in drinking water (Siglin et al., 2000). The U.S. EPA
originally asked for a regulatory level of 1 ng/mL in drinking water for perchlorate
in 2002 and several states set an advisory level of perchlorate in drinking water
ranging from 1 to 51 ng/mL (EPA, 2002; EPA, 2005b). In contrast, a much less
conservative reference dose equivalent to 200 ng/mL was proposed by the
Perchlorate Study Group, which is composed of perchlorate producers and
industrial consumers (Dahl 2004). Since then, debate on what level of
perchlorate in drinking water is safe has been ongoing (Dahl, 2004; Stokstad,
2005). No National Drinking Water Standard is set for perchlorate currently, but
the National Research Council of the National Academies (NRC) issued a
reference dose for chronic oral exposure (oral RfD) of 0.7 μg/kg/day (NAS, 2005)
in January 2005 and EPA set this as its safe dose for perchlorate. The safe dose
corresponds to 24.5 ng/mL perchlorate in drinking water for a 70-kg adult
6
consuming 2 L of water every day. This value is 23 times higher than EPA’s draft
reference dose, but 7 times lower than that recommended by the Perchlorate
Study Group.
1.3 Study Objectives, Background, and Hypotheses
The first objective of this study is to develop analytical methods for
perchlorate determination in biological matrices. Even though new more
sensitive analytical methods have recently been developed for perchlorate
determination (Tian et al., 2003; Krynitsky et al., 2004; Winkler et al., 2004; Li
and George, 2005; Martinelango et al., 2005; Valentin-Blasini et al., 2005),
perchlorate determination in complex biological matrices using traditional ion
chromatography (IC) is still a challenge. The unique characteristics of the
perchlorate anion and complexity of the matrices results in high background and
interference problems during routine IC analysis. However, the ability to detect
perchlorate in exposed animals or humans is critical for effects studies and risk
assessments. Perchlorate residues in biological fluids such as plasma, urine,
and milk can serve as biomarkers for perchlorate exposure, and therefore, a well-
developed method for perchlorate determination in these matrices would
contribute greatly to perchlorate exposure assessment. In this study, analytical
methods for perchlorate determination in these matrices were explored.
The second objective was to assess perchlorate exposure in mammals in
both the laboratory and the field using developed analytical methods for
perchlorate determination. There is evidence for perchlorate exposure and effect
on plants, animals (both aquatic and terrestrial), and humans in contaminated
sites as mentioned above, however to our knowledge, there is little data on
perchlorate exposure to large mammals (such as dairy and beef cattle). Large
mammals could potentially ingest perchlorate through both contaminated drinking
water and forage crops and thus present a potential pathway of perchlorate
exposure to humans. There is increasing concern regarding potential
7
perchlorate exposure and effects on animals and humans through trophic
transfer especially since perchlorate has been detected in dairy milk, human
breast milk, and some food items (Erickson, 2003; Kirk et al., 2003; Krynitsky et
al., 2004; Capuco et al., 2005; Kirk et al., 2005). Therefore, perchlorate
exposure to large mammals from contaminated sites was assessed.
Perchlorate exposure in laboratory animals was assessed through
investigating perchlorate distribution and excretion in prairie vole (Microtus
ochrogaster) and deer mice (Peromyscus maniculatus), respectively. Several
studies on the uptake, distribution, and excretion of perchlorate in animals
including humans showed that most perchlorate was not metabolized in the body
and excreted primarily in urine (Anbar et al., 1959; Goldman and Stanbury, 1973;
Peña et al., 1976; Batjoens et al., 1993; Yu et al., 2002). Although the highest
perchlorate concentrations were reported in the thyroid in many studies, the
perchlorate distribution pattern in other tissues was not consistent. To a large
degree, adverse effects of perchlorate exposure on animals and humans depend
on its uptake, distribution, and excretion in the body. Whether perchlorate
accumulates or not, how perchlorate distributes among tissues, and what are the
excretion and depuration patterns via urine are fundamental questions. That will
help determine whether perchlorate exposure causes adverse human health
effects or ecological impacts. Therefore, a tissue distribution study of perchlorate
in prairie vole (Microtus ochrogaster) and perchlorate excretion and depuration
studies in deer mice (Peromyscus maniculatus) were conducted. The
hypotheses we tested included (1) urine is the major pathway through which
perchlorate is excreted; (2) perchlorate excretion via urine is dose-dependent:
high levels of perchlorate exposure correspond to high levels of perchlorate
urinary excreted; (3) perchlorate is depurated rapidly via urine after removal of
perchlorate exposure. Developed methods were used to determine perchlorate
residues in tissues and urine.
8
The third objective of this study was to characterize perchlorate effects in
mammals. The effect of perchlorate exposure was investigated in terms of
transporter gene expression. The sodium-iodide symporter (NIS) is well
documented as a basolaternal membrane transporter for iodide in many organs
including human kidney. Since perchlorate has a similar size and same charge
as iodide, NIS may play an important role in perchlorate uptake in the thyroid; it is
also a potential transporter for perchlorate influx and efflux in other organs such
as the kidney. Pendrin has been reported as a transporter of several ions in the
thyroid, kidney, and lung. Perchlorate exposure in deer mice was associated
with changes in pendrin gene expression in the kidney and lung (Ramachandran,
2005). The relationship between the perchlorate excretion pattern via urine and
the level of these transporters in the kidney can provide a potential perchlorate
excretion mechanism and a potential adaptation mechanism at the molecular
level. Therefore, the relationship between pendrin and NIS gene expression in
the kidney and perchlorate excretion pattern via urine was explored. It was
hypothesized that the level of the transporter gene(s) would increase upon
perchlorate exposure, and in turn, perchlorate excretion via urine would increase.
The second effect was the correlation between perchlorate exposure and
milk fatty acid profile. Based on preliminary data that showed a weak negative
correlation between perchlorate concentrations and total polyunsaturated fatty
acids (PUFA) in 39 human breast milk samples collected from Lubbock, TX and
nearby counties (unpublished data), a theoretically supported relationship was
proposed: disruption of thyroid hormone production by perchlorate exposure
ultimately could alter the fatty acid profile in milk. Therefore, we investigated the
effects of perchlorate exposure on the milk fatty acid profile in lactating goats that
were dosed with perchlorate for 4.5 weeks. We hypothesized that perchlorate
exposure would change the fatty acid profile in the goat milk. Fatty acids,
particularly PUFA, are important functional components in milk; therefore, effects
on fatty acids may alter their health benefits to offspring. Thus, this work will
9
contribute to the environmental and human health risk assessment of
perchlorate, particularly for normal development of offspring with maternal
exposure to perchlorate.
1.4 Dissertation Format and Contents
This dissertation is composed of seven chapters. Each chapter is about a
sub-study and can be an individual manuscript for publication, except Chapter I,
which is a general introduction for perchlorate and the background of this study,
and Chapter VII, which is a general conclusion for this study. Each chapter, from
Chapter II to VI, includes introduction, methods and materials, results and
discussion, and conclusions sections.
Chapter I includes a general review for perchlorate occurrence and fate in
the environment, and its potential toxicity (potential health effect) of exposure,
which gives readers a general idea on what perchlorate is and why it is important
to do research on this chemical. It also briefly introduces the background,
objectives, and hypotheses of the sub-studies.
Chapter II is about analysis methodology development for perchlorate
determination. It includes a review of perchlorate analysis methods
(introduction), and three sub-chapters, each contain methods and materials,
results and discussion, and conclusions sections. The first sub-chapter is about
the cleanup methods developed for perchlorate determination in plasma and
urine matrices, which has been published in Talanta (Cheng, Q. F. Liu, J. E.
Cañas, and T. A. Anderson. 2006, A cleanup method for perchlorate
determination in urine. 68:1457-1462); the second is about a LC-ESI-MS method
developed for perchlorate determination in biological fluids (plasma, urine, and
milk); and the third is about an IC-MS/MS method for perchlorate determination
in urine.
Chapter III is about a study on perchlorate exposure and absorption in
mammals, beef cattle specifically. It has been published in Journal of Agricultural
10
and Food Chemistry (Q. Cheng, L. Perlmutter, P. N. Smith, S. T. McMurry, W. A.
Jackson, and T. A. Anderson. 2004. A Study on Perchlorate Exposure and
Absorption in Beef Cattle. 52, 3456-3461)
Chapter IV is about a study designed to elucidate perchlorate distribution,
excretion via urine, and depuration pattern in small rodents. It includes three
experiments: perchlorate distribution in prairie vole (Microtus ochrogaster),
excretion, and depuration in deer mice (Peromyscus maniculatus).
Chapter V is about the effect of perchlorate exposure on gene expression
in deer mice. The genes were focused on two transporters: sodium-iodide
symporter (NIS) and pendrin. The relationships between perchlorate exposure
and/or excretion patterns and the level of these gene expressions in the kidney
and stomach are discussed.
Chapter VI is about the effect of perchlorate exposure on fatty acid profiles
in goat milk. That perchlorate may alter fatty acid profiles in milk was
hypothesized and the alternation was observed in the lactating goats which were
dosed with perchlorate for 4.5 weeks.
Chapter VII is a general conclusion for this dissertation (this study).
Results and concerns from characterizing perchlorate exposure and effects in
mammals in the current study are summarized briefly.
11
CHAPTER II
PERCHLORATE DETERMINATION IN PLASMA, URINE, AND MILK
- METHOD DEVELOPMENT
2.1 Introduction
Many methods have been historically used to determine perchlorate
including gravimetry, spectrophotometry, electrochemistry (ion selectivity
electrodes (ISEs) and membrane field transistors (MEMFETs)), capillary
electrophoresis, and ion pair high performance liquid chromatography (HPLC)
(Urbansky, 1998; Urbansky, 2000; Motzer, 2001; Urbansky, 2002). However,
there are problems with these methods such as interferences from phosphate,
nitrate, chlorate, and other anions, low sensitivity, and high detection limits. An
extraction-spectrophotometric method was recently developed for the
determination of trace amounts of perchlorate based on an ion pair with thionine;
the reported detection limit (23 ng/mL) was still higher than other reported
detection limits (Pourreza and Mousavi, 2005).
Ion chromatography (IC) is currently the recommended method by the
U.S. EPA for routine determination of perchlorate (Hautman et al., 1999). It is a
sensitive and reliable technique, especially for drinking water, surface water, and
groundwater analysis for perchlorate. Dionex Corporation was a pioneer in the
development of methods for trace perchlorate determination in ground and
drinking water by IC (Hautman et al., 1999; Jackson et al., 1999; Jackson et al.,
2000a; Jackson et al., 2000b; Jackson and Chassaniol, 2002), and has marketed
a commercial IC instrument. With the improved method developed by Jackson et
al. (2000b), the detection limit for perchlorate in drinking water can be as low as
0.15 ng/mL. Perchlorate determination was performed on a DX-500 IC System
(Dionex Corporation) consisting of a GP 50 gradient pump, EG 40 eluent
generator, AS 40 automated sampler, LC 30 chromatography compartment, and
CD 20 conductivity detector. Dionex IonPac AS16 analytical column and IonPac
12
AG 16 guard column were used to separate the analytes. Anions were detected
by suppressed conductivity. It is these components that are the basis for EPA
Method 314.0 (Hautman et al., 1999).
Perchlorate determination by IC is greatly hindered when samples contain
high total dissolved solids (TDS), such as high salinity water, fertilizer, plant, and
animal matrices. Conductivity detection responds to any ion with sufficient
conductivity and therefore lacks specificity for perchlorate. Quantitative
determination of perchlorate in biological fluids (e.g. milk, urine, and plasma) is
often problematic with ion chromatography using suppressed conductivity
detection (IC-SCD) because biological fluids usually contain additional ions,
proteins, lipids, sugars, and other biomolecules that may confound accurate
determination of perchlorate. Without effective sample preparation and cleanup
methods, which are typically costly, time consuming, and labor intensive,
problems such as high background conductivity and interferences in biological
fluids are always encountered using IC-SCD. The higher background and
interferences may lead to a higher likelihood of both false positives and false
negatives. Therefore, the sensitivity, precision, and accuracy of IC-SCD are not
satisfactory in these complicated matrices. The desire to eliminate TDS has led
to development of a preconcentration method for perchlorate prior to IC analysis
(Tian et al., 2003; Tian et al., 2005; Cañas et al., 2006). With an online
preconcentration/preelution technique based on IC, perchlorate is concentrated
on a preconcentration column, undesirable matrix is preeluted with a low
concentration eluent and then perchlorate is injected into the IC separation and
detection system. This method has proved to be effective in detecting trace
perchlorate in milk with a LOD of 0.5 ng/mL (Kirk et al., 2003). The method was
also used to determine perchlorate in complex matrices such synthetic high ionic
strength solutions, bird egg extracts, hydroponic nitrate fertilizer samples, animal
tissues, and lettuce (Tian et al., 2005; Cañas et al., 2006). This method was
highly effective in removing most of the matrix anions and was resistant to the
13
interferences commonly encountered in a high ionic strength background (Tian et
al., 2005). An evaporative preconcentration technique has also been reported to
determine trace perchlorate in drinking water using ion chromatography with a
detection limit of 0.2 ng/mL (Liu et al., 2002).
There are other options to eliminate TDS and some interferences in
samples, for example, improvement of the sample preparation method before
instrumental analysis. It was reported that exposure of plant tissue extracts to
alumina could significantly reduce the high background conductivity during IC
analysis (Ellington and Evans, 2000). The minimum reporting level of
perchlorate in lettuce and tomato was found to be about 250 ng/mL (based on
wet weight) with this preparation method. Anderson and Wu (2002) also
evaluated cleanup methods for perchlorate determination in animal tissues.
Cleanup of animal tissue extracts using polar sorbents (Al and Si), an ion
exchange sorbent (SCX), or an ion exchange membrane (Nafion®) reduced the
background conductivity in IC and led to high perchlorate recovery (≥ 85%). In
addition, granular barium chloride, Dionex OnGuard cartridges (silver, barium,
and hydrogen), and pH adjustment with HCl were used as cleanup methods for
environmental water samples to remove sulfate, chloride, and carbonate ions
which usually contribute to high total conductivity and interferences for
perchlorate determination using ion chromatography or mass spectrometry
(Winkler et al., 2004; Medina et al., 2005).
Confirmatory testing is another primary way to minimize the interferences
and provide unambiguous results for perchlorate determination, especially in
complicated sample matrices, such as biological fluids. Confirmation with
Raman spectroscopy has been used for qualitative identification of perchlorate in
fertilizers and plant tissues (Williams et al., 2001). Infrared spectroscopy using
an attenuated total reflectance crystal (ATR-FTIR) was also used for perchlorate
identification in fertilizers (Collette et al., 2003). However, mass spectrometry
(MS) is a major technique that has been recently reported for perchlorate
14
determination in a variety of matrices. MS has become an alternative to IC-SCD
and is a preferred technique in accurate qualitative and quantitative
determination of perchlorate.
Methods based on coupling ion chromatography with electrospray
ionization mass spectrometry (IC-ESI-MS) have been used to determine
perchlorate in milk (Kirk et al., 2003; Kirk et al., 2005), and extracts of whole fish
(Dodds et al., 2004). LC/IC-ESI-MS/MS also has been applied for perchlorate
determination in water, groundwater, soil, milk, some food items, and human
urine (Koester et al., 2000; Krynitsky et al., 2004; Winkler et al., 2004; Li and
George, 2005; Snyder et al., 2005; Valentin-Blasini et al., 2005). Without the
assistance of chromatography, ESI-MS itself can also be used for perchlorate
confirmation. Following ion-pair extraction, quantitative determination of
perchlorate in water samples and commercial fertilizers using flow injection ESI-
MS has been reported (Urbansky et al., 1999; Magnuson et al., 2000b;
Magnuson et al., 2000a; Urbansky et al., 2000a; Collette et al., 2003). ESI-
FAIMS (high-field asymmetric waveform ion mobility) -MS with flow injection was
also used for perchlorate determination in water and human urine (Ells et al.,
2000; Handy et al., 2000).
To enhance the sensitivity and selectivity for measuring perchlorate by
MS, some specialized techniques involving improved sample preparation and/or
instrumentation have been reported. For instance, an online pre-concentration
and pre-elution (PC-PE) technique, reported by (Tian et al., 2003), has been
applied to the analysis of milk by IC-MS (Kirk et al., 2003; Kirk et al., 2005). Gas
phase ion association with a long chain dipositive cationic agent was applied in
IC-ESI-MS to increase selectivity and sensitivity of the perchlorate measurement
(Martinelango et al., 2005). An isotopically labeled internal standard has also
been used to correct ionization suppression (Krynitsky et al., 2004; Li and
George, 2005; Valentin-Blasini et al., 2005).
15
Due to the widespread occurrence of perchlorate contamination in the
environment and the potential hazards of perchlorate exposure and effect in
animals and humans, perchlorate contamination monitoring is important and
critical for environmental and human risk assessment. Perchlorate residues in
biological fluids such as urine, milk, and plasma can serve as non-lethal
biomarkers for monitoring environmental contamination of perchlorate, especially
since the anion is excreted via urine and milk in animals and humans (Anbar et
al., 1959; Goldman and Stanbury, 1973; Peña et al., 1976; Batjoens et al., 1993;
Greer et al., 2002; Yu et al., 2002; Kirk et al., 2003; Capuco et al., 2005; Kirk,
2005; Kirk et al., 2005; Valentin-Blasini et al., 2005), and blood delivers
perchlorate to the target tissues. Therefore, it is desirable to monitor perchlorate
residues in these biological fluids and thus, assess its risk to the environment,
animals, and humans.
In some instances, it may be more preferable to develop a good
preparation method prior to conventional IC analysis because of the high cost to
setup a MS system and maintain its normal performance. However, information
on preparation methods, especially cleanup methods, is limited. Since the ability
to detect perchlorate in exposed animals or humans is critical to effects studies
and risk assessments, a well-developed preparation method would contribute
greatly to the more accurate detection of trace perchlorate using conventional IC.
Cleanup methods were developed for blood plasma and urine in order to
eliminate interferences for perchlorate determination using ion chromatography.
Perchlorate determination in complex matrices, including urine, milk, and plasma,
using an LC-ESI-MS system was also explored. The characteristics and
efficiency of IC-SCD and LC-ESI-MS for the determination of perchlorate in these
types of samples were also compared. An IC-MS/MS method was also explored
and applied to urine analysis for perchlorate.
16
2.2 Cleanup Methods for Perchlorate Determination in Plasma and Urine†
† Part of this work has been published in the journal of Talanta (Q. Cheng, F. Liu, J.E. Cañas,
T.A. Anderson, Talanta. 2006 68:1457-1462).
2.2.1 Materials and Methods
Chemicals
A custom perchlorate (ClO4-) standard solution was obtained from
AccuStandard, Inc. (New Haven, CT). Sodium hydroxide (50%, w/w) aqueous
solution and ethanol (pesticide grade) were purchased from Fisher Scientific
(Fair Lawn, NJ). Acetonitrile (HPLC grade) was from EMD (Gibbstown, NJ). All
solutions were prepared in 18.2 MΩ Milli-Q water.
Sample source and treatment
Plasma was collected from heifer calves inhabiting a reference site near
McGregor, McLennan County, Texas during spring 2003. The reference site was
a pasture that was a sufficient distance from a perchlorate manufacture and
usage facility such that perchlorate was not present in available on-site surface
or groundwater utilized by the cattle, nor was it present in vegetation. Plasma
samples were processed using methods similar to those previously described
(Fisher et al., 2000; Anderson and Wu, 2002; Narayanan et al., 2003). First, 1
mL of plasma was precipitated with 4 mL of ethanol (ice-cold) and then
centrifuged (4 °C) at 3750 rpm for 5 min. The supernatant was removed,
evaporated to dryness under nitrogen, and reconstituted in 5 mL Milli-Q water.
Samples were then cleaned using alumina and C18 solid phase extraction (SPE)
cartridges, and filtered (0.45 μm) prior to ion chromatography (IC) analysis.
Perchlorate standard was spiked into the plasma samples at final concentrations
of 2.5, 5, 10, 50, and 100 ng/mL to determine the recovery and precision of the
cleanup method.
Urine samples used in the current study were from prairie voles, cattle,
and humans (female). Cow urine was provided by the Department of Animal and
17
Food Science, Texas Tech University (Lubbock, TX). Vole urine was obtained
from a breeding colony housed at Texas Tech University. Human urine was
obtained from volunteers in Lubbock, TX. Perchlorate was not detected in the
cattle and human urine. However, trace perchlorate was detected in vole urine.
In order to determine the efficiency of different cleanup methods for urine,
a perchlorate standard solution was spiked into cattle urine at a final
concentration of 100 µg/L. The samples were analyzed for perchlorate using ion
chromatography after preparation by different cleanup methods, and the
efficiency and recovery of perchlorate in the samples was determined. Based on
these preliminary results, the most efficient method was chosen for further
evaluation of its applicability to different urine sources (vole and human) with
spiked perchlorate (2.5, 10, and 100 µg/L). In addition, urine samples collected
from cows inhabiting a perchlorate-contaminated site were used to evaluate the
applicability of the cleanup method for field samples.
Sample preparation procedure for urine cleanup
Solid phase extraction (SPE) cartridges were used in the cleanup process
of urine for ion chromatography analysis. Ten types of SPE cartridges were
evaluated, individually or in combination, to determine cleanup efficiency. The
SPE cartridges tested included quaternary amine (CUQAX 100 mg), quaternary
amine with hydroxide (CHQAX 100 mg), quaternary amine-acetate (CAQAX 100
mg), strong anion exchange (Strata SAX 100 mg), N-2 aminoethyl (PSA 500 mg)
combined with alumina-neutral (Al-N 1 g), octadecyl (C18 1 g) combined with
PSA (500 mg), hydrophobic and aminopropyl (NAX 1 g), NAX combined with Al-
N, NAX combined with PSA, and C18 combined with Al-N. CUQAX, CHQAX,
CAQAX, PSA, and NAX were obtained from United Chemical Technologies, Inc.
(Bristol, PA). Strata SAX was purchased from Phenomenex (Torrance, CA).
C18 cartridges were purchased from Honeywell B&J (Muskegon, MI), and Al-N
was purchased from J.T. Baker (Phillipsburg, NJ).
18
Depending on the sorbent, SPE cartridges were conditioned as
appropriate prior to use. For CUQAX, CHQAX, and CAQAX, 0.4 mL of urine was
loaded, 1 mL Milli-Q water (>18MΩ) was used to elute the sample through the
cartridge, and the eluate was diluted to a final volume of 2 mL with Milli-Q water.
For SAX, 0.5 mL of urine was loaded, then 2.5 mL NaOH (20 mM in 15%
acetonitrile solution) was added to elute the sample through the cartridge
following consecutive washing with 1 mL Milli-Q water and 1.5 mL NaOH (20 mM
in 15% acetonitrile solution). For NAX, following the loading of 0.8 mL urine and
washing with 0.6 mL DI water, 4 mL Milli-Q water was used to elute the cartridge.
For the combination cartridges with NAX and Al-N or NAX and PSA, the 4 mL
Milli-Q water eluted from NAX was further processed through Al-N or PSA. In the
case of C18 in combination with PSA or Al-N, 0.8 mL urine was loaded onto the
cartridge, followed by 4 mL Milli-Q water to elute the cartridge. The eluate then
was loaded and eluted through PSA or Al-N cartridges. In the case of PSA
combined with Al-N, 0.8 mL urine was first diluted to 4 mL with Milli-Q water and
then eluted through the PSA cartridge, followed by an Al-N cartridge. All final
eluates were filtered (0.45 µm) and analyzed by ion chromatography without
further dilution.
Sample analysis
A method similar to EPA Method 314.0 (Hautman et al., 1999) was
followed to determine perchlorate in all samples. The analysis was performed on
a Dionex DX-500 Ion Chromatography System equipped with a GP50 gradient
pump, a CD20 conductivity detector, and an AS40 automated sampler (Dionex
Corp.). PeakNet® chromatography software was used to control the system. Ion
separation was conducted with a Dionex IonPac AS16 (250 mm x 4.0 mm i.d.)
analytical column after a Dionex guard column (AG16). Conditions for the
system were as follows: flow rate = 1.0 mL/min; eluent = 50 mM sodium
hydroxide; injection volume = 1000 µL. Ion detection was by suppressed
19
conductivity in the external water mode. Computer-generated peak areas were
used to measure sample concentrations in an external standard mode.
2.2.2 Results and Discussion
Recovery and precision of alumina-neutral plus C18 as a cleanup method for
plasma
Several different sorbent materials and solid phase extraction (SPE)
cartridges were tested as cleanup methods before IC analysis. An alumina-
neutral (Al-N) cartridge combined with a C18 cartridge provided the best cleanup
for plasma in terms of reduced background conductivity and interference (Figure
2.1). Table 2.1 shows perchlorate recoveries of samples spiked with 2.5 to 100
μg/L. The total average recovery was 84% ± 2.3 (mean ± SD). In addition, the
detection limit for perchlorate in blood plasma (ratio of signal and noise (S/N) = 3)
was estimated as 2.74 μg/L after 5X dilution.
Efficiency of various cleanup procedures for urine
Among the tested SPE cartridges as individuals or in combination, NAX
and its combination with other cartridges reduced the background conductivity
and interference dramatically (Figure 2.2). For a 5X-diluted urine sample,
cleanup by NAX in combination with PSA or Al-N cartridges resulted in very low
background conductivity and much less interference compared with other
cleanup procedures. As illustrated in Figure 2.2, cleanup with NAX combined
with Al-N gave the best result in terms of reducing interference and background
signal. Furthermore, cleanup by NAX, NAX plus PSA, and NAX plus Al-N
cartridges showed much higher perchlorate recoveries among all tested cleanup
procedures (Table 2.2). The sorbent in NAX cartridges is composed of a silica
backbone with an anion exchanger (aminopropyl) and a hydrophobic carbon
chain (C8). When a urine sample, which contains abundant positively charged
ions, is applied to the NAX cartridge, the positively charged ions are not retained
20
by the anion exchanger (the amine groups) and are eluted, whereas the
negatively charged ions can interact with the amine groups. Hydrophobic
molecules in the urine, such as organic-based compounds (i.e., carbohydrates,
proteins, etc.), bind to the C8 phase. Therefore, the negatively charged and
hydrophobic compounds can be held in the cartridge after application of urine.
Because amine groups are weak anion exchangers, perchlorate anions do not
strongly interact with them. Thus, perchlorate anions can be eluted by water
following the application of urine while hydrophobic compounds and other
stronger anions are left in the cartridge through interaction with C8 and amine
groups, respectively. However, cleanup with the NAX cartridge alone gave a
relatively high background signal due to the high total conductivity. The
combination of NAX with PSA and particularly with Al-N showed significant
improvement (Figure 2.2). Work in our lab has shown that Al-N was effective in
reducing background and interference in a variety of other matrices (unpublished
data). Here, we also found this type of cartridge works efficiently for urine
cleanup as well when combined with NAX. Although the combination of C18 and
PSA has a similar functional composition as NAX, this combination did not show
similar results as NAX in terms of background signal and perchlorate recovery:
two functional groups in one cartridge work more effectively to reduce
background and maintain high recovery than the combination of the two
functional groups in two separate cartridges.
CAQAX, CHQAX, CUQAX (i.e., QAXs), and SAX cartridges contain
quaternary amine anion exchangers. In the current study, the way we used them
as cleanup cartridges for perchlorate analysis is based on a preelution principle:
loading the sample on the cartridge, washing the cartridge with water or other
solution, and then eluting perchlorate from the cartridge with a proper solution.
These cartridges were not as effective as either NAX alone or in combination
with Al-N or PSA in reducing background signal and interferences (Figure 2.2).
In addition, they gave poor perchlorate recovery (Table 2.2). The QAX-type
21
cartridges do not bind perchlorate strongly, and thus perchlorate may be eluted
by the washing solution. Therefore, we skipped the washing step, and directly
eluted perchlorate with water without washing after loading the sample on the
cartridges. However, co-eluting ions in the eluate and high background signal
interfered with perchlorate determination by ion chromatography. Compared to
QAX, SAX is a much stronger anion exchanger. However, the anion exchange
capacity appears to vary depending on the vendor. In the current study, we
found that perchlorate can be eluted from SAX cartridges from Phenomenex
(Torrance, CA), but not from another provider/brand by using 20 mM (or higher)
NaOH as an eluent. Because of the relatively small mass of the sorbent bed in
the cartridge (100 mg), it was not easy to separate perchlorate from other
interferences. As a result, high background conductivity and interferences were
observed. It was difficult to elute perchlorate if larger SAX cartridges with more
sorbent bed were used. Furthermore, perchlorate recovery was low when using
SAX cartridges. SAX is a strong anion exchanger, which holds perchlorate
tightly, causing difficulty in eluting perchlorate using water. Even with 20 mM or
higher NaOH (a stronger eluent than water), perchlorate could not be eluted with
a limited amount of eluent, and therefore, low recovery of perchlorate was
observed. In addition, poor reproducibility was observed using this cleanup
method. This may be caused by inconsistent elution rates. Therefore,
controlling the flow rate of eluent at a constant value would probably improve the
reproducibility of the SAX cartridge in cleanup of urine.
The combinations of C18 with Al-N and PSA with Al-N produced high
perchlorate recoveries similar to NAX in combination with PSA or Al-N (Table
2.2), but they were less effective in reducing background conductivity and
interferences. Cleanup efficiency for these four types of cleanup procedures for
both blank and spiked urine are presented in Figure 2.3. For the combination of
either C18 with Al-N or PSA with Al-N, the perchlorate peak (peak A in Figure
2.3a) was very close to an interference peak (peak B in Figure 2.3b), leading to
22
the appearance of a shoulder-peak near the retention time for perchlorate
(retention times less than 0.5 min difference). Consequently, it would be easy to
mistakenly identify the interference as perchlorate in samples which contain no
perchlorate (false positive). In contrast, no interference peak was observed in
samples processed by a combination of NAX with Al-N or with PSA. The
cleanup of urine using NAX combined with Al-N or PSA produced high recovery,
low background conductivity, and no adjacent interference peak.
Accuracy and precision of NAX plus Al-N for cleanup of different sources of urine
Since NAX combined with Al-N proved to be the most efficient for cleanup
of cow urine for the determination of perchlorate by ion chromatography, we
further evaluated the accuracy and precision of this cleanup procedure for
different types of urine samples spiked with perchlorate (Table 2.3). Perchlorate
recoveries (± SD) were 67% ± 2.51, 77% ± 3.56, and 81% ± 1.66 for cow urine
spiked with perchlorate at 2.5, 10, and 100 μg/L, respectively. The highest
perchlorate recovery was found for vole urine, with 97% ± 4.13, 83% ± 5.13, and
86% ± 1.62 in the samples spiked with 2.5, 10, and 100 μg/L perchlorate,
respectively. Recovery was lowest in human urine, with 76% ± 0.82, 46% ± 0.96,
and 56% ± 3.40, respectively. Since Al-N (without conditioning) does not adsorb
perchlorate, the reduced perchlorate recovery in human urine samples is
probably caused by the NAX cartridge. We tested the effect of different elution
volumes of Milli-Q water on perchlorate recovery, and found that perchlorate was
eluted primarily within the first 4 mL of water, with 92% and 63% recovery of
spiked perchlorate (100 μg/L) in cow and human urine, respectively.
The pH profile of different urine samples (Table 2.4) may cause differential
perchlorate recovery. The pH of human and cow urine was 7.10 and 9.05,
respectively. The pH may alter perchlorate elution from NAX by affecting the
amine groups. Perchlorate recovery was increased dramatically if 20 mM NaOH
was used as an eluent, but with interferences. In addition, conductivity of urine
23
samples (Table 2.4) may also have an influence on cleanup using NAX. Human
urine (with higher conductivity) may have additional ions which could compete
with perchlorate interaction with the amine groups and cause a wide disperse
pattern of perchlorate during wash and elution processes: some perchlorate may
be lost in the wash step, some may still interact with the amine groups even after
4 mL of water elution. Consequently, unsatisfactory recovery was observed.
Considering the recoveries and reduction of background signal, the limit of
detection (LOD) for perchlorate in cow, vole, and human urine samples was 12.6,
12.3, 18.7 μg/L, respectively (based on S/N = 3).
Application of cleanup method (NAX plus Al-N) to urine samples from field and
laboratory studies
It is well known that perchlorate is excreted primarily via urine (Anbar et
al., 1959; Goldman and Stanbury, 1973; Peña et al., 1976; Batjoens et al., 1993;
Yu et al., 2002; Valentin-Blasini et al., 2005); therefore, monitoring perchlorate
residues in urine should be a sensitive biomarker for perchlorate exposure. The
current study provided a promising cleanup method for perchlorate determination
using ion chromatography in a variety of urine types, including cattle, vole, and
human urine. In addition, the application of this cleanup method provides for the
detection of perchlorate in urine as low as 12.6 μg/L. To our knowledge, this is
the lowest reported detection limit of perchlorate in urine or a similar biological
matrix using conventional ion chromatography.
We attempted to use this cleanup method to evaluate perchlorate in urine
samples from the field. Urine (n = 4) was collected from cattle inhabiting two
different pastures where perchlorate was detected in ponds which serve as
drinking water for the cattle at concentrations as high as 100 μg/L. Cattle on
these pastures were not restricted to water supplies containing perchlorate; most
of the ponds did not contain perchlorate and there was some anecdotal evidence
that the cattle were avoiding the perchlorate-contaminated water. Using the
24
cleanup method described, we did not detect perchlorate in any of the urine
samples, which was consistent with analysis results of the corresponding plasma
samples in which no perchlorate was detected (data not shown here and
unpublished). Confirmation analysis using LC-MS revealed that one urine
sample contained perchlorate (concentration = 3.45 μg/L after 8X dilution).
Perchlorate was detected in all 4 samples using IC-MS/MS (the minimal report
detection limit is 10 ng/L) but concentrations in three samples are lower than the
detection limit of LC-MS (2.28 ng/mL, S/N = 3) after 8X dilution, and therefore not
detected using the LC-MS. The other urine sample with detectable perchlorate
using LC-MS was very dirty with many interferences and high background
conductivity even after cleanup; thus perchlorate was not detected by
conventional IC.
Compared to the cow urine provided by the Department of Animal and
Food Science, Texas Tech University, used in the laboratory portion of this study,
urine collected from the field was much darker in color. The average pH of these
cow urine samples was 7.86 ± 0.11 (± SD), and the conductivity ranged from
11.74 mS to 68.68 mS. These field urine samples had much higher background
and poor recovery if 0.8 mL sample was loaded onto the NAX and eluted with 4
mL Milli-Q water. These more complex urine samples appeared to exceed the
capacity of NAX, resulting in only partial interaction of sample with the NAX.
Therefore, we had to revise the procedure slightly (only 0.4 mL or less sample
was loaded onto NAX and eluted with 4 mL Milli-Q water or 5 mM NaOH after
washing with 0.6 mL Milli-Q water). Nonetheless, perchlorate was not detected
in these field animal urine samples by conventional ion chromatography.
We also applied this cleanup method to deer mouse urine from a
laboratory study, but the result was not satisfactory. The urine was concentrated,
and mixed with some feces because of limited separation ability of the metabolic
cages. An interference that may have come from food (rodent chow) confounded
perchlorate determination using conventional IC. Therefore, an online
25
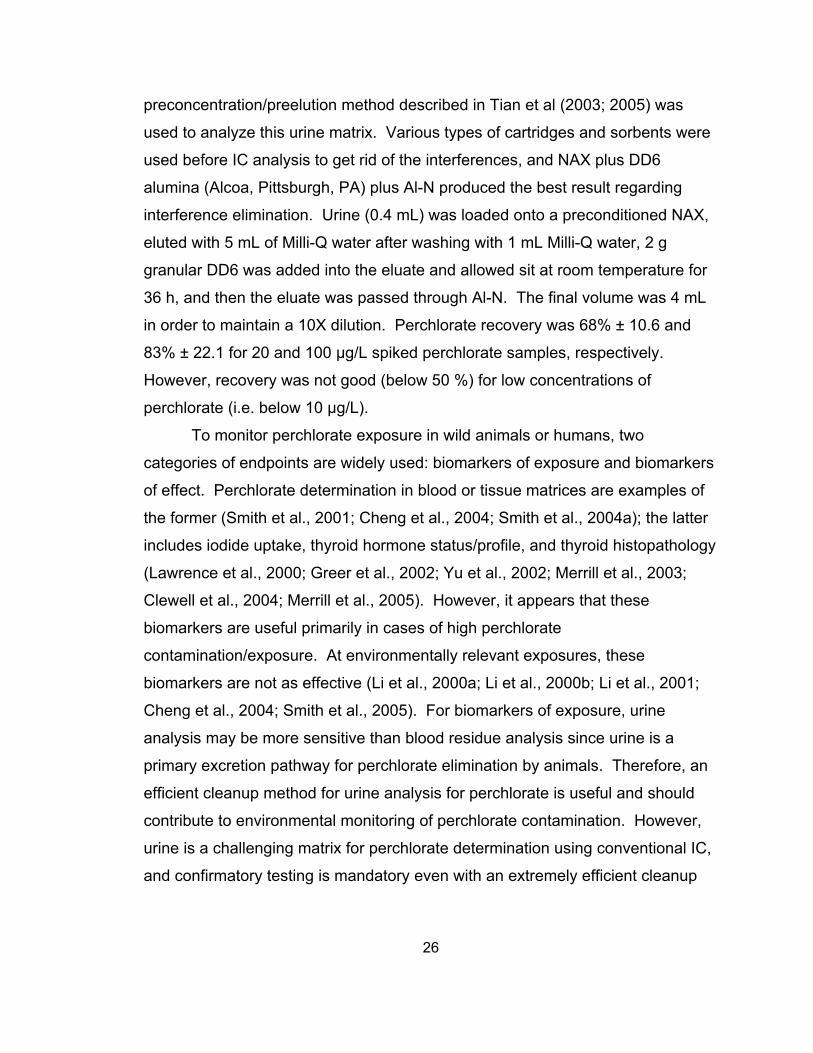
preconcentration/preelution method described in Tian et al (2003; 2005) was
used to analyze this urine matrix. Various types of cartridges and sorbents were
used before IC analysis to get rid of the interferences, and NAX plus DD6
alumina (Alcoa, Pittsburgh, PA) plus Al-N produced the best result regarding
interference elimination. Urine (0.4 mL) was loaded onto a preconditioned NAX,
eluted with 5 mL of Milli-Q water after washing with 1 mL Milli-Q water, 2 g
granular DD6 was added into the eluate and allowed sit at room temperature for
36 h, and then the eluate was passed through Al-N. The final volume was 4 mL
in order to maintain a 10X dilution. Perchlorate recovery was 68% ± 10.6 and
83% ± 22.1 for 20 and 100 μg/L spiked perchlorate samples, respectively.
However, recovery was not good (below 50 %) for low concentrations of
perchlorate (i.e. below 10 μg/L).
To monitor perchlorate exposure in wild animals or humans, two
categories of endpoints are widely used: biomarkers of exposure and biomarkers
of effect. Perchlorate determination in blood or tissue matrices are examples of
the former (Smith et al., 2001; Cheng et al., 2004; Smith et al., 2004a); the latter
includes iodide uptake, thyroid hormone status/profile, and thyroid histopathology
(Lawrence et al., 2000; Greer et al., 2002; Yu et al., 2002; Merrill et al., 2003;
Clewell et al., 2004; Merrill et al., 2005). However, it appears that these
biomarkers are useful primarily in cases of high perchlorate
contamination/exposure. At environmentally relevant exposures, these
biomarkers are not as effective (Li et al., 2000a; Li et al., 2000b; Li et al., 2001;
Cheng et al., 2004; Smith et al., 2005). For biomarkers of exposure, urine
analysis may be more sensitive than blood residue analysis since urine is a
primary excretion pathway for perchlorate elimination by animals. Therefore, an
efficient cleanup method for urine analysis for perchlorate is useful and should
contribute to environmental monitoring of perchlorate contamination. However,
urine is a challenging matrix for perchlorate determination using conventional IC,
and confirmatory testing is mandatory even with an extremely efficient cleanup
26
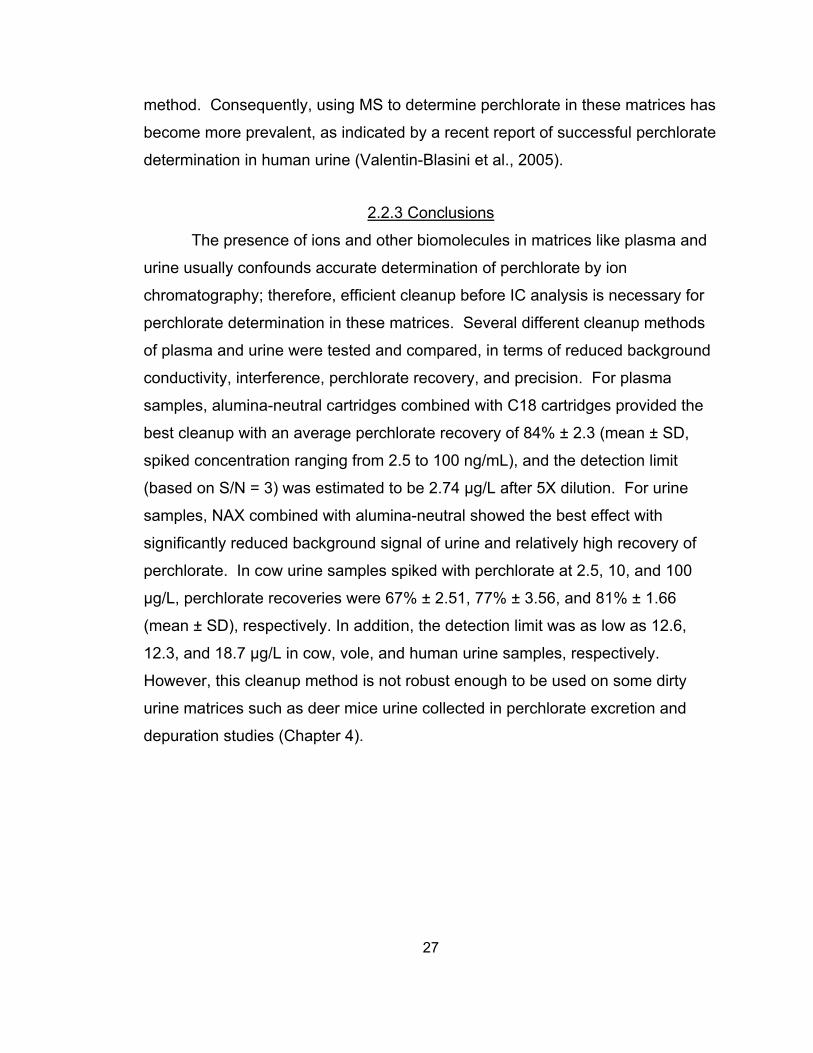
method. Consequently, using MS to determine perchlorate in these matrices has
become more prevalent, as indicated by a recent report of successful perchlorate
determination in human urine (Valentin-Blasini et al., 2005).
2.2.3 Conclusions
The presence of ions and other biomolecules in matrices like plasma and
urine usually confounds accurate determination of perchlorate by ion
chromatography; therefore, efficient cleanup before IC analysis is necessary for
perchlorate determination in these matrices. Several different cleanup methods
of plasma and urine were tested and compared, in terms of reduced background
conductivity, interference, perchlorate recovery, and precision. For plasma
samples, alumina-neutral cartridges combined with C18 cartridges provided the
best cleanup with an average perchlorate recovery of 84% ± 2.3 (mean ± SD,
spiked concentration ranging from 2.5 to 100 ng/mL), and the detection limit
(based on S/N = 3) was estimated to be 2.74 μg/L after 5X dilution. For urine
samples, NAX combined with alumina-neutral showed the best effect with
significantly reduced background signal of urine and relatively high recovery of
perchlorate. In cow urine samples spiked with perchlorate at 2.5, 10, and 100
μg/L, perchlorate recoveries were 67% ± 2.51, 77% ± 3.56, and 81% ± 1.66
(mean ± SD), respectively. In addition, the detection limit was as low as 12.6,
12.3, and 18.7 μg/L in cow, vole, and human urine samples, respectively.
However, this cleanup method is not robust enough to be used on some dirty
urine matrices such as deer mice urine collected in perchlorate excretion and
depuration studies (Chapter 4).
27
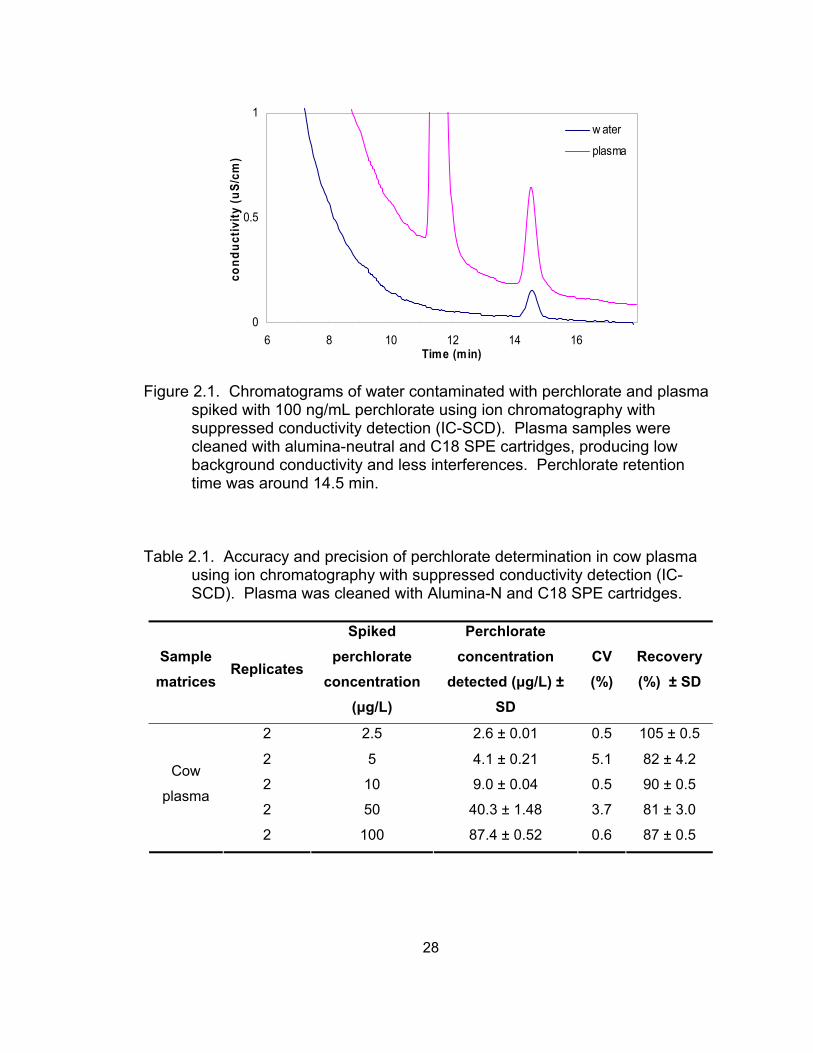
0
0.5
1
6 8 10 12 14 16Time (min)
cond
uctiv
ity (u
S/cm
)
w ater
plasma
Figure 2.1. Chromatograms of water contaminated with perchlorate and plasma
spiked with 100 ng/mL perchlorate using ion chromatography with suppressed conductivity detection (IC-SCD). Plasma samples were cleaned with alumina-neutral and C18 SPE cartridges, producing low background conductivity and less interferences. Perchlorate retention time was around 14.5 min.
Table 2.1. Accuracy and precision of perchlorate determination in cow plasma
using ion chromatography with suppressed conductivity detection (IC-SCD). Plasma was cleaned with Alumina-N and C18 SPE cartridges.
Sample matrices
Replicates
Spiked perchlorate
concentration (μg/L)
Perchlorate concentration
detected (μg/L) ± SD
CV (%)
Recovery (%) ± SD
2 2.5 2.6 ± 0.01 0.5 105 ± 0.5
2 5 4.1 ± 0.21 5.1 82 ± 4.2
2 10 9.0 ± 0.04 0.5 90 ± 0.5
2 50 40.3 ± 1.48 3.7 81 ± 3.0
Cow
plasma
2 100 87.4 ± 0.52 0.6 87 ± 0.5
28
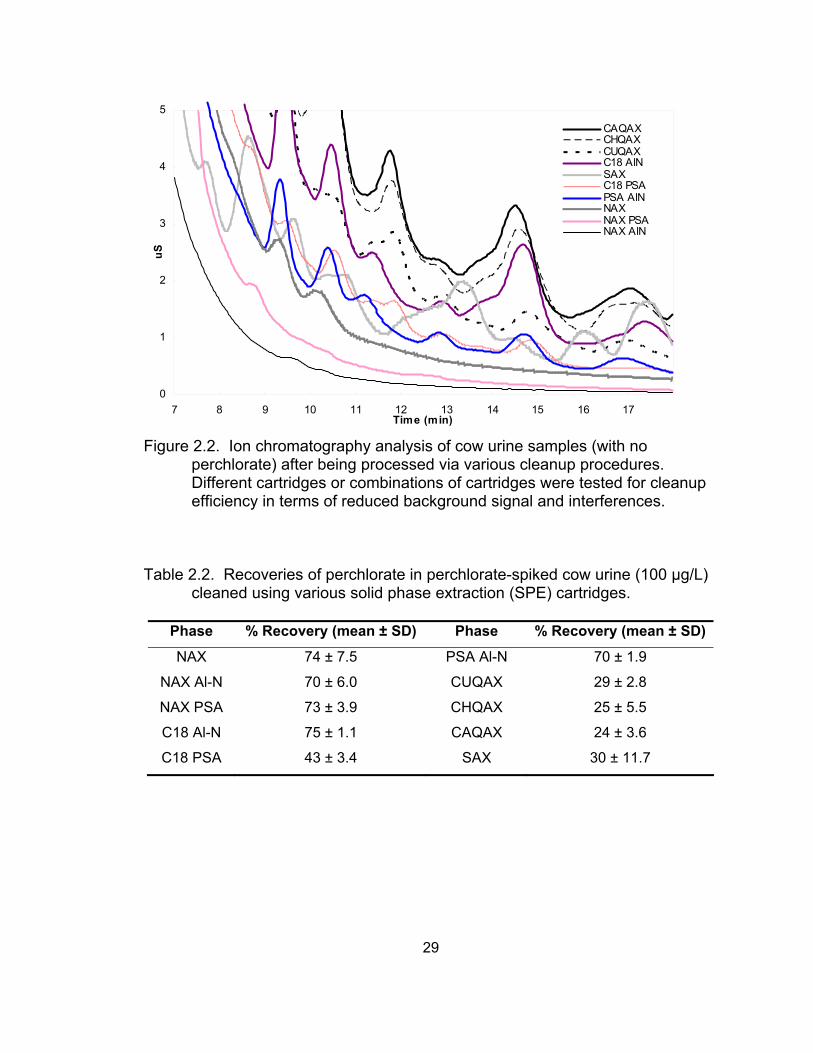
0
1
2
3
4
5
7 8 9 10 11 12 13 14 15 16 17Time (min)
uS
CAQAXCHQAXCUQAXC18 AlNSAXC18 PSAPSA AlNNAXNAX PSA NAX AlN
Figure 2.2. Ion chromatography analysis of cow urine samples (with no
perchlorate) after being processed via various cleanup procedures. Different cartridges or combinations of cartridges were tested for cleanup efficiency in terms of reduced background signal and interferences.
Table 2.2. Recoveries of perchlorate in perchlorate-spiked cow urine (100 µg/L) cleaned using various solid phase extraction (SPE) cartridges.
Phase % Recovery (mean ± SD) Phase % Recovery (mean ± SD)
NAX 74 ± 7.5 PSA Al-N 70 ± 1.9
NAX Al-N 70 ± 6.0 CUQAX 29 ± 2.8
NAX PSA 73 ± 3.9 CHQAX 25 ± 5.5
C18 Al-N 75 ± 1.1 CAQAX 24 ± 3.6
C18 PSA 43 ± 3.4 SAX 30 ± 11.7
29
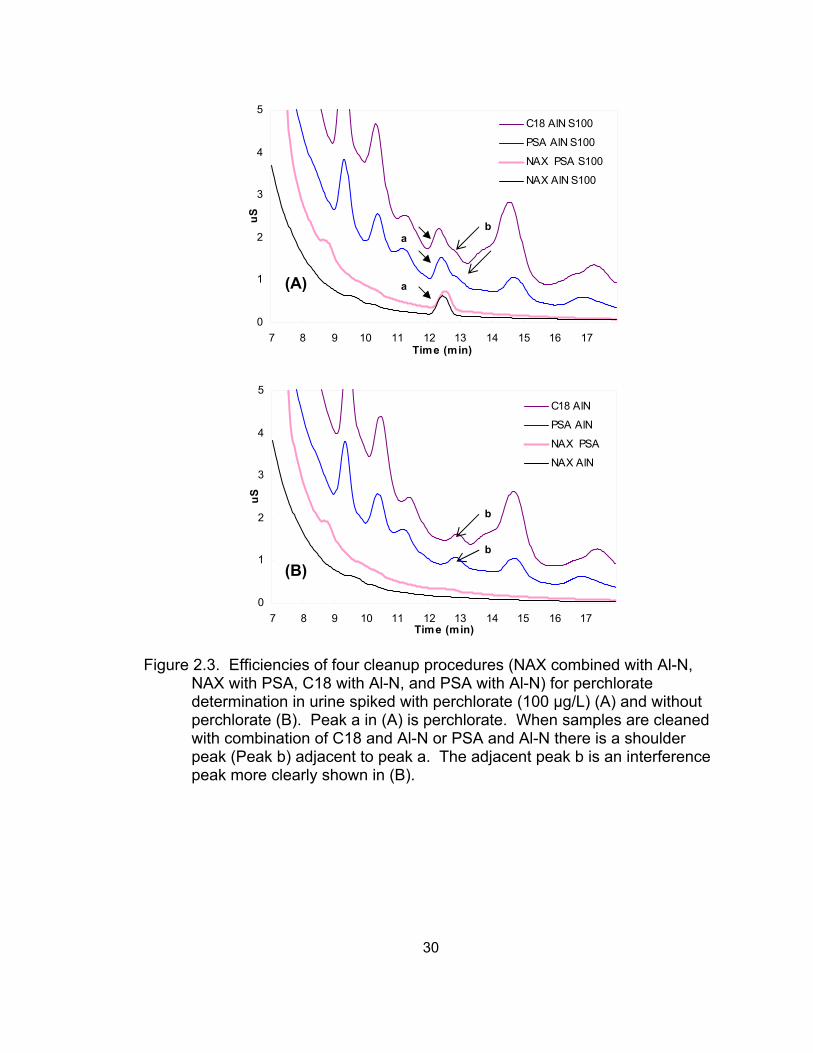
0
1
2
3
4
5
7 8 9 10 11 12 13 14 15 16 17Time (min)
uS
C18 AlN S100
PSA AlN S100
NAX PSA S100
NAX AlN S100
0
1
2
3
4
5
7 8 9 10 11 12 13 14 15 16 17Time (min)
uS
C18 AlN
PSA AlN
NAX PSA
NAX AlN
a
a
b
(A)
b
b
(B)
Figure 2.3. Efficiencies of four cleanup procedures (NAX combined with Al-N, NAX with PSA, C18 with Al-N, and PSA with Al-N) for perchlorate determination in urine spiked with perchlorate (100 µg/L) (A) and without perchlorate (B). Peak a in (A) is perchlorate. When samples are cleaned with combination of C18 and Al-N or PSA and Al-N there is a shoulder peak (Peak b) adjacent to peak a. The adjacent peak b is an interference peak more clearly shown in (B).
30
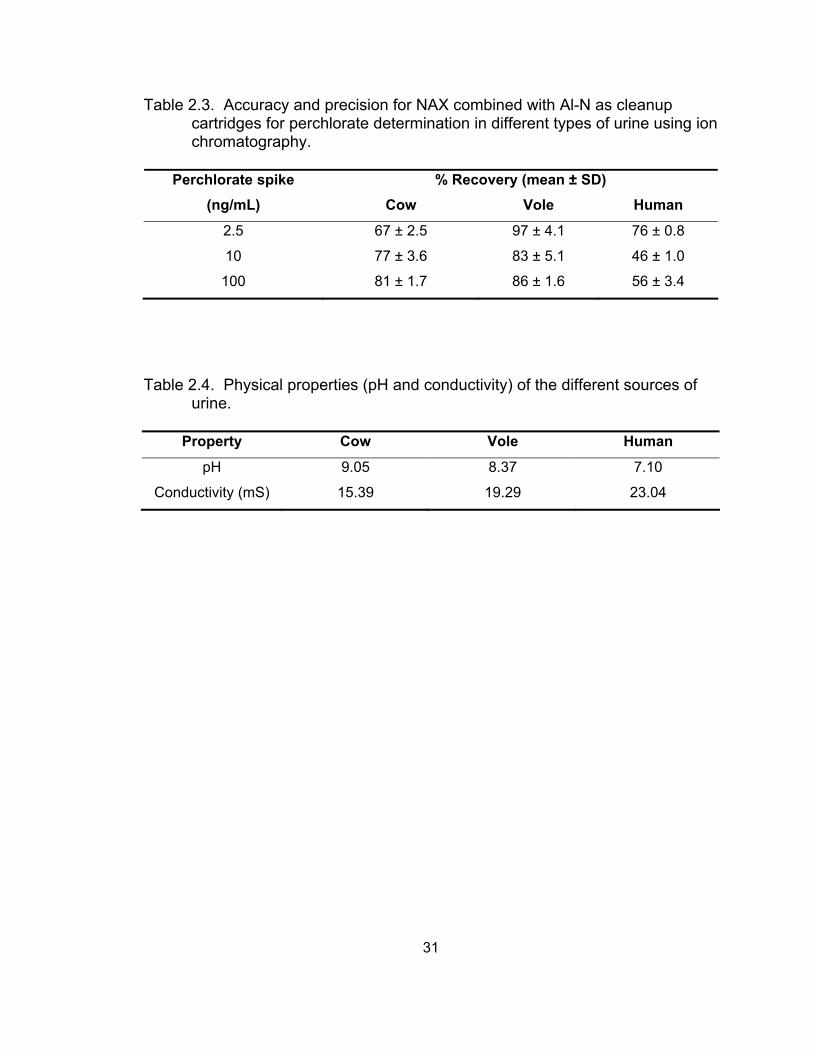
Table 2.3. Accuracy and precision for NAX combined with Al-N as cleanup cartridges for perchlorate determination in different types of urine using ion chromatography.
% Recovery (mean ± SD) Perchlorate spike
(ng/mL) Cow Vole Human
2.5 67 ± 2.5 97 ± 4.1 76 ± 0.8
10 77 ± 3.6 83 ± 5.1 46 ± 1.0
100 81 ± 1.7 86 ± 1.6 56 ± 3.4
Table 2.4. Physical properties (pH and conductivity) of the different sources of urine.
Property Cow Vole Human
pH 9.05 8.37 7.10
Conductivity (mS) 15.39 19.29 23.04
31
2.3 Perchlorate Determination in Urine, Milk, and Plasma Using Liquid
Chromatography Electrospray Ionization Mass Spectrometry (LC-ESI-MS) and
Comparison with Ion Chromatography with Suppressed Conductivity Detection
(IC-SCD)
2.3.1 Materials and Methods
Reagents and standards
A custom perchlorate (ClO4-) standard solution was purchased
AccuStandard, Inc. (New Haven, CT). Sodium hydroxide (50%, w/w) aqueous
solution and acetonitrile (HPLC grade) were purchased from Fisher Scientific
(Fair Lawn, NJ). Ammonium acetate (99%) was obtained from J.T. Baker
(Phillipsburg, NJ). Ammonium hydroxide, 28.0-30.0% as NH3, was purchased
from Sigma-Aldrich (St. Louis, MO). All solutions were prepared in 18.2 MΩ Milli-
Q water.
Sample sources and preparation
Urine was collected from sheep raised at the Texas Tech University
Agriculture Research Farm. Urine samples were prepared using NAX2 SPE
cartridges (United Chemical Technologies, Inc. Bristol, PA). After 0.3 mL of urine
was loaded onto the preconditioned cartridge and washed with 1.5 mL of DI
water, 3 mL Milli-Q water was used to elute the cartridge, and then the 3 mL
eluate was processed through an alumina-neutral cartridge (J. T. Baker,
Phillipsburg, NJ). Several prepared samples were pooled, divided into 7 aliquots,
and spiked with perchlorate to obtain final perchlorate concentrations of 0, ~ 2, ~
5, ~ 10, ~ 50, ~ 100, and ~ 200 ng/mL.
Dairy milk (1% fat) and soymilk were purchased from a local supermarket,
and human breast milk was provided by healthy lactating mothers residing in
Lubbock, TX or nearby counties that was collected by the Department of Human
Development and Family Studies, Texas Tech University (Lubbock, TX). Milk
32
samples (48 mL) were precipitated using acetonitrile (96 mL), and centrifuged at
3750 rpm for 10 min (Beckman Allegra 6R Centrifuge, USA). The supernatant
was evaporated to 24 mL under nitrogen gas, and then passed through
preconditioned C18 SPE cartridges with 2 mL per cartridge (Fisher Science,
USA). The eluate was collected, and each cartridge was then washed with 5 mL
of Milli-Q water which was combined with the eluate. The pooled eluate was
evaporated to a final volume of 48 mL, and then cleaned using alumina-neutral
cartridges (4 mL per cartridge). The eluate was collected and divided into nine
aliquots, and then spiked with perchlorate to achieve final concentrations of 0, ~
2, ~ 5, ~ 10, ~ 50, ~ 100, ~ 200, ~ 500, and ~ 1000 ng/mL. Because of
inadequate sample volume, only 25 mL of human breast milk were used to
prepare the spiked samples with final concentrations of 0, ~ 5, ~ 10, and ~ 100
ng/mL.
Plasma was collected from cows inhabiting a perchlorate-contaminated
site in Kansas. These cows were not restricted to the contaminated water
source, and perchlorate was not detected in the plasma samples used in this
study. The plasma sample (8 mL) was precipitated with acetonitrile (16 mL) and
centrifuged at 3750 rpm for 10 min. The supernatant was evaporated to 8 mL,
and then passed through three preconditioned C18 cartridges (i.e., about 3 mL
per cartridge). The eluate was collected and each cartridge was then washed
with 5 mL of Milli-Q water which was combined with the eluate. The pooled
eluate was diluted to a final volume of 40 mL with Milli-Q water. After cleanup
through aluminum-neutral cartridges (4 mL per cartridge), all eluates were pooled
and divided into seven aliquots, and spiked to obtain final perchlorate
concentrations of 0, ~ 2, ~ 5, ~ 10, ~ 50, ~ 100, and ~ 200 ng/mL.
Prepared samples were then separated into two aliquots, one for ion
chromatography analysis with suppressed conductivity detection (IC-SCD) and
the other for liquid chromatography electrospray ionization mass spectrometry
(LC-ESI-MS). Because perchlorate could not be separated from the
33
interferences using IC-SCD, sheep urine samples were only analyzed by LC-ESI-
MS.
IC-SCD analysis
A method similar to EPA Method 314.0 (Hautman et al., 1999) was
followed to determine perchlorate in all samples. The analysis was performed on
Dionex DX-500 Ion Chromatography System equipped with a GP50 gradient
pump, a CD20 conductivity detector, and an AS40 automated sampler (Dionex
Corp., Sunnyvale, CA). PeakNet® chromatography software was used to control
the system. Ion separation was conducted with a Dionex IonPac AS16 (250 mm
x 4.0 mm i.d.) analytical and AG16 (50 mm x 4.0 mm i.d.) guard columns.
Conditions for the system were as follows: flow rate = 1.0 mL/min; eluent = 50
mM sodium hydroxide; injection volume = 1000 µL. Ion detection was by
suppressed conductivity in the external water mode. Computer-generated peak
areas were used to measure sample concentrations in an external standard
mode.
LC-ESI-MS analysis
Perchlorate determination by mass spectrometry was conducted by LC-
MS (LCQ Advantage, Thermo-Finnigan Inc., San Jose, CA, USA) operated in the
electrospray ionization mode (ESI). An IC-Pak Anion HR analytical column (75
mm × 4.6 mm i.d) from Waters (Milford, MA) was eluted with 20 mM ammonium
acetate in 55:45 (v/v) acetonitrile/water (pH = 10 with ammonium hydroxide) at
500 μL/min. An injection loop volume of 25 μL was used for MS analysis.
Selected ion monitoring (SIM) mode was used to monitor ClO4- at m/z 99.0 ± 0.5
and 101.0 ± 0.5 corresponding to 35ClO4- and 37 ClO4
-, respectively. A diversion
valve was used during each run to direct flow to waste for the first 10.0 min, after
which the eluent was directed into the electrospray interface for 6.0 min.
Conditions for negative ion ESI - MS were as follows: 0.5 kV ion spray voltage, -4
34
V capillary voltage, and 150 ºC capillary temperature. Other parameters such as
sheath gas flow rate and aux/sweep gas flow rate were optimized with tune.
Peak area produced at m/z 99.0 ± 0.5 was used for quantitative analysis. The
isotopic ratio of 35ClO4- and 37ClO4
- ( m/z 99.0 ± 0.5 and 101.0 ± 0.5) at the
retention time within ± 50% of 3.08 (i.e., 1.5 to 4.6) was used for perchlorate
confirmation.
2.3.2 Results and Discussion
Linearity of response and detection limit for LC-ESI-MS
For 25 μL injections, the MS response to perchlorate was found to be
linear over the spiked concentration range (2, 5, 10, 50, 100, and 200 ng/mL) in
water, sheep urine, and dairy milk. Good linearity for perchlorate was found over
the concentration range from 2.0 to100.0 ng/mL in spiked cow plasma samples.
Milli-Q water: A (counts) = (0.93 ± 0.06) × 105 [ClO4-, ng/mL] + (4.27 ± 0.68) ×
105, r2 = 0.9948, n = 6…(1)
Sheep urine: A (counts) = (1.65 ± 0.09) × 105 [ClO4-, ng/mL] – (2.69 ± 4.67) ×
105, r2 = 0.9926, n = 5…(2)
Dairy milk: A (counts) = (1.09 ± 0.14) × 105 [ClO4-, ng/mL] + (6.72 ± 5.52) × 105,
r2 = 0.9971, n = 5…(3)
Cow plasma: A (counts) = (1.13 ± 0.04) × 105 [ClO4-, ng/mL] + (9.74 ± 1.71) ×
105, r2 = 0.9977, n = 5…(4)
In the current study, no statistical difference was observed in the MS
responses to perchlorate in dairy milk and Milli-Q water samples over the
concentration range from 2.0 to 200.0 ng/mL in terms of slopes of the linear
range (p = 0.058. t-test), but it was found between cow plasma and Milli-Q water,
sheep urine and Milli-Q water (p < 0.001) (Figure 2.4). Much higher MS
35
responses to perchlorate were found in sheep urine than in Milli-Q water,
particularly in the samples spiked with more perchlorate.
Both the limit of detection (LOD) based on S/N=3 and the method
detection limit (MDL) based on the definition in EPA Method 314.0 were
estimated (Table 2.5). In water, a MDL as low as 50 ng/L (Winkler et al., 2004),
and LOD (S/N = 3) as low as 25 ng/L with an ion association technique
(Martinelango et al., 2005) have been reported. In the current study, the LOD
(S/N = 3) was 2.49 ng/mL in a simple matrix such as Milli-Q water. The huge
difference regarding method sensitivity may be due to the limitation of our
instrument. Most mass spectrometers used in previous reports, in which a much
lower MDL or LOD for perchlorate was reported, used a quadrupole mass filter
as the mass analyzer, while a octapole ion trap was used as the mass analyzer
in our instrument. To our knowledge, this type of mass analyzer has not been
previously used to determine perchlorate. Ion traps are not as effective as
quadrupole mass filters in trapping low m/z ions. Additionally, because of mass
discrimination, low m/z ions are usually not transferred by ESI as efficiently as
higher m/z ions, and background noise also tends to be higher for low m/z ions
(Kempen and Brodbelt, 2000; Martinelango et al., 2005). In addition, high mass
molecules have been reported to suppress the signal of smaller molecules
(Sterner et al., 2000; Annesley, 2003). Ion-pair (or association) techniques were
therefore developed by some groups to improve sensitivity and selectivity of
perchlorate determination by MS (Urbansky et al., 1999; Magnuson et al., 2000a;
Martinelango et al., 2005). The optimum m/z range in the MS used in this study
was designed to be 200 - 2000. Therefore, since the perchlorate ion was
monitored at m/z of 99 and 101, which is outside the optimal range, the MDL and
LOD using this instrument in the current study were higher than those reported in
other studies.
Method accuracy and precision were evaluated in sheep urine, dairy milk,
and cow plasma by spiking perchlorate into these matrices at different levels and
36
evaluating the recovery (Table 2.6). Because of the difference in MS response
for perchlorate in different matrices, perchlorate recovery in sheep urine and cow
plasma matrices was calculated based on the calibration curve of its respective
matrix, and the recovery in dairy milk was based on the calibration curve of Milli-
Q water. Perchlorate recovery was 80 – 120% in the spiked sheep urine and
cow plasma matrices, while 75 – 140% recoveries were observed in the spiked
dairy milk samples. Good precision was revealed by a lower coefficient of
variation (CV % ≤ 4.88%) in a single-day experiment of perchlorate determination
in these types of matrices.
Comparison of LC-ESI-MS with IC-SCD
Interfering components, such as additional ions, proteins, lipids, sugars,
and other biomolecules in biological fluids, produced high background
conductivity and co-elution were routine phenomena encountered in perchlorate
determination by IC-SCD. As shown in Figures 2.5, 2.6, and 2.7, retention time
of interfering components in the samples was close (or the same) to that of
perchlorate during IC-SCD analysis, causing uncertainty for perchlorate
determination in the samples. In contrast, with the mass spectrometry method,
only perchlorate was eluted at the retention time using m/z 99.0 ± 0.5 SIM. As
seen from the chromatograms in Figures 2.5, 2.6, and 2.7, representing MS
chromatograms of the same sample with m/z 99.0 ± 0.5 SIM detection, no high
background and co-elution of interferences occurred. The matrices under study
did not show a difference in LC-ESI-MS in terms of baseline and interferences,
but a pronounced difference was observed using IC-SCD, unless effective
preparation and cleanup methods were applied to these matrices. On the other
hand, without information about the background difference in mass spectrometry,
dirty samples with high background would be analyzed by LC-ESI-MS, and as a
result, the separation column would be more easily impacted. In this cascade, a
37
guard column is necessary and important to protect the separation column from
potential damage caused by dirty samples.
Because of high background conductivity and the existence of
interferences in IC-SCD analysis, perchlorate LODs (S/N = 3) of the dairy milk
and cow plasma were not able to be calculated, and because perchlorate could
not be separated from the interferences, sheep urine matrix was not analyzed for
LOD determination using IC-SCD (Figure 2.7). Based on previous studies, LODs
(based on S/N = 3) of cow plasma and urine samples were 2.74 and 2.52 ng/mL,
respectively, in 5X diluted matrices using IC-SCD (Cheng et al., 2004; Cheng et
al., 2006). These reported LODs approximate the LOD by LC-ESI-MS in the
current study (Table 2.5). With extremely effective offline and online cleanup
methods, the LOD of milk using IC-SCD was reported as low as 0.4 ng/mL (Kirk
et al., 2005). However, the matrices used in the current study were not prepared
and cleaned as extensively as that in the previous studies, where the baseline
and conductivity background of the matrices were comparable to that of standard
solutions using IC-SCD. In addition, different types of matrices, even the same
type of matrix, but from different species, may have different properties for
perchlorate determination using IC-SCD because of different composition, which
can lead to different LODs using the same instrument. For example, cow urine
analyzed in the previous study was much cleaner than sheep urine in the current
study. The cleaner sample allowed a cow urine LOD (for IC-SCD), which was
close to that of LC-ESI-MS, to be lower than that of the sheep urine. Therefore, if
the LODs by IC-SCD could have been estimated, they would have been higher
than those by LC-ESI-MS.
For both IC-SCD and LC-ESI-MS analyses, mean peak areas for
standards and spiked milk matrices, including dairy milk, soymilk, and human
breast milk, were plotted as a function of perchlorate concentration (Figure 2.8).
There was no significant difference between standards, dairy milk, and soymilk
matrices regarding instrumental response to perchlorate using either IC-SCD or
38
LC-ESI-MS method (p > 0.05 in most comparisons over the spiked concentration
range using t-test). The MS response to perchlorate spiked in human milk was
lower than that in other matrices over the spiked concentration range, which may
be caused by ionization suppression due to more ion species in the human milk
samples. As described by Dodds et al. (2004), high background conductivity in
the case of IC-SCD corresponds to ionization suppression in the case of ESI-MS,
higher background conductivity was also observed in these human milk samples
using IC-SCD. Linearity of perchlorate response was observed from 2 to 1,000
ng/mL by IC-SCD (r2 > 0.99) whereas it was from 2 to 200 ng/mL by LC-ESI-MS
(r2 > 0.99). Deviation from linearity was observed above 200 ng/mL by LC-ESI-
MS; this may result from ionization suppression caused by high ionic strength of
perchlorate.
All perchlorate standards and spiked dairy milk samples were analyzed in
triplicate by both methods, and spiked cow plasma samples were analyzed by
IC-SCD in duplicate and LC-ESI-MS in triplicate, respectively. Coefficient of
variation (CV %) of these two methods are displayed in Table 2.7. Compared
with the IC-SCD method, the analysis precision was improved for the dairy milk,
especially at low levels of spiked perchlorate, but not for cow plasma and
standard solutions when using LC-ESI-MS. This implies that LC-ESI-MS has an
advantage over IC-SCD regarding precision for samples which have high
background conductivity in IC-SCD analysis, such as the dairy milk matrix
prepared in the current study.
2.3.3 Conclusions
High background conductivity and the existence of interfering components
are problems routinely encountered in perchlorate determination in biological
fluids by IC-SCD; the application of LC-ESI-MS avoids these problems. Although
the linear range in LC-ESI-MS is much narrower than that in IC-SCD and there is
a problem with ionization suppression in the case of ESI-MS corresponding to
39
high background conductivity in IC-SCD, the LC-ESI-MS methodology offers a
significant improvement over IC-SCD. LC-ESI-MS provides better precision,
especially at low perchlorate concentrations in complicated matrices, perchlorate
confirmation, and lower detection limits for perchlorate determination in matrices
with less sample cleanup. Therefore, the LC-ESI-MS method reported here can
provide a better quantitative and qualitative analysis of complicated matrices
tested in the current study and work as an efficient alternative analytical tool to
IC-SCD for perchlorate contamination monitoring in the environment.
40
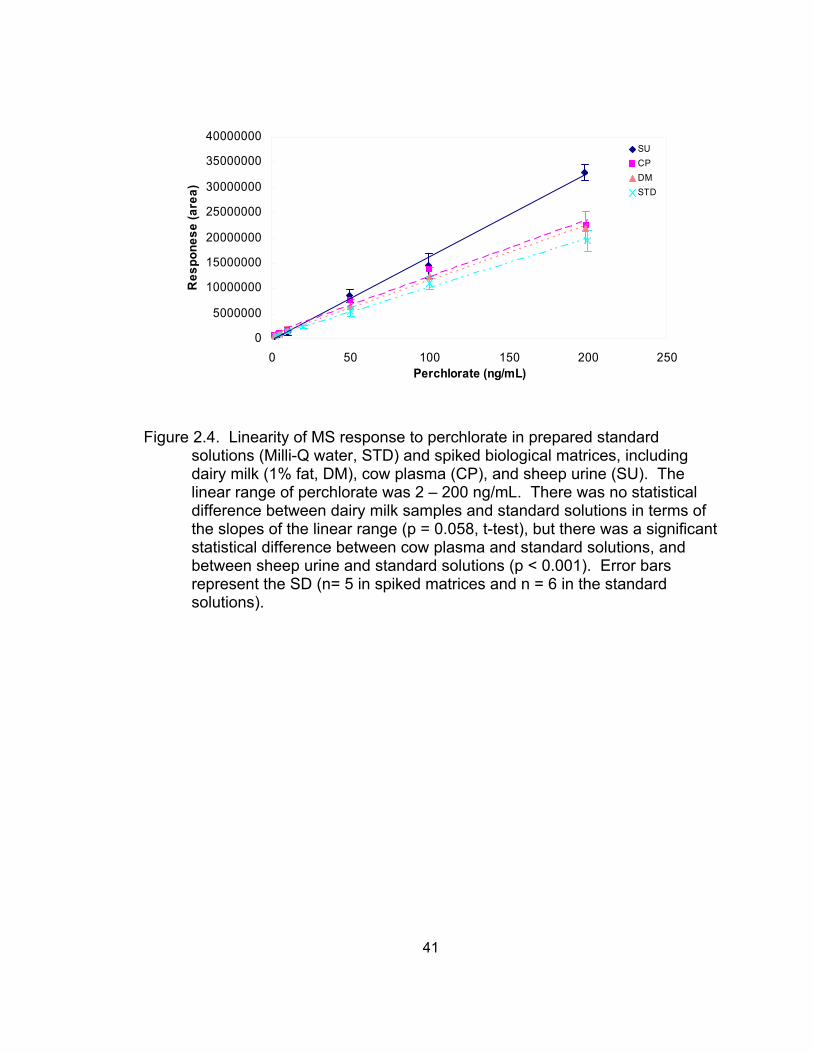
0
5000000
10000000
15000000
20000000
25000000
30000000
35000000
40000000
0 50 100 150 200 250Perchlorate (ng/mL)
Res
pone
se (a
rea)
SUCPDMSTD
Figure 2.4. Linearity of MS response to perchlorate in prepared standard solutions (Milli-Q water, STD) and spiked biological matrices, including dairy milk (1% fat, DM), cow plasma (CP), and sheep urine (SU). The linear range of perchlorate was 2 – 200 ng/mL. There was no statistical difference between dairy milk samples and standard solutions in terms of the slopes of the linear range (p = 0.058, t-test), but there was a significant statistical difference between cow plasma and standard solutions, and between sheep urine and standard solutions (p < 0.001). Error bars represent the SD (n= 5 in spiked matrices and n = 6 in the standard solutions).
41
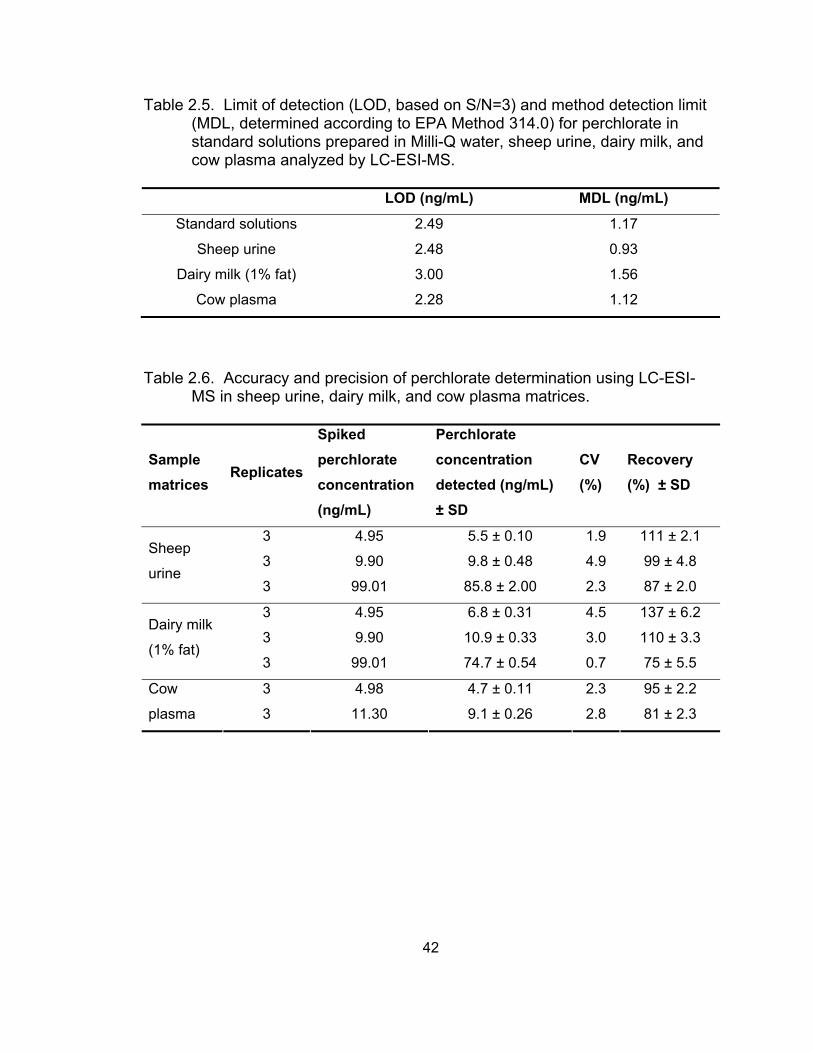
Table 2.5. Limit of detection (LOD, based on S/N=3) and method detection limit (MDL, determined according to EPA Method 314.0) for perchlorate in standard solutions prepared in Milli-Q water, sheep urine, dairy milk, and cow plasma analyzed by LC-ESI-MS.
LOD (ng/mL) MDL (ng/mL)
Standard solutions 2.49 1.17
Sheep urine 2.48 0.93
Dairy milk (1% fat) 3.00 1.56
Cow plasma 2.28 1.12
Table 2.6. Accuracy and precision of perchlorate determination using LC-ESI-MS in sheep urine, dairy milk, and cow plasma matrices.
Sample matrices
Replicates
Spiked perchlorate concentration (ng/mL)
Perchlorate concentration detected (ng/mL) ± SD
CV (%)
Recovery (%) ± SD
3 4.95 5.5 ± 0.10 1.9 111 ± 2.1
3 9.90 9.8 ± 0.48 4.9 99 ± 4.8 Sheep
urine 3 99.01 85.8 ± 2.00 2.3 87 ± 2.0
3 4.95 6.8 ± 0.31 4.5 137 ± 6.2
3 9.90 10.9 ± 0.33 3.0 110 ± 3.3 Dairy milk
(1% fat) 3 99.01 74.7 ± 0.54 0.7 75 ± 5.5
3 4.98 4.7 ± 0.11 2.3 95 ± 2.2 Cow
plasma 3 11.30 9.1 ± 0.26 2.8 81 ± 2.3
42
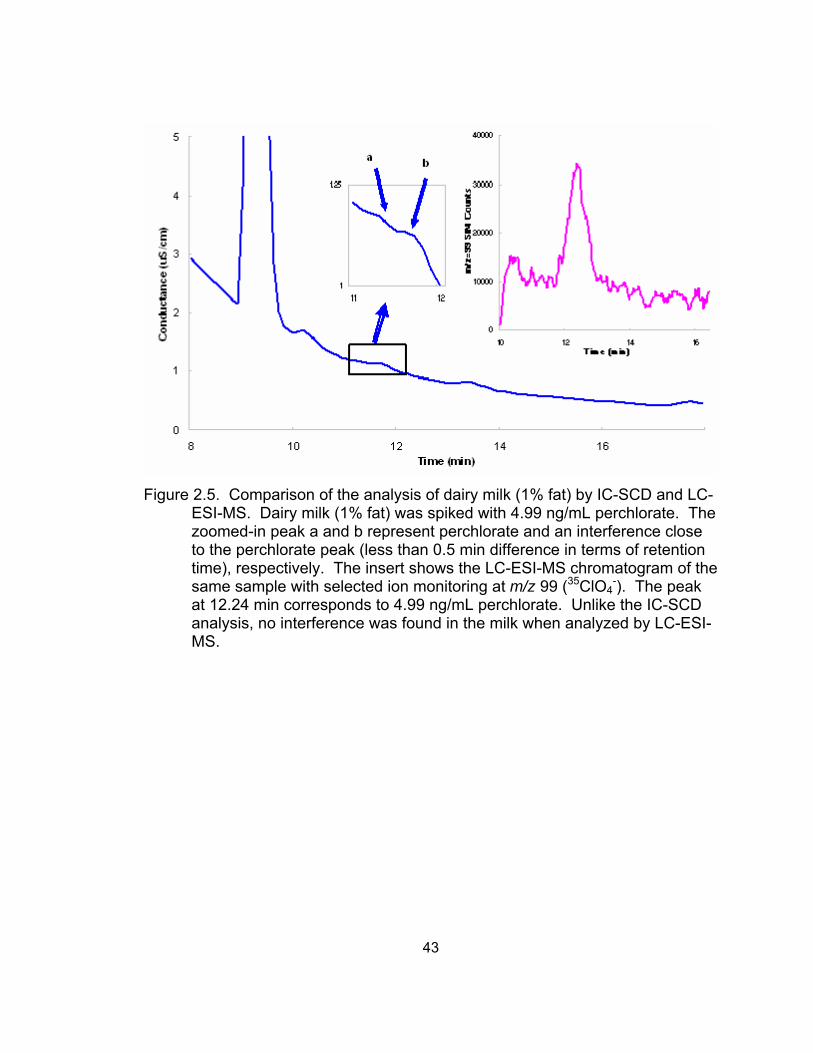
Figure 2.5. Comparison of the analysis of dairy milk (1% fat) by IC-SCD and LC-
ESI-MS. Dairy milk (1% fat) was spiked with 4.99 ng/mL perchlorate. The zoomed-in peak a and b represent perchlorate and an interference close to the perchlorate peak (less than 0.5 min difference in terms of retention time), respectively. The insert shows the LC-ESI-MS chromatogram of the same sample with selected ion monitoring at m/z 99 (35ClO4
-). The peak at 12.24 min corresponds to 4.99 ng/mL perchlorate. Unlike the IC-SCD analysis, no interference was found in the milk when analyzed by LC-ESI-MS.
43
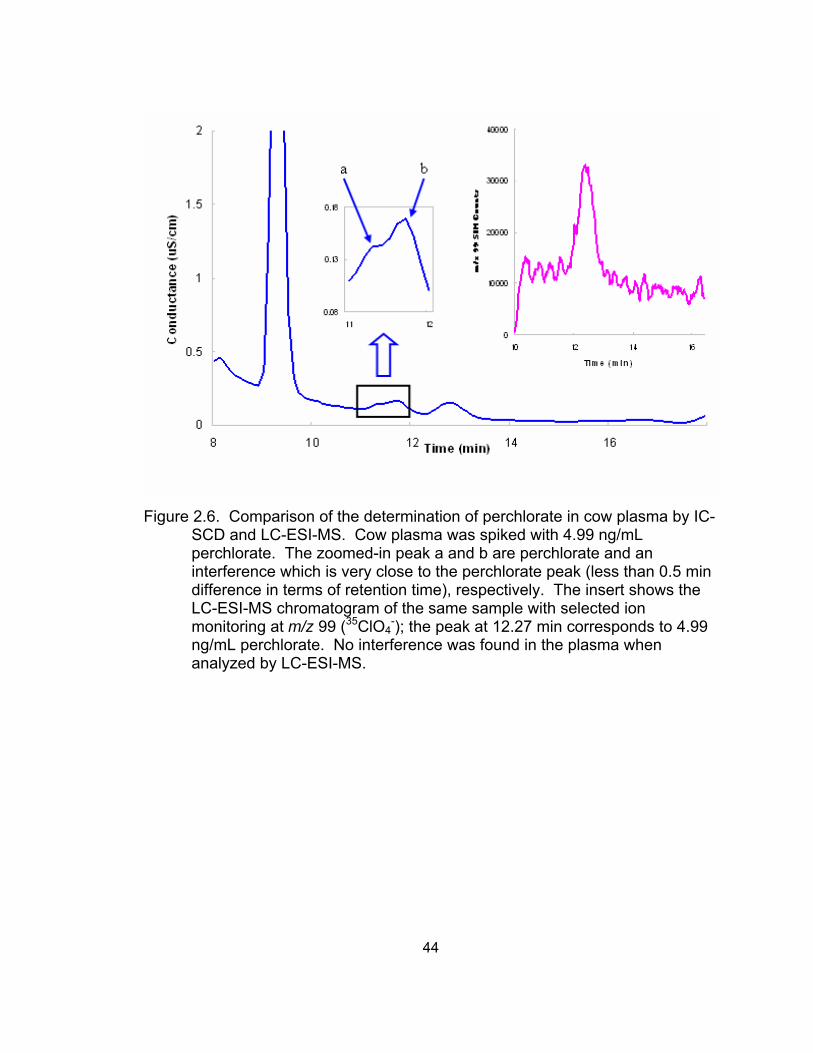
Figure 2.6. Comparison of the determination of perchlorate in cow plasma by IC-
SCD and LC-ESI-MS. Cow plasma was spiked with 4.99 ng/mL perchlorate. The zoomed-in peak a and b are perchlorate and an interference which is very close to the perchlorate peak (less than 0.5 min difference in terms of retention time), respectively. The insert shows the LC-ESI-MS chromatogram of the same sample with selected ion monitoring at m/z 99 (35ClO4
-); the peak at 12.27 min corresponds to 4.99 ng/mL perchlorate. No interference was found in the plasma when analyzed by LC-ESI-MS.
44
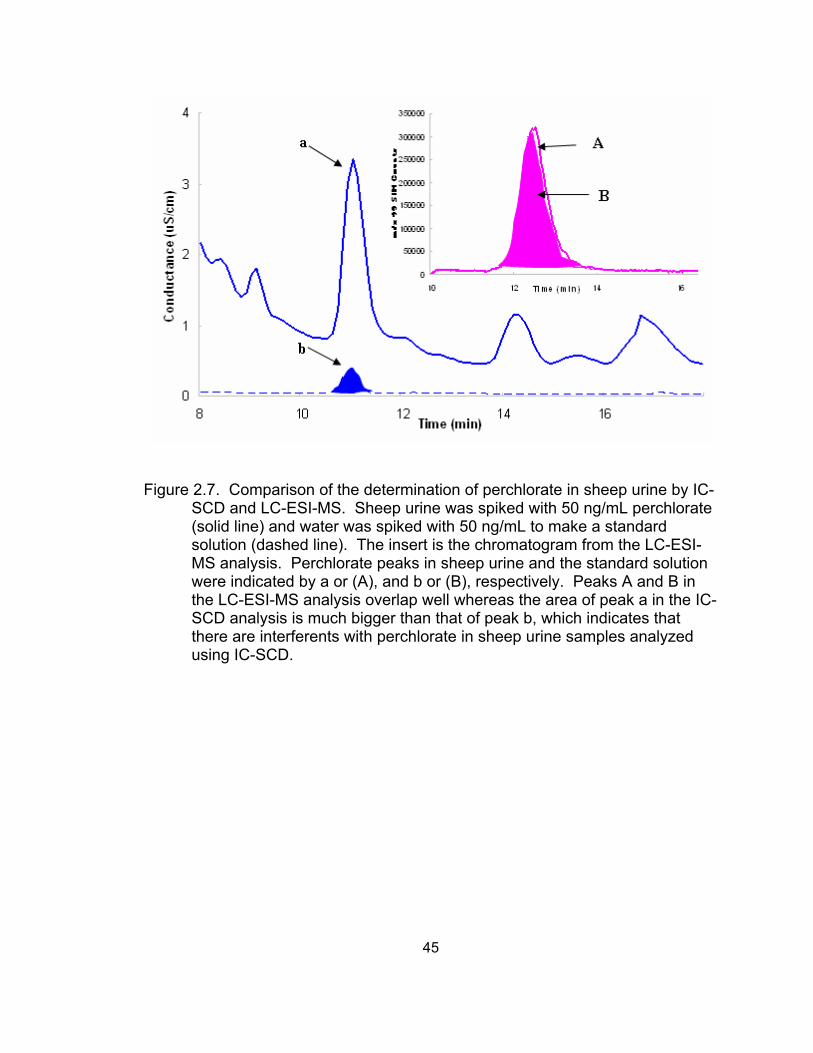
Figure 2.7. Comparison of the determination of perchlorate in sheep urine by IC-SCD and LC-ESI-MS. Sheep urine was spiked with 50 ng/mL perchlorate (solid line) and water was spiked with 50 ng/mL to make a standard solution (dashed line). The insert is the chromatogram from the LC-ESI-MS analysis. Perchlorate peaks in sheep urine and the standard solution were indicated by a or (A), and b or (B), respectively. Peaks A and B in the LC-ESI-MS analysis overlap well whereas the area of peak a in the IC-SCD analysis is much bigger than that of peak b, which indicates that there are interferents with perchlorate in sheep urine samples analyzed using IC-SCD.
45
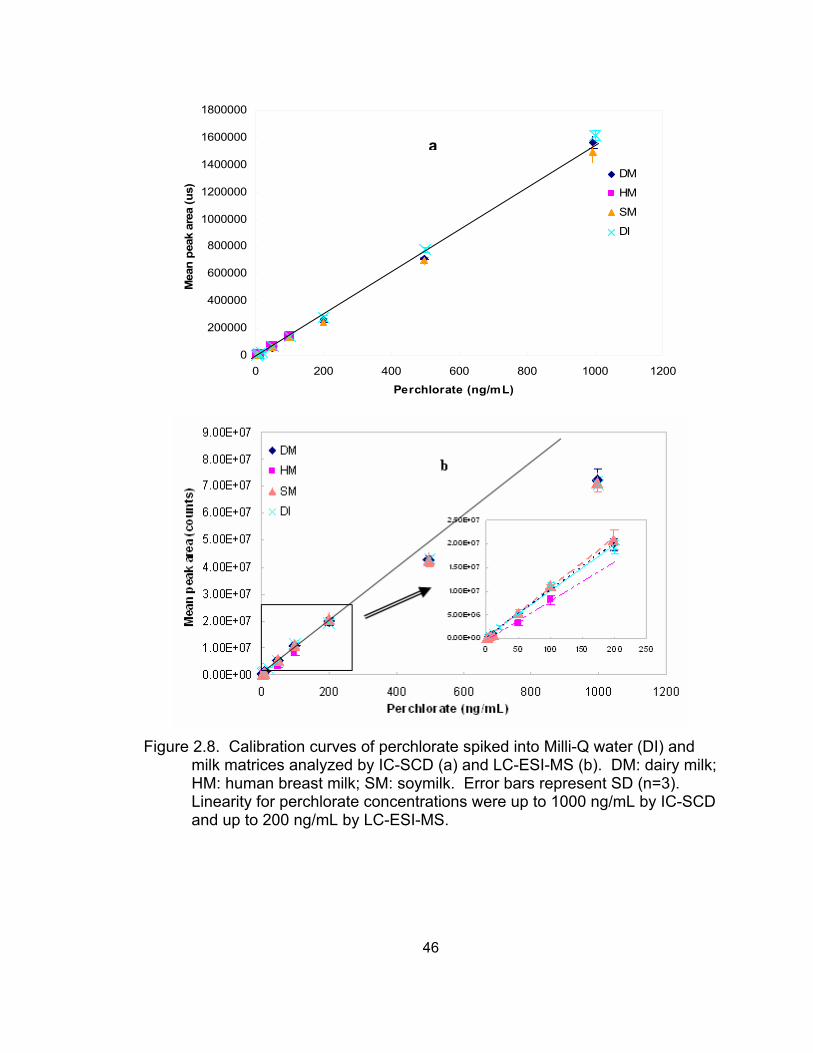
0
200000
400000
600000
800000
1000000
1200000
1400000
1600000
1800000
0 200 400 600 800 1000 1200
Perchlorate (ng/mL)
Mea
n pe
ak a
rea
(us)
aDM
HM
SM
DI
Figure 2.8. Calibration curves of perchlorate spiked into Milli-Q water (DI) and
milk matrices analyzed by IC-SCD (a) and LC-ESI-MS (b). DM: dairy milk; HM: human breast milk; SM: soymilk. Error bars represent SD (n=3). Linearity for perchlorate concentrations were up to 1000 ng/mL by IC-SCD and up to 200 ng/mL by LC-ESI-MS.
46
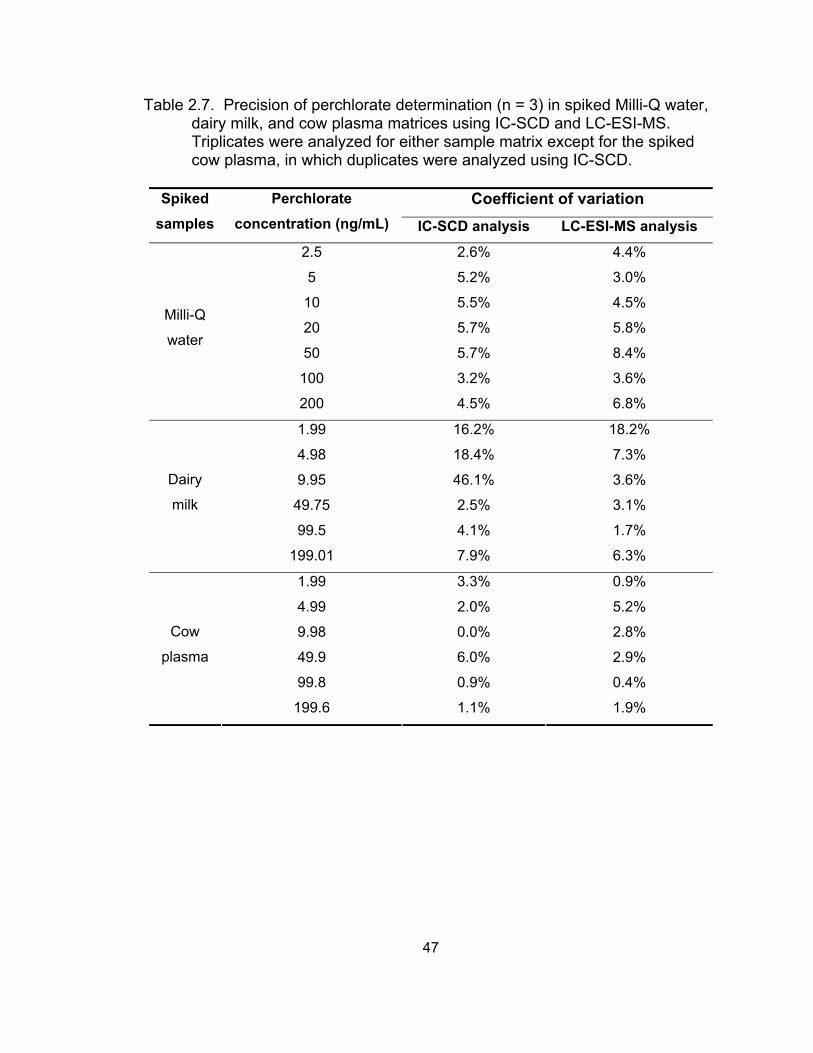
Table 2.7. Precision of perchlorate determination (n = 3) in spiked Milli-Q water, dairy milk, and cow plasma matrices using IC-SCD and LC-ESI-MS. Triplicates were analyzed for either sample matrix except for the spiked cow plasma, in which duplicates were analyzed using IC-SCD.
Coefficient of variation Spiked
samples Perchlorate
concentration (ng/mL) IC-SCD analysis LC-ESI-MS analysis
2.5 2.6% 4.4%
5 5.2% 3.0%
10 5.5% 4.5%
20 5.7% 5.8%
50 5.7% 8.4%
100 3.2% 3.6%
Milli-Q
water
200 4.5% 6.8%
1.99 16.2% 18.2%
4.98 18.4% 7.3%
9.95 46.1% 3.6%
49.75 2.5% 3.1%
99.5 4.1% 1.7%
Dairy
milk
199.01 7.9% 6.3%
1.99 3.3% 0.9%
4.99 2.0% 5.2%
9.98 0.0% 2.8%
49.9 6.0% 2.9%
99.8 0.9% 0.4%
Cow
plasma
199.6 1.1% 1.9%
47
2.4 Perchlorate Determination in Urine Using Ion Chromatography Coupled with
Atmospheric Pressure Ionization Tandem Mass Spectrometry (IC-MS/MS)
2.4.1 Materials and Methods
Reagents and standards
A custom perchlorate (ClO4-) standard solution was purchased from
AccuStandard, Inc. (New Haven, CT). Sodium hydroxide (50%, w/w) aqueous
solution and acetonitrile (HPLC grade) was purchased from Fisher Scientific (Fair
Lawn, NJ). Liquid nitrogen (high purity grade) was purchased from Aeriform
(Lubbock, TX). 18O-perchlorate internal standard (NaCl18O4, 1 mg/L) was
obtained from Dionex (Sunnyvale, CA). All solutions were prepared in 18.2 MΩ
Milli-Q water. Concentrations of the calibration standards ranged from 0.02
ng/mL to 2 ng/mL. 0.1 ng 18O-perchlorate internal standard (10 μL of 10 ng/mL
internal standard) was spiked into each calibration standard or urine sample (0.5
mL) before injection into the IC-MS/MS system.
Ion chromatography
Analyses were conducted with an ion chromatograph coupled with the API
2000TM MS/MS system. The ion chromatography system (Dionex, Sunnyvale,
CA) was equipped with a GP50 gradient pump, AS40 auto-sampler, CD25
conductivity detector, LC30 chromatography oven with rear-loading Rheodyne
injection valve, a 2-mm anion self-regenerating suppressor (ASRS Ultra II)
operating in the external water mode, Rheodyne 6-port valve for matrix diversion,
shielded conductivity cell, and a static mixing “Tee”. Chromeleon® software was
used for system control.
The separation was performed on an IonPac AS20 analytical column (250
mm x 2 mm i.d., Dionex) with an AG20 guard column (50 mm x 2 mm i.d.,
Dionex). Sample was injected using loop injection mode (100 μL loop). NaOH
eluent (45 mM) was used under isocratic conditions at a flow rate of 0.3 mL/min.
48
A suppressor (ASRS Ultra II, Dionex) in external water mode was used to
remove Na+ (54 mA). The retention time of perchlorate was 13.4 min with a total
run time of 16 min.
Mass spectrometry
Applied Biosystems/MDS Sciex API 2000™ triple quadrupole mass
spectrometer (Applied Biosystems/MDS Sciex, Concord, ON, Canada) with a
TurboIonSpray® source was used for the determination of perchlorate.
Operational parameters were as follows: 500 °C source temperature, negative
ion mode, 30.0 psi curtain gas, 50 psi gas supply 1, 75 psi gas supply 2, -4500 V
ion spray voltage, 6 collision gas thichness, -50 V declustering potential, -300 V
focusing potential, -10 V entrance potential, -35 V collision energy, -13.5 collision
exit potential, 150 msec dwell time for each transition, and a 16 min run time.
Multiple reaction monitoring (MRM) mode was used to acquire mass spectral
data. Three transitions were monitored, including 98.9/82.9 (35Cl16O4- →
35Cl16O3-), 100.9/84.9 (37Cl16O4
-→ 37Cl16O3-), and 107.0/89.0 (35Cl18O4
- → 35Cl18O3
-). Analyst® software was used for data acquisition. Highly pure nitrogen
was used as the collision gas.
An on-line 6-port diversion valve was kept in the divert position to divert
matrix ions to waste for the first 10 min, after which the column eluent was
switched into the TurboIonSpray® source for 5 min, during this time perchlorate
was eluted from the column, and then the valve was returned to the original
divert position for the last minute of the run. The matrix diversion technique
diverts non-analyte matrix salts to waste and helps to minimize contamination of
the downstream MS system components. An auxiliary pump supplied post-
column solvent (90% acetonitrile in water) at a flow rate of 0.3 mL/min through
the static mixing “Tee” to the MS throughout the run to improve the electrospray
process efficiency and sensitivity. The column effluent is switched at 10 min of
the run to combine with the post-column solvent about 3 min before perchlorate
49
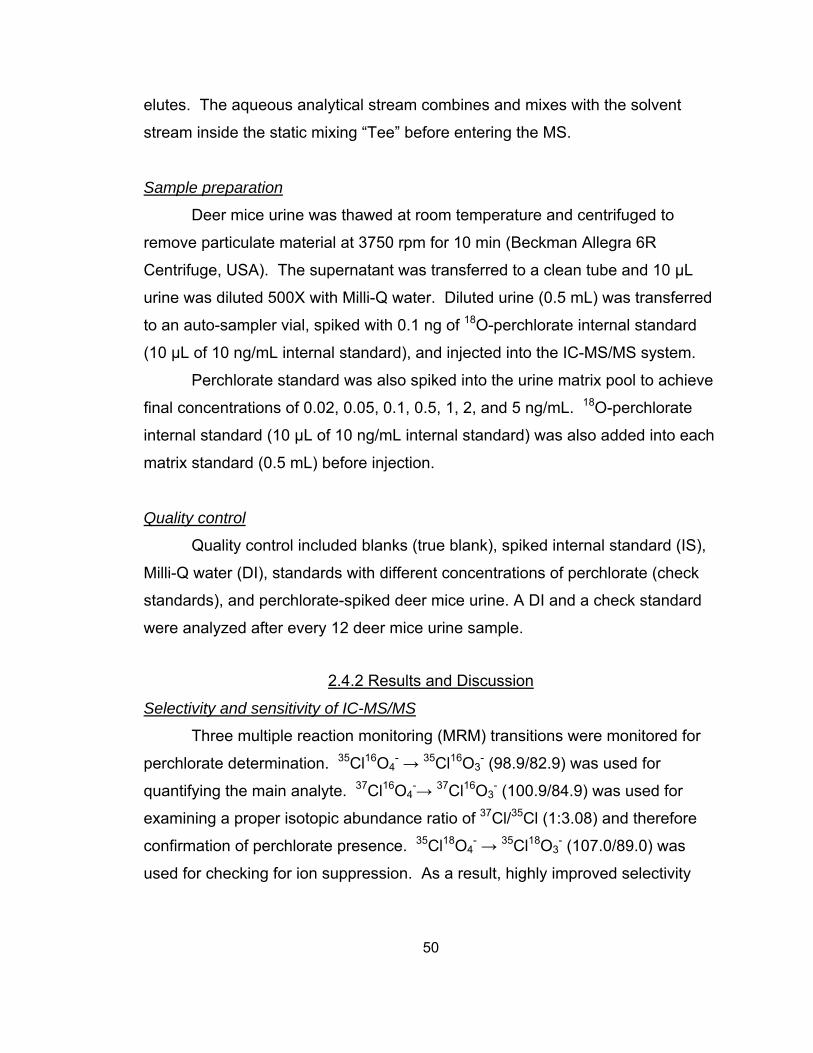
elutes. The aqueous analytical stream combines and mixes with the solvent
stream inside the static mixing “Tee” before entering the MS.
Sample preparation
Deer mice urine was thawed at room temperature and centrifuged to
remove particulate material at 3750 rpm for 10 min (Beckman Allegra 6R
Centrifuge, USA). The supernatant was transferred to a clean tube and 10 μL
urine was diluted 500X with Milli-Q water. Diluted urine (0.5 mL) was transferred
to an auto-sampler vial, spiked with 0.1 ng of 18O-perchlorate internal standard
(10 μL of 10 ng/mL internal standard), and injected into the IC-MS/MS system.
Perchlorate standard was also spiked into the urine matrix pool to achieve
final concentrations of 0.02, 0.05, 0.1, 0.5, 1, 2, and 5 ng/mL. 18O-perchlorate
internal standard (10 μL of 10 ng/mL internal standard) was also added into each
matrix standard (0.5 mL) before injection.
Quality control
Quality control included blanks (true blank), spiked internal standard (IS),
Milli-Q water (DI), standards with different concentrations of perchlorate (check
standards), and perchlorate-spiked deer mice urine. A DI and a check standard
were analyzed after every 12 deer mice urine sample.
2.4.2 Results and Discussion
Selectivity and sensitivity of IC-MS/MS
Three multiple reaction monitoring (MRM) transitions were monitored for
perchlorate determination. 35Cl16O4- → 35Cl16O3
- (98.9/82.9) was used for
quantifying the main analyte. 37Cl16O4-→ 37Cl16O3
- (100.9/84.9) was used for
examining a proper isotopic abundance ratio of 37Cl/35Cl (1:3.08) and therefore
confirmation of perchlorate presence. 35Cl18O4- → 35Cl18O3
- (107.0/89.0) was
used for checking for ion suppression. As a result, highly improved selectivity
50
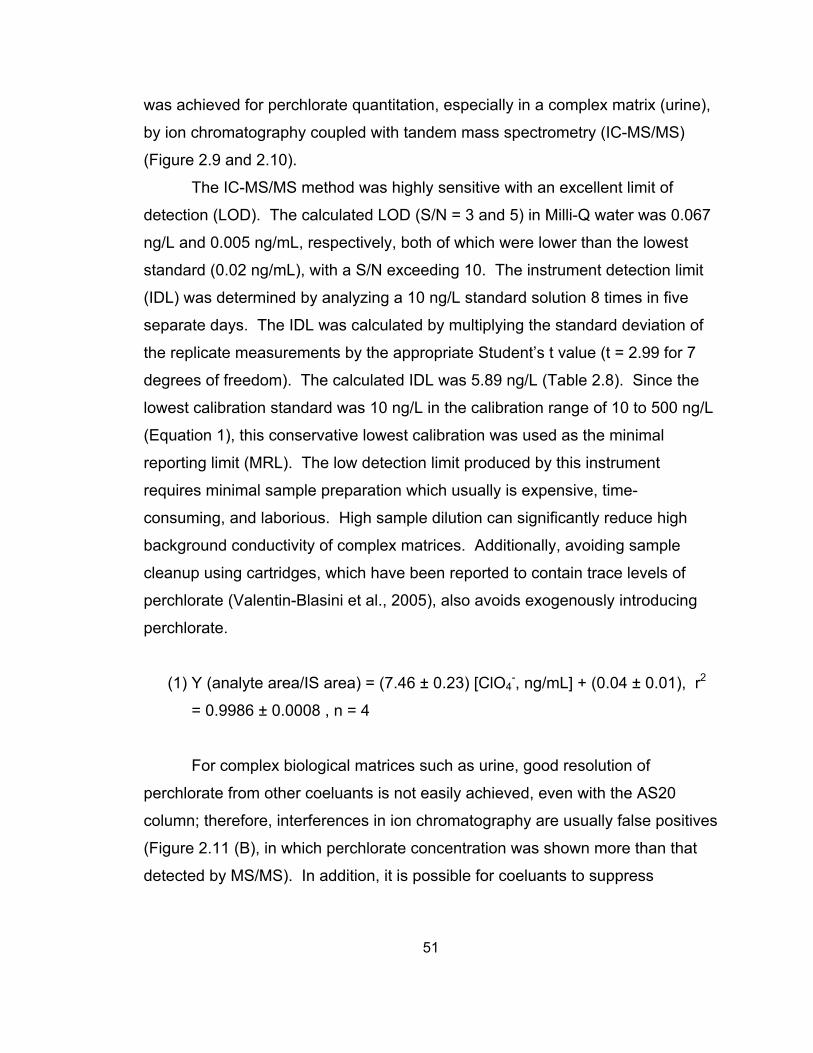
was achieved for perchlorate quantitation, especially in a complex matrix (urine),
by ion chromatography coupled with tandem mass spectrometry (IC-MS/MS)
(Figure 2.9 and 2.10).
The IC-MS/MS method was highly sensitive with an excellent limit of
detection (LOD). The calculated LOD (S/N = 3 and 5) in Milli-Q water was 0.067
ng/L and 0.005 ng/mL, respectively, both of which were lower than the lowest
standard (0.02 ng/mL), with a S/N exceeding 10. The instrument detection limit
(IDL) was determined by analyzing a 10 ng/L standard solution 8 times in five
separate days. The IDL was calculated by multiplying the standard deviation of
the replicate measurements by the appropriate Student’s t value (t = 2.99 for 7
degrees of freedom). The calculated IDL was 5.89 ng/L (Table 2.8). Since the
lowest calibration standard was 10 ng/L in the calibration range of 10 to 500 ng/L
(Equation 1), this conservative lowest calibration was used as the minimal
reporting limit (MRL). The low detection limit produced by this instrument
requires minimal sample preparation which usually is expensive, time-
consuming, and laborious. High sample dilution can significantly reduce high
background conductivity of complex matrices. Additionally, avoiding sample
cleanup using cartridges, which have been reported to contain trace levels of
perchlorate (Valentin-Blasini et al., 2005), also avoids exogenously introducing
perchlorate.
(1) Y (analyte area/IS area) = (7.46 ± 0.23) [ClO4-, ng/mL] + (0.04 ± 0.01), r2
= 0.9986 ± 0.0008 , n = 4
For complex biological matrices such as urine, good resolution of
perchlorate from other coeluants is not easily achieved, even with the AS20
column; therefore, interferences in ion chromatography are usually false positives
(Figure 2.11 (B), in which perchlorate concentration was shown more than that
detected by MS/MS). In addition, it is possible for coeluants to suppress
51
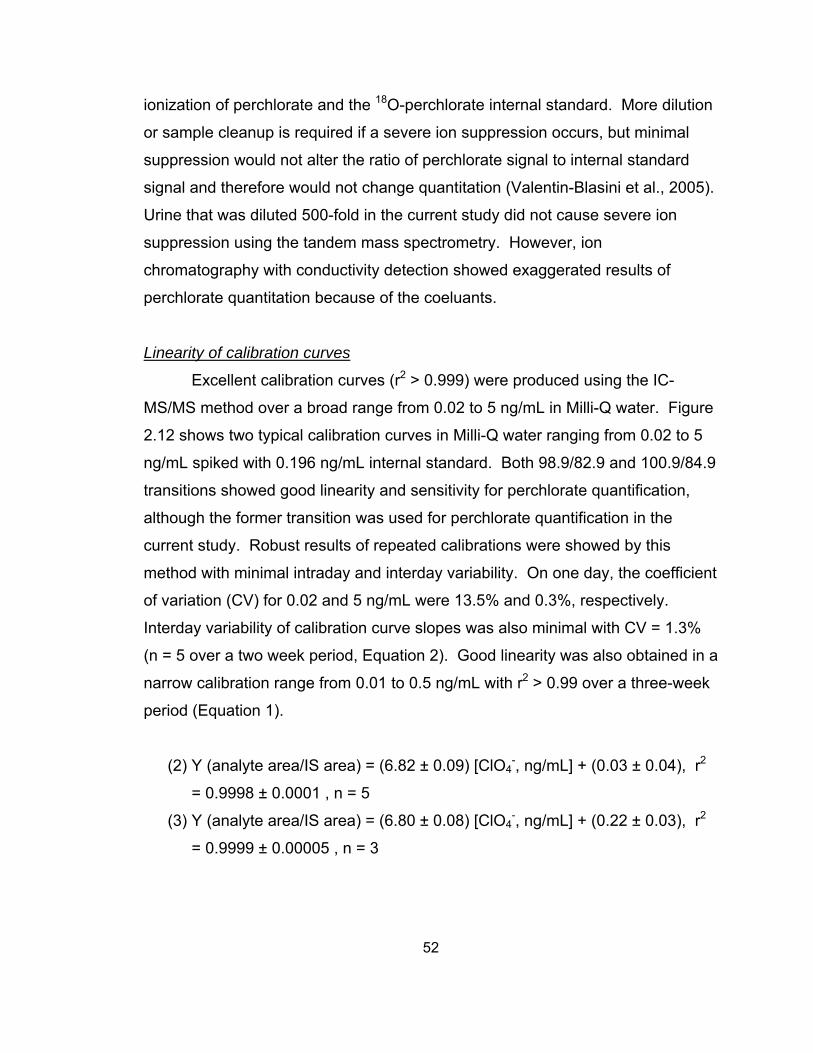
ionization of perchlorate and the 18O-perchlorate internal standard. More dilution
or sample cleanup is required if a severe ion suppression occurs, but minimal
suppression would not alter the ratio of perchlorate signal to internal standard
signal and therefore would not change quantitation (Valentin-Blasini et al., 2005).
Urine that was diluted 500-fold in the current study did not cause severe ion
suppression using the tandem mass spectrometry. However, ion
chromatography with conductivity detection showed exaggerated results of
perchlorate quantitation because of the coeluants.
Linearity of calibration curves
Excellent calibration curves (r2 > 0.999) were produced using the IC-
MS/MS method over a broad range from 0.02 to 5 ng/mL in Milli-Q water. Figure
2.12 shows two typical calibration curves in Milli-Q water ranging from 0.02 to 5
ng/mL spiked with 0.196 ng/mL internal standard. Both 98.9/82.9 and 100.9/84.9
transitions showed good linearity and sensitivity for perchlorate quantification,
although the former transition was used for perchlorate quantification in the
current study. Robust results of repeated calibrations were showed by this
method with minimal intraday and interday variability. On one day, the coefficient
of variation (CV) for 0.02 and 5 ng/mL were 13.5% and 0.3%, respectively.
Interday variability of calibration curve slopes was also minimal with CV = 1.3%
(n = 5 over a two week period, Equation 2). Good linearity was also obtained in a
narrow calibration range from 0.01 to 0.5 ng/mL with r2 > 0.99 over a three-week
period (Equation 1).
(2) Y (analyte area/IS area) = (6.82 ± 0.09) [ClO4-, ng/mL] + (0.03 ± 0.04), r2
= 0.9998 ± 0.0001 , n = 5
(3) Y (analyte area/IS area) = (6.80 ± 0.08) [ClO4-, ng/mL] + (0.22 ± 0.03), r2
= 0.9999 ± 0.00005 , n = 3
52
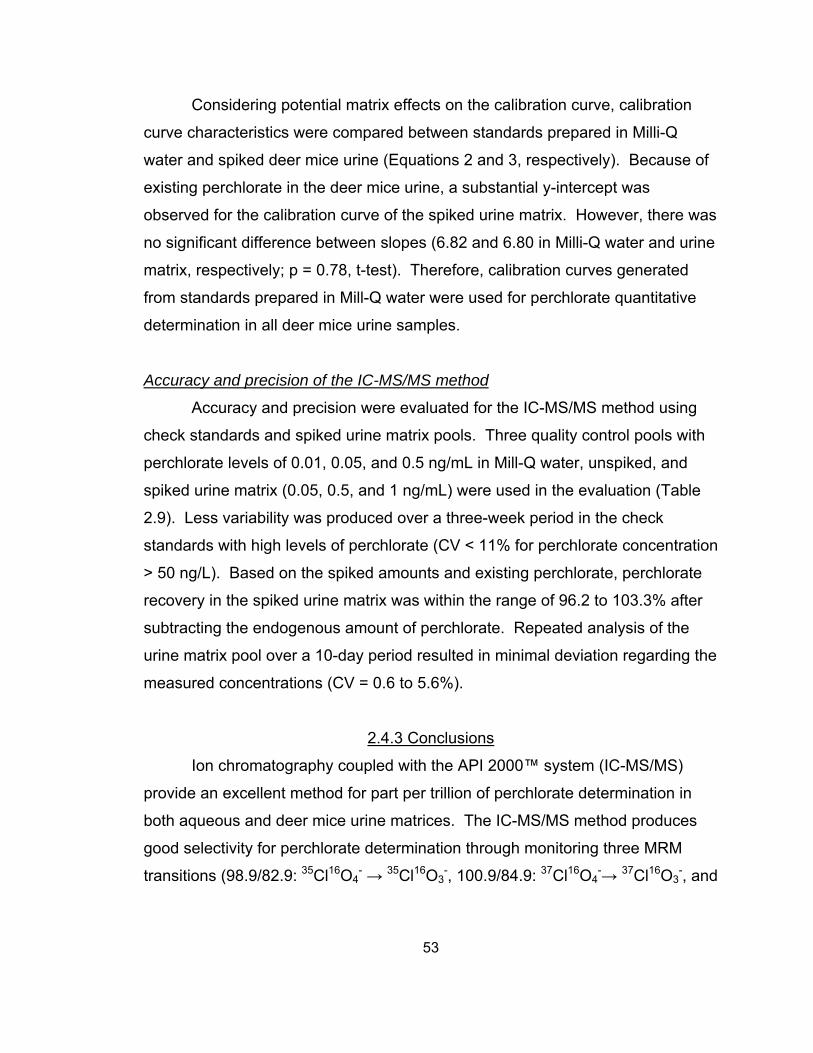
Considering potential matrix effects on the calibration curve, calibration
curve characteristics were compared between standards prepared in Milli-Q
water and spiked deer mice urine (Equations 2 and 3, respectively). Because of
existing perchlorate in the deer mice urine, a substantial y-intercept was
observed for the calibration curve of the spiked urine matrix. However, there was
no significant difference between slopes (6.82 and 6.80 in Milli-Q water and urine
matrix, respectively; p = 0.78, t-test). Therefore, calibration curves generated
from standards prepared in Mill-Q water were used for perchlorate quantitative
determination in all deer mice urine samples.
Accuracy and precision of the IC-MS/MS method
Accuracy and precision were evaluated for the IC-MS/MS method using
check standards and spiked urine matrix pools. Three quality control pools with
perchlorate levels of 0.01, 0.05, and 0.5 ng/mL in Mill-Q water, unspiked, and
spiked urine matrix (0.05, 0.5, and 1 ng/mL) were used in the evaluation (Table
2.9). Less variability was produced over a three-week period in the check
standards with high levels of perchlorate (CV < 11% for perchlorate concentration
> 50 ng/L). Based on the spiked amounts and existing perchlorate, perchlorate
recovery in the spiked urine matrix was within the range of 96.2 to 103.3% after
subtracting the endogenous amount of perchlorate. Repeated analysis of the
urine matrix pool over a 10-day period resulted in minimal deviation regarding the
measured concentrations (CV = 0.6 to 5.6%).
2.4.3 Conclusions
Ion chromatography coupled with the API 2000™ system (IC-MS/MS)
provide an excellent method for part per trillion of perchlorate determination in
both aqueous and deer mice urine matrices. The IC-MS/MS method produces
good selectivity for perchlorate determination through monitoring three MRM
transitions (98.9/82.9: 35Cl16O4- → 35Cl16O3
-, 100.9/84.9: 37Cl16O4-→ 37Cl16O3
-, and
53
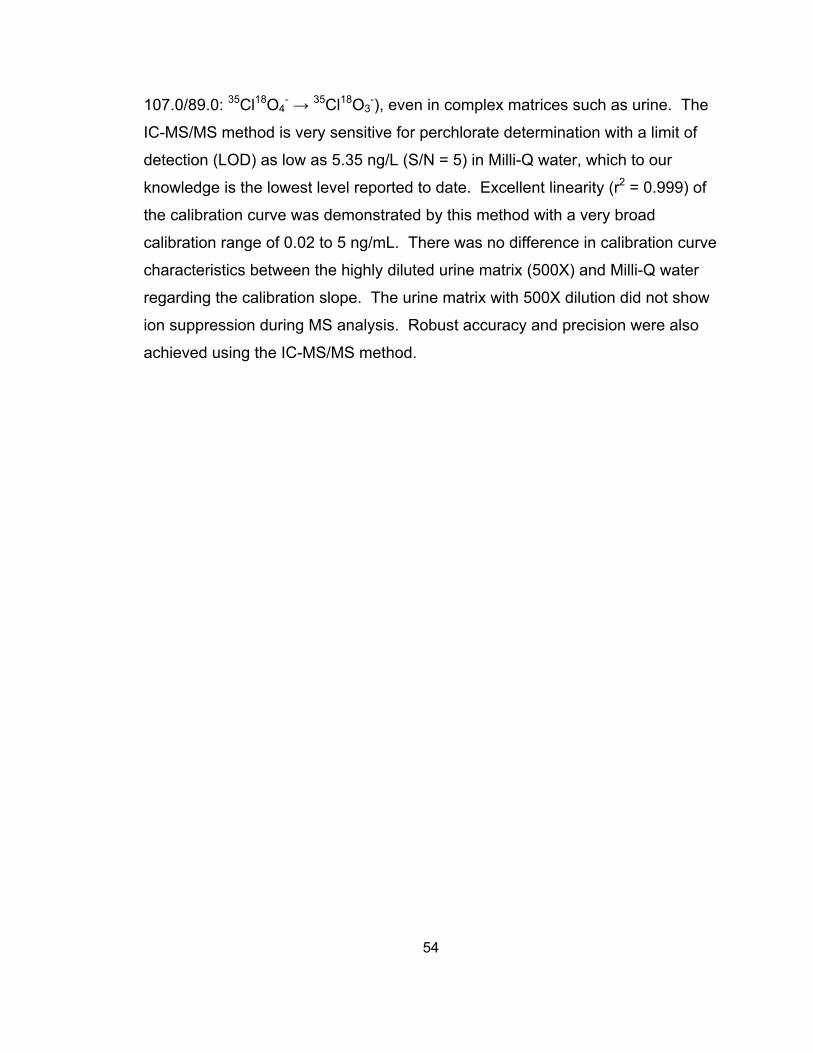
107.0/89.0: 35Cl18O4- → 35Cl18O3
-), even in complex matrices such as urine. The
IC-MS/MS method is very sensitive for perchlorate determination with a limit of
detection (LOD) as low as 5.35 ng/L (S/N = 5) in Milli-Q water, which to our
knowledge is the lowest level reported to date. Excellent linearity (r2 = 0.999) of
the calibration curve was demonstrated by this method with a very broad
calibration range of 0.02 to 5 ng/mL. There was no difference in calibration curve
characteristics between the highly diluted urine matrix (500X) and Milli-Q water
regarding the calibration slope. The urine matrix with 500X dilution did not show
ion suppression during MS analysis. Robust accuracy and precision were also
achieved using the IC-MS/MS method.
54
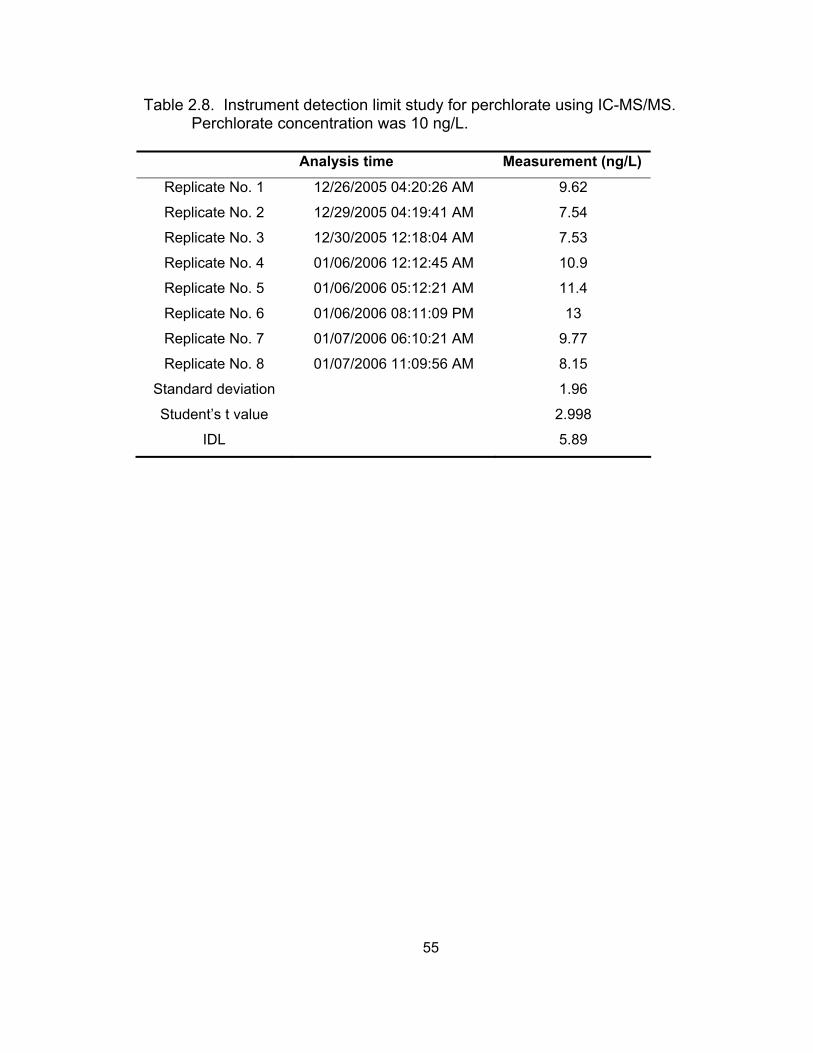
Table 2.8. Instrument detection limit study for perchlorate using IC-MS/MS. Perchlorate concentration was 10 ng/L.
Analysis time Measurement (ng/L)
Replicate No. 1 12/26/2005 04:20:26 AM 9.62
Replicate No. 2 12/29/2005 04:19:41 AM 7.54
Replicate No. 3 12/30/2005 12:18:04 AM 7.53
Replicate No. 4 01/06/2006 12:12:45 AM 10.9
Replicate No. 5 01/06/2006 05:12:21 AM 11.4
Replicate No. 6 01/06/2006 08:11:09 PM 13
Replicate No. 7 01/07/2006 06:10:21 AM 9.77
Replicate No. 8 01/07/2006 11:09:56 AM 8.15
Standard deviation 1.96
Student’s t value 2.998
IDL 5.89
55
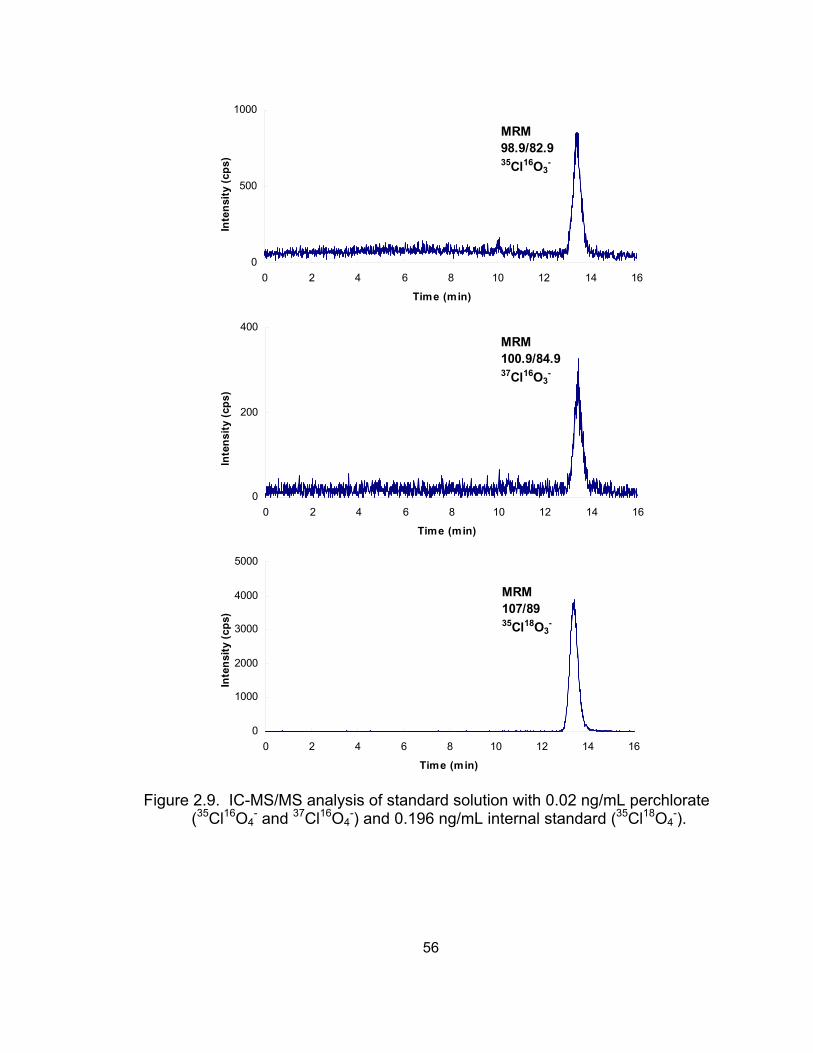
0
500
1000
0 2 4 6 8 10 12 14
Time (min)
Inte
nsity
(cps
)
MRM 98.9/82.935Cl16O3
-
16
0
200
400
0 2 4 6 8 10 12 14
Time (min)
Inte
nsity
(cps
)
MRM 100.9/84.937Cl16O3
-
16
0
1000
2000
3000
4000
5000
0 2 4 6 8 10 12 14 1
Time (min)
Inte
nsity
(cps
)
MRM 107/8935Cl18O3
-
6
Figure 2.9. IC-MS/MS analysis of standard solution with 0.02 ng/mL perchlorate
(35Cl16O4- and 37Cl16O4
-) and 0.196 ng/mL internal standard (35Cl18O4-).
56
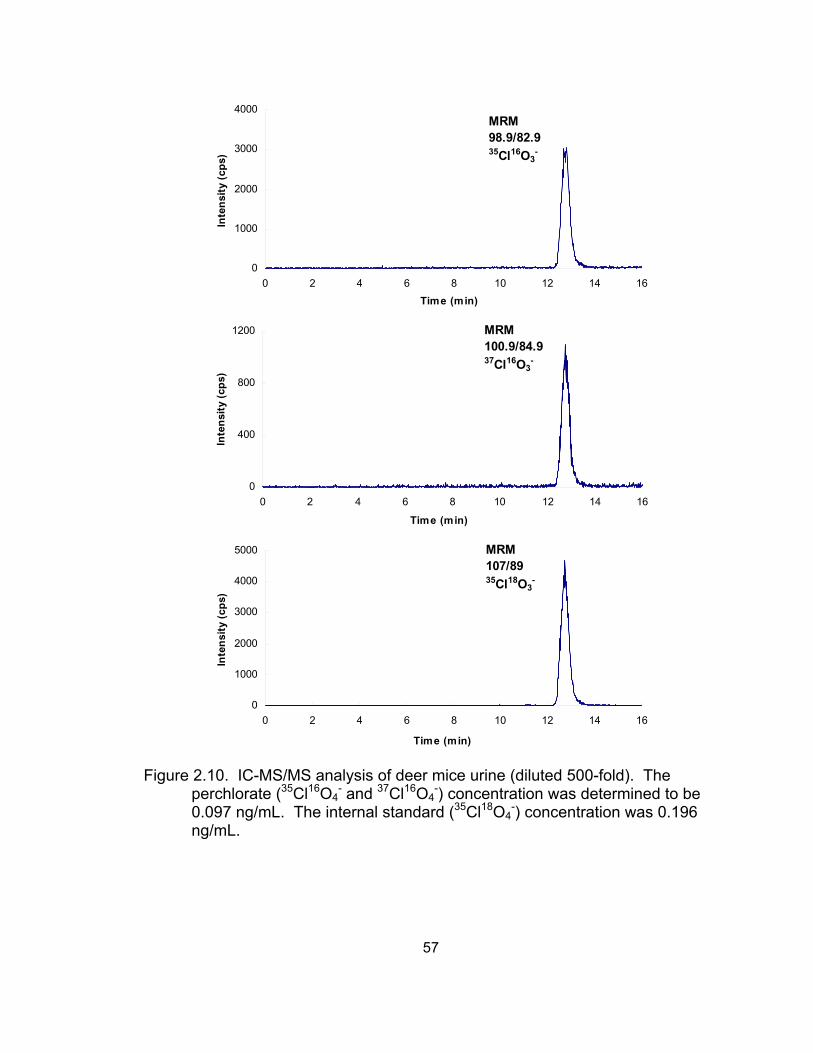
0
1000
2000
3000
4000
0 2 4 6 8 10 12 14 1
Time (min)
Inte
nsity
(cps
)
MRM 98.9/82.935Cl16O3
-
6
0
400
800
1200
0 2 4 6 8 10 12 14 16
Time (min)
Inte
nsity
(cps
)
MRM 100.9/84.937Cl16O3
-
0
1000
2000
3000
4000
5000
0 2 4 6 8 10 12 14 1
Time (min)
Inte
nsity
(cps
)
MRM 107/8935Cl18O3
-
6
Figure 2.10. IC-MS/MS analysis of deer mice urine (diluted 500-fold). The
perchlorate (35Cl16O4- and 37Cl16O4
-) concentration was determined to be 0.097 ng/mL. The internal standard (35Cl18O4
-) concentration was 0.196 ng/mL.
57
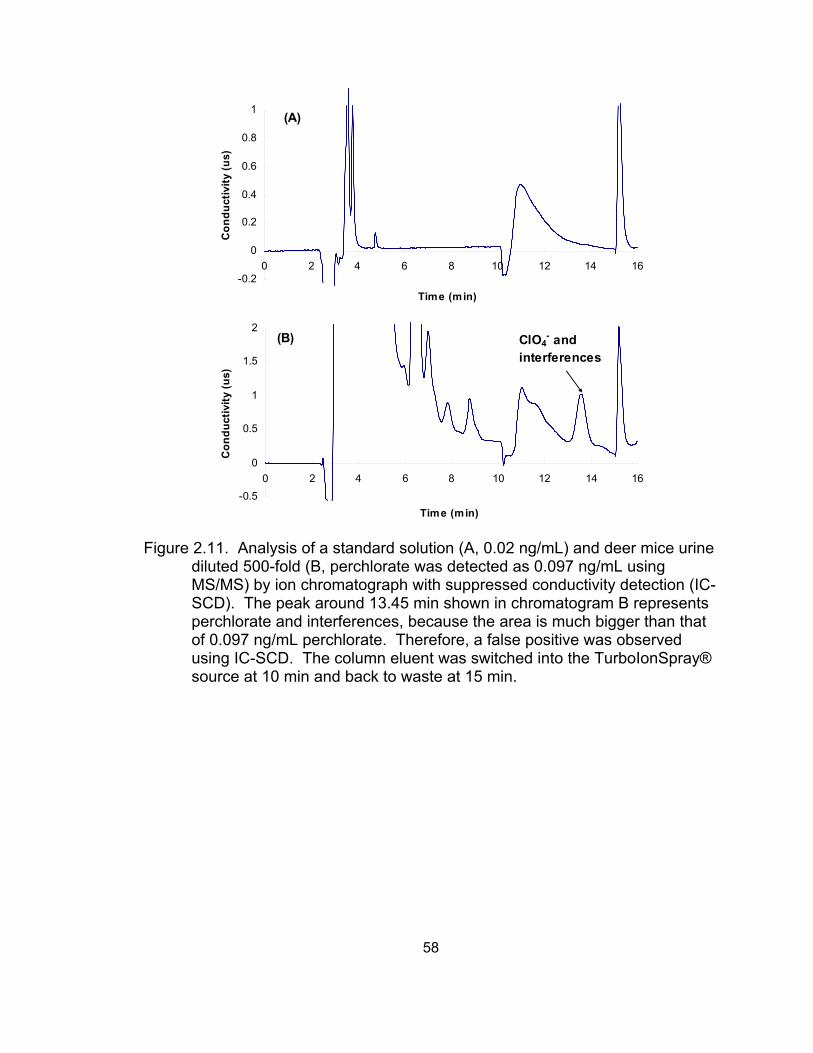
-0.2
0
0.2
0.4
0.6
0.8
1
0 2 4 6 8 10 12 14
Time (min)
Con
duct
ivity
(us)
(A)
16
-0.5
0
0.5
1
1.5
2
0 2 4 6 8 10 12 14
Time (min)
Con
duct
ivity
(us)
ClO4- and
interferences
16
(B)
Figure 2.11. Analysis of a standard solution (A, 0.02 ng/mL) and deer mice urine
diluted 500-fold (B, perchlorate was detected as 0.097 ng/mL using MS/MS) by ion chromatograph with suppressed conductivity detection (IC-SCD). The peak around 13.45 min shown in chromatogram B represents perchlorate and interferences, because the area is much bigger than that of 0.097 ng/mL perchlorate. Therefore, a false positive was observed using IC-SCD. The column eluent was switched into the TurboIonSpray® source at 10 min and back to waste at 15 min.
58
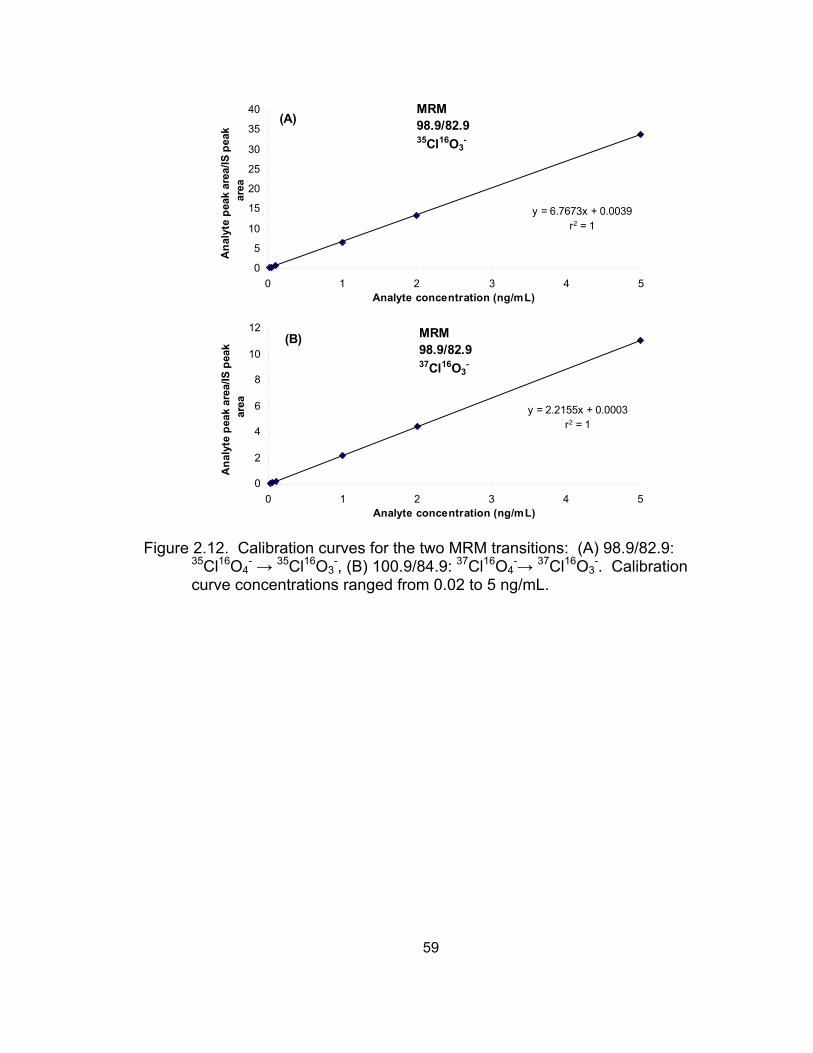
y = 6.7673x + 0.0039r2 = 1
0
5
10
15
20
25
30
35
40
0 1 2 3 4 5Analyte concentration (ng/mL)
Ana
lyte
pea
k ar
ea/IS
pea
k ar
ea
(A)MRM 98.9/82.9 35Cl16O3
-
y = 2.2155x + 0.0003r2 = 1
0
2
4
6
8
10
12
0 1 2 3 4Analyte concentration (ng/mL)
Ana
lyte
pea
k ar
ea/IS
pea
k ar
ea
(B) MRM 98.9/82.9 37Cl16O3
-
5
Figure 2.12. Calibration curves for the two MRM transitions: (A) 98.9/82.9:
35Cl16O4- → 35Cl16O3
-, (B) 100.9/84.9: 37Cl16O4-→ 37Cl16O3
-. Calibration curve concentrations ranged from 0.02 to 5 ng/mL.
59
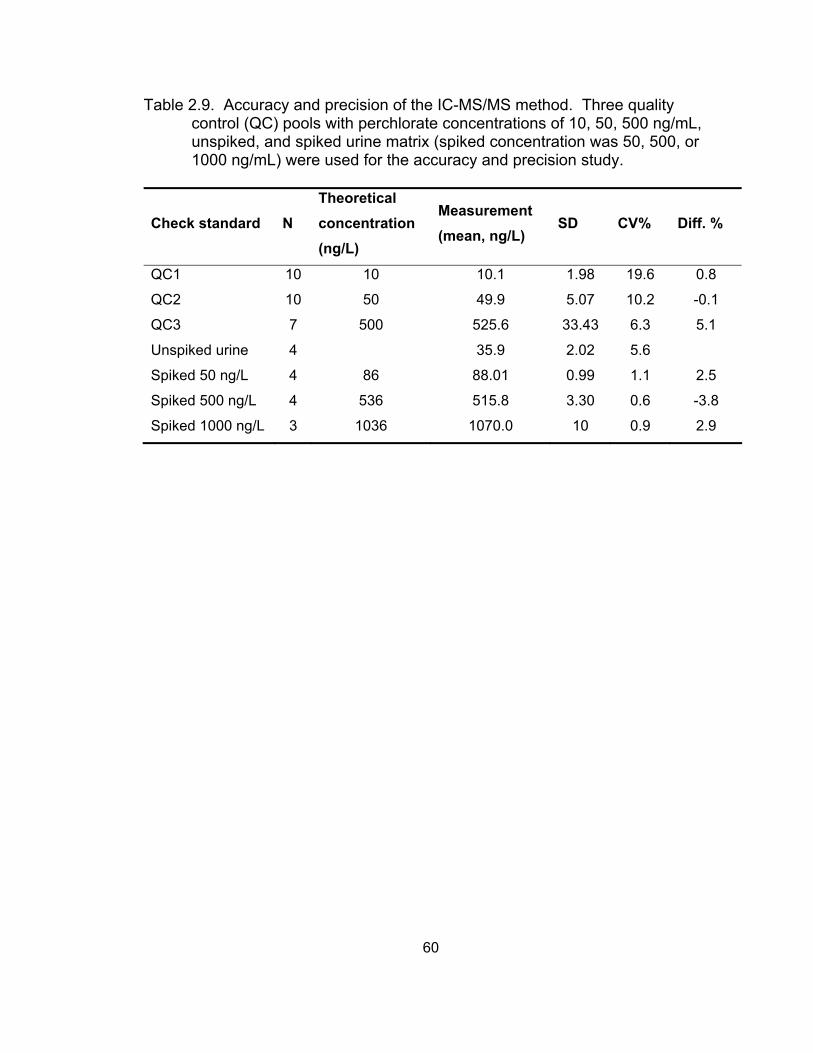
Table 2.9. Accuracy and precision of the IC-MS/MS method. Three quality control (QC) pools with perchlorate concentrations of 10, 50, 500 ng/mL, unspiked, and spiked urine matrix (spiked concentration was 50, 500, or 1000 ng/mL) were used for the accuracy and precision study.
Check standard N Theoretical concentration (ng/L)
Measurement (mean, ng/L)
SD CV% Diff. %
QC1 10 10 10.1 1.98 19.6 0.8
QC2 10 50 49.9 5.07 10.2 -0.1
QC3 7 500 525.6 33.43 6.3 5.1
Unspiked urine 4 35.9 2.02 5.6
Spiked 50 ng/L 4 86 88.01 0.99 1.1 2.5
Spiked 500 ng/L 4 536 515.8 3.30 0.6 -3.8
Spiked 1000 ng/L 3 1036 1070.0 10 0.9 2.9
60
CHAPTER III
ASSESSING PERCHLORATE EXPOSURE TO MAMMALS IN THE FIELD‡
‡: results of this work were published in the Journal of Agricultural and Food Chemistry (Q.
Cheng, L. Perlmutter, P. N. Smith, S. T. McMurry, W. A. Jackson, and T. A. Anderson, 2004, A
Study on Perchlorate Exposure and Absorption in Beef Cattle. 52: 3456-3461)
3.1 Introduction
Once released into the environment, perchlorate can persist for many
decades because of its unique characteristics: extremely water-soluble, mobile in
aqueous systems, and kinetically stable. Perchlorate can be taken up and
accumulated by plants and edible vegetation through irrigation with contaminated
water, fertilization with fertilizer derived from Chilean caliche, or from perchlorate-
contaminated soil (Susarla et al., 2000; Urbansky et al., 2000b; Ellington et al.,
2001; Tan et al., 2004; Yu et al., 2004; Jackson et al., 2005b; Sanchez et al.,
2005). Animals and human beings can be exposed to perchlorate through
ingestion of plants or food containing perchlorate (trophic transfer) and/or through
drinking contaminated water directly.
Perchlorate has been reported in tissues of animals in the vicinity of
contaminated sites. Aquatic organisms have been found to be at a relatively high
risk for perchlorate exposure. In streams and ponds near the Longhorn Army
Ammunition Plant (LHAAP) near Karnack, Texas, perchlorate was detected in
aquatic insects, fish, and frogs at concentrations ranging from 811 to 2038 µg/kg,
below detection to 207 µg/kg, and below detection to 580 µg/kg, respectively
(Smith et al., 2001). Smith et al. (2001) also reported perchlorate concentrations
ranging from below detection to 2328 µg/kg in small mammals (e.g., rodents)
collected from LHAAP. Perchlorate exposure and effects were also investigated
in raccoons at a contaminated site by monitoring perchlorate residues in plasma
and changes of thyroid hormones in the circulation system (blood) (Smith et al.,
2005).
61
Epidemiological studies of perchlorate exposure and effects on humans
have also been conducted (Lamm and Doemland, 1999; Brechner et al., 2000;
Crump et al., 2000; Li et al., 2000a; Li et al., 2000b; Li et al., 2001). In all these
cases, contaminated drinking water was investigated as the source of
perchlorate exposure for humans (neonates and/or school-age children as the
major subjects). However, recently, perchlorate contamination has been found in
supermarket milk samples, human breast milk, and some food items (Kirk et al.,
2003; Krynitsky et al., 2004; Kirk et al., 2005; Valentin-Blasini et al., 2005), which
indicates that humans may be exposed to perchlorate through trophic transfer in
addition to exposure to drinking water. The detection of perchlorate in
supermarket milk samples, human milk, and human urine (Kirk et al., 2003;
Krynitsky et al., 2004; Valentin-Blasini et al., 2005) indicates that environmental
contamination of perchlorate is much more widespread than what was originally
thought in the U.S. and animals and humans are being exposed.
Although many studies have been conducted to assess perchlorate
exposure and effect on plants, animals (both aquatic and terrestrial), and humans
at contaminated sites as mentioned above, there is scarce data on large
mammal (such as dairy and beef cattle) exposure to perchlorate. However, large
mammals present a potential pathway of perchlorate exposure to humans
through trophic transfer and it has been of concern since perchlorate was
reported in some commercial milk samples and other food items (Erickson, 2003;
Kirk et al., 2003; Krynitsky et al., 2004; Kirk et al., 2005). Cattle raised in
impacted areas may be of special importance due to their potential ingestion of
perchlorate both through impacted water and their large intake of forage crops,
which could also contain significant quantities of perchlorate. In some instances,
humans are exposed to perchlorate through similar ways of trophic transfer in
addition to contaminated drinking water. Therefore, an assessment of
perchlorate exposure to large mammals at contaminated sites is necessary and
would contribute to perchlorate risk assessment in the environment and humans.
62
A study on perchlorate exposure and absorption in beef cattle was
conducted. Perchlorate residues in blood plasma and tissues were evaluated in
heifer calves raised on a site impacted by perchlorate. These animals inhabited
areas in central Texas near the Naval Weapons Industrial Reserve Plant
(NWIRP), a facility that produced many kinds of perchlorate-containing products
prior to 1995. Monitoring data indicated that perchlorate was present in some
streams and tributaries near the site (Motzer, 2001). This raised concerns that
wildlife and domestic animals consumed by humans may contain perchlorate
residues and contribute to perchlorate exposure to humans. Perchlorate
residues in blood plasma were also investigated in cattle from two Kansas farms
adjacent to facilities that used or handled perchlorate.
3.2 Materials and Methods
Study description and sample collection in TX
The study was conducted over 14 weeks during the spring of 2003 near
McGregor, McLennan County, Texas. Four Shorthorn heifer calves (~535 lbs.
each) were purchased commercially from an individual seller. All calves were
held for 1 week on the “Reference Site”. Two calves (E1 and E2) were then
separated and sent to a perchlorate-impacted “Treatment Site” while the other
two calves (R1 and R2) remained on the Reference Site. The Reference Site
was a pasture a sufficient distance from NWIRP such that perchlorate was not
present in available on-site surface or groundwater utilized by the cattle, nor was
it present in vegetation. The Treatment Site was a pasture near the NWIRP
boundary with a spring-fed stream bisecting the pasture. Previous monitoring
data for the spring (collected over a 2 year period) indicated that perchlorate was
consistently present in the water (range = 20-60 ng/mL) (unpublished data from
our laboratory). The spring-fed stream served as the only water source for
calves on the Treatment Site. Calves on the Treatment Site also had access to
vegetation (mostly grass) near the stream. We had previously monitored
63
vegetation near the stream (trees and aquatic plants) and showed that
perchlorate levels in leaves varied with species and distance from the stream
(Tan et al., 2004). However, supplemental forage (hay) used during the first 2
weeks of the study on both sites did not contain detectable perchlorate
(unpublished data from our laboratory).
Calves on both sites were visually monitored on a daily basis, and blood
was collected from each animal every 2 weeks. Blood samples were always
collected in the morning (before 9:00 a.m.). Approximately 50 mL of blood was
drawn at each sampling and placed into four sterile EDTA-coated blood
collection vials. The samples were then spun at approximately 3100 rpm for 15
min. Plasma was transferred off and placed in 15-mL falcon tubes. Samples
were stored on dry ice during transport back to the laboratory and frozen (-80 °C)
until analysis. At the time of each blood collection, drinking water that the
animals had access to was also collected and placed on ice during transport
back to the laboratory, where it was stored at 4 °C until analysis.
At the conclusion of the study, animals were processed in a manner
identical to a commercial beef processing operation. The following tissue
samples were obtained from each animal for residue analysis: liver, thyroid, and
various meat cuts (sirloin steak, round steak, T-bone steak, and roast).
Determination of perchlorate
A perchlorate (ClO4-) standard solution was obtained as a custom
standard from AccuStandard, Inc. (New Haven, CT). Sodium hydroxide (NaOH),
50% (w/w) aqueous solution was purchased from Fisher Scientific. All solutions
were prepared in 18.2 MΩ Milli-Q water. Ethanol was purchased from Fisher
Scientific.
Plasma samples were processed using methods similar to those
described previously (Fisher et al., 2000; Anderson and Wu, 2002; Narayanan et
al., 2003) prior to analysis. First, 1 mL of plasma was precipitated with 4 mL of
64
ethanol (ice-cold) and then centrifuged (4 °C) at 3750 rpm for 5 min. The
supernatant was removed, evaporated to dryness under nitrogen, and
reconstituted in 5 mL of Milli-Q water. Samples were then cleaned using alumina
and C18 solid-phase extraction (SPE) cartridges and filtered (0.45 μm) prior to
ion chromatography (IC) analysis.
Tissue samples were also processed prior to IC analysis. Samples (10-20
g) were air-dried and then extracted with Milli-Q water using accelerated solvent
extraction (ASE; Dionex Corp.). Extraction conditions were as follows: pressure
= 1500 psi, temperature = 100 °C, extraction time = 15 min. Sample extract
volumes were measured, diluted (5X), and cleaned with alumina and C18 SPE
cartridges. Eluates were filtered (0.45 μm) prior to IC analysis.
Surface water samples collected from the 2 sites during the course of the
study were filtered (0.45 μm) prior to IC analysis.
All samples (plasma extracts, tissue extracts, and surface water) were
analyzed by ion chromatography similar to EPA Method 314 (Hautman et al.,
1999). Analysis was carried out using a Dionex DX-500 Ion Chromatography
System equipped with a GP50 gradient pump, a CD20 conductivity detector, and
an AS40 automated sampler (Dionex Corp.). PeakNet chromatography software
was used to control the system. Ion separation was made with a Dionex IonPac
AS16 (250-mm X 4.0-mm) analytical column. Conditions for the system were as
follows: flow rate = 1.0 mL/min; eluent = 50 mM sodium hydroxide; injection
volume = 1000 μL. Ion detection was by suppressed conductivity in the external
water mode. A seven-point standard curve was constructed from constant
volume injections of calibration standards of 2.5, 5, 10, 20, 50, 100, 200, and 500
ppb (ng/mL). Computer-generated peak areas were used to measure sample
concentrations in an external standard mode. Quality control (QC) samples
included blanks, matrix spikes, and check standards. Using the analytical
method described above, the detection limits for perchlorate in water, plasma,
and muscle were 1.0 ng/mL, 13.7 ng/mL, and 23.2 ng/g, respectively. Good
65
perchlorate recovery (average recovery of 83.6% ± 2.3) of spiked blood plasma
has been shown in Chapter II (Table 2.1).
3.3 Results and Discussion
Perchlorate in drinking water, blood plasma, and tissues of beef cattle in TX
Perchlorate was not detected in surface water samples collected from the
Reference Site (detection limit = 1.0 ng/mL). In contrast, perchlorate was
detected throughout the study (14 weeks) in water samples from the Treatment
Site (mean ± standard error = 25.4 ± 1.3 ng/mL; n = 8) (Figure 3.1). The
concentrations of perchlorate in water from the Treatment Site during the 14-
week study were consistent with more than 2 years of monitoring data from that
location (unpublished data).
Perchlorate was not detected in blood plasma samples from either calf
occupying the Reference Site (Figure 3.1). Similar results were obtained for the
2 calves on the Treatment Site with one exception; perchlorate was detected (15
ng/mL and 22 ng/mL) in one of the calves on consecutive sampling periods 4 and
6 weeks after the beginning of the study. Perchlorate was not detected
(detection limit = 23.2 ng/g) in any of the tissue samples collected from calves
occupying the Reference Site. In addition, perchlorate was not detected in any of
the tissue samples collected from calves occupying the Treatment Site.
Our results indicate that despite the presence of perchlorate in drinking
water at the Treatment Site, there was little quantifiable perchlorate exposure
measured in blood plasma from heifer calves. Constant exposure to 25 ppb
perchlorate in water over 14 weeks did not result in measurable residues in blood
plasma or edible tissues.
Water intake of cattle is well understood (NRC, 2001). A beef heifer
consumes 20-55 liters of water per day and excretes 75% of that intake (2:1
feces/urine). On the basis of that assumption and the measured drinking water
concentrations, the heifers on the Treatment Site ingested 125-350 μg
66
perchlorate/day. If one makes the assumption that cattle have 60 mL of blood
per kilogram of body weight (Animal-Welfare-Advisory-Committee, 1996), the
expected perchlorate concentration in plasma should be 9-25 ng/mL. This range
is consistent with the 2 detections that were observed (15 and 22 ng/mL).
Perchlorate can be rapidly excreted in urine, with reported urinary
excretion half-lives ranging from 8 to 20 h in rats (Goldman and Stanbury, 1973;
Wolff, 1998; Fisher et al., 2000). Although Batjoens and co-workers (Batjoens et
al., 1993) reported that prolonged perchlorate administration (4 g/day for 10
days) in cows resulted in a longer excretion period in the urine than that with a
single dose, perchlorate accumulation did not occur because of the relatively
rapid excretion. The rapid half-life of perchlorate in mammals contributes to the
difficulty in assessing perchlorate exposure by monitoring blood. Although we
also collected urine from the animals opportunistically, this sample matrix proved
to be difficult for IC analysis by Method 314 at that time, due to a high signal
background.
Perchlorate in contaminated water, blood plasma, and urine from cattle in
Kansas
Perchlorate was detected with greater frequency and at slightly higher
concentrations in blood of cattle from two Kansas farms adjacent to facilities that
used or handled perchlorate (unpublished data from our laboratory). Cattle on
these farms were not restricted to water supplies containing perchlorate (as were
those on the pasture near the NWIRP site), although the water that was
contaminated had higher perchlorate concentrations (>100 ng/mL). Nonetheless,
perchlorate was detected in 4 of 33 and 17 of 26 cattle at the two Kansas farms.
The highest plasma perchlorate concentrations observed in the Kansas cattle
were 43 and 32 ng/mL, respectively. Although perchlorate was detected at
slightly higher concentrations in these animals, thyroid hormone levels were not
different from control (unexposed) cattle (Cheng et al., 2004).
67
There is an increasing concern regarding potential perchlorate exposure
and effect on animals and humans through trophic transfer. Cattle could
potentially ingest perchlorate through both impacted drinking water and forage
crops, which can accumulate perchlorate with bioconcentration factors ranging
from 1.4 to 620 in field and greenhouse studies (Jackson et al., 2005b). Drinking
water was the major source for perchlorate exposure to these cattle, especially
from TX with no perchlorate detectable in supplemental forage (hay) used during
the first 2 weeks of the study. Therefore, it is possible that exposure to
perchlorate through drinking water which contained ~25 ng/mL perchlorate rather
than food did not show high residues in blood plasma. However, it is likely that
overall perchlorate exposure in heifers from the Treatment Site (TX) was higher
than that measured in water as vegetation samples from the Treatment Site also
contained perchlorate (Tan et al., 2004).
The difference in perchlorate concentrations in whole blood vs. plasma
was tested in order to know the location of perchlorate in the blood and whether
the negative result of perchlorate residues in cow plasma was caused by less
perchlorate distributed into plasma. Equal amounts of perchlorate were spiked
into two aliquots of deer mouse whole blood (0.2 mL each). One aliquot was
precipitated with ethanol directly, centrifuged, and the supernatant was
evaporated to dryness, reconstituted with Milli-Q water, and finally was cleaned
with C18 and alumina-neutral cartridges. The other aliquot was centrifuged and
plasma was obtained. The plasma was then processed according to the
procedure used for the first aliquot (precipitated, evaporated, reconstituted, and
cleaned). The final volume of the two cleaned samples was the same.
Perchlorate concentrations determined using IC were 12% higher in the whole
blood sample than in the plasma. Considering the average recovery of 83.6% ±
2.3 with the cleanup method, 12% difference in perchlorate concentration
between whole blood and plasma would not contribute significantly to the
negative results of perchlorate residues in cow plasma.
68
Using the cleanup method and LC-ESI-MS described in Chapter II,
confirmation analysis revealed that one cattle urine sample (total n = 4) from
Kansas contained perchlorate (concentration = 3.45 μg/L after 8X dilution).
Perchlorate was detected in all 4 urine samples using IC-MS/MS described in
Chapter II. We did not detect perchlorate in any of the corresponding cattle
plasma samples (n = 4). Urine would be a more sensitive biomarker for
perchlorate exposure. In addition, perchlorate may deposit in its target tissue
(thyroid) and cause less perchlorate to be retained in the circulation system.
Therefore, perchlorate distribution, excretion, and depuration studies were
conducted and results are presented in next chapter.
3.4 Conclusions
As environmental contamination of perchlorate is more widespread, and
animals and humans have been exposed, an assessment of perchlorate
exposure to large mammals at contaminated sites becomes important and
necessary. Information gathered contributes to perchlorate risk assessment in
the environment and to humans. Constant exposure to 25 ng/mL perchlorate in
water over 14 weeks did not result in measurable residues in blood plasma or
edible tissues of cattle at the first test site (McLennan County, Texas). However,
perchlorate was detected in 4 of 33 and 17 of 26 cattle at the two Kansas farms
with the highest plasma perchlorate concentrations of 43 and 32 ng/mL,
respectively. Because of excretion via urine or other pathways, urine could be a
sensitive biomarker for perchlorate exposure to animals and humans. In
addition, perchlorate may deposit in its target tissue (thyroid) and thus less
perchlorate would remain in the circulation system. Therefore, perchlorate
residues in plasma may not be a proper biomarker for perchlorate exposure
assessment.
69
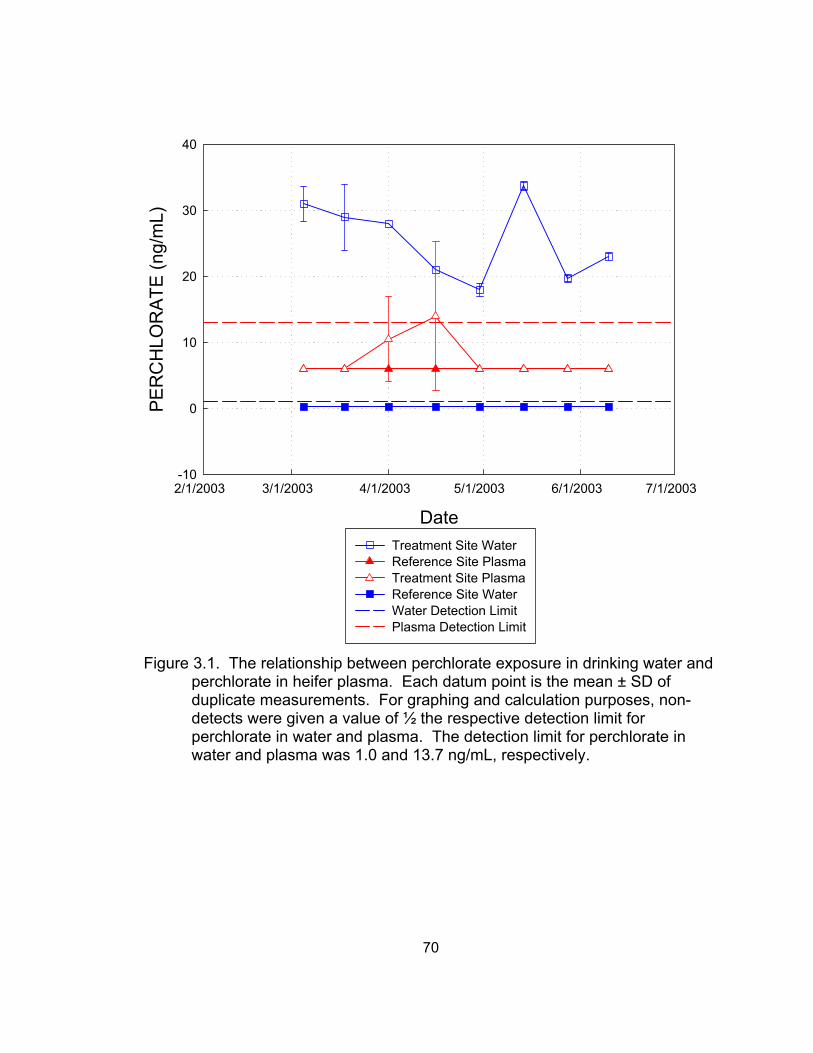
Date
2/1/2003 3/1/2003 4/1/2003 5/1/2003 6/1/2003 7/1/2003
PER
CH
LOR
ATE
(ng/
mL)
-10
0
10
20
30
40
Treatment Site WaterReference Site PlasmaTreatment Site PlasmaReference Site WaterWater Detection LimitPlasma Detection Limit
Figure 3.1. The relationship between perchlorate exposure in drinking water and
perchlorate in heifer plasma. Each datum point is the mean ± SD of duplicate measurements. For graphing and calculation purposes, non-detects were given a value of ½ the respective detection limit for perchlorate in water and plasma. The detection limit for perchlorate in water and plasma was 1.0 and 13.7 ng/mL, respectively.
70
CHAPTER IV
PERCHLORATE DISTRIBUTION AND EXCRETION IN LABORATORY
ANIMALS
4.1 Introduction
Environmental contamination of perchlorate (ClO4-) appears to be
widespread in the United States, especially in aqueous systems. Perchlorate
can be taken up by and accumulated in vegetation. Animals, including humans,
can be potentially exposed to perchlorate through drinking water and/or trophic
transfer. Evidence of the presence of perchlorate in commercial milk, human
milk, human urine, and some food items (Kirk et al., 2003; Krynitsky et al., 2004;
Valentin-Blasini et al., 2005) exists in the scientific literature.
Many studies have shown that perchlorate is taken up by the thyroid.
Using labeled perchlorate, Anbar et al. (1959) found the highest concentration in
the thyroid, followed by ova and blood in rats and rabbits. Peña et al. (1976)
reported the greatest concentration in the thyroid, followed by gizzard lining at 3
hours after a single injection of K36ClO4 in hens. Chow et al. (1969; 1970)
demonstrated relative thyroid concentrations of perchlorate were much greater
than other organs in rats and guinea pigs. The perchlorate ion was concentrated
in rat thyroid but not in skeletal muscle, and the radioactive ClO4- concentration in
the thyroid was negatively related to the doses of stable perchlorate received.
Yu et al. (2002) reported that perchlorate appeared to be actively sequestered
into the thyroid gland, gastrointestinal tract, and possibly the skin of rats.
Narayanan et al. (2003) also found that the highest concentration of perchlorate
was in the thyroid, followed by milk, amniotic fluid, and serum in pregnant and
lactating rats dosed with 10 mg/kg perchlorate through drinking water from
gestation day 2 until either gestation day 20 or postnatal day 10.
Perchlorate does not appear to be metabolized in the body and compared
to the portion taken up by the thyroid, a major portion of perchlorate can be
71
excreted from the body primarily into urine with half-lives varying from < 8 h to
~20 h in rats (Wolff, 1998). Goldman and Stanbury (1973) reported that
perchlorate was taken up by the thyroid in rats, reached a peak around 4 h, and
then fell to approximately 5% of the peak value within 95 h with a half-life of 20 h.
Peña et al (1976) found that 87.6% and 99.4% of 36ClO4- was recovered in
excreta 3 h and 24 h, respectively, after administration in hens. The largest total
deposition in the 3 h group was found in the blood (2.9%), followed by muscles,
internal organs, and ova. In a study by Yu et al. (2002), very high recovery of
perchlorate (99.5%) was obtained in urine from male rats; 95% of administered
perchlorate was cleared in 55 to 75 h. In cattle, perchlorate was also excreted in
the urine at a concentration-related elimination rate after oral administration of a
single dose (Batjoens et al., 1993). The study also showed that prolonged
perchlorate administration (4 g/day for 10 days) resulted in a longer excretion
period in the urine. In humans, Lamm et al. (1999) reported that urinary
perchlorate concentration increased during a “work” exposure time with a
decrease between the 12-hour work shifts. The average perchlorate elimination
half-lives of post-exposure for low- and medium-exposure groups were 7.9 and
8.2 hours, respectively. In a low-dose short-term study (10 mg/day perchlorate
for 14 days), urinary perchlorate markedly increased and reached a level of ~7.6
mg per 24 hours at 7 and 14 days (Lawrence et al., 2000). Greer et al. (2002)
determined that post-exposure half-lives ranged from 6.0 to 9.3 h for eight
volunteers who drank water at a dosage of 0.5 mg/kg-day for two weeks.
Perchlorate has also been observed to be excreted via milk. Perchlorate
has been found in both commercial milk samples and human breast milk (Kirk et
al., 2003; Kirk et al., 2005). In a perchlorate dosing study with lactating goats
(Kirk, 2005), perchlorate was detected in milk at higher concentrations 2-h post-
dose than 24-h post-dose. Generally, perchlorate concentrations in goat milk
collected at 24 h after dosing decreased after week one through week four.
Following a 20-h infusion interval of perchlorate into dairy cow rumen everyday
72
for 5 weeks, perchlorate was detected at a constant level in milk and urine during
the 5 weeks, with much higher levels of perchlorate in the urine (Capuco et al.,
2005).
In many of the aforementioned studies, the highest perchlorate
concentration was reported in the thyroid, but the perchlorate distribution pattern
in other tissues was not consistent. To a large degree, adverse effects of
perchlorate on vertebrates depend on uptake, distribution, and excretion in the
body. Fundamental questions such as whether perchlorate accumulates in the
body, how is perchlorate distributed among tissues, and what are the excretion
and elimination patterns via urine will help to determine whether perchlorate
exposure causes adverse human health effects or ecological impacts.
Therefore, a tissue distribution study of perchlorate in voles and perchlorate
excretion and elimination studies in deer mice were conducted. Prairie voles
(Microtus ochrogaster) provide a useful mammalian herbivore model of
contaminant exposure and toxicity. Deer mice (Peromyscus maniculatus) are the
most abundant and widely distributed rodents in North America (Joyner et al.,
1998) and are considered to be highly relevant to ecological risk assessment of
environmental contaminants. Both species are used as terrestrial wildlife
receptors for environmental contaminant risk assessment.
The hypotheses tested included (1) urine is the major pathway through
which perchlorate is excreted; (2) perchlorate excretion is dose-dependent: high
perchlorate exposure levels correspond to high excretion levels in urine; (3)
perchlorate is depurated rapidly via urine.
4.2 Materials and Methods
Chemicals
A custom perchlorate (ClO4-) standard solution was obtained from
AccuStandard, Inc. (New Haven, CT). Magnesium perchlorate, sodium
perchlorate (reagent grade anhydrous), and sodium hydroxide (NaOH, 50%
73
(w/w)) aqueous solution were purchased from Fisher Scientific. All solutions
were prepared in 18.2 MΩ Milli-Q water. Ethanol and acetonitrile (HPLC grade)
were also purchased from Fisher Scientific. 18O-perchlorate internal standard
(NaCl18O4, 1 mg/L) was obtained from Dionex (Sunnyvale, CA).
Animals
Male adult prairie voles (Microtus ochrogaster) (42.9 ± 7 g) used
throughout the distribution experiment were obtained from the breeding colony,
Texas Tech University (Lubbock, TX). Male adult deer mice (Peromyscus
maniculatus) (18.5 ± 1.8 g) used in the excretion and elimination studies were
provided by Dr. Michael Hooper’s breeding colony, Texas Tech University
(Lubbock, TX).
Distribution experiment
Ten voles were arbitrarily placed into 10 different metabolic cages at 8:00
pm on the first day with no food or water. The size of the cage was 233 mm D.I.
X 103 mm H with a wire-mesh bottom. Reference urine and feces were collected
from the metabolic cages between 7:30 am and 8:00 am on the second day. At
8:00 am, upon completion of collection of reference materials, all voles were
randomly assigned to either a 4-h or 8-h dosing period (five voles for each
group), with oral access to 250 μg/mL magnesium perchlorate in water via pre-
weighed water bottles. The 4-h group was dosed from 8:00 am to 12:00 pm. At
the end of the 4 hours, water bottles were removed from metabolic cages and
weighed. Voles were euthanized using a carbon dioxide chamber and
necropsied to obtain blood, liver, kidney, and thyroid tissues. The blood was
centrifuged to collect plasma. All samples were stored on dry ice until
transported to The Institute of Environmental and Human Health where they were
stored at -80 °C until analysis. Urine and feces were collected from the cages
upon completion of the necropsy. The other five voles (8-h group) were dosed
74
from 8:00 am to 4:00 pm and then processed as described above for the 4-h
group.
Excretion experiment
Twenty-four deer mice were arbitrarily assigned into four groups (one
control and three treatments: low, medium, and high). Siblings were placed in
different groups. Animals were housed individually in metabolic cages held by
two racks (4 groups X 3 cages per rack) and animals in the same treatment
group were placed arbitrarily on the racks. Animals were allowed to acclimate for
two days in the cages to test facility conditions of room temperature (ranging
from 65 – 78 °F), 25 – 75% relative humidity, and 12:12 h of dark:light prior to
initiation of dosing. Animals were exposed to perchlorate daily through drinking
water for four consecutive weeks (sodium perchlorate dissolved in Milli-Q water).
Mice in the control group were given Milli-Q water without perchlorate throughout
the study. Urine samples were initially collected at 8, 16, 24, 36, 48, 72, and 96
h, and then were collected every 24 hours up to day 8. After day 8, urine was
collected every two or three days until the end of the study. Reference urine was
collected before treatment initiation. Food and water were provided ad libitum
and checked daily. Water consumption was recorded at each urine collection.
Perchlorate concentrations in the dosed drinking water (low, medium, and high)
were 17, 165, and 1600 ng/mL, respectively. Deer mouse body weights were
recorded before treatment and each week during the exposure to monitor any
weight changes. Metabolic cages were replaced (cleaned) weekly.
At end of the exposure experiment (day 29), animals were weighed,
anesthetized with carbon dioxide, bled via heart puncture, and euthanized by
exsanguination. At necropsy, the following tissues were collected: kidney liver,
intestinal tract, and stomach. Blood samples were placed in EDTA-rinsed tubes,
centrifuged, and plasma was collected. All tissues, plasma, and carcasses were
placed on dry ice after collection and during transport to the laboratory, where
75
they were stored at – 80 °C until gene expression analysis (presented in Chapter
V).
Depurtion experiment
Twelve deer mice were arbitrarily assigned into two groups (low dose and
high dose). Siblings were placed in different groups. Animals were housed
individually in 12 metabolic cages placed arbitrarily on one rack. Animals were
allowed to acclimate for two days in the cages to test facility conditions of room
temperature (ranging from 65 – 78 °F), 25 – 75% relative humidity, and 12:12 h
of dark:light prior to initiation of dosing. Animals were dosed with perchlorate
through drinking water over 8 hours (sodium perchlorate dissolved in Milli-Q
water). After the exposure period and throughout the “elimination phase” of the
study, Milli-Q water rather than perchlorate-contaminated water was given to the
animals. Urine samples were collected at 8, 16, 24, 36, 48, 72, and 96 hours
after treatment. Reference urine was collected before treatment initiation. Food
and water were provided ad libitum and checked every day. Water consumption
was recorded at each urine collection. Perchlorate concentrations in the drinking
water were 17 and 1600 ng/mL in the low and high dose groups, respectively.
Body weights were recorded before treatment and at the end of the study (day
4).
Perchlorate determination method
An ion chromatography (IC) method similar to EPA Method 314 was used
to determine perchlorate residues in the distribution experiment. The IC method
was shown to be capable of detecting perchlorate in water, plasma, and muscle
at 1.0 ng/mL, 13.7 ng/mL, and 23.2 ng/g, respectively (Chapter II). The
chromatography was performed by a Dionex DX-500 Ion Chromatography
System equipped with a GP50 gradient pump, a CD20 conductivity detector, and
an AS40 automated sampler (Dionex Corp.). PeakNet® chromatography
76
software was used to control the system. Ion separation was made with a
Dionex IonPac AS16 (250 mm x 4.0 mm) analytical column. Conditions for the
system were as follows: flow rate = 1.0 mL/min; eluent = 50 mM sodium
hydroxide; injection volume = 1000 µL. Ion detection was by suppressed
conductivity in the external water mode.
Before IC analysis, tissue samples (liver, kidney, and thyroid) were air
dried and then extracted with Milli-Q water using Accelerated Solvent Extraction
(ASE; Dionex Corp.). Sample extract volumes were measured, diluted, and
cleaned with C18 and alumina SPE cartridges. Eluates were filtered (0.45 μm)
prior to IC analysis.
Plasma samples were also processed prior to analysis. Plasma was
precipitated with ethanol (ice-cold) and then centrifuged (4 °C) at 3750 rpm for 5
min. The supernatant was removed, evaporated to dryness under nitrogen, and
reconstituted in 5 mL Milli-Q water. Samples were cleaned with C18 and
alumina, and then filtered prior to ion chromatography (IC) analysis. Urine
samples were diluted 2500X with Milli-Q water, filtered, and then analyzed using
the IC.
Perchlorate determination in deer mice urine in the excretion and
depuration experiments was conducted with an ion chromatograph coupled with
the API 2000TM MS/MS system. The ion chromatography system (Dionex,
Sunnyvale, CA) was equipped with a GP50 gradient pump, AS40 auto-sampler,
CD25 conductivity detector, LC30 chromatography oven with rear-loading
Rheodyne injection valve, a 2-mm anion self-regenerating suppressor (ASRS
Ultra II) operated in the external water mode, Rheodyne 6-port valve for matrix
diversion, shielded conductivity cell, and a static mixing “T”. Chromeleon®
software was used for system control. The separation was performed with an
IonPac AS20 analytical column (250 mm x 2 mm i.d., Dionex) with an AG20
guard column (50 mm x 2 mm i.d., Dionex). Sample was injected using loop
injection mode (100 μL loop). NaOH eluent (45 nM) was used under isocratic
77
conditions at a flow rate of 0.3 mL/min. A suppressor (ASRS Ultra II, Dionex) in
external water mode was used to remove Na+ (54 mA). The retention time of
perchlorate was 13.4 min with a total run time of 16 min.
Applied Biosystems/MDS Sciex API 2000™ triple quadrupole mass
spectrometer (Applied Biosystems/MDS Sciex, Concord, ON, Canada) with a
TurboIonSpray® source was used for perchlorate determination. The operational
parameters were as follows: 500 °C source temperature, negative ion mode, 30.0
psi curtain gas, 50 psi gas supply 1, 75 psi gas supply 2, -4500 V ion spray
voltage, 6 collision gas thichness, -50 V declustering potential, -300 V focusing
potential, -10 V entrance potential, -35 V collision energy, -13.5 collision exit
potential, 150 msec dwell time for each transition, and 16 min as running time.
Highly pure nitrogen was used as the collision gas. Multiple reaction monitoring
(MRM) mode was used to acquire mass spectral data. Three transitions were
monitored, including 98.9/82.9 (35Cl16O4- → 35Cl16O3
-), 100.9/84.9 (37Cl16O4-→
37Cl16O3-), and 107.0/89.0 (35Cl18O4
- → 35Cl18O3-). Analyst® software was used
for data acquisition.
An on-line 6-port diversion valve was kept in the divert position to divert
matrix ions to waste for the first 10 min, after which the column eluent was
switched into the ionization source for the next 5 min, during this time perchlorate
eluted from the column, and then the valve switched back to the original divert
position for the last minute of the run. The matrix diversion technique diverts
non-analyte matrix salts to waste and helps to minimize contamination of the
downstream MS system components. An auxiliary pump supplies post-column
solvent (90% acetonitrile in water) at a flow rate of 0.3 mL/min through the static
mixing “Tee” to the MS throughout the run to improve the electrospray process
efficiency and sensitivity. The column effluent is switched at 10 min in the run to
combine with the post-column solvent about 3 min before perchlorate elutes.
The aqueous analytical stream combines and mixes with the solvent stream
inside the static mixing “Tee” before entering the MS.
78
Deer mouse urine was thawed at room temperature and centrifuged (3750
rpm for 10 min) to remove particulate material (Beckman Allegra 6R Centrifuge,
USA). The supernatant was transferred to a clean tube and 10 μL was diluted
(500 x) with Milli-Q water. Diluted urine (0.5 mL) was transferred to an auto-
sampler vial, spiked with 0.1 ng of 18O-perchlorate internal standard (10 μL of 10
ng/mL internal standard), and injected into the IC-MS/MS system. Quality control
samples included blanks, spiked matrix, and check standards. Blank and check
standards were analyzed after every 15 samples during the IC-MS/MS analyses
to assure that perchlorate recovery was between 80 – 120%; 96 – 103%
perchlorate was recovered in the spiked matrix (Table 2.9 in Chapter II).
Statistical analysis
Statistical analyses were performed using R software (version 2.1.1, Free
Software Foundation, Boston, MA). Normality and homogeneity of variance of
the data were tested using Sharpiro-Wilk normality test and Bartlett’s test,
respectively. Two-tailed t-tests were conducted to test differences in water
consumption, urine production, and perchlorate recovery in vole tissues, plasma,
and urine in the distribution experiment. Two-tailed t-tests were also conducted
to test differences in perchlorate intake and urine residues in the depuration
experiment. Correlation analysis was conducted to test the relationship between
perchlorate residues in tissues, plasma, or urine and perchlorate intake. One-
way ANOVA was used to test differences in water consumption, body weight,
perchlorate concentration in urine, and mass percentage of the total intake
through drinking water excreted into urine (within different treatments and at each
sampling time) in the excretion experiment. An α = 0.05 was used for all tests.
Exponential non-linear regressions were modeled using Excel®.
79
4.3 Results and Discussion
Perchlorate distribution in voles
There was no difference between groups regarding water consumption
and body weight, but there was an individual in the 4-h group that drank an
excessive amount of water which resulted in much higher perchlorate intake; that
individual was not included in data analysis. Excluding that individual datum,
perchlorate intake in the 4-h group was significantly lower than that in the 8-h
group (28.8 ± 6.5 μg/g bw vs. 31.1 ± 5.4 μg/g bw, p < 0.001). But the rate of
perchlorate intake was higher in the 4-h than in the 8-h group (7.2 μg/g bw/hr vs.
3.9 μg/g bw/hr), with the majority of water consumed in the first 4 hours. Higher
perchlorate was detected in urine with average concentrations of 351 and 490
μg/mL in the 4- and 8-h groups, respectively, followed by plasma (48.4 and 40.2
μg/mL, respectively), thyroid (12.4 and 8.1 μg/g, respectively), feces (2.1 and 2.2
μg/g, respectively), liver (1.5 and 1.8 μg/g, respectively), and kidney (0.9 and 0.7
μg/g, respectively) (Figure 4.1). Compared to the 4-h group, average perchlorate
concentration increased 39.6% in urine in the 8-h group. Average perchlorate
concentration also increased in liver and feces: 20.5% and 8.8% in the 8-h group,
respectively. However, average perchlorate concentrations decreased in
plasma, thyroid, and kidney in the 8-h group.
Perchlorate mass in kidney, thyroid, blood, and urine was significantly
correlated with perchlorate intake with r2 = 0.82, 0.78, 0.73, and 0.62,
respectively (p < 0.01). Perchlorate residues relative to perchlorate intake were
calculated in the fluids and tissues, and it was observed that perchlorate can be
excreted primarily through urine with an average recovery of 34% and 88% in 4-
and 8-h exposure groups, respectively (Table 4.1). There was a significant
difference of perchlorate recovery in urine between the two groups (p = 0.0129).
Higher perchlorate urinary excretion rate occurred between 4 and 8 h because
54% perchlorate was recovered at that period. Compared to perchlorate
recovery in urine, little perchlorate was observed in blood, liver, kidney, thyroid,
80
and feces; there were no significant differences between the two groups
regarding recovery of perchlorate in blood, liver, thyroid, kidney, and feces.
Perchlorate recovery in liver was increased slightly in the 8-h group when
compared to the 4-h group. However, perchlorate recovery decreased in blood,
thyroid, kidney, and feces in the 8-h group. It seems to indicate that a major
portion of perchlorate was depleted in these tissues and blood before 8 hours,
and maybe even before 4 hours. Among the tissues tested, more perchlorate
(expressed as mass percentage of perchlorate intake) was found in the liver
rather than the thyroid.
Our preliminary results are consistent with many other studies (Goldman
and Stanbury, 1973; Peña et al., 1976; Batjoens et al., 1993; Greer et al., 2002;
Yu et al., 2002). It is well established that a major portion of perchlorate can be
excreted from the body into the urine, and in a relatively short time. For example,
Batjoens et al. (1993) reported that perchlorate was excreted in the urine at a
concentration-related elimination rate after oral administration of a single dose in
cattle. Yu et al. (2002) reported 99.5% perchlorate was recovered in urine, and
95% of injected perchlorate was cleared in 55 to 75 h in rats. Greer and
coauthors (2002) documented that the half-life of perchlorate elimination in
humans ranged from 6 to 9.3 h following perchlorate withdraw. Peña et al.
(1976) reported that 87.6% and 99.4% of 36ClO4 were recovered in the excreta 3
h and 24 h, respectively, after administration in laying hens. Goldman and
Stanbury (1973) reported that 36ClO4 disappeared from the body with a half-life of
approximately 20 h in rat. The authors also reported that the disappearance
rates of 36ClO4 from the plasma and thyroid, and the appearance rate in the urine,
corresponded closely.
In this study, the thyroid had the highest perchlorate concentration among
the tested tissues, which was similar to findings of many other studies (Anbar et
al., 1959; Goldman and Stanbury, 1973; Peña et al., 1976; Yu et al., 2002).
However, the liver had a higher perchlorate residue, expressed as a mass
81
percentage of perchlorate intake, than thyroid and kidney. This phenomenon
was also observed in other studies. Peña et al. (1976) reported the highest
concentration of perchlorate in thyroids of laying hens at 3 h after a single
injection of K36ClO4. In their study, the largest total deposition (amount) in the 3-
h group was found in the blood, followed by muscle, internal organs, and ova.
Because of the limited number of tissues tested in this study, the perchlorate
distribution pattern among tissues was not always consistent with other studies;
however, there have also been inconsistencies among studies regarding
perchlorate distribution in body tissues. Yu et al. (2002) reported the highest
perchlorate concentration was in the thyroid, followed by plasma, red blood cells,
kidney, skin, liver, spleen, and muscle at 0.5 h post-dosing in rats; this is not
consistent with the Pena et al. study (1976), or the Goldman and Stanbury study
(1973). Variation may be caused by the differences in dosage, dose route,
tested animal, exposure duration, sampling time, and analysis method, which all
could change perchlorate toxicokinetics.
In this study, the perchlorate mass balance was not completely closed,
particularly in the 4-h group. There are at least two reasons for this observation.
First, the amounts of urine and blood collected were less than the total amount of
each fluid in the animals. Collected blood may only represent one quarter of the
total blood in the animals. For the 4-h group, urine volume was much less than
the 8-h group because there was less urine production. Since perchlorate
concentration was highest in urine, small volume differences can result in huge
differences in terms of perchlorate mass. Therefore, the total perchlorate
recovery in the 4-h group was only 36%, while 90% was recovered in the 8-h
group. Secondly, we only determined perchlorate in urine, blood, thyroid, liver,
kidney, and feces. Perchlorate may also exist in the gastrointestinal tract and
contents, especially in the 4-h group. Perchlorate may also be taken up by other
organs such as skin. Therefore, it is possible that more than 90% of the dose
82
could be recovered into urine if longer time (> 8 h) was used to excrete
perchlorate from the body.
Perchlorate excretion pattern via urine in deer mice
No significant difference was found among treatments regarding water
consumption (on average, 7.97 ± 2.7 g/day) and body weight (on average, 18.46
± 1.8 g) of the deer mice at each sampling time over the 28 d exposure.
Perchlorate daily dosage was estimated as 6.25 ± 0.6, 72.64 ± 5.8, and 778.06 ±
82.2 ng/g bw in the low, medium, and high dose groups, respectively.
Perchlorate concentrations in the urine increased rapidly after initiation of
exposure in the medium and high dose groups. Perchlorate concentration
appeared to reach a steady state within one day in all groups (Figure 4.2).
Higher concentrations of perchlorate were found at 16 h and day 2 in all
treatments, which is consistent with the fact that urine collected at 16 h and day 2
was mainly produced during the night and deer mice are nocturnal animals with a
higher excretion at night. Perchlorate concentrations in urine were significantly
correlated with perchlorate intake over the exposure period with an average of r2
> 0.6899 and p < 0.001. There was a significant treatment difference (p < 0.001)
among the three dose groups in terms of perchlorate concentration in urine over
the exposure period (28 days), with significant differences beginning at the first
urine collection time (8 h) (Figure 4.2). Even though perchlorate was detected in
the control group (31.4 ± 28.7 ng/mL), there was still a significant difference
between the control and low dose groups at days 7 and 20 (p < 0.005) but not on
days 14 and 28 (p > 0.1). Trace perchlorate was detected in the tap water (0.65
ng/mL) and rodent chow (1.44 ng/g). Perchlorate was also detected in the dish-
washing solution. A “background” intake of perchlorate has been previously
reported because of low-level perchlorate in some feed and water (Capuco et al.,
2005). Assuming a deer mouse ate 3 - 5 g food/day (personal communication),
the daily intake would be 4.32 – 7.20 ng perchlorate, much lower than the
83
amount excreted daily via urine (20.65 ± 12.9 ng) in the control animals. Other
sources of perchlorate in the deer mice are not clear, and an endogenous
perchlorate source may exist.
The amount of perchlorate excreted via urine was calculated based on
perchlorate concentrations in urine and the amount of urine collected (which is
assumed to be the amount of urine produced). Based on the amount of the dose
solution (water containing a certain concentration of perchlorate) the deer mice
consumed, the amount of perchlorate intake was similarly estimated. Therefore,
a mass balance of perchlorate intake and output was established. Perchlorate
output through urinary excretion as a mass percentage of perchlorate intake
through dosed drinking water in the deer mice over the 28-d exposure period is
illustrated in Figure 4.3. At 8 h, 22, 29, and 51% of the perchlorate intake
through drinking water was excreted into urine in the high, medium, and low dose
groups, respectively, and these percentages increased to a steady state after
one day. Average perchlorate output through urinary excretion was 46, 46, and
61% of the perchlorate intake through drinking water in the high, medium, and
low dose groups, respectively, over the 28-d exposure. There was no significant
treatment difference regarding perchlorate output through excretion via urine as a
mass percentage of perchlorate intake through dosed drinking water in the deer
mice at any sample collection time.
In the perchlorate distribution experiment in voles, 34 and 88% of
perchlorate was recovered in the urine in the 4- and 8-h exposure groups,
respectively. However, in deer mice only 22, 29, and 51% of the perchlorate
intake through drinking water was excreted into urine after 8 h exposure in the
three different dose groups, respectively. The difference regarding perchlorate
recovery in the urine may be caused by a species difference. Different species
show different absorption, distribution, metabolism, and excretion, which may
produce different excretion rates. Different life traits and other characteristics
may also contribute to different excretion rates of perchlorate. For example,
84
prairie voles usually produce more urine than deer mice, which may result in
more perchlorate recovery in the urine in terms of mass percentage.
Previous studies have shown that a major portion of perchlorate can be
excreted from the body in the urine in a relatively short time (Anbar et al., 1959;
Goldman and Stanbury, 1973; Peña et al., 1976; Batjoens et al., 1993; Greer et
al., 2002; Yu et al., 2002). Therefore a steady state, with more than 80% of
perchlorate excretion via urine in terms of mass percentage, was expected to be
reached in the current study. However, much lower perchlorate output via urine
as a mass percentage of perchlorate intake was found in the current excretion
experiment. Over the 28-d exposure, an average of 46% from the high and
medium and 61% from the low dose group of perchlorate intake were excreted
via urine. Several possible factors may help to explain these observations. First,
in this study, deer mice were exposed to perchlorate-treated drinking water ad
libitum over 28 days. In previous studies, perchlorate was injected as a one-time
dose. Exposure routes can influence uptake, and thus influence excretion of
perchlorate via urine. Continuous oral consumption of perchlorate may cause
accumulation in the body because of retarded elimination and excretion. It is
possible that perchlorate was present in the tissues such as liver and kidney, but
below the detection limit after high dilution during extraction and/or small mass of
these organs. In addition, skin represents a greater percentage of body weight of
rats than humans (19% vs. 3.7%) (NAS, 2005), therefore, more perchlorate could
be retained in deer mouse skin and cause less perchlorate to be excreted via
urine.
Secondly, metabolism of perchlorate within the gastrointestinal tract may
occur. Although there is no evidence for perchlorate metabolism in the body
(Anbar et al., 1959), perchlorate can be reduced to chlorate, chlorite, and
chloride through a series of enzymatic conversions under anaerobic conditions
(Coates et al., 1999). The existence of anaerobic bacteria which express
perchlorate reductase in the environment (Bruce et al., 1999; Coates et al.,
85
1999), isolated and purified perchlorate reductase (Kengen et al., 1999), and
identified gene encoding perchlorate reductase (Bender et al., 2005) support the
possibility that some metabolism takes place in the body. In addition, perchlorate
metabolic conversion has been proposed to occur in cow rumen (Capuco et al.,
2005), based in part on results where the total output of perchlorate was 58, 55,
33, and 17% of total intake for cows in the 0, 0.4, 4, and 40 mg/day infusion
groups, respectively. These output mass percentages were comparable with our
observations. Deer mice do not have a rumen, but this does not exclude the
possibility of perchlorate metabolism in the intestine and cecum by microbial
activities.
Finally, perchlorate may be lost because of incomplete urine collection or
via excretion in feces. Metabolic cages were used to hold these animals during
exposure. Deer mice can move rodent chow easily from the food container to
the mesh because of their small body size relative to the cages. The cage does
not isolate the chow and feces from the urine very well, and as a result, urine
may be absorbed by the chow and feces sticking to the wall of the cage, causing
less urine to be collected. Perchlorate also can be excreted via feces although it
contributes a small portion compared to the urine. Perchlorate was not
detectable in the feces collected at 8 h, which may be because of the high
dilution factor during sample extraction and resulting perchlorate below the
detection limit. Subsequent feces analysis was not continued. Assuming 15%
perchlorate loss because of incomplete urine collection, feces excretion, and
retained in the body, there is still about 40% of the perchlorate that is still
unaccounted for in this study.
Perchlorate intake from food and other sources resulted in a higher
perchlorate intake than intended in this study. The extra amount of perchlorate
accounted for a more significant portion of perchlorate in urine in the low dose
group, while the contribution from the extra perchlorate was negligible compared
to intake in the medium and high dose groups. As a result, slightly higher
86
recovery of perchlorate (expressed as a mass percentage of the total perchlorate
intake through dosed drinking water) was observed in the low dose group at each
collection time and overall. Similarly, much more perchlorate was “recovered” in
the low dose group than the high dose group in the depuration experiment.
Perchlorate depuration via urine in deer mice
Perchlorate depuration patterns were observed in deer mice via urinary
excretion during an 88 h depuration period following an 8 h exposure to
perchlorate in drinking water. No significant difference occurred between the low
and high dose groups in terms of perchlorate “background” concentration in urine
before exposure (21.6 ± 4.4 and 20.9 ± 6.5 ng/mL (mean ± SD) in the low and
high dose groups, respectively) (Figure 4.4). Perchlorate concentrations in urine
increased rapidly after the 8 h exposure to 2X and 122X that of background
perchlorate concentrations in the low and high dose groups, respectively. During
the 88 h depuration period, perchlorate concentrations in urine decreased
dramatically, especially in the high dose group. For the low dose group,
perchlorate concentrations in urine decreased to a steady “background” level
after 16 h of depuration. However, perchlorate concentrations in urine continued
to decrease after 88 h of depuration in the high dose group.
In the evaluation of perchlorate mass balance, it was found that 56.6 ±
14.3% of the perchlorate intake was excreted in the 88 h depuration period in the
high dose group, which was comparable to the percentage of total perchlorate
intake excreted into urine in the high and medium dose groups in our previous
excretion experiment (46%, on average). However, 234.6 ± 57.5% was found in
the low dose group. Daily perchlorate intake through food and other sources
introduced extra perchlorate in addition to the amount from dosed drinking water
and thus resulted in more than 200% recovery of perchlorate via urine. Daily
intake of perchlorate through food also may help explain the leveling of
87
perchlorate concentrations in urine to a steady “background” level after 16 hours
of depuration.
Exponential non-linear regression models were used to predict the half-life
and mean lifetime of perchlorate in deer mice. The models were developed
based on perchlorate concentrations in urine during the depuration period after
subtracting the “background” perchlorate levels (Figure 4.5). Mean background
perchlorate level in the low dose group minus SD (21.6 – 4.4 = 17.2 ng/mL) was
used as the subtracter in the low dose group to avoid negative concentrations in
the late depuration period. Mean background perchlorate level in the high dose
group (20.9 ng/mL) was used as the subtracter in the high dose group. The
models fit the depuration patterns well (r2 = 0. 0.38 and 0.84 in the low and high
dose groups, respectively). The half-lives of perchlorate in the low and high dose
groups were calculated as 37.9 and 18.2 hours, respectively. The mean lifetime
in the low and high dose groups was 54.6 and 26.3 hours, respectively. Our
results were comparable with other previous studies. The half-life of perchlorate
elimination has been reported differently for different species, ranging from 6 to
9.3 hours in humans (Lamm et al., 1999; Greer et al., 2002; Braverman et al.,
2005), and < 8 to 20 h in rats (Goldman and Stanbury, 1973; Wolff, 1998; Fisher
et al., 2000). Slightly longer half-lives obtained in the current experiment may be
caused by the different exposure routes (inhalation, oral, or injection) and one
dose or continuous exposure. In the current study, deer mice were exposed to
perchlorate for 8 h through drinking water. A shorter half-life and mean lifetime of
perchlorate were found in the high dose group when compared to the low dose
group. Greater perchlorate burdens in the body may cause a higher excretion
rate, and therefore a shorter half-life and mean lifetime.
Perchlorate excretion patterns during continuous 96 h exposure to
perchlorate and a depuration patterns with 88 h of depuration after 8 h exposure
were compared (Figure 4.6). No significant difference was found between
depuration and excretion at 8 h regarding perchlorate concentrations in urine in
88
both groups. However, a significant difference was observed between
depuration and excretion from 16 to 96 h in both groups (all p < 0.05).
Perchlorate concentrations in urine decreased after 8 h in the depuration
experiment in both groups, with a steady state reached after one day in the low
dose group and a continuous decrease in the high dose group. In contrast,
perchlorate concentrations in urine increased at 16 h and fluctuated within a
certain range in the excretion experiment in both groups after 16 h.
Mass balance evaluation showed differential perchlorate intake and output
in the excretion and depuration experiments. Perchlorate from the food was
lower than the daily excretion via urine in the control group in the excretion
experiment; more than 200% recovery of perchlorate was found in urine in the
low dose group in the depuration experiment. Thus, there must be other sources
of perchlorate and endogenous perchlorate may exist. On the other hand,
around 46 - 61% of the perchlorate was excreted via urine in the excretion
experiment, and 57% of perchlorate was recovered in urine in the high dose
group in the depuration experiment, resulting in the proposed concept of
metabolism of perchlorate in the body (gastrointestinal tract) (Capuco et al.,
2005). Perchlorate existence in the rodent chow exposed the animals to
perchlorate before initiation of exposure through dosed drinking water.
Therefore, adaptation to perchlorate may occur in these animals, which could
cause the ambiguity in the current study. Perchlorate existence in the food, other
potential sources of perchlorate, and perchlorate metabolism made perchlorate
fate in animals was not as straightforward as reported by other previous studies.
4.4 Conclusions
A study on perchlorate distribution was conducted in male adult prairie
voles (Microtus ochrogaster). Excretion via urine was the major pathway for
perchlorate fate in the body, with much higher concentrations of perchlorate
detected in urine in 4- and 8-hour exposure groups. Perchlorate mass in kidney,
89
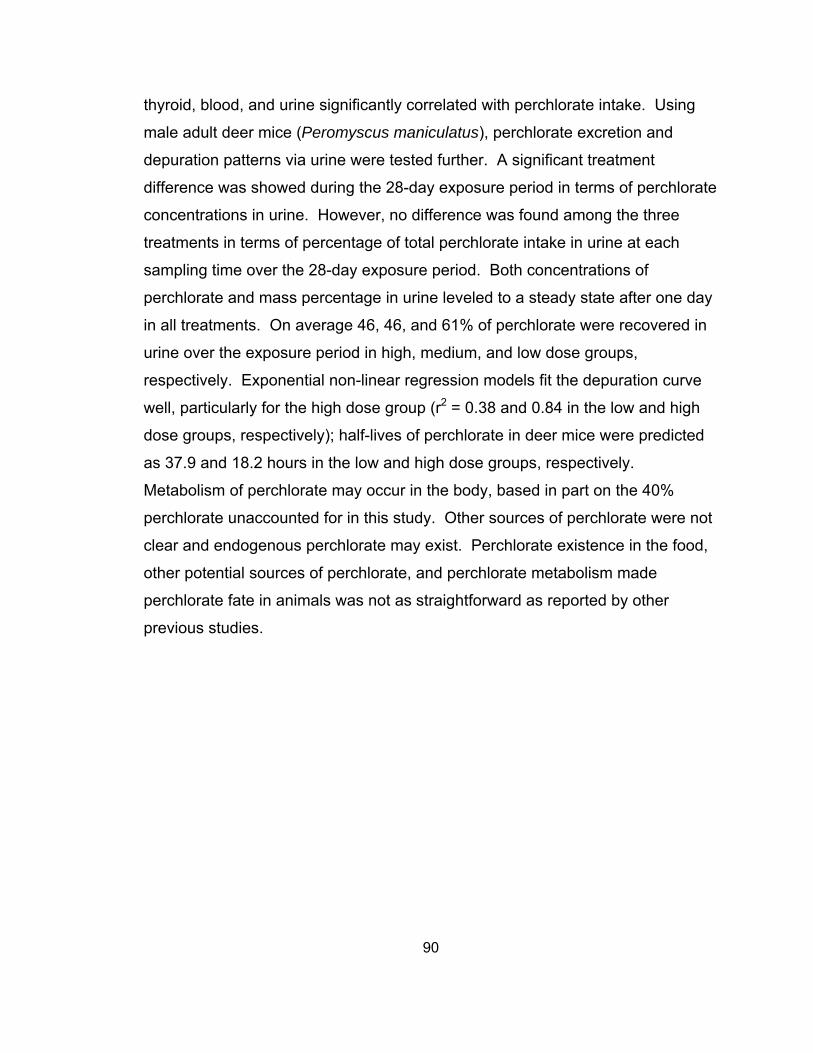
thyroid, blood, and urine significantly correlated with perchlorate intake. Using
male adult deer mice (Peromyscus maniculatus), perchlorate excretion and
depuration patterns via urine were tested further. A significant treatment
difference was showed during the 28-day exposure period in terms of perchlorate
concentrations in urine. However, no difference was found among the three
treatments in terms of percentage of total perchlorate intake in urine at each
sampling time over the 28-day exposure period. Both concentrations of
perchlorate and mass percentage in urine leveled to a steady state after one day
in all treatments. On average 46, 46, and 61% of perchlorate were recovered in
urine over the exposure period in high, medium, and low dose groups,
respectively. Exponential non-linear regression models fit the depuration curve
well, particularly for the high dose group (r2 = 0.38 and 0.84 in the low and high
dose groups, respectively); half-lives of perchlorate in deer mice were predicted
as 37.9 and 18.2 hours in the low and high dose groups, respectively.
Metabolism of perchlorate may occur in the body, based in part on the 40%
perchlorate unaccounted for in this study. Other sources of perchlorate were not
clear and endogenous perchlorate may exist. Perchlorate existence in the food,
other potential sources of perchlorate, and perchlorate metabolism made
perchlorate fate in animals was not as straightforward as reported by other
previous studies.
90
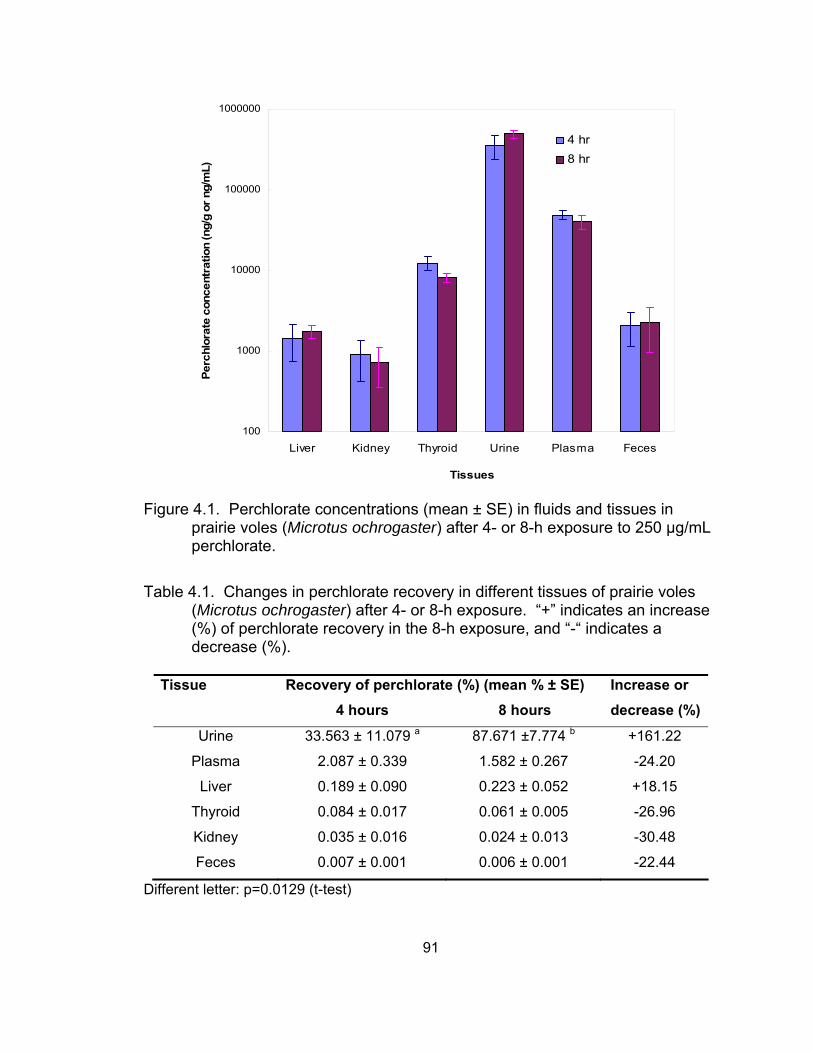
100
1000
10000
100000
1000000
Liver Kidney Thyroid Urine Plasma Feces
Tissues
Perc
hlor
ate
conc
entr
atio
n (n
g/g
or n
g/m
L)
4 hr8 hr
Figure 4.1. Perchlorate concentrations (mean ± SE) in fluids and tissues in
prairie voles (Microtus ochrogaster) after 4- or 8-h exposure to 250 μg/mL perchlorate.
Table 4.1. Changes in perchlorate recovery in different tissues of prairie voles (Microtus ochrogaster) after 4- or 8-h exposure. “+” indicates an increase (%) of perchlorate recovery in the 8-h exposure, and “-“ indicates a decrease (%).
Recovery of perchlorate (%) (mean % ± SE) Tissue
4 hours 8 hours Increase or decrease (%)
Urine 33.563 ± 11.079 a 87.671 ±7.774 b +161.22
Plasma 2.087 ± 0.339 1.582 ± 0.267 -24.20
Liver 0.189 ± 0.090 0.223 ± 0.052 +18.15
Thyroid 0.084 ± 0.017 0.061 ± 0.005 -26.96
Kidney 0.035 ± 0.016 0.024 ± 0.013 -30.48
Feces 0.007 ± 0.001 0.006 ± 0.001 -22.44
Different letter: p=0.0129 (t-test)
91
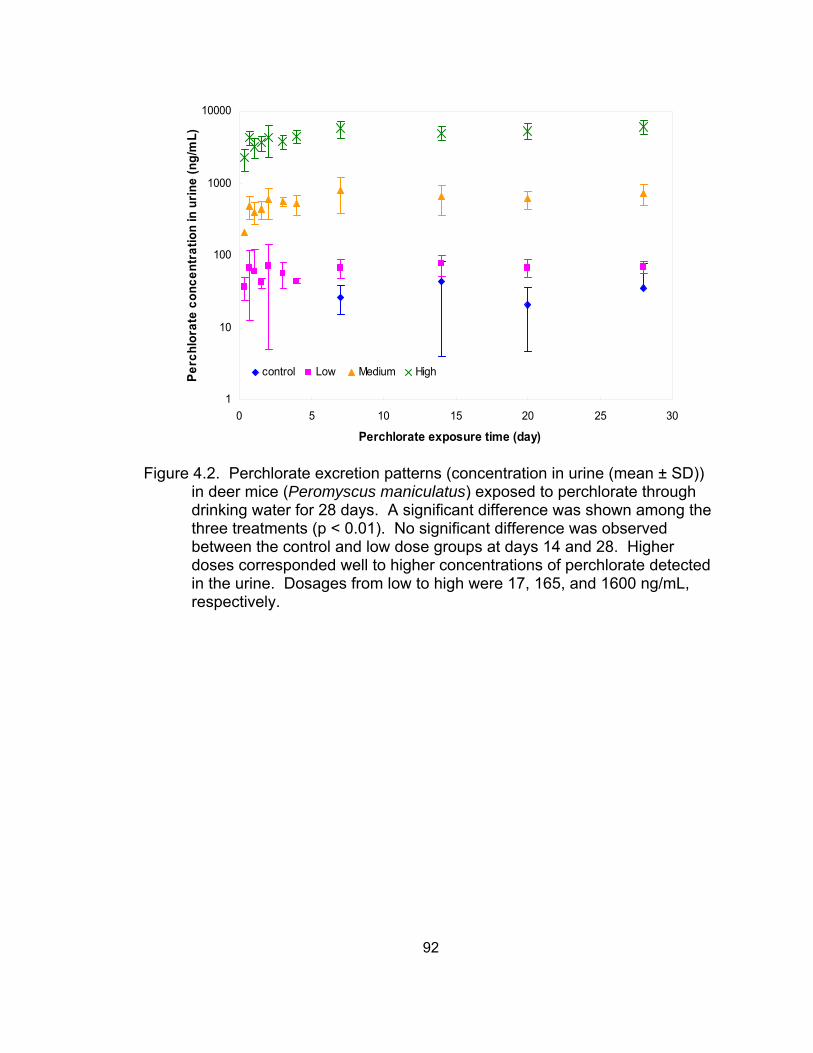
1
10
100
1000
10000
0 5 10 15 20 25 30
Perchlorate exposure time (day)
Perc
hlor
ate
conc
entr
atio
n in
urin
e (n
g/m
L)
control Low Medium High
Figure 4.2. Perchlorate excretion patterns (concentration in urine (mean ± SD))
in deer mice (Peromyscus maniculatus) exposed to perchlorate through drinking water for 28 days. A significant difference was shown among the three treatments (p < 0.01). No significant difference was observed between the control and low dose groups at days 14 and 28. Higher doses corresponded well to higher concentrations of perchlorate detected in the urine. Dosages from low to high were 17, 165, and 1600 ng/mL, respectively.
92
0
0.2
0.4
0.6
0.8
1
1.2
1.4
0 5 10 15 20 25 30
Perchlorate exposure time (day)
Perc
hlor
ate
excr
etio
n (p
erce
ntag
e of
pe
rchl
orat
e in
take
)
LOW
MEDIUM
HIGH
Figure 4.3. Perchlorate urinary excretion as percentage of total perchlorate
intake through dosed drinking water over the 28-day exposure period (mean ± SD). Dosages from low to high were 17, 165, and 1600 ng/mL, respectively. No significant difference was observed among the three treatments at each sampling time over the exposure period.
93

1
10
100
1000
10000
low highGroup
Perc
hlor
ate
conc
entr
atio
n in
urin
e (n
g/m
L)
0 8 h 16 h 24 h 36 h 48 h 72 h 96 h
Figure 4.4. Perchlorate concentration in urine (mean ± SD) in the depuration
experiment in which deer mice (Peromyscus maniculatus) was exposed to perchlorate for 8 hours and followed by an 88 h depuration period. Low dose - 17 ng/mL; high dose - 1600 ng/mL.
94
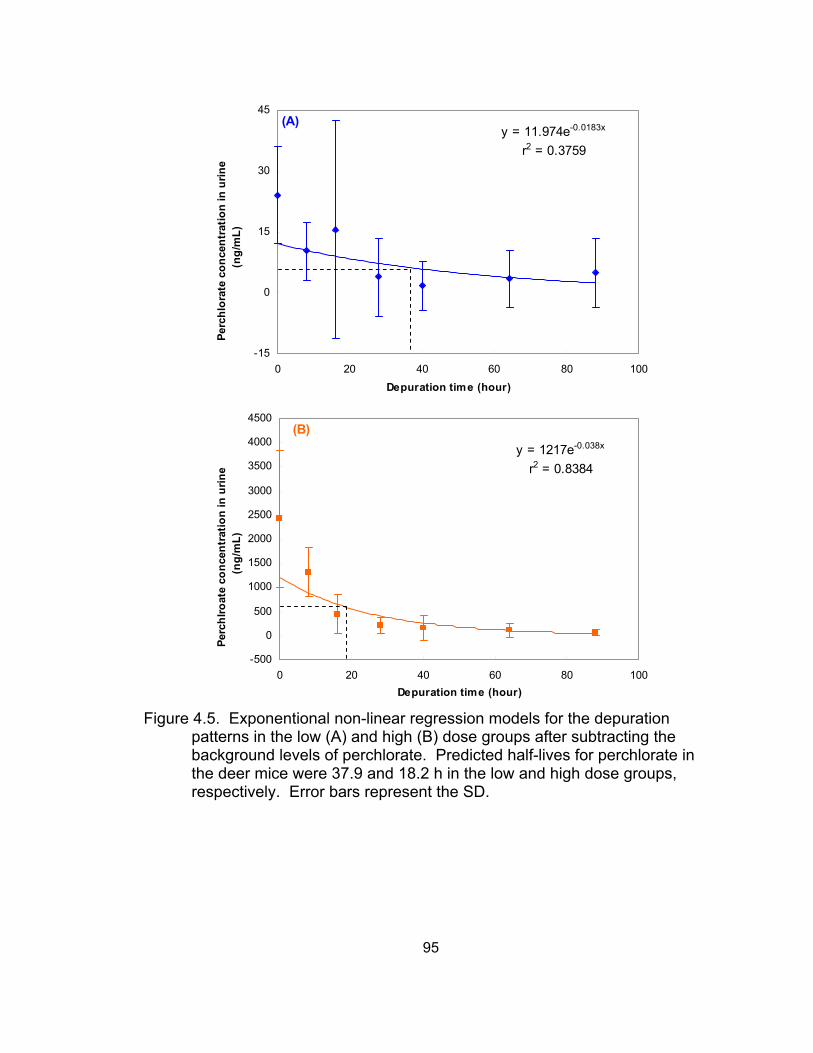
y = 11.974e-0.0183x
r2 = 0.3759
-15
0
15
30
45
0 20 40 60 80
Depuration time (hour)
Perc
hlor
ate
conc
entr
atio
n in
urin
e (n
g/m
L)
(A)
100
y = 1217e-0.038x
r2 = 0.8384
-500
0
500
1000
1500
2000
2500
3000
3500
4000
4500
0 20 40 60 80Depuration time (hour)
Perc
hlro
ate
conc
entr
atio
n in
urin
e (n
g/m
L)
(B)
100
Figure 4.5. Exponentional non-linear regression models for the depuration
patterns in the low (A) and high (B) dose groups after subtracting the background levels of perchlorate. Predicted half-lives for perchlorate in the deer mice were 37.9 and 18.2 h in the low and high dose groups, respectively. Error bars represent the SD.
95
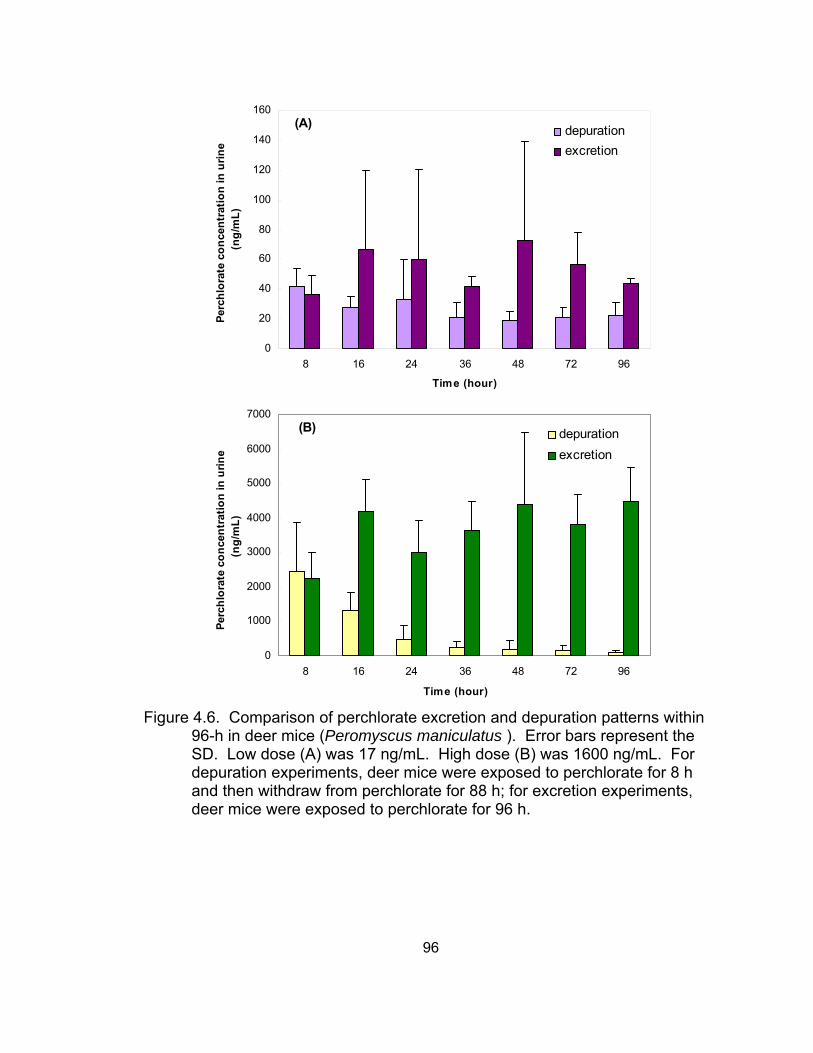
0
20
40
60
80
100
120
140
160
8 16 24 36 48 72 96
Time (hour)
Perc
hlor
ate
conc
entr
atio
n in
urin
e (n
g/m
L)
depurationexcretion
(A)
0
1000
2000
3000
4000
5000
6000
7000
8 16 24 36 48 72 96
Time (hour)
Perc
hlor
ate
conc
entr
atio
n in
urin
e (n
g/m
L)
depurationexcretion
(B)
Figure 4.6. Comparison of perchlorate excretion and depuration patterns within
96-h in deer mice (Peromyscus maniculatus ). Error bars represent the SD. Low dose (A) was 17 ng/mL. High dose (B) was 1600 ng/mL. For depuration experiments, deer mice were exposed to perchlorate for 8 h and then withdraw from perchlorate for 88 h; for excretion experiments, deer mice were exposed to perchlorate for 96 h.
96
CHAPTER V
EFFECTS OF PERCHLORATE EXPOSURE ON SODIUM-IODIDE
SYMPORTER AND PENDRIN GENE EXPRESSION IN DEER MICE
5.1 Introduction
The sodium-iodide symporter (NIS) is a basolateral plasma membrane
transporter which mediates active uptake of iodide into thyroid follicular cells.
Iodide uptake by the thyroid is the crucial first step in thyroid hormone
biosynthesis. NIS couples the inward transport of two sodium (Na+) ions with the
inward transport of one iodide (I-) ion into the cell (Eskandari et al., 1997; De La
Vieja et al., 2000). The translocation of Na+ into the cell occurs in favor of its
electrochemical gradient, which is maintained by the Na+/K+ ATPase. The
inwardly directed Na+ gradient drives iodide uptake against its electrochemical
gradient.
As I- can be transported and accumulated into many other tissues in
addition to the thyroid, such as skin, salivary glands, gastric mucosa, and
lactating mammary gland, the presence of NIS in extra-thyroidal tissues has also
been reported. NIS has been detected in rat gastric mucosa using
immunocytochemistry, and NIS mRNA has been detected in rat brain, stomach,
skin, mammary gland, placenta, uterus, and ovary using reverse-transcriptase
polymerase chain reaction (PCR) technique (Kotani et al., 1998). In humans,
immunohistochemical assays revealed positive NIS protein expression in salivary
glands and stomach but not in pancreas, skin, ovaries, spleen, esophagus, small
intestine, appendix, and kidney (Vayre et al., 1999). Northern blot analysis and
reverse transcription-PCR followed by Southern hybridization revealed NIS RNA
expression in several extrathyroidal tissues in humans, including the salivary
gland, parotid gland, submandibular gland, pituitary gland, pancreas, testis,
mammary gland, gastric mucosa, prostate, ovary, adrenal gland, heart, thymus,
and lung (Spitzweg et al., 1998; Spitzweg et al., 1999b). NIS gene expression
97
was also reported in human kidney and placenta with reverse transcription-PCR
(Mitchell et al., 2001; Spitzweg et al., 2001). Controversies were shown on the
localization of extrathyroidal NIS among different mammals (i.e. man, pig,
guinea-pig, rat and mouse) (Josefsson et al., 2002). In addition, the conflicting
reports on the location of NIS protein or gene expression may be caused by
different methodologies and their sensitivity (Josefsson et al., 2002).
Expression of NIS protein in the thyroid is upregulated by thyroid
stimulating hormone (TSH) in vivo and in the FRTL-5 cell (De La Vieja et al.,
2000; Dohan et al., 2000; Dohan et al., 2003). Besides TSH, I- has also been
considered as a main factor regulating NIS activity in the thyroid. The well-
known acute Wolff-Chaikoff effect shows that organic binding of I- in rat thyroid
was blocked when [I-] in plasma levels reached a crucially high threshold (Wolff
and Chaikoff, 1948). The ensuing escape from the acute effect, in which the
level of organification of I- is restored, was explained as a decrease in I- uptake
possibly caused by down-regulation of NIS expression (Braverman and Ingbar,
1963; Eng et al., 1999; Dohan et al., 2000). Administration of iodide has been
reported to decrease NIS mRNA and/or protein levels in in vivo and in vitro
studies although with different proposed mechanisms (Spitzweg et al., 1999a;
Eng et al., 2001; Dohan et al., 2003). In addition to TSH and I-, cytokines were
also reported to play a role in the modulation of NIS gene expression (Ajjan et al.,
1998a; Ajjan et al., 1998b; Spitzweg et al., 1999a; Eng et al., 2001). These
cytokines, including TNF-α, TNF-β, interferon-γ, IL-1α, IL-1β, and IL-6, exerted
an inhibitory effect on NIS expression and iodide uptake in thyroid cells.
Prolactin and insulin also stimulated NIS accumulation in mammary gland and
was associated with enhanced iodide accumulation in milk (Rillema et al., 2000;
Rillema et al., 2002).
NIS transports a wide variety of anions in addition to I-. These include
ClO3-, SCN-, SeCN-, NO3
-, Br-, BF4-, IO4
-, and BrO3-; NIS shows different affinity
for these anions with I- ≥ SCN- > ClO3- > Br- (Dohan et al., 2000; Van Sande et
98
al., 2003). Perchlorate has been characterized as the most widely known
inhibitor of thyroidal iodide uptake; it competitively inhibits iodide uptake by the
thyroid via NIS, and therefore disrupts normal thyroid function. Perchlorate was
previously proposed to be transported via NIS, but it action as a blocker rather
than a substrate for NIS was proposed as well (Eskandari et al., 1997; De La
Vieja et al., 2000).
Alternatively, a mechanism of perchlorate-induced toxicity in the thyroid
has been proposed in which perchlorate stimulates the discharge of iodide from
the follicles (Wolff, 1998). Pendrin, an iodide/chloride transporter found in the
apical membrane, has been suggested as a possible participant in the efflux of
iodide into the follicular lumen (Wolff, 2005). In the thyroid, perchlorate seems to
facilitate the efflux of iodide from the follicular lumen and cytoplasm (Wolff, 1998).
No report has described the mechanism of iodide transport at the apical
membrane. Therefore, it is possible that perchlorate alters the transport function
of pendrin at the apical membrane by an unknown mechanism.
Pendrin is a putative 780-amino acid transmembrane glycoprotein
containing 11 and 12 transmembrane domains and is encoded by the Pendrin
syndrome gene (PDS) (Everett et al., 1997; Royaux et al., 2000). Mutations of
the PDS gene are responsible for Pendred syndrome, which is characterized by
congenital hearing loss and goiter (Everett et al., 1997). Pendrin has been
demonstrated to transport iodide and chloride, but not sulfate, in a sodium-
independent fashion in Xenopus laevis ooctyes and Sf9 cells (Scott et al., 1999).
Pendrin also acts as chloride/formate and chloride/hydroxyl/bicarbonate
exchangers in the mammalian kidney, Xenopus laevis oocytes, and HEK-293 cell
expression systems (Scott and Karniski, 2000; Royaux et al., 2001; Soleimani et
al., 2001). In the thyroid, pendrin is an iodide-specific apical transporter and is
responsible for iodide efflux from thyroid cells (Royaux et al., 2000; Yoshida et
al., 2002).
99
Generally, pendrin displays a different pattern of expression than NIS in
extra-thyroidal tissues. Pendrin expression has been reported primarily in the
thyroid (Bidart et al., 2000b; Royaux et al., 2000; Mian et al., 2001), kidney
(Lacroix et al., 2001; Royaux et al., 2001; Soleimani et al., 2001), and inner ear
(Everett et al., 1999; Yoshino et al., 2004). It has also been found in other
tissues such as human sertoli cells (Lacroix et al., 2001), the endometrium of
humans, rats, and mice (Suzuki et al., 2002), lactating mammary glands (Rillema
and Hill, 2003), and the placenta during gestation (Bidart et al., 2000a). In
contrast to NIS, no transcription of the PDS gene was detectable in any digestive
tract tissue (Lacroix et al., 2001). In deer mice, a much higher expression of
pendrin was found in kidney, lungs, and reproductive tissues (including testes,
ovaries, and uterus) than in the thyroid (Ramachandran, 2005).
Pendrin expression was found to be significantly induced by low
concentrations of thyroglobulin (TG), but not by TSH, sodium, iodide, or insulin in
a rat thyroid cell line (FRTL-5) (Royaux et al., 2000). At physiological
concentrations, the combination of prolactin, insulin, and cortisol stimulated
pendrin expression in cultured mammary tissues taken from midpregnant mice
(Rillema and Hill, 2003). Prolactin stimulation of iodide transport was abolished
by pendrin exchange inhibitors in cultured mammary tissues from 12- to 14-day
pregnant mice (Rillema and Hill, 2003). In the kidney, pendrin expression was
regulated by the acid-base status with acid-loading or K+-depletion causing a
reduction and bicarbonate-loading producing an increase in pendrin expression
level (Wagner et al., 2002; Frische et al., 2003; Quentin et al., 2004). Chronic
changes in the chloride balance have played a role in the regulation of pendrin
expression in the kidney (Quentin et al., 2004). Pendrin was also reportedly
upregulated with aldosterone analogues (deoxycorticosterone pivalate) and
therefore may be critical in the pathogenesis of mineralocorticoid-induced
hypertension and metabolic alkalosis (Verlander et al., 2003) in addition to being
100
essential for acid-base balance. Pendrin also plays a vital role in the renal
conservation of water and Cl- during NaCl restriction (Wall et al., 2004).
Although perchlorate has been most commonly characterized as being
transported into the thyroid, it appears to be eliminated rapidly and primarily via
urine in humans, rats, and cows (Anbar et al., 1959; Goldman and Stanbury,
1973; Batjoens et al., 1993; Yu et al., 2002). It is uncertain whether NIS is
expressed in the kidney due to conflicting reports (Vayre et al., 1999; Spitzweg et
al., 2001), but pendrin has been found to be highly expressed in deer mice
kidney (Ramachandran, 2005). Therefore, it is possible that perchlorate
exposure may have an effect on transporter (i.e. NIS and/or pendrin) levels or
activities in the kidney; higher levels or activities of these transporters in the
kidney may correspond to high levels of perchlorate exposure and in turn, a
higher perchlorate excretion rate via urine. The relationship between perchlorate
exposure and transporters in the kidney (or other organs) would provide
additional insight about the perchlorate excretion pattern via urine and some
indication of perchlorate toxicokinetics at the molecular level. To our knowledge,
no information describes the relationship of perchlorate and (regulation of) NIS
expression. Therefore, the relationship between transporter gene expression
and perchlorate exposure was explored in the current study. Four questions
were addressed: (1) What is the expression pattern of NIS among deer mice
tissues? (2) How does perchlorate exposure affect NIS gene expression in the
kidney if the NIS gene is expressed in the kidney? (3) How does perchlorate
exposure affect pendrin gene expression in the kidney? (4) Is there a
relationship between urinary perchlorate excretion and NIS (and/or pendrin) gene
expression in the kidney? It was hypothesized that the transporter gene
expression would increase upon perchlorate exposure.
101
5.2 Materials and Methods
Animal exposure to perchlorate
Animals: Male adult deer mice (Peromyscus maniculatus) (18.5 ± 1.8 g)
were provided by Dr. Michael Hooper’s breeding colony at Texas Tech University
(Lubbock, TX). Perchlorate dosing solutions were prepared by dissolving sodium
perchlorate (reagent grade anhydrous, Fisher Scientific) in 18.2 MΩ Milli-Q
water. The concentration of perchlorate was determined using ion
chromatography.
Perchlorate excretion experiment: Twenty-four deer mice were arbitrarily
assigned into four groups (one control and three treatments: low, medium, and
high). Siblings were separated into different groups. Animals were housed
individually in metabolic cages which were placed on two racks (4 groups X 3
cages per rack). Cages were placed arbitrarily on the racks. Animals (around
70-d old) were allowed to acclimate for two days to test facility conditions of room
temperature (65 – 78 °F), relative humidity (25 – 75%), and 12:12 h dark:light
prior to the initiation of dosing. Food was provided ad libitum and checked daily.
Perchlorate was administered daily through drinking water ad libitum for four
consecutive weeks (sodium perchlorate dissolved in Milli-Q water). The mice in
the control group were given Milli-Q water without perchlorate throughout the
study. Water consumption was recorded at each urine collection. Perchlorate
concentrations in the dosed drinking water (low, medium, and high) were 17,
165, and 1600 ng/mL, respectively. Deer mice body weights were recorded
before treatment and each week during the exposure to monitor any weight
changes. Metabolic cages were replaced (cleaned) once per week.
Perchlorate elimination experiment: Twelve deer mice were arbitrarily
assigned into two groups (low dose and high dose). As in the excretion
experiment, siblings were placed in different groups. Animals were housed
individually in metabolic cages placed arbitrarily on one rack. Animals were
housed in the cages and allowed to acclimate for two days to test facility
102
conditions of room temperature (65 – 78 °F), relative humidity (25 – 75%), and
12:12 h dark:light prior to the initiation of dosing. Perchlorate was dosed through
drinking water over 8 hours (sodium perchlorate dissolved in Milli-Q water). After
dosing, Milli-Q water (no perchlorate) was provided to these animals throughout
the remainder of the study (88 hour, elimination phase). Food and water were
provided ad libitum and checked daily. Water consumption was recorded at each
urine collection. Perchlorate concentrations in the drinking water were 17 and
1600 ng/mL in the low and high dose groups, respectively. Deer mice body
weights were recorded before treatment and at the end of the study (day 4).
At end of the excretion and elimination experiments (days 29 and 4,
respectively), animals were weighed, anesthetized with carbon dioxide, bled via
heart puncture, and euthanized by exsanguination. At necropsy, the following
tissues were collected: kidney, liver, intestinal tract, stomach, and testes. Brain,
heart, and lung were also collected from the control animals to characterize the
NIS gene expression pattern among these tissues. Blood samples were placed
in EDTA-rinsed tubes, centrifuged, and plasma was collected. All tissues,
plasma, and carcasses were placed on dry ice after collection and during
transport back to the laboratory, where they were stored at – 80 °C until gene
expression analysis.
Partial deer mice NIS cDNA sequence development
Ribonucleic acid (RNA) isolation: Since NIS expression has been
reported in rat stomach and human gastric mucosa (Kotani et al., 1998; Spitzweg
et al., 1998; Spitzweg et al., 1999b), gastrointestinal track and stomach were
used to isolate total mRNA. TRIzol Reagent (Invitrogen, Carlsbad, CA) was used
to flush contents out from fresh gastrointestinal tract and stomach from a control
deer mouse. Tissue (50-100 mg) was homogenized in 1 mL TRIzol Reagent
using a PowerGen 125 homogenizer (Fisher Scientific, Pittsburgh, PA) and
incubated for 5 minutes at room temperature. Chloroform was added (0.2 mL
103
per mL of TRIzol Reagent), shaken vigorously, and incubated at room
temperature for 5 min. The samples were centrifuged at 12,000 rpm for 15 min
at 4 °C (Microfuge 22R Centrifuge, Beckman Coulter, Fullerton, CA). The top
aqueous phase was transferred to a fresh microtube. Isopropyl alcohol was
added (0.5 mL per mL of TRIzol Reagent), shaken, and incubated for 10 min at
room temperature. The samples were then centrifuged at 12,000 rpm for 10 min
at 4 °C. The supernatant was decanted and the pellet was washed with 75%
ethanol (at least 1 mL per mL TRIzol Reagent). The samples were centrifuged at
9,600 rpm for 5 min at 4 °C. The supernatant was decanted and the pellets were
air dried for 5 min and dissolved in 50 μL nuclease-free water (Ambion, Austin,
TX). Aliquots (1 μL) were used to spectrophotometrically measure RNA
concentration based on the absorbance (260 nm) using a SmartSpec 3000
spectrophotometer (Bio-Rad, Hercules, CA). The remaining RNA was aliquoted
and stored at -80 °C.
RNA purity and integrity: RNA of high quality (i.e. purified and intact RNA)
is the first and most critical requirement for gene expression analysis. Good
purity of isolated RNA was determined by the absorbance ratio at 260 nm and
280 nm (range = 1.8 - 2.1). Integrity of total RNA was assessed by running the
isolated RNA sample on a 1% formaldehyde agarose gel with ethidium bromide.
A sample solution containing 1 μg RNA, 8-10 μL of formaldehyde loading buffer,
and 0.3 μL ethidium bromide was prepared for each sample and incubated for 17
min at 75 °C. An 18S + 28S Ribosomal RNA marker from calf liver (Sigma-
Aldrich, St. Louis, MO) was also prepared in the same way. Sample or marker
solution (~ 10 µL) was loaded on a 1% denaturing formaldehyde agarose gel and
electrophoresis was performed at 80 volts for one hour in 1X MOPS-EDTA-
Sodium Acetate (MESA) buffer. A photograph of the gel was taken under ultra-
violet (UV) light with a DigiDoc-It imaging system in combination with TFM-20
transilluminator and Dot it 1-d analysis software (UVP, Inc., Upland, CA). Intact
104
total RNA on such a denaturing gel has two sharp and clear bands: 28S and 18S
ribosomal RNA (rRNA) with an intensity ratio of 1:2 as shown in Figure 5.1.
Deoxyribonuclease (DNase) treatment: A DNA-free kit (Ambion, Austin,
TX) was used to remove genomic deoxyribonucleic acid (DNA) from isolated
RNA. An aliquot of 10 µg of RNA sample was taken and nuclease-free water
was added to a total volume of 25 µL. DNase buffer (10X, 2.5 µL) and 1 µL
rDNase was added and the sample was incubated for 25 min at 37 °C. DNase
Inactivation Reagent (2.5 µL) was added and incubated for 2 min at room
temperature, mixing occasionally, to remove the DNase and divalent cations,
which will affect reverse transcription PCR. The sample was centrifuged at
10,000 rpm for 2 min at room temperature. The supernatant, DNA free RNA,
was transferred to a fresh tube without touching the pellet. Aliquoted sample was
stored at - 80 °C or used for reverse transcription.
Reverse transcription: DNA free RNA sample (2 μg) aliquot was used for
reverse transcription using a RETROscript Kit (Ambion, Austin, TX). Oligo (dT)
(2 μL) was added to the sample and nuclease-free water was added to a final
volume of 12 μL. Heat denaturation of RNA was conducted at 75 °C for 3 min.
RT buffer (10X, 2 μL), 4 μL of dNTP mix, 1 μL of RNase Inhibitor, and 1 μL of
Moloney Murine Leukemia Virus-Reverse Transcriptase (MMLV-RT) were added
and the sample was incubated at 43 °C for one hour for reverse transcription.
Finally, the sample was incubated at 92 °C for 10 min to inactivate the Reverse
Transcriptase. The generated complementary DNA (cDNA) was stored in -20
°C.
Polymerase chain reaction (PCR): PCR was conducted using the
RETROscript Kit (Ambion, Austin, TX) based on its protocol. Five μL of the
reverse transcription product (cDNA) was used as template, 5 μL 10X PCR
buffer, 2.5 μL dNTP mix, and nuclease-free water were added to a final volume
of 50 μL. Sense primer (1.25 μL), antisense primer (1.25 μL), and 2 units
SuperTaq polymerase were then added into the reaction solution. PCR was
105
conducted in a Biometra TGradient thermocycler (Whatman Biometra,
Goettingen, Germany) for 30 cycles of denaturation (94 °C, 30 sec.) annealing
(66.5 °C, 30 sec.), and extension (72 °C. 45 sec.), with an initial denaturation at
95 °C for 2 min and a final extension at 72 °C for 5 min. The PCR products were
analyzed on a native 2% agarose gel in the presence of ethidium bromide.
Electrophoresis was performed at 120 volts for 25 min in 1X tris-acetate-EDTA
(TAE) buffer. A photograph of the gel was taken under ultra-violet (UV) light with
DigiDoc-It imaging system combining TFM-20 transilluminator and Dot it 1-d
analysis software (UVP, Inc., Upland, CA).
Sense and antisense oligonucleotide primers were designed using
VectorNTI primer design software (Infomax, Bethesda, MD) with partial NIS
cDNA sequence in Mus musculus (AF235001), and synthesized by Invitrogen
(USA). The partial Mus musculus NIS sequence showed a high similarity to
other species including Homo sapiens and Rattus norvegicus. The generated
sense and antisense oligonucleotide primers are listed in Table 5.1.
Sequencing: Deer mice NIS PCR products were sequenced for
identification and verification using ABI PRISM 377 automated DNA sequencer
(Perkin-Elmer Applied Biosystems, Foster City, CA) at the DNA sequencing core
facility, Biotechnology Center, Texas Tech University. Deer mice specific partial
NIS sequence was then analyzed for homology to previously characterized
genes deposited in the National Center for Biotechnology Informatics (NCBI)
database using the Basic Local Alignment Tool (BLAST) program.
Characterization of gene expression in deer mice with real-time PCR
cDNA preparation: Total RNA was extracted from deer mice tissues as
described above using TRIzol Reagent. The isolated mRNA samples were
assessed for their purity and integrity. High quality RNA samples were DNase
treated and reverse transcribed to cDNA.
106
Primers and probe design for real-time PCR: With the deer mice specific
partial NIS cDNA sequence generated, the TaqMan specific probe and
oligonucleotide primers for NIS mRNA equivalents real-time PCR amplification
were designed by Primer Express software (Perkin-Elmer Applied Biosystems,
Foster City, CA) following Applied Biosystem’s probe and primers design
guidelines. Additional rules were also considered to determine probe and primer
sets such that no more than 2 Gs or Cs in the last 5 nucleotides at the 3’ end for
both primers, the melting temperature (Tm) of the primer was 10 ° lower than the
probe, and no more Cs than Gs in the probe. Designed TaqMan probes and
primers specific for deer mice NIS gene were synthesized by Applied Biosystem.
FAM (6-carboxyfluorescein) was used as the 5’ reporter dye and TAMRA (6-
carboxytetramethylrhodamine) as the 3’ quencher dye for the TaqMan probe.
Similarly, TaqMan probes and primers for pendrin mRNA equivalents real-
time PCR were also designed and synthesized based on the deer mice specific
partial pendrin cDNA sequence developed in Dr. Ernest Smith’s lab
(Ramachandran, 2005). TaqMan probes and primers for pendrin and NIS mRNA
equivalents real-time PCR amplification are shown in Table 5.2.
Real-time PCR: Quantitative real-time PCR analysis was performed using
an ABI PRISM 7000 Sequence Detection System (Perkin-Elmer Applied
Biosystems, Foster City, CA). Real-time fluorescence-based quantitative PCR
has been established as a benchmark technology for the quantification of nucleic
acids and/or comparison of RNA levels (Bustin, 2005; Bustin et al., 2005). Real-
time PCR monitors the fluorescence emitted during the reaction as an indicator
of amplification during each PCR cycle (Ginzinger, 2002; Dorak, 2005). It
quantitates the initial amount of the template specifically, sensitively, and
reproducibly, rather than just detecting the amount of final amplified product at
the endpoint as in conventional PCR. Therefore, it provides a highly sensitive
and accurate quantitative analysis of gene expression with cDNA as the reaction
template.
107
Since real-time PCR is a very sensitive method for gene quantification,
careful normalization is essential for accurate quantitative analysis. Therefore, a
housekeeping gene expression is usually used to normalize the quantification of
target gene expression. A good housekeeping gene should be expressed at a
consistent level under experimental conditions. There are several commonly
used internal housekeeping controls; glyceraldehyde-3-phosphate
dehydrogenase (GAPDH) is one of the most widely used. Most important is that
GAPDH is expressed at consistent levels across age and in various tissues of
deer mouse (Ramachandran, 2005). The probe of GAPDH has VIC as the 5’
reporter dye and TAMRA as the 3’ quencher dye.
A PCR reaction solution with a final volume of 50 μL was prepared that
contained TaqMan GAPDH (250 nM), sense and antisense GAPDH primers (20
nM x 20 nM), sense and antisense pendrin or NIS primers (300 nM x 300 nM), 50
ng of pendrin cDNA or 150 ng of NIS cDNA, and 25 μL of TaqMan Universal
PCR master mix (Perkin-Elmer Applied Biosystems, Foster City, CA). Four 10-
fold serial dilutions of pooled control cDNA samples were used as standards.
Reaction solution without cDNA template was also prepared as the No Template
Controls (NTC). All samples were prepared in duplicate and PCR reactions were
processed in sealed 96-well optical plates.
The program for the real-time thermal cycler was set as the following:
initial 2 min hold at 50 °C for optimal AmpErase UNG activity and a 10 min hold
at 95 °C for AmpliTaq Gold DNA polymerase activation, then 40 cycles of
denaturation (95 °C, 15 sec.) and annealing/extension ( 60 °C, 1 min.).
Fluorescence is released during the amplification reaction and a threshold level
is reached when the fluorescent signal is first statistically significantly above
background. The cycle threshold (CT) value, the cycle number at which the
threshold level is reached, represents the amount of product amplified that is
related to cDNA template concentration. This value was recorded for both the
FAM and VIC dyes in the standard and unknown samples. A calibration curve
108
between the CT values for the FAM or VIC dye of the standards and the amount
of their respective mRNA equivalents was established. Then, the amount of
mRNA equivalents of the target gene and GAPDH in the unknowns was
determined from their CT values based on the calibration curve. The ratio of the
mRNA equivalents of target gene and GAPDH was taken as target gene
expression relative to GAPDH.
NIS gene expression pattern among tissues (i.e. brain, liver, kidney, testis,
large intestine, stomach, heart, and lung) in deer mice was characterized first.
Because NIS gene was observed highly expressed in the stomach, and
perchlorate was mainly excreted via urine, NIS and pendrin gene expressions in
the stomach and kidney were then characterized in deer mice exposed to
perchlorate in the excretion and depuration experiments.
Statistical analyses
Statistical analyses were performed using R software (version 2.1.1, Free
Software Foundation, Boston, MA). Normality and homogeneity of variance of
the data were tested using Sharpiro-Wilk normality test and Bartlett’s test,
respectively. Differences of target gene (i.e. pendrin and NIS) expression in
specific tissues among different perchlorate treatment groups were tested using
one way analysis of variance (ANOVA) followed by Tukey Honest Significant
Difference (Tukey HSD) multiple comparison if a significant difference was
observed. Liner regression analysis was conducted between gene expression in
the kidney and perchlorate excretion via urine. Alpha was set at 0.05 for the
statistical analyses.
5.3 Results and Discussion
Partial sequence of NIS gene
With the sense and antisense primers designed by Vector NIT from partial
NIS cDNA sequence of Mus musculus (Table 5.1), a PCR product with 425 base
109
pairs was amplified from the cDNA of deer mouse small intestine and stomach
(Figure 5.2). The deer mice specific NIS partial sequence (Figure 5.3) shows
87% similarity to the NIS gene in Rattus norvegicus, more than 86% similarity to
the NIS gene in Mus musculus, and 84% similarity to Homo sapiens NIS gene.
To our knowledge, this is the first discovery of a partial NIS cDNA
sequence specific for deer mice. Cloned NIS cDNA was reported in several
species including rat, mouse, and human (Dai et al., 1996; Smanik et al., 1996;
Perron et al., 2001; Pinke et al., 2001), but no complete or partial deer mice NIS
gene sequence has been reported before. To design the primers for PCR
amplification of NIS cDNA in deer mice, complete NIS cDNA sequences of
Rattus norvegicus, Mus musculus, and Homo sapiens were compared using
Vector NIT, and then a specific Mus musculus partial sequence with the highest
similarity to other species was used as a template for the design of sense and
antisense primers.
NIS gene expression pattern in deer mice
The NIS gene was expressed at relatively different levels in various deer
mice tissues (Figure 5.4). The highest expression of NIS was found in the
stomach, which was 11.59 times higher than in the testes, followed by testes,
brain, and large intestine. NIS gene expression levels in the brain and large
intestine were 3.7 and 4.29 times, respectively, lower than that in the testes.
Barely was any NIS gene expression observed in the lung, kidney, heart, and
liver, which was 215, 272, 1070, and 2315 times lower than the expression
observed in testes, respectively. This is the first time to quantitatively analyze
NIS mRNA expression in various deer mice tissues to date.
To some degree, our results were consistent with previous reports on NIS
expression in various rat or human tissues. In extrathyroidal tissues, previous
studies showed NIS mRNA expression in rat brain, stomach, skin, mammary
gland, placenta, uterus, and ovary using the reverse-transcription polymerase
110
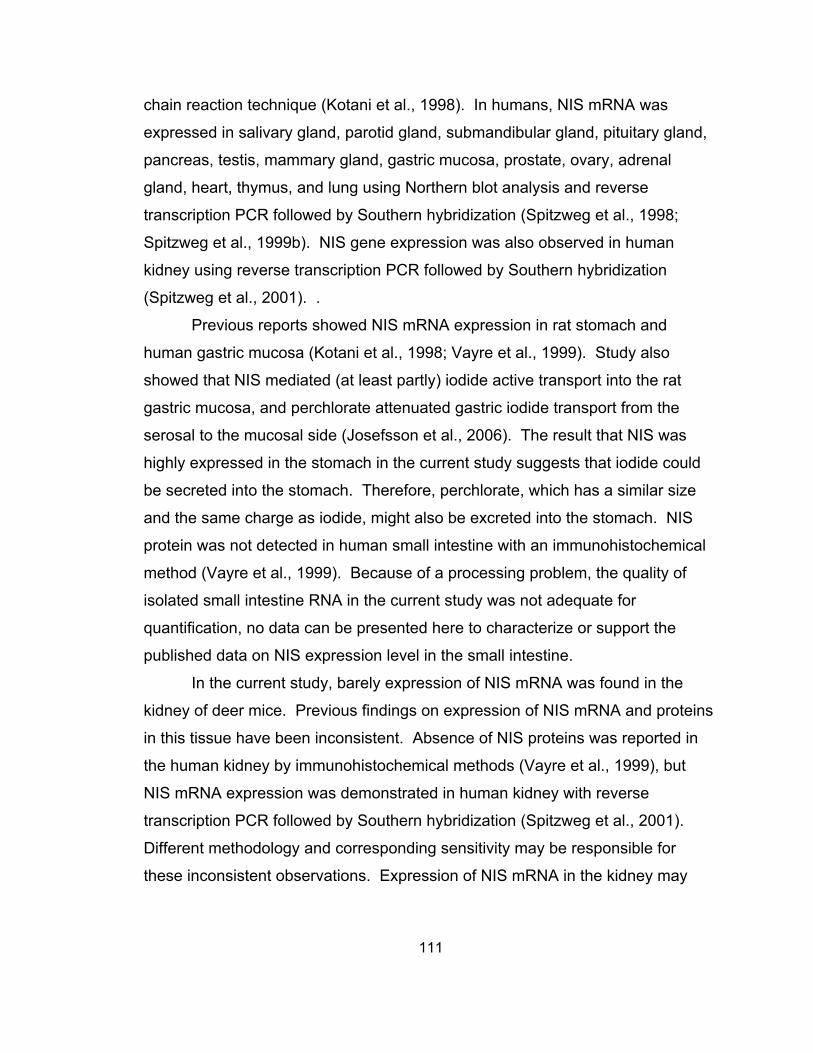
chain reaction technique (Kotani et al., 1998). In humans, NIS mRNA was
expressed in salivary gland, parotid gland, submandibular gland, pituitary gland,
pancreas, testis, mammary gland, gastric mucosa, prostate, ovary, adrenal
gland, heart, thymus, and lung using Northern blot analysis and reverse
transcription PCR followed by Southern hybridization (Spitzweg et al., 1998;
Spitzweg et al., 1999b). NIS gene expression was also observed in human
kidney using reverse transcription PCR followed by Southern hybridization
(Spitzweg et al., 2001). .
Previous reports showed NIS mRNA expression in rat stomach and
human gastric mucosa (Kotani et al., 1998; Vayre et al., 1999). Study also
showed that NIS mediated (at least partly) iodide active transport into the rat
gastric mucosa, and perchlorate attenuated gastric iodide transport from the
serosal to the mucosal side (Josefsson et al., 2006). The result that NIS was
highly expressed in the stomach in the current study suggests that iodide could
be secreted into the stomach. Therefore, perchlorate, which has a similar size
and the same charge as iodide, might also be excreted into the stomach. NIS
protein was not detected in human small intestine with an immunohistochemical
method (Vayre et al., 1999). Because of a processing problem, the quality of
isolated small intestine RNA in the current study was not adequate for
quantification, no data can be presented here to characterize or support the
published data on NIS expression level in the small intestine.
In the current study, barely expression of NIS mRNA was found in the
kidney of deer mice. Previous findings on expression of NIS mRNA and proteins
in this tissue have been inconsistent. Absence of NIS proteins was reported in
the human kidney by immunohistochemical methods (Vayre et al., 1999), but
NIS mRNA expression was demonstrated in human kidney with reverse
transcription PCR followed by Southern hybridization (Spitzweg et al., 2001).
Different methodology and corresponding sensitivity may be responsible for
these inconsistent observations. Expression of NIS mRNA in the kidney may
111
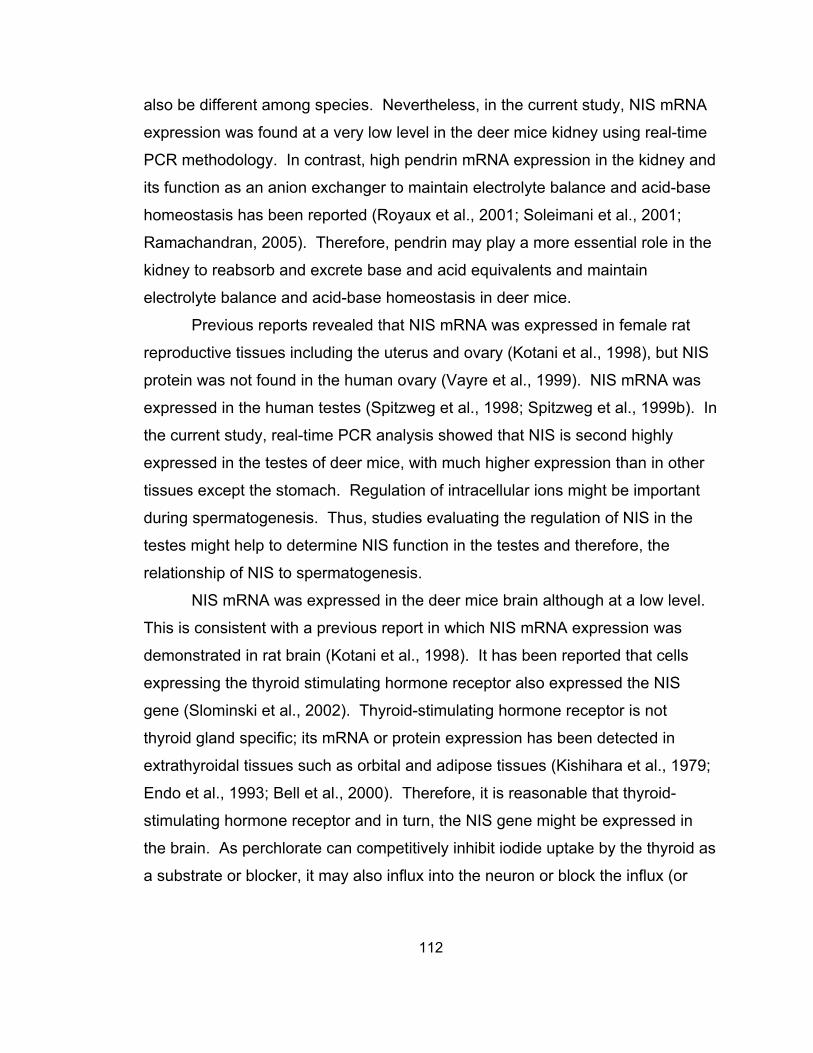
also be different among species. Nevertheless, in the current study, NIS mRNA
expression was found at a very low level in the deer mice kidney using real-time
PCR methodology. In contrast, high pendrin mRNA expression in the kidney and
its function as an anion exchanger to maintain electrolyte balance and acid-base
homeostasis has been reported (Royaux et al., 2001; Soleimani et al., 2001;
Ramachandran, 2005). Therefore, pendrin may play a more essential role in the
kidney to reabsorb and excrete base and acid equivalents and maintain
electrolyte balance and acid-base homeostasis in deer mice.
Previous reports revealed that NIS mRNA was expressed in female rat
reproductive tissues including the uterus and ovary (Kotani et al., 1998), but NIS
protein was not found in the human ovary (Vayre et al., 1999). NIS mRNA was
expressed in the human testes (Spitzweg et al., 1998; Spitzweg et al., 1999b). In
the current study, real-time PCR analysis showed that NIS is second highly
expressed in the testes of deer mice, with much higher expression than in other
tissues except the stomach. Regulation of intracellular ions might be important
during spermatogenesis. Thus, studies evaluating the regulation of NIS in the
testes might help to determine NIS function in the testes and therefore, the
relationship of NIS to spermatogenesis.
NIS mRNA was expressed in the deer mice brain although at a low level.
This is consistent with a previous report in which NIS mRNA expression was
demonstrated in rat brain (Kotani et al., 1998). It has been reported that cells
expressing the thyroid stimulating hormone receptor also expressed the NIS
gene (Slominski et al., 2002). Thyroid-stimulating hormone receptor is not
thyroid gland specific; its mRNA or protein expression has been detected in
extrathyroidal tissues such as orbital and adipose tissues (Kishihara et al., 1979;
Endo et al., 1993; Bell et al., 2000). Therefore, it is reasonable that thyroid-
stimulating hormone receptor and in turn, the NIS gene might be expressed in
the brain. As perchlorate can competitively inhibit iodide uptake by the thyroid as
a substrate or blocker, it may also influx into the neuron or block the influx (or
112
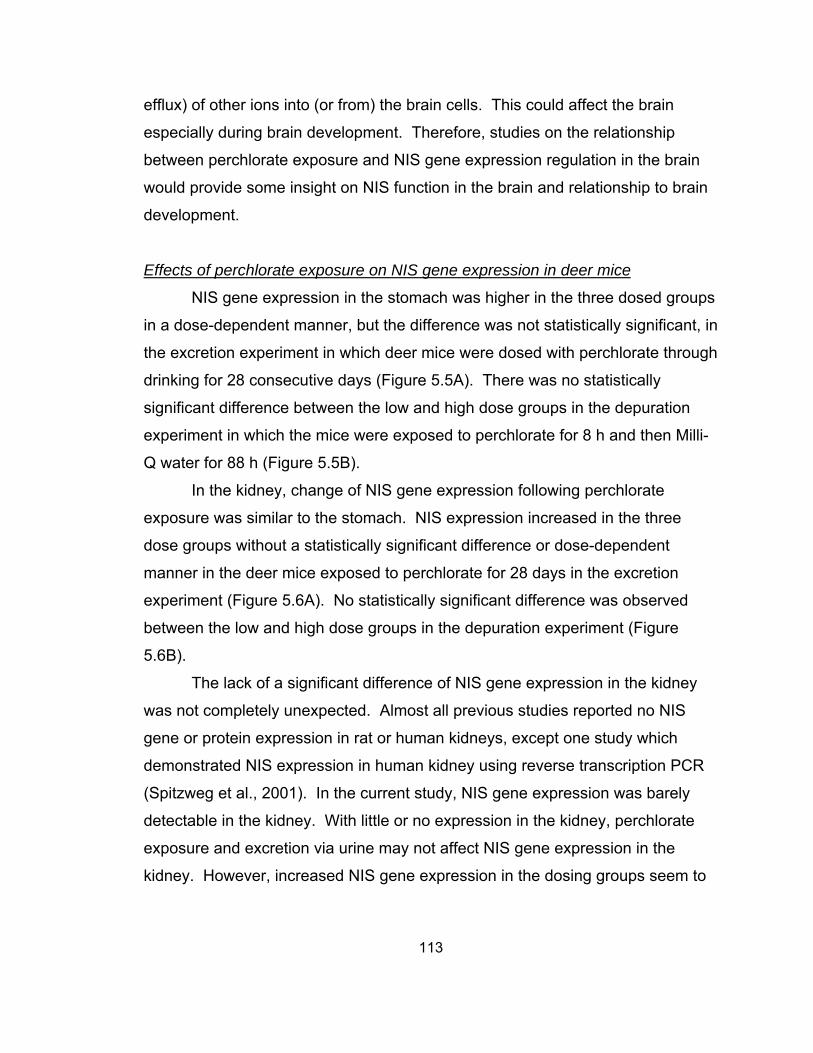
efflux) of other ions into (or from) the brain cells. This could affect the brain
especially during brain development. Therefore, studies on the relationship
between perchlorate exposure and NIS gene expression regulation in the brain
would provide some insight on NIS function in the brain and relationship to brain
development.
Effects of perchlorate exposure on NIS gene expression in deer mice
NIS gene expression in the stomach was higher in the three dosed groups
in a dose-dependent manner, but the difference was not statistically significant, in
the excretion experiment in which deer mice were dosed with perchlorate through
drinking for 28 consecutive days (Figure 5.5A). There was no statistically
significant difference between the low and high dose groups in the depuration
experiment in which the mice were exposed to perchlorate for 8 h and then Milli-
Q water for 88 h (Figure 5.5B).
In the kidney, change of NIS gene expression following perchlorate
exposure was similar to the stomach. NIS expression increased in the three
dose groups without a statistically significant difference or dose-dependent
manner in the deer mice exposed to perchlorate for 28 days in the excretion
experiment (Figure 5.6A). No statistically significant difference was observed
between the low and high dose groups in the depuration experiment (Figure
5.6B).
The lack of a significant difference of NIS gene expression in the kidney
was not completely unexpected. Almost all previous studies reported no NIS
gene or protein expression in rat or human kidneys, except one study which
demonstrated NIS expression in human kidney using reverse transcription PCR
(Spitzweg et al., 2001). In the current study, NIS gene expression was barely
detectable in the kidney. With little or no expression in the kidney, perchlorate
exposure and excretion via urine may not affect NIS gene expression in the
kidney. However, increased NIS gene expression in the dosing groups seem to
113
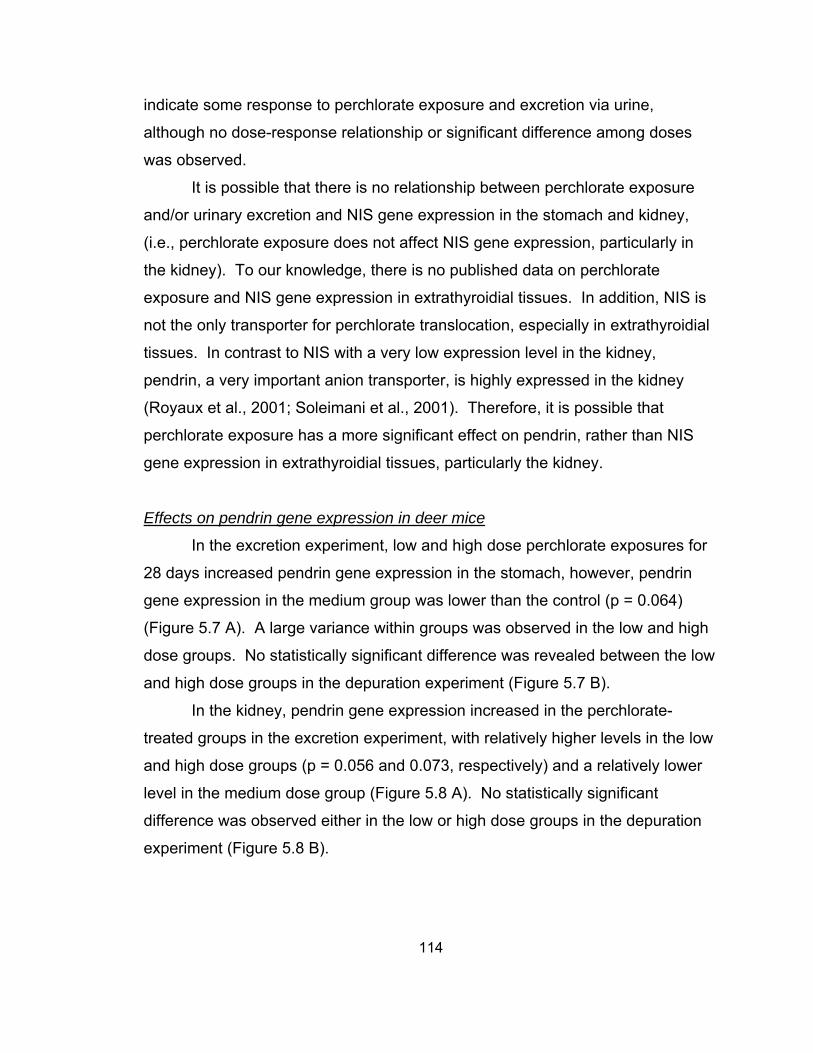
indicate some response to perchlorate exposure and excretion via urine,
although no dose-response relationship or significant difference among doses
was observed.
It is possible that there is no relationship between perchlorate exposure
and/or urinary excretion and NIS gene expression in the stomach and kidney,
(i.e., perchlorate exposure does not affect NIS gene expression, particularly in
the kidney). To our knowledge, there is no published data on perchlorate
exposure and NIS gene expression in extrathyroidial tissues. In addition, NIS is
not the only transporter for perchlorate translocation, especially in extrathyroidial
tissues. In contrast to NIS with a very low expression level in the kidney,
pendrin, a very important anion transporter, is highly expressed in the kidney
(Royaux et al., 2001; Soleimani et al., 2001). Therefore, it is possible that
perchlorate exposure has a more significant effect on pendrin, rather than NIS
gene expression in extrathyroidial tissues, particularly the kidney.
Effects on pendrin gene expression in deer mice
In the excretion experiment, low and high dose perchlorate exposures for
28 days increased pendrin gene expression in the stomach, however, pendrin
gene expression in the medium group was lower than the control (p = 0.064)
(Figure 5.7 A). A large variance within groups was observed in the low and high
dose groups. No statistically significant difference was revealed between the low
and high dose groups in the depuration experiment (Figure 5.7 B).
In the kidney, pendrin gene expression increased in the perchlorate-
treated groups in the excretion experiment, with relatively higher levels in the low
and high dose groups (p = 0.056 and 0.073, respectively) and a relatively lower
level in the medium dose group (Figure 5.8 A). No statistically significant
difference was observed either in the low or high dose groups in the depuration
experiment (Figure 5.8 B).
114
Pendrin expression among different tissues in deer mice has been
previously characterized (Ramachandran, 2005) but without information on
pendrin expression in the stomach. Transcription of the pendrin gene was not
detectable in any human digestive tract tissue (Lacroix et al., 2001). Therefore,
low or trace pendrin gene expression in the stomach could occur, and cause
large variance within groups.
In the depuration experiment, after 88-h depuration with clear Milli-Q
water, perchlorate concentration in urine decreased dramatically, especially in
the high dose group, with average of 22 and 87 µg/mL in the low and high dose
groups, respectively. No significant difference was observed between the low
and high dose groups regarding both NIS and pendrin gene expression in the
kidney, which were also comparable to (no significant difference from) that in the
control group in the excretion experiment. It indicates that these two transporters
gene expression in the kidney came down to a normal level after 88-h depuration
if they were induced at 8 h in the depuration experiment. It is also possible that
these two transporters still are able to handle perchlorate ion urinary excretion
even with high perchlorate burden in the body such as in the high dose group, if
perchlorate was excreted into urine via these two transporters.
Ammonium perchlorate exposure has been shown to alter pendrin gene
expression in deer mice kidney (Ramachandran, 2005), with different alteration
patterns at different mice ages. It seems likely that an animal’s age, dosing
period, and dosage would contribute to different effects of perchlorate on pendrin
gene expression in the kidney. However, compared to the present study, much
higher concentrations of ammonium perchlorate (58.5 and 117 µg/mL) were
used. In addition, high concentrations of ammonium perchlorate also contain
high levels of ammonium ion, which has been shown to have an effect on acid-
base balance and induction of metabolic acidosis (Tizianello et al., 1982; Tanner,
1984; Lina and Kuijpers, 2004). Therefore, use of ammonium perchlorate in the
exposure could complicate attempts to elucidate the effect of perchlorate ion on
115
pendrin gene expression in the kidney. In the current study, deer mice were
exposed to sodium perchlorate, which may have contributed to the different
effect pattern of perchlorate on pendrin gene expression in the kidney and lack of
statistical significance when compared to the study conducted by Ramachandran
(2005).
Several factors maybe have contributed to responsible for the lack of a
significant difference in both NIS and pendrin gene expression in the stomach or
kidney. The first is the fact that these animals were exposed to perchlorate
through food and water, which contained trace levels of perchlorate, before
initiation of the exposure study. Trace amounts of perchlorate exposure before
the dosing experiment may have allowed the deer mice to develop a tolerance to
perchlorate. Therefore, the effect of perchlorate exposure to a higher level
and/or urinary excretion on NIS gene expression may have been compromised.
The second is the fact that only 45 – 61% of the total perchlorate intake from
dosed drinking water was excreted via urine. Perchlorate metabolism or
organification may occur in the body and then result in less perchlorate excreted
via urine. Besides, no statistically significant difference was found among the
three treatments with regards to mass percentage of total perchlorate intake
through drinking water that was excreted via urine over the 28-day exposure.
Finally, high individual variance may result in non-significant differences among
the four dosing groups. Individual differences and a relatively small sample size
resulted in high standard deviations within groups. Thus, no statistically
significant difference was revealed, even though NIS gene expression in the
treatments was higher than the control and varied in a dose-dependent manner
in the stomach.
Is a 28-day exposure period long enough to induce NIS gene expression
and reveal a significant difference among the three treatments in the excretion
experiment? Longer exposure period was used in the study conducted by
Ramachandran (2005), and significant changes of pendrin gene expression was
116
observed in the deer mice kidney. While perchlorate urinary excretion rate was
found higher in the first two day during exposure period, and therefore
transporters gene expression could change significantly in a short time as well.
In the excretion experiment, gene expression was only investigated at day
28, at that time perchlorate urinary excretion rate has been decreased and
reached a steady state. Thus, NIS and pendrin gene expression in the kidney
could also turn back to the normal level and cause no significant increase
observed in the dose groups. Therefore, temporal pattern of NIS and (or)
pendrin gene expression in the kidney along perchlorate exposure period may
reveal a significant increase in certain time, such as at the first two days, in which
perchlorate urinary excretion rate was high. Transporters and their
corresponding mRNA may have different half-lives in the body (or specific
tissues) and then have different response to perchlorate exposure and urinary
excretion. Therefore, if the transporters (proteins) level or activity could be
measured in the current study, it would provide more information and insight on
the mechanism of perchlorate urinary excretion and potential health effect in the
animals.
Linear regression analysis between gene expression in the kidney at day
28 and perchlorate excretion did not show a significant relationship between
gene expression (either NIS or pendrin) in the kidney and perchlorate urinary
excretion mass at day 28, average daily excretion mass, or total excretion mass
over the 28 day exposure. No significant linear relationship was found neither
between NIS in the stomach and kidney, pendrin in the stomach and kidney, or
NIS in the stomach and pendrin in the kidney. It is possible that transporters
gene expression in the kidney and perchlorate urinary excretion at corresponding
time interval could show a significant relationship. However, there is a possibility
as well that perchlorate excretion via urine was facilitated by other transporters
rather than NIS and pendrin.
117
5.4 Conclusions
A partial sequence of deer mice NIS gene cDNA with 425 bps was
elucidated in the current study, which to our knowledge is the first discovery of
the deer mice NIS gene. Quantitative analysis of NIS mRNA expression in
various tissues was also studied for the first time with expression levels from
highest to lowest in deer mice tissues in the following order: stomach, testes,
brain, large intestine, lung, kidney, heart, and liver. Perchlorate exposure
through dosed drinking water for 28 days did not cause a significant effect on NIS
gene expression in the kidney and stomach, or pendrin gene expression in the
kidney, although gene expression increased in the dosing groups and a dose-
dependent manner was observed in NIS gene expression in the stomach. In the
depuration experiment, no significant difference was found between the low and
high dose groups (8-h exposure to perchlorate followed by an 88-h depuration
period) in terms of NIS or pendrin gene expression in the kidney or stomach.
Furthermore, no significant linear relationship was observed between both genes
expression in the kidney and perchlorate urinary excretion in the excretion
experiment. Several factors could complicate the effect of perchlorate exposure
on NIS and pendrin gene expression in the stomach and kidney. In the current
study, these include (1) pre-exposure to trace perchlorate through food and
water, which may have resulted in adaptation (or tolerance) in these animals; (2)
metabolism of perchlorate in deer mice, which may be the reason for only 46 –
61% perchlorate excreted into urine; (3) large differences among individuals and
relatively small sample size. It is also possible that there is no effect of
perchlorate exposure and/or excretion via urine on these two transporters gene
expression, particularly in the kidney.
118
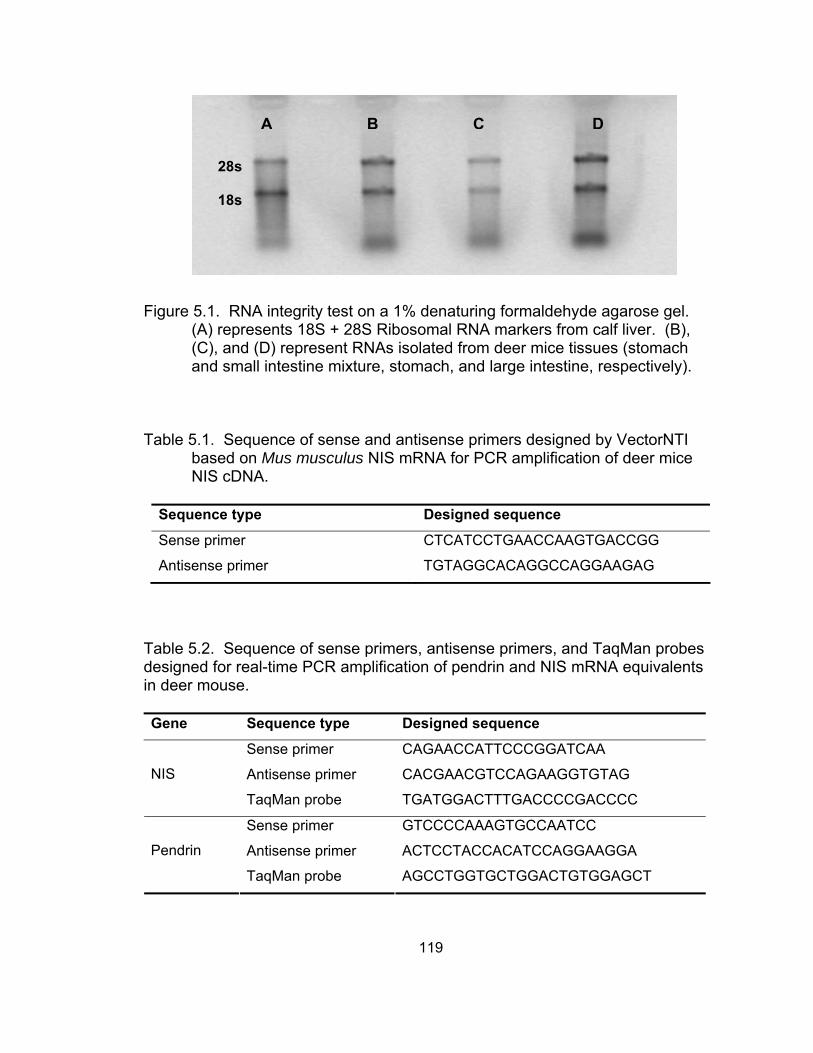
B C DA
28s 18s
Figure 5.1. RNA integrity test on a 1% denaturing formaldehyde agarose gel.
(A) represents 18S + 28S Ribosomal RNA markers from calf liver. (B), (C), and (D) represent RNAs isolated from deer mice tissues (stomach and small intestine mixture, stomach, and large intestine, respectively).
Table 5.1. Sequence of sense and antisense primers designed by VectorNTI
based on Mus musculus NIS mRNA for PCR amplification of deer mice NIS cDNA.
Sequence type Designed sequence
Sense primer CTCATCCTGAACCAAGTGACCGG
Antisense primer TGTAGGCACAGGCCAGGAAGAG
Table 5.2. Sequence of sense primers, antisense primers, and TaqMan probes designed for real-time PCR amplification of pendrin and NIS mRNA equivalents in deer mouse. Gene Sequence type Designed sequence
Sense primer CAGAACCATTCCCGGATCAA
Antisense primer CACGAACGTCCAGAAGGTGTAG NIS
TaqMan probe TGATGGACTTTGACCCCGACCCC
Sense primer GTCCCCAAAGTGCCAATCC
Antisense primer ACTCCTACCACATCCAGGAAGGA Pendrin
TaqMan probe AGCCTGGTGCTGGACTGTGGAGCT
119
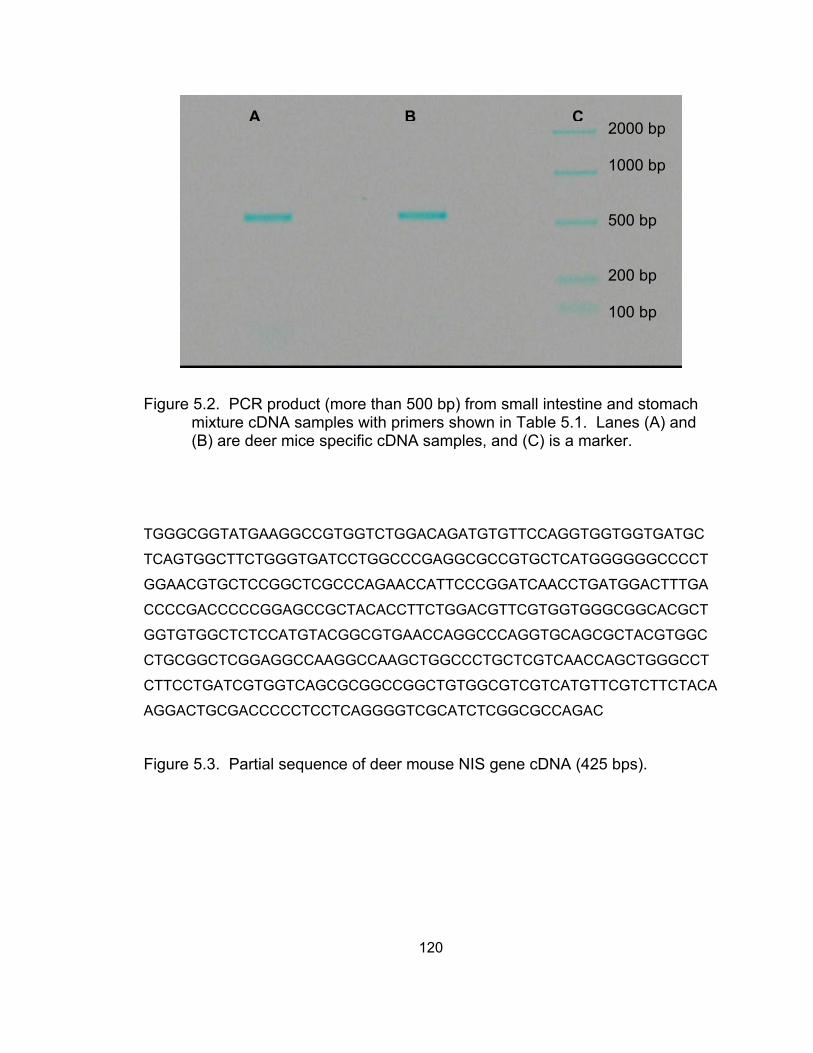
A B C2000 bp 1000 bp 500 bp 200 bp 100 bp
Figure 5.2. PCR product (more than 500 bp) from small intestine and stomach
mixture cDNA samples with primers shown in Table 5.1. Lanes (A) and (B) are deer mice specific cDNA samples, and (C) is a marker.
TGGGCGGTATGAAGGCCGTGGTCTGGACAGATGTGTTCCAGGTGGTGGTGATGC
TCAGTGGCTTCTGGGTGATCCTGGCCCGAGGCGCCGTGCTCATGGGGGGCCCCT
GGAACGTGCTCCGGCTCGCCCAGAACCATTCCCGGATCAACCTGATGGACTTTGA
CCCCGACCCCCGGAGCCGCTACACCTTCTGGACGTTCGTGGTGGGCGGCACGCT
GGTGTGGCTCTCCATGTACGGCGTGAACCAGGCCCAGGTGCAGCGCTACGTGGC
CTGCGGCTCGGAGGCCAAGGCCAAGCTGGCCCTGCTCGTCAACCAGCTGGGCCT
CTTCCTGATCGTGGTCAGCGCGGCCGGCTGTGGCGTCGTCATGTTCGTCTTCTACA
AGGACTGCGACCCCCTCCTCAGGGGTCGCATCTCGGCGCCAGAC
Figure 5.3. Partial sequence of deer mouse NIS gene cDNA (425 bps).
120
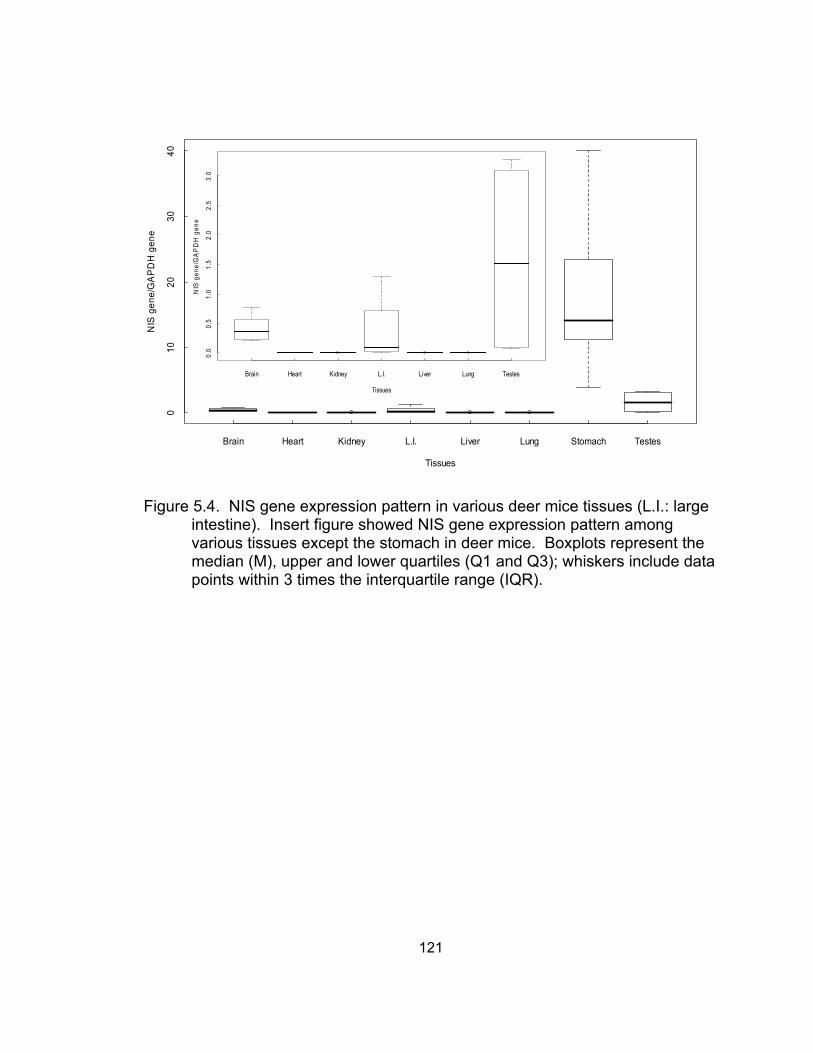
Figure 5.4. NIS gene expression pattern in various deer mice tissues (L.I.: large
intestine). Insert figure showed NIS gene expression pattern among various tissues except the stomach in deer mice. Boxplots represent the median (M), upper and lower quartiles (Q1 and Q3); whiskers include data points within 3 times the interquartile range (IQR).
Brain Heart Kidney L.I. Liver Lung Stomach Testes
010
2030
40
Tissues
NIS
gen
e/G
AP
DH
gen
e
Brain Heart Kidney L.I. Liver Lung Testes
0.0
0.5
1.0
1.5
2.0
2.5
3.0
Tissues
NIS
gen
e/G
AP
DH
gen
e
121
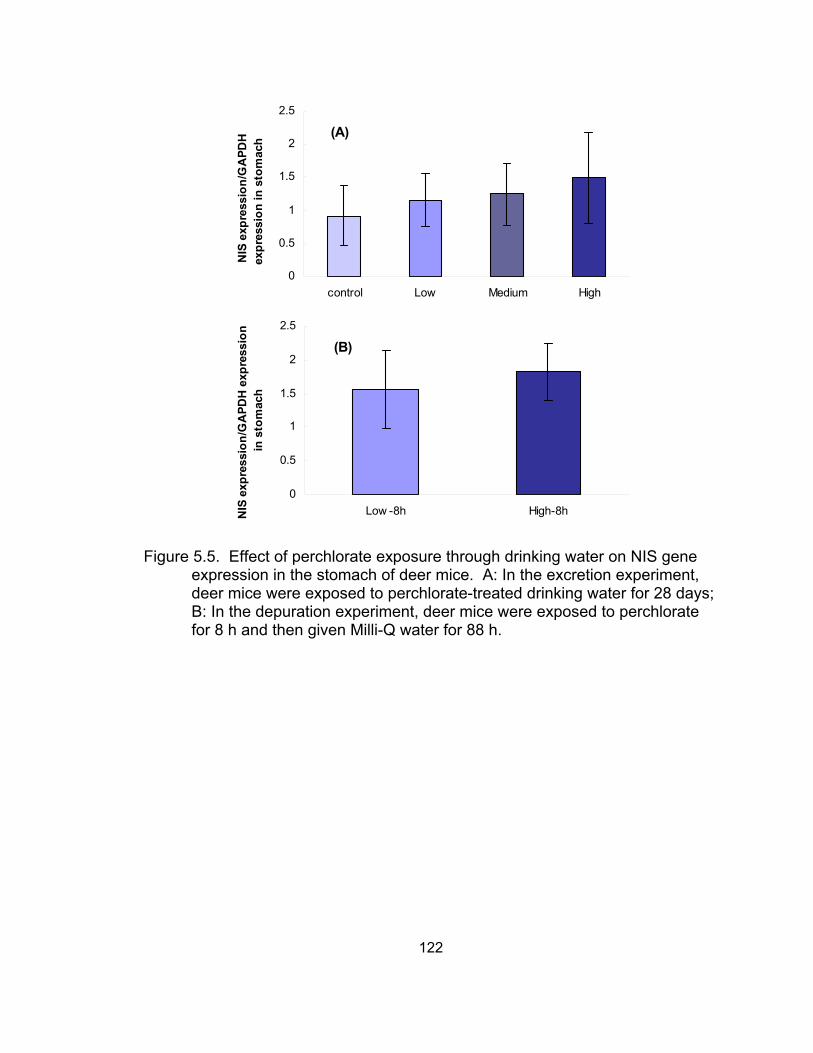
0
0.5
1
1.5
2
2.5
control Low Medium High
NIS
exp
ress
ion/
GA
PDH
ex
pres
sion
in s
tom
ach
(A)
0
0.5
1
1.5
2
2.5
Low -8h High-8hNIS
exp
ress
ion/
GA
PDH
exp
ress
ion
in s
tom
ach
(B)
Figure 5.5. Effect of perchlorate exposure through drinking water on NIS gene
expression in the stomach of deer mice. A: In the excretion experiment, deer mice were exposed to perchlorate-treated drinking water for 28 days; B: In the depuration experiment, deer mice were exposed to perchlorate for 8 h and then given Milli-Q water for 88 h.
122
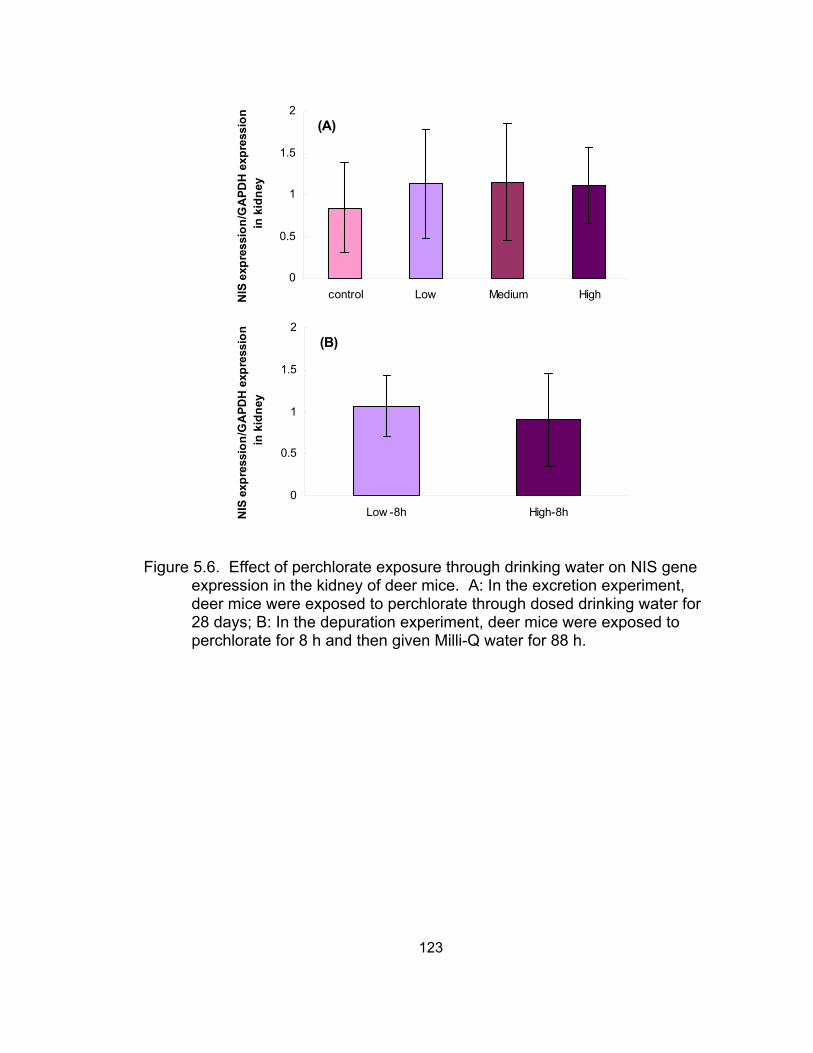
0
0.5
1
1.5
2
control Low Medium HighNIS
exp
ress
ion/
GA
PDH
exp
ress
ion
in k
idne
y
(A)
0
0.5
1
1.5
2
Low -8h High-8hNIS
exp
ress
ion/
GA
PDH
exp
ress
ion
in k
idne
y
(B)
Figure 5.6. Effect of perchlorate exposure through drinking water on NIS gene
expression in the kidney of deer mice. A: In the excretion experiment, deer mice were exposed to perchlorate through dosed drinking water for 28 days; B: In the depuration experiment, deer mice were exposed to perchlorate for 8 h and then given Milli-Q water for 88 h.
123
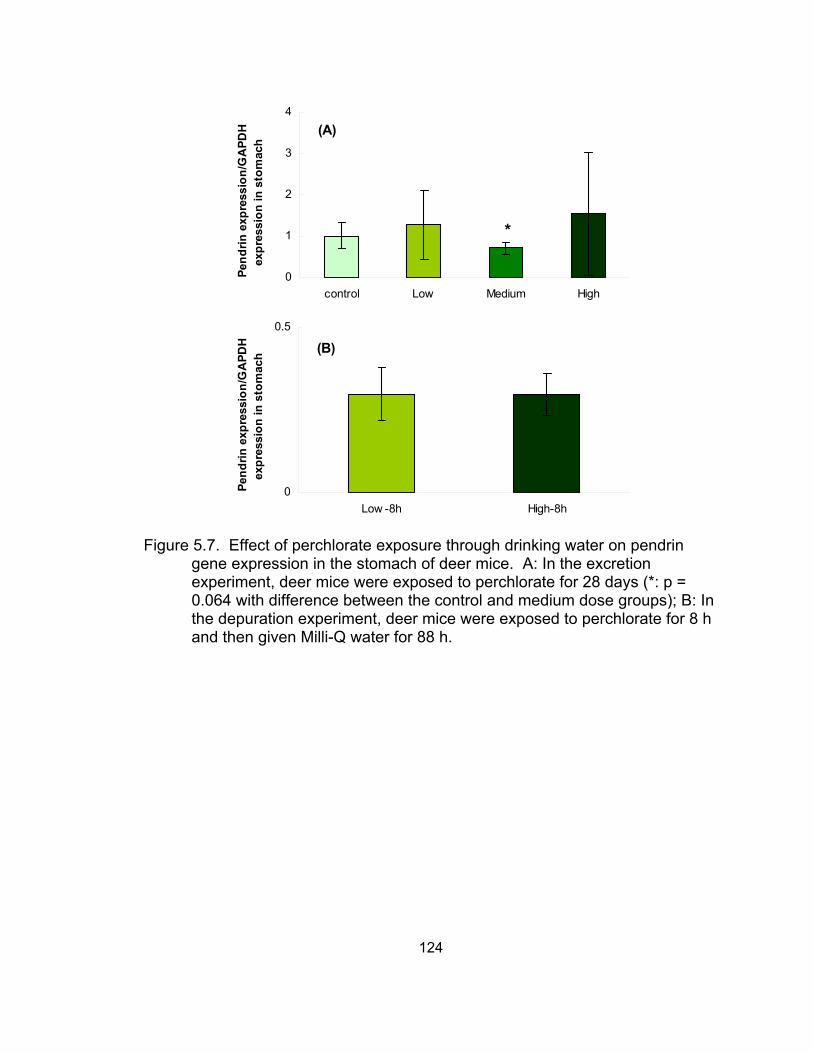
0
1
2
3
4
control Low Medium High
Pend
rin e
xpre
ssio
n/G
APD
H
expr
essi
on in
sto
mac
h
(A)
*
0
0.5
Low -8h High-8h
Pend
rin e
xpre
ssio
n/G
APD
H
expr
essi
on in
sto
mac
h (B)
Figure 5.7. Effect of perchlorate exposure through drinking water on pendrin
gene expression in the stomach of deer mice. A: In the excretion experiment, deer mice were exposed to perchlorate for 28 days (*: p = 0.064 with difference between the control and medium dose groups); B: In the depuration experiment, deer mice were exposed to perchlorate for 8 h and then given Milli-Q water for 88 h.
124
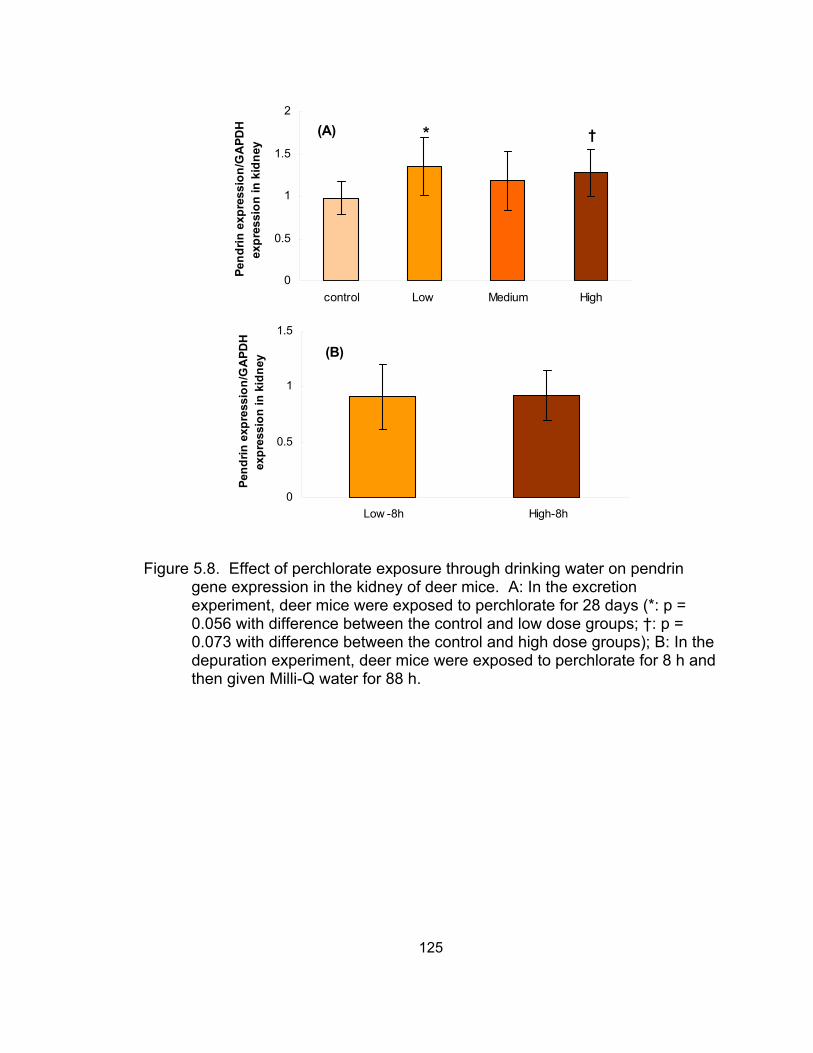
0
0.5
1
1.5
2
control Low Medium High
Pend
rin e
xpre
ssio
n/G
APD
H
expr
essi
on in
kid
ney
(A) †*
0
0.5
1
1.5
Low -8h High-8h
Pend
rin e
xpre
ssio
n/G
APD
H
expr
essi
on in
kid
ney (B)
Figure 5.8. Effect of perchlorate exposure through drinking water on pendrin
gene expression in the kidney of deer mice. A: In the excretion experiment, deer mice were exposed to perchlorate for 28 days (*: p = 0.056 with difference between the control and low dose groups; †: p = 0.073 with difference between the control and high dose groups); B: In the depuration experiment, deer mice were exposed to perchlorate for 8 h and then given Milli-Q water for 88 h.
125
CHAPTER VI PERCHLORATE EFFECTS ON FATTY ACID PROFILES IN MILK
6.1 Introduction
Milk fat is important for growing newborn(s) by acting as an energy source
as well as involvement in some other biological processes (Koletzko and
Rodriguez-Palmero, 1999; Jensen and Heird, 2002; Alessandri et al., 2004;
German and Dillard, 2006). For example, lipids are structural components of all
tissues, and fatty acids are indispensable for cell membrane synthesis. Lipids
comprise 50-60% of the dry weight of the adult brain, of which approximately
35% are in the form of long chain polyunsaturated fatty acids (PUFA), with
arachidonic acid (AA, C20:4n6) and docosahexaenoic acid (DHA, C22:6n3) as
the majority (Wainwright, 2002). Therefore, the early development of highly
specialized organs, such as brain and retinal tissue, requires adequate intake of
fatty acids, especially PUFA (Koletzko and Rodriguez-Palmero, 1999; Alessandri
et al., 2004). PUFA are incorporated into nerve cell membranes, modulate
membrane biophysical properties, and contribute to the functional maturation of
the central nervous system. In addition, PUFA are also involved in the regulation
of neurotransmitter release, synthesis of biologically active oxygenated
derivatives, and gene expression at the transcriptional level during adipocyte
differentiation (Uauy et al., 2000; Uauy et al., 2001; Wainwright, 2002; Alessandri
et al., 2004; Lapillonne et al., 2004).
Lower PUFA intake through milk causes deficiencies in PUFA and could
arrest the development of the immune system, brain, and visual system in infants
(Neville and Picciano, 1997; Heird, 2001; Alessandri et al., 2004). Essential fatty
acid (EFA) deficiency impairs physical and behavioral development, extreme
dietary fatty acid imbalance such as high DHA levels with low ω-6 fatty acids
levels causes growth retardation in mice, and dietary deficiency of ω-3 fatty acids
during development leads to characteristic changes in fatty acid composition in
the brain (Wainwright, 2002). Deficiency of PUFA has been implicated in
126
schizophrenia and attention-deficit hyperactivity disorder in humans (Stevens et
al., 1996; Wainwright, 2002). Alteration of PUFA composition in membranes may
also affect a variety of membrane functions such as effects on ion channels,
transporters, protein binding, cellular and intracellular signal transduction, and
neurotransmission (Wainwright, 2002). As the only food source to infants, milk
quality in terms of fatty acid composition is very important for normal infant
growth and development.
Milk fat synthesis is a multiple step process with the involvement of many
enzymes, such as fatty acid synthase (FAS), which is the key enzyme for de
novo synthesis of fatty acids within mammary epithelial cells for short- and
medium-chain fatty acids (C ≤ 14) (Hadley, 2000). Thyroid hormone (i.e.
triiodothyronine) was reported to stimulate transcription of the fatty acid synthase
gene (Goodridge, 1986; Wilson et al., 1986; Stapleton et al., 1990; Kameda,
1995). Therefore, as a thyroid hormone disruptor, perchlorate may affect de
novo fatty acid synthesis in mammary gland. In addition to the fatty acids de
novo synthesized in mammary gland, other origins of fatty acids for milk fat
synthesis include: from endogenous stored lipids (and/or fatty acids), from
synthesis of lipids (and/or fatty acids) by liver or other tissues, and from the diet
(Neville and Picciano, 1997). Fatty acids for milk fat synthesis, especially the
long chain fatty acids with C ≥ 16, can be derived from these lipids from the
circulation system through hydrolysis regulated by lipoprotein lipase (LPL),
another important enzyme for milk fat synthesis (Hamosh et al., 1972; Iverson et
al., 1995). It has been reported that de novo fatty acid synthesis in the liver and
triglycerides synthesis in both the liver and kidney were reduced in the presence
of KClO4 in sea lamprey (Kao et al., 1999). Therefore, circulating lipids or non-
esterified fatty acids could decrease and result in less fatty acids available to the
mammary epithelial cells for milk fat synthesis, particularly the long chain fatty
acids (C ≥ 16).
127
Hormones such as prolactin also play important roles in mammary gland
development and milk synthesis and secretion. Prolactin has been postulated to
regulate activation of LPL in the mammary gland (Neville and Picciano, 1997;
Hadley, 2000). Prolactin may also affect the activity of FAS. Induction of
prolactin requires thyroid hormones (Hadley, 2000). Therefore, as a thyroid
hormone disruptor, perchlorate may eventually have an influence on the fatty
acid composition of milk fat through interference with prolactin and in turn, the
function of LPL and (or) fatty acid synthase. Interruption in thyroid hormone
production by perchlorate may also change fatty acid profile in milk fat through
affecting fatty acid de novo synthesis in other tissues such as the liver in addition
to the mammary gland. The proposed relationship between fatty acid profile in
milk fat and perchlorate is illustrated in Figure 6.1.
Perchlorate has been well documented as a thyroid hormone disruptor
since it competitively inhibits iodide uptake by the thyroid gland, and as a result,
interferes with normal thyroid hormone production. In mammals, this interference
affects development, growth, and metabolism (Wolff, 1998; Soldin et al., 2001).
Environmental contamination of perchlorate in the United States appears to be
widespread, especially in aqueous systems, because of its use in military
munitions and other industrial products, such as rocket propellant, fireworks, and
air bags, and also its natural occurrence (Susarla et al., 1999; Urbansky et al.,
2001; Dasgupta et al., 2005; Jackson et al., 2005a). Perchlorate can be taken up
into plants and animals (Siglin et al., 2000; Smith et al., 2001; Smith et al.,
2004b; Tan et al., 2004; Yu et al., 2004; Jackson et al., 2005b; Sanchez et al.,
2005). Humans can be exposed to perchlorate through drinking water or trophic
transfer. Recently, reports indicated that perchlorate occurs in supermarket milk
samples and human milk, and that perchlorate can be excreted into cow milk
(Kirk et al., 2003; Krynitsky et al., 2004; Capuco et al., 2005). This suggests that
perchlorate contamination in the U. S. is more widespread than was originally
thought and human exposure to perchlorate has likely occurred for several years.
128
There is a concern about the potential effect of perchlorate exposure on
milk quality, particularly because perchlorate has been found to exist in milk. Our
preliminary data revealed a weak negative relationship between perchlorate
residue levels and PUFA levels in human breast milk samples collected locally.
Therefore, maternal exposure to perchlorate may affect normal growth and brain
development in infants by altering fatty acid composition, particularly PUFA in
milk fat, since fatty acids play important roles in brain development, physical
growth, behavioral development, and many other biological processes (Stevens
et al., 1996; Koletzko and Rodriguez-Palmero, 1999; Uauy et al., 2001;
Wainwright, 2002; Alessandri et al., 2004).
In the current study, we evaluated the effect of perchlorate on fatty acid
composition in milk fat in lactating goats exposed to different levels of perchlorate
at a variety of exposure intervals. The hypothesis tested in our study was that
exposure of the lactating goats to perchlorate would change the fatty acid profile
in the goat milk. Additionally, the correlation between perchlorate concentrations
and fatty acid profile in human breast milk was investigated to further evaluate
the potential risk of human exposure to perchlorate.
6.2 Materials and Methods
Experimental design and sample collection
Eighteen lactating goats from the Texas Tech University Agriculture
Research Farm were assigned to three different perchlorate dosing groups,
including 0, 0.1, and 1 mg/kg body weight (i.e., six goats in each dosing group).
Each group consisted of goats of similar weight (and presumably age). For
example, four “heavier” (presumably older) goats were paired with two “light”
(presumably younger) goats to form each group. The goats were orally dosed
from Monday to Friday of each week (May 19th - June 21st 2003). Milk was
collected daily before perchlorate dosing. Milk samples were placed on ice after
collection and during transport back to the laboratory, where they were stored at -
129
20ºC until analysis. Fatty acid analyses were conducted for milk samples
collected on May 20th (day 2), May 28th (day 10), June 4th (day 17), June 11th
(day 24), and June 18th (day 31). Because some samples were unavailable for
fatty acid analysis, n ranged from 3 – 6 for different groups at different times.
Thirty-nine human milk samples were provided by the Department of
Human Development and Family Studies, Texas Tech University. These
samples were collected from healthy lactating mothers residing in Lubbock, TX or
nearby counties (from July 2004 to June 2005). Lactation stages were around
either 6 weeks or 3 months. Samples were stored at -20ºC after collection until
analysis.
Fatty acid analysis in milk
Frozen samples were thawed at room temperature and then heated at 85
ºC for 15 minutes to inactivate milk lipases. Each sample was prepared in
triplicate. Lipids were extracted from milk samples with chloroform/methanol
(2:1) containing 0.01% butylated hydroxytoluene (BHT) (Folch et al., 1957), and
then transesterified with 12% boron trifluoride (BF3) in methanol into fatty acid
methyl esters (Morrison and Smith, 1964). Fatty acid methyl esters were
extracted into hexane and analyzed using a Hewlett-Packard gas chromatograph
(HP 6890 series, USA) equipped with a flame ionization detector and a fused
silica capillary DB-WAX column (30 m × 0.32 mm ID, 0.25 μm film thichness)
from J&W Scientific (Folsom, CA). The oven temperature program was: initial
temperature 35 ºC, held for 2 min; raised to 210 ºC at a rate of 20 ºC/min, and
held at 210 ºC for 5 min; raised to 215 ºC at a rate of 1 ºC/min; raised again to
230 ºC at 8 ºC/min and held at 230 ºC for 5 min. The injector and detector
temperatures were 250 ºC. Helium was used as the carrier gas at a flow velocity
of 44 cm/sec. Identification and quantification of fatty acids in samples were
based on a 37-component FAME mixture standard (AccuStandard Inc. New
130
Haven, CT). Recovery of an internal standard (C19:0) was 84 ± 13% (mean ±
SD).
Monounsaturated fatty acids (MUFA), PUFA, medium-chain fatty acids,
and long-chain fatty acids were investigated as endpoints. MUFA consisted of
C16:1n9, 18:1n9, 20:1n9, and 22:1n9. PUFA included ω-6 series (C18:2n6,
18:3n6, 20:3n6, and 20:4n6), and ω-3 series (C18:3n3, 20:3n3, 20:5n3, and
22:6n3). Medium-chain fatty acids were composed of fatty acids with carbons ≤
14 (C8:0, 10:0, 12:0, and 14:0), and long-chain fatty acids included fatty acids
with carbons ≥ 16 (C16:0, 16:1n9, 18:0, 18:1n9, 18:2n6, 18:3n6, 18:3n3, 20:0,
20:1n9, 20:3n3, 20:3n6, 20:4n6, 20:5n3, 22:0, 22:1n9, and 22:6n3). Fatty acid
was expressed as a percentage of extracted lipid from the goat milk, and as a
percentage of total fatty acids for the human milk samples.
Perchlorate determination in human milk
An aliquot of human breast milk sample (1.5 mL) and 6 mL of acetonitrile
were combined into a 15-mL centrifuge tube followed by centrifugation at 3750
rpm for 10 min (Beckman Allegra 6R Centrifuge, USA). The supernatant was
evaporated to ~ 0.5 mL using nitrogen gas, and then passed through a
preconditioned C18 solid phase extraction (SPE) cartridge (Fisher). The eluate
was collected and the cartridge was then washed with 4 mL of 18.3 MΩ Milli-Q
water, which was combined with the eluate. Two replicates from one sample
were pooled and evaporated to a final volume of 3 mL. After cleanup through an
Alumina-neutral SPE cartridge (J.T. Baker, Phillipsburg, NJ), the eluate was
syringe-filtered (0.45 μm) before ion chromatography analysis.
A method similar to EPA Method 314.0 (Hautman et al., 1999) was
followed to determine perchlorate in human breast milk samples. The milk
analysis was performed on a Dionex DX-500 Ion Chromatography System
equipped with a GP50 gradient pump, a CD20 conductivity detector, and an
AS40 autosampler (Dionex Corp.). PeakNet® chromatography software was
131
used to control the system. Ion separation was made with a Dionex IonPac
AS16 (250 mm × 4.0 mm) analytical column following a Dionex guard column
(AG16). Conditions for the system were as follows: flow rate = 1.0 mL/min;
eluent = 50 mM sodium hydroxide; injection volume = 1000 µL.
Quantification of perchlorate was accomplished using an external
standard method. An instrument calibration curve was constructed by analyzing
standards at 2.5, 5, 10, 50, 100 μg/L perchlorate. Quality control samples
included blanks, matrix spikes, and check standards. The limit of detection for
perchlorate was 1 μg/L by IC. Recovery of spiked perchlorate (including cleanup
and IC analysis) was 81 – 115%.
Statistical analysis
Statistical analyses were conducted using R software (R 2.0.1 vision, Free
Software Foundation, Boston, MA). Two-way ANOVA was conducted to test the
effects of two factors: dosage and dosing time, and/or their interaction.
Differences in fatty acid composition of milk among the three treatments at either
exposure interval in goats were tested using one-way ANOVA followed by
Tukey’s multiple comparison. A linear regression analysis between perchlorate
content and total PUFA levels in the human milk samples was also conducted.
Student’s t-test was used to test the difference in fatty acid profiles between two
different lactation stages in humans (6-week and 3-month).
6.3 Results and Discussion
Fatty acid profile in goat milk dosed with perchlorate
Results of the two-way ANOVA are shown in Table 6.1. No significant
effect was found in terms of the interaction of dosage and dosing time regarding
all end-points. Time had a significant effect on fatty acid profiles in terms of all
end-points, and dose showed a significant effect on fatty acid profile (PUFA, ω-6,
ω-3, and MUFA content). Total PUFA content and ω-6 fatty acids in goat milk
132
were significantly reduced at day 10 (p = 0.0053 and 0.0113, respectively), day
17 (p < 0.001), and day 24 (p < 0.05), but not at days 2 and 31 in the high dose
treatment (Figures 6.2 and 6.3). ω-3 fatty acids showed no apparent dose-
dependent response during perchlorate exposure (data not shown). MUFA
content was significantly reduced only at day 17 (p = 0.0130) in the high dose
treatment (Figure 6.4). Although dose did not show a significant effect on
medium-chain and long-chain fatty acids (MCFA and LCFA) in milk (Table 6.1),
differences in both MCFA and LCFA among the three treatments were still tested
using one-way ANOVA. Significant reductions in medium- and long-chain fatty
acids were observed at day 24 only (p = 0.0431 and 0.0097, respectively)
(Figures 6.5 and 6.6). No significant difference was observed over the dosing
time in terms of PUFA and ω-6 fatty acids in both control and low dose groups
(Figure 6.7), but there was a significant difference between day 17 and 31
regarding both PUFA and ω-6 in the high dose group.
PUFA play key roles in the early development of young and are involved
in organogenesis (e.g. brain and retinal formation and development) (Koletzko
and Rodriguez-Palmero, 1999; Uauy et al., 2000; Uauy et al., 2001; Alessandri et
al., 2004). Therefore, adequate intake of PUFA is necessary for normal
development. In the current experiment, total PUFA was decreased at days 10,
17, and 24 for both perchlorate exposure scenarios, with a particularly significant
reduction occurring in the 1 mg/kg treatment (Figure 6.2). This indicates that
perchlorate exposure depressed total PUFA in milk of lactating goats, causing a
deficiency in PUFA available to the young. Maternal PUFA is the major PUFA for
younglings during early development. Therefore, supplementation of PUFA to
the diet of lactating goats could be required if perchlorate exposure occurs,
although some PUFA can be synthesized in and secreted from the mammary
gland (Marangoni et al., 2004) in addition to fatty acids derived from the diet.
Similar to the response of total PUFA upon perchlorate exposure, ω-6
fatty acids were reduced at days 10, 17, and 24 for both perchlorate treatments
133
(Figure 6.3). ω-6 fatty acids account for a major portion of total PUFA in goat
milk. In the current study, a significant linear correlation was found between ω-6
fatty acids and total PUFA content in all goat milk samples (r2 = 0.9929) at day
17. Therefore, ω-6 fatty acids and total PUFA in milk responded similarly to
perchlorate exposure. Among the ω-6 fatty acids examined in the current study,
linoleic acid (LA, C18:2n6) was the dominant fatty acid. Also, a significant linear
correlation existed between the LA content and total PUFA content within all
perchlorate treatments (r2 = 0.9873) at day 17. LA was proposed as a precursor
for long-chain PUFA, such as arachidonic acid (AA, C20:4n6) and
docosahexaenoic acid (DHA, C22:6n3) which are indispensable nutrients for
early development and growth of the brain and retina (Innis, 2000; Uauy et al.,
2000; Uauy et al., 2001; Alessandri et al., 2004; Marangoni et al., 2004; Innis,
2005). In the current study, AA and DHA in the high dose group decreased to
79.4 ± 12.82 % of the control at day 24 and 63.2 ± 16.80 % of the control at day
31, respectively. This is probably due to the decrease in the precursor of long-
chain PUFA, i.e. LA, during exposure, which decreased to 61.4 ± 15.63 % of the
control at day 17 and 64.8 ± 6.47 % of the control at day 24.
As seen in Figures 6.2 and 6.3, the maximum reduction of both PUFA and
ω-6 fatty acids in the 0.1 mg/kg perchlorate treatment occurred later than at the 1
mg/kg treatment. The delayed response of goats to the lower perchlorate
treatment indicates that the higher perchlorate concentrations appear to act on
and alter PUFA and ω-6 fatty acid content with greater efficiency.
The lack of a significant change in the endpoints evaluated for all
exposure scenarios at day 2 (Figures 6.2 - 6.6) indicates that a 2-day exposure
to perchlorate, up to 1 mg/kg, was not sufficient to alter the fatty acid profile in
goat milk. This was not completely unexpected because milk fat biosynthesis is
a complex process in which many molecular-level activities are involved (Figure
6.1) and some time is needed for an effect to be manifested. The reduction in
most fatty acids that occurred at days 10, 17, and/or 24 was reversed; no
134
significant difference was found when compared with the control at day 31
(Figures 6.2 - 6.6). This is possibly due to adaptation mechanisms which might
be induced to compensate for the effect of perchlorate exposure, such that the
goats increased the removal of perchlorate via milk and/or urine. Kirk et al
(2005) found that the perchlorate content in milk 24 hours after perchlorate
dosing was significantly reduced when compared with levels at 2 hours post-
dose (perhaps because less perchlorate was available for excretion with time).
Excretion of perchlorate via urine is a major pathway for mammals following
perchlorate exposure (Anbar et al., 1959; Goldman and Stanbury, 1973; Peña et
al., 1976; Batjoens et al., 1993; Yu et al., 2002; Capuco et al., 2005). A study on
the temporal pattern of urine excretion of perchlorate could provide an answer to
whether animals can reduce perchlorate effects by increasing excretion via urine
upon exposure to perchlorate. Perchlorate excretion via urine in deer mice,
whether based on perchlorate concentration or mass percentage of the total
intake through dosed drinking water, increased and achieved a steady state soon
(24 h) after perchlorate exposure (Chapter IV). Inconsistent temporal patterns
between urine excretion of perchlorate and changes in fatty acid profiles may be
a result of the complex and multiple-step process of fatty acid synthesis, which
needs some time to manifest the effect of perchlorate.
The reverse effect described earlier may also be caused by the increased
production of thyrotropin-releasing hormone (TRH), resulting from decreased
thyroid hormone negative feedback. As a potent prolactin-releasing factor, TRH
can stimulate prolactin secretion from the pituitary (Cooke et al., 2004), and as a
result, alter the fatty acid profile in milk by reversing the effect of perchlorate.
It was observed that there was no significant difference between 0.1
mg/kg and 1 mg/kg perchlorate treatments after week 1 through week 4 in terms
of mean perchlorate residues in goat milk collected 24 hours after dosing (Kirk,
2005), suggesting that perchlorate did not accumulate in milk. In the current
study, perchlorate exposure caused pronounced effects on all endpoints at day
135
10, day 17, and/or day 24 (Figures 6.2 - 6.6). This discrepancy between reduced
perchlorate residues in milk (i.e. week 1 through week 4) and the effect of
perchlorate on the fatty acid profile in milk (i.e. days 10, 17, and/or 24) suggests
that perchlorate does not act directly on fatty acids in milk. Fatty acid synthesis
and secretion in milk is partly regulated by prolactin and involves activation (or
function) of lipoprotein lipase (LPL) and fatty acid synthase, which are the
principle enzymes of fatty acid mobilization and synthesis in mammary epithelial
cells (Hamosh et al., 1972; Hadley, 2000). Alternatively, thyroid hormones are
necessary for the induction of prolactin and can stimulate transcription of the fatty
acid synthase gene (Goodridge, 1986; Wilson et al., 1986; Stapleton et al., 1990;
Kameda, 1995; Hadley, 2000). Therefore, theoretically, disruption of thyroid
hormone production by perchlorate exposure can ultimately alter the fatty acid
profile in milk (Figure 6.1), as was observed in the current study. A mechanistic
study needs to be conducted to determine what specific events occur during this
cascade.
Diet has a major influence on fatty acid composition in milk (Finley et al.,
1985; Neville and Picciano, 1997; Francois et al., 1998; Chilliard et al., 2003;
Chilliard and Ferlay, 2004), but milk and (or) milk fat composition also changes
with lactation stage (Arumughan and Narayanan, 1981; Zanartu et al., 1983;
Neville and Picciano, 1997). In the current study, the goats had access to the
same food and water, but their stage of lactation was unknown (i.e. they may not
have been at the same stage of lactation despite the food, water, and weight
grouping). Therefore, differences in lactation stage could have been a
confounding factor in the altered fatty acid profile in milk observed in this study.
Nevertheless, changes in fatty acid profiles in goat milk observed in the current
study were consistent with previous reports to a certain degree. Reduction in
milk fat was observed in a cow study with perchlorate exposure, although the
value was within the normal range for good health (Capuco et al., 2005). In
addition, it was also reported that de novo fatty acid synthesis in the liver and
136
triglyceride synthesis in both the liver and kidney were reduced in the presence
of KClO4 in sea lamprey (Kao et al., 1999).
Human milk survey
No significant statistical difference was observed between the 6-week and
3-month lactation stages in terms of either each fatty acid, total saturated fatty
acids, MUFA, PUFA, ω-3, ω-6, medium-chain fatty acids (C ≤14), or long-chain
fatty acids (C ≥ 16) (t-test, p > 0.05). A weak negative relationship (r2 = 0.033, p
= 0.267) between perchlorate concentrations and total PUFA levels in the 39
human milk samples was observed (Figure 6.8). As was the case for the goat
milk samples, there were good linear relationships between linoleic acid
(C18:2n6) and total PUFA, and ω-6 and total PUFA (r2= 0.9598 and 0.9769,
respectively). The difference in total PUFA among samples resulted mainly from
differences in linoleic acid. However, no significant relationship (either positive or
negative with p < 0.1) was found between AA, DHA, MUFA, medium- or long-
chain fatty acids and perchlorate concentrations. Given an average body weight
of 5.8 kg and an average daily breast milk intake of 712 mL for a 1 to 4-month old
baby (EPA, 1996), the reference dose of 0.7 μg/kg/day recommended by the
National Academy of Science (NAS, 2005) can be converted into a perchlorate
concentration in breast milk of 5.70 μg/L. When the ranges of observed
perchlorate and DHA were divided into two groups, four quadrants were formed
(Figure 6.9); not a single datum with high DHA (> 0.1%) – high perchlorate (>
5.70 μg/L) was found for these samples.
Perchlorate was detected in all human milk samples, ranging from 0.84 to
8.18 μg/L with an average of 3.43 μg/L. During the first 6 months of lactation
with exclusive breast-feeding, 24 h milk production from each breast is 453.6 ±
201 g (Kent et al., 1999). Assuming 5% of the perchlorate taken up by a 50-kg
lactating mother was excreted via milk, then the perchlorate exposure level to the
mother would be about 1.48 μg/kg body weight with a maximum of 2.14 μg/kg
137
(corresponding to average and high 24 h milk production with the maximum
perchlorate residues in milk, i.e. 8.18 μg/L). The fact that the predicted
perchlorate exposure level in humans was much lower than that administered in
the goat dosing study could explain why no significant relationship was found
between either endpoint and perchlorate concentrations in the human milk. In
addition, nutritional and physical factors which can influence fatty acid
composition in milk were not incorporated into the data analyses. Furthermore,
due to the unavailability of information about perchlorate exposure conditions
such as time, frequency, and source, the effect of perchlorate on fatty acid
composition in human milk samples were not conclusive. An epidemiological
study with large sample sizes would contribute more to evaluating the potential
risk of perchlorate on pregnant and/lactating women and their infants.
Both thyroid hormones and PUFA are very important in the early
development of infants, especially for brain development. Thyroid hormones
regulate the processes of neuronal proliferation, migration, synpatogenesis, and
myelination, as well as promote the uptake of amino acids, glucose, and other
necessary nutrients by brain tissues (Chan and Kilby, 2000; Brown, 2003;
Zoeller, 2003). Brain structure requires complex lipids, especially PUFA
(Koletzko and Rodriguez-Palmero, 1999; Alessandri et al., 2004). As a sole
source of nutrients for the infant, high breast milk quality is critical for normal
development and growth. In the current study, we found that perchlorate
depressed the total PUFA content in goat milk. This could also occur in human
milk if perchlorate exposure occurs at higher levels. In addition, it was reported
that perchlorate at concentrations above 10 µg/L in milk was associated with low
iodine content in human breast milk (Kirk et al., 2005). Adequate iodide intake is
necessary for pregnant and lactating women. If maternal exposure to
perchlorate occurs, it is possible that insufficient maternal thyroid hormones,
PUFA, and/or iodide is available for the normal development and growth of the
infants. Malnutrition, difficulty with motor coordination and balance, and attention
138
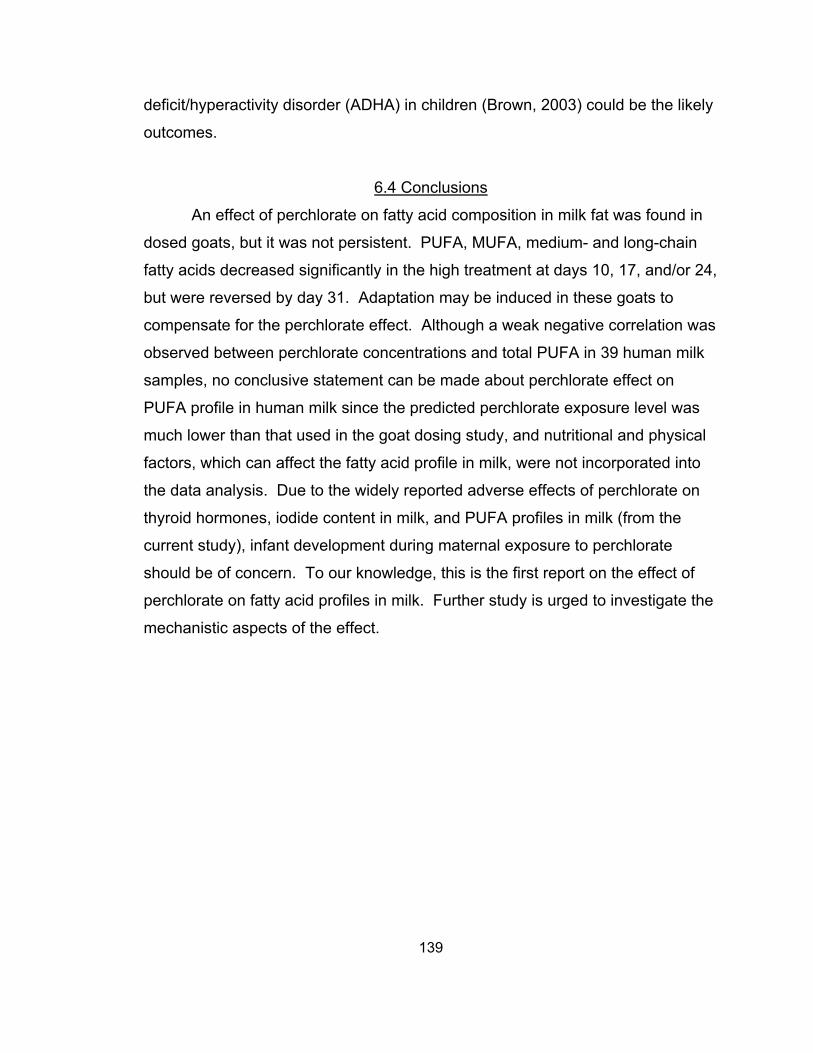
deficit/hyperactivity disorder (ADHA) in children (Brown, 2003) could be the likely
outcomes.
6.4 Conclusions
An effect of perchlorate on fatty acid composition in milk fat was found in
dosed goats, but it was not persistent. PUFA, MUFA, medium- and long-chain
fatty acids decreased significantly in the high treatment at days 10, 17, and/or 24,
but were reversed by day 31. Adaptation may be induced in these goats to
compensate for the perchlorate effect. Although a weak negative correlation was
observed between perchlorate concentrations and total PUFA in 39 human milk
samples, no conclusive statement can be made about perchlorate effect on
PUFA profile in human milk since the predicted perchlorate exposure level was
much lower than that used in the goat dosing study, and nutritional and physical
factors, which can affect the fatty acid profile in milk, were not incorporated into
the data analysis. Due to the widely reported adverse effects of perchlorate on
thyroid hormones, iodide content in milk, and PUFA profiles in milk (from the
current study), infant development during maternal exposure to perchlorate
should be of concern. To our knowledge, this is the first report on the effect of
perchlorate on fatty acid profiles in milk. Further study is urged to investigate the
mechanistic aspects of the effect.
139
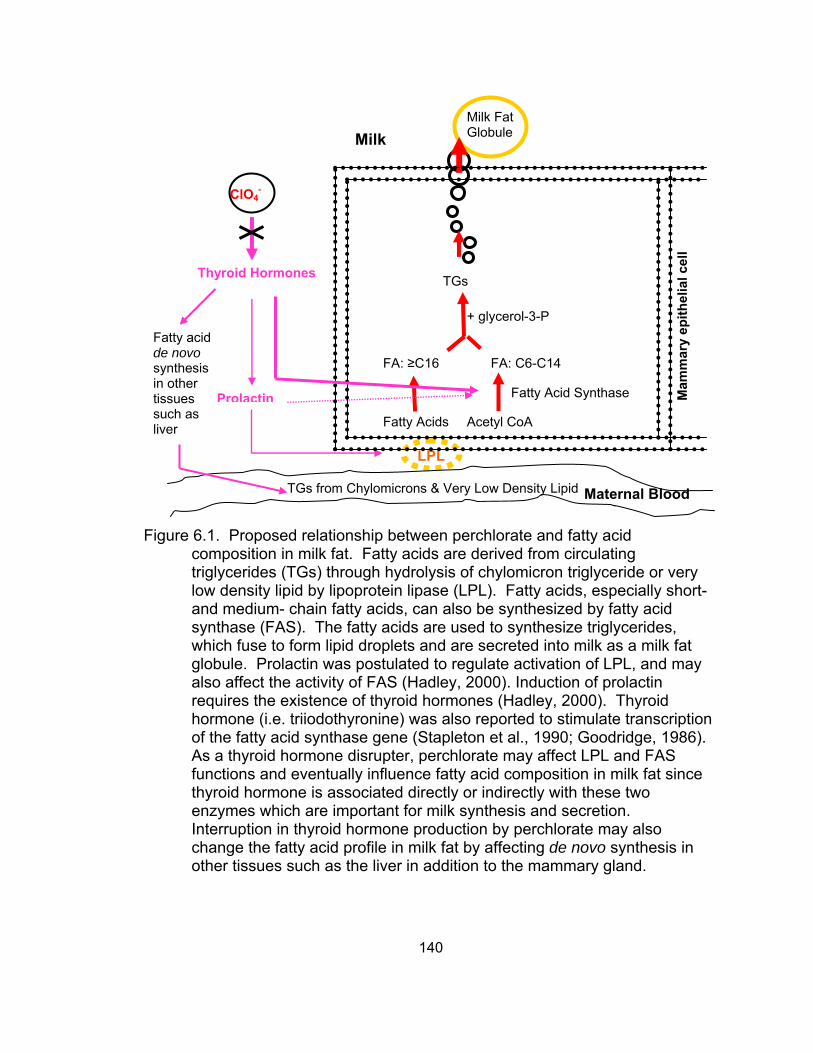
Milk Fat Globule
Figure 6.1. Proposed relationship between perchlorate and fatty acid
composition in milk fat. Fatty acids are derived from circulating triglycerides (TGs) through hydrolysis of chylomicron triglyceride or very low density lipid by lipoprotein lipase (LPL). Fatty acids, especially short- and medium- chain fatty acids, can also be synthesized by fatty acid synthase (FAS). The fatty acids are used to synthesize triglycerides, which fuse to form lipid droplets and are secreted into milk as a milk fat globule. Prolactin was postulated to regulate activation of LPL, and may also affect the activity of FAS (Hadley, 2000). Induction of prolactin requires the existence of thyroid hormones (Hadley, 2000). Thyroid hormone (i.e. triiodothyronine) was also reported to stimulate transcription of the fatty acid synthase gene (Stapleton et al., 1990; Goodridge, 1986). As a thyroid hormone disrupter, perchlorate may affect LPL and FAS functions and eventually influence fatty acid composition in milk fat since thyroid hormone is associated directly or indirectly with these two enzymes which are important for milk synthesis and secretion. Interruption in thyroid hormone production by perchlorate may also change the fatty acid profile in milk fat by affecting de novo synthesis in other tissues such as the liver in addition to the mammary gland.
Fatty Acid Synthase
FA: C6-C14
Acetyl CoA
LPL
TGs
+ glycerol-3-P
TGs from Chylomicrons & Very Low Density Lipid
Milk
FA: ≥C16
Fatty Acids
ClO4-
Mam
mar
y ep
ithel
ial c
ell
Thyroid Hormones
Prolactin
Maternal Blood
Fatty acid de novo synthesis in other tissues such as liver
140
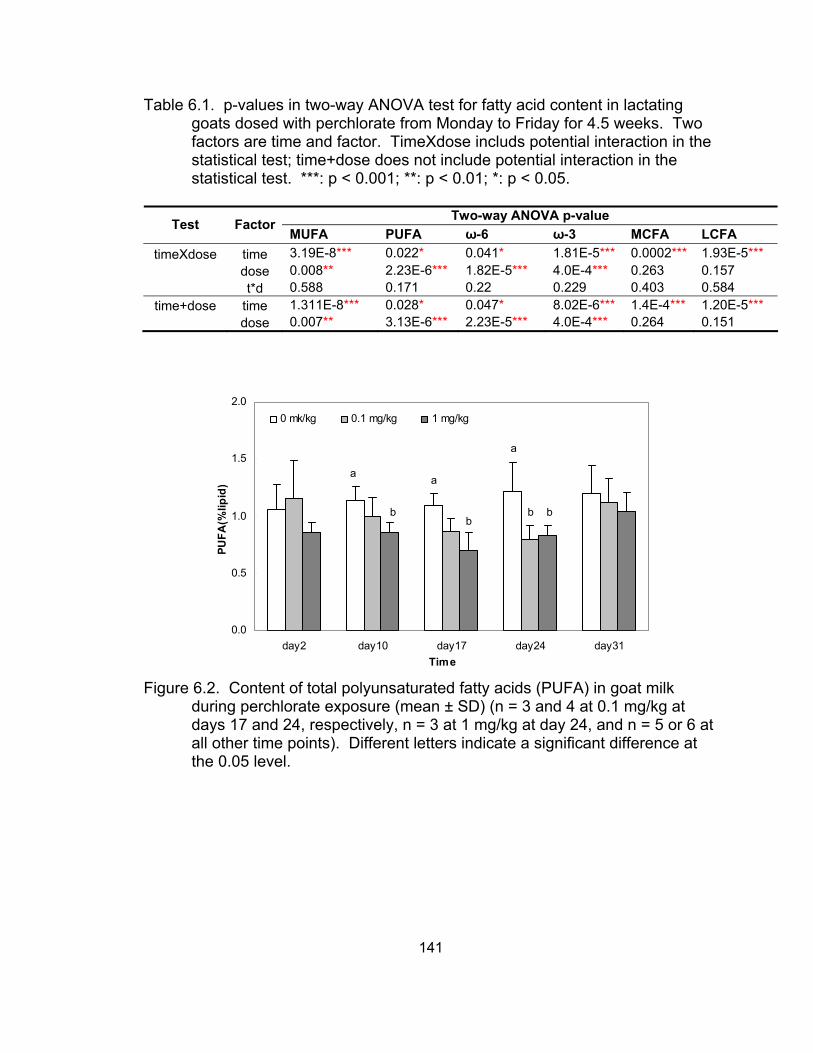
Table 6.1. p-values in two-way ANOVA test for fatty acid content in lactating goats dosed with perchlorate from Monday to Friday for 4.5 weeks. Two factors are time and factor. TimeXdose includs potential interaction in the statistical test; time+dose does not include potential interaction in the statistical test. ***: p < 0.001; **: p < 0.01; *: p < 0.05.
Two-way ANOVA p-value Test Factor
MUFA PUFA ω-6 ω-3 MCFA LCFA timeXdose time 3.19E-8*** 0.022* 0.041* 1.81E-5*** 0.0002*** 1.93E-5***
dose 0.008** 2.23E-6*** 1.82E-5*** 4.0E-4*** 0.263 0.157 t*d 0.588 0.171 0.22 0.229 0.403 0.584
time+dose time 1.311E-8*** 0.028* 0.047* 8.02E-6*** 1.4E-4*** 1.20E-5*** dose 0.007** 3.13E-6*** 2.23E-5*** 4.0E-4*** 0.264 0.151
0.0
0.5
1.0
1.5
2.0
day2 day10 day17 day24 day31Time
PUFA
(%lip
id)
0 mk/kg 0.1 mg/kg 1 mg/kg
a
a
b
a
b b b
Figure 6.2. Content of total polyunsaturated fatty acids (PUFA) in goat milk
during perchlorate exposure (mean ± SD) (n = 3 and 4 at 0.1 mg/kg at days 17 and 24, respectively, n = 3 at 1 mg/kg at day 24, and n = 5 or 6 at all other time points). Different letters indicate a significant difference at the 0.05 level.
141
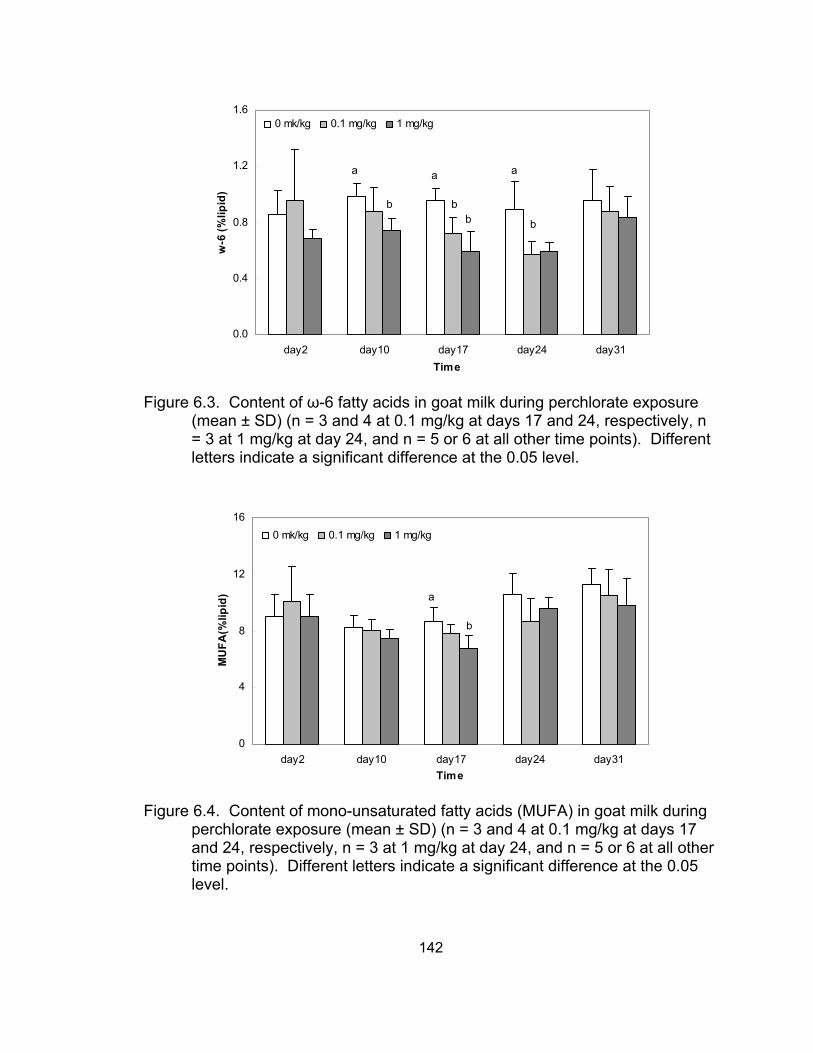
0.0
0.4
0.8
1.2
1.6
day2 day10 day17 day24 day31Time
w-6
(%lip
id)
0 mk/kg 0.1 mg/kg 1 mg/kg
a
b
a
bb
a
b
Figure 6.3. Content of ω-6 fatty acids in goat milk during perchlorate exposure
(mean ± SD) (n = 3 and 4 at 0.1 mg/kg at days 17 and 24, respectively, n = 3 at 1 mg/kg at day 24, and n = 5 or 6 at all other time points). Different letters indicate a significant difference at the 0.05 level.
0
4
8
12
16
day2 day10 day17 day24 day31Time
MU
FA(%
lipid
)
0 mk/kg 0.1 mg/kg 1 mg/kg
a
b
Figure 6.4. Content of mono-unsaturated fatty acids (MUFA) in goat milk during
perchlorate exposure (mean ± SD) (n = 3 and 4 at 0.1 mg/kg at days 17 and 24, respectively, n = 3 at 1 mg/kg at day 24, and n = 5 or 6 at all other time points). Different letters indicate a significant difference at the 0.05 level.
142
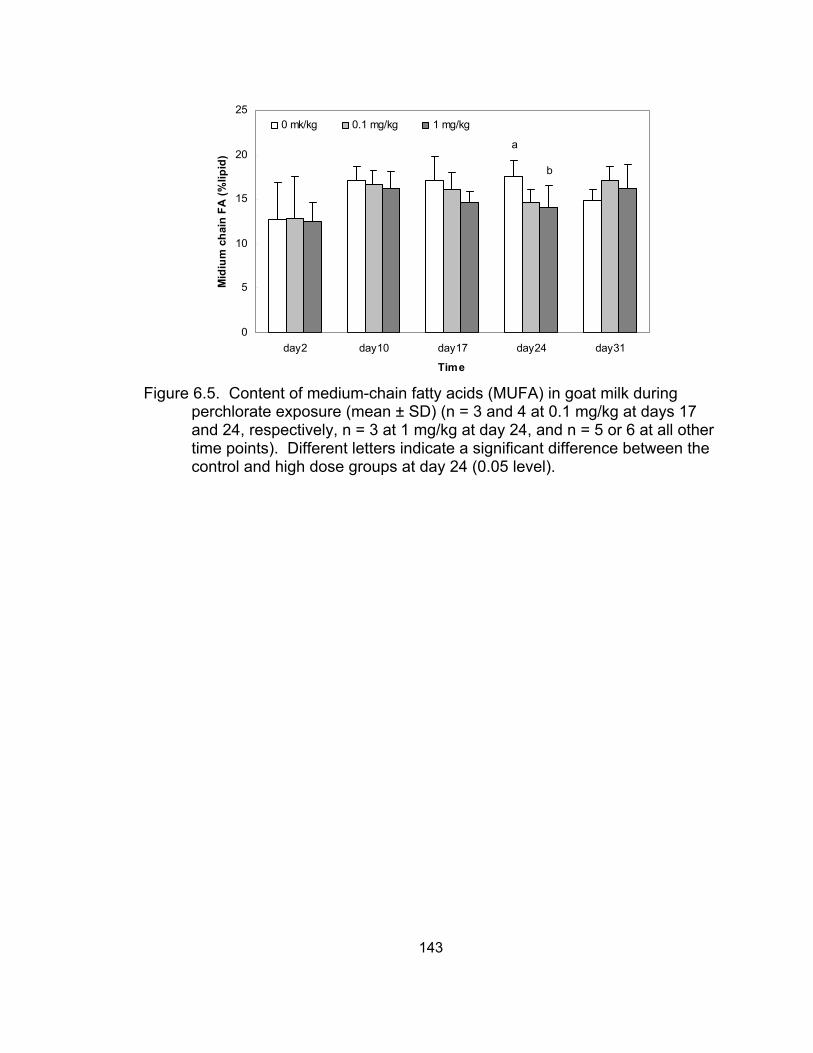
0
5
10
15
20
25
day2 day10 day17 day24 day31
Time
Mid
ium
cha
in F
A (%
lipid
)
0 mk/kg 0.1 mg/kg 1 mg/kg
a
b
Figure 6.5. Content of medium-chain fatty acids (MUFA) in goat milk during
perchlorate exposure (mean ± SD) (n = 3 and 4 at 0.1 mg/kg at days 17 and 24, respectively, n = 3 at 1 mg/kg at day 24, and n = 5 or 6 at all other time points). Different letters indicate a significant difference between the control and high dose groups at day 24 (0.05 level).
143
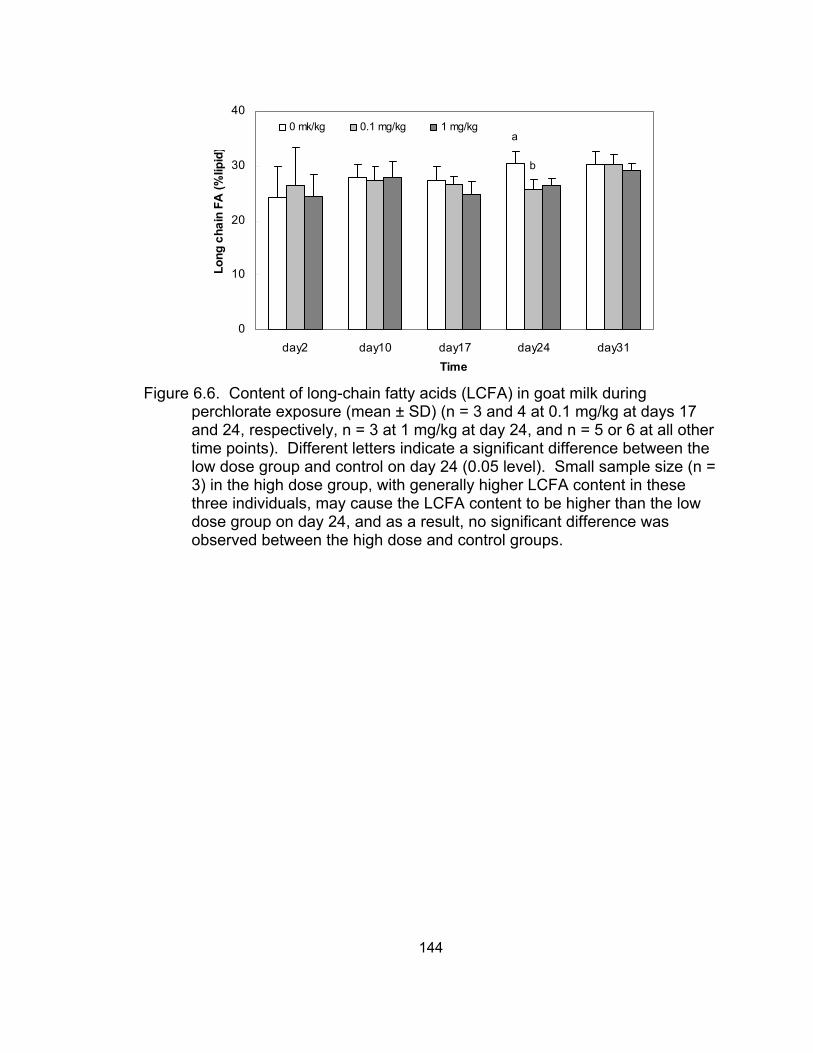
0
10
20
30
40
day2 day10 day17 day24 day31Time
Long
cha
in F
A (%
lipid
)
0 mk/kg 0.1 mg/kg 1 mg/kg a
b
Figure 6.6. Content of long-chain fatty acids (LCFA) in goat milk during
perchlorate exposure (mean ± SD) (n = 3 and 4 at 0.1 mg/kg at days 17 and 24, respectively, n = 3 at 1 mg/kg at day 24, and n = 5 or 6 at all other time points). Different letters indicate a significant difference between the low dose group and control on day 24 (0.05 level). Small sample size (n = 3) in the high dose group, with generally higher LCFA content in these three individuals, may cause the LCFA content to be higher than the low dose group on day 24, and as a result, no significant difference was observed between the high dose and control groups.
144
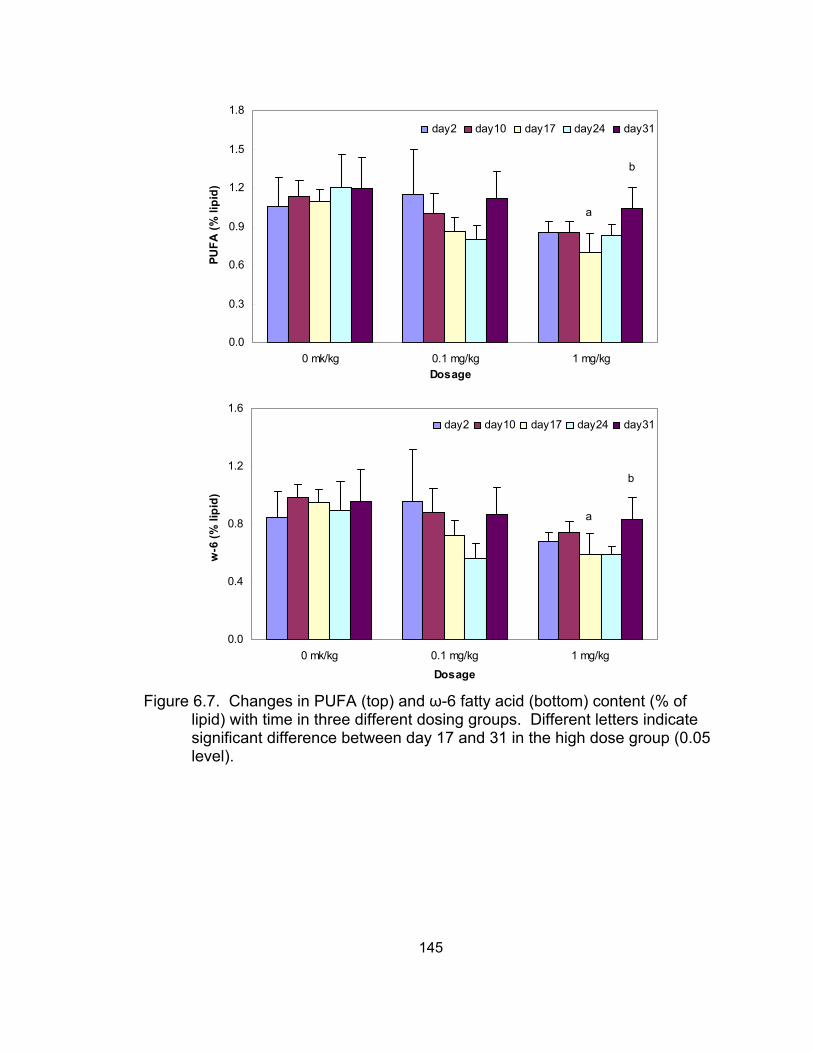
0.0
0.3
0.6
0.9
1.2
1.5
1.8
0 mk/kg 0.1 mg/kg 1 mg/kgDosage
PUFA
(% li
pid)
day2 day10 day17 day24 day31
a
b
0.0
0.4
0.8
1.2
1.6
0 mk/kg 0.1 mg/kg 1 mg/kg
Dosage
w-6
(% li
pid)
day2 day10 day17 day24 day31
a
b
Figure 6.7. Changes in PUFA (top) and ω-6 fatty acid (bottom) content (% of
lipid) with time in three different dosing groups. Different letters indicate significant difference between day 17 and 31 in the high dose group (0.05 level).
145
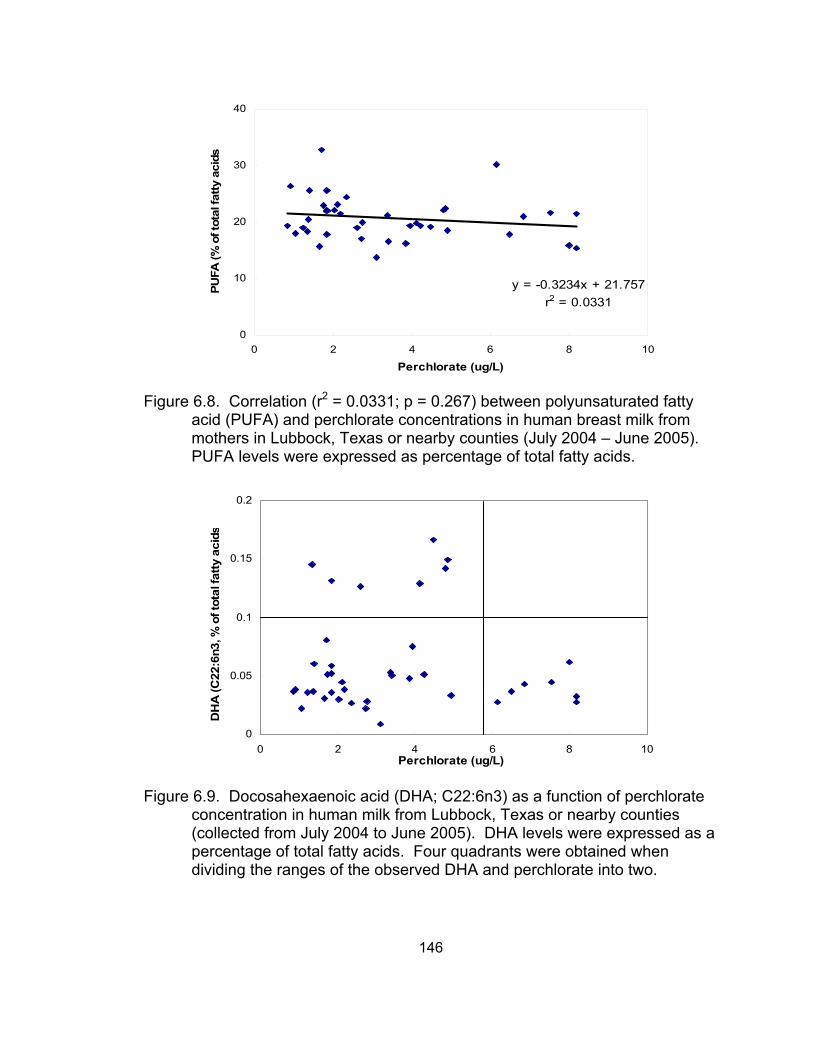
y = -0.3234x + 21.757r2 = 0.0331
0
10
20
30
40
0 2 4 6 8
Perchlorate (ug/L)
PUFA
(% o
f tot
al fa
tty a
cids
10
Figure 6.8. Correlation (r2 = 0.0331; p = 0.267) between polyunsaturated fatty
acid (PUFA) and perchlorate concentrations in human breast milk from mothers in Lubbock, Texas or nearby counties (July 2004 – June 2005). PUFA levels were expressed as percentage of total fatty acids.
0
0.05
0.1
0.15
0.2
0 2 4 6 8Perchlorate (ug/L)
DH
A (C
22:6
n3, %
of t
otal
fatty
aci
d
10
s
Figure 6.9. Docosahexaenoic acid (DHA; C22:6n3) as a function of perchlorate
concentration in human milk from Lubbock, Texas or nearby counties (collected from July 2004 to June 2005). DHA levels were expressed as a percentage of total fatty acids. Four quadrants were obtained when dividing the ranges of the observed DHA and perchlorate into two.
146
CHAPTER VII
CONCLUSIONS AND FUTURE RESEARCH
7.1 Study Summary and Conclusions
Methods development for perchlorate determination in biological fluids
was explored firstly in this study. The presence of ions and other biomolecules in
matrices like plasma and urine usually confounds accurate determination of
perchlorate by ion chromatography with suppressed conductivity detection (IC-
SCD); therefore, efficient cleanup before IC analysis is necessary for perchlorate
determination in these matrices. Several different cleanup methods for plasma
and urine were tested and compared in the current study, in terms of reduced
background conductivity, interference, perchlorate recovery, and precision.
Effective sample preparation and cleanup process are usually expensive, time
consuming, and labor intensive. High background conductivity and the existence
of interfering components are still routine problems encountered for perchlorate
determination by conventional IC (IC-SCD). In addition, IC-SCD cannot provide
unambiguous confirmation for perchlorate determination, particularly in biological
samples. Therefore, the application of mass spectrometry (MS) in perchlorate
determination in biological fluids was also explored in the current study. MS was
able to provide a better quantitative and qualitative analysis of complicated
matrices and served as an efficient alternative analytical tool to IC-SCD for
perchlorate monitoring. Particularly, ion chromatography coupled with MS/MS
provided an excellent method for part per trillion perchlorate determination in
both aqueous and deer mice urine matrices, with high selectivity, sensitivity, and
robust accuracy and precision.
The study on perchlorate exposure and absorption in beef cattle showed
that constant exposure to 25 ng/mL perchlorate in water over 14 weeks did not
result in measurable residues in blood plasma or edible tissues of cattle at the
first test site (McLennan County, Texas). Perchlorate was detected in 4 of 33
147
and 17 of 26 cattle at two Kansas farms with the highest plasma perchlorate
concentrations of 43 and 32 ng/mL, respectively. However, perchlorate was
detected in all four urine samples from Kansas using IC-MS/MS. Perchlorate
residues in urine rather than plasma may be a more sensitive biomarker for
perchlorate exposure assessment.
The study on perchlorate distribution, excretion, and depuration in rodents
showed that (1) excretion via urine was the major pathway for perchlorate fate in
the body; (2) perchlorate urinary excretion was dose-dependent, higher dose
level corresponded well to high perchlorate concentration in urine; (3) perchlorate
urinary excretion reached to a steady state after one day in all treatments over
the 28-d exposure; and (4) perchlorate was depurated rapidly via urine.
Perchlorate mass in kidney, thyroid, blood, and urine was significantly correlated
with perchlorate intake. On average of 46, 46, and 61% of perchlorate were
recovered in urine over the 28-d exposure period in high, medium, and low dose
groups, respectively. Metabolism of perchlorate may occur in the body, based in
part on the 40% perchlorate unaccounted for in this study. Other sources of
perchlorate were not clear, and endogenous perchlorate may exist. Perchlorate
fate in animals was not as straightforward as reported by previous studies.
Perchlorate exposure through dosed drinking water for 28 days increased
NIS gene expression in the kidney and stomach, and pendrin gene expression in
the kidney, without a significant difference. A dose-dependent manner was
observed in NIS gene expression in the stomach. In the depuration experiment,
no significant difference was found between the low and high dose groups (8-h
exposure to perchlorate followed by an 88-h depuration period) in terms of NIS or
pendrin gene expression in the kidney or stomach. Linear regression analysis
did not show a significant relationship between perchlorate urinary excretion and
either gene expression in the kidney at day 28.
Several factors could complicate the effect of perchlorate exposure on NIS
and pendrin gene expression in the stomach and kidney in the current study,
148
including (1) pre-exposure to trace perchlorate through food and water, which
may have resulted in adaptation (or tolerance) in these animals; (2) metabolism
of perchlorate in deer mice, which may cause 45 – 61% perchlorate recovery via
urine; (3) short-term exposure, which may be insufficient to induce gene
expression in the tissues; and (4) large differences among individuals. It is also
possible that there is no effect of perchlorate exposure and/or excretion via urine
on NIS gene expression, particularly in the kidney. Nevertheless, alteration of
pendrin gene expression in the kidney produced by perchlorate exposure may
cause abnormalities in acid-base homeostasis and sodium-chloride balance,
metabolic alkalosis and hypertension, and alteration of blood pressure.
A partial sequence of deer mice NIS gene cDNA with 425 bps was
elucidated in the current study for the first time. Quantitative analysis of NIS
mRNA expression in various tissues was also studied for the first time with
expression levels from highest to lowest in deer mice tissues in the following
order: stomach, testes, brain, large intestine, and barely expression in lung,
kidney, heart, and liver.
An effect of perchlorate on fatty acid composition in milk fat was observed
in dosed goats during lactation, but it was not persistent. PUFA, MUFA, medium-
and long-chain fatty acids decreased significantly in the high treatment at days
10, 17, and/or 24, but were reversed by day 31. Adaptation may be induced in
these goats to compensate for the perchlorate effect. Although a weak negative
correlation was observed between perchlorate concentrations and total PUFA in
39 human milk samples, no conclusive statement can be made about perchlorate
effect on the PUFA profile in human milk since the predicted perchlorate
exposure level was much lower than that used in the goat dosing study, and
nutritional and physical factors, which can affect the fatty acid profile in milk, were
not incorporated into the data analysis. Due to the widely reported adverse
effects of perchlorate on thyroid hormones, iodide content in milk, and PUFA
profiles in milk (from the current study), infant development during maternal
149
exposure to perchlorate should be of concern. To our knowledge, this is the first
report on the effect of perchlorate on fatty acid profiles in milk. Further study is
urged to investigate the mechanistic aspects of the effect.
7.2 Future Studies
One major suggestion for future study on assessment of perchlorate
exposure in the environment and human is using mass spectrometry to
determine perchlorate in various matrices. Perchlorate was seldom detected in
cattle plasma samples in two contaminated sites (Chapter III), which may be
caused by the limitation of IC-SCD for perchlorate determination in complicate
biological matrices in terms of detection limit and selectivity. With IC-MS/MS
methodology, perchlorate can be detected in various matrices sensitively and
accurately. Additionally, perchlorate residues in urine may be a more sensitive
indicator for perchlorate exposure. Therefore, IC-MS/MS application for
perchlorate determination in environmental and biological samples would
contribute significantly to assessing perchlorate exposure in the environment and
human in the future, and determining perchlorate residue in urine rather than
plasma would provide a more sensitive biomarker for perchlorate exposure
assessment in animals including humans.
Inconsistence of perchlorate intake through drinking water and excretion
via urine in terms of mass balance was revealed in the excretion and depuration
experiments (Chapter IV), which presented a question: where did ~ 40%
perchlorate go in those animals? Perchlorate metabolism and in the body were
proposed in the current study, but more research is needed to provide evidence
and support it. A study could be conducted in the future to test the existence of
anaerobic bacteria which express perchlorate reductase, perchlorate reductase,
and/or the gene encoding perchlorate reductase in deer mice body, especially
the gastrointestinal tract, which would indicate the possibility of perchlorate
transition to chlorate, chlorite, and/or chloride. Isotopic labeled perchlorate can
150
be used as dosing solution to test fate, transport, and transition of perchlorate in
the body and provide evidence for perchlorate toxicokinetics in animals.
Regarding effects of perchlorate exposure on transporter gene
expression, protein expression should be analyzed as well. Usually, protein is
expressed because of its encoding gene expression. However, if perchlorate
was transported through these transporters (i.e. NIS and pendrin), protein levels
or activities rather than gene expression levels would be directly related to
perchlorate excretion or uptake by the cells. In addition, evaluation on protein
expression level is very important and necessary, especially for mechanism
study involving post-transcription. West blotting or immunohistochemical
methodologies could be used to evaluate effects of perchlorate exposure on
these transporter expression levels and activities in the interested tissues, such
as the stomach and kidney in the current study, and therefore, provide more
insight about the perchlorate excretion pattern via urine and some indication of
perchlorate toxicokinetics at the molecular level.
A study could be conducted to address the question about effects of
perchlorate exposure on profile of fatty acid in milk at molecular levels regarding
the mechanistic aspects. Effects of perchlorate exposure could be explored with
some enzymes and hormones levels as endpoints. These enzymes and
hormones could be thyroid hormone, prolactin, lipoprotein lipase, fatty acid
synthase, and etc., which are involved in milk fatty acid synthesis process and
related to thyroid hormone directly or indirectly. In terms of relationship between
perchlorate residue levels and PUFA levels in human breast milk collected
locally, perchlorate levels in milk confirmed using mass spectrometry would
provide an unambiguous evidence for the conclusion, and an epidemiological
study with large sample size and more information on subjects nutrition and
physic status would contribute more to evaluating the potential risk of perchlorate
on pregnant and/or lactating women and their infants.
151

Future studies also could be conducted to address questions including,
but not limited to, (1) species difference regarding perchlorate uptake,
distribution, excretion, and effects; (2) influence of pre-exposure to perchlorate
on perchlorate uptake, distribution, excretion, and effects; (3) induction of gene
expression caused by perchlorate exposure; and (4) diet confounding influence
on the relationship between perchlorate exposure and the profile of fatty acids in
milk.
152
REFERENCES
Ajjan, R.A., Kamaruddin, N.A., Crisp, M., Watson, P.F., Ludgate, M. and Weetman, A.P.: Regulation and tissue distribution of the human sodium iodide symporter gene. Clin Endocrinol (Oxf) 49 (1998a) 517-23.
Ajjan, R.A., Watson, P.F., Findlay, C., Metcalfe, R.A., Crisp, M., Ludgate, M. and Weetman, A.P.: The sodium iodide symporter gene and its regulation by cytokines found in autoimmunity. J Endocrinol 158 (1998b) 351-8.
Alessandri, J.M., Guesnet, P., Vancassel, S., Astorg, P., Denis, I., Langelier, B., Aid, S., Poumes-Ballihaut, C., Champeil-Potokar, G. and Lavialle, M.: Polyunsaturated fatty acids in the central nervous system: evolution of concepts and nutritional implications throughout life. Reprod Nutr Dev 44 (2004) 509-38.
Anbar, M., Guttmann, S. and Lewitus, Z.: The mode of action of perchlorate ions on the iodine uptake of the thyroid gland. Int J Appl Radiat Isot 7 (1959) 87-96.
Anderson, T.A. and Wu, T.H.: Extraction, cleanup, and analysis of the perchlorate anion in tissue samples. Bull Environ Contam Toxicol 68 (2002) 684-91.
Animal-Welfare-Advisory-Committee: Guidelines for the Welfare of Livestock from which Blood is Harvested for Commercial and Research Purposes, http://www.biosecurity.govt.nz/animal-welfare/codes/blood/index.htm. Animal Welfare Advisory Committee, 1996.
Annesley, T.M.: Ion suppression in mass spectrometry. Clin Chem 49 (2003) 1041-4.
Arumughan, C. and Narayanan, K.M.: Influence of stage of lactation on the triacylglycerol composition of buffalo milk fat. Lipids 16 (1981) 155-64.
Baldridge, M.G., Stahl, R.L., Gerstenberger, S.L., Tripoli, V. and Hutz, R.J.: In utero and lactational exposure of Long-Evans rats to ammonium perchlorate (AP) disrupts ovarian follicle maturation. Reprod Toxicol 19 (2004) 155-61.
Bass Becking, L.G.M., Haldane, A.D. and Izard, D.: Perchlorate, an important constituent of seawater. Nature 182 (1958) 645-647.
Batjoens, P., Debrabander, H.F. and Tkindt, L.: Ion Chromatographic Determination of Perchlorate in Cattle Urine. Analytica Chimica Acta 275 (1993) 335-340.
Bekkedal, M.Y., Arfsten, D. and Mattie, D.: An evaluation of neurobehavioral tests used to assess the neurodevelopmental effects of early ammonium perchlorate exposure. J Toxicol Environ Health A 67 (2004) 835-44.
153
Bell, A., Gagnon, A., Grunder, L., Parikh, S.J., Smith, T.J. and Sorisky, A.: Functional TSH receptor in human abdominal preadipocytes and orbital fibroblasts. Am J Physiol Cell Physiol 279 (2000) C335-40.
Bender, K.S., Shang, C., Chakraborty, R., Belchik, S.M., Coates, J.D. and Achenbach, L.A.: Identification, characterization, and classification of genes encoding perchlorate reductase. J Bacteriol 187 (2005) 5090-6.
Bidart, J.M., Lacroix, L., Evain-Brion, D., Caillou, B., Lazar, V., Frydman, R., Bellet, D., Filetti, S. and Schlumberger, M.: Expression of Na+/I- symporter and Pendred syndrome genes in trophoblast cells. J Clin Endocrinol Metab 85 (2000a) 4367-72.
Bidart, J.M., Mian, C., Lazar, V., Russo, D., Filetti, S., Caillou, B. and Schlumberger, M.: Expression of pendrin and the Pendred syndrome (PDS) gene in human thyroid tissues. J Clin Endocrinol Metab 85 (2000b) 2028-33.
Bradford, C.M., Rinchard, J., Carr, J.A. and Theodorakis, C.: Perchlorate affects thyroid function in eastern mosquitofish (Gambusia holbrooki) at environmentally relevant concentrations. Environ Sci Technol 39 (2005) 5190-5.
Braverman, L.E., He, X., Pino, S., Cross, M., Magnani, B., Lamm, S.H., Kruse, M.B., Engel, A., Crump, K.S. and Gibbs, J.P.: The effect of perchlorate, thiocyanate, and nitrate on thyroid function in workers exposed to perchlorate long-term. J Clin Endocrinol Metab 90 (2005) 700-6.
Braverman, L.E. and Ingbar, S.H.: Changes in Thyroidal Function During Adaptation to Large Doses of Iodide. J Clin Invest 42 (1963) 1216-31.
Brechner, R.J., Parkhurst, G.D., Humble, W.O., Brown, M.B. and Herman, W.H.: Ammonium perchlorate contamination of Colorado River drinking water is associated with abnormal thyroid function in newborns in Arizona. J Occup Environ Med 42 (2000) 777-82.
Brown, V.J.: Disrupting a delicate balance: environmental effects on the thyroid. Environ Health Perspect 111 (2003) A642-9.
Bruce, R.A., Achenbach, L.A. and Coates, J.D.: Reduction of (per)chlorate by a novel organism isolated from paper mill waste. Environ Microbiol 1 (1999) 319-29.
Bustin, S.A.: Real-time, fluorescence-based quantitative PCR: a snapshot of current procedures and preferences. Expert Rev Mol Diagn 5 (2005) 493-8.
Bustin, S.A., Benes, V., Nolan, T. and Pfaffl, M.W.: Quantitative real-time RT-PCR--a perspective. J Mol Endocrinol 34 (2005) 597-601.
Cañas, J.E., Cheng, Q., Tian, K. and Anderson, T.A.: Optimization of operating conditions for the determination of perchlorate in biological samples using
154
preconcentration/preelution ion chromatography. Journal of Chromatography A In press (2006).
Capuco, A.V., Rice, C.P., Baldwin, R.L.t., Bannerman, D.D., Paape, M.J., Hare, W.R., Kauf, A.C., McCarty, G.W., Hapeman, C.J., Sadeghi, A.M., Starr, J.L., McConnell, L.L. and Van Tassell, C.P.: Fate of dietary perchlorate in lactating dairy cows: Relevance to animal health and levels in the milk supply. Proc Natl Acad Sci U S A 102 (2005) 16152-7.
Chan, S. and Kilby, M.D.: Thyroid hormone and central nervous system development. J Endocrinol 165 (2000) 1-8.
Chang, S., Crothers, C., Lai, S. and Lamm, S.: Pediatric neurobehavioral diseases in Nevada counties with respect to perchlorate in drinking water: an ecological inquiry. Birth Defects Res A Clin Mol Teratol 67 (2003) 886-92.
Cheng, Q., Liu, F., Cañas, J.E. and Anderson, T.A.: A cleanup method for perchlorate determination in urine. Talanta 68 (2006) 1457-1462.
Cheng, Q., Perlmutter, L., Smith, P.N., McMurry, S.T., Jackson, W.A. and Anderson, T.A.: A study on perchlorate exposure and absorption in beef cattle. J Agric Food Chem 52 (2004) 3456-61.
Chilliard, Y. and Ferlay, A.: Dietary lipids and forages interactions on cow and goat milk fatty acid composition and sensory properties. Reprod Nutr Dev 44 (2004) 467-92.
Chilliard, Y., Ferlay, A., Rouel, J. and Lamberet, G.: A review of nutritional and physiological factors affecting goat milk lipid synthesis and lipolysis. J Dairy Sci 86 (2003) 1751-70.
Clewell, R.A., Merrill, E.A., Narayanan, L., Gearhart, J.M. and Robinson, P.J.: Evidence for competitive inhibition of iodide uptake by perchlorate and translocation of perchlorate into the thyroid. Int J Toxicol 23 (2004) 17-23.
Cline, T.R., Plumlee, M.P., Christian, J.E. and Kessler, W.V.: Effect of potassium perchlorate and sodium chloride given orally upon radioiodine deposition into milk of goats. J Dairy Sci 52 (1969) 1124-6.
Coates, J.D., Michaelidou, U., Bruce, R.A., O'Connor, S.M., Crespi, J.N. and Achenbach, L.A.: Ubiquity and diversity of dissimilatory (per)chlorate-reducing bacteria. Appl Environ Microbiol 65 (1999) 5234-41.
Collette, T.W., Williams, T.L., Urbansky, E.T., Magnuson, M.L., Hebert, G.N. and Strauss, S.H.: Analysis of hydroponic fertilizer matrixes for perchlorate: comparison of analytical techniques. Analyst 128 (2003) 88-97.
155
Cooke, P.S., Holsberger, D.R., Witorsch, R.J., Sylvester, P.W., Meredith, J.M., Treinen, K.A. and Chapin, R.E.: Thyroid hormone, glucocorticoids, and prolactin at the nexus of physiology, reproduction, and toxicology. Toxicol Appl Pharmacol 194 (2004) 309-35.
Crane, H.M., Pickford, D.B., Hutchinson, T.H. and Brown, J.A.: Effects of ammonium perchlorate on thyroid function in developing fathead minnows, Pimephales promelas. Environ Health Perspect 113 (2005) 396-401.
Crump, C., Michaud, P., Tellez, R., Reyes, C., Gonzalez, G., Montgomery, E.L., Crump, K.S., Lobo, G., Becerra, C. and Gibbs, J.P.: Does perchlorate in drinking water affect thyroid function in newborns or school-age children? J Occup Environ Med 42 (2000) 603-12.
Dahl, R.: Perchlorate debate grows. Environmental Health Perspectives 112 (2004) A546.
Dai, G., Levy, O. and Carrasco, N.: Cloning and characterization of the thyroid iodide transporter. Nature 379 (1996) 458-60.
Dasgupta, P.K., Martinelango, P.K., Jackson, W.A., Anderson, T.A., Tian, K., Tock, R.W. and Rajagopalan, S.: The origin of naturally occurring perchlorate: the role of atmospheric processes. Environ Sci Technol 39 (2005) 1569-75.
De La Vieja, A., Dohan, O., Levy, O. and Carrasco, N.: Molecular analysis of the sodium/iodide symporter: impact on thyroid and extrathyroid pathophysiology. Physiol Rev 80 (2000) 1083-105.
Djurdjevic, D. and Lengemann, F.W.: Effect of perchlorate on the milk-plasma radioiodine ratio of intact and thyroidectomized goats. J Dairy Sci 53 (1970) 808-12.
Dodds, E.D., Kennish, J.M., Von Hippel, F.A., Bernhardt, R. and Hines, M.E.: Quantitative analysis of perchlorate in extracts of whole fish homogenates by ion chromatography: comparison of suppressed conductivity detection and electrospray ionization mass spectrometry. Anal Bioanal Chem 379 (2004) 881-7.
Dohan, O., De la Vieja, A. and Carrasco, N.: Molecular study of the sodium-iodide symporter (NIS): a new field in thyroidology. Trends Endocrinol Metab 11 (2000) 99-105.
Dohan, O., De la Vieja, A., Paroder, V., Riedel, C., Artani, M., Reed, M., Ginter, C.S. and Carrasco, N.: The sodium/iodide Symporter (NIS): characterization, regulation, and medical significance. Endocr Rev 24 (2003) 48-77.
Dorak, M.T.: Real time PCR, http://www.dorak.info/genetics/realtime.html, 2005.
156
Ellington, J.J. and Evans, J.J.: Determination of perchlorate at parts-per-billion levels in plants by ion chromatography. Journal of Chromatography A 898 (2000) 193-199.
Ellington, J.J., Wolfe, N.L., Garrison, A.W., Evans, J.J., Avants, J.K. and Teng, Q.C.: Determination of perchlorate in tobacco plants and tobacco products. Environmental Science & Technology 35 (2001) 3213-3218.
Ells, B., Barnett, D.A., Purves, R.W. and Guevremont, R.: Trace level determination of perchlorate in water matrices and human urine using ESI-FAIMS-MS. Journal of Environmental Monitoring 2 (2000) 393-397.
Endo, T., Ohno, M., Kotani, S., Gunji, K. and Onaya, T.: Thyrotropin receptor in non-thyroid tissues. Biochem Biophys Res Commun 190 (1993) 774-9.
Eng, P.H., Cardona, G.R., Fang, S.L., Previti, M., Alex, S., Carrasco, N., Chin, W.W. and Braverman, L.E.: Escape from the acute Wolff-Chaikoff effect is associated with a decrease in thyroid sodium/iodide symporter messenger ribonucleic acid and protein. Endocrinology 140 (1999) 3404-10.
Eng, P.H., Cardona, G.R., Previti, M.C., Chin, W.W. and Braverman, L.E.: Regulation of the sodium iodide symporter by iodide in FRTL-5 cells. Eur J Endocrinol 144 (2001) 139-44.
EPA: Volume II Food ingestion factors; chapter 13 breast milk intake., http://www.epa.gov/ordntrnt/ORD/WebPubs/exposure/chap13.pdf, 1996.
EPA: Perchlorate Environmental Contamination: Toxicological Review and Risk Characterization, http://www.epa.gov/swerffrr/documents/perchlorate.htm, 2002.
EPA: Perchlorate Occurrences, http://www.epa.gov/fedfac/documents/perchlorate_links.htm#occurrences, 2005a.
EPA: State Perchlorate Advisory Levels, http://www.epa.gov/swerffrr/pdf/stateadvisorylevels.pdf, 2005b.
Erickson, B.E.: Perchlorate found in milk in Texas. Environmental Science & Technology 37 (2003) 377A-378A.
Eskandari, S., Loo, D.D., Dai, G., Levy, O., Wright, E.M. and Carrasco, N.: Thyroid Na+/I- symporter. Mechanism, stoichiometry, and specificity. J Biol Chem 272 (1997) 27230-8.
Everett, L.A., Glaser, B., Beck, J.C., Idol, J.R., Buchs, A., Heyman, M., Adawi, F., Hazani, E., Nassir, E., Baxevanis, A.D., Sheffield, V.C. and Green, E.D.: Pendred syndrome is caused by mutations in a putative sulphate transporter gene (PDS). Nat Genet 17 (1997) 411-22.
157
Everett, L.A., Morsli, H., Wu, D.K. and Green, E.D.: Expression pattern of the mouse ortholog of the Pendred's syndrome gene (Pds) suggests a key role for pendrin in the inner ear. Proc Natl Acad Sci U S A 96 (1999) 9727-32.
EWG: Rocket Science, http://www.ewg.org/reports/rocketscience/chap1.html, 2001.
EWG: Perchlorate-contaminated drinking water sources in California., http://www.ewg.org/reports/rocketwater/table1.php, 2003.
Finley, D.A., Lonnerdal, B., Dewey, K.G. and Grivetti, L.E.: Breast milk composition: fat content and fatty acid composition in vegetarians and non-vegetarians. Am J Clin Nutr 41 (1985) 787-800.
Fisher, J., Todd, P., Mattie, D., Godfrey, D., Narayanan, L. and Yu, K.: Preliminary development of a physiological model for perchlorate in the adult male rat: a framework for further studies. Drug Chem Toxicol 23 (2000) 243-58.
Folch, J., Lees, M. and Sloane Stanley, G.H.: A simple method for the isolation and purification of total lipides from animal tissues. J Biol Chem 226 (1957) 497-509.
Francois, C.A., Connor, S.L., Wander, R.C. and Connor, W.E.: Acute effects of dietary fatty acids on the fatty acids of human milk. Am J Clin Nutr 67 (1998) 301-8.
Frische, S., Kwon, T.H., Frokiaer, J., Madsen, K.M. and Nielsen, S.: Regulated expression of pendrin in rat kidney in response to chronic NH4Cl or NaHCO3 loading. Am J Physiol Renal Physiol 284 (2003) F584-93.
Gentles, A., Surles, J. and Smith, E.E.: Evaluation of adult quail and egg production following exposure to perchlorate-treated water. Environ Toxicol Chem 24 (2005) 1930-4.
German, J.B. and Dillard, C.J.: Composition, structure and absorption of milk lipids: a source of energy, fat-soluble nutrients and bioactive molecules. Crit Rev Food Sci Nutr 46 (2006) 57-92.
Gibbs, J.P., Ahmad, R., Crump, K.S., Houck, D.P., Leveille, T.S., Findley, J.E. and Francis, M.: Evaluation of a population with occupational exposure to airborne ammonium perchlorate for possible acute or chronic effects on thyroid function. J Occup Environ Med 40 (1998) 1072-82.
Ginzinger, D.G.: Gene quantification using real-time quantitative PCR: an emerging technology hits the mainstream. Exp Hematol 30 (2002) 503-12.
Goldman, S.J. and Stanbury, J.B.: The metabolism of perchlorate in the rat. Endocrinology 92 (1973) 1536-8.
Goleman, W.L., Carr, J.A. and Anderson, T.A.: Environmentally relevant concentrations of ammonium perchlorate inhibit thyroid function and alter sex ratios in developing Xenopus laevis. Environ Toxicol Chem 21 (2002a) 590-7.
158
Goleman, W.L., Urquidi, L.J., Anderson, T.A., Smith, E.E., Kendall, R.J. and Carr, J.A.: Environmentally relevant concentrations of ammonium perchlorate inhibit development and metamorphosis in Xenopus laevis. Environ Toxicol Chem 21 (2002b) 424-30.
Goodridge, A.G.: Regulation of the gene for fatty acid synthase. Fed Proc 45 (1986) 2399-405.
Greer, M.A., Goodman, G., Pleus, R.C. and Greer, S.E.: Health effects assessment for environmental perchlorate contamination: the dose response for inhibition of thyroidal radioiodine uptake in humans. Environ Health Perspect 110 (2002) 927-37.
Hadley, M.E.: Endocrinology, fifth ed. Prentice Hall, Upper Saddle River, NJ, 2000.
Hamosh, M., Chernick, S.S. and Scow, R.O.: Lipoprotein lipase activity during pregnancy and lactation. Isr J Med Sci 8 (1972) 834-5.
Handy, R., Barnett, D.A., Purves, R.W., Horlick, G. and Guevremont, R.: Determination of nanomolar levels of perchlorate in water by ESI-FAIMS-MS. Journal of Analytical Atomic Spectrometry 15 (2000) 907-911.
Hautman, D.P., Munch, D.J., Eaton, A.D. and Haghani, A.W.: Method 314.0 Determination of Perchlorate in Drinking Water Using Ion Chromatography, Revision 1.0, EPA 815-B-99-003. U.S. Environmental Protection Agency, Cincinnati, OH, 1999.
Heird, W.C.: The role of polyunsaturated fatty acids in term and preterm infants and breastfeeding mothers. Pediatr Clin North Am 48 (2001) 173-88.
Innis, S.M.: The role of dietary n-6 and n-3 fatty acids in the developing brain. Developmental Neuroscience 22 (2000) 474-80.
Innis, S.M.: Essential fatty acid transfer and fetal development. Placenta 26 Suppl A (2005) S70-5.
Iverson, S.J., Hamosh, M. and Bowen, W.D.: Lipoprotein lipase activity and its relationship to high milk fat transfer during lactation in grey seals. J Comp Physiol [B] 165 (1995) 384-95.
Jackson, P.E. and Chassaniol, K.: Advances in the determination of inorganic ions in potable waters by ion chromatography. Journal of Environmental Monitoring 4 (2002) 10-15.
Jackson, P.E., Gokhale, S. and Rohrer, J.S.: Chapter 5: recent developments in the analysis of perchlorate using ion chromatography. In: Urbansky, E.T. (Ed.), Perchlorate in the Environment, New York, 2000a, pp. 37-44.
159
Jackson, P.E., Gokhale, S., Streib, T., Rohrer, J.S. and Pohl, C.A.: Improved method for the determination of trace perchlorate in ground and drinking waters by ion chromatography. Journal of Chromatography A 888 (2000b) 151-158.
Jackson, P.E., Laikhtman, M. and Rohrer, J.S.: Determination of trace level perchlorate in drinking water and ground water by ion chromatography. Journal of Chromatography A 850 (1999) 131-135.
Jackson, W.A., Anandam, S.K., Anderson, T., Lehman, T., Rainwater, K., Rajagopalan, S., Ridley, M. and Tock, R.: Perchlorate occurrence in the Texas southern high plains aquifer system. Ground Water Monitoring and Remediation 25 (2005a) 137-149.
Jackson, W.A., Arunagiri, S., Tock, R., Anderson, T. and Rainwater, K.: Technical note: electrochemical generation of perchlorate in municipal drinking water systems. Journal AWWA 96 (2004) 103-108.
Jackson, W.A., Joseph, P., Laxman, P., Tan, K., Smith, P.N., Yu, L. and Anderson, T.A.: Perchlorate accumulation in forage and edible vegetation. Journal of Agricultural and Food Chemistry 53 (2005b) 369-373.
Jensen, C.L. and Heird, W.C.: Lipids with an emphasis on long-chain polyunsaturated fatty acids. Clin Perinatol 29 (2002) 261-81, vi.
Josefsson, M., Evilevitch, L., Westrom, R., Grunditz, T. and Ekblad, E.: Sodium-iodide symporter mediates iodide secretion in rat gastric mucosa in vitro. Experimental Biology and Medicine 231 (2006) 277-281.
Josefsson, M., Grunditz, T., Ohlsson, T. and Ekblad, E.: Sodium/iodide-symporter: distribution in different mammals and role in entero-thyroid circulation of iodide. Acta Physiol Scand 175 (2002) 129-37.
Joyner, C.P., Myrick, L.C., Crossland, J.P. and Dawson, W.D.: Deer Mice As Laboratory Animals. Ilar J 39 (1998) 322-330.
Kameda, K.: Thyroid hormone inhibits fatty acid synthase gene transcription in chicken liver. Mol Cell Biochem 144 (1995) 105-8.
Kao, Y., Manzon, R.G., Sheridan, M.A. and Youson, J.H.: Study of the relationship between thyroid hormones and lipid metabolism during KClO4-induced metamorphosis of landlocked lamprey, Petromyzon marinus. Comp Biochem Physiol C Pharmacol Toxicol Endocrinol 122 (1999) 363-73.
Kempen, E.C. and Brodbelt, J.S.: A method for the determination of binding constants by electrospray ionization mass spectrometry. Anal Chem 72 (2000) 5411-6.
160
Kengen, S.W., Rikken, G.B., Hagen, W.R., van Ginkel, C.G. and Stams, A.J.: Purification and characterization of (per)chlorate reductase from the chlorate-respiring strain GR-1. J Bacteriol 181 (1999) 6706-11.
Kent, J.C., Mitoulas, L., Cox, D.B., Owens, R.A. and Hartmann, P.E.: Breast volume and milk production during extended lactation in women. Exp Physiol 84 (1999) 435-47.
Kirk, A.B.: Perchlorate in human and ruminant milk, Department of Environmental Toxicology. Texas Tech University, Lubbock, 2005.
Kirk, A.B., Martinelango, P.K., Tian, K., Dutta, A., Smith, E.E. and Dasgupta, P.K.: Perchlorate and iodide in dairy and breast milk. Environ Sci Technol 39 (2005) 2011-7.
Kirk, A.B., Smith, E.E., Tian, K., Anderson, T.A. and Dasgupta, P.K.: Perchlorate in milk. Environmental Science & Technology 37 (2003) 4979-4981.
Kishihara, M., Nakao, Y., Baba, Y., Matsukura, S., Kuma, K. and Fujita, T.: Interaction between thyroid-stimulating immunoglobulins and thyrotropin receptors in fat cell membranes. J Clin Endocrinol Metab 49 (1979) 706-11.
Koester, C.J., Beller, H.R. and Halden, R.U.: Analysis of perchlorate in groundwater by electrospray ionization mass spectrometry/mass spectrometry. Environmental Science & Technology 34 (2000) 1862-1864.
Koletzko, B. and Rodriguez-Palmero, M.: Polyunsaturated fatty acids in human milk and their role in early infant development. J Mammary Gland Biol Neoplasia 4 (1999) 269-84.
Kotani, T., Ogata, Y., Yamamoto, I., Aratake, Y., Kawano, J.I., Suganuma, T. and Ohtaki, S.: Characterization of gastric Na+/I- symporter of the rat. Clin Immunol Immunopathol 89 (1998) 271-8.
Krynitsky, A.J., Niemann, R.A. and Nortrup, D.A.: Determination of perchlorate anion in foods by ion chromatography-tandem mass spectrometry. Analytical Chemistry 76 (2004) 5518-5522.
Lacroix, L., Mian, C., Caillou, B., Talbot, M., Filetti, S., Schlumberger, M. and Bidart, J.M.: Na(+)/I(-) symporter and Pendred syndrome gene and protein expressions in human extra-thyroidal tissues. Eur J Endocrinol 144 (2001) 297-302.
Lamm, S.H., Braverman, L.E., Li, F.X., Richman, K., Pino, S. and Howearth, G.: Thyroid health status of ammonium perchlorate workers: a cross-sectional occupational health study. J Occup Environ Med 41 (1999) 248-60.
Lamm, S.H. and Doemland, M.: Has perchlorate in drinking water increased the rate of congenital hypothyroidism? J Occup Environ Med 41 (1999) 409-11.
161
Landrum, M., Canas, J.E., Coimbatore, G., Cobb, G.P., Jackson, W.A., Zhang, B. and Anderson, T.A.: Effects of perchlorate on earthworm (Eisenia fetida) survival and reproductive success. Sci Total Environ (2005).
Lapillonne, A., Clarke, S.D. and Heird, W.C.: Polyunsaturated fatty acids and gene expression. Curr Opin Clin Nutr Metab Care 7 (2004) 151-6.
Lawrence, J.E., Lamm, S.H., Pino, S., Richman, K. and Braverman, L.E.: The effect of short-term low-dose perchlorate on various aspects of thyroid function. Thyroid 10 (2000) 659-63.
Li, F.X., Byrd, D.M., Deyhle, G.M., Sesser, D.E., Skeels, M.R., Katkowsky, S.R. and Lamm, S.H.: Neonatal thyroid-stimulating hormone level and perchlorate in drinking water. Teratology 62 (2000a) 429-31.
Li, F.X., Squartsoff, L. and Lamm, S.H.: Prevalence of thyroid diseases in Nevada counties with respect to perchlorate in drinking water. J Occup Environ Med 43 (2001) 630-4.
Li, Y.T. and George, E.J.: Analysis of perchlorate in water by reversed-phase LC/ESI.MS/MS using an internal standard technique. Analytical Chemistry 77 (2005) 4453-4458.
Li, Z., Li, F.X., Byrd, D., Deyhle, G.M., Sesser, D.E., Skeels, M.R. and Lamm, S.H.: Neonatal thyroxine level and perchlorate in drinking water. J Occup Environ Med 42 (2000b) 200-5.
Lina, B.A. and Kuijpers, M.H.: Toxicity and carcinogenicity of acidogenic or alkalogenic diets in rats; effects of feeding NH(4)Cl, KHCO(3) or KCl. Food Chem Toxicol 42 (2004) 135-53.
Liu, Y.J., Mou, S. and Heberling, S.: Determination of trace level bromate and perchlorate in drinking water by ion chromatography with an evaporative preconcentration technique. Journal of Chromatography A 956 (2002) 85-91.
Magnuson, M.L., Urbansky, E.T. and Kelty, C.A.: Determination of perchlorate at trace levels in drinking water by ion-pair extraction with electrospray ionization mass spectrometry. Analytical Chemistry 72 (2000a) 25-29.
Magnuson, M.L., Urbansky, E.T. and Kelty, C.A.: Microscale extraction of perchlorate in drinking water with low level detection by electrospray-mass spectrometry. Talanta 52 (2000b) 285-291.
Manzon, R.G. and Youson, J.H.: The effects of exogenous thyroxine (T4) or triiodothyronine (T3), in the presence and absence of potassium perchlorate, on the incidence of metamorphosis and on serum T4 and T3 concentrations in larval sea lampreys (Petromyzon marinus L.). Gen Comp Endocrinol 106 (1997) 211-20.
162
Marangoni, F., Colombo, C., De Angelis, L., Gambaro, V., Agostoni, C., Giovannini, M. and Galli, C.: Cigarette smoke negatively and dose-dependently affects the biosynthetic pathway of the n-3 polyunsaturated fatty acid series in human mammary epithelial cells. Lipids 39 (2004) 633-7.
Martinelango, P.K., Anderson, J.L., Dasgupta, P.K., Armstrong, D.W., Al-Horr, R.S. and Slingsby, R.W.: Gas-phase ion association provides increased selectivity and sensitivity for measuring perchlorate by mass spectrometry. Analytical Chemistry 77 (2005) 4829-4835.
McNabb, F.M., Larsen, C.T. and Pooler, P.S.: Ammonium perchlorate effects on thyroid function and growth in bobwhite quail chicks. Environ Toxicol Chem 23 (2004) 997-1003.
Medina, V.F., Larson, S.L., Extine, B. and Bednar, A.: Perchlorate analysis using solid-phase extraction cartridges. Journal of Chromatographic Science 43 (2005) 195-200.
Merrill, E.A., Clewell, R.A., Gearhart, J.M., Robinson, P.J., Sterner, T.R., Yu, K.O., Mattie, D.R. and Fisher, J.W.: PBPK predictions of perchlorate distribution and its effect on thyroid uptake of radioiodide in the male rat. Toxicol Sci 73 (2003) 256-69.
Merrill, E.A., Clewell, R.A., Robinson, P.J., Jarabek, A.M., Gearhart, J.M., Sterner, T.R. and Fisher, J.W.: PBPK model for radioactive iodide and perchlorate kinetics and perchlorate-induced inhibition of iodide uptake in humans. Toxicol Sci 83 (2005) 25-43.
Mian, C., Lacroix, L., Alzieu, L., Nocera, M., Talbot, M., Bidart, J.M., Schlumberger, M. and Caillou, B.: Sodium iodide symporter and pendrin expression in human thyroid tissues. Thyroid 11 (2001) 825-30.
Mitchell, A.M., Manley, S.W., Morris, J.C., Powell, K.A., Bergert, E.R. and Mortimer, R.H.: Sodium iodide symporter (NIS) gene expression in human placenta. Placenta 22 (2001) 256-8.
Morrison, W.R. and Smith, L.M.: Preparation of Fatty Acid Methyl Esters and Dimethylacetals from Lipids with Boron Fluoride--Methanol. J Lipid Res 5 (1964) 600-8.
Motzer, W.E.: Perchlorate: Problems, detection, and solutions. Environmental Forensics 2 (2001) 301-311.
Mukhi, S., Carr, J.A., Anderson, T.A. and Patino, R.: Novel biomarkers of perchlorate exposure in zebrafish. Environ Toxicol Chem 24 (2005) 1107-15.
Narayanan, L., Buttler, G.W., Yu, K.O., Mattie, D.R. and Fisher, J.W.: Sensitive high-performance liquid chromatography method for the determination of low levels of
163
perchlorate in biological samples. Journal of Chromatography B-Analytical Technologies in the Biomedical and Life Sciences 788 (2003) 393-399.
NAS: Health Implications of Perchlorate Ingestion. THE NATIONAL ACADEMIES PRESS, Washington, D. C., 2005.
Neville, M.C. and Picciano, M.F.: Regulation of milk lipid secretion and composition. Annu Rev Nutr 17 (1997) 159-83.
NRC: Nutrient Requirements of Dairy Cattle. National Research Council, National Academy Press, Washingdon DC, 2001.
Patino, R., Wainscott, M.R., Cruz-Li, E.I., Balakrishnan, S., McMurry, C., Blazer, V.S. and Anderson, T.A.: Effects of ammonium perchlorate on the reproductive performance and thyroid follicle histology of zebrafish. Environ Toxicol Chem 22 (2003) 1115-21.
Peña, H.G., Kessler, W.V., Christian, J.E., Cline, T.R. and Plumlee, M.P.: A comparative study of iodine and potassium perchlorate metabolism in the laying hen. 2. Uptake, distribution, and excretion of potassium perchlorate. Poult Sci 55 (1976) 188-201.
Perron, B., Rodriguez, A.M., Leblanc, G. and Pourcher, T.: Cloning of the mouse sodium iodide symporter and its expression in the mammary gland and other tissues. J Endocrinol 170 (2001) 185-96.
Pinke, L.A., Dean, D.S., Bergert, E.R., Spitzweg, C., Dutton, C.M. and Morris, J.C.: Cloning of the mouse sodium iodide symporter. Thyroid 11 (2001) 935-9.
Pourreza, N. and Mousavi, H.Z.: Extraction spectrophotometric determination of trace amounts of perchlorate based on ion-pair formation with thionine. Journal of Analytical Chemistry 60 (2005) 816-818.
Quentin, F., Chambrey, R., Trinh-Trang-Tan, M.M., Fysekidis, M., Cambillau, M., Paillard, M., Aronson, P.S. and Eladari, D.: The Cl-/HCO3- exchanger pendrin in the rat kidney is regulated in response to chronic alterations in chloride balance. Am J Physiol Renal Physiol 287 (2004) F1179-88.
Ramachandran, B.R.: Characterization of pendrin gene expression in developing and adult deer mice following exposure to ammonium perchlorate during gestation and post-gestation, Environemtal Toxicology. Texas Tech University, Lubbock, TX, 2005.
Rillema, J.A. and Hill, M.A.: Prolactin regulation of the pendrin-iodide transporter in the mammary gland. Am J Physiol Endocrinol Metab 284 (2003) E25-8.
164
Rillema, J.A., Williams, C.H., Moulden, J. and Golden, K.L.: Effect of insulin on iodide uptake in mouse mammary gland explants. Exp Biol Med (Maywood) 227 (2002) 32-5.
Rillema, J.A., Yu, T.X. and Jhiang, S.M.: Effect of prolactin on sodium iodide symporter expression in mouse mammary gland explants. Am J Physiol Endocrinol Metab 279 (2000) E769-72.
Royaux, I.E., Suzuki, K., Mori, A., Katoh, R., Everett, L.A., Kohn, L.D. and Green, E.D.: Pendrin, the protein encoded by the Pendred syndrome gene (PDS), is an apical porter of iodide in the thyroid and is regulated by thyroglobulin in FRTL-5 cells. Endocrinology 141 (2000) 839-45.
Royaux, I.E., Wall, S.M., Karniski, L.P., Everett, L.A., Suzuki, K., Knepper, M.A. and Green, E.D.: Pendrin, encoded by the Pendred syndrome gene, resides in the apical region of renal intercalated cells and mediates bicarbonate secretion. Proc Natl Acad Sci U S A 98 (2001) 4221-6.
Sanchez, C.A., Krieger, R.I., Khandaker, N., Moore, R.C., Holts, K.C. and Neidel, L.L.: Accumulation and perchlorate exposure potential of lettuce produced in the Lower Colorado River region. J Agric Food Chem 53 (2005) 5479-86.
Scott, D.A. and Karniski, L.P.: Human pendrin expressed in Xenopus laevis oocytes mediates chloride/formate exchange. Am J Physiol Cell Physiol 278 (2000) C207-11.
Scott, D.A., Wang, R., Kreman, T.M., Sheffield, V.C. and Karniski, L.P.: The Pendred syndrome gene encodes a chloride-iodide transport protein. Nat Genet 21 (1999) 440-3.
Siglin, J.C., Mattie, D.R., Dodd, D.E., Hildebrandt, P.K. and Baker, W.H.: A 90-day drinking water toxicity study in rats of the environmental contaminant ammonium perchlorate. Toxicol Sci 57 (2000) 61-74.
Slominski, A., Wortsman, J., Kohn, L., Ain, K.B., Venkataraman, G.M., Pisarchik, A., Chung, J.H., Giuliani, C., Thornton, M., Slugocki, G. and Tobin, D.J.: Expression of hypothalamic-pituitary-thyroid axis related genes in the human skin. J Invest Dermatol 119 (2002) 1449-55.
Smanik, P.A., Liu, Q., Furminger, T.L., Ryu, K., Xing, S., Mazzaferri, E.L. and Jhiang, S.M.: Cloning of the human sodium lodide symporter. Biochem Biophys Res Commun 226 (1996) 339-45.
Smith, P.N., Theodorakis, C.W., Anderson, T.A. and Kendall, R.J.: Preliminary assessment of perchlorate in ecological receptors at the Longhorn Army Ammunition Plant (LHAAP), Karnack, Texas. Ecotoxicology 10 (2001) 305-13.
165
Smith, P.N., Utley, S.J., Cox, S.B., Anderson, T.A. and McMurry, S.T.: Monitoring perchlorate exposure and thyroid hormone status among raccoons inhabiting a perchlorate-contaminated site. Environ Monit Assess 102 (2005) 337-47.
Smith, P.N., Yu, L., McMurry, S.T. and Anderson, T.A.: Perchlorate in water, soil, vegetation, and rodents collected from the Las Vegas Wash, Nevada, USA. Environmental Pollution 132 (2004a) 121-127.
Smith, P.N., Yu, L., McMurry, S.T. and Anderson, T.A.: Perchlorate in water, soil, vegetation, and rodents collected from the Las Vegas Wash, Nevada, USA. Environ Pollut 132 (2004b) 121-7.
Snyder, S.A., Vanderford, B.J. and Rexing, D.J.: Trace analysis of bromate, chlorate, iodate, and perchlorate in natural and bottled waters. Environmental Science & Technology 39 (2005) 4586-4593.
Soldin, O.P., Braverman, L.E. and Lamm, S.H.: Perchlorate clinical pharmacology and human health: a review. Ther Drug Monit 23 (2001) 316-31.
Soleimani, M., Greeley, T., Petrovic, S., Wang, Z., Amlal, H., Kopp, P. and Burnham, C.E.: Pendrin: an apical Cl-/OH-/HCO3- exchanger in the kidney cortex. Am J Physiol Renal Physiol 280 (2001) F356-64.
Spitzweg, C., Dutton, C.M., Castro, M.R., Bergert, E.R., Goellner, J.R., Heufelder, A.E. and Morris, J.C.: Expression of the sodium iodide symporter in human kidney. Kidney Int 59 (2001) 1013-23.
Spitzweg, C., Joba, W., Eisenmenger, W. and Heufelder, A.E.: Analysis of human sodium iodide symporter gene expression in extrathyroidal tissues and cloning of its complementary deoxyribonucleic acids from salivary gland, mammary gland, and gastric mucosa. J Clin Endocrinol Metab 83 (1998) 1746-51.
Spitzweg, C., Joba, W., Morris, J.C. and Heufelder, A.E.: Regulation of sodium iodide symporter gene expression in FRTL-5 rat thyroid cells. Thyroid 9 (1999a) 821-30.
Spitzweg, C., Joba, W., Schriever, K., Goellner, J.R., Morris, J.C. and Heufelder, A.E.: Analysis of human sodium iodide symporter immunoreactivity in human exocrine glands. J Clin Endocrinol Metab 84 (1999b) 4178-84.
Stapleton, S.R., Mitchell, D.A., Salati, L.M. and Goodridge, A.G.: Triiodothyronine stimulates transcription of the fatty acid synthase gene in chick embryo hepatocytes in culture. Insulin and insulin-like growth factor amplify that effect. J Biol Chem 265 (1990) 18442-6.
Sterner, J.L., Johnston, M.V., Nicol, G.R. and Ridge, D.P.: Signal suppression in electrospray ionization Fourier transform mass spectrometry of multi-component samples. J Mass Spectrom 35 (2000) 385-91.
166
Stevens, L.J., Zentall, S.S., Abate, M.L., Kuczek, T. and Burgess, J.R.: Omega-3 fatty acids in boys with behavior, learning, and health problems. Physiol Behav 59 (1996) 915-20.
Stokstad, E.: Environmental health. Debate continues over safety of water spiked with rocket fuel. Science 307 (2005) 507.
Susarla, S., Bacchus, S.T., Harvey, G. and McCutcheon, S.C.: Phytotransformations of perchlorate contaminated waters. Environmental Technology 21 (2000) 1055-1065.
Susarla, S., Collette, T.W., Garrison, A.W., Wolfe, N.L. and McCutcheon, S.C.: Perchlorate identification in fertilizers. Environmental Science & Technology 33 (1999) 3469-3472.
Suzuki, K., Royaux, I.E., Everett, L.A., Mori-Aoki, A., Suzuki, S., Nakamura, K., Sakai, T., Katoh, R., Toda, S., Green, E.D. and Kohn, L.D.: Expression of PDS/Pds, the Pendred syndrome gene, in endometrium. J Clin Endocrinol Metab 87 (2002) 938.
Tan, K., Anderson, T.A., Jones, M.W., Smith, P.N. and Jackson, W.A.: Accumulation of perchlorate in aquatic and terrestrial plants at a field scale. J Environ Qual 33 (2004) 1638-46.
Tanner, G.A.: Renal regulation of acid-base balance: ammonia excretion. Physiologist 27 (1984) 95-7.
Thuett, K.A., Roots, E.H., Mitchell, L.P., Gentles, B.A., Anderson, T., Kendall, R.J. and Smith, E.E.: Effects of in utero and lactational ammonium perchlorate exposure on thyroid gland histology and thyroid and sex hormones in developing deer mice (peromyscus maniculatus) through postnatal day 21. J Toxicol Environ Health A 65 (2002) 2119-30.
Tian, K., Canas, J.E., Dasgupta, P.K. and Anderson, T.A.: Preconcentration/preelution ion chromatography for the determination of perchlorate in complex samples. Talanta 65 (2005) 750-755.
Tian, K., Dasgupta, P.K. and Anderson, T.A.: Determination of trace perchlorate in high-salinity water samples by ion chromatography with on-line preconcentration an preelution. Analytical Chemistry 75 (2003) 701-706.
Tietge, J.E., Holcombe, G.W., Flynn, K.M., Kosian, P.A., Korte, J.J., Anderson, L.E., Wolf, D.C. and Degitz, S.J.: Metamorphic inhibition of Xenopus laevis by sodium perchlorate: effects on development and thyroid histology. Environ Toxicol Chem 24 (2005) 926-33.
167
Tizianello, A., Deferrari, G., Garibotto, G., Robaudo, C., Acquarone, N. and Ghiggeri, G.M.: Renal ammoniagenesis in an early stage of metabolic acidosis in man. J Clin Invest 69 (1982) 240-50.
Uauy, R., Hoffman, D.R., Peirano, P., Birch, D.G. and Birch, E.E.: Essential fatty acids in visual and brain development. Lipids 36 (2001) 885-95.
Uauy, R., Mena, P. and Rojas, C.: Essential fatty acids in early life: structural and functional role. Proc Nutr Soc 59 (2000) 3-15.
Urbansky, E.T.: Perchlorate Chemistry: Implications for Analysis and Remediation. Bioremediation Journal 2 (1998).
Urbansky, E.T.: Quantitation of perchlorate ion: Practices and advances applied to the analysis of common matrices. Critical Reviews in Analytical Chemistry 30 (2000) 311-343.
Urbansky, E.T.: Perchlorate as an environmental contaminant. Environmental Science and Pollution Research 9 (2002) 187-192.
Urbansky, E.T., Brown, S.K., Magnuson, M.L. and Kelty, C.A.: Perchlorate levels in samples of sodium nitrate fertilizer derived from Chilean caliche. Environmental Pollution 112 (2001) 299-302.
Urbansky, E.T. and Collette, T.W.: Comparison and evaluation of laboratory performance on a method for the determination of perchlorate in fertilizers. Journal of Environmental Monitoring 3 (2001) 454-462.
Urbansky, E.T., Gu, B.H., Magnuson, M.L., Brown, G.M. and Kelty, C.A.: Survey of bottled waters for perchlorate by electrospray ionization mass spectrometry (ESI-MS) and ion chromatography (IC). Journal of the Science of Food and Agriculture 80 (2000a) 1798-1804.
Urbansky, E.T., Magnuson, M.L., Freeman, D. and Jelks, C.: Quantitation of perchlorate ion by electrospray ionization mass spectrometry (ESI-MS) using stable association complexes with organic cations and bases to enhance selectivity. Journal of Analytical Atomic Spectrometry 14 (1999) 1861-1866.
Urbansky, E.T., Magnuson, M.L., Kelty, C.A. and Brown, S.K.: Perchlorate uptake by salt cedar (Tamarix ramosissima) in the Las Vegas Wash riparian ecosystem. Science of the Total Environment 256 (2000b) 227-232.
Urbansky, E.T. and Schock, M.R.: Issues in managing the risks associated with perchlorate in drinking water. Journal of Environmental Management 56 (1999) 79-95.
168
Valentin-Blasini, L., Mauldin, J.P., Maple, D. and Blount, B.C.: Analysis of perchlorate in human urine using ion chromatography and electrospray tandem mass spectrometry. Analytical Chemistry 77 (2005) 2475-2481.
Van Sande, J., Massart, C., Beauwens, R., Schoutens, A., Costagliola, S., Dumont, J.E. and Wolff, J.: Anion selectivity by the sodium iodide symporter. Endocrinology 144 (2003) 247-52.
Vayre, L., Sabourin, J.C., Caillou, B., Ducreux, M., Schlumberger, M. and Bidart, J.M.: Immunohistochemical analysis of Na+/I- symporter distribution in human extra-thyroidal tissues. Eur J Endocrinol 141 (1999) 382-6.
Verlander, J.W., Hassell, K.A., Royaux, I.E., Glapion, D.M., Wang, M.E., Everett, L.A., Green, E.D. and Wall, S.M.: Deoxycorticosterone upregulates PDS (Slc26a4) in mouse kidney: role of pendrin in mineralocorticoid-induced hypertension. Hypertension 42 (2003) 356-62.
Wagner, C.A., Finberg, K.E., Stehberger, P.A., Lifton, R.P., Giebisch, G.H., Aronson, P.S. and Geibel, J.P.: Regulation of the expression of the Cl-/anion exchanger pendrin in mouse kidney by acid-base status. Kidney Int 62 (2002) 2109-17.
Wainwright, P.E.: Dietary essential fatty acids and brain function: a developmental perspective on mechanisms. Proc Nutr Soc 61 (2002) 61-9.
Wall, S.M., Kim, Y.H., Stanley, L., Glapion, D.M., Everett, L.A., Green, E.D. and Verlander, J.W.: NaCl restriction upregulates renal Slc26a4 through subcellular redistribution: role in Cl- conservation. Hypertension 44 (2004) 982-7.
Williams, T.L., Martin, R.B. and Collette, T.W.: Raman spectroscopic analysis of fertilizers and plant tissue for perchlorate. Applied Spectroscopy 55 (2001) 967-983.
Wilson, S.B., Back, D.W., Morris, S.M., Jr., Swierczynski, J. and Goodridge, A.G.: Hormonal regulation of lipogenic enzymes in chick embryo hepatocytes in culture. Expression of the fatty acid synthase gene is regulated at both translational and pretranslational steps. J Biol Chem 261 (1986) 15179-82.
Winkler, P., Minteer, M. and Willey, J.: Analysis of perchlorate in water and soil by electrospray LC/MS/MS. Analytical Chemistry 76 (2004) 469-473.
Wolff, J.: Perchlorate and the thyroid gland. Pharmacol Rev 50 (1998) 89-105.
Wolff, J.: What is the role of pendrin? Thyroid 15 (2005) 346-8.
Wolff, J. and Chaikoff, I.L.: Plasma inorganic iodide as a homeostatic regulator of thyroid function. Journal of Biological Chemistry 174 (1948) 555–564.
York, R.G., Barnett, J., Jr., Brown, W.R., Garman, R.H., Mattie, D.R. and Dodd, D.: A rat neurodevelopmental evaluation of offspring, including evaluation of adult and
169
neonatal thyroid, from mothers treated with ammonium perchlorate in drinking water. Int J Toxicol 23 (2004) 191-214.
York, R.G., Brown, W.R., Girard, M.F. and Dollarhide, J.S.: Oral (drinking water) developmental toxicity study of ammonium perchlorate in New Zealand White rabbits. Int J Toxicol 20 (2001a) 199-205.
York, R.G., Brown, W.R., Girard, M.F. and Dollarhide, J.S.: Two-generation reproduction study of ammonium perchlorate in drinking water in rats evaluates thyroid toxicity. Int J Toxicol 20 (2001b) 183-97.
York, R.G., Funk, K.A., Girard, M.F., Mattie, D. and Strawson, J.E.: Oral (drinking water) developmental toxicity study of ammonium perchlorate in Sprague-Dawley rats. Int J Toxicol 22 (2003) 453-64.
Yoshida, A., Taniguchi, S., Hisatome, I., Royaux, I.E., Green, E.D., Kohn, L.D. and Suzuki, K.: Pendrin is an iodide-specific apical porter responsible for iodide efflux from thyroid cells. J Clin Endocrinol Metab 87 (2002) 3356-61.
Yoshino, T., Sato, E., Nakashima, T., Nagashima, W., Teranishi, M.A., Nakayama, A., Mori, N., Murakami, H., Funahashi, H. and Imai, T.: The immunohistochemical analysis of pendrin in the mouse inner ear. Hear Res 195 (2004) 9-16.
Yu, K.O., Narayanan, L., Mattie, D.R., Godfrey, R.J., Todd, P.N., Sterner, T.R., Mahle, D.A., Lumpkin, M.H. and Fisher, J.W.: The pharmacokinetics of perchlorate and its effect on the hypothalamus-pituitary-thyroid axis in the male rat. Toxicol Appl Pharmacol 182 (2002) 148-59.
Yu, L., Canas, J.E., Cobb, G.P., Jackson, W.A. and Anderson, T.A.: Uptake of perchlorate in terrestrial plants. Ecotoxicol Environ Saf 58 (2004) 44-9.
Zanartu, D., Polan, C.E., Ferreri, L.E. and McGilliard, M.L.: Effect of stage of lactation and varying available energy intake on milk production, milk composition, and subsequent tissue enzymic activity. J Dairy Sci 66 (1983) 1644-52.
Zoeller, R.T.: Challenges confronting risk analysis of potential thyroid toxicants. Risk Anal 23 (2003) 143-62.
170

171
APPENDIX
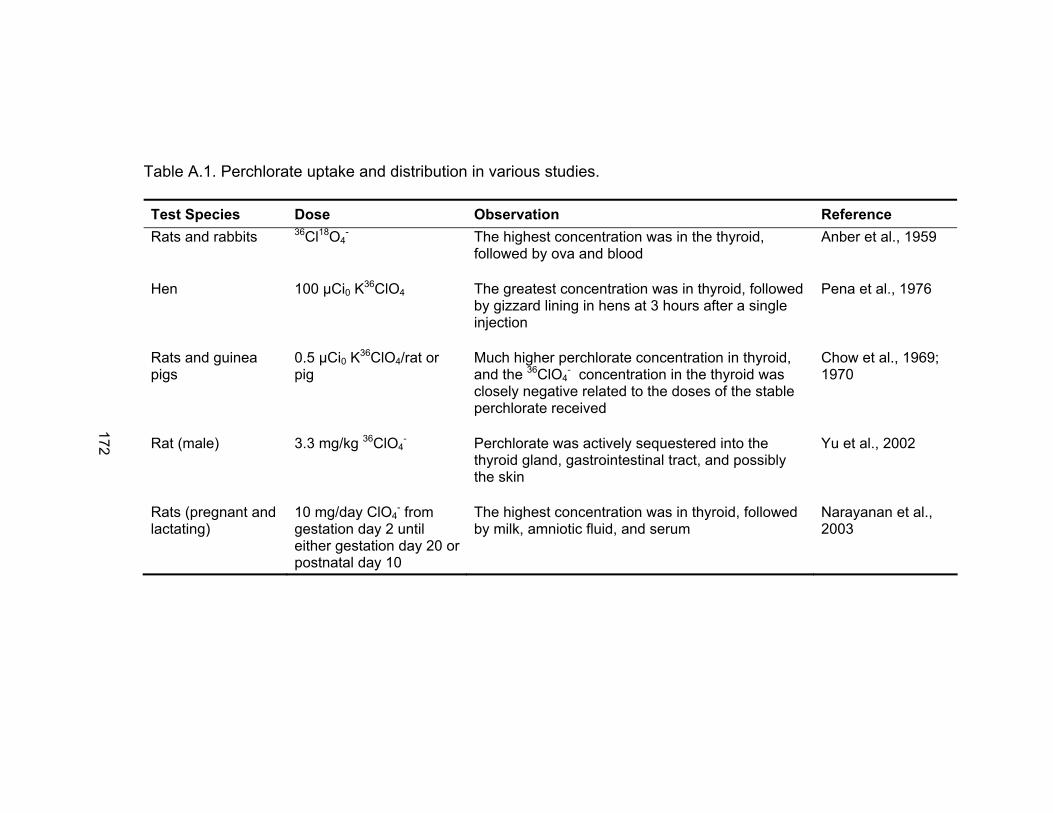
Table A.1. Perchlorate uptake and distribution in various studies. Test Species Dose Observation Reference Rats and rabbits 36Cl18O4
- The highest concentration was in the thyroid, followed by ova and blood
Anber et al., 1959
Hen 100 μCi0 K36ClO4 The greatest concentration was in thyroid, followed by gizzard lining in hens at 3 hours after a single injection
Pena et al., 1976
Rats and guinea pigs
0.5 μCi0 K36ClO4/rat or pig
Much higher perchlorate concentration in thyroid, and the 36ClO4
- concentration in the thyroid was closely negative related to the doses of the stable perchlorate received
Chow et al., 1969; 1970
Rat (male) 3.3 mg/kg 36ClO4- Perchlorate was actively sequestered into the
thyroid gland, gastrointestinal tract, and possibly the skin
Yu et al., 2002
Rats (pregnant and lactating)
10 mg/day ClO4- from
gestation day 2 until either gestation day 20 or postnatal day 10
The highest concentration was in thyroid, followed by milk, amniotic fluid, and serum
Narayanan et al., 2003
172
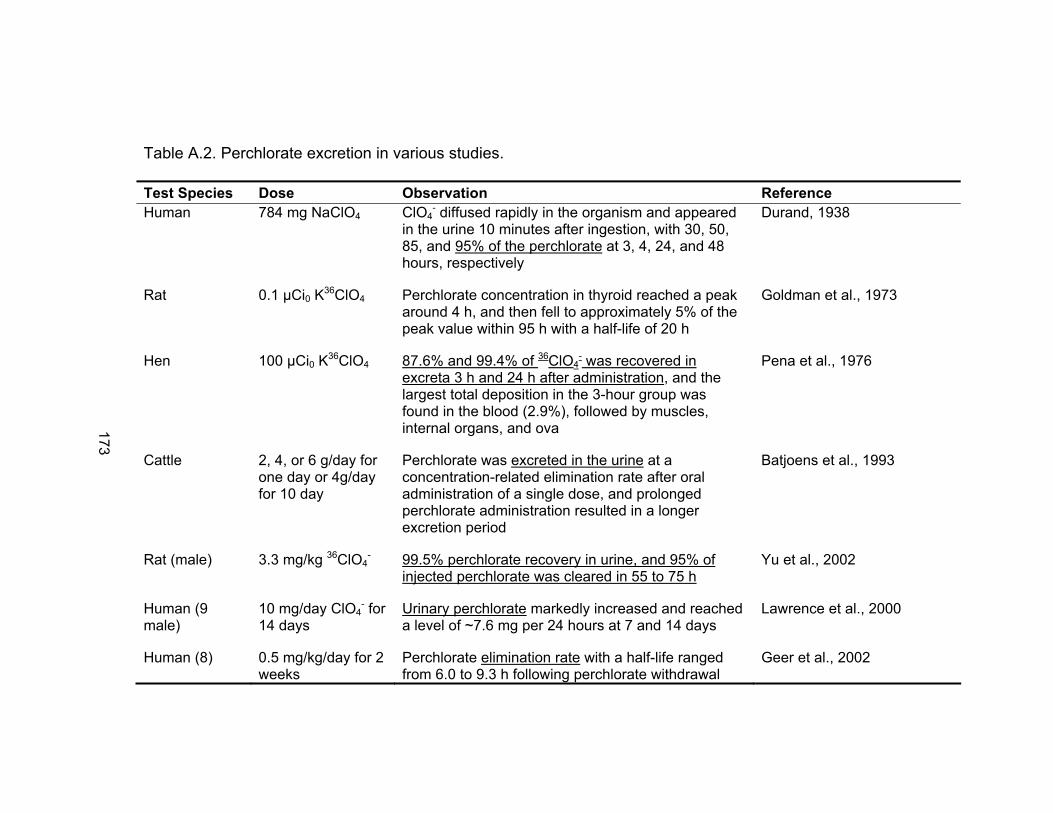
Table A.2. Perchlorate excretion in various studies. Test Species Dose Observation Reference Human 784 mg NaClO4 ClO4
- diffused rapidly in the organism and appeared in the urine 10 minutes after ingestion, with 30, 50, 85, and 95% of the perchlorate at 3, 4, 24, and 48 hours, respectively
Durand, 1938
Rat 0.1 μCi0 K36ClO4 Perchlorate concentration in thyroid reached a peak around 4 h, and then fell to approximately 5% of the peak value within 95 h with a half-life of 20 h
Goldman et al., 1973
Hen 100 μCi0 K36ClO4 87.6% and 99.4% of 36ClO4- was recovered in
excreta 3 h and 24 h after administration, and the largest total deposition in the 3-hour group was found in the blood (2.9%), followed by muscles, internal organs, and ova
Pena et al., 1976
Cattle 2, 4, or 6 g/day for one day or 4g/day for 10 day
Perchlorate was excreted in the urine at a concentration-related elimination rate after oral administration of a single dose, and prolonged perchlorate administration resulted in a longer excretion period
Batjoens et al., 1993
Rat (male) 3.3 mg/kg 36ClO4- 99.5% perchlorate recovery in urine, and 95% of
injected perchlorate was cleared in 55 to 75 h
Yu et al., 2002
Human (9 male)
10 mg/day ClO4- for
14 days Urinary perchlorate markedly increased and reached a level of ~7.6 mg per 24 hours at 7 and 14 days
Lawrence et al., 2000
Human (8) 0.5 mg/kg/day for 2 weeks
Perchlorate elimination rate with a half-life ranged from 6.0 to 9.3 h following perchlorate withdrawal
Geer et al., 2002
173
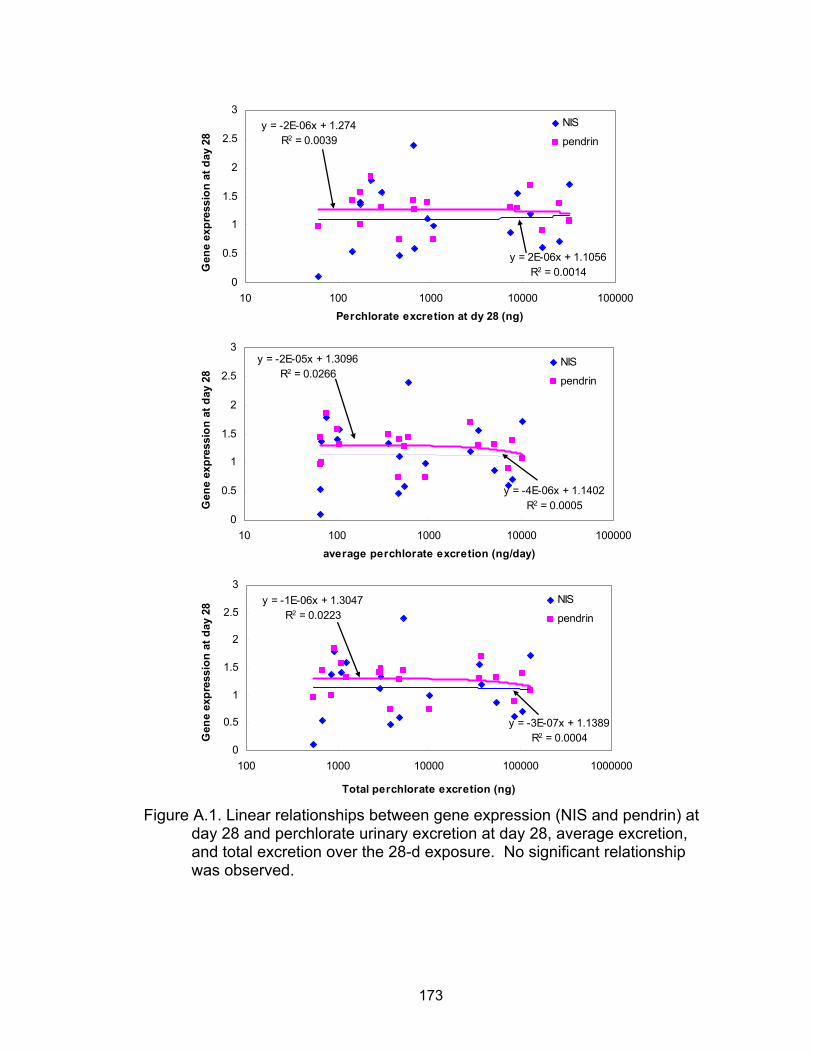
y = -2E-06x + 1.274R2 = 0.0039
y = 2E-06x + 1.1056R2 = 0.0014
0
0.5
1
1.5
2
2.5
3
10 100 1000 10000 100000Perchlorate excretion at dy 28 (ng)
Gen
e ex
pres
sion
at d
ay 2
8
NIS
pendrin
y = -2E-05x + 1.3096R2 = 0.0266
y = -4E-06x + 1.1402R2 = 0.0005
0
0.5
1
1.5
2
2.5
3
10 100 1000 10000 100000average perchlorate excretion (ng/day)
Gen
e ex
pres
sion
at d
ay 2
8
NIS
pendrin
y = -1E-06x + 1.3047R2 = 0.0223
y = -3E-07x + 1.1389R2 = 0.0004
0
0.5
1
1.5
2
2.5
3
100 1000 10000 100000 1000000
Total perchlorate excretion (ng)
Gen
e ex
pres
sion
at d
ay 2
8 NIS
pendrin
Figure A.1. Linear relationships between gene expression (NIS and pendrin) at
day 28 and perchlorate urinary excretion at day 28, average excretion, and total excretion over the 28-d exposure. No significant relationship was observed.
173
PERMISSION TO COPY
In presenting this dissertation in partial fulfillment of the requirements for a
PhD degree at Texas Tech University or Texas Tech University Health Sciences
Center, I agree that the Library and my major department shall make it freely
available for research purposes. Permission to copy this thesis for scholarly
purposes may be granted by the Director of the Library or my major professor. It
is understood that any copying or publication of this thesis for financial gain shall
not be allowed without my further written permission and that any user may be
liable for copyright infringement.
Agree (Permission is granted.)
Qiuqiong Cheng 4/20/2006
Student Signature Date
Disagree (Permission is not granted.)
_______________________________________________ _________________
Student Signature Date