characterization of red cell membrane proteins as a function of red cell density
TRANSCRIPT
FEBS Letters 580 (2006) 6527–6532
Characterization of red cell membrane proteins as a functionof red cell density:
Annexin VII in different forms of hereditary spherocytosis
Marianna Caterinoa,b, Margherita Ruoppoloa,b,*, Stefania Orrub,c, Marcella Savoiaa,Silverio Perrottad, Luigi Del Vecchioa,b, Francesco Salvatorea,b, Gordon W. Stewarte,
Achille Iolascona,b
a Dipartimento di Biochimica e Biotecnologie Mediche, Universita di Napoli ‘‘Federico II’’, Via Pansini, 5 80131 Napoli, Italyb CEINGE, Biotecnologie Avanzate, scarl, Via Comunale Margherita 482, 80145 Napoli, Italy
c Facolta’ di Scienze Motorie, Universita’ di Napoli ‘‘Parthenope’’, Via Acton 38, 80133 Napoli, Italyd Dipartimento di Pediatria, Seconda Universita di Napoli, Via S. Andrea delle Dame 4, 80100 Napoli, Italy
e Department of Medicine Royal Free and University College Medical School University College London, 5 University Street, London WC1E 6JJ, UK
Received 15 September 2006; revised 27 October 2006; accepted 30 October 2006
Available online 7 November 2006
Edited by Gianni Cesareni
Abstract Fresh human blood samples were collected fromhealthy controls and splenectomized and unsplenectomized pa-tients with hereditary spherocytosis due to band 3 or ankyrinand spectrin deficiency. The erythrocytes were separated intoage-related fractions using self-forming Percoll density gradi-ents. Membrane proteins were analysed by 2D electrophoresisand identified by mass spectrometry.
Annexin VII was present in reticulocytes but was then lost asthe cells matured. A different pattern was found in band 3-defi-cient samples: annexin VII was in fact present in both matureand immature red cell membranes. Cytoskeletal anomalies maythen influence the turn-over of annexin VII during erythrocytematuration.� 2006 Federation of European Biochemical Societies. Publishedby Elsevier B.V. All rights reserved.
Keywords: Red blood cell; Membrane proteins; Proteomics;Hereditary spherocytosis; Annexin VII; Mass spectrometry
1. Introduction
Hereditary spherocytosis (HS) is characterized by the pres-
ence of spherocytes in peripheral blood smears with varying
degrees of hemolysis and splenomegaly [1]. HS can be caused
by dominantly- and recessively-inherited family-specific muta-
tions. These mutations involve five proteins that are implicated
in ‘vertical’ associations between the cytoskeleton and the
overlaying lipid bilayer: a and b spectrin [2], ankyrin [3], band
3 [4,5], and protein 4.2 [6].
Abbreviations: 2DE, two-dimensional electrophoresis; HS, hereditaryspherocytosis; LCMS/MS, liquid chromatography coupled to tandemmass spectrometry; MALDI-TOF, matrix assisted laser desorptionionisation-time of flight; MS, mass spectrometry; RBC, red blood cell
*Corresponding author. Present address: Dipartimento di Biochimica eBiotecnologie Mediche, Universita di Napoli ‘‘Federico II’’, ViaPansini, 5 80131 Napoli, Italy. Fax: +39 0 81 7462404.E-mail address: [email protected] (M. Ruoppolo).
0014-5793/$32.00 � 2006 Federation of European Biochemical Societies. Pu
doi:10.1016/j.febslet.2006.10.070
Monodimesional electrophoresis by means of Laemmli and
Fairbanks gels can define the vast majority of red cell mem-
brane defects in HS, but in 10–20% of cases the biochemical
mechanism underlining HS remains obscure [1]. Further, the
mechanism(s) by which senescent and oxidatively-damaged
normal erythrocytes, or erythrocytes with a membrane defect,
are cleared from the circulation, are not well understood.
In the present work, we have sought to use a proteomic ap-
proach to characterize the red blood cell membrane proteins in
normal and in hereditary spherocytosis (HS) red blood cells as
a function of cell age. We have used contemporary methods
for the solubilisation, separation and identification of erythro-
cyte membrane proteins [7–14]. HS patients with ankyrin and
spectrin or band 3 deficiencies have been clinically character-
ized in a previous study [15]. Here we have found that the
expression of annexin VII is related to cell density.
2. Materials and methods
2.1. Blood collectionAfter informed consent blood samples were collected from healthy
controls and splenectomized and not-splenectomized patients affectedwith HS due to ankyrin and spectrin or with band 3 deficiencies. Clin-ical findings of these patients were described elsewhere [15,16].
2.2. Red blood cell membrane preparationBlood (30 ml, in the case of healthy controls) and 10 ml (in the case
of HS patients) was filtered to remove white cells following as de-scribed [17]. Filtered blood was centrifuged at 478 · g for 10 min at4 �C and the supernatant was discarded. The erythrocytes were sepa-rated into density-dependent fractions on self-forming Percoll densitygradient [15]. Samples were centrifuged at 33000 · g for 35 min at4 �C in 50 ml polypropylene tubes, in a fixed angle rotor. After makinga picture of the banding pattern of red blood cell density gradient,erythrocyte fractions of increasing density were recovered by aspira-tion, diluted in five volumes of 0.9% NaCl, 5 mM phosphate bufferpH 8.0, centrifuged at 478 · g for 10 min at 4 �C, washed four timeswith five volumes of 0.9% NaCl, 5 mM phosphate buffer by gentle mix-ing and recentrifugated. Reticulocyte enrichment in the top fractionwas up to 25% [17].
The preparation of human red blood cell membranes was carried outaccording to conventional methods [15]. The pellets were aliquoted andstored at �80 �C in 7 M urea, 2 M thiourea, 2% amidosulfobetaine-14(ASB-14), 40 mM Tris–HCl, pH 8.5.
blished by Elsevier B.V. All rights reserved.
6528 M. Caterino et al. / FEBS Letters 580 (2006) 6527–6532
2.3. 2D electrophoresis and image analysisMembrane proteins were dissolved in the isoelectric focusing solu-
tion, containing 3 mM tributylphosphine (TBP), 10 mM iodoaceta-mide (IAA) and 1% carrier ampholyte pH 3–10. The IPG Strips (pH3–10 non-linear, 17 cm long, Biorad Laboratories) were rehydratedwith isoelectric focusing solution, containing 60 lg or 500 lg proteinsample to carry out analytical or preparative analysis, respectively,in a Protean IEF Cell (Biorad), under a gentle voltage (50 V), over-night. The rehydrated strips were focused using the following runningconditions: 0–1000 V in 5 h, 1000 V for 10 h, voltage gradient from1000 V to 10000 V for a total of 80 kV/h. Before running the seconddimension, the IPG strips were equilibrated for 30 min in equilibrationbuffer, containing 6 M urea, 2% (w/v) sodium-dodecyl sulphate (SDS),0.375 M Tris–HCl buffer at pH 8.5 and 20% (v/v) glycerol. Electropho-resis in the second dimension was carried out in 10% polyacrylamidegels. The IPG strips were embedded with 0.5% w/v melted agarosesolution, prior to running on the SDS–PAGE slabs. The agarose solu-tion contained 0.001% (w/v) bromophenol blue as a tracking dye. Thegels were run at 30 mA/gel constant current at 12 �C.
The proteins were visualized by a double staining procedure, usingcolloidal coomassie staining (Pierce) and silver staining [18]. Tenhealthy controls were studied. The two-dimensional electrophoresis(2DE) maps of density fractions were obtained in triplicate for eachsample. Gels were acquired with a 36.3 · 36.3 l resolution using aGS-800 Calibrated Densitometer (Biorad, Hercules, CA). Gel imageswere analysed by PDQUEST 7.1 software provided by the manufac-turer. Spot detection parameters were optimised in order to minimizethe false positive detection and maximize the real spot detection. Acomposite image was generated from each group of triplicated gels,in which only spots that matched across all the images were used.Composite images from healthy controls relative to a specific densityfraction were compared each others and a master gel was obtainedfor any type of membrane protein sample (Fig. 1a, Ac and Cc).
To test the gel-to-gel variation we estimated the total intensity (SpotQuantity) of a defined spot in all composite images (intragel variation)and in all master images (intergel variation). The Spot Quantity mea-surements for actin are reported in Table 1S of the supplementarymaterials. The coefficient of variation which is commonly used formeasuring gel-to-gel variation was below 5% for all the proteins ana-lysed thus indicating that protein spots could easily be compared toeach other, showing a good reproducibility of the method.
2.4. Mass spectrometry procedureProtein spots of interest were excised from the gels and treated as
described [19,20]. The peptide mixtures were analysed by MALDI MS.Mass spectrometric analysis was performed using a Voyager-DE
PRO matrix assisted laser desorption ionisation-time of flight(MALDI-TOF) mass spectrometer (Applied Biosystems, Framing-ham, MA) with the following specifications: positive ion mode, reflec-
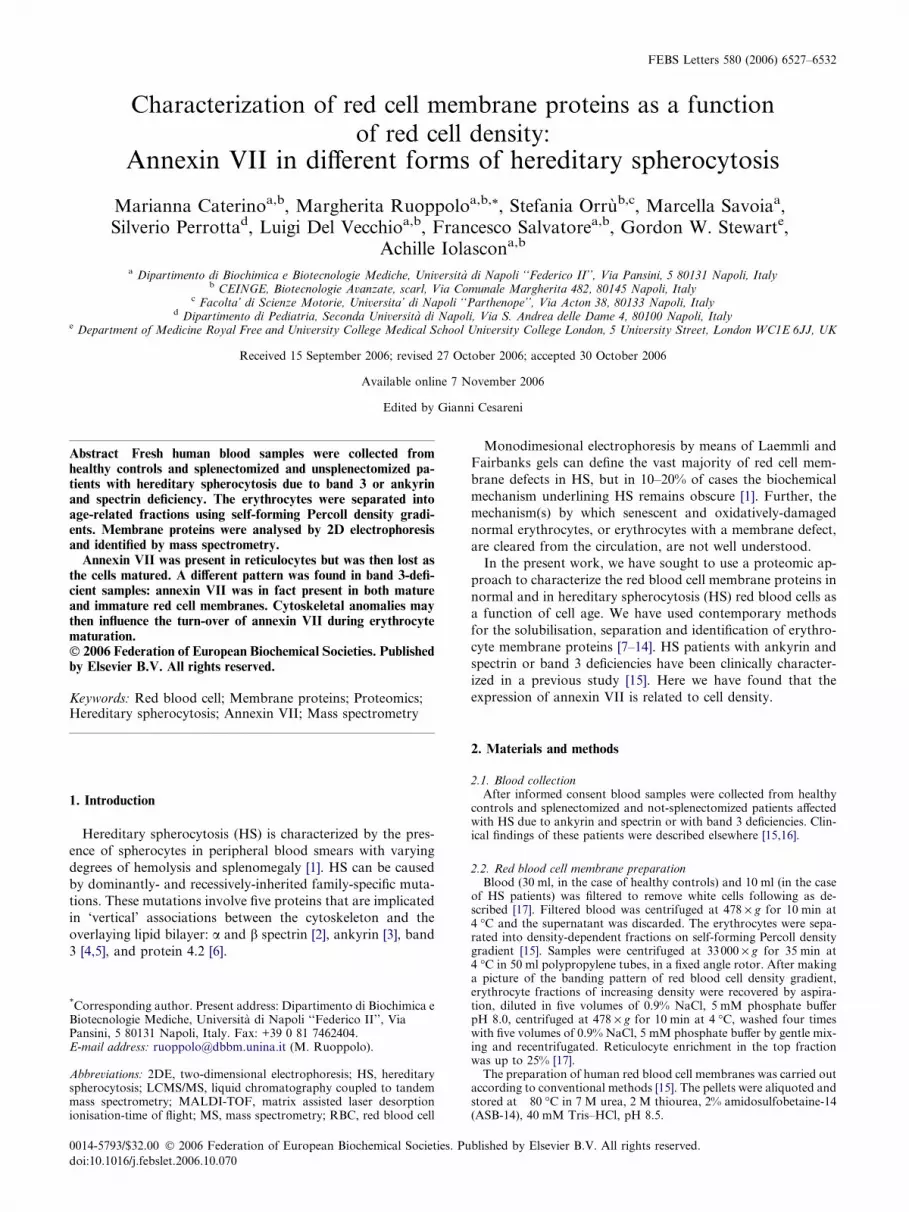
Fig. 1. Density distribution of red blood cells. In the figure, ‘c’ refersto control, ‘au’ to unsplenectomized ankyrin and spectrin deficiency,‘as’ to splenectomized ankyrin and spectrin deficiency.
tron mode, 20000 V accelerating voltage, 70% grid voltage, 0,01%guide wire, 100 ns extraction time, 2000 laser intensity with 1000 shotsper spectrum. The trypsin-autodigested peptides (842.51, 2163.06, and2274.46, m/z) were set as internal calibration standard. A mass list ofpeptides was obtained for each protein digest. A database search withpeptide masses was performed against the non-redundant NationalCenter for Biotechnology Information (NCBI) protein database usingMASCOT software (www.matrixscience.com). The results were evalu-ated on the basis of the number of matching peptides to the proteinspresent in the database, the pI, the apparent molecular mass of theprotein derived from the gel and the percent coverage of the wholesequence. One missed cleavage and 100 ppm mass accuracy wereselected among searching parameters.
Some of the peptide mixtures were further analysed by lLCMS/MSusing a Q-ToF hybrid mass spectrometer (Micromass) equipped with aZ-spray source and coupled on-line with a capillary chromatographysystem. After loading, the peptide mixture (7 ll) was first concentratedand washed at 30 ll/min on a reverse-phase pre-column (Waters) using0.1% formic acid as eluent. The sample was then fractionated using aC18 reverse-phase capillary column (75 lm · 10 mm) at a flow rate of200 nl/min using a linear gradient of eluent B (0.1% formic acid in ace-tonitrile) in A (0.1% formic acid) from 5% to 60% in 30 min. Elutionwas monitored on the mass spectrometer without any splitting device.The mass spectrometer was set up in a data-dependent mode where afull scan spectrum (m/z range from 500 to 2000 Da) was followed by atandem mass spectrum. The precursor ion was selected as the most in-tense peak of the previous scan. A ramp of collision energy between 30and 60 eV was applied depending on the mass and charge of the pre-cursor ion. Mascot software was used to analyse raw MS and MS/MS data and identify proteins.
2.5. Western blottingWestern blotting was carried out as described [21,22] using mouse
monoclonal antibodies directed against human annexin VII (SantaCruz Biotechnology, Inc., Santa Cruz, CA) or b-actin (Sigma, St.Louis, MO). The proteins were detected by horseradish peroxidaseanti-mouse immunoglobulin G and chemiluminescence reagents(Amersham Biosciences, Uppsala, Sweden). Western blotting were car-ried out in triplicate for each sample from the healthy controls and theHS patients.
2.6. Flow cytometry detection of CD71 expressionAliquots of 50 ll of more and less dense red blood cell (RBC) frac-
tions, adjusted to sample concentration of 5 · 106, were stained withsaturating amounts (20 ll) of FITC conjugated monoclonal antibodydirected to transferrin receptor (CD71), obtained from Serotec (Ra-leigh, NC, USA). After 30 min incubation at 4 �C, RBCs were washedin PBS and the sample resuspended in PBS before running on aFACSCalibur flow cytometer (Becton Dickinson, San Jose, CA,USA). Cutoff point between negative and positive events was setaccording to the results obtained with a non-reactive antibody usedas isotypic control (Serotec). Sample analysis was performed byCellQuest Software (Becton Dickinson). Experiments were run onthree different blood samples.
3. Results and discussion
The density distribution of RBC from healthy controls is
shown in Fig. 1a. Three density fractions named Ac, Bc and
Cc were collected and washed. Analysis of reticulocyte content
in the top fraction confirmed the high content of young red
cells (15–25%). The absolute cell age of the density-fraction-
ated red cells from the various populations was determined
by the band 4.1a/4.1b ratio, confirming previous findings
[15,23].
Membranes were prepared from fractionated red blood cells
and the proteins analysed using a proteomic approach. The
analysis of membrane proteins remains a difficult task for tech-
niques based on standard 2D electrophoresis, because proteins
present at low levels can be missed [7–11]. Taking into account
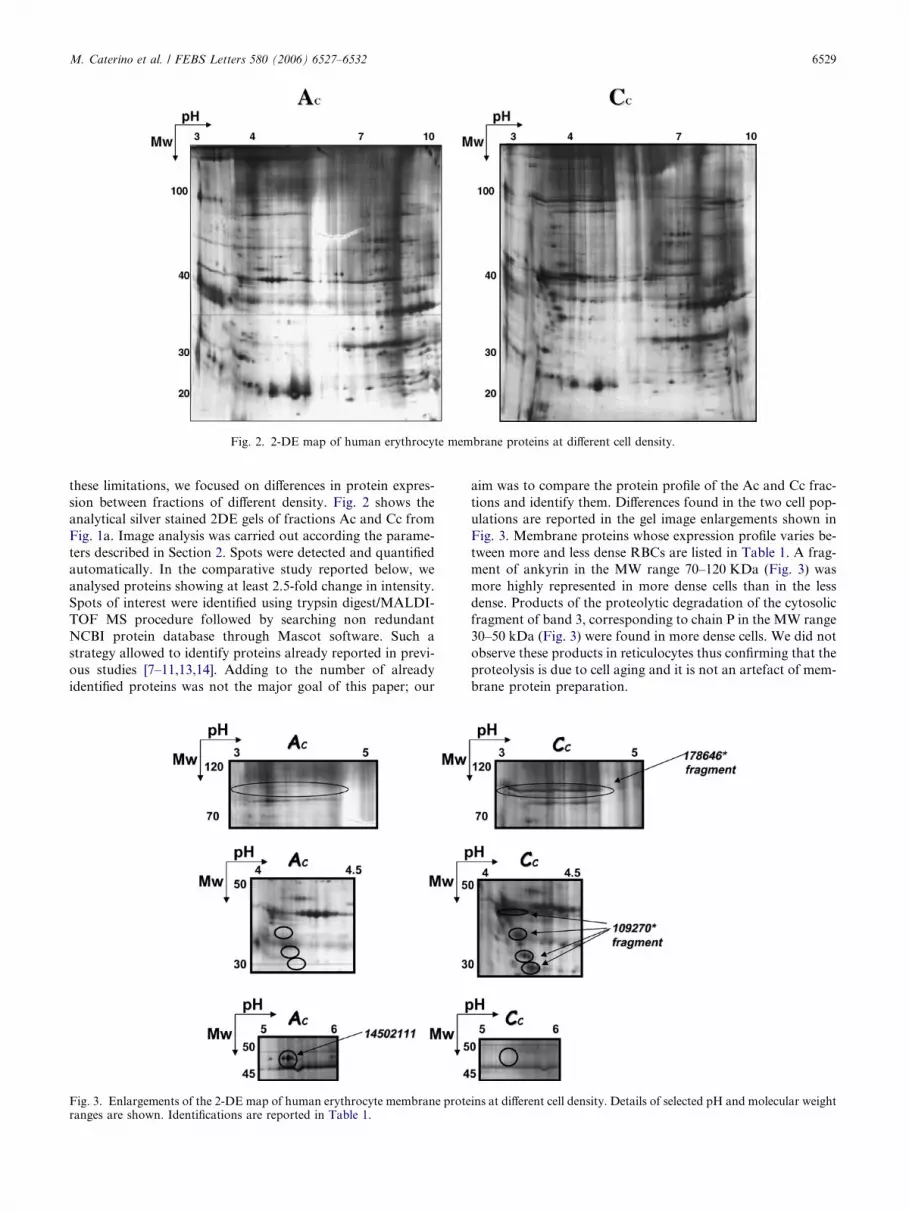
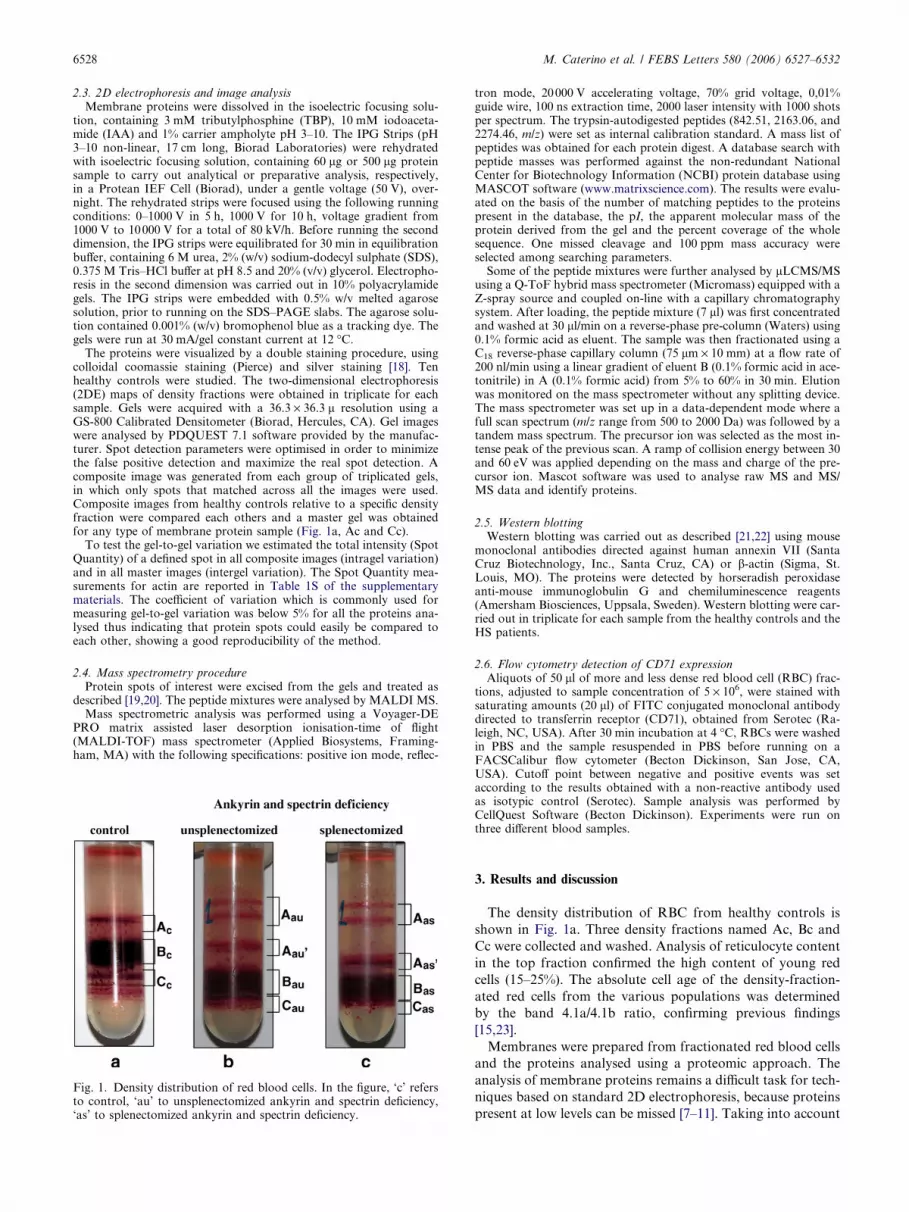
Fig. 2. 2-DE map of human erythrocyte membrane proteins at different cell density.
M. Caterino et al. / FEBS Letters 580 (2006) 6527–6532 6529
these limitations, we focused on differences in protein expres-
sion between fractions of different density. Fig. 2 shows the
analytical silver stained 2DE gels of fractions Ac and Cc from
Fig. 1a. Image analysis was carried out according the parame-
ters described in Section 2. Spots were detected and quantified
automatically. In the comparative study reported below, we
analysed proteins showing at least 2.5-fold change in intensity.
Spots of interest were identified using trypsin digest/MALDI-
TOF MS procedure followed by searching non redundant
NCBI protein database through Mascot software. Such a
strategy allowed to identify proteins already reported in previ-
ous studies [7–11,13,14]. Adding to the number of already
identified proteins was not the major goal of this paper; our
Fig. 3. Enlargements of the 2-DE map of human erythrocyte membrane proteranges are shown. Identifications are reported in Table 1.
aim was to compare the protein profile of the Ac and Cc frac-
tions and identify them. Differences found in the two cell pop-
ulations are reported in the gel image enlargements shown in
Fig. 3. Membrane proteins whose expression profile varies be-
tween more and less dense RBCs are listed in Table 1. A frag-
ment of ankyrin in the MW range 70–120 KDa (Fig. 3) was
more highly represented in more dense cells than in the less
dense. Products of the proteolytic degradation of the cytosolic
fragment of band 3, corresponding to chain P in the MW range
30–50 kDa (Fig. 3) were found in more dense cells. We did not
observe these products in reticulocytes thus confirming that the
proteolysis is due to cell aging and it is not an artefact of mem-
brane protein preparation.
ins at different cell density. Details of selected pH and molecular weight
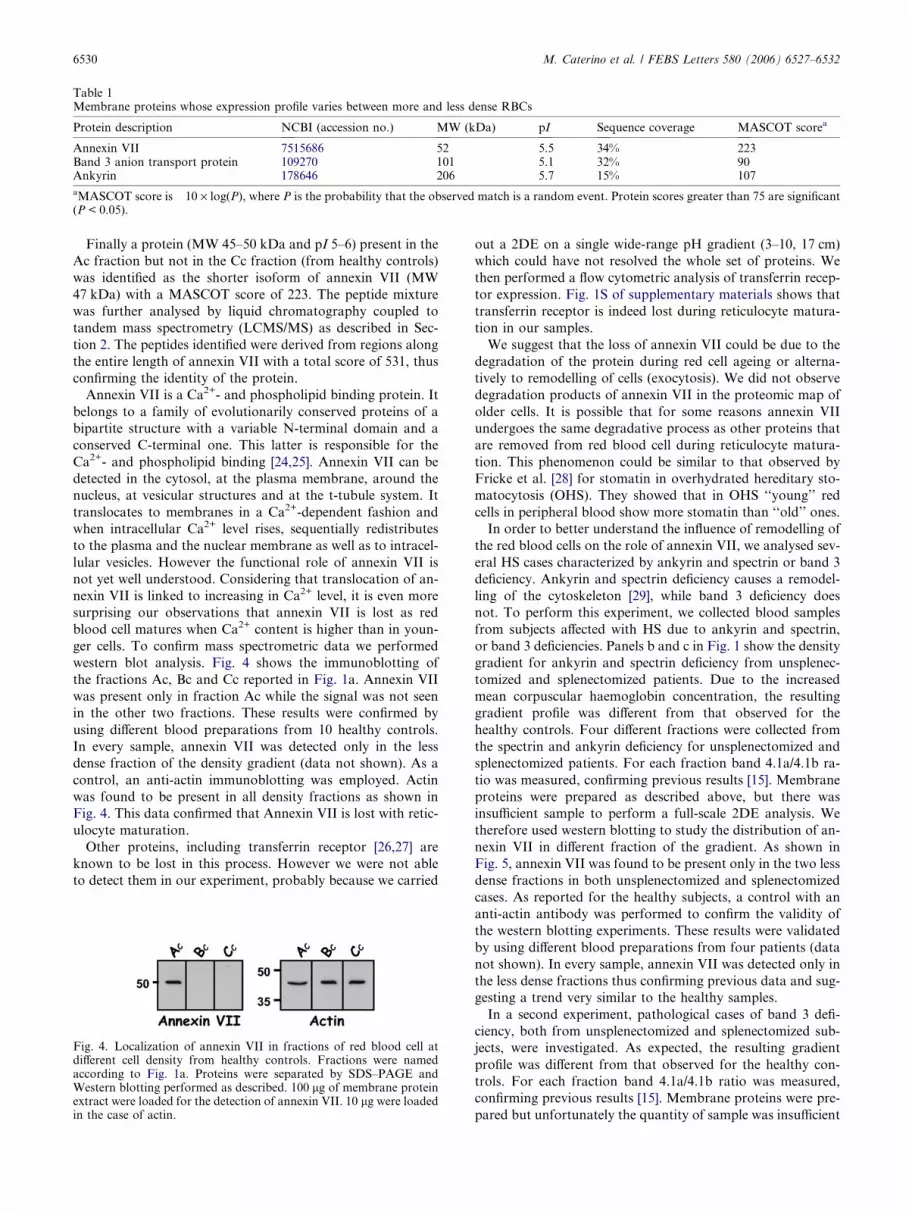
Table 1Membrane proteins whose expression profile varies between more and less dense RBCs
Protein description NCBI (accession no.) MW (kDa) pI Sequence coverage MASCOT scorea
Annexin VII 7515686 52 5.5 34% 223Band 3 anion transport protein 109270 101 5.1 32% 90Ankyrin 178646 206 5.7 15% 107
aMASCOT score is �10 · log(P), where P is the probability that the observed match is a random event. Protein scores greater than 75 are significant(P < 0.05).
6530 M. Caterino et al. / FEBS Letters 580 (2006) 6527–6532
Finally a protein (MW 45–50 kDa and pI 5–6) present in the
Ac fraction but not in the Cc fraction (from healthy controls)
was identified as the shorter isoform of annexin VII (MW
47 kDa) with a MASCOT score of 223. The peptide mixture
was further analysed by liquid chromatography coupled to
tandem mass spectrometry (LCMS/MS) as described in Sec-
tion 2. The peptides identified were derived from regions along
the entire length of annexin VII with a total score of 531, thus
confirming the identity of the protein.
Annexin VII is a Ca2+- and phospholipid binding protein. It
belongs to a family of evolutionarily conserved proteins of a
bipartite structure with a variable N-terminal domain and a
conserved C-terminal one. This latter is responsible for the
Ca2+- and phospholipid binding [24,25]. Annexin VII can be
detected in the cytosol, at the plasma membrane, around the
nucleus, at vesicular structures and at the t-tubule system. It
translocates to membranes in a Ca2+-dependent fashion and
when intracellular Ca2+ level rises, sequentially redistributes
to the plasma and the nuclear membrane as well as to intracel-
lular vesicles. However the functional role of annexin VII is
not yet well understood. Considering that translocation of an-
nexin VII is linked to increasing in Ca2+ level, it is even more
surprising our observations that annexin VII is lost as red
blood cell matures when Ca2+ content is higher than in youn-
ger cells. To confirm mass spectrometric data we performed
western blot analysis. Fig. 4 shows the immunoblotting of
the fractions Ac, Bc and Cc reported in Fig. 1a. Annexin VII
was present only in fraction Ac while the signal was not seen
in the other two fractions. These results were confirmed by
using different blood preparations from 10 healthy controls.
In every sample, annexin VII was detected only in the less
dense fraction of the density gradient (data not shown). As a
control, an anti-actin immunoblotting was employed. Actin
was found to be present in all density fractions as shown in
Fig. 4. This data confirmed that Annexin VII is lost with retic-
ulocyte maturation.
Other proteins, including transferrin receptor [26,27] are
known to be lost in this process. However we were not able
to detect them in our experiment, probably because we carried
Fig. 4. Localization of annexin VII in fractions of red blood cell atdifferent cell density from healthy controls. Fractions were namedaccording to Fig. 1a. Proteins were separated by SDS–PAGE andWestern blotting performed as described. 100 lg of membrane proteinextract were loaded for the detection of annexin VII. 10 lg were loadedin the case of actin.
out a 2DE on a single wide-range pH gradient (3–10, 17 cm)
which could have not resolved the whole set of proteins. We
then performed a flow cytometric analysis of transferrin recep-
tor expression. Fig. 1S of supplementary materials shows that
transferrin receptor is indeed lost during reticulocyte matura-
tion in our samples.
We suggest that the loss of annexin VII could be due to the
degradation of the protein during red cell ageing or alterna-
tively to remodelling of cells (exocytosis). We did not observe
degradation products of annexin VII in the proteomic map of
older cells. It is possible that for some reasons annexin VII
undergoes the same degradative process as other proteins that
are removed from red blood cell during reticulocyte matura-
tion. This phenomenon could be similar to that observed by
Fricke et al. [28] for stomatin in overhydrated hereditary sto-
matocytosis (OHS). They showed that in OHS ‘‘young’’ red
cells in peripheral blood show more stomatin than ‘‘old’’ ones.
In order to better understand the influence of remodelling of
the red blood cells on the role of annexin VII, we analysed sev-
eral HS cases characterized by ankyrin and spectrin or band 3
deficiency. Ankyrin and spectrin deficiency causes a remodel-
ling of the cytoskeleton [29], while band 3 deficiency does
not. To perform this experiment, we collected blood samples
from subjects affected with HS due to ankyrin and spectrin,
or band 3 deficiencies. Panels b and c in Fig. 1 show the density
gradient for ankyrin and spectrin deficiency from unsplenec-
tomized and splenectomized patients. Due to the increased
mean corpuscular haemoglobin concentration, the resulting
gradient profile was different from that observed for the
healthy controls. Four different fractions were collected from
the spectrin and ankyrin deficiency for unsplenectomized and
splenectomized patients. For each fraction band 4.1a/4.1b ra-
tio was measured, confirming previous results [15]. Membrane
proteins were prepared as described above, but there was
insufficient sample to perform a full-scale 2DE analysis. We
therefore used western blotting to study the distribution of an-
nexin VII in different fraction of the gradient. As shown in
Fig. 5, annexin VII was found to be present only in the two less
dense fractions in both unsplenectomized and splenectomized
cases. As reported for the healthy subjects, a control with an
anti-actin antibody was performed to confirm the validity of
the western blotting experiments. These results were validated
by using different blood preparations from four patients (data
not shown). In every sample, annexin VII was detected only in
the less dense fractions thus confirming previous data and sug-
gesting a trend very similar to the healthy samples.
In a second experiment, pathological cases of band 3 defi-
ciency, both from unsplenectomized and splenectomized sub-
jects, were investigated. As expected, the resulting gradient
profile was different from that observed for the healthy con-
trols. For each fraction band 4.1a/4.1b ratio was measured,
confirming previous results [15]. Membrane proteins were pre-
pared but unfortunately the quantity of sample was insufficient
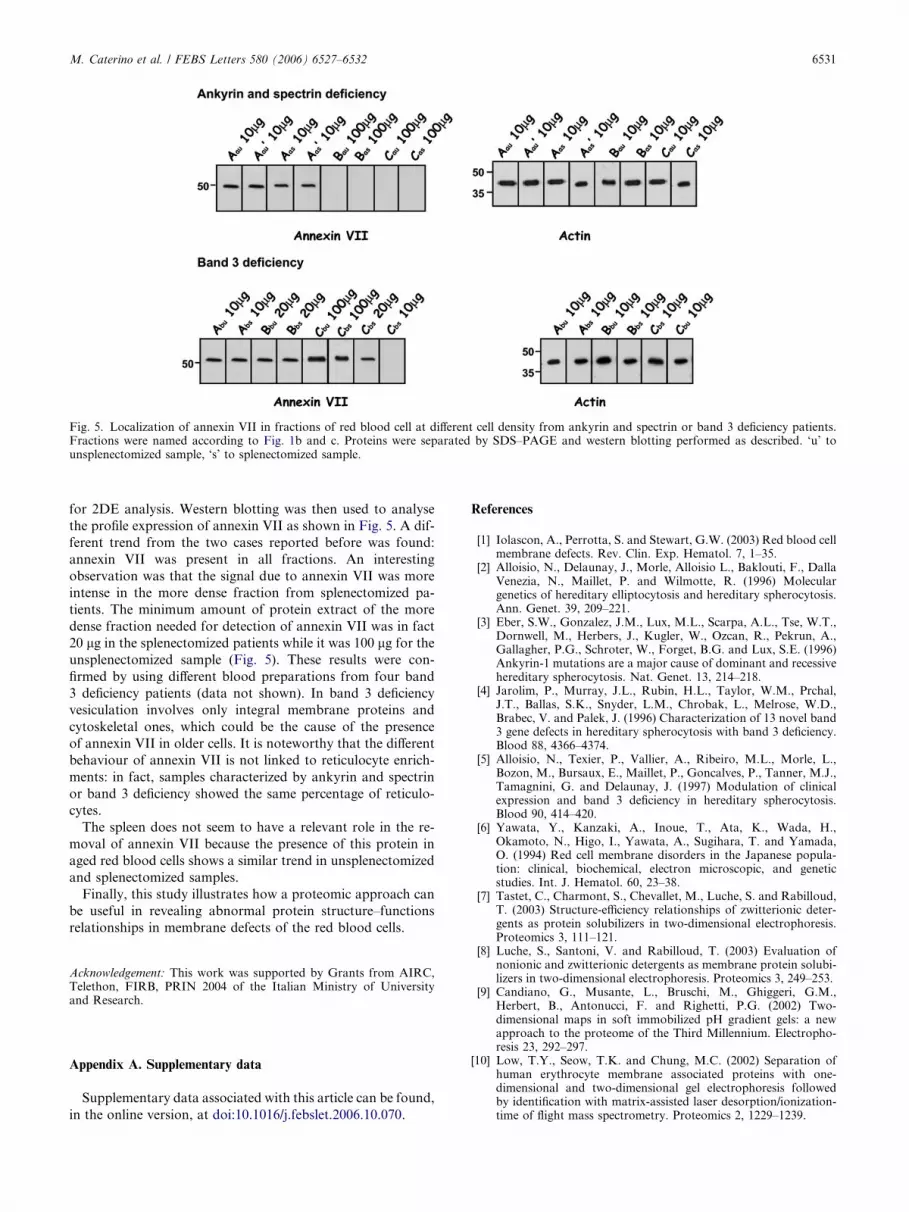
Fig. 5. Localization of annexin VII in fractions of red blood cell at different cell density from ankyrin and spectrin or band 3 deficiency patients.Fractions were named according to Fig. 1b and c. Proteins were separated by SDS–PAGE and western blotting performed as described. ‘u’ tounsplenectomized sample, ‘s’ to splenectomized sample.
M. Caterino et al. / FEBS Letters 580 (2006) 6527–6532 6531
for 2DE analysis. Western blotting was then used to analyse
the profile expression of annexin VII as shown in Fig. 5. A dif-
ferent trend from the two cases reported before was found:
annexin VII was present in all fractions. An interesting
observation was that the signal due to annexin VII was more
intense in the more dense fraction from splenectomized pa-
tients. The minimum amount of protein extract of the more
dense fraction needed for detection of annexin VII was in fact
20 lg in the splenectomized patients while it was 100 lg for the
unsplenectomized sample (Fig. 5). These results were con-
firmed by using different blood preparations from four band
3 deficiency patients (data not shown). In band 3 deficiency
vesiculation involves only integral membrane proteins and
cytoskeletal ones, which could be the cause of the presence
of annexin VII in older cells. It is noteworthy that the different
behaviour of annexin VII is not linked to reticulocyte enrich-
ments: in fact, samples characterized by ankyrin and spectrin
or band 3 deficiency showed the same percentage of reticulo-
cytes.
The spleen does not seem to have a relevant role in the re-
moval of annexin VII because the presence of this protein in
aged red blood cells shows a similar trend in unsplenectomized
and splenectomized samples.
Finally, this study illustrates how a proteomic approach can
be useful in revealing abnormal protein structure–functions
relationships in membrane defects of the red blood cells.
Acknowledgement: This work was supported by Grants from AIRC,Telethon, FIRB, PRIN 2004 of the Italian Ministry of Universityand Research.
Appendix A. Supplementary data
Supplementary data associated with this article can be found,
in the online version, at doi:10.1016/j.febslet.2006.10.070.
References
[1] Iolascon, A., Perrotta, S. and Stewart, G.W. (2003) Red blood cellmembrane defects. Rev. Clin. Exp. Hematol. 7, 1–35.
[2] Alloisio, N., Delaunay, J., Morle, Alloisio L., Baklouti, F., DallaVenezia, N., Maillet, P. and Wilmotte, R. (1996) Moleculargenetics of hereditary elliptocytosis and hereditary spherocytosis.Ann. Genet. 39, 209–221.
[3] Eber, S.W., Gonzalez, J.M., Lux, M.L., Scarpa, A.L., Tse, W.T.,Dornwell, M., Herbers, J., Kugler, W., Ozcan, R., Pekrun, A.,Gallagher, P.G., Schroter, W., Forget, B.G. and Lux, S.E. (1996)Ankyrin-1 mutations are a major cause of dominant and recessivehereditary spherocytosis. Nat. Genet. 13, 214–218.
[4] Jarolim, P., Murray, J.L., Rubin, H.L., Taylor, W.M., Prchal,J.T., Ballas, S.K., Snyder, L.M., Chrobak, L., Melrose, W.D.,Brabec, V. and Palek, J. (1996) Characterization of 13 novel band3 gene defects in hereditary spherocytosis with band 3 deficiency.Blood 88, 4366–4374.
[5] Alloisio, N., Texier, P., Vallier, A., Ribeiro, M.L., Morle, L.,Bozon, M., Bursaux, E., Maillet, P., Goncalves, P., Tanner, M.J.,Tamagnini, G. and Delaunay, J. (1997) Modulation of clinicalexpression and band 3 deficiency in hereditary spherocytosis.Blood 90, 414–420.
[6] Yawata, Y., Kanzaki, A., Inoue, T., Ata, K., Wada, H.,Okamoto, N., Higo, I., Yawata, A., Sugihara, T. and Yamada,O. (1994) Red cell membrane disorders in the Japanese popula-tion: clinical, biochemical, electron microscopic, and geneticstudies. Int. J. Hematol. 60, 23–38.
[7] Tastet, C., Charmont, S., Chevallet, M., Luche, S. and Rabilloud,T. (2003) Structure-efficiency relationships of zwitterionic deter-gents as protein solubilizers in two-dimensional electrophoresis.Proteomics 3, 111–121.
[8] Luche, S., Santoni, V. and Rabilloud, T. (2003) Evaluation ofnonionic and zwitterionic detergents as membrane protein solubi-lizers in two-dimensional electrophoresis. Proteomics 3, 249–253.
[9] Candiano, G., Musante, L., Bruschi, M., Ghiggeri, G.M.,Herbert, B., Antonucci, F. and Righetti, P.G. (2002) Two-dimensional maps in soft immobilized pH gradient gels: a newapproach to the proteome of the Third Millennium. Electropho-resis 23, 292–297.
[10] Low, T.Y., Seow, T.K. and Chung, M.C. (2002) Separation ofhuman erythrocyte membrane associated proteins with one-dimensional and two-dimensional gel electrophoresis followedby identification with matrix-assisted laser desorption/ionization-time of flight mass spectrometry. Proteomics 2, 1229–1239.
6532 M. Caterino et al. / FEBS Letters 580 (2006) 6527–6532
[11] Kakhniashvili, D.G., Bulla, L.A.J. and Goodman, S.R. (2004)The human erythrocyte proteome: analysis by ion trap massspectrometry. Mol. Cell Proteom. 3, 501–509.
[12] Umlauf, E., Csaszar, E., Moertelmaier, M., Schuetz, G.J., Parton,R.G. and Prohaska, R. (2004) Association of stomatin with lipidbodies. J. Biol. Chem. 279, 23699–23709.
[13] Bruschi, M., Seppi, C., Arena, S., Musante, L., Santucci, L.,Balduini, C., Scaloni, A., Lanciotti, M., Righetti, P.G. andCandiano, G. (2005) Proteomic analysis of erythrocyte mem-branes by soft immobiline gels combined with differential proteinextraction. J. Proteome Res. 4, 1304–1309.
[14] Pasini, E.M., Kirkegaard, M., Mortensen, P., Lutz, H.U.,Thomas, A.W. and Mann, M. (2006) In-depth analysis of themembrane and cytosolic proteome of red blood cells. Blood 108(3), 791–801.
[15] Reliene, R., Mariani, M., Zanella, A., Reinhart, W.H., Ribeiro,M.L., del Giudice, E.M., Perrotta, S., Iolascon, A., Eber, S. andLutz, H.U. (2002) Splenectomy prolongs in vivo survival oferythrocytes differently in spectrin/ankyrin- and band 3-deficienthereditary spherocytosis. Blood 100, 2208–2215.
[16] Miraglia del Giudice, E., Nobili, B., Francese, M., D’Urso, L.,Iolascon, A., Eber, S. and Perrotta, S. (2001) Clinical andmolecular evaluation of non-dominant hereditary spherocytosis.Brit. J. Haematol. 112, 42–47.
[17] Galletti, P., Ingrosso, D., Nappi, A., Gragnaniello, V., Iolascon,A. and Pinto, L. (1983) Increased methyl esterification ofmembrane proteins in aged red-blood cells. Preferential esterifi-cation of ankyrin and band-4.1 cytoskeletal proteins. Eur. J.Biochem. 135, 25–28.
[18] Seow, T.K., Ong, S.E., Liang, R.C., Ren, E.C., Chan, L., Ou, K.and Chung, M.C. (2000) Two-dimensional electrophoresis map ofthe human hepatocellular carcinoma cell line, HCC-M, andidentification of the separated proteins by mass spectrometry.Electrophoresis 21, 1787–1813.
[19] Shevchenko, A., Wilm, M., Vorm, O. and Mann, M. (1996) Massspectrometric sequencing of proteins silver-stained polyacryl-amide gels. Anal. Chem. 68, 850–858.
[20] Orru, S., Caputo, I., D’Amato, A., Ruoppolo, M. and Esposito,C. (2003) Proteomics identification of acyl-acceptor and acyl-
donor substrates for transglutaminase in a human intestinalepithelial cell line. Implications for celiac disease. J. Biol. Chem.278, 31766–33173.
[21] Laemmli, U.K. (1970) Cleavage of structural proteins during theassembly of the head of bacteriophage T4. Nature 227, 680–685.
[22] Towbin, H., Staenelin, T. and Gordon, J. (1992) Electrophoretictransfer of proteins from polyacrylamide gels to nitrocellulosesheets: procedure and some applications. Biotechnology 24, 145–149.
[23] Lutz, H.U., Stammler, P., Fasler, S., Ingold, M. and Fehr, J.(1992) Density separation of human red blood cells on selfforming Percoll gradients: correlation with cell age. Biochim.Biophys. Acta 1116, 1–10.
[24] Salzer, U., Hinterdorfer, P., Hunger, U., Borken, C. andProhaska, R. (2002) Ca(++)-dependent vesicle release fromerythrocytes involves stomatin-specific lipid rafts, synexin (annex-in VII), and sorcin. Blood 99, 2569–2577.
[25] Herr, C., Clemen, C.S., Lehnert, G., Kutschkow, R., Picker,S.M., Gathof, B.S., Zamparelli, C., Schleicher, .M. and Noegel,A.A. (2003) Function, expression and localization of annexin A7in platelets and red blood cells: insights derived from an annexinA7 mutant mouse. BMC Biochem. 4, 1–11.
[26] Ciana, A., Minetti, G. and Balduini, C. (2004) Phosphotyrosinephosphatases acting on band 3 in human erythrocytes of differentage: PTP1B processing during ageing. Bioelectrochemistry. 62,169–173.
[27] Minetti, G., Ciana, A. and Balduini, C. (2004) Differential sortingof tyrosine kinases and phosphotyrosine phosphatases acting onband 3 during vesiculation of human erythrocytes. Biochem. J.377, 489–497.
[28] Fricke, B., Argent, A.C., Chetty, M.C., Pizzey, A.R., Turner, E.J.,Ho, M.M., Iolascon, A., Von During, M. and Stewart, G.W.(2003) The ‘‘stomatin’’ gene and protein in overhydrated hered-itary stomatocytosis. Blood 102, 2268–2277.
[29] Iolascon, A., Miraglia del Giudice, E., Perrotta, S., Pinto, L.,Fiorelli, G., Cappellini, D.M., Vasseur, C., Bursaux, E. andCutillo, S., et al. (1992) Hereditary spherocytosis (HS) due to lossof anion exchange transporter. Haematologica 77, 450–456.