characterization of biogenic volatile organic compounds and meteorology at azusa during the...
TRANSCRIPT
Atmospheric Environment 37 Supplement No. 2 (2003) S181–S196
Characterization of biogenic volatile organic compounds andmeteorology at Azusa during the SCOS97-NARSTO
Anni Reissella,1, Clinton MacDonaldb, Paul Robertsb, Janet Areya,*,2
aAir Pollution Research Center, University of California, Riverside, CA 92521, USAbSonoma Technology, Inc., 1360 Redwood Way, Suite C, Petaluma, CA 94954, USA
Received 4 March 2002; accepted 10 March 2003
Abstract
Meteorological modeling and analyses were performed for the 4–6 August and 4–6 September 1997 intensive
sampling episodes of the 1997 Southern California Ozone Study (SCOS97-NARSTO). This investigation was
conducted to study the connection of measured and modeled meteorological phenomenon with measured biogenic
volatile organic compound (BVOC) concentrations. Trajectory and surface wind analysis for five out of the six intensive
sampling days indicated that drainage flow from the mountains at nighttime and early morning affected the BVOCs
measured at the Azusa, CA monitoring site. Nitric oxide emissions from vehicles precluded nighttime chemical
reactions of the BVOCs at Azusa, allowing overnight accumulation of local monoterpene emissions in addition to
monoterpenes transported by drainage flows. The monoterpene mixing ratios maximized in the early morning hours
and the monoterpene/CO ratios showed sharp maxima at 0300–0600 h PDT on all days. In contrast, normalization of
benzene to CO diminished its diurnal variation, consistent with vehicle traffic as the source for these two long-lived
anthropogenic compounds. Substantial early morning methacrolein (MACR) and methyl vinyl ketone (MVK) mixing
ratios (and high (MACR + MVK)/isoprene ratios) measured at Azusa on all episode days were consistent with
drainage flow from elevated sites which had received NOx emissions and ozone transported from the urban basin by
daytime upslope flows. Isolation of these elevated sites from the basin NO emissions as the nocturnal boundary layer
was established would allow rapid nighttime nitrate radical reaction with isoprene, or slower isoprene reaction with
ozone, to produce high (MACR + MVK)/isoprene ratios in drainage flows into Azusa.
r 2003 Elsevier Ltd. All rights reserved.
Keywords: Biogenic volatile organic compounds; Meteorological modeling; Monoterpenes; Isoprene
1. Introduction
On a global scale, biogenic volatile organic com-
pounds (BVOCs), non-methane organic compounds
emitted from vegetation, are estimated to exceed
anthropogenic non-methane VOC emissions (M .uller,
1992; Piccot et al., 1992; Guenther et al., 1995, 2000;
World Meteorological Organization, 1995), and hence
have a considerable effect on tropospheric chemistry
(Trainer et al., 1987a; Fehsenfeld et al., 1992;
Fuentes et al., 2000). Measurements and modeling
studies have shown that BVOCs contribute to ozone
formation in rural and urban areas (Trainer et al.,
1987b; Chameides et al., 1988, 1992; Biesenthal
et al., 1997; Starn et al., 1998), and also play a
significant role in particle formation (Went, 1960;
Hoffmann et al., 1997; Kavouras et al., 1999; Griffin
et al., 1999).
ARTICLE IN PRESS
AE International – North America
*Corresponding author. Tel.: +1-909-787-3502; fax: +1-
909-787-5004.
E-mail addresses: [email protected] (A. Reissell),
[email protected] (C. MacDonald), paul@sonomatech.
com (P. Roberts), [email protected] (J. Arey).1Present address: Division of Atmospheric Sciences, Depart-
ment of Physical Sciences, P.O. Box 64, 00014 University of
Helsinki, Finland.2Also at Department of Environmental Sciences, University
of California, Riverside.
1352-2310/03/$ - see front matter r 2003 Elsevier Ltd. All rights reserved.
doi:10.1016/S1352-2310(03)00390-X
The Southern California Ozone Study (SCOS97-
NARSTO) measurement program was carried out in
summer 1997 in order to investigate the formation and
transport of ozone, and to improve and expand
databases to support photochemical modeling in the
Los Angeles Basin and Southern California. The severe
photochemical air pollution experienced in the Los
Angeles Basin is attributed to emissions from contin-
uous urban traffic and a persistent eastern Pacific high-
pressure system especially during summertime, with
complex meteorological conditions influenced by sur-
rounding mountains on three sides and the Pacific
Ocean on the southwest. To examine the potential role
of biogenic volatile organic compounds in ozone
formation, BVOCs were measured at several sites in
the basin, including elevated locations, during SCOS97-
NARSTO intensive sampling episodes. Measurements
of isoprene, its atmospheric transformation products
methacrolein (MACR) and methyl vinyl ketone
(MVK), and monoterpenes at elevated locations near
Azusa have previously been reported (Reissell and Arey,
2001).
Based on archived SCOS97-NARSTO surface and
aloft wind, temperature, and mixing height data,
meteorological modeling and analysis were performed
to aid in interpreting BVOC measurements at Azusa and
contrasting these with aromatic VOCs and CO, routi-
nely monitored measures of traffic emissions. In
particular, back trajectories of air parcels arriving at
Azusa in early morning were calculated for two
SCOS97-NARSTO intensive sampling periods, 4–6
August and 4–6 September, in order to examine possible
source areas for the BVOCs measured at Azusa.
An attempt is made to reconcile the predicted BVOC
sources, the known chemistry of the BVOCs and the
measured meteorological parameters with the observed
ambient BVOC mixing ratios.
2. Experimental procedures
2.1. Site
Azusa is located midbasin in California’s densely
populated and heavily vehicle traffic-impacted South
Coast Air Basin and is about 4–5 km from the base of
the San Gabriel Mountains. The front range of the San
Gabriel Mountains, which trends roughly WNW-ESE,
lies to the north of Azusa and reaches heights of about
900–2100m above sea level (m asl). This front range
rises sharply from the basin, with steep slopes and
rugged canyons. The mouth of the San Gabriel Canyon,
a prominent NE-SW trending canyon that extends down
to the basin from the San Gabriel Reservoir, lies
approximately 3–4 km NNE of Azusa. The highest
mountains in the area, with elevations above 2100m asl,
are located approximately 13–16 km north and north-
west of Azusa.
The predominant natural plant communities of the
San Gabriel Mountains include Chamise series and
Chamise-hoaryleaf ceanothus series. Live oak chaparral
series and mixed chaparral shrublands also occur. At
higher elevations, Ponderosa pine series with some
Bigcone Douglas-fir series and Bigcone Douglas-fir-
canyon live oak series occurs on north-facing slopes.
(Information summarized from http://www.fs.fed.us/r5/
projects/ecoregions/m262bd.htm, an Ecological Subre-
gions of California website operated by the Pacific
Southwest region of the US Forest Service).
2.2. Meteorological analyses
2.2.1. Surface wind data, mixing heights and ventilation
For each episode day hourly surface wind data at
Azusa and Glendora (see Fig. 1) were reviewed and the
direction, scalar wind speed for each persistent flow
direction (typically onshore during the day and offshore
at night), and duration of flow types were noted.
Morning and afternoon mixing heights were deter-
mined from a variety of sources to produce the best
estimate of mixing heights at Azusa. At Azusa, sodar
(sound detection and ranging) wind data were available
to estimate morning mixing heights for the August
episode only. Therefore, for the August and September
episodes, the 0800 to 0900 h PDT mixing heights at El
Monte (see emt in Fig. 1) were estimated using RASS
(radio acoustic sounding system) virtual temperature
(Tv) data coupled with surface Tv data, radar profiler
reflectivity data, and lidar (light detection and ranging)
ozone data. The morning mixing heights at El Monte for
the August episode were compared to the depth of the
drainage flow as shown by the available sodar data
collected at Azusa. In this way it was verified that the
morning mixing heights at El Monte were similar to the
morning mixing heights at Azusa. Due to the limited
altitude range, it was not possible to determine after-
noon mixing heights from the sodar data. Therefore,
afternoon mixing heights were estimated at El Monte
using the radar profiler reflectivity data and the lidar
ozone data, and at Pomona using ozonesonde data.
Since El Monte is located about 15 km southwest of
Azusa and Pomona is located about 15 km to the
southeast of Azusa, the mixing heights from these
locations give a reasonable range of likely afternoon
mixing heights at Azusa.
As noted, the 0800 to 0900 h PDT morning mixing
heights at El Monte were taken as representative of the
mixing heights at Azusa. Furthermore, the mixing height
data indicated that the 0800–0900 h PDT mixing heights
were representative of the overnight boundary layer
depth and not the morning convective boundary layer
depth. Therefore, to estimate overnight and early
ARTICLE IN PRESSA. Reissell et al. / Atmospheric Environment 37 Supplement No. 2 (2003) S181–S196S182
morning ventilation, the daily 0800–0900 h PDT mixing
heights from El Monte were multiplied by the average
overnight scalar wind speeds at Azusa to give a
‘‘ventilation index’’.
2.2.2. Calmet wind model
Hourly three-dimensional wind fields and back-
trajectories were produced using the CALMET diag-
nostic wind model to characterize the flow patterns
during the episodes. The CALMET meteorological
model (Scire et al., 1999) is a software tool that
combines objective and diagnostic analysis methods to
create three-dimensional meteorological wind fields for
use in modeling and analysis.
The inputs to the CALMET meteorological model
consisted of surface terrain heights, surface wind data,
mixing heights, and upper-air wind data. US Geological
Survey fine resolution topography was spatially aver-
aged and gridded to prepare the terrain height inputs for
the SCOS97-NARSTO study region. The aloft wind
data were quality-controlled radar profiler wind data
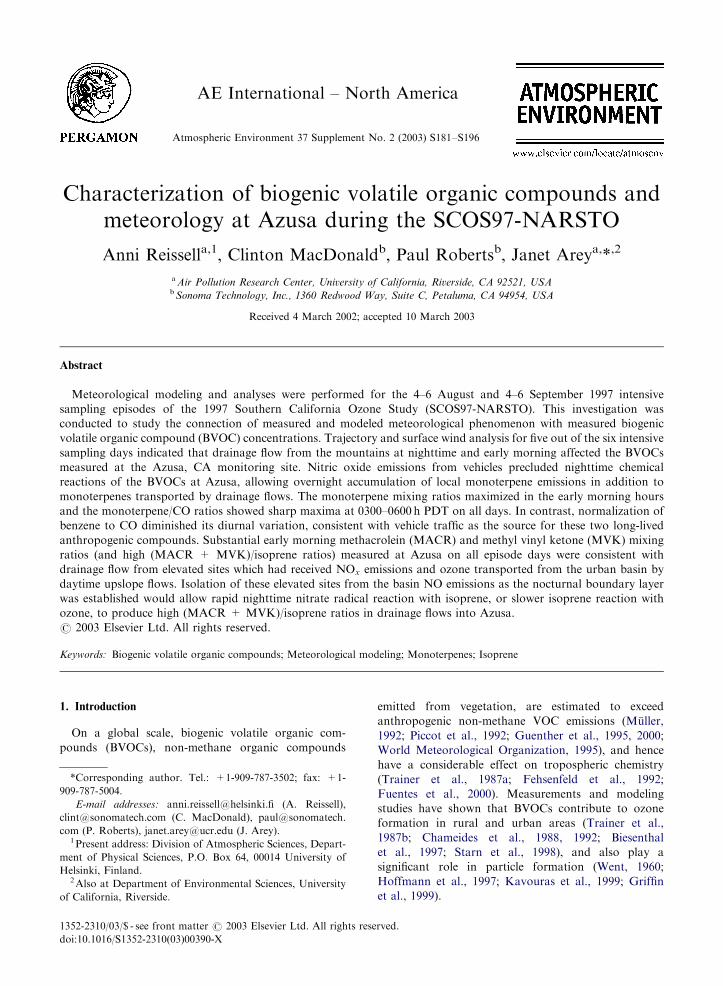
collected at 26 sites (MacDonald et al., 2002). The
locations of the radar wind profilers (RWPs) in the
modeling domain and additional sites of interest are
shown in Fig. 1 and the site details are given in Table 1.
The surface wind data were obtained from the SCOS97-
NARSTO data archive and comprised data collected at
244 sites, including the Azusa study site and nearby
Glendora. The wind fields were developed with 4-km
horizontal resolution. The vertical structure of the wind
fields was tailored to the RWP range gates to ensure that
the 22 wind field layers corresponded as closely as
possible to the observed wind levels of the RWPs.
A number of sources of uncertainty are associated
with the CALMET wind fields and trajectories. As a
diagnostic wind model, CALMET is an interpolator
with parameterizations that account for the effects of
terrain and stability on the wind fields in areas of limited
observations. In this regard, as the density and
representativeness of input data improves, the results
from these types of models become more robust. Since
the SCOS97-NARSTO had a high density network of
both upper-air and surface sites, the CALMET wind
fields should give a reasonable estimate of the wind flow
in the modeling domain and the trajectories should give
a reasonable estimate of the air parcel paths.
For each episode day, plots of the CALMET wind
fields and 24-h 158m above ground level (m agl) back
trajectories arriving at Azusa at times that correspond to
the 0300–0600 h PDT and 0600–0900 h PDT VOC
sampling periods were prepared. Each trajectory plot
was reviewed and the general parcel paths were recorded
and the probable emission source areas were noted.
2.3. VOC sampling and analyses
2.3.1. Biogenic VOCs
Sampling was conducted on the roof of the South
Coast Air Quality Management District (SCAQMD)
monitoring station at Azusa. Samples were collected on
adsorbent tubes at the sampling site, transported to the
laboratory, spiked with gaseous internal standards,
subsequently thermally desorbed and analyzed by gas
ARTICLE IN PRESS
Fig. 1. Modeling domain in Southern California showing location of 26 radar wind profiler sites during the SCOS97-NARSTO field
study (see Table 1 for site identifications) and the locations of Azusa, Pine Mountain, Glendora and Pomona monitoring sites.
A. Reissell et al. / Atmospheric Environment 37 Supplement No. 2 (2003) S181–S196 S183
chromatography with a mass selective detector (MSD).
Ozone scrubbers (Cu–MnO2 plies in PFTE compression
fitting, Calogirou et al., 1996), were placed in front of
the sampling tubes and sampling was conducted at a
flow rate of 50ml min�1 using diaphragm pumps
(Thomas) and mass flow controllers (Tylan General).
A detailed description of the analysis procedures is
presented elsewhere (Reissell and Arey, 2001).
For the 4–6 August sampling period the sampling
intervals were 3 h during the daytime and 7 h during
nighttime. The sampling periods were 0300–0600,
0600–0900, 0900–1200, 1300–1600, 1700–2000, and
2000–0300 h local Pacific daylight time (PDT). During
the 4–6 September sampling period, more frequent
nighttime sampling was conducted and the nighttime
sampling periods were 1700–2000, 2000–2400, 2400–
0300 and 0300–0600 h PDT. Duplicate samples were
collected for BVOC quantification and based on all the
samples collected at Azusa during SCOS97-NARSTO
the precision for the BVOCs was: isoprene711%,
MACR 731%, MVK733%, a-pinene726%, limo-
nene722%, and 1,8-cineole718% (Reissell and Arey,
2001).
2.3.2. Anthropogenic VOCs
The anthropogenic VOCs discussed in this study are
the aromatic compounds benzene, toluene, ethylben-
zene, m-xylene, p-xylene, and o-xylene. The methods
used for sampling and analysis were those specified by
the US Environmental Protection Agency for the
enhanced O3 monitoring Photochemical Assessment
Monitoring Stations (PAMS).
At Azusa VOC samples were collected through a glass
inlet probe on the roof of the SCAQMD monitoring
station on a routine basis with an automatic multiple-
event canister collection system designed for around-the-
clock collection frequency. Eight three-hour integrated
samples were collected every day starting at midnight
(PDT) each day. After collection the canisters were
analyzed by gas chromatography with flame ionization
detection on an auto-GC at Pico Rivera operated by the
SCAQMD. A Nafion dryer was used to control
moisture in the samples. The SCOS97-NARSTO data
set was obtained from the California Air Resources
Board (CARB, 2000), supplemented by recent updates
to the m-xylene and p-xylene data (SCAQMD, 2001).
3. Results and discussion
3.1. VOCs and meteorology at Azusa
The VOCs measured at Azusa can be examined most
conveniently in three groups: (1) anthropogenic aro-
matic compounds emitted from vehicle traffic (benzene,
toluene, ethylbenzene, m-xylene, p-xylene, and o-xylene);
(2) monoterpene BVOCs (a-pinene, sabinene, b-pinene,limonene, and the oxygenated monoterpene derivative
1,8-cineole) which are emitted from vegetation as a
positive function of temperature; and (3) isoprene (a
BVOC whose emission requires light and increases with
temperature) and its major carbonyl reaction products
methacrolein (MACR) and methyl vinyl ketone (MVK).
Times series for the sum of the mixing ratios of the six
aromatic compounds, the sum of the mixing ratios of the
four monoterpenes, and the mixing ratios of isoprene,
MACR, and MVK from Azusa are shown in the top
panels of Figs. 2 and 3 for the 4–6 August and 4–6
ARTICLE IN PRESS
Table 1
Location and elevation of SCOS97-NARSTO radar wind
profiler (upper-air wind data) and RASS (virtual temperature)
sites and the Azusa, Pine Mountain, Glendora and Pomona
monitoring sites
Site name Site ID Latitude Longitude Elevation
(m asl)
El Montea emt 34.09 118.03 95
Norton ntn 34.09 117.26 318
Alpine ape 32.86 116.81 463
Brown Field bfd 32.57 116.99 158
Carlsbad cbd 33.14 117.27 110
El Centro eco 32.83 115.57 �18
Goleta gla 34.43 119.85 4
Los Alamitos las 33.79 118.05 7
Palmdale pde 34.61 118.09 777
Port Hueneme phe 34.17 119.22 2
San Clemente Island sce 33.02 118.59 53
Santa Catalina Island scl 33.45 118.48 37
Tustin ttn 33.71 117.84 16
Central Los Angeles usc 34.02 118.28 67
Van Nuys vns 34.22 118.49 241
Los Angeles Int. lax 33.94 118.44 47
Ontario ont 34.06 117.58 280
Point Loma plm 32.70 117.25 23
Valley Center vlc 33.26 117.04 415
Barstow btw 34.92 117.31 694
Hesperia hpa 34.39 117.40 975
Riverside rsd 33.92 117.31 488
Temecula tcl 33.50 117.16 335
Thermal tml 33.64 116.16 �36
Vandenberg AFB vaf 34.77 120.53 149
Simi Valley smi 34.29 118.80 279
Azusab,c 34.14 117.92 183
Pine Mountaind 34.22 117.90 B1350
Glendorab 34.15 117.84 237
Pomonae 34.06 117.76 259
aAlso lidar O3 data site.bSurface winds available.cSite of BVOC measurements (this work) and PAMS VOC
measurement site.dSite of BVOC measurements; 1383m on 4–6 August 1997
and 1311m on 4–7 September 1997 (Reissell and Arey, 2001).eOzonesonde data available (CARB, 2000).
A. Reissell et al. / Atmospheric Environment 37 Supplement No. 2 (2003) S181–S196S184
ARTIC
LEIN
PRES
S
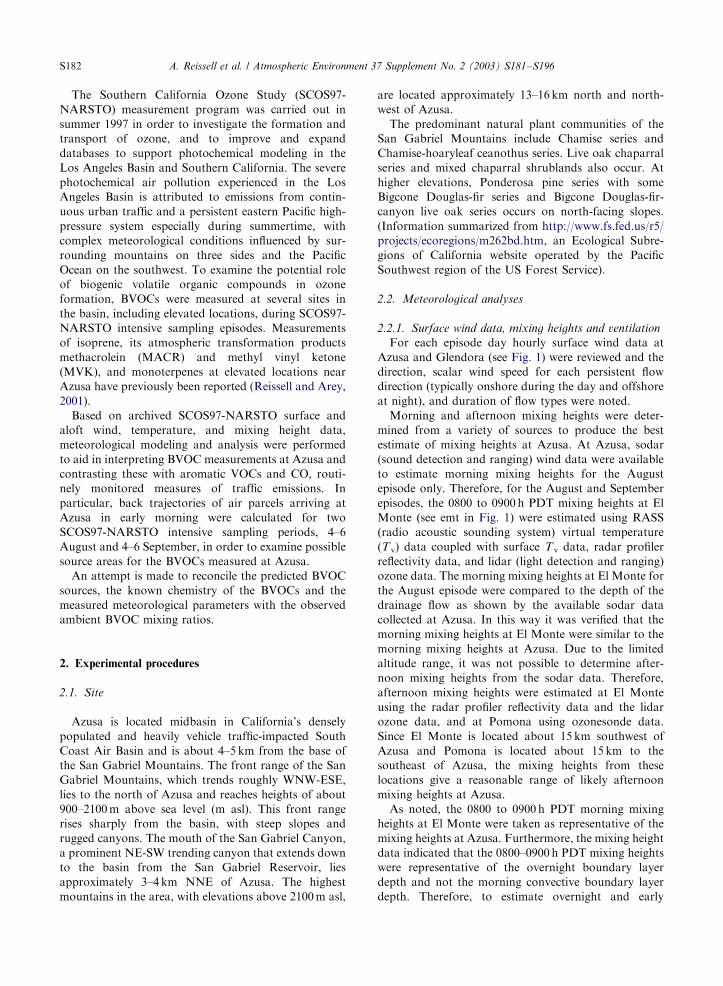
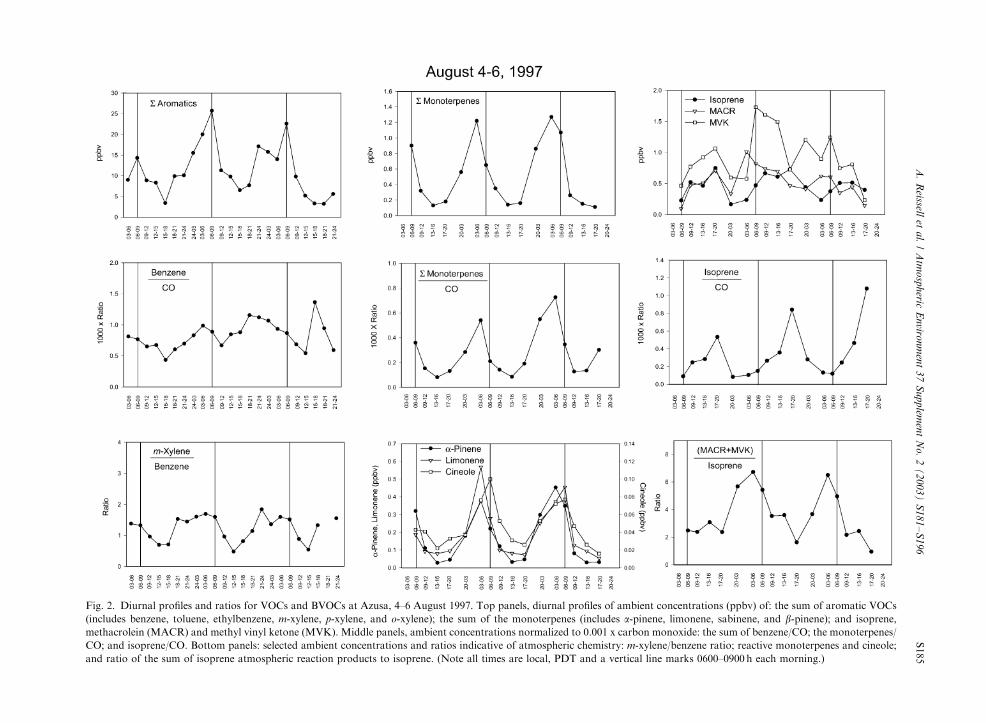
Fig. 2. Diurnal profiles and ratios for VOCs and BVOCs at Azusa, 4–6 August 1997. Top panels, diurnal profiles of ambient concentrations (ppbv) of: the sum of aromatic VOCs
(includes benzene, toluene, ethylbenzene, m-xylene, p-xylene, and o-xylene); the sum of the monoterpenes (includes a-pinene, limonene, sabinene, and b-pinene); and isoprene,
methacrolein (MACR) and methyl vinyl ketone (MVK). Middle panels, ambient concentrations normalized to 0.001 x carbon monoxide: the sum of benzene/CO; the monoterpenes/
CO; and isoprene/CO. Bottom panels: selected ambient concentrations and ratios indicative of atmospheric chemistry: m-xylene/benzene ratio; reactive monoterpenes and cineole;
and ratio of the sum of isoprene atmospheric reaction products to isoprene. (Note all times are local, PDT and a vertical line marks 0600–0900 h each morning.)
A.
Reissell
eta
l./
Atm
osp
heric
En
viron
men
t3
7S
up
plem
ent
No
.2
(2
00
3)
S1
81
–S
19
6S185
ARTIC
LEIN
PRES
S
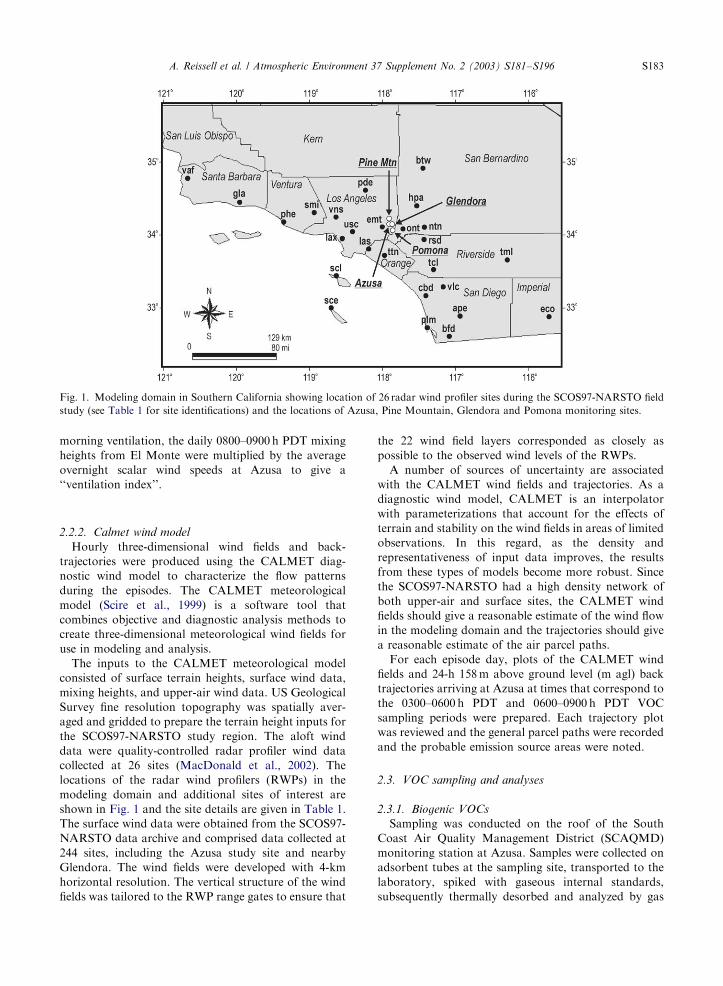
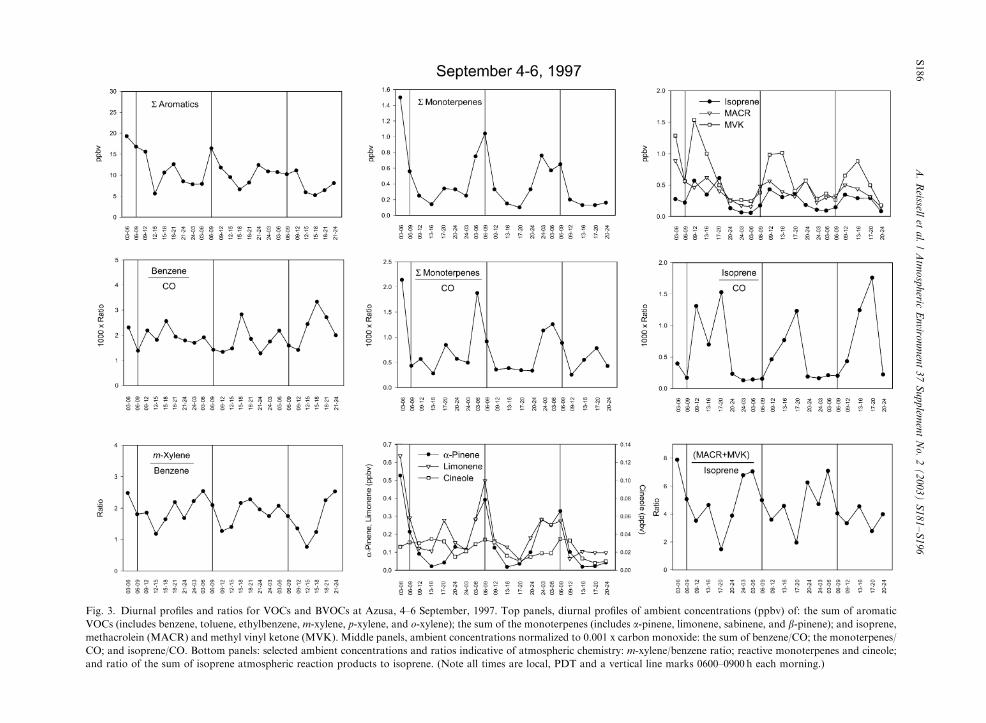
Fig. 3. Diurnal profiles and ratios for VOCs and BVOCs at Azusa, 4–6 September, 1997. Top panels, diurnal profiles of ambient concentrations (ppbv) of: the sum of aromatic
VOCs (includes benzene, toluene, ethylbenzene, m-xylene, p-xylene, and o-xylene); the sum of the monoterpenes (includes a-pinene, limonene, sabinene, and b-pinene); and isoprene,
methacrolein (MACR) and methyl vinyl ketone (MVK). Middle panels, ambient concentrations normalized to 0.001 x carbon monoxide: the sum of benzene/CO; the monoterpenes/
CO; and isoprene/CO. Bottom panels: selected ambient concentrations and ratios indicative of atmospheric chemistry: m-xylene/benzene ratio; reactive monoterpenes and cineole;
and ratio of the sum of isoprene atmospheric reaction products to isoprene. (Note all times are local, PDT and a vertical line marks 0600–0900 h each morning.)
A.
Reissell
eta
l./
Atm
osp
heric
En
viron
men
t3
7S
up
plem
ent
No
.2
(2
00
3)
S1
81
–S
19
6S186
September intensive sampling periods, respectively. The
diurnal profiles of these organic compounds are strongly
influenced by mixing heights, but important differences
among the compounds are obvious when their concen-
trations are normalized to CO, a non-reactive tracer for
vehicle traffic (middle panels in Figs. 2 and 3).
Alkene BVOCs react rapidly in the troposphere with
hydroxyl (OH) radicals, nitrate (NO3) radicals, and
ozone (O3) (Atkinson, 1997, 2000). Calculated lifetimes
(time for decay of the VOC to 1/e of its initial
concentration) of representative VOC and BVOC
compounds are given in Table 2. It should be noted
that the lifetimes given are inversely proportional to the
OH radical, NO3 radical and O3 concentrations
assumed. The complex interplay of the spatial and
temporal variations in OH radicals, NO3 radicals and O3
with the local meteorology and topography and the
resulting influence on the BVOC and VOC concentra-
tions at Azusa are discussed below in conjunction with
the bottom panels in Figs. 2 and 3.
3.1.1. Anthropogenic aromatic compounds
Azusa is considered as a midbasin receptor site for
anthropogenic VOCs, being located east of the main
source area of downtown Los Angeles. The monitoring
site in Azusa was close to the 10 and 210 freeways. As
seen from Table 3, during these intensive sampling
periods generally southwesterly winds prevailed at
Azusa during daytime and easterly winds during night-
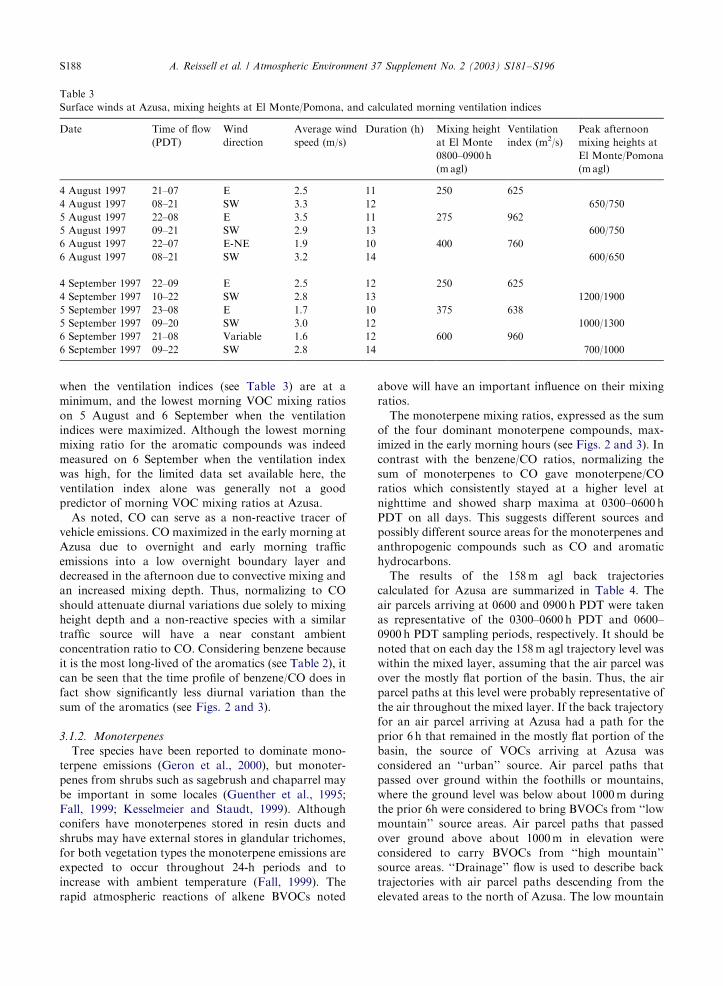
time. The 0800–0900 h PDT mixing heights ranged from
250m agl on 4 August and 4 September to 600m agl on
6 September. In August, the sum of the aromatic
compound mixing ratios (see Fig. 2) clearly shows
morning maxima at 0600–0900 h PDT and minima in
the late afternoon (1500–1800 h PDT). The trend is
similar in September (see Fig. 3), but the maxima and
minima are less pronounced. The aromatic compounds
are emitted from traffic, which is continuous on the
nearby freeways and, therefore, these compounds
accumulate within the shallow mixed layer at nighttime
and peak during the early morning rush hour. The sharp
decrease in the mixing ratio of the sum of the aromatic
compounds for the 0900–1200 h PDT samples is
consistent with the mixing height data from El Monte
which showed that the morning convective boundary
layer did not exceed the height of the nocturnal
boundary layer until after 1000 h PDT each day. The
afternoon minima can be explained mainly by continu-
ing increases in mixing height with resulting dilution (see
peak afternoon mixing heights in Table 3).
Ignoring any spatial or day of the week variations in
emission sources, the ventilation index would suggest
that the highest morning anthropogenic VOC mixing
ratios would be expected on 4 August and 4 September
ARTICLE IN PRESS
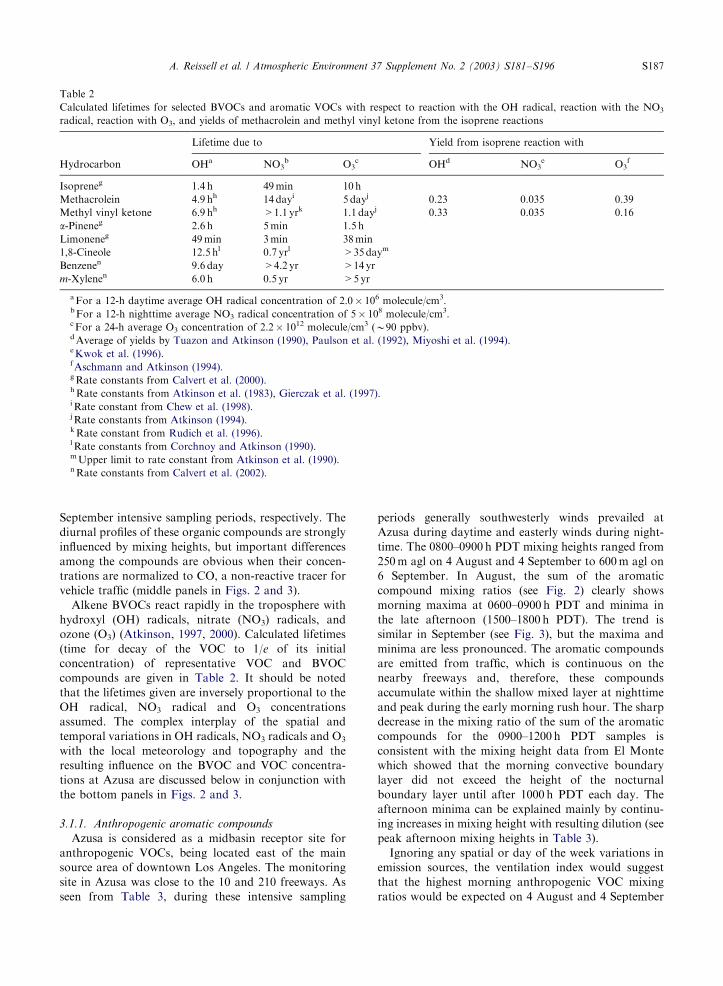
Table 2
Calculated lifetimes for selected BVOCs and aromatic VOCs with respect to reaction with the OH radical, reaction with the NO3
radical, reaction with O3, and yields of methacrolein and methyl vinyl ketone from the isoprene reactions
Lifetime due to Yield from isoprene reaction with
Hydrocarbon OHa NO3b O3
c OHd NO3e O3
f
Isopreneg 1.4 h 49min 10 h
Methacrolein 4.9 hh 14 dayi 5 dayj 0.23 0.035 0.39
Methyl vinyl ketone 6.9 hh >1.1 yrk 1.1 dayj 0.33 0.035 0.16
a-Pineneg 2.6 h 5min 1.5 h
Limoneneg 49min 3min 38min
1,8-Cineole 12.5 hl 0.7 yrl >35daym
Benzenen 9.6 day >4.2 yr >14yr
m-Xylenen 6.0 h 0.5 yr >5yr
aFor a 12-h daytime average OH radical concentration of 2.0� 106 molecule/cm3.bFor a 12-h nighttime average NO3 radical concentration of 5� 108 molecule/cm3.cFor a 24-h average O3 concentration of 2.2� 1012 molecule/cm3 (B90 ppbv).dAverage of yields by Tuazon and Atkinson (1990), Paulson et al. (1992), Miyoshi et al. (1994).eKwok et al. (1996).fAschmann and Atkinson (1994).gRate constants from Calvert et al. (2000).hRate constants from Atkinson et al. (1983), Gierczak et al. (1997).iRate constant from Chew et al. (1998).jRate constants from Atkinson (1994).kRate constant from Rudich et al. (1996).lRate constants from Corchnoy and Atkinson (1990).mUpper limit to rate constant from Atkinson et al. (1990).nRate constants from Calvert et al. (2002).
A. Reissell et al. / Atmospheric Environment 37 Supplement No. 2 (2003) S181–S196 S187
when the ventilation indices (see Table 3) are at a
minimum, and the lowest morning VOC mixing ratios
on 5 August and 6 September when the ventilation
indices were maximized. Although the lowest morning
mixing ratio for the aromatic compounds was indeed
measured on 6 September when the ventilation index
was high, for the limited data set available here, the
ventilation index alone was generally not a good
predictor of morning VOC mixing ratios at Azusa.
As noted, CO can serve as a non-reactive tracer of
vehicle emissions. CO maximized in the early morning at
Azusa due to overnight and early morning traffic
emissions into a low overnight boundary layer and
decreased in the afternoon due to convective mixing and
an increased mixing depth. Thus, normalizing to CO
should attenuate diurnal variations due solely to mixing
height depth and a non-reactive species with a similar
traffic source will have a near constant ambient
concentration ratio to CO. Considering benzene because
it is the most long-lived of the aromatics (see Table 2), it
can be seen that the time profile of benzene/CO does in
fact show significantly less diurnal variation than the
sum of the aromatics (see Figs. 2 and 3).
3.1.2. Monoterpenes
Tree species have been reported to dominate mono-
terpene emissions (Geron et al., 2000), but monoter-
penes from shrubs such as sagebrush and chaparrel may
be important in some locales (Guenther et al., 1995;
Fall, 1999; Kesselmeier and Staudt, 1999). Although
conifers have monoterpenes stored in resin ducts and
shrubs may have external stores in glandular trichomes,
for both vegetation types the monoterpene emissions are
expected to occur throughout 24-h periods and to
increase with ambient temperature (Fall, 1999). The
rapid atmospheric reactions of alkene BVOCs noted
above will have an important influence on their mixing
ratios.
The monoterpene mixing ratios, expressed as the sum
of the four dominant monoterpene compounds, max-
imized in the early morning hours (see Figs. 2 and 3). In
contrast with the benzene/CO ratios, normalizing the
sum of monoterpenes to CO gave monoterpene/CO
ratios which consistently stayed at a higher level at
nighttime and showed sharp maxima at 0300–0600 h
PDT on all days. This suggests different sources and
possibly different source areas for the monoterpenes and
anthropogenic compounds such as CO and aromatic
hydrocarbons.
The results of the 158m agl back trajectories
calculated for Azusa are summarized in Table 4. The
air parcels arriving at 0600 and 0900 h PDT were taken
as representative of the 0300–0600 h PDT and 0600–
0900 h PDT sampling periods, respectively. It should be
noted that on each day the 158m agl trajectory level was
within the mixed layer, assuming that the air parcel was
over the mostly flat portion of the basin. Thus, the air
parcel paths at this level were probably representative of
the air throughout the mixed layer. If the back trajectory
for an air parcel arriving at Azusa had a path for the
prior 6 h that remained in the mostly flat portion of the
basin, the source of VOCs arriving at Azusa was
considered an ‘‘urban’’ source. Air parcel paths that
passed over ground within the foothills or mountains,
where the ground level was below about 1000m during
the prior 6h were considered to bring BVOCs from ‘‘low
mountain’’ source areas. Air parcel paths that passed
over ground above about 1000m in elevation were
considered to carry BVOCs from ‘‘high mountain’’
source areas. ‘‘Drainage’’ flow is used to describe back
trajectories with air parcel paths descending from the
elevated areas to the north of Azusa. The low mountain
ARTICLE IN PRESS
Table 3
Surface winds at Azusa, mixing heights at El Monte/Pomona, and calculated morning ventilation indices
Date Time of flow
(PDT)
Wind
direction
Average wind
speed (m/s)
Duration (h) Mixing height
at El Monte
0800–0900h
(magl)
Ventilation
index (m2/s)
Peak afternoon
mixing heights at
El Monte/Pomona
(magl)
4 August 1997 21–07 E 2.5 11 250 625
4 August 1997 08–21 SW 3.3 12 650/750
5 August 1997 22–08 E 3.5 11 275 962
5 August 1997 09–21 SW 2.9 13 600/750
6 August 1997 22–07 E-NE 1.9 10 400 760
6 August 1997 08–21 SW 3.2 14 600/650
4 September 1997 22–09 E 2.5 12 250 625
4 September 1997 10–22 SW 2.8 13 1200/1900
5 September 1997 23–08 E 1.7 10 375 638
5 September 1997 09–20 SW 3.0 12 1000/1300
6 September 1997 21–08 Variable 1.6 12 600 960
6 September 1997 09–22 SW 2.8 14 700/1000
A. Reissell et al. / Atmospheric Environment 37 Supplement No. 2 (2003) S181–S196S188
area BVOC emissions are from mainly shrub vegetation,
and the high mountain emissions will reflect the presence
of coniferous forested areas rich in monoterpenes.
Although the low mountain terrain emissions will likely
be dominated during the daytime by isoprene emissions,
the BVOCs in the nighttime drainage flow may be
influenced by nighttime NO3 radical chemistry (dis-
cussed in detail below) and will lack fresh light-
dependent isoprene emissions (Reissell and Arey, 2001).
As shown in Table 4, trajectories for four out of the
six days showed that the air parcels arriving at Azusa at
0600 h PDT and 0900 h PDT were in the San Gabriel
Mountains six hours prior to arrival and the parcel
paths were associated with drainage flow. On 4 and 5
August and 4 and 5 September, the drainage flow was
strong and emissions from trees in the San Gabriel
forest, as well as from the shrub vegetation common to
the local hills would be transported to Azusa.
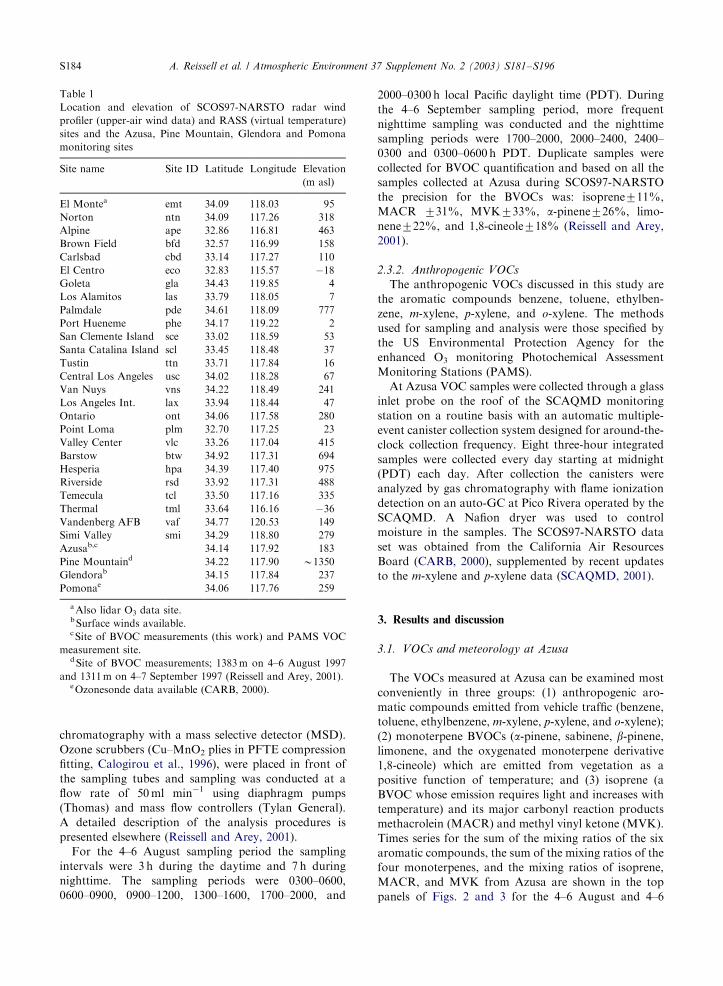
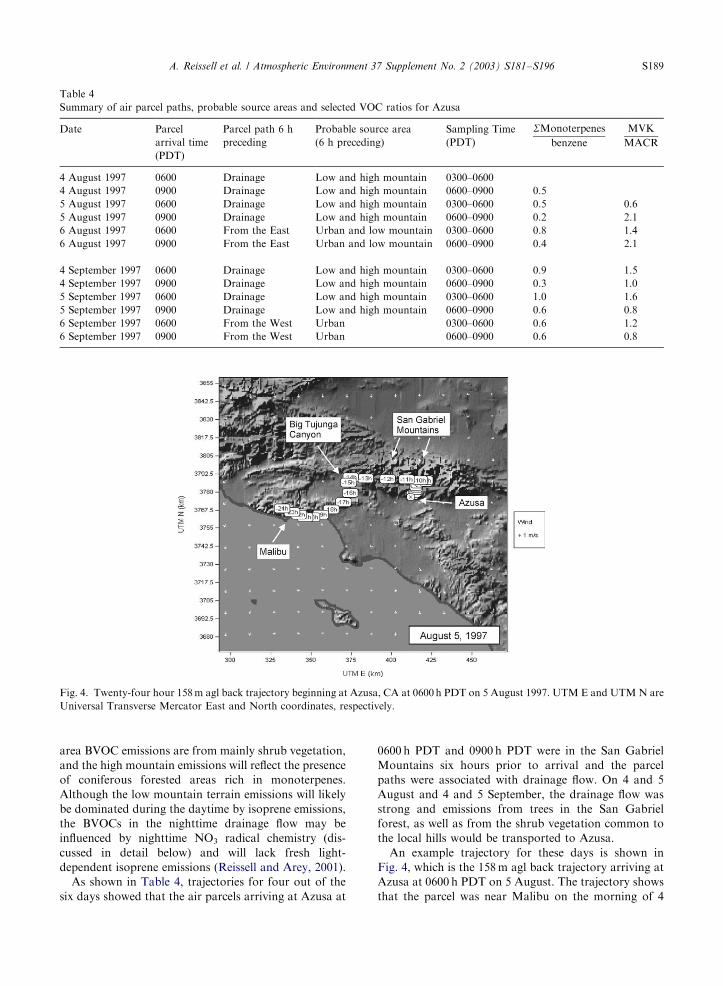
An example trajectory for these days is shown in
Fig. 4, which is the 158m agl back trajectory arriving at
Azusa at 0600 h PDT on 5 August. The trajectory shows
that the parcel was near Malibu on the morning of 4
ARTICLE IN PRESS
Fig. 4. Twenty-four hour 158m agl back trajectory beginning at Azusa, CA at 0600h PDT on 5 August 1997. UTM E and UTMN are
Universal Transverse Mercator East and North coordinates, respectively.
Table 4
Summary of air parcel paths, probable source areas and selected VOC ratios for Azusa
Date Parcel
arrival time
(PDT)
Parcel path 6 h
preceding
Probable source area
(6 h preceding)
Sampling Time
(PDT)
SMonoterpenes
benzene
MVK
MACR
4 August 1997 0600 Drainage Low and high mountain 0300–0600
4 August 1997 0900 Drainage Low and high mountain 0600–0900 0.5
5 August 1997 0600 Drainage Low and high mountain 0300–0600 0.5 0.6
5 August 1997 0900 Drainage Low and high mountain 0600–0900 0.2 2.1
6 August 1997 0600 From the East Urban and low mountain 0300–0600 0.8 1.4
6 August 1997 0900 From the East Urban and low mountain 0600–0900 0.4 2.1
4 September 1997 0600 Drainage Low and high mountain 0300–0600 0.9 1.5
4 September 1997 0900 Drainage Low and high mountain 0600–0900 0.3 1.0
5 September 1997 0600 Drainage Low and high mountain 0300–0600 1.0 1.6
5 September 1997 0900 Drainage Low and high mountain 0600–0900 0.6 0.8
6 September 1997 0600 From the West Urban 0300–0600 0.6 1.2
6 September 1997 0900 From the West Urban 0600–0900 0.6 0.8
A. Reissell et al. / Atmospheric Environment 37 Supplement No. 2 (2003) S181–S196 S189
August, eventually traveling east along the San Gabriel
Mountains before descending to Azusa in the morning
drainage flow. Although the 6–24 h parcel paths differ
on 4 and 5 August and on 4 and 5 September, the
existence and strength of the drainage flow is quite
similar. That is, from midnight to 0600 h PDT on these
four days, air was flowing into Azusa from the
mountains to the north.
On 6 August and 6 September, the parcel paths 6 h
prior to arrival at Azusa were different. On 6 August the
parcel path was from the east along the base of the San
Gabriel Mountains (parcel path not shown for this day);
therefore, the VOC source area for Azusa on 6 August is
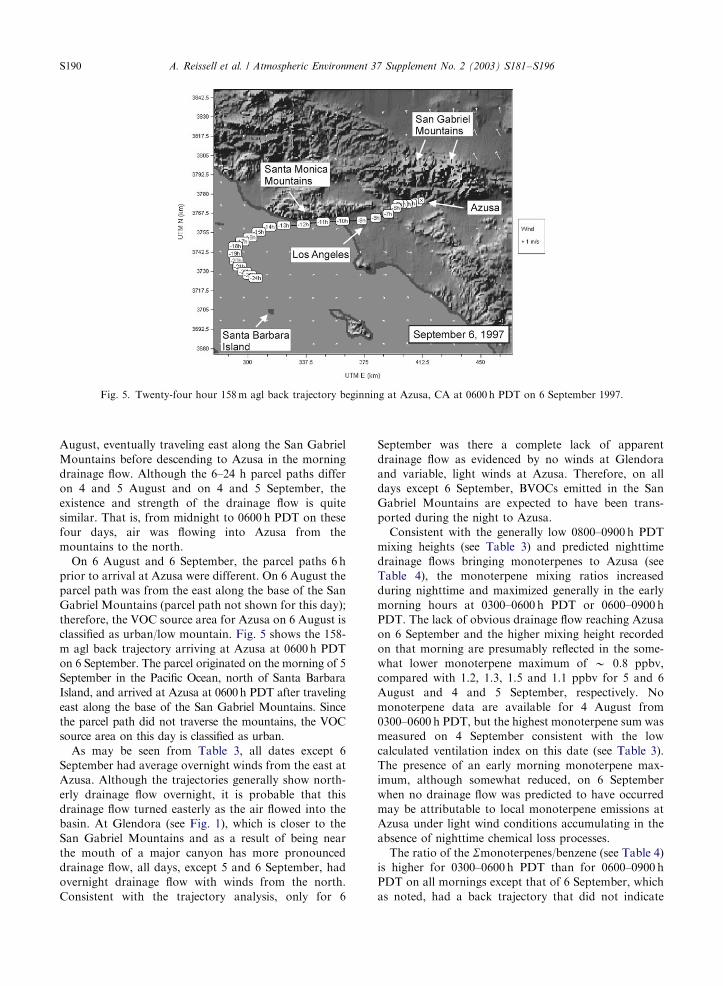
classified as urban/low mountain. Fig. 5 shows the 158-
m agl back trajectory arriving at Azusa at 0600 h PDT
on 6 September. The parcel originated on the morning of 5
September in the Pacific Ocean, north of Santa Barbara
Island, and arrived at Azusa at 0600h PDT after traveling
east along the base of the San Gabriel Mountains. Since
the parcel path did not traverse the mountains, the VOC
source area on this day is classified as urban.
As may be seen from Table 3, all dates except 6
September had average overnight winds from the east at
Azusa. Although the trajectories generally show north-
erly drainage flow overnight, it is probable that this
drainage flow turned easterly as the air flowed into the
basin. At Glendora (see Fig. 1), which is closer to the
San Gabriel Mountains and as a result of being near
the mouth of a major canyon has more pronounced
drainage flow, all days, except 5 and 6 September, had
overnight drainage flow with winds from the north.
Consistent with the trajectory analysis, only for 6
September was there a complete lack of apparent
drainage flow as evidenced by no winds at Glendora
and variable, light winds at Azusa. Therefore, on all
days except 6 September, BVOCs emitted in the San
Gabriel Mountains are expected to have been trans-
ported during the night to Azusa.
Consistent with the generally low 0800–0900 h PDT
mixing heights (see Table 3) and predicted nighttime
drainage flows bringing monoterpenes to Azusa (see
Table 4), the monoterpene mixing ratios increased
during nighttime and maximized generally in the early
morning hours at 0300–0600 h PDT or 0600–0900 h
PDT. The lack of obvious drainage flow reaching Azusa
on 6 September and the higher mixing height recorded
on that morning are presumably reflected in the some-
what lower monoterpene maximum of B 0.8 ppbv,
compared with 1.2, 1.3, 1.5 and 1.1 ppbv for 5 and 6
August and 4 and 5 September, respectively. No
monoterpene data are available for 4 August from
0300–0600 h PDT, but the highest monoterpene sum was
measured on 4 September consistent with the low
calculated ventilation index on this date (see Table 3).
The presence of an early morning monoterpene max-
imum, although somewhat reduced, on 6 September
when no drainage flow was predicted to have occurred
may be attributable to local monoterpene emissions at
Azusa under light wind conditions accumulating in the
absence of nighttime chemical loss processes.
The ratio of the Smonoterpenes/benzene (see Table 4)
is higher for 0300–0600 h PDT than for 0600–0900 h
PDT on all mornings except that of 6 September, which
as noted, had a back trajectory that did not indicate
ARTICLE IN PRESS
Fig. 5. Twenty-four hour 158m agl back trajectory beginning at Azusa, CA at 0600 h PDT on 6 September 1997.
A. Reissell et al. / Atmospheric Environment 37 Supplement No. 2 (2003) S181–S196S190
drainage flow. The fact that 6 August, with no apparent
drainage flow into Azusa, also had a higher Smono-
terpenes/benzene ratio for 0300–0600 h PDT than 0600–
0900 h PDT might suggest a possible influence of more
local low mountain/foothill monoterpene sources, con-
sistent with drainage flow being measured at Glendora
on this date.
3.1.3. Isoprene, methacrolein and methyl vinyl ketone
Isoprene mixing ratios (Figs. 2 and 3) were consis-
tently highest during daytime and lowest at nighttime.
Isoprene is mainly emitted by deciduous vegetation, and
emission rates are affected both by light [photosynthe-
tically active radiation (PAR)] and temperature, typi-
cally maximizing at B800 PAR and increasing with
temperature up to B40�C (Fall, 1999; Guenther, 1999).
Normalizing isoprene to CO at Azusa compensates for
the increased dilution in the afternoon and the peak
consistently observed at 1700–2000 h PDT suggests local
isoprene emissions, from for example Eucalyptus spp.,
maximized under full sunlight during this hot part of the
day. An alternative explanation would be entrainment
of isoprene-rich air resulting from vegetative emissions
at elevated locations.
MACR and MVK are atmospheric transformation
products of isoprene (see Table 2). The complex diurnal
profiles of isoprene, MACR and MVK at Azusa can be
contrasted with simultaneous measurements made on
Pine Mountain (at 1300–1400m), located in the San
Gabriel Mountains and 11 km north of Azusa. At Pine
Mountain, isoprene increased rapidly after sunrise
followed, after a lag time, by increases in MACR and
MVK. These profiles were consistently repeated each
day and were attributed to local isoprene emissions
controlled by light and temperature, and MACR and
MVK formed dominantly from daytime OH radical
reaction of isoprene. Rapid decreases in isoprene after
sunset were attributed to reaction with NO3 radicals
(Reissell and Arey, 2001). Nitrate radicals can form at
elevated sites to which NOx and O3 have been
transported from the basin during the daytime and
which then become isolated from basin NO emissions,
for example, by being located within a nighttime
elevated stable inversion layer (Lu and Turco, 1994,
1995, 1996). As discussed below, if the MACR and
MVK at Azusa are solely the product of isoprene
reactions, these must include both daytime OH radical
reactions and transport from areas where nighttime
isoprene chemistry has occurred.
3.2. Atmospheric chemistry
At Azusa during the daytime, atmospheric chemistry
will be very important in determining the concentrations
of BVOCs. As seen from Table 2, the OH radical-
initiated reaction is important and often the dominant
VOC atmospheric loss processes. The OH radical
concentration of 2� 106 radicals cm3 which was used
here to calculate lifetimes due to OH radical reaction is
based on a globally and annually averaged value (Prinn
et al., 1995, 2001; Hein et al., 1997) and daytime maxima
in September (1993) of 5–6� 106 radicals/cm3 have been
reported for Los Angeles (George et al., 1999). To
illustrate the reactivity of alkene BVOCs with NO3
radicals and O3, the lifetime calculations given in Table 2
were made using an NO3 radical concentration of
5� 108 molecules/cm3 [a value consistent with modeled
NO3 at an elevated site during SCOS97-NARSTO,
where 8 ppbv NO2 and 80 ppbv O3 were present at
sunset (Reissell and Arey, 2001)] and an O3 concentra-
tion of 90 ppbv (a 1-h average value reached at Azusa on
all six days discussed here).
High O3 concentrations will affect the alkene BVOC
lifetimes, and as can be seen from Table 4 the overall
lifetime of limonene due to daytime reaction with 2� 106
molecules/cm3 OH and 90 ppbv of O3 would be less than
a half hour. In contrast, during the evenings at Azusa
little or no chemistry occurred and therefore
monoterpenes brought to Azusa in drainage flows or
emitted locally during the night accumulated under the
nocturnal boundary layer. The O3 concentration routi-
nely dropped to low levels (p4 ppbv) each night at
Azusa, being titrated by vehicle traffic NO emissions
into the shallow nocturnal boundary layer (this also
eliminates O3-alkene reactions as a nighttime source of
OH radicals, Paulson et al., 1999). The presence of NO
also precluded significant NO3 radical concentrations
(note that NO3 radicals are not important during
the daytime because of their rapid photolysis) (Wayne
et al., 1991).
The influence of chemistry can be seen by comparing
the diurnal profile of reactive monoterpenes such as
limonene and a-pinene with long-lived species such as 1,8-
cineole (emitted perhaps from local Eucalyptus trees)
[refer to the bottom panels of Figs. 2 and 3 for this and
the following discussions]. At Azusa, the highest mono-
terpene mixing ratios were measured for limonene and a-pinene—in the early morning hours. There were rapid
decreases in a-pinene and limonene before noon, but less
pronounced decreases in 1,8-cineole. Cineole and another
long-lived BVOC, camphor, showed profiles very similar
to one another, with less rapid afternoon decreases and
less pronounced day-night differences than the more
reactive monoterpenes (Reissell and Arey, 2001).
The limonene and a-pinene mixing ratios generally
followed one another, although limonene stayed at a
higher level during daytime, despite its higher reactivity
(see Table 2). This was particularly apparent in
September (Fig. 3). Very high limonene mixing ratios
(up to 3.8 ppbv) were observed on two mornings during
SCOS97-NARSTO intensive sampling periods not dis-
cussed here (Reissell and Arey, 2001), and it may be that
ARTICLE IN PRESSA. Reissell et al. / Atmospheric Environment 37 Supplement No. 2 (2003) S181–S196 S191
local, and likely anthropogenic, limonene emissions
occur near Azusa.
The reaction rate of m-xylene (the most reactive of the
four C2-benzenes) with the OH radical is about twenty
times that of benzene (Table 2). Assuming that traffic is
the main source of these two anthropogenic aromatic
compounds, a decrease in the m-xylene/benzene ratio
suggests an ‘‘aged’’ air mass (see lower left panels of
Figs. 2 and 3). At Azusa this ratio was lower during
daytime and generally lowest between 1200–1500 h PDT
when the inclusion of aged air from aloft into the rising
mixed layer could account for the lower m-xylene/
benzene ratio.
This ratio would also decrease if the rate of oxidation
of m-xylene at Azusa was significant compared to the
rate of its emission. If there were no emissions at Azusa
after the morning, about 2 h reaction with an OH radical
concentration of 6� 106 molecules/cm3 [as noted pre-
viously, the reported maximum in Sept. 1993 (George
et al., 1999)] would result in the observed factor of B3
decrease in the m-xylene/benzene ratio. Fresh emissions
from the continual traffic at Azusa (with its higher m-
xylene/benzene ratio) would tend to increase the ratio.
Thus, although the higher oxidation rate at midday
plays a role in altering the m-xylene/benzene ratio, it
seems unlikely to be the sole factor.
3.2.1. Isoprene and reaction product ratios
The relationship between isoprene and its atmospheric
transformation products MACR and MVK changes
with the type of chemistry occurring. Data collected
simultaneously at an elevated site on Pine Mountain,
located 11 km north of Azusa (sampling at B1350m),
where strong local isoprene sources were present
(isoprene maximum 2 ppbv), was consistent with day-
time OH radical reaction controlling the MACR and
MVK formation. As the isoprene mixing ratio increased
during the day, its major loss process was by reaction
with the OH radical producing MACR and MVK
(Table 2). Hydroxyl radical reaction was the major loss
process for MACR and MVK as well, and considering
only OH radical-initiated photooxidation the ratio of
(MACR+MVK)/isoprene will increase approaching an
upper limit steady-state value of 2.4 (see Reissell and
Arey, 2001). Near an isoprene emission source, or before
reaching steady-state, this ratio will be less than the
steady-state value. From the generally greater than
steady-state values of the (MACR+MVK)/isoprene
ratio at Azusa as seen in Figs. 2 and 3 (bottom right
panels) it is clear that local isoprene emission and
reaction could not account for the MACR and MVK at
Azusa, expect perhaps in the late afternoons. Thus, if
biogenic, i.e., arising from isoprene, the early morning
MACR and MVK at Azusa must have non-local
sources, which allowed nighttime chemistry to influence
the ratio of (MACR+MVK)/isoprene.
Nighttime NO3 radical reaction with isoprene will
rapidly deplete the isoprene present, leaving the MACR
and MVK mixing ratios largely unchanged (note the
equal but low yields of MACR and MVK from the NO3
radical reaction, see Table 2) . Consistent with nighttime
NO3 reaction with isoprene, at Pine Mountain at night
the ratio of (MACR+MVK/isoprene) increased dra-
matically (maxima B60 for August and B30 for
September) and the MVK/MACR ratios changed little
(Reissell and Arey, 2001). In contrast to the NO3 radical
reaction with isoprene, changes in the nighttime
(MACR+MVK)/isoprene ratio due to O3 reaction with
isoprene would result in changes to the MVK/MACR
ratio because the yield ratio from the O3 reaction is 0.4
(see Table 2) and the yield ratio from the OH reaction is
1.4 (approaching 2.1 at steady-state).
The (MACR+MVK)/isoprene ratio was consistently
high at Azusa during the nighttime and maximized at
0300–0600 h PDT. These high ratios indicate that the
MACR and MVK at Azusa were transported from areas
where the isoprene had been reacted with NO3 and/or
O3. The MVK/MACR ratios given in Table 4 for the
0300–0600 h PDT and 0600–0900 h PDT samples when
the ratio (MACR+MVK)/isoprene was high are con-
sistent with isoprene loss mainly by NO3 reaction
(MVK/MACR from 1.4 to 2.1, reflecting their forma-
tion from daytime OH radical reaction of isoprene) with
the MVK/MACR valueso1.4 suggesting a contribution
of O3 reaction to the nighttime isoprene losses. The fact
that the MVK/MACR ratios measured for the 0300–
0600 h PDT and 0600–0900 h PDT samples on a given
day were not the same is consistent with the wind
changing from generally east at night to southwest
sometime between 0800 and 1000 h PDT.
The occurrence of nighttime NO3 chemistry at
elevated locations during the SCOS97-NARSTO study
was supported by the BVOC reactions observed at Pine
Mountain and Mount Baldy (located 25 km NE of
Azusa; sampling at B1200 m elevation) and by
measurements of O3 at Pine Mountain and of O3 and
NO2 at sunset on Mount Baldy (Reissell and Arey,
2001). Attributing the high (MACR + MVK)/isoprene
ratio at Azusa to nighttime NO3 chemistry depleting
isoprene at elevated sites, followed by transport of
MACR and MVK to Azusa requires daytime upslope
flow (to bring NOx and O3 to the elevated sites where
isoprene is being emitted) and nighttime drainage flow
into Azusa.
As seen from Table 4, on all days except 6 September
the CALMET model trajectories predicted that BVOCs
from low mountain areas were transported to Azusa
overnight. Back trajectory analyses showed previous-
day afternoon and evening flow into the mountains for
air parcels arriving at Azusa on 4–6 August and on 5
September. Flow was up the canyons just north of
Azusa for air parcels arriving at Azusa on 4 August and
ARTICLE IN PRESSA. Reissell et al. / Atmospheric Environment 37 Supplement No. 2 (2003) S181–S196S192
5 September and up the west side of the San Gabriel
Mountains (see, for example, Big Tujunga Canyon in
Fig. 4) for air parcels arriving on 5 and 6 August.
However, as shown in Fig. 5, the air arriving at Azusa
on 6 September is predicted not to have spent any time
in the San Gabriel Mountains and was over the Pacific
the prior day. For the afternoon of 3 September, the
trajectories indicated that winds transported air from
the high desert northeast of the mountains, into the San
Gabriel Mountains, and then downslope to Azusa on
the morning of 4 September. Thus, trajectory analyses
show mountain influence for all these mornings, except
for 6 September.
The apparent inconsistency in the meteorological
model results and the high early morning ratio of
(MACR+MVK)/isoprene on 6 September, i.e. the lack
of drainage flow in the early morning on 6 September,
may be because the CALMET model does not capture
local mountain effects under these low wind speed
conditions. Table 3 shows that afternoon mixing heights
on 4–6 August, although higher than during the early
morning hours, remained below about 600 to 750m agl
throughout the day at El Monte and Pomona. This
indicates that there was a strong inversion overhead with
very little vertical ventilation of pollutants on each of
these days at these locations, and probably at Azusa as
well. However, it has previously been shown (Lu and
Turco, 1994–1996) that in the Los Angeles basin, the
presence of low and high mountains results in upslope
mountain winds that carry air from the basin to
elevations above the mixed layer. As noted in Table 3,
on all days sustained southwesterly winds occurred
during the day at Azusa and these winds and heating of
the southern slopes of the hills and mountains north of
Azusa are expected to result in upslope flows, which
would transport NOx; ozone and anthropogenic VOCs
from the basin. Consistent with the existence of upslope
flows, ozone maxima were measured each day on Pine
Mountain (at 1300–1400m elevation) which generally
peaked about an hour later than at Azusa and afternoon
mixing ratios of anthropogenic tetrachloroethene
reached B70% of those simultaneously measured at
Azusa (Reissell and Arey, 2001). Therefore, because
most of the isoprene emissions are expected to occur
from the lower elevation shrub vegetation it seems likely
that local upslope flows and drainage flows from the
close-by foothills may be responsible for the early
morning MACR and MVK at Azusa, even on 6
September when the winds were very light and variable
and there was no demonstrated drainage flow.
4. Conclusions
At Azusa, CA during the 4–6 August and 4–6
September intensive sampling periods of SCOS97-
NARSTO, generally southwesterly winds prevailed
during daytime and easterly winds during nighttime.
The height of the mixed layer was at a minimum at night
and in the early morning and peaked during daytime.
Trajectory and surface wind analysis for the six intensive
sampling days indicated that, on all days except 6
September, drainage flow from the mountains at night-
time and early morning affected the BVOCs measured at
Azusa. During daytime, concentrations of the com-
pounds at Azusa were governed by emissions, reactions
with OH radicals and O3, transport by generally
southwesterly flows, convective mixing and dilution
within a rising mixed layer, as well as possible
entrainment of air from the residual layers aloft into
the rising mixed layer. During the night, NO emissions
at Azusa precluded nighttime chemistry and VOCs and
BVOCs accumulated under the low nighttime boundary
layer.
The monoterpene mixing ratios maximized in the
early morning hours and the monoterpene/CO ratios
showed sharp maxima at 0300–0600 h PDT on all days.
In contrast, normalization of benzene to CO diminished
its diurnal variation, consistent with vehicle traffic as
the source for these two long-lived anthropogenic
compounds.
Local sources for isoprene at Azusa were indicated by
the pronounced maxima in the isoprene/CO mixing
ratios occurring at 1700–2000 h PDT. Another possible
rationale for the high isoprene in the afternoon is
emissions from the foothills and mountain slopes mixing
into the deepening mixed layer. This is consistent with
the high daytime isoprene mixing ratios measured, for
example, at Pine Mountain. During daytime, limonene
mixing ratios at Azusa stayed at a higher level than a-pinene, although the lifetime of limonene is expected to
be shorter than that of a-pinene, suggesting probable
local anthropogenic sources for limonene.
Substantial early morning MACR and MVK mixing
ratios (and high (MACR+MVK)/isoprene ratios)
measured at Azusa were consistent with drainage flow
from elevated mountain areas which had received NOx
emissions transported from the urban basin by upslope
flows under consistent daytime southwesterly winds.
Drainage flow from the high elevations is expected to be
depleted in a-pinene, limonene and isoprene due to
reactions with NO3 radicals. Such rapid alkene BVOC
depletions were observed at B1300–1400m elevation on
Pine Mountain in samples collected simultaneously with
those described here (Reissell and Arey, 2001). As the air
flows over the foothills at lower elevations, continuing
emissions would supply monoterpenes (but not light-
dependent isoprene) into the nighttime drainage flow
which then travels into basin areas, such as Azusa,
where further nighttime reactions are precluded by NO
emissions. The high ratio of (MACR+MVK)/isoprene
even on 6 September, the single day without apparent
ARTICLE IN PRESSA. Reissell et al. / Atmospheric Environment 37 Supplement No. 2 (2003) S181–S196 S193
drainage flow, may indicate that the CALMET meteor-
ological model did not capture local mountain effects
under the low wind speed conditions present on this day.
The presence of an early morning monoterpene max-
imum on 6 September, although reduced in comparison
with those of other mornings, suggests that in the
absence of nighttime chemical loss processes local
monoterpene emissions can accumulate to significant
levels.
Because of the high reactivity of the BVOCs, a
thorough understanding of the interplay of basin NOx
emissions reaching elevated areas and of BVOCs and
their reaction products returning in drainage flows will
require more time-resolved measurements than made
during SCOS97-NARSTO. It would be advantageous to
simultaneously conduct, with high time resolution,
measurements of BVOCs, their major reaction products,
anthropogenic VOCs, as well as meteorological para-
meters both in the Los Angeles Basin and at elevated
sites.
Acknowledgements
The SCOS97-NARSTO BVOC data collection de-
scribed in this manuscript was funded by the California
Air Resources Board through contract 95–309 and was
made possible through the logistical support of Rudy
Eden of the South Coast Air Quality Management
District and Bart Croes, Randy Pasek and Ash Lashgari
of the California Air Resources Board. A.R. gratefully
acknowledges support from the Maj and Tor Nessling
Foundation, the Helsingin Sanomat Centennial Foun-
dation, the Ella and Georg Ehrnrooth Foundation and
the Jenny and Antti Wihuri Foundation. J.A. acknowl-
edges support from US Department of Energy Grant
No. DE-FG03-01ER63095 and the University of Cali-
fornia Agricultural Experiment Station. C.M. acknowl-
edges Jason Roney of Sonoma Technology, Inc. who
assisted in performing the CALMET model runs and
production of the trajectories. C.M. also acknowledges
the numerous organizations who collected the upper-air
radar profiler wind data and the surface meteoro-
logical data, with special thanks to the National Oceanic
and Atmospheric Administration’s Environmental
Technology Laboratory for processing the upper-air
wind data.
References
Aschmann, S.M., Atkinson, R., 1994. Formation yields of
methyl vinyl ketone and methacrolein from the gas-phase
reaction of O3 with isoprene. Environmental Science and
Technology 28, 1539–1542.
Atkinson, R., 1994. Gas-phase tropospheric chemistry of
organic compounds. Journal of Physical and Chemical
Reference Data. Monograph 2, 1–216.
Atkinson, R., 1997. Gas-phase tropospheric chemistry of
volatile organic compounds: 1 alkanes and alkenes. Journal
of Physical and Chemical Reference Data 26, 215–290.
Atkinson, R., 2000. Atmospheric chemistry of VOCs and NOx.
Atmospheric Environment 34, 2063–2101.
Atkinson, R., Aschmann, S.M., Pitts Jr., J.N., 1983. Kinetics of
the gas-phase reactions of OH radicals with a series of a,b-unsaturated carbonyls at 29972K. International Journal of
Chemical Kinetics 15, 75–81.
Atkinson, R., Hasegawa, D., Aschmann, S.M., 1990. Rate
constants for the gas-phase reactions of O3 with a series of
monoterpenes and related compounds at 29972K. Inter-
national Journal of Chemical Kinetics 22, 871–887.
Biesenthal, T.A., Wu, Q., Shepson, P.B., Wiebe, H.A., Anlauf,
K.G., Mackay, G.I., 1997. A study of relationships between
isoprene, its oxidation products, and ozone, in the
Lower Fraser Valley, BC. Atmospheric Environment 31,
2049–2058.
Calogirou, A., Larsen, B.R., Brussol, C., Duane, M., Kotzias,
D., 1996. Decomposition of terpenes by ozone during
sampling on Tenax. Analytical Chemistry 68, 1499–1506.
Calvert, J.G., Atkinson, R., Kerr, J.A., Madronich, S.,
Moortgat, G.K., Wallington, T.J., Yarwood, G., 2000.
The Mechanisms of Atmospheric Oxidation of the Alkenes.
Oxford University Press, New York, NY, 552pp.
Calvert, J.G., Atkinson, R., Becker, K.H., Kamens, R.M.,
Seinfeld, J.H., Wallington, T.J., Yarwood, G., 2002. The
Mechanisms of Atmospheric Oxidation of the Aromatic
Hydrocarbons. Oxford University Press, New York, NY,
556pp.
CARB, 2000. California Air Resources Board, Research
Division, Sacramento, CA, SCOS97, NARSTO, Data Vol.
1, Ozone Study, RD-2000-001.
Chameides, W.L., Lindsay, R.W., Richardson, J., Kiang, C.S.,
1988. The role of biogenic hydrocarbons in urban
photochemical smog: Atlanta as a case study. Science 241,
1473–1475.
Chameides, W.L., Fehsenfeld, F., Rodgers, M.O., Cardelino,
C., Martinez, J., Parrish, D., Lonneman, W., Lawson, D.R.,
Rasmussen, R.A., Zimmerman, P., Greenberg, J., Mid-
dleton, P., Wang, T., 1992. Ozone precursor relationships in
ambient atmosphere. Journal of Geophysical Research 97,
6037–6055.
Chew, A.A., Atkinson, R., Aschmann, S.M., 1998. Kinetics
of the gas-phase reactions of NO3 radicals with a series of
alcohols, glycol ethers, ethers and chloroalkenes. Journal of
the Chemical Society Faraday Transactions 94, 1083–1089.
Corchnoy, S.B., Atkinson, R., 1990. Kinetics of the gas-phase
reactions of OH and NO3 radicals with 2-carene, 1,8-
cineole, p-cymene, and terpinolene. Environmental Science
and Technology 24, 1497–1502.
Fall, R., 1999. Biogenic emissions of volatile organic com-
pounds from higher plants. In: Hewitt, C.N. (Ed.), Reactive
Hydrocarbons in the Atmosphere. Academic Press, San
Diego, pp. 41–96.
Fehsenfeld, F.C., Calvert, J., Fall, R., Goldan, P., Guenther,
A.B., Hewitt, C.N., Lamb, B., Liu, S., Trainer, M.,
Westberg, H., Zimmerman, P., 1992. Emissions of volatile
ARTICLE IN PRESSA. Reissell et al. / Atmospheric Environment 37 Supplement No. 2 (2003) S181–S196S194
organic compounds from vegetation and the implications
for atmospheric chemistry. Global Biochemical Cycles 6,
389–430.
Fuentes, J.D., Lerdau, M., Atkinson, R., Baldocchi, D.,
Bottenheim, J.W., Ciccioli, P., Lamb, B., Geron, C., Gu,
L., Guenther, A., Sharkey, T.D., Stockwell, W., 2000.
Biogenic hydrocarbons in the atmospheric boundary layer:
a review. Bulletin of the American Meteorological Society
81, 1537–1575.
George, L.A., Hard, T.M., O’Brien, R.J., 1999. Measurement
of free radicals OH and HO2 in Los Angeles smog. Journal
of Geophysical Research 104, 11643–11655.
Geron, C., Rasmussen, R., Arnts, R.R., Guenther, A., 2000. A
review and synthesis of monoterpene speciation from forests
in the United States. Atmospheric Environment 34,
1761–1781.
Gierczak, T., Burkholder, J.B., Talukdar, R.K., Mellouki, A.,
Barone, S.B., Ravishankara, A.R., 1997. Atmospheric fate
of methyl vinyl ketone and methacrolein. Journal of
Photochemistry and Photobiology A: Chemistry 110, 1–10.
Griffin, R.J., Cocker III, D.R., Seinfeld, J.H., Dabdub, D.,
1999. Estimate of global atmospheric aerosol from oxida-
tion of biogenic hydrocarbons. Geophysical Research
Letters 26, 2721–2724.
Guenther, A., 1999. Modeling biogenic volatile organic
compound emissions to the atmosphere. In: Hewitt, C.N.
(Ed.), Reactive Hydrocarbons in the Atmosphere. Academic
Press, San Diego, pp. 97–118.
Guenther, A., Hewitt, C.N., Erickson, D., Fall, R., Geron, C.,
Graedel, T., Harley, P., Klinger, L., Lerdau, M., McKay,
W.A., Pierce, T., Scholes, B., Steinbrecher, R., Tallamraju,
R., Taylor, J., Zimmerman, P., 1995. A global model of
natural volatile organic compound emissions. Journal of
Geophysical Research 100, 8873–8892.
Guenther, A., Geron, C., Pierce, T., Lamb, B., Harley, P., Fall,
R., 2000. Natural emissions of non-methane volatile organic
compounds, carbon monoxide, and oxides of nitrogen
from North America. Atmospheric Environment 34,
2205–2230.
Hein, R., Crutzen, P.J., Heimann, M., 1997. An inverse
modeling approach to investigate the global atmospheric
methane cycle. Global Biogeochemical Cycles 11, 43–76.
Hoffmann, T., Odum, J.R., Bowman, F., Collins, D., Klockow,
D., Flagan, R.C., Seinfeld, J.H., 1997. Formation of organic
aerosols from the oxidation of biogenic hydrocarbons.
Journal of Atmospheric Chemistry 26, 189–222.
Kavouras, I.G., Mihalpoulos, N., Stephanou, E.G., 1999.
Secondary organic aerosol formation vs primary organic
aerosol emission: in situ evidence for the chemical coupling
between monoterpene acidic photooxidation products and
new particle formation over forests. Environmental Science
and Technology 33, 1028–1037.
Kesselmeier, J., Staudt, M., 1999. Biogenic volatile organic
compounds (VOC): an overview on emission, physio-
logy and ecology. Journal of Atmospheric Chemistry 33,
23–88.
Kwok, E.S.C., Aschmann, S.M., Arey, J., Atkinson, R., 1996.
Product formation from the reaction of the NO3 radical
with isoprene and rate constants for the reactions of
methacrolein and methyl vinyl ketone with the NO3 radical.
International Journal of Chemical Kinetics 28, 925–934.
Lu, R., Turco, R.P., 1994. Air pollutant transport in a coastal
environment—I. Two-dimensional simulations of sea-breeze
and mountain effects. Journal of Atmospheric Sciences 51,
2285–2308.
Lu, R., Turco, R.P., 1995. Air pollutant transport in a coastal
environment—II. Three-dimensional simulations over Los
Angeles Basin. Atmospheric Environment 29, 1499–1518.
Lu, R., Turco, R.P., 1996. Ozone distribution over the Los
Angeles Basin: three-dimensional simulations with the
SMOG model. Atmospheric Environment 30, 4155–4176.
MacDonald, C.P., Barnett, A.N., Dye, T.S., Nguyen, D.T.,
Knoderer, C.A., Roberts, P.T., Baxter, R.A., Weber, B.L.,
2002. Processing and validation of data collected by radar
wind profilers, radio acoustic sounding systems, and sodars
during the 1997 Southern California Ozone Study. Prepared
for California Air Resources Board, Sacramento, CA and
South Coast Air Quality Management District, Diamond
Bar, CA by Sonoma Technology, Inc., Petaluma, CA,
Parsons Corporation, Pasadena, CA, and National Oceanic
and Atmospheric Administration, Environmental Technol-
ogy Laboratory, Boulder, CO, STI-99752A/B-2151-DFR,
February.
Miyoshi, A., Hatakeyama, S., Washida, N., 1994. OH radical-
initiated photooxidation of isoprene: an estimate of global
CO production. Journal of Geophysical Research 99,
18779–18787.
M .uller, J.-F., 1992. Geographical distribution and seasonal
variation of surface emissions and deposition velocities of
atmospheric trace gases. Journal of Geophysical Research
97, 3787–3804.
Paulson, S.E., Flagan, R.C., Seinfeld, J.H., 1992. Atmospheric
photooxidation of isoprene part I: the hydroxyl radical and
ground state atomic oxygen reactions. International Journal
of Chemical Kinetics 24, 79–101.
Paulson, S.E., Chung, M.Y., Hasson, A.S., 1999. OH radical
formation from the gas-phase reaction of ozone with
terminal alkenes and the relationship between structure
and mechansim. Journal of Physical Chemistry 103,
8125–8138.
Piccot, S.D., Watson, J.J., Jones, J.W., 1992. A global
inventory of volatile organic compound emissions from
anthropogenic sources. Journal of Geophysical Research
97, 9897–9912.
Prinn, R.G., Weiss, R.F., Miller, B.R., Huang, J., Alyea, F.N.,
Cunnold, D.M., Fraser, P.J., Hartley, D.E., Simmonds,
P.G., 1995. Atmospheric trends and lifetime of CH3CCl3and global OH concentrations. Science 269, 187–192.
Prinn, R.G., Huang, J., Weiss, R.F., Cunnold, D.M., Fraser,
P.J., Simmonds, P.G., McCulloch, A., Harth, C., Salameh,
P., O’Doherty, S., Wang, R.H.J., Porter, L., Miller, B.R.,
2001. Evidence for substantial variations of atmospheric
hydroxyl radicals in the past two decades. Science 292,
1882–1888.
Reissell, A., Arey, J., 2001. Biogenic volatile organic com-
pounds at Azusa and elevated sites during the 1997
Southern California Ozone Study. Journal of Geophysical
Research 106, 1607–1621.
Rudich, Y., Talukdar, R.K., Fox, R.W., Ravishankara, A.R.,
1996. Rate coefficients for reactions of NO3 with a few
olefins and oxygenated olefins. Journal of Physical Chem-
istry 100, 5374–5381.
ARTICLE IN PRESSA. Reissell et al. / Atmospheric Environment 37 Supplement No. 2 (2003) S181–S196 S195
SCAQMD, 2001. South Coast Air Quality Management
District, Diamond Bar, CA.
Scire, J.S., Robe, F.R., Fernau, M.E., Yamartino, R.J., 1999. A
User’s Guide for the CALMET Meteorological Model
(Version 5.0). Earth Tech Inc., Concord, MA.
Starn, T.K., Shepson, P.B., Bertman, S.B., White, J.S., Splawn,
B.G., Riemer, D.D., Zika, R.G., Olszyna, K., 1998.
Observations of isoprene chemistry and its role in ozone
production at a semirural site during the 1995 Southern
Oxidant Study. Journal of Geophysical Research 103,
22425–22435.
Trainer, M., Hsie, E.Y., McKeen, S.A., Tallamraju, R., Parrish,
D.D., Fehsenfeld, F.C., Liu, S.C., 1987a. Impact of natural
hydrocarbons on hydroxyl and peroxy radicals at a remote
site. Journal of Geophysical Research 92, 11879–11894.
Trainer, M., Williams, E.J., Parrish, D.D., Buhr, M.P., Allwine,
E.J., Westberg, H.H., Fehsenfeld, F.C., Liu, S.C., 1987b.
Models and observations of the impact of natural hydro-
carbons on rural ozone. Nature 329, 705–707.
Tuazon, E.C., Atkinson, R., 1990. A product study of the gas-
phase reaction of isoprene with the OH radical in the
presence of NOx. International Journal of Chemical
Kinetics 22, 1221–1236.
Wayne, R.P., Barnes, I., Biggs, P., Burrows, J.P., Canosa-Mas,
C.E., Hjorth, J., Le Bras, G., Moortgat, G.K., Perner, D.,
Poulet, G., Restelli, G., Sidebottom, H., 1991. The nitrate
radical: physics, chemistry, and the atmosphere. Atmo-
spheric Environment 25A, 1–203.
Went, F.W., 1960. Blue hazes in the atmosphere. Nature 187,
641–643.
World Meteorological Organization, 1995. Scientific Assess-
ment of Ozone Depletion; 1995. Global Ozone Research
and Monitoring Project, Report No. 37, Geneva, Switzer-
land (Chapter 2).
ARTICLE IN PRESSA. Reissell et al. / Atmospheric Environment 37 Supplement No. 2 (2003) S181–S196S196