characterization of b2o3 and/or wo3 containing tellurite glasses
TRANSCRIPT
Journal of Non-Crystalline Solids 358 (2012) 641–647
Contents lists available at SciVerse ScienceDirect
Journal of Non-Crystalline Solids
j ourna l homepage: www.e lsev ie r .com/ locate / jnoncryso l
Characterization of B2O3 and/or WO3 containing tellurite glasses
A.E. Ersundu, M. Çelikbilek, S. Aydin ⁎Istanbul Technical University, Department of Metallurgical and Materials Engineering, Istanbul, 34469, Turkey
⁎ Corresponding author. Tel.: +90 212 285 68 64; faE-mail address: [email protected] (S. Aydin).
0022-3093/$ – see front matter © 2011 Elsevier B.V. Alldoi:10.1016/j.jnoncrysol.2011.11.012
a b s t r a c t
a r t i c l e i n f oArticle history:Received 12 September 2011Received in revised form 3 November 2011Available online 3 December 2011
Keywords:Tellurite glasses;Thermal behavior;Fourier transform infrared spectroscopy;Crystallization behavior;Microstructure
Characterization of B2O3 and/or WO3 containing tellurite glasses was realized in the 0.80TeO2–(0.20−x)WO3−xB2O3 system (0≤x≤0.20 in molar ratio) by using differential scanning calorimetry, Fourier trans-form infrared spectroscopy, X-ray diffraction, scanning electron microscopy and energy dispersive X-rayspectrometry techniques. Glasses were prepared with a conventional melt-quenching technique at 750 °C. Torecognize the thermal behavior of the glasses, glass transition and crystallization temperatures, glass stabilityvalue, glass transition activation energy, fragility parameter were calculated from the thermal analyses. Density,molar volume, oxygen molar volume and oxygen packing density values were determined to investigate thephysical properties of glasses. Fourier transform infrared spectra were interpreted in terms of the structuraltransformations on the glass network, according to the changing B2O3 and/or WO3 content. Crystallizationbehavior of the glasses was investigated by in situ X-ray diffraction measurements and microstructuralcharacterization was realized by scanning electron microscopy and energy dispersive X-ray spectrometryanalyses.
© 2011 Elsevier B.V. All rights reserved.
1. Introduction
Tellurite glasses have become technologically and scientificallyimportant due to their outstanding properties, such as relatively lowphonon energy, high refractive index, high dielectric constant, goodinfrared transmittance, low glass transition and melting temperature,thermal and chemical stability and high crystallization resistance.These advantageous properties make tellurite glasses preferablehost materials for some infrared and infrared to visible upconversionapplications in optical data storage, lasers, sensors and spectroscopicdevices [1–6].
Tellurium dioxide (TeO2) is a conditional glass former which doesnot transform to the glassy state without the addition of a secondarycomponent under conventional cooling conditions. Therefore, glassforming agents such as alkalis, heavy metal oxides or halogens areused to obtain tellurite glasses [1–6]. It is known that the structureand properties of oxide glasses are strongly dependent on the natureand concentration of the constituent oxides. Addition of WO3, as anetwork modifier or intermediate oxide network, to tellurite glassesprovides several advantageous properties, such as doping with rare-earth elements in a wide range, modifying the composition by athird, fourth, and even fifth component, enhancing the chemical sta-bility and devitrification resistance. Furthermore, compared to other
x: +90 212 285 34 27.
rights reserved.
tellurite glasses, WO3 containing tellurite glasses have slightly higherphonon energy and higher glass transition temperature, thereforethey can be used at high optical intensities without exposure to ther-mal damage [2–5]. Addition of B2O3 to tellurite glasses provides someunique features by enhancing the thermal and chemical stability andcrystallization resistance [1,7,8]. Due to these favorable properties, aconsiderable number of publications have been published on WO3
and/or B2O3 tellurite glasses by different researchers [1–15].Although there exist numerous studies on binary and ternary
tellurite glasses containing B2O3 and/or WO3, thermal and structuralbehavior of tellurite based glasses need to be studied in detail to de-velop and use them in opto-electronic applications. Therefore, in thepresent study the authors aim to investigate the thermal and struc-tural properties and crystallization behavior of B2O3 and/or WO3
containing tellurite glasses in the 0.80TeO2–(0.20−x)WO3–xB2O3
system (0≤x≤0.20 in molar ratio) by applying differential scanningcalorimetry (DSC), Fourier transform infrared spectroscopy (FTIR),X-ray diffraction (XRD) and scanning electron microscopy and energydispersive X-ray spectrometry (SEM/EDS) analyses.
2. Experimental procedure
In the experimental studies, different compositions of the0.80TeO2–(0.20−x)WO3–xB2O3 system (0≤x≤0.20 in molar ratio)were prepared with a conventional melt-quenching technique to char-acterize B2O3 and/orWO3 containing tellurite glasses. High purity pow-ders of TeO2 (99.99% purity, Alfa Aesar Company), WO3 (99.8% purity,Alfa Aesar Company) and H3BO3 (99.5% purity, Sigma-Aldrich Compa-ny) were thoroughly mixed and 5 g size powder batches were
642 A.E. Ersundu et al. / Journal of Non-Crystalline Solids 358 (2012) 641–647
melted in a platinum crucible with a closed lid at 750 °C for 30 mi-nutes in an electrical furnace and quenched in water bath. Originaland final compositions of the samples are given in Table 1. The finalcompositions were calculated by performing chemical analysisusing a Perkin Elmer AAnalyst 800 atomic absorption spectrometerwith an error estimate of ±2%.
X-ray diffraction analyses (XRD) were realized to check the amor-phous nature of the as-cast samples. XRD investigations were carriedout with powdered samples in a Bruker™ D8 Advanced Series pow-der diffractometer using Cu Kα radiation in the 2θ range from 10° to90°.
Thermal behavior of the glass samples were investigated by ap-plying differential scanning calorimetry analyses (DSC) in a NetzschDSC 204 F1 (limit of detection: b0.1 μW, with an error estimate of ±1 °C) using a constant sample weight of 20±1 mg in aluminumpans, under flowing (25 ml/min) argon gas with a heating rate of10 °C/min. The glass transition onset (Tg), crystallization onset andpeak (Tc/Tp) temperatures were determined from the DSC scans.The glass transition onset temperatures (Tg) were determined asthe inflection point of the endothermic change of the calorimetricsignal. Crystallization onset temperatures were specified as the be-ginning of the reaction where the crystallization first starts andpeak temperatures represent the maximum value of the exotherm.The temperature difference between the glass transition (Tg) andthe first exothermic peak onset (Tc1), ΔT=Tc1−Tg, indicating thevalue of glass stability was calculated.
The activation energy of the glass transition, Eg, was determinedby running non-isothermal DSC scans of the glass samples at sevendifferent heating rates, B, (5, 10, 15, 20, 25, 30 and 40 °C/min) fromroom temperature to 550 °C.
Densities, ρ, of the glass samples were determined at room temper-ature by the Archimedes principle using distilled water as the immer-sion liquid and a digital balance of sensitivity 10−4 g. The densityvalues obtained by repeated measurements showed an error of ±0.2%.
Themolar volume, VM, oxygenmolar volume, VO and oxygen pack-ing density, OPD, values were calculated to investigate the physicalproperties of glasses.
Fourier transform infrared (FTIR) spectroscopy analyses were re-alized at room temperature, using the KBr pellet technique, in thewave number range from 400 to 1600 cm−1 with a resolution of1 cm−1 using a Perkin Elmer Spectrum 100 FTIR spectrometer. ForFTIR experiments 0.005 g of glass samples were weighed, mixed andground with 0.300 g KBr. After which the mixture was pressed at 10tons for 1 min, to yield transparent disks suitable for mounting inthe spectrometer.
The crystallization behavior of the glasses was investigated by run-ning in situ X-ray powder diffraction (in situ XRD) measurementswith a Philips X'pert MRD (Cu Kα radiation) fitted with a high temper-ature furnace (Anton-Parr DHS900). The heating rate was 10 °C/minand each pattern was recorded after an annealing time of 10 minutes
Table 1Values of glass transition onset (Tg), crystallization onset and peak (Tc/Tp), glass stability (Δvolume (VM), oxygen molar volume (VO), oxygen packing density (OPD) of 0.80TeO2–(0.20
SampleID
OriginalCompositions(mol %)
FinalCompositions(mol %)
Tg(°C)
Tc1 / Tp1(°C)
Tc2/ Tp2(°C)
Tc3 / Tp3(°C)
ΔT(°C
TeO2 WO3 B2O3 TeO2 WO3 B2O3
TWB0 80 20 0 77.7 22.3 0 349 447/492 –/488 98TWB5 80 15 5 79.2 16.1 4.7 345 435/459 –/497 90TWB10 80 10 10 79.8 10.7 9.5 344 434/453 –/459 –/480 90TWB15 80 5 15 80.6 5.8 13.6 343 420/439 –/460 475/486 77TWB20 80 0 20 81.8 0 18.2 340 415/431 –/488 75
– : undetermined values.
at the chosen temperatures, in the 2θ range from 10° to 90°. The Inter-national Centre for DiffractionData (ICDD) files were used to determinethe crystalline phases by comparing the peak positions and intensitieswith the reference patterns.
Microstructural characterization experiments was conducted withgold/platinum coated bulk samples in JEOL™ Model JSM 7000F scan-ning electron microscope (SEM) linked with Oxford Inca energydispersive X-ray spectrometer (EDS) attachment.
3. Theoretical basis
The activation energy for the glass transition reaction can be calcu-lated from the modified Kissinger equation [16]. Kissinger equationwas originally introduced to determine the kinetics of chemical reac-tions and it is widely used to calculate the activation energy of crystal-lization [16,17]. The activation energy was calculated from the slopesof the linear fits to the experimental data from a plot of ln(Tg2/ B) versus1/Tg, by using the following equation:
lnT2g
B
!¼ Eg
RTgþ const ð1Þ
where Tg is the glass transition onset temperature for a given heatingrate B, Eg is the glass transition activation energy, R is the gas constant.
The fragility parameter, m, of the glass samples can be calculated(with an error estimate of ±1) from the following expression [18,19]:
m ¼ EgRTg
!ð2Þ
wherem is the fragility parameter, Eg is the activation energy for glasstransition, R is the gas constant and Tg is the glass transition onsettemperature.
The molar volume, VM, can be calculated as a function of the molarfraction of each of the three components and the oxygen molar vol-ume, VO, can be calculated by using the following expression [20]:
VO ¼ ∑ xiMi
ρ
� �1
∑xini
� �ð3Þ
where xi is the molar fraction of each component i; Mi is the molecu-lar weight; ρ is the glass density and ni is the number of oxygen atomsin each oxide.
Oxygen packing density, OPD, can be calculated from the densityand composition using the following formula:
OPD ¼ 1000C ρ=Mð Þ ð4Þ
where C is the number of oxygen atoms per each composition, ρ is thecalculated glass density, M is the molecular weight.
T), activation energy of glass transition (Eg), fragility parameter (m), density (ρ), molar−x)WO3–xB2O3 glasses.
)Eg(kJ mol−1)
m ρat 25 °C(g cm−3)
ρtheoretical(g cm−3)
VM
(cm3 mol−1)VO
(cm3mol−1)OPD(mol L−1)
598 115 5.85 5.97 29.75 13.52 73.95552 107 5.66 5.74 29.32 13.8 75.04507 98 5.40 5.51 29.23 14.26 75.28512 99 5.14 5.28 29.13 14.75 75.53469 92 4.92 5.05 28.78 15.15 76.44
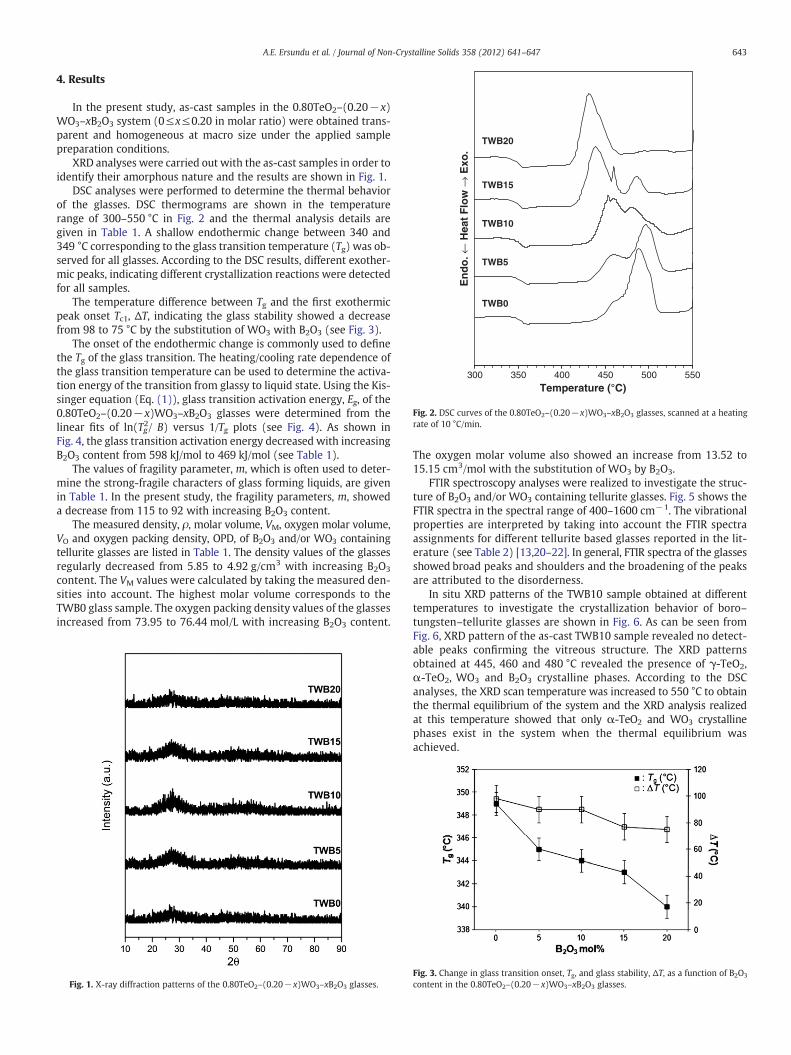
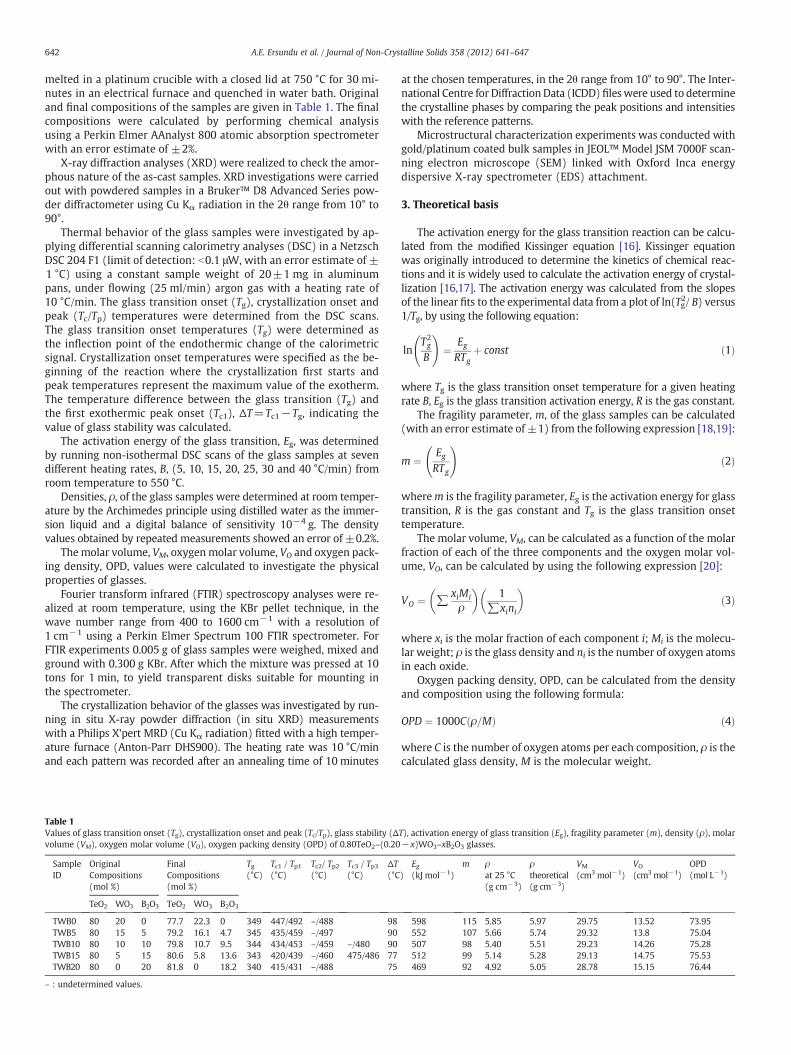
Fig. 2. DSC curves of the 0.80TeO2–(0.20−x)WO3–xB2O3 glasses, scanned at a heatingrate of 10 °C/min.
643A.E. Ersundu et al. / Journal of Non-Crystalline Solids 358 (2012) 641–647
4. Results
In the present study, as-cast samples in the 0.80TeO2–(0.20−x)WO3–xB2O3 system (0≤x≤0.20 in molar ratio) were obtained trans-parent and homogeneous at macro size under the applied samplepreparation conditions.
XRD analyses were carried out with the as-cast samples in order toidentify their amorphous nature and the results are shown in Fig. 1.
DSC analyses were performed to determine the thermal behaviorof the glasses. DSC thermograms are shown in the temperaturerange of 300–550 °C in Fig. 2 and the thermal analysis details aregiven in Table 1. A shallow endothermic change between 340 and349 °C corresponding to the glass transition temperature (Tg) was ob-served for all glasses. According to the DSC results, different exother-mic peaks, indicating different crystallization reactions were detectedfor all samples.
The temperature difference between Tg and the first exothermicpeak onset Tc1, ΔT, indicating the glass stability showed a decreasefrom 98 to 75 °C by the substitution of WO3 with B2O3 (see Fig. 3).
The onset of the endothermic change is commonly used to definethe Tg of the glass transition. The heating/cooling rate dependence ofthe glass transition temperature can be used to determine the activa-tion energy of the transition from glassy to liquid state. Using the Kis-singer equation (Eq. (1)), glass transition activation energy, Eg, of the0.80TeO2–(0.20−x)WO3–xB2O3 glasses were determined from thelinear fits of ln(Tg2/ B) versus 1/Tg plots (see Fig. 4). As shown inFig. 4, the glass transition activation energy decreased with increasingB2O3 content from 598 kJ/mol to 469 kJ/mol (see Table 1).
The values of fragility parameter, m, which is often used to deter-mine the strong-fragile characters of glass forming liquids, are givenin Table 1. In the present study, the fragility parameters, m, showeda decrease from 115 to 92 with increasing B2O3 content.
The measured density, ρ, molar volume, VM, oxygen molar volume,VO and oxygen packing density, OPD, of B2O3 and/or WO3 containingtellurite glasses are listed in Table 1. The density values of the glassesregularly decreased from 5.85 to 4.92 g/cm3 with increasing B2O3
content. The VM values were calculated by taking the measured den-sities into account. The highest molar volume corresponds to theTWB0 glass sample. The oxygen packing density values of the glassesincreased from 73.95 to 76.44 mol/L with increasing B2O3 content.
Fig. 1. X-ray diffraction patterns of the 0.80TeO2–(0.20−x)WO3–xB2O3 glasses.
The oxygen molar volume also showed an increase from 13.52 to15.15 cm3/mol with the substitution of WO3 by B2O3.
FTIR spectroscopy analyses were realized to investigate the struc-ture of B2O3 and/or WO3 containing tellurite glasses. Fig. 5 shows theFTIR spectra in the spectral range of 400–1600 cm−1. The vibrationalproperties are interpreted by taking into account the FTIR spectraassignments for different tellurite based glasses reported in the lit-erature (see Table 2) [13,20–22]. In general, FTIR spectra of the glassesshowed broad peaks and shoulders and the broadening of the peaksare attributed to the disorderness.
In situ XRD patterns of the TWB10 sample obtained at differenttemperatures to investigate the crystallization behavior of boro–tungsten–tellurite glasses are shown in Fig. 6. As can be seen fromFig. 6, XRD pattern of the as-cast TWB10 sample revealed no detect-able peaks confirming the vitreous structure. The XRD patternsobtained at 445, 460 and 480 °C revealed the presence of γ-TeO2,α-TeO2, WO3 and B2O3 crystalline phases. According to the DSCanalyses, the XRD scan temperature was increased to 550 °C to obtainthe thermal equilibrium of the system and the XRD analysis realizedat this temperature showed that only α-TeO2 and WO3 crystallinephases exist in the system when the thermal equilibrium wasachieved.
Fig. 3. Change in glass transition onset, Tg, and glass stability, ΔT, as a function of B2O3
content in the 0.80TeO2–(0.20−x)WO3–xB2O3 glasses.
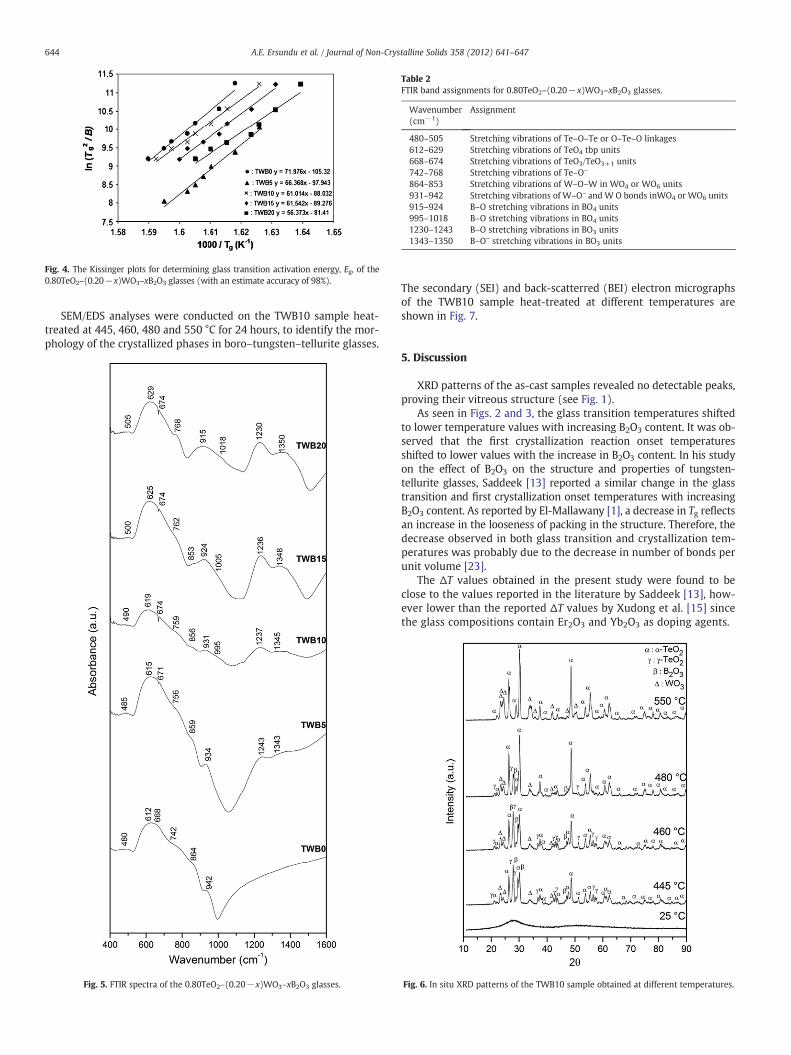
Fig. 4. The Kissinger plots for determining glass transition activation energy, Eg, of the0.80TeO2–(0.20−x)WO3–xB2O3 glasses (with an estimate accuracy of 98%).
Table 2FTIR band assignments for 0.80TeO2–(0.20−x)WO3–xB2O3 glasses.
Wavenumber(cm−1)
Assignment
480–505 Stretching vibrations of Te–O–Te or O–Te–O linkages612–629 Stretching vibrations of TeO4 tbp units668–674 Stretching vibrations of TeO3/TeO3+1 units742–768 Stretching vibrations of Te–O–
864–853 Stretching vibrations of W–O–W in WO4 or WO6 units931–942 Stretching vibrations of W–O– and W O bonds inWO4 or WO6 units915–924 B–O stretching vibrations in BO4 units995–1018 B–O stretching vibrations in BO4 units1230–1243 B–O stretching vibrations in BO3 units1343–1350 B–O– stretching vibrations in BO3 units
644 A.E. Ersundu et al. / Journal of Non-Crystalline Solids 358 (2012) 641–647
SEM/EDS analyses were conducted on the TWB10 sample heat-treated at 445, 460, 480 and 550 °C for 24 hours, to identify the mor-phology of the crystallized phases in boro–tungsten–tellurite glasses.
Fig. 5. FTIR spectra of the 0.80TeO2–(0.20−x)WO3–xB2O3 glasses.
The secondary (SEI) and back-scatterred (BEI) electron micrographsof the TWB10 sample heat-treated at different temperatures areshown in Fig. 7.
5. Discussion
XRD patterns of the as-cast samples revealed no detectable peaks,proving their vitreous structure (see Fig. 1).
As seen in Figs. 2 and 3, the glass transition temperatures shiftedto lower temperature values with increasing B2O3 content. It was ob-served that the first crystallization reaction onset temperaturesshifted to lower values with the increase in B2O3 content. In his studyon the effect of B2O3 on the structure and properties of tungsten-tellurite glasses, Saddeek [13] reported a similar change in the glasstransition and first crystallization onset temperatures with increasingB2O3 content. As reported by El-Mallawany [1], a decrease in Tg reflectsan increase in the looseness of packing in the structure. Therefore, thedecrease observed in both glass transition and crystallization tem-peratures was probably due to the decrease in number of bonds perunit volume [23].
The ΔT values obtained in the present study were found to beclose to the values reported in the literature by Saddeek [13], how-ever lower than the reported ΔT values by Xudong et al. [15] sincethe glass compositions contain Er2O3 and Yb2O3 as doping agents.
Fig. 6. In situ XRD patterns of the TWB10 sample obtained at different temperatures.
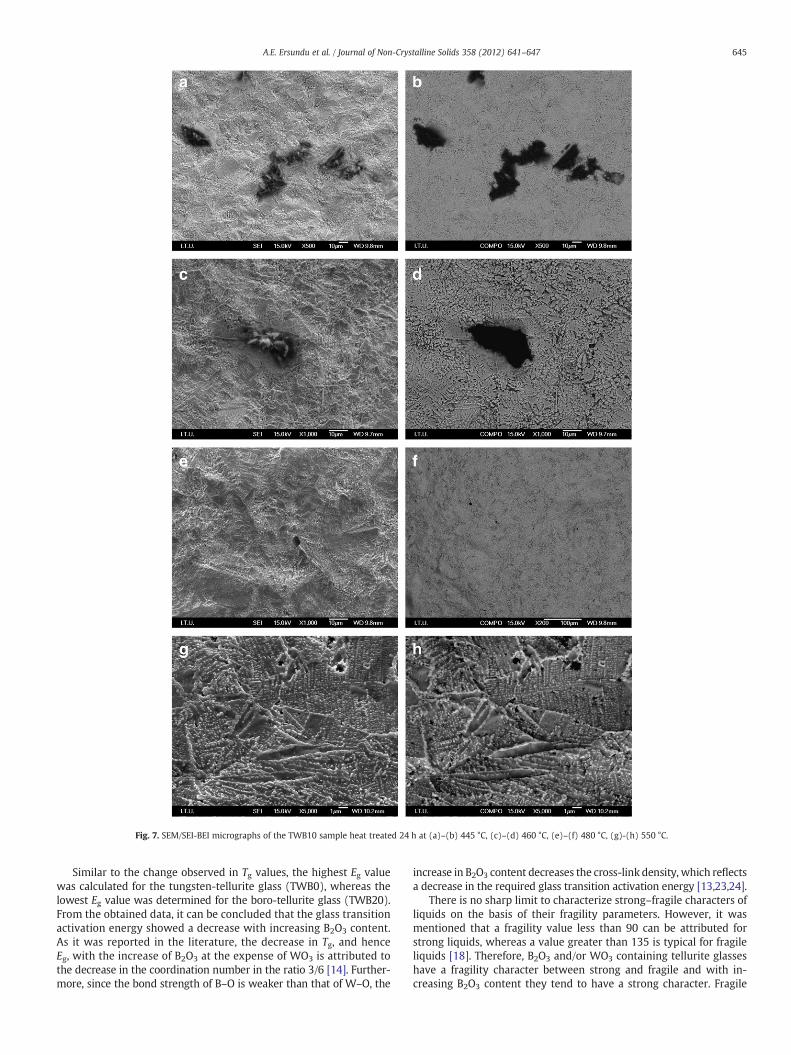
Fig. 7. SEM/SEI-BEI micrographs of the TWB10 sample heat treated 24 h at (a)–(b) 445 °C, (c)–(d) 460 °C, (e)–(f) 480 °C, (g)-(h) 550 °C.
645A.E. Ersundu et al. / Journal of Non-Crystalline Solids 358 (2012) 641–647
Similar to the change observed in Tg values, the highest Eg valuewas calculated for the tungsten-tellurite glass (TWB0), whereas thelowest Eg value was determined for the boro-tellurite glass (TWB20).From the obtained data, it can be concluded that the glass transitionactivation energy showed a decrease with increasing B2O3 content.As it was reported in the literature, the decrease in Tg, and henceEg, with the increase of B2O3 at the expense of WO3 is attributed tothe decrease in the coordination number in the ratio 3/6 [14]. Further-more, since the bond strength of B–O is weaker than that of W–O, the
increase in B2O3 content decreases the cross-link density, which reflectsa decrease in the required glass transition activation energy [13,23,24].
There is no sharp limit to characterize strong–fragile characters ofliquids on the basis of their fragility parameters. However, it wasmentioned that a fragility value less than 90 can be attributed forstrong liquids, whereas a value greater than 135 is typical for fragileliquids [18]. Therefore, B2O3 and/or WO3 containing tellurite glasseshave a fragility character between strong and fragile and with in-creasing B2O3 content they tend to have a strong character. Fragile
646 A.E. Ersundu et al. / Journal of Non-Crystalline Solids 358 (2012) 641–647
liquids are determined with a fast increase in their viscosity and alarge change in their heat capacity as the glass transition temperatureis approached; while the viscosity and heat capacity of strong liquidsshow a small change in the glass transition region [18,19,25].
The decrease in the density values is attributed to the lower mo-lecular weight of B2O3 (69.6 g/mol) compared to WO3 (231.84 g/mol).The measured density values of the glasses are in agreement with thecalculated theoretical density values. The VM values were found todecrease with the substitution of WO3 by B2O3 as the glass structurebecame less dense. The oxygen packing density and oxygen molarvolume showed an increase with the substitution of WO3 by B2O3
due to the formation of more B–O linkages and fewer W–O–W link-ages with increasing B2O3 content.
As seen in Fig. 5, the FTIR spectrum of the tungsten–tellurite glass(TWB0) showed six peaks at 480, 612, 668, 742, 864 and 942 cm−1.The peak at 480 cm−1 is attributed to the stretching vibrations ofTe–O–Te or O–Te–O linkages in between two TeO4 four-coordinateatoms. The envelope of the three characteristic absorption bands at612, 668 and 742 cm−1 corresponds to the stretching vibrations ofTe–O bond in TeO4 and TeO3 units. The peak observed at 864 cm−1
was found to belong to the W–O–W in WO4 or WO6 units and thepeak at 942 cm−1 was assigned to the stretching vibrations of W–O−
and WO bonds associated with WO4 and WO6 units.With the introduction of B2O3 to tellurite glasses new absorp-
tion bands corresponding to the stretching vibrations of B–O unitswas observed in the FTIR spectra in the wavenumber range 915–1350 cm−1. As it was determined for the tungsten-tellurite glass(TWB0), the first four peaks of B2O3 containing tellurite glasses (TWB5,TWB10, TWB15, TWB20) were related to the stretching vibrations ofTe–O units and they shifted to the higher frequencies with increasingB2O3 content. This behavior can be explained due to the transfor-mation of TeO4 units into TeO3 units with the increase in B2O3
content.For the TWB5 sample, two bands corresponding to the W–O units
were detected at lower wavelengths comparing to the TWB0 glassand two new absorption bands related to the stretching vibrationsof B–O units were observed in the spectra. By increasing the B2O3 con-tent to 10 mol%, another band representing B–O stretching vibrationsin BO4 units was detected at 995 cm−1 for TWB10 sample. For TWB15glass, only one peak corresponding to the W–O units was observed at853 cm−1 since the FTIR peak related to the stretching vibrations ofW–O– and W O bonds in WO4 or WO6 units disappeared and anotherFTIR band corresponding to the stretching vibrations of B–O units wasdetected at 924 cm−1. For boro-tellurite glass (TWB20), apart fromthe four absorption bands corresponding to the Te–O units, four ab-sorption bands representing the B–O units were detected. The FTIRbands at 915 and 1018 cm−1 were assigned to the stretching vibra-tions in BO4 units, while the bands at 1230 and 1350 cm−1 werefound to be related to the B–O and B–O– stretching vibrations in BO3
units, respectively.As can be seen from the in-situ XRD patterns of TWB10 sample
(Fig. 6), increasing the temperature from 445 to 480 °C resulted in adecrease in the peak intensities of γ-TeO2 and B2O3 phases, whilethe peak intensities of α-TeO2 and WO3 crystalline phases increased.The reason for detecting only α-TeO2 and WO3 crystalline phases at550 °C, when the thermal equilibrium was achieved, can be explaineddue to the transformation of the metastable γ-TeO2 phase into stableα-TeO2 phase with increasing temperature, which was also observedin our previous studies on different binary and ternary tellurite sys-tems [2,4]. The reason for not detecting the B2O3 phase in the XRDscan at 550 °C is thought to be due to its potential melting behaviorin the structure. Bürger et al. reported the transformation of B2O3
into the liquid phase at around 709 K (436 °C) in the TeO2–B2O3 bina-ry system. Therefore, in our study it is considered that B2O3 phasetransforms into the liquid state above 480 °C. However, this meltingbehavior could not be clearly detected from the DSC measurements
due to several exothermic reactions occurring at around the sametemperature with the melting reaction of B2O3.
The secondary electron micrograph of the TWB10 sample heat-treated at 445 °C showed the presence of a network-like structureconstituting the general matrix and dendritic rod-like crystallites invarious orientations on the general matrix (see Fig. 7a). It wasdetected that irregular dark crystallites were also found to be presenton the surface. By taking the in situ XRD results into account and con-sidering the BEI micrograph (see Fig. 7b) and EDS analysis, it isthought that the network-like structure forming the general matrixcorrespond to the formation of α-TeO2 and WO3 crystalline phases(82.12 at.% Te and 17.88 at.% W). The rod-like crystallites formed onthe general matrix were thought to be related to the γ-TeO2 phaseand they are rich in TeO2 content (95.97 at.% Te), while the irregulardark crystallites were found to be rich in B2O3 (77.75 at.% B) and cor-respond to the B2O3 phase present on the surface.
Similar to the sample heat treated at 445 °C, the SEI and BEI micro-graphs taken from the TWB10 sample heat-treated at 460 °C (seeFig. 7c and d) revealed the presence of the network-like structureon the background forming the general matrix which correspondsto the α-TeO2 and WO3 crystalline phases and the dendritic rod-likecrystallites on the general matrix were related to the existing γ-TeO2
phase in the structure. It was also observed that the dark crystallitescorresponding to the B2O3 phase were still present on the surface.
Fig. 7e and f are the representative SEI and BEI micrographs of theTWB10 sample heat-treated at 480 °C revealing the network-likestructure on the general matrix related to the formation of α-TeO2
and WO3 crystallites and dendritic rod-like crystallites correspondingto the γ-TeO2 phase in the structure. It can be seen that the dark crys-tallites related to the B2O3 phase became smaller in size but still pre-sent in the structure.
The SEI and BEI micrographs of the TWB10 sample heat-treated at550 °C are shown in Fig. 7g and h, respectively. It was observed thatwith increasing temperature, the dendritic rod-like crystallites corre-sponding to the γ-TeO2 phase and dark crystallites related to the B2O3
phase are no longer present in the structure. It was detected that thegrain-like crystallites constituted the general matrix with small whitecrystallites precipitated along the grain boundaries. The EDS spectrataken from the general matrix showed that the grain-like crystallitesare rich in TeO2 content (89.77 at.% Te and 10.23 at.% W) and it isthought that they belong to the α-TeO2 phase. However, the EDSspectra taken from the grain boundaries showed that the WO3 con-tent is almost three times higher along the grain boundaries (71.79at.% Te and 28.21 at.% W) than the grains, which means that thesmall white crystallites are related to the WO3 phase.
6. Conclusion
Characterization of B2O3 and/or WO3 containing tellurite glasseswas realized in the 0.80TeO2 – (0.20-x)WO3 – xB2O3 system(0≤x≤0.20 in molar ratio) through DSC, FTIR, XRD and SEM/EDStechniques. Thermal analysis results revealed that the glass transitionand first crystallization reaction onset temperatures shifted to lowertemperature with increasing B2O3 content and the glass stability valuesshowed a decrease from 98 to 75 °C. The glass transition activation en-ergy calculated from the Kissinger equation and found to be decreasedfrom 598 kJ/mol to 469 kJ/mol with increasing B2O3 content. The fragil-ity parameters showed a decrease from 115 to 92 with increasing B2O3
content and it was determined that B2O3 and/orWO3 containing tellur-ite glasses have a fragility character between strong and fragile and theytend to have a strong character with increasing B2O3 content. Thedensity and molar volume values decreased with the increase inB2O3 content. With the substitution of WO3 by B2O3, the oxygenpacking density and oxygen molar volume showed an increase, asthe glass structure became less dense. FTIR spectroscopy analyses re-alized to investigate the structure of B2O3 and/or WO3 containing
647A.E. Ersundu et al. / Journal of Non-Crystalline Solids 358 (2012) 641–647
tellurite glasses revealed that Te–O, W–O and B–O units are presentin the structure. In situ XRD and SEM/EDS analyses realized to inves-tigate the crystallization behavior of boro–tungsten–tellurite glassesshowed that γ-TeO2, α-TeO2, WO3 and B2O3 crystalline phases werepresent at 445, 460 and 480 °C in the structure. When the thermalequilibrium was achieved at 550 °C, only α-TeO2 and WO3 crystal-line phases were found to exist in the structure due to the transfor-mation of the metastable γ-TeO2 phase into stable α-TeO2 phaseand the transformation of B2O3 into the liquid phase.
Acknowledgement
The authors of this study gratefully acknowledge The Scientific &Technological Research Council of Turkey (TUBITAK) for the financialsupport under the project numbered 108M077. In situ X-ray powderdiffraction measurements were carried out in part in the FrederickSeitz Materials Research Laboratory Central Facilities, University ofIllinois.
References
[1] R.A.H. El-Mallawany, Tellurite Glasses Handbook, CRC Press, Boca Raton/London/New York/Washington, DC, 2002.
[2] A.E. Ersundu, G. Karaduman, M. Çelikbilek, N. Solak, S. Aydin, J. Eur. Ceram. Soc. 30(2010) 3087–3092.
[3] A.E. Ersundu, G. Karaduman, M. Çelikbilek, N. Solak, S. Aydin, J. Alloys Compd. 508(2010) 266–272.
[4] M. Çelikbilek, A.E. Ersundu, N. Solak, S. Aydin, J. Non-Cryst. Solids 357 (2011)88–95.
[5] M. Çelikbilek, A.E. Ersundu, N. Solak, S. Aydin, J. Alloys Compd. 509 (2011)5646–5654.
[6] A.E. Ersundu, M. Çelikbilek, N. Solak, S. Aydin, J. Eur. Ceram. Soc. 31 (2011)2775–2781.
[7] A.I. Sabry, M.M. El-Samanoudy, J. Mater. Sci. 30 (1995) 3930–3935.[8] H. Bürger, W. Vogel, V. Kozhukharov, M. Marinov, J. Mater. Sci. 9 (1984) 403–412.[9] S. Blanchandin, P. Marchet, P. Thomas, J.C. Champarnaud-Mesjard, B. Frit, A.
Chagraoui, J. Mater. Sci. 34 (1999) 4285–4292.[10] T. Kosuge, Y. Benino, V. Dimitrov, R. Sato, T. Komatsu, J. Non-Cryst. Solids 242
(1998) 154–164.[11] I. Shaltout, Y. Tang, R. Braunstein, A.M. Abu-Elazm, J. Phys. Chem. Solids 56 (1994)
141–150.[12] M.L. Öveçoğlu, G. Özen, S. Cenk, J. Eur. Ceram. Soc. 26 (2006) 1149–1158.[13] Y.B. Saddeek, Philos. Mag. 89 (2009) 41–54.[14] K.A. Aly, Y.B. Saddeek, A. Dahshan, Philos. Mag. 90 (2010) 429–4441.[15] Z. Xudong, X. Tiefeng, N. Qiuhua, D. Shixun, S. Xiang, J. Rare Earth 24 (2006)
771–776.[16] H.E. Kissinger, J. Res. Nat. Bur. Stand. 57 (1956) 217–221.[17] A.A. Elabbar, J. Alloys Compd. 476 (2009) 125–129.[18] D. Zhu, C.S. Ray, W. Zhou, D.E. Day, J. Non-Cryst. Solids 319 (2003) 247–256.[19] R. Brüning, M. Sutton, J. Non-Cryst. Solids 205–207 (1996) 480–484.[20] D. Munoz-Martín, M.A. Villegas, J. Gonzalo, J.M. Fernández-Navarro, J. Eur. Ceram.
Soc. 29 (2009) 2903–2913.[21] S. Rada, E. Culea, M. Rada, P. Pascuta, V. Maties, J. Mater. Sci. 44 (2009)
3235–3240.[22] G. Upender, S. Bharadwaj, A.M. Awasthi, V.C. Mouli, Mater. Chem. Phys. 118
(2009) 298–302.[23] R.A.H. El-Mallawany, I.A. Ahmed, J. Mater. Sci. 43 (2008) 5131–5138.[24] D. Lide, Handbook of Chemistry and Physics, Boca Raton, FL, CRC Press, 2004.[25] I.S. Voivod, P.H. Poole, F. Sciortino, Nature 412 (2001) 514–517.