characterisation of the sol?gel process in the superconducting ndba2cu3o7?y system
TRANSCRIPT
Characterisation of the sol–gel process in the superconductingNdBa2Cu3O72y system{
B. Schoofs,*a D. Van de Vyver,a P. Vermeir,ab J. Schaubroeck,b S. Hoste,a G. Hermana and I. Van Driesschea
Received 28th September 2006, Accepted 20th December 2006
First published as an Advance Article on the web 6th February 2007
DOI: 10.1039/b614149h
The objective of this paper is to obtain a better insight into the sol–gel mechanism of water-based
precursors for the development of thin NdBa2Cu3O72y (NBCO) superconducting films. The
influence of metal complexation behaviour on the formation of transparent and homogenous gels
after the combination of different metal salts and ligands has been studied for several metal salts
(Cu2+, Nd3+ and Ba2+). Two inorganic aqueous sol–gel precursors have been studied: a metal
nitrate–citric acid-based and a metal acetate–triethanolamine-based solution. The characteristics
of the precursor solution are based on the determination of the stability constants by the
computer program Superquad. The prediction of the complex stability in this solution was related
to the complexation of the three metal ions (Cu2+, Nd3+ and Ba2+) with a certain ligand.
IR-spectroscopy was used for the determination of the gel. This resulted in a better understanding
of the composition of the solution and could be used for preparation of more stable sol–gel
precursors for the synthesis of homogeneous end products. These sol–gel systems were used for
the deposition of highly textured superconducting thin films on SrTiO3 substrates by dip-coating.
Using detailed thermal analysis, it is shown that the morphology of the films can be optimised by
adjusting the parameters during thermal treatment, resulting in dense and highly textured thin
films. Special attention is given to the microstructure of the thin film because of its relevance to
the superconducting transport properties of the coated conductor system.
1 Introduction
A large number of synthetic routes for the preparation of
(RE)1Ba2Cu3O72y (123) superconducting oxides are reported
in the literature (RE = rare earth).1 The normal state and
superconducting properties of polycrystalline (123) materials
and textured (123) thin films depend on the morphology,
which is in turn determined by the preparative methods.
The use of sol–gel techniques to prepare glasses and electro-
ceramics has received increasing interest during the last
decade. The sol–gel process has become an attractive technique
for the preparation of oxide ceramics with a great variety of
chemical compositions, because of the possibility of producing
very homogeneous multi-component materials at temperatures
much lower than used in melt-based procedures.2 Most
industrial processes are based on inorganic precursors, such
as metal salts in aqueous solutions. Such precursors are much
cheaper and easier to handle than metal alkoxides in organic
solvents. The sol–gel process involves the evolution of
inorganic networks through the formation of a colloidal
suspension (sol) and gelation of the sol to form a three-
dimensional network in a continuous liquid phase (gel). From
a chemical point of view, sol–gel chemistry is based on the
hydrolysis and condensation of metal complexes (Fig. 1).3 In
the aqueous method described in this work, the metal salts are
dissolved in water with formation of unstable metal aqua
complexes. Fast hydrolysis of these species will then lead to
precipitation of metal hydroxides. To prevent this, the rate of
hydrolysis needs to be controlled by adding complexing agents,
leading to the formation of metal chelates and thus, stabilisa-
tion of the precursor solution.
By slow evaporation of the solvent (water), condensation of
these complexes will take place, leading to the formation of a
homogenous gel network. It can be seen that this condensation
mechanism requires stable M–OH species and therefore it will
only occur with a judicious selection of several parameters: i)
the value of pH, depending on the metal source, ii) the choice
of complexing agent and iii) the metal to complexing agent
aDepartment of Inorganic and Physical Chemistry, Ghent University,Krijgslaan 281 (S3), 9000 Ghent, BelgiumbDepartment of Industrial Sciences, Hogeschool Ghent, AssociationGhent University, Jozef Kluyskensstraat 2, 9000 Ghent, Belgium.E-mail: [email protected]{ Electronic supplementary information (ESI) available: Additionaltables and figures. See DOI: 10.1039/b614149h.
Fig. 1 Sol–gel reactions (with M = Metal, z = positive charge, m =
negative charge, A = complexing agent)
PAPER www.rsc.org/materials | Journal of Materials Chemistry
1714 | J. Mater. Chem., 2007, 17, 1714–1724 This journal is � The Royal Society of Chemistry 2007
ratio. For our sol–gel precursors, it should also be mentioned
that the function of a complexing agent is twofold: i)
stabilising the precursor solution through formation of
metal hydroxo complexes and ii) acting as a driving force for
the gelation because these hydroxo complexes benefit the
condensation process. Since the quality assurance of the final
product is dependent on the homogeneity and the bonding
behaviour of the metal complexes within the sol and the gel,
a systematic study of the properties of the gels derived
from varying operational parameters has been undertaken in
this paper.4
The paper describes the collection of these data using
potentiometric titration curves and SUPERQUAD software
instead of estimating them from experimental trial-and-error
synthesis. These data lead to a better understanding of the
composition for each solution and can be used for the prepara-
tion of more stable sol–gel precursors for the synthesis of
homogenous end products. The conversion into a gel network
was studied using IR spectroscopy.
In this way, the chemistry of two water-based sol–gel routes
is described in detail, both starting from different metal salts
(acetates and nitrates) and different complexing agents
(triethanolamine and citric acid). From these solutions, both
bulk NBCO material and thin NBCO films on SrTiO3 were
prepared and analysed using TGA–DTA–MS measurements
to study the thermal decomposition behaviour of the gel
network. Texture analysis of the NBCO layers was performed
using XRD scanning and SEM imaging. Electrical resistivity
measurements were applied to determine the critical transition
temperature of the superconductor.
2 Experimental
2.1 Reagents
All reagents were of analytical grade and used as received.
Distilled and deionised water (Milli-Q quality, specific
conductance , 0.05 mS cm21) was used throughout for all
solutions.
Titrisol ampoules were used to obtain carbonate-free
potassium hydroxide solutions (# 0.2 M). The metal-ion
stock-solution was prepared from metal nitrate and was
standardised by titration with the disodium salt of ethylene-
diaminetetraacetic acid (EDTA) in the presence of a small
amount of the Hg(EDTA) complex using appropriate condi-
tions and electrodes (mercury and calomel).5 All final solutions
for the potentiometric and spectrophotometric titrations were
made up to an ionic strength of 0.1 M with KNO3.
2.2 Synthesis
Based on experimental results, two water-based inorganic
NBCO sol–gel precursors were prepared. The stability and
thus homogeneity of these solutions was studied using
potentiometric measurements.
2.2.1 Metal acetate–triethanolamine (TEA) route. Nd , Ba
and Cu acetates (Nd(CH3COO)3?4H2O, Ba(CH3COO)2 and
Cu(CH3COO)2?1H2O) are dissolved in a 4 : 1 water–acetic
acid mixture with a total metal concentration of 0.6 M. After
refluxing at 90 uC for 6 h, a clear blue solution is obtained. To
25 ml of this solution, 3 ml of triethanolamine (98%) as a
complexing agent is added while stirring. The solution is
allowed to cool, then the pH of the solution is adjusted to 5
using ammonia. After water is evaporated slowly at 60 uC, a
clear blue, homogenous, viscous gel is formed. This sol–gel
precursor solution can be stored for 2 weeks. After this period,
precipitation of large blue crystals appears. As these pre-
cipitates can lead to off-stoichiometric phase formation
and impurities in the final oxide film, the stability of this
solution was analysed using potentiometric titration curves, as
described in Section 3.
2.2.2 Metal nitrate–citrate route. Nd , Ba and Cu nitrates
(Nd(NO3)3?6H2O, Ba(NO3)2 and Cu(NO3)2?3H2O) were dis-
solved in water with a total metal concentration of 0.6 M.
Then citric acid is added as a complexing agent in a ratio of
metal ion to citric acid of 1 : 3. The pH is adjusted to 7 using
ammonia. After water is slowly evaporated at 60 uC, a glassy
state, homogenous gel is formed. This NBCO precursor
solution can be stored for several months but using the results
of potentiometric titration curves, a further optimisation of
this precursor will be described in Section 3.
To prepare superconducting bulk material via powder
synthesis, the precursor gels were decomposed at 880 uC and
pressed into pellets before being sintered at 990 uC for 30 h in a
1% O2/Ar reduced oxygen atmosphere. The final step consists
of annealing in pure oxygen at 400 uC for 20 h.
To produce thin films on polished and cleaned SrTiO3 (001)
single crystals, the precursor gels were dip-coated at room
temperature at a speed of 170 mm min21 in a class 10 000
clean room. After gelling at 60 uC for 3 h, these amorphous
layers were converted to dense, crystalline NBCO films at
990 uC for 6 h in a 1% O2/Ar atmosphere. The final step
consists of annealing at 400 uC in pure oxygen for 5 h.
2.3 Characterisation techniques
2.3.1 Potentiometric measurements. The potentiometric
measurements were performed with standard dilute KOH
using a Schott pH meter and a 5 ml Schott T-burette (total
volume). The pH meter was connected with a Schott H2680
glass electrode and a Schott B3410 calomel electrode with a
second salt bridge filled with 0.1 M KNO3. Each aqueous
system under consideration was measured in a 100 ml
jacketed cell thermostatted at 25 uC ¡ 0.1 uC by a refrigerated,
circulated water bath. All systems were studied under
anaerobic conditions, established by a stream of pre-saturated
nitrogen, obtained by bubbling the inert gas through a 0.1 M
KNO3 solution. The ionic strength was adjusted to 0.10 M
by the addition of KNO3 as supporting electrolyte. The
concentrations of all the experimental ligand solutions were in
the range of 1.0 6 1023 M. The program Titrate, slightly
modified, was used to monitor the titration.6
The titration data were processed using Gran’s method7
in order to calculate the standard cell potential (Eu), the
dissociation constant of water (Kw), together with the
correction terms for changes in the liquid junction potential
in strong acid medium, aj (2log[H+] , 2.5), and for the
This journal is � The Royal Society of Chemistry 2007 J. Mater. Chem., 2007, 17, 1714–1724 | 1715
non-linear electrode response in a strong alkaline medium,
bj (2log[H+] . 11.5), as described previously.
Experimental runs were performed by adding increments
of standard base to a ligand solution containing an excess of
HNO3.
For each chemical species MpLqHr in the solution equilibria
there is its formation constant, which is expressed (charges
were omitted for simplicity) as follows:
bpgr~MqLpHr
� �
M½ �p L½ �q H½ �r
Because the thermodynamic definition of a formation
constant utilises activities (and not concentrations, as given
above), the quotient of the activity coefficients was kept
constant by performing the experiments in a medium of
constant ionic strength by adding potassium nitrate.
The stability constants of several aqueous species were
calculated by Superquad using a numerical analysis of all
experimental titration data.8,9 These data were evaluated by
testing a number of chemically acceptable complexation
models. These models not only consist of metal ion–ligand
complexes (MpLqHr) with r = 0), also some protonated
complexes (r . 0) and hydroxo complexes (r , 0) can appear.
After successive attempts, the best models were selected
according to the best agreement between observed and
calculated data by means of an accurate statistic analysis of
the global s-value for the refinement, by goodness of fit (x2)
and by the standard deviation of each formation constant as
calculated by Superquad. The simulated titration curves and
species distribution diagrams for each given set of aqueous
species were computed from the equilibrium constants with the
program Equil.10
2.3.2 IR spectra. IR spectra (4000–400 cm21) of the gel
samples were taken in KBr pellets at room temperature using a
Mattson Unicam FTIR spectrometer. Each measurement ran
over 64 scans, at a resolution of 4 cm21.
2.3.3 Other techniques. The thermal decomposition beha-
viour of the gel network was investigated separately by TGA–
DTA measurements (Stanton–Redcroft STA 1500) on bulk
samples with the same composition as the dip-coated layers.
The microstructure of the deposited layers was characterised
by X-ray diffraction (XRD; Siemens D5000, CuKa) using h–2h
geometry in combination with pole figures for determination
of the degree of biaxial texturation of the layer. The overall
morphology of the thin films was characterised by optical
microscopy (Leitz) and SEM (Philips 501). Local defects in the
layer and orientation of the material at the substrate–layer
interface were identified using high resolution TEM measure-
ments (Jeol JEM 3010). The critical temperature of the
superconductive layers was determined by resistivity measure-
ments using a custom-made four-point test device (Keithley).
3 Results and discussion
3.1 Potentiometric results
3.1.1 Acetate and triethanolamine system. TEA is a hydro-
philic ligand with a nitrogen donor atom substituted with three
side arms bearing OH-groups. Because of its chelating ability,
this ligand generally forms monomeric tricyclic structures that
are water-soluble (Fig. S1, ESI{).11 The TEA complexes were
formed by the reaction of TEA and the metal salt in water.
i. Protonation constants of triethanolamine (TEA). The
potentiometric equilibrium curve of TEA?HNO3 was found
to possess an inflection at a = 1 (where a = mol of base added/
mol of ligand), which corresponds to the completion of the
neutralisation of the ammonium ion. The inflection at a = 0
matches the end of the neutralisation of the excess HNO3
added to the ligand solution. The protonation constant
obtained for TEA is listed in Table S1, ESI{.
ii. Cu(II) TEA complexes. The complexometric titrations with
Cu(II) were performed in four different molar ratios (1 : 1, 1 : 2,
1 : 3 and 1 : 4). Due to the coordinative properties of the metal
ion and the structure of the ligand, the metal ion being
surrounded by a maximum of two ligands was suggested. The
potentiometric equilibrium curve for the 1 : 1 Cu2+/TEA
titration shows an inflection point at a = 3, corresponding to
the formation of a mononuclear dihydroxo Cu(II) complex.
The Cu(II) complexation curve indicates a good complexation
strength because the curve profile is under the ligand
deprotonation curve after titration of the strong acid HNO3
(a . 0). The chemical model was further refined with three
other mononuclear species. The equilibrium curves for the
other molar ratios show inflection points at a = 2, 1.68 and
1.50. All of these inflections refer to the formation of the same
mononuclear dihydroxo Cu(II) complex, followed by a proton
neutralization step, corresponding to deprotonation of the
excess ligand in the solution. Dinuclear Cu(II) complexes
were all rejected by Superquad. These four different titrations
result in a chemical model of four mononuclear Cu(II) species
(Table S2, ESI{). This chemical model differs from the model
characterised by Bjerrum et al.12 and Hancock et al.,13 which
also includes ML2 hydroxo and M2L2 hydroxo species.
The corresponding species distribution diagrams only differ
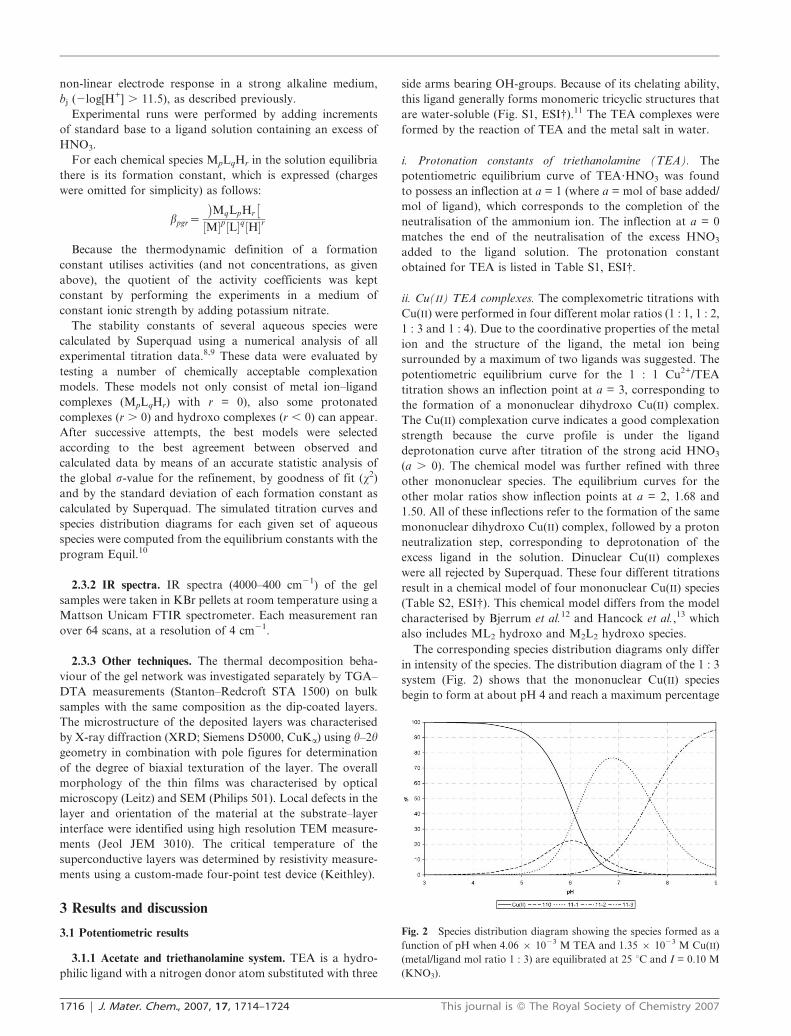
in intensity of the species. The distribution diagram of the 1 : 3
system (Fig. 2) shows that the mononuclear Cu(II) species
begin to form at about pH 4 and reach a maximum percentage
Fig. 2 Species distribution diagram showing the species formed as a
function of pH when 4.06 6 1023 M TEA and 1.35 6 1023 M Cu(II)
(metal/ligand mol ratio 1 : 3) are equilibrated at 25 uC and I = 0.10 M
(KNO3).
1716 | J. Mater. Chem., 2007, 17, 1714–1724 This journal is � The Royal Society of Chemistry 2007
of 22% at a pH of 6. Other complexes that form as the pH is
further increased are CuLOH+, CuL(OH)2 and CuL(OH)32.
The hydroxo Cu(II) complexes form at and above pH 5.0,
and are significant species at higher pH. The monohydroxo
complex was formed in the region between pH 5–10 and lead
to a maximum of 76%. A further increase in pH leads to the
replacement of another water molecule to form the dihydroxy
species with a peak maximum of 95% at a pH of 9.
A possible Cu(II) complex configuration uses the nitrogen
and the three oxygen donor atoms of TEA. The preference of
the Cu(II) ion for fivefold instead of sixfold coordination,
which occurs for other cations of comparable charge and size,
results from a Jahn–Teller destabilisation of the octahedral
complex.14 Three donor atoms must be located in the
equatorial plane, but one has to be located axial. Elongation
through the z-axis is therefore difficult and this leads to a
decrease in complexation strength. The other coordination site
is occupied by a water molecule, which will be replaced with
increasing pH by a hydroxide ion. Another possibility is the
deprotonation of the alcohol groups with increasing basicity,
but a potentiometric measurement alone cannot give any
confirmation for this chemical concept.
iii. Ba(II) TEA complexes. The thermodynamic stability of
complexes of Ba(II) with TEA are too weak to determine
stability constant values (logb = 0.36).
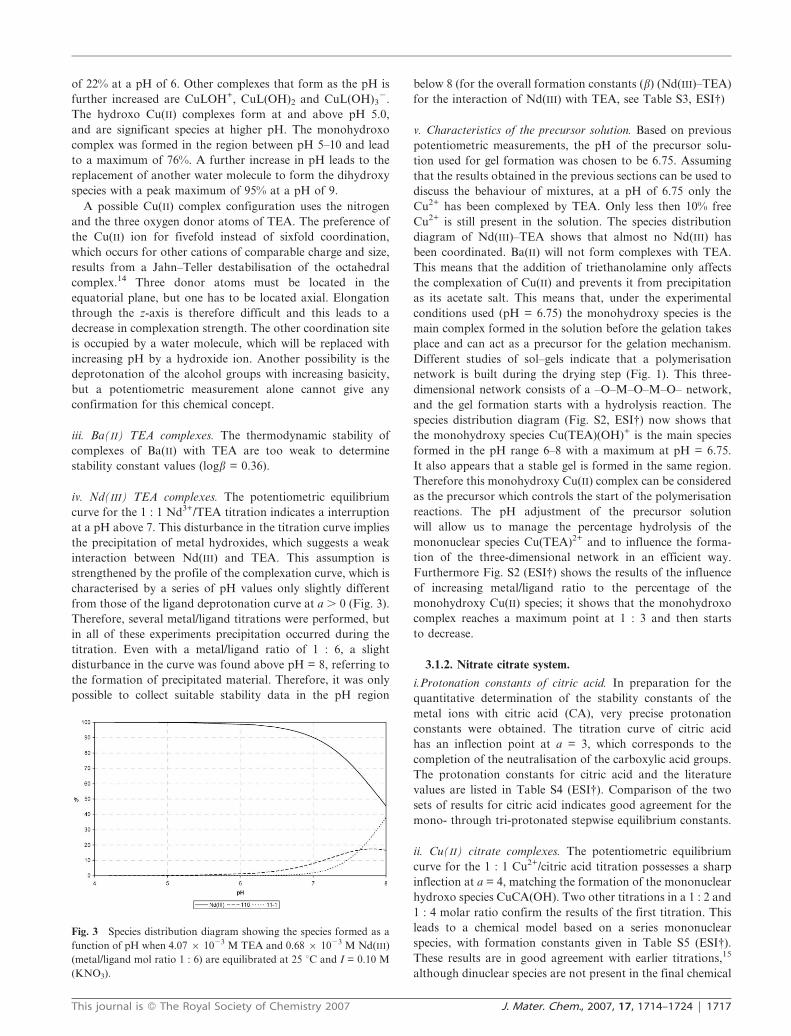
iv. Nd(III) TEA complexes. The potentiometric equilibrium
curve for the 1 : 1 Nd3+/TEA titration indicates a interruption
at a pH above 7. This disturbance in the titration curve implies
the precipitation of metal hydroxides, which suggests a weak
interaction between Nd(III) and TEA. This assumption is
strengthened by the profile of the complexation curve, which is
characterised by a series of pH values only slightly different
from those of the ligand deprotonation curve at a . 0 (Fig. 3).
Therefore, several metal/ligand titrations were performed, but
in all of these experiments precipitation occurred during the
titration. Even with a metal/ligand ratio of 1 : 6, a slight
disturbance in the curve was found above pH = 8, referring to
the formation of precipitated material. Therefore, it was only
possible to collect suitable stability data in the pH region
below 8 (for the overall formation constants (b) (Nd(III)–TEA)
for the interaction of Nd(III) with TEA, see Table S3, ESI{)
v. Characteristics of the precursor solution. Based on previous
potentiometric measurements, the pH of the precursor solu-
tion used for gel formation was chosen to be 6.75. Assuming
that the results obtained in the previous sections can be used to
discuss the behaviour of mixtures, at a pH of 6.75 only the
Cu2+ has been complexed by TEA. Only less then 10% free
Cu2+ is still present in the solution. The species distribution
diagram of Nd(III)–TEA shows that almost no Nd(III) has
been coordinated. Ba(II) will not form complexes with TEA.
This means that the addition of triethanolamine only affects
the complexation of Cu(II) and prevents it from precipitation
as its acetate salt. This means that, under the experimental
conditions used (pH = 6.75) the monohydroxy species is the
main complex formed in the solution before the gelation takes
place and can act as a precursor for the gelation mechanism.
Different studies of sol–gels indicate that a polymerisation
network is built during the drying step (Fig. 1). This three-
dimensional network consists of a –O–M–O–M–O– network,
and the gel formation starts with a hydrolysis reaction. The
species distribution diagram (Fig. S2, ESI{) now shows that
the monohydroxy species Cu(TEA)(OH)+ is the main species
formed in the pH range 6–8 with a maximum at pH = 6.75.
It also appears that a stable gel is formed in the same region.
Therefore this monohydroxy Cu(II) complex can be considered
as the precursor which controls the start of the polymerisation
reactions. The pH adjustment of the precursor solution
will allow us to manage the percentage hydrolysis of the
mononuclear species Cu(TEA)2+ and to influence the forma-
tion of the three-dimensional network in an efficient way.
Furthermore Fig. S2 (ESI{) shows the results of the influence
of increasing metal/ligand ratio to the percentage of the
monohydroxy Cu(II) species; it shows that the monohydroxo
complex reaches a maximum point at 1 : 3 and then starts
to decrease.
3.1.2. Nitrate citrate system.
i.Protonation constants of citric acid. In preparation for the
quantitative determination of the stability constants of the
metal ions with citric acid (CA), very precise protonation
constants were obtained. The titration curve of citric acid
has an inflection point at a = 3, which corresponds to the
completion of the neutralisation of the carboxylic acid groups.
The protonation constants for citric acid and the literature
values are listed in Table S4 (ESI{). Comparison of the two
sets of results for citric acid indicates good agreement for the
mono- through tri-protonated stepwise equilibrium constants.
ii. Cu(II) citrate complexes. The potentiometric equilibrium
curve for the 1 : 1 Cu2+/citric acid titration possesses a sharp
inflection at a = 4, matching the formation of the mononuclear
hydroxo species CuCA(OH). Two other titrations in a 1 : 2 and
1 : 4 molar ratio confirm the results of the first titration. This
leads to a chemical model based on a series mononuclear
species, with formation constants given in Table S5 (ESI{).
These results are in good agreement with earlier titrations,15
although dinuclear species are not present in the final chemical
Fig. 3 Species distribution diagram showing the species formed as a
function of pH when 4.07 6 1023 M TEA and 0.68 6 1023 M Nd(III)
(metal/ligand mol ratio 1 : 6) are equilibrated at 25 uC and I = 0.10 M
(KNO3).
This journal is � The Royal Society of Chemistry 2007 J. Mater. Chem., 2007, 17, 1714–1724 | 1717
model. It is apparent from the species distribution diagram
that the mononuclear Cu(II) species begin to form at a pH , 3.
It is interesting to note that a protonated metal complex was
found in the theoretically accepted model. As the mononuclear
complex is formed the three acidic protons of the carboxylic
groups are all deprotonated. With further increasing pH, the
hydroxo Cu(II) complex is being formed and is the dominating
species at higher pH (pH . 5). This hydrolysis mechanism
is described using the distribution curves of Cu(II) with citric
acid as the ligand. The importance of this hydroxo complex is
clear, and has the same precursor function as described in the
TEA system.
iii. Nd(III) citrate complexes. The complexation of Nd(III) with
citric acid was studied in a 1 : 1, 1 : 2 and 1 : 4 metal/ligand mol
ratio. The overall results are published in Table S6 (ESI{). The
metal ion Nd(III) forms mononuclear and polynuclear com-
plexes. The simulated distribution diagram shows a dominant
ML2 complex species in the pH region 3–8. With increasing
pH, polynuclear hydroxo complexes become more important.
iv. Ba(II) citrate complexes. Ba(II) gives rise to a weaker
complexation in comparison with Cu(II) and Nd(III). The
complexation of Ba(II) with citric acid will lead to mono-
nuclear complexes, with a stability constant of 2.55,15 resulting
in a decrease of the free Ba2+ concentration of 40%. Because of
the lower stability constant of the Ba(II) citric acid complexes,
related to Cu(II) and Nd(III) complexes, these phenomena will
be of less importance in the optimisation of stable precursor
solutions.
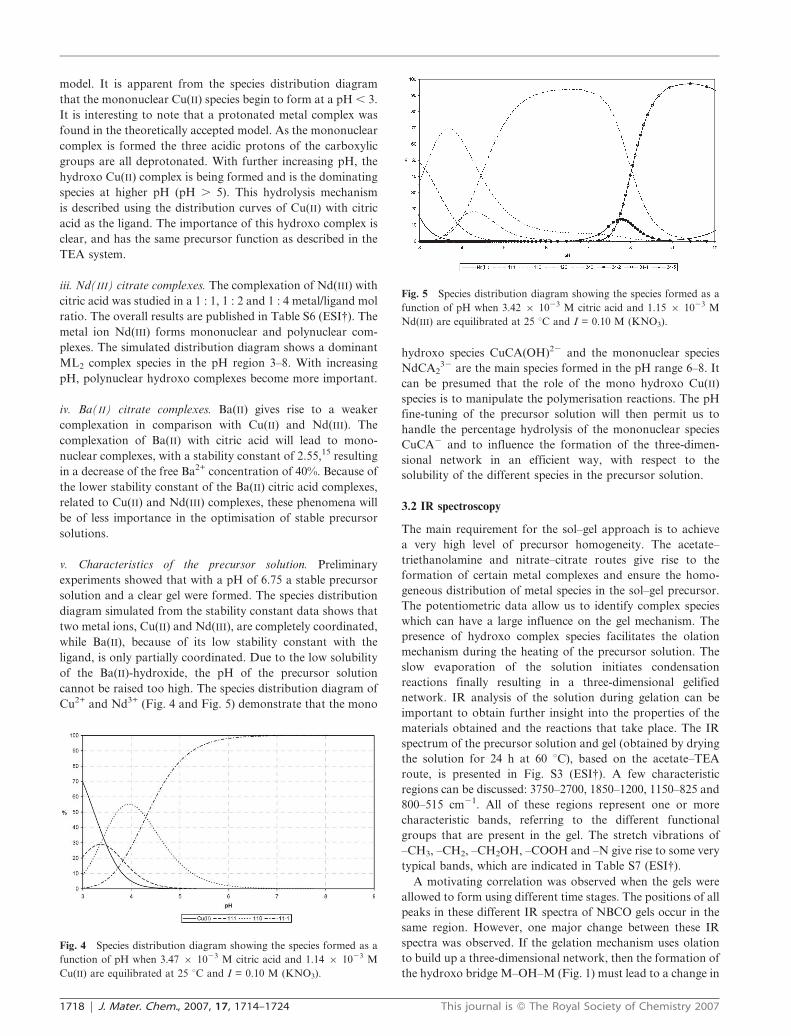
v. Characteristics of the precursor solution. Preliminary
experiments showed that with a pH of 6.75 a stable precursor
solution and a clear gel were formed. The species distribution
diagram simulated from the stability constant data shows that
two metal ions, Cu(II) and Nd(III), are completely coordinated,
while Ba(II), because of its low stability constant with the
ligand, is only partially coordinated. Due to the low solubility
of the Ba(II)-hydroxide, the pH of the precursor solution
cannot be raised too high. The species distribution diagram of
Cu2+ and Nd3+ (Fig. 4 and Fig. 5) demonstrate that the mono
hydroxo species CuCA(OH)22 and the mononuclear species
NdCA232 are the main species formed in the pH range 6–8. It
can be presumed that the role of the mono hydroxo Cu(II)
species is to manipulate the polymerisation reactions. The pH
fine-tuning of the precursor solution will then permit us to
handle the percentage hydrolysis of the mononuclear species
CuCA2 and to influence the formation of the three-dimen-
sional network in an efficient way, with respect to the
solubility of the different species in the precursor solution.
3.2 IR spectroscopy
The main requirement for the sol–gel approach is to achieve
a very high level of precursor homogeneity. The acetate–
triethanolamine and nitrate–citrate routes give rise to the
formation of certain metal complexes and ensure the homo-
geneous distribution of metal species in the sol–gel precursor.
The potentiometric data allow us to identify complex species
which can have a large influence on the gel mechanism. The
presence of hydroxo complex species facilitates the olation
mechanism during the heating of the precursor solution. The
slow evaporation of the solution initiates condensation
reactions finally resulting in a three-dimensional gelified
network. IR analysis of the solution during gelation can be
important to obtain further insight into the properties of the
materials obtained and the reactions that take place. The IR
spectrum of the precursor solution and gel (obtained by drying
the solution for 24 h at 60 uC), based on the acetate–TEA
route, is presented in Fig. S3 (ESI{). A few characteristic
regions can be discussed: 3750–2700, 1850–1200, 1150–825 and
800–515 cm21. All of these regions represent one or more
characteristic bands, referring to the different functional
groups that are present in the gel. The stretch vibrations of
–CH3, –CH2, –CH2OH, –COOH and –N give rise to some very
typical bands, which are indicated in Table S7 (ESI{).
A motivating correlation was observed when the gels were
allowed to form using different time stages. The positions of all
peaks in these different IR spectra of NBCO gels occur in the
same region. However, one major change between these IR
spectra was observed. If the gelation mechanism uses olation
to build up a three-dimensional network, then the formation of
the hydroxo bridge M–OH–M (Fig. 1) must lead to a change in
Fig. 4 Species distribution diagram showing the species formed as a
function of pH when 3.47 6 1023 M citric acid and 1.14 6 1023 M
Cu(II) are equilibrated at 25 uC and I = 0.10 M (KNO3).
Fig. 5 Species distribution diagram showing the species formed as a
function of pH when 3.42 6 1023 M citric acid and 1.15 6 1023 M
Nd(III) are equilibrated at 25 uC and I = 0.10 M (KNO3).
1718 | J. Mater. Chem., 2007, 17, 1714–1724 This journal is � The Royal Society of Chemistry 2007
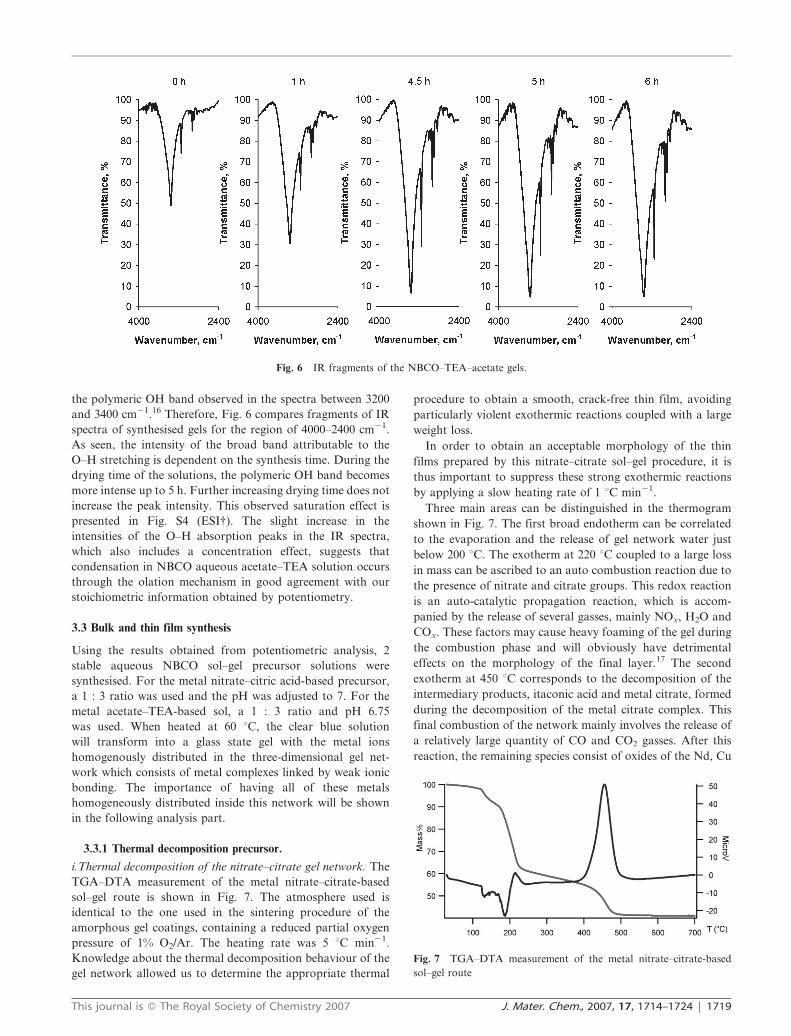
the polymeric OH band observed in the spectra between 3200
and 3400 cm21.16 Therefore, Fig. 6 compares fragments of IR
spectra of synthesised gels for the region of 4000–2400 cm21.
As seen, the intensity of the broad band attributable to the
O–H stretching is dependent on the synthesis time. During the
drying time of the solutions, the polymeric OH band becomes
more intense up to 5 h. Further increasing drying time does not
increase the peak intensity. This observed saturation effect is
presented in Fig. S4 (ESI{). The slight increase in the
intensities of the O–H absorption peaks in the IR spectra,
which also includes a concentration effect, suggests that
condensation in NBCO aqueous acetate–TEA solution occurs
through the olation mechanism in good agreement with our
stoichiometric information obtained by potentiometry.
3.3 Bulk and thin film synthesis
Using the results obtained from potentiometric analysis, 2
stable aqueous NBCO sol–gel precursor solutions were
synthesised. For the metal nitrate–citric acid-based precursor,
a 1 : 3 ratio was used and the pH was adjusted to 7. For the
metal acetate–TEA-based sol, a 1 : 3 ratio and pH 6.75
was used. When heated at 60 uC, the clear blue solution
will transform into a glass state gel with the metal ions
homogenously distributed in the three-dimensional gel net-
work which consists of metal complexes linked by weak ionic
bonding. The importance of having all of these metals
homogeneously distributed inside this network will be shown
in the following analysis part.
3.3.1 Thermal decomposition precursor.
i.Thermal decomposition of the nitrate–citrate gel network. The
TGA–DTA measurement of the metal nitrate–citrate-based
sol–gel route is shown in Fig. 7. The atmosphere used is
identical to the one used in the sintering procedure of the
amorphous gel coatings, containing a reduced partial oxygen
pressure of 1% O2/Ar. The heating rate was 5 uC min21.
Knowledge about the thermal decomposition behaviour of the
gel network allowed us to determine the appropriate thermal
procedure to obtain a smooth, crack-free thin film, avoiding
particularly violent exothermic reactions coupled with a large
weight loss.
In order to obtain an acceptable morphology of the thin
films prepared by this nitrate–citrate sol–gel procedure, it is
thus important to suppress these strong exothermic reactions
by applying a slow heating rate of 1 uC min21.
Three main areas can be distinguished in the thermogram
shown in Fig. 7. The first broad endotherm can be correlated
to the evaporation and the release of gel network water just
below 200 uC. The exotherm at 220 uC coupled to a large loss
in mass can be ascribed to an auto combustion reaction due to
the presence of nitrate and citrate groups. This redox reaction
is an auto-catalytic propagation reaction, which is accom-
panied by the release of several gasses, mainly NOx, H2O and
COx. These factors may cause heavy foaming of the gel during
the combustion phase and will obviously have detrimental
effects on the morphology of the final layer.17 The second
exotherm at 450 uC corresponds to the decomposition of the
intermediary products, itaconic acid and metal citrate, formed
during the decomposition of the metal citrate complex. This
final combustion of the network mainly involves the release of
a relatively large quantity of CO and CO2 gasses. After this
reaction, the remaining species consist of oxides of the Nd, Cu
Fig. 6 IR fragments of the NBCO–TEA–acetate gels.
Fig. 7 TGA–DTA measurement of the metal nitrate–citrate-based
sol–gel route
This journal is � The Royal Society of Chemistry 2007 J. Mater. Chem., 2007, 17, 1714–1724 | 1719
and Ba metal ions. These metal oxides then convert to the
desired NBCO phase at the sintering temperature of 940 uC.
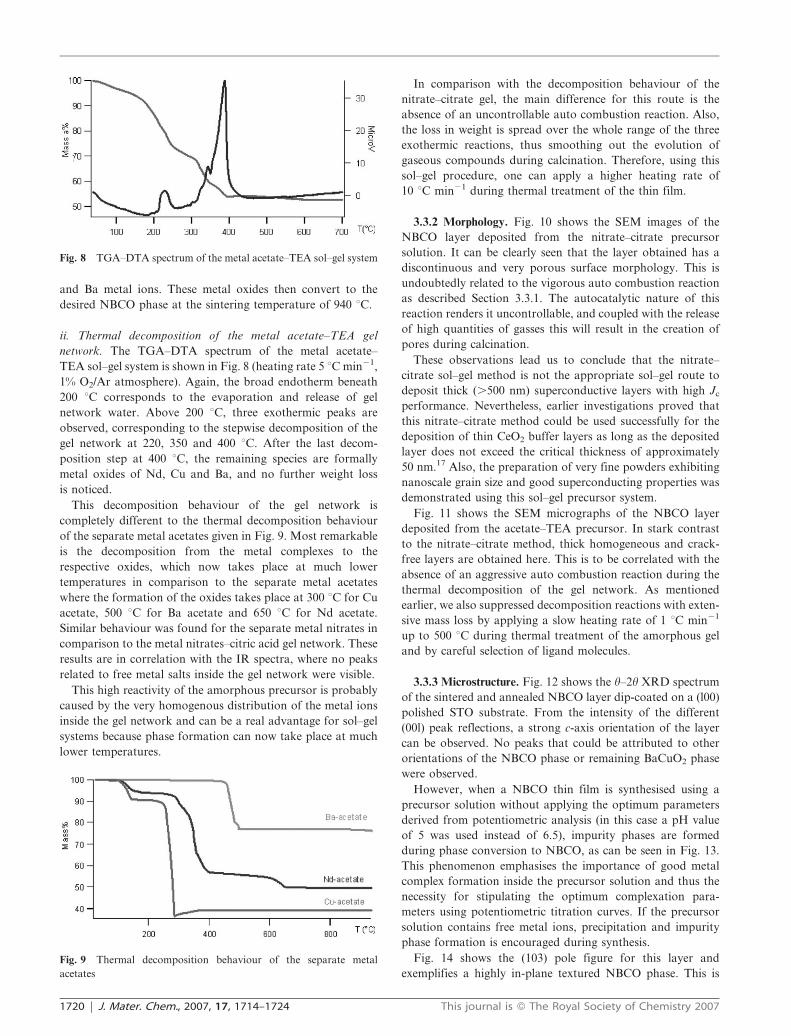
ii. Thermal decomposition of the metal acetate–TEA gel
network. The TGA–DTA spectrum of the metal acetate–
TEA sol–gel system is shown in Fig. 8 (heating rate 5 uC min21,
1% O2/Ar atmosphere). Again, the broad endotherm beneath
200 uC corresponds to the evaporation and release of gel
network water. Above 200 uC, three exothermic peaks are
observed, corresponding to the stepwise decomposition of the
gel network at 220, 350 and 400 uC. After the last decom-
position step at 400 uC, the remaining species are formally
metal oxides of Nd, Cu and Ba, and no further weight loss
is noticed.
This decomposition behaviour of the gel network is
completely different to the thermal decomposition behaviour
of the separate metal acetates given in Fig. 9. Most remarkable
is the decomposition from the metal complexes to the
respective oxides, which now takes place at much lower
temperatures in comparison to the separate metal acetates
where the formation of the oxides takes place at 300 uC for Cu
acetate, 500 uC for Ba acetate and 650 uC for Nd acetate.
Similar behaviour was found for the separate metal nitrates in
comparison to the metal nitrates–citric acid gel network. These
results are in correlation with the IR spectra, where no peaks
related to free metal salts inside the gel network were visible.
This high reactivity of the amorphous precursor is probably
caused by the very homogenous distribution of the metal ions
inside the gel network and can be a real advantage for sol–gel
systems because phase formation can now take place at much
lower temperatures.
In comparison with the decomposition behaviour of the
nitrate–citrate gel, the main difference for this route is the
absence of an uncontrollable auto combustion reaction. Also,
the loss in weight is spread over the whole range of the three
exothermic reactions, thus smoothing out the evolution of
gaseous compounds during calcination. Therefore, using this
sol–gel procedure, one can apply a higher heating rate of
10 uC min21 during thermal treatment of the thin film.
3.3.2 Morphology. Fig. 10 shows the SEM images of the
NBCO layer deposited from the nitrate–citrate precursor
solution. It can be clearly seen that the layer obtained has a
discontinuous and very porous surface morphology. This is
undoubtedly related to the vigorous auto combustion reaction
as described Section 3.3.1. The autocatalytic nature of this
reaction renders it uncontrollable, and coupled with the release
of high quantities of gasses this will result in the creation of
pores during calcination.
These observations lead us to conclude that the nitrate–
citrate sol–gel method is not the appropriate sol–gel route to
deposit thick (.500 nm) superconductive layers with high Jc
performance. Nevertheless, earlier investigations proved that
this nitrate–citrate method could be used successfully for the
deposition of thin CeO2 buffer layers as long as the deposited
layer does not exceed the critical thickness of approximately
50 nm.17 Also, the preparation of very fine powders exhibiting
nanoscale grain size and good superconducting properties was
demonstrated using this sol–gel precursor system.
Fig. 11 shows the SEM micrographs of the NBCO layer
deposited from the acetate–TEA precursor. In stark contrast
to the nitrate–citrate method, thick homogeneous and crack-
free layers are obtained here. This is to be correlated with the
absence of an aggressive auto combustion reaction during the
thermal decomposition of the gel network. As mentioned
earlier, we also suppressed decomposition reactions with exten-
sive mass loss by applying a slow heating rate of 1 uC min21
up to 500 uC during thermal treatment of the amorphous gel
and by careful selection of ligand molecules.
3.3.3 Microstructure. Fig. 12 shows the h–2h XRD spectrum
of the sintered and annealed NBCO layer dip-coated on a (l00)
polished STO substrate. From the intensity of the different
(00l) peak reflections, a strong c-axis orientation of the layer
can be observed. No peaks that could be attributed to other
orientations of the NBCO phase or remaining BaCuO2 phase
were observed.
However, when a NBCO thin film is synthesised using a
precursor solution without applying the optimum parameters
derived from potentiometric analysis (in this case a pH value
of 5 was used instead of 6.5), impurity phases are formed
during phase conversion to NBCO, as can be seen in Fig. 13.
This phenomenon emphasises the importance of good metal
complex formation inside the precursor solution and thus the
necessity for stipulating the optimum complexation para-
meters using potentiometric titration curves. If the precursor
solution contains free metal ions, precipitation and impurity
phase formation is encouraged during synthesis.
Fig. 14 shows the (103) pole figure for this layer and
exemplifies a highly in-plane textured NBCO phase. This is
Fig. 8 TGA–DTA spectrum of the metal acetate–TEA sol–gel system
Fig. 9 Thermal decomposition behaviour of the separate metal
acetates
1720 | J. Mater. Chem., 2007, 17, 1714–1724 This journal is � The Royal Society of Chemistry 2007
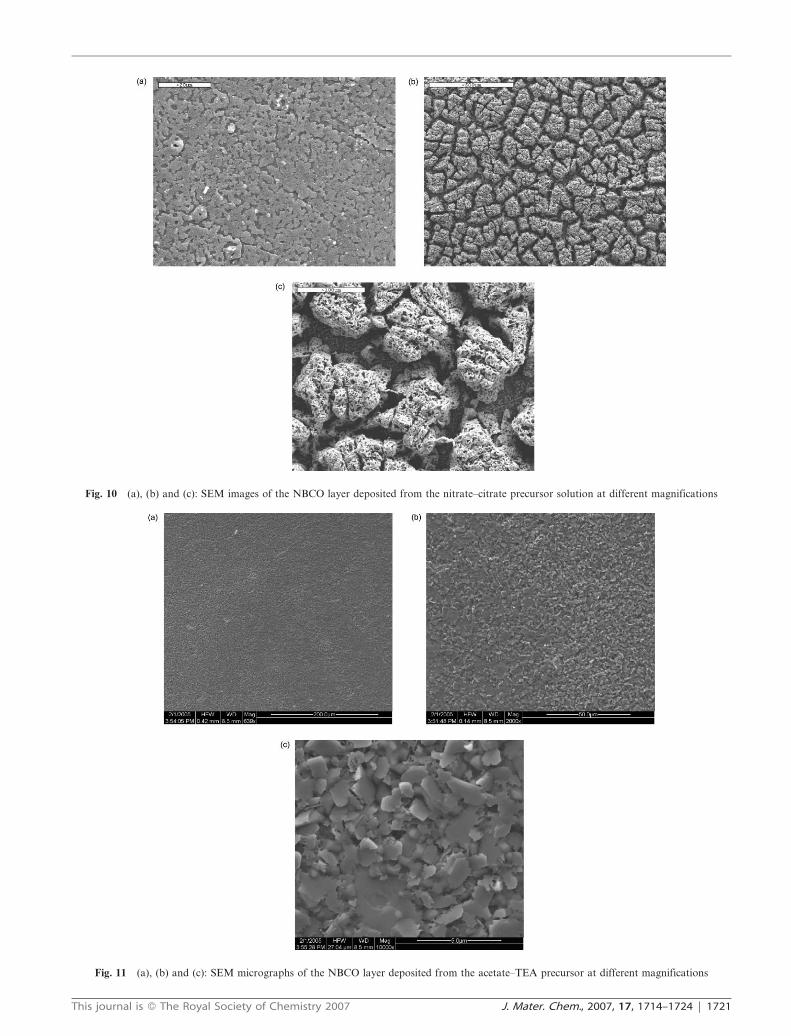
Fig. 10 (a), (b) and (c): SEM images of the NBCO layer deposited from the nitrate–citrate precursor solution at different magnifications
Fig. 11 (a), (b) and (c): SEM micrographs of the NBCO layer deposited from the acetate–TEA precursor at different magnifications
This journal is � The Royal Society of Chemistry 2007 J. Mater. Chem., 2007, 17, 1714–1724 | 1721
confirmed by the very low degree of mis-orientation angles
(2.67u) calculated from the FWHM, given in the accompanied
phi-scan in Fig. S5 (ESI{).
It is well known that the good lattice match with the STO
single crystal substrate induces the textured growth of the
NBCO phase. In vacuum techniques this is thought to occur in
an atomic layer-by-layer growth. However, using a sol–gel
system, one starts from a bulky amorphous layer which is
already present on the substrate and which has to be converted
to the final crystalline phase afterwards. To induce texture in
this layer, this means that the initial nucleation of the NBCO
phase has to take place at the interface between the substrate
and the amorphous layer.
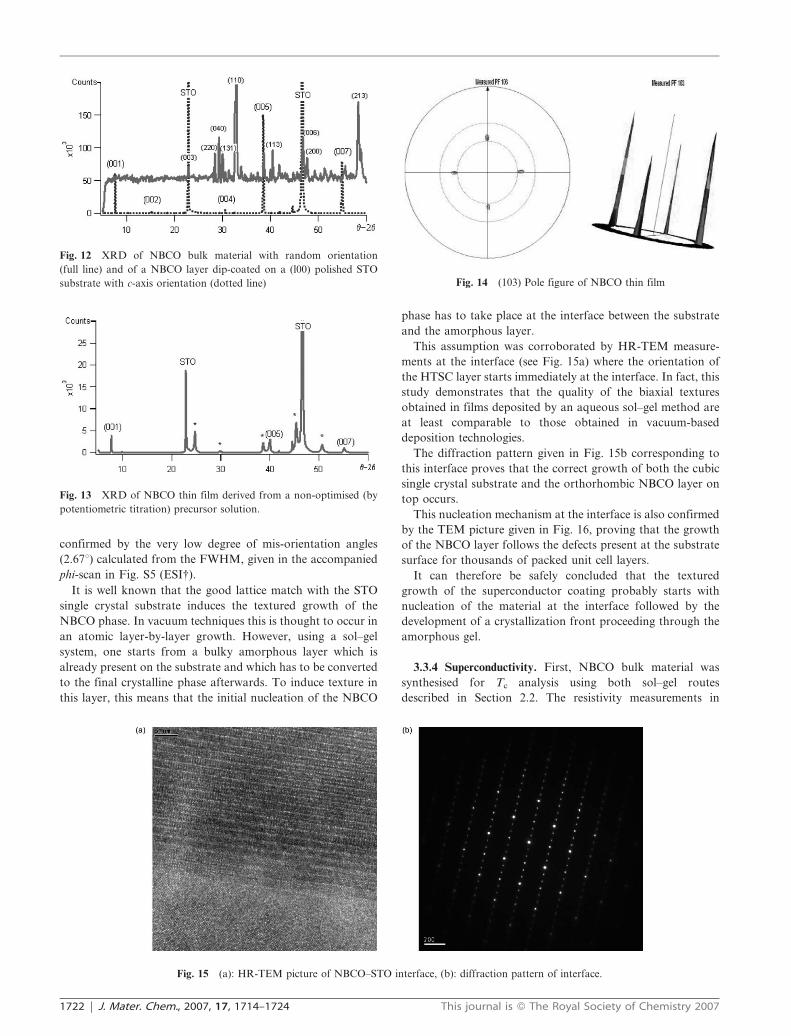
This assumption was corroborated by HR-TEM measure-
ments at the interface (see Fig. 15a) where the orientation of
the HTSC layer starts immediately at the interface. In fact, this
study demonstrates that the quality of the biaxial textures
obtained in films deposited by an aqueous sol–gel method are
at least comparable to those obtained in vacuum-based
deposition technologies.
The diffraction pattern given in Fig. 15b corresponding to
this interface proves that the correct growth of both the cubic
single crystal substrate and the orthorhombic NBCO layer on
top occurs.
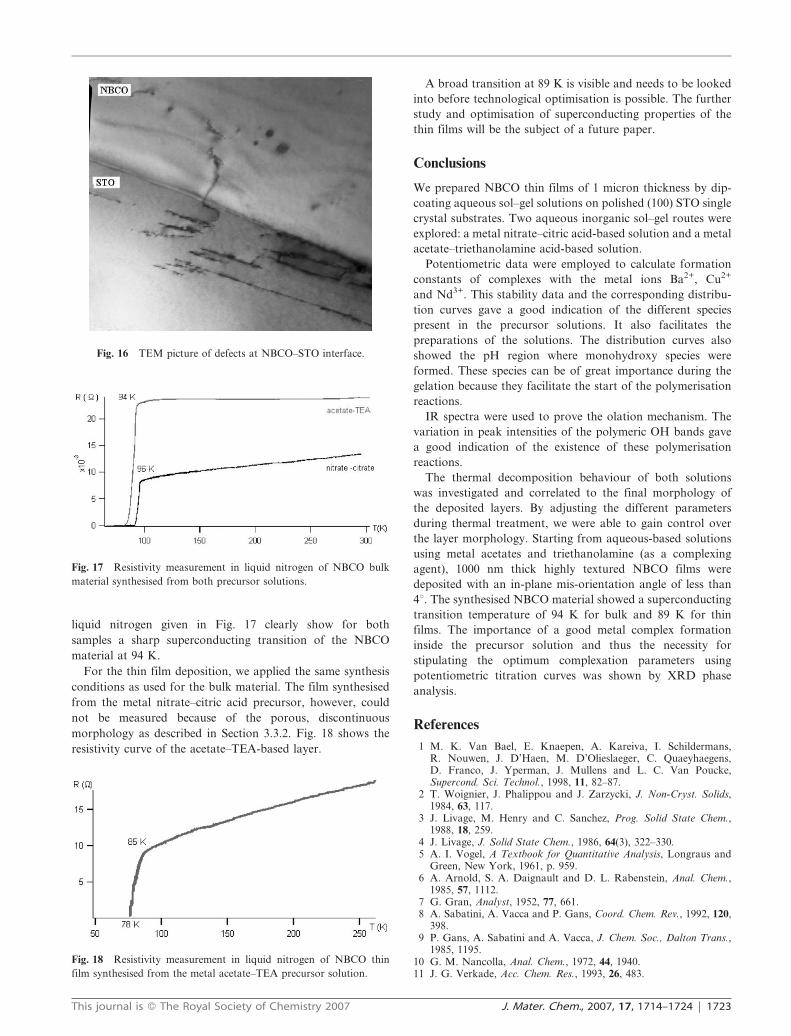
This nucleation mechanism at the interface is also confirmed
by the TEM picture given in Fig. 16, proving that the growth
of the NBCO layer follows the defects present at the substrate
surface for thousands of packed unit cell layers.
It can therefore be safely concluded that the textured
growth of the superconductor coating probably starts with
nucleation of the material at the interface followed by the
development of a crystallization front proceeding through the
amorphous gel.
3.3.4 Superconductivity. First, NBCO bulk material was
synthesised for Tc analysis using both sol–gel routes
described in Section 2.2. The resistivity measurements in
Fig. 12 XRD of NBCO bulk material with random orientation
(full line) and of a NBCO layer dip-coated on a (l00) polished STO
substrate with c-axis orientation (dotted line)
Fig. 13 XRD of NBCO thin film derived from a non-optimised (by
potentiometric titration) precursor solution.
Fig. 15 (a): HR-TEM picture of NBCO–STO interface, (b): diffraction pattern of interface.
Fig. 14 (103) Pole figure of NBCO thin film
1722 | J. Mater. Chem., 2007, 17, 1714–1724 This journal is � The Royal Society of Chemistry 2007
liquid nitrogen given in Fig. 17 clearly show for both
samples a sharp superconducting transition of the NBCO
material at 94 K.
For the thin film deposition, we applied the same synthesis
conditions as used for the bulk material. The film synthesised
from the metal nitrate–citric acid precursor, however, could
not be measured because of the porous, discontinuous
morphology as described in Section 3.3.2. Fig. 18 shows the
resistivity curve of the acetate–TEA-based layer.
A broad transition at 89 K is visible and needs to be looked
into before technological optimisation is possible. The further
study and optimisation of superconducting properties of the
thin films will be the subject of a future paper.
Conclusions
We prepared NBCO thin films of 1 micron thickness by dip-
coating aqueous sol–gel solutions on polished (100) STO single
crystal substrates. Two aqueous inorganic sol–gel routes were
explored: a metal nitrate–citric acid-based solution and a metal
acetate–triethanolamine acid-based solution.
Potentiometric data were employed to calculate formation
constants of complexes with the metal ions Ba2+, Cu2+
and Nd3+. This stability data and the corresponding distribu-
tion curves gave a good indication of the different species
present in the precursor solutions. It also facilitates the
preparations of the solutions. The distribution curves also
showed the pH region where monohydroxy species were
formed. These species can be of great importance during the
gelation because they facilitate the start of the polymerisation
reactions.
IR spectra were used to prove the olation mechanism. The
variation in peak intensities of the polymeric OH bands gave
a good indication of the existence of these polymerisation
reactions.
The thermal decomposition behaviour of both solutions
was investigated and correlated to the final morphology of
the deposited layers. By adjusting the different parameters
during thermal treatment, we were able to gain control over
the layer morphology. Starting from aqueous-based solutions
using metal acetates and triethanolamine (as a complexing
agent), 1000 nm thick highly textured NBCO films were
deposited with an in-plane mis-orientation angle of less than
4u. The synthesised NBCO material showed a superconducting
transition temperature of 94 K for bulk and 89 K for thin
films. The importance of a good metal complex formation
inside the precursor solution and thus the necessity for
stipulating the optimum complexation parameters using
potentiometric titration curves was shown by XRD phase
analysis.
References
1 M. K. Van Bael, E. Knaepen, A. Kareiva, I. Schildermans,R. Nouwen, J. D’Haen, M. D’Olieslaeger, C. Quaeyhaegens,D. Franco, J. Yperman, J. Mullens and L. C. Van Poucke,Supercond. Sci. Technol., 1998, 11, 82–87.
2 T. Woignier, J. Phalippou and J. Zarzycki, J. Non-Cryst. Solids,1984, 63, 117.
3 J. Livage, M. Henry and C. Sanchez, Prog. Solid State Chem.,1988, 18, 259.
4 J. Livage, J. Solid State Chem., 1986, 64(3), 322–330.5 A. I. Vogel, A Textbook for Quantitative Analysis, Longraus and
Green, New York, 1961, p. 959.6 A. Arnold, S. A. Daignault and D. L. Rabenstein, Anal. Chem.,
1985, 57, 1112.7 G. Gran, Analyst, 1952, 77, 661.8 A. Sabatini, A. Vacca and P. Gans, Coord. Chem. Rev., 1992, 120,
398.9 P. Gans, A. Sabatini and A. Vacca, J. Chem. Soc., Dalton Trans.,
1985, 1195.10 G. M. Nancolla, Anal. Chem., 1972, 44, 1940.11 J. G. Verkade, Acc. Chem. Res., 1993, 26, 483.
Fig. 16 TEM picture of defects at NBCO–STO interface.
Fig. 17 Resistivity measurement in liquid nitrogen of NBCO bulk
material synthesised from both precursor solutions.
Fig. 18 Resistivity measurement in liquid nitrogen of NBCO thin
film synthesised from the metal acetate–TEA precursor solution.
This journal is � The Royal Society of Chemistry 2007 J. Mater. Chem., 2007, 17, 1714–1724 | 1723

12 J. Bjerrum, B. V. Agarwala and S. Refn, Acta Chem. Scand. Ser. A,1981, 35, 685.
13 R. D. Hancock and B. S. Nakani, J. Coord. Chem., 1984, 13, 309.14 A. Pasquarello, I. Petri, P. S. Salmon, O. Parisel, R. Car, E. Toth,
D. H. Powell, H. E. Fischer, L. Helm and A. E. Merbach, Science,2001, 291, 856–859.
15 A. E. Martell and R. M. Smith, Critical Stability Constants,Plenum, New York, 1977.
16 R. S. Liu, W. N. Wang, C. T. Chang and P. T. Wu, Jpn. J. Appl.Phys., 1989, 28(12), 2155–2157.
17 G. Penneman, I. Van Driessche, E. Bruneel and S. Hoste, Key Eng.Mater., 2004, 264–268, 501–504.
1724 | J. Mater. Chem., 2007, 17, 1714–1724 This journal is � The Royal Society of Chemistry 2007