chapter 5 managing the effects of riparian vegetation on flooding
TRANSCRIPT
5
Managing the effects of riparian vegetation on floodingIan Rutherfurd, Brett Anderson and Anthony Ladson
Summary
~ The major effect of removing riparian vegetation and wood from streams has been the
changes in channel form (widening, deepening and straightening) that have occurred.
It is important to consider that we are returning vegetation to a channel system that
now has a much larger flow capacity.
~ The major hydrological effect of returning vegetation to streams is via its influence on
roughness and flow resistance.
~ Revegetating riparian zones, or adding large wood to stream channels, increases the
stage of floods at a cross-section and reach scale, although in many cases the effects
are likely to be small. The effect will be greatest where the vegetation is planted across
the full width of a floodplain.
~ Adding or removing large wood (snags) in streams has little effect on the height and
duration of large floods.
~ At catchment scale, the cumulative effect of riparian revegetation is to increase flood
stage and duration in headwater streams (where flooding is usually not a problem
anyway), but decrease flood stage in larger streams, further downstream, where
flooding may in the past have been a problem (local-scale versus network-scale effects).
~ Although the effect of riparian vegetation on flooding is modest in comparison to the
effects of dams and river regulation, it should be considered in planning major
revegetation works. The effect is largely positive for downstream catchments, where
riparian vegetation will reduce the depth of flooding. The decreased flow depth comes
at the cost of slightly longer flood durations.
~ Riparian revegetation should be seen as a catchment scale tool that can have a
beneficial effect on flooding in lowland areas. Whilst flow regulation and landuse
change affect the amount of water available in floods (magnitude and frequency),
riparian vegetation affects the velocity of the flood wave delivered to the stream.
All of these interacting aspects need to be considered together.
CHAPTER
5.1 Flooding issuesLarge pieces of wood (snags), and riparian vegetationgrowing within a watercourse, have been considered toblock channels, and slow down flood flow, therebyincreasing flood height. As a result, for the last 150 yearspeople have been removing vegetation from stream bedand banks in order to reduce flood risk for adjoininglanduses. At present, however, replanting native riparianvegetation is the single most common streamrehabilitation activity in Australia. Nearly 80% of allstream restoration projects involve riparian revegetation,and many involve returning wood to the stream bed.
This turnaround in management approach hasmeant that, in the life-time of many landholders, theyhave seen publicly-sponsored efforts to drain swamps,to remove wood from streams, and to clear riparianvegetation. Now they see publicly-sponsored efforts toreverse this work: to replant riparian vegetation andreturn snags to rivers (Erskine & Webb 2003). Sincemuch of the rationale for removing vegetation wasrelated to flooding and drainage, it should not come as a surprise when landholders ask whether returningriparian vegetation will also lead to a return of historicalflood levels. In fact, many landholders resist efforts atriparian revegetation on the grounds that it will increaseflooding problems. Are they right to do so? This chapter
PRINCIPLES FOR RIPARIAN LANDS MANAGEMENT
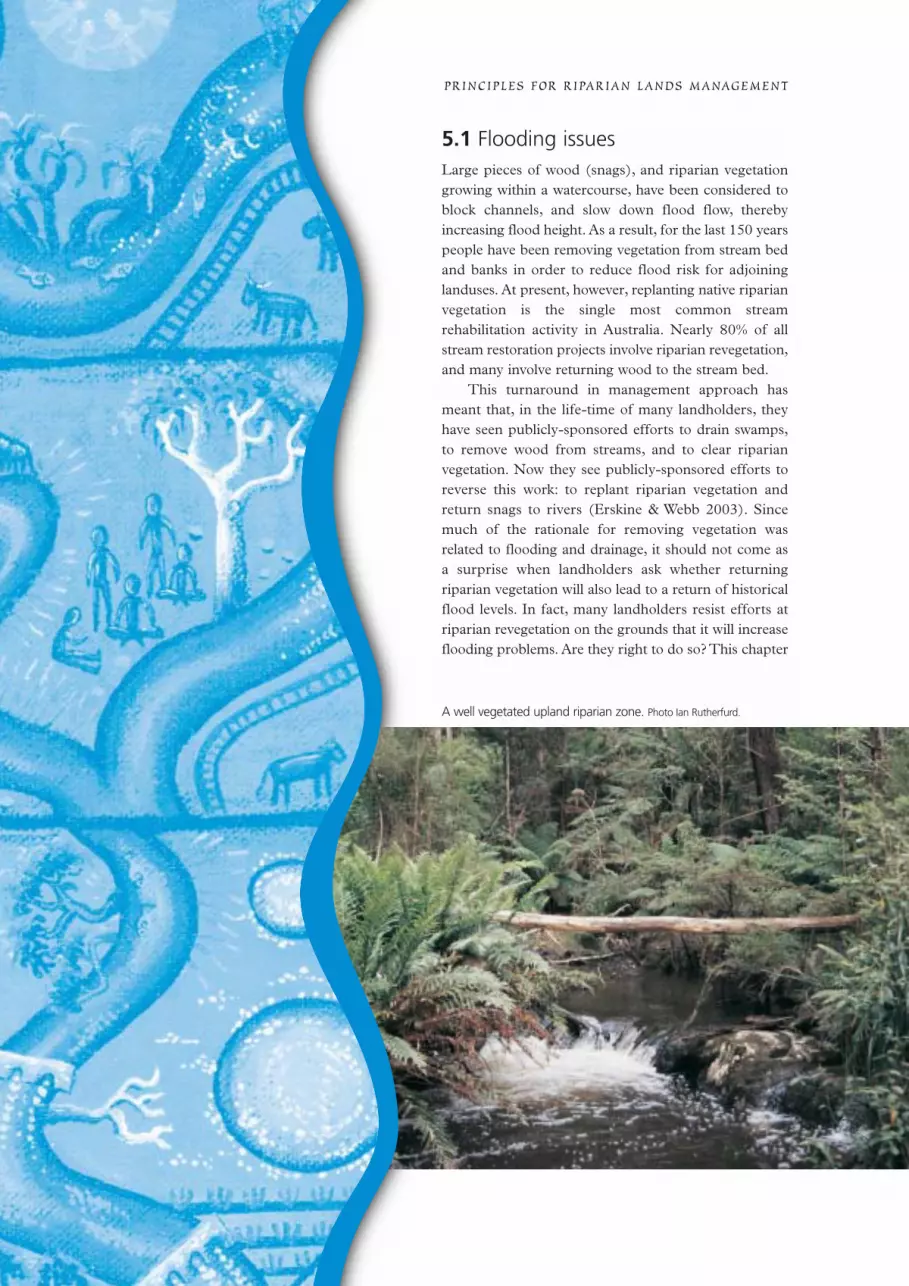
A well vegetated upland riparian zone. Photo Ian Rutherfurd.
reviews recent scientific assessments of the hydraulic and hydrological consequences of revegetating riparianzones, and of returning snags to streams. Theseconsequences in turn have effects on flood magnitude(i.e. height or stage), and flood duration. For waterwaymanagers, this chapter addresses the following types ofissues that they might encounter:1. A farmer will not give us permission to revegetate
his stream because he is concerned that his propertywill be flooded.What can I say to the farmer, is thisa risk?
2. If we replant a 5 metre strip of vegetation along the banks of all 1st and 2nd order streams in this1000 km2 catchment, what will be the effect on floodlevels in the catchment as a whole?
3. If we revegetate 3 kilometres of the banks of thisriparian zone, what will be the effect on flood level?
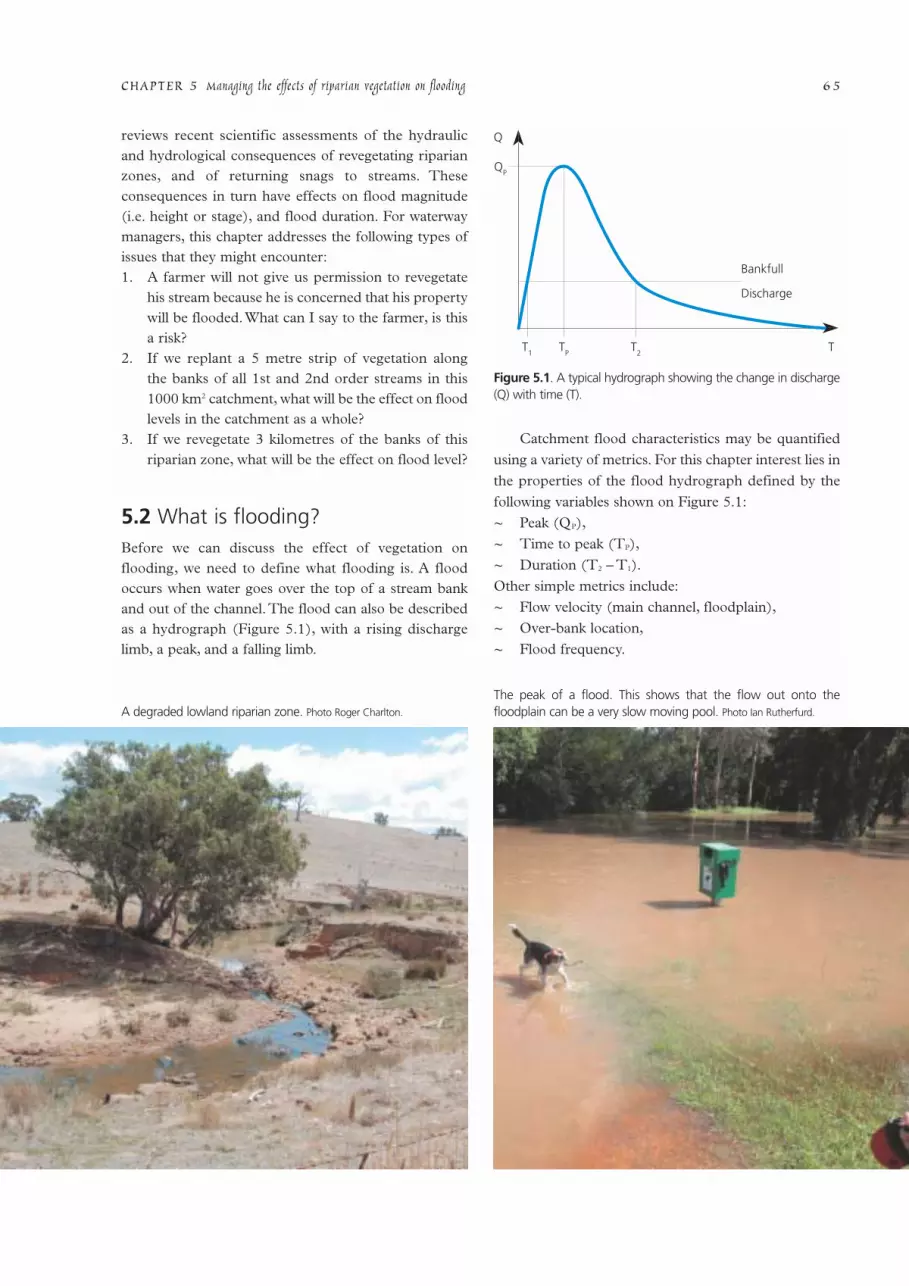
5.2 What is flooding? Before we can discuss the effect of vegetation onflooding, we need to define what flooding is. A floodoccurs when water goes over the top of a stream bankand out of the channel. The flood can also be describedas a hydrograph (Figure 5.1), with a rising dischargelimb, a peak, and a falling limb.
Catchment flood characteristics may be quantified
using a variety of metrics. For this chapter interest lies in
the properties of the flood hydrograph defined by the
following variables shown on Figure 5.1:
~ Peak (QP),
~ Time to peak (TP),
~ Duration (T2 – T1).
Other simple metrics include:
~ Flow velocity (main channel, floodplain),
~ Over-bank location,
~ Flood frequency.
CHAPTER 5 Managing the effects of riparian vegetation on flooding 6 5
Q
QP
T1
TP
T2
T
Bankfull
Discharge
Figure 5.1. A typical hydrograph showing the change in discharge(Q) with time (T).
The peak of a flood. This shows that the flow out onto thefloodplain can be a very slow moving pool. Photo Ian Rutherfurd.A degraded lowland riparian zone. Photo Roger Charlton.
The ‘size’ (or magnitude) of a flood can be measured bythree related properties of the flow; the stage (or height)of the water surface1 the duration of the flood (defined asthe period of time that it is overbank), and the frequencyof the flood (being how often a particular flood can beexpected in a period of time).Thus, a natural floodplaincould be expected to be flooded every year or two. Thefrequency of this flood would be ‘annual’ or 1–2 yearsrecurrence interval. The stage would be defined as, forexample, a “5 metre stage on the Jonesville gauge”. Theduration of the annual flood could vary from a few daysover bank, to perhaps a week, before the water falls backwithin the channel. In small tributaries the hydrographcan rise and fall in hours, in large, low-land rivers, thefloodplains, under natural conditions, could have stayedflooded for weeks or months.
The amount of water in a flood (the discharge) is aproduct of the cross-sectional area of the flow, multipliedby the velocity of the flow. The faster the velocity, thesmaller the cross-sectional area, and so the lower thestage of the flood. If the flow is blocked, the velocity fallsand the stage rises. A flood should be thought of as awave of water passing down a channel, getting larger asit goes because new tributaries contribute water to thewave. Standing at one point, an observer sees the riverrise and fall. This wave tends to slow down as it movesdownstream, this means that the wave spreads out,or ‘attenuates’. The wave contains the same amount ofwater, but as it slows down, the elevation of the peak ofthe wave (amplitude) rises, and the duration (or length)of the wave increases.
Another important influence on the size of the waveis the presence of floodplains. Floodplains reduce thesize of the wave by siphoning off some of the water fromthe main flow and storing it for a time, effectively slowingdown a part of the flow. The size of the wave (peakdischarge) at a given location, therefore depends on howfast waves from the various tributaries come together,and how much water has been detained along the way.
Engineers and land holders have worked to clear,straighten and de-snag channels in order to reduce the flow resistance that would slow the flood flow and attenuate the peak. The aim of all of these‘channelisation’ works has been to increase the velocityof the flood wave, decrease its height, and encourage itto pass through as quickly as possible (Brookes 1988,Mason et al. 1990, Shankman & Pugh 1992). Ourresearch question is: does revegetation influence thesize of the flood wave?
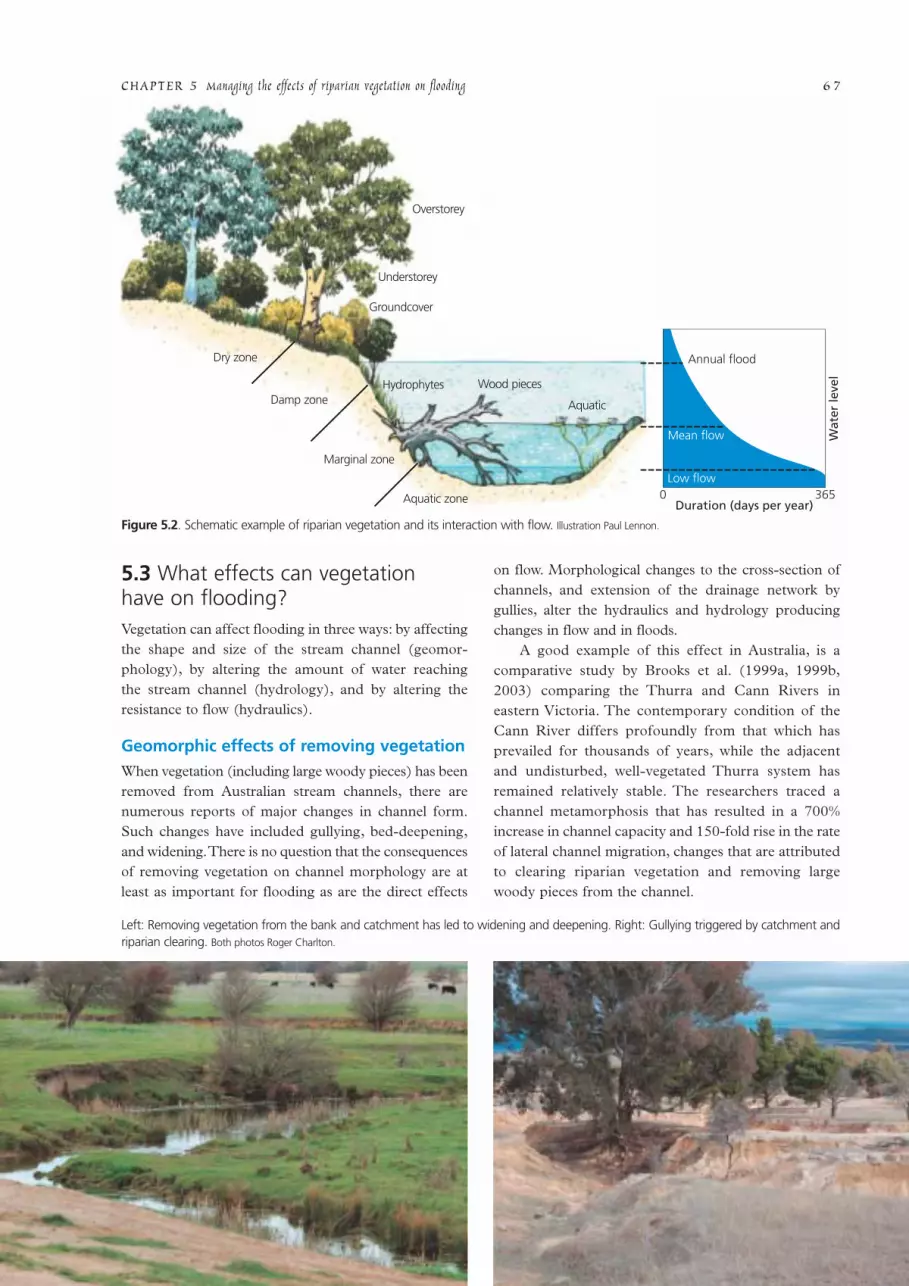
What makes up riparian vegetation in the context of flooding?Riparian vegetation affects flow by coming into contactwith the flowing water. Thus, vegetation growing indifferent parts of the cross-section interact with differentflows. In the bed of the channel are the submergedmacrophytes (such as reeds), and the woody pieces, thatinteract with all flows. As we move up the stream banksthe plants are accustomed to less and less inundation.Hydrophytes give way to grass, bushes and trees up theface of the stream bank. Above the top of the bank,vegetation only interacts with annual floods.
PRINCIPLES FOR RIPARIAN LANDS MANAGEMENT6 6
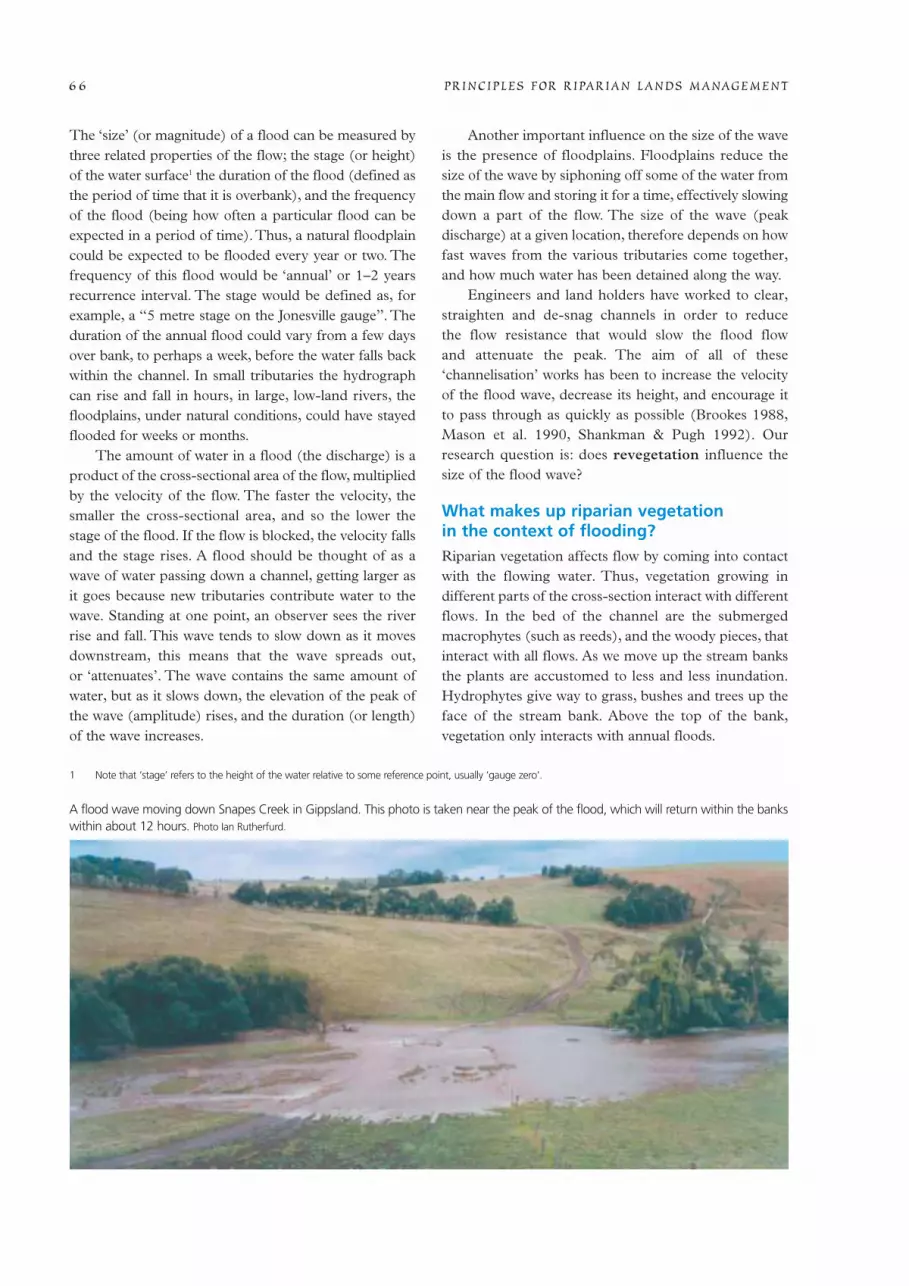
A flood wave moving down Snapes Creek in Gippsland. This photo is taken near the peak of the flood, which will return within the bankswithin about 12 hours. Photo Ian Rutherfurd.
1 Note that ‘stage’ refers to the height of the water relative to some reference point, usually ‘gauge zero’.
5.3 What effects can vegetation have on flooding? Vegetation can affect flooding in three ways: by affectingthe shape and size of the stream channel (geomor-phology), by altering the amount of water reaching the stream channel (hydrology), and by altering theresistance to flow (hydraulics).
Geomorphic effects of removing vegetationWhen vegetation (including large woody pieces) has beenremoved from Australian stream channels, there arenumerous reports of major changes in channel form.Such changes have included gullying, bed-deepening,and widening.There is no question that the consequencesof removing vegetation on channel morphology are atleast as important for flooding as are the direct effects
on flow. Morphological changes to the cross-section ofchannels, and extension of the drainage network bygullies, alter the hydraulics and hydrology producingchanges in flow and in floods.
A good example of this effect in Australia, is acomparative study by Brooks et al. (1999a, 1999b,2003) comparing the Thurra and Cann Rivers ineastern Victoria. The contemporary condition of theCann River differs profoundly from that which hasprevailed for thousands of years, while the adjacent and undisturbed, well-vegetated Thurra system hasremained relatively stable. The researchers traced achannel metamorphosis that has resulted in a 700%increase in channel capacity and 150-fold rise in the rateof lateral channel migration, changes that are attributedto clearing riparian vegetation and removing largewoody pieces from the channel.
CHAPTER 5 Managing the effects of riparian vegetation on flooding 6 7
Figure 5.2. Schematic example of riparian vegetation and its interaction with flow. Illustration Paul Lennon.
Left: Removing vegetation from the bank and catchment has led to widening and deepening. Right: Gullying triggered by catchment andriparian clearing. Both photos Roger Charlton.
Dry zone
Damp zone
Marginal zone
Aquatic zone
Overstorey
Understorey
Groundcover
Hydrophytes Wood pieces
Aquatic
0
Wat
er le
vel
Duration (days per year)365
Annual flood
Mean flow
Low flow

Wood in streams has the potential to significantlyand sometimes systematically shape channel processesacross a wide range of scales (Montgomery & Piegay2003). For example, as well as providing a direct physicalbarrier to flow, it affects channel form by:~ creating steps in the longitudinal profile (Harmon et
al. 1987, Keller & Swanson 1979, Marston 1982,Webb & Erskine 2003);
~ moderating sediment storage and scour withinchannels:– underpinning the forming of bars and benches
(Malanson & Butler 1990, Webb & Erskine2001),
– regulating bedload transport (Beschta 1979,Fetherston et al. 1995), and
– causing localised scour (Abbe & Montgomery1996, Marsh et al. 2001).
~ contributing to the formation of pools (Buffingtonet al. 2002, Marsh et al. 1999, Robison & Beschta1990,Webb & Erskine 2003) which improves habitatthrough the provision of cover (Hortle & Lake 1983,Richmond & Fausch 1995);
~ enhancing overbank deposition of fines, reported asthe dominant deposition process on floodplains byGurnell and Gregory (1981).
In recent years, research and experience have shown thebeneficial effects of riparian vegetation on the stability of stream banks and the role of in-channel vegetation
and wood in controlling bed grade and erosion. Theimportant contribution of both to maintaining habitatcomplexity and biodiversity have also been accepted.This new knowledge underpins the current emphasis onreversing past clearing to improve the condition of manystreams and rivers.
In this chapter we are not concerned with the effectsof removing vegetation, but with the consequences ofreturning it. In most cases, riparian vegetation and woodis being returned to streams that have already altered theform of their channel. It is important to emphasise thatrevegetating streams will not simply reverse the effect of clearing the streams, returning them to their ‘pre-European’ form. Instead, we are considering the effectsof returning vegetation to already altered channels.
Hydrological effects of riparian vegetation Vegetation can have numerous impacts on the amountof rainfall that becomes runoff, and enters streams(Table 5.1). Although riparian zones make up only asmall percentage of the total area of a catchment, theycan make up a large percentage of the land adjoiningfirst-order streams which is the main source of runoff.Overall, the main effect of riparian vegetation onhydrology (i.e. the amount of water entering streams) is on base flow rather than on flooding. Thus, theremainder of this chapter deals with the hydraulic effectof vegetation on flow resistance.
Research by Andrew Brooks has demonstrated that the Cann River (inset) originally had the same form as the adjacent Thurra River, butwidened and deepened in response to channelisation and riparian clearing. Photos Andrew Brooks.
Resistance effects of riparian vegetation at a cross-section and a reachThe scientific literature contains a number of excellentreviews on the topic of fluvial resistance; most recentlyworks by Bathurst (1993) and Yen (1991). However,most of the work on the resistance effects of vegetationare based on studies of small vegetation elements. Whatis missing is a way of representing the effects of all plants,small and large. Dawson and Charlton (1987) list someof the factors that influence the magnitude of resistanceoffered by a plant or stand of plants:~ the height of vegetation relative to the depth of
flow,~ plant characteristics such as stem diameter, leaf
size, surface texture and specific gravity which varywith the age of the plant and often the season,
~ flexibility of the stems or the whole plant stand (e.g.in the case of a reed bank),
~ orientation of stems within the plant and their arealdensity,
~ degree of stem compaction with increasing flowvelocity and the associated change in standpermeability,
~ distribution of individual plants within a stand, theirfrequency and dispersion pattern,
~ orientation of the plant with respect to the local flowdirection.
Vegetation affects flood velocity, and so flood stage,in three ways:1. by directly occupying space in the channel cross-
section, and so reducing capacity,2. by using energy in the flow (such as by vibrating),
and3. (the most important effect) is to block flow and
reduce velocity.
CHAPTER 5 Managing the effects of riparian vegetation on flooding 6 9
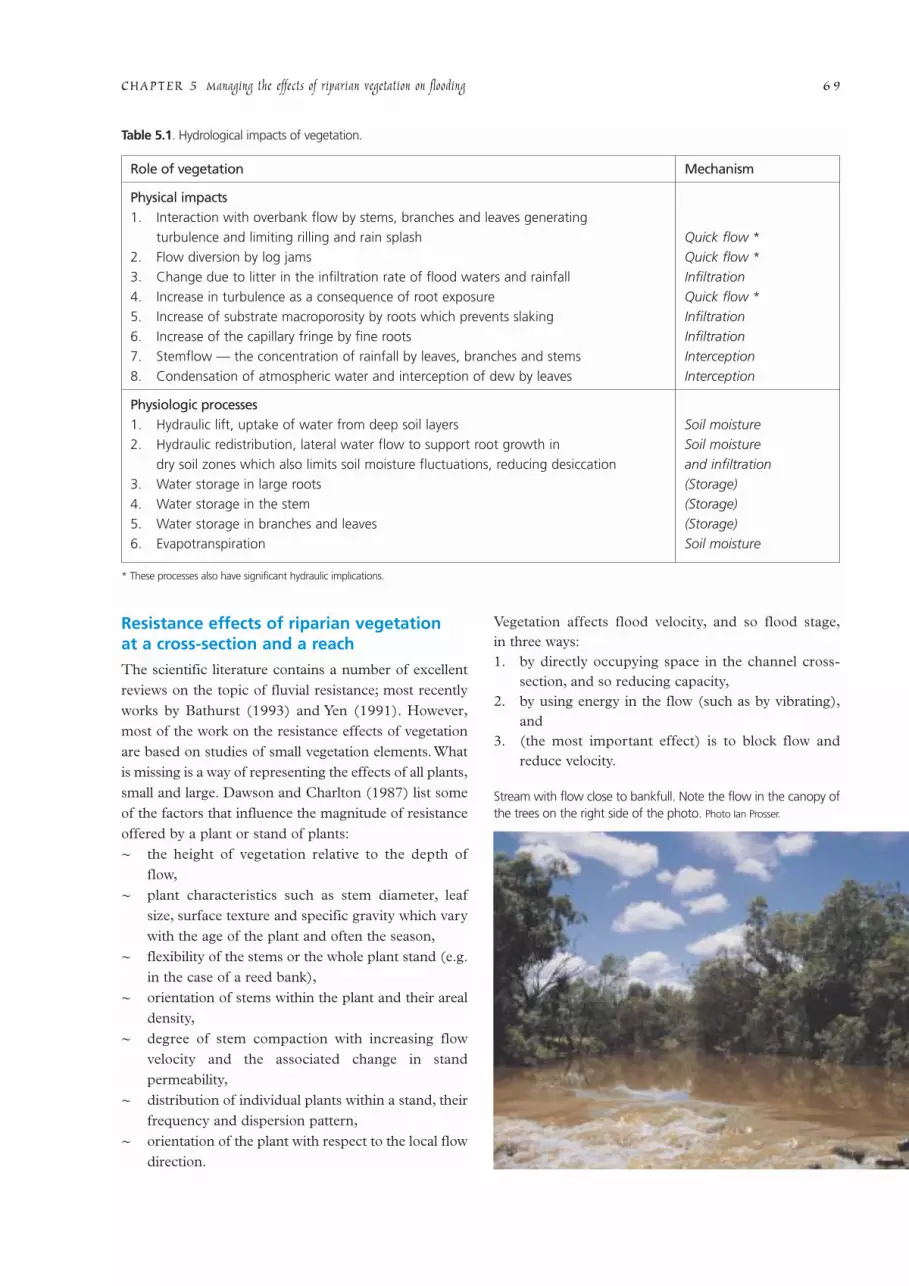
Stream with flow close to bankfull. Note the flow in the canopy ofthe trees on the right side of the photo. Photo Ian Prosser.
Table 5.1. Hydrological impacts of vegetation.
Role of vegetation Mechanism
Physical impacts1. Interaction with overbank flow by stems, branches and leaves generating
turbulence and limiting rilling and rain splash Quick flow *2. Flow diversion by log jams Quick flow *3. Change due to litter in the infiltration rate of flood waters and rainfall Infiltration4. Increase in turbulence as a consequence of root exposure Quick flow *5. Increase of substrate macroporosity by roots which prevents slaking Infiltration6. Increase of the capillary fringe by fine roots Infiltration7. Stemflow — the concentration of rainfall by leaves, branches and stems Interception8. Condensation of atmospheric water and interception of dew by leaves Interception
Physiologic processes1. Hydraulic lift, uptake of water from deep soil layers Soil moisture2. Hydraulic redistribution, lateral water flow to support root growth in Soil moisture
dry soil zones which also limits soil moisture fluctuations, reducing desiccation and infiltration3. Water storage in large roots (Storage)4. Water storage in the stem (Storage)5. Water storage in branches and leaves (Storage)6. Evapotranspiration Soil moisture
* These processes also have significant hydraulic implications.
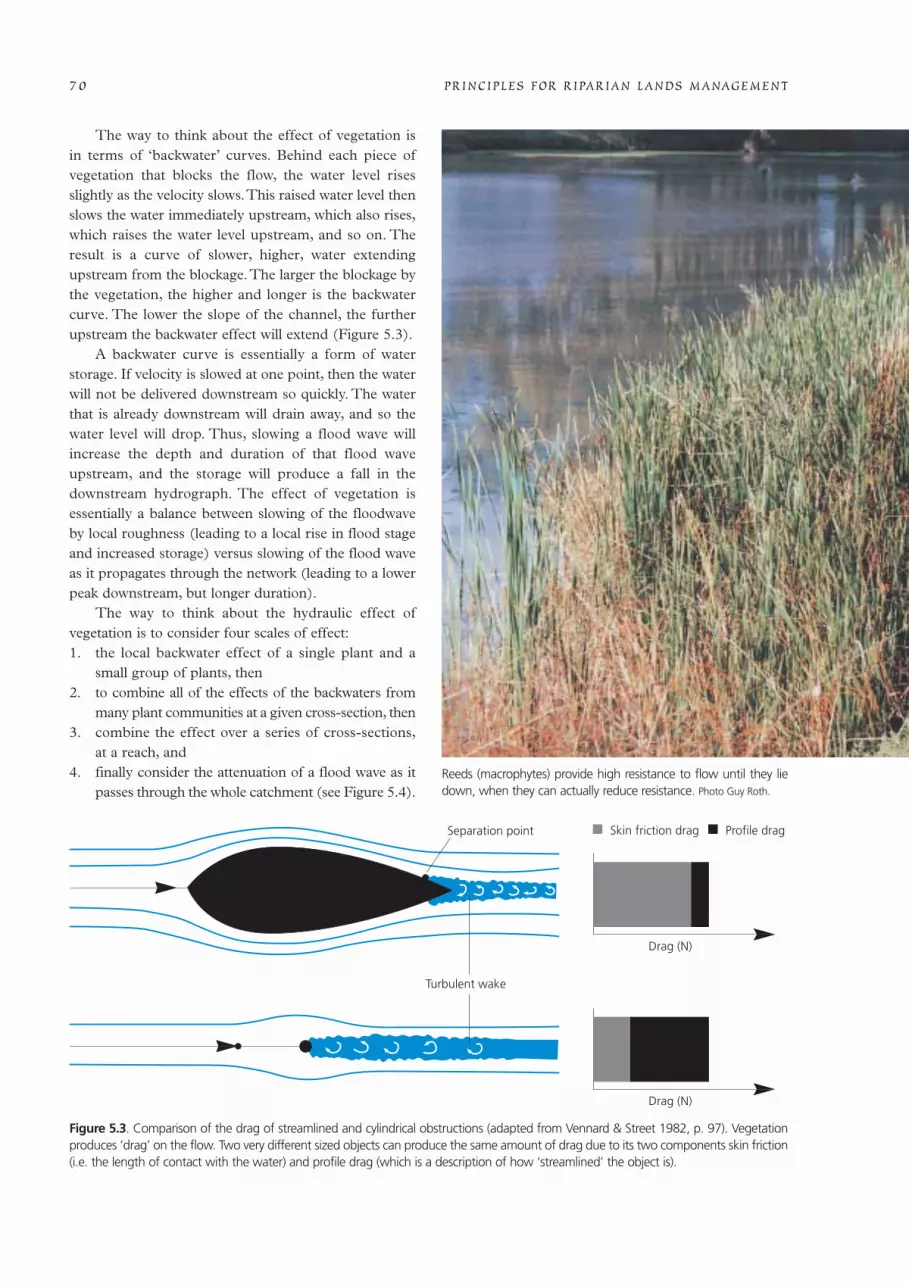
The way to think about the effect of vegetation is in terms of ‘backwater’ curves. Behind each piece ofvegetation that blocks the flow, the water level risesslightly as the velocity slows.This raised water level thenslows the water immediately upstream, which also rises,which raises the water level upstream, and so on. Theresult is a curve of slower, higher, water extendingupstream from the blockage.The larger the blockage bythe vegetation, the higher and longer is the backwatercurve. The lower the slope of the channel, the furtherupstream the backwater effect will extend (Figure 5.3).
A backwater curve is essentially a form of waterstorage. If velocity is slowed at one point, then the waterwill not be delivered downstream so quickly. The waterthat is already downstream will drain away, and so thewater level will drop. Thus, slowing a flood wave willincrease the depth and duration of that flood waveupstream, and the storage will produce a fall in thedownstream hydrograph. The effect of vegetation isessentially a balance between slowing of the floodwaveby local roughness (leading to a local rise in flood stageand increased storage) versus slowing of the flood waveas it propagates through the network (leading to a lowerpeak downstream, but longer duration).
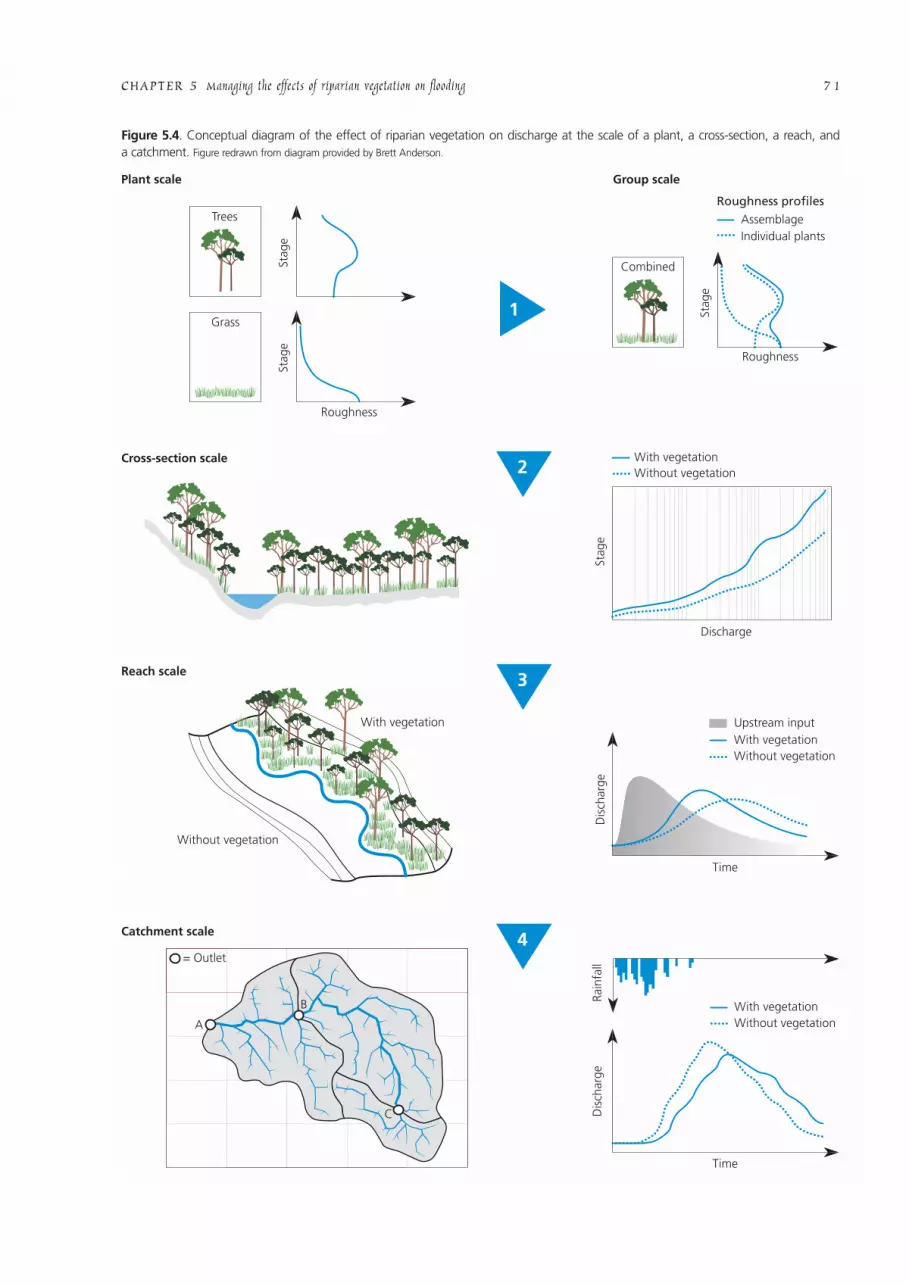
The way to think about the hydraulic effect ofvegetation is to consider four scales of effect:1. the local backwater effect of a single plant and a
small group of plants, then 2. to combine all of the effects of the backwaters from
many plant communities at a given cross-section, then 3. combine the effect over a series of cross-sections,
at a reach, and4. finally consider the attenuation of a flood wave as it
passes through the whole catchment (see Figure 5.4).
PRINCIPLES FOR RIPARIAN LANDS MANAGEMENT7 0
Reeds (macrophytes) provide high resistance to flow until they liedown, when they can actually reduce resistance. Photo Guy Roth.
Drag (N)
Drag (N)
Separation point
Turbulent wake
Skin friction drag Profile drag
Figure 5.3. Comparison of the drag of streamlined and cylindrical obstructions (adapted from Vennard & Street 1982, p. 97). Vegetationproduces ‘drag’ on the flow. Two very different sized objects can produce the same amount of drag due to its two components skin friction(i.e. the length of contact with the water) and profile drag (which is a description of how ‘streamlined’ the object is).
CHAPTER 5 Managing the effects of riparian vegetation on flooding 7 1
With vegetationWithout vegetation
Upstream input
Catchment scale
Without vegetation
With vegetation
Reach scale
Cross-section scale
Plant scale Group scale
Discharge
Dis
char
geD
isch
arge
Rain
fall
Time
Time
Stag
e
With vegetationWithout vegetation
With vegetation
Roughness
Roughness
Stag
e
Without vegetation
Assemblage
Roughness profiles
Individual plants
Stag
e
Trees
Stag
e
A
B
= Outlet
C
Grass
Combined
1
2
3
4
Figure 5.4. Conceptual diagram of the effect of riparian vegetation on discharge at the scale of a plant, a cross-section, a reach, and a catchment. Figure redrawn from diagram provided by Brett Anderson.
A comment on compound channelsBefore we discuss the effect of vegetation on hydraulicresistance, it is important to mention compoundchannels. Riparian vegetation occurs at the interfacebetween the channel and the floodplain. Even withoutvegetation, this is a complicated hydraulic environment,with the high velocity flows in the channel interactingwith the low velocity flows on the floodplain. One of thekey effects of riparian vegetation is to alter the hydraulicrelationship between the floodplain and the channel.
There are excellent reviews of compound channelhydraulics by Knight and Shiono (1996), and Helmio(2002). As the floodplains of a compound channel areinundated, the conveyance of the floodplains is initiallysmall by comparison with that of the main channel.Consequently, the flow velocity on the floodplains ismuch lower than in the main channel. The velocitydifference results in a zone of turbulence at the interfacebetween the two flows, often described as a vertical shearlayer. Extensive three dimensional mixing of main-channel and flood plain flows produces a momentumtransfer across the interface leading to velocity reductionin the main channel. The penetration is reduced asriparian vegetation density increases, which in turn,further reduces the velocity in the main-channel (Naot etal. 1996).
The relative effect of riparian vegetation onmomentum transfer depends a great deal on whether thestream is straight or sinuous. For example, Burkham
(1976) shows that flow resistance is low where thechannel is straight and parallel to the floodplain, but highwhere the channel meanders across the floodplain. In hisanalysis of three floods down the Gila River in Arizona,Burkham (1976) observed that roughness (Manning’s n)(definition in box below) decreased by an average of 30%where floodplain trees were cleared. Thus, in relativeterms, revegetating the riparian zone of a straight streamwill have more effect on flooding than it will on ameandering stream.
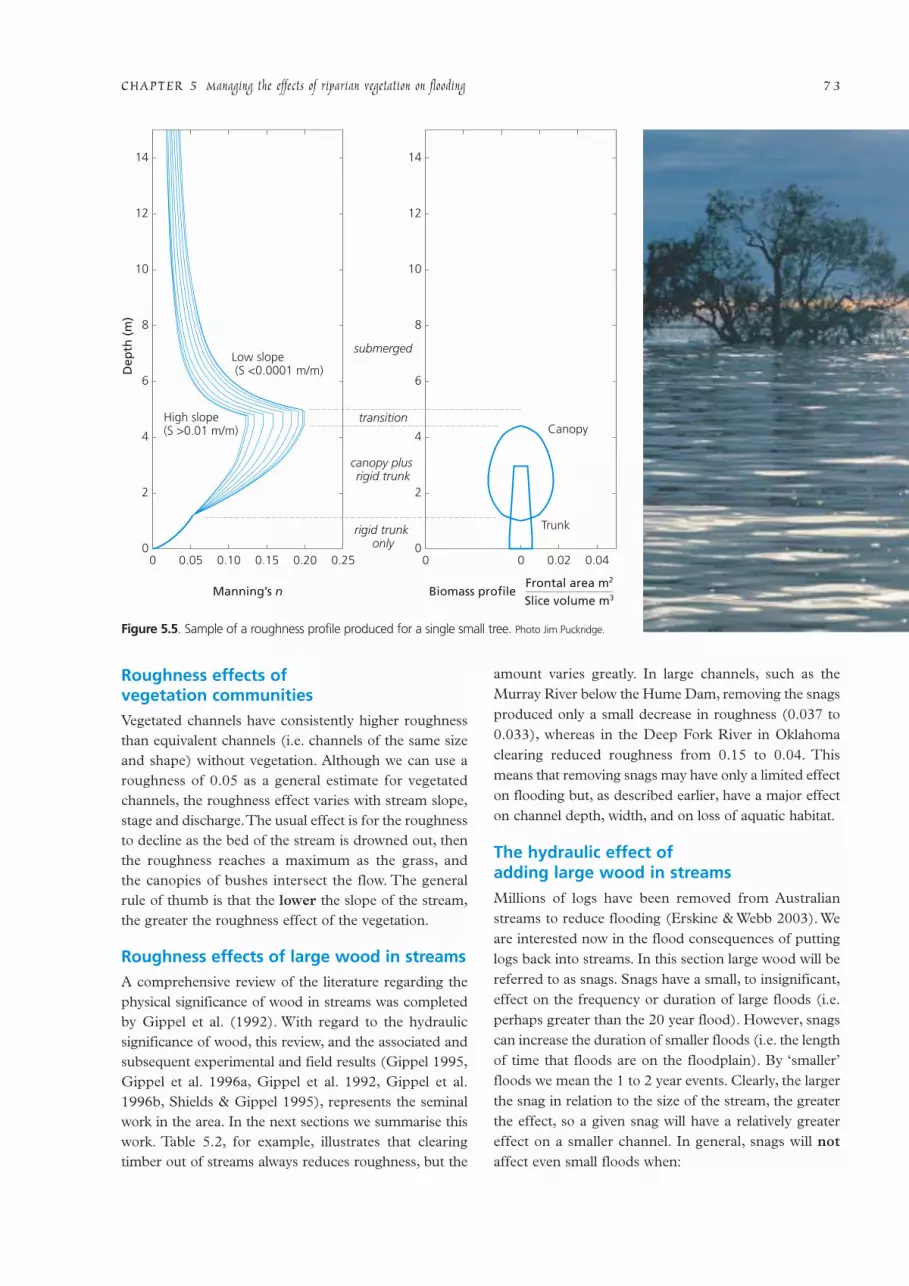
The effect of individual plants on roughnessThe effect of vegetation on roughness varies dramaticallywith flow depth. For example, when we consider grasses,at low flows the water flows through and around thegrass, and the grass will provide maximum resistance toflow. As the depth of flow increases, the grass will besubmerged, then it will probably be pushed down by theflow, which will reduce the resistance. This is because:~ the volume density of stems/foliage (collectively
called biomass) is the primary determinant of themagnitude of flow roughness for plants,
~ plant flexibility causes streamlining of stems/leavesunder flow pressure that may reduce flow resistanceby over 50% (where flow pressure is either energy orvelocity driven by channel slope),
~ vegetation roughness profiles exhibit distinctcharacteristics over two different depth ranges. Theranges are defined by whether the plant is emergentor submerged.
PRINCIPLES FOR RIPARIAN LANDS MANAGEMENT7 2
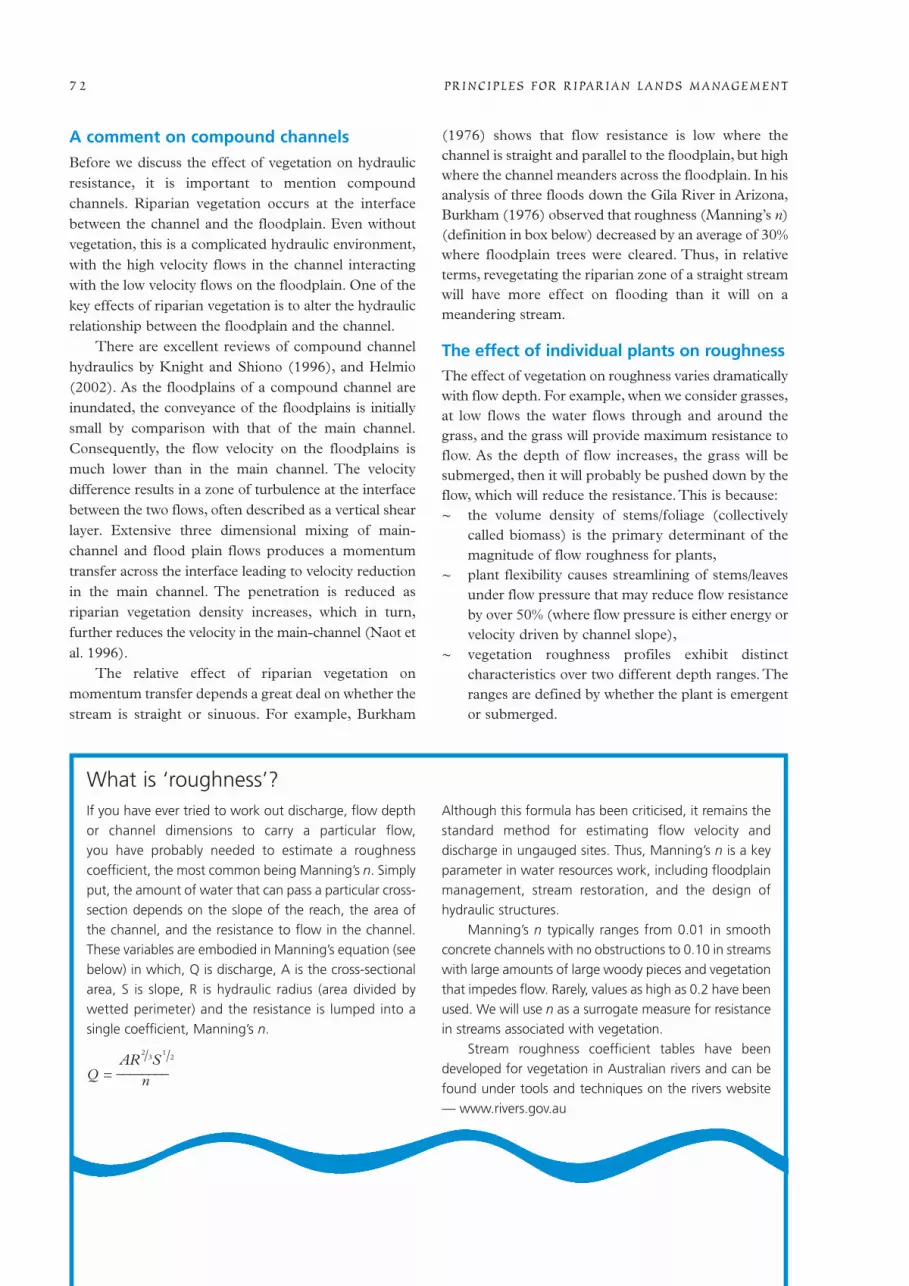
What is ‘roughness’?If you have ever tried to work out discharge, flow depthor channel dimensions to carry a particular flow, you have probably needed to estimate a roughnesscoefficient, the most common being Manning’s n. Simplyput, the amount of water that can pass a particular cross-section depends on the slope of the reach, the area ofthe channel, and the resistance to flow in the channel.These variables are embodied in Manning’s equation (seebelow) in which, Q is discharge, A is the cross-sectionalarea, S is slope, R is hydraulic radius (area divided bywetted perimeter) and the resistance is lumped into asingle coefficient, Manning’s n.
Although this formula has been criticised, it remains thestandard method for estimating flow velocity anddischarge in ungauged sites. Thus, Manning’s n is a keyparameter in water resources work, including floodplainmanagement, stream restoration, and the design ofhydraulic structures.
Manning’s n typically ranges from 0.01 in smoothconcrete channels with no obstructions to 0.10 in streamswith large amounts of large woody pieces and vegetationthat impedes flow. Rarely, values as high as 0.2 have beenused. We will use n as a surrogate measure for resistancein streams associated with vegetation.
Stream roughness coefficient tables have beendeveloped for vegetation in Australian rivers and can befound under tools and techniques on the rivers website— www.rivers.gov.au
AR2/3S
1/2
Q = ________n
Roughness effects of vegetation communitiesVegetated channels have consistently higher roughnessthan equivalent channels (i.e. channels of the same sizeand shape) without vegetation. Although we can use aroughness of 0.05 as a general estimate for vegetatedchannels, the roughness effect varies with stream slope,stage and discharge.The usual effect is for the roughnessto decline as the bed of the stream is drowned out, thenthe roughness reaches a maximum as the grass, and the canopies of bushes intersect the flow. The generalrule of thumb is that the lower the slope of the stream,the greater the roughness effect of the vegetation.
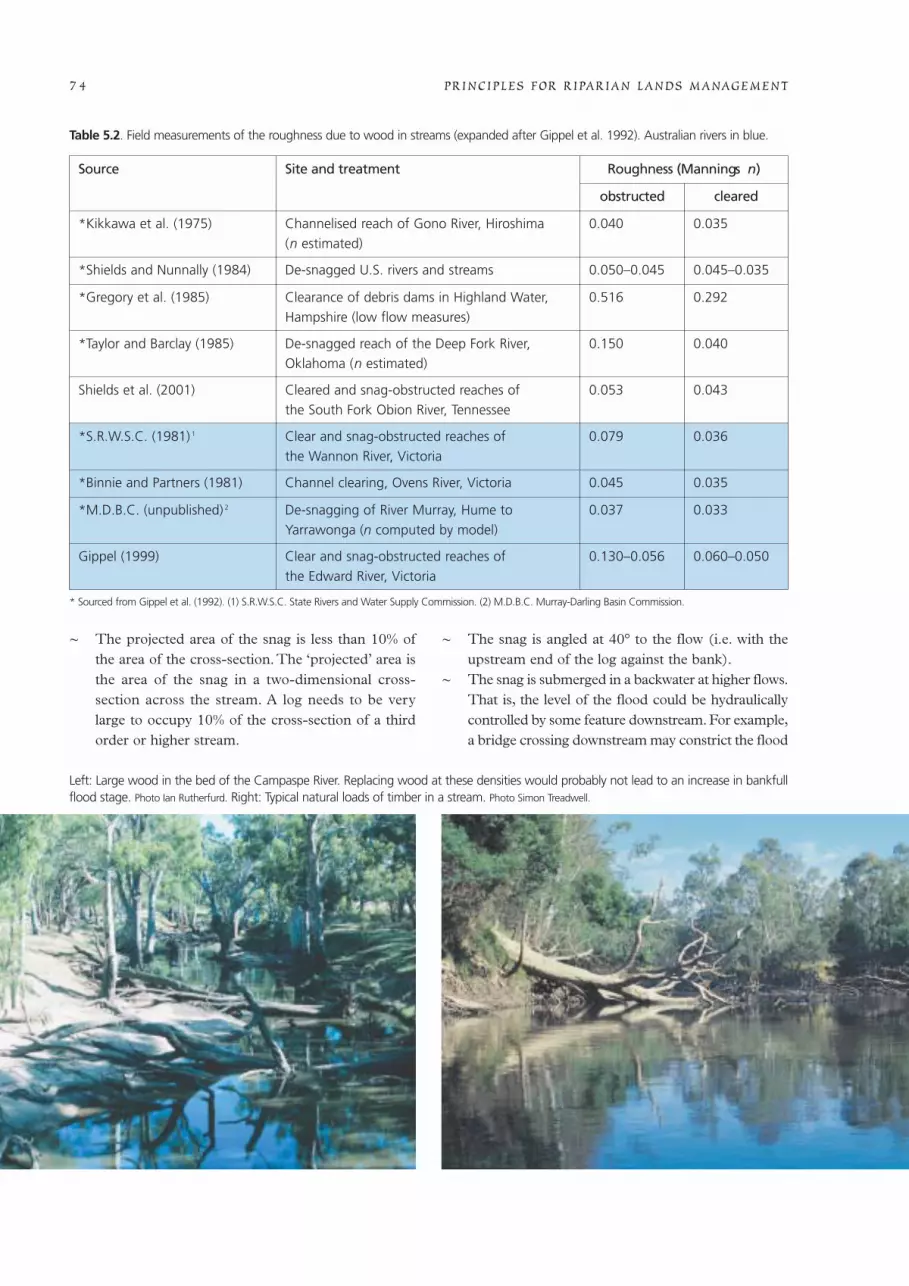
Roughness effects of large wood in streamsA comprehensive review of the literature regarding thephysical significance of wood in streams was completedby Gippel et al. (1992). With regard to the hydraulicsignificance of wood, this review, and the associated andsubsequent experimental and field results (Gippel 1995,Gippel et al. 1996a, Gippel et al. 1992, Gippel et al.1996b, Shields & Gippel 1995), represents the seminalwork in the area. In the next sections we summarise thiswork. Table 5.2, for example, illustrates that clearingtimber out of streams always reduces roughness, but the
amount varies greatly. In large channels, such as theMurray River below the Hume Dam, removing the snagsproduced only a small decrease in roughness (0.037 to0.033), whereas in the Deep Fork River in Oklahomaclearing reduced roughness from 0.15 to 0.04. Thismeans that removing snags may have only a limited effecton flooding but, as described earlier, have a major effecton channel depth, width, and on loss of aquatic habitat.
The hydraulic effect of adding large wood in streams Millions of logs have been removed from Australianstreams to reduce flooding (Erskine & Webb 2003). Weare interested now in the flood consequences of puttinglogs back into streams. In this section large wood will bereferred to as snags. Snags have a small, to insignificant,effect on the frequency or duration of large floods (i.e.perhaps greater than the 20 year flood). However, snagscan increase the duration of smaller floods (i.e. the lengthof time that floods are on the floodplain). By ‘smaller’floods we mean the 1 to 2 year events. Clearly, the largerthe snag in relation to the size of the stream, the greaterthe effect, so a given snag will have a relatively greatereffect on a smaller channel. In general, snags will notaffect even small floods when:
CHAPTER 5 Managing the effects of riparian vegetation on flooding 7 3
Figure 5.5. Sample of a roughness profile produced for a single small tree. Photo Jim Puckridge.
00
2
4
6
8
10
12
14
0.05 0.10 0.15 0.20 0.25 00
2
4
6
8
10
12
14
0 0.02 0.04
Low slope (S <0.0001 m/m)
High slope(S >0.01 m/m)
Biomass profileManning’s n
Dep
th (
m)
Frontal area m2
Slice volume m3
Trunk
Canopy
submerged
transition
canopy plus rigid trunk
rigid trunk only
~ The projected area of the snag is less than 10% ofthe area of the cross-section. The ‘projected’ area isthe area of the snag in a two-dimensional cross-section across the stream. A log needs to be verylarge to occupy 10% of the cross-section of a thirdorder or higher stream.
~ The snag is angled at 40° to the flow (i.e. with theupstream end of the log against the bank).
~ The snag is submerged in a backwater at higher flows.That is, the level of the flood could be hydraulicallycontrolled by some feature downstream. For example,a bridge crossing downstream may constrict the flood
PRINCIPLES FOR RIPARIAN LANDS MANAGEMENT7 4
Table 5.2. Field measurements of the roughness due to wood in streams (expanded after Gippel et al. 1992). Australian rivers in blue.
* Sourced from Gippel et al. (1992). (1) S.R.W.S.C. State Rivers and Water Supply Commission. (2) M.D.B.C. Murray-Darling Basin Commission.
Source Site and treatment Roughness (ManningÕs n)
obstructed cleared
*Kikkawa et al. (1975) Channelised reach of Gono River, Hiroshima (n estimated)
0.040 0.035
*Shields and Nunnally (1984) De-snagged U.S. rivers and streams 0.050–0.045 0.045–0.035
*Gregory et al. (1985) Clearance of debris dams in Highland Water, Hampshire (low flow measures)
0.516 0.292
*Taylor and Barclay (1985) De-snagged reach of the Deep Fork River, Oklahoma (n estimated)
0.150 0.040
Shields et al. (2001) Cleared and snag-obstructed reaches of the South Fork Obion River, Tennessee
0.053 0.043
*S.R.W.S.C. (1981) 1 Clear and snag-obstructed reaches ofthe Wannon River, Victoria
0.079 0.036
*Binnie and Partners (1981) Channel clearing, Ovens River, Victoria 0.045 0.035
*M.D.B.C. (unpublished) 2 De-snagging of River Murray, Hume to Yarrawonga (n computed by model)
0.037 0.033
Gippel (1999) Clear and snag-obstructed reaches of the Edward River, Victoria
0.130–0.056 0.060–0.050
Left: Large wood in the bed of the Campaspe River. Replacing wood at these densities would probably not lead to an increase in bankfullflood stage. Photo Ian Rutherfurd. Right: Typical natural loads of timber in a stream. Photo Simon Treadwell.
flow.This constriction will then produce a backwaterupstream. If a log falls within that backwater, then itwill have no hydraulic effect on flow at all during thatflood. As the flood level falls, however, the log willeventually produce its own shorter backwater. Thesame principle applies to a backwater produced by alog: if another log falls within that backwater, it willhave no hydraulic effect on flow. A rule of thumb forthis effect is that a log that is five to six log diametersupstream of another log of similar (or larger) size, willnot affect flood level, because it will be within thebackwater of the existing log.
~ Several snags in line will not produce any moreafflux than a single snag, so long as each piece islocated within two times the diameter of the nextpiece up or downstream. Thus, up to six pieces canbe placed parallel to each other in a line. In general,any piece of wood will add little extra afflux (i.e. risein water level) if it is placed within four log diametersof the next piece.
Chris Gippel has measured the effect of removing logsin several situations. The following three examplesillustrate that removing even dense piles of logs in a largestream does not produce dramatic change in water levelat bankfull flow.~ In a 30 metre wide channel, 2 metres deep, a log
20 metres long and 1 metre in diameter (i.e. blockingone third of the channel area), in a flow of 1.5 m s-1,causes a 5% increase in water surface elevation(100 millimetres).
~ Seven LWD accumulations were removed from theTumut River (40 metres wide, 2.5 metres deep) andthe effects on flow conveyance measured (Shields & Gippel 1995). Removing the snags reducedupstream water surface level by about 0.2 metres,and increased conveyance by about 20% at bankfullflow. The afflux (i.e. the backwater effect) extendedfor about 3 kilometres upstream.The effect on majorfloods would be negligible.
~ Removing 96 items of woody debris from the channelof the Lower Thomson River did not produce ameasurable effect on the height of bankfull flow.
This new understanding explains why removing one oreven several pieces of wood from a stream in mostsituations has a negligible effect on local flooding, eitherin height or duration. However, there is plenty of evidenceof the negative effects of removing wood, includingchannel deepening and widening, loss of aquatic habitat,and infilling of pools that are essential refugia oversummer low flows. Unless a hydraulic survey shows thatremoving wood will result in significant reduction in flood effects, it is best to ‘let sleeping logs lie’.
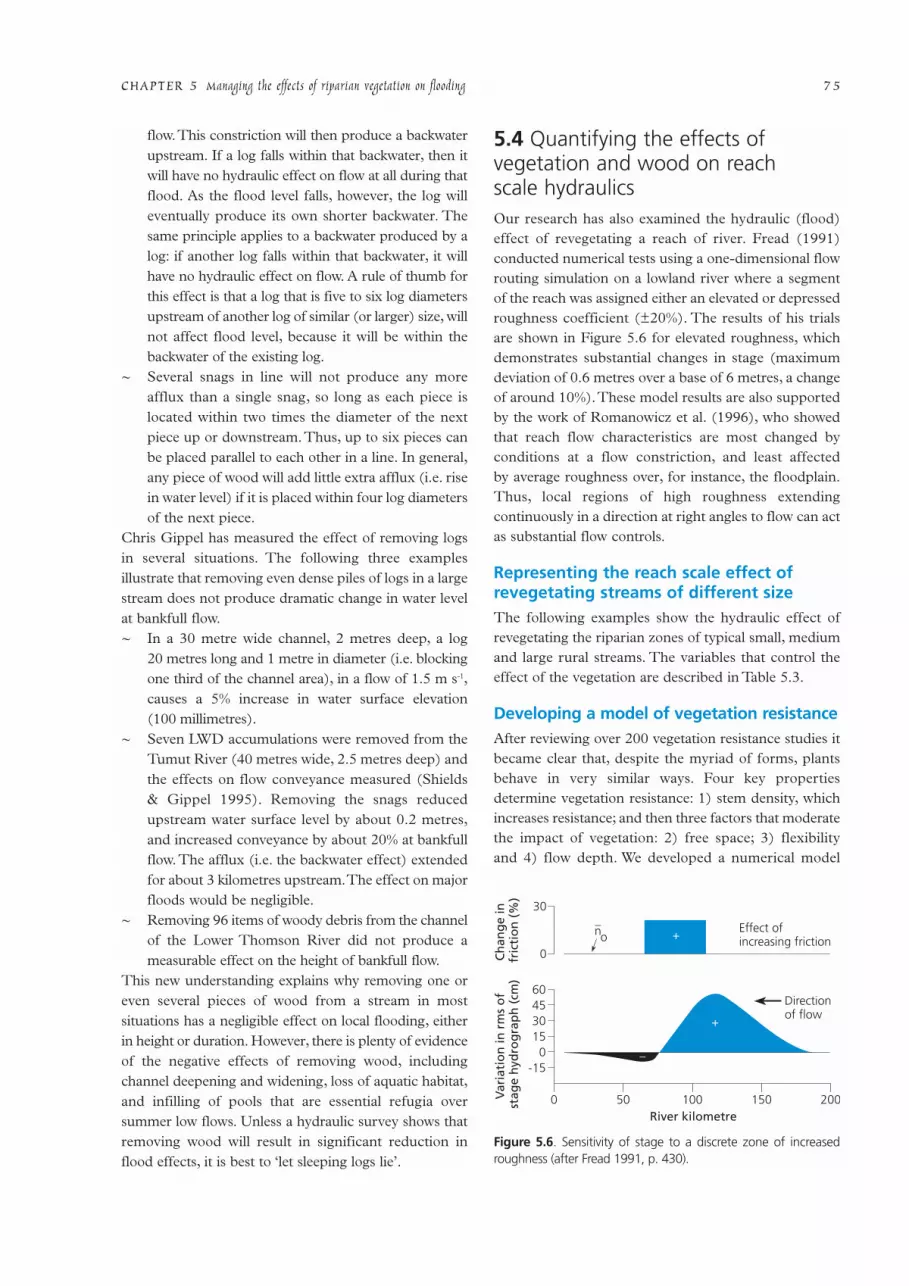
5.4 Quantifying the effects ofvegetation and wood on reach scale hydraulicsOur research has also examined the hydraulic (flood)effect of revegetating a reach of river. Fread (1991)conducted numerical tests using a one-dimensional flowrouting simulation on a lowland river where a segmentof the reach was assigned either an elevated or depressedroughness coefficient (±20%). The results of his trials are shown in Figure 5.6 for elevated roughness, whichdemonstrates substantial changes in stage (maximumdeviation of 0.6 metres over a base of 6 metres, a changeof around 10%).These model results are also supportedby the work of Romanowicz et al. (1996), who showedthat reach flow characteristics are most changed byconditions at a flow constriction, and least affected by average roughness over, for instance, the floodplain.Thus, local regions of high roughness extendingcontinuously in a direction at right angles to flow can actas substantial flow controls.
Representing the reach scale effect ofrevegetating streams of different sizeThe following examples show the hydraulic effect ofrevegetating the riparian zones of typical small, mediumand large rural streams. The variables that control theeffect of the vegetation are described in Table 5.3.
Developing a model of vegetation resistanceAfter reviewing over 200 vegetation resistance studies itbecame clear that, despite the myriad of forms, plantsbehave in very similar ways. Four key propertiesdetermine vegetation resistance: 1) stem density, whichincreases resistance; and then three factors that moderate the impact of vegetation: 2) free space; 3) flexibility and 4) flow depth. We developed a numerical model
CHAPTER 5 Managing the effects of riparian vegetation on flooding 7 5
0 10050 150 200
Effect of increasing friction
Direction of flow
Ch
ang
e in
fr
icti
on
(%
)V
aria
tio
n in
rm
s o
f st
age
hyd
rog
rap
h (
cm)
0
30
River kilometre
15304560
-150
no +
+
_
_
Figure 5.6. Sensitivity of stage to a discrete zone of increasedroughness (after Fread 1991, p. 430).
(ROVER — Resistance of Vegetation in Rivers) that
represents these vegetation characteristics in a hydraulic
model. This model allows us to estimate the effect of
vegetation on flood stage.Table 5.4 provides some more
detail on each mechanism, and gives an indication of the
size of the impact.
A feature of the resistance of plants is the wide
fluctuation with flow depth.Therefore, in ROVER, plant
resistance is described by a curve showing the variation
of Manning’s n with flow depth. The specific shape of
the curve depends on the four plant properties (via a
set of numerical relationships). The model is able to
accurately reproduce the resistance of the following
plant types: mature trees; grasses; aquatic plants; flexible
saplings (cedar, spruce and willow); and fallen timber
(snags).
How will planting riparian vegetationaffect flood height in a long reach?
A local rise in flood stage at one point will lead to adecrease in flood stage downstream due to storage. Thefirst part of the trade-off — the increase in flow depth —is readily calculated at a particular site by applyingROVER. The problem, therefore, became how toquantify the sensitivity of flood wave size to the amountof vegetation in the channel network upstream of the site. While similar sensitivity tests have been run in the past by other investigators, resistance was specified inthese tests as a single constant value, and the effect ofvegetation was added as a second constant increment.This work breaks new ground by considering vegetationresistance as a property that varies with flow depth, andchanging the resistance increment according to channel
PRINCIPLES FOR RIPARIAN LANDS MANAGEMENT7 6
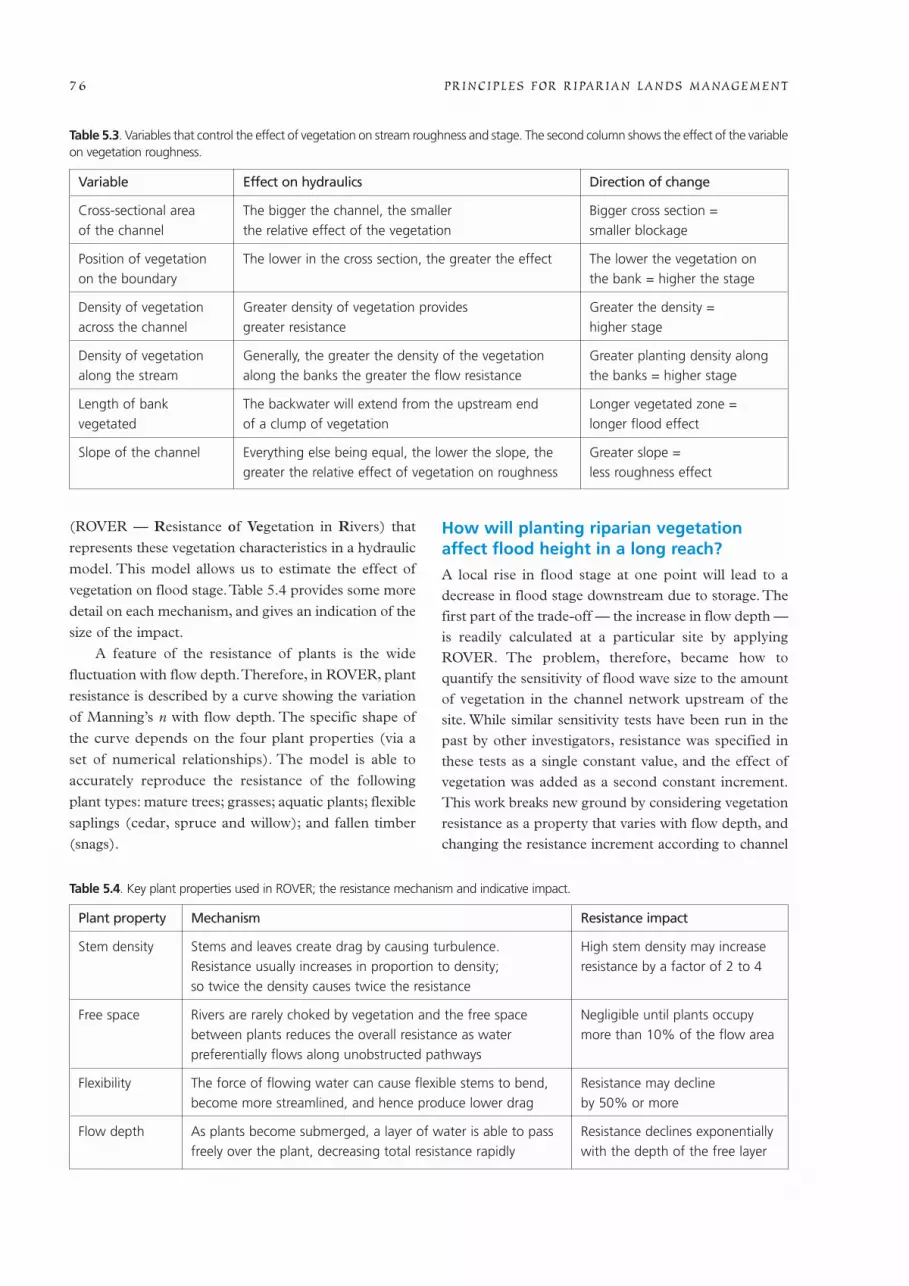
Table 5.3. Variables that control the effect of vegetation on stream roughness and stage. The second column shows the effect of the variableon vegetation roughness.
Variable Effect on hydraulics Direction of change
Cross-sectional area The bigger the channel, the smaller Bigger cross section = of the channel the relative effect of the vegetation smaller blockage
Position of vegetation The lower in the cross section, the greater the effect The lower the vegetation on on the boundary the bank = higher the stage
Density of vegetation Greater density of vegetation provides Greater the density = across the channel greater resistance higher stage
Density of vegetation Generally, the greater the density of the vegetation Greater planting density along along the stream along the banks the greater the flow resistance the banks = higher stage
Length of bank The backwater will extend from the upstream end Longer vegetated zone = vegetated of a clump of vegetation longer flood effect
Slope of the channel Everything else being equal, the lower the slope, the Greater slope = greater the relative effect of vegetation on roughness less roughness effect
Plant property Mechanism Resistance impact
Stem density Stems and leaves create drag by causing turbulence. High stem density may increase Resistance usually increases in proportion to density; resistance by a factor of 2 to 4so twice the density causes twice the resistance
Free space Rivers are rarely choked by vegetation and the free space Negligible until plants occupy between plants reduces the overall resistance as water more than 10% of the flow areapreferentially flows along unobstructed pathways
Flexibility The force of flowing water can cause flexible stems to bend, Resistance may decline become more streamlined, and hence produce lower drag by 50% or more
Flow depth As plants become submerged, a layer of water is able to pass Resistance declines exponentially freely over the plant, decreasing total resistance rapidly with the depth of the free layer
Table 5.4. Key plant properties used in ROVER; the resistance mechanism and indicative impact.
size and slope. To explore this variability required notonly high resolution flood routing (to handle thevariation of resistance with flow depth) but also a largenumber of trials.
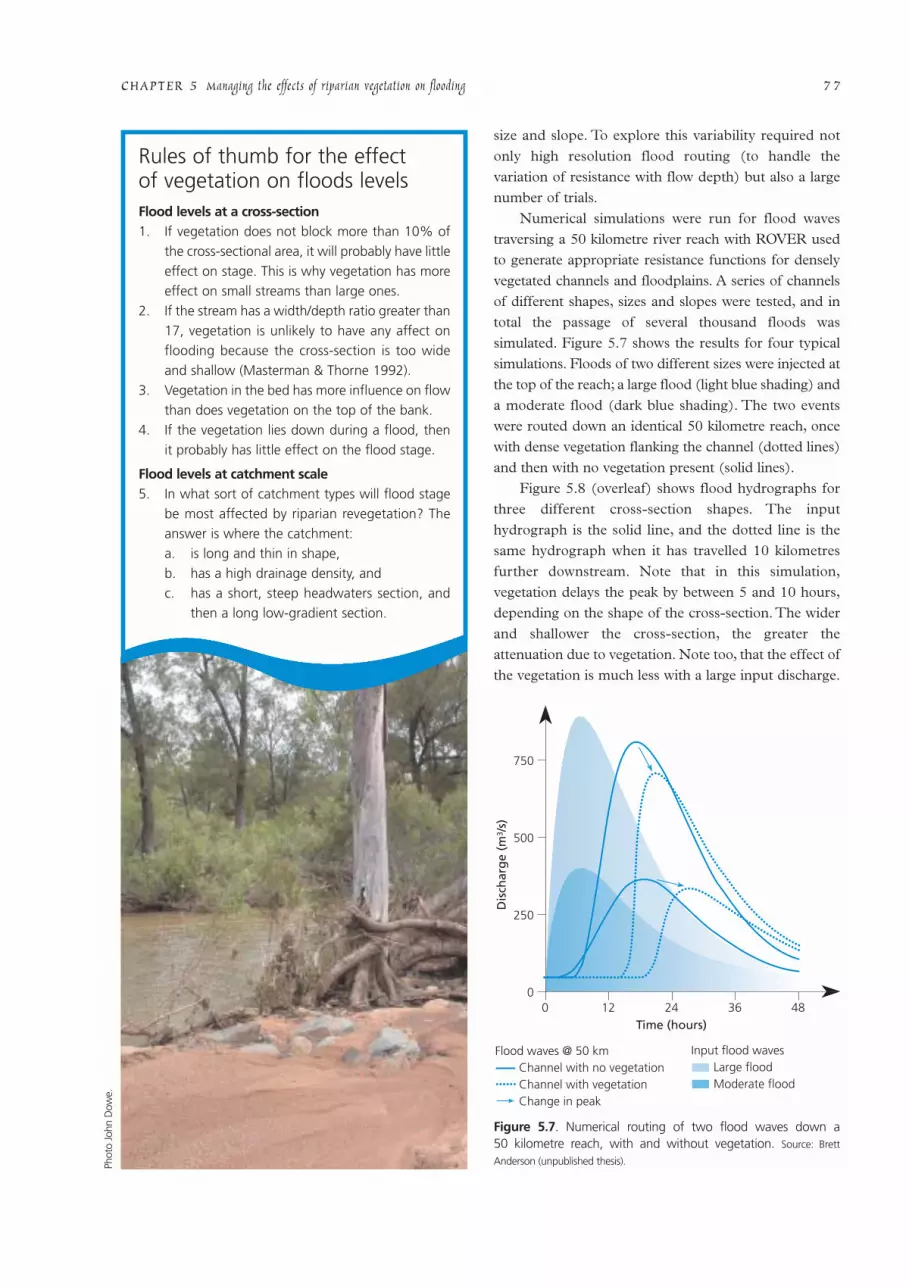
Numerical simulations were run for flood wavestraversing a 50 kilometre river reach with ROVER usedto generate appropriate resistance functions for denselyvegetated channels and floodplains. A series of channelsof different shapes, sizes and slopes were tested, and intotal the passage of several thousand floods wassimulated. Figure 5.7 shows the results for four typicalsimulations. Floods of two different sizes were injected atthe top of the reach; a large flood (light blue shading) anda moderate flood (dark blue shading). The two eventswere routed down an identical 50 kilometre reach, oncewith dense vegetation flanking the channel (dotted lines)and then with no vegetation present (solid lines).
Figure 5.8 (overleaf) shows flood hydrographs forthree different cross-section shapes. The inputhydrograph is the solid line, and the dotted line is thesame hydrograph when it has travelled 10 kilometresfurther downstream. Note that in this simulation,vegetation delays the peak by between 5 and 10 hours,depending on the shape of the cross-section. The widerand shallower the cross-section, the greater theattenuation due to vegetation. Note too, that the effect ofthe vegetation is much less with a large input discharge.
CHAPTER 5 Managing the effects of riparian vegetation on flooding 7 7
Rules of thumb for the effect of vegetation on floods levelsFlood levels at a cross-section1. If vegetation does not block more than 10% of
the cross-sectional area, it will probably have littleeffect on stage. This is why vegetation has moreeffect on small streams than large ones.
2. If the stream has a width/depth ratio greater than17, vegetation is unlikely to have any affect onflooding because the cross-section is too wideand shallow (Masterman & Thorne 1992).
3. Vegetation in the bed has more influence on flowthan does vegetation on the top of the bank.
4. If the vegetation lies down during a flood, thenit probably has little effect on the flood stage.
Flood levels at catchment scale5. In what sort of catchment types will flood stage
be most affected by riparian revegetation? Theanswer is where the catchment:a. is long and thin in shape,b. has a high drainage density, andc. has a short, steep headwaters section, and
then a long low-gradient section.
00
250
500
750
12 24Time (hours)
Dis
char
ge
(m3 /
s)
36 48
Input flood wavesLarge floodModerate flood
Flood waves @ 50 kmChannel with no vegetationChannel with vegetationChange in peak
Figure 5.7. Numerical routing of two flood waves down a 50 kilometre reach, with and without vegetation. Source: Brett
Anderson (unpublished thesis). Phot
o Jo
hn D
owe.
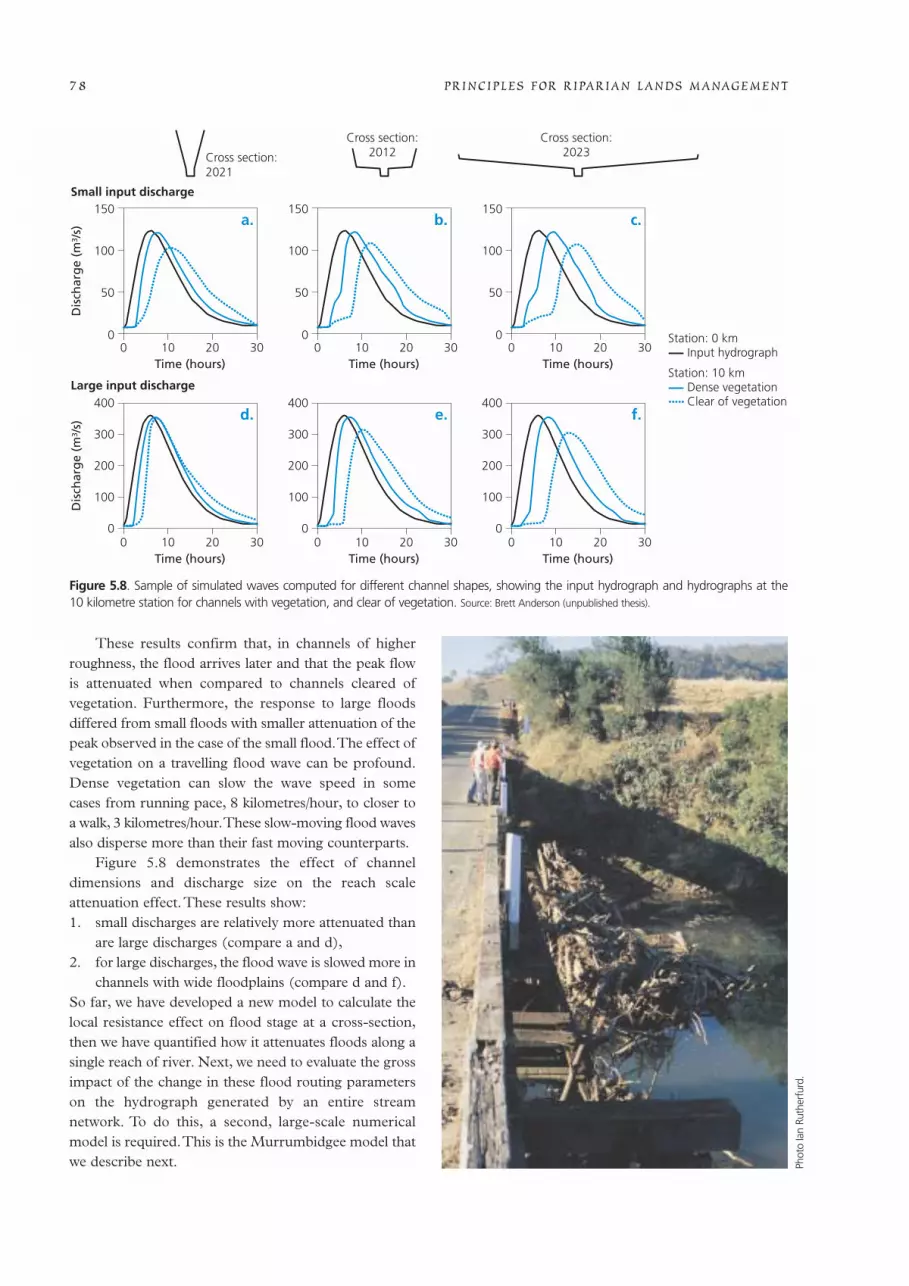
These results confirm that, in channels of higherroughness, the flood arrives later and that the peak flowis attenuated when compared to channels cleared ofvegetation. Furthermore, the response to large floodsdiffered from small floods with smaller attenuation of thepeak observed in the case of the small flood.The effect ofvegetation on a travelling flood wave can be profound.Dense vegetation can slow the wave speed in some cases from running pace, 8 kilometres/hour, to closer toa walk, 3 kilometres/hour.These slow-moving flood wavesalso disperse more than their fast moving counterparts.
Figure 5.8 demonstrates the effect of channeldimensions and discharge size on the reach scaleattenuation effect. These results show:1. small discharges are relatively more attenuated than
are large discharges (compare a and d),2. for large discharges, the flood wave is slowed more in
channels with wide floodplains (compare d and f).So far, we have developed a new model to calculate thelocal resistance effect on flood stage at a cross-section,then we have quantified how it attenuates floods along asingle reach of river. Next, we need to evaluate the grossimpact of the change in these flood routing parameterson the hydrograph generated by an entire streamnetwork. To do this, a second, large-scale numericalmodel is required.This is the Murrumbidgee model thatwe describe next.
PRINCIPLES FOR RIPARIAN LANDS MANAGEMENT7 8
00
50
100
150
10Time (hours)
20 30 00
50
100
150
10Time (hours)
20 3000
50
100
150
10Time (hours)
Dis
char
ge
(m3 /
s)D
isch
arg
e (m
3 /s)
Small input discharge
a. b. c.
d. e. f.
Cross section: 2021
Station: 0 kmInput hydrograph
Station: 10 kmDense vegetationClear of vegetation
Large input discharge
20 30
00
100
200
300
400
10Time (hours)
20 30 00
100
200
300
400
10Time (hours)
20 30 00
100
200
300
400
10Time (hours)
20 30
Cross section: 2012
Cross section: 2023
Figure 5.8. Sample of simulated waves computed for different channel shapes, showing the input hydrograph and hydrographs at the 10 kilometre station for channels with vegetation, and clear of vegetation. Source: Brett Anderson (unpublished thesis).
Phot
o Ia
n Ru
ther
furd
.
5.5 What will be the effect ofrevegetation on flooding at the scale of a whole catchmentThe detailed simulations along the 50 kilometre reaches(previous) showed that the effect of vegetation on floodrouting primarily causes variations in wave speed and inthe dispersion coefficient.Thus, by varying only the wavespeed and the dispersion coefficient we can predict thedifference between the size of a flood wave generated bychannel networks with and without riparian vegetation.The model is generic, in that it can be applied to anynetwork of channels.To demonstrate the potential impactof a whole-of-catchment revegetation project, we havechosen a set of simulations using the channel network of the upper Murrumbidgee River above Wagga Wagga.
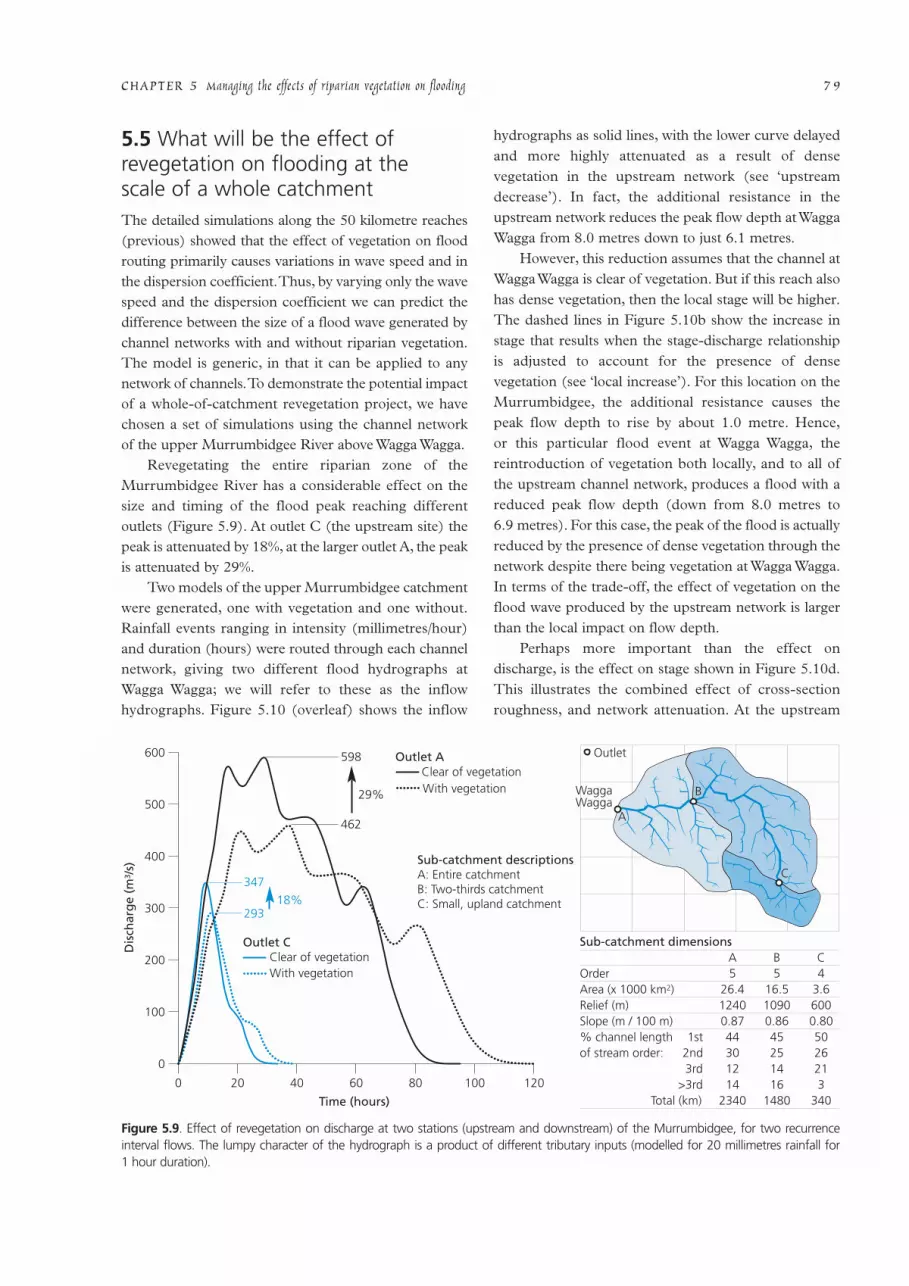
Revegetating the entire riparian zone of theMurrumbidgee River has a considerable effect on thesize and timing of the flood peak reaching differentoutlets (Figure 5.9). At outlet C (the upstream site) thepeak is attenuated by 18%, at the larger outlet A, the peakis attenuated by 29%.
Two models of the upper Murrumbidgee catchmentwere generated, one with vegetation and one without.Rainfall events ranging in intensity (millimetres/hour)and duration (hours) were routed through each channelnetwork, giving two different flood hydrographs atWagga Wagga; we will refer to these as the inflowhydrographs. Figure 5.10 (overleaf) shows the inflow
hydrographs as solid lines, with the lower curve delayedand more highly attenuated as a result of densevegetation in the upstream network (see ‘upstreamdecrease’). In fact, the additional resistance in theupstream network reduces the peak flow depth at WaggaWagga from 8.0 metres down to just 6.1 metres.
However, this reduction assumes that the channel atWagga Wagga is clear of vegetation. But if this reach alsohas dense vegetation, then the local stage will be higher.The dashed lines in Figure 5.10b show the increase instage that results when the stage-discharge relationshipis adjusted to account for the presence of densevegetation (see ‘local increase’). For this location on theMurrumbidgee, the additional resistance causes the peak flow depth to rise by about 1.0 metre. Hence,or this particular flood event at Wagga Wagga, thereintroduction of vegetation both locally, and to all of the upstream channel network, produces a flood with areduced peak flow depth (down from 8.0 metres to6.9 metres). For this case, the peak of the flood is actuallyreduced by the presence of dense vegetation through thenetwork despite there being vegetation at Wagga Wagga.In terms of the trade-off, the effect of vegetation on theflood wave produced by the upstream network is largerthan the local impact on flow depth.
Perhaps more important than the effect ondischarge, is the effect on stage shown in Figure 5.10d.This illustrates the combined effect of cross-sectionroughness, and network attenuation. At the upstream
CHAPTER 5 Managing the effects of riparian vegetation on flooding 7 9
0
100
200
300
400
500
600
Dis
char
ge
(m3 /
s)
0 20 40 60 80 100 120
Time (hours)
Outlet CClear of vegetationWith vegetation
Sub-catchment descriptionsA: Entire catchmentB: Two-thirds catchmentC: Small, upland catchment
Sub-catchment dimensions OrderArea (x 1000 km2)Relief (m)Slope (m / 100 m)% channel lengthof stream order:
A5
26.412400.8744301214
2340
1st2nd3rd
>3rdTotal (km)
B5
16.510900.8645251416
1480
C4
3.66000.805026213
340
29318%
29%
347
462
598 Outlet AClear of vegetationWith vegetation
Outlet
A
B
C
WaggaWagga
Figure 5.9. Effect of revegetation on discharge at two stations (upstream and downstream) of the Murrumbidgee, for two recurrenceinterval flows. The lumpy character of the hydrograph is a product of different tributary inputs (modelled for 20 millimetres rainfall for 1 hour duration).
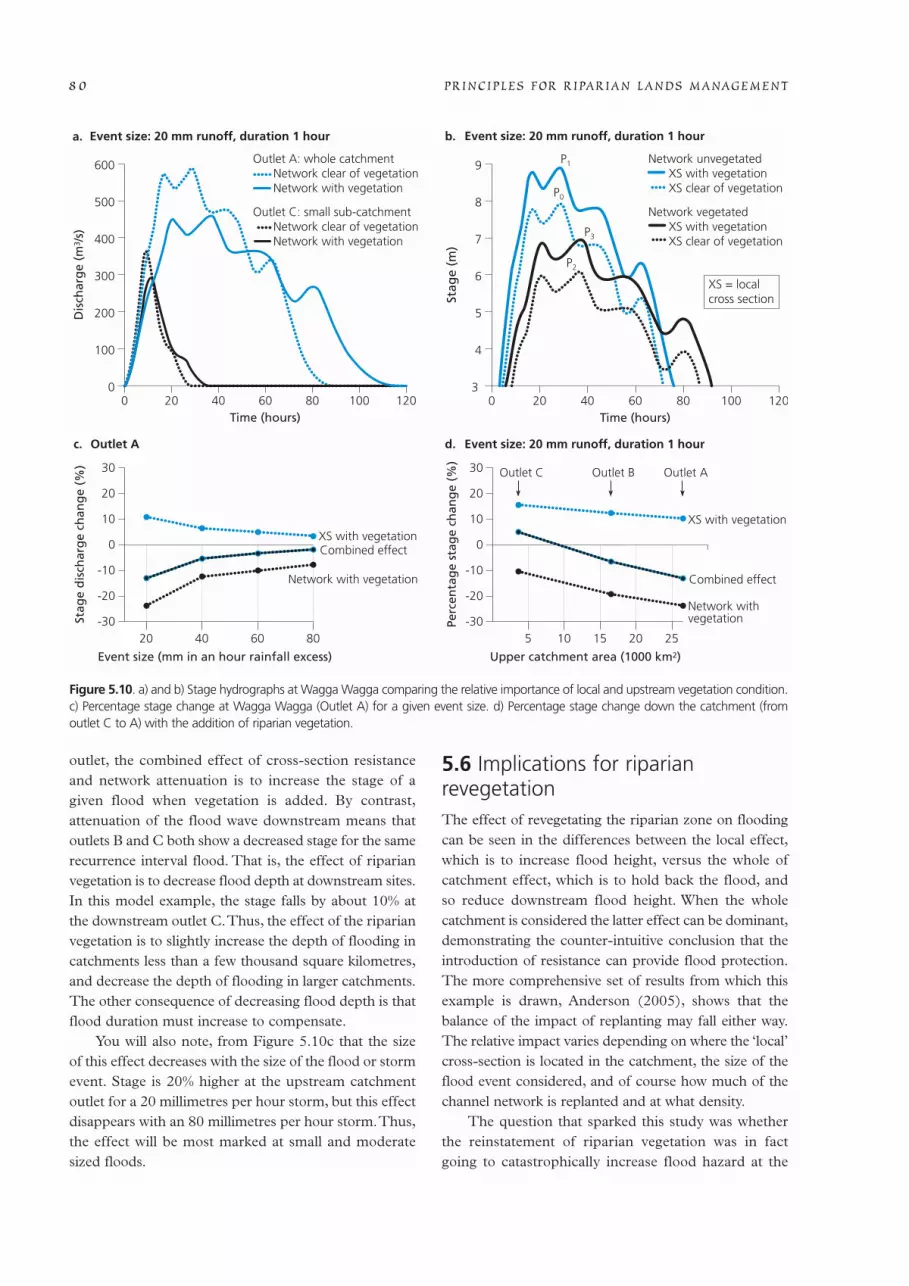
outlet, the combined effect of cross-section resistanceand network attenuation is to increase the stage of agiven flood when vegetation is added. By contrast,attenuation of the flood wave downstream means thatoutlets B and C both show a decreased stage for the samerecurrence interval flood. That is, the effect of riparianvegetation is to decrease flood depth at downstream sites.In this model example, the stage falls by about 10% atthe downstream outlet C.Thus, the effect of the riparianvegetation is to slightly increase the depth of flooding incatchments less than a few thousand square kilometres,and decrease the depth of flooding in larger catchments.The other consequence of decreasing flood depth is thatflood duration must increase to compensate.
You will also note, from Figure 5.10c that the size of this effect decreases with the size of the flood or stormevent. Stage is 20% higher at the upstream catchmentoutlet for a 20 millimetres per hour storm, but this effectdisappears with an 80 millimetres per hour storm.Thus,the effect will be most marked at small and moderatesized floods.
5.6 Implications for riparianrevegetationThe effect of revegetating the riparian zone on floodingcan be seen in the differences between the local effect,which is to increase flood height, versus the whole ofcatchment effect, which is to hold back the flood, and so reduce downstream flood height. When the wholecatchment is considered the latter effect can be dominant,demonstrating the counter-intuitive conclusion that theintroduction of resistance can provide flood protection.The more comprehensive set of results from which thisexample is drawn, Anderson (2005), shows that thebalance of the impact of replanting may fall either way.The relative impact varies depending on where the ‘local’cross-section is located in the catchment, the size of theflood event considered, and of course how much of thechannel network is replanted and at what density.
The question that sparked this study was whetherthe reinstatement of riparian vegetation was in fact going to catastrophically increase flood hazard at the
PRINCIPLES FOR RIPARIAN LANDS MANAGEMENT8 0
Event size: 20 mm runoff, duration 1 hour Event size: 20 mm runoff, duration 1 hour
Outlet A: whole catchment Network clear of vegetation Network with vegetation
Outlet C: small sub-catchment Network clear of vegetation Network with vegetation
Dis
char
ge
(m3 /
s)
XS with vegetationCombined effect
Network with vegetation
Outlet A
Outlet C
XS with vegetation
Combined effect
Network with vegetation
Upper catchment area (1000 km2)Event size (mm in an hour rainfall excess)
P3
P2
P1
P0
00 20 40 60
Time (hours)80 100 120
100
200
300
400
500
600
a. b.
Event size: 20 mm runoff, duration 1 hourd.c.
Stag
e d
isch
arg
e ch
ang
e (%
)
Perc
enta
ge
stag
e ch
ang
e (%
)
-3020 40 60 80
-20
-10
0
10
20
30St
age
(m)
3 0 20 40 60
Time (hours)80 100 120
4
5
6
7
8
9
-305 10 15 20 25
-20
-10
0
10
20
30
Network unvegetated XS with vegetation XS clear of vegetation
Network vegetated XS with vegetation XS clear of vegetation
XS = local cross section
Outlet B Outlet A
Figure 5.10. a) and b) Stage hydrographs at Wagga Wagga comparing the relative importance of local and upstream vegetation condition.c) Percentage stage change at Wagga Wagga (Outlet A) for a given event size. d) Percentage stage change down the catchment (fromoutlet C to A) with the addition of riparian vegetation.
scale of large catchments, by undoing over a century ofvegetation removal.This research provides a clear answerto this question. Even in a large catchment, the impactof total riparian revegetation could be changes in peakdepth and overbank duration in the order of 10% to 20%.
What are the impacts of riparian vegetationon flooding relative to other impacts?
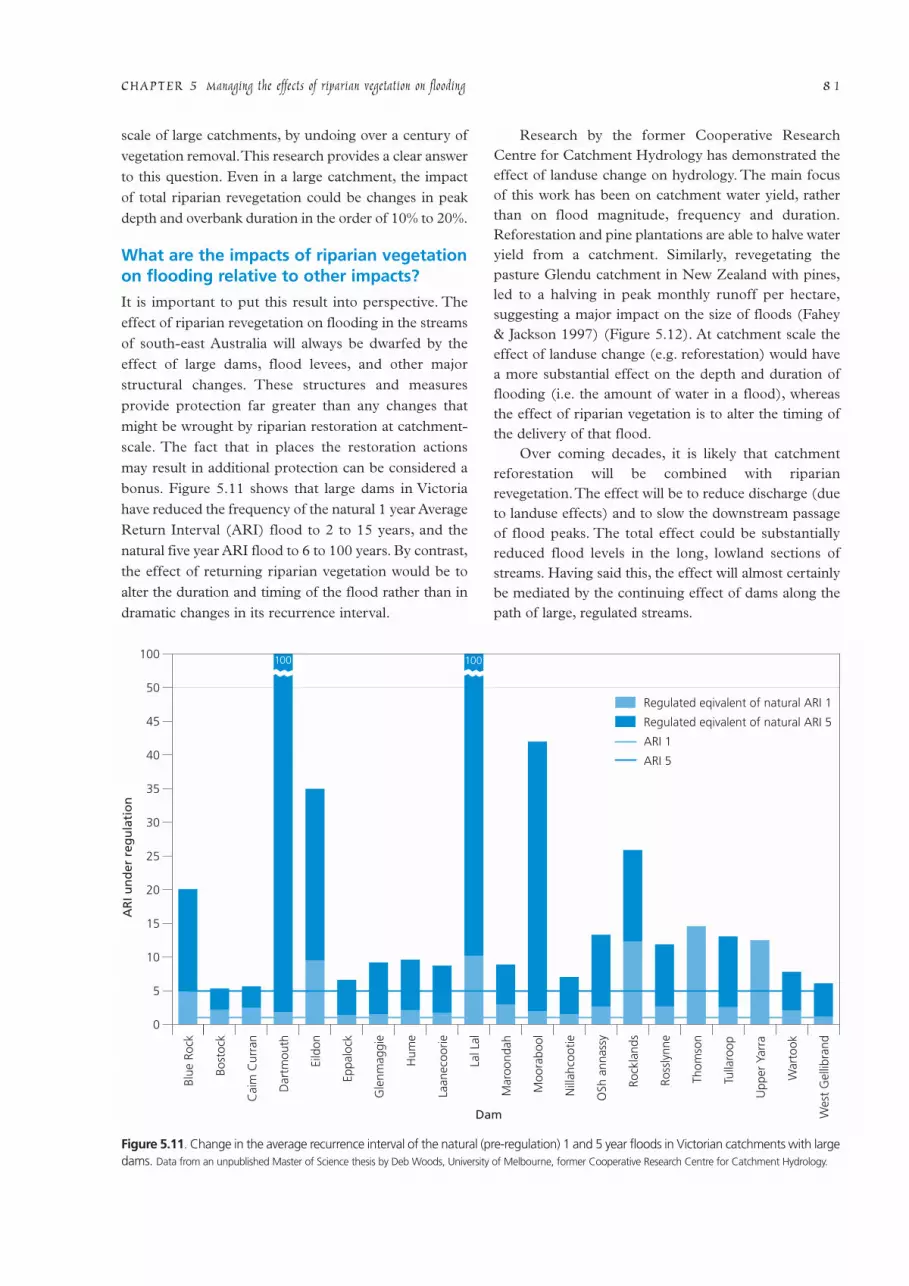
It is important to put this result into perspective. Theeffect of riparian revegetation on flooding in the streamsof south-east Australia will always be dwarfed by theeffect of large dams, flood levees, and other majorstructural changes. These structures and measuresprovide protection far greater than any changes thatmight be wrought by riparian restoration at catchment-scale. The fact that in places the restoration actions may result in additional protection can be considered abonus. Figure 5.11 shows that large dams in Victoriahave reduced the frequency of the natural 1 year AverageReturn Interval (ARI) flood to 2 to 15 years, and thenatural five year ARI flood to 6 to 100 years. By contrast,the effect of returning riparian vegetation would be toalter the duration and timing of the flood rather than indramatic changes in its recurrence interval.
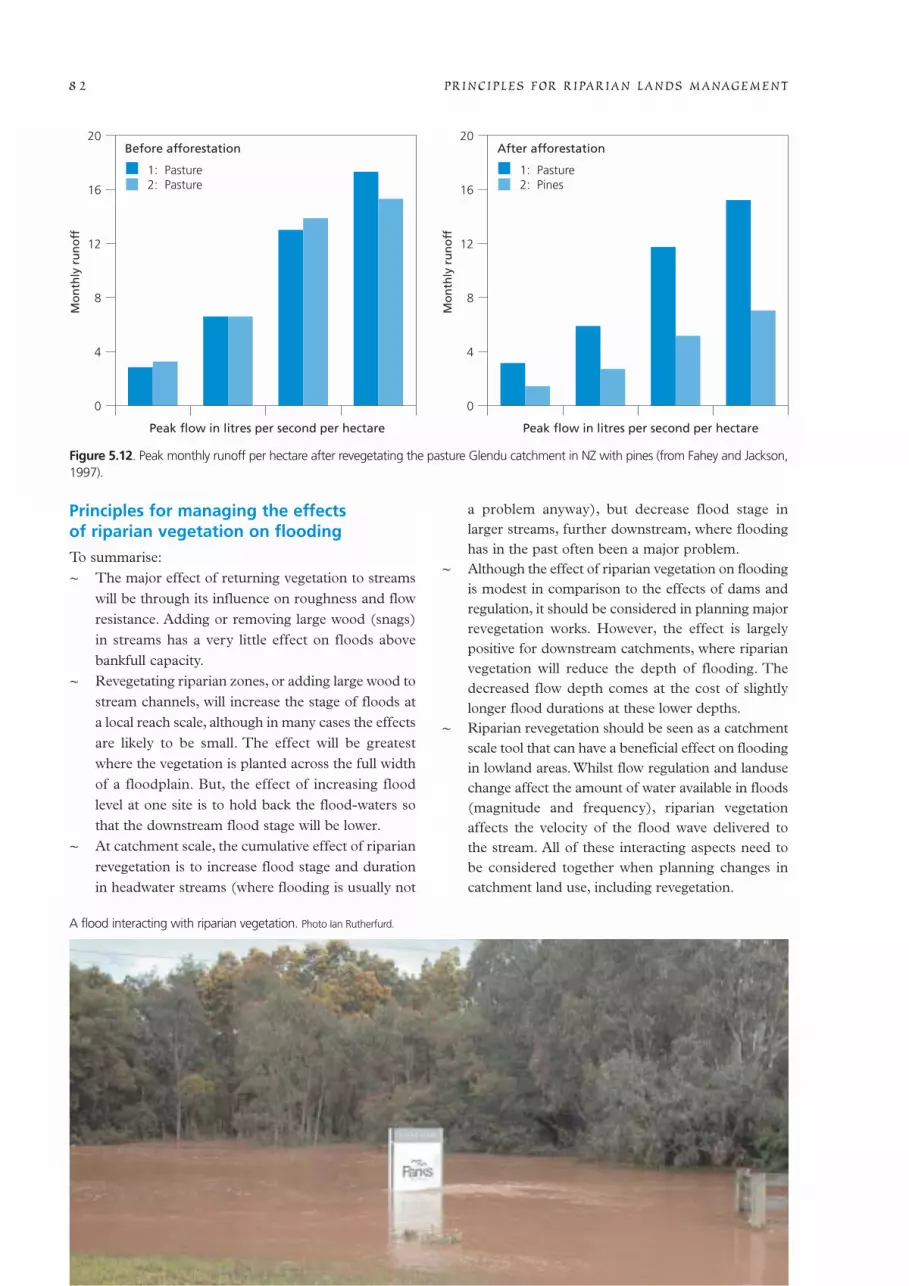
Research by the former Cooperative ResearchCentre for Catchment Hydrology has demonstrated theeffect of landuse change on hydrology. The main focusof this work has been on catchment water yield, ratherthan on flood magnitude, frequency and duration.Reforestation and pine plantations are able to halve wateryield from a catchment. Similarly, revegetating thepasture Glendu catchment in New Zealand with pines,led to a halving in peak monthly runoff per hectare,suggesting a major impact on the size of floods (Fahey& Jackson 1997) (Figure 5.12). At catchment scale theeffect of landuse change (e.g. reforestation) would havea more substantial effect on the depth and duration offlooding (i.e. the amount of water in a flood), whereasthe effect of riparian vegetation is to alter the timing ofthe delivery of that flood.
Over coming decades, it is likely that catchmentreforestation will be combined with riparianrevegetation.The effect will be to reduce discharge (dueto landuse effects) and to slow the downstream passageof flood peaks. The total effect could be substantiallyreduced flood levels in the long, lowland sections ofstreams. Having said this, the effect will almost certainlybe mediated by the continuing effect of dams along thepath of large, regulated streams.
CHAPTER 5 Managing the effects of riparian vegetation on flooding 8 1
0
5
10
15
20
25
30
35
40
45
50
100
Blue
Roc
k
Bost
ock
Cai
m C
urra
n
Dar
tmou
th
Eild
on
Eppa
lock
Gle
nmag
gie
Hum
e
Laan
ecoo
rie
Lal L
al
Mar
oond
ah
Moo
rabo
ol
Nill
ahco
otie
OíSh
anna
ssy
Rock
land
s
Ross
lynn
e
Thom
son
Tulla
roop
Upp
er Y
arra
War
took
Wes
t G
ellib
rand
AR
I un
der
reg
ula
tio
n
Regulated eqivalent of natural ARI 1
Regulated eqivalent of natural ARI 5
ARI 1
ARI 5
Dam
100 100
Figure 5.11. Change in the average recurrence interval of the natural (pre-regulation) 1 and 5 year floods in Victorian catchments with largedams. Data from an unpublished Master of Science thesis by Deb Woods, University of Melbourne, former Cooperative Research Centre for Catchment Hydrology.
Principles for managing the effects of riparian vegetation on flooding
To summarise:~ The major effect of returning vegetation to streams
will be through its influence on roughness and flowresistance. Adding or removing large wood (snags)in streams has a very little effect on floods abovebankfull capacity.
~ Revegetating riparian zones, or adding large wood tostream channels, will increase the stage of floods ata local reach scale, although in many cases the effectsare likely to be small. The effect will be greatestwhere the vegetation is planted across the full widthof a floodplain. But, the effect of increasing floodlevel at one site is to hold back the flood-waters sothat the downstream flood stage will be lower.
~ At catchment scale, the cumulative effect of riparianrevegetation is to increase flood stage and durationin headwater streams (where flooding is usually not
a problem anyway), but decrease flood stage inlarger streams, further downstream, where floodinghas in the past often been a major problem.
~ Although the effect of riparian vegetation on floodingis modest in comparison to the effects of dams andregulation, it should be considered in planning majorrevegetation works. However, the effect is largelypositive for downstream catchments, where riparianvegetation will reduce the depth of flooding. Thedecreased flow depth comes at the cost of slightlylonger flood durations at these lower depths.
~ Riparian revegetation should be seen as a catchmentscale tool that can have a beneficial effect on floodingin lowland areas. Whilst flow regulation and landusechange affect the amount of water available in floods(magnitude and frequency), riparian vegetationaffects the velocity of the flood wave delivered to the stream. All of these interacting aspects need to be considered together when planning changes incatchment land use, including revegetation.
PRINCIPLES FOR RIPARIAN LANDS MANAGEMENT8 2
0
4
8
12
16
20
0
4
8
12
16
20Before afforestation
1: Pasture2: Pasture
1: Pasture2: Pines
After afforestation
Peak flow in litres per second per hectare
Mo
nth
ly r
un
off
Mo
nth
ly r
un
off
Peak flow in litres per second per hectare
Figure 5.12. Peak monthly runoff per hectare after revegetating the pasture Glendu catchment in NZ with pines (from Fahey and Jackson,1997).
A flood interacting with riparian vegetation. Photo Ian Rutherfurd.

ReferencesAbbe, T.B. & Montgomery, D.R. 1996, ‘Large woody debris
jams, channel hydraulics and habitat formation in largerivers’, Regulated Rivers: Research & Management, vol. 12,pp. 210–21.
Anderson, B.G. 2005, On the impact of riparian vegetation on catchment scale flooding characteristics, PhD thesis,University of Melbourne.
Bathurst, J.C. 1993, ‘Flow resistance through the channelnetwork’, in K. Beven & M.J. Kirkby (eds), ChannelNetwork Hydrology, pp. 69–98, John Wiley & Sons Ltd.
Beschta, R.L. 1979, ‘Debris removal and its effects onsedimentation in an Oregon coast range stream’, NorthwestScience, vol. 53, pp. 71–77.
Brookes, A. 1988, Channelized Rivers: Perspectives forenvironmental management, 326 pages, John Wiley & Sons.
Brooks, A. 1999a, ‘Large Woody Debris and the geomor-phology of a perennial river in southeast Australia’, paperpresented at Second Australian Stream ManagementConference, Cooperative Research Centre for CatchmentHydrology, Adelaide, South Australia.
Brooks, A. 1999b, ‘Lessons for river managers from the fluvialTardis (Direct insight into post-European channel changesfrom a near-intact alluvial river)’, paper presented atSecond Australian Stream Management Conference,Cooperative Research Centre for Catchment Hydrology,Adelaide, South Australia.
Brooks, A.P. et al. 2003, ‘The long-term control of vegetationand woody debris on channel and flood-plain evolution:Insights from a paired catchment study in southeasternAustralia’, Geomorphology, vol. 51, pp. 7–29.
Buffington, J.M. et al. 2002, ‘Controls on the size andoccurrence of pools in coarse-grained forest rivers’, RiverResearch and Applications (in press).
Burkham, D.E. 1976, ‘Hydraulic effects of changes in bottom-land vegetation on three major floods, Gila River in South-Eastern Arizona’, United States Geological SurveyProfessional Paper 655-J, U.S.G.S, US Department of theInterior,Washington, DC.
Erskine, D.W. & Webb, A.A. 2003, ‘Desnagging to resnagging:new directions in river rehabilitation in southeasternAustralia’, River Research and Applications, vol. 19,pp. 233–49.
Fetherston, K.L. et al. 1995, ‘Large woody debris, physicalprocess, and riparian forest development in montane rivernetworks of the Pacific Northwest’, Geomorphology,vol. 13, pp. 133–44.
Fread, D.L. 1991, ‘Flood Routing Models and the Manning n’,in B.C. Yen (ed.), Channel Flow Resistance: Centennial ofManning’s formula, pp. 421–35, Water ResourcesPublications, Littleton, Colorade, USA.
Gippel, C.J. 1995, ‘Environmental hydraulics of large woodydebris in streams and rivers’, Journal of EnvironmentalEngineering, pp. 338–95.
Gippel, C.J. 1999, ‘Edward River: Hydraulic effect of snags andmanagement options’, Report by Fluvial Systems Pty Ltd,Melbourne, Vic. to NSW Department of Land and WaterConservation, Albury, NSW.
Gippel, C.J. et al. 1996a, ‘Distribution and hydraulicsignificance of large woody debris in a lowland AustralianRiver’, Hydrobiologia, vol. 318, pp. 179–94.
Gippel, C.J. et al. 1992, The Hydraulic Basis of SnagManagement, 116 pages, University of Melbourne,Melbourne.
Gippel, C.J. et al. 1996b, ‘Hydraulic guidelines for there-introduction and management of large woody debris inlowland rivers’, Regulated Rivers:Research and management,vol. 12, pp. 223–36.
Gurnell, A.M. & Gregory, W.J. 1981, ‘The influence ofvegetation on stream channel processes’, in T.P. Burt & D.E. Walling (eds), Catchment Experiments inGeomorphology, pp. 515–35, Geo Books, Norwich, UK.
Harmon, M.E. et al. 1987, ‘Coarse woody debris in mixed-conifer forests, Sequoia National Park, California’,Canadian Journal of Forest Research, vol. 17, pp. 1265–72.
Helmio, T. 2002, ‘Unsteady 1D flow model of compoundchannel with vegetated floodplains’, Journal of Hydrology,vol. 269, pp. 89–99.
Hortle, K.G. & Lake, P.S. 1983, ‘Fish of channelized andunchannelized sections of the Bunyip River, Victoria’,Australian Journal of Marine and Freshwater Research,vol. 34, pp. 441–50.
Keller, E.A. & Swanson, F.J. 1979, ‘Effects of large organicmaterial on channel form and fluvial processes’, EarthSurface Processes, pp. 361–80.
Knight, D.W. & Hamed, M.E. 1984, ‘Boundary shear insymmetrical compound channels’, Journal of theHydraulics Division, ASCE, vol. 110, pp. 1412–26.
Knight, D.W. & Shiono, K. 1996, ‘River channel and floodplainhydraulics’, in M.G. Anderson,Walling, D.E. & Bates, P.D.(eds), Floodplain Processes, pp. 139–81, Wiley, Chichester;New York.
Malanson, G.P. & Butler, D.R. 1990, ‘Woody debris, sediment,and riparian vegetation of a subalpine river, Montana,USA’, Arctic and Alpine Research, vol. 22, pp. 183–94.
Marsh, N. et al. 1999, ‘Large woody debris in some Australianstreams: natural loadings, distribution and morphologicaleffects’, in I.D. Rutherfurd & R. Bartley (eds), SecondAustralian Stream Management Conference, pp. 427–32,Cooperative Research Centre for Catchment Hydrology,Adelaide, South Australia.
Marsh, N. et al. 2001, ‘Enhancing instream habitat with largewoody debris: a flume experiment’, paper presented atThird Australian Stream Management Conference,CRCCH, Brisbane, Australia.
Marston, R.A. 1982, ‘The geomorphic significance of log stepsin forest streams’, Annals of the Association of AmericanGeographers, vol. 72, pp. 99–108.
Mason, R.R. et al. 1990, Effects of Channel Modifications onthe Hydrology of Chicod Creek Basin, North Carolina,1975–87, U.S. Geological Survey, with U.S. Departmentof Agriculture, Soil Conservation Service.
Masterman, R. & Thorne, C.R. 1992, Predicting influence ofbank vegetation on channel capacity, Journal of HydraulicEngineering, vol. 118, pp. 1052–58.
Montgomery, D.R. & Piegay, H. 2003, ‘Wood in Rivers:Interactions with channel morphology and processes’,Geomorphology, vol. 51, pp. 1–5.
Naot, D. et al. 1996, ‘Hydrodynamic behaviour of partlyvegetated open channels’, Journal of Hydraulic Engineering,ASCE, vol. 122, pp. 625–33.
CHAPTER 5 Managing the effects of riparian vegetation on flooding 8 3

Richmond, A.D. & Fausch, K.D. 1995, ‘Characterisitics andfunction of large woody debris in sub-alpine RockyMountain streams in northern Colorado’, CanadianJournal of Fisheries and Aquatic Science, vol. 52,pp. 1789–1802.
Robison, E.G. & Beschta, R.L. 1990, ‘Identifying trees inriparian areas that can provide coarse woody debris tostreams’, Forest Science, vol. 36, pp. 790–801.
Romanowicz, R. et al. 1996, ‘Bayesian calibration of floodinundation models’, in M.G. Anderson et al. (eds),Floodplain Processes, pp. 333–60, John Wiley & Sons Ltd.
Shankman, D. & Pugh, T.B. 1992, ‘Discharge response tochannelization of a coastal plain stream’, Wetlands, vol. 12,pp. 157–62.
Shields, F.D. & Gippel, C.J. 1995, ‘Prediction of effects ofwoody debris removal on flow resistance’, Journal ofHydraulic Engineering, vol. 121, pp. 341-354.
Shields, F.D.J. et al. 2001, ‘Effect of Large Woody DebrisStructures on Stream Hydraulics’, paper presented at Conference on Wetlands Engineering and RiverRestoration, American Society of Civil Engineers, Reston,VA.
Vennard, J. K. & Street, R.L. 1982, Elementary Fluid Mechanics,Sixth edition, SI Version ed., John Wiley & Sons, Toronto.
Watson, D. 1987, ‘Hydraulic effects of aquatic weeds in UKrivers’, Regulated Rivers: Research and management, vol. 1,pp. 211–77.
Webb, A.A. & Erskine, W.D. 2001, ‘Large woody debris,riparian vegetation and pool formation on sand-bed, foreststreams in south-eastern Australia’, paper presented at the Third Australian Stream Management Conference,Cooperative Research Centre for Catchment Hydrology,Brisbane, Queensland.
Webb, A.A. & Erskine, W.D. 2003, ‘Distribution, recruitment,and geomorphic significance of large woody debris in an alluvial forest stream: Tonghi Creek, southeasternAustralia’, Geomorphology, vol. 51, pp. 109–26.
Yen, B.C. 1991, ‘Hydraulic resistance in open channels’, in B.C. Yen (ed.), Channel Flow Resistance: Centennial of Manning’s formula, pp. 1–135, Water ResourcesPublications, Littleton, Colorado, U.S.A.
PRINCIPLES FOR RIPARIAN LANDS MANAGEMENT8 4