chapter 1 introduction ctsi logistics philippines
TRANSCRIPT

Chapter 1
Introduction
CTSI Logistics Philippines, an International freight
forwarding company service in the Philippines. It is one of the
biggest transporting Companies with a good reputation & has
established great relationships with 147 worldwide associates,
officials & organizations across the world. The company owned a
three story warehouse and office facilities measuring 180,000 sq.
ft and 70,000 sq. ft open area allowing easy ingress/egress of
trucks and container vans and safe loading/unloading of cargo
strategically located at CTSI Head Office, Cargo Center 1 & 2,
Km. 14, West Service Road, Merville Pranaque City, Philippines.
CTSI Logistics also owned sub major Warehouse strategically
located in Clark Subic, Cebu, Cagayan De Oro, and Davao
CTSI Logistics was established in 1989, and has been honed
and tested through 22 years of having served world class US
apparel brands including Polo Ralph Lauren, Liz Claiborne,
Limited, Nautica, and Nike. CTSI Logistics started as a fledging
freight forwarding that quickly rose above the rest by delivering
1

most comprehensive, innovative and personalized transport service
headed by the CEO Jerry L. Tan, and in the Philippine Logistics
Specialist for Operation and Distribution Ann Stephanie T.
Tapales. The company also expanded their capabilities to include
other products like electronics, aircraft parts, perishables,
pharmaceuticals, medical equipment and dangerous goods.
CTSI Logistics strong partnership with major airlines like
China Airlines, Korean Air, Philippine Airlines, Continental
Airlines, and Saudia among others and have been honored by Korean
Air and China Airlines as one of the Top Business partners based
on cargo tonnage uplifted. CTSI Logistics also develop relations
with major international ocean carriers such as MOL (Mitsui
O.S.K. Line), OOCL, Hyundai.
CTSI Logistics offers a comprehensive range of services to
facilitate freight deliveries that are on time & are cost
effective. Delivering Import and Export cargo by land, sea or
air, Door to Door Services, Custom Clearance, CTSI Logistics
committed itself early on to provide unmatched service in the
local & international transport industry; focusing on strict
quality control to provide total customer satisfaction.
2

Background of the Study
CTSI Logistics offers a wide variety of services to suit the
client’s requirements. It vision is to provide and recognize
quality comprehensive global logistics services that responds in
order to continued growth, prosperity and long term stability to
our client’s increasingly sophisticated logistical needs.
In order to deliver their mission in providing quality
service, they must be able to do so in a quick and efficient
manner. However, given the current problems that CTSI is facing,
it is unable to do so. Queuing Delay in Poor Product Handling and
Facilities Allocation results in long holding time and high lead
inventory and In-transit cost.
In Supply chain logistics, it starts in the International
receiving of the package box from the International freight
forwarding company. All the collected Boxes must past the
standard size of 24″ x 24″ x 35”. Customer must have proper
declaration of the stuff inside the box for Custom Reason. After
passing the Custom clearance, Barcode encoding is done in every
boxes and declaration in the cargo manifest, before it is store
in the cargo containers The Cargo cut-off every Thursday noon and
depart once a week. As technology moves, Cargo Containers are now
3

equipped with GPS tracking systems until it bound to our
Philippine Port in North Harbor or Subic Freeport. In the
seaport, release clearance (Purchase Order, Waybill Information,
and ASN validation) must be acquired before the chassy is
transferred and loaded in the waiting area. The problem starts
in the cargo waiting area in the warehouse. One chassy contains
three hundred twelve (312) boxes stack in (27L x 4W x 3H). Poor
material handling of cargo due to long unloading time and check
in time due to issuing of Universal Product Code (UPC). The
issuing of the UPC using a portable hand held barcode with
printer. Jamming of the printed sticker from the hand held
machine and poor handling of the stacker of the printed UPC
leading to damage because of peeling of sticker from the base
paper, scattering of ink in the printed UPC. This lead to high
inventory cost and in transit cost of the company. Another
factor that affects the queuing is the mismanagement of the
warehouse due to poor stocking leading to misallocation and
allocation of storage of the product. This keeps the product in
long holding time and additional to facilities cost and slow pace
operation of the company.
4

This study shall focus on formulating mathematical solutions
using operation research II technique in order to minimize the
queuing in the supply chain output. This shall gather all the
necessary data to be able to come up with the best solution in
maximizing the company profit.
Problem Statement
CTSI Logistics Philippines is experiencing 13.49 % Delay in
operation of warehouse 1 amounting to PHP 125,385.36
Objectives of the study
To eliminate the 13.49% delay in the operation of warehouse
1 amounting to PHP 125,385.36
Specific Objective:
To reduce the delay caused by cumulative effect of long
queue
To improve the current queuing system used in the agency
5

To improve the supply chain and maximize the operation cost
of the company
Scope and Limitations
The scope of the study is limited to CTSI Logistics
Philippines Warehouse Facility 1 at the working area and its
workers. The actual observation will focus in the working area,
from the queuing of the packages from inbound to warehouse of
Docking Station 1. There will be a series of actual observations
and data gathering. It is limited to a maximum of 8 hours and can
be extended upon the needs and requests of the observers. The
observation and data analysis is based on the time study and data
forecasted conducted and accompanied by the observer.
Methodology
The following methods were used in gathering data and
information to analyze and interpret the problem which the store
encounters.
6

Interview with the Marketing and Supply Chain Logistics
Specialist for Operation and the Operation personnel
With the help of the Marketing and Supply Chain
Logistics Specialist for Operation Ms. Ann Stephanie T.
Tapales and the operations personnel, the observer was
provided with data (logbook profile, manifest history,
summary reports, and tracking records etc.) needed to
clearly understand the background of the problem situation.
Some questions that were asked:
How many trucks and machines do you have?
Are the trucks experiencing breakdowns? How frequent?
What is the actual capacity of the company warehouse?
Internet and Literature Research
A Research was utilized to provide the observer with
necessary information to clearly understand the existing
problem situation of the company. Internet Researches is
useful for the terminologies of the unfamiliar words,
Reading books regarding time and motion study helps to
7

understand the problem and to learn the different techniques
in solution to the said problem.
Sample thesis
Sample thesis and study regarding logistics
improvement was utilized as a reference on how the study
will make use of the information necessary for the
completion of the project.
Actual observation
The actual observation in the CTSI Logistics
Philippines will suggest an alternative course of action for
the problems detected in the operation. It is an overlook
for computing values.
1. Forecasting. Eight (8) hours of observation
in Operation Time.
2. Observation of occurrence of the long
process in Storing, holding and in transit
time.
Significance of the Study
8

To the Company, the study will continually help to improve
the Company Supply Chain Management and to be able to have an
easy process in logistics operation.
To the Industrial engineering students, the study will serve
as a guide and background concentrating on Operations Research II
and Supply Chain Management that can be used for future reference
and studies.
To the Workers, the study will help the workers to make
their job easier and more productive.
To the Readers, the study will help the readers most
especially those who are encountering the same problem in the
freight services how to resolve the problem.
To the Researchers, the study will provide a venture for the
researchers to apply what they have learned in Operation
Research, Engineering Management and Motion and Time Study. The
observations and warehouse visit will be an experience and an
introduction for the real life industry practice.
Definition of terms
ASN – Automatic Serial Number, a unique control Number
printed in the Box of the Package
9

Chassy – a 40ft, 44,000 lbs rectangular steel box used for
transporting goods from one place to another.
Customer –is usually used to refer to a current and
potential client of an individual organization.
Forecasting is the process of making statements about events
whose actual outcomes have not yet been observed.
Inquiry –is any process that has the aim of augmenting
knowledge, resolving doubt, or solving a problem.
Logistics is the management of the flow of goods between the
point of origin and the point of destination in order to meet the
requirements of customers or corporations.
Queuing – oldest and the most quantitative technique most
widely used in the study of waiting lines
Universal Product Code (UPC) – general term for barcode
consist of unique number and printer bars and intervening spaces
that represents product identification.
Warehouse - is a commercial building or facilities for
storage of goods and products.
10

11

CHAPTER 2
REVIEW OF RELATED LITERATURE
Logistics is the organization of the flow of goods between
the point of origin and the point of destination in order to meet
the requirements of customers or corporations.
Logistics involves the combination of information,
transportation, inventory, warehousing, and material handling,
delivery, idle or holding constraints, routing, packaging and
often security. Logistics is a channel of the supply chain which
adds the value of time and place utility. Today the complexity of
production logistics can be modeled, analyzed, visualized and
optimized by plant simulation software, but is constantly
changing. This can involve anything from consumer goods such as
food, to IT materials, to aerospace and defense equipment.
Logistics is one of the main functions within a company. The
main targets of logistics can be divided into performance related
and cost related. They are high due date reliability, short
delivery times, low inventory level and high capacity
utilization. But when decisions need to be made, there is always
12

a tradeoff between these targets. This is what makes being a
logistician challenging and interesting.
The term production logistics is used to describe logistic
processes within an industry. The purpose of production logistics
is to ensure that each machine and workstation is being fed with
the right product in the right quantity and quality at the right
time. The concern is not the transportation itself, but to
streamline and control the flow through value-adding processes
and eliminate non–value-adding ones. Production logistics can be
applied to existing as well as new plants. Manufacturing in an
existing plant is a constantly changing process. Machines are
exchanged and new ones added, which gives the opportunity to
improve the production logistics system accordingly.
Production logistics is becoming more important with
decreasing batch sizes. In many industries (e.g. mobile phones),
a batch size of one is the short-term aim, allowing even a single
customer's demand to be fulfilled efficiently. Track and tracing,
which is an essential part of production logistics due to product
safety and product reliability issues is also gaining importance,
especially in the automotive and medical industries.
13

In queuing which is the oldest form and the most widely used
technique in quantitative analysis. The three basic qualities of
queuing are the arrivals, service facilities, and the actual
waiting line. Most ideal problems are focused on finding the
ideal level of the service a firm should provide.
1
CHAPTER 31 Baziotopoulos (2008). An Investigation of Logistics Outsourcing Practices In the Greek Manufacturing Sector. PhD thesis
14

PRESENTATION OF GATHERED DATA
Table 2.1 Benchmark Queuing Analysis At the Warehouse 1 CTSI
Logistics CCFD-001 and Warehouse 2 CTSI Logistics CCFD-002
INBOUND
Warehouse
1
Warehouse
2
Average Chassy Arriving (Unit/Day) 2 2
Average Time each Chassy waits to be
Unloaded 9.71 8.4
Total Chassy Hour Lost per Day 19.42 16.8
Estimated Cost of Idle Chassy
(PHP/Hour) 1500 1500
Chassy Time Cost (Waiting time Cost in
PHP) 29,130 25,200
CTSI Logistics Wages and Services Cost
(PHP/day) 15,000 15,000
Total Expected Cost Per Day (PHP) 44,130 36,293.41
Total Expected Cost Per Week (PHP)(4
shipment) 176,520 415,173.67
Total Expected Cost Per Month (PHP) 706,080 580694.64
Cost Difference125,385.36
Service time Difference1.31 hours
Service time Percentage Difference13.49 %
15
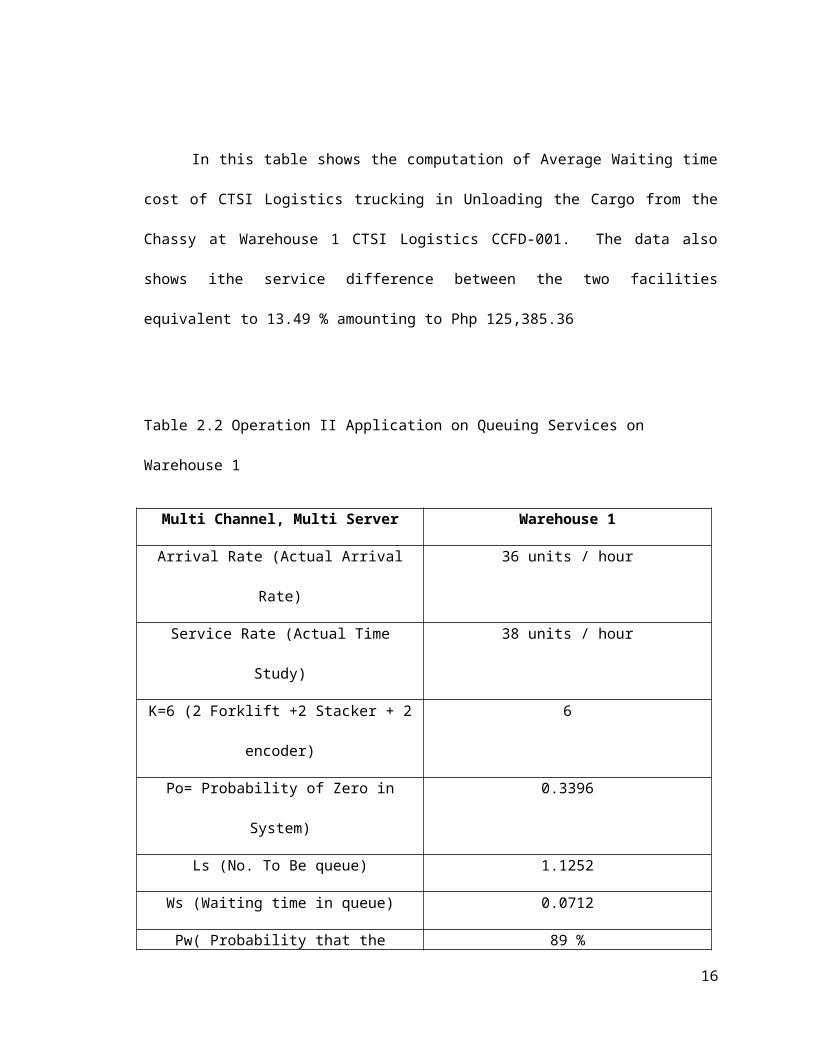
In this table shows the computation of Average Waiting time
cost of CTSI Logistics trucking in Unloading the Cargo from the
Chassy at Warehouse 1 CTSI Logistics CCFD-001. The data also
shows ithe service difference between the two facilities
equivalent to 13.49 % amounting to Php 125,385.36
Table 2.2 Operation II Application on Queuing Services on
Warehouse 1
Multi Channel, Multi Server Warehouse 1
Arrival Rate (Actual Arrival
Rate)
36 units / hour
Service Rate (Actual Time
Study)
38 units / hour
K=6 (2 Forklift +2 Stacker + 2
encoder)
6
Po= Probability of Zero in
System)
0.3396
Ls (No. To Be queue) 1.1252
Ws (Waiting time in queue) 0.0712
Pw( Probability that the 89 %
16

service is Busy)
In the Operation Research II, Queuing system Multi Channel,
waiting time in queue is at .0712, or simply the process is delay
by 7.12 minutes per every hour in the inbound of the product to
the company.
Benchmarking: Flow Process Chart for Inbound at CTSI LOGISTICS-
001-CFD
Elements Symbols Time(in
min’s
Distance
(feet)
17

.)
1. Arrival of the Cargo Truck 9 875
2. Opening of Chassy and Removing Safety Bracing
7.5
3. Palletize at the Tailgate
(Repeat 78 times)93.60 1,560
4.Isuue, Inspect and Hit Barcode
(repeat 150 Times)
195 40
5. Load Box to Pallet(repeat 312 times)
174.02
6. Pick Pallet andTransport by Forklift(repeat 78 times Ave. Distance 278 Ft)
147 21,684
7. Store Pallets(Repeat 78 Times) 17.50
8. Close and Dispatch Truck 4.02 875
Total 582.92 24,159
In the chart above shows the flow process chart in warehouse
1. Total time is 582.92 minutes.
18

19

Figure 1: CTSI Logistics Philippines Logistic Supply Chain
Flowchart. Highlighted above shows the bottleneck of the
operation.
20

CTSI Logistics Warehouse Layout
21

Figure 2. Warehouse Layout of CTSI Logistics Philippines
22

Benchmarking: Flow Process Chart for Inbound at CTSI LOGISTICS-
002-CFD (Castrol Product)
Elements SymbolsTime
Mins
Distance
Feet
1. Arrival of theCargo Truck 8.5 435
2. Opening ofChassy and Removing
Safety Bracing8
3. Pick Pallet andTransport byForklift
(RF ID SCAN)(repeat 150 timesAve. Distance 255
Ft)
207.5038250
4. Store Pallets(Repeat 78 Times) 19.50
5. Close andDispatch Truck 4.15 435
Total 247.65 39,120
In the chart above shows the flow process chart in warehouse
2. Total time is 247.65 minutes.
Source:
1

______________________________
Ann Stephanie T. Tapales
Operation Logistics Specialist
CTSI Logistics Philippines
Benchmarking Summary from Facilities 1 and Facilities 2 of CTSI
Logistics Philippines
WareHouse 1 (Per
Line)
WareHouse 2
Manpower 6 4
Total Time 458.92 min 247.65 min
Inbound Time (Pick,
Hit and Store)
287 min 207.50 min
Time difference in
Service
78 min
Manpower Difference 2
Service time
Percentage
Difference
13.49 %
2

Reduce Cost (Per
Month)
125,385.36
` In the table above shows the Percentage of delay due to
picking, Hit and identification of the boxes during Inbound and
storage.
Backtracking in CTSI from Chassey (Docking Station) to Storage (Warehouse)
Travelling 255 FtTrial Time (minutes)
17.14
28.15
37.45
47.28
3

57.56
68.25
78.45
87.44
97.17
107.04
Total Time77.14
Average time 7.714Normal Time 7.714Actual Time 9.26
In Table above shows the backtracking in CTSI from the
docking facilities to the warehouse. The data shows the
actual and standard time, furthermore it also show the
percentage delay causes by improper stocking and traffic
congestion inside the warehouse facilities.
Table 2.8: Hand held Barcode and Printer Specification
ORIGIN Germany
4

DATE OF PROCURENT 04-17-1996MODEL MNR-0417-JPP-0201Light Intensity 0.25 CdlaLifespan 10 yearsAccuracy +- 1.2 %
Battery12 V 5-Hours Drain
TimePrinter Output Ink Paper StickerProtection No
Table above shows the machine specification of the hand
held barcode , the date of procurement and the origin of the
machine.
5
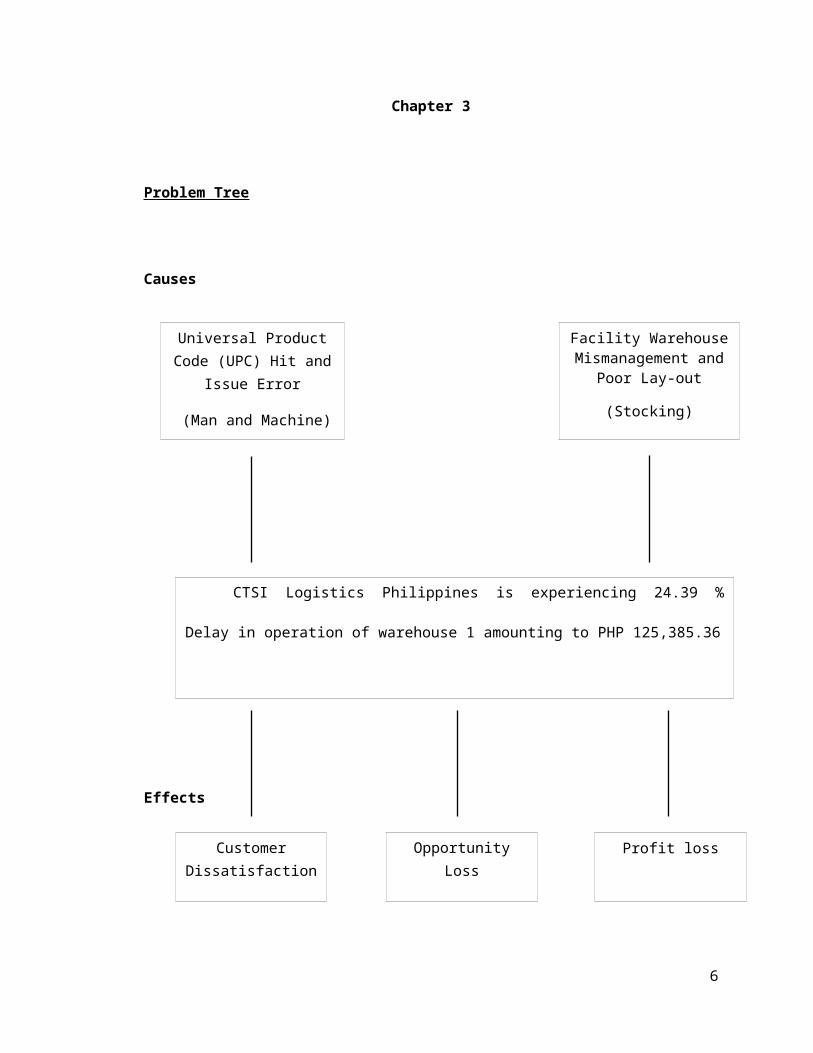
Chapter 3
Problem Tree
Causes
Effects
6
CTSI Logistics Philippines is experiencing 24.39 %
Delay in operation of warehouse 1 amounting to PHP 125,385.36
CustomerDissatisfaction
OpportunityLoss
Profit loss
Facility WarehouseMismanagement and
Poor Lay-out
(Stocking)
Universal ProductCode (UPC) Hit and
Issue Error
(Man and Machine)

Universal Product Code (UPC) Hit and Issue Error (Man and Machine)
During inbound (unloading of the boxes from the truck to
warehouse), stacker must hit the international barcode and issue
warehouse barcode using portable hand held barcode reader.
Frequently, there are times that printer of the machine jammed
therefore it cost additional time to realign the paper. Also,
when the waybill of the box is damage or unreadable during hit,
the stacker manually encodes the waybill and print the UPC
warehouse control data, negligence comes when the stacker encodes
and print out invalid waybill information. Also poor handling of
the sticker when printed due to ink scattering and damage during
peeling of the paper and the sticker, therefore, it cause
additional time and cost to the company
Figure 1: Sample of the UPC in CTSI Logistics Philippines
Facility Warehouse Mismanagement
7

Mismanagement of the warehouse due to stocking leading
misallocation and allocation of the storage is another factors
that contributes to long waiting time in the operation.
Misallocation comes when the outbound of the boxes which is
missing to the original location. Mishandling and manual
allocation of the storage causes by damage boxes and the
unavailability of the rack during inbound. Furthermore, Poor
Layout affects also the queuing in the systems. Operation is not
effective therefore it decrease productivity and space
utilization.
Effects
Customer dissatisfaction
It is almost certain that the 3rd party distributors
products will be dissatisfied if the company will not be able to
deliver the products on time delay in the delivery of the
products will affect the company’s credibility and the company
needs to avoid this from happening.
Opportunity Loss
The company could lose opportunities because of the flaws in
their overall performance. Because of these, the opportunity for
8

them to gain more customers may reduce. The customers will not be
satisfied with the service they receive. They may also lose their
valued customers because of the problems in the service they
offer.
Profit loss
The Company’s main interest is to earn maximum profit by
achieving their maximizing quality service in the most efficient
way possible. However the company cannot achieve this with their
present services offered that causes them to lose profit.
Objective Tree
Means
9Improvement ofFacility
Warehouse Layoutand Automationusing Pro-model
Convert UPC toRFID Sticker
Tags

Ends
10
To develop a mathematical model that would strategically
minimize the CTSI Logistics warehouse 1 operation cost.
SatisfiedCustomers
OpportunityGain
Profit gain

Convert UPC to RFID sticker Tags
In converting UPC to RFID sticker tags, will reduce the
inbound and outbound time for the services will dramatically
reduced. Within this new technology, small sticker tags are put
into boxes (usually laser marked) and tower sensors in the
warehouse are put that will serve as the automated dispatcher.
Also it reduces human error and effort.
Figure 2: Sample RFID Sticker Tag
Facility Warehouse Automation using Pro-model
11

Automation of the warehouse using Pro-Model will reduce the
misallocation and allocation of the products during inbound and
outbound. Using Pro-Model software enables the company to
automatically locate, relocate and allocation the product that
will reduce company cost, maintenance, transit and holding cost.
Figure 3: Pro- Model Software (Courtesy of CMT Logistics
Philippines)
Figure 4: Proposed Warehouse Lay-out
12

In the figure above, applying the lay-out principle,
arrangement of inbound area into facilities on two opposite side
of the building will dramatically reduce the congestion and
increase space utilization of the company
Customer Satisfaction
If the company will be able to match their target output in
service in the exact time as ordered by the customer, the
customer will be satisfied by the service provided by the company
and the products they will receive.
Opportunity Gain
Upholding customer is one of the things a company needs to
do. By achieving the target output to be delivered, customers
13

will be satisfied with the service they receive. With this the
customers may also recommend their company to other firms.
Increase in profit
If the waiting cost will be reduce the company will gain the
maximum possible profit, this will mean an increase in profit
from the previous months.
CHAPTER 4
ALTERNATIVE COURSES OF ACTION
14

ACA #1: Convert UPC to RFID Sticker Tags
The old system in CTSI Logistics is where the inspector
issues a barcode upon the arrival of the package. Delays
are cause because of malfunctioning of the hand held barcode
reader, poor printing output of the barcode, and jamming of
the paper into the barcode machine. Another factor is that
due to the oldness, the battery is easy to deplete.
The best solution to this problem is to convert and
install a long range RFID detectors and ID tags to the
system. Within this process delay and error will be
eliminated.
Advantages:
Increase company productivity
Improved working conditions
Save space for future improvements
Disadvantages:
Additional cost to the company
15

Table 3.1: Proposed Flow Process Chart for Centralized Methane
Tanks
Conditions EffectsReduce Time 70 min
Reduce Manpower 2
Percentage to Delay 24.39 %
Shared Amount of Opportunity Gain Php 125,385.36
Return of Investment (Break EvenAnalysis)
1.12 Years
Cost of the RFID tags and Sticker Php 1,000,000Shared Amount of Opportunity Gain Php 1,118,403.66
16

Supplier No.1: Airam Technologies (RFID STICKER TAGS)
Model: AE-PPP-1700
Frequency: 13.65 Mhz
Chipise: mifare S50
Origin: China
Source:http://www.alibaba.com/products/
356935189/13_56MHZ_Programming_rfid_sticker_Tag.html
SWOT ANALYSIS
Name Strengths Weaknesses Opportunities
Threats
Supplier: Airam
TechnologieModel:AE-PPP-
programmable
Easy maintenance
Price of each doesnot include tax yet
Demand forindustrialRFID TAGS are emerging
Entry of NewLocal Competitors in the market
17

1700 ISO14443a certificat
e
and shipping costs
in Europe and North America
Table 3.2 BILL OF MATERIALS (Procurement and Installation of
RFID sticker Tags Model: AE-PPP-1700)
COMPONENTS QUANTITY DETAILS PRICE (PHP)RFID TAGS 1 Roll (per
10,000 pcs)
RFID sticker
tags
74,450
RFID TOWER 1 set Computer Based
Inbound
Outbound RFID
Tower
131,100
RFID HAND HELD
GUNS
1 set Programmable
RFID hand Held
Accessories
205,165
TOTAL PROJECT COST
Material Cost PHP 385,000Shipping Cost PHP 250,000
18

Assembly Cost PHP 240,000Labor Cost PHP 125,000Total Cost PHP 1,000,000
In table 3.2 shows the Bill of materials and the
summary of project cost in procurement and installation of
RFID tags and Sticker (Airam Technologies (RFID STICKER
TAGS) Model: AE-PPP-1700) for warehouse 1
ACA #2: Improvement of Facility Warehouse Layout and Automation
using Pro-model
In proposing the new layout for the warehouse facilities by
adding an additional docking area will reduce the congestion flow
and damages to the materials. Automation of the system in
warehousing and allocation of space to the product will
dramatically reduce the misallocation and allocation of the
products during inbound and outbound. Using Pro-Model software
19

enables the company to automatically locate, relocate and
allocation the product that will reduce company cost,
maintenance, transit and holding cost.
Advantages:
Increase company productivity
Improved working conditions
Additional space for future improvements
Disadvantages:
Additional cost to the company
Conditions EffectsAdditional Space Acquired 1463sq. m
Volume Capacity 3000 cu. ftCost of the New Facilities PHP 3,514,700
Return of Investment (Break Even
Analysis)
7.18 years
Shared Amount of Opportunity Gain PHP 489,568.20
Table 3.3 BILL OF MATERIALS (Improvement of Facility
Warehouse Layout and Automation using Pro-model)
20

TOTAL PROJECT COST
Contractor Cost PHP 1,500,000Installation Cost PHP 750,000Software Cost PHP 340,000Labor Cost PHP 799,700Total Cost PHP 3,514,700
In table 3.3 shows the Bill of materials and the
summary of project cost in Improvement of Facility Warehouse
Layout and Automation using Pro-model for warehouse 1
21

Figure 7: Proposed Layout on CTSI Logistics
22

Table 4.1 Cost Benefit Analysis
ACA COST BENEFITS
TANGIBLE INTANGIBLE
1. Convert UPC
to RFID Sticker
Tags
Cost of
procurement
and
installation
of Rfid tags
and sticker (
Airam
Technologies
(RFID STICKER
TAGS)Model:
AE-PPP-1700
= PHP
1,000,000
Shared Amount
of opportunity
Gain
=
PHP1,118,403.6
6
-Return of
Investment
=1.12 years
-Continuous
production
operation
-High Quality
Product
-High Morale
operator
2. Improvement
of Facility
Warehouse Layout
and Automation
using Pro-model
Installation of the Proposed Layout.
= PHP3,514,700
- Shared
Amount of
opportunity
Gain
= PHP
489,568.20
-Return of
Investment
=7.18 years
-Better
performance by
workers
-workers
satisfaction
-quality
products
23

CHAPTER 5
CONCLUSION AND RECOMMENDATIONS
Conclusion
Generally, the objective of the study is to eliminate the
productivity loss by 24.39 % delay in operation problems that
CTSI Logistics had experienced in past months of operation. Each
of the ACAs will increase the productivity in the operation if
implemented. The implementation of all ACAs will reduce the
productivity loss, provide high quality and competitive products
in the daily based operations and services of the company.
Recommendation
Since the major factor that contributes to the productivity
loss is caused by the UPC hit and issue error because of
defective machines, the researcher is highly recommended to
implement ACA1 which is the conversion into RFID tags. This will
remove the delay due to downtime period of the warehouse
operations. Furthermore, the implementation of other alternative
24

are also suggested reducing dramatically the storage time of the
pre- processed materials and also increasing the availability of
the materials to the company customers
25

CHAPTER 6
DETAILED PLAN OF ACTION
ACTIVITY MONTH 1 MONTH 2 MONTH 3 MONTH 4
Planning of theimplementation of ACAs
Review of the studyPresentation ofstudy to the companyConsultation tothe production dept. about matters regarding RFID sticker tags implementation Construction ofthe RFID towersand ControllersFacilitiesEvaluate of implemented ACAs
The table above shows the detailed plan of action of the
chosen alternative courses of action. The implementation of the
ACAs is projected to be completed within four (4) months.
26

Detailed Plan of Action:
1. Planning of the implementation of the ACAs
The proposal will be presented to the top management
including the President, CEO and Plant Manager. The proposal
should be presented substantially so that top management
will see that the project is feasible for the company.
2. Review of the study
Series of integrity and simulation will be
conducted to the company regarding the proposed
implementation of ACAs. Surveying and strict planning,
scheduling and monitoring will be used to serve as a
guide for the feasibility of the study
3. Presentation of the study to the company
Presentation of the proposal to the top management and
it will be subject for approval of the Company President and
Plant Manager. During this time both the Company President
27

and Plant Manager can give their opinions and suggestions
regarding the project.-
4. Consultation to the production dept. about matters regarding
RFID sticker tags implementation.
Consultation to the plant production manager
regarding the implementation of the new proposed
system.
5. Construction of the RFID controls and Towers
The procurement and construction of the RFID
controllers and towers of the plant layout will be
executed the same time as the procurement of the RFID
systems. The changes in the plant can be as long as
three (3) week.
6. Evaluate of implemented ACA
There will be assessment of the effect of the
implemented alternatives. Continuous evaluation of the
28

action plan should be done in order to monitor the
benefits.
ATTACHEMENT
29

30