changes in the geographical distribution of plant species and
TRANSCRIPT
RESEARCH ARTICLE
Changes in the geographical distribution of
plant species and climatic variables on the
West Cornwall peninsula (South West UK)
Aleksandra Kosanic1,4*, Karen Anderson2, Stephan Harrison1, Thea Turkington3,
Jonathan Bennie1
1 University of Exeter, Centre for Geography Environment and Society, Penryn Campus, Penryn, United
Kingdom, 2 University of Exeter, Environment and Sustainability Institute, Penryn Campus, Penryn, United
Kingdom, 3 Centre for Climate Research Singapore, Meteorological Services Singapore, Singapore,
Singapore, 4 Ecology Lab (Biology Department), University of Konstanz, Konstanz, Germany
Abstract
Recent climate change has had a major impact on biodiversity and has altered the geo-
graphical distribution of vascular plant species. This trend is visible globally; however, more
local and regional scale research is needed to improve understanding of the patterns of
change and to develop appropriate conservation strategies that can minimise cultural,
health, and economic losses at finer scales. Here we describe a method to manually geo-
reference botanical records from a historical herbarium to track changes in the geographical
distributions of plant species in West Cornwall (South West England) using both historical
(pre-1900) and contemporary (post-1900) distribution records. We also assess the use of
Ellenberg and climate indicator values as markers of responses to climate and environmen-
tal change. Using these techniques we detect a loss in 19 plant species, with 6 species los-
ing more than 50% of their previous range. Statistical analysis showed that Ellenberg (light,
moisture, nitrogen) and climate indicator values (mean January temperature, mean July
temperature and mean precipitation) could be used as environmental change indicators.
Significantly higher percentages of area lost were detected in species with lower January
temperatures, July temperatures, light, and nitrogen values, as well as higher annual precip-
itation and moisture values. This study highlights the importance of historical records in
examining the changes in plant species’ geographical distributions. We present a method
for manual geo-referencing of such records, and demonstrate how using Ellenberg and cli-
mate indicator values as environmental and climate change indicators can contribute
towards directing appropriate conservation strategies.
Introduction
Recent climate change has become one of the main drivers of shifts in the geographical distri-
butions of plant species [1, 2]. There are several ways in which species can respond to climate
change: adapt, move in different directions in order to track suitable climates, (i.e. towards
PLOS ONE | https://doi.org/10.1371/journal.pone.0191021 February 5, 2018 1 / 18
a1111111111
a1111111111
a1111111111
a1111111111
a1111111111
OPENACCESS
Citation: Kosanic A, Anderson K, Harrison S,
Turkington T, Bennie J (2018) Changes in the
geographical distribution of plant species and
climatic variables on the West Cornwall peninsula
(South West UK). PLoS ONE 13(2): e0191021.
https://doi.org/10.1371/journal.pone.0191021
Editor: Andy J Green, Consejo Superior de
Investigaciones Cientificas, SPAIN
Received: August 11, 2016
Accepted: December 27, 2017
Published: February 5, 2018
Copyright: © 2018 Kosanic et al. This is an open
access article distributed under the terms of the
Creative Commons Attribution License, which
permits unrestricted use, distribution, and
reproduction in any medium, provided the original
author and source are credited.
Data Availability Statement: All vegetation data
files are available from the NBN- Vascular Plants
Database (https://data.nbn.org.uk/) and from “The
Flora of Cornwall” by Davey 1909. For the post-
1900 dataset data are available at the NBN
Homesite. Please go to /Record share and explore
data/NBN Atlas/Location/Spatial Search/Customise
filters for Occurrence records. Other relevant data
are within the paper and its Supporting Information
files. The authors confirm that others would be able
to access these data in the same manner as the
higher latitudes and elevations, or to the east and west) [3, 4], and go extinct locally, regionally,
or, in a worst case scenario, globally [5–8]. Projections show that the increase of the global
mean temperature by the year 2100 is very likely to be between 1.5˚C and 4.0˚C (depending on
emission scenarios) and the impact on ecosystems will be unprecedented [9, 10]. Responses of
plant species will depend on their genetic diversity and ability to adapt to the magnitude and
rate of climate change, as well as availability of space for species to move into local microcli-
mates [11–13]. Nevertheless, it has been shown that not all plant species will be equally sensi-
tive to climatic change [2, 8, 14]. However, temperature is not the only aspect of the climate
that is changing. Precipitation and the frequency of extreme events will also have an impact on
vegetation, and the rate and magnitude of these climatic effects will differ regionally and locally
[10, 15–17]. Changes in geographical distributions of vegetation at the local and regional scales
can impact community composition, ecosystem function, and genetic diversity, which can
make plants even more vulnerable to on-going environmental change [18–21]. Furthermore,
changes in the distribution of vegetation on such scales could also affect regional identity and
ecosystem services provision [22–24]. Therefore, there is a need for more research to focus on
vegetation responses to climate change at local and regional scales [25, 26], particularly in
order to identify vulnerable plant species. This can help to secure in situ management and pre-
vent regional and local vegetation loss that could drive economic, social and environmental
losses [2, 27]. Attribution of vegetation responses to climate change at local and regional scales,
and identification of vulnerable species is nonetheless a difficult challenge in ecology; mainly
because decadal patterns could be related to non-climatic factors, not least factors such as land
use change [1, 28]. Hence, we need a better understanding of species’ individualistic responses
to environmental change [8].
To track species’ responses to climate or environmental change, historical records (e.g. her-
barium collections) represent exceptional sources of scientific and conservation data because
they offer a means of tracking changes in species’ geographical distributions over time. So far,
historical vegetation records have been used to analyse climatic effects on vegetation phenol-
ogy [29–32], to predict changes in species’ distributions, to analyse patterns of plant species
invasion, and to identify threatened species [33–35]; however, there is still a lack of regional
and local scale studies. The major reason for the limited number of studies at the regional and
local scales is not only a lack of multiple historical records (e.g. climatic and vegetation data)
but also the lack of historical vegetation records in a precise geo-referenced form (i.e. geo-
graphical latitude and longitude) [36–38]. Therefore, a major task for scientists, museums, and
archives is to deal with location uncertainties of historical records and to make such databases
available in an accurate geo-referenced form [39–42]. This need has led to the design of web-
based automated or semi-automated mapping applications such as BioGeomancer, MaNIS,
MaPSTeDI [40, 43]; however, these applications are not available for all countries or regions,
and in such instances geo-referencing needs to be performed manually. Manual geo-refere-
ncing, particularly on a specimen by specimen basis, is generally avoided as it has been charac-
terised as time consuming [40, 44] and lacking detailed methodological guidance in the
literature.
In this manuscript we present a method describing the process of manual geo-referencing
of historical records (i.e. herbarium collections), in order to examine changes in the geographi-
cal distribution of plant species, using West Cornwall (South West England) as a study site
with good availability of historical vegetation records [24]. We also assess whether Ellenberg
values (EV) and climate indicator values (CV), both developed to characterise plant species
ecology (i.e. species’ individual sensitivity to abiotic change) [45–47], can be used as tools to
track climate and environmental change, and to show which species will be more sensitive to
the change. For example, EV have been used previously to detect environmental change [48–
Changes in geographical distribution of plant species in West Cornwall
PLOS ONE | https://doi.org/10.1371/journal.pone.0191021 February 5, 2018 2 / 18
authors and that they did not have any special
access privileges that others would not have.
Funding: Founding was provided by University of
Exeter and Cornwall Council to AK for her PhD
project. Neither of these founding routes have
reference numbers. The funders had no role in
study design, data collection and analysis, decision
to publish, or preparation of the manuscript.
Competing interests: The authors have declared
that no competing interests exist.
50] and to document habitat quality [51]; however, there have been few studies examining if
EV reflect a local or regional climate change signal [52–54]. Additionally EV can serve as a tool
for detecting those plant species that are most vulnerable to climate change [52] and, poten-
tially, for informing successful conservation strategies at local and regional scales. This study
aims to address two key questions: 1) Can historical (herbarium) plant species data be used to
evaluate changes in geographical distribution? 2) Is there a correlation between EV and CV of
plant species and their distribution patterns?
Data and methodology
Contemporary plant species data (post-1900)
Contemporary spatial records (referred to in this paper as “post-1900”) of plant distribution in
West Cornwall (South West England) were obtained from the online “Vascular Plants Data-
base” of the National Biodiversity Network (NBN) [55]. The NBN database contains the distri-
butions of 6669 taxa of flowering plants and ferns and contains mostly records from the “New
Atlas of the British and Irish Flora” [56] and records collected by volunteer members of the
Botanical Society of the British Isles (BSBI). NBN Vascular Plant records were validated by
BSBI members and obtained at a 10x10 km grid resolution for this study.
Historical plant species data (pre-1900)
Cornwall has a long history of botanical records that date back to Victorian times, which was
encouraged by Natural History Societies at the time, in order to construct regional scientific
knowledge [57]. In this study, historical records (referred to as “pre-1900”) were used from
“The Flora of Cornwall” [58], a collection of all known herbarium data in the county of Corn-
wall and the Scilly Isles from the 18th and 19th centuries. In these records Cornwall is divided
into eight botanical districts based on river basins [58]. Geo-referencing was undertaken for
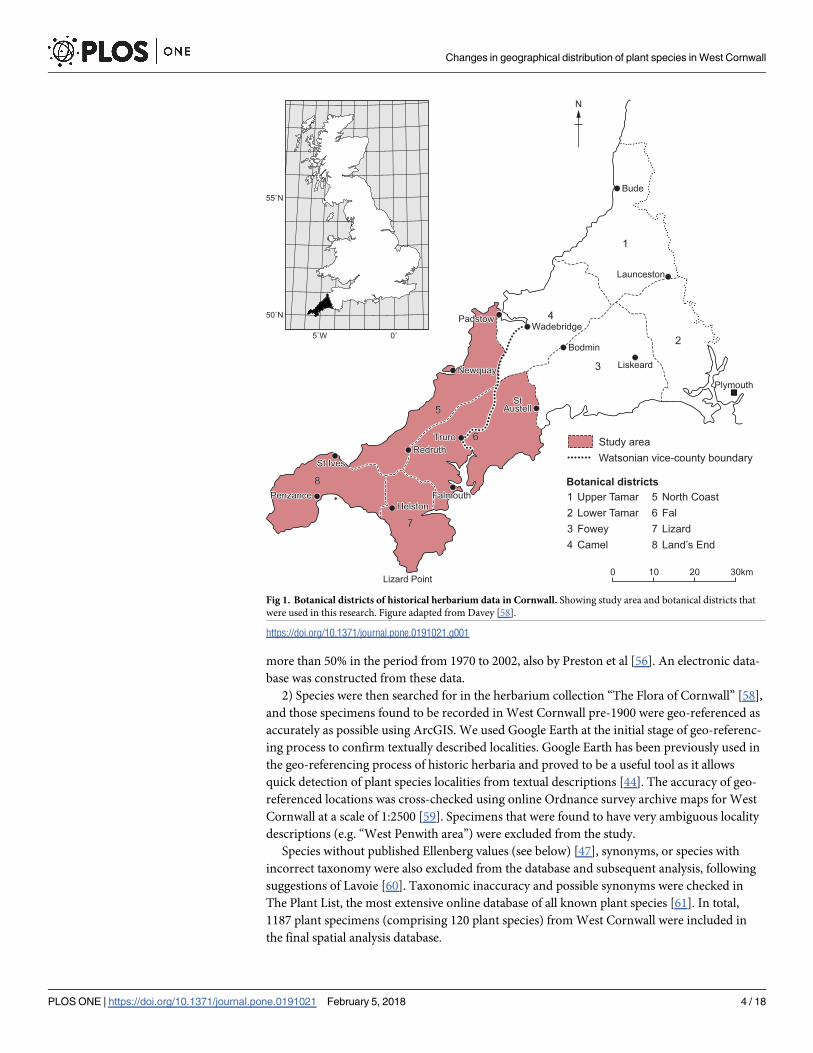
the 5th, 6th, 7th and 8th districts that cover the area of West Cornwall (Fig 1). Records contained
both native and non-native species. Such historical data contain textual descriptions of locali-
ties where plant specimens were found (e.g. “Achillea ptarmica, first record: 1769; district 7:
Porkellis Moor, Wendron, Coverack, Emyln” page 247), [58], rather than explicit definitions of
longitude and latitude. We therefore acknowledge several uncertainties in the geo-referencing
process: taxonomical inaccuracy; spatial error; bias associated with frequency; and time spent
on data collection (i.e. some areas or species that could be poorly sampled). The latter uncer-
tainty provides particular challenges [36] and details of our methods for dealing with these
uncertainties are given below.
Handling and spatial analysis of plant species records in ArcGIS
Manual geo-referencing of historical plant species data posed a methodological challenge [40]
due to textual descriptions of specimen localities. Specifically, “The Flora of Cornwall” [58]
contains descriptions of species (genus and specific epithet) and textual descriptions of geo-
graphic localities (i.e. places where specimens had been collected). In order to manually geo-
reference these data and import into GIS software (ArcGIS) for subsequent spatial and tempo-
ral analysis, the following three steps were undertaken:
1) As it would be impractical to geo-reference all plant specimens in West Cornwall as
recorded in the Flora of Cornwall [58], we created a baseline dataset using the “New Atlas of
the British and Irish Flora” [56]. For this baseline dataset, 380 plant species were selected fol-
lowing two rules: a) they were detected in Cornwall pre-1970 by Preston et al. [56] and b) their
geographical distribution (calculated as a change in areal extent) increased or decreased by
Changes in geographical distribution of plant species in West Cornwall
PLOS ONE | https://doi.org/10.1371/journal.pone.0191021 February 5, 2018 3 / 18
more than 50% in the period from 1970 to 2002, also by Preston et al [56]. An electronic data-
base was constructed from these data.
2) Species were then searched for in the herbarium collection “The Flora of Cornwall” [58],
and those specimens found to be recorded in West Cornwall pre-1900 were geo-referenced as
accurately as possible using ArcGIS. We used Google Earth at the initial stage of geo-referenc-
ing process to confirm textually described localities. Google Earth has been previously used in
the geo-referencing process of historic herbaria and proved to be a useful tool as it allows
quick detection of plant species localities from textual descriptions [44]. The accuracy of geo-
referenced locations was cross-checked using online Ordnance survey archive maps for West
Cornwall at a scale of 1:2500 [59]. Specimens that were found to have very ambiguous locality
descriptions (e.g. “West Penwith area”) were excluded from the study.
Species without published Ellenberg values (see below) [47], synonyms, or species with
incorrect taxonomy were also excluded from the database and subsequent analysis, following
suggestions of Lavoie [60]. Taxonomic inaccuracy and possible synonyms were checked in
The Plant List, the most extensive online database of all known plant species [61]. In total,
1187 plant specimens (comprising 120 plant species) from West Cornwall were included in
the final spatial analysis database.
10 20 30km0
Plymouth
Bude
Wadebridge
HelstonHelstonHelston
RedruthRedruthTruroTruro
StStAustellAustell
RedruthTruro
StAustell
Bodmin
Liskeard
Launceston
Lizard Point
1
2
3
4
5
6
7
8
5
6
7
8
PadstowPadstowPadstow
NewquayNewquayNewquay
St IvesSt IvesSt Ives
PenzancePenzancePenzance FalmouthFalmouthFalmouth
Study areaWatsonian vice-county boundary
Botanical districtsUpper TamarLower TamarFoweyCamel
1234
North CoastFalLizardLand’s End
5678
N
0˚5˚W
55˚N
50˚N
Fig 1. Botanical districts of historical herbarium data in Cornwall. Showing study area and botanical districts that
were used in this research. Figure adapted from Davey [58].
https://doi.org/10.1371/journal.pone.0191021.g001
Changes in geographical distribution of plant species in West Cornwall
PLOS ONE | https://doi.org/10.1371/journal.pone.0191021 February 5, 2018 4 / 18
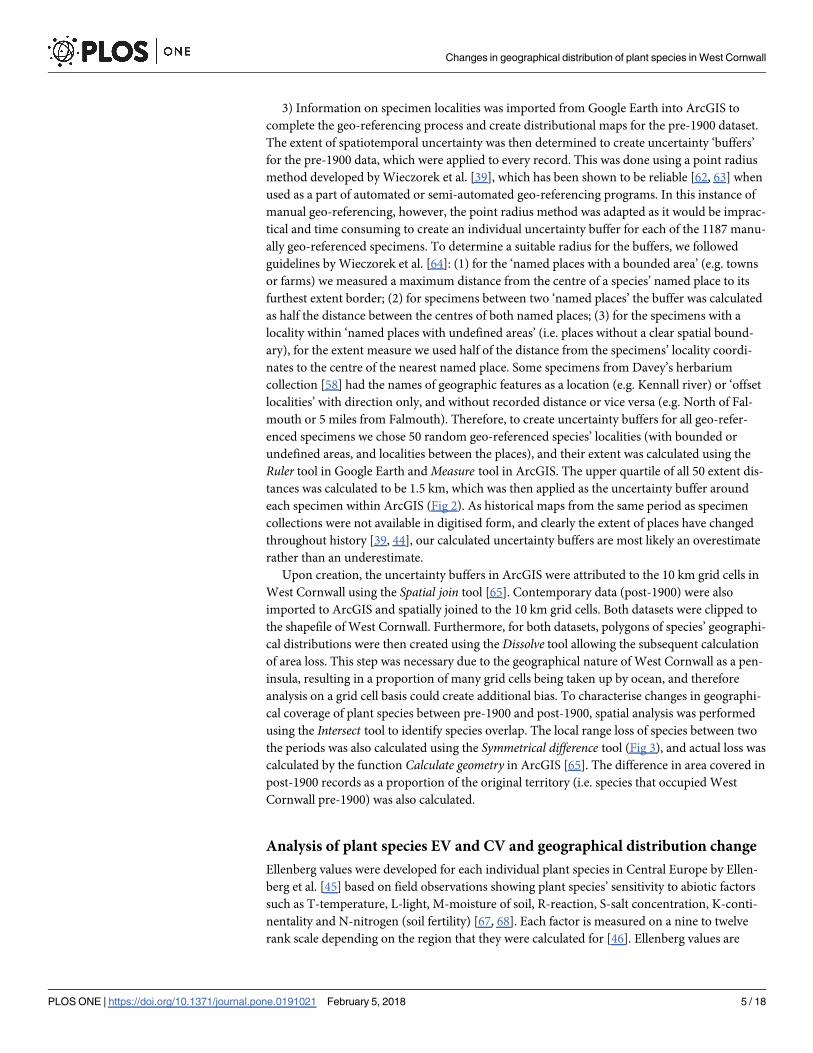
3) Information on specimen localities was imported from Google Earth into ArcGIS to
complete the geo-referencing process and create distributional maps for the pre-1900 dataset.
The extent of spatiotemporal uncertainty was then determined to create uncertainty ‘buffers’
for the pre-1900 data, which were applied to every record. This was done using a point radius
method developed by Wieczorek et al. [39], which has been shown to be reliable [62, 63] when
used as a part of automated or semi-automated geo-referencing programs. In this instance of
manual geo-referencing, however, the point radius method was adapted as it would be imprac-
tical and time consuming to create an individual uncertainty buffer for each of the 1187 manu-
ally geo-referenced specimens. To determine a suitable radius for the buffers, we followed
guidelines by Wieczorek et al. [64]: (1) for the ‘named places with a bounded area’ (e.g. towns
or farms) we measured a maximum distance from the centre of a species’ named place to its
furthest extent border; (2) for specimens between two ‘named places’ the buffer was calculated
as half the distance between the centres of both named places; (3) for the specimens with a
locality within ‘named places with undefined areas’ (i.e. places without a clear spatial bound-
ary), for the extent measure we used half of the distance from the specimens’ locality coordi-
nates to the centre of the nearest named place. Some specimens from Davey’s herbarium
collection [58] had the names of geographic features as a location (e.g. Kennall river) or ‘offset
localities’ with direction only, and without recorded distance or vice versa (e.g. North of Fal-
mouth or 5 miles from Falmouth). Therefore, to create uncertainty buffers for all geo-refer-
enced specimens we chose 50 random geo-referenced species’ localities (with bounded or
undefined areas, and localities between the places), and their extent was calculated using the
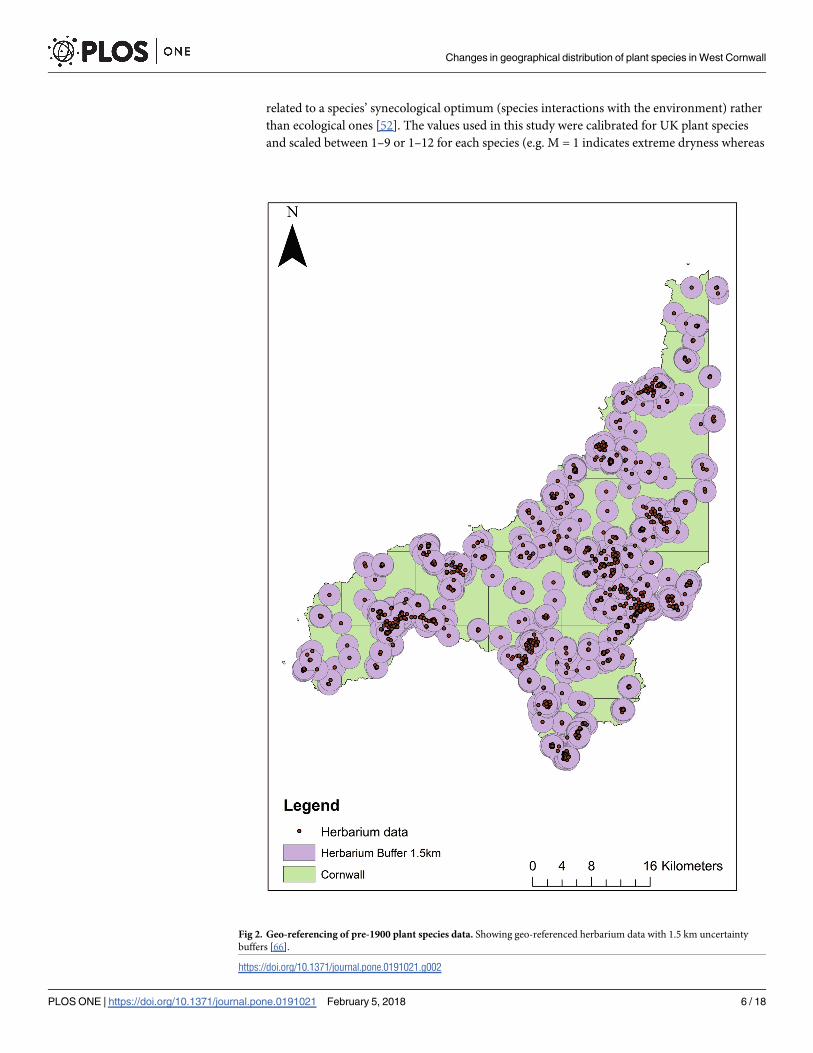
Ruler tool in Google Earth and Measure tool in ArcGIS. The upper quartile of all 50 extent dis-
tances was calculated to be 1.5 km, which was then applied as the uncertainty buffer around
each specimen within ArcGIS (Fig 2). As historical maps from the same period as specimen
collections were not available in digitised form, and clearly the extent of places have changed
throughout history [39, 44], our calculated uncertainty buffers are most likely an overestimate
rather than an underestimate.
Upon creation, the uncertainty buffers in ArcGIS were attributed to the 10 km grid cells in
West Cornwall using the Spatial join tool [65]. Contemporary data (post-1900) were also
imported to ArcGIS and spatially joined to the 10 km grid cells. Both datasets were clipped to
the shapefile of West Cornwall. Furthermore, for both datasets, polygons of species’ geographi-
cal distributions were then created using the Dissolve tool allowing the subsequent calculation
of area loss. This step was necessary due to the geographical nature of West Cornwall as a pen-
insula, resulting in a proportion of many grid cells being taken up by ocean, and therefore
analysis on a grid cell basis could create additional bias. To characterise changes in geographi-
cal coverage of plant species between pre-1900 and post-1900, spatial analysis was performed
using the Intersect tool to identify species overlap. The local range loss of species between two
the periods was also calculated using the Symmetrical difference tool (Fig 3), and actual loss was
calculated by the function Calculate geometry in ArcGIS [65]. The difference in area covered in
post-1900 records as a proportion of the original territory (i.e. species that occupied West
Cornwall pre-1900) was also calculated.
Analysis of plant species EV and CV and geographical distribution change
Ellenberg values were developed for each individual plant species in Central Europe by Ellen-
berg et al. [45] based on field observations showing plant species’ sensitivity to abiotic factors
such as T-temperature, L-light, M-moisture of soil, R-reaction, S-salt concentration, K-conti-
nentality and N-nitrogen (soil fertility) [67, 68]. Each factor is measured on a nine to twelve
rank scale depending on the region that they were calculated for [46]. Ellenberg values are
Changes in geographical distribution of plant species in West Cornwall
PLOS ONE | https://doi.org/10.1371/journal.pone.0191021 February 5, 2018 5 / 18
related to a species’ synecological optimum (species interactions with the environment) rather
than ecological ones [52]. The values used in this study were calibrated for UK plant species
and scaled between 1–9 or 1–12 for each species (e.g. M = 1 indicates extreme dryness whereas
Fig 2. Geo-referencing of pre-1900 plant species data. Showing geo-referenced herbarium data with 1.5 km uncertainty
buffers [66].
https://doi.org/10.1371/journal.pone.0191021.g002
Changes in geographical distribution of plant species in West Cornwall
PLOS ONE | https://doi.org/10.1371/journal.pone.0191021 February 5, 2018 6 / 18
M = 12 indicates almost constant submersion) [46, 47]. Hill et al. [47] omitted the calibration
of the original EV for K-continentality and T-temperature as they were not applicable for the
UK oceanic climate. Therefore, here we focus on EV for light (L), moisture (M) and nitrogen
(N). Furthermore, instead of K-continentality and T-temperature EV, we used three CV from
previously derived mean climatic data for the species range within 10 km grid cells for the Brit-
ish Isles [47]: (i) mean January temperature (Tjan), (ii) mean July temperature (Tjul), and (iii)
mean precipitation (RR). To match the ordinal values of the three EV, temperature and precip-
itation indicators (Tjan, Tjul, and RR) were subdivided based on the values in Table 1, with
lower values indicating the coldest/driest conditions and higher values indicating the warmest/
wettest conditions (see S1 Table). The subdivisions were selected to have an even spread of spe-
cies between the indicator values, while maintaining regular spacing and minimising the num-
ber of species more than 0.5˚C and 100mm from the extreme indicator threshold values for
temperature and precipitation CV, respectively. The maximum, minimum and median mean
temperature and precipitation values are in Table 2.
Finally, the percentage of the pre-1900 area of each species that had no records in the
post-1900 records was determined as a measure of area loss. We tested whether losses were
more pronounced for species traits (EV and CV). The analysis compared each pair of indicator
values, to detect any non-montonic relationships that could be missed by the Pearson’s
0 10 20km
IntersectPresentPast
a) Carex extensa
N
b) Carex extensa
LossIntersectPresentPast
c) Mentha pulegium
Loss
d) Mentha pulegium
e) Achillea ptarmica
IntersectPresentPast
f) Achillea ptarmica
Loss
g) Arum italicum
IntersectPresentPast
Loss
h) Arum italicum
50º0'N
50º10'N
50º20'N
50º30'N
5º40' 5º30'W 5º20'W 5º10'W 5º0'
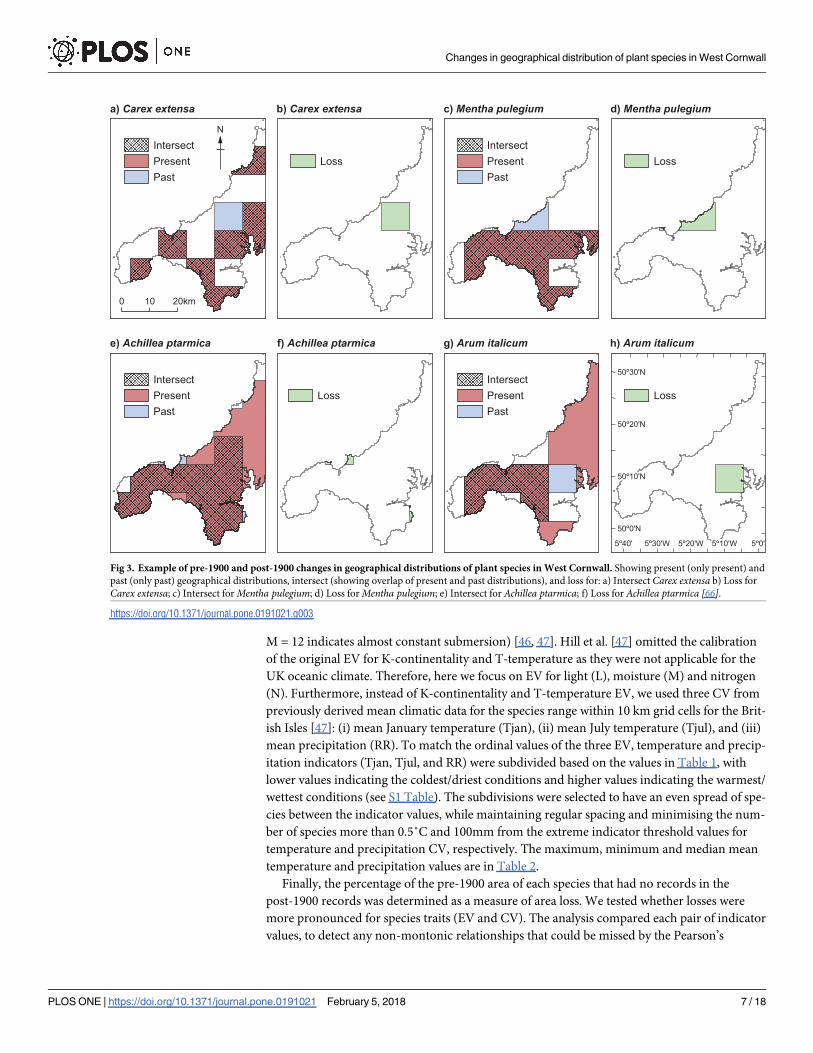
Fig 3. Example of pre-1900 and post-1900 changes in geographical distributions of plant species in West Cornwall. Showing present (only present) and
past (only past) geographical distributions, intersect (showing overlap of present and past distributions), and loss for: a) Intersect Carex extensa b) Loss for
Carex extensa; c) Intersect for Mentha pulegium; d) Loss for Mentha pulegium; e) Intersect for Achillea ptarmica; f) Loss for Achillea ptarmica [66].
https://doi.org/10.1371/journal.pone.0191021.g003
Changes in geographical distribution of plant species in West Cornwall
PLOS ONE | https://doi.org/10.1371/journal.pone.0191021 February 5, 2018 7 / 18

correlation coefficient or Kendall’s Tau. The non-parametric Mann-Whitney U test was used to
determine whether the percentage of area lost was statistically different (p value< 0.05) between
two indicator values. The Mann-Whitney U test (also referred to as Mann-Whitney-Wilcoxon)
has been used in other studies to determine the significant difference between two independent
groups of data [69]. The test was necessary to test both EV and CV and determine which species
with their associated values experienced a higher loss and were thus potentially more vulnerable
to environmental change (see S1 Table). As an additional test, we also developed a Generalized
Linear Model (GLM) in R-3.3.2 [70], in order to test the relation between percentage of area
lost (response variable) and climatic values (explanatory variables) that were used in creating a
substitute for the original EV [47]. The area lost were transformed using an arc-sine transforma-
tion since the data was proportional and bounded between zero and one.
Results
Spatial analysis of change in plant species geographical distribution
Of the 120-plant species analysed, spatial overlap between the pre-1900 and post-1900 datasets
was found for 116 species, whereas 5 species appeared only in either post-1900 or pre-1900 data-
sets or without an intersect (Fig 3). A decrease in geographical extent was found for 19 species
(the decrease was larger than 50% for 6 species), and no change in geographical distribution was
found for 10 species. Species with the highest losses across West Cornwall are shown in Table 3.
Ellenberg values and climate indicator values
The ranges of CV and EV for the 120-species analysed are presented in Table 1B. For EV,
Moisture (M) had the widest range (1–12) followed by Nitrogen (N) (1–9), and the narrowest
Table 2. The minimum, median and maximum value for each Ellenberg value (EV), light (L), moisture (M), nitro-
gen (N) and climate indictor value (CV), mean January temperature (Tjan), mean July temperature (Tjul), and
mean precipitation (RR).
Variable Minimum Median Maximum
(Tjan) 1.9˚C 3.8˚C 6.8˚C
(Tjul) 13.0˚C 15.6˚C 16.6˚C
(RR) 604mm 900mm 1483mm
(L) 4 7 9
(M) 2 5 12
(N) 1 5 9
https://doi.org/10.1371/journal.pone.0191021.t002
Table 1. Classifications for three climate indicator values (CV): Mean January temperature (Tjan), mean July
temperature (Tjul), and mean precipitation (RR).
Indicator value Tjan (˚C) Tjul
(˚C)
RR
(mm)
1 <2.5 < 13.5 < 700
2 2.5–3.0 13.5–14.0 700–800
3 3.0–3.5 14.0–14.5 800–900
4 3.5–4.0 14.5–15.0 900–1000
5 4.0–4.5 15.0–15.5 1000–1100
6 4.5–5.0 15.5–16.0 1100–1200
7 5.0–5.5 16.0–16.5 1200–1300
8 �5.5 �16.5 �1300
https://doi.org/10.1371/journal.pone.0191021.t001
Changes in geographical distribution of plant species in West Cornwall
PLOS ONE | https://doi.org/10.1371/journal.pone.0191021 February 5, 2018 8 / 18
range was for Light (L) (4–9). Based on the CV criteria, all three indicators span the same
range (1–8).
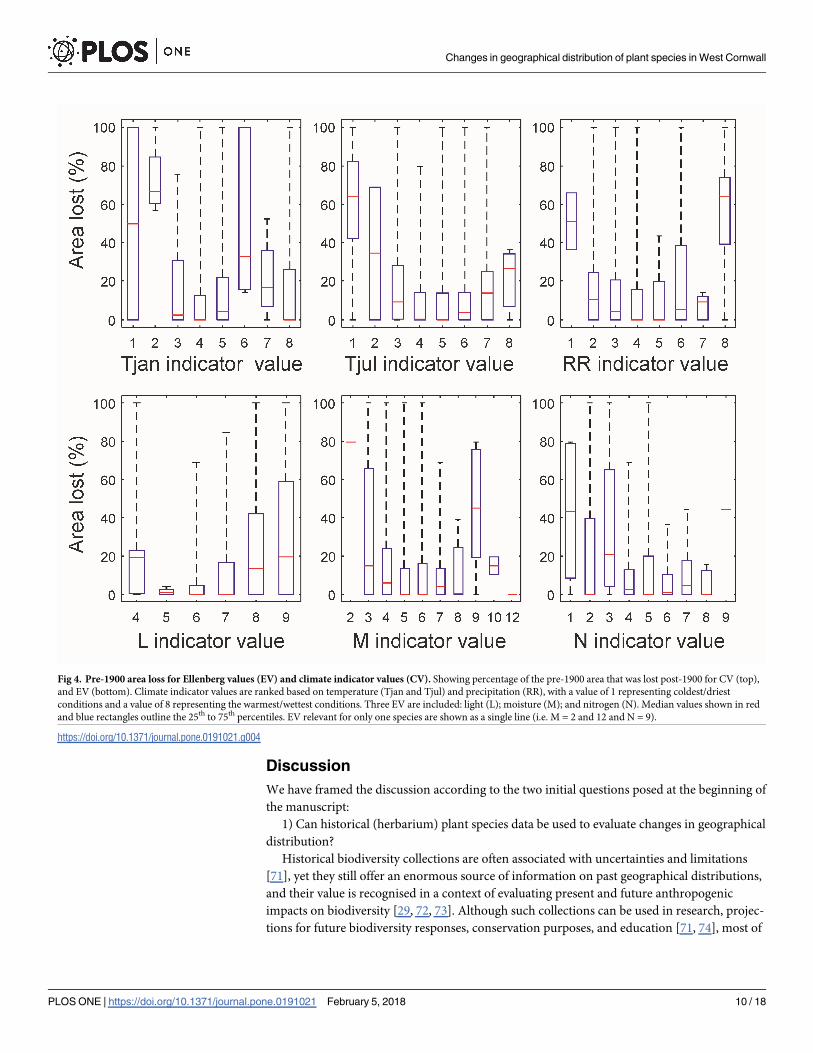
The percentage area losses between post- and pre-1900 calculated in relation to CV are
shown in Fig 4 (top row). For Tjan, species with cold temperatures (Tjan = 2) had the highest
percentage area loss, which was significantly greater than those with a value of 3, 4, 5, 7 and 8.
Species with Tjan indicator values of 4 and 5 also showed a significantly lower reduction in
extent than species for Tjan = 6 (Table 4). Therefore, except for Tjan = 6, species with colder
winter temperatures generally show greater losses than those with warmer temperatures. For
summer temperatures (Tjul), species with the lowest temperatures (Tjul = 1) lost a significantly
higher percentage of the pre-1900 area than those with values of 4 and 5, with no significant
differences between the other indicator values (Table 4). Based on the annual precipitation,
species with RR = 8 showed significantly greater losses in area relative to pre-1900 than those
with an indicator values of 2, 3, 4, 5, and 7. Species for which RR = 1 also had a higher median
value of percentage area lost, but this was not significantly different to the other categories due
to few species in this group (Table 4). Overall, CV indicate that species with cooler winter and
summer temperatures, and higher annual rainfall had a greater percentage loss in area between
pre- and post-1900.
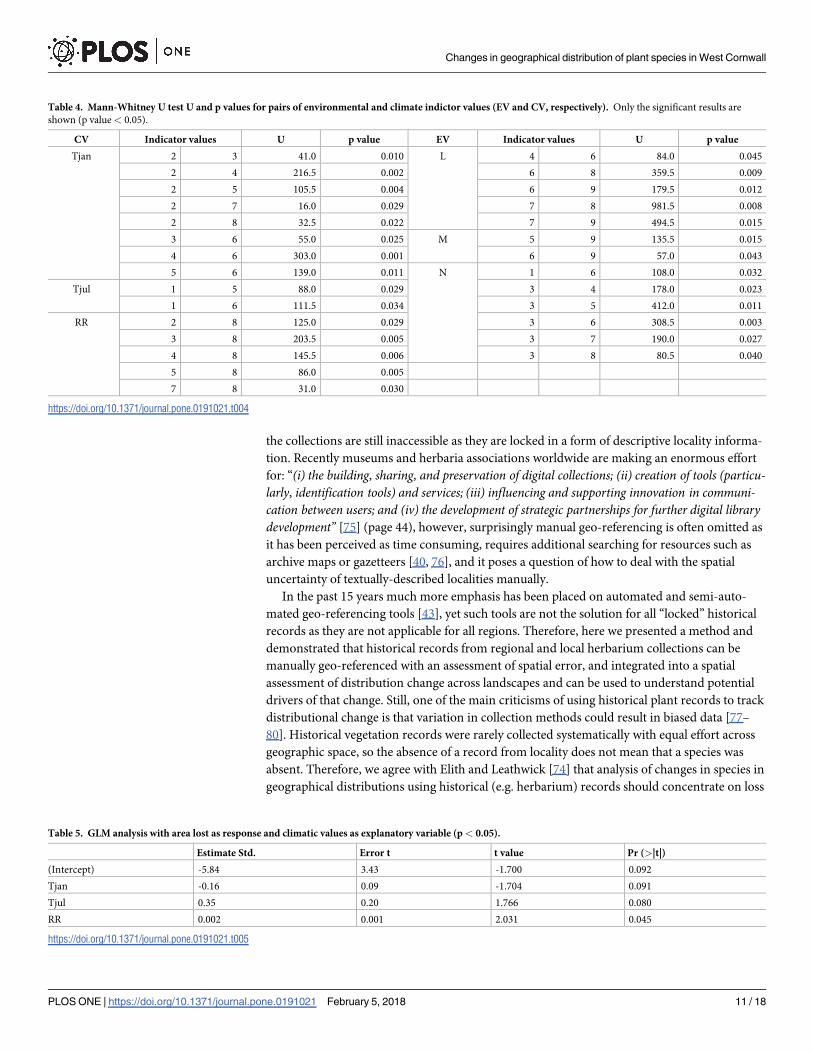
The GLM results are somewhat consistent with the findings above. Based on the GLM, the
probability of losing species increases for species with higher RR values (Table 5). Further-
more, there are indications that the loss will be greater for species with lower January tempera-
ture and higher July temperature, however, these findings are short of statistical significance
(Table 5).
The percentage of area lost in relation to EV is shown in Fig 4 (bottom row). Indicator val-
ues observed by only one species are shown as a single red line in Fig 4. For light (L) there was
no clear pattern; losses for species with L = 4 were significantly higher than those with L = 6,
while species with L = 8 or 9 showed significantly greater losses than those with L = 6 or 7
(Table 4). For moisture (M), excluding indicator values applicable to only one species (M = 2
and 12), species with moderate values (M = 4 to 8) had lower median losses than those with
moderate-extreme values (M = 3, 9, 10) (Table 4). However, when considering all species for
an indicator value, only species with M = 9 showed significantly greater losses than those with
a value of 5 or 6 (Table 4). For nitrogen (N), species with lower indicator values had a higher
percentage of area lost, with those having N = 1 showing significantly greater loss than those
with N = 6, and those with N = 3 showing significantly greater loss than those with N = 4 to 8
(Table 4).
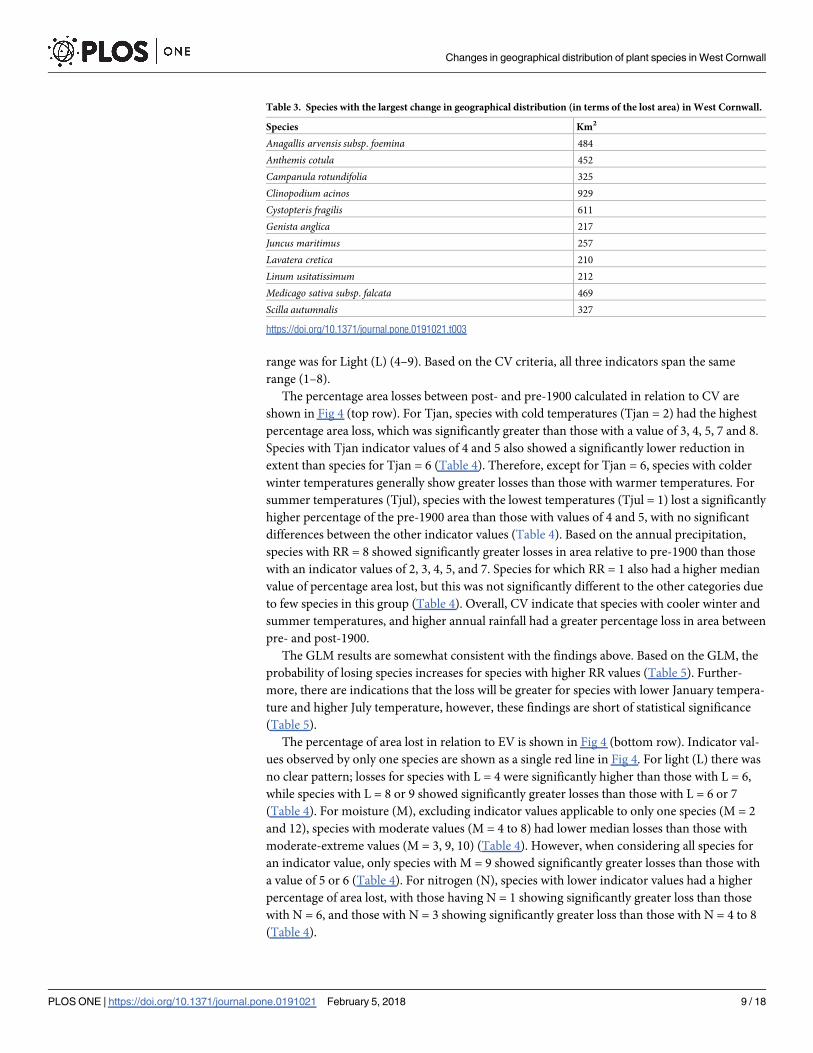
Table 3. Species with the largest change in geographical distribution (in terms of the lost area) in West Cornwall.
Species Km2
Anagallis arvensis subsp. foemina 484
Anthemis cotula 452
Campanula rotundifolia 325
Clinopodium acinos 929
Cystopteris fragilis 611
Genista anglica 217
Juncus maritimus 257
Lavatera cretica 210
Linum usitatissimum 212
Medicago sativa subsp. falcata 469
Scilla autumnalis 327
https://doi.org/10.1371/journal.pone.0191021.t003
Changes in geographical distribution of plant species in West Cornwall
PLOS ONE | https://doi.org/10.1371/journal.pone.0191021 February 5, 2018 9 / 18
Discussion
We have framed the discussion according to the two initial questions posed at the beginning of
the manuscript:
1) Can historical (herbarium) plant species data be used to evaluate changes in geographical
distribution?
Historical biodiversity collections are often associated with uncertainties and limitations
[71], yet they still offer an enormous source of information on past geographical distributions,
and their value is recognised in a context of evaluating present and future anthropogenic
impacts on biodiversity [29, 72, 73]. Although such collections can be used in research, projec-
tions for future biodiversity responses, conservation purposes, and education [71, 74], most of
Fig 4. Pre-1900 area loss for Ellenberg values (EV) and climate indicator values (CV). Showing percentage of the pre-1900 area that was lost post-1900 for CV (top),
and EV (bottom). Climate indicator values are ranked based on temperature (Tjan and Tjul) and precipitation (RR), with a value of 1 representing coldest/driest
conditions and a value of 8 representing the warmest/wettest conditions. Three EV are included: light (L); moisture (M); and nitrogen (N). Median values shown in red
and blue rectangles outline the 25th to 75th percentiles. EV relevant for only one species are shown as a single line (i.e. M = 2 and 12 and N = 9).
https://doi.org/10.1371/journal.pone.0191021.g004
Changes in geographical distribution of plant species in West Cornwall
PLOS ONE | https://doi.org/10.1371/journal.pone.0191021 February 5, 2018 10 / 18
the collections are still inaccessible as they are locked in a form of descriptive locality informa-
tion. Recently museums and herbaria associations worldwide are making an enormous effort
for: “(i) the building, sharing, and preservation of digital collections; (ii) creation of tools (particu-larly, identification tools) and services; (iii) influencing and supporting innovation in communi-cation between users; and (iv) the development of strategic partnerships for further digital librarydevelopment” [75] (page 44), however, surprisingly manual geo-referencing is often omitted as
it has been perceived as time consuming, requires additional searching for resources such as
archive maps or gazetteers [40, 76], and it poses a question of how to deal with the spatial
uncertainty of textually-described localities manually.
In the past 15 years much more emphasis has been placed on automated and semi-auto-
mated geo-referencing tools [43], yet such tools are not the solution for all “locked” historical
records as they are not applicable for all regions. Therefore, here we presented a method and
demonstrated that historical records from regional and local herbarium collections can be
manually geo-referenced with an assessment of spatial error, and integrated into a spatial
assessment of distribution change across landscapes and can be used to understand potential
drivers of that change. Still, one of the main criticisms of using historical plant records to track
distributional change is that variation in collection methods could result in biased data [77–
80]. Historical vegetation records were rarely collected systematically with equal effort across
geographic space, so the absence of a record from locality does not mean that a species was
absent. Therefore, we agree with Elith and Leathwick [74] that analysis of changes in species in
geographical distributions using historical (e.g. herbarium) records should concentrate on loss
Table 4. Mann-Whitney U test U and p values for pairs of environmental and climate indictor values (EV and CV, respectively). Only the significant results are
shown (p value< 0.05).
CV Indicator values U p value EV Indicator values U p value
Tjan 2 3 41.0 0.010 L 4 6 84.0 0.045
2 4 216.5 0.002 6 8 359.5 0.009
2 5 105.5 0.004 6 9 179.5 0.012
2 7 16.0 0.029 7 8 981.5 0.008
2 8 32.5 0.022 7 9 494.5 0.015
3 6 55.0 0.025 M 5 9 135.5 0.015
4 6 303.0 0.001 6 9 57.0 0.043
5 6 139.0 0.011 N 1 6 108.0 0.032
Tjul 1 5 88.0 0.029 3 4 178.0 0.023
1 6 111.5 0.034 3 5 412.0 0.011
RR 2 8 125.0 0.029 3 6 308.5 0.003
3 8 203.5 0.005 3 7 190.0 0.027
4 8 145.5 0.006 3 8 80.5 0.040
5 8 86.0 0.005
7 8 31.0 0.030
https://doi.org/10.1371/journal.pone.0191021.t004
Table 5. GLM analysis with area lost as response and climatic values as explanatory variable (p< 0.05).
Estimate Std. Error t t value Pr (>|t|)
(Intercept) -5.84 3.43 -1.700 0.092
Tjan -0.16 0.09 -1.704 0.091
Tjul 0.35 0.20 1.766 0.080
RR 0.002 0.001 2.031 0.045
https://doi.org/10.1371/journal.pone.0191021.t005
Changes in geographical distribution of plant species in West Cornwall
PLOS ONE | https://doi.org/10.1371/journal.pone.0191021 February 5, 2018 11 / 18
and not gain. Furthermore, uncertainties in historical records could also be related to the qual-
ity of local and regional records, and a more cautious approach is needed if records are from
regions where national biodiversity monitoring is scarce, affected by war or political instability,
and regions with undeveloped transportation infrastructure [81, 82]. Nevertheless, in such
regions even contemporary (i.e. 20th and 21st century) biodiversity records can be affected by
collection bias [81] so we suggest that a detailed inspection of historical/contemporary biodi-
versity records (e.g. locality, date of collection, field notes) is required before assessing changes
in local/regional distributions. To summarise, and answering the initial question directly, her-
barium data can be used to evaluate vegetation change but users must acknowledge uncertain-
ties in historical records to overcome a challenging process of manual geo-referencing.
2) Is there a correlation between EV and CV of plant species and their distribution
patterns?
Only a few studies have looked at whether changes in geographical distributions of plant
species and their associated Ellenberg indicator values follow regional climate variability [52,
83], and this has shown to be true to a certain extent due to microclimatic variations [84]
showing we need more local and regional climate change analysis. Our results showed that
species with colder average temperature Tjan values had a greater percentage loss of area than
other species between pre-1900 and post-1900 datasets. These findings are consistent with
results by Maclean et al. [26] who detected losses in the region (West Cornwall) for grassland
species with low temperature requirements. The changes found in plant species geographical
distributions and their associated CV also follow previous findings on climate change in the
region [85]. For example, the results for plant species change and associated Tjul, are also con-
sistent with previous results on climate variability in West Cornwall that show a positive trend
in summer temperatures in the 20th and 21st centuries [85].
We found that changes in species’ geographical distributions correlated with rainfall (RR)
and moisture (M) indicator values. Climate indicator values for RR and EV for M showed the
greatest losses in pre-1900 area for species with the highest and lowest precipitation require-
ments, and for those with moderately extreme M values. GLM results also showed that the loss
will be larger for the species with the higher RR values. Although these results do not follow
the previous findings by Kosanic et al. [85], as no positive trends in annual or seasonal precipi-
tation were detected, they are in line with Maclean et al. [26] who detected a shift in plant com-
munities towards species with lower moisture requirements over the Lizard Peninsula. These
results confirm high spatial variability of both temperature and precipitation effects, suggesting
that more research on local vegetation response and microclimate is needed [13, 84, 86]. More
local scale research will bring not only a clearer understanding of vegetation-climate change
relationships but will also help to identify new microclimates that could buffer climate change
effects and offer opportunities for targeted in situ conservation strategies [26, 87]. On the other
hand, our result showing a smaller loss of moderately wetter species could also reflect land use
changes, as specialist wetland or drought-tolerant species are expected to be lost as wetter and/
or drier habitats become scarce or degraded. These results demonstrate that we need reliable
information on local climate variability in the post-industrial era and that we need a better
understanding of how plant species react to extreme climatic events.
Significant differences were also found for the non-climatic indicator values. A few signifi-
cant differences were found for the light (L) EV showing a greater loss for specialist species
(i.e. ones that require low light and high light environments), which may be linked to environ-
mental change and with changes in species composition [49, 88].
Changes in the geographical distribution of plant species associated with nitrogen (N)
showed a larger loss of area coverage for those with a lower N requirement. Higher nutrient
availability as a result of changed and intensified agricultural practices may cause the
Changes in geographical distribution of plant species in West Cornwall
PLOS ONE | https://doi.org/10.1371/journal.pone.0191021 February 5, 2018 12 / 18
prevalence of highly-competitive species and low-nutrient species are being out-competed
[89]. Both changes in a plant species distributions with high or low L and N requirements
could reflect a greater importance of non-climatic drivers such as changes in land use and
increased urbanisation in the region during 20th and 21st centuries [90].
Conclusion
This study demonstrates a novel method for incorporating spatial uncertainty in the manual
geo-referencing of herbarium records and shows how to tackle the limitations of historical rec-
ords [71]. We successfully use this approach to track changes in the geographical distributions
of plant species at a local/regional scale. Historical records have a tremendous importance for
analysing past changes in vegetation distribution that offer insight into responses to future as
well as past environmental change. Our results show that the distributions of plant species
with different EV and CV have also changed through time, and that they reflect the climatic
variability of West Cornwall to some extent.
This approach can contribute towards identification of more sensitive and therefore more
vulnerable plant species at the regional scale and should support more targeted in situ conser-
vation strategies [27]. We argue that further research should be conducted on microclimates
[13, 26, 84, 91], land use change, and species distribution changes, providing a firmer link
between EV and CV, and changes in plant species geographical distributions. More research
on EV and CV could lead not only towards clearer attribution of plant species’ responses to
environmental change but also towards the detection of microrefugia sites and, therefore,
could be used as a tool to preserve species in the region. To preserve species locally and region-
ally is important not only from the perspective of ecosystem services, regional identity, and
human well-being, but also in a context of genetic diversity, an important component of spe-
cies’ resilience in the face of future climate change [9, 24, 92, 93].
Supporting information
S1 Table. Plant species and climatic variables. Showing: plant species (ID), Area that was lost
(%), Classified climate indicator values (CV), Ellenberg values (EV), Mean climatic data for
the plant species (Raw CV).
(PDF)
Acknowledgments
We would like to thank Dr America Paz Duran (University of Cambridge) for her valuable
advice on spatial analysis in ArcGIS. Also we would like to thank Dr Martin Coombes (Univer-
sity of Oxford) for proofreading this manuscript.
Author Contributions
Conceptualization: Aleksandra Kosanic, Thea Turkington.
Data curation: Aleksandra Kosanic.
Formal analysis: Aleksandra Kosanic, Thea Turkington.
Investigation: Aleksandra Kosanic.
Methodology: Aleksandra Kosanic, Thea Turkington.
Validation: Aleksandra Kosanic, Karen Anderson, Stephan Harrison, Thea Turkington, Jona-
than Bennie.
Changes in geographical distribution of plant species in West Cornwall
PLOS ONE | https://doi.org/10.1371/journal.pone.0191021 February 5, 2018 13 / 18
Writing – original draft: Aleksandra Kosanic, Karen Anderson, Stephan Harrison, Thea Tur-
kington, Jonathan Bennie.
Writing – review & editing: Aleksandra Kosanic, Karen Anderson, Stephan Harrison, Thea
Turkington, Jonathan Bennie.
References1. Parmesan C, Duarte C, Poloczanska E, Richardson AJ, Singer MC. Overstretching attribution. Nature
Clim Change. 2011; 1(1):2–4.
2. Pacifici M, Foden WB, Visconti P, Watson JEM, Butchart SHM, Kovacs KM, et al. Assessing species
vulnerability to climate change. Nature Clim Change. 2015; 5(3):215–24. https://doi.org/10.1038/
nclimate2448
3. Palmer G, Hill JK, Brereton TM, Brooks DR, Chapman JW, Fox R, et al. Individualistic sensitivities and
exposure to climate change explain variation in species’ distribution and abundance changes. Science
Advances. 2015; 1(9). https://doi.org/10.1126/sciadv.1400220 PMID: 26601276
4. Chen I- C, Hill JK, Ohlemuller R, Roy DB, Thomas CD. Rapid Range Shifts of Species Associated with
High Levels of Climate Warming. Science. 2011; 333(6045):1024–6. https://doi.org/10.1126/science.
1206432 PMID: 21852500
5. Parmesan C. Ecological and Evolutionary Responses to Recent Climate Change. Annual Review of
Ecology, Evolution, and Systematics. 2006; 37(1):637–69. https://doi.org/10.1146/annurev.ecolsys.37.
091305.110100
6. Cardinale BJ, Duffy JE, Gonzalez A, Hooper DU, Perrings C, Venail P, et al. Biodiversity loss and its
impact on humanity. Nature. 2012; 486(7401):59–67. https://doi.org/10.1038/nature11148 PMID:
22678280
7. Lenoir J, Gegout JC, Marquet PA, de Ruffray P, Brisse H. A Significant Upward Shift in Plant Species
Optimum Elevation During the 20th Century. Science. 2008; 320(5884):1768–71. https://doi.org/10.
1126/science.1156831 PMID: 18583610
8. Parmesan C, Hanley ME. Plants and climate change: complexities and surprises. Annals of Botany.
2015; 116(6):849–64. https://doi.org/10.1093/aob/mcv169 PMID: 26555281
9. Bellard C, Bertelsmeier C, Leadley P, Thuiller W, Courchamp F. Impacts of climate change on the future
of biodiversity. Ecology letters. 2012; 15(4):365–77. https://doi.org/10.1111/j.1461-0248.2011.01736.x
PMID: 22257223
10. IPCC. Climate Change 2014, Synthesis Report, Summary for Policymakers. Contribution of Working
Groups I, II and III to the Fifth Assessment Report of the Intergovernmental Panel on Climate Change.
Geneva, Switzerland: 2014.
11. Loarie SR, Duffy PB, Hamilton H, Asner GP, Field CB, Ackerly DD. The velocity of climate change.
Nature. 2009; 462(7276):1052–5. https://doi.org/10.1038/nature08649 PMID: 20033047
12. Alsos IG, Ehrich D, Thuiller W, Eidesen PB, Tribsch A, Schonswetter P, et al. Genetic consequences of
climate change for northern plants. Proceedings of the Royal Society B: Biological Sciences. 2012; 279
(1735):2042–51. https://doi.org/10.1098/rspb.2011.2363 PMID: 22217725
13. Suggitt AJ, Wilson RJ, August TA, Beale CM, Bennie JJ, Dordolo A, et al. Climate change refugia for
the flora and fauna of England. Sheffield: Natural England, 2014.
14. Corlett RT, Westcott DA. Will plant movements keep up with climate change? Trends in Ecology & Evo-
lution. 2013; 28(8):482–8.
15. Zhao M, Running SW. Drought-Induced Reduction in Global Terrestrial Net Primary Production from
2000 Through 2009. Science. 2010; 329(5994):940–3. https://doi.org/10.1126/science.1192666 PMID:
20724633
16. Coumou D, Rahmstorf S. A decade of weather extremes. Nature Clim Change. 2012; 2(7):491–6.
17. Min S- K, Zhang X, Zwiers FW, Hegerl GC. Human contribution to more-intense precipitation extremes.
Nature. 2011; 470(7334):378–81. https://doi.org/10.1038/nature09763 PMID: 21331039
18. Richardson AD, Andy Black T, Ciais P, Delbart N, Friedl MA, Gobron N, et al. Influence of spring and
autumn phenological transitions on forest ecosystem productivity. Philosophical Transactions of the
Royal Society of London B: Biological Sciences. 2010; 365(1555):3227–46. https://doi.org/10.1098/
rstb.2010.0102 PMID: 20819815
19. Butchart SHM, Walpole M, Collen B, van Strien A, Scharlemann JPW, Almond REA, et al. Global Biodi-
versity: Indicators of Recent Declines. Science. 2010; 328(5982):1164–8. https://doi.org/10.1126/
science.1187512 PMID: 20430971
Changes in geographical distribution of plant species in West Cornwall
PLOS ONE | https://doi.org/10.1371/journal.pone.0191021 February 5, 2018 14 / 18
20. VilàM, Ibañez I. Plant invasions in the landscape. Landscape Ecol. 2011; 26(4):461–72. https://doi.org/
10.1007/s10980-011-9585-3
21. Matthies D, Brauer I, Maibom W, Tscharntke T. Population size and the risk of local extinction: empirical
evidence from rare plants. Oikos. 2004; 105(3):481–8. https://doi.org/10.1111/j.0030-1299.2004.
12800.x
22. Balvanera P, Siddique I, Dee L, Paquette A, Isbell F, Gonzalez A, et al. Linking Biodiversity and Ecosys-
tem Services: Current Uncertainties and the Necessary Next Steps. BioScience. 2013:1–9. https://doi.
org/10.1093/biosci/bit003
23. de Oliveira LEC, Berkes F. What value São Pedro’s procession? Ecosystem services from local peo-
ple’s perceptions. Ecological Economics. 2014; 107(0):114–21.
24. Kosanic A, Anderson K, Frère CH, Harrison S. Regional vegetation change and implications for local
conservation: An example from West Cornwall (United Kingdom). Global Ecology and Conservation.
2015; 4:405–13.
25. Keppel G, Van Niel KP, Wardell-Johnson GW, Yates CJ, Byrne M, Mucina L, et al. Refugia: identifying
and understanding safe havens for biodiversity under climate change. Global Ecology and Biogeogra-
phy. 2012; 21(4):393–404. https://doi.org/10.1111/j.1466-8238.2011.00686.x
26. Maclean IMD, Hopkins JJ, Bennie J, Lawson CR, Wilson RJ. Microclimates buffer the responses of
plant communities to climate change. Global Ecology and Biogeography. 2015:n/a-n/a. https://doi.org/
10.1111/geb.12359
27. Greenwood O, Mossman HL, Suggitt AJ, Curtis RJ, Maclean IMD. Review: Using in situ management
to conserve biodiversity under climate change. Journal of Applied Ecology. 2016; 53(3):885–94. https://
doi.org/10.1111/1365-2664.12602 PMID: 27609987
28. Parmesan C, Yohe G. A globally coherent fingerprint of climate change impacts across natural systems.
Nature. 2003; 421(6918):37–42. https://doi.org/10.1038/nature01286 PMID: 12511946
29. Calinger KM, Queenborough S, Curtis PS. Herbarium specimens reveal the footprint of climate change
on flowering trends across north-central North America. Ecology letters. 2013; 16(8):1037–44. doi: 10.
1111/ele.12135. PMC3806244. PMID: 23786499
30. Panchen ZA, Primack RB, Aniśko T, Lyons RE. Herbarium specimens, photographs, and field observa-
tions show Philadelphia area plants are responding to climate change. American Journal of Botany.
2012; 99(4):751–6. https://doi.org/10.3732/ajb.1100198 PMID: 22447982
31. Gallagher RV, Hughes L, Leishman MR. Phenological trends among Australian alpine species: using
herbarium records to identify climate-change indicators. Australian Journal of Botany. 2009; 57(1):1–9.
https://doi.org/10.1071/BT08051
32. Matthews ER, Mazer SJ. Historical changes in flowering phenology are governed by temperature × pre-
cipitation interactions in a widespread perennial herb in western North America. New Phytologist. 2016;
210(1):157–67. https://doi.org/10.1111/nph.13751 PMID: 26595165
33. Lienert J, Fischer M, Diemer M. Local extinctions of the wetland specialist Swertia perennis L. (Gentia-
naceae) in Switzerland: a revisitation study based on herbarium records. Biological Conservation.
2002; 103(1):65–76.
34. Van den Eynden V, Oatham MP, Johnson W. How free access internet resources benefit biodiversity
and conservation research: Trinidad and Tobago’s endemic plants and their conservation status. Oryx.
2008; 42(03):400–7. https://doi.org/10.1017/S0030605308007321
35. Rivers MC, Taylor L, Brummitt NA, Meagher TR, Roberts DL, Lughadha EN. How many herbarium
specimens are needed to detect threatened species? Biological Conservation. 2011; 144(10):2541–7.
https://doi.org/10.1016/j.biocon.2011.07.014
36. Graham CH, Ferrier S, Huettman F, Moritz C, Peterson AT. New developments in museum-based infor-
matics and applications in biodiversity analysis. Trends in Ecology & Evolution. 2004; 19(9):497–503.
https://doi.org/10.1016/j.tree.2004.07.006 PMID: 16701313
37. Soberon J, Peterson T. Biodiversity informatics: managing and applying primary biodiversity data. Phil-
osophical Transactions of the Royal Society of London Series B: Biological Sciences. 2004; 359
(1444):689–98. https://doi.org/10.1098/rstb.2003.1439 PMID: 15253354
38. Feeley KJ, Silman MR. Modelling the responses of Andean and Amazonian plant species to climate
change: the effects of georeferencing errors and the importance of data filtering. Journal of Biogeogra-
phy. 2010; 37(4):733–40. https://doi.org/10.1111/j.1365-2699.2009.02240.x
39. Wieczorek J, Guo Q, Hijmans R. The point-radius method for georeferencing locality descriptions and
calculating associated uncertainty. International Journal of Geographical Information Science. 2004; 18
(8):745–67. https://doi.org/10.1080/13658810412331280211
Changes in geographical distribution of plant species in West Cornwall
PLOS ONE | https://doi.org/10.1371/journal.pone.0191021 February 5, 2018 15 / 18
40. Guralnick RP, Wieczorek J, Beaman R, Hijmans RJ, the BioGeomancer Working G. BioGeomancer:
Automated Georeferencing to Map the World’s Biodiversity Data. PLoS biology. 2006; 4(11):e381.
https://doi.org/10.1371/journal.pbio.0040381 PMID: 17105347
41. Graham CH, Elith J, Hijmans RJ, Guisan A, Townsend Peterson A, Loiselle BA, et al. The influence of
spatial errors in species occurrence data used in distribution models. Journal of Applied Ecology. 2008;
45(1):239–47. https://doi.org/10.1111/j.1365-2664.2007.01408.x
42. Elith J, Graham C H., Anderson R P., Dudık M, Ferrier S, Guisan A, et al. Novel methods improve pre-
diction of species’ distributions from occurrence data. Ecography. 2006; 29(2):129–51. https://doi.org/
10.1111/j.2006.0906–7590.04596.x
43. Auer T, MacEachren AM, McCabe C, Pezanowski S, Stryker M. HerbariaViz: A web-based client–
server interface for mapping and exploring flora observation data. Ecological Informatics. 2011; 6
(2):93–110.
44. Garcia-Milagros E, Funk VA. data: Improving the use of information from museum specimens: Using
Google Earth to georeference Guiana Shield specimens in the US National Herbarium. Frontiers of Bio-
geography. 2010; 2(3).
45. Ellenberg H, Weber HE, Dull R, Wirth V, Werner W, Paulißen D. Zeigerwerte von Pflanzen in Mitteleur-
opa (Indicator values for plants of Central Europe), Scripta Botanica. 2001.
46. Hill MO, Roy DB, Mountford JO, Bunce RGH. Extending Ellenberg’s indicator values to a new area: an
algorithmic approach. Journal of Applied Ecology. 2000; 37(1):3–15. https://doi.org/10.1046/j.1365-
2664.2000.00466.x
47. Hill MO, Preston CD, Roy DB. PLANTATT—attributes of British and Irish Plants: status, size, life his-
tory, geography and habitats. 2004.
48. Diekmann M. Species indicator values as an important tool in applied plant ecology–a review. Basic
and Applied Ecology. 2003; 4(6):493–506.
49. Dzwonko Z. Assessment of light and soil conditions in ancient and recent woodlands by Ellenberg indi-
cator values. Journal of Applied Ecology. 2001; 38(5):942–51. https://doi.org/10.1046/j.1365-2664.
2001.00649.x
50. Haring T, Reger B, Ewald J, Hothorn T, Schroder B. Predicting Ellenberg’s soil moisture indicator value
in the Bavarian Alps using additive georegression. Applied Vegetation Science. 2012:n/a-n/a. https://
doi.org/10.1111/j.1654-109X.2012.01210.x
51. Kollmann J, Fischer A. Vegetation as indicator for habitat quality. Basic and Applied Ecology. 2003; 4
(6):489–91.
52. Pignatti S, Bianco P, Fanelli G, Guarino R, Petersen J, Tescarollo P. Reliability and effectiveness of
Ellenberg’s indices in checking flora and vegetation changes induced by climatic variations. In: Walther
GR, Burga CA, Edwards PJ, editors. “Fingerprints” of Climate Change: Springer US; 2001. p. 281–304.
53. Renetzeder C, Knoflacher M, Loibl W, Wrbka T. Are habitats of Austrian agricultural landscapes sensi-
tive to climate change? Landscape and Urban Planning. 2010; 98(3–4):150–9. https://doi.org/10.1016/j.
landurbplan.2010.08.022
54. Van Der Veken S, Bossuyt B, Hermy M. Climate gradients explain changes in plant community compo-
sition of the forest understory: an extrapolation after climate warming. Belgian Journal of Botany. 2004;
137(1):55–69.
55. NBN. Vascular Plants Database and Vascular Plants Databese additions since 2000. Natural Biodiver-
sity Network,; 2013; Data acess set to 10 km resolution. https://data.nbn.org.uk/. Accessed 16 June
2013.
56. Preston CD, Pearman DA, Dines TD. New Atlas of the British and Irish Flora. 1st ed. Press OU, editor.
Oxford: Oxford University Press; 2002.
57. Naylor S. The field, the museum and the lecture hall: the spaces of natural history in Victorian Cornwall.
Transactions of the Institute of British Geographers. 2002; 27(4):494–513. https://doi.org/10.1111/
1475-5661.00067
58. Davey HF. The Flora of Cornwall. 2nd ed. Wakefield, West Yorkshire, England: EP Publishing Limited;
1909.
59. OS. Old-Maps.co.uk, 1:2500. 2010. https://www.old-maps.co.uk/#/Map/180500/32500. Accessed 10
April 2013.
60. Lavoie C. Biological collections in an ever changing world: Herbaria as tools for biogeographical and
environmental studies. Perspectives in Plant Ecology, Evolution and Systematics. 2013; 15(1):68–76.
61. The Plant List. A working list of all plant species. 2013; Version 1.1. http://www.theplantlist.org/.
Accessed 9 January 2013.
Changes in geographical distribution of plant species in West Cornwall
PLOS ONE | https://doi.org/10.1371/journal.pone.0191021 February 5, 2018 16 / 18
62. Doherty P, Guo Q, Liu Y, Wieczorek J, Doke J. Georeferencing Incidents from Locality Descriptions and
its Applications: a Case Study from Yosemite National Park Search and Rescue. Transactions in GIS.
2011; 15(6):775–93. https://doi.org/10.1111/j.1467-9671.2011.01290.x
63. Chapman AD, Wieczorek J. A guide to the best practices for georeferencing biological species written
by the BioGeomancer Consortium. In: Facility GBI, editor. Copenhagen2006. p. 1–77.
64. Wieczorek J, Bloom D, Constable H, Fang J, Koo M, Spencer C, et al. Georeferencing Quick Reference
Guide. 2012.
65. ESRI. ArcGIS Desktop: Release 10. Redlands, CA.2011. www.esri.com. Accessed 1 January 2013.
66. OS. ESRI Shapefile, Boundary-Line of Cornwall. Southampton2017.
67. Godefroid S, Dana ED. ORIGINAL ARTICLE: Can Ellenberg’s indicator values for Mediterranean plants
be used outside their region of definition? Journal of Biogeography. 2007; 34(1):62–8. https://doi.org/
10.1111/j.1365-2699.2006.01582.x
68. Bennie J, Hill MO, Baxter R, Huntley B. Influence of slope and aspect on long-term vegetation change
in British chalk grasslands. Journal of Ecology. 2006; 94(2):355–68. https://doi.org/10.1111/j.1365-
2745.2006.01104.x
69. Curtis CA, Bradley BA. Plant Distribution Data Show Broader Climatic Limits than Expert-Based Cli-
matic Tolerance Estimates. PloS one. 2016; 11(11):e0166407. https://doi.org/10.1371/journal.pone.
0166407 PMID: 27870859
70. R Core Team. R: A language and environment for statistical computing. R Foundation for Statistical
Computing. Vienna, Austria2016.
71. Newbold T. Applications and limitations of museum data for conservation and ecology, with particular
attention to species distribution models. Progress in Physical Geography. 2010; 34(1):3–22. https://doi.
org/10.1177/0309133309355630
72. Tsutsui ND, Suarez AV. The Value of Museum Collections for Research and Society. BioScience.
2004; 67:66–74.
73. Baker DJ, Hartley AJ, Pearce-Higgins JW, Jones RG, Willis SG. Neglected issues in using weather and
climate information in ecology and biogeography. Diversity and Distributions. 2017; 23(3):329–40.
https://doi.org/10.1111/ddi.12527
74. Elith J, Leathwick J. Predicting species distributions from museum and herbarium records using multire-
sponse models fitted with multivariate adaptive regression splines. Diversity and Distributions. 2007; 13
(3):265–75. https://doi.org/10.1111/j.1472-4642.2007.00340.x
75. Beaman RS, Conn BJ. Automated geoparsing and georeferencing of Malesian collection locality data.
Telopea 2003; 10(1):43–52.
76. Beaman R, Wieczorek J, Blum S. Determining Space from Place for Natural History Collections. In a
Distributed Digital Library Environment. 2004; 10(5).
77. Isaac NJB, Pocock MJO. Bias and information in biological records. Biological Journal of the Linnean
Society. 2015; 115(3):522–31. https://doi.org/10.1111/bij.12532
78. Mair L, Ruete A. Explaining Spatial Variation in the Recording Effort of Citizen Science Data across Mul-
tiple Taxa. PloS one. 2016; 11(1):e0147796. https://doi.org/10.1371/journal.pone.0147796 PMID:
26820846
79. Bellamy C, Altringham J. Predicting Species Distributions Using Record Centre Data: Multi-Scale
Modelling of Habitat Suitability for Bat Roosts. PloS one. 2015; 10(6):e0128440. doi: 10.1371/journal.
pone.0128440. PMC4460044. PMID: 26053548
80. Boakes EH, McGowan PJK, Fuller RA, Chang-qing D, Clark NE, O’Connor K, et al. Distorted Views of
Biodiversity: Spatial and Temporal Bias in Species Occurrence Data. PLoS biology. 2010; 8(6):
e1000385. https://doi.org/10.1371/journal.pbio.1000385 PMID: 20532234
81. Boakes EH, Fuller RA, McGowan PJK, Mace GM. Uncertainty in identifying local extinctions: the distri-
bution of missing data and its effects on biodiversity measures. Biology Letters. 2016; 12(3). https://doi.
org/10.1098/rsbl.2015.0824 PMID: 26961894
82. Tingley MW, Beissinger SR. Detecting range shifts from historical species occurrences: new perspec-
tives on old data. Trends in Ecology & Evolution. 2009; 24(11):625–33.
83. Filibeck G, Adams J, Brunetti M, Di Filippo A, Rosati L, Scoppola A, et al. Tree ring ecological signal is
consistent with floristic composition and plant indicator values in Mediterranean Fagus sylvatica forests.
Journal of Ecology. 2015; 103(6):1580–93. https://doi.org/10.1111/1365-2745.12478
84. Scherrer D, Korner C. Topographically controlled thermal-habitat differentiation buffers alpine plant
diversity against climate warming. Journal of Biogeography. 2011; 38(2):406–16. https://doi.org/10.
1111/j.1365-2699.2010.02407.x
Changes in geographical distribution of plant species in West Cornwall
PLOS ONE | https://doi.org/10.1371/journal.pone.0191021 February 5, 2018 17 / 18
85. Kosanic A, Harrison S, Anderson K, Kavcic I. Present and historical climate variability in South West
England. Climatic Change. 2014:1–17. https://doi.org/10.1007/s10584-014-1101-8
86. Ashcroft MB, Gollan JR, Warton DI, Ramp D. A novel approach to quantify and locate potential microre-
fugia using topoclimate, climate stability, and isolation from the matrix. Global Change Biology. 2012;
18(6):1866–79. https://doi.org/10.1111/j.1365-2486.2012.02661.x
87. Ashcroft MB, Chisholm LA, French KO. Climate change at the landscape scale: predicting fine-grained
spatial heterogeneity in warming and potential refugia for vegetation. Global Change Biology. 2009; 15
(3):656–67. https://doi.org/10.1111/j.1365-2486.2008.01762.x
88. Colles A, Liow LH, Prinzing A. Are specialists at risk under environmental change? Neoecological,
paleoecological and phylogenetic approaches. Ecology Letters. 2009; 12(8):849–63. https://doi.org/10.
1111/j.1461-0248.2009.01336.x PMID: 19580588
89. Wesche K, Krause B, Culmsee H, Leuschner C. Fifty years of change in Central European grassland
vegetation: Large losses in species richness and animal-pollinated plants. Biological Conservation.
2012; 150(1):76–85.
90. Casalegno S, Bennie JJ, Inger R, Gaston KJ. Regional Scale Prioritisation for Key Ecosystem Services,
Renewable Energy Production and Urban Development. PloS one. 2014; 9(9):e107822. https://doi.org/
10.1371/journal.pone.0107822 PMID: 25250775
91. Suggitt A, Wilson R, August T, Fox R, Isaac NB, Macgregor N, et al. Microclimate affects landscape
level persistence in the British Lepidoptera. Journal of Insect Conservation. 2015; 19(2):237–53. https://
doi.org/10.1007/s10841-014-9749-y
92. Carpenter SR, Mooney HA, Agard J, Capistrano D, DeFries RS, Dıaz S, et al. Science for managing
ecosystem services: Beyond the Millennium Ecosystem Assessment. Proceedings of the National
Academy of Sciences. 2009; 106(5):1305–12. https://doi.org/10.1073/pnas.0808772106 PMID:
19179280
93. Seddon N, Mace GM, Naeem S, Tobias JA, Pigot AL, Cavanagh R, et al. Biodiversity in the Anthropo-
cene: prospects and policy. Proceedings of the Royal Society B: Biological Sciences. 2016; 283(1844).
https://doi.org/10.1098/rspb.2016.2094 PMID: 27928040
Changes in geographical distribution of plant species in West Cornwall
PLOS ONE | https://doi.org/10.1371/journal.pone.0191021 February 5, 2018 18 / 18