changes in growth performance and proximate composition in japanese flounder during metamorphosis
TRANSCRIPT

Changes in growth performance and proximate
composition in Japanese flounder during metamorphosis
M. A. R. HOSSAIN*†, M. TAGAWA*, R. MASUDA‡ AND
M. TANAKA*
*Laboratory of Marine Stock-enhancement Biology, Division of Applied Bioscience,Graduate School of Agriculture, Kyoto University, Kyoto 606-8502, Japan and‡Fisheries Research Station, Kyoto University, Naga-Hama, Maizuru, Kyoto,
625-0086, Japan
(Received 15 January 2002, Accepted 22 August 2003)
Morphological changes are described in Japanese flounder Paralichthys olivaceus larvae and
juveniles with emphasis on growth during the period of metamorphosis. Ontogenetic changes in
condition factor and lipid, glycogen and protein levels were also analysed to determine the
utilization of stored energy. Fish grew from 6�6 to 20�3mm LT (1�15 to 84�4mg in mass, M)
during the period from 11 to 40 days after hatching (DAH) at 19�3� C. Per cent specific growthrate per day (% G day�1) for wet mass was lowest during the metamorphic phase (21–30DAH)
compared to pre- (11–20DAH) and post-metamorphic (31–40DAH) phases. When LT and M
were expressed as M¼ a LbT, the b value was highest during the pre-metamorphic phase and
lowest during the metamorphic phase. These findings indicate that the developmental changes
that occur during metamorphosis of Japanese flounder are closely related to the growth pattern.
Moisture, lipid and glycogen contents were also at the lowest level during metamorphosis
compared to pre- and post-metamorphosis, which suggest that Japanese flounder use their
energy reserves to accomplish metamorphosis due to an apparent decline in feeding during this
period. # 2003 The Fisheries Society of the British Isles
Key words: growth retardation; metamorphosis; Paralichthys olivaceus; settlement; stored
energy.
INTRODUCTION
The Japanese flounder Paralichthys olivaceus (Temminck & Schlegel) is one ofthe most important and the highest-priced fishes in the coastal fisheries ofJapan, with an annual catches of 6000 to 8000 t (Tanaka et al., 1989; Fujii &Noguchi, 1996). Because they are easy to handle, aquaculture of juveniles of thisspecies is flourishing in Japan. Now Japanese flounder is the most importanttarget species for stock enhancement of marine fishes with an annual release of25 million hatchery-reared juveniles.Like other pleuronectiforms, Japanese flounder larvae go through a meta-
morphosis coincident with the shift from pelagic to benthic life and from
†Author to whom correspondence should be addressed at present address: Department of Fish Biology
and Genetics, Faculty of Fisheries, Bangladesh Agricultural University, Mymensingh-2202, Bangladesh.
Tel.: þ880 91 54963; fax: þ880 91 55810; email: [email protected]
Journal of Fish Biology (2003) 63, 1283–1294
doi:10.1046/j.1095-8649.2003.00251.x,availableonlineathttp://www.blackwell-synergy.com
1283# 2003TheFisheries Society of theBritish Isles

symmetric larvae to asymmetric juveniles (Tanaka et al., 1989). Youson (1988)characterized this metamorphosis (‘first metamorphosis’) as a dramatic andabrupt change in form that is triggered by internal and environmental cues.Morphological changes during metamorphosis in this species are described indetail, and the transition forms staged, by Minami (1982). The metamorphosisis known to be triggered by thyroid hormones (Inui et al., 1989; Tagawa et al.,1990) and the timing fluctuates depending on environmental factors such aswater temperature (Seikai et al., 1986).Fukuhara (1986) described the morphological and functional development
including eye migration and swimming speed of Japanese flounder in early lifestages. The effect of temperature on the duration of different stages of meta-morphosis of the species was described by Seikai et al. (1986). The activity ofthyroxine at two different temperatures (Tanangonan et al., 1989) and differentfatty acids in the proximate composition (Furuita et al., 1998) of metamorphos-ing Japanese flounder have also been investigated. Tanaka et al. (1996)described the morphology of the developing digestive system in relation tometamorphosis and settlement. Although the early life history of Japaneseflounder has been extensively studied (Tanaka et al., 1998), day to day growth,growth retardation (if any) and feeding of this species during different phases ofmetamorphosis is still not fully understood. The first aim of the present studywas to describe, growth performance before, during and after metamorphosis.The second aim was to analyse developmental changes in body composition(lipid, glycogen and protein content) to elucidate their role in metamorphosis.
MATERIALS AND METHODS
FISH AND REARING CONDITIONS
Japanese flounder eggs were provided by the Japan Sea Farming Association(JASFA), Miyazu Station, Miyazu, Kyoto Prefecture, Japan. Eggs were hatched on5 May 2000 and larvae were reared at the Fisheries Research Station (FRS) of KyotoUniversity, Maizuru, Kyoto Prefecture, Japan, during May to June, 2000. Eggs wereincubated in a 500 l polycarbonate tank with running sea water. Water in the tank wasaerated at a rate of 50–100mlmin�1. Larvae were fed L-type rotifers Brachionus plicatalis(O.F. Muller) (supplied by JASFA Miyazu Station and cultured with Chlorella sp.) for21 days, from 3 days after hatching (DAH). Artemia nauplii (Miyako Kagaku Co. Ltd.,Tokyo, Japan) were fed to larvae from 10–35DAH. At the end of the Artemia feeding,26DAH, fish were gradually switched to pellet food until the juveniles reached 5 cm totallength (LT). Both rotifers and Artemia nauplii were enriched with docosahexaenoic acid(DHA, Harima Kagaku Co. Ltd, Tokyo, Japan) and grown at an incubation density of200–300 individualsml�1 and 100 individualsml�1, respectively. They were disinfectedusing the anti-bacterial agent, Erbaju (10% beads, Ueno Fine Chemical Industry Ltd,Osaka, Japan) before being fed to Japanese flounder larvae. Temperature in therearing tank was maintained at 19�3� 0�3� C (mean� S.E.). Controlled illuminationwith fluorescent lamps gave a 12L : 12D photoperiod (light on 0830 hours).
SAMPLING AND PRESERVATION
Fish were sampled every day between 11–40DAH (total sampling period 30 days). Allthe sampled fish were first anaesthetized using 200 ppm benzocaine (MS222). A few ofthese fish were examined under a microscope and the food items (rotifer or Artemia) in
1284 M. A . R . HOSSAIN ET AL .
# 2003TheFisheries Society of the British Isles, Journal of FishBiology 2003, 63, 1283–1294

the stomach were counted. Then half of the remaining sampled fish were frozen at�80� C and the other half was preserved in 10% buffered formalin solution.
DEVELOPMENTAL STAGES
Formalin preserved sample were carefully separated into developmental stages as firstdescribed by Minami (1982) and later modified by Seikai et al. (1986) and Tanangonanet al. (1989). These authors classified the development of Japanese flounder larvae intothree main phases; pre-metamorphosis, metamorphosis and post-metamorphosis with tensub-stages (Table I). All the stages are defined based on the morphological and behav-ioral characteristics of larvae.
MORPHOMETRIC MEASUREMENTS AND PROXIMATECOMPOSITION ANALYSES
Alizarin staining was done to identify fin rays, eye migration and skeletal development.The formalin preserved samples were stained based on Sire et al. (1997) with a fewmodifications. First, the samples were rehydrated in water and depigmented forc. 20min in 0�5% KOH containing 3% H2O2 followed by rinsing in distilled water toremove H2O2. The fish samples were then placed in a mixture of 1% KOH and glycerol(1v/1v) for 2 h for partial clearing. Then the samples were stained using alizarin reddissolved in 0�5% KOH. After staining the samples were cleared again in the samemixture (KOH and glycerol) for 1 h and finally stored in pure glycerol. Body dimensionsmeasured were LT (cm), standard length (LS, cm), mass (M, g) and body depth (BD,mm). Body length and depth measurements were made using a microscope with a profileprojector. Average daily growth was calculated in each phase for LT as 0�1 (LTend –LTstart) and for mass as 0�1 (Mend –Mstart). The specific growth rate (G, % day�1) wascalculated as G¼ 100 g, where g¼ (lnX2� lnX1) (t2� t1)
�1 and X1 and X2 are LT, LS, BDand M at times (days) t1 and t2. (Busacker et al., 1990).The relationship between M (g) and LT (cm) was calculated from M¼ a Lb
T, wherea and b are constants. When b¼ 3, growth is isometric (Ricker, 1979). The nutritionalcondition of the fish was estimated using the condition factor K (Bolger & Connolly,1989), calculated as: K ¼ 100ML�3
T , where LT is in cm.Moisture, protein and lipid content were estimated according to Fonds et al. (1995).
Glycogen content was analysed following the method detailed by Montgomery (1957).
STATISTICAL ANALYSIS
Moisture, protein, lipid and glycogen content was expressed as per cent body mass andarcsine transformed. Bartlett’s test revealed homogeneous variances for all the statisticalcomparisons (Sokal & Rohlf, 1981). Growth variables and proximate composition oflarvae at the three stages were analysed by ANOVA (a¼ 0�05).
RESULTS
METAMORPHIC PHASES
Larvae at 11 and 13DAH (average LT¼ 6�6 and 7�8mm, respectively) hadsymmetrically positioned eyes and three elongated dorsal fin rays. They wereidentified as stage C (Fig. 1). Some larvae at 12DAH, however, had D stagecharacteristics with five dorsal fin rays and six caudal fin rays (Fig. 1). At15DAH (average LT¼ 8�8mm) the body depth was expanded, notochord flex-ion was observed, and thus larvae were identified as stage E. Some of the larvae,however, were found to be at stage D even after 15DAH.
JAPANESE FLOUNDER METAMORPHOSIS 1285
# 2003TheFisheries Society of theBritish Isles, Journal of FishBiology 2003, 63, 1283–1294

TABLEI.
Morphometricandbehaviouralcharacteristics
ofmetamorphosingJapaneseflounder
larvaein
differentstages
Development
Stage
Characteristics
Pre-m
etamorphosis
AEyes
symmetrical.Yolk
totallyabsorbed
butoilglobule
sometim
espresent.
Openingofmouth.Startsexogenousfeeding.Pelagic
larvae.
BEyes
symmetrical.Budofelongateddorsalfinrays.Gutexpanded.Pelagic
larvae.
CEyes
symmetrical.Threeelongatedanteriordorsalfinrays.Budofcaudalfinrays.Pelagic
larvae.
DEyes
symmetrical.Beginningofbodycompression.Fiveelongateddorsalfinrays.Six
caudalfinrays.Pelagic.
ENotochord
flexion45�upward.Bodydepth
increased.Beginningofeyemigration.Pelagic
larvae.
Earlymetamorphosis
FSix
elongateddorsalfinrays.Proliferationofdorsalandanalfinrays.Slightlydorsal
movem
entofrighteyebutstillrighteyeunobservable
from
leftside.
Definiteasymmetry
dueto
eyemigration.Notochord
stillextendingposteriorto
hypurals.Hypuralsandcaudal
finraysdeveloping.Pelagic
larvae.
Mid-m
etamorphosis
GRighteyeobservable
from
leftside.
Dorsalandanalfinrayswelldeveloped.Pelagic
larvae.
Late
metamorphosis
HNearlyhalfoftherighteyeobservable
from
leftside.
Righteyeatdorsalmid
lineordorsaledge.
Bodydepth
increased.Pelagic
withperiodicalsettlingbehaviour(pseudo-settlem
ent).Metamorphic
clim
ax.
Post-m
etamorphosis
I 1Righteyecompletely
ontheleftside.
Elongateddorsalfinraysabsorbed.Settled
orbenthic
juveniles.
I 2Settled
orbenthic
juveniles
for5days.
After
Minami(1982),Seikaiet
al.(1986)andTanangonanet
al.(1989).
1286 M. A . R . HOSSAIN ET AL .
# 2003TheFisheries Society of the British Isles, Journal of FishBiology 2003, 63, 1283–1294
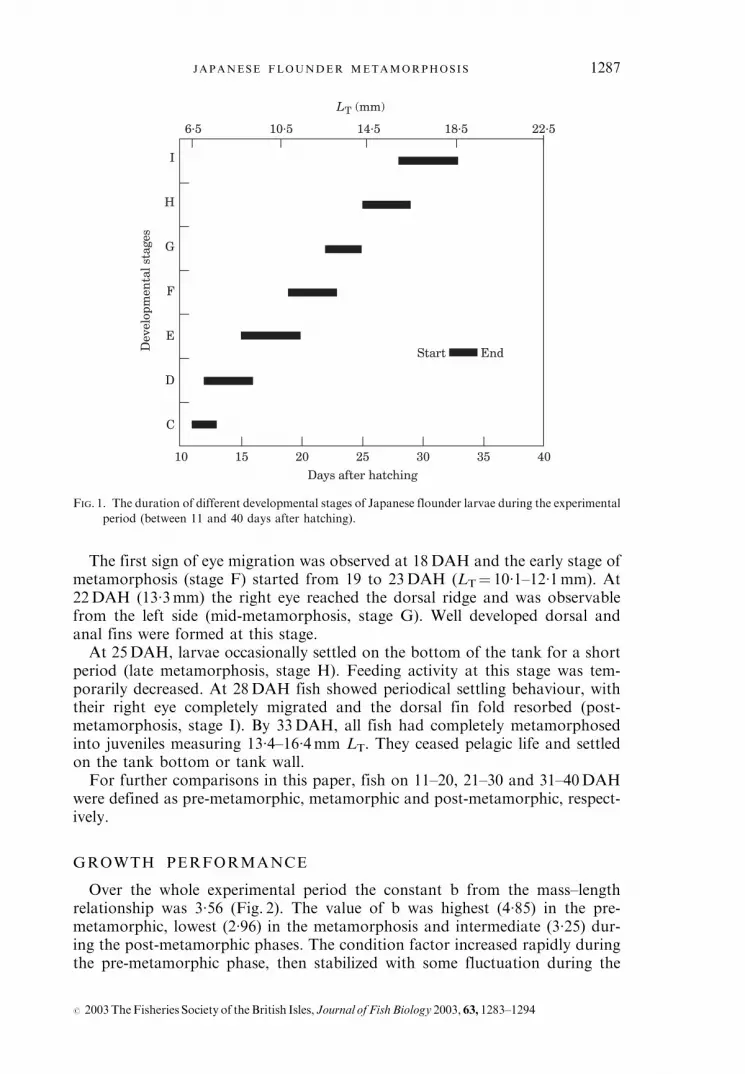
The first sign of eye migration was observed at 18DAH and the early stage ofmetamorphosis (stage F) started from 19 to 23DAH (LT¼ 10�1–12�1mm). At22DAH (13�3mm) the right eye reached the dorsal ridge and was observablefrom the left side (mid-metamorphosis, stage G). Well developed dorsal andanal fins were formed at this stage.At 25DAH, larvae occasionally settled on the bottom of the tank for a short
period (late metamorphosis, stage H). Feeding activity at this stage was tem-porarily decreased. At 28DAH fish showed periodical settling behaviour, withtheir right eye completely migrated and the dorsal fin fold resorbed (post-metamorphosis, stage I). By 33DAH, all fish had completely metamorphosedinto juveniles measuring 13�4–16�4mm LT. They ceased pelagic life and settledon the tank bottom or tank wall.For further comparisons in this paper, fish on 11–20, 21–30 and 31–40DAH
were defined as pre-metamorphic, metamorphic and post-metamorphic, respect-ively.
GROWTH PERFORMANCE
Over the whole experimental period the constant b from the mass–lengthrelationship was 3�56 (Fig. 2). The value of b was highest (4�85) in the pre-metamorphic, lowest (2�96) in the metamorphosis and intermediate (3�25) dur-ing the post-metamorphic phases. The condition factor increased rapidly duringthe pre-metamorphic phase, then stabilized with some fluctuation during the
10 15 20 25 30 35 40
I
H
G
F
E
D
C
6.5 10.5 14.5 18.5 22.5
Start End
Days after hatching
Dev
elop
men
tal s
tage
s
LT (mm)
FIG. 1. The duration of different developmental stages of Japanese flounder larvae during the experimental
period (between 11 and 40 days after hatching).
JAPANESE FLOUNDER METAMORPHOSIS 1287
# 2003TheFisheries Society of theBritish Isles, Journal of FishBiology 2003, 63, 1283–1294

metamorphic phase. Average K in fish over the whole experimental period was0�88. The value of K was lowest (0�68) in the metamorphosis phase, highest(1�00) in the pre-metamorphic phase and intermediate (0�94) during the post-metamorphic phase (Table II).Average daily growth in pre-metamorphosis, metamorphosis and post-
metamorphosis was 0�42, 0�34 and 0�72mmday�1 (LT) and 1�07, 1�55 and 5�14mgday�1 (M). The specific growth rate for wet mass was lowest (P< 0�05) duringmetamorphosis followed by post-metamorphosis and pre-metamorphosis (Fig. 3).The specific growth rate measured by LT, LS and BD depth were highest in
pre-metamorphic phase, then decreased towards metamorphosis and againincreased after the metamorphosis (Fig. 4).
FISH BODY COMPOSITION
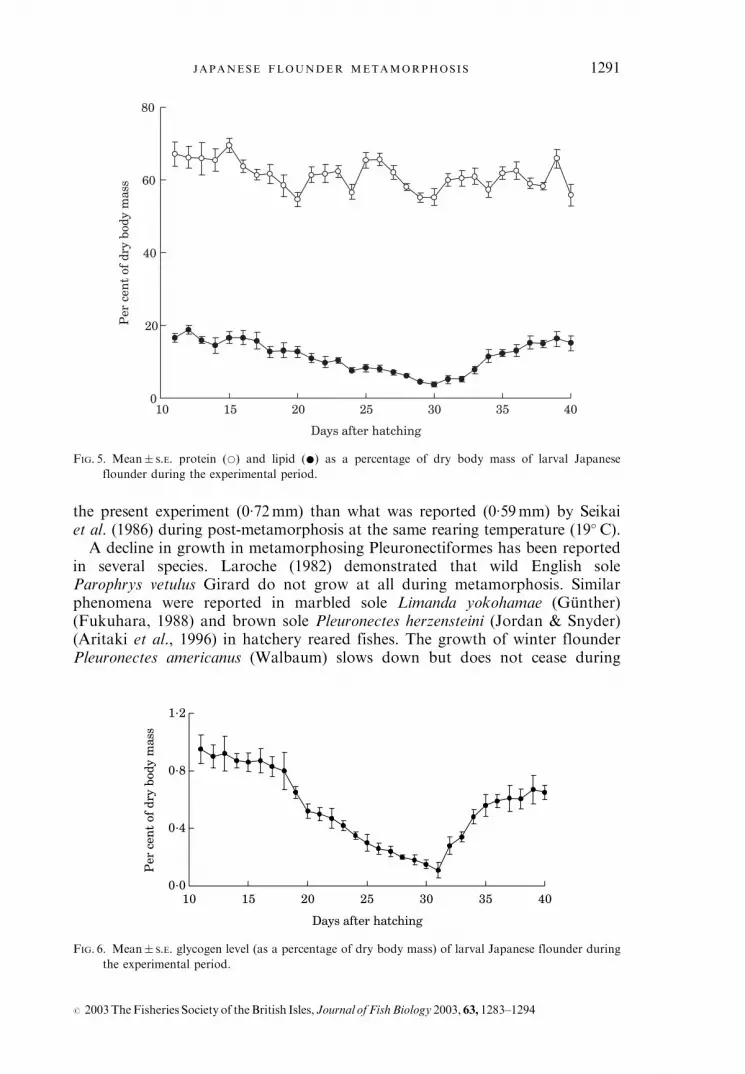
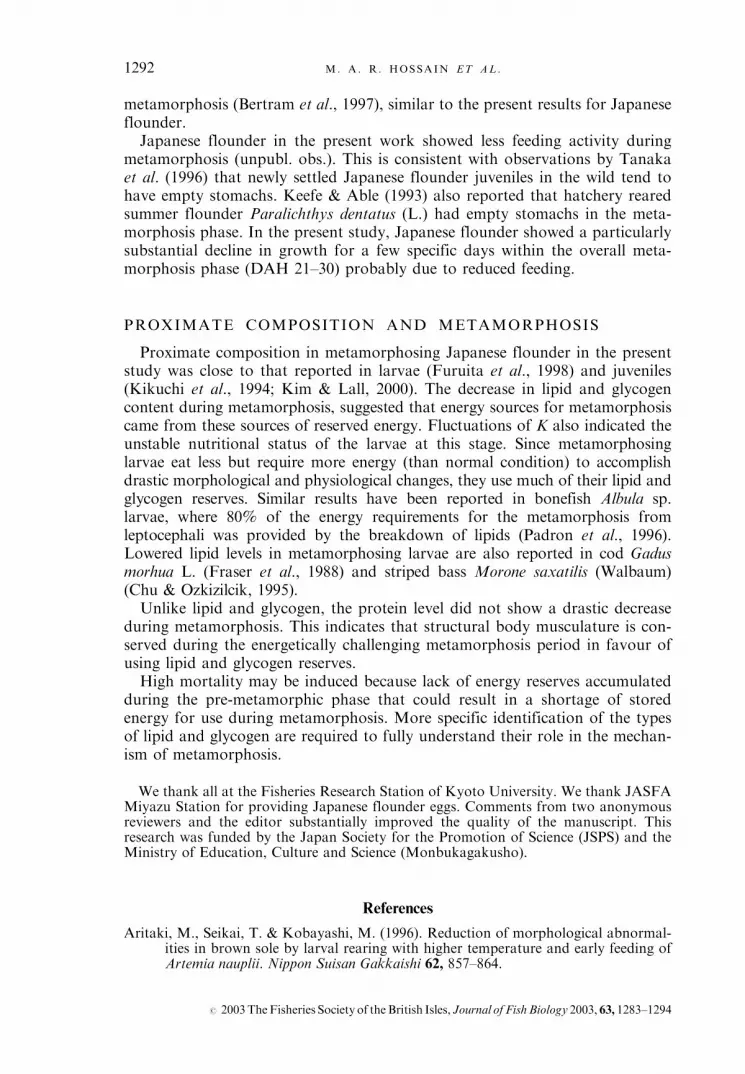
Moisture, lipid and glycogen levels decreased during metamorphosis (DAH21–30) and then recovered to higher level after metamorphosis (Table II andFigs 5 and 6). Protein level did not appear to decline during the metamorphicphase (Table II and Fig. 5).
DISCUSSION
GROWTH DECLINE DURING METAMORPHOSIS
Growth rate of Japanese flounder declined during metamorphosis (Figs 3 and4). The LT at post-metamorphosis found in this experiment is in agreement withSeikai et al. (1986). The average daily length increment, however, was better in
0.500.00
0.02
0.04
0.06
0.08
0.10
1.00 1.50 2.00 2.50
10 15 20 25 30 35 40
Days after hatching
Mas
s (g
)
LT (cm)
FIG. 2. The length and wet mass relationship of metamorphosing Japanese flounder larvae. Error bars
are S.E. The curve was fitted by M¼ 0�007 L3�56T (r2¼ 0�98).
1288 M. A . R . HOSSAIN ET AL .
# 2003TheFisheries Society of the British Isles, Journal of FishBiology 2003, 63, 1283–1294

TABLEII.Mean�
S.E.conditionfactorandproxim
ate
compositionofJapaneseflounder
larvaein
threephasesofmetamorphosis.
Values
withdifferentsuperscriptlettersweresignificantlydifferent(P
<0� 05)amongthephases
DAH
KMoisture
(%)
Dry
mass
(%)
Lipid
(%wet
mass)
Lipid
(%dry
mass)
Protein
(%wet
mass)
Protein
(%dry
mass)
Glycogen
(%dry
mass)
Glycogen
(%wet
mass)
11–20
1� 00�0� 03c
81� 73�0� 48c
18� 27�0� 48a
2� 78�0� 05c
15� 38�0� 63c
11� 54�0� 17ab
63� 43�1� 40b
0� 82�0� 04d
0� 15�0� 01c
21–30
0� 68�0� 06a
78� 83�0� 20a
21� 17�0� 20c
1� 62�0� 13a
7� 71�0� 68a
12� 78�0� 20c
60� 41�1� 11a
0� 31�0� 04a
0� 06�0� 01a
31–40
0� 94�0� 07bc81� 26�0� 39bc18� 74�0� 39a
2� 15�0� 20b
11� 70�1� 20b
11� 28�0� 21a
60� 24�0� 81a
0� 49�0� 06b
0� 09�0� 01b
11–40
0� 88�0� 06b
80� 60�0� 32b
19� 40�0� 32b
2� 19�0� 12b
11� 59�0� 79b
11� 87�0� 17b
61� 36�0� 72ab
0� 54�0� 05c
0� 10�0� 01b
JAPANESE FLOUNDER METAMORPHOSIS 1289
# 2003TheFisheries Society of theBritish Isles, Journal of FishBiology 2003, 63, 1283–1294

0
10
20
30
40
11–20 21–30 31–40
G (
% d
ay–1
)
Days after hatching
c
a
b
FIG. 3. Mean� S.E. specific growth rates for wet mass at three different phases. Different letters indicate
significantly different values (P< 0�05).
0.0
2.5
5.0
10 20 30 40
0.0
2.5
5.0
10 20 30 40
0.0
2.5
5.0
10 20 30 40
Day after hatching
G (
% d
ay–1
)
(a)
(b)
(c)
FIG. 4. Daily specific growth rates of larval Japanese flounder over the experimental period based on (a)
total length, (b) standard length and (c) body depth.
1290 M. A . R . HOSSAIN ET AL .
# 2003TheFisheries Society of the British Isles, Journal of FishBiology 2003, 63, 1283–1294
the present experiment (0�72mm) than what was reported (0�59mm) by Seikaiet al. (1986) during post-metamorphosis at the same rearing temperature (19� C).A decline in growth in metamorphosing Pleuronectiformes has been reported
in several species. Laroche (1982) demonstrated that wild English soleParophrys vetulus Girard do not grow at all during metamorphosis. Similarphenomena were reported in marbled sole Limanda yokohamae (Gunther)(Fukuhara, 1988) and brown sole Pleuronectes herzensteini (Jordan & Snyder)(Aritaki et al., 1996) in hatchery reared fishes. The growth of winter flounderPleuronectes americanus (Walbaum) slows down but does not cease during
0
20
40
60
80
10 15 20 25 30 35 40
Per
cen
t of
dry
bod
y m
ass
Days after hatching
FIG. 5. Mean� S.E. protein (*) and lipid (*) as a percentage of dry body mass of larval Japanese
flounder during the experimental period.
0.0
0.4
0.8
1.2
10 15 20 25 30 35 40
Per
cen
t of
dry
bod
y m
ass
Days after hatching
FIG. 6. Mean� S.E. glycogen level (as a percentage of dry body mass) of larval Japanese flounder during
the experimental period.
JAPANESE FLOUNDER METAMORPHOSIS 1291
# 2003TheFisheries Society of theBritish Isles, Journal of FishBiology 2003, 63, 1283–1294
metamorphosis (Bertram et al., 1997), similar to the present results for Japaneseflounder.Japanese flounder in the present work showed less feeding activity during
metamorphosis (unpubl. obs.). This is consistent with observations by Tanakaet al. (1996) that newly settled Japanese flounder juveniles in the wild tend tohave empty stomachs. Keefe & Able (1993) also reported that hatchery rearedsummer flounder Paralichthys dentatus (L.) had empty stomachs in the meta-morphosis phase. In the present study, Japanese flounder showed a particularlysubstantial decline in growth for a few specific days within the overall meta-morphosis phase (DAH 21–30) probably due to reduced feeding.
PROXIMATE COMPOSITION AND METAMORPHOSIS
Proximate composition in metamorphosing Japanese flounder in the presentstudy was close to that reported in larvae (Furuita et al., 1998) and juveniles(Kikuchi et al., 1994; Kim & Lall, 2000). The decrease in lipid and glycogencontent during metamorphosis, suggested that energy sources for metamorphosiscame from these sources of reserved energy. Fluctuations of K also indicated theunstable nutritional status of the larvae at this stage. Since metamorphosinglarvae eat less but require more energy (than normal condition) to accomplishdrastic morphological and physiological changes, they use much of their lipid andglycogen reserves. Similar results have been reported in bonefish Albula sp.larvae, where 80% of the energy requirements for the metamorphosis fromleptocephali was provided by the breakdown of lipids (Padron et al., 1996).Lowered lipid levels in metamorphosing larvae are also reported in cod Gadusmorhua L. (Fraser et al., 1988) and striped bass Morone saxatilis (Walbaum)(Chu & Ozkizilcik, 1995).Unlike lipid and glycogen, the protein level did not show a drastic decrease
during metamorphosis. This indicates that structural body musculature is con-served during the energetically challenging metamorphosis period in favour ofusing lipid and glycogen reserves.High mortality may be induced because lack of energy reserves accumulated
during the pre-metamorphic phase that could result in a shortage of storedenergy for use during metamorphosis. More specific identification of the typesof lipid and glycogen are required to fully understand their role in the mechan-ism of metamorphosis.
We thank all at the Fisheries Research Station of Kyoto University. We thank JASFAMiyazu Station for providing Japanese flounder eggs. Comments from two anonymousreviewers and the editor substantially improved the quality of the manuscript. Thisresearch was funded by the Japan Society for the Promotion of Science (JSPS) and theMinistry of Education, Culture and Science (Monbukagakusho).
References
Aritaki, M., Seikai, T. & Kobayashi, M. (1996). Reduction of morphological abnormal-ities in brown sole by larval rearing with higher temperature and early feeding ofArtemia nauplii. Nippon Suisan Gakkaishi 62, 857–864.
1292 M. A . R . HOSSAIN ET AL .
# 2003TheFisheries Society of the British Isles, Journal of FishBiology 2003, 63, 1283–1294

Bertram, D. F., Miller, T. J. & Leggett, W. C. (1997). Individual variation in growth anddevelopment during the early life stages of winter flounder, Pleuronectes amer-icanus. Fishery Bulletin 95, 1–10.
Bolger, T. & Connolly, P. L. (1989). The selection of suitable indices for the measurementand analysis of fish condition. Journal of Fish Biology 34, 171–182.
Busacker, G. P., Adelman, I. R. & Goolish, E. M. (1990). Growth. In Methods forFish Biology (Schreck, C. B. & Moyle, P. B., eds), pp. 363–387. Bethesda, MD:American Fisheries Society.
Chu, F. L. & Ozkizilcik, S. (1995). Lipid and fatty acid composition of stripped bass(Morone sexatilis) larvae during metamorphosis. Comparative Biochemistry andPhysiology IIIB, 665–674.
Fonds, M., Tanaka, M. & Van Der Veer, H. W. (1995). Feeding and growth of juvenileJapanese flounder Paralichthys olivaceus in relation to temperature and foodsupply. Netherlands Journal of Sea Research 34, 111–118.
Fraser, A. J., Gamble, J. C. & Sargent, J. R. (1988). Changes in lipid content, lipid classand fatty acid composition of developing eggs and unfed larvae of cod (Gadusmorhua). Marine Biology 99, 307–313.
Fujii, T. & Noguchi, M. (1996). Feeding and growth of Japanese flounder (Paralichthysolivaceus) in the nursery ground. In Survival Strategies in the Early Life Stages ofMarine Resources (Watanabe, Y., Yamashita, Y. & Oozeki, Y., eds), pp. 141–151.Rotterdam: A. A. Balkema.
Fukuhara, O. (1986). Morphological and functional development of Japanese flounderin early life stage. Bulletin of the Japanese Society of Scientific Fisheries 52,81–91.
Fukuhara, O. (1988). Morphological and functional development of larval and juvenileLimanda yokohamae (Pisces: Pleuronectidae) reared in the laboratory. MarineBiology 99, 271–282.
Furuita, H., Takeuchi, T. & Uematsu, K. (1998). Effects of eicosapentaenoic and docosa-hexaenoic acids on growth, survival and brain development of larval Japaneseflounder Paralichthys olivaceus. Aquaculture 161, 269–279.
Inui, Y., Tagawa, M., Miwa, S. & Hirano, T. (1989). Effects of bovine TSH on the tissuethyroxine level and metamorphosis in prometamorphic flounder larvae. Generaland Comparative Endocrinology 74, 406–410.
Keefe, M. & Able, K. (1993). Patterns of metamorphosis in summer flounder, Para-lichthys dentatus. Journal of Fish Biology 42, 713–728.
Kikuchi, K., Furuta, T. & Honda, H. (1994). Utilization of feather meal as a proteinsource in the diet of juvenile Japanese flounder. Fisheries Science 60, 203–206.
Kim, J. D. & Lall, S. P. (2000). Amino acid composition of whole body tissue of Atlantichalibut Hippoglossus hippoglossus, yellowtail flounder Pleuronectes ferruginea andJapanese flounder Paralichthys olivaceus. Aquaculture 187, 367–373.
Laroche, J. L. (1982). Growth during metamorphosis of English sole, Paralichthys ventulus.Fishery Bulletin US 80, 150–153.
Minami, T. (1982). The early life history of Japanese flounder Paralichthys olivaceus.Bulletin of the Japanese Society of Scientific Fisheries 48, 1551–1588.
Montgomery, R. (1957). Determination of Glycogen. Archive of Biochemistry and Bio-physics 67, 378–386.
Padron, D., Lindley, V. A. & Pfeiler, E. (1996). Changes in lipid composition duringmetamorphosis of bonefish (Albula sp.) Leptocephali. Lipids 31, 513–519.
Ricker, W. E. (1979). Growth rates and models. In Fish Physiology, Vol. VIII (Hoar, W. S.,Randall, D. J. & Brett, J. R., eds), pp. 677–743. London: Academic Press.
Seikai, T., Tanangonan, J. B. & Tanaka, M. (1986). Temperature influence on larvalgrowth and metamorphosis of the Japanese flounder, Paralichthys olivaceus.Bulletin of the Japanese Society of Scientific Fisheries 52, 977–982.
Sire, J. A. F., Babiar, O., Bourguignon, J. & Quilhac, A. (1997). Scale development inzebrafish (Danio rerio). Journal of Anatomy 190, 545–561.
Sokal, R. R. & Rohlf, F. J. (1981). Biometry: the Principle and Practices of Statistics inBiological Research, 2nd edn. New York: Freeman and Company.
JAPANESE FLOUNDER METAMORPHOSIS 1293
# 2003TheFisheries Society of theBritish Isles, Journal of FishBiology 2003, 63, 1283–1294

Tagawa, M., Miwa, S., Inui, Y., de Jesus, E. G. & Hirano, T. (1990). Changes in thyroidhormone concentrations during early development and metamorphosis of theflounder, Paralichthys olivaceus. Zoological Science 7, 93–96.
Tanaka, M., Goto, T., Tomiyama, M. & Sudo, H. (1989). Immigration, settlement andmortality of flunder (Paralichthys olivaceus) larvae and juveniles in a nurseryground, Shijiki Bay, Japan. Netherlands Journal of Sea Research 24, 57–67.
Tanaka, M., Kawai, S., Seikai, T. & Burke, J. S. (1996). Development of the digestiveorgan system in Japanese flounder in relation to metamorphosis and settlement.Marine and FreshwaterBehaviour and Physiology 28, 19–31.
Tanaka, M., Seikai, T., Yamamoto, E. & Furuta, S. (1998). Significance of larval andjuvenile ecophysiology for stock enhancement of the Japanese flounder, Para-lichthys olivaceus. Bulletin of Marine Science 62, 551–571.
Tanangonan, J. B., Tagawa, M., Tanaka, M. & Hirano, T. (1989). Changes in tissuethyroxine level of Japanese flounder Paralichthys olivaceus reared at differenttemperatures. Bulletin of the Japanese Society of Scientific Fisheries 55, 485–490.
Youson, J. H. (1988). First metamorphosis. In Fish Physiology, Vol. XIB (Hoar, W. S. &Randall, D. J., eds) pp. 135–196. New York: Academic Press.
1294 M. A . R . HOSSAIN ET AL .
# 2003TheFisheries Society of the British Isles, Journal of FishBiology 2003, 63, 1283–1294