chandra observations of the luminous ir galaxy ngc3256
TRANSCRIPT
arX
iv:a
stro
-ph/
0109
198v
2 5
Oct
200
1Mon. Not. R. Astron. Soc. 000, 000–000 (0000) Printed 1 February 2008 (MN LATEX style file v1.4)
Chandra Observations of the Luminous IR Galaxy
NGC3256
P. Lira,1,2 M. Ward,1 A. Zezas,3 A. Alonso-Herrero4,5 S. Ueno,61 Department of Physics & Astronomy, University of Leicester, Leicester LE1 7RH, UK2 Departamento de Astronomıa, Universidad de Chile, Casilla 36-D, Santiago, Chile3 Harvard-Smithsonian Center for Astrophysics, 60 Garden St., Cambridge MA, 02138, USA4 Department of Physical Science, University of Hertfordshire, Hatfield, Herts AL10 9AB, UK5 Steward Observatory, University of Arizona, Tucson, AZ 85721, USA6 Space Utilization Research Program, National Space Development Agency of Japan (NASDA), Tsukuba Space Center,2-1-1 Sengen, Tsukuba, Ibaraki 305, Japan
1 February 2008
ABSTRACT
We present a detailed analysis of high-resolution Chandra observations of themerger system NGC3256, the most IR luminous galaxy in the nearby universe. TheX-ray data show that several discrete sources embedded in complex diffuse emissioncontribute >
∼ 20% of the total emission (Ltot
x∼ 8 × 1041 ergs s−1 in the 0.5-10 keV
energy range). The compact sources are hard and extremely bright and their emissionis probably dominated by accretion driven processes. Both galaxy nuclei are detectedwith Lx ∼ 3 − 10 × 1040 ergs s−1. No evidence is found for the presence of an activenucleus in the southern nucleus, contrary to previous speculation. Once the discretesources are removed, the diffuse component has a soft spectrum which can be modelledby the superposition of 3 thermal plasma components with temperatures kT = 0.6, 0.9and 3.9 keV. Alternatively, the latter component can be described as a power-law withindex Γ ∼ 3. Some evidence is found for a radial gradient of the amount of absorp-tion and temperature of the diffuse component. We compare the X-ray emission withoptical, Hα and NICMOS images of NGC3256 and find a good correlation betweenthe inferred optical/near-IR and X-ray extinctions. Although Inverse Compton scat-tering could be important in explaining the hard X-rays seen in the compact sourcesassociated with the nuclei, the observed diffuse emission is probably of thermal origin.The observed X-ray characteristics support a scenario in which the powerful X-rayemission is driven solely by the current episode of star formation.
Key words: galaxies: general – galaxies: active – galaxies: nuclei – X-rays: galaxies.
1 INTRODUCTION
The IRAS all-sky survey revealed a class of galaxies with in-frared luminosities which overlap the bolometric luminosityof quasars. The vast amounts of energy released by these Lu-minous Infra-Red Galaxies (LIRGs: LIR > 1011 L⊙) and Ul-tra Luminous Infra-Red Galaxies (ULIRGs: LIR > 1012 L⊙)opened a question that has still not been completely re-solved: what is the primary source of their power? The twofavored answers are extreme starburst activity or the pres-ence of an active nucleus. Important clues came from theobserved correlation between IR luminosity and the pres-ence of an AGN, showing that the fraction of Seyfert nucleidetected in optical surveys increases from ∼ 5% to ∼ 50%
for objects with log LIR ∼ 10.5 L⊙ and log LIR ∼ 12.5 L⊙respectively (Sanders & Mirabel 1996).
The definite presence (or absence) of an AGN in in-frared luminous systems is difficult to test, since tens or evenhundreds of magnitudes of visual extinction are routinelyderived for the central regions of these galaxies. However,recent results from mid-IR observations using ISO , whichcan probe regions with extinctions as high as AV ∼ 50 mag-nitudes, show that 70 − 80% percent of ULIRGS are pre-dominantly powered by star formation activity (Genzel etal1998; Lutz, Veilleux & Genzel 1999).
Since nearly all ULIRGS have distorted morphologies ithas been suggested that galactic interactions displace largemasses of molecular gas into the central few kpc of these
c© 0000 RAS
2 Lira etal.
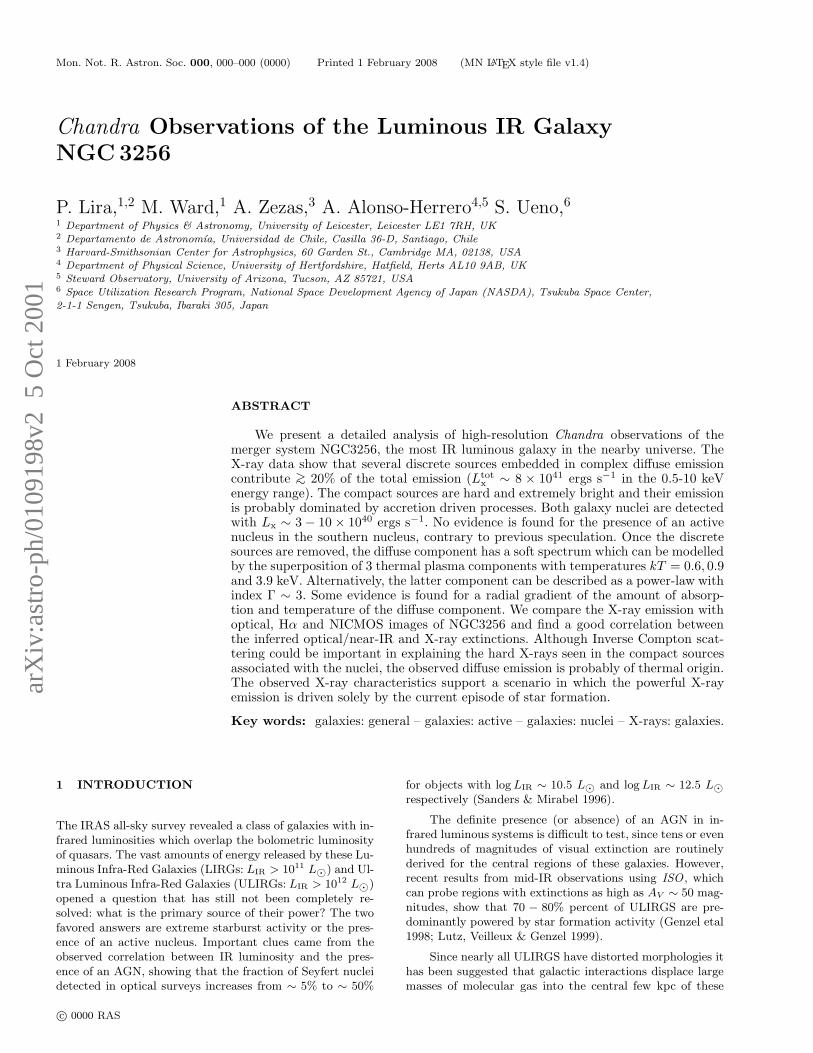
Figure 1. Chandra images of NGC3256 in the 0.3-1.5 (left) and 1.5-10 (right) keV energy ranges. The images extend ∼ 60 arcsecs oneach side. North is at the top and East in on the left. Discrete sources are labelled by increasing order of right ascension. Sources 1 and14 are not included in the figure (see Table 1 for celestial coordinates).
systems, fueling a powerful starburst or an accretion pow-ered AGN. Several possible evolutionary scenarios have beenproposed to link ULIRGs with QSOs, ‘super-starbursts’ andelliptical galaxies (Sanders etal 1988; Joseph & Wright 1985;see also Lıpari etal 2001 and references therein).
NGC3256 is a spectacular merger system. Its IR lumi-nosity of 6× 10¹¹ L⊙ makes it the most luminous object in
the local (z < 0.01) universe ⋆. Evidence of a recent interac-tion is the presence of 200 kpc extended tails and a highlychaotic nuclear region (Graham etal 1984). Direct evidencefor the presence of a powerful starburst in the galaxy comesfrom the detection of strong absorption features from mas-sive stars (Doyon, Joseph & Wright 1994, Lıpari etal 2000).The central region of the starburst (∼ 5 kpc across) is char-acterized by strong near-IR line emission, high metallicities,and outflows. (Moorwood & Oliva 1994; Lıpari etal 2000).A double nucleus has been detected at radio and near-IRfrequencies (Norris & Forbes 1995; Kotilainen etal 1996),suggesting that NGC3256 is not a very advanced mergersystem. While the northern nucleus has always been recog-nised as a pure starburst, the presence of a hidden AGN inthe southern nucleus has remained a matter of speculation.
X-ray observations of NGC3256 were obtained previ-ously with ROSAT and ASCA. From the analysis of ASCA
data Moran, Lehnert & Helfand (1999, hereafter MLH) de-termined a total luminosity in the 0.5-10 keV energy rangeof 1.6 × 1042 ergs s−1. If powered solely by star formation,NGC3256 would represent the top end of the X-ray lumi-nosity distribution of starburst galaxies. MLH also arguedthat the observed power law tail could not be explained bythe presence of an AGN or a population of Galactic-typeX-ray binaries and suggested that Inverse Compton scatter-ing could provide a substantial fraction of the observed highenergy component.
In order to understand the nature of the NGC3256 pow-erful emission, observations at high spatial resolution are re-quired. High resolution X-ray observations are particularlysuited for this aim, since hard X-rays are able to probe deepinto the most obscured regions and give vital informationabout hot gaseous components commonly associated withstrong starbursts and which are undetectable at other wave-lengths. In this paper we report recent high resolution ob-servations of NGC3256 made using the Chandra X-ray Ob-servatory. This paper is organised as follows: section 2 givesdetails of the data analysis procedure while sections 3 and4 focus on the characteristics of the population of compactsources and the diffuse emission respectively; in section 5 abrief comparison between the Chandra and ASCA observa-tions is given; a full discussion is presented in section 6 andconclusions and summary can be found in section 7.
⋆ A distance of 56 Mpc (z = 0.009, H◦ = 50 km s−1 Mpc−1) hasbeen used throughout this paper.
Table 1. Detected discrete sources in NGC3256. Background sub-tracted source counts (SC) above 0.3 keV are given for eachsource. The significance of the detections was determined asSC/σB , where σB is the standard deviation of the backgroundand was computed as 1 +
√Background counts + 0.75. This cor-
rection to the standard deviation gives a more appropriate esti-mate of Poissonian errors for cases of low number counts (Gehrels1986).
Source Position (J2000) Source Counts Significance
1 10 27 48.02 -43 54 26.5 22.8 ± 6.2 25.342 10 27 50.04 -43 54 20.5 50.6 ± 10.9 18.583 10 27 50.74 -43 54 16.2 38.7 ± 12.8 11.534 10 27 50.93 -43 53 43.4 25.6 ± 7.0 19.155 10 27 51.23 -43 53 58.8 59.7 ± 11.0 24.006 10 27 51.23 -43 54 10.9 92.4 ± 17.3 18.277(N) 10 27 51.25 -43 54 14.2 712.2 ± 30.6 141.388(S) 10 27 51.22 -43 54 19.4 34.3 ± 13.0 10.099 10 27 51.64 -43 54 09.7 171.2 ± 18.9 36.2710 10 27 51.76 -43 54 13.6 261.6 ± 20.7 60.0511 10 27 52.03 -43 54 12.6 119.8 ± 15.1 38.84
12 10 27 52.56 -43 53 49.9 48.3 ± 8.5 42.8413 10 27 52.88 -43 54 11.8 26.7 ± 7.9 14.5114 10 27 55.14 -43 54 47.1 88.5 ± 10.7 86.00
2 OBSERVATIONS AND DATA ANALYSIS
A Chandra 28 ks observation of NGC3256 was obtainedon the 5th of January 2000. For an assumed distance of56 Mpc, 1 arcsec (encircling ∼ 90% of the photons from a
point source at 1.5 keV †) corresponds to a linear size of 270pc. The data were analysed using a combination of Chan-
dra X-ray Center (CXC) Ciao (V1) and HERSARC XSPEC(V10.0) software. The galaxy was imaged using the (back-illuminated) ACIS S3 chip, which is known to suffer fromflares of high background radiation. An examination of ourobservations, after discarding all events outside the 0.3-10.0keV energy range, showed that in fact about half of the ob-serving time was affected by high background. The strategyadopted to ensure minimum contamination from the highbackground episodes is described in sections 3 and 4.1. Theaverage count rate during the observation was found to be2.55 counts per second in the S3 chip, compared with the
quiescent 0.79 counts per second measured in-flight ‡. Thethree known bad columns of the S3 chip were located faraway (∼ 5 arcmin) from our target and therefore did notinduce any problems during the data analysis.
Simple aperture photometry shows that all the galacticemission is contained within a circle of radius ∼ 60 arcsec,while circles of radius ∼ 27 and ∼ 18 arcsec encircle ∼ 95%and ∼ 90% of the counts, respectively. The large first radius
† see the Chandra Proposers’ Observatory Guide v3.0, December2000, http://asc.harvard.edu/udocs/docs/POG/MPOG/‡ see the Chandra Proposers’ Observatory Guide v3.0, December2000, http://asc.harvard.edu/udocs/docs/POG/MPOG/
c© 0000 RAS, MNRAS 000, 000–000
Chandra Observations of NGC3256 3
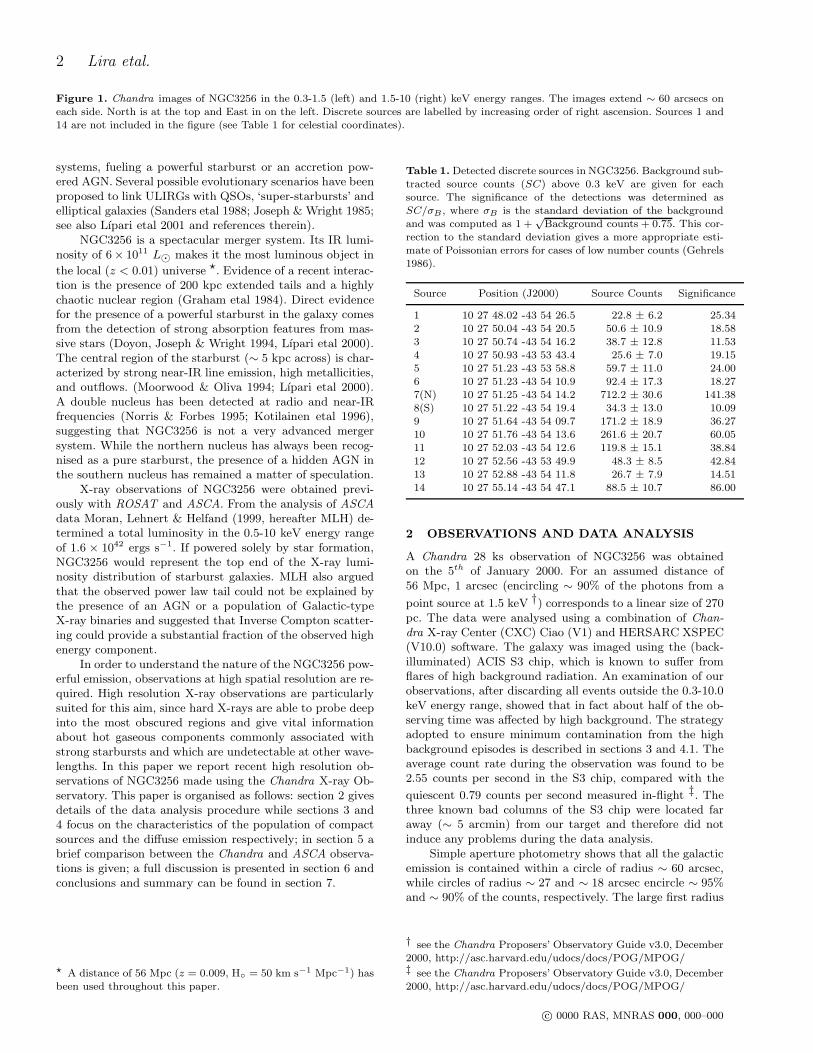
Figure 2. Spatial profiles of the discrete sources obtained from a full 0.3-10 keV band image and compared with the model PSF(continuous lines). The error bars correspond to 1σ confidence levels. The profiles for both nuclei (N and S) were obtained from a harder,2-5 keV image.
c© 0000 RAS, MNRAS 000, 000–000
4 Lira etal.
is necessary to contain the two most distant discrete sources(sources 1 and 14 in Figure 1 and Table 1), which are locatedat ∼ 40 − 55 arcsec from the central peak of emission.
Due to a calibration error in early Chandra data, theastrometry of the original observations of NGC3256 wereaffected by a ∼ 8 arcsec shift in absolute astrometry. Afterreprocessing of the data at the CXC, which corrected forthis problem, we found that the position of the brightestX-ray compact source seen in the galaxy (source 7 in Figure1 and Table 1) was offset with respect to the radio positionfor the northern nucleus (which is coincident, within 1 arc-sec, with the position of the nucleus seen at optical and IRwavelengths - Norris & Forbes 1995) by only 0.44 arcsecs.Also, good positional agreement is found between severalknots of emission seen in X-rays and optical wavelengths(see sections 6.2 and 6.3.1).
Figure 1 shows a ∼ 60 × 60 arcsec Chandra image ofNGC3256 in the 0.3-1.5 and 1.5-10 keV energy ranges. Thesoft image shows a significant and spatially complex diffusecomponent. Several of the discrete sources are more easilyseen in the harder band, where the diffuse emission has amuch lower surface brightness. The emission is dominatedby a strong compact source located at the center of the X-ray emitting region and labeled as source 7. As mentionedabove, this source has been identified with the northern nu-cleus of the galaxy. Another, harder source is found 5 arc-seconds to the south of this position in the 1.5-10 keV band(source 8), and is identified as the X-ray counterpart of thesouthern nucleus. The diffuse emission shows complex mor-phology, with a strong central ‘Bar’ running in a ES to NWdirection just above of the northern nucleus. Another inter-esting feature is a southern ‘Arm’ connecting sources 8 and2, which leaves a void of soft X-ray emission at the positionof the southern nucleus.
3 DISCRETE SOURCES
A wavelet detection algorithm was used to search for com-pact sources associated with NGC3256. This algorithm isparticularly suited for the detection of closely spaced andextended sources. However, given the strong and com-plex extended emission component in the central region ofNGC3256, it still is possible that strong fluctuations of thebackground can be identified as spurious sources. For thisreason, the detection algorithm was run using an image inthe 1.5-10 KeV energy range only, where discrete sourcesare more conspicuous. Also, low surface brightness and ob-viously extended sources in the Arm and to the NW of thebright central source were disregarded since their morphol-ogy did not appear less smeared in the hard band image.The final source list was compiled only after the determi-nation of the detection significance for each source. A totalof 14 compact sources were found with a detection signif-icance (=(source counts)/(background standard deviation)ranging from ∼ 140 to ∼ 12 (see Table 1). The sources areshown in Figure 1 and labeled from 1 to 14 with increasingright ascension.
For each discrete source a background subtracted num-ber of counts was obtained from within a r = 3.5 pixel aper-ture (1.72 arcsec). This encircles ∼ 99% of the photons at 0.3keV and ∼ 90% of the photons at 5.0 keV (in general, sources
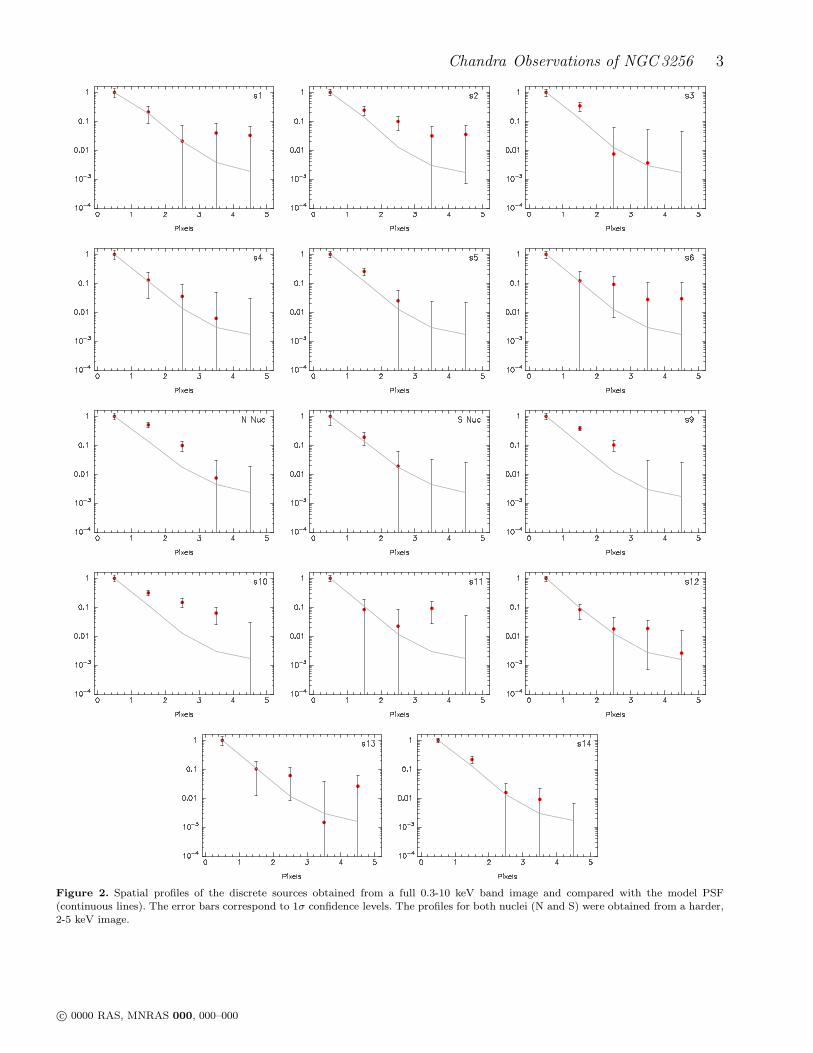
Figure 3. Spectra of the 3 brightest discrete sources in NGC3256in the 0.5-10 keV range: source 7 (the Northern nucleus - top), 9(centre) and 10 (bottom). The top panels of each plot show thedata and folded model (see Table 2). The bottom panels show theresiduals to the fit.
were not detected above this energy). The small aperturesused imply that on average only ∼ 2 of the source counts areexpected to correspond to the background. Therefore, thestudy of these sources was done without screening out thehigh background episodes. None of the sources was affectedby pileup. For each individual source a local background re-gion was defined by using an annulus with r ∼ 5− 10 pixelscentered at the position of the source with holes excised atthe position of any other nearby compact sources. The de-termined counts and associated significance can be found inTable 1.
3.1 Spatial Analysis
We have analysed the spatial profile of the detected sources.To do this we obtained locally background subtracted countswithin circular apertures of radius 1, 2, 3, 4 and 5 pixels and
c© 0000 RAS, MNRAS 000, 000–000
Chandra Observations of NGC3256 5
Table 2. Fitted models for the emission from sources 7 (the northern nucleus), 9 and 10. Hydrogen columns are given in units of 1021
cm−2 and plasma temperatures in units of keV. The errors correspond to 90% CL for 1 parameter of interest. Observed fluxes are inunits of 10−14 ergs s−1 cm−2 and intrinsic luminosities are in units of 1040 ergs s−1 (for an assumed distance of 56 Mpc).
Source Model NH kT NH Γ χ2red
(dof) Fx Lx Fx Lx
0.5-2.5 0.5-2.5 2.5-10 2.5-10(keV) (keV) (keV) (keV)
7(N) a PL - - 3.8+0.8−0.6 2.81+0.35
−0.28 1.81(32) 6.77 6.88 3.90 1.52
7(N) b M+PL 3.4+1.0−0.9 0.66+0.12
−0.10 † 2.25+0.38−0.24 0.91(30) 6.64 5.68 4.80 1.85
7(N) c M+PL Gal 0.69+0.10−0.06 5.8+8.0
−2.3 2.57+0.81−0.33 0.84(30) 7.01 8.50 4.53 1.79
9 PL - - 1.6+2.1Gal
2.43+1.09−0.80 1.04(10) 1.59 0.93 0.91 0.35
10 PL - - 2.9+2.0−1.7 2.91+1.20
−0.81 1.51(13) 2.38 2.08 0.73 0.28
10 M+PL Gal 1.00+0.18−0.23 † 1.67+0.40
−0.37 0.93(12) 2.55 1.15 1.28 0.44
†: Same hydrogen column as applied to previous spectral component.
Throughout this paper, whenever the column of gas fitted to a low temperature thermal component (probably associatedto a large-scale extended hot phase) presented an unrealistically low value of NH , the Galactic hydrogen column (NGal ∼9 × 1020 cm−2, labelled as Gal) was adopted instead.
compared them with model PSFs generated at the positionof each source (Figure 2). The full 0.3-10 keV band imagewas used to obtain the source profiles, except for both nu-clei, for which a harder 2-5 keV band image was used. In thisway the amount of diffuse emission around the northern nu-cleus was minimised, and the detectability of the obscuredsouthern nucleus was maximised. The major difficulties inobtaining a meaningful analysis of the profiles are the poorsampling of the PSF (at 1.5 keV, for example, ∼ 90% of theenergy is expected to fall within only 4 pixels), and the pres-ence of the strong and spatially variable diffuse component.
For isolated sources, such as sources 1, 4, 5, 12, 13 and14, the photometry suffers little from contamination by ex-tended emission and therefore the profiles are reliable de-spite the small number of counts detected for some of thesources. All sources show profiles consistent with the modelPSF, although source 5 shows some evidence for an extendedcomponent. However, as this is based on only one data point,we will assume that all isolated sources are indeed unre-solved.
The scenario is less straightforward for those sources lo-cated in the innermost region of the galaxy since the back-ground estimates will not account for any spatial changes ofthe diffuse emission within the apertures used to obtain theprofiles. Figure 2 shows that while the spatial distribution ofsources 3, 6, and 8 (the southern nucleus) 11 and 13 are welldescribed by the model PSF, sources 2, and 7 (the northernnucleus) 9 and 10 are clearly resolved.
A simple Gaussian fit to the profiles shown in Figure2 gives FWHM values (the only parameter allowed to varyduring the fitting) of ∼ 0.8 − 1.5 pixels (∼ 0.4 − 0.7 arcsec)for unresolved sources, while extended sources had FWHM∼ 2.2−2.8 pixels (implying deconvolved FWHM ∼ 1.8−2.5pixels or ∼ 0.9− 1.3 arcsec). The model PSF had a FWHM∼ 1.2 pixels (∼ 0.6 arcsec). The only source that did notfollow this trend was source 2, which has a best fit value of1.5 pixels (ie, within the range of the unresolved sources),even though Figure 2 suggests that the profile is extended.
The aperture used to perform the count subtraction(r = 3.5 pixels) is only adequate if it contains most of the
flux from the extended sources. The Gaussian fit to the pro-files shows that these sources have a FWHM of up to 2.8pixels (ie, 3σ = 3.6 pixels or ∼ 1.8 arcsecs). A well cen-tred extraction aperture of 3.5 pixels, therefore, will containmost of the source counts. Since all extended sources show awell defined peak, and sources 7, 9 and 10 correspond to thebrightest discrete sources found in the galaxy, the centeringof their flux distribution is well determined and, therefore,these apertures were adequate.
3.2 Fluxes and luminosities
Only three of the 14 detected discrete sources had suffi-ciently high numbers of counts to perform a useful spectralanalysis. These correspond to source 7, the northern nu-cleus, and sources 9 and 10. The spectra were modeled witha single (Mekal (M) or power-law (PL)) component and adouble (Mekal and power-law (M+PL) model in the 0.5-10keV band pass. These models are representative of sourcesdominated by thermal emission (such as SNRs and galacticbubbles), non-thermal emission (such as accreting compactobjects), and composite objects.
For all sources the single Mekal model was a very poorrepresentation of the data, while the single power-law gave amuch better fit, particularly for source 9, given the low num-ber of bins available (see Table 2 and Figure 3). For sources7 and 10, M+PL models were also tried. For source 7 two in-dependent hydrogen columns were adopted for each spectralcomponent in model c. This model represents a physicallyplausible scenario with the low temperature Mekal compo-nent representing a large-scale extended gaseous phase, andthe harder, more absorbed component arising from embed-ded or intrinsically absorbed sources directly associated withthe northern nucleus. Since the best fit values of the hydro-gen column affecting the low temperature Mekal componentwere very close to or slightly less than Galactic, we fixedthe NH to the Galactic column (see note-foot in Table 2),resulting in the same number of degrees of freedom as modelb.
To convert the count rates to fluxes for the remaining
c© 0000 RAS, MNRAS 000, 000–000
6 Lira etal.
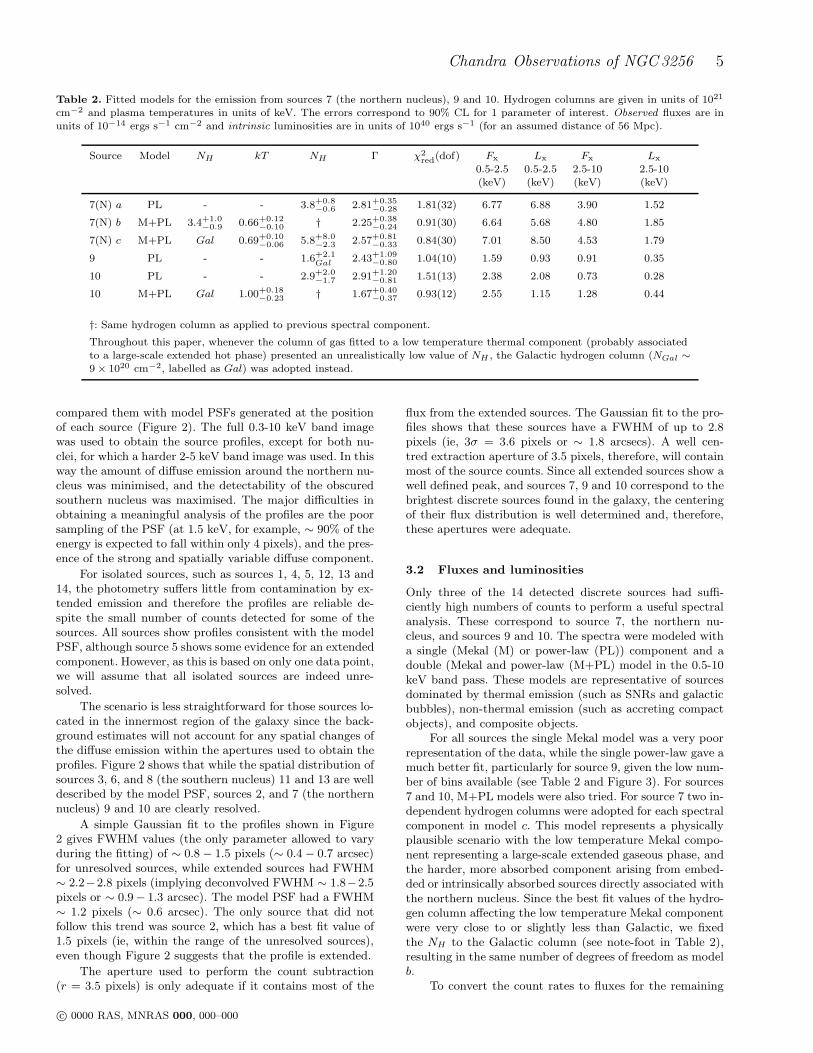
Figure 4. ‘Hardness-ratios’ (colour-colour) diagram for X-ray discrete sources. The X-ray colours were defined as the ratio of countsobserved in the 0.3-1.0 keV, 1.0-2.0 keV and 2.0-7.0 keV energy bands. One σ error bars are shown. The grids of models correspondto single Raymond-Smith plasmas (triangles - dash-dotted line) with temperatures (from top to bottom) 6.0, 3.0, 1.0 and 0.5 keV, andsingle power laws (squares - dotted line) with index Γ (from top to bottom) 0.5, 1.0, 1.5, 2.0, 2.5 and 3.0. From right to left successivegrids correspond to absorbing columns of 1021 (just above Galactic), 5× 10²¹ and 1022 cm−2 respectively. Sources 7, 9 and 10, for whichspectral fits were properly derived are also included.
sources we must assume an intrinsic spectral shape and in-tervening absorbing column. In order to gain some insightinto the best values to adopt, we studied the X-ray coloursof the sources, defined as the ratio of counts observed inthe 0.3-1.0 keV, 1.0-2.0 keV and 2.0-7.0 keV energy bands.The bands were chosen in order to maximise the detectionof the sources in all three bands, as well as to obtain a goodcharacterization of the spectra. To compare the observedX-ray colours of the sources with different spectral shapes,we computed the colours of pure power-law and RaymondSmith models using the HEASRAC Portable, Interactive,Multi-Mission Simulator (PIMMS - Mukai 1993).
Grids of points were determined for parameters Γ =0.5 − 3.0 and kT = 6.0 − 0.5 keV, for the power-law andRaymond Smith models respectively, and for NH = 1021 −
1023 cm−2. In figure 4 we have plotted the computed gridsalong with the observed colours of the discrete sources. Errorbars were computed as 1 standard deviation in the countratios. The southern nucleus (source 8) is not shown sinceit is not detected in either of the two softest bands used inthe diagram (see further discussion below in this section).
The positions for sources 7, 9 and 10 can be used toinvestigate the limitations in using these type of diagrams,since we have determined their spectral parameters fromspectral fits. From the single power-law fits showed in Table2 we find that all sources have an absorbing column higherthan Galactic but lower than 5 × 1021 cm−2, in agreementwith the location of the sources in the colour-colour diagram.However, from the diagram the columns are underestimatedfor sources 7 and 10. For source 7 for example, NH ∼ 4×10²¹
cm−2 is found from the spectral fit, while the column de-duced from the colour-colour diagram is about 1021 cm−2.The fitted power-law indices also roughly agree with the lo-cation of sources 9 and 10, giving values of Γ ∼ 2.5− 3.0. Alarger discrepancy is seen for source 7 where the power-lawindex estimated from the diagram is harder (Γ ∼ 2.0 − 2.5)than its fitted value. These disagreements could be due tothe observed spectral complexity of the emission in source7 which cannot be recovered by the over-simplified singleparameter models used in the colour-colour diagram. Forsource 9, however, the only case where the single power-lawmodel gives an acceptable fit (χ2
red ∼ 1.0), the best fit val-ues suggest a hard source and a moderate hydrogen column(Γ ∼ 2.4, NH ∼ 1.6 × 1021 cm−2), which is not accuratelyreflected by the position of the source in the colour-colourdiagram. These comparisons clearly illustrate the limits tousing colour-colour and hardness-ratio diagrams.
The positions of the remaining sources in the colour-colour diagram show that most of the sources have an ab-sorbing column above the Galactic value, ie between 1021
and 5 × 1021 cm−2. The bulk of the sources show a harderspectral shape than those for which we have performed aspectral fitting and therefore a power law with index be-tween Γ = 2.0 and 2.5 seems a reasonable spectral shapeto adopt. Bearing in mind the limitations in obtaining spec-tral parameters from the colour-colour diagram as discussedabove, the derived power-law indices are in good agreementwith that expected from a population of high-mass X-ray bi-naries (Γ ∼ 1− 2 White, Nagase & Parmar, 1995) or youngsupernova remnants (kT ∼ 1 − 4 keV, Bregman & Pildis
c© 0000 RAS, MNRAS 000, 000–000
Chandra Observations of NGC3256 7
Table 3. Fluxes and luminosities in the 0.5-10 keV energy rangefor the compact sources assuming a single power law componentwith index Γ = 2.0 and 2.5. The adopted hydrogen columns arealso given. Observed fluxes are in units of 10−14 ergs s−1 cm−2
and intrinsic luminosities are in units of 1040 ergs s−1 (for anassumed distance of 56 Mpc).
Γ = 2.0 Γ = 2.5Source NH Fx Lx Fx Lx
1 1021 0.43 0.19 0.30 0.142 1022 2.12 1.38 1.59 1.433 1022 1.62 1.05 1.22 1.104 5 × 10²¹ 0.81 0.45 0.59 0.425 1021 1.13 0.49 0.78 0.366 5 × 10²¹ 2.91 1.63 2.20 1.587(N) 1021 13.5 5.80 9.25 4.298(S) 5 × 10²² 3.00 3.04 2.47 4.109 1021 3.25 1.39 2.22 1.0310 1021 4.96 2.13 3.40 1.5811 1021 2.27 0.97 1.56 0.7212 5 × 10²¹ 1.52 0.85 1.10 0.7913 1021 0.51 0.22 0.35 0.2214 5 × 10²¹ 2.78 1.56 2.02 1.45
Total 40.81 21.15 29.05 19.21
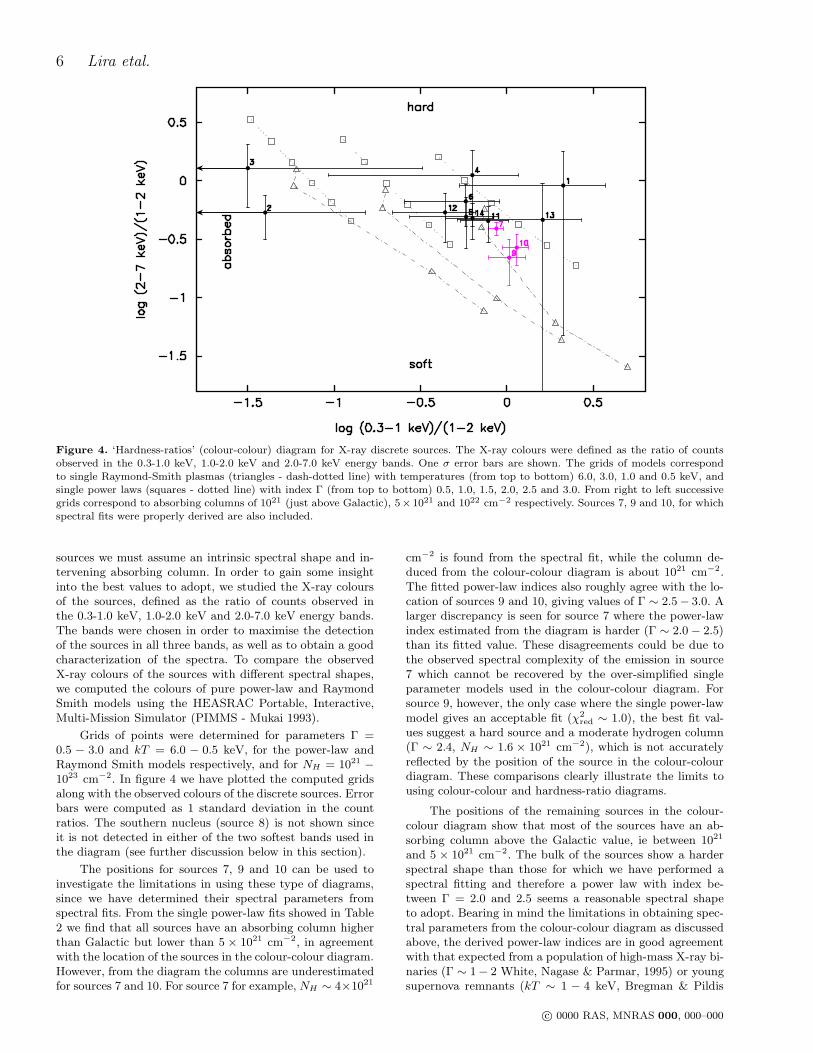
Figure 5. Stacked spectra for heavily absorbed sources 2, 3 and8 (triangles), and less absorbed sources sources 5, 6, 11 and 13(circles).
1992). Sources 2 and 3, however, do not follow the trendshown by the rest of the sources and present evidence formuch larger absorption. These sources are not detected inthe 0.3-1.0 keV band and we only have an upper limit fortheir (0.3-1.0 keV)/(1.0-2.0 keV) colour. A column densityof 1022 cm−2 was chosen as a representative value for thesetwo heavily absorbed sources.
In order to check that the range of power-law indicesand absorbing columns inferred from the colour-colour di-agram are representative of ‘real’ spectral shapes, we pro-duced two ‘stacked’ spectra for a group of obscured and un-obscured sources. The sources were selected based on theirobserved colours in Figure 4 and from their location withrespect to the reddening observed in a colour image of thecentral region of the galaxy (see section 6.2). Figure 5 clearlyshows that although the observed hard tails present a sim-ilar slope for the two stacked spectra, the soft end showsclear evidence for significant absorption in these sources, in
Figure 6. Discrete source lightcurves. The average count rate foreach source is plotted as a straight line.
good agreement with their position in the colour-colour di-agram. Single component models (M or PL) were fitted tothe stacked data and showed that the absorbing column af-fecting the unobscured sources was a few times the Galacticvalue, while the corresponding value for the obscured sourceswas about an order of magnitude larger.
The southern nucleus is only detected at hard energies,and no counts are detected below ∼ 2.0 keV. This is per-haps not surprising, since it is well established that this is aheavily obscured region. To characterise the spectral shapeof this nucleus we have again used a colour-colour diagram,but this time using the 2.0-3.3 keV, 3.3-4.5 keV and 4.5-10 keV energy range. The bands were chosen in order tomaximise the background subtracted number of counts ineach one of them. We then compared the observed (2.0-3.3keV)/(3.3-4.5 keV) and (4.5-10 keV)/(3.3-4.5 keV) colourswith grids of power law models as described previously. Wefind that the spectral shape of the source is well parame-terized by a range of indices Γ ∼ 1.0 − 2.5 if an absorbingcolumn of 5× 1022 cm−2 is adopted. A higher column (1023
cm−2) is possible but only if Γ >∼ 2.0, while a lower column(1022 cm−2) requires Γ <∼ 1.5. Columns above 1023 cm−2
or below 1022 cm−2 are not consistent with the observedcolours.
The final computed fluxes and luminosities for allsources are listed in Table 3. They were computed assum-ing a power law spectrum with indices Γ = 2.0 and 2.5and the hydrogen columns discussed above. The adoption ofthe different indices implies changes in the fluxes of about∼ 30%. Much larger errors could be introduced if the spec-tral shapes are not well described by the assumed models,as can be seen by comparing the fluxes and luminosities ob-tained for source 7 from the spectral fitting and the adoptedparameters used in Table 3. Statistical errors will dominate,however, for the faintest sources (<∼ 30 counts - see Table1). Another significant source of uncertainty is the adoptionof a representative background. This problem is particularlyimportant for sources embedded in strong diffuse emission.In all, the fluxes and luminosities in Table 3 are probablygood to within a factor of two or three. Inspection of Tables1 and 3 shows that our sensitivity threshold is ∼ 4 × 10⁻¹⁵
ergs s−1 cm−2 (∼ 1.5×1039 ergs s−1) for an isolated source,and ∼ 1.5 × 10⁻¹⁴ ergs s−1 cm−2 (∼ 6 × 1039 ergs s−1) forsources embedded within the diffuse emission.
3.3 Time variability
In order to search for time variability of the discrete sourceslight curves for the 6 brightest objects were constructed us-ing 6 bins of 4.3 ksec each, spanning a total of 26 ksecs.The errors associated with the count rates correspond to 1σdeviations assuming Poisson statistics. The light curves areshown in Figure 6.
A superficial examination shows no obvious signs ofvariability in the lightcurves. We carried out a χ2 test tocompare the lightcurves with a constant distribution. Thetest showed that all distributions are consistent with no vari-ability (χ2
red<∼ 0.5), except for source 6 where no variation is
c© 0000 RAS, MNRAS 000, 000–000
8 Lira etal.
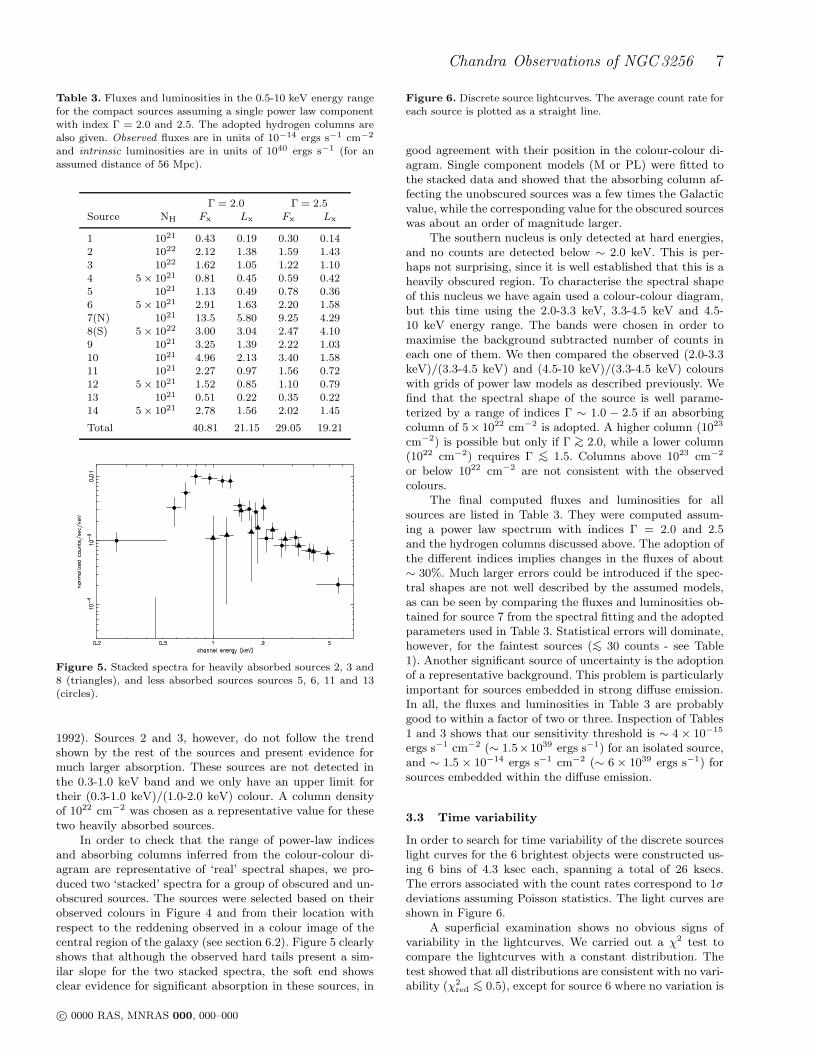
Figure 7. Left: Spectrum of the diffuse component in NGC3256 in the 0.5-5 keV range. The top panel shows the data and folded model;the bottom panel shows the residuals in the same energy range. Right: best fit model components.
a poorer representation of the data (χ2red = 1.59). However,
this is not a significant result, and the null hypothesis is notrejected at the 85% confidence level.
4 DIFFUSE EMISSION
4.1 Integrated spectrum
In order to perform a spectral analysis of the diffuse com-ponent in NGC3256 a large aperture with a diameter of 40arcsec (∼ 11 kpc) was defined after removing all discretesources. At this distance from the central peak of emissionthe diffuse emission had a comparable surface brightnessto the background. The large aperture used implies thatthe observed episodes of high background described in Sec-tion 2 could contaminate the intrinsic emission from thegalaxy. Therefore the data were filtered to exclude back-ground count rates above 1.5 counts per second. Conse-quently only 14.5 ksec (∼ 52%) of the total observing timewas used. These screened data are used for all the analysisdescribed here and in section 4.2.
The aperture was fully contained within only one (outof four) of the readout nodes of the S3 chip (node to nodesensitivity changes can be as large 10 percent). In fact, thebulk of the extended component covered a roughly circularregion with a diameter <∼ 30 arcseconds, compact enough forthe response of the detector to remain fairly constant. Forthis reason only one set of Fits Embedded Functions (FEF- a FITS table which stores the mapping of the energy topulse height) was used to calibrate the spectrum. (Usinga response built up from the weighted combination of the3 to 4 FEFs that fully covered the area subtended by thediffuse component did not change the fit to the data). Thebackground was obtained from a large semi-annular regionsurrounding NGC3256 (r ∼ 75 − 115 arcsec) and fully con-tained within the same readout node as the emission fromthe galaxy.
Figure 7 shows the spectrum of the diffuse emission. Atotal of ∼ 2860 counts were detected within the aperture,of which at most ∼ 100 could be from the background. Therelative softness of the emission is evident as no counts aredetected above ∼ 5 keV. The presence of strong emissionlines is also readily visible at ∼ 1.4 keV and ∼ 1.8 keV.
At these energies we expect contributions from lines such asHe-like and K-shell emission of Mg and Si ions, indicatingthe presence of a thermal component with kT < 2 keV.
The spectrum of the diffuse emission was first fitted us-ing single and double component models which yielded un-acceptable chi-squared values. We then followed with three-component models (M+M+M or M+M+PL). The presenceof multi-temperature gas has already been claimed for sev-eral starburst galaxies, such as NGC1808 (Awaki etal 1996),Arp 299 (Heckman etal 1999), NGC4449 (della Ceca, Grif-fiths & Heckman, 1997), NGC253 and M82 (Ptak etal 1997).The introduction of a power law component could accountfor an unresolved population of accreting binaries. Since dif-ferent spectral components can have different degrees of ab-sorption (see references above), we allowed for different NH
values for the fitted components. We also fixed the hydrogencolumn absorbing the softest thermal plasma component tothe Galactic value, since fitting the parameter nearly alwaysresulted in a Galactic or slightly under-Galactic value.
The results of the spectral fits are reported in Table4. Solar metallicities were assumed throughout, consistentwith the optically measured abundances (Lıpari etal 2000).If left free to vary, the abundances imply a solar or over-solarvalue, without significantly improving the fit. For the firsttwo models in Table 4, the second and third spectral com-ponents are subject to the same hydrogen column. For thethird and fourth model, each component has an independentintervening NH . Despite the clear improvement in the statis-tics of the successive models presented in Table 4, it wasimpossible to reduce χ2
red below 1.3. This is probably dueto the still preliminary status of the instrument responsesavailable for the calibration of the data. The uncertaintiesmostly affect the modeling of line emission dominated spec-tra. All the models in Table 4 are consistent with a generalpicture of a moderately absorbed cool thermal plasma plus awarmer thermal component with a much higher absorption.A steep power law or a thermal component with a tempera-ture of about 4 keV is necessary to explain the faint hard tailseen in the spectrum. Table 5 lists fluxes and luminositiesderived for each component from the model with the bestreduced chi-squared (M+M+PL model; last entry in Table4).
c© 0000 RAS, MNRAS 000, 000–000
Chandra Observations of NGC3256 9
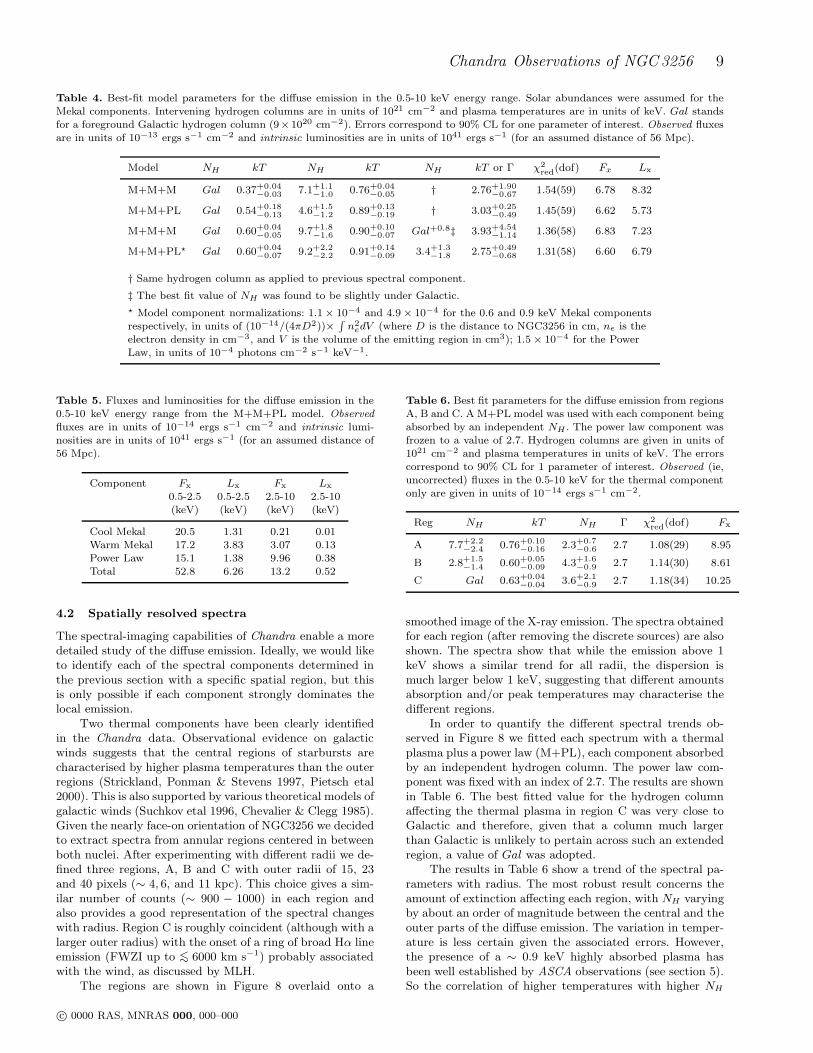
Table 4. Best-fit model parameters for the diffuse emission in the 0.5-10 keV energy range. Solar abundances were assumed for theMekal components. Intervening hydrogen columns are in units of 1021 cm−2 and plasma temperatures are in units of keV. Gal standsfor a foreground Galactic hydrogen column (9×1020 cm−2). Errors correspond to 90% CL for one parameter of interest. Observed fluxesare in units of 10−13 ergs s−1 cm−2 and intrinsic luminosities are in units of 1041 ergs s−1 (for an assumed distance of 56 Mpc).
Model NH kT NH kT NH kT or Γ χ2red
(dof) Fx Lx
M+M+M Gal 0.37+0.04−0.03 7.1+1.1
−1.0 0.76+0.04−0.05 † 2.76+1.90
−0.67 1.54(59) 6.78 8.32
M+M+PL Gal 0.54+0.18−0.13 4.6+1.5
−1.2 0.89+0.13−0.19 † 3.03+0.25
−0.49 1.45(59) 6.62 5.73
M+M+M Gal 0.60+0.04−0.05 9.7+1.8
−1.6 0.90+0.10−0.07 Gal+0.8‡ 3.93+4.54
−1.14 1.36(58) 6.83 7.23
M+M+PL⋆ Gal 0.60+0.04−0.07 9.2+2.2
−2.2 0.91+0.14−0.09 3.4+1.3
−1.8 2.75+0.49−0.68 1.31(58) 6.60 6.79
† Same hydrogen column as applied to previous spectral component.
‡ The best fit value of NH was found to be slightly under Galactic.
⋆ Model component normalizations: 1.1 × 10⁻⁴ and 4.9 × 10⁻⁴ for the 0.6 and 0.9 keV Mekal componentsrespectively, in units of (10−14/(4πD2))×
∫n2
edV (where D is the distance to NGC3256 in cm, ne is theelectron density in cm−3, and V is the volume of the emitting region in cm3); 1.5 × 10⁻⁴ for the PowerLaw, in units of 10−4 photons cm−2 s−1 keV−1.
Table 5. Fluxes and luminosities for the diffuse emission in the0.5-10 keV energy range from the M+M+PL model. Observedfluxes are in units of 10−14 ergs s−1 cm−2 and intrinsic lumi-nosities are in units of 1041 ergs s−1 (for an assumed distance of56 Mpc).
Component Fx Lx Fx Lx
0.5-2.5 0.5-2.5 2.5-10 2.5-10(keV) (keV) (keV) (keV)
Cool Mekal 20.5 1.31 0.21 0.01Warm Mekal 17.2 3.83 3.07 0.13Power Law 15.1 1.38 9.96 0.38Total 52.8 6.26 13.2 0.52
4.2 Spatially resolved spectra
The spectral-imaging capabilities of Chandra enable a moredetailed study of the diffuse emission. Ideally, we would liketo identify each of the spectral components determined inthe previous section with a specific spatial region, but thisis only possible if each component strongly dominates thelocal emission.
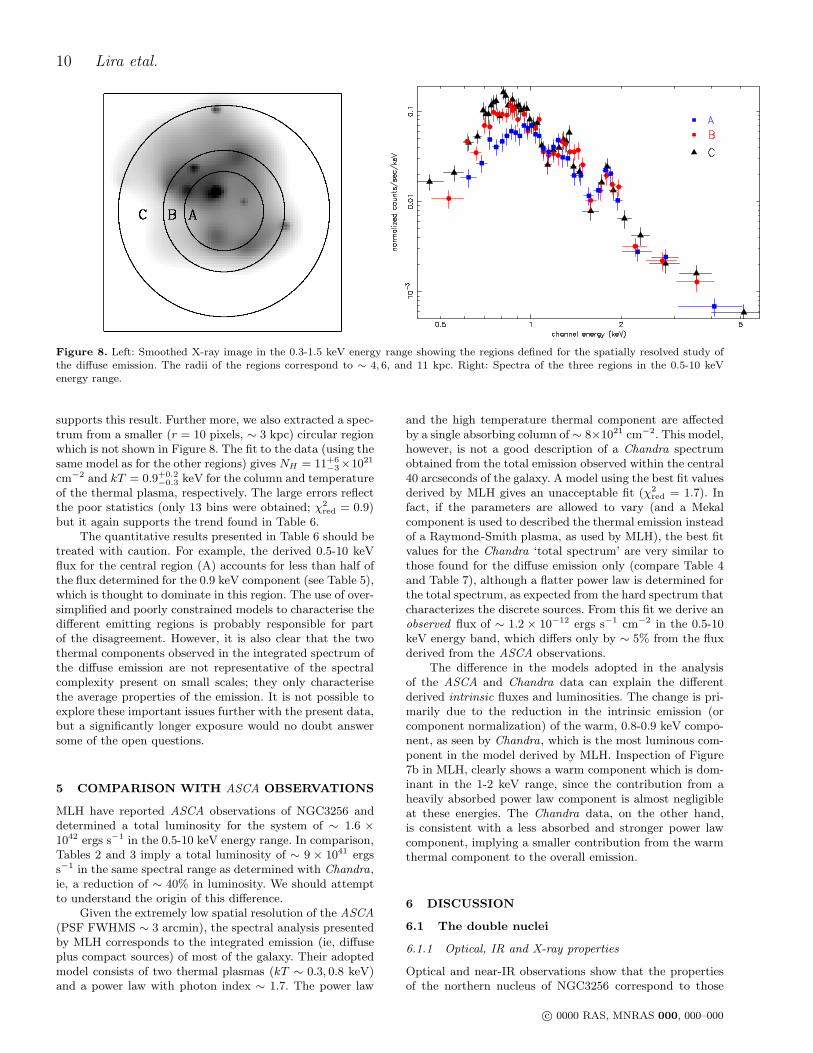
Two thermal components have been clearly identifiedin the Chandra data. Observational evidence on galacticwinds suggests that the central regions of starbursts arecharacterised by higher plasma temperatures than the outerregions (Strickland, Ponman & Stevens 1997, Pietsch etal2000). This is also supported by various theoretical models ofgalactic winds (Suchkov etal 1996, Chevalier & Clegg 1985).Given the nearly face-on orientation of NGC3256 we decidedto extract spectra from annular regions centered in betweenboth nuclei. After experimenting with different radii we de-fined three regions, A, B and C with outer radii of 15, 23and 40 pixels (∼ 4, 6, and 11 kpc). This choice gives a sim-ilar number of counts (∼ 900 − 1000) in each region andalso provides a good representation of the spectral changeswith radius. Region C is roughly coincident (although with alarger outer radius) with the onset of a ring of broad Hα lineemission (FWZI up to <∼ 6000 km s−1) probably associatedwith the wind, as discussed by MLH.
The regions are shown in Figure 8 overlaid onto a
Table 6. Best fit parameters for the diffuse emission from regionsA, B and C. A M+PL model was used with each component beingabsorbed by an independent NH . The power law component wasfrozen to a value of 2.7. Hydrogen columns are given in units of1021 cm−2 and plasma temperatures in units of keV. The errorscorrespond to 90% CL for 1 parameter of interest. Observed (ie,uncorrected) fluxes in the 0.5-10 keV for the thermal componentonly are given in units of 10−14 ergs s−1 cm−2.
Reg NH kT NH Γ χ2red
(dof) Fx
A 7.7+2.2−2.4 0.76+0.10
−0.16 2.3+0.7−0.6 2.7 1.08(29) 8.95
B 2.8+1.5−1.4 0.60+0.05
−0.09 4.3+1.6−0.9 2.7 1.14(30) 8.61
C Gal 0.63+0.04−0.04 3.6+2.1
−0.9 2.7 1.18(34) 10.25
smoothed image of the X-ray emission. The spectra obtainedfor each region (after removing the discrete sources) are alsoshown. The spectra show that while the emission above 1keV shows a similar trend for all radii, the dispersion ismuch larger below 1 keV, suggesting that different amountsabsorption and/or peak temperatures may characterise thedifferent regions.
In order to quantify the different spectral trends ob-served in Figure 8 we fitted each spectrum with a thermalplasma plus a power law (M+PL), each component absorbedby an independent hydrogen column. The power law com-ponent was fixed with an index of 2.7. The results are shownin Table 6. The best fitted value for the hydrogen columnaffecting the thermal plasma in region C was very close toGalactic and therefore, given that a column much largerthan Galactic is unlikely to pertain across such an extendedregion, a value of Gal was adopted.
The results in Table 6 show a trend of the spectral pa-rameters with radius. The most robust result concerns theamount of extinction affecting each region, with NH varyingby about an order of magnitude between the central and theouter parts of the diffuse emission. The variation in temper-ature is less certain given the associated errors. However,the presence of a ∼ 0.9 keV highly absorbed plasma hasbeen well established by ASCA observations (see section 5).So the correlation of higher temperatures with higher NH
c© 0000 RAS, MNRAS 000, 000–000
10 Lira etal.
Figure 8. Left: Smoothed X-ray image in the 0.3-1.5 keV energy range showing the regions defined for the spatially resolved study ofthe diffuse emission. The radii of the regions correspond to ∼ 4, 6, and 11 kpc. Right: Spectra of the three regions in the 0.5-10 keVenergy range.
supports this result. Further more, we also extracted a spec-trum from a smaller (r = 10 pixels, ∼ 3 kpc) circular regionwhich is not shown in Figure 8. The fit to the data (using thesame model as for the other regions) gives NH = 11+6
−3×10²¹
cm−2 and kT = 0.9+0.2−0.3 keV for the column and temperature
of the thermal plasma, respectively. The large errors reflectthe poor statistics (only 13 bins were obtained; χ2
red = 0.9)but it again supports the trend found in Table 6.
The quantitative results presented in Table 6 should betreated with caution. For example, the derived 0.5-10 keVflux for the central region (A) accounts for less than half ofthe flux determined for the 0.9 keV component (see Table 5),which is thought to dominate in this region. The use of over-simplified and poorly constrained models to characterise thedifferent emitting regions is probably responsible for partof the disagreement. However, it is also clear that the twothermal components observed in the integrated spectrum ofthe diffuse emission are not representative of the spectralcomplexity present on small scales; they only characterisethe average properties of the emission. It is not possible toexplore these important issues further with the present data,but a significantly longer exposure would no doubt answersome of the open questions.
5 COMPARISON WITH ASCA OBSERVATIONS
MLH have reported ASCA observations of NGC3256 anddetermined a total luminosity for the system of ∼ 1.6 ×
1042 ergs s−1 in the 0.5-10 keV energy range. In comparison,Tables 2 and 3 imply a total luminosity of ∼ 9 × 1041 ergss−1 in the same spectral range as determined with Chandra,ie, a reduction of ∼ 40% in luminosity. We should attemptto understand the origin of this difference.
Given the extremely low spatial resolution of the ASCA
(PSF FWHMS ∼ 3 arcmin), the spectral analysis presentedby MLH corresponds to the integrated emission (ie, diffuseplus compact sources) of most of the galaxy. Their adoptedmodel consists of two thermal plasmas (kT ∼ 0.3, 0.8 keV)and a power law with photon index ∼ 1.7. The power law
and the high temperature thermal component are affectedby a single absorbing column of ∼ 8×1021 cm−2. This model,however, is not a good description of a Chandra spectrumobtained from the total emission observed within the central40 arcseconds of the galaxy. A model using the best fit valuesderived by MLH gives an unacceptable fit (χ2
red = 1.7). Infact, if the parameters are allowed to vary (and a Mekalcomponent is used to described the thermal emission insteadof a Raymond-Smith plasma, as used by MLH), the best fitvalues for the Chandra ‘total spectrum’ are very similar tothose found for the diffuse emission only (compare Table 4and Table 7), although a flatter power law is determined forthe total spectrum, as expected from the hard spectrum thatcharacterizes the discrete sources. From this fit we derive anobserved flux of ∼ 1.2 × 10⁻¹² ergs s−1 cm−2 in the 0.5-10keV energy band, which differs only by ∼ 5% from the fluxderived from the ASCA observations.
The difference in the models adopted in the analysisof the ASCA and Chandra data can explain the differentderived intrinsic fluxes and luminosities. The change is pri-marily due to the reduction in the intrinsic emission (orcomponent normalization) of the warm, 0.8-0.9 keV compo-nent, as seen by Chandra, which is the most luminous com-ponent in the model derived by MLH. Inspection of Figure7b in MLH, clearly shows a warm component which is dom-inant in the 1-2 keV range, since the contribution from aheavily absorbed power law component is almost negligibleat these energies. The Chandra data, on the other hand,is consistent with a less absorbed and stronger power lawcomponent, implying a smaller contribution from the warmthermal component to the overall emission.
6 DISCUSSION
6.1 The double nuclei
6.1.1 Optical, IR and X-ray properties
Optical and near-IR observations show that the propertiesof the northern nucleus of NGC3256 correspond to those
c© 0000 RAS, MNRAS 000, 000–000
Chandra Observations of NGC3256 11
Table 7. Best-fit model parameters for the total emission in the 0.5-10 keV energy range. Solar abundances were assumed for the Mekalcomponents. Intervening hydrogen columns are in units of 1021 cm−2 and plasma temperatures are in units of keV. Gal stands for aforeground Galactic hydrogen column (9 × 1020 cm−2). Errors correspond to 90% CL for one parameter of interest. Observed fluxes arein units of 10−13 ergs s−1 cm−2 and intrinsic luminosities are in units of 1041 ergs s−1 (for an assumed distance of 56 Mpc).
Model NH kT NH kT NH kT or Γ χ2red
(dof) Fx Lx
M+M+PL Gal 0.50+0.12−0.17 3.7+0.5
−0.7 0.88+0.21−0.14 † 2.42+0.17
−0.21 1.16(80) 11.72 7.67
M+M+PL⋆ Gal 0.58+0.05−0.14 7.8+1.7
−2.1 0.92+0.12−0.17 3.4+1.3
−1.8 1.99+0.32−0.36 1.07(79) 12.09 9.09
†: Same hydrogen column as applied to previous spectral component.
⋆ Model component normalizations: 1.3 × 10⁻⁴ and 5.8 × 10⁻⁴ for the 0.6 and 0.9 keV Mekal componentsrespectively, in units of (10−14/(4πD)) ×
∫n2
e dV (where D is the distance to NGC3256 in cm, ne is theelectron density in cm−3, and V is the volume of the emitting region in cm3); 1.8 × 10⁻⁴ for the PowerLaw, in units of 10−4 photons cm−2 s−1 keV−1.
of a strong starburst. Lıpari etal (2000) found that theoptical emission line features correspond to ‘those of low-ionization and high metallicity giant HII regions’. On theother hand, the outer regions (R > 10 arcsec) are charac-terised by shock excitation (Lıpari etal 2000; MLH). Lıparietal also presented UV spectra of the central region (10×20arcsec) showing strong absorption lines, implying the pres-ence of massive young stars. Kotilainen etal (1996) obtainednear-IR emission line maps of the centre of the galaxy anddetermined an extinction towards the northern nucleus ofAV ∼ 2.4 magnitudes.
The southern nucleus of NGC3256 was first imaged inthe near-IR continuum by Moorwood & Oliva (1994), al-though near-IR spectroscopy of the source had already beenpresented by Doyon, Joseph & Wright (1994). From theirK band imaging Moorwood & Oliva detected an obscuredsource located 5 arcsec to the south of the central peak(the northern nucleus) and suggested that this secondarypeak corresponded to the nucleus of the merging compan-ion galaxy. Support came with radio observations reportedby Norris & Forbes (1995) showing two equally bright knotsof emission. Near-IR observations by Kotilainen etal (1996)showed that the luminosity of both nuclei is comparable inthe L (3.5 µm) band and they estimated an extinction to-wards the southern nucleus of AV ∼ 10 magnitudes. Highresolution N-band (12 µm) images show, however, that thenorthern nucleus is ∼ 20 times brighter than the southernpeak in the mid-IR, suggesting that the northern nucleusis the dominant star-forming region in the galaxy (Lira &Ward 2002).
In order to improve the reddening estimations towardsthe galaxy nuclei, we have analysed archive NICMOS dataof the central region of NGC3256. These observations wereobtained on the 28th of November 1997 using the NIC2 cam-era (FOV = 19.2 × 19.2 arcsec, FWHM for a point source∼ 0.15 arcsec) and the F222M (∼ K band), F160W (∼ Hband), and F190N (Paα plus continuum at 1.90 µm) filters.For details of the reduction procedure see Alonso-Herreroetal (2000). Gaussian fitting to the K-band data shows thatboth nuclei are resolved, with the northern nucleus (decon-volved FWHM ∼ 0.25 arcsec) being more compact than thesouthern nucleus (deconvolved FWHM ∼ 0.34 arcsec). Us-ing an aperture of 0.76 arcsec in diameter we measured anH − K colour of 0.64 magnitudes for the northern nucleusand 1.44 magnitudes for the southern nucleus. Assuming a
intrinsic colour H − K ∼ 0.22 for the nuclei of starburstand Seyfert galaxies (Glass & Morwood 1985) and the ex-tinction law of Cardelli, Clayton & Mathis (1989) this im-plies a visual extinction of ∼ 5.5 and ∼ 16 magnitudes forthe northern and southern nuclei respectively. Assuming aGalactic gas-to-dust ratio, these values of AV correspondto a hydrogen column density for the northern nucleus of∼ 8 × 1021 cm−2 and ∼ 2.5 × 1022 cm−2 for the southernnucleus, in good agreement with the values inferred from theX-ray observations.
The northern nucleus is the brightest X-ray source inNGC3256 with an unabsorbed luminosity of ∼ 8−10×1040
ergs s−1 in the 0.5-10 keV energy range (see Table 2). Thesource is clearly resolved, and therefore it probably corre-sponds to a compact grouping of individual sources and dif-fuse emission at the heart of the nuclear starburst. The de-convolved FWHM of the radial profile in the 2-5 keV rangeshown in Figure 2 corresponds to ∼ 1 arcsec, or ∼ 270 pc atthe distance of NGC3256. The full band, 0.5-10 keV profilehas a deconvolved FWHM of ∼ 1.5 arcsec, corresponding to400 pc, which is only a factor ∼ 1.5 times smaller than thecentral starbursting region present in M82. The X-ray lumi-nosity of both regions are also similar. In the case of M82the 2-10 keV emission is dominated by a highly variable andextremely luminous point source (Kaaret etal 2001, Wardetal 2001).
The NICMOS data for NGC3256 do not show conspic-uous sources within a radius of 1.5 arcsec of the northernnucleus. The FWHM of the peak is only ∼ 0.25 arcsecsor ∼ 70 pc. Althought there is little evidence for a one-to-one correlation between X-ray and IR point sources, wewould expect the overall size of these regions to be similar(eg, M82 - Griffiths etal 2000). Therefore any populationof X-ray emitting discrete sources (accreting binaries andcompact SNRs) should be mainly associated with the verycompact peak seen in the NICMOS data. It seems unlikelythat a population of ‘normal’ binaries and SNRs could ex-plain the observed X-ray emission, since several hundredssuch sources would need to be packed within a very smallvolume. A more plausible scenario is that the X-ray emis-sion is dominated by a diffuse component (eg, the base ofthe galactic wind - support for this scenario comes from therather steep index of the power-law component determinedin Table 2 which can also be fitted by a hot gas component
c© 0000 RAS, MNRAS 000, 000–000
12 Lira etal.
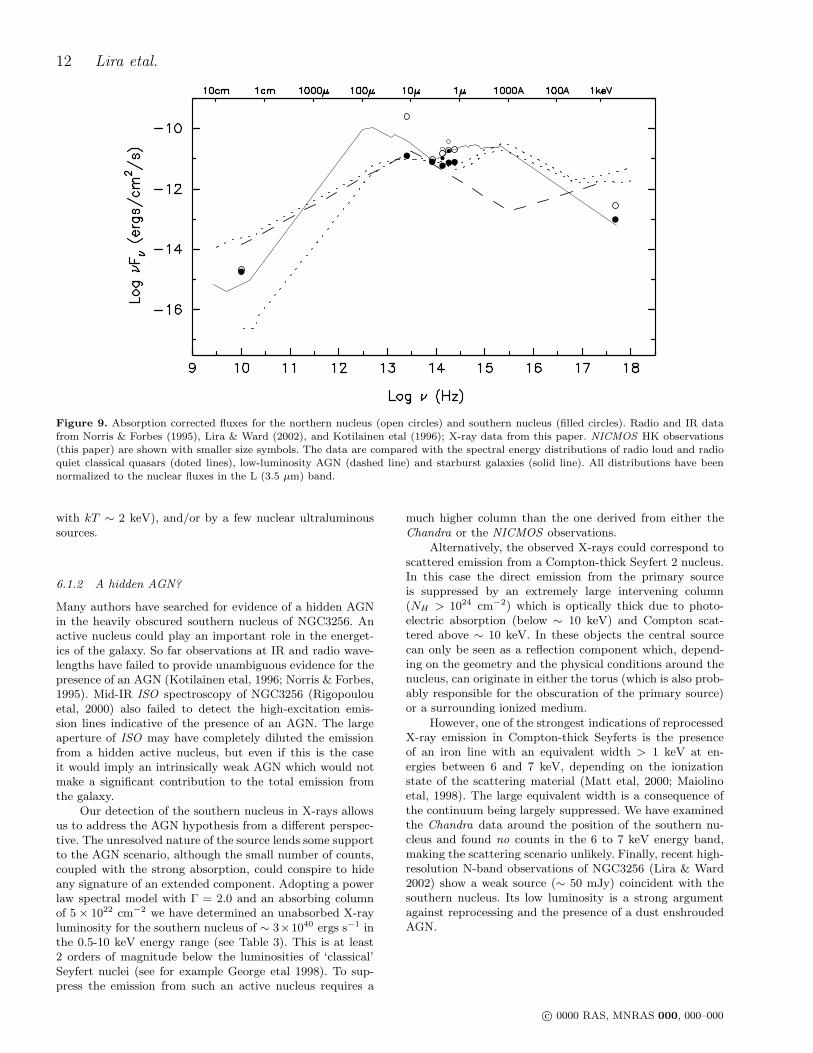
Figure 9. Absorption corrected fluxes for the northern nucleus (open circles) and southern nucleus (filled circles). Radio and IR datafrom Norris & Forbes (1995), Lira & Ward (2002), and Kotilainen etal (1996); X-ray data from this paper. NICMOS HK observations(this paper) are shown with smaller size symbols. The data are compared with the spectral energy distributions of radio loud and radioquiet classical quasars (doted lines), low-luminosity AGN (dashed line) and starburst galaxies (solid line). All distributions have beennormalized to the nuclear fluxes in the L (3.5 µm) band.
with kT ∼ 2 keV), and/or by a few nuclear ultraluminoussources.
6.1.2 A hidden AGN?
Many authors have searched for evidence of a hidden AGNin the heavily obscured southern nucleus of NGC3256. Anactive nucleus could play an important role in the energet-ics of the galaxy. So far observations at IR and radio wave-lengths have failed to provide unambiguous evidence for thepresence of an AGN (Kotilainen etal, 1996; Norris & Forbes,1995). Mid-IR ISO spectroscopy of NGC3256 (Rigopoulouetal, 2000) also failed to detect the high-excitation emis-sion lines indicative of the presence of an AGN. The largeaperture of ISO may have completely diluted the emissionfrom a hidden active nucleus, but even if this is the caseit would imply an intrinsically weak AGN which would notmake a significant contribution to the total emission fromthe galaxy.
Our detection of the southern nucleus in X-rays allowsus to address the AGN hypothesis from a different perspec-tive. The unresolved nature of the source lends some supportto the AGN scenario, although the small number of counts,coupled with the strong absorption, could conspire to hideany signature of an extended component. Adopting a powerlaw spectral model with Γ = 2.0 and an absorbing columnof 5 × 1022 cm−2 we have determined an unabsorbed X-rayluminosity for the southern nucleus of ∼ 3×1040 ergs s−1 inthe 0.5-10 keV energy range (see Table 3). This is at least2 orders of magnitude below the luminosities of ‘classical’Seyfert nuclei (see for example George etal 1998). To sup-press the emission from such an active nucleus requires a
much higher column than the one derived from either theChandra or the NICMOS observations.
Alternatively, the observed X-rays could correspond toscattered emission from a Compton-thick Seyfert 2 nucleus.In this case the direct emission from the primary sourceis suppressed by an extremely large intervening column(NH > 1024 cm−2) which is optically thick due to photo-electric absorption (below ∼ 10 keV) and Compton scat-tered above ∼ 10 keV. In these objects the central sourcecan only be seen as a reflection component which, depend-ing on the geometry and the physical conditions around thenucleus, can originate in either the torus (which is also prob-ably responsible for the obscuration of the primary source)or a surrounding ionized medium.
However, one of the strongest indications of reprocessedX-ray emission in Compton-thick Seyferts is the presenceof an iron line with an equivalent width > 1 keV at en-ergies between 6 and 7 keV, depending on the ionizationstate of the scattering material (Matt etal, 2000; Maiolinoetal, 1998). The large equivalent width is a consequence ofthe continuum being largely suppressed. We have examinedthe Chandra data around the position of the southern nu-cleus and found no counts in the 6 to 7 keV energy band,making the scattering scenario unlikely. Finally, recent high-resolution N-band observations of NGC3256 (Lira & Ward2002) show a weak source (∼ 50 mJy) coincident with thesouthern nucleus. Its low luminosity is a strong argumentagainst reprocessing and the presence of a dust enshroudedAGN.
c© 0000 RAS, MNRAS 000, 000–000
Chandra Observations of NGC3256 13
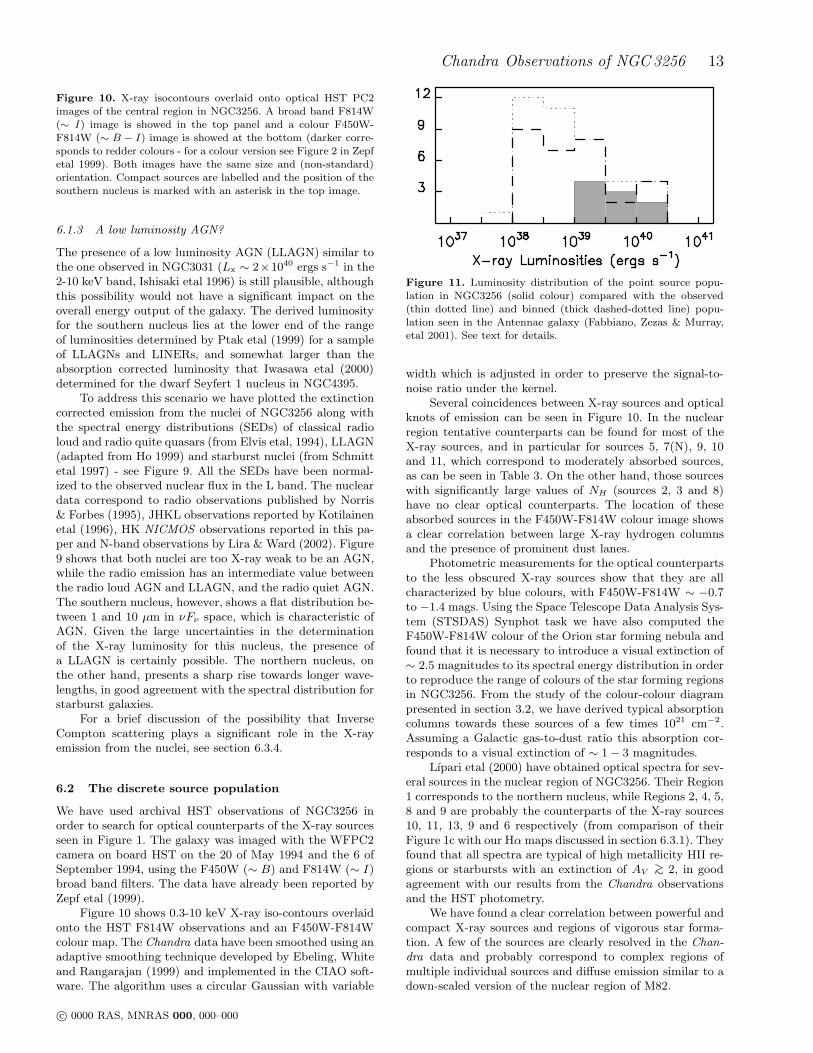
Figure 10. X-ray isocontours overlaid onto optical HST PC2images of the central region in NGC3256. A broad band F814W(∼ I) image is showed in the top panel and a colour F450W-F814W (∼ B − I) image is showed at the bottom (darker corre-sponds to redder colours - for a colour version see Figure 2 in Zepfetal 1999). Both images have the same size and (non-standard)orientation. Compact sources are labelled and the position of thesouthern nucleus is marked with an asterisk in the top image.
6.1.3 A low luminosity AGN?
The presence of a low luminosity AGN (LLAGN) similar tothe one observed in NGC3031 (Lx ∼ 2×1040 ergs s−1 in the2-10 keV band, Ishisaki etal 1996) is still plausible, althoughthis possibility would not have a significant impact on theoverall energy output of the galaxy. The derived luminosityfor the southern nucleus lies at the lower end of the rangeof luminosities determined by Ptak etal (1999) for a sampleof LLAGNs and LINERs, and somewhat larger than theabsorption corrected luminosity that Iwasawa etal (2000)determined for the dwarf Seyfert 1 nucleus in NGC4395.
To address this scenario we have plotted the extinctioncorrected emission from the nuclei of NGC3256 along withthe spectral energy distributions (SEDs) of classical radioloud and radio quite quasars (from Elvis etal, 1994), LLAGN(adapted from Ho 1999) and starburst nuclei (from Schmittetal 1997) - see Figure 9. All the SEDs have been normal-ized to the observed nuclear flux in the L band. The nucleardata correspond to radio observations published by Norris& Forbes (1995), JHKL observations reported by Kotilainenetal (1996), HK NICMOS observations reported in this pa-per and N-band observations by Lira & Ward (2002). Figure9 shows that both nuclei are too X-ray weak to be an AGN,while the radio emission has an intermediate value betweenthe radio loud AGN and LLAGN, and the radio quiet AGN.The southern nucleus, however, shows a flat distribution be-tween 1 and 10 µm in νFν space, which is characteristic ofAGN. Given the large uncertainties in the determinationof the X-ray luminosity for this nucleus, the presence ofa LLAGN is certainly possible. The northern nucleus, onthe other hand, presents a sharp rise towards longer wave-lengths, in good agreement with the spectral distribution forstarburst galaxies.
For a brief discussion of the possibility that InverseCompton scattering plays a significant role in the X-rayemission from the nuclei, see section 6.3.4.
6.2 The discrete source population
We have used archival HST observations of NGC3256 inorder to search for optical counterparts of the X-ray sourcesseen in Figure 1. The galaxy was imaged with the WFPC2camera on board HST on the 20 of May 1994 and the 6 ofSeptember 1994, using the F450W (∼ B) and F814W (∼ I)broad band filters. The data have already been reported byZepf etal (1999).
Figure 10 shows 0.3-10 keV X-ray iso-contours overlaidonto the HST F814W observations and an F450W-F814Wcolour map. The Chandra data have been smoothed using anadaptive smoothing technique developed by Ebeling, Whiteand Rangarajan (1999) and implemented in the CIAO soft-ware. The algorithm uses a circular Gaussian with variable
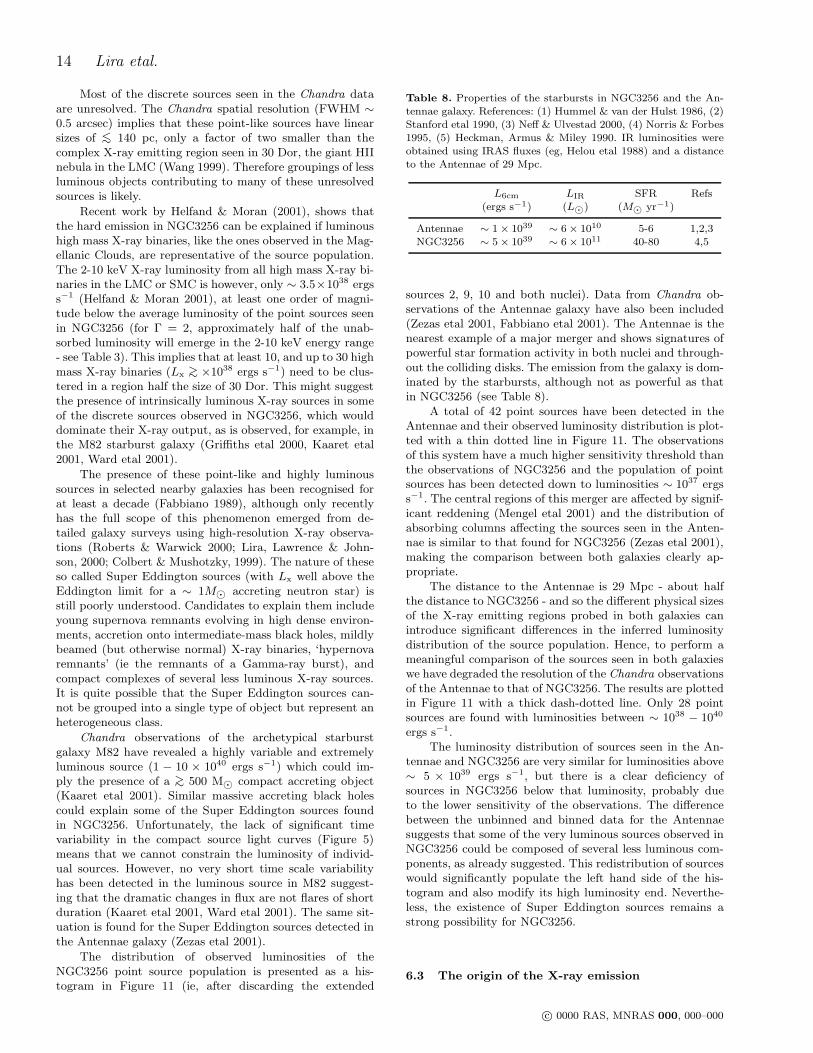
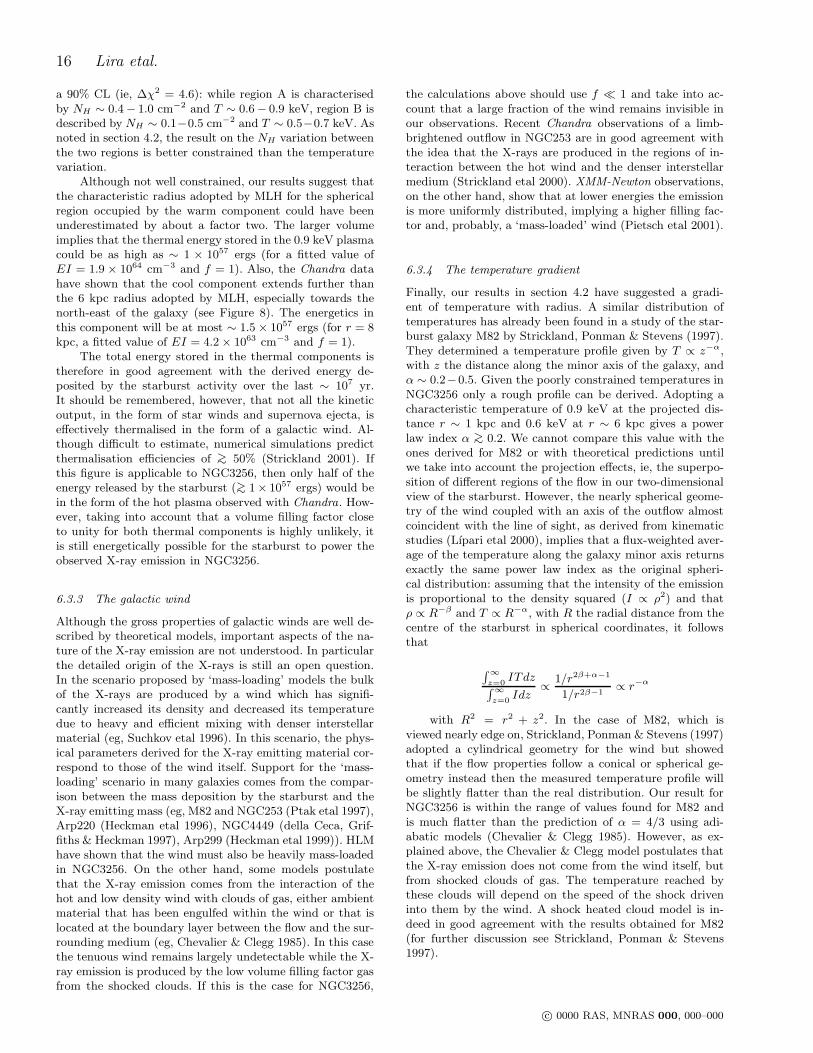
Figure 11. Luminosity distribution of the point source popu-lation in NGC3256 (solid colour) compared with the observed(thin dotted line) and binned (thick dashed-dotted line) popu-lation seen in the Antennae galaxy (Fabbiano, Zezas & Murray,etal 2001). See text for details.
width which is adjusted in order to preserve the signal-to-noise ratio under the kernel.
Several coincidences between X-ray sources and opticalknots of emission can be seen in Figure 10. In the nuclearregion tentative counterparts can be found for most of theX-ray sources, and in particular for sources 5, 7(N), 9, 10and 11, which correspond to moderately absorbed sources,as can be seen in Table 3. On the other hand, those sourceswith significantly large values of NH (sources 2, 3 and 8)have no clear optical counterparts. The location of theseabsorbed sources in the F450W-F814W colour image showsa clear correlation between large X-ray hydrogen columnsand the presence of prominent dust lanes.
Photometric measurements for the optical counterpartsto the less obscured X-ray sources show that they are allcharacterized by blue colours, with F450W-F814W ∼ −0.7to −1.4 mags. Using the Space Telescope Data Analysis Sys-tem (STSDAS) Synphot task we have also computed theF450W-F814W colour of the Orion star forming nebula andfound that it is necessary to introduce a visual extinction of∼ 2.5 magnitudes to its spectral energy distribution in orderto reproduce the range of colours of the star forming regionsin NGC3256. From the study of the colour-colour diagrampresented in section 3.2, we have derived typical absorptioncolumns towards these sources of a few times 1021 cm−2.Assuming a Galactic gas-to-dust ratio this absorption cor-responds to a visual extinction of ∼ 1 − 3 magnitudes.
Lıpari etal (2000) have obtained optical spectra for sev-eral sources in the nuclear region of NGC3256. Their Region1 corresponds to the northern nucleus, while Regions 2, 4, 5,8 and 9 are probably the counterparts of the X-ray sources10, 11, 13, 9 and 6 respectively (from comparison of theirFigure 1c with our Hα maps discussed in section 6.3.1). Theyfound that all spectra are typical of high metallicity HII re-gions or starbursts with an extinction of AV >∼ 2, in goodagreement with our results from the Chandra observationsand the HST photometry.
We have found a clear correlation between powerful andcompact X-ray sources and regions of vigorous star forma-tion. A few of the sources are clearly resolved in the Chan-
dra data and probably correspond to complex regions ofmultiple individual sources and diffuse emission similar to adown-scaled version of the nuclear region of M82.
c© 0000 RAS, MNRAS 000, 000–000
14 Lira etal.
Most of the discrete sources seen in the Chandra dataare unresolved. The Chandra spatial resolution (FWHM ∼
0.5 arcsec) implies that these point-like sources have linearsizes of <∼ 140 pc, only a factor of two smaller than thecomplex X-ray emitting region seen in 30 Dor, the giant HIInebula in the LMC (Wang 1999). Therefore groupings of lessluminous objects contributing to many of these unresolvedsources is likely.
Recent work by Helfand & Moran (2001), shows thatthe hard emission in NGC3256 can be explained if luminoushigh mass X-ray binaries, like the ones observed in the Mag-ellanic Clouds, are representative of the source population.The 2-10 keV X-ray luminosity from all high mass X-ray bi-naries in the LMC or SMC is however, only ∼ 3.5×1038 ergss−1 (Helfand & Moran 2001), at least one order of magni-tude below the average luminosity of the point sources seenin NGC3256 (for Γ = 2, approximately half of the unab-sorbed luminosity will emerge in the 2-10 keV energy range- see Table 3). This implies that at least 10, and up to 30 highmass X-ray binaries (Lx >∼ ×1038 ergs s−1) need to be clus-tered in a region half the size of 30 Dor. This might suggestthe presence of intrinsically luminous X-ray sources in someof the discrete sources observed in NGC3256, which woulddominate their X-ray output, as is observed, for example, inthe M82 starburst galaxy (Griffiths etal 2000, Kaaret etal2001, Ward etal 2001).
The presence of these point-like and highly luminoussources in selected nearby galaxies has been recognised forat least a decade (Fabbiano 1989), although only recentlyhas the full scope of this phenomenon emerged from de-tailed galaxy surveys using high-resolution X-ray observa-tions (Roberts & Warwick 2000; Lira, Lawrence & John-son, 2000; Colbert & Mushotzky, 1999). The nature of theseso called Super Eddington sources (with Lx well above theEddington limit for a ∼ 1M⊙ accreting neutron star) isstill poorly understood. Candidates to explain them includeyoung supernova remnants evolving in high dense environ-ments, accretion onto intermediate-mass black holes, mildlybeamed (but otherwise normal) X-ray binaries, ‘hypernovaremnants’ (ie the remnants of a Gamma-ray burst), andcompact complexes of several less luminous X-ray sources.It is quite possible that the Super Eddington sources can-not be grouped into a single type of object but represent anheterogeneous class.
Chandra observations of the archetypical starburstgalaxy M82 have revealed a highly variable and extremelyluminous source (1 − 10 × 1040 ergs s−1) which could im-ply the presence of a >∼ 500 M⊙ compact accreting object(Kaaret etal 2001). Similar massive accreting black holescould explain some of the Super Eddington sources foundin NGC3256. Unfortunately, the lack of significant timevariability in the compact source light curves (Figure 5)means that we cannot constrain the luminosity of individ-ual sources. However, no very short time scale variabilityhas been detected in the luminous source in M82 suggest-ing that the dramatic changes in flux are not flares of shortduration (Kaaret etal 2001, Ward etal 2001). The same sit-uation is found for the Super Eddington sources detected inthe Antennae galaxy (Zezas etal 2001).
The distribution of observed luminosities of theNGC3256 point source population is presented as a his-togram in Figure 11 (ie, after discarding the extended
Table 8. Properties of the starbursts in NGC3256 and the An-tennae galaxy. References: (1) Hummel & van der Hulst 1986, (2)Stanford etal 1990, (3) Neff & Ulvestad 2000, (4) Norris & Forbes1995, (5) Heckman, Armus & Miley 1990. IR luminosities wereobtained using IRAS fluxes (eg, Helou etal 1988) and a distanceto the Antennae of 29 Mpc.
L6cm LIR SFR Refs(ergs s−1) (L⊙) (M⊙ yr−1)
Antennae ∼ 1 × 1039 ∼ 6 × 10¹⁰ 5-6 1,2,3NGC3256 ∼ 5 × 1039 ∼ 6 × 10¹¹ 40-80 4,5
sources 2, 9, 10 and both nuclei). Data from Chandra ob-servations of the Antennae galaxy have also been included(Zezas etal 2001, Fabbiano etal 2001). The Antennae is thenearest example of a major merger and shows signatures ofpowerful star formation activity in both nuclei and through-out the colliding disks. The emission from the galaxy is dom-inated by the starbursts, although not as powerful as thatin NGC3256 (see Table 8).
A total of 42 point sources have been detected in theAntennae and their observed luminosity distribution is plot-ted with a thin dotted line in Figure 11. The observationsof this system have a much higher sensitivity threshold thanthe observations of NGC3256 and the population of pointsources has been detected down to luminosities ∼ 1037 ergss−1. The central regions of this merger are affected by signif-icant reddening (Mengel etal 2001) and the distribution ofabsorbing columns affecting the sources seen in the Anten-nae is similar to that found for NGC3256 (Zezas etal 2001),making the comparison between both galaxies clearly ap-propriate.
The distance to the Antennae is 29 Mpc - about halfthe distance to NGC3256 - and so the different physical sizesof the X-ray emitting regions probed in both galaxies canintroduce significant differences in the inferred luminositydistribution of the source population. Hence, to perform ameaningful comparison of the sources seen in both galaxieswe have degraded the resolution of the Chandra observationsof the Antennae to that of NGC3256. The results are plottedin Figure 11 with a thick dash-dotted line. Only 28 pointsources are found with luminosities between ∼ 1038 − 1040
ergs s−1.The luminosity distribution of sources seen in the An-
tennae and NGC3256 are very similar for luminosities above∼ 5 × 1039 ergs s−1, but there is a clear deficiency ofsources in NGC3256 below that luminosity, probably dueto the lower sensitivity of the observations. The differencebetween the unbinned and binned data for the Antennaesuggests that some of the very luminous sources observed inNGC3256 could be composed of several less luminous com-ponents, as already suggested. This redistribution of sourceswould significantly populate the left hand side of the his-togram and also modify its high luminosity end. Neverthe-less, the existence of Super Eddington sources remains astrong possibility for NGC3256.
6.3 The origin of the X-ray emission
c© 0000 RAS, MNRAS 000, 000–000
Chandra Observations of NGC3256 15
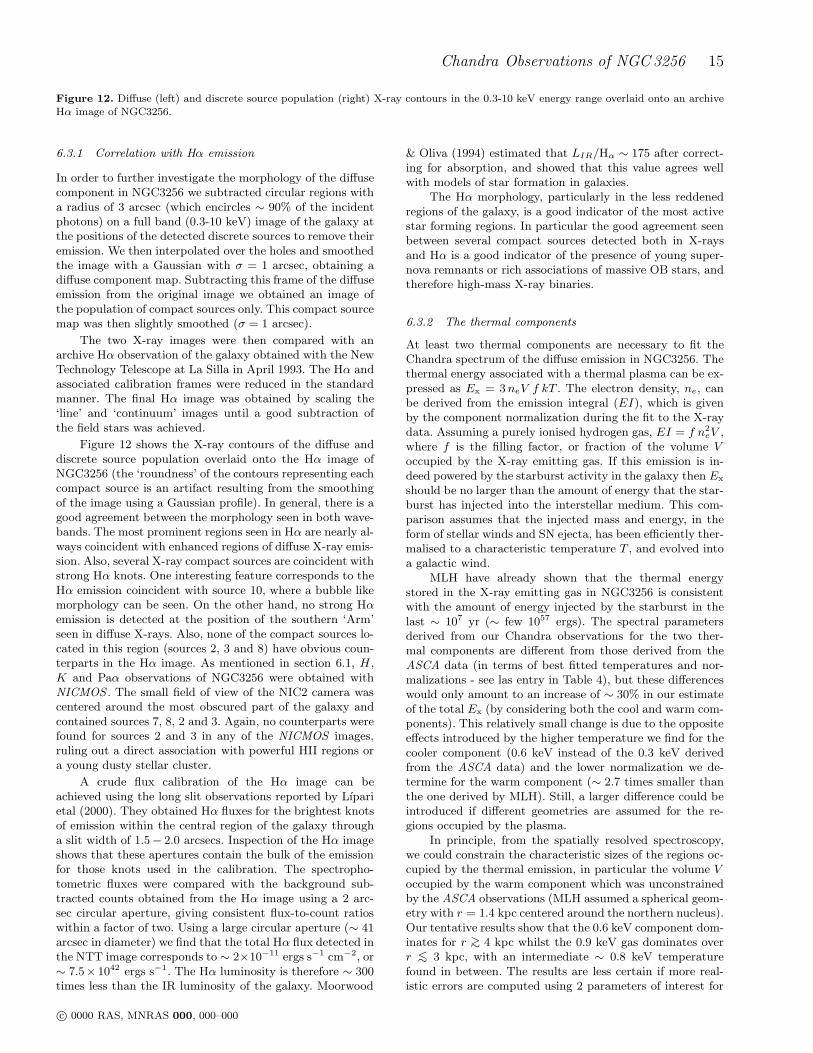
Figure 12. Diffuse (left) and discrete source population (right) X-ray contours in the 0.3-10 keV energy range overlaid onto an archiveHα image of NGC3256.
6.3.1 Correlation with Hα emission
In order to further investigate the morphology of the diffusecomponent in NGC3256 we subtracted circular regions witha radius of 3 arcsec (which encircles ∼ 90% of the incidentphotons) on a full band (0.3-10 keV) image of the galaxy atthe positions of the detected discrete sources to remove theiremission. We then interpolated over the holes and smoothedthe image with a Gaussian with σ = 1 arcsec, obtaining adiffuse component map. Subtracting this frame of the diffuseemission from the original image we obtained an image ofthe population of compact sources only. This compact sourcemap was then slightly smoothed (σ = 1 arcsec).
The two X-ray images were then compared with anarchive Hα observation of the galaxy obtained with the NewTechnology Telescope at La Silla in April 1993. The Hα andassociated calibration frames were reduced in the standardmanner. The final Hα image was obtained by scaling the‘line’ and ‘continuum’ images until a good subtraction ofthe field stars was achieved.
Figure 12 shows the X-ray contours of the diffuse anddiscrete source population overlaid onto the Hα image ofNGC3256 (the ‘roundness’ of the contours representing eachcompact source is an artifact resulting from the smoothingof the image using a Gaussian profile). In general, there is agood agreement between the morphology seen in both wave-bands. The most prominent regions seen in Hα are nearly al-ways coincident with enhanced regions of diffuse X-ray emis-sion. Also, several X-ray compact sources are coincident withstrong Hα knots. One interesting feature corresponds to theHα emission coincident with source 10, where a bubble likemorphology can be seen. On the other hand, no strong Hαemission is detected at the position of the southern ‘Arm’seen in diffuse X-rays. Also, none of the compact sources lo-cated in this region (sources 2, 3 and 8) have obvious coun-terparts in the Hα image. As mentioned in section 6.1, H ,K and Paα observations of NGC3256 were obtained withNICMOS . The small field of view of the NIC2 camera wascentered around the most obscured part of the galaxy andcontained sources 7, 8, 2 and 3. Again, no counterparts werefound for sources 2 and 3 in any of the NICMOS images,ruling out a direct association with powerful HII regions ora young dusty stellar cluster.
A crude flux calibration of the Hα image can beachieved using the long slit observations reported by Lıparietal (2000). They obtained Hα fluxes for the brightest knotsof emission within the central region of the galaxy througha slit width of 1.5− 2.0 arcsecs. Inspection of the Hα imageshows that these apertures contain the bulk of the emissionfor those knots used in the calibration. The spectropho-tometric fluxes were compared with the background sub-tracted counts obtained from the Hα image using a 2 arc-sec circular aperture, giving consistent flux-to-count ratioswithin a factor of two. Using a large circular aperture (∼ 41arcsec in diameter) we find that the total Hα flux detected inthe NTT image corresponds to ∼ 2×10⁻¹¹ ergs s−1 cm−2, or∼ 7.5× 1042 ergs s−1. The Hα luminosity is therefore ∼ 300times less than the IR luminosity of the galaxy. Moorwood
& Oliva (1994) estimated that LIR/Hα ∼ 175 after correct-ing for absorption, and showed that this value agrees wellwith models of star formation in galaxies.
The Hα morphology, particularly in the less reddenedregions of the galaxy, is a good indicator of the most activestar forming regions. In particular the good agreement seenbetween several compact sources detected both in X-raysand Hα is a good indicator of the presence of young super-nova remnants or rich associations of massive OB stars, andtherefore high-mass X-ray binaries.
6.3.2 The thermal components
At least two thermal components are necessary to fit theChandra spectrum of the diffuse emission in NGC3256. Thethermal energy associated with a thermal plasma can be ex-pressed as Ex = 3 neV f kT . The electron density, ne, canbe derived from the emission integral (EI), which is givenby the component normalization during the fit to the X-raydata. Assuming a purely ionised hydrogen gas, EI = f n2
eV ,where f is the filling factor, or fraction of the volume Voccupied by the X-ray emitting gas. If this emission is in-deed powered by the starburst activity in the galaxy then Ex
should be no larger than the amount of energy that the star-burst has injected into the interstellar medium. This com-parison assumes that the injected mass and energy, in theform of stellar winds and SN ejecta, has been efficiently ther-malised to a characteristic temperature T , and evolved intoa galactic wind.
MLH have already shown that the thermal energystored in the X-ray emitting gas in NGC3256 is consistentwith the amount of energy injected by the starburst in thelast ∼ 107 yr (∼ few 1057 ergs). The spectral parametersderived from our Chandra observations for the two ther-mal components are different from those derived from theASCA data (in terms of best fitted temperatures and nor-malizations - see las entry in Table 4), but these differenceswould only amount to an increase of ∼ 30% in our estimateof the total Ex (by considering both the cool and warm com-ponents). This relatively small change is due to the oppositeeffects introduced by the higher temperature we find for thecooler component (0.6 keV instead of the 0.3 keV derivedfrom the ASCA data) and the lower normalization we de-termine for the warm component (∼ 2.7 times smaller thanthe one derived by MLH). Still, a larger difference could beintroduced if different geometries are assumed for the re-gions occupied by the plasma.
In principle, from the spatially resolved spectroscopy,we could constrain the characteristic sizes of the regions oc-cupied by the thermal emission, in particular the volume Voccupied by the warm component which was unconstrainedby the ASCA observations (MLH assumed a spherical geom-etry with r = 1.4 kpc centered around the northern nucleus).Our tentative results show that the 0.6 keV component dom-inates for r >∼ 4 kpc whilst the 0.9 keV gas dominates overr <∼ 3 kpc, with an intermediate ∼ 0.8 keV temperaturefound in between. The results are less certain if more real-istic errors are computed using 2 parameters of interest for
c© 0000 RAS, MNRAS 000, 000–000
16 Lira etal.
a 90% CL (ie, ∆χ2 = 4.6): while region A is characterisedby NH ∼ 0.4− 1.0 cm−2 and T ∼ 0.6− 0.9 keV, region B isdescribed by NH ∼ 0.1−0.5 cm−2 and T ∼ 0.5−0.7 keV. Asnoted in section 4.2, the result on the NH variation betweenthe two regions is better constrained than the temperaturevariation.
Although not well constrained, our results suggest thatthe characteristic radius adopted by MLH for the sphericalregion occupied by the warm component could have beenunderestimated by about a factor two. The larger volumeimplies that the thermal energy stored in the 0.9 keV plasmacould be as high as ∼ 1 × 1057 ergs (for a fitted value ofEI = 1.9 × 1064 cm−3 and f = 1). Also, the Chandra datahave shown that the cool component extends further thanthe 6 kpc radius adopted by MLH, especially towards thenorth-east of the galaxy (see Figure 8). The energetics inthis component will be at most ∼ 1.5 × 1057 ergs (for r = 8kpc, a fitted value of EI = 4.2 × 1063 cm−3 and f = 1).
The total energy stored in the thermal components istherefore in good agreement with the derived energy de-posited by the starburst activity over the last ∼ 107 yr.It should be remembered, however, that not all the kineticoutput, in the form of star winds and supernova ejecta, iseffectively thermalised in the form of a galactic wind. Al-though difficult to estimate, numerical simulations predictthermalisation efficiencies of >∼ 50% (Strickland 2001). Ifthis figure is applicable to NGC3256, then only half of theenergy released by the starburst (>∼ 1× 1057 ergs) would bein the form of the hot plasma observed with Chandra. How-ever, taking into account that a volume filling factor closeto unity for both thermal components is highly unlikely, itis still energetically possible for the starburst to power theobserved X-ray emission in NGC3256.
6.3.3 The galactic wind
Although the gross properties of galactic winds are well de-scribed by theoretical models, important aspects of the na-ture of the X-ray emission are not understood. In particularthe detailed origin of the X-rays is still an open question.In the scenario proposed by ‘mass-loading’ models the bulkof the X-rays are produced by a wind which has signifi-cantly increased its density and decreased its temperaturedue to heavy and efficient mixing with denser interstellarmaterial (eg, Suchkov etal 1996). In this scenario, the phys-ical parameters derived for the X-ray emitting material cor-respond to those of the wind itself. Support for the ‘mass-loading’ scenario in many galaxies comes from the compar-ison between the mass deposition by the starburst and theX-ray emitting mass (eg, M82 and NGC253 (Ptak etal 1997),Arp220 (Heckman etal 1996), NGC4449 (della Ceca, Grif-fiths & Heckman 1997), Arp299 (Heckman etal 1999)). HLMhave shown that the wind must also be heavily mass-loadedin NGC3256. On the other hand, some models postulatethat the X-ray emission comes from the interaction of thehot and low density wind with clouds of gas, either ambientmaterial that has been engulfed within the wind or that islocated at the boundary layer between the flow and the sur-rounding medium (eg, Chevalier & Clegg 1985). In this casethe tenuous wind remains largely undetectable while the X-ray emission is produced by the low volume filling factor gasfrom the shocked clouds. If this is the case for NGC3256,
the calculations above should use f ≪ 1 and take into ac-count that a large fraction of the wind remains invisible inour observations. Recent Chandra observations of a limb-brightened outflow in NGC253 are in good agreement withthe idea that the X-rays are produced in the regions of in-teraction between the hot wind and the denser interstellarmedium (Strickland etal 2000). XMM-Newton observations,on the other hand, show that at lower energies the emissionis more uniformly distributed, implying a higher filling fac-tor and, probably, a ‘mass-loaded’ wind (Pietsch etal 2001).
6.3.4 The temperature gradient
Finally, our results in section 4.2 have suggested a gradi-ent of temperature with radius. A similar distribution oftemperatures has already been found in a study of the star-burst galaxy M82 by Strickland, Ponman & Stevens (1997).They determined a temperature profile given by T ∝ z−α,with z the distance along the minor axis of the galaxy, andα ∼ 0.2−0.5. Given the poorly constrained temperatures inNGC3256 only a rough profile can be derived. Adopting acharacteristic temperature of 0.9 keV at the projected dis-tance r ∼ 1 kpc and 0.6 keV at r ∼ 6 kpc gives a powerlaw index α >∼ 0.2. We cannot compare this value with theones derived for M82 or with theoretical predictions untilwe take into account the projection effects, ie, the superpo-sition of different regions of the flow in our two-dimensionalview of the starburst. However, the nearly spherical geome-try of the wind coupled with an axis of the outflow almostcoincident with the line of sight, as derived from kinematicstudies (Lıpari etal 2000), implies that a flux-weighted aver-age of the temperature along the galaxy minor axis returnsexactly the same power law index as the original spheri-cal distribution: assuming that the intensity of the emissionis proportional to the density squared (I ∝ ρ2) and thatρ ∝ R−β and T ∝ R−α, with R the radial distance from thecentre of the starburst in spherical coordinates, it followsthat
∫∞
z=0ITdz
∫∞
z=0Idz
∝1/r2β+α−1
1/r2β−1∝ r−α
with R2 = r2 + z2. In the case of M82, which isviewed nearly edge on, Strickland, Ponman & Stevens (1997)adopted a cylindrical geometry for the wind but showedthat if the flow properties follow a conical or spherical ge-ometry instead then the measured temperature profile willbe slightly flatter than the real distribution. Our result forNGC3256 is within the range of values found for M82 andis much flatter than the prediction of α = 4/3 using adi-abatic models (Chevalier & Clegg 1985). However, as ex-plained above, the Chevalier & Clegg model postulates thatthe X-ray emission does not come from the wind itself, butfrom shocked clouds of gas. The temperature reached bythese clouds will depend on the speed of the shock driveninto them by the wind. A shock heated cloud model is in-deed in good agreement with the results obtained for M82(for further discussion see Strickland, Ponman & Stevens1997).
c© 0000 RAS, MNRAS 000, 000–000
Chandra Observations of NGC3256 17
6.3.5 The hard emission
MLH have argued that the 2-10 keV intrinsic luminosity inthe power law component (∼ 2× 1041 ergs s−1 as measuredby ASCA) could not be explained solely by the presence ofa Galactic population of high mass X-ray binaries and thatInverse Compton scattering was likely to make a significantcontribution. They reached this conclusion by comparing thehard X-ray luminosity per O star observed in our Galaxywith the one inferred for NGC3256. New results publishedby Helfand & Moran (2001) show that in fact the 2-10 keVluminosity is well explained if a Magellanic Cloud type pop-ulation of high mass X-ray binaries is assumed instead of aGalactic population.
Chandra observations show that most of the power lawcomponent seen with ASCA can be identified with a pop-ulation of discrete sources. These extremely bright sourcescan have luminosities at least one order of magnitude aboveany source seen in our Galaxy. From a comparison of theluminosity in the discrete source population and the diffusecomponent in the 2.5-10 keV range we find that ∼ 75−80%of the emission (∼ 1.2× 1041 ergs s−1) comes from the hard(Γ ∼ 2) and powerful (1039−1040 ergs s−1) compact sourcesresolved by Chandra. A few of these sources have been foundto be extended and therefore they probably correspond tocompact star-forming regions. Since it is becoming increas-ingly evident that super Eddington sources are often foundin galaxies undergoing vigorous episodes of star formation,we can speculate that some of the observed discrete sourcesfound in NGC3256 correspond to (or are dominated by)these high luminosity sources. It is, however, impossible totest this further with the present data.
The extended emission has a power law componentcharacterised by a fairly steep slope (Γ <∼ 3, or kT ∼ 4 keVif a Mekal model is adopted). This component represents∼ 75% of the total luminosity in the diffuse emission in the2.5-10 keV band (see Table 5). An image in this energy rangewould determine the morphology of the Γ ∼ 3 emission, butour data do not have sufficient counts for this. From thespectral fit in Table 5, however, we know that a moderateextinction is associated with this component, and thereforeit is unlikely that the bulk of the emission is connected withthe innermost, and more heavily reddened parts of the star-burst. Also, the inclusion of this component in the fit to thedifferent spatial regions seen in Figure 8 always gave accept-able values of χ2
red, suggesting that the emission is presenteven at large radii. Therefore, the ∼ 4× 1040 ergs s−1 emit-ted in the 2.5-10 keV range in the power law componentis most likely due to an unresolved population of X-ray bi-naries and supernova remnants distributed throughout thegalactic disk. The inferred temperature is at the top endof the range of temperatures measured for young supernovaremnants (kT ∼ 1 − 4 keV; Bregman & Pildis 1992) and isclose to the temperatures observed in low mass X-ray bina-ries (kT ∼ 3 keV; Barret 2001). Inclusion of some contri-bution from the harder spectra of high-mass X-ray binariesand X-ray pulsars would improve the spectral match.
6.3.6 Inverse Compton Scattering?
Our Chandra observations have shown that most of theΓ <∼ 2 power law emission is accounted for by hard and
powerful discrete sources. So far we have speculated that ac-cretion onto compact objects is the dominant mechanism re-sponsible for this emission. However, Inverse Compton (IC)scattering is also a viable non-thermal mechanism that couldcontribute significantly.
NGC3256 shows strong IR and nonthermal (Syn-chrotron) radio emission. This implies the spatial co-existence of a population of relativistic electrons and IR seedphotons which could be up-scattered by the electrons intoX-ray frequencies. The IC luminosity can be expressed asLIC = LSyn × Uph/ UB, where LSyn is the radio luminosityand Uph and UB are the seed photon and magnetic energydensities, respectively (cf, Rybicki & Lightman 1979). Thelow surface brightness of the radio and IR emission outsidethe nuclei implies that IC emission is probably negligible inthe extranuclear regions. For example, source 10 in Figure1, the brightest source seen outside the nuclei at X-ray andoptical wavelengths (for optical broad band data see Table 3in Lıpari etal 2000), appears much fainter than the nuclei inthe L band map presented by Kotilainen etal (1996) and inthe radio maps by Norris & Forbes (1995), implying a smallvalue for the LSyn × Uph product.
In the case of the nuclei, however, IC emission could stillplay a significant role in the production of hard X-rays. Thisis particularly relevant in the case of the northern nucleus,which has a 2-10 luminosity of ∼ 2.5× 1040 ergs s−1 (whichis completely dominated by the power law component) andhas been found to be an extended source in X-rays (FWHM∼ 1 arcsec). A similar size has also been determined fromradio and N-band (12 µm) observations (Norris & Forbes1995, Lira & Ward 2002), although a much smaller peak isdetermined from NICMOS data at 2.2 µm (section 6.1.1).MLH have shown that between 5 × 1039 and 5 × 1040 ergss−1 could be produced by IC scattering in each nucleus inthe 2-10 keV band.
If IC scattering does take place, the power law spec-tra of the radio and X-ray emission are expected to havethe same slope, since the index of the power law distribu-tion of the electron energies (n) determines the output spec-trum for Synchrotron and IC radiation in the same man-ner (α = (n − 1)/2, where α is the power-law energy indexof the out-coming spectra). From the radio observations ofNGC3256 (Norris & Forbes 1995) we find that the power-law index of the radio emission in the nuclei has α ∼ 0.8.This value is inconsistent with the X-ray index observed inthe northern nucleus power law (α = Γ− 1 ∼ 1.2− 2.4 - seeTable 2). More realistic errors, with 3 parameters of interestfor a 90% CL (ie, ∆χ2 = 6.3) imply that α ∼ 1−2.8, with alower limit closer to the value of the radio index. No detailedcomparison can be made for the southern nucleus, althoughthe (poorly constrained) range of power-law indices derivedin section 3.2 is consistent with the observed radio slope.Therefore, IC emission cannot be dismissed as a possibly sig-nificant component of the observed hard luminosities fromboth nuclei, although this emission can also be explainedsolely by the output from accretion driven sources, and inparticular, by the presence of super-Eddington sources.
c© 0000 RAS, MNRAS 000, 000–000
18 Lira etal.
7 CONCLUSIONS AND SUMMARY
Until recently, the detailed study of the diffuse emission andpoint source population in starburst galaxies has been a diffi-cult task. The poor spatial resolution and limited wavelengthcoverage of X-ray missions prior to Chandra have resultedin an incomplete picture. Einstein and ROSAT images wereable to detect a diffuse component and resolve some of thepoint sources in several starburst galaxies, but their narrowspectral energy range gave only partial information on thecomplex multi-components making up the emission. Satel-lites with wider spectral coverage (ASCA, BeppoSAX ), wereable to study the X-ray emission of starburst galaxies upto harder energies, but their extremely low spatial resolu-tion gave little or no information about the different spatialcomponents. This situation is now changing dramatically asChandra data for starburst galaxies become available.
In this paper we have presented a detailed spatial andspectral analysis of Chandra observations of the IR lumi-nous merger system, NGC3256. Our main results can besummarized as follows:
(1) The total absorption corrected luminosity of thegalaxy over the 0.5-10 keV energy range is Lx ∼ 9×1041 ergss−1 (∼ 50% of the luminosity inferred from previous ASCA
observations due to the different adopted models). A sig-nificant fraction (∼ 80%) of the X-ray emission is detectedas diffuse emission. Fourteen compact sources are detected,with absorption corrected luminosities between ∼ 1039 and∼ 1041 ergs s−1. The X-ray spectra of the diffuse emission ispredominantly soft, while the discrete sources exhibit char-acteristically harder spectra.
(2) Both galaxy nuclei are clearly detected in X-rays.The northern nucleus is spatially resolved (FWHM >∼ 270pc) and it corresponds to the brightest source, with a cor-rected luminosity of ∼ 1 × 1041 ergs s−1 in the 0.5-10 keVrange. The southern nucleus is a heavily obscured sourceand with an intrinsic luminosity ∼ 3− 4× 1040 ergs s−1. Noclear evidence is found for the presence of an AGN in thesouthern nucleus.
(3) All the detected discrete sources have luminosi-ties one order of magnitude above the Eddington limit fora ∼ 1M⊙ accreting neutron star. No doubt fainter pointsources are present but are below the sensitivity thresholdof our observations. No variability was detected in any of thesources found in NGC3256 and therefore, we were unable toconstrain the luminosity of individual sources. However, in-trinsically powerful sources (Lx >∼ 1039 ergs s−1) are verylikely to be present.
(4) The diffuse emission has a soft spectrum which canbe described as the superposition of two thermal plasmacomponents with temperatures T ∼ 0.6, 0.9 keV plus aharder tail with Γ ∼ 3. Tentative evidence is found from spa-tially resolved spectra for a trend in the extinction and thetemperature of the thermal plasma to decrease with largerradial distances from the nuclear region, in agreement withobservations of other starburst galaxies and with wind mod-els.
(5) The morphology of the diffuse emission and the lo-cation of the discrete sources show a good correlation withoptical and Hα images. The extinction determined from theX-rays is in good agreement with the values derived fromoptical and infrared NICMOS data.
(6) While the thermal components in the diffuse emis-sion can be explained in terms of the mass and energy depo-sition by the nuclear starburst, the observed hard tail is bestexplained by a combination of a population of faint pointsources and hot plasma emission from young SNRs. InverseCompton scattering could still be important in explainingthe hard X-rays seen in the two nuclei.
ACKNOWLEDGEMENTS
We thank Pepi Fabbiano for kindly making available re-sults from Chandra observations on the Antennae galaxy.The archival data are based on observations made withESO Telescopes at the La Silla under programme ID 51.2-0036 and on observations made with the NASA/ESA Hub-ble Space Telescope, obtained from the data archive at theSpace Telescope Institute. STScI is operated by the associ-ation of Universities for Research in Astronomy, Inc. underthe NASA contract NAS 5-26555. This work was supportedby CXC grant GO1-2116X. AZ acknowledges support byNASA contract NAS8-39073 (CXC). Data were reduced us-ing Starlink facilities.
REFERENCES
Alonso-Herrero A., Rieke M.J., Rieke G.H. & Scoville N.Z., 2000,ApJ, 532, 845
Awaki H., Ueno S., Koyama K., Tsuru T. & Iwasawa K., 1996,PASJ, 48, 409
Barret D., 2001, AdSpR, in press (astro-ph/0101295)Bregman J.N. & Pildis R.A., 1992, ApJ, 398 L107
Cardelli J.A., Clayton G.C. & Mathis J.S., 1989, ApJ 345 245Chevalier R.A. & Clegg, A.W., 1985, Nat, 317, 44
Colbert E.J.M & Mushotzky R.F., 1999, ApJ 519 89della Ceca R., Griffiths R.E. & Heckman T.M., 1997, ApJ, 485,
581
Doyon R., Joseph R.D. & Wright G.S., 1994, ApJ, 421, 101Ebeling H., White D.A. & Rangarajan F.V.N., 1999, MNRAS,
acceptedElvis M., Wilkes B.J., McDowell J.C., Green R.F., Bechtold J.,
Willner S.P., Oey M.S., Polomski E. & Cutri R., 1994, ApJSS,95 1
Fabbiano G., 1989, ARA&A, 87, 27Fabbiano G., Zezas A. & Murray S.S, 2001, ApJ, 554, 1035
Gehrels N., 1986, ApJ, 303, 336Genzel R., Lutz D., Sturm E., Egami E., Kunze D., Moor-
wood A.F.M., Rigopoulou D., Spoon H.W.W., Sternberg A.,Tacconi-Garman L.E., Tacconi L. & Thatte N., 1998, ApJ,498, 579
George I.M., Turner T.J., Netzer H., Nandra K., Mushotzky R.F.& Yaqoob T., 1998, ApJSS, 114, 73
Glass I.S. & Moorwood A.F.M., 1985, MNRAS, 214, 429
Graham J.R., Wright G.S., Meikle W.P.S., Joseph R.D. & BodeM.F., 1984, Nature, 310, 213
Griffiths R.E., Ptak A., Feigelson E.D., Garmire G., Townsley L.,Brandt W.N., Sambruna R. & Bregman J.N., 2000, Science,290, 1325
Heckman T.M., Armus L. & Miley G.K., 1990, ApJSS, 74, 833Heckman T.M., Dahlem M., Eales S.A., Fabbiano G. & Weaver
K., 1996, ApJ, 457, 616Heckman T.M., Armus L., Weaver K.A. & Wang J., 1999, ApJ,
517, 130
Helfand D.J. & Moran E.C., 2001, ApJ, 554, 27
c© 0000 RAS, MNRAS 000, 000–000
Chandra Observations of NGC3256 19
Helou G., Khan I.R., Malek L. & Boehmer L., 1988, ApJSS, 68,
151Ho L.C., 1999, ApJ, 516, 672
Hummel E. & van der Hulst J.M., 1986, A&A, 155, 151
Iwasawa K., Fabian A.C., Almaini O., Lira P., Lawrence A.,Hayashida K. & Inoue H., 2000, MNRAS, 318, 879
Joseph R.D. & Wright G.S., 1985, MNRAS, 214, 87
Kaaret P., Prestwich A.H., Zezas A., Murray S.S., Kim D.-W.,Kilgard R.E., Schlegel E.M. & Ward M.J., 2001, MNRAS,321, L29
Kotilainen J.K., Moorwood A.F.M., Ward M.J. & Forber D.A.,1996, A&A, 305, 107
Lıpari S., Dıaz R., Taniguchi Y., Terlevich R., Dottori H. & Car-ranza G., 2000, AJ, 120, 645
Lıpari S., Sanders D., Terlevich R., Veilleux S., Diaz R., TaniguchiY., Zheng W., Kim D., Tsvetanov Z., Carranza G. & DottoriH., 2001 (astro-ph/0007316)
Lira P., Lawrence A. & Johnson R.A., 2000, MNRAS, 319, 17
Lutz D., Veilleux S. & Genzel R., 1999, ApJL, 517, L13
Maiolino R., Salvati M., Bassani L., Dadina M., della Ceca R.,Matt G., Risaliti G. & Zamorani G., 1998, A&A, 338, 781
Matt G., Fabian A.C., Guainazzi M., Iwasawa K., Bassani L. &Malaguti G., 2000, MNRAS, 318, 173
Mengel S., Lehnert M.D., Thatte N., Tacconi-Garman L.E. &Genzel R., 2001, ApJ, in press
Moorwood A.F.M. & Oliva E., 1994, ApJ, 429, 602Moran E.C., Lehnert M.D. & Helfand D.J., 1999, ApJ, 526, 649
(MLH)
Mukai K., 1993, Legacy, 3, 21
Neff S.G. & Ulvestad J.S., 2000, AJ, 120, 670
Norris R.P. & Forbes D.A., 1995, ApJ, 446, 594Pietsch W., Vogler A., Klein U. & Zinnecker H., 2000, A&A, 360,
24
Pietsch W., Roberts T.P., Sako M., Freyberg M.J., Read A.M.,Borozdin K.N., Branduardi-Raymont G., Cappi M., Ehle M.,Ferrando P., Kahn S.M., Ponman T.J., Ptak A., Shirey R.E.& Ward M., 2001, A&AL, 365, L174
Ptak A., Serlemitsos P., Yaqoob T. & Mushotzky R.F., 1999,ApJSS, 120, 179
Ptak A., Serlemitsos P., Yaqoob T., Mushotzky R.F. & Tsuru,T., 1997, AJ, 113, 1286
Rigopoulou D., Lutz D., Genzel R., Egami E., Kunze D., SturmE., Feuchtgruber H., Schaeidt S., Bauer O.H., Sternberg A.,Netzer H., Moorwood A.F.M. & de Graauw T., 1996, A&A,315, L125
Roberts T.P. & Warwick R.S., 2000, MNRAS, 315, 98
Rybicki G.B. & Lightman A.P., 1979, Radiative processes in as-trophysics, Wiley-Interscience
Sanders D.B. & Mirabel I.F., 1996, ARA&A, 34, 749Sanders D.B., Soifer B.T., Elias J.H., Madore B.F., Matthews K.,
Neugebauer G.& Scoville N.Z., 1988, ApJ, 325, 74
Schmitt H.R., Kinney A.L., Calzetti D. & Storchi Bergmann T.,1997, AJ, 114 592
Stanford S.A., Sargent A.I., Sanders D.B. & Scoville N.Z., 1990,ApJ, 349, 492
Strickland D.K., 2001, in Chemical Enrichment of the ICM andIGM (astro-ph/0107116)
Strickland D.K., Ponman T.J. & Stevens I.R., 1997, A&A, 320,378
Strickland D.K., Heckman T.M., Weaver K.A. & Dahlem M.,2000, AJ, 120, 2965
Suchkov A.A., Berman V.G., Heckman T.M. & Balsara D.S.,1996, ApJ, 463, 528
Wang Q.D., 1999, ApJL, 510, L139
Ward M.J., etal, 2001, in preparation
White N.E., Nagase F. & Parmar A.N., 1995, in Lewin W.H.G.,van Paradijs J. & van der Heuvel E.P.J., eds, X-ray Binaries,Cambridge University Press, p.1
Zepf S.E., Ashman K.M., English J., Freeman K.C. & Sharples
R.M., 1999, AJ, 118, 752Zezas A. etal, 2001, in preparation
c© 0000 RAS, MNRAS 000, 000–000

This figure "fig1a.jpg" is available in "jpg" format from:
http://arXiv.org/ps/astro-ph/0109198v2

This figure "fig1b.jpg" is available in "jpg" format from:
http://arXiv.org/ps/astro-ph/0109198v2

This figure "fig6.jpg" is available in "jpg" format from:
http://arXiv.org/ps/astro-ph/0109198v2

This figure "fig10a.jpg" is available in "jpg" format from:
http://arXiv.org/ps/astro-ph/0109198v2

This figure "fig10b.jpg" is available in "jpg" format from:
http://arXiv.org/ps/astro-ph/0109198v2

This figure "fig12a.jpg" is available in "jpg" format from:
http://arXiv.org/ps/astro-ph/0109198v2

This figure "fig12b.jpg" is available in "jpg" format from:
http://arXiv.org/ps/astro-ph/0109198v2