cbic 201402109 sm miscellaneous information
TRANSCRIPT

Supporting Information� Copyright Wiley-VCH Verlag GmbH & Co. KGaA, 69451 Weinheim, 2014
Biosynthesis of Nudicaulins: A 13CO2-Pulse/Chase LabelingStudy with Papaver nudicauleEvangelos C. Tatsis,[a] Eva Eylert,[b] Ravi Kumar Maddula,[a] Elena Ostrozhenkova,[b]
Ales Svatos,[a] Wolfgang Eisenreich,[b] and Bernd Schneider*[a]
cbic_201402109_sm_miscellaneous_information.pdf

SI. 2
Table of contents
Table of contents..................................................................................................................................2
List of figures .......................................................................................................................................3
List of tables.........................................................................................................................................6
S1. Isotopologue Profiling ...................................................................................................................7
S2. Spectroscopic data of kaempferol-3-O-β-sophoroside-7-O-β-glucoside (3) isolated from flowers
of Papaver nudicaule plants after the 13CO2 labeling experiment.......................................................9
S3. Spectroscopic data of nudicaulin I (1) isolated from flowers of Papaver nudicaule plants after
the 13CO2 labeling experiment. ..........................................................................................................29
S4. Reconstruction of biosynthetic pathways, retrodictive/predictive comparative analysis ............52

SI. 3
List of figures
Figure S1. Structure of compound 3 ....................................................................................................9
Figure S2. ESI-MS spectrum of 3 obtained from the pulse-chase labeling experiment using 13CO2 as a tracer.............................................................................................................................11
Figure S3. ESI-MS spectrum of 3 at natural abundance....................................................................12
Figure S4. 1H NMR spectrum (500 MHz, CD3OD) of kaempferol-3-O-β-sophoroside-7-O-β-glucoside (3) obtained from the pulse-chase labeling experiment using 13CO2 as a tracer..........................................................................................................................................13
Figure S5. 13C NMR spectrum (125 MHz, CD3OD) of kaempferol-3-O-β-sophoroside-7-O-β-glucoside (3) obtained from the pulse-chase labeling experiment using 13CO2 as a tracer..........................................................................................................................................13
Figure S6. Selected region of the H-2'/6' signal of the 1H NMR spectrum (500 MHz, CD3OD) of kaempferol-3-O-β-sophoroside-7-O-β-glucoside (3) isolated from Papaver nudicaule after pulse-chase labeling experiment with 13CO2. The 1H-13C spin-spin coupling satellites and coupling constants are indicated. ..............................................................14
Figure S7. 13C NMR signals (125 MHz, CD3OD) of C-2 and C-5 of 3 obtained from the pulse-chase labeling experiment using 13CO2 as a tracer. ..................................................................17
Figure S8. 13C NMR signal (125 MHz, CD3OD) of C-3 of 3 obtained from the pulse-chase labeling experiment using 13CO2 as a tracer. ................................................................................18
Figure S9. 13C NMR signal (125 MHz, CD3OD) of C-4 of 3 obtained from the pulse-chase labeling experiment using 13CO2 as a tracer. ................................................................................19
Figure S10. 13C NMR signals (125 MHz, CD3OD) of C-6, C-1´´ and C-1´´´´ of 3 obtained from the pulse-chase labeling experiment using 13CO2 as a tracer................................................20
Figure S11. 13C NMR signal (125 MHz, CD3OD) of C-7 of 3 obtained from the pulse-chase labeling experiment using 13CO2 as a tracer. ..................................................................21
Figure S12. 13C NMR signal (125 MHz, CD3OD) of C-8 of 3 obtained from the pulse-chase labeling experiment using 13CO2 as a tracer. ..................................................................22
Figure S13. 13C NMR signals (125 MHz, CD3OD) of C-9 and C-4´ of 3 obtained from the pulse-chase labeling experiment using 13CO2 as a tracer..........................................................23
Figure S14. 13C NMR signal (125 MHz, CD3OD) of C-10 of 3 obtained from the pulse-chase labeling experiment using 13CO2 as a tracer. ..................................................................23
Figure S15. 13C NMR signal (125 MHz, CD3OD) of C-1´ of 3 obtained from the pulse-chase labeling experiment using 13CO2 as a tracer. ..................................................................24
Figure S16. 13C NMR signal (125 MHz, CD3OD) of C-2´/6´ of 3 obtained from the pulse-chase labeling experiment using 13CO2 as a tracer. ..................................................................25
Figure S17. 13C NMR signal (125 MHz, CD3OD) of C-3´/5´ of 3 obtained from the pulse-chase labeling experiment using 13CO2 as a tracer. ..................................................................26
Figure S18. 13C NMR signal (125 MHz, CD3OD) of C-1´´´ of 3 obtained from the pulse-chase labeling experiment using 13CO2 as a tracer. ..................................................................27
Figure S19. 13C NMR signals (125 MHz, CD3OD) of C-2´´´ and C-2´´´´ of 3 obtained from the pulse-chase labeling experiment using 13CO2 as a tracer................................................28
Figure S20. Structure of compound 1 ................................................................................................29
Figure S21. ESI-MS spectrum of 1 obtained from the pulse-chase labeling experiment using 13CO2 as a tracer.........................................................................................................................31
Figure S22. ESI-MS spectrum of 1 at natural abundance..................................................................32

SI. 4
Figure S23. 1H NMR spectrum (500 MHz, CD3OD) of nudicaulin I (1) obtained from the pulse-chase labeling experiment using 13CO2 as a tracer..........................................................33
Figure S24. 13C NMR spectrum (125 MHz, CD3OD) of nudicaulin I (1) obtained from the pulse-chase labeling experiment using 13CO2 as a tracer. The 13C signals of TFA are marked in orange and the most downfield line of the 13C signal of MeOH is marked in red......33
Figure S25. 1H,13C-HSQC spectrum (500 MHz, CD3OD) of nudicaulin I (1) obtained from the pulse-chase labeling experiment using 13CO2 as a tracer................................................34
Figure S26. 1H,13C-HMBC spectrum (500 MHz, CD3OD) of nudicaulin I (1) obtained from the pulse-chase labeling experiment using 13CO2 as a tracer................................................35
Figure S27. Selected region of 1H NMR spectrum (500 MHz, CD3OD) of nudicaulin I (1) isolated from Papaver nudicaule after pulse-chase labeling experiment with 13CO2.
1H-13C spin-spin coupling satellites and the coupling constant are indicated.....................................36
Figure S28. 13C NMR signal (125 MHz, CD3OD) of C-2 of 1 obtained from the pulse-chase labeling experiment using 13CO2 as a tracer. ..................................................................40
Figure S29. 13C NMR signal (125 MHz, CD3OD) of C-3 of 1 obtained from the pulse-chase labeling experiment using 13CO2 as a tracer. ..................................................................40
Figure S30. 13C NMR signals (125 MHz, CD3OD) of C-4 and C-1´´´´ of 1 obtained from the pulse-chase labeling experiment using 13CO2 as a tracer..........................................................41
Figure S31. 13C NMR signal (125 MHz, CD3OD) of C-5 of 1 obtained from the pulse-chase labeling experiment using 13CO2 as a tracer. ..................................................................41
Figure S32. 13C NMR signals (125 MHz, CD3OD) of C-6 and C-1´´ of 1 obtained from the pulse-chase labeling experiment using 13CO2 as a tracer..........................................................42
Figure S33. 13C NMR signals (125 MHz, CD3OD) of C-7 and C-9 of 1 obtained from the pulse-chase labeling experiment using 13CO2 as a tracer..........................................................42
Figure S34. 13C NMR signal of C-8 (125 MHz, CD3OD) of 1 obtained from the pulse-chase labeling experiment using 13CO2 as a tracer. ..................................................................43
Figure S35. 13C NMR signals (125 MHz, CD3OD) of C-11 and C-16 of 1 obtained from the pulse-chase labeling experiment using 13CO2 as a tracer..........................................................43
Figure S36. 13C NMR signals (125 MHz, CD3OD) of C-12 and C-4´ of 1 obtained from the pulse-chase labeling experiment using 13CO2 as a tracer..........................................................44
Figure S37. 13C NMR signals (125 MHz, CD3OD) of C-13 and C-17 of 1 obtained from the pulse-chase labeling experiment using 13CO2 as a tracer..........................................................44
Figure S38. 13C NMR signals (125 MHz, CD3OD) of C-14 and C-1´ of 1 obtained from the pulse-chase labeling experiment using 13CO2 as a tracer..........................................................45
Figure S39. 13C NMR signal (125 MHz, CD3OD) of C-15 of 1 obtained from the pulse-chase labeling experiment using 13CO2 as a tracer. ..................................................................45
Figure S40. 13C NMR signals (125 MHz, CD3OD) of C-18 and C-3´/5´ of 1 obtained from the pulse-chase labeling experiment using 13CO2 as a tracer................................................46
Figure S41. 13C NMR signals (125 MHz, CD3OD) of C-19 of 1 obtained from the pulse-chase labeling experiment using 13CO2 as a tracer. ..................................................................47
Figure S42. 13C NMR signal (125 MHz, CD3OD) of C-2´/6´ of 1 obtained from the pulse-chase labeling experiment using 13CO2 as a tracer. ..................................................................47
Figure S43. 13C NMR signal (125 MHz, CD3OD) of C-1´´´ of 1 obtained from the pulse-chase labeling experiment using 13CO2 as a tracer. ..................................................................48
Figure S44. 13C NMR signal (125 MHz, CD3OD) of C-2´´ of 1 obtained from the pulse-chase labeling experiment using 13CO2 as a tracer. ..................................................................48

SI. 5
Figure S45. 13C NMR signals (125 MHz, CD3OD) of C-2´´´´ and C-5´´´´ of 1 obtained from the pulse-chase labeling experiment using 13CO2 as a tracer................................................49
Figure S46. 13C NMR signal (125 MHz, CD3OD) of C-3´´´´ of 1 obtained from the pulse-chase labeling experiment using 13CO2 as a tracer. ..................................................................50
Figure 47. 13C NMR signals (125 MHz, CD3OD) of C-4´´, C-4´´´ and C-4´´´´ of 1 obtained from the pulse-chase labeling experiment using 13CO2 as a tracer................................................51
Figure S48. 13C NMR signals (125 MHz, CD3OD) of C-6´´, C-6´´´ and C-6´´´´ of 1 obtained from the pulse-chase labeling experiment using 13CO2 as a tracer..........................................51
Figure S49. Reconstruction of the pentose phosphate pathway from the experimentally assessed isotopologue profile of glucose based on the deconvolution of 13C NMR signals of glucose C of 1. The labeling patterns of the above mentioned intermediates were predicted on the basis of standard biosynthetic routes in plants. Multiple 13C-labeled isotopologues are indicated by bars connecting 13C-atoms within the same molecule. 13C2 isotopologues are marked in cyan colored bars and the 13C3 isotopologues are marked in crimson colored bars. The numbers indicate the % molar abundances of the corresponding isotopologues. The widths of the bars also reflect the % molar abundances of the isotopologues.....................................................................................52
Figure S50. Reconstruction of the shikimate pathway based on predicted labeling pattern of erythrose-4-phosphate (E4P) (as shown in Figure S50) and inferred labeling pattern (as concluded from isotopologue profile of 3) of phosphoenol pyruvate (PEP). The labeling patterns of shikimate pathway intermediates were predicted on the basis of established biosynthetic routes in plants. Multiple 13C-labeled isotopologues are indicated by bars connecting 13C-atoms within the same molecule. The 13C isotopologues of E4P origin are marked by red color bars and the 13C isotopologues of PEP origin are marked in blue and green color bars. The numbers indicate the % molar abundances of the corresponding isotopologues. The widths of the bars also reflect the % molar abundances of the isotopologues. (b) The experimentally determined labeling pattern of aromatic ring B of 3 and rings d and f of 1 with shikimate origin..................................53
Figure S51. (a) Reconstruction of the indole biosynthetic pathway. The labeling pattern of ribose-5-phosphate was based on predicted labeling pattern as shown in Figure S50. The labeling pattern of anthranilic acid was based on predicted labeling pattern as shown in Figure S51. The labeling patterns of shikimate pathway intermediates were predicted on the basis of established biosynthetic routes in plants. (b) Predicted labeling pattern of nudicaulin I (1) aglycon based on reconstruction of biosynthetic pathways of indole (a) and flavonoids (d). (c) Experimentally determined labeling pattern of nudicaulin I (1) aglycon as derived by deconvolution of 13C NMR signals. (d) Reconstruction of flavonoid biosynthetic pathway based on experimentally determined labeling pattern of kaempferol derivative (3) as derived by deconvolution of 13C NMR signals. Multiple 13C-labeled isotopologues are indicated by bars connecting 13C-atoms within the same molecule. The numbers indicate the % molar abundances of the corresponding isotopologues in mol%. The widths of the bars also reflect the % molar abundances of the isotopologues.............................................................................................................56

SI. 6
List of tables
Table S1. ESI-MS data of 3 obtained from the pulse-chase labeling experiment using 13CO2 as a tracer. For spectrum, see Figure S2.................................................................................10
Table S2. ESI-MS data of 3 at natural abundance. For spectrum, see Figure S3. .............................11
Table S3. 1H and 13C NMR spectroscopic data (500 MHz for 1H; 125 MHz for 13C; CD3OD) of kaempferol-3-O-ß-sophoroside-7-O-ß-glucoside (3) with 13C abundances obtained from the pulse-chase labeling experiment using 13CO2 as a tracer..........................................15
Table S4. ESI-MS data of 1 obtained from the pulse-chase labeling experiment using 13CO2 as a tracer. For spectrum, see Figure S21...............................................................................30
Table S5. ESI-MS data of 1 at natural abundance. For spectrum, see Figure S22. ...........................31
Table S6. 1H and 13C NMR spectroscopic data (500 MHz for 1H; 125 MHz for 13C; CD3OD) of nudicaulin I (1) with 13C abundances obtained from the pulse-chase labeling experiment using 13CO2 as a tracer. ...................................................................................................37

SI. 7
S1. Isotopologue Profiling
The isotopologue analysis was carried out as previously reported.[1] The metabolites 1 and 3 were
isolated by HPLC as has been described in the Experimental Section. The assignment of 13C NMR
signals of compounds 1 and 3 [2] was confirmed by 1D and 2D NMR experiments. 13C NMR spectra
of 1 and 3 obtained from labeled samples and 13C NMR spectra of natural 13C abundance
compounds 1 and 3 were measured under identical spectroscopic conditions. The relative 13C
abundance of each carbon was determined by comparing the signal intensities of the biosynthetic
samples with the signals of samples of natural 13C abundance. Absolute 13C abundances were
determined from 1H-13C spin-spin coupling satellites in the 1H NMR spectra (Figures S5 and S25).
Then the relative 13C abundances were calibrated to the absolute values. The multiple-labeled
isotopologues were quantified from the corresponding 13C-13C spin-spin coupling satellite signals in
the 13C NMR spectra. The integral of each respective satellite pair was then calibrated to the total
signal integrals of a given carbon atom (%13C13C in Tables S3 and S6). From the overall 13C
abundances, the molar contribution of specific isotopologues was then assessed (Tables S3 and S6).
The abundance of multiply labeled metabolites was dramatically increased due to the labeling
experiments with 13CO2, where universally 13C-labeled photosynthates were produced and further
metabolized to primary metabolites. Isotopologues carrying blocks of two or more adjacent 13C
atoms give rise to 13C-13C spin-spin coupling satellites whereas the single labeled isotopologues
give rise to the central signal line. Therefore, the signals of analyzed metabolites, derived from the
labeling experiments, appeared as overlayed signals with a large central signal line and one or more
pairs of satellite signals. The multiplets represent building blocks of the carbon skeleton and reflect
the biosynthetic history and especially the formation or breaking of C-C bonds. The 13C multiplets
1 (a) Eisenreich, W.; Bacher, A. Gen. 22, 121–153 edited by J.K. Setlow, Kluwer Academic/Plenum Publishers, 2000. (b) Römisch-Margl, W.; Schramek, N.; Radykewicz, T.; Ettenhuber, C.; Eylert, E.; Huber, C.; Römisch-Margl, L.; Schwarz, C.; Dobner, M.; Demmel, N.; Winzenhörlein, B.; Bacher, A.; Eisenreich, W. Phytochemistry 2007, 68, 2273–2289. (c) Ostrozhenkova, E.; Eylert, E.; Schramek, N.; Golan-Goldhirsh, A.; Bacher, A.; Eisenreich, W. Phytochemistry 2007, 68, 2816–2824. (c) Schramek, N.; Wang, H.; Römisch-Margl, W.; Keil, B.; Radykewicz, T.; Winzenhörlein, B.; Beerhues, L.; Bacher, A.; Rohdich, F.; Gershenzon, J.; Liu, B.; Eisenreich, W. Phytochemistry 2010, 71, 179–187. 2 (a) Tatsis, E.C.; Schaumlöffel, A.; Warskulat, A.C.; Massiot, G.; Schneider, B.; Bringmann, G. Org. Lett. 2013, 15, 156–159. (b) Tatsis, E.C.; Böhm, W.; Schneider, B. Phytochemistry 2013, 92, 105–112.

SI. 8
represent different levels of complexity due to the presence of molecular species carrying one, two,
three or even four 13C atoms. Practically that means that different multiply 13C labeled
isotopologues could be distinguished on the basis of characteristic NMR signatures. The relative
intensity of signal integrals corresponds to molar abundance of each isotopologue.
Example 1. The signal of C-1´ (122.7) of 3 (Figure S15) consists of the central signal line,
which represents the [1´-13C1]-isotopologue, and the pair of satellites (JC-1´–C-2´ = 59 Hz) due
to the co-presence of 13C atoms at position C-1´ and C-2´ ([1´,2´-13C2]-isotopolugue). The
contribution to the total signal of C-1´ is 56.2% for [1´-13C1]-isotopologue and 43.8% for
[1´,2´-13C2]-isotopologue.
Example 2. In the aromatic ring B of 3, the signal of C-4´ ( 161.7) (Figure S13) appears as
an overlay of the doublet of doublets of the [3´,4´,5´-13C3]-isotopologue (JC-4´–C-3´ = JC-4´–C-5´ =
64 Hz) and the congruent doublets of the [4´,3´-13C2]- and [4´,5´-13C2]-isotopologues. The
[4´,5´,6´-13C3]-isotopologue was identified from its 13C-13C spin-spin couplings of 1JC-4´–C-5´ =
64 Hz and 2J C4´–C6´ = 7 Hz.
Example 3. The signal pattern which is observed for C-3 of 3 comprises nine lines of
significant intensities (Figure S8). The deconvolution of this complex signal patterns for each
individual isotopologue was achieved by taking into account the coupling constants as well as
the chemical shift increments. The central signal line (135.2) represents the [3-13C1]-
isotopologue, while the two flanking signal lines shown in red beneath the spectrum with
coupling constant 89 Hz are the result of 13C-13C spin-spin coupling between the observed C-
3 and the adjacent C-2. Hence, that doublet represents the [2,3-13C2]-isotopologue. The other
doublet satellite pair with JC–C = 65 Hz shown in blue beneath the spectrum arose from the
[3,4-13C2]-isotopologue. The double doublet pattern with coupling constants J = 89 Hz (red)
and J = 65 Hz (blue) is the result of the presence of simultaneous 13C labeling at C-2, C-3 and
C-4, corresponding to the [2,3,4-13C3]-isotopologue. The integration of signals assigned to
different isotopologues resulted in their relative abundances.

S2. Spectroscopic data of kaempferol-3-O-β-sophoroside-7-O-β-glucoside (3)
isolated from flowers of Papaver nudicaule plants after the 13CO2 labeling
experiment.
Figure S1. Structure of compound 3
SI. 9

SI. 10
Table S1. ESI-MS data of 3 obtained from the pulse-chase labeling experiment using 13CO2 as a
tracer. For spectrum, see Figure S2.
m/z Intensity Relative intensity
773.22 76257.9 100.00
774.22 44039.7 57.75
775.22 25447.1 33.37
776.22 14523.5 19.05
777.23 8581.4 11.25
778.23 6489.7 8.51
779.23 4496.2 5.90
780.24 3205.2 4.20
781.24 2064.8 2.71
782.24 1801.2 2.36
783.25 1170.8 1.54
784.25 842.8 1.11
785.25 826.9 1.08
786.26 483.4 0.63
787.26 425 0.56
788.27 242.3 0.32
789.27 257.3 0.34
790.27 185.1 0.24
791.27 91.4 0.12
Calculated total 13C enrichment: 5.73%

Figure S2. ESI-MS spectrum of 3 obtained from the pulse-chase labeling experiment using 13CO2 as
a tracer.
Table S2. ESI-MS data of 3 at natural abundance. For spectrum, see Figure S3.
m/z Intensity Relative intensity
773.22 2237543 100
774.22 843528.4 37.7
775.22 249382.7 11.15
776.22 50135.6 2.24
777.23 3924.2 0.18
SI. 11

Figure S3. ESI-MS spectrum of 3 at natural abundance.
SI. 12

Figure S4. 1H NMR spectrum (500 MHz, CD3OD) of kaempferol-3-O-β-sophoroside-7-O-β-
glucoside (3) obtained from the pulse-chase labeling experiment using 13CO2 as a tracer.
Figure S5. 13C NMR spectrum (125 MHz, CD3OD) of kaempferol-3-O-β-sophoroside-7-O-β-
glucoside (3) obtained from the pulse-chase labeling experiment using 13CO2 as a tracer.
SI. 13

Figure S6. Selected region of the H-2'/6' signal of the 1H NMR spectrum (500 MHz, CD3OD) of
kaempferol-3-O-β-sophoroside-7-O-β-glucoside (3) isolated from Papaver nudicaule after pulse-
chase labeling experiment with 13CO2. The 1H-13C spin-spin coupling satellites and coupling
constants are indicated.
SI. 14

Table S3. 1H and 13C NMR spectroscopic data (500 MHz for 1H; 125 MHz for 13C; CD3OD) of kaempferol-3-O-ß-sophoroside-7-O-ß-glucoside (3) with 13C abundances obtained from the pulse-chase labeling experiment using 13CO2 as a tracer.
Position 1H NMR 13C NMR Coupling constants 13C and isotopologue abundances
δ, mult., J (Hz) δ JCC (Hz) [coupled C]a % 13Cb % 13C13Cc [coupled C]a % mol isotopologues d
Aglycone
2 159.4 89 [3], 6 [4] 5.2 32.0 [3 and 4] 19.3 [3]
1.7 [2, 3, 4] 1.0 [2, 3]
3 135.2 89 [2], 65 [4] 7.1 34.7 [2 and 4] 20.1 [2] 14.4 [4]
2.5 [2, 3, 4] 1.4 [2,3] 1.0 [3,4]
4 179.9 65 [3], 6 [2] 6.1 37.1 [2 and 3] 13.5 [3]
2.3 [2, 3, 4] 0.8 [3, 4]
5 158.0 72 [6], 64 [10] 5.2 47.3 [6 or 10] 2.5 [5, 6] or [5, 10] 6 6.51, d, 2.1 100.8 72 [5/7] 6.1 49.9 [5 or 7] 3.1 [5, 6] or [6, 7] 7 164.7 72 [6/8] 5.4 46.7 [6 or 8] 2.5 [7, 8] or [6, 7] 8 6.79, d, 2.1 95.7 72 [7/9] 5.5 47.1 [7 or 9] 2.6 [7, 8] or [8, 9] 9 162.8 72 [8], 64 [10] 5.5 47.4 [8 or 10] 2.6 [9, 10] or [8, 9] 10 107.6 64 [5/9] 5.2 49.4 [9 or 5] 2.5 [9, 10] or [5, 10] 1' 122.7 59 [2´] 5.7 43.8 [2´] 2.5 [1´, 2´]
2'/6' 8.10, d-like, 8.8 132.5 59 [1´/5´] 5.9 46.9 [2´ either 5´] 2. 8 [1´, 2´] and [5´, 6´] 3'/5' 6.92, d-like, 8.8 116.3 59 [6´], 64 [4´] 5.8 21.6 [4´ and 6´]
34.8 [4´ either 6´] 1.3 [4´, 5´, 6´] 2.0 [3´, 4´] and [4´, 5´] and [5´, 6´]
4' 161.7 64 [3´,5´], 7 [6´] 5.5 14.0 [3´ and 5´] 11.2 [5´ and 6´] 31.0 [3´ either 5´]
0.8 [3´, 4´, 5´] 0.6 [4´, 5´, 6´] 1.7 [3´, 4´] and [4´, 5´]
Glucose Ae
1'' 5.50, d, 7.6 100.8 47 [2´´] 6.7 54.5 [2´´] 3.7 [1´´,2´´] 2'' 3.76, dd, 7.6, 8.8 82.6 47 [1´´], 38 [3´´] 6.6 31.5 [1´´ and 3´´] 2.1 [1´´, 2´´, 3´´]
SI. 15

SI. 16
36.5 [1´´ either 3´´] 2.4 [1´´,2´´] and [2´´,3´´] 3'' 3.51, dd, 8.8 7.7 77.9 4'' 3.40 71.1 5'' 3.24 78.3 6a'' 3.49, dd, 5.2, 11.8 62.4 6b'' 3.95, dd, 11.8 1.8
Glucose Be
1''' 4.77, d, 7.50 104.8 46 [2´´´] 6.6 54.3 [2´´´] 3.6 [1´´´, 2´´´] 2''' 3.36 75.6 46 [1´´´], 39 [3´´´] 5.3 22.1 [1´´´ and 3´´´]
35.2 [1´´´ either 3´´´] 1.2 [1´´´, 2´´´, 3´´´] 1.9 [1´´,2´´] and [2´´,3´´]
3''' 3.55 78.2 4''' 3.36 71.2 5''' 3.31 78.2
6'''A 3.79, dd, 5.2, 12.1 62.5 6'''B 3.81, dd, 12.1, 2.0
Glucose Ce
1'''' 5.08, d, 7.35 101.5 47 [2´´´´] 6.5 54.7 [2´´´´] 3. 6 [1´´´´,2´´´´] 2'''' 3.51 74.6 47 [1´´´´], 39 [3´´´´] 5.4 21.9 [1´´´´ and 3´´´´]
36.1 [1´´´´ either 3´´´´] 1.2 [1´´´´, 2´´´´, 3´´´´] 2.0 [1´´´, 2´´´] and [2´´´, 3´]
3'''' 3.4 77.9 4'''' 3.38 71.2 5'''' 3.62 77.8
6''''A 3.52, dd, 6.8, 11.8 62.4 6''''B 3.93, dd, 11.8, 1.8
a The numbers in parentheses indicate the coupling partners. b 13C abundances of individual carbon atoms (%13C). c Relative contribution of a satellite pair to the overall 13C NMR signal integral of the indexed carbon atom. d Relative molar amounts of isotopologues were calculated as %13C × % 13C13C . Bracketed numbers indicate 13C atoms of the respective isotopologue. e Due to strongly overlapping 13C NMR signals, the 13C abundances of carbons of the glucose units were only partly identified.

Figure S7. 13C NMR signals (125 MHz, CD3OD) of C-2 and C-5 of 3 obtained from the pulse-chase
labeling experiment using 13CO2 as a tracer.
SI. 17

Figure S8. 13C NMR signal (125 MHz, CD3OD) of C-3 of 3 obtained from the pulse-chase labeling
experiment using 13CO2 as a tracer.
SI. 18

Figure S9. 13C NMR signal (125 MHz, CD3OD) of C-4 of 3 obtained from the pulse-chase labeling
experiment using 13CO2 as a tracer.
SI. 19

Figure S10. 13C NMR signals (125 MHz, CD3OD) of C-6, C-1´´ and C-1´´´´ of 3 obtained from the
pulse-chase labeling experiment using 13CO2 as a tracer.
SI. 20

Figure S11. 13C NMR signal (125 MHz, CD3OD) of C-7 of 3 obtained from the pulse-chase
labeling experiment using 13CO2 as a tracer.
SI. 21

Figure S12. 13C NMR signal (125 MHz, CD3OD) of C-8 of 3 obtained from the pulse-chase
labeling experiment using 13CO2 as a tracer.
SI. 22

Figure S13. 13C NMR signals (125 MHz, CD3OD) of C-9 and C-4´ of 3 obtained from the pulse-
chase labeling experiment using 13CO2 as a tracer.
Figure S14. 13C NMR signal (125 MHz, CD3OD) of C-10 of 3 obtained from the pulse-chase
labeling experiment using 13CO2 as a tracer.
SI. 23

Figure S15. 13C NMR signal (125 MHz, CD3OD) of C-1´ of 3 obtained from the pulse-chase
labeling experiment using 13CO2 as a tracer.
SI. 24

Figure S16. 13C NMR signal (125 MHz, CD3OD) of C-2´/6´ of 3 obtained from the pulse-chase
labeling experiment using 13CO2 as a tracer.
SI. 25

Figure S17. 13C NMR signal (125 MHz, CD3OD) of C-3´/5´ of 3 obtained from the pulse-chase
labeling experiment using 13CO2 as a tracer.
SI. 26

Figure S18. 13C NMR signal (125 MHz, CD3OD) of C-1´´´ of 3 obtained from the pulse-chase
labeling experiment using 13CO2 as a tracer.
SI. 27

Figure S19. 13C NMR signals (125 MHz, CD3OD) of C-2´´´ and C-2´´´´ of 3 obtained from the
pulse-chase labeling experiment using 13CO2 as a tracer.
SI. 28

S3. Spectroscopic data of nudicaulin I (1) isolated from flowers of Papaver
nudicaule plants after the 13CO2 labeling experiment.
Figure S20. Structure of compound 1
SI. 29

SI. 30
Table S4. ESI-MS data of 1 obtained from the pulse-chase labeling experiment using 13CO2 as a tracer. For spectrum, see Figure S21.
m/z Intensity Relative intensity
872.26 366411.4 100.00
873.26 249132.5 67.99
874.27 150715.8 41.13
875.27 86850.7 23.70
876.27 59723 16.30
877.28 40948.1 11.18
878.28 30583.4 8.35
879.28 21387.8 5.84
880.29 18765.2 5.12
881.29 14771.2 4.03
882.29 13744.6 3.75
883.3 11825.6 3.23
884.3 11218 3.06
885.3 9518.6 2.60
886.31 10499.3 2.87
887.31 6620.8 1.81
888.31 6817.5 1.86
889.32 6793.7 1.85
890.32 5451.1 1.49
891.33 2888 0.79
892.33 1682.7 0.46
893.33 1927.3 0.53
Calculated total 13C enrichment: 7.13%

Figure S21. ESI-MS spectrum of 1 obtained from the pulse-chase labeling experiment using 13CO2
as a tracer.
Table S5. ESI-MS data of 1 at natural abundance. For spectrum, see Figure S22.
m/z Intensity Relative intensity
872.26 2218932 100.00
873.27 1012388 45.63
874.27 318905.4 14.37
875.27 69779.9 3.14
876.27 5977.8 0.27
SI. 31

Figure S22. ESI-MS spectrum of 1 at natural abundance.
SI. 32
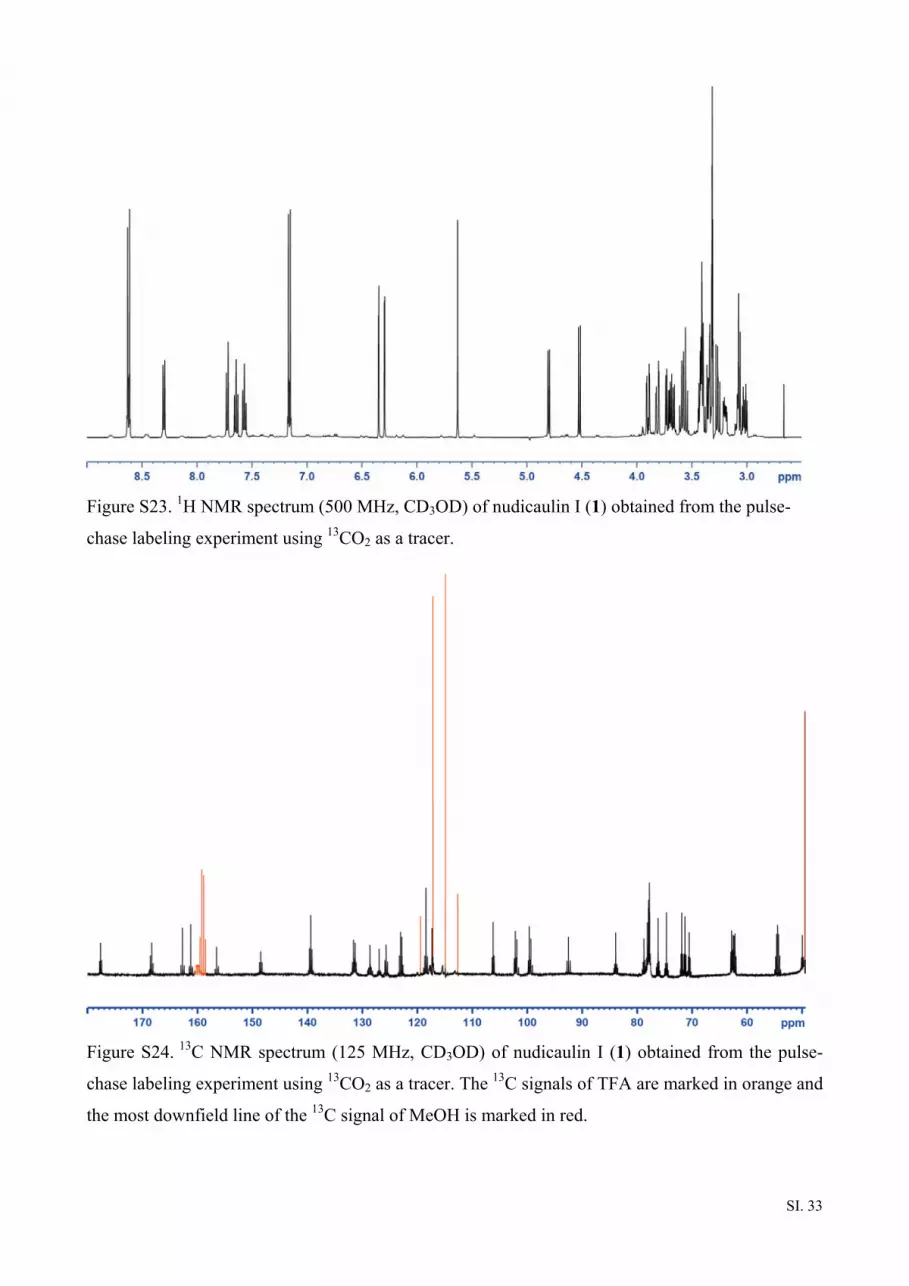
Figure S23. 1H NMR spectrum (500 MHz, CD3OD) of nudicaulin I (1) obtained from the pulse-
chase labeling experiment using 13CO2 as a tracer.
Figure S24. 13C NMR spectrum (125 MHz, CD3OD) of nudicaulin I (1) obtained from the pulse-
chase labeling experiment using 13CO2 as a tracer. The 13C signals of TFA are marked in orange and
the most downfield line of the 13C signal of MeOH is marked in red.
SI. 33

Figure S25. 1H,13C-HSQC spectrum (500 MHz, CD3OD) of nudicaulin I (1) obtained from the
pulse-chase labeling experiment using 13CO2 as a tracer.
SI. 34

Figure S26. 1H,13C-HMBC spectrum (500 MHz, CD3OD) of nudicaulin I (1) obtained from the
pulse-chase labeling experiment using 13CO2 as a tracer.
SI. 35

Figure S27. Selected region of 1H NMR spectrum (500 MHz, CD3OD) of nudicaulin I (1) isolated
from Papaver nudicaule after pulse-chase labeling experiment with 13CO2. 1H-13C spin-spin
coupling satellites and the coupling constant are indicated.
SI. 36

Table S6. 1H and 13C NMR spectroscopic data (500 MHz for 1H; 125 MHz for 13C; CD3OD) of nudicaulin I (1) with 13C abundances obtained from the pulse-chase labeling experiment using 13CO2 as a tracer.
No 1H NMR 13C NMR Coupling constant 13C and isotopologue abundances
δ, mult., J (Hz) δa JCC (Hz) [coupled C]b % 13Cc % 13C13Cd [coupled C]b % mol isotopologues e
Aglycon
2 177.5 48 [13] 9.5 49.4 [13] 4.7 [2, 13] 3 5.63, s 49.9 41 [11] 5.7 53.4 [11] 3.0 [3, 11] 4 101.8 77 [5], 63 [9] 4.8 47.0 2.2 [4, 5] or [4, 9] 5 156.4 77 [4], 66 [6] 5.5 49.9 2.7 [4, 5] or [5, 6] 6 6.33, d, 2.0 99.3 66 [5], 71 [7] 5.5 48.3 2.6 [6, 7] or [5, 6] 7 162.6 71 [6/8] 5.6 52.1 2.9 [6, 7] or [7, 8] 8 6.29, d, 2.0 92.4 71 [7/9] 5.6 50.8 2.8 [8, 9] or [7, 8] 9 161.1 71 [8], 63 [4] 6.0 48.4 2.9 [8, 9] or [4, 9] 11 126.9 41 [3], 53 [12] 5.0 33.1 [3, 12], 19.4 [12], 14.0 [3] 1.7 [3, 11, 12], 1.0 [11, 12], 0.7 [3, 11] 12 168.5 53 [11] 4.9 55.3 [11] 2.7 [11, 12] 13 131.2 48 [2] 8.8 51.5 [2] 4.5 [2, 13] 14 122.7 59 [19] 8.5 57.9 [19] 4.9 [14, 19] 15 8.33, d, 7.8 125.6 58 [16] 8.3 49.9 [16] 4.2 [15, 16] 16 7.59, dd, 7.8, 7.8 128.5 58 [15], 56 [17] 7.8 32.2 [15, 17],
37.8 [15 or 17] 2.5 [15, 16, 17], 2.9 [15, 16] and [16, 17]
17 7.66, dd, 7.8, 7.8 131.5 56 [16/ 18] 7.4 15.6 [16 and 18], 46.4 [16 or 18]
1.2 [16, 17, 18] 3.4 [16, 17] and [17, 18]
18 7.72, d, 7.8 117.2 56 [17] 8.2 44.6 [17] 3.7 [17, 18] 19 148.4 59 [14] 8.3 56.2 [14] 4.7 [14, 19] 1´ 123.0 59 [2´] 6.2 55.4 [2´] 3.4 [1´, 2´]
2´/6´ 8.63, d, 9.0 139.3 59 [1´/ 5´] 6.2 48.7 [1´ or 5´] 3.0 [1´, 2´] and [5´, 6´] 3´/5´ 7.16, d, 9.0 118.3 59 [6´], 61 [4´] 6.3 21.0 [4´ and 6´],
36.4 [4´ or 6´] 1.3 [4´, 5´, 6´], 2.3 [3´, 4´], [4´, 5´] and [5´, 6´]
SI. 37

SI. 38
4´ 168.3 61 [3´, 5´], 9 [6´] 6.8 15.4 [3´ and 5´], 13.1 [5´ and 6´], 33.6 [3´ or 5´]
1.1 [3´, 4´, 5´] 0.9 [4´, 5´, 6], 2.3 [3´, 4´] and [4´, 5´]
Glc Af
1´´ 4.78, d, 7.4 99.6 48 [2´´] 6.3 56.2 [1´´] 3.5 [1´´, 2´´] 2´´ 3.56 83.8 48 [1´´], 40 [3´´] 6.6 32.7 [1´´ and 3´´]
21.0 [1´´] 16.3 [3´´]
2.2 [1´´, 2´´, 3´´] 1.4 [1´´, 2´´] 1.1 [2´´, 3´´]
3´´ 3.55 77.7 4´´ 3.39 70.4 40 [3´´/5´´] 6.2 26.5 [3´´ and 5´´]
41.5 [3´´ or 5 ´´] 1.7 [3´´, 4´´, 5´´] 2.6 [3´´, 4´´] and [4´´, 5´´]
5´´ 3.33 77.8 6´´A 3.87, dd, 12.0, 2.0 6´´B 3.67, dd, 12.0, 5.9
62.4 43 [5´´] 6.8 56.9 [5´´] 3.9 [5´´, 6´´]
Glc Bf
1´´´ 4.51, d, 7.7 106.1 46 [2´´´] 6.6 55.6 [1´´´] 3.7 [1´´´, 2´´´] 2´´´ 3.24 77.7 3´´´ 3.06 77.8 4´´´ 3.05 71.8 40 [3´´´/ 5´´´] 6.3 26.1 [3´´´ and 5´´´]
39.8 [3´´´ or 5 ´´´] 1.6 [3´´´, 4´´´, 5´´´] 2.5 [3´´´, 4´´´] and [4´´´, 5´´´]
5´´´ 3.39 78.1 6´´´A 3.31, dd, 11.8, 1.9
6´´´B 3.00, dd, 11.8, 5.7 62.7 43 [5´´´] 6.6 57.2 [5´´´] 3.8 [5´´´, 6´´´]
Glc C
1´´´´ 4.78, d, 7.4 102.1 47 [2´´´´] 6.8 57.7 [2´´´´] 3.9 [1´´´´, 2´´´´] 2´´´´ 3.38 74.6 46 [1´´´´]
40 [3´´´´] 6.0 32.8 [1´´´´ and 3´´´´],
20.9 16.9
2.0 [1´´´´, 2´´´´, 3´´´´], 1.5 [1´´´´, 2´´´´], 1.0 [2´´´´, 3´´´´]
3´´´´ 3.18 78.7 42 [2´´´´/ 4´´´´] 6.2 39.8 [2´´´´ and 4´´´´] 2.5 [2´´´´, 3´´´´, 4´´´´],

SI. 39
36.2 [2´´´´ or 4´´´´] 2.2 [2´´´´, 3´´´´] and [3´´´´, 4´´´´] 4´´´´ 3.33 71.2 40 [3´´´´/5´´´´]
6.1 29.1 [3´´´´ and 5´´´´]
46.3 [3´´´´ or 5´´´´] 1.8 [3´´´´, 4´´´´, 5´´´´] 2.8 [3´´´´, 4´´´´] and [4´´´´, 5´´´´]
5´´´´ 3.31 76.1 40 [4´´´´] 43 [6´´´´]
5.9 34.8 [4´´´´ and 6´´´´] 21.2 [6´´´´] 17.8 [4´´´´]
2.1 [4´´´´, 5´´´´, 6´´´´] 1.2 [5´´´´, 6´´´´] 1.1 [4´´´´, 5´´´´]
6´´´´A 3.79, dd, 12.1, 2.1
6´´´´B 3.70, dd, 12.1, 5.3 62.1 43 [5´´´´] 6.6 56.4 [5´´´´] 3.7 [5´´´´, 6´´´´]
a
remb
c
d
e
f
13C NMR chemical shifts are from ref.1 and may slightly deviate in the spectra obtained from the 13CO2 experiment due to residual trifluoroacetic acid aining from HPLC solvent.
The numbers in parentheses indicate the coupling partners. 13C abundances of individual carbon atoms (%13C). Relative contribution of a satellite pair to the overall 13C NMR signal integral of the indexed carbon atom. Relative molar amounts of isotopologues were calculated as %13C × % 13C13C . Bracketed numbers indicate 13C atoms of the respective isotopologue. Due to strongly overlapping 13C NMR signals, the 13C abundances of carbons of the glucose units A and B were only partly identified.

Figure S28. 13C NMR signal (125 MHz, CD3OD) of C-2 of 1 obtained from the pulse-chase
labeling experiment using 13CO2 as a tracer.
Figure S29. 13C NMR signal (125 MHz, CD3OD) of C-3 of 1 obtained from the pulse-chase
labeling experiment using 13CO2 as a tracer.
SI. 40

Figure S30. 13C NMR signals (125 MHz, CD3OD) of C-4 and C-1´´´´ of 1 obtained from the pulse-
chase labeling experiment using 13CO2 as a tracer.
Figure S31. 13C NMR signal (125 MHz, CD3OD) of C-5 of 1 obtained from the pulse-chase labeling
experiment using 13CO2 as a tracer.
SI. 41

Figure S32. 13C NMR signals (125 MHz, CD3OD) of C-6 and C-1´´ of 1 obtained from the pulse-
chase labeling experiment using 13CO2 as a tracer.
Figure S33. 13C NMR signals (125 MHz, CD3OD) of C-7 and C-9 of 1 obtained from the pulse-
chase labeling experiment using 13CO2 as a tracer.
SI. 42
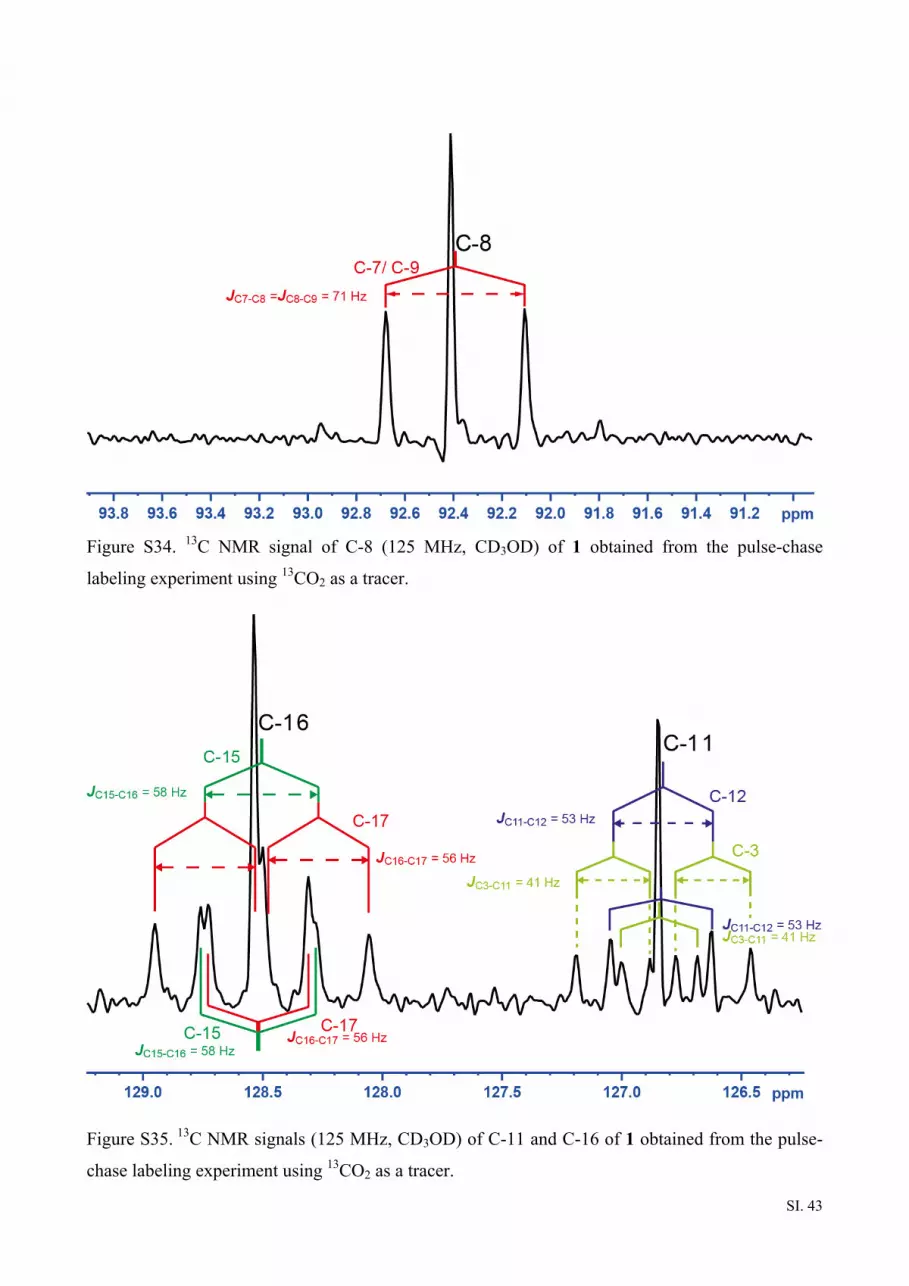
Figure S34. 13C NMR signal of C-8 (125 MHz, CD3OD) of 1 obtained from the pulse-chase
labeling experiment using 13CO2 as a tracer.
Figure S35. 13C NMR signals (125 MHz, CD3OD) of C-11 and C-16 of 1 obtained from the pulse-
chase labeling experiment using 13CO2 as a tracer.
SI. 43

Figure S36. 13C NMR signals (125 MHz, CD3OD) of C-12 and C-4´ of 1 obtained from the pulse-
chase labeling experiment using 13CO2 as a tracer.
Figure S37. 13C NMR signals (125 MHz, CD3OD) of C-13 and C-17 of 1 obtained from the pulse-
chase labeling experiment using 13CO2 as a tracer.
SI. 44

Figure S38. 13C NMR signals (125 MHz, CD3OD) of C-14 and C-1´ of 1 obtained from the pulse-
chase labeling experiment using 13CO2 as a tracer.
Figure S39. 13C NMR signal (125 MHz, CD3OD) of C-15 of 1 obtained from the pulse-chase
labeling experiment using 13CO2 as a tracer.
SI. 45

Figure S40. 13C NMR signals (125 MHz, CD3OD) of C-18 and C-3´/5´ of 1 obtained from the
pulse-chase labeling experiment using 13CO2 as a tracer.
SI. 46

Figure S41. 13C NMR signals (125 MHz, CD3OD) of C-19 of 1 obtained from the pulse-chase
labeling experiment using 13CO2 as a tracer.
Figure S42. 13C NMR signal (125 MHz, CD3OD) of C-2´/6´ of 1 obtained from the pulse-chase
labeling experiment using 13CO2 as a tracer.
SI. 47

Figure S43. 13C NMR signal (125 MHz, CD3OD) of C-1´´´ of 1 obtained from the pulse-chase
labeling experiment using 13CO2 as a tracer.
Figure S44. 13C NMR signal (125 MHz, CD3OD) of C-2´´ of 1 obtained from the pulse-chase
labeling experiment using 13CO2 as a tracer.
SI. 48

Figure S45. 13C NMR signals (125 MHz, CD3OD) of C-2´´´´ and C-5´´´´ of 1 obtained from the
pulse-chase labeling experiment using 13CO2 as a tracer.
SI. 49

Figure S46. 13C NMR signal (125 MHz, CD3OD) of C-3´´´´ of 1 obtained from the pulse-chase
labeling experiment using 13CO2 as a tracer.
SI. 50

Figure 47. 13C NMR signals (125 MHz, CD3OD) of C-4´´, C-4´´´ and C-4´´´´ of 1 obtained from the
pulse-chase labeling experiment using 13CO2 as a tracer.
Figure S48. 13C NMR signals (125 MHz, CD3OD) of C-6´´, C-6´´´ and C-6´´´´ of 1 obtained from
the pulse-chase labeling experiment using 13CO2 as a tracer.
SI. 51

S4. Reconstruction of biosynthetic pathways, retrodictive/predictive
comparative analysis
SI. 52
Figure S49. Reconstruction of the pentose phosphate pathway from the experimentally assessed
isotopologue profile of glucose based on the deconvolution of 13C NMR signals of glucose C of 1.
The labeling patterns of the above mentioned intermediates were predicted on the basis of standard

biosynthetic routes in plants. Multiple 13C-labeled isotopologues are indicated by bars connecting 13C-atoms within the same molecule. 13C2 isotopologues are marked in cyan colored bars and the 13C3 isotopologues are marked in crimson colored bars. The numbers indicate the % molar
abundances of the corresponding isotopologues. The widths of the bars also reflect the % molar
abundances of the isotopologues.
Figure S50. Reconstruction of the shikimate pathway based on predicted labeling pattern of
erythrose-4-phosphate (E4P) (as shown in Figure S50) and inferred labeling pattern (as concluded
from isotopologue profile of 3) of phosphoenol pyruvate (PEP). The labeling patterns of shikimate
pathway intermediates were predicted on the basis of established biosynthetic routes in plants.
SI. 53

SI. 54
Multiple 13C-labeled isotopologues are indicated by bars connecting 13C-atoms within the same
molecule. The 13C isotopologues of E4P origin are marked by red color bars and the 13C
isotopologues of PEP origin are marked in blue and green color bars. The numbers indicate the %
molar abundances of the corresponding isotopologues. The widths of the bars also reflect the %
molar abundances of the isotopologues. (b) The experimentally determined labeling pattern of
aromatic ring B of 3 and rings d and f of 1 with shikimate origin.

SI. 55

SI. 56
Figure S51. (a) Reconstruction of the indole biosynthetic pathway. The labeling pattern of ribose-5-phosphate was based on predicted labeling pattern
as shown in Figure S50. The labeling pattern of anthranilic acid was based on predicted labeling pattern as shown in Figure S51. The labeling patterns
of shikimate pathway intermediates were predicted on the basis of established biosynthetic routes in plants. (b) Predicted labeling pattern of nudicaulin
I (1) aglycon based on reconstruction of biosynthetic pathways of indole (a) and flavonoids (d). (c) Experimentally determined labeling pattern of
nudicaulin I (1) aglycon as derived by deconvolution of 13C NMR signals. (d) Reconstruction of flavonoid biosynthetic pathway based on
experimentally determined labeling pattern of kaempferol derivative (3) as derived by deconvolution of 13C NMR signals. Multiple 13C-labeled
isotopologues are indicated by bars connecting 13C-atoms within the same molecule. The numbers indicate the % molar abundances of the
corresponding isotopologues in mol%. The widths of the bars also reflect the % molar abundances of the isotopologues.