cationic nano-systems for dna transfection
TRANSCRIPT

CATIONIC NANO-SYSTEMS FOR DNA
TRANSFECTION
BY
Diana Patrícia Soares de Paiva
THESIS SUBMITTED TO THE UNIVERSITY OF PORTO FOR A DOCTOR OF
PHILOSOPHY IN CHEMICAL AND BIOLOGICAL ENGINEERING
SUPERVISION
MARIA DO CARMO DA SILVA PEREIRA
SANDRA CRISTINA PINTO DA ROCHA
PORTO, 2013


To my family ...


“Some people succeed because they are destined to!
But most people succeed because they are determined to!”
Henry Ford, 1863-1947


i
AcknowledgmentsAcknowledgmentsAcknowledgmentsAcknowledgments
This thesis and, therefore, all the work done in the last 5 years was not
possible without the valuable contribution of some people that I am very
grateful.
I thank to Professor Maria do Carmo Pereira for accepting me as her
PhD student in the Faculty of Engineering of the University of Porto (FEUP,
Porto, Portugal) and for believe on my capabilities. Her guidance, support,
suggestions and scientific discussions were always essential.
I would like to give my deepest appreciation to Doctor Sandra Rocha
for her help and contribution for this PhD. She has always friendly and
hopeful, and made easier to overcome the difficulties and frustrations of this
work.
Also, I express my gratitude to the members of our investigation
group, particularly, to Professor Manuel Coelho, for the group scientific
discussions and brain storming. To LEPAE members and staff a special thank
for their help and contribution.
Some fundamental studies where performed at Max Planck Institute of
Colloids and Interface (Golm, Germany), so I want to thank to Professor
Helmuth Möhwald for the opportunity and for his hospitality. Professor
Gerald Brezesinski deserves may deeply gratitude for all the guidance and
helpful discussions on Langmuir monolayers studies and for being such a good

ii
and welcome friend. My stay in Germany was really pleasant and I would like
to thank all the friends I made there, especially, Professor Gerald’s group for
the fantastic working atmosphere and my roommates for being such a good
friends.
Many thanks to the co-workers that contributed for this research
work. To Doctor Isabel Cardoso and the members of Molecular Neurobiology
group from Instituto de Biologia Molecular e Celular (Porto, Portugal), my
appreciation for the help on cellular transfection studies. To Doctor Galya
Ivanova from Centro de Materiais da Universidade do Porto (Porto, Portugal)
for her help on NMR work. To Doctor Alberto Martín Molina and his group
from Facultad de Ciencias, Universidad de Granada (Granada, Spain), for their
help on the liposome complexation theory.
To all my friends at Department of Chemical Engineering (FEUP, Porto,
Portugal) and Tuna Feminina de Engenharia (TUNAFE, Porto, Portugal) for the
support, encouragement and good times over the years. Thank you all for
constant presence and friendship.
To my family, I offer all my gratitude, for being there and supporting
my choices, encouraging me to pursue my dreams and go further. To my
husband Joaquim Freitas a special thanks for being there all the time and
helping me on the most challenging problems. To my baby, Gabriel, thank you
for colouring my life and make me smile.
I am thankful to Fundação para a Ciência e Tecnologia (FCT) for a PhD
fellowship (SFRH/BD/45384/2008). The research work was supported by FCT
research projects: Nano-NMed–SD/0156/2007 and PTDC/QUI-
BIQ/102827/2008.

iii
ResumoResumoResumoResumo
Este trabalho de investigação visou a preparação e caracterização de
sistemas para o transporte e entrega de ADN. Esses sistemas são catiónicos e
não virais e são constituídos por lípidos e polímeros.
As monocamadas de Langmuir foram utilizadas para prever as
interações entre o lípido catiónico DOTAP (Cloreto de trimetil(2,3-
dioleoilpropil)amónio) e o colesterol (CHOL) ou o seu derivado colesterol
fluorado (heptafluorocolesterol, F7-CHOL). A mistura do DOTAP com cada um
dos esteróis (rácio 1:1) origina monocamadas na fase líquida expandida,
idênticas às do DOTAP. Verificou-se que a área por molécula das misturas é
mais pequena que a esperada de acordo com a regra da adição aplicável no
caso de ambos os compostos serem completamente miscíveis ou imiscíveis na
monocamada. A adsorção de ADN na monocamada é similar para ambos os
sistemas, o que sustenta a possibilidade da utilização de colesterol fluorado
como lípido auxiliar na formulação de vetores para transfeção de ADN.
A compactação de ADN e respetiva transfeção foram testadas para
lipossomas constituídos pelo DOTAP e pelo colesterol fluorado (rácio molar
1:1). Os resultados confirmaram que mais lipossomas do sistema DOTAP:F7-
CHOL são necessários para compactar a mesma quantidade de ADN quando
comparado com o sistema DOTAP:CHOL e que a ligação lipossoma-ADN é
mais forte no caso do sistema DOTAP:F7-CHOL/ADN. A estabilidade de ambos

iv
os sistemas na presença de ADN é idêntica, bem como a eficiência de
transfeção.
Os vetores baseados em bola-anfifílicos foram produzidos por dois
métodos distintos. Primeiro utilizou-se a metodologia de deposição de
camadas. Após a adição de algumas camadas de polímeros para promover a
estabilização do núcleo das micropartículas, camadas alternadas de ADN e
bola-anfifílico (BA) foram depositadas. A presença quer do ADN quer do BA à
superfície das micropartículas foi confirmada, visualmente, por microscopia
confocal. A outra metodologia utilizada foi a formação de vesículas lipídicas
preparadas com diferentes rácios molares de BA e DOTAP. O rácio molar que
evidenciou melhor comportamento foi o de BA:DOTAP 1:5. As vesículas foram
posteriormente complexadas com ADN (rácio mássico lípido:ADN 10:1). Os
estudos de transfeção revelaram que o sistema BA:DOTAP possui um melhor
potencial de transfeção com menos impacto na viabilidade das células do que
o sistema de DOTAP.
Copolímeros de quitosano e maltodextrina foram sintetizados por
aminação redutiva, partindo de quitosano de baixo peso molecular. O grau de
substituição, quantificado por espectroscopia de ressonância magnética
nuclear, foi superior a 70% para rácios molares de 1:1 e 1:5 entre as unidades
de glucosaminas do quitosano e uma molécula de maltodextrina. O elevado
grau de substituição obtido gerou um composto solúvel em água a pH de 7.4.
Adicionalmente, o copolímero forma, espontaneamente, nanopartículas
esféricas com diâmetros de cerca de 300 nm. As moléculas de ADN interagem
eficientemente com as nanopartículas do copolímero, evidenciando potencial
para a aplicação deste sistema como transportador de ADN.
Este estudo apresenta diferentes sistemas com possíveis aplicações na
terapia génica. Estes sistemas exibem boas características como vetores de
transfeção de ADN.

v
AbstractAbstractAbstractAbstract
This doctoral thesis had as objectives the preparation and
characterisation of cationic non-viral DNA delivery systems based on lipids
and polymers.
Langmuir monolayers were used to predict the interactions between
the cationic lipid DOTAP (1,2-dioleoyl-3-trimethylammonium-propane,
chloride salt) and cholesterol or its derivative heptafluorocholesterol
(fluorinated cholesterol). The mixture of DOTAP with each of the sterols at 1:1
molar ratios leads to monolayers in a liquid expanded state, similarly to that
of DOTAP alone. The area per molecule of the mixtures was smaller than that
expected according to the additivity rule applicable if the two components are
either completely miscible or immiscible within the monolayer. The
adsorption of DNA to the monolayer is similar for both systems, supporting
the use of fluorinated cholesterol as helper lipid in DNA transfection vectors.
Liposomes of the cationic lipid DOTAP and the fluorinated cholesterol
(F7-CHOL) were tested at the molar ratios of 1:1 for DNA compaction and
transfection. The results confirmed that more DOTAP:F7-CHOL liposomes are
needed to compact the same amount of DNA as DOTAP:CHOL and that the
liposome-DNA binding is stronger in the case of DOTAP:F7-CHOL/DNA system.
The stability rates of both liposomes in the presence of DNA were similar as
well as the transfection efficiencies.

vi
Bolaamphiphile based vectors were prepared using two distinct
methods: layer-by-layer (LbL) deposition method and hydration lipid film
technique. Microparticles were coated with few polymer layers by LbL for
stabilization, followed by deposition of DNA and bolaamphiphile (BA) layers,
alternately. The amount of DNA present on the layers was 0.035 ± 0.005
mg/mL as estimated by ethidium bromide assays. The presence of both DNA
and BA molecules at the surface of the microparticles was confirmed by
confocal laser scanning microscopy. Vesicles of the bolamphiphile and DOTAP
were also prepared using different molar ratios of each molecule. The ratio
that exhibited better behaviour was BA:DOTAP 1:5. The vesicles were then
successfully complexed with DNA at the lipid:DNA ratio of 10:1 (w:w).
Transfection studies revealed that the BA:DOTAP mixed system has a higher
transfection potential with less impact on cell viability than DOTAP system.
Graft copolymers of chitosan and maltodextrin were synthesised by
reductive amination of a low molecular weight chitosan. The degree of
substitution is 70% or above, as quantified by nuclear magnetic resonance
spectroscopy, at molar ratios of chitosan glucosamine units and maltodextrin
of 1:1 and 1:5. The high substitution degree generates a water-soluble
compound at pH 7.4. In addition, the copolymer self-assembles into spherical
nanoparticles with diameters of about 300 nm. DNA molecules interact
efficiently with the copolymer nanoparticles indicating a potential application
of the system for DNA delivery.
The current study presents different systems with possible applications
in gene therapy. These systems exhibit good characteristics as DNA
transfection vectors.

vii
ContentsContentsContentsContents
1. INTRODUCTION .............................................................................................. 1
REFERENCES ............................................................................................................. 4
2. NANO-SYSTEMS FOR GENE DELIVERY .............................................................. 7
2.1. VIRAL VECTORS ............................................................................................... 9
2.2. NON-VIRAL VECTORS ...................................................................................... 11
2.2.1. LIPID-BASED SYSTEMS .................................................. ......................................... 13
2.2.2. POLYMERIC CARRIERS .................................................. ......................................... 19
2.2.3. INORGANIC BASED NANOPARTICLES .................................................. ...................... 23
2.3. REFERENCES ................................................................................................. 25
3. INTERACTION OF DNA WITH LIPID MONOLAYERS .......................................... 45
3.1. LIPID MONOLAYER EXPERIMENTS ....................................................................... 46
3.1.1. CHEMICALS................................................... ................................................... ... 46
3.1.2. PRESSURE/AREA ISOTHERMS .................................................. ............................... 47
3.1.3. SURFACE POTENTIAL .................................................. .......................................... 49
3.1.4. BREWSTER ANGLE MICROSCOPY (BAM) ............................................. .................... 50
3.1.5. INFRARED REFLECTION ABSORPTION SPECTROSCOPY (IRRAS) .................................... 51

viii
3.2. RESULTS AND DISCUSSION ............................................................................... 53
3.2.1. DOTAP/F7-CHOLESTEROL MONOLAYERS .................................................. .............. 53
3.2.2. DNA INTERACTION WITH DOTAP/F7-CHOLESTEROL MONOLAYERS ............................. 59
3.3. CONCLUSIONS ............................................................................................... 63
3.4. REFERENCES ................................................................................................. 64
4. COMPACTION PROCESS OF DNA BY FLUORINATED LIPOSOMES ..................... 71
4.1. EXPERIMENTAL DETAILS ................................................................................... 73
4.1.1. CHEMICALS .................................................. ................................................... .... 73
4.1.2. PREPARATION OF LIPOSOMES, DNA SOLUTION AND LIPOPLEXES .................................. 73
4.1.3. DYNAMIC LIGHT SCATTERING .................................................. ............................... 74
4.1.4. ELECTROPHORETIC MOBILITY .................................................. ............................... 76
4.1.5. FLUORESCENCE SPECTROSCOPY .................................................. ............................ 77
4.1.6. TRANSMISSION ELECTRON MICROSCOPY .................................................. ............... 78
4.1.7. COMPLEXATION THEORY .................................................. ..................................... 79
4.1.8. TURBIDITY MEASUREMENTS .................................................. ................................. 81
4.1.9. CIRCULAR DICHROISM .................................................. ........................................ 83
4.1.10. IN VITRO TRANSFECTION STUDIES .................................................. ........................ 85
4.1.10.1. Pulse cytophotometry ....................................................................... ......... 86
4.1.10.2. Confocal Laser Scanning Microscopy ......................................................... 86
4.2. RESULTS AND DISCUSSION ............................................................................... 87
4.2.1. ELECTRIC PROPERTIES AND DIAMETER OF THE COMPLEXES .......................................... 87
4.2.2. DNA BINDING AFFINITY TO LIPOSOMES .................................................. ................. 91
4.2.3. MORPHOLOGY OF THE COMPLEXES .................................................. ....................... 93
4.2.4. BOUNDARY CONCENTRATIONS OF THE LIPOPLEXES .................................................. ... 95
4.2.5. STABILITY RATIO .................................................. ................................................ 99
4.2.6. DNA CONFORMATION .................................................. ...................................... 101
4.2.7. CELL TRANSFECTION STUDIES .................................................. ............................. 104
4.3. CONCLUSIONS ............................................................................................. 106

ix
4.4. REFERENCES ............................................................................................... 106
5. BOLAAMPHIPHILE-BASED VECTORS ............................................................. 117
5.1. BOLAAMPHIPHILE PARTICLES ........................................................................... 118
5.1.1. MATERIALS AND METHODS .................................................. ............................... 119
5.1.1.1. Chemicals ................................ ................................................... ................ 119
5.1.1.2. LbL assembly ............................. ................................................... .............. 120
5.1.1.3. Zeta potential ........................... ................................................... ............... 121
5.1.1.4. Fluorescence spectroscopy ................................................................... ..... 121
5.1.1.5. Confocal Laser Scanning Microscopy (CLSM) ............................................ 122
5.1.2. RESULTS AND DISCUSSION .................................................. ................................ 122
5.1.3. CONCLUSIONS .................................................. ................................................. 1 24
5.2. LIPID VESICLES ............................................................................................. 125
5.2.1. MATERIALS AND METHODS .................................................. ............................... 125
5.2.1.1. Chemicals ................................ ................................................... ................ 125
5.2.1.2. Preparation of Liposomes ................. ................................................... ...... 126
5.2.1.3. DLS and electrophoretic mobility ............................................................ .. 126
5.2.1.4. Morphology studies ....................... ................................................... ......... 126
5.2.1.5. In vitro transfection studies ............................. .......................................... 127
5.2.2. RESULTS AND DISCUSSION .................................................. ................................ 128
5.2.2.1. Vesicle characterisation .................................................................... ......... 128
5.2.2.2. Cell transfection studies ................ ................................................... ......... 132
5.2.3. CONCLUSIONS .................................................. ................................................. 1 33
5.3. REFERENCES ............................................................................................... 134

x
6. CHITOSAN-N-MALTODEXTRIN CONJUGATES................................................ 139
6.1. EXPERIMENTAL SECTION ................................................................................ 140
6.1.1. CHEMICALS .................................................. ................................................... .. 140
6.1.2. SYNTHESIS OF CHITOSAN-GRAFT-MALTODEXTRIN .................................................. .. 140
6.1.3. FOURIER-TRANSFORM INFRARED (FTIR) SPECTROSCOPY .......................................... 141
6.1.4. NUCLEAR MAGNETIC RESONANCE (NMR) SPECTROSCOPY ........................................ 142
6.1.5. PREPARATION OF NANOPARTICLES .................................................. ...................... 144
6.1.6. PREPARATION OF POLYPLEXES .................................................. ............................ 145
6.1.7. DLS AND ZETA POTENTIAL MEASUREMENTS .................................................. ......... 145
6.1.8. TRANSMISSION ELECTRON MICROSCOPY (TEM) ............................................. ......... 146
6.1.9. SCANNING ELECTRON MICROSCOPY (SEM) ............................................. ............... 146
6.2. RESULTS AND DISCUSSION ............................................................................. 147
6.2.1. CHARACTERISATION OF CHITOSAN-N-MALTODEXTRIN COPOLYMER ............................ 147
6.2.2. CHITOSAN-N-MALTODEXTRIN NANOPARTICLES .................................................. ..... 152
6.2.3. CHITOSAN-N-MALTODEXTRIN/DNA COMPLEXES .................................................. .. 155
6.3. CONCLUSIONS ............................................................................................. 157
6.4. REFERENCES ............................................................................................... 158
7. CONCLUDING REMARKS ............................................................................. 163
LIST OF ABBREVIATIONS .................................................................................... 167
LIST OF FIGURES ................................................................................................ 175
LIST OF TABLES ................................................................................................. 179

xi
PrefacePrefacePrefacePreface
According to the Law n° 216/92 of 13th
October and to the Doctoral
Regulations of the University of Porto, we clarify that all the experiments,
interpretation and discussion presented on this thesis are our own, except if
stated otherwise. In this dissertation, results were presented from the
following publications:
Paiva, D., Martin-Molina, A., Cardoso, I., Quesada-Perez, M., Pereira, M. C.,
Rocha, S. (2013). “The effect of a fluorinated cholesterol derivative
on the stability and physical properties of cationic DNA vectors”, Soft
Matter, 9, 401.
Paiva, D., Brezesinski, G., Pereira, M. C., Rocha, S. (2013). “Langmuir
monolayers of monocationic lipid mixed with cholesterol or
fluorocholesterol: DNA adsorption studies”, Langmuir, 29, 1920.
Paiva, D., Rocha, S., Ivanova, G., Pereira, M. C. “Synthesis and characterization
of chitosan-maltodextrin graft copolymers: Novel nanoparticles for
drug delivery”, Physical Chemistry Chemical Physics, DOI:
10.1039/C3CP51215K.


INTRODUCTION 1
Chapter 1
1.1.1.1. IntroductionIntroductionIntroductionIntroduction
The gene therapy concept states that a human disease might be
treated if the correct genetic material is supplied to the targeted cell. The new
genetic material can correct or supplement the defective genes responsible
for the disease progression (Mansouri, 2004). Different gene therapeutics to
treat diseases such as cancer, AIDS and neurological disorders are currently in
clinical trials (Biffi, 2006; Ginn, 2013; Li, 2005; Strayer, 2005).
In gene therapy, the development and study of DNA vectors with high
transfection efficiency and low toxicity is extremely important. Ideally, a DNA
delivery system with therapeutic purposes should have high transfection
efficiency and high specificity to the target cell to reduce the side effects. The
system should in addition be small, stable, biodegradable, easy to prepare and
should allow the DNA release and expression (Mansouri, 2004; Patil, 2005).
Nanoparticles and nanocapsules offer many advantages in gene therapy due
to their versatile chemical structures, surface functionalities and the ability to
obtain controlled sizes.
The focus of this PhD research work is to prepare and characterise
non-viral DNA delivery systems based on lipids and polymers. These systems
avoid some of the problems associated to viral vectors such as high toxicity

2 INTRODUCTION
and the generation of a strong immune response. Other advantages of non-
viral vectors are easy formulation and assembly (Patil, 2005).
Non-viral vectors are typically positively charged such as cationic
liposomes prepared with 1,2-dioleoyl-3-trimethylammonium-propane,
chloride salt (DOTAP) or cationic nanoparticles made of chitosan. These
systems compact efficiently the DNA through electrostatic interactions
leading to the formation of complexes (Morille, 2008). In this thesis the
preparation of three different non-viral systems is described.
One system is based on fluorinated compounds (fluorinated modified
cholesterol) mixed with the cationic lipid DOTAP. Fluorinated cationic
liposomes have shown a higher transfection potential in in vitro and in vivo
studies when compared to their analogues (Krafft, 2001). Also, these
compounds exhibit good properties regarding the transport and protection of
active principles in the blood stream (Riess, 2002). The use of fluorinated
cholesterol in cationic liposomes for DNA delivery is described in the point of
view of the helper lipid effect. Cholesterol is normally added to lipid-based
DNA vectors to help the fusion of the liposome with the membrane, but also
to increase the stability and decrease the toxicity of the system. The use of
fluorinated cholesterol might increase further the stability of the system due
to its high hydrophobic character and protect DNA molecules from
degradation in the blood stream, increasing the half-life of the system
(Boulanger, 2004).
A second carrier was prepared with bolaamphiphiles, which are
molecules with two hydrophilic end groups connected by a hydrophobic tail.
Bolaamphiphiles are described to self-assemble in water and form packed
monolayer lipid membranes (Forbes, 2006). A bolaamphiphile molecule with a
hydrophobic chain of 22 carbon atoms, trimethylamine-quaternized at one
end and with a hydroxyl group at the other end was synthesised. The carriers

INTRODUCTION 3
containing this molecule were prepared by two different approaches. One
strategy was to use the layer-by-layer technique to assemble bolaamphiphile
and DNA layers on a microparticle core that could eventually be removed to
originate micro- or nanocapsules (Sukhorukov, 2007). A different approach
was to incorporate the bolaamphiphile in vesicles composed of the cationic
lipid DOTAP. This mixture is expected to form stable vesicles with small sizes
even in dry state due the two polar heads and the long carbon chain present
in the bolaamphiphile (Jain, 2010).
A DNA vector system based on chitosan conjugates is also proposed.
Chitosan is a non-toxic and natural biodegradable cationic polymer with low
immunogenicity and high biocompatibility (Jayakumar, 2010). These
properties made chitosan one of the more used polymers for gene therapies.
However, this molecule shows some problems, like solubility at physiological
pH and side effects as hypocholesterolemia if applied in high doses, limiting its
application. To overcome these complications and to improve its ability to
transfect genetic material, this cationic polymer was modified by grafting a
neutral polymer. Maltodextrin was chosen because it is a non-ionic excipient
that enhances gene expression and has low toxicity (Huang, 2002).
This thesis is organised into seven chapters. This chapter, introduction,
covers the objectives and scope of the proposed work. Chapter 2, nano-
systems for gene delivery, contains an overview of the non-viral vectors
concerning their applications in gene therapy and their advantages and
disadvantages. Chapter 3, interaction of DNA with lipid monolayers, covers the
use of Langmuir lipid monolayers to predict the interactions between the
fluorinated cholesterol and DOTAP and to study the interaction of DNA
molecules with the monolayer. Chapter 4, compaction process of DNA by
fluorinated liposomes, is dedicated to the characterisation of DOTAP
liposomes mixed with fluorinated cholesterol and the comparison of this

4 INTRODUCTION
system with the well-known DOTAP:cholesterol liposomes. In chapter 5,
bolaamphiphile-based vectors, the potential application of a new synthesised
bolaamphiphile in DNA carriers is discussed and in chapter 6, chitosan-N-
maltodextrin conjugates, the synthesis of chitosan-graft-maltodextrin
copolymers, their assembly into nanoparticles and their interaction with DNA
are described. Finally, chapter 7, concluding remarks, summarises the main
findings of this thesis.
ReferencesReferencesReferencesReferences
Biffi, A.; Capotondo, A.; Fasano, S.; Carro, U.d.; Marchesini, S.; Azuma, H.;
Malaguti, M.C.; Amadio, S.; Brambilla, R.; Grompe, M.; Bordignon, C.;
Quattrini, A.; Naldini, L. (2006). Gene therapy of metachromatic
leukodystrophy reverses neurological damage and deficits in mice,
The Journal of Clinical Investigation, 116, 3070.
Boulanger, C.; Di Giorgio, C.; Gaucheron, J.; Vierling, P. (2004). Transfection
with fluorinated lipoplexes based on new fluorinated cationic lipids
and in the presence of a bile salt surfactant, Bioconjugate Chemistry,
15, 901.
Forbes, C.C.; DiVittorio, K.M.; Smith, B.D. (2006). Bolaamphiphiles Promote
Phospholipid Translocation Across Vesicle Membranes, Journal of the
American Chemical Society, 128, 9211.
Ginn, S.L.; Alexander, I.E.; Edelstein, M.L.; Abedi, M.R.; Wixon, J. (2013). Gene
therapy clinical trials worldwide to 2012 – an update, The Journal of
Gene Medicine, 15, 65.
Huang, C.-Y.; Ma, S.S.; Lee, S.; Radhakrishnan, R.; Braun, C.S.;
Choosakoonkriang, S.; Wiethoff, C.M.; Lobo, B.A.; Middaugh, C.R.
(2002). Enhancements in gene expression by the choice of plasmid
INTRODUCTION 5
DNA formulations containing neutral polymeric excipients, Journal of
Pharmaceutical Sciences, 91, 1371.
Jain, N.; Arntz, Y.; Goldschmidt, V.r.; Duportail, G.; Mély, Y.; Klymchenko, A.S.
(2010). New Unsymmetrical Bolaamphiphiles: Synthesis, Assembly
with DNA, and Application for Gene Delivery, Bioconjugate
Chemistry, 21, 2110.
Jayakumar, R.; Chennazhi, K.P.; Muzzarelli, R.A.A.; Tamura, H.; Nair, S.V.;
Selvamurugan, N. (2010). Chitosan conjugated DNA nanoparticles in
gene therapy, Carbohydrate Polymers, 79, 1.
Krafft, M.P. (2001). Fluorocarbons and fluorinated amphiphiles in drug
delivery and biomedical research, Advanced Drug Delivery Reviews,
47, 209.
Li, C.; Bowles, D.E.; van Dyke, T.; Samulski, R.J. (2005). Adeno-associated virus
vectors: potential applications for cancer gene therapy, Cancer Gene
Therapy, 12, 913.
Mansouri, S.; Lavigne, P.; Corsi, K.; Benderdour, M.; Beaumont, E.; Fernandes,
J.C. (2004). Chitosan-DNA nanoparticles as non-viral vectors in gene
therapy: strategies to improve transfection efficacy, European Journal
of Pharmaceutics and Biopharmaceutics, 57, 1.
Morille, M.; Passirani, C.; Vonarbourg, A.; Clavreul, A.; Benoit, J.P. (2008).
Progress in developing cationic vectors for non-viral systemic gene
therapy against cancer, Biomaterials, 29, 3477.
Patil, S.; Rhodes, D.; Burgess, D. (2005). DNA-based therapeutics and DNA
delivery systems: A comprehensive review, The AAPS Journal, 7, E61.
Riess, J.G. (2002). Blood substitutes and other potential biomedical
applications of fluorinated colloids, Journal of Fluorine Chemistry,
114, 119.

6 INTRODUCTION
Strayer, D.S.; Akkina, R.; Bunnell, B.A.; Dropulic, B.; Planelles, V.; Pomerantz,
R.J.; Rossi, J.J.; Zaia, J.A. (2005). Current status of gene therapy
strategies to treat HIV/AIDS, Molecular Therapy, 11, 823.
Sukhorukov, G.B.; Möhwald, H. (2007). Multifunctional cargo systems for
biotechnology, Trends in Biotechnology, 25, 93.

NANO-SYSTEMS FOR GENE DELIVERY 7
Chapter 2
2.2.2.2. NanoNanoNanoNano----systems for gene systems for gene systems for gene systems for gene
deliverydeliverydeliverydelivery
Human diseases might be treated by the transfer of genetic material
into specific cells in order to correct or supplement defective genes
(Alderuccio, 2009; Buckley, 2011; Fischer, 2010). Gene therapy is been studied
in clinical trials for different type of diseases such as cancer (Brannon-Peppas,
2004; Li, 2005; Ramesh, 2001), HIV/AIDS (Kiem, 2012; Strayer, 2005), diabetes
(Callejas, 2013; Jean, 2011), cystic fibrosis (Mitomo, 2010; Pringle, 2009) and
neurological disorders (Biffi, 2006; Kim, 2009; Manfredsson, 2010).
There are many processes to perform gene therapy treatments such as
gene addition, gene correction/alteration and gene knockdown that could be
used individually or in combination (Kay, 2011). Gene knockdown acts by
introducing siRNA (short interfering RNA) or miRNA (mediated gene
regulation circuits of RNA) to block or cleave a gene transcript, by selecting
the sequences that should be replicated, eliminating the defective sequences
(Summerton, 2007). Gene correction/alteration is not a common technique,
however it is acquiring some interest by using artificially engineered nucleases

8 NANO-SYSTEMS FOR GENE DELIVERY
to cut the genome at a specific location, driving the cell endogenous
mechanisms to repair the introduced break through natural processes (Urnov,
2010).
Gene addition is one of the more commonly used techniques and
basically introduces a new sequence of DNA without removal of the
endogenous mutated gene. The therapeutic gene needs to reach the interior
of the cell and it will be treated by the subsequent cell processes. For this
route of gene therapy, the limitation step is the carrier used to transport the
genetic information through the human body and the ability to cross the cell
membrane. It is known that DNA sequences and free oligonucleotides are
rapidly degraded by serum nucleases in the blood when injected
intravenously (Miguel, 2003). Thus, a vehicle is necessary to compact and
protect the genetic material. The process is called DNA transfection (Figure
2.1).
Figure 2.1. Schematic representation of the DNA transfection process (Patil,
2005a).

NANO-SYSTEMS FOR GENE DELIVERY 9
An ideal DNA delivery system should have high transfection efficiency
with high specificity to the target cell, as well as low toxicity and
immunogenicity. The system should be small, stable, biodegradable, simple
and allow the release, delivery and expression of the DNA (Mansouri, 2004;
Patil, 2005a). The development of novel nano-systems as DNA vectors with
these properties is extremely important.
Gene delivery vehicles can be divided into two main categories, viral
and non-viral particles that can be complexed with DNA molecules.
2.1.2.1.2.1.2.1. Viral Viral Viral Viral VectorsVectorsVectorsVectors
The main advantage of using viral vectors is that they are highly
efficient in delivering genetic material through the cell membrane (Atkinson,
2010). The viral life cycle can be divided into two phases: infection and
replication. The infection is the penetration of the viral genome into the cell,
after which the expression occurs, releasing viral regulatory products used for
viral replication. Viral–based gene therapy vectors encapsulate a modified
genome that after expression transduce therapeutic genetic material (Kay,
2001).
Engineering genetically a virus DNA sequence is neither simple nor
easy and it raises concerns about their safety. Misguided preparations can
influence not only the efficacy of the system but also its toxicity and
immunogenicity. These reasons and the high cost of preparation represent
the major disadvantages of viral systems, because it is necessary to introduce
a new disease to prevent or cure the genetic disorder and re-administration of
the vector will be inefficient due to the immune response against the virus
(Nayak, 2010). One of the more common viruses used in gene therapy are
retrovirus and lentivirus, adenovirus and adeno-associated viruses and Herpes
simplex virus (Saraswat, 2009).

10 NANO-SYSTEMS FOR GENE DELIVERY
Retrovirus and lentivirus can be modified to infect mammalian cells.
When the virus is modified, it loses the ability of replicate and therefore it
only affects one cell. Once it is in the cell it will integrate the chromosome of
the host genome and provide a stable long expression of the transgene.
However this integration has the negative effect of an inherent risk of
insertional mutagenesis on future cells originated from the dividing process.
Lentivirus suppressed this step, since it only transfects non-dividing cells and
therefore will not be harmful to other cells (Atkinson, 2010; Mitomo, 2010).
Adenovirus vectors are appropriated to carry large sequences of DNA.
However a severe immune response of the host leads to a limited action of
the adenoviral DNA on the targeted cell, resulting in a transient expression of
the therapeutic gene that is lost over time (Walther, 2000). The viral sequence
is kept as an episome instead of a chromosome. The episome is constituted by
closed circular DNA that can be replicated by the nucleus but it is lost during
cell division. Nevertheless, after an appropriate modification the genetic
information can be maintained active at least during the life of the host cell.
Yet, the immune response will attack also the host cell probably in few weeks.
Repeated doses of this virus will also be destroyed (Atkinson, 2010). High
dosages of a first dose can induce severe toxicity. These problems affect the
efficacy of this vector and are its bigger disadvantage (Kay, 2011).
Adeno-associated viral vectors represent an alternative to adeno virus.
This is a non-pathogenic single stranded DNA virus that lacks of viral coding
sequences and is not associated with any disease, so it does not have
problems concerning toxicity or inflammatory responses (Walther, 2000).
They have the ability to infect both dividing and non-dividing cells and can
transduce on a broad range of in vivo tissues. Although the biggest
disadvantage of these systems is the limitation on the size of the therapeutic
gene, which cannot be higher than 5 kb (Li, 2005).

NANO-SYSTEMS FOR GENE DELIVERY 11
Herpes simplex virus (HSV) has a large capacity to encode therapeutic
genes and can infect a large number of cell types. Due to its ability to persist
in a latent state after the first infection, this virus provides the potential for a
long term expression of the therapeutic gene (Kay, 2001). However, the lack
of experience with recombinant herpes virus in patients and the difficulties on
target specific cells as well as toxicity revealed to be limitations for this system
(Saraswat, 2009).
Recombination of different types of virus or the combination of viral
vectors with non-viral delivery systems could be the solution to optimise
these carriers in order to obtain efficient vehicles with promising properties
for gene therapies. Recently a new generation of non-viral vehicles with some
of viral properties has risen. Virosomes combine the therapeutic gene with
fusogenic viral envelope proteins (Bomsel, 2011; Moser, 2011; Sharma, 2010).
In conclusion, viral vectors have superior transfection efficiencies, but
their use is dramatically limited by their severe side effects. However and
despite their disadvantages, viral vectors represent more than 50% of the
vectors used currently in clinical trials for gene therapeutics (Ginn, 2013;
Lonez, 2008; Ramesh, 2001).
2.2.2.2.2.2.2.2. NonNonNonNon----viral vectorsviral vectorsviral vectorsviral vectors
Non-viral vehicles exhibit low transfection efficiency but properties like
biocompatibility and potential for a large scale production make these
systems very attractive for gene therapy. There are numerous non-viral
systems that have reached clinical trials in the last few years (Ginn, 2013;
Mintzer, 2009; Seow, 2009).
Naked DNA injections in live tissue are a non-viral method to transfect
DNA into cells. This method consists in the injection of oligonucleotides or
small interfering RNA (siRNA) directly to the targeted sites. The in vivo

12 NANO-SYSTEMS FOR GENE DELIVERY
expression for this therapy is effective for intravascular delivery into liver and
muscle tissues. However the efficiency of transfection on skeletal or cardiac
muscle is relatively low and variable (Herweijer, 2003; Luo, 2000). The use of
mechanical and electrical procedures to deliver DNA into specific locations is
limited. Electroporation, an electrical method, is used to facilitate the DNA
transfection, by applying high voltage electrical current. As a result, high cell
mortality is verified, making this strategy inadequate for clinical use.
Mechanical strategies by means of applied pressure and particles
bombardment are limited to external tissues, like muscle, mucosal and skin,
because to reach internal organs an invasive procedure (through surgery) is
needed, which will carry risks for the patient. Despite its difficulty to
standardise, this methodology has reached clinical trials and, currently,
represents 18% of trials for gene therapies (Ginn, 2013; Gu, 2011; Morishita,
2011).
The complexation of DNA with lipids (lipoplexes), polymers
(polyplexes) and other non-viral vectors appear as an alternative methodology
to classical vectors based on viruses (Morille, 2008; Zhu, 2010). One of the
best properties of positively charged molecules is that they interact efficiently
with negatively charged groups of DNA, mainly by electrostatic interactions,
with DNA loadings close to 100%. This becomes a fast and easy method to
prepare delivery systems that do not require an encapsulation step. However,
the size of the complex can depend significantly on the type of cationic
structure used and the preparation conditions including DNA concentration,
pH, buffer, presence of salts and the N/P (nitrogen/phosphate) charge ratio
(Kamimura, 2011; Leal, 2007; Sennato, 2008). Studies revealed that the
optimal mean diameter of the vehicles for gene transfer is 50-60 nm (Gao,
2005; Laouini, 2013; Rodríguez-Pulido, 2009). Nevertheless, the positive
overall charge of the generated DNA complex will interact with the negative

NANO-SYSTEMS FOR GENE DELIVERY 13
charged cell membrane and can promote forced endocytosis of larger vectors,
increasing its uptake by cells and, consequently, improving DNA delivery
(Lonez, 2008; Mansouri, 2004; Zelphati, 1996).
2.2.1.2.2.1.2.2.1.2.2.1. LipidLipidLipidLipid----based systemsbased systemsbased systemsbased systems
Lipids are amphiphilic molecules that have the ability to self-form, in
the presence of aqueous solutions, stable structures named liposomes. A lipid
molecule is constituted by a head group (hydrophilic) and a hydrophobic tail
composed mainly by a hydrocarbon chain. Due to the hydrophobic tail, when
in contact with aqueous solutions they rearrange themselves to form a
bilayer, where the lipid tails are oriented to the interior of the bilayer and the
hydrophilic group is in contact with the water molecules. The size of the
formed structures is easily controlled (50- 200 nm) applying methods such as
freeze-thaw cycles, sonication and membrane extrusion (Dua, 2012; Honda,
2013; Jesorka, 2008).
Liposomes have several advantages over the viral systems. The low
immunogenicity is one of the main advantages of liposomes. Also they are
synthetic, relatively cheap to produce and do not induce cell contamination.
Liposomal systems are stable and protect the DNA from nuclease degradation
during transport. Additionally, liposomes can be prepared to target a specific
group of cells. The principal disadvantages of these systems are the low
transfection efficiency and some risk of inflammatory toxicity (Kamimura,
2011; Seow, 2009)
Liposomes can be used to transport and delivery DNA and drugs.
Anionic liposomes, like DMPG (1,2-dimyristoyl-sn-glycero-3-[phospho-rac-(1-
glycerol)]) can interact efficiently with positively charged drugs (Drulis-Kawa,
2010; Rodrigues, 2001; Shimanouchi, 2012). Studies with DNA molecules
show that these vectors have limitations due to the inefficient entrapment.

14 NANO-SYSTEMS FOR GENE DELIVERY
Both liposomes and DNA possess negative charges, leading to a poor
association. Therefore not many studies have been developed with this
system for DNA delivery. However, it has been reported in the literature that
DOPG (1,2-dioleoyl-sn-glycero-3-[phospho-rac-(1-glycerol)]) mixed with DOPE
(1,2-dioleoyl-sn-glycero-3-phosphoethanolamine) can be complexed with DNA
in the presence of calcium ions (Ca2+) and transfect effectively the DNA (Patil,
2004; Patil, 2005b).
On the other hand, cationic liposomes interact efficiently with DNA
molecules due to the opposite charges. Cationic liposomes are known to have
more affinity to the cell surface or endothelial glycoproteins facilitating the
crossover of the system through the membrane (Rao, 2010).
There are numerous type of cationic lipids used for gene delivery
(Geusens, 2011). DOTMA (1,2-di-O-octadecenyl-3-trimethylammonium
propane) was the first cationic lipid to be used. Currently, it is used in several
studies and it is part of the Lipofectin® formulations, the first commercial
formulation used as a standard to evaluate the effectiveness of the new
transfection reagents, despite its toxicity (Tarahovsky, 2009). DOTAP (1,2-
dioleoyl-3-trimethylammonium-propane, chloride salt) is a monovalent
cationic aliphatic lipid first synthesised by Leventis and Silvius (Leventis, 1990).
It has a high potential for transfection studies combined with its low toxicity,
becoming one of the more used cationic lipids in gene therapy studies
(Caracciolo, 2012). Other cationic lipids also used are DC-Chol (3β-[N-(N',N'-
dimethylaminoethane)-carbamoyl]cholesterol hydrochloride) (Caracciolo,
2005; Muñoz-Úbeda, 2010); multivalent aliphatic lipids such as DOGS
(dioctadecylaminoglycylspermine) and DOSPA (2,3 Dioleyloxy-N-
[2(sperminecarboxaminino)ethyl]-N,N-dimethyl-1-propanaminium
trifluroacetate). DOSPA is one of the lipids present in Lipofectamine®, one of

NANO-SYSTEMS FOR GENE DELIVERY 15
the more used commercial formulations available as reagent to assess
transfection in cell experiments (Pedroso de Lima, 2003).
The transfection efficiency of cationic liposomes is dependent on the
lipid molecule, the presence of helper lipids, the lipid/DNA ratio and which
cells are targeted. Helper lipids, like cholesterol or DOPE (dioleoyl
phosphoethanolamine), are normally neutral in charge and are used to
improve the system stability, reduce the toxicity of cationic lipids and increase
the half-life of liposomes and their transfection efficiency in in vivo studies
(Crook, 1998; Hui, 1996; Miguel, 2003; Xu, 2008; Zhang, 2004). To improve the
formulations based on cationic lipids, a new generation of lipids modified with
fluorine atoms has emerged.
Fluorine is the most electronegative of the elements and it has a high
ionisation potential and a very low polarizability (Kissa, 1994). Thereby, liquid
fluorocarbons present low van der Waals interactions and low cohesive
energy densities (Riess, 1994a). Consequently these fluorocarbons show very
low surface tensions, excellent spreading properties, high fluidity, low
dielectric constant and high compressibility (Krafft, 1998). The larger surface
exhibited by these fluorinated chains combined with the low polarizability
results on enhanced hydrophobicity. They show both hydrophobic and
lipophobic properties at the same time (Krafft, 2001; Riess, 2009).
Many fluorocarbons are biocompatible, even at large doses they
appear to be innocuous and physiologically inactive. No toxicity, carcinogenic,
mutagenic effects or immunological reactions have been described for pure
fluorocarbons with a molecular weight ranging from 460 to 520 g/mol. A
phase I clinical trial revealed that perfluorooctyl bromide emulsion at a
dosage of 1.2 or 1.8 g of fluorocarbon/kg do not present side effects in
healthy humans (Krafft, 2001; Leese, 2000; Riess, 1984).

16 NANO-SYSTEMS FOR GENE DELIVERY
Fluorinated amphiphiles have increased tendency to self-assemble in
water when compared to their hydrogenated analogues due to the strong
hydrophobic character of the fluorinated chains (Krafft, 2003). They also have
a lower critical micellar concentration than the hydrogenated analogues
(Shinoda, 1972). Fluorinated lipids have been synthesised and tested as the
main cationic lipid of DNA vectors (analogues of cationic DOSPA) as well as the
helper lipid (analogues of DOPE) (Gaucheron, 2000; Gaucheron, 2001a;
Gaucheron, 2001b; Gaucheron, 2002; Klein, 2010; Otmane Boussif, 2001).
They have shown advantages over their hydrogenated analogues and cationic
polymers (polyethylenimine) regarding the transfection potential (Huh, 1996).
Due to the strong tendency to self-assemble, fluorinated lipids prevent the
interaction of DNA with lipophilic or hydrophilic molecules responsible for
lipofection inhibition, and protect DNA from degradation in the bloodstream
since hemolytic activity is strongly suppressed (Boulanger, 2004; Riess, 1991;
Riess, 1994b).
Bolaamphiphile lipids differ from conventional lipids because they
have two hydrophilic heads in opposite sides of the molecule instead of one.
These head groups are connected through a hydrocarbon chain (Fuhrhop,
1986). The more known natural bolaamphiphile is the monolayered
membrane of thermophilic and acidophilic archaebacteria, as Sulfolobus
solfataricus or Sulfolobus acidocaldarius species (Baek, 2010; Rosa, 1986).
These molecules exhibit promising applications in gene therapy (Dakwar,
2012; Nuraje, 2012). They have enhanced physical stability due to the
presence of the two polar groups. These molecules can be symmetrical or
asymmetrical with respect to the charge present on the head groups. It is
possible to synthesise a molecule with the same head group at both ends or
with a positively charged group at one end and a neutral group at the other.
According to the charges, the molecules will rearrange to form stable vesicles

NANO-SYSTEMS FOR GENE DELIVERY 17
that could be used to encapsulate, transport and deliver an active principle
(Brunelle, 2009; Grinberg, 2010; Kaufman, 2013).
The self-assembly of bolaamphiphiles into structures can be very
different, depending on its characteristics. If the bolaamphiphile has
symmetrical head groups, it will have a tendency to generate monolayered
vesicles. However if the head groups are asymmetrical, the rearrangement
could be very different. Usually, they form monolayer lipid membranes when
the head groups are smaller or about of the same size of the hydrophobic
core. For bigger head groups, the molecules could form bilayered structures
that are more rigid and can have crystal shapes. In crystal assemblies, three
types of arrangements can occur. Considering a and b the head groups of an
asymmetrical bolaamphiphile, the bilayer could be assembled in a parallel
way, where the a head group is oriented to the inner space and the b head
groups to the outer space or vice-versa with respect to the head groups
(Figure 2.2.a/b). This orientation will depend on the forces present on the
head groups and in the solution bulk or surface. These bolaamphiphiles can
also organise themselves in an antiparallel way, where the a head group is
oriented to a b head group, forming in the inner space a sequence of a-b-a in
one layer to the corresponding sequence b-a-b on the other (Figure 2.2.c)
(Fuhrhop, 2004).
Despite the influence of the head groups on the assembly of these
structures, the hydrophobic part of the molecule also plays an important role
on the way that these molecules self-assemble. Long carbon chains usually
lead to monolayered lipid membranes, similar to liposomes, while short
hydrocarbon chains generate vesicles like micelles (Jain, 2010; Jain, 2012;
Popov, 2010). The presence of double bonds between carbons or other
groups in the hydrophobic chain confers rigidity to the molecule and could
lead to a U-shaped orientation of the molecule in which the hydrophilic

18 NANO-SYSTEMS FOR GENE DELIVERY
groups are aligned on the same side and the U bend is in the opposite side,
generating a bilayered vesicle (Meister, 2007; Yan, 2009).
Mixtures of bolaamphiphile with lipids are used to improve the
properties of the transport vector (Caschera, 2011). The lipids present
assembled according a bilayer vesicle and the bolaamphiphile can be
intercalated if the size of its hydrophobic part is close to twice of the size of
the hydrophobic part of the lipid molecule (Halter, 2004). Bolaamphiphile
molecules can also acquire the U-shape to better blend within the bilayer (Gu,
2003; Hutter, 2012; Moss, 1991).
Figure 2.2. Schematic representation of possible arrangements of asymmetrical
bolamphiphiles in crystals: a) parallel a,a; b) parallel a,b; c) antiparallel a,b and
b,a (Fuhrhop, 2004).

NANO-SYSTEMS FOR GENE DELIVERY 19
2.2.2.2.2.2.2.2.2.2.2.2. Polymeric Polymeric Polymeric Polymeric carrierscarrierscarrierscarriers
Polymeric gene vectors are prepared by complexation of cationic
polymers with anionic DNA molecules generating nanospheres with diameters
ranging from 50 to 700 nm (Pannier, 2004). Polyplexes or polymer-DNA
complexes are internalised by cells through endocytosis or membrane fusion,
due to the overall positive charge of the complex, and the DNA release
happens upon endosomal escape by proton-sponge mechanism (Boussif,
1995; Jewell, 2008). These vectors are more stable and less toxic than
liposome systems and condense more DNA (Mansouri, 2004). Other
advantages of these systems include low immunogenicity, versatility of
physicochemical properties and easy manufacture (Merdan, 2002). Cationic
polymers typically interact with DNA in a stronger way, through electrostatic
interactions, leading to the formation of complexes with multiple DNA
molecules. Therefore the size of the particles is related mostly with the
polymer physical properties than the DNA molecule size (Mintzer, 2009).
However, biocompatibility and, principally, transfection efficiency still have to
be improved.
Polymer vectors strongly depend on the nature of the polymer and
their molecular weight and on the ionic strength of the solutions.
Modifications on the polymer structure confer specific physiological and
physicochemical properties that help with the DNA uptake and the tissue
targeting (Merdan, 2002).
Polyethylenimine (PEI) is one of the more used polymers in gene
therapeutics. It can be synthesised in different lengths, be branched or linear
and can be functionalised for better compatibility. Regarding polymer vectors,
PEI presents good results when it comes to transfection efficiency (Pun, 2004).
It condenses DNA efficiently forming homogeneous spherical nanoparticles.

20 NANO-SYSTEMS FOR GENE DELIVERY
Branched PEI has a higher molecular weight being more cytotoxic, but also
condenses more DNA since it possesses more available positive charges,
forming smaller nanoparticles. Linear PEI with low molecular weight shows
higher transfection efficiency values and lower cytotoxicity when compared to
branched PEI (Park, 2006). Despite its valuable characteristics, PEI showed
high toxicity in in vivo trials, mostly due to the high amount of positive charges
and the non-biodegradability of the compound. In order to reduce its toxicity,
studies were performed to graft other polymers like polyethylene glycol
(PEG), a non-ionic hydrophilic polymer (Petersen, 2002) or β-cyclodextrin (β-
CD), a sugar polymer with low toxicity (Pun, 2004).
Poly(L-lysine) (PLL) is a homopolypeptide that combined with its
biodegradable nature make it an ideal polymer for DNA transfection. PLL with
a molecular weight above 3 kDa can effectively bind DNA molecules to form
stable complexes. However, at physiological pH, all primary amine groups of
PLL are protonated, which hampers the release of DNA by the endosomes
and, therefore, has a weak transfection efficiency. In addition, PLL complexes
exhibit a high cytotoxicity (Morille, 2008). To overcome these problems, a
numerous of biodegradable PLL conjugates have been synthesised. Poly(lactic-
co-glycolic acid)(PLGA)-grafted-PLL conjugates showed reduced toxicity and
enhancements on the transfection efficiency (Jeong, 2002). Ester-linked PLL-
PEG multiblock copolymers combined with various ratios of histidine residues
promote gene transfer and reduce the cytotoxicity when compared to the
non-derivatised PLL (Bikram, 2004). Polylysine has non-specific cell targeting.
Derivatisation of PLL molecules with targeting moieties is one of the recurrent
solutions for this problem. Hepatic cell targeting uses galactose (Han, 2000) or
lactose (Choi, 1998) moieties. Tumor tissue targeting was achieved by
conjugating PLL to folate (Cho, 2005) or transferrin (Wagner, 1991) molecules.

NANO-SYSTEMS FOR GENE DELIVERY 21
In order to target leukaemia T-cells a specific JL1 antigen was coupled to
polylysine (Suh, 2001).
Natural polysaccharides or carbohydrates are used in gene therapy
due to their properties such as biodegradability, reduced toxicity, long half-life
in the blood stream and the ability to target cells of the liver, spleen, lung and
spinal-cord (Liu, 2008). Numerous saccharides are used in gene delivery such
as dextran (Bisht, 2009), amylose (Kaneko, 2007) and cyclodextrin (Teijeiro-
Osorio, 2009).
Nanoparticles of chitosan and its derivatives are studied in the
pharmaceutical field as drug carriers and DNA delivery systems (Pannier,
2004; Patel, 2012). Chitosan is a linear polymer of β-(1-4)-linked-D-
glucosamine monomers with randomly distributed N-acetyl-D-glucosamine
units obtained by partial deacetylation of chitin, a natural polysaccharide
found principally in crustacean shells such as shrimps and crabs (Jayakumar,
2010b). It is a non-toxic and natural biodegradable cationic polymer with low
immunogenicity and high biocompatibility. Other advantages of this
macromolecule include stability, versatility of physicochemical properties and
the possibility of modification by attaching cell compatible ligands
(Jayakumar, 2010a). However, problems related to chitosan delivery systems
have been reported: the pH dependence (chitosan is insoluble at neutral pH);
the control of particle size, shape and polydispersity due to the variability of
chitosan molecular weight; the limitation of chitosan application in humans
due to hypocholesterolemia caused by high doses of chitosan; the in vitro
transfection rate of DNA-chitosan nanoparticles is very much dependent on
the cell type (Masotti, 2009; Patil, 2005a; Sato, 2001).
The systems are typically prepared either by complexation of the
cationic polymer with anionic DNA or by encapsulation/entrapment of the
active principle in the chitosan matrix. Chitosan colloidal systems have

22 NANO-SYSTEMS FOR GENE DELIVERY
normally a size ranging from a few nanometres to 500 nm (Agnihotri, 2004;
Felt, 1998; Liu, 2008; Nguyen, 2009). They have been used in non-
conventional drug delivery for nasal, ocular and peroral administration in
order to prolong the contact time and protect DNA from nuclease degradation
(Mansouri, 2004; Saranya, 2011).
There are many factors influencing the gene expression or drug
delivery using chitosan systems (Kim, 2007; Mao, 2010). Kiang et al. tested
chitosan molecules with different molecular weight and degree of
deacetylation and determined that these properties play a key role in the
optimisation of the formulations for DNA transfection (Kiang, 2004). An
alternative approach to improve chitosan properties is to chemically modify
its structure by grafting other molecules (Dünnhaupt, 2012; Gao, 2008;
Kaneko, 2007; Zhou, 2011). Mathew et al. conjugated folic acid with
carboxymethyl chitosan to produce nanoparticles capable of targeting and
controlling the release of 5-fluorouracil, an anticancer drug used in
chemotherapy (Mathew, 2010). Park et al. suggested grafting dextran to
galactosylated chitosan for targeting genes to hepatocytes (Park, 2001).
Unmodified chitosan was also grafted to dextran molecules of different
molecular weights, resulting in compounds with different degrees of
substitution and water solubility at different pH (Janciauskaite, 2008).
Dendrimers are spherical, highly branched polymers. They consist of a
central core molecule, where highly branched arms grow to form a tree-like
structure (Chen, 2000). The ramification happens in a well-ordered and
symmetrical way with the repetition of the same sequence of reactions,
producing monodisperse nanoparticles. Dendrimers are classified by the
number of generations, which corresponds to the number of repeated
branching sequences that are performed during the synthesis. High
generation dendrimers (10) have superior transfection efficiencies when

NANO-SYSTEMS FOR GENE DELIVERY 23
compared to low generation dendrimers (2) (Zhu, 2010). Polyamidoamine
(PAMAM) is one of the more popular dendrimers. It is safe, non-immunogenic
and has a high capacity regarding transfection efficiency, due the presence of
primary and tertiary amines (Vaidya, 2011). The primary amine groups play an
important role on the DNA binding, producing compact nanoparticles and
promoting the cellular uptake. The tertiary amines favour the release of DNA
into the cytoplasm by disabling the endosomes (Vaidya, 2011).
2.2.3.2.2.3.2.2.3.2.2.3. InorganicInorganicInorganicInorganic basedbasedbasedbased nanoparticlesnanoparticlesnanoparticlesnanoparticles
Apart from liposomal and polymeric vectors, some new DNA vehicles
have gained attention in the last few years. Inorganic nanoparticles allies
optical, magnetic and other physical properties to the inertness, stability and
ease of functionalization, making them an attractive alternative to organic
vehicles (Huang, 2011).
Metal based nanoparticles hold a high potential for applications in
both diagnostic imaging and targeted drug delivery. Normally, these
nanoparticles are delivered in colloidal formulations with increased circulatory
half-life and carry large amounts of drug due to its extremely small sizes with
large surface areas (Naahidi, 2013). Gold nanoparticles (AuNPs) are one of the
more studied metals as delivery system. They are easy to synthesise with
different sizes, and the process is simple, cheap and reliable. Studies have
shown that these nanoparticles are biocompatible, non-toxic and that their
negative charged surface can be easily functionalised with diverse
macromolecules (Li, 2009; Parveen, 2012). Bhattarai et al. modified the
surface of gold nanoparticles with chitosan. This formulation formed
complexes with plasmid DNA and exhibited higher transfection efficiency in
the stomach and intestine after oral delivery, when compared with
Lipofectin® formulation (Bhattarai, 2008). Li et al. coated gold nanoparticles

24 NANO-SYSTEMS FOR GENE DELIVERY
with DDAB (didodecyldimethylammonium bromide, a cationic lipid). These
nanoparticles can complex to lipoplexes in order to condense more DNA
molecules. This combined system had higher transfection efficiency when
compared to the lipoplexes alone (Li, 2010).
Quantum dots (QDs) are nanoparticles with broad applications in
imaging detection and targeting. Quantum dot refers to a specific kind of
nanoparticles with crystalline structure and composed by a semiconducting
material, such as cadmium sulphite or cadmium selenide. These materials
possess unique optical properties, which associated with its small size (2-10
nm) and the flexible surface chemistry make them ideal systems for gene
therapy (Vengala, 2012). QDs nanoparticles are known to induce toxicity. To
overcome this problem, surface functionality with polymers or peptides has
been done and the systems showed reduced cytotoxicity and enhanced
uptake in vitro and in vivo (Clarke, 2010; Daou, 2009; Tan, 2010). Zhang et al.
proposed water-soluble QDs modified with aminoethanethiol hydrochloride
and sodium thioglycolate, which interact with plasmid DNA through
electrostatic interactions. This system revealed to have high transfection
efficiencies and lower cellular toxicity when compared to Lipofectamine
2000® formulation (Zhang, 2012).
Magnetic nanoparticles (MNPs) have been widely used for
biotechnological and biomedical applications. These nanoparticles have the
ability to target a specific site and thereby reduce the systemic distribution of
the cytotoxic compounds in vivo. The MNPs are dispersed in organic or
inorganic liquid carriers that will be injected into the vascular system and
driven to the targeted site by application of a magnetic field. The genetic
material is released by changing the physiological conditions, for example
(Veiseh, 2010). Super paramagnetic iron oxide nanoparticles (SPIONs) are one
of the more used MNPs in biomedical applications. Based normally on

NANO-SYSTEMS FOR GENE DELIVERY 25
magnetite (Fe3O4) or maghemite (γ-Fe2O3), they are biocompatible and
biodegradable nanoparticles with small sizes up to 500 nm in diameter.
SPIONs are hydrophobic particles with large surface area to volume ratio.
Coating these MNPs with synthetic or natural polymers, such as PEI, chitosan,
dextran, PEG and PLL generates biostable and non-toxic carriers (Kami, 2011).
Fouriki et al. used MNPs composed by iron oxide cores coated with PEI
derivatives. Plasmid DNA was coupled to the MNPs and the system showed
higher transfection potential and lower toxicity when compared with the
commercial formulation Lipofectamine 2000® (Fouriki, 2012).
2.3.2.3.2.3.2.3. ReferencesReferencesReferencesReferences
Agnihotri, S.A.; Mallikarjuna, N.N.; Aminabhavi, T.M. (2004). Recent advances
on chitosan-based micro- and nanoparticles in drug delivery, Journal
of Controlled Release, 100, 5.
Alderuccio, F.; Chan, J.; Scott, D.W.; Toh, B.-H. (2009). Gene therapy and bone
marrow stem-cell transfer to treat autoimmune disease, Trends in
Molecular Medicine, 15, 344.
Atkinson, H.; Chalmers, R. (2010). Delivering the goods: viral and non-viral
gene therapy systems and the inherent limits on cargo DNA and
internal sequences, Genetica, 138, 485.
Baek, K.; Kim, Y.; Kim, H.; Yoon, M.; Hwang, I.; Ko, Y.H.; Kim, K. (2010).
Unconventional U-shaped conformation of a bolaamphiphile
embedded in a synthetic host, Chemical Communications, 46, 4091.
Bhattarai, S.R.; K.C, R.B.; Aryal, S.; Bhattarai, N.; Kim, S.Y.; Yi, H.K.; Hwang,
P.H.; Kim, H.Y. (2008). Hydrophobically modified chitosan/gold
nanoparticles for DNA delivery, Journal of Nanoparticle Research, 10,
151.
26 NANO-SYSTEMS FOR GENE DELIVERY
Biffi, A.; Capotondo, A.; Fasano, S.; Carro, U.d.; Marchesini, S.; Azuma, H.;
Malaguti, M.C.; Amadio, S.; Brambilla, R.; Grompe, M.; Bordignon, C.;
Quattrini, A.; Naldini, L. (2006). Gene therapy of metachromatic
leukodystrophy reverses neurological damage and deficits in mice,
The Journal of Clinical Investigation, 116, 3070.
Bikram, M.; Ahn, C.-H.; Chae, S.Y.; Lee, M.; Yockman, J.W.; Kim, S.W. (2004).
Biodegradable Poly(ethylene glycol)-co-poly(l-lysine)-g-histidine
Multiblock Copolymers for Nonviral Gene Delivery, Macromolecules,
37, 1903.
Bisht, S.; Maitra, A. (2009). Dextran–doxorubicin/chitosan nanoparticles for
solid tumor therapy, Wiley Interdisciplinary Reviews: Nanomedicine
and Nanobiotechnology, 1, 415.
Bomsel, M.; Tudor, D.; Drillet, A.-S.; Alfsen, A.; Ganor, Y.; Roger, M.-G.; Mouz,
N.; Amacker, M.; Chalifour, A.; Diomede, L.; Devillier, G.; Cong, Z.;
Wei, Q.; Gao, H.; Qin, C.; Yang, G.-B.; Zurbriggen, R.; Lopalco, L.;
Fleury, S. (2011). Immunization with HIV-1 gp41 Subunit Virosomes
Induces Mucosal Antibodies Protecting Nonhuman Primates against
Vaginal SHIV Challenges, Immunity, 34, 269.
Boulanger, C.; Di Giorgio, C.; Gaucheron, J.; Vierling, P. (2004). Transfection
with fluorinated lipoplexes based on new fluorinated cationic lipids
and in the presence of a bile salt surfactant, Bioconjugate Chemistry,
15, 901.
Boussif, O.; Lezoualc'h, F.; Zanta, M.A.; Mergny, M.D.; Scherman, D.;
Demeneix, B.; Behr, J.P. (1995). A versatile vector for gene and
oligonucleotide transfer into cells in culture and in vivo:
polyethylenimine, Proceedings of the National Academy of Sciences,
92, 7297.

NANO-SYSTEMS FOR GENE DELIVERY 27
Brannon-Peppas, L.; Blanchette, J.O. (2004). Nanoparticle and targeted
systems for cancer therapy, Advanced Drug Delivery Reviews, 56,
1649.
Brunelle, M.; Polidori, A.; Denoyelle, S.; Fabiano, A.S.; Vuillaume, P.Y.;
Laurent-Lewandowski, S.; Pucci, B. (2009). A structure-activity
investigation of hemifluorinated bifunctional bolaamphiphiles
designed for gene delivery, Comptes Rendus Chimie, 12, 188.
Buckley, S.M.K.; Rahim, A.A.; Chan, J.K.Y.; David, A.L.; Peebles, D.M.; Coutelle,
C.; Waddington, S.N. (2011). Recent advances in fetal gene therapy,
Therapeutic Delivery, 2, 461.
Callejas, D.; Mann, C.J.; Ayuso, E.; Lage, R.; Grifoll, I.; Roca, C.; Andaluz, A.;
Ruiz-de Gopegui, R.; Montane, J.; Muńoz, S.; Ferre, T.; Haurigot, V.;
Zhou, S.; Ruberte, J.; Mingozzi, F.; High, K.; Garcia, F.; Bosch, F.
(2013). Treatment of Diabetes and Long-term Survival Following
Insulin and Glucokinase Gene Therapy, Diabetes, DOI: 10.2337/db12-
1113.
Caracciolo, G.; Caminiti, R. (2005). Do DC-Chol/DOPE-DNA complexes really
form an inverted hexagonal phase?, Chemical Physics Letters, 411,
327.
Caracciolo, G.; Amenitsch, H. (2012). Cationic liposome/DNA complexes: from
structure to interactions with cellular membranes, European
Biophysics Journal, 41, 815.
Caschera, F.; de la Serna, J.B.; Löffler, P.M.G.; Rasmussen, T.E.; Hanczyc, M.M.;
Bagatolli, L.A.; Monnard, P.A. (2011). Stable Vesicles Composed of
Monocarboxylic or Dicarboxylic Fatty Acids and Trimethylammonium
Amphiphiles, Langmuir, 27, 14078.
Chen, W.; Turro, N.J.; Tomalia, D.A. (2000). Using ethidium bromide to probe
the interactions between DNA and dendrimers, Langmuir, 16, 15.

28 NANO-SYSTEMS FOR GENE DELIVERY
Cho, K.C.; Kim, S.H.; Jeong, J.H.; Park, T.G. (2005). Folate Receptor-Mediated
Gene Delivery Using Folate-Poly(ethylene glycol)-Poly(L-lysine)
Conjugate, Macromolecular Bioscience, 5, 512.
Choi, Y.H.; Liu, F.; Park, J.S.; Kim, S.W. (1998). Lactose-Poly(ethylene Glycol)-
Grafted Poly-l-Lysine as Hepatoma Cell-Targeted Gene Carrier,
Bioconjugate Chemistry, 9, 708.
Clarke, S.; Pinaud, F.; Beutel, O.; You, C.; Piehler, J.; Dahan, M. (2010).
Covalent Monofunctionalization of Peptide-Coated Quantum Dots for
Single-Molecule Assays, Nano Letters, 10, 2147.
Crook, K.; Stevenson, B.J.; Dubouchet, M.; Porteous, D.J. (1998). Inclusion of
cholesterol in DOTAP transfection complexes increases the delivery
of DNA to cells in vitro in the presence of serum, Gene Therapy, 5,
137.
Dakwar, G.R.; Hammad, I.A.; Popov, M.; Linder, C.; Grinberg, S.; Heldman, E.;
Stepensky, D. (2012). Delivery of proteins to the brain by
bolaamphiphilic nano-sized vesicles, Journal of Controlled Release,
160, 315.
Daou, T.J.; Li, L.; Reiss, P.; Josserand, V.r.; Texier, I. (2009). Effect of
Poly(ethylene glycol) Length on the in Vivo Behavior of Coated
Quantum Dots, Langmuir, 25, 3040.
Drulis-Kawa, Z.; Dorotkiewicz-Jach, A. (2010). Liposomes as delivery systems
for antibiotics, International Journal of Pharmaceutics, 387, 187.
Dua, J.S.; Rana, A.C.; Bhandari, A.K. (2012). Liposome: methods of preparation
and applications, International Journal of Pharmaceutical Studies and
Research, 3, 14.
Dünnhaupt, S.; Barthelmes, J.; Iqbal, J.; Perera, G.; Thurner, C.C.; Friedl, H.;
Bernkop-Schnürch, A. (2012). In vivo evaluation of an oral drug

NANO-SYSTEMS FOR GENE DELIVERY 29
delivery system for peptides based on S-protected thiolated chitosan,
Journal of Controlled Release, 160, 477.
Felt, O.; Buri, P.; Gurny, R. (1998). Chitosan: A unique polysaccharide for drug
delivery, Drug Development and Industrial Pharmacy, 24, 979.
Fischer, A.; Hacein-Bey-Abina, S.; Cavazzana-Calvo, M. (2010). 20 years of
gene therapy for SCID, Nature Immunology, 11, 457.
Fouriki, A.; Clements, M.A.; Farrow, N.; Dobson, J. (2012). Efficient
transfection of MG-63 osteoblasts using magnetic nanoparticles and
oscillating magnetic fields, Journal of Tissue Engineering and
Regenerative Medicine, 10.1002/term.1508.n/a.
Fuhrhop, J.-H.; Wang, T. (2004). Bolaamphiphiles, Chemical Reviews, 104,
2901.
Fuhrhop, J.H.; Fritsch, D. (1986). Bolaamphiphiles form ultrathin, porous and
unsymmetric monolayer lipid membranes, Accounts of Chemical
Research, 19, 130.
Gao, H.; Shi, W.; Freund, L.B. (2005). Mechanics of receptor-mediated
endocytosis, Proceedings of the National Academy of Sciences of the
United States of America, 102, 9469.
Gao, Y.; Xu, Z.; Chen, S.; Gu, W.; Chen, L.; Li, Y. (2008). Arginine-chitosan/DNA
self-assemble nanoparticles for gene delivery: In vitro characteristics
and transfection efficiency, International Journal of Pharmaceutics,
359, 241.
Gaucheron, J.; Santaella, C.; Vierling, P. (2000). Highly Fluorinated
Lipospermines for Gene Transfer: Synthesis and Evaluation of Their in
Vitro Transfection Efficiency, Bioconjugate Chemistry, 12, 114.
Gaucheron, J.; Boulanger, C.; Santaella, C.; Sbirrazzuoli, N.; Boussif, O.;
Vierling, P. (2001a). In Vitro Cationic Lipid-Mediated Gene Delivery

30 NANO-SYSTEMS FOR GENE DELIVERY
with Fluorinated Glycerophosphoethanolamine Helper Lipids,
Bioconjugate Chemistry, 12, 949.
Gaucheron, J.; Santaella, C.; Vierling, P. (2001b). Improved in vitro gene
transfer mediated by fluorinated lipoplexes in the presence of a bile
salt surfactant, The Journal of Gene Medicine, 3, 338.
Gaucheron, J.; Santaella, C.; Vierling, P. (2002). Transfection with fluorinated
lipoplexes based on fluorinated analogues of DOTMA, DMRIE and
DPPES, Biochimica et Biophysica Acta (BBA) - Biomembranes, 1564,
349.
Geusens, B.; Strobbe, T.; Bracke, S.; Dynoodt, P.; Sanders, N.; Gele, M.V.;
Lambert, J. (2011). Lipid-mediated gene delivery to the skin,
European Journal of Pharmaceutical Sciences, 43, 199.
Ginn, S.L.; Alexander, I.E.; Edelstein, M.L.; Abedi, M.R.; Wixon, J. (2013). Gene
therapy clinical trials worldwide to 2012 – an update, The Journal of
Gene Medicine, 15, 65.
Grinberg, S.; Kipnis, N.; Linder, C.; Kolot, V.; Heldman, E. (2010). Asymmetric
bolaamphiphiles from vernonia oil designed for drug delivery,
European Journal of Lipid Science and Technology, 112, 137.
Gu, Q.; Zou, A.; Yuan, C.; Guo, R. (2003). Effects of a bolaamphiphile on the
structure of phosphatidylcholine liposomes, Journal of Colloid and
Interface Science, 266, 442.
Gu, Y.; Zhang, J.; Guo, L.; Cui, S.; Li, X.; Ding, D.; Kim, J.-M.; Ho, S.-H.; Hahn, W.;
Kim, S. (2011). A phase I clinical study of naked DNA expressing two
isoforms of hepatocyte growth factor to treat patients with critical
limb ischemia, The Journal of Gene Medicine, 13, 602.
Halter, M.; Nogata, Y.; Dannenberger, O.; Sasaki, T.; Vogel, V. (2004).
Engineered Lipids That Cross-Link the Inner and Outer Leaflets of
Lipid Bilayers, Langmuir, 20, 2416.

NANO-SYSTEMS FOR GENE DELIVERY 31
Han, J.; Il Yeom, Y. (2000). Specific gene transfer mediated by galactosylated
poly-l-lysine into hepatoma cells, International Journal of
Pharmaceutics, 202, 151.
Herweijer, H.; Wolff, J.A. (2003). Progress and prospects: naked DNA gene
transfer and therapy, Gene Therapy, 10, 453.
Honda, M.; Asai, T.; Oku, N.; Araki, Y.; Tanaka, M.; Ebihara, N. (2013).
Liposomes and nanotechnology in drug development: Focus on
ocular targets, International Journal of Nanomedicine, 8, 495.
Huang, H.-C.; Barua, S.; Sharma, G.; Dey, S.K.; Rege, K. (2011). Inorganic
nanoparticles for cancer imaging and therapy, Journal of Controlled
Release, 155, 344.
Huh, N.W.; Porter, N.A.; McIntosh, T.J.; Simon, S.A. (1996). The interaction of
polyphenols with bilayers: Conditions for increasing bilayer adhesion,
Biophysical Journal, 71, 3261.
Hui, S.W.; Langner, M.; Zhao, Y.L.; Ross, P.; Hurley, E.; Chan, K. (1996). The
role of helper lipids in cationic liposome-mediated gene transfer,
Biophysical Journal, 71, 590.
Hutter, T.; Linder, C.; Heldman, E.; Grinberg, S. (2012). Interfacial and self-
assembly properties of bolaamphiphilic compounds derived from a
multifunctional oil, Journal of Colloid and Interface Science, 365, 53.
Jain, N.; Arntz, Y.; Goldschmidt, V.r.; Duportail, G.; Mély, Y.; Klymchenko, A.S.
(2010). New Unsymmetrical Bolaamphiphiles: Synthesis, Assembly
with DNA, and Application for Gene Delivery, Bioconjugate
Chemistry, 21, 2110.
Jain, N.; Goldschmidt, V.; Oncul, S.; Arntz, Y.; Duportail, G.; Mély, Y.;
Klymchenko, A.S. (2012). Lactose-ornithine bolaamphiphiles for
efficient gene delivery in vitro, International Journal of
Pharmaceutics, 423, 392.

32 NANO-SYSTEMS FOR GENE DELIVERY
Janciauskaite, U.; Rakutyte, V.; Miskinis, J.; Makuska, R. (2008). Synthesis and
properties of chitosan-N-dextran graft copolymers, Reactive and
Functional Polymers, 68, 787.
Jayakumar, R.; Chennazhi, K.P.; Muzzarelli, R.A.A.; Tamura, H.; Nair, S.V.;
Selvamurugan, N. (2010a). Chitosan conjugated DNA nanoparticles in
gene therapy, Carbohydrate Polymers, 79, 1.
Jayakumar, R.; Prabaharan, M.; Nair, S.V.; Tokura, S.; Tamura, H.;
Selvamurugan, N. (2010b). Novel carboxymethyl derivatives of chitin
and chitosan materials and their biomedical applications, Progress in
Materials Science, 55, 675.
Jean, M.; Alameh, M.; Buschmann, M.D.; Merzouki, A. (2011). Effective and
safe gene-based delivery of GLP-1 using chitosan/plasmid-DNA
therapeutic nanocomplexes in an animal model of type 2 diabetes,
Gene Therapy, 18, 807.
Jeong, J.H.; Park, T.G. (2002). Poly(l-lysine)-g-poly(d,l-lactic-co-glycolic acid)
micelles for low cytotoxic biodegradable gene delivery carriers,
Journal of Controlled Release, 82, 159.
Jesorka, A.; Orwar, O. (2008). Liposomes: Technologies and Analytical
Applications, Annual Review of Analytical Chemistry, 1, 801.
Jewell, C.M.; Lynn, D.M. (2008). Surface-mediated delivery of DNA: Cationic
polymers take charge, Current Opinion in Colloid & Interface Science,
13, 395.
Kami, D.; Takeda, S.; Itakura, Y.; Gojo, S.; Watanabe, M.; Toyoda, M. (2011).
Application of Magnetic Nanoparticles to Gene Delivery,
International Journal of Molecular Sciences, 12, 3705.
Kamimura, K.; Suda, T.; Guisheng, Z.; Dexi, L. (2011). Advances in Gene
Delivery Systems, Pharmaceutical Medicine - New Zealand, 25, 293.

NANO-SYSTEMS FOR GENE DELIVERY 33
Kaneko, Y.; Matsuda, S.I.; Kadokawa, J.I. (2007). Chemoenzymatic synthesis of
amylose-grafted chitin and chitosan, Biomacromolecules, 8, 3959.
Kaufman, Y.; Grinberg, S.; Linder, C.; Heldman, E.; Gilron, J.; Freger, V. (2013).
Fusion of bolaamphiphile micelles: A method to prepare stable
supported biomimetic membranes, Langmuir, 29, 1152.
Kay, M.A.; Glorioso, J.C.; Naldini, L. (2001). Viral vectors for gene therapy: the
art of turning infectious agents into vehicles of therapeutics, Nature
Medicine, 7, 33.
Kay, M.A. (2011). State-of-the-art gene-based therapies: The road ahead,
Nature Reviews Genetics, 12, 316.
Kiang, T.; Wen, J.; Lim, H.W.; Leong, K.W.K.W. (2004). The effect of the degree
of chitosan deacetylation on the efficiency of gene transfection,
Biomaterials, 25, 5293.
Kiem, H.-P.; Jerome, Keith R.; Deeks, Steven G.; McCune, Joseph M. (2012).
Hematopoietic-Stem-Cell-Based Gene Therapy for HIV Disease, Cell
Stem Cell, 10, 137.
Kim, S.U.; de Vellis, J. (2009). Stem cell-based cell therapy in neurological
diseases: A review, Journal of Neuroscience Research, 87, 2183.
Kim, T.-H.; Jiang, H.-L.; Jere, D.; Park, I.-K.; Cho, M.-H.; Nah, J.-W.; Choi, Y.-J.;
Akaike, T.; Cho, C.-S. (2007). Chemical modification of chitosan as a
gene carrier in vitro and in vivo, Progress in Polymer Science, 32, 726.
Kissa, E.; Fluorinated Surfactants: Synthesis, Properties, Applications, Vol. 50,
Marcel Dekker, United States of America, 1994.
Klein, E.; Ciobanu, M.; Klein, J.; MacHi, V.; Leborgne, C.; Vandamme, T.; Frisch,
B.; Pons, F.; Kichler, A.; Zuber, G.; Lebeau, L. (2010). "HFP" fluorinated
cationic lipids for enhanced lipoplex stability and gene delivery,
Bioconjugate Chemistry, 21, 360.

34 NANO-SYSTEMS FOR GENE DELIVERY
Krafft, M.P.; Riess, J.G. (1998). Highly fluorinated amphiphiles and colloidal
systems, and their applications in the biomedical field. A
contribution, Biochimie, 80, 489.
Krafft, M.P. (2001). Fluorocarbons and fluorinated amphiphiles in drug
delivery and biomedical research, Advanced Drug Delivery Reviews,
47, 209.
Krafft, M.P.; Goldmann, M. (2003). Monolayers made from fluorinated
amphiphiles, Current Opinion in Colloid & Interface Science, 8, 243.
Laouini, A.; Charcosset, C.; Fessi, H.; Holdich, R.G.; Vladisavljevic, G.T. (2013).
Preparation of liposomes: a novel application of microengineered
membranes - investigation of the process parameters and application
to the encapsulation of vitamin E, RSC Advances, 3, 4985.
Leal, C.; Moniri, E.; Pegado, L.; Wennerstrom, H. (2007). Electrostatic
attraction between DNA and a cationic surfactant aggregate. The
screening effect of salt, Journal of Physical Chemistry B, 111, 5999.
Leese, P.T.; Noveck, R.J.; Shorr, J.S.; Woods, C.M.; Flaim, K.E.; Keipert, P.E.
(2000). Randomized safety studies of intravenous perflubron
emulsion. I. Effects on coagulation function in healthy volunteers,
Anesthesia and Analgesia, 91, 804.
Leventis, R.; Silvius, J.R. (1990). Interactions of mammalian cells with lipid
dispersions containing novel metabolizable cationic amphiphiles,
Biochimica et Biophysica Acta (BBA) - Biomembranes, 1023, 124.
Li, C.; Bowles, D.E.; van Dyke, T.; Samulski, R.J. (2005). Adeno-associated virus
vectors: potential applications for cancer gene therapy, Cancer Gene
Therapy, 12, 913.
Li, D.; Li, P.; Li, G.; Wang, J.; Wang, E. (2009). The effect of nocodazole on the
transfection efficiency of lipid-bilayer coated gold nanoparticles,
Biomaterials, 30, 1382.

NANO-SYSTEMS FOR GENE DELIVERY 35
Li, D.; Li, G.; Li, P.; Zhang, L.; Liu, Z.; Wang, J.; Wang, E. (2010). The
enhancement of transfection efficiency of cationic liposomes by
didodecyldimethylammonium bromide coated gold nanoparticles,
Biomaterials, 31, 1850.
Liu, Z.; Jiao, Y.; Wang, Y.; Zhou, C.; Zhang, Z. (2008). Polysaccharides-based
nanoparticles as drug delivery systems, Advanced Drug Delivery
Reviews, 60, 1650.
Lonez, C.; Vandenbranden, M.; Ruysschaert, J.-M. (2008). Cationic liposomal
lipids: From gene carriers to cell signaling, Progress in Lipid Research,
47, 340.
Luo, D.; Saltzman, W.M. (2000). Synthetic DNA delivery systems, Nature
Biotechnology, 18, 33.
Manfredsson, F.P.; Mandel, R.J. (2010). Development of gene therapy for
neurological disorders, Discovery medicine, 9, 204.
Mansouri, S.; Lavigne, P.; Corsi, K.; Benderdour, M.; Beaumont, E.; Fernandes,
J.C. (2004). Chitosan-DNA nanoparticles as non-viral vectors in gene
therapy: strategies to improve transfection efficacy, European Journal
of Pharmaceutics and Biopharmaceutics, 57, 1.
Mao, S.; Sun, W.; Kissel, T. (2010). Chitosan-based formulations for delivery of
DNA and siRNA, Advanced Drug Delivery Reviews, 62, 12.
Masotti, A.; Ortaggi, G. (2009). Chitosan Micro- and Nanospheres: Fabrication
and Applications for Drug and DNA Delivery, Mini-Reviews in
Medicinal Chemistry, 9, 463.
Mathew, M.E.; Mohan, J.C.; Manzoor, K.; Nair, S.V.; Tamura, H.; Jayakumar, R.
(2010). Folate conjugated carboxymethyl chitosan-manganese doped
zinc sulphide nanoparticles for targeted drug delivery and imaging of
cancer cells, Carbohydrate Polymers, 80, 442.

36 NANO-SYSTEMS FOR GENE DELIVERY
Meister, A.; Weygand, M.J.; Brezesinski, G.; Kerth, A.; Drescher, S.; Dobner, B.;
Blume, A. (2007). Evidence for a Reverse U-Shaped Conformation of
Single-Chain Bolaamphiphiles at the Air−Water Interface, Langmuir,
23, 6063.
Merdan, T.; Kopecek, J.; Kissel, T. (2002). Prospects for cationic polymers in
gene and oligonucleotide therapy against cancer, Advanced Drug
Delivery Reviews, 54, 715.
Miguel, M.G.; Pais, A.; Dias, R.S.; Leal, C.; Rosa, M.; Lindman, B. (2003). DNA-
cationic amphiphile interactions, Colloids and Surfaces A:
Physicochemical and Engineering Aspects, 228, 43.
Mintzer, M.A.; Simanek, E.E. (2009). Nonviral Vectors for Gene Delivery,
Chemical Reviews, 109, 259.
Mitomo, K.; Griesenbach, U.; Inoue, M.; Somerton, L.; Meng, C.; Akiba, E.;
Tabata, T.; Ueda, Y.; Frankel, G.M.; Farley, R.; Singh, C.; Chan, M.;
Munkonge, F.; Brum, A.; Xenariou, S.; Escudero-Garcia, S.; Hasegawa,
M.; Alton, E.W. (2010). Toward gene therapy for cystic fibrosis using a
lentivirus pseudotyped with Sendai virus envelopes, Molecular
Therapy, 18, 1173.
Morille, M.; Passirani, C.; Vonarbourg, A.; Clavreul, A.; Benoit, J.P. (2008).
Progress in developing cationic vectors for non-viral systemic gene
therapy against cancer, Biomaterials, 29, 3477.
Morishita, R.; Makino, H.; Aoki, M.; Hashiya, N.; Yamasaki, K.; Azuma, J.;
Taniyama, Y.; Sawa, Y.; Kaneda, Y.; Ogihara, T. (2011). Phase I/IIa
Clinical Trial of Therapeutic Angiogenesis Using Hepatocyte Growth
Factor Gene Transfer to Treat Critical Limb Ischemia, Arteriosclerosis,
Thrombosis, and Vascular Biology, 31, 713.

NANO-SYSTEMS FOR GENE DELIVERY 37
Moser, C.; Amacker, M.; Zurbriggen, R. (2011). Influenza virosomes as a
vaccine adjuvant and carrier system, Expert Review of Vaccines, 10,
437.
Moss, R.A.; Fujita, T.; Okumura, Y. (1991). Dynamics of a bolaamphiphilic lipid
in a bilayer liposome, Langmuir, 7, 2415.
Muñoz-Úbeda, M.; Rodríguez-Pulido, A.; Nogales, A.; Martín-Molina, A.;
Aicart, E.; Junquera, E. (2010). Effect of lipid composition on the
structure and theoretical phase diagrams of DC-Chol/DOPE-DNA
lipoplexes, Biomacromolecules, 11, 3332.
Naahidi, S.; Jafari, M.; Edalat, F.; Raymond, K.; Khademhosseini, A.; Chen, P.
(2013). Biocompatibility of engineered nanoparticles for drug
delivery, Journal of Controlled Release, 166, 182.
Nayak, S.; Herzog, R.W. (2010). Progress and prospects: Immune responses to
viral vectors, Gene Therapy, 17, 295.
Nguyen, D.N.; Green, J.J.; Chan, J.M.; Longer, R.; Anderson, D.G. (2009).
Polymeric Materials for Gene Delivery and DNA Vaccination,
Advanced Materials, 21, 847.
Nuraje, N.; Bai, H.; Su, K. (2012). Bolaamphiphilic molecules: Assembly and
applications, Progress in Polymer Science,
Otmane Boussif; Jérôme Gaucheron; Caroline Boulanger; Catherine Santaella;
Hanno V. J. Kolbe; Pierre Vierling (2001). Enhanced in vitro and in
vivo cationic lipid-mediated gene delivery with a fluorinated
glycerophosphoethanolamine helper lipid, The Journal of Gene
Medicine, 3, 109.
Pannier, A.K.; Shea, L.D. (2004). Controlled release systems for DNA delivery,
Molecular Therapy, 10, 19.

38 NANO-SYSTEMS FOR GENE DELIVERY
Park, I.K.; Park, Y.H.; Shin, B.A.; Choi, E.S.; Kim, Y.R.; Akaike, T.; Cho, C.S.
(2001). Galactosylated chitosan-graft-dextran as hepatocyte-
targeting DNA carrier, Journal of Controlled Release, 75, 433.
Park, T.G.; Jeong, J.H.; Kim, S.W. (2006). Current status of polymeric gene
delivery systems, Advanced Drug Delivery Reviews, 58, 467.
Parveen, S.; Misra, R.; Sahoo, S.K. (2012). Nanoparticles: a boon to drug
delivery, therapeutics, diagnostics and imaging, Nanomedicine:
Nanotechnology, Biology and Medicine, 8, 147.
Patel, T.; Zhou, J.; Piepmeier, J.M.; Saltzman, W.M. (2012). Polymeric
nanoparticles for drug delivery to the central nervous system,
Advanced Drug Delivery Reviews, 64, 701.
Patil, S.; Rhodes, D.; Burgess, D. (2004). Anionic liposomal delivery system for
DNA transfection, The AAPS Journal, 6, 13.
Patil, S.; Rhodes, D.; Burgess, D. (2005a). DNA-based therapeutics and DNA
delivery systems: A comprehensive review, The AAPS Journal, 7, E61.
Patil, S.D.; Rhodes, D.G.; Burgess, D.J. (2005b). Biophysical characterization of
anionic lipoplexes, Biochimica et Biophysica Acta (BBA) -
Biomembranes, 1711, 1.
Pedroso de Lima, M.C.; Neves, S.; Filipe, A.; Düzgüneş, N.; Simões, S. (2003).
Cationic liposomes for gene delivery: from biophysics to biological
applications, Current Medicinal Chemistry, 10, 1221.
Petersen, H.; Fechner, P.M.; Fischer, D.; Kissel, T. (2002). Synthesis,
Characterization, and Biocompatibility of Polyethylenimine-graft-
poly(ethylene glycol) Block Copolymers, Macromolecules, 35, 6867.
Popov, M.; Linder, C.; Deckelbaum, R.J.; Grinberg, S.; Hansen, I.H.; Shaubi, E.;
Waner, T.; Heldman, E. (2010). Cationic vesicles from novel
bolaamphiphilic compounds, Journal of Liposome Research, 20, 147.

NANO-SYSTEMS FOR GENE DELIVERY 39
Pringle, I.; Hyde, S.; Gill, D. (2009). Non-viral vectors in cystic fibrosis gene
therapy: recent developments and future prospects, Expert Opinion
on Biological Therapy, 9, 991.
Pun, S.H.; Bellocq, N.C.; Liu, A.; Jensen, G.; Machemer, T.; Quijano, E.; Schluep,
T.; Wen, S.; Engler, H.; Heidel, J.; Davis, M.E. (2004). Cyclodextrin-
Modified Polyethylenimine Polymers for Gene Delivery, Bioconjugate
Chemistry, 15, 831.
Ramesh, R.; Saeki, T.; Templeton, N.S.; Ji, L.; Stephens, L.C.; Ito, I.; Wilson,
D.R.; Wu, Z.; Branch, C.D.; Minna, J.D.; Roth, J.A. (2001). Successful
treatment of primary and disseminated human lung cancers by
systemic delivery of tumor suppressor genes using an improved
liposome vector, Molecular Therapy, 3, 337.
Rao, N.M. (2010). Cationic lipid-mediated nucleic acid delivery: beyond being
cationic, Chemistry and Physics of Lipids, 163, 245.
Riess, J.G. (1984). Reassessment of Criteria for the Selection of
Perfluorochemicals for Second-Generation Blood Substitutes:
Analysis of Structure/Property Relationships, Artificial Organs, 8, 44.
Riess, J.G.; Pace, S.; Zarif, L. (1991). Highly effective surfactants with low
hemolytic activity, Advanced Materials, 3, 249.
Riess, J.G. (1994a). Highly fluorinated systems for oxygen transport, diagnosis
and drug delivery, Colloids and Surfaces A: Physicochemical and
Engineering Aspects, 84, 33.
Riess, J.G. (1994b). Fluorinated Vesicles, Journal of Drug Targeting, 2, 455.
Riess, J.G. (2009). Highly fluorinated amphiphilic molecules and self-
assemblies with biomedical potential, Current Opinion in Colloid &
Interface Science, 14, 294.
Rodrigues, C.; Gameiro, P.; Reis, S.; Lima, J.L.; de Castro, B. (2001). Derivative
spectrophotometry as a tool for the determination of drug partition

40 NANO-SYSTEMS FOR GENE DELIVERY
coefficients in water/dimyristoyl-L-alpha-phosphatidylglycerol
(DMPG) liposomes, Biophysical Chemistry, 94, 97.
Rodríguez-Pulido, A.; Martín-Molina, A.; Rodríguez-Beas, C.s.; Llorca, O.;
Aicart, E.; Junquera, E. (2009). A Theoretical and Experimental
Approach to the Compaction Process of DNA by
Dioctadecyldimethylammonium Bromide/Zwitterionic Mixed
Liposomes, The Journal of Physical Chemistry B, 113, 15648.
Rosa, M.; Gambacorta, A.; Gliozzi, A. (1986). Structure, biosynthesis, and
physicochemical properties of archaebacterial lipids, Microbiological
Reviews, 50, 70.
Saranya, N.; Moorthi, A.; Saravanan, S.; Devi, M.P.; Selvamurugan, N. (2011).
Chitosan and its derivatives for gene delivery, International Journal of
Biological Macromolecules, 48, 234.
Saraswat, P.; Soni, R.R.; Bhandari, A.; Nagori, B.P. (2009). DNA as therapeutics;
An update, Indian Journal of Pharmaceutical Sciences, 71, 488.
Sato, T.; Ishii, T.; Okahata, Y. (2001). In vitro gene delivery mediated by
chitosan. Effect of pH, serum, and molecular mass of chitosan on the
transfection efficiency, Biomaterials, 22, 2075.
Sennato, S.; Truzzolillo, D.; Bordi, F.; Cametti, C. (2008). Effect of Temperature
on the Reentrant Condensation in Polyelectrolyte-Liposome
Complexation, Langmuir, 24, 12181.
Seow, Y.; Wood, M.J. (2009). Biological gene delivery vehicles: beyond viral
vectors, Molecular Therapy, 17, 767.
Sharma, R.; Yasir, M. (2010). Virosomes: A novel carrier for drug delivery,
International Journal of PharmTech Research, 2, 2327.
Shimanouchi, T.; Shimauchi, N.; Ohnishi, R.; Kitaura, N.; Yagi, H.; Goto, Y.;
Umakoshi, H.; Kuboi, R. (2012). Formation of spherulitic amyloid β

NANO-SYSTEMS FOR GENE DELIVERY 41
aggregate by anionic liposomes, Biochemical and Biophysical
Research Communications, 426, 165.
Shinoda, K.; Hato, M.; Hayashi, T. (1972). Physicochemical properties of
aqueous solutions of fluorinated surfactants, The Journal of Physical
Chemistry, 76, 909.
Strayer, D.S.; Akkina, R.; Bunnell, B.A.; Dropulic, B.; Planelles, V.; Pomerantz,
R.J.; Rossi, J.J.; Zaia, J.A. (2005). Current status of gene therapy
strategies to treat HIV/AIDS, Molecular Therapy, 11, 823.
Suh, W.; Chung, J.-K.; Park, S.-H.; Kim, S.W. (2001). Anti-JL1 antibody-
conjugated poly (l-lysine) for targeted gene delivery to leukemia T
cells, Journal of Controlled Release, 72, 171.
Summerton, J.E. (2007). Morpholino, siRNA, and S-DNA compared: impact of
structure and mechanism of action on off-target effects and
sequence specificity, Current Topics in Medicinal Chemistry, 7, 651.
Tan, S.J.; Jana, N.R.; Gao, S.; Patra, P.K.; Ying, J.Y. (2010). Surface-Ligand-
Dependent Cellular Interaction, Subcellular Localization, and
Cytotoxicity of Polymer-Coated Quantum Dots, Chemistry of
Materials, 22, 2239.
Tarahovsky, Y.S. (2009). Cell transfection by DNA-lipid complexes - lipoplexes,
Biochemistry. Biokhimiıa, 74, 1293.
Teijeiro-Osorio, D.; Remuñán-López, C.; Alonso, M.J. (2009).
Chitosan/cyclodextrin nanoparticles can efficiently transfect the
airway epithelium in vitro, European Journal of Pharmaceutics and
Biopharmaceutics, 71, 257.
Urnov, F.D.; Rebar, E.J.; Holmes, M.C.; Zhang, H.S.; Gregory, P.D. (2010).
Genome editing with engineered zinc finger nucleases, Nature
Reviews: Genetics, 11, 636.

42 NANO-SYSTEMS FOR GENE DELIVERY
Vaidya, A.; Agarwal, A.; Jain, A.; Agrawal, R.K.; Jain, S.K. (2011). Bioconjugation
of polymers: a novel platform for targeted drug delivery, Current
Pharmaceutical Design, 17, 1108.
Veiseh, O.; Gunn, J.W.; Zhang, M. (2010). Design and fabrication of magnetic
nanoparticles for targeted drug delivery and imaging, Advanced Drug
Delivery Reviews, 62, 284.
Vengala, P.; Dasari, A.; Yeruva, N. (2012). Quantum dots for drug delivery and
therapy, International Journal of Pharmacy and Technology, 4, 2055.
Wagner, E.; Cotten, M.; Mechtler, K.; Kirlappos, H.; Birnstiel, M.L. (1991).
DNA-binding transferrin conjugates as functional gene-delivery
agents: synthesis by linkage of polylysine or ethidium homodimer to
the transferrin carbohydrate moiety, Bioconjugate Chemistry, 2, 226.
Walther, W.; Stein, U. (2000). Viral vectors for gene transfer: a review of their
use in the treatment of human diseases, Drugs, 60, 249.
Xu, L.; Anchordoquy, T.J. (2008). Cholesterol domains in cationic lipid/DNA
complexes improve transfection, Biochimica et Biophysica Acta (BBA)
- Biomembranes, 1778, 2177.
Yan, Y.; Lu, T.; Huang, J. (2009). Recent advances in the mixed systems of
bolaamphiphiles and oppositely charged conventional surfactants,
Journal of Colloid and Interface Science, 337, 1.
Zelphati, O.; Szoka, F.C. (1996). Liposomes as a carrier for intracellular delivery
of antisense oligonucleotides: a real or magic bullet?, Journal of
Controlled Release, 41, 99.
Zhang, H.-L.; Zhang, M.-Z.; Li, X.-Y.; Wan, M.; Li, Y.-Q.; Zhang, R.-Y.; Zhao, Y.-D.
(2012). A convenient method of preparing gene vector for real time
monitoring transfection process based on the quantum dots,
Materials Research Bulletin, 47, 3330.

NANO-SYSTEMS FOR GENE DELIVERY 43
Zhang, S.; Xu, Y.; Wang, B.; Qiao, W.; Liu, D.; Li, Z. (2004). Cationic compounds
used in lipoplexes and polyplexes for gene delivery, Journal of
Controlled Release, 100, 165.
Zhou, Y.; Chen, J.H.; Wang, H.; Wang, C.X.; Zhang, J.Y.; Tao, Y.W.; Zheng, G.;
Xie, H.Y. (2011). Synthesis and characterization of folate-
poly(ethylene glycol) chitosan graft-polyethylenimine as a non-viral
carrier for tumor-targeted gene delivery, African Journal of
Biotechnology, 10, 6120.
Zhu, L.; Mahato, R.I. (2010). Lipid and polymeric carrier-mediated nucleic acid
delivery, Expert Opinion on Drug Delivery, 7, 1209.


INTERACTION OF DNA WITH LIPID MONOLAYERS 45
Chapter 3
3.3.3.3. Interaction of DNA with lipid Interaction of DNA with lipid Interaction of DNA with lipid Interaction of DNA with lipid
monolayersmonolayersmonolayersmonolayers
Interfacial research investigates the thermodynamics of the adsorption
layers at the liquid interface in order to better understand the equilibrium
process at the surface of liquids or at the interface between two liquids
(Fainerman, 1998). Mixed monolayers of insoluble lipids usually present
deviations to the Langmuir adsorption isotherm and the equation of state for
adsorption layers, due to different molar area values. Also the ability for
reorientation and aggregation of some lipids interferes with the fluid state of
the monolayers (Fainerman, 1998).
The application of emerging technology with high resolutions at the
nanoscale level allows a deeper study of the thermodynamics involved in the
interfacial equilibrium through Langmuir monolayers. Techniques as pressure-
area isotherms, surface potential, Brewster angle microscopy (BAM) and
infrared reflection-absorption spectroscopy (IRRAS) were used to study
interactions in two-dimensional arrangements of amphiphilic molecules
(Buschow, 2001; Butt, 2006; Maltseva, 2005). These methods allow a

46 INTERACTION OF DNA WITH LIPID MONOLAYERS
considerable knowledge on interactions between different species, their
molecular orientation and defects, the shape and texture of the domains and
the two-dimensional lattice structure. These techniques are also used to
mimic the binding of polyelectrolytes to the interface (peptides, proteins,
DNA) and to simulate enzymatic reactions at the membrane surfaces
(Brezesinski, 2003).
The study using Langmuir monolayers provided information about the
lipid mixtures, DOTAP and cholesterol or fluorinated cholesterol that was
useful for the studies with liposomes. A comparative study between
cholesterol and fluorinated cholesterol as the helper lipids in DOTAP systems
was performed using Langmuir monolayer studies (Gromelski, 2006; Symietz,
2004). Pressure-area isotherms, surface potential and Brewster angle
microscopy measurements were carried out to gain information about
molecular distribution and mixing behaviour of the lipids in the monolayer.
The DNA adsorption process at the monolayer interface was studied by
vibrational spectroscopy (Brezesinski, 2003). DNA is expected to adsorb from
the subphase to the interface due to electrostatic forces and to induce
changes in the density and composition of the interface layer, which is
detected by infrared reflection absorption spectroscopy (Gromelski, 2006).
3.1.3.1.3.1.3.1. Lipid Lipid Lipid Lipid Monolayer experimentsMonolayer experimentsMonolayer experimentsMonolayer experiments
3.1.1.3.1.1.3.1.1.3.1.1. ChemicalsChemicalsChemicalsChemicals
DOTAP (1,2-dioleoyl-3-trimethylammonium-propane, chloride salt,
MW 698.542), cholesterol (ovine wool, > 98%, MW 386.355) and F7-
cholesterol (25,26,26,26,27,27,27-heptafluorocholesterol, MW 512.587)
(Figure 3.1) were purchased from Avanti Polar Lipids, Inc. Salmon testes DNA

INTERACTION OF DNA WITH LIPID MONOLAYERS 47
and PBS (phosphate buffered saline: 0.01 M phosphate buffer, 0.0027 M
potassium chloride and 0.137 M sodium chloride, pH 7.4) were purchased
from Sigma-Aldrich. The deionised water was purified with Milli-Q apparatus
with the specific resistance of 18.2 MΩ∙cm. Chloroform (Merck) was used to
dissolve the lipids.
3.1.2.3.1.2.3.1.2.3.1.2. PrPrPrPressure/area Isothermsessure/area Isothermsessure/area Isothermsessure/area Isotherms
The early research on Langmuir monolayers stated that different two-
dimensional phases exist or co-exist. Monolayer phases are classified in
gaseous (G), Liquid-expanded (LE), Liquid-condensed (LC) and solid (S), as
visible in Figure 3.2. The monolayer compressibility varies according to the
sequence G>LE>LC>S, and it is determined by measuring the surface pressure-
DOTAP
Cholesterol Heptafluorocholesterol
Figure 3.1. Chemical structures of DOTAP, CHOL (cholesterol) and F7-CHOL
(heptafluorocholesterol).

48 INTERACTION OF DNA WITH LIPID MONOLAYERS
molecular area (π-A) isotherms under equilibrium conditions (Vollhardt,
2006).
The lateral surface pressure π of the monolayer is the difference
between the surface tension (γ) of pure water (72.8 mN/m at 20°C) and water
covered with monolayer (Gromelski, 2004; 2006):
= − (3.1)
The surface pressure is a measurement of the cohesive energy present
at the interface. The lipid molecules will interact with each other through
attractive and repulsive forces (Freire, 2007). The air/water interface
possesses an excess of free energy from the difference in environment
between the surface molecules and those in the bulk. This interfacial free
energy is responsible for the surface tension. The surface pressure-area
isotherms were recorded using a PTFE Langmuir film balance system (Riegler
& Kirstein, Potsdam, Germany), represented on Figure 3.3.
Figure 3.2. Representative phases of a surface pressure-area isotherm of a
Langmuir monolayer.

INTERACTION OF DNA WITH LIPID MONOLAYERS 49
Monolayers of DOTAP, cholesterol, F7-cholesterol or their mixtures
were obtained by spreading the solution of lipids in chloroform at a
concentration of 1 mM on the buffer surface (PBS buffer or PBS containing 0.1
mg/mL of DNA). The surface tension was determined with a continuous
Wilhelmy-type pressure measuring system using a 10 mm wide filter paper as
plate. The monolayers were compressed at a constant velocity of 5
Å2/molecule/min and at a temperature of (20 ± 1)°C. The average area per
molecule A of an ideal mixture was calculated by the additivity relationship
considering the molar fraction X of each component,
A= X1A1 + X2A2 (3.2)
3.1.3.3.1.3.3.1.3.3.1.3. Surface PotentialSurface PotentialSurface PotentialSurface Potential
Cells need an electric field and concentration profiles of ions in the
proximity of their membranes to exist. These parameters are described by the
classical Gouy-Chapman (GC) model of electrical double layer (EDL). However
Figure 3.3. Langmuir film balance system.

50 INTERACTION OF DNA WITH LIPID MONOLAYERS
deviations from that rule happen in non-homogeneously charged surfaces,
like the lipid water interface of many mixtures (Shapovalov, 2006).
Surface potential experiments provide additional information on the
packing and orientation of the lipid molecules at the monolayer. The potential
of the surface is read as a function of the area per molecule and depends on
the monolayer phase. At larger areas per molecule the surface potential is
close to zero. It remains constant till a critical area is reached on compression,
increasing or decreasing depending on the charge of the lipids in study
(Oliveira, 1997). These critical areas normally coincide with the increase of the
surface pressure values on Langmuir isotherms, indicating that the monolayer
become more structured than before, due the compression effect.
Surface potential measurements were recorded using a homemade
device (V. L. Shapovalov, Institute of Chemical Physics, RAS, Moscow, Russia)
that combines a Kelvin probe sensor and a Wilhelmy plate in order to record
at the same time the surface potential and the surface pressure isotherm.
Briefly, a 250 x 100 x 8 mm3 Teflon trough with a single barrier (asymmetric
compression) contains a gold-plated electrode of 10 mm diameter that
vibrates at ca. 80 Hz. The reference electrode was made of Ag/AgCl
(Shapovalov, 2006). Surface potential and surface pressure was set to zero
before spreading the monolayer onto the subphase and the results are
recorded at the same conditions described above. Final surface potential data
were referenced to the surface potential of a subphase without the
monolayer.
3.1.4.3.1.4.3.1.4.3.1.4. Brewster Angle Microscopy (BAM)Brewster Angle Microscopy (BAM)Brewster Angle Microscopy (BAM)Brewster Angle Microscopy (BAM)
BAM technique was first developed to clarify the structural
characteristics of amphiphilic substances at the air-water interface. It
provides information on the morphology of the monolayers including the

INTERACTION OF DNA WITH LIPID MONOLAYERS 51
inner structure of the formed domains as well as heterogeneities in thin films
(Melzer, 1997). Inhomogeneities on the monolayer can be from lipid density
variation at the water surface (Symietz, 2004).
A clean and perfect interface between two media with different
refractive index has no reflection if it is illuminated by parallel (p)-polarised
light under a unique angle of incidence, called Brewster angle (α). For the
air/water interface, the Brewster angle is 53.1° (Henon, 1991; Kaercher,
1993). The formation of a thin film with a different refractive index changes
the optical status that is now reflecting the light and producing an image of
the monolayer (Rodríguez Patino, 1999). The occurrence of domains with
higher molecular densities will reflect the light and be visible as brighter areas
compared with the dark background of the water surface.
The system used is available commercially (BAM2, Nanofilm
Technology Ltd., Germany; 20 mW laser, wavelength 514 nm, resolution 3
μm) and consists of a CCD camera that detects the p-polarised light of the
diode laser reflected from the surface for film characterisation. The Brewster
angle for air-water interface is 53.1°. The recorded images were analysed with
the existing software and corrected for the perspective of observation under
the Brewster angle with a spatial resolution of about 2 µm.
3.1.5.3.1.5.3.1.5.3.1.5. InfrInfrInfrInfrared Reflection Absorption ared Reflection Absorption ared Reflection Absorption ared Reflection Absorption
Spectroscopy (IRRAS)Spectroscopy (IRRAS)Spectroscopy (IRRAS)Spectroscopy (IRRAS)
Infrared reflection absorption spectroscopy of lipid monolayers at the
air/water interface contributes with unique molecular structure and
orientation information from the film compounds. Parameters as lipid chain
conformation, tilt angle and presence of DNA molecules at the interface could

52 INTERACTION OF DNA WITH LIPID MONOLAYERS
be determined with this technique via changes in vibrational frequencies
(Brezesinski, 2003; Gromelski, 2004).
IRRAS is based on the observation that when mid-IR radiation reaches
the aqueous monolayers, a fraction of the light is reflected from the molecular
compounds of the thin film at the surface. Light in a well-defined polarisation
state, either parallel (p-polarised) or perpendicular (s-polarised) to the plane
of incidence, impinges onto the surface at a well-defined and controlled angle
of incidence, which is reflected and detected at the same angle (Mendelsohn,
2010). Table 3.1 shows some of the more important Mid-IR group frequencies
of phospholipids and DNA (Banyay, 2003; Blume, 1996; Gromelski, 2006).
Wavenumber
(cm-1
) Symbol Description
DNA characteristic bands
1720-1710 ν(C=O) DNA base pairing
1225-1220 νas(PO2-) Asymmetric PO2
- stretching (B form)
1090-1085 νs(PO2-) Symmetric PO2
- stretching of backbone (A/B form)
1069-1044 ν(C-O) C-O stretching of backbone
970 ν(C-C) C-C stretching of backbone (B form)
Phospholipid characteristic bands
3400-3700 ν(O-H) H-O-H stretching
2925 νas(CH2) Asymmetric CH2 stretching (LE phase)
2918 νas(CH2) Asymmetric CH2 stretching (LC phase)
2855 νs(CH2) Symmetric CH2 stretching (LE phase)
2849 νs(CH2) Symmetric CH2 stretching (LC phase)
1740 ν(C=O) C=O stretching
Table 3.1. More common Mid-IR group frequencies of phospholipids and DNA
(Banyay, 2003; Blume, 1996; Gromelski, 2006).

INTERACTION OF DNA WITH LIPID MONOLAYERS 53
IRRAS spectra were recorded using an IFS 66 FTIR spectrometer
(Bruker, Germany) equipped with a liquid nitrogen cooled MCT detector. The
spectrometer was coupled to a Langmuir film balance, placed in a sealed
container, to guarantee a constant water vapour atmosphere. The IR beam
was focused on the water surface of the Langmuir trough at an angle of
incidence equal to 40° and was polarised vertically (s) using a KRS-5 (thallium
bromide and iodide mixed crystal) wire grid polariser. FTIR spectra were
collected at 8 cm-1 resolution with 400 scans and subtracted from the
spectrum of the reference trough (PBS buffer). The waiting time for DNA
adsorption was the same in all experiments and was 1 hour (Gromelski, 2006).
3.2.3.2.3.2.3.2. Results and DiscussionResults and DiscussionResults and DiscussionResults and Discussion
3.2.1.3.2.1.3.2.1.3.2.1. DOTAP/F7DOTAP/F7DOTAP/F7DOTAP/F7----cholesterol monolayerscholesterol monolayerscholesterol monolayerscholesterol monolayers
The surface pressure-area (π-A) isotherm of DOTAP on phosphate
buffered saline (PBS) is characteristic of a liquid-expanded phase and has an
initial pressure increase at 105 Å2/molecule. The addition of cholesterol
(CHOL) or F7-cholesterol (F7-CHOL) to DOTAP (chemical structures shown in
Figure 3.1) at 1:1 ratio leads to the same overall liquid-expanded phase
behaviour with a decrease in the area per molecule (Figure 3.4). The
isotherms of the pure CHOL monolayer and the pure F7-CHOL monolayer on
PBS buffer are identical and are characteristic of a condensed phase, showing
small changes in average molecular area with increasing surface pressure. The
initial increase is at 55 Å2/molecule and their limiting area A0 (extrapolation of
the linear part of the isotherm to π = 0) is 40 Å2/molecule. The lateral
interactions between DOTAP and the sterols were analysed by calculating the

54 INTERACTION OF DNA WITH LIPID MONOLAYERS
average area per molecule within the mixed monolayer as a function of lipid
concentration at the surface pressures of 5 and 35 mN/m (Table 3.2). A
negative deviation to the ideal mixing or complete demixing is observed
experimentally, particularly at 5 mN/m, supporting the condensing effect of
the sterols. BAM analysis of DOTAP/CHOL 1:1 shows domains at surface
pressures below 15 mN/m, which disappear completely when the pressure
reaches 20 mN/m (Figure 3.4).
20 40 60 80 100 120 140 1600
5
10
15
20
25
30
35DOTAP/F7-CHOL
CHOL
F7-CHOL
Su
rfa
ce p
ressu
re (
mN
/m)
Area per molecule (Å2)
DOTAP
DOTAP/
F7-CHOL
on DNA
DOTAP/F7-CHOL
π = 0.5 mN/m (65 Å2)π = 0 mN/m (90 Å
2)
DOTAP/CHOL
π = 20 mN/m (47 Å2)
DOTAP/CHOL
π = 10 mN/m (52 Å2)
Figure 3.4. Pressure-area isotherms of monolayers of DOTAP, cholesterol
(CHOL), F7-cholesterol (F7-CHOL), DOTAP/cholesterol 1:1 mixture
(DOTAP/CHOL) and DOTAP/F7-cholesterol 1:1 mixture (DOTAP/F7-CHOL) on PBS
buffer and of DOTAP/F7-cholesterol 1:1 mixture on 0.1 mg/mL of DNA dissolved
in PBS. Brewster angle microscopy images of the mixtures of DOTAP and the
sterols at different surface pressures are also shown.
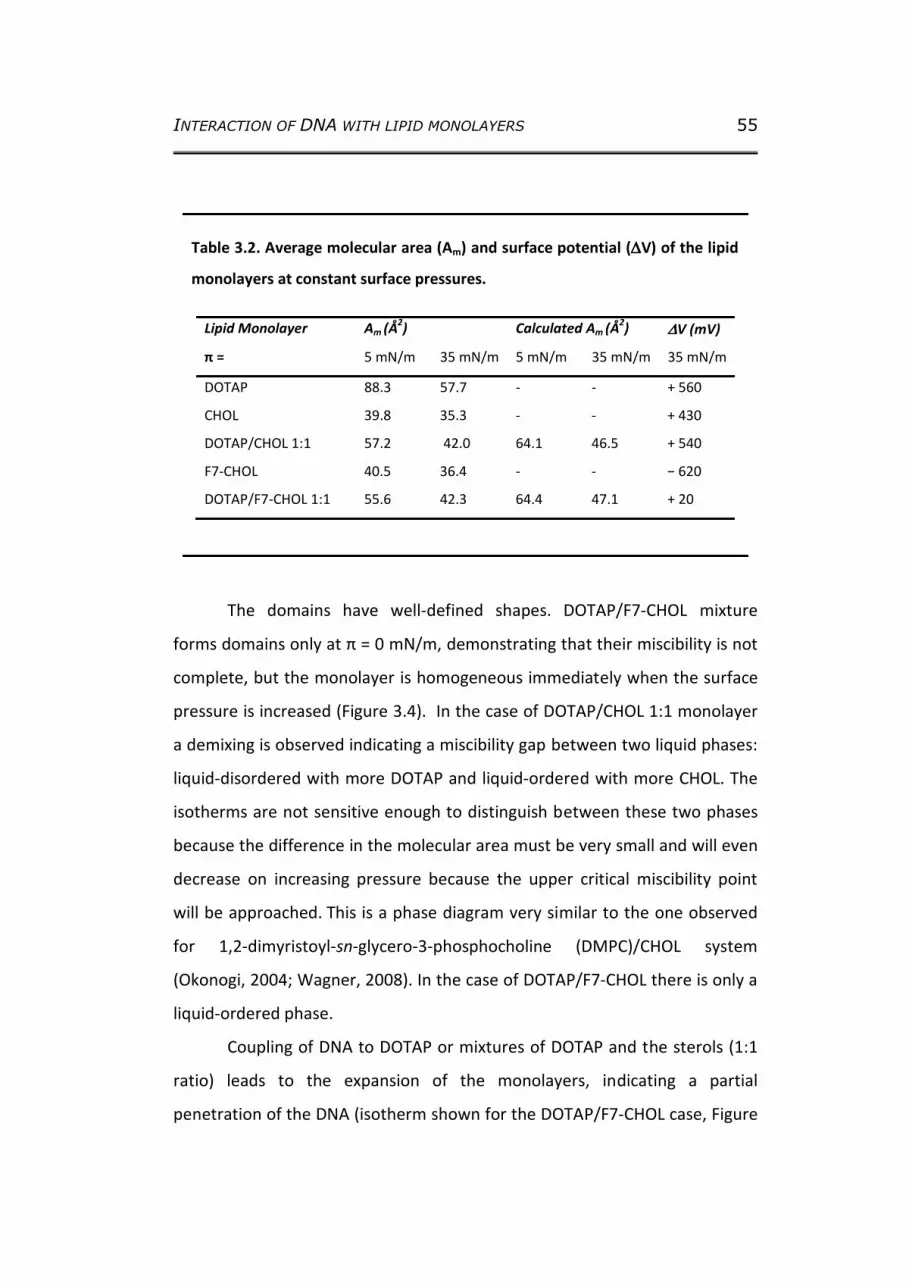
INTERACTION OF DNA WITH LIPID MONOLAYERS 55
The domains have well-defined shapes. DOTAP/F7-CHOL mixture
forms domains only at π = 0 mN/m, demonstrating that their miscibility is not
complete, but the monolayer is homogeneous immediately when the surface
pressure is increased (Figure 3.4). In the case of DOTAP/CHOL 1:1 monolayer
a demixing is observed indicating a miscibility gap between two liquid phases:
liquid-disordered with more DOTAP and liquid-ordered with more CHOL. The
isotherms are not sensitive enough to distinguish between these two phases
because the difference in the molecular area must be very small and will even
decrease on increasing pressure because the upper critical miscibility point
will be approached. This is a phase diagram very similar to the one observed
for 1,2-dimyristoyl-sn-glycero-3-phosphocholine (DMPC)/CHOL system
(Okonogi, 2004; Wagner, 2008). In the case of DOTAP/F7-CHOL there is only a
liquid-ordered phase.
Coupling of DNA to DOTAP or mixtures of DOTAP and the sterols (1:1
ratio) leads to the expansion of the monolayers, indicating a partial
penetration of the DNA (isotherm shown for the DOTAP/F7-CHOL case, Figure
Lipid Monolayer Am (Å2) Calculated Am (Å
2) ∆∆∆∆V (mV)
π = 5 mN/m 35 mN/m 5 mN/m 35 mN/m 35 mN/m
DOTAP 88.3 57.7 - - + 560
CHOL 39.8 35.3 - - + 430
DOTAP/CHOL 1:1 57.2 42.0 64.1 46.5 + 540
F7-CHOL 40.5 36.4 - - − 620
DOTAP/F7-CHOL 1:1 55.6 42.3 64.4 47.1 + 20
Table 3.2. Average molecular area (Am) and surface potential (∆∆∆∆V) of the lipid
monolayers at constant surface pressures.

56 INTERACTION OF DNA WITH LIPID MONOLAYERS
3.4). The molecular areas in the monolayers are larger when DNA is in the
subphase. This might be due to an expanding effect of adsorbed DNA. This
shift to larger molecular areas is observed at all pressures studied showing
that partially penetrated DNA is not squeezed-out by compression. As shown
in a previous study, the amount of adsorbed DNA increases with increasing
electrolyte concentration up to physiological values (Shapovalov, 2010). This
has been explained by the fact that the ionic atmosphere around a
macromolecule becomes more compact and stable with increasing ionic
strength. For this reason, the reduction of the effective charge requires larger
amounts of DNA for the compensation of the overall monolayer charge.
The surface potential (ΔV) of DOTAP monolayers on PBS buffer is
positive and increases gradually with pressure as it is described for
phospholipids in the fluid phase, which is attributed to an increase in
molecular density (Figure 3.5) (Miller, 1987; Möhwald, 1995).
0 20 40 60 80 100 120 140
-600
-400
-200
0
200
400
600
F7-CHOL
Su
rfa
ce
po
ten
tia
l (m
V)
Area per molecule (Å2)
DOTAP
DOTAP/CHOLCHOL
DOTAP/F7-CHOL
Figure 3.5. Surface potential isotherms of monolayers of DOTAP, cholesterol
(CHOL), F7-cholesterol (F7-CHOL), DOTAP/cholesterol 1:1 (DOTAP/CHOL) and
DOTAP/F7-cholesterol 1:1 (DOTAP:F7-CHOL) on PBS buffer.

INTERACTION OF DNA WITH LIPID MONOLAYERS 57
Condensed CHOL monolayers show a positive ΔV whereas the
potential of F7-CHOL monolayers for similar surface pressures is highly
negative, comparably to that observed for amphiphiles with perfluorocarbon
chain (Figure 3.5 and Table 3.2) (Andreeva, 2008; Shibata, 1996). The mixtures
of DOTAP and the sterols show that the ΔV lies between the values of the
pure lipid monolayers (Table 3.2). The ΔV of DOTAP/CHOL 1:1 monolayers is
highly positive whereas that of DOTAP/F7-CHOL 1:1 is close to zero (Figure 3.5
and Table 3.2).
The sterols increase the structural order of the DOTAP hydrocarbon
acyl chains by stabilising forces (hydrogen bonding and van der Waals
attraction) and lead to an increase in the packing density of the monolayer.
The condensing effect of CHOL on fluid monolayers has been known for a long
time (Demel, 1967; Leathes, 1925; Stockton, 1976). Although the process by
which CHOL induces this effect is not completely understood, it has recently
been suggested that the molecule maximises the hydrocarbon contacts,
minimising the contact of lipophilic groups with the aqueous phase and forms
a contiguous hydrophilic surface (template model) (Daly, 2011). The
fluorination of the CHOL tail does not induce significant changes on this
condensing effect (Kauffman, 2000). This indicates that the attractive
interaction between DOTAP and the fluorinated CHOL is not affected by the
lipophobicity character of CF3 groups (O'Hagan, 2008) and most likely depends
on the head group and on the sterol ring. This relates also to the fact that the
molecular areas of CHOL and F7-CHOL monolayers are comparable, which
strongly suggests that they orient similarly in a vertical way at the interface
throughout compression with the OH group towards the polar interface
(Kauffman, 2000). The ΔV of a charged monolayer results from different
contributions. The dipole moments of the lipid molecules, µ⊥,m (vertical
component of the molecular dipole moment), the change in orientation of the

58 INTERACTION OF DNA WITH LIPID MONOLAYERS
water molecules at the monolayer-subphase interface, the type of charges in
the head groups and the counter charges in the subphase (diffuse layer
potential):
∆V =µ⊥,m
ε ⋅ε0 ⋅A+ψ (3.9)
where ε0 is the absolute permittivity of vacuum, ε is the relative permittivity
of the monolayer considering the contributions of the hydrocarbon chains,
polar heads and hydration water, A is the area per molecule, ψ is the diffuse
double layer contribution (that can be calculated by the Gouy–Chapman–
Stern theory) (Miller, 1987; Möhwald, 1995; Oliveira, 1997; Truzzolillo, 2008).
The surface pressure values are given with respect to the free water (buffer)
surface, hence the influence of water molecules can be excluded. Besides
opposite signs, similar absolute potential values have been measured for the
same hydrophilic group but different chains (fluorinated or hydrocarbon)
excluding the predominance of the water structure on the potential (Miller,
1987). DOTAP is fully charged at pH 7.4 (Zuidam, 1997). The ΔV value of
DOTAP monolayer is thus a result of the double-layer potential and the dipole
moments of the molecules (Bordi, 2006; Truzzolillo, 2008). The polarisation of
the carbonyl groups may largely contribute to the positive values of ΔV
(inferred by studies with phospholipid monolayers, either non-ionic or
negatively charged) considering the molecular arrangement in which the
oxygen is deeper in the subphase than the carbon atom yielding to the correct
polarity (orientation of the dipoles with negative ends toward the water)
(Miller, 1987; Möhwald, 1995). In addition, a contribution from the methyl
groups terminating the aliphatic tails has to be taken into account (Möhwald,
1995; Vogel, 1988). For uncharged monolayers, only the dipole moments
contribute to the ΔV and for CHOL monolayers the positive values can be
attributed to the dipole moment of the C-OH (C3) group (Kauffman, 2000).

INTERACTION OF DNA WITH LIPID MONOLAYERS 59
The presence of CHOL in DOTAP monolayers only slightly decreases the ΔV
value when compared to pure DOTAP (Table 3.2). The dipole potential varies
inversely with molecular area and dielectric constant. CHOL decreases the
molecular area of DOTAP monolayer and it is known to reduce the dielectric
constant of the membrane interface (Haldar, 2012). On the other hand, the
surface potential of the charged monolayer also depends directly on the
diffuse layer potential, which is proportional to the charge density at the
interface (Truzzolillo, 2008), which is lower in the case of DOTAP/CHOL
monolayers. The highly negative dipole moment for F7-CHOL monolayers
results from the polarisation of the fluorinated side chain (Kauffman, 2000).
Fluorination of terminal methyl group or the upper part of hydrocarbon
chains of lipids results in negative dipoles at the monolayer-air boundary, due
to the preferred orientation of the hydrophobic CF3 group toward air (Bernett,
1963; Fox, 1957; McIntosh, 1996; Vogel, 1988). The surface potential
oscillations observed for F7-CHOL are probably due to the fact that in the
coexistence region of a 2D-gas and a condensed monolayer, the monolayer is
not homogeneous and the measured values strongly depend on particular
experimental conditions (Shapovalov, 2006). The dipole moment of F7-CHOL
most likely cancels partly that of DOTAP leading to an overall ΔV close to zero
for the two-component monolayer (Table 3.2).
3.2.2.3.2.2.3.2.2.3.2.2. DNA interaction with DOTAP/F7DNA interaction with DOTAP/F7DNA interaction with DOTAP/F7DNA interaction with DOTAP/F7----
cholesterol monolayerscholesterol monolayerscholesterol monolayerscholesterol monolayers
IRRA spectra of the monolayers of DOTAP and DOTAP mixed with
sterols on 0.1 mg/mL of salmon testes DNA in PBS buffer also showed
adsorption of DNA to the interface, indicated by the presence of the

60 INTERACTION OF DNA WITH LIPID MONOLAYERS
characteristic band at 970 cm-1 (spectra shown for surface pressures of 35
mN/m, Figure 3.6.a).
1000 1200 1400 1600 1800-4
-2
0
2
4
6
8
10
125
4
3
2
1
(a)
Re
flecta
nce -
Ab
sorb
ance (
10
3)
Wavenumber (cm-1)
3000 3250 3500 3750
0
5
10
15
20
25
30
35
40
2800 2900 3000-2
-1
0
1
2
3
4
Wavenumber (cm-1)
Re
fle
cta
nce
- A
bso
rban
ce
(10
3)
1
2
3
4
5
(c)
Reflecta
nce -
Absorb
ance (
10
3)
Wavenumber (cm-1)
(b)
1
2
3
4
5
Figure 3.6. Different regions of the IRRAS spectra of monolayers of (1) DOTAP,
(2) DOTAP/F7-cholesterol 1:1, (3) F7-cholesterol, (4) DOTAP/cholesterol 1:1 and
(5) cholesterol on PBS buffer (dashed line) and on 0.1 mg/mL DNA dissolved in
PBS buffer (solid line) subphases. Different regions of the IRRA spectra are
presented in separate plots and the spectra are offset for clarity: DNA marker
bands (a), CH2 stretching vibrations (b), and OH stretching band (c). The surface
pressure is in all cases 35 mN/m.

INTERACTION OF DNA WITH LIPID MONOLAYERS 61
The region between 900 and 1800 cm-1 is rich in DNA marker bands
(Dittrich, 2011). The band at 970 cm-1 is caused by 2´endo deoxyribose
conformation of the DNA backbone. In the 1000-1250 cm-1 region, one can
see the vibrations of phosphate groups. The band at 1223 cm-1 corresponds to
the phosphate group asymmetric stretching, while the band at 1088 cm-1 is
given by the symmetric stretching. For DOTAP/F7-CHOL mixtures the
characteristic band of C-F stretching of pure F7-CHOL at 1223 cm-1 can
interfere with the asymmetric band from the phosphate group of DNA, but
the increase in that band is clearly evident when DNA is in the subphase. The
region between 3000 and 3800 cm-1 gives information about surface layer
thickness through the OH stretching vibration band (Dopico, 2007). The
intensity of OH stretching vibration band increases in the presence of DNA,
indicating an increase in surface layer thickness. The DOTAP head group is
positively charged at pH 7.4, which enables the electrostatic interaction with
DNA even in the presence of other salt ions. The symmetric and asymmetric
CH2-valence vibrations (bands between 2850 and 2920 cm-1) provide
qualitative information about hydrocarbon chain conformation (Macphail,
1984; Snyder, 1982). The monolayers of DOTAP and of its mixture with sterols
exhibit a high amount of gauche conformers because CH2 symmetric and
asymmetric stretching bands are at 2854 and 2924 cm-1, respectively (Figure
3.6.b). These values are in accordance with a liquid-expanded phase and do
not change on compression (Table 3.3). The adsorption of DNA at the
interface does not induce significant changes on the phase state of the
monolayers.

62 INTERACTION OF DNA WITH LIPID MONOLAYERS
CHOL has the CH2 symmetric stretching band at 2850 cm-1, indicating
an all-trans conformation (condensed phase). The same is valid for F7-CHOL
CH2 stretching bands. The CH2 asymmetric stretching band is not considered
in this case since it contains significant overlapping contributions from methyl
groups (Lewis, 1998). In the case of pure CHOL and F7-CHOL monolayers, DNA
is not detected at the interface. From direct observation of the intensity of the
symmetric stretching band of the phosphate group (1088 cm-1) of DNA it is
possible to perform a comparison of the different systems. When the amount
of positively charged lipids decreases, a decreasing in the amount of absorbed
DNA is visible. This decrease of the band intensity is more noticeable for the
mixture of DOTAP and F7-CHOL. The difference in OH-band intensities around
3600 cm-1 between DOTAP, DOTAP/CHOL and DOTAP/F7-CHOL also indicates
a smaller amount of adsorbed DNA for the mixture with the fluorinated
cholesterol.
Lipid Monolayer on PBS or DNA/PBS νsCH2 (cm-1)
π=5 mN/m 35 mN/m
DOTAP 2854 2854
CHOL 2850 2850
DOTAP/CHOL 1:1 2854 2854
F7-CHOL 2850 2850
DOTAP/F7-CHOL 1:1 2854 2854
Table 3.3. Symmetric CH2 vibration band of the lipid monolayers obtained by
IRRAS.

INTERACTION OF DNA WITH LIPID MONOLAYERS 63
3.3.3.3.3.3.3.3. ConclusionConclusionConclusionConclusionssss
The use of F7-CHOL as the helper lipid in cationic non-viral gene
vectors is proposed. The effect of this neutral lipid on the structure of
monolayers formed by the cationic lipid DOTAP was studied and compared
with that of CHOL. Both isotherms and IRRAS results demonstrate that the
mixtures of DOTAP and the sterols (1:1 molar ratio) are in the liquid expanded
state. The mixtures appeared homogeneous at pressures between 30-35
mN/m, which is considered the lateral pressure in liposomes and will have
implications for the ability of the lipoplexes formed by these lipids to
condense DNA. F7-CHOL and CHOL induce a condensing effect on DOTAP
monolayers but BAM showed that CHOL is less miscible with DOTAP than F7-
CHOL. CHOL and F7-CHOL orient similarly in a vertical way at the interface
throughout compression with the OH group towards the polar interface, as
concluded from the surface potential measurements and molecular areas.
From IRRAS results, it is possible to conclude that a smaller amount of DNA is
adsorbed at DOTAP/F7-CHOL monolayers when compared with DOTAP/CHOL.
Since the isotherms of the mixtures show very similar molecular areas, similar
charge densities are expected in the mixed monolayers. The only possible
explanation for the moment is a different miscibility behaviour between
DOTAP and CHOL or F7-CHOL, respectively. If CHOL is less miscible with
DOTAP, more patches containing different amounts of CHOL and therefore
different charge densities are expected. This is in line with the BAM
experiments showing a homogeneous DOTAP/F7-CHOL monolayer at any
lateral pressure above zero. This leads to a homogeneous monolayer with a
smaller charge density compared to that of the DOTAP/CHOL mixtures, which
shows the coexistence of cholesterol-rich and cholesterol-poor domains up to
20 mN/m, indicating the coexistence of patches with higher or smaller charge

64 INTERACTION OF DNA WITH LIPID MONOLAYERS
densities in the mixed monolayer. The patches with the higher charge density
are responsible for the attraction of a larger amount of DNA. According to
these results, F7-CHOL and DOTAP are completely miscible, and DNA adsorbs
to this mixed monolayer even at ionic strength close to the physiological
values, thus F7-CHOL is a promising candidate for the preparation of gene
delivery vectors.
3.4.3.4.3.4.3.4. ReferencesReferencesReferencesReferences
Andreeva, T.D.; Petrov, J.G.; Brezesinski, G.; Moehwald, H. (2008). Structure of
the Langmuir monolayers with fluorinated ethyl amide and ethyl
ester polar heads creating dipole potentials of opposite sign,
Langmuir, 24, 8001.
Banyay, M.; Sarkar, M.; Gräslund, A. (2003). A library of IR bands of nucleic
acids in solution, Biophysical Chemistry, 104, 477.
Bernett, M.K.; Zisman, W.A. (1963). Behavior of Monolayers of Progressively
Fluorinated Fatty Acids Absorbed on Water, Journal of Physical
Chemistry, 67, 1534.
Blume, A. (1996). Properties of lipid vesicles: FT-IR spectroscopy and
fluorescence probe studies, Current Opinion in Colloid & Interface
Science, 1, 64.
Bordi, F.; Cametti, C.; Sennato, S.; Paoli, B.; Marianecci, C. (2006). Charge
renormalization in planar and spherical charged lipidic aqueous
interfaces, Journal of Physical Chemistry B, 110, 4808.
Brezesinski, G.; Möhwald, H. (2003). Langmuir monolayers to study
interactions at model membrane surfaces, Advances in Colloid and
Interface Science, 100-102, 563.
Buschow, K.H.J.C., Robert W.; Flemings, Merton C.; Ilschner, Bernhard;
Kramer, Edward J.; Mahajan, Subhash; Encyclopedia of Materials -

INTERACTION OF DNA WITH LIPID MONOLAYERS 65
Science and Technology, Volume 1-11, 1st Edition, Elsevier, The
Netherlands, 2001.
Butt, H.-J.; Graf, K.; Physics and chemistry of interfaces, Wiley-VCH, Germany,
2006.
Daly, T.A.; Wang, M.H.; Regen, S.L. (2011). The Origin of Cholesterol's
Condensing Effect, Langmuir, 27, 2159.
Demel, R.A.; Vandeene.Ll; Pethica, B.A. (1967). Monolayer Interactions of
Phospholipids and Cholesterol, Biochimica Et Biophysica Acta, 135,
11.
Dittrich, M.; Bottcher, M.; Oliveira, J.S.L.; Dobner, B.; Mohwald, H.;
Brezesinski, G. (2011). Physical-chemical characterization of novel
cationic transfection lipids and the binding of model DNA at the air-
water interface, Soft Matter, 7, 10162.
Dopico, A.M.; Methods in Membrane Lipids, Volume 400, 16th Edition,
Humana Press, United States of America, 2007.
Fainerman, V.B.; Lucassen-Reynders, E.H.; Miller, R. (1998). Adsorption of
surfactants and proteins at fluid interfaces, Colloids and Surfaces A:
Physicochemical and Engineering Aspects, 143, 141.
Fox, H.W. (1957). Force-Area and Potential-Area Relations of Monolayers of
Terminally Fluorinated Octadecylamine and Octadecanoic Acid,
Journal of Physical Chemistry, 61, 1058.
Freire, M.G.; Carvalho, P.J.; Fernandes, A.M.; Marrucho, I.M.; Queimada, A.J.;
Coutinho, J.A.P. (2007). Surface tensions of imidazolium based ionic
liquids: Anion, cation, temperature and water effect, Journal of
Colloid and Interface Science, 314, 621.
Gromelski, S.; Brezesinski, G. (2004). Adsorption of DNA to zwitterionic DMPE
monolayers mediated by magnesium ions, Physical Chemistry
Chemical Physics, 6, 5551.

66 INTERACTION OF DNA WITH LIPID MONOLAYERS
Gromelski, S.; Brezesinski, G. (2006). DNA condensation and interaction with
zwitterionic phospholipids mediated by divalent cations, Langmuir,
22, 6293.
Haldar, S.; Kanaparthi, R.K.; Samanta, A.; Chattopadhyay, A. (2012).
Differential Effect of Cholesterol and Its Biosynthetic Precursors on
Membrane Dipole Potential, Biophysical Journal, 102, 1561.
Henon, S.; Meunier, J. (1991). Microscope at the Brewster angle: Direct
observation of first-order phase transitions in monolayers, Review of
Scientific Instruments, 62, 936.
Kaercher, T.; Hönig, D.; Möbius, D. (1993). Brewster angle microscopy,
International Ophthalmology, 17, 341.
Kauffman, J.M.; Westerman, P.W.; Carey, M.C. (2000). Fluorocholesterols, in
contrast to hydroxycholesterols, exhibit interfacial properties similar
to cholesterol, Journal of Lipid Research, 41, 991.
Leathes, J.B. (1925). Role of fats in vital phenomena., Lancet, 1, 853.
Lewis, R.N.A.H.; McElhaney, R.N. (1998). The structure and organization of
phospholipid bilayers as revealed by infrared spectroscopy, Chemistry
and Physics of Lipids, 96, 9.
Macphail, R.A.; Strauss, H.L.; Snyder, R.G.; Elliger, C.A. (1984). C-H Stretching
Modes and the Structure of Normal-Alkyl Chains .2. Long, All-Trans
Chains, Journal of Physical Chemistry, 88, 334.
Maltseva, E.; Model membrane interactions with ions and peptides at the
air/water interface, Ph.D, Universität Potsdam, 2005.
McIntosh, T.J.; Simon, S.A.; Vierling, P.; Santaella, C.; Ravily, V. (1996).
Structure and interactive properties of highly fluorinated
phospholipid bilayers, Biophysical Journal, 71, 1853.
Melzer, V.; Weidemann, G.; Vollhardt, D.; Brezesinski, G.; Wagner, R.; Struth,
B.; Möhwald, H. (1997). Brewster Angle Microscopy and X-ray GID

INTERACTION OF DNA WITH LIPID MONOLAYERS 67
Studies of Morphology and Crystal Structure in Monolayers of N-
Tetradecyl-γ,δ-dihydroxypentanoic Acid Amide, The Journal of
Physical Chemistry B, 101, 4752.
Mendelsohn, R.; Mao, G.; Flach, C.R. (2010). Infrared reflection–absorption
spectroscopy: Principles and applications to lipid–protein interaction
in Langmuir films, Biochimica et Biophysica Acta (BBA) -
Biomembranes, 1798, 788.
Miller, A.; Helm, C.A.; Mohwald, H. (1987). The Colloidal Nature of
Phospholipid Monolayers, Journal De Physique, 48, 693.
Möhwald, H., Phospholipid Monolayers, in Handbook of Biological Physics
R.L.a.E. Sackmann, Editor. 1995, Elsevier Science The Netherlands. p.
161.
O'Hagan, D. (2008). Understanding organofluorine chemistry. An introduction
to the C-F bond, Chemical Society Reviews, 37, 308.
Okonogi, T.M.; McConnell, H.M. (2004). Contrast inversion in the
epifluorescence of cholesterol-phospholipid monolayers, Biophysical
Journal, 86, 880.
Oliveira, O.N.; Bonardi, C. (1997). The surface potential of Langmuir
monolayers revisited, Langmuir, 13, 5920.
Rodríguez Patino, J.M.; Sánchez, C.C.; Rodríguez Niño, M.R. (1999).
Morphological and Structural Characteristics of Monoglyceride
Monolayers at the Air−Water Interface Observed by Brewster Angle
Microscopy, Langmuir, 15, 2484.
Shapovalov, V.L.; Brezesinski, G. (2006). Breakdown of the Gouy−Chapman
Model for Highly Charged Langmuir Monolayers: Counterion Size
Effect, The Journal of Physical Chemistry B, 110, 10032.
Shapovalov, V.L.; Dittrich, M.; Konovalov, O.V.; Brezesmski, G. (2010). Use of
Total Reflection X-ray Fluorescence (TRXF) for the Quantification of

68 INTERACTION OF DNA WITH LIPID MONOLAYERS
DNA Binding to Lipid Monolayers at the Air-Water Interface,
Langmuir, 26, 14766.
Shibata, O.; Yamamoto, S.K.; Lee, S.; Sugihara, G. (1996). Mixed monolayer
properties of tetradecanoic acid with n-perfluorocarboxylic acids with
10, 12, 14, 16, and 18 carbon atoms, Journal of Colloid and Interface
Science, 184, 201.
Snyder, R.G.; Strauss, H.L.; Elliger, C.A. (1982). C-H Stretching Modes and the
Structure of Normal-Alkyl Chains .1. Long, Disordered Chains, Journal
of Physical Chemistry, 86, 5145.
Stockton, G.W.; Smith, I.C.P. (1976). Deuterium Nuclear Magnetic-Resonance
Study of Condensing Effect of Cholesterol on Egg Phosphatidylcholine
Bilayer Membranes .1. Perdeuterated Fatty-Acid Probes, Chemistry
and Physics of Lipids, 17, 251.
Symietz, C.; Schneider, M.; Brezesinski, G.; Möhwald, H. (2004). DNA
alignment at cationic lipid monolayers at the air/water interface,
Macromolecules, 37, 3865.
Truzzolillo, D.; Bordi, F.; Cametti, C.; Sennato, S. (2008). Phenomenological
surface characterization of cationic-lipid monolayers in the presence
of oppositely charged polyions, Colloids and Surfaces a-
Physicochemical and Engineering Aspects, 319, 51.
Vogel, V.; Mobius, D. (1988). Local Surface-Potentials and Electric-Dipole
Moments of Lipid Monolayers - Contributions of the Water Lipid and
the Lipid Air Interfaces, Journal of Colloid and Interface Science, 126,
408.
Vollhardt, D.; Fainerman, V.B. (2006). Progress in characterization of Langmuir
monolayers by consideration of compressibility, Advances in Colloid
and Interface Science, 127, 83.

INTERACTION OF DNA WITH LIPID MONOLAYERS 69
Wagner, K.; Desbat, B.; Brezesinski, G. (2008). Liquid-liquid immiscibility in
model membranes activates secretory phospholipase A2, Biochimica
Et Biophysica Acta, 1778, 166.
Zuidam, N.J.; Barenholz, Y. (1997). Electrostatic parameters of cationic
liposomes commonly used for gene delivery as determined by 4-
heptadecyl-7-hydroxycoumarin, Biochimica Et Biophysica Acta-
Biomembranes, 1329, 211.


COMPACTION PROCESS OF DNA BY FLUORINATED LIPOSOMES 71
Chapter 4
4.4.4.4. Compaction process of DNA Compaction process of DNA Compaction process of DNA Compaction process of DNA
by fluorinated liposomesby fluorinated liposomesby fluorinated liposomesby fluorinated liposomes
Numerous cationic lipids have been synthesised and tested for gene
delivery in cell cultures, animal models and patients who take part in clinical
trials (Morille, 2008; Zhu, 2010). Gene therapy uses plasmid DNA or cellular
RNA interference machinery to turn off gene expression in cancer cells or
other diseased cells (Aagaard, 2007; Morille, 2008). The use of naked nucleic
acids is limited by the presence of serum nucleases and thus it is only valid for
direct injection of the macromolecule on tissues that are easily accessible
such as skin and muscle (Morille, 2008). These lipids are usually used for gene
delivery in the form of liposomes that are complexed with DNA through
electrostatic interactions. The toxicity of these complexes, named lipoplexes,
is related to the charge ratio between the cationic liposomes and DNA plus
the dose that is administered (Lv, 2006). Also, the toxicity of such systems in
cell cultures is attributed to the free liposomes present in the mixture, as the
separate components of the lipoplexes do not show any toxicity when
injected in mice models (Xu, 1999). Thus the study of the interaction between

72 COMPACTION PROCESS OF DNA BY FLUORINATED LIPOSOMES
liposomes and nuclei acids as well as the physicochemical characterisation of
such complexes is critical for the development of novel DNA vectors.
The use of fluorinated cholesterol as helper lipid in DOTAP liposomes is
described and their colloidal properties are compared with that of
DOTAP:cholesterol liposomes (Crook, 1998). When administered
intravenously, cationic liposome–DNA complexes are rapidly cleared from the
bloodstream (Audouy, 2002). Fluorinated liposomes have the advantage of
long-term self-stability (Ravily, 1997). Their half-live time in the blood stream
is similar to pegylated liposomes (Santaella, 1993). Although fluorinated
systems seem to have high transfection potency, their use as gene vectors is
still poorly explored (Boulanger, 2004; Gaucheron, 2001b; Gaucheron, 2002).
In this work, liposomes of mixtures of DOTAP and heptafluorocholesterol
were produced and used to form complexes with DNA, which were
characterised experimentally by measurements of hydrodynamic diameter,
electrophoretic mobility, fluorescence and turbidity. The compaction of DNA
by fluorinated liposomes was also theoretically analysed by a
phenomenological theory addressed by Nguyen and Shklovskii (Nguyen,
2001a; b). This theory provides phase diagrams of the systems including the
charge inversion and re-entrant condensation processes among the
lipoplexes. These phase diagrams contain information about the liposome and
DNA concentration necessary to have either anionic or cationic isolated
lipoplexes or clusters of lipoplexes. By predicting them, it is possible to know
the optimum values of DNA and liposome concentrations for an efficient
transfection from a physicochemical standpoint.

COMPACTION PROCESS OF DNA BY FLUORINATED LIPOSOMES 73
4.1.4.1.4.1.4.1. Experimental detailsExperimental detailsExperimental detailsExperimental details
4.1.1.4.1.1.4.1.1.4.1.1. ChemicalsChemicalsChemicalsChemicals
DOTAP (1,2-dioleoyl-3-trimethylammonium-propane, chloride salt,
MW 698.542), cholesterol (ovine wool, > 98%, MW 386.355) and F7-
cholesterol (25,26,26,26,27,27,27-heptafluorocholesterol, MW 512.587)
(Figure 3.1) were purchased from Avanti Polar Lipids, Inc. DNA
(Deoxyribonucleic acid sodium salt from calf thymus, type I), Hepes buffer (4-
(2-Hydroxyethyl) piperazine-1-ethanesulfonic acid, ≥ 99.5%), Tris buffer (2-
amino-2-(hydroxymethyl)-1,3-propanediol, ≥ 99.9%) and the probe ethidium
bromide (EtBr, 3,8-Diamino-5-ethyl-6-phenylphenanthridinium bromide, ≥
95.0%) were supplied by Sigma-Aldrich. The deionised water was purified with
Milli-Q apparatus with the specific resistance of 18.2 MΩ∙cm. Chloroform was
from Merck.
4.1.2.4.1.2.4.1.2.4.1.2. Preparation of LiposomesPreparation of LiposomesPreparation of LiposomesPreparation of Liposomes, DNA , DNA , DNA , DNA
solution and lipoplexessolution and lipoplexessolution and lipoplexessolution and lipoplexes
Liposomes were prepared by the thin lipid film hydration method
(Figure 4.1) (Palmerini, 2006; Sharma, 1997). Briefly, the appropriate lipid
mixture (DOTAP:cholesterol or DOTAP:F7-cholesterol 1:1 molar ratio) was
dissolved in chloroform, which was then evaporated under vacuum using a
rotating apparatus.

74 COMPACTION PROCESS OF DNA BY FLUORINATED LIPOSOMES
The lipid film was hydrated with 10 mL of 10 mM Hepes buffer pH 7.4
(ionic strength 0.00325 M). The suspension was vortexed for 15 minutes and
extruded through Whatman filters of decreasing sizes (up to 100 nm pore size
membranes) using a pressure extruder apparatus. The total lipid
concentration was 5 mM. DNA was dissolved in 10 mM Hepes buffer at a
concentration of 1 mg/mL (stock solution), which was kept at 4°C under
magnetic stirring for at least 1 day. Liposome-DNA complexes were prepared
by adding equal volumes of DNA solution at a constant concentration (final
concentration was 0.05 mg/mL) and liposome suspension at different
concentrations (final concentrations ranging from 0.05 and 0.50 mg/mL). DNA
solution was added drop wise to the liposomes and the mixture was kept
under magnetic stirring for at least 15 minutes.
4.1.3.4.1.3.4.1.3.4.1.3. Dynamic light scatteringDynamic light scatteringDynamic light scatteringDynamic light scattering
Light scattering effects are an optical phenomenon where the particles
interact with light that strikes them and some of that light is deflected from its
original direction. The intensity of the scattered light depends on many
Figure 4.1. Lipid film hydration method.

COMPACTION PROCESS OF DNA BY FLUORINATED LIPOSOMES 75
factors, such as: wavelength of the incident light, shape and size of the
scattering particles, optical properties of the scatters and the angle of
observation. The light scattering can be classified as static or dynamic
depending on how the intensity is measured. If the time-averaged total
intensity is measured as a function of scattering angle, concentration or both
it is called static light scattering. In dynamic light scattering what is measured
is the temporal variation of the intensity, and it is represented as the intensity
autocorrelation function. The variation of the intensity with time contains
information on the random motion of the particles due to their kinetic energy
and can be used to measure the diffusion coefficient of the particles. The
hydrodynamic radius of the particle is calculated by means of the diffusion
coefficient and the Stokes-Einstein equation (Hiemenz, 1997):
= =
(4.1)
In the first part of this equation, is the Boltzmann constant, is the
absolute temperature of the dispersion and is the Stokes coefficient that is
equal to 6, where is the viscosity and is the hydrodynamic radius,
which gives the particle size (Hiemenz, 1997).
The hydrodynamic diameter of liposomes and lipoplexes was
measured at room temperature with a Malvern Zetasizer Nano instrument by
dynamic light scattering (DLS) at 173°. The results were averaged from five
measurements for each sample and were obtained for at least three
independent procedure of sample preparation. The final concentration of
liposomes varied from 0.05 to 0.50 mg/mL (0.1–1.0 mM) and the
concentration of DNA was 0.05 mg/mL.

76 COMPACTION PROCESS OF DNA BY FLUORINATED LIPOSOMES
4.1.4.4.1.4.4.1.4.4.1.4. Electrophoretic mobilityElectrophoretic mobilityElectrophoretic mobilityElectrophoretic mobility
The electrokinetic phenomena can be defined by a liquid that moves
tangential to a charge surface, so it combines effects of motion and electrical
phenomena, which are interpreted to yield a quantity known as the zeta
potential (ζ). There are four phenomena related with the term electrokinetic:
electrophoresis, electroosmosis, streaming potential and sedimentation
potential. Electrophoresis refers to movement of a particle in a stationary
liquid when an electric field is applied. So this method measures the velocity
at which the particles move in a liquid induced by an electrical field (Butt,
2006; Hiemenz, 1997).
Around each particle there is an electrical double layer with a high
concentration of opposite charged ions. That layer can be divided into two
parts, an inner region, called stern layer, where opposite charged ions are
strongly bond to the particle surface and an outer region or diffuse layer,
where the ions are loosely bond to the particle. The zeta potential is the
potential at the point where the bound Stern layer ends and the mobile
diffuse layer begins (Butt, 2006; Hiemenz, 1997).
When an electric field is applied, the particles are attracted towards
the electrode with opposite charge, but forces including viscosity tend to
oppose this movement. When the equilibrium of forces is established, the
particles move with a constant velocity. This velocity is normally called
electrophoretic mobility () and depends on the strength of the electric field
or voltage gradient, the dielectric constant (), the viscosity () and the zeta
potential (ζ). Henry’s equation gives the relationship between these four
properties (Butt, 2006; Hiemenz, 1997):
= (4.2)

COMPACTION PROCESS OF DNA BY FLUORINATED LIPOSOMES 77
Zeta potential magnitude gives the indication of potential stability of
the colloidal system. Generally a suspension is unstable if zeta potential is
between -30 mV to 30 mV. So in this case the particles might flocculate. The
stability is reduced at the isoelectric point (iep) where the zeta potential is
zero at the hydrodynamic interface. This can be confused with the point of
zero charge (pzc), where the surface charge (solid-liquid interface) is zero
(Butt, 2006; Hiemenz, 1997).
The electrophoretic mobility μe of liposomes and lipoplexes was
measured at room temperature with a Malvern Zetasizer Nano series
instrument by laser Doppler velocimetry (LDV), where the light scattered at an
angle of 17° is converted into a zeta potential distribution. The results were
averaged from five measurements for each sample and were obtained for at
least three independent procedure of sample preparation. The final
concentration of liposomes varied from 0.05 to 0.50 mg/mL (0.1–1.0 mM) and
the concentration of DNA was 0.05 mg/mL.
4.1.5.4.1.5.4.1.5.4.1.5. Fluorescence spectroscopyFluorescence spectroscopyFluorescence spectroscopyFluorescence spectroscopy
Luminescence is the emission of light from any substance when
excited at a specific wavelength. Depending on the nature of the excited
state, luminescence can be classified as fluorescence (excited singlet states) or
phosphorescence (excited triplet states). Briefly, a fluorophore is excited from
the ground electronic state to a higher vibrational level of energy. Collisions
with other molecules cause the excited molecule to lose its excess of
vibrational energy until it reaches the lowest vibrational level of the excited
electronic state. From this level the molecule can return to any of the
vibrational levels of the ground state, emitting its energy in the form of
fluorescence. Typically, the emission spectrum is collected at the wavelength

78 COMPACTION PROCESS OF DNA BY FLUORINATED LIPOSOMES
with maximum fluorescence intensity of the excitation spectrum and vice
versa (Lakowicz, 2006).
Fluorescence measurements are commonly executed in steady-state
but time-resolved measurements can also be done. Steady-state
measurements are performed with constant illumination of the sample by a
continuous beam of light and the emission spectrum is recorded due to the
nanosecond scale of fluorescence (Lakowicz, 2006).
Steady-state fluorescence measurements were carried out using a
Perkin-Elmer LS-50B luminescence spectrometer (REQUIMTE, Department of
Chemistry, Faculty of Pharmacy, University of Porto). The DNA concentration
was kept constant (0.025 mg/mL) and liposomes were added at liposome-
DNA mass ratio (L/D) varying from 0 to 10, similarly to the other
characterisation studies. Ethidium bromide (EtBr) was added to DNA solution
at a DNA:EtBr mass ratio of 6:1. Fluorescence emission spectra were recorded
between 560-700 nm at an excitation wavelength of 540 nm, emission and
excitation band slits of 10 nm and scan rate of 400 nm/min. All spectra were
subtracted to the spectra of blanks (buffer or buffer plus liposomes at the
same concentrations that were used for the formation of lipoplexes).
4.1.6.4.1.6.4.1.6.4.1.6. Transmission Electron MicroscopyTransmission Electron MicroscopyTransmission Electron MicroscopyTransmission Electron Microscopy
Transmission electron microscopy (TEM) gives real space images
allowing a direct interpretation of the structure geometry (Buschow, 2001). In
TEM technique, an electron beam is transmitted through the sample under
observation and the applied intensity depends on the thickness of the sample
and the concentration of atoms in that sample (Ebnesajjad, 2006; Hiemenz,
1997). The electrons have the same energy and wavelength as they are
accelerated by the same voltage. TEM is not a surface-sensitive method
because the electrons pass through the whole sample (Butt, 2006). The

COMPACTION PROCESS OF DNA BY FLUORINATED LIPOSOMES 79
produced image is a two-dimensional projection of the entire object, including
the surface and the internal structures. Different contrast is obtained due to
the thickness and composition of the material and the absorption of electrons
in the material.
TEM (Jeol JEM-1400, JEOL) images allow a morphological analysis of
the liposomes and its complexes. Liposomes were prepared as reported in
section 4.1.2, but in this case the hydration solvent used was 5% sucrose
solution in 10 mM HEPES buffer. Sucrose allows rigidity and consequent
stability of the vesicles after the drying process. Each sample of vesicles (5 µL)
was placed on copper grids (Formvar/carbon on 400 mesh – Agar) and let to
adsorb for 5 minutes. The staining was performed with 2% (w/v) of filtered
aqueous solution of uranyl acetate for 45 seconds. Dried grids were visualised
at 80 kV and digital Images were collected at a magnification of 200 000 x.
4.1.7.4.1.7.4.1.7.4.1.7. ComplexComplexComplexComplexationationationation theorytheorytheorytheory
As in previous works (Barrán-Berdón, 2012; Muñoz-Úbeda, 2010;
Muñoz-Úbeda, 2011; Rodriguez-Pulido, 2009), we have used the
complexation theory of Nguyen and Shklovskii to study lipoplexes formed by
cationic liposomes and DNA (Nguyen, 2001a; b). This phenomenological
theory describes the complexation of a long flexible charged polyelectrolyte of
contour length l, with oppositely charged spherical and rod-like particles.
According to these authors, the free energy of the system formed by negative
charged polyions and cationic liposomes F(N,x), can be expressed as the sum
of the free energy of a complex formed by a single liposome and N polyions,
Fc(N,x), the free energy of the aggregates Fa(N,x), and the free energy of the
remaining free polyion in the solution, Fp(N,x). If we particularise for our case
in which polyions are DNA molecules, the theory predicts that for a given
concentration of DNA (P), the state of the system can be described in terms of

80 COMPACTION PROCESS OF DNA BY FLUORINATED LIPOSOMES
the DNA concentration in the limit of new negligible small liposome
concentration (P0). To this end, a minimising calculation of the function F(N,x)
with respect to N and x is required. As a consequence, a phase diagram can be
obtained to characterise the whole complexation process in which lipoplexes
experience aggregation (condensation) and disaggregation (reentrant
condensation) as a function of the liposome-DNA ratio. Namely, for a given
concentration of DNA and growing concentration of liposomes (S), lipoplexes
experience aggregation at some critical concentration, Sa, below the
isoneutrality, and remain in this aggregated (or condensed) state up to
another concentration, Sd, above the isoneutrality. For concentrations of
liposomes higher than Sd, clusters of lipoplexes start to disaggregate as a
consequence of a charge inversion process (Nguyen, 2001a; b). In order to
build the corresponding phase diagram, the theory provides two equations
that can be solved in terms of the phenomenological parameters P0 and E0. P0
is related to the DNA concentration in the limit of negligible liposome
concentrations whereas E0 is related to the energy gained per complex by
forming the aggregates (compared to a free neutral isolated liposome-DNA
complex in solution):
!1 + $%&'(
) = * − *,-. !$ '( /%&) (4.3)
0 !1 − $%&'(
) = * − *,-. !−$ '( /%&) (4.4)
where q and Q are the total charge of DNA and liposomes respectively, is
the thermal energy, Ce is the electrical capacitance. This last parameter can be
calculated as 1 = 4πε,ε51 + κ75 if liposomes are assumed to be spherical
particles of radius a immersed in an electrolytic solution characterised by the
dielectric permittivity ε,ε and a reciprocal Debye length κ7. Accordingly,

COMPACTION PROCESS OF DNA BY FLUORINATED LIPOSOMES 81
knowing the phenomenological parameters P0 and E0, this set of equations
allows the calculation of the two boundary concentrations of liposomes Sa and
Sd for each DNA concentration. Apart from this theory, there are other
theoretical and computer simulation studies that contribute to a better
understanding of DNA complexes. For instance, theoretical analysis of the
physical properties of cationic and zwitterionic lipid-DNA complexes based on
a coarse-grained molecular model implemented by Monte Carlo (MC)
simulations (Farago, 2006; Farago, 2007). Coarse-grained and Molecular
Dynamics Simulations have been applied to study charged dendrimers in the
presence of multivalent salt solution as well as their complexation with linear
polyelectrolyte (Tian, 2009; 2010a; b; 2011). Also, numerical calculations of
the mean-field electrostatic free energy of a zwitterionic lipid monolayer and
DNA support the experimental observations where DNA adsorbs onto a
zwitterionic lipid monolayer in the presence of divalent cations (Bohinc, 2012;
Mengistu, 2009).
4.1.8.4.1.8.4.1.8.4.1.8. Turbidity measurementsTurbidity measurementsTurbidity measurementsTurbidity measurements
The turbidity of the equilibrium phase is related to the formation of a
non-soluble phase that may precipitate or remain stable for short or long
periods of time (Espinosa-Andrews, 2007). Turbidity measurements can be
assessed by absorbance kinetic studies, since aggregation leads to an increase
of the average size of the scattered particles. Then, a spectrophotometer
working with a visible wavelength is capable of detect and analyse the
aggregation kinetics of many colloidal systems (Peula-García, 2010).
Ultraviolet-visible spectroscopy (UV-Vis) refers to absorption
spectroscopy in the UV-Vis spectral region. Molecules can absorb the energy
in the form of ultraviolet or visible light to excite photons from the ground

82 COMPACTION PROCESS OF DNA BY FLUORINATED LIPOSOMES
state to an excited state. This technique is complementary to fluorescence
spectroscopy, previously described (Lakowicz, 2006).
The stability studies of the liposome suspensions were performed by
turbidity measurements as a function of DNA concentration at room
temperature using a UV-1700 PharmaSpec Spectrometer (Kyoto, Japan).
Absorbance kinetic data were obtained at 570 nm, during 180 seconds, with
an interval of 2 seconds. The liposome concentration was 0.5 mM and DNA
was added at concentrations ranging from 0.003 to 0.150 mg/mL. The
reported data are the average of 4 independent measurements. The Fuchs
stability ratio W (or stability factor) was determined from these data. This
magnitude is a criterion for the stability of the colloidal system: W = kr / ks
where the rate constant kr describes rapid coagulation and ks is the rate
constant for the slow coagulation regime. Thus, the inverse of the stability
ratio provides a measure of the effectiveness of collisions leading to
coagulation. Information on the kinetics-aggregation constants of dimer
formation can be directly derived from the initial slopes of the absorbance vs.
time curves (dAbs/dt) (Peula-García, 2010). Accordingly, plotting W as a
function of the electrolyte concentration in a double-logarithmic scale
becomes useful to estimate the critical coagulation concentration (CCC),
which is generally defined as the minimum concentration of electrolyte
required to induce coagulation (W = 1). The CCC value is therefore related to
destabilisation processes (i. e. low CCC means low stability) and its value has
been previously determined for the case of anionic liposomes in the presence
of divalent cations (Martín-Molina, 2012). In the present study, however, DNA
plays the role of the electrolyte so the CCC in this case would be the minimum
concentration of DNA required to induce coagulation of liposomes. On the
other hand, in some cases the stability curves can exhibit an increase of W for
electrolyte concentrations larger than the CCC. This phenomenon is usually

COMPACTION PROCESS OF DNA BY FLUORINATED LIPOSOMES 83
called colloidal restabilisation and the minimum salt concentration at which
the system begins to restabilise is defined as the critical stabilisation
concentration (CSC). This restabilisation phenomenon at high salt
concentrations is well known in hydrophilic colloidal systems and is governed
by hydration forces (Peula-García, 2010). In our case, the CSC will be
redefined as the minimum DNA concentration at which the system begins to
restabilise and such procedure of restabilisation will be attributed to the
formation of lipoplexes stabilised by the complexation of the DNA with the
cationic liposomes.
4.1.9.4.1.9.4.1.9.4.1.9. Circular DichroismCircular DichroismCircular DichroismCircular Dichroism
The DNA structure when bound to the liposomes can be predicted by
circular dichroism spectroscopy in the far-UV spectral region. Circular
dichroism is a phenomenon that affects chiral molecules such as DNA and
proteins. The difference in absorption of the left (9:) and right (9;) circularly
polarised light defines circular dichroism. CD spectropolarimeters normally
present the results as a spectrum that correlates the wavelength, λ (nm), with
the ellipticity, θ (deg). The conversion occurs according the following rule:
1 = ∆9 = 9: − 9; = =>?@, AB ?, (4.5)
Applying the Lambert-Beer law to the CD theory, in order to remove
concentration and path length dependence,
∆9 = ∆C1D (4.6)
where ∆ε is the extinction coefficient (M-1 cm-1 or mol-1 dm3 cm-1), C is the
molar concentration (M) and l is the optical path length that crosses the
sample (cm) (Rodger, 1997).
The most known arrangement for DNA molecules, discovered in 1953,
is a right-handed double helix of the B-form. However DNA can adopt many

84 COMPACTION PROCESS OF DNA BY FLUORINATED LIPOSOMES
other structures, for example right-handed A-type typical from RNA or C-form
mostly found in DNA fibers (Figure 4.2) (Baase, 1979; Kypr, 2009; Lu, 2003;
Miyahara, 2012; Vorlíčková, 2012).
Figure 4.2. Representative scheme of DNA A-, B- and C-form (Lu, 2003).

COMPACTION PROCESS OF DNA BY FLUORINATED LIPOSOMES 85
The circular dichroism spectra were recorded with a Jasco 720
spectrophotometer from 220 to 315 nm using quartz cuvettes with an optical
path length of 0.5 cm. The concentration of DNA was kept constant and equal
to 0.05 mg/mL for calf thymus DNA (ctDNA) and 0.025 mg/mL for plasmid
DNA (pDNA) (pEGFP-N1, BD Biosciences Clontech). The average molecular
weight considered for DNA was 348 g/mol (Schindler, 1997; Symietz, 2004).
Tris buffer (10 mM) was used as solvent.
4.1.10.4.1.10.4.1.10.4.1.10. In vitroIn vitroIn vitroIn vitro transfection studiestransfection studiestransfection studiestransfection studies
The gene transfer and transgene expression after cellular transfection
was monitored using green fluorescent protein (GFP) plasmid (pEGFP-N1)
encoding for green fluorescent protein, hereafter designed by pDNA, which
was amplified and isolated with a PlasmidPrep Midi Flow kit (GE Healthcare).
The concentration and purity of pDNA were determined using a NanoDrop
1000 (Thermo Scientific) apparatus. Two cell culture lines were used in this
study, SH-SY5Y and HeLa. SH-SY5Y cell line was grown in Minimum Essential
Medium (MEM) (Lonza) and Ham’s F-12 (Lonza) (1:1), supplemented with
10% (v/v) heat inactivated fetal bovine serum (FBS – Gibco), 2 mM L-
Glutamine (Lonza), 100U Penicillin/Streptomycin (Gibco) and 1% MEM non-
essential amino acid solution (Sigma). HeLa cell line was grown in Dulbecco’s
Modified Eagle’s Medium (Lonza) supplemented with 10% FBS and 100U
Penicillin/Streptomycin. Cells were cultured in a humidified 5% CO2
atmosphere at 37°C. For transfection studies, cells were seeded at
approximately 70% confluence in 6-well tissue culture plates, 24 h before the
experiments. Before transfection, growth medium was removed and cells
were washed twice with PBS, pH 7.4. Cells were then incubated with 200 µL of
lipoplexes prepared with liposomes and pDNA in OPTI-MEM (Gibco). The final

86 COMPACTION PROCESS OF DNA BY FLUORINATED LIPOSOMES
concentration of pDNA was 8 µg/well. The negative control corresponded to
cells treated with liposomes without pDNA. After 5 h, the medium was
replaced by fresh growth medium and transfection was assessed after 48 h
incubation time by flow cytometry (FACS Canto II, BD Biosciences) and CLSM.
4.1.10.1.4.1.10.1.4.1.10.1.4.1.10.1. Pulse cytophotometryPulse cytophotometryPulse cytophotometryPulse cytophotometry
Pulse cytophotometry, usually entitled flow cytometry or FACS
(Fluorescence-activated cell sorter) is a biophysical technique used to count
cells through detection of a biomarker inside the cell structure. The detection
is performed by suspending the cells in a fluid that passes through a laser
capable of detecting the biomarkers. This technique is useful because it can
analyse multiple parameters of individual cells within heterogeneous
populations (Givan, 2001; Shapiro, 2003). Twenty thousand events were
measured for each sample. Experimental data were statistically analysed
applying one-way analysis of variance (ANOVA) following Tukey test approach.
4.1.10.2.4.1.10.2.4.1.10.2.4.1.10.2. Confocal Laser Scanning MicroscopyConfocal Laser Scanning MicroscopyConfocal Laser Scanning MicroscopyConfocal Laser Scanning Microscopy
Microscopy images of transfected cells were obtained using a confocal
laser scanning microscope (CLSM), Leica SP2 AOBS SE (Leica Microsystems).
Confocal imaging is an optical microscopy tool that provides a high resolution
image in a three dimensional form without destruction. This technique has
the ability to acquire in-focus images from selected depths (optical sectioning)
and rebuilt a three-dimensional image through computer technology. This
process was coupled with fluorescence microscopy, allowing the visualisation
of specimens that emit colour from fluorescent markers when exposed to
light (Pawley, 2006).

COMPACTION PROCESS OF DNA BY FLUORINATED LIPOSOMES 87
4.2.4.2.4.2.4.2. Results and DiscussionResults and DiscussionResults and DiscussionResults and Discussion
4.2.1.4.2.1.4.2.1.4.2.1. ElectElectElectElectric propertiesric propertiesric propertiesric properties and diameterand diameterand diameterand diameter of of of of
the complexesthe complexesthe complexesthe complexes
The electric properties of the lipoplexes were firstly studied by
evaluating their electrophoretic mobility (µe) as a function of the L/D ratio. In
this way, changes in the electrokinetic behaviour of the systems will be
univocally related to the presence of the fluorinated lipid F7-CHOL
(heptafluorocholesterol) in one of the systems. The experimental data of µe as
a function of L/D ratio for DOTAP:CHOL/DNA and DOTAP:F7-CHOL/DNA
systems fit to a sigmoidal curve that divides the L/D axis in three different zeta
potential regions (Figure 4.3.A and Figure 4.4.A): i) a region where lipoplexes
show a net negative and almost constant electrophoretic mobility; ii) a region
where the isoelectric point (L/D)0 is reached and an inversion of the
electrophoretic mobility sign takes place and iii) a region of net positive
electrophoretic mobility that tends to the value of the pure liposomes. This
behaviour was previously found in works with other cationic lipoplexes
(Barrán-Berdón, 2012; Muñoz-Úbeda, 2010; Muñoz-Úbeda, 2011; Rodriguez-
Pulido, 2009). Examples of a sign reversal in the electrophoretic mobility have
been also reported for different cationic lipoplexes (Zuzzi, 2007) as well as
other colloidal systems such liposomes (Martín-Molina, 2010), latex particles
(Martín-Molina, 2003; Martín-Molina, 2008; Martín-Molina, 2009; Popa, 2010;
Schneider, 2011) and DNA (Besteman, 2007) in the presence of multivalent
counterions. In all these cases, the change of the sign in the electrophoretic
mobility is explained in terms of a charge inversion (or overcharging)
phenomena (Lyklema, 2009).

88 COMPACTION PROCESS OF DNA BY FLUORINATED LIPOSOMES
In our case, although the two systems present a similar qualitative behaviour,
the curve corresponding to DOTAP:F7-CHOL/DNA lipoplexes appears shifted
towards larger L/D ratio than that reported for lipoplexes without F7-CHOL. In
0 2 4 6 8 10
150
200
250
300
350
400
450
0 2 4 6 8 10
-6
-4
-2
0
2
4
6
Hyd
rodyna
mic
dia
mete
r (n
m)
L/D
A
B
µe (
µm
cm
/Vs)
L/D
Figure 4.3. Electrophoretic mobility (A) and hydrodynamic diameter (B) of
DOTAP:CHOL-DNA lipoplexes at different lipid-DNA (L/D) mass ratios in HEPES
buffer (10 mM, pH 7.4). The DOTAP:CHOL molar ratio is 1:1 and DNA
concentration is 0.05 mg/mL.

COMPACTION PROCESS OF DNA BY FLUORINATED LIPOSOMES 89
particular, the isoelectric point for DOTAP:CHOL/DNA and DOTAP:F7-
CHOL/DNA is within the ranges 3 < (L/D)0 < 4 and 4 < (L/D)0 < 5, respectively.
0 2 4 6 8 10
150
200
250
300
350
400
450
0 2 4 6 8 10
-6
-4
-2
0
2
4
6
Hyd
rodyna
mic
dia
mete
r (n
m)
L/D
µe (
µm
cm
/Vs)
L/D
A
B
Figure 4.4. Electrophoretic mobility (A) and hydrodynamic diameter (B) of
DOTAP:F7-CHOL-DNA lipoplexes at different lipid-DNA (L/D) mass ratios in
HEPES buffer (10 mM, pH 7.4). The DOTAP:F7-CHOL molar ratio is 1:1 and DNA
concentration is 0.05 mg/mL.

90 COMPACTION PROCESS OF DNA BY FLUORINATED LIPOSOMES
This means that more liposomes are required to neutralise the charge of DNA
in the system with F7-CHOL. Although this fluorinated lipid does not provide
net charge to the liposomes, its presence in the lipid bilayer seems to reduce
the electropositive behaviour of the DOTAP liposomes. This feature could be
related to the strong interaction between DOTAP and fluorinated cholesterol.
Lipid monolayers studies showed that the area per molecule of DOTAP
monolayer is reduced if fluorinated cholesterol lipids are included and that
the lipid mixture monolayer is homogeneous at the low surface pressure of 5
mN/m in contrast to DOTAP:CHOL monolayer, which become miscible only
when the pressure reaches 20 mN/m (Paiva, 2013). This could explain, at least
in part, the differences between the two curves.
The hydrodynamic diameter of complexes that resulted from the
interaction of DNA, at a constant concentration, and liposomes increases with
liposome concentration and up to the isoelectric point (Figure 4.3.B and
Figure 4.4.B). Further increase of the liposome amount leads to a decrease of
the diameter of the lipoplexes and at L/D ratios of 9 and 10 the values tend to
that of the liposomes. The hydrodynamic diameter of the liposomes was 97 ±
9 nm (PdI = 0.36 ± 0.22) for DOTAP:CHOL and 103 ± 7 nm (PdI = 0.30 ± 0.21)
for DOTAP:F7-CHOL. The maximum size value of the complexes is observed at
a ratio close to the isoelectric point. Similar behaviour has been reported for
other lipoplexes including for complexes of DOTAP liposomes and double
strand DNA (Barrán-Berdón, 2012; Besteman, 2007). The aggregation of DNA
and liposomes is discussed as a reversible process resulting from a balance of
long-range electrostatic repulsion and of short-range attraction (Bordi, 2005;
Sennato, 2005). It is also described that the formation of complexes occurs
without the rupture of the vesicles and that large clusters result from the
aggregation of the liposome-DNA complexes (Sennato, 2005).

COMPACTION PROCESS OF DNA BY FLUORINATED LIPOSOMES 91
The mechanism that is proposed in the literature considering the surface
charges agrees with our results: DNA interacts with the liposomes through
electrostatic interactions and when the amount of negatively charged DNA
nearly counterbalances the liposome positive surface charges, the maximum
aggregation is reached (Ciani, 2007; Sennato, 2005).
4.2.2.4.2.2.4.2.2.4.2.2. DNA binding affinity to liposomesDNA binding affinity to liposomesDNA binding affinity to liposomesDNA binding affinity to liposomes
Fluorescence spectroscopy was carried out following the variation on
the emission of ethidium bromide (EtBr) in aqueous solutions at constant DNA
concentration and increasing liposome amount. EtBr is an aromatic planar
cationic probe, which intercalates between base pairs of double-stranded
DNA leading to a high fluorescence quantum yield, compared to low
fluorescence intensity when dispersed in water. Since liposomes do not
quench the fluorescence of EtBr, the decreasing of fluorescence intensity with
increasing L/D ratio for DOTAP:F7-CHOL/DNA lipoplexes confirms the
exclusion of the EtBr from the DNA base pair microenvironment (Figure
4.5.A). A similar tendency was observed for DOTAP:CHOL/DNA lipoplexes.
Since the intercalation of EtBr unwinds the DNA base pairs near the
intercalation site by 26°, the conformational flexibility of DNA may decrease
after it binds to the liposomes (Jones, 1980). The interaction of DNA with
positively charged liposomes is expected to lead to a conformation
rearrangement of the DNA macromolecule (Bordi, 2003; Ciani, 2004;
Goncalves, 2004; Piedade, 2004). The displacement of EtBr from DNA to bulk
might also be a consequence of the strong electrostatic interactions between
DNA and cationic liposomes, which will decrease the ionic attractive forces
between EtBr and DNA (Chen, 2000).

92 COMPACTION PROCESS OF DNA BY FLUORINATED LIPOSOMES
560 580 600 620 640 660 680
0
100
200
300
400
500
600
700
0 2 4 6 8 10
0.0
0.2
0.4
0.6
0.8
1.0
L/D = 10
I F (a.u
.)
λ (nm)
L/D = 0 DOTAP:F7-CHOL/DNA
A
B
DOTAP:CHOL/DNA
DOTAP:F7-CHOL/DNA
I F (
λ =
590
nm
, a.u
.)
L/D
Figure 4.5. (A) Emission fluorescence spectra of DNA:EtBr (6:1) in the presence
of DOTAP:F7-CHOL liposomes at the lipid/DNA (L/D) mass ratios from 0 to 10;
dotted line shows the emission fluorescence spectrum of EtBr in HEPES buffer
solution without liposomes and lipoplexes. (B) Emission fluorescence intensity
of DNA:EtBr (6:1) at 590 nm in the presence of DOTAP:CHOL and DOTAP:F7-
CHOL liposomes at L/D ratios form 0 to 10. The values were normalised to the
maximum fluorescence intensity (DNA:EtBR in the absence of liposomes).
DOTAP:sterol ratio is 1:1 and the DNA concentration is 0.025 mg/mL.

COMPACTION PROCESS OF DNA BY FLUORINATED LIPOSOMES 93
The maximum emission intensity, which is at 590 nm, decreases comparably
for both DOTAP:CHOL and DOTAP:F7-CHOL liposomes when added at
increasing concentrations to DNA:EtBr complex (Figure 4.5.B). The emission
intensity at 590 nm is slightly lower for lipoplexes of DOTAP:CHOL and DNA
than for DOTAP:F7-CHOL and DNA at L/D ratios of 2 and 3, indicating that
more DOTAP:F7-CHOL liposomes are required to compact the same amount
of DNA. This result is in accordance with the electrophoretic mobility study.
4.2.3.4.2.3.4.2.3.4.2.3. MMMMorphologyorphologyorphologyorphology of the complexesof the complexesof the complexesof the complexes
The structure, size and morphology of the lipoplexes are known to be
key factors in transfection efficiency (Rodriguez-Pulido, 2009). The different
nature of the liposomes and consequently the L/D ratios in the lipoplexes
were studied by means of TEM imaging. The micrographs were selected to be
representative with respect to all observations. Both DOTAP:CHOL and
DOTAP:F7-CHOL liposomes are unilamellar and present a spherical shape
(Figure 4.6). The size of the vesicles observed by TEM is in agreement with the
size distribution obtained by dynamic light scattering. The presence of the
fluorinated atoms in the bilayer does not affect the overall size of the
liposomes. TEM micrographs were also taken to lipoplex samples at L/D ratios
below and above the isoneutrality ratio, (L/D)0. It is expected that liposome
structure, size and morphology change in the presence of DNA.
On Figure 4.6 (B-C) and (E-F) is possible to see details of the
micrographs taken at a L/D ratio < (L/D)0, for DOTAP:CHOL and DOTAP:F7-
CHOL system, respectively. In this case, lipoplexes present an excess of DNA.
Not many differences are observed for these lipoplexes when compared to
the respective liposome. However is notice a more delimited pattern around
the particles in the presence of DNA. This happens because DNA molecules
present a negative contrast when exposed to uranyl acetate, evidencing a

94 COMPACTION PROCESS OF DNA BY FLUORINATED LIPOSOMES
darker colour. The presence of a more intense colour around the bilayer
indicates an increase on the density on the surface of the vesicles, confirming
that DNA is compacted on the surface of the liposomes through strong
electrostatic interactions, which is in agreement with potential and
fluorescence studies.
The strong interaction between the liposome and DNA could have other
consequences. One is that it could lead to a disruption on the liposomes,
producing smaller complexes, not observed for these systems, meaning that
they are very stable with and without DNA. Another consequence is that
when L/D is close to (L/D)0 liposomes could fuse due to the action of the
condensed DNA (Rodriguez-Pulido, 2008; Rodriguez-Pulido, 2009). From size
measurements, for both systems, is observed this fusion or complex
aggregation by the increase of the lipoplex diameter with the approximation
of the isoneutrality ratio. On Figure 4.7 is presented some micrographs where
Figure 4.6. TEM micrographs of liposomes in the absence of DNA (A and D) and
of lipoplexes at L/D<(L/D)0 (B, C, E, F). (A-C) refers to DOTAP:CHOL system and
(D-F) to DOTAP:F7-CHOL. Scale bar: 100 nm.

COMPACTION PROCESS OF DNA BY FLUORINATED LIPOSOMES 95
L/D ratio is above the isoelectric point, for DOTAP-CHOL (A-C) and DOTAP:F7-
CHOL (D-F) systems. In this case, it was not only notice the increase on the
density of the liposomes surface, as well as a clear shell covering the entire
liposome. The exhibition of ramifications is consistent with the liposome
coated by the DNA molecules.
4.2.4.4.2.4.4.2.4.4.2.4. Boundary concentrations of the Boundary concentrations of the Boundary concentrations of the Boundary concentrations of the
lipoplexeslipoplexeslipoplexeslipoplexes
The different electrokinetic regions found experimentally for the
lipoplexes as a function of the L/D ratio were also analysed from a theoretical
point of view by using the complexation model presented in section 4.1.7. In
particular, the model is applied to predict the phase diagrams of the
Figure 4.7. Details extrated from the original TEM micrographs of lipoplexes at
L/D>(L/D)0. (A-C) refers to DOTAP:CHOL system and (D-F) to DOTAP:F7-CHOL.
Scale bar: 100 nm.

96 COMPACTION PROCESS OF DNA BY FLUORINATED LIPOSOMES
lipoplexes in this work, i. e., the calculation of the boundary concentrations
Sa(P) and Sd(P) as a function of the DNA concentration (P). To this end, the
electrophoretic data are used to obtain the experimental values of Sa(Pexp) and
Sd(Pexp) for the DNA concentration that was used in the experiments (Table
4.1). Then, these inputs are used to solve equations (4.3) and (4.4) in order to
determine the characteristic parameters P0 and E0 for each system (Table 4.1).
The experimental conditions required for the calculations (Table 4.1)
are determined as follows: q is estimated assuming a DNA molecule formed
Parameter1
DOTAP:CHOL/DNA DOTAP:F7CHOL/DNA
a (nm) 50.0 50.0
κD (nm-1) 5.33 5.33
Ce (C2 J-1) 1.17 x 10⁻¹³ 1.17 x 10⁻¹³
Q (e) 28500 28500
q (e) 5400 5400
Pexp (segments/l) 17.16 x 10¹⁵ 17.16 x 10¹⁵
Sa(Pexp) (part/l) 1.55 x 10¹⁵ 1.74 x 10¹⁵
Sd(Pexp) (part/l) 5.59 x 10¹⁵ 3.05 x 10¹⁵
E0 (J) 5.57 x 10⁻²⁶ 25.40 x 10⁻²⁶
P0 (segments/l) 5.60 x 10¹⁵ 2.91 x 10¹⁵
1
a, liposome radius; κD, reciprocal Debye length; Ce, liposome capacitance; Q,
liposome charge; q, charge of DNA segment; P, DNA concentration; Sa(P), liposome concentration at aggregation; Sd(P), liposome concentration at disaggregation; E0, DNA-liposome interaction energy; P0, DNA concentration in equilibrium with lipoplexes.
Table 4.1. Phenomenological parameters P0 and E0 for each system and the
required experimental conditions for their calculation.

COMPACTION PROCESS OF DNA BY FLUORINATED LIPOSOMES 97
by 2700 bp fragments on average (obtained from agarose gel electrophoresis
experiments (Muñoz-Úbeda, 2010; Rodriguez-Pulido, 2009)); Q is calculated
from the surface area of the liposome and the estimated area for the
headgroup of the lipid. The phenomenological parameter E0 is much larger for
DOTAP:F7-CHOL/DNA than for DOTAP:CHOL/DNA lipoplexes. This feature may
be understood as the strength of the liposome-DNA binding being stronger in
the case of DOTAP:F7-CHOL/DNA system. On the other hand, P0 < Pexp in both
cases, which agrees with the assumption that most of the DNA molecules is
forming the complexes. However, the value of P0 for DOTAP:F7-CHOL/DNA is
almost half of that obtained for the lipoplexes without F7-CHOL. Although
more DOTAP:F7-CHOL liposomes are required to form the lipoplexes, most of
the DNA molecules could be implicated in the complexation once the
lipoplexes are formed.
The values of P0 are similar as those reported for other charged
lipoplexes (Barrán-Berdón, 2012; Muñoz-Úbeda, 2010; Rodriguez-Pulido,
2009). The values of E0, on the other hand, are much lower than those
calculated in the present work. This is due to the definition of Ce, which in the
previous works was defined in the vacuum instead of in an electrolyte
solution. In any case, we must be aware that P0 and E0 are two
phenomenological parameters and as the authors of the model stated, it is
difficult to assign them a real meaning on the basis of a microscopic theory
(Nguyen, 2001a).
Once the parameters are calculated, the values of Sa(P) and Sd(P) can
be predicted for any DNA concentration by varying P in equations (4.3) and
(4.4). Figure 4.8 shows the theoretical phase diagram of DOTAP:CHOL/DNA
and DOTAP:F7-CHOL/DNA. Given a constant value of P, the phase diagram
predicts the existence of negatively charged stable lipoplexes for liposome
concentrations S < Sa(P), with free anionic polyelectrolyte in excess. If S

98 COMPACTION PROCESS OF DNA BY FLUORINATED LIPOSOMES
increases, lipoplexes experience aggregation and the suspension becomes
unstable (grey region of the diagrams in Figure 4.8).
In this domain of S concentration, i.e., for Sa(P) < S(P) < Sd(P), the isoneutrality
of the lipoplexes is reached (the electrophoretic mobility is null). However,
Figure 4.8. Boundary concentration lines, Sa(P) and Sd(P), for DOTAP:CHOL/DNA
(up) and DOTAP:F7-CHOL/DNA (down) lipoplexes, according to the aggregation-
disaggregation theory.
0.0 0.5 1.0 1.5 2.0 2.5 3.0 3.5 4.0
5
10
15
20
25
30
Sd(P)
Sa(P)
Sd(P
exp)S
a(P
exp)
10
15 P
(p
art
/l)
1015
S (part/l)
DOTAP:F7-Chol/DNA
Pexp
0.0 0.5 1.0 1.5 2.0 2.5 3.0 3.5 4.0
5
10
15
20
25
30
Sd(P)
Sa(P)
Sd(P
exp)S
a(P
exp)
10
15 P
(pa
rt/l)
1015
S (part/l)
DOTAP:Chol/DNA
Pexp

COMPACTION PROCESS OF DNA BY FLUORINATED LIPOSOMES 99
the theory predicts that complexes at this point attract more cationic
liposomes than those required to neutralise the negative charge (Nguyen,
2001a). As a consequence, a charge inversion process takes place. Finally, for
S > Sd(P), clusters start to partially dissolve giving rise to stable and free
positively charged lipoplexes in coexistence with the remaining clusters.
4.2.5.4.2.5.4.2.5.4.2.5. Stability ratio Stability ratio Stability ratio Stability ratio
Similar results were obtained for the stability rate of DOTAP:CHOL and
DOTAP:F7-CHOL liposomes as a function of DNA concentration (Figure 4.9):
the stability of the liposomes decreases as the DNA concentration increases
until the systems become unstable. Then if the DNA concentration continues
to increase, both systems are stabilised again. This behaviour is in general
similar to that found for the electrophoretic mobility measurements in which
two asymptotic values of |µe| were reached for low and high values of L/D
ratio. Consequently, regions in which the systems are stable are attributed to
the formation of lipoplexes that are stabilised electrostatically. In contrast,
regions where W ∼ 1 corresponds to a range of DNA concentration at which
the isoelectric point of the lipoplexes is expected to be reached. Furthermore,
the regions where the systems are stable and unstable agree with those
predicted by the complexation model in which a reentrant condensation
procedure is expected to happen. Concerning the numerical values of CCC and
CSC, slight differences are observed: these critical DNA concentrations are,
respectively, 0.022 mg/mL and 0.078 mg/m for DOTAP:CHOL. In the case of
DOTAP:F7-CHOL, the values of CCC and CSC are, respectively, 0.026 mg/mL
and 0.087 mg/mL. The observed small differences agree with those found in
the results of electrophoretic mobility, which showed that for the system with
F7-CHOL lipids more liposomes are required to neutralise the charge of DNA.

100 COMPACTION PROCESS OF DNA BY FLUORINATED LIPOSOMES
Accordingly, the interaction between DOTAP and fluorinated cholesterol can
0.01 0.1
1
10
100
1000
10000W
DNA concentration (mg/mL)
A
0.01 0.1
1
10
100
1000
10000
W
DNA concentration (mg/mL)
B
Figure 4.9. Fuchs stability ratio W (stability factor) of liposomes DOTAP:CHOL (A)
and DOTAP:F7-CHOL (B), as a function of DNA concentration. Data are
presented on the logarithmic scale.

COMPACTION PROCESS OF DNA BY FLUORINATED LIPOSOMES 101
justify the different electrokinetic and stability behaviour that was found for
this system.
The ionic strength of physiological media can affect the process of DNA
complexation, shifting the stability ratio, DNA-liposome condensation curve
and the isoelectric point of the lipoplexes, which will have a direct implication
on the DNA transfection efficiency. In general, salt reduces the electrical
surface potential of the liposomes and the increase of the ionic strength shifts
the isoelectric point to higher L/D ratios (Eastman, 1997; Kennedy, 2000;
Pullmannova, 2012). However, the effect of NaCl on the neutralisation is
dependent on the salt concentration and on the type of lipids present in the
system (Eastman, 1997; Hirsch-Lerner, 2005). The DOTAP:CHOL system was
the least sensitive to increases of NaCl and had better integrity in serum when
compared to others such as DOTAP:DOPE liposomes. The percentage of DNA
that was associated to the liposomes in 150 mM of NaCl aqueous solution was
more than 90% for DOTAP/DNA charge ratios of 1:1 and 1:2 (Hirsch-Lerner,
2005).
4.2.6.4.2.6.4.2.6.4.2.6. DNA conformationDNA conformationDNA conformationDNA conformation
The number of base pairs per turn, the inclination of the base with
respect to the helix axis, the distance of the bases from the helix axis, the rise
per base pair and the handedness of the helix characterise the polymorphism
of the secondary structure of nucleic acids.
Both ctDNA and pDNA samples (Figure 4.10) were analysed by CD
spectroscopy. They both show a negative peak at 246 nm, a positive peak
around 273 nm with the zero crossing around 260 nm, which is consistent
with the CD spectra for a B conformation of a double helical DNA. In this case,
the base pairs are perpendicular to the double helix axis, which confers a
weak chirality to the molecule, which is characterised by the low peak

102 COMPACTION PROCESS OF DNA BY FLUORINATED LIPOSOMES
intensities. The variation in the amplitude of the CD signal may be due to the
different nucleotide sequences (Kypr, 2009; Marty, 2009).
When DNA is electrostatically bound to the lipid vesicles, a decrease in
the Δε (M-1 cm-1) signal of the positive peak and an increase in the absolute
value of the negative peak of the CD spectra are observed (Figure 4.11). Also
both peaks reveal a red wavelength shift. The binding of DNA to the vesicles
generates a conformation change or at least a transition on the DNA
polymorphism. The differences may suggest a partial B- to C-DNA
conformational transition as stated before in the literature for DOTAP
complexes (Marty, 2009). The C-form CD spectrum was found for DNA
condensed or packaged systems, especially monocationic lipid formulations
(Ranjbar, 2009; Simberg, 2001).
220 240 260 280 300
-4
-2
0
2
4
∆ε
(Μ−
1 c
m−
1)
Wavelength (nm)
ctDNA
pDNA
Figure 4.10. CD spectra of ctDNA and pDNA in Tris buffer (pH=7.4).

COMPACTION PROCESS OF DNA BY FLUORINATED LIPOSOMES 103
DNA is thus more compacted in the presence of the carrier. The use of
the fluorinated helper lipid (F7-CHOL) has no impact on the conformational
220 240 260 280 300
-3
-2
-1
0
1
2
3∆
ε (Μ
−1 c
m−
1)
Wavelength (nm)
ctDNA
DOTAP:CHOL/ctDNA
DOTAP:F7-CHOL/ctDNA
220 240 260 280 300-6
-4
-2
0
2
4
6
Wavelength (nm)
∆ε
(Μ−
1 c
m−
1)
pDNA
DOTAP:CHOL/pDNA
DOTAP:F7-CHOL/pDNA
Figure 4.11. CD spectra of ctDNA (up) and pDNA (down) for DNA alone and
complexes of DNA with DOTAP:CHOL and DOTAP:F7-CHOL at the L/D ratio of
10:1.

104 COMPACTION PROCESS OF DNA BY FLUORINATED LIPOSOMES
structure of the DNA when compared with CHOL lipid, since the spectral
curves are overlapped. Different L/D ratios (1, 2, 6 and 20) were also tested,
however no significant differences were found between ratios, indicating that
the DNA conformation does not change with the increase of the lipid
concentration.
4.2.7.4.2.7.4.2.7.4.2.7. Cell transfection studiesCell transfection studiesCell transfection studiesCell transfection studies
The transfection efficiency of lipoplexes was evaluated using two
different cell lines: SH-SY5Y, a human neuroblastoma derived cell line, and
HeLa, an immortal cell line, derived from cervical cancer. Cell lines were
transfected with plasmid DNA (pDNA) encoding green fluorescent protein
(GFP). Flow cytometry analysis revealed that GFP expression was induced
similarly by DOTAP:F7-CHOL/pDNA and DOTAP:CHOL/pDNA, in both cell lines
(Figure 4.12).
DOTAP:CHOL/pDNA DOTAP:F7-CHOL/pDNA0
5
10
15
20
25
30
35
40
% T
ran
sfe
cte
d c
ells
SH-SY5Y
DOTAP:CHOL/pDNA DOTAP:F7-CHOL/pDNA0
5
10
15
20
25
30
% T
ransfe
cte
d c
ells
HeLa
Figure 4.12. Transfection of SH-SY5Y and HeLa cell lines with green fuorescent
protein (GFP plasmid (pDNA): cytometry analysis of levels of transfection of
cells using DOTAP:CHOL and DOTAP:F7-CHOL systems. The L/D ratio was 10:1.
Results are expressed as mean ± S.D. (n = 3).

COMPACTION PROCESS OF DNA BY FLUORINATED LIPOSOMES 105
Comparing the different type of cells, DOTAP:F7-CHOL/pDNA system shows
higher transfection efficiency in SH-SY5Y line (P < 0.01), whereas for
DOTAP:CHOL/pDNA the differences are not significant. Naked pDNA did not
transfect the cells (Figure 4.13).
DOTAP:CHOL was shown to be more efficient than the commercial
formulation lipofectamine® (Ramesh, 2001) and to transfect different cell
tissues as lung and heart cell tissues (Templeton, 1997). The system has been
studied in vivo and shown to be efficient also in transporting genetic material
to cells (Eliyahu, 2007; Kim, 2007; Ramesh, 2001; Templeton, 1997).
SH
-SY
5Y
H
eLa
A. Naked pDNA B. DOTAP:CHOL C. DOTAP:F7-CHOL
Figure 4.13. Illustrative confocal images of GFP expression for SH-Sy5Y and HeLa
cell lines when transfected with naked plasmid DNA (A), DOTAP:CHOL/pDNA (B)
and DOTAP:F7-CHOL/pDNA (C). The scale bar is 50 µm.

106 COMPACTION PROCESS OF DNA BY FLUORINATED LIPOSOMES
DOTAP:F7-CHOL is thus a good candidate for in vivo studies, regarding the
similarities of the in vitro transfection results with DOTAP:CHOL.
4.3.4.3.4.3.4.3. ConclusionsConclusionsConclusionsConclusions
We propose the use of F7-CHOL (heptafluorocholesterol) as helper
lipid in cationic DOTAP liposomes for DNA delivery. This fluorinated derivative
of cholesterol was chosen because previous studies highlighted the efficient
gene transfer by lipids containing fluorinated hydrophobic chains (Boulanger,
2004; Boussif, 2001; Gaucheron, 2001a; Gaucheron, 2001b; Gaucheron,
2002). The properties of the system with fluorinated cholesterol were
compared to that of DOTAP:CHOL liposomes. The results show that more
liposomes are required to form the lipoplexes with DOTAP:F7-CHOL system
than with DOTAP:CHOL. However, the aggregation-disaggregation model
predicts that, even if more DOTAP:F7-CHOL liposomes are needed, most of
the DNA is involved in the complexation process when the lipoplexes are
formed. Both DOTAP:F7-CHOL and DOTAP:CHOL systems show similar stability
in the presence of DNA and have identical transfection efficiency. These
results are in agreement with other studies that describe also comparable
DNA compaction process, size of lipoplexes and transfection efficiency for the
commonly used helper lipid DOPE and its fluorinated analogues when mixed
with cationic lipids (Gaucheron, 2001a). Our study verified that fluorine atoms
can be included in the cholesterol molecule without dramatically changing the
properties of the cationic liposomes.
4.4.4.4.4.4.4.4. ReferencesReferencesReferencesReferences
Aagaard, L.; Rossi, J.J. (2007). RNAi therapeutics: Principles, prospects and
challenges, Advanced Drug Delivery Reviews, 59, 75.

COMPACTION PROCESS OF DNA BY FLUORINATED LIPOSOMES 107
Audouy, S.A.L.; de Leij, L.F.M.H.; Hoekstra, D.; Molema, G. (2002). In vivo
characteristics of cationic liposomes as delivery vectors for gene
therapy, Pharmaceutical Research, 19, 1599.
Baase, W.A.; Johnson, W.C., Jr. (1979). Circular dichroism and DNA secondary
structure, Nucleic Acids Research, 6, 797.
Barrán-Berdón, A.L.; Muñoz-Úbeda, M.; Aicart-Ramos, C.; Pérez, L.; Infante,
M.R.; Castro-Hartmann, P.; Martín-Molina, A.; Aicart, E.; Junquera, E.
(2012). Ribbon-type and cluster-type lipoplexes constituted by a
chiral lysine based cationic gemini lipid and plasmid DNA, Soft
Matter, 8, 7368.
Besteman, K.; Van Eijk, K.; Lemay, S.G. (2007). Charge inversion accompanies
DNA condensation by multivalent ions, Nature Physics, 3, 641.
Bohinc, K.; Brezesinski, G.; May, S. (2012). Modeling the influence of adsorbed
DNA on the lateral pressure and tilt transition of a zwitterionic lipid
monolayer, Physical Chemistry Chemical Physics, 14, 10613.
Bordi, F.; Cametti, C.; De Luca, F.; Gili, T.; Gaudino, D.; Sennato, S. (2003).
Charged lipid monolayers at the air-solution interface: coupling to
polyelectrolytes, Colloids and Surfaces B-Biointerfaces, 29, 149.
Bordi, F.; Cametti, C.; Diociaiuti, M.; Sennato, S. (2005). Large equilibrium
clusters in low-density aqueous suspensions of polyelectrolyte-
liposome complexes: A phenomenological model, Physical Review E,
71, 050401.
Boulanger, C.; Di Giorgio, C.; Gaucheron, J.; Vierling, P. (2004). Transfection
with fluorinated lipoplexes based on new fluorinated cationic lipids
and in the presence of a bile salt surfactant, Bioconjugate Chemistry,
15, 901.
Boussif, O.; Gaucheron, J.; Boulanger, C.; Santaella, C.; Kolbe, H.V.J.; Vierling,
P. (2001). Enhanced in vitro and in vivo cationic lipid-mediated gene

108 COMPACTION PROCESS OF DNA BY FLUORINATED LIPOSOMES
delivery with a fluorinated glycerophosphoethanolamine helper lipid,
Journal of Gene Medicine, 3, 109.
Buschow, K.H.J.C., Robert W.; Flemings, Merton C.; Ilschner, Bernhard;
Kramer, Edward J.; Mahajan, Subhash; Encyclopedia of Materials -
Science and Technology, Volume 1-11, 1st Edition, Elsevier, The
Netherlands, 2001.
Butt, H.-J.; Graf, K.; Physics and chemistry of interfaces, Wiley-VCH, Germany,
2006.
Chen, W.; Turro, N.J.; Tomalia, D.A. (2000). Using ethidium bromide to probe
the interactions between DNA and dendrimers, Langmuir, 16, 15.
Ciani, L.; Ristori, S.; Calamai, L.; Martini, G. (2004). DOTAP/DOPE and DC-
Chol/DOPE lipoplexes for gene delivery: zeta potential measurements
and electron spin resonance spectra, Biochimica Et Biophysica Acta-
Biomembranes, 1664, 70.
Ciani, L.; Ristori, S.; Bonechi, C.; Rossi, C.; Martini, G. (2007). Effect of the
preparation procedure on the structural properties of
oligonucleotide/cationic liposome complexes (lipoplexes) studied by
electron spin resonance and Zeta potential, Biophysical Chemistry,
131, 80.
Crook, K.; Stevenson, B.J.; Dubouchet, M.; Porteous, D.J. (1998). Inclusion of
cholesterol in DOTAP transfection complexes increases the delivery
of DNA to cells in vitro in the presence of serum, Gene Therapy, 5,
137.
Eastman, S.J.; Siegel, C.; Tousignant, J.; Smith, A.E.; Cheng, S.H.; Scheule, R.K.
(1997). Biophysical characterization of cationic lipid:DNA complexes,
Biochimica Et Biophysica Acta-Biomembranes, 1325, 41.
Ebnesajjad, S.; Surface Treatment of Materials for Adhesion Bonding, William
Andrew, United States of America, 2006.

COMPACTION PROCESS OF DNA BY FLUORINATED LIPOSOMES 109
Eliyahu, H.; Joseph, A.; Schillemans, J.P.; Azzam, T.; Domb, A.J.; Barenholz, Y.
(2007). Characterization and in vivo performance of dextran-
spermine polyplexes and DOTAP/cholesterol lipoplexes administered
locally and systemically, Biomaterials, 28, 2339.
Espinosa-Andrews, H.; Báez-González, J.G.; Cruz-Sosa, F.; Vernon-Carter, E.J.
(2007). Gum Arabic−Chitosan Complex Coacervabon,
Biomacromolecules, 8, 1313.
Farago, O.; Grønbech-Jensen, N.; Pincus, P. (2006). Mesoscale Computer
Modeling of Lipid-DNA Complexes for Gene Therapy, Physical Review
Letters, 96, 018102.
Farago, O.; Grønbech-Jensen, N. (2007). Computational and Analytical
Modeling of Cationic Lipid-DNA Complexes, Biophysical Journal, 92,
3228.
Gaucheron, J.; Boulanger, C.; Santaella, C.; Sbirrazzuoli, N.; Boussif, O.;
Vierling, P. (2001a). In Vitro Cationic Lipid-Mediated Gene Delivery
with Fluorinated Glycerophosphoethanolamine Helper Lipids,
Bioconjugate Chemistry, 12, 949.
Gaucheron, J.; Santaella, C.; Vierling, P. (2001b). Improved in vitro gene
transfer mediated by fluorinated lipoplexes in the presence of a bile
salt surfactant, The Journal of Gene Medicine, 3, 338.
Gaucheron, J.; Santaella, C.; Vierling, P. (2002). Transfection with fluorinated
lipoplexes based on fluorinated analogues of DOTMA, DMRIE and
DPPES, Biochimica et Biophysica Acta (BBA) - Biomembranes, 1564,
349.
Givan, A.L.; Flow Cytometry: First Principles, 2nd Edition, John Wiley & Sons,
United States of America, 2001.

110 COMPACTION PROCESS OF DNA BY FLUORINATED LIPOSOMES
Goncalves, E.; Debs, R.J.; Heath, T.D. (2004). The effect of liposome size on the
final lipid/DNA ratio of cationic lipoplexes, Biophysical Journal, 86,
1554.
Hiemenz, P.C.; Rajagopalan, R.; Principles of colloid and surface chemistry, 3rd
Edition, Marcel Dekker, United States of America, 1997.
Hirsch-Lerner, D.; Zhang, M.; Eliyahu, H.; Ferrari, M.E.; Wheeler, C.J.;
Barenholz, Y. (2005). Effect of "helper lipid" on lipoplex electrostatics,
Biochimica Et Biophysica Acta-Biomembranes, 1714, 71.
Jones, R.L.; Lanier, A.C.; Keel, R.A.; Wilson, W.D. (1980). The effect of ionic
strength on DNA-ligand unwinding angles for acridine and quinoline
derivatives., Nucleic Acids Research, 8, 1613.
Kennedy, M.T.; Pozharski, E.V.; Rakhmanova, V.A.; MacDonald, R.C. (2000).
Factors governing the assembly of cationic phospholipid-DNA
complexes (vol 78, pg 1620, 2000), Biophysical Journal, 79, 1168.
Kim, J.Y.; Choung, S.; Lee, E.J.; Kim, Y.J.; Choi, Y.C. (2007). Immune activation
by siRNA/liposome complexes in mice is sequence- independent:
Lack of a role for toll-like receptor 3 signaling, Molecules and Cells,
24, 247.
Kypr, J.; Kejnovská, I.; Renčiuk, D.; Vorlíčková, M. (2009). Circular dichroism
and conformational polymorphism of DNA, Nucleic Acids Research,
37, 1713.
Lakowicz, J.R.; Principles of Fluorescence Spectroscopy, 3rd Edition, Springer,
United States of America, 2006.
Lu, X.J.; Olson, W.K. (2003). 3DNA: a software package for the analysis,
rebuilding and visualization of three‐dimensional nucleic acid
structures, Nucleic Acids Research, 31, 5108.

COMPACTION PROCESS OF DNA BY FLUORINATED LIPOSOMES 111
Lv, H.T.; Zhang, S.B.; Wang, B.; Cui, S.H.; Yan, J. (2006). Toxicity of cationic
lipids and cationic polymers in gene delivery, Journal of Controlled
Release, 114, 100.
Lyklema, J. (2009). Quest for ion-ion correlations in electric double layers and
overcharging phenomena, Advances in Colloid and Interface Science,
147-148, 205.
Martín-Molina, A.; Quesada-Pérez, M.; Galisteo-González, F.; Hidalgo-Álvarez,
R. (2003). Primitive models and electrophoresis: An experimental
study, Colloids and Surfaces A: Physicochemical and Engineering
Aspects, 222, 155.
Martín-Molina, A.; Maroto-Centeno, J.A.; Hidalgo-Álvarez, R.; Quesada-Pérez,
M. (2008). Charge reversal in real colloids: Experiments, theory and
simulations, Colloids and Surfaces A: Physicochemical and
Engineering Aspects, 319, 103.
Martín-Molina, A.; Rodríguez-Beas, C.; Hidalgo-Álvarez, R.; Quesada-Pérez, M.
(2009). Effect of surface charge on colloidal charge reversal, Journal
of Physical Chemistry B, 113, 6834.
Martín-Molina, A.; Rodríguez-Beas, C.; Faraudo, J. (2010). Charge reversal in
anionic liposomes: Experimental demonstration and molecular origin,
Physical Review Letters, 104,
Martín-Molina, A.; Rodríguez-Beas, C.; Faraudo, J. (2012). Effect of Calcium
and Magnesium on Phosphatidylserine Membranes: Experiments and
All-Atomic Simulations, Biophysical Journal, 102, 2095.
Marty, R.; N'soukpoe-Kossi, C.N.; Charbonneau, D.; Weinert, C.M.; Kreplak, L.;
Tajmir-Riahi, H.A. (2009). Structural analysis of DNA complexation
with cationic lipids, Nucleic Acids Research, 37, 849.

112 COMPACTION PROCESS OF DNA BY FLUORINATED LIPOSOMES
Mengistu, D.H.; Bohinc, K.; May, S. (2009). Binding of DNA to zwitterionic lipid
layers mediated by divalent cations, Journal of Physical Chemistry B,
113, 12277.
Miyahara, T.; Nakatsuji, H.; Sugiyama, H. (2012). Helical Structure and Circular
Dichroism Spectra of DNA: A Theoretical Study, The Journal of
Physical Chemistry A, 117, 42.
Morille, M.; Passirani, C.; Vonarbourg, A.; Clavreul, A.; Benoit, J.P. (2008).
Progress in developing cationic vectors for non-viral systemic gene
therapy against cancer, Biomaterials, 29, 3477.
Muñoz-Úbeda, M.; Rodríguez-Pulido, A.; Nogales, A.; Martín-Molina, A.;
Aicart, E.; Junquera, E. (2010). Effect of lipid composition on the
structure and theoretical phase diagrams of DC-Chol/DOPE-DNA
lipoplexes, Biomacromolecules, 11, 3332.
Muñoz-Úbeda, M.; Rodríguez-Pulido, A.; Nogales, A.; Llorca, O.; Quesada-
Pérez, M.; Martín-Molina, A.; Aicart, E.; Junquera, E. (2011). Gene
vectors based on DOEPC/DOPE mixed cationic liposomes: A
physicochemical study, Soft Matter, 7, 5991.
Nguyen, T.T.; Shklovskii, B.I. (2001a). Complexation of a polyelectrolyte with
oppositely charged spherical macroions: Giant inversion of charge,
Journal of Chemical Physics, 114, 5905.
Nguyen, T.T.; Shklovskii, B.I. (2001b). Complexation of DNA with positive
spheres: Phase diagram of charge inversion and reentrant
condensation, Journal of Chemical Physics, 115, 7298.
Paiva, D.; Brezesinski, G.; Pereira, M.d.C.; Rocha, S. (2013). Langmuir
Monolayers of Monocationic Lipid Mixed with Cholesterol or
Fluorocholesterol: DNA Adsorption Studies, Langmuir, 29, 1920.
Palmerini, C.A.; Cametti, C.; Sennato, S.; Gaudino, D.; Carlini, E.; Bordi, F.;
Arienti, G. (2006). Role of cholesterol, DOTAP, and DPPC in

COMPACTION PROCESS OF DNA BY FLUORINATED LIPOSOMES 113
prostasome/spermatozoa interaction and fusion, Journal of
Membrane Biology, 211, 185.
Pawley, J.B.; Handbook of Biological Confocal Microscopy, 3rd Edition,
Springer, United States of America, 2006.
Peula-García, J.M.; Ortega-Vinuesa, J.L.; Bastos-González, D. (2010). Inversion
of Hofmeister Series by Changing the Surface of Colloidal Particles
from Hydrophobic to Hydrophilic, The Journal of Physical Chemistry C,
114, 11133.
Piedade, J.A.P.; Mano, M.; de Lima, M.C.P.; Oretskaya, T.S.; Oliveira-Brett,
A.M. (2004). Electrochemical sensing of the behaviour of
oligonucleotide lipoplexes at charged interfaces, Biosensors &
Bioelectronics, 20, 975.
Popa, I.; Gillies, G.; Papastavrou, G.; Borkovec, M. (2010). Attractive and
Repulsive Electrostatic Forces between Positively Charged Latex
Particles in the Presence of Anionic Linear Polyelectrolytes, The
Journal of Physical Chemistry B, 114, 3170.
Pullmannova, P.; Bastos, M.; Bai, G.Y.; Funari, S.S.; Lacko, I.; Devinsky, F.;
Teixeira, J.; Uhrikova, D. (2012). The ionic strength effect on the DNA
complexation by DOPC - gemini surfactants liposomes, Biophysical
Chemistry, 160, 35.
Ramesh, R.; Saeki, T.; Templeton, N.S.; Ji, L.; Stephens, L.C.; Ito, I.; Wilson,
D.R.; Wu, Z.; Branch, C.D.; Minna, J.D.; Roth, J.A. (2001). Successful
treatment of primary and disseminated human lung cancers by
systemic delivery of tumor suppressor genes using an improved
liposome vector, Molecular Therapy, 3, 337.
Ranjbar, B.; Gill, P. (2009). Circular Dichroism Techniques: Biomolecular and
Nanostructural Analyses- A Review, Chemical Biology & Drug Design,
74, 101.

114 COMPACTION PROCESS OF DNA BY FLUORINATED LIPOSOMES
Ravily, V.; Santaella, C.; Vierling, P.; Gulik, A. (1997). Phase behavior of
fluorocarbon di-O-alkyl-glycerophosphocholines and
glycerophosphoethanolamines and long-term shelf stability of
fluorinated liposomes, Biochimica Et Biophysica Acta-Biomembranes,
1324, 1.
Rodger, A.; Nordén, B.; Circular Dichroism & Linear Dichroism, Oxford
University Press, United States of America, 1997.
Rodriguez-Pulido, A.; Aicart, E.; Llorca, O.; Junquera, E. (2008). Compaction
Process of Calf Thymus DNA by Mixed Cationic−Zwiherionic
Liposomes: A Physicochemical Study, The Journal of Physical
Chemistry B, 112, 2187.
Rodriguez-Pulido, A.; Martin-Molina, A.; Rodriguez-Beas, C.; Llorca, O.; Aicart,
E.; Junquera, E. (2009). A Theoretical and Experimental Approach to
the Compaction Process of DNA by Dioctadecyldimethylammonium
Bromide/Zwitterionic Mixed Liposomes, Journal of Physical Chemistry
B, 113, 15648.
Santaella, C.; Frézard, F.; Vierling, P.; Riess, J.G. (1993). Extended in vivo blood
circulation time of fluorinated liposomes, Febs Letters, 336, 481.
Schindler, T.; Nordmeier, E. (1997). The stability of polyelectrolyte complexes
of Calf-Thymus DNA and synthetic polycations: Theoretical and
experimental investigations, Macromolecular Chemistry and Physics,
198, 1943.
Schneider, C.; Hanisch, M.; Wedel, B.; Jusufi, A.; Ballauff, M. (2011).
Experimental study of electrostatically stabilized colloidal particles:
Colloidal stability and charge reversal, Journal of Colloid and Interface
Science, 358, 62.
Sennato, S.; Bordi, F.; Cametti, C.; Di Biasio, A.; Diociaiuti, M. (2005).
Polyelectrolyte-liposome complexes: An equilibrium cluster phase

COMPACTION PROCESS OF DNA BY FLUORINATED LIPOSOMES 115
close to the isoelectric condition, Colloids and Surfaces a-
Physicochemical and Engineering Aspects, 270, 138.
Shapiro, H.M.; Practical Flow cytometry, 4th Edition, John Wiley & Sons,
United States of America, 2003.
Sharma, A.; Sharma, U.S. (1997). Liposomes in drug delivery: Progress and
limitations, International Journal of Pharmaceutics, 154, 123.
Simberg, D.; Danino, D.; Talmon, Y.; Minsky, A.; Ferrari, M.E.; Wheeler, C.J.;
Barenholz, Y. (2001). Phase Behavior, DNA Ordering, and Size
Instability of Cationic Lipoplexes, Journal of Biological Chemistry, 276,
47453.
Symietz, C.; Schneider, M.; Brezesinski, G.; Möhwald, H. (2004). DNA
alignment at cationic lipid monolayers at the air/water interface,
Macromolecules, 37, 3865.
Templeton, N.S.; Lasic, D.D.; Frederik, P.M.; Strey, H.H.; Roberts, D.D.;
Pavlakis, G.N. (1997). Improved DNA: liposome complexes for
increased systemic delivery and gene expression, Nature
Biotechnology, 15, 647.
Tian, W.-d.; Ma, Y.-q. (2009). Molecular Dynamics Simulations of a Charged
Dendrimer in Multivalent Salt Solution, The Journal of Physical
Chemistry B, 113, 13161.
Tian, W.-d.; Ma, Y.-q. (2010a). Complexation of a Linear Polyelectrolyte with a
Charged Dendrimer: Polyelectrolyte Stiffness Effects,
Macromolecules, 43, 1575.
Tian, W.-d.; Ma, Y.-q. (2010b). Effects of valences of salt ions at various
concentrations on charged dendrimers, Soft Matter, 6, 1308.
Tian, W.-d.; Ma, Y.-q. (2011). Coarse-grained molecular simulation of
interacting dendrimers, Soft Matter, 7, 500.

116 COMPACTION PROCESS OF DNA BY FLUORINATED LIPOSOMES
Vorlíčková, M.; Kejnovská, I.; Bednářová, K.; Renčiuk, D.; Kypr, J. (2012).
Circular Dichroism Spectroscopy of DNA: From Duplexes to
Quadruplexes, Chirality, 24, 691.
Xu, Y.H.; Hui, S.W.; Frederik, P.; Szoka, F.C. (1999). Physicochemical
characterization and purification of cationic lipoplexes, Biophysical
Journal, 77, 341.
Zhu, L.; Mahato, R.I. (2010). Lipid and polymeric carrier-mediated nucleic acid
delivery, Expert Opinion on Drug Delivery, 7, 1209.
Zuzzi, S.; Cametti, C.; Onori, G.; Sennato, S. (2007). Liposome-induced DNA
compaction and reentrant condensation investigated by dielectric
relaxation spectroscopy and dynamic light scattering techniques,
Physical Review E, 76, 011925.

BOLAAMPHIPHILE-BASED VECTORS 117
Chapter 5
5.5.5.5. BolaBolaBolaBolaaaaamphiphilemphiphilemphiphilemphiphile----basedbasedbasedbased vectorsvectorsvectorsvectors
The prefix “bola” is associated to the shape of an old South American
missile weapon that consists of two balls attached together by a cord. It was
adopted by the science community to represent visually a molecule with two
hydrophilic head groups linked by a hydrophobic carbon chain. There are few
molecules in nature with these properties, however, most bolaamphiphiles
are chemically synthesized (Baek, 2010; Fuhrhop, 1986). Bolaamphiphile
molecules have their physical stability enhanced and they can be assembled
into distinct structures that could be used as gene carriers (Jain, 2010).
Bolaamphiphile molecules usually have two similar head groups, originating a
symmetric monolayer vesicle. However, some bolaamphiphiles are
constituted by two different head groups, a positively charged at one end and
a neutral one at the other end, assembling into asymmetric monolayers. Both
types of bolaamphiphile can be used as vesicles to encapsulate the active
principle (Brunelle, 2009; Grinberg, 2010; Kaufman, 2013). There are many
applications for these molecules and they can be used not only has
components of lipid vesicles but also in nanocapsules that are prepared by the
layer-by-layer self-assembly technique.

118 BOLAAMPHIPHILE-BASED VECTORS
5.1.5.1.5.1.5.1. Bolaamphiphile particlesBolaamphiphile particlesBolaamphiphile particlesBolaamphiphile particles
Bolaamphiphile molecules can be incorporated on particles through
the deposition of layers with different charges by layer-by-layer technique
(Figure 5.1). It consists on the use of a core particle, such as silicon oxide
(SiO2), calcium carbonate (CaCO3) or polystyrene (PS). These cores are used to
produce multi-layered films by layer-by-layer deposition of oppositely charged
polymers (Shchukin, 2004; Zhao, 2006). After deposition of several layers
(enough to allow the stability of the capsule) the core can be dissolved.
The resulting capsule will be smaller than the microparticle used in the
process due to the shrinking of the species in the absence of the core. The
active principle can be either entrapped or encapsulated within the carrier.
Figure 5.1. Schematic representation of the Layer-by-Layer process (Donath,
1998).

BOLAAMPHIPHILE-BASED VECTORS 119
5.1.1.5.1.1.5.1.1.5.1.1. Materials and methodsMaterials and methodsMaterials and methodsMaterials and methods
5.1.1.1.5.1.1.1.5.1.1.1.5.1.1.1. ChemicalsChemicalsChemicalsChemicals
The bolaamphiphile studied in this work, 22-hydroxy-N,N,N-
trimethyldocosan-1-aminium (BA), was synthetized by Prof. Dr. Bodo Dobner’s
group (Institute of Pharmacy, Biochemical Pharmacy, Martin Luther University
of Halle-Wittenberg, Halle an der Saale, Germany) and is shown in Figure 5.2.
Monodisperse polystyrene particles (4.1 ± 0.1 µm, negatively charged)
in a 10 % w/v aqueous suspension were acquired from Microparticles GmbH
and used as cores. DNA (deoxyribonucleic acid sodium salt from calf thymus,
type I), sodium chloride (NaCl), PAH (Poly(allylamine hydrochloride), positively
charged) and PSS (Poly(sodium 4-styrenesulfonate), negatively charged) were
purchased from Sigma-Aldrich and used without further purification. Rhod PE
(1,2-dipalmitoyl-sn-glycero-3-phosphoethanolamine-N-(lissamine rhodamine
B sulfonyl), ammonium salt, MW 1249.65), was purchased from Avanti Polar
Lipids, Inc. The deionized water was purified with Milli-Q apparatus with the
specific resistance of 18.2 MΩ∙cm. All solutions, except for DNA, were filtered
through a 200 nm porous membrane. Chloroform was supplied by Merck.
Figure 5.2. Chemical structure of 22-hydroxy-N,N,N-trimethyldocosan-1-
aminium (BA).

120 BOLAAMPHIPHILE-BASED VECTORS
5.1.1.2.5.1.1.2.5.1.1.2.5.1.1.2. LbL assemblyLbL assemblyLbL assemblyLbL assembly
Solutions of PAH and PSS (5 mg/mL) were prepared in NaCl (0.5 M)
aqueous solution. DNA was dissolved in deionized water at a concentration of
0.1 mg/mL and was kept at 4°C under magnetic stirring for at least 2 days to
ensure complete dissolution. A volume of 100 µL of PS microparticles was
retrieved from the stock solution and used for LbL deposition. The cores were
washed with 1 mL of deionized water and centrifuged (Eppendorf centrifuge
5804 R, Eppendorf AG, Germany) at 8000 rpm, during 5 minutes. Then the
supernatant was discarded and the particles were re-suspended in 1 mL of
water. This procedure was repeated twice. Before the last centrifugation a
sample of 20 µL of the re-suspended particles was collected to measure the
electrophoretic mobility of the system. The washing process was repeated for
each added layers, as standard method. The layers were deposited onto the
PS cores in the following order: PAH (1) / PSS (2) / PAH (3) / DNA (4) / BA (5) /
DNA (6) / BA (7). After addition of each polymer solution (1 mL) the
suspension was kept at room temperature under sporadic manual agitation
for 20 minutes following by at least 3 washing steps. Due to the nature of the
lipid and its affinity to form vesicles in the presence of water, the addition of
the BA layers was performed as follows. BA (0.1 mg) was first dissolved in
chloroform, which was evaporated under gaseous N2 to produce a lipid film
(further details on section 4.1.2). The particles re-suspended in water were
added to the lipid film. Due to the presence of the charged particles it is
expected that the BA organizes itself around the microparticles, forming a
new layer. To remove the BA from the glass surface of the vial, some manual
agitation was promoted. It is important to avoid the vortex, since it can
destroy the previous layers. At least 5 independent assays were performed, to
ensure reproducibility.

BOLAAMPHIPHILE-BASED VECTORS 121
5.1.1.3.5.1.1.3.5.1.1.3.5.1.1.3. Zeta potentialZeta potentialZeta potentialZeta potential
The electrophoretic mobility (section 4.1.4), converted into zeta
potential (ZP, mV), of the microparticles was measured at room temperature
with a Malvern Zetasizer Nano series instrument by laser Doppler velocimetry.
The results were averaged from three measurements for each sample. The
collected 20 µL of each sample was diluted into 1000 µL of deionized water to
fill the cuvette volume.
5.1.1.4.5.1.1.4.5.1.1.4.5.1.1.4. Fluorescence spectroscopyFluorescence spectroscopyFluorescence spectroscopyFluorescence spectroscopy
In order to assess the amount of DNA at the particle surface, the
supernatant of the microparticles at which DNA layer was added was
recovered after centrifugation. The unbound DNA was free to interact with
ethidium bromide (EtBr) molecules emitting fluorescence (Cosa, 2001). A
calibration curve was established considering the range of possible
concentrations and allowed the quantification of the remaining DNA in
solution. This way and with the knowledge of the initial concentration, it was
possible to determine indirectly the concentration of DNA present at the
particle surface. Detailed information about this technique can be found in
section 4.1.5.
Steady-state fluorescence measurements were carried out using a
Perkin-Elmer LS-50B luminescence spectrometer (REQUIMTE, Department of
Chemistry, Faculty of Pharmacy, University of Porto). Ethidium bromide (EtBr,
5 mg/mL, 100 µL) was added to 500 µL of DNA solution, followed by the
addition of deionised water up to 1000 µL. Fluorescence emission spectra
were recorded between 560-700 nm at an excitation wavelength of 540 nm,
emission and excitation band slits of 10 nm and scan rate of 400 nm/min.

122 BOLAAMPHIPHILE-BASED VECTORS
5.1.1.5.5.1.1.5.5.1.1.5.5.1.1.5. CCCConfocal onfocal onfocal onfocal LLLLaser aser aser aser SSSScanning canning canning canning MMMMicroscopy icroscopy icroscopy icroscopy
(CLSM)(CLSM)(CLSM)(CLSM)
DNA and bolaamphiphile layers were stained for CLSM imaging (Leica
TCS SP5 II, Leica Microsystems), detailed in section 4.1.10.2. The
bolaamphiphile solution was previously mixed with 0.2% (w/w) of Rhod PE
lipid (fluorescent marker) in chloroform, which was evaporated and the film
was hydrated, in order to mix properly the two lipids in solution. This was
used as marked layer to perform CLSM imaging. After placing a drop of the
microparticles on a slide, a drop of DAPI solution was added to stain DNA
layers.
5.1.2.5.1.2.5.1.2.5.1.2. Results and DiscussionResults and DiscussionResults and DiscussionResults and Discussion
The layer by layer deposition was assessed by zeta potential (ZP)
measurements. PAH and PSS layers were used to provide stability to the shell
once the core was removed. The use of NaCl promotes the electrostatic
interactions between the charged layers by reducing the repulsion through
charge screening (Caruso, 1999; Hall, 2011).
The ZP signal inversion suggests a successful deposition of the layers
(Figure 5.3). DNA and BA solutions were prepared without NaCl since it
induced sample aggregation.
The DNA concentration per layer was estimated to be 0.035 ± 0.005
mg/mL (the initial DNA concentration was 0.1 mg/mL). These results were
reproducible. The last layer must be of BA to protect the DNA layers from
degradation.

BOLAAMPHIPHILE-BASED VECTORS 123
CLSM technique allows to acquiring fluorescence images for the
different dyes and separating them to be sure that the colour derives from the
specific marker. Images taken from different microparticle samples show the
presence of DNA and BA layers (Figure 5.4). The blue staining by DAPI solution
confirms the presence of DNA. DAPI binds strongly to A-T rich regions of the
DNA molecules and emits light when excited with ultraviolet light
(Kapuscinski, 1995). The red colour observed in the images is due to the
presence of Rhodamine labelled PE lipid. This lipid mixes with the
bolaamphiphile molecules in the bilayer, allowing the visualization through
fluorescence spectroscopy. Images in transmission mode were also collected
to confirm that all particles were stained.
0 1 2 3 4 5 6 7-60
-40
-20
0
20
40
60Z
eta
Po
ten
tia
l (m
V)
Layer
Figure 5.3. Zeta potential of the successive layers added to the PS cores by the
LbL technique.

124 BOLAAMPHIPHILE-BASED VECTORS
5.1.3.5.1.3.5.1.3.5.1.3. ConclusionsConclusionsConclusionsConclusions
The layer-by-layer assembly is one of the many techniques used in the
fabrication of particles for gene delivery. Here we described a new system
that intercalates layers of DNA molecules and a new bolaamphiphile. The zeta
potential variation gives an indication of the layer deposition through the
signal change from positive to negative values, according to the charge of the
polymer that is deposited at the particle surface. Further tests were carried
Figure 5.4. CLSM images of multilayered microparticles with PS cores showing
the presence of DNA (Blue chanel - left), BA layer (red chanel - center) and the
sobreposition of both chanels (right). Scale bar is 12 µm.

BOLAAMPHIPHILE-BASED VECTORS 125
out to ensure the presence of DNA within the layers as well the presence of
the bolaamphiphile. CLSM images confirm the uniform presence of both
compounds at the particle surface. It is possible to remove the cores of these
systems in order to obtain a microcapsule. The layers can also be assembled
using smaller cores to facilitate the internalisation of the particles by the cells.
5.2.5.2.5.2.5.2. Lipid vesiclesLipid vesiclesLipid vesiclesLipid vesicles
Bolaamphiphile molecules can self-assemble into monolayered or
bilayered vesicles, due to their two hydrophilic head groups. These molecules
can also be part of a mixture of lipids to improve the properties of the vesicles
for DNA transfection.
5.2.1.5.2.1.5.2.1.5.2.1. Materials and methodsMaterials and methodsMaterials and methodsMaterials and methods
5.2.1.1.5.2.1.1.5.2.1.1.5.2.1.1. ChemicalsChemicalsChemicalsChemicals
DOTAP and Rhod PE (1,2-dipalmitoyl-sn-glycero-3-
phosphoethanolamine-N-(lissamine rhodamine B sulfonyl), ammonium salt,
MW 1249.65) were purchased from Avanti Polar Lipids, Inc. Hepes buffer (4-
(2-Hydroxyethyl) piperazine-1-ethanesulfonic acid, ≥ 99.5%) was supplied by
Sigma-Aldrich. The green fluorescent protein (GFP) plasmid (pEGFP-N1, BD
Biosciences Clontech) encoded for green fluorescent protein, hereafter
designed by pDNA, was amplified and isolated with a PlasmidPrep Midi Flow
kit (GE Healthcare) and the concentration and purity of pDNA were assessed
using a NanoDrop 1000 (Thermo Scientific) apparatus. The deionised water
was purified with Milli-Q apparatus with the specific resistance of 18.2
MΩ∙cm. Chloroform was from Merck.

126 BOLAAMPHIPHILE-BASED VECTORS
5.2.1.2.5.2.1.2.5.2.1.2.5.2.1.2. Preparation of LiposomesPreparation of LiposomesPreparation of LiposomesPreparation of Liposomes
Liposomes were prepared by the thin lipid film hydration method
(Palmerini, 2006). Briefly, the appropriate lipid mixture (BA:DOTAP) at
different molar ratios was dissolved in chloroform, which was then
evaporated under N2 flow. The lipid film was hydrated with 1 mL of 10 mM
Hepes buffer pH 7.4 (ionic strength 0.00325 M). The suspension was vortexed
for 15 minutes, sonicated for 15 min at 60°C and extruded through Whatman
filters of decreasing pore sizes (up to 100 nm pore size membranes) using a
pressure extruder apparatus, at 60°C. The total lipid concentration was 1 mM.
5.2.1.3.5.2.1.3.5.2.1.3.5.2.1.3. DLS and electrophoretic mobilityDLS and electrophoretic mobilityDLS and electrophoretic mobilityDLS and electrophoretic mobility
The hydrodynamic diameter (section 4.1.3) and the electrophoretic
mobility (section 4.1.4), μe, of liposomes and lipoplexes were measured at
room temperature with a Malvern Zetasizer Nano series instrument by,
respectively, dynamic light scattering (DLS) and laser doppler velocimetry. The
results were averaged from three measurements for each sample and were
obtained for at least three independent procedure of sample preparation. The
final concentration of liposomes was 0.1 mg/mL and the concentration of
pDNA was 0.01 mg/mL.
5.2.1.4.5.2.1.4.5.2.1.4.5.2.1.4. Morphology studiesMorphology studiesMorphology studiesMorphology studies
To characterise the type of structures formed by the bolaamphiphile
alone, Transmission Electron Microscopy (TEM) and Confocal Laser Scanning
Microscopy (CLSM) were used (described in section 4.1.6 and 4.1.10.2,
respectively). For the TEM (Jeol JEM-1400, JEOL) analysis, a drop of the

BOLAAMPHIPHILE-BASED VECTORS 127
suspension was placed on copper grids (Formvar/carbon on 400 mesh – Agar)
and stained with 2% (w/v) uranyl acetate. For CLSM imaging (Leica TCS SP5 II,
Leica Microsystems) the BA was mixed with 0.2% of Rhod PE lipid (fluorescent
marker).
5.2.1.5.5.2.1.5.5.2.1.5.5.2.1.5. In vitroIn vitroIn vitroIn vitro transfection studiestransfection studiestransfection studiestransfection studies
The gene transfer and transgene expression after cellular transfection
was monitored using pDNA encoded with GFP. HEK 293 cell line was used in
this study and was grown in Minimum Essential Medium (Lonza),
supplemented with 10% (v/v) heat inactivated fetal bovine serum (FBS –
Gibco), 2 mM L-Glutamine (Lonza), 100U Penicillin/Streptomycin (Gibco) and
1% MEM non-essential amino acid solution (Sigma). Cells were cultured in a
humidified 5% CO2 atmosphere at 37°C. For transfection studies, cells were
seeded at approximately 70% confluence in 12-well tissue culture plates, 24 h
before the experiments. Before transfection, growth medium was removed
and cells were washed twice with PBS, pH 7.4. Liposome-pDNA complexes
were prepared by adding equal volumes of pDNA solution at 0.01 mg/mL to
the liposome suspension. The lipid:pDNA ratio was 10:1 (w:w), corresponding
to a N:P ratio of 5 for BA:DOTAP liposomes (charge ratio between the cationic
groups (amine) of the liposome and the anionic groups (phosphate) of the
pDNA) (Crook, 1998; Jain, 2012; Paiva, 2013). DNA solution was added drop
wise to the liposomes and the mixture was kept under magnetic stirring for at
least 15 minutes. Cells were then incubated with 200 µL of lipoplexes
prepared with liposomes and pDNA in OPTI-MEM (Gibco). The final
concentration of pDNA was 2 µg/well. The negative control corresponded to
cells treated with liposomes without pDNA. After 5 h, the medium was
replaced by fresh growth medium and transfection was assessed after 48 h

128 BOLAAMPHIPHILE-BASED VECTORS
incubation time by flow cytometry (FACS Canto II, BD Biosciences), detailed in
section 4.1.10.1. Twenty thousand events were measured for each sample.
Experimental data was statistically analysed applying one-way analysis of
variance (ANOVA) following Tukey test approach. Microscopy images of
transfected cells were obtained using the CLSM.
5.2.2.5.2.2.5.2.2.5.2.2. Results and DiscussionResults and DiscussionResults and DiscussionResults and Discussion
5.2.2.1.5.2.2.1.5.2.2.1.5.2.2.1. Vesicle characterisVesicle characterisVesicle characterisVesicle characterisationationationation
The properties associated to bolaamphiphiles are very promising with
respect to delivery systems (Nuraje, 2012). Attempts of extruding samples
containing only BA were not successful, even at high temperatures (∼100°C).
The size measurements revealed a very poly-dispersed population with mean
diameters of 5 ± 2 µm. CLSM and TEM analysis show that BA forms
microstructures, some of which present a crystal shape (Figure 5.5). Crystal
structures are expected when the size of the two polar groups is not too
different. For instance, they could assemble into a bilayer, where the OH-
groups will be oriented to the inner space and the N- groups to the outer
space (Figure 2.2.a). Also, they may form a mixed orientation where will be a
OH- group and a N- group in the inner space, as visible on Figure 2.2.b
(Fuhrhop, 2004).

BOLAAMPHIPHILE-BASED VECTORS 129
Previous works report that these amphiphiles self-assemble into small
nanoparticles (50-100 nm) (Jain, 2012; Popov, 2010), suggesting a formation
of an asymmetric monolayer, which was confirmed by Langmuir monolayer
studies and Grazing incidence X-Ray diffraction (Berchel, 2009; Deleu, 2011;
Dolle, 2011; Hutter, 2012). However these structures are influenced by the
number of carbons in the hydrophobic part of the molecule as well as the
forces present in the hydrophilic part. The hydrophobic tail of the BA has no
double bonds, which would allow the formation of vesicles with a monolayer
of lipid, where the OH-end group would be directed to the inside of the
vesicle and the N group to the outside. Due to its long carbon chain, the BA
could also rearrange itself in a U-shape, also reported in the literature for
similar molecules (Meister, 2007; Yan, 2009). In this case, a bilayer would be
Figure 5.5. Self-assembled bolaamphiphile structure observed by TEM (top) and
CLSM (bottom). Scale bar is, respectively, 3 and 10 µm.

130 BOLAAMPHIPHILE-BASED VECTORS
formed and its structure could be more rigid, generating bigger particles that
would not respond so well to the extrusion method due to its assembly.
Mixing this BA with other lipids at appropriate ratios could help the formation
of large unilamellar vesicles (LUV), where the BA could be intercalated with
the other lipids.
The BA was mixed with a well-known and commonly used cationic
lipid, DOTAP (Zhu, 2010), at BA:DOTAP molar ratios of 1:1, 1:5 and 1:10. For
the ratio 1:1, it was not possible to carry out extrusion of the sample. The size
of the structures was smaller than that obtained for the BA alone (Figure 5.6).
At the molar ratios of 1:5 and 1:10, BA:DOTAP vesicles were extruded
and it was possible to obtain large unilamellar vesicles using filters of pore size
of 100 nm. Due the similarity of the results for the two ratios, vesicles
prepared with BA:DOTAP at 1:5 molar ratios were chosen for further studies
BA 1:1 1:5 1:10 DOTAP0
40
80
120
160
1500
3000
4500
6000
7500
Siz
e (
nm
)
System (ratio BA:DOTAP)
Figure 5.6. Hydrodynamic diameter of vesicles of BA, DOTAP and their mixture
at different molar ratios.

BOLAAMPHIPHILE-BASED VECTORS 131
using cell cultures. In the literature, mixtures of bolaamphiphiles with other
lipids, such as cholesterol (Dakwar, 2012) and DOPE (Jain, 2012) have been
reported, mainly to stabilise the liposomes when they are complexed with
pDNA. Since the BA does not self-assemble into small vesicles, DOTAP was
chosen due its charge, which will help the formation of stable nanoparticles
even when they are complexed with pDNA. Zeta potential of the vesicles was
measured for the formulations in study (Figure 5.7).
The complex formation with DNA was observed at the ratio of
lipid:pDNA 10:1 (w:w) (Paiva, 2013). To assess the stability of the system, zeta
potential measurements were conducted with and without pDNA. Size
measurements of the liposomes and the lipoplexes revealed similar values of
that obtained for the liposomes alone, however, the pDNA has an effect on
the population distribution reduces the polydispersity index (PdI) of the
BA BA:DOTAP 1:5 DOTAP0
10
20
30
40
50
Ze
ta P
ote
ntia
l (m
V)
System
Vesicle
Complex
Figure 5.7. Zeta potential values for the studied formulations, before and after
complexation.

132 BOLAAMPHIPHILE-BASED VECTORS
sample. Zeta potential values were also obtained for the formulations and
showed were around 32 mV for all preparations (Figure 5.7). This parameter
indicates that all lipoplexes are stable and positively charged, which is a
condition desirable for cell transfections studies (Jesorka, 2008; Lonez, 2008).
5.2.2.2.5.2.2.2.5.2.2.2.5.2.2.2. Cell transfection studiesCell transfection studiesCell transfection studiesCell transfection studies
The transfection efficiency of lipoplexes was evaluated using HEK 293
cell line, a human embryonic kidney derived cell line. Cells were transfected
with plasmid DNA (pDNA) encoding green fluorescent protein (GFP). Flow
cytometry analysis revealed that GFP expression was induced similarly by
DOTAP/pDNA and BA:DOTAP/pDNA (Figure 5.8.A). Naked pDNA did not
transfect the cells (Figure 5.8.B). DOTAP has been proven to be an efficient
and wide used system to complex, deliver and transfect DNA into, for
example, human hematopoietic stem cells (Martino, 2009) and cervical cancer
cells (Fletcher, 2005). Combined with other lipids, like cholesterol, DOTAP has
been studied in vivo and shown to be efficient in transporting genetic material
to cells (Eliyahu, 2007; Kim, 2007; Ramesh, 2001; Templeton, 1997). These
results show that the BA mixed with DOTAP at the molar ratio of 1:5, has
potential as vehicle for pDNA delivery, evidencing good results with respect to
the DOTAP system. It was observed for all cell trials that BA:DOTAP system
achieved higher values than DOTAP system. However and according to the
statistical analysis, the transfection values are not significantly different at the
0.05 level, indicating that both systems have a similar ability to transfect cells.
The cytometry technique and confocal analysis showed that DOTAP lipoplexes
cause more cellular dead than BA:DOTAP lipoplexes, indicating that this
system is less cytotoxic.

BOLAAMPHIPHILE-BASED VECTORS 133
5.2.3.5.2.3.5.2.3.5.2.3. ConclusionsConclusionsConclusionsConclusions
We propose vesicles that combine a bolaamphiphile with cationic
lipids to form stable and positively charged liposomes capable of compacting
efficiently genetic material by electrostatic interactions. Comparing the carrier
D O T A P B A :D O T A P 1 :50
5
1 0
1 5
2 0
2 5
3 0
3 5
% T
ransfe
cte
d c
ells
A
Figure 5.8. Transfection of HEK cell line with green fluorescent protein (GFP)
plasmid (pDNA) at 10:1 L/D ratio: (A) cytometry analysis of transfection levels
for DOTAP and BA:DOTAP 1:5 systems. Results are expressed as mean ± S.D.
(n=3). (B) Illustrative confocal images of GFP expression when transfected with
naked pDNA (B1), DOTAP (B2) and BA:DOTAP 1:5 (B3). The scale bar is 50 µm.

134 BOLAAMPHIPHILE-BASED VECTORS
made of BA:DOTAP 1:5 with DOTAP vesicles, they present similar properties
with respect to size and zeta potential values. The transfection studies show
that the bolaamphiphile mixed system has a higher transfection potential
when compared to DOTAP vesicles.
5.3.5.3.5.3.5.3. RRRRefereneferenefereneferencescescesces
Baek, K.; Kim, Y.; Kim, H.; Yoon, M.; Hwang, I.; Ko, Y.H.; Kim, K. (2010).
Unconventional U-shaped conformation of a bolaamphiphile
embedded in a synthetic host, Chemical Communications, 46, 4091.
Berchel, M.; Mériadec, C.; Lemiègre, L.; Artzner, F.; Jeftic, J.; Benvegnu, T.
(2009). Supramolecular structures based on new bolaamphiphile
molecules investigated by small angle and wide angle X-ray scattering
and polarized optical microscopy, Journal of Physical Chemistry B,
113, 15433.
Brunelle, M.; Polidori, A.; Denoyelle, S.; Fabiano, A.S.; Vuillaume, P.Y.;
Laurent-Lewandowski, S.; Pucci, B. (2009). A structure-activity
investigation of hemifluorinated bifunctional bolaamphiphiles
designed for gene delivery, Comptes Rendus Chimie, 12, 188.
Caruso, F.; Lichtenfeld, H.; Donath, E.; Möhwald, H. (1999). Investigation of
Electrostatic Interactions in Polyelectrolyte Multilayer Films: Binding
of Anionic Fluorescent Probes to Layers Assembled onto Colloids,
Macromolecules, 32, 2317.
Cosa, G.; Focsaneanu, K.S.; McLean, J.R.N.; McNamee, J.P.; Scaiano, J.C.
(2001). Photophysical Properties of Fluorescent DNA-dyes Bound to
Single- and Double-stranded DNA in Aqueous Buffered Solution,
Photochemistry and Photobiology, 73, 585.
Crook, K.; Stevenson, B.J.; Dubouchet, M.; Porteous, D.J. (1998). Inclusion of
cholesterol in DOTAP transfection complexes increases the delivery

BOLAAMPHIPHILE-BASED VECTORS 135
of DNA to cells in vitro in the presence of serum, Gene Therapy, 5,
137.
Dakwar, G.R.; Hammad, I.A.; Popov, M.; Linder, C.; Grinberg, S.; Heldman, E.;
Stepensky, D. (2012). Delivery of proteins to the brain by
bolaamphiphilic nano-sized vesicles, Journal of Controlled Release,
160, 315.
Deleu, M.; Damez, C.; Gatard, S.; Nott, K.; Paquot, M.; Bouquillon, S. (2011).
Synthesis and physico-chemical characterization of bolaamphiphiles
derived from alkenyl d-xylosides, New Journal of Chemistry, 35, 2258.
Dolle, C.; Magrone, P.; Riva, S.; Ambrosi, M.; Fratini, E.; Peruzzi, N.; Nostro,
P.L. (2011). Symmetric and asymmetric bolaamphiphiles from
ascorbic acid, Journal of Physical Chemistry B, 115, 11638.
Donath, E.; Sukhorukov, G.B.; Caruso, F.; Davis, S.A.; Mohwald, H. (1998).
Novel hollow polymer shells by colloid-templated assembly of
polyelectrolytes, Angewandte Chemie-International Edition, 37, 2202.
Eliyahu, H.; Joseph, A.; Schillemans, J.P.; Azzam, T.; Domb, A.J.; Barenholz, Y.
(2007). Characterization and in vivo performance of dextran-
spermine polyplexes and DOTAP/cholesterol lipoplexes administered
locally and systemically, Biomaterials, 28, 2339.
Fletcher, S.; Ahmad, A.; Perouzel, E.; Heron, A.; Miller, A.D.; Jorgensen, M.R.
(2005). In Vivo Studies of Dialkynoyl Analogues of DOTAP
Demonstrate Improved Gene Transfer Efficiency of Cationic
Liposomes in Mouse Lung, Journal of Medicinal Chemistry, 49, 349.
Fuhrhop, J.-H.; Wang, T. (2004). Bolaamphiphiles, Chemical Reviews, 104,
2901.
Fuhrhop, J.H.; Fritsch, D. (1986). Bolaamphiphiles form ultrathin, porous and
unsymmetric monolayer lipid membranes, Accounts of Chemical
Research, 19, 130.

136 BOLAAMPHIPHILE-BASED VECTORS
Grinberg, S.; Kipnis, N.; Linder, C.; Kolot, V.; Heldman, E. (2010). Asymmetric
bolaamphiphiles from vernonia oil designed for drug delivery,
European Journal of Lipid Science and Technology, 112, 137.
Hall, K.; Lee, T.-H.; Aguilar, M.-I. (2011). The role of electrostatic interactions
in the membrane binding of melittin, Journal of Molecular
Recognition, 24, 108.
Hutter, T.; Linder, C.; Heldman, E.; Grinberg, S. (2012). Interfacial and self-
assembly properties of bolaamphiphilic compounds derived from a
multifunctional oil, Journal of Colloid and Interface Science, 365, 53.
Jain, N.; Arntz, Y.; Goldschmidt, V.r.; Duportail, G.; Mély, Y.; Klymchenko, A.S.
(2010). New Unsymmetrical Bolaamphiphiles: Synthesis, Assembly
with DNA, and Application for Gene Delivery, Bioconjugate
Chemistry, 21, 2110.
Jain, N.; Goldschmidt, V.; Oncul, S.; Arntz, Y.; Duportail, G.; Mély, Y.;
Klymchenko, A.S. (2012). Lactose-ornithine bolaamphiphiles for
efficient gene delivery in vitro, International Journal of
Pharmaceutics, 423, 392.
Jesorka, A.; Orwar, O. (2008). Liposomes: Technologies and Analytical
Applications, Annual Review of Analytical Chemistry, 1, 801.
Kapuscinski, J. (1995). DAPI: A DNA-specific fluorescent probe, Biotechnic and
Histochemistry, 70, 220.
Kaufman, Y.; Grinberg, S.; Linder, C.; Heldman, E.; Gilron, J.; Freger, V. (2013).
Fusion of bolaamphiphile micelles: A method to prepare stable
supported biomimetic membranes, Langmuir, 29, 1152.
Kim, J.Y.; Choung, S.; Lee, E.J.; Kim, Y.J.; Choi, Y.C. (2007). Immune activation
by siRNA/liposome complexes in mice is sequence- independent:
Lack of a role for toll-like receptor 3 signaling, Molecules and Cells,
24, 247.

BOLAAMPHIPHILE-BASED VECTORS 137
Lonez, C.; Vandenbranden, M.; Ruysschaert, J.-M. (2008). Cationic liposomal
lipids: From gene carriers to cell signaling, Progress in Lipid Research,
47, 340.
Martino, S.; di Girolamo, I.; Tiribuzi, R.; Angelo, F.; Datti, A.; Orlacchio, A.
(2009). Efficient siRNA Delivery by the Cationic Liposome DOTAP in
Human Hematopoietic Stem Cells Differentiating into Dendritic Cells,
Journal of Biomedicine and Biotechnology, DOI:
10.1155/2009/410260.
Meister, A.; Weygand, M.J.; Brezesinski, G.; Kerth, A.; Drescher, S.; Dobner, B.;
Blume, A. (2007). Evidence for a Reverse U-Shaped Conformation of
Single-Chain Bolaamphiphiles at the Air−Water Interface, Langmuir,
23, 6063.
Nuraje, N.; Bai, H.; Su, K. (2012). Bolaamphiphilic molecules: Assembly and
applications, Progress in Polymer Science, 38, 302.
Paiva, D.; Martin-Molina, A.; Cardoso, I.; Quesada-Perez, M.; Pereira, M.D.;
Rocha, S. (2013). The effect of a fluorinated cholesterol derivative on
the stability and physical properties of cationic DNA vectors, Soft
Matter, 9, 401.
Palmerini, C.A.; Cametti, C.; Sennato, S.; Gaudino, D.; Carlini, E.; Bordi, F.;
Arienti, G. (2006). Role of cholesterol, DOTAP, and DPPC in
prostasome/spermatozoa interaction and fusion, Journal of
Membrane Biology, 211, 185.
Popov, M.; Linder, C.; Deckelbaum, R.J.; Grinberg, S.; Hansen, I.H.; Shaubi, E.;
Waner, T.; Heldman, E. (2010). Cationic vesicles from novel
bolaamphiphilic compounds, Journal of Liposome Research, 20, 147.
Ramesh, R.; Saeki, T.; Templeton, N.S.; Ji, L.; Stephens, L.C.; Ito, I.; Wilson,
D.R.; Wu, Z.; Branch, C.D.; Minna, J.D.; Roth, J.A. (2001). Successful
treatment of primary and disseminated human lung cancers by

138 BOLAAMPHIPHILE-BASED VECTORS
systemic delivery of tumor suppressor genes using an improved
liposome vector, Molecular Therapy, 3, 337.
Shchukin, D.G.; Patel, A.A.; Sukhorukov, G.B.; Lvov, Y.M. (2004).
Nanoassembly of Biodegradable Microcapsules for DNA Encasing,
Journal of the American Chemical Society, 126, 3374.
Templeton, N.S.; Lasic, D.D.; Frederik, P.M.; Strey, H.H.; Roberts, D.D.;
Pavlakis, G.N. (1997). Improved DNA: liposome complexes for
increased systemic delivery and gene expression, Nature
Biotechnology, 15, 647.
Yan, Y.; Lu, T.; Huang, J. (2009). Recent advances in the mixed systems of
bolaamphiphiles and oppositely charged conventional surfactants,
Journal of Colloid and Interface Science, 337, 1.
Zhao, W.; Zheng, B.; Haynie, D.T. (2006). A Molecular Dynamics Study of the
Physical Basis of Stability of Polypeptide Multilayer Nanofilms,
Langmuir, 22, 6668.
Zhu, L.; Mahato, R.I. (2010). Lipid and polymeric carrier-mediated nucleic acid
delivery, Expert Opinion on Drug Delivery, 7, 1209.

CHITOSAN-N-MALTODEXTRIN CONJUGATES 139
Chapter 6
6.6.6.6. ChitosanChitosanChitosanChitosan----NNNN----maltodextrin maltodextrin maltodextrin maltodextrin
conjugatesconjugatesconjugatesconjugates
Grafting other polymers to chitosan has been used as an alternative
technique to improve its properties with respect to cell uptake and release. To
further explore this methodology, the synthesis and characterisation of a
polymer based on chitosan and maltodextrin (MD) were carried out.
Maltodextrin, an oligosaccharide, is a non-ionic excipient of D-glucose units
linked by α(1-4) glycosidic bonds that enhances gene expression and has low
toxicity (Huang, 2002). Maltodextrins are water soluble compounds and are
produced by partial hydrolysis of starch. They are classified in terms of DE
(dextrose equivalent), having between 3 and 20 DE. The conjugation of
chitosan with maltodextrin (DE 18-20) was achieved by reductive amination
and the resultant copolymer was characterised by Fourier-transform infrared
spectroscopy (FTIR) and nuclear magnetic resonance spectroscopy (NMR).
Nanoparticles of chitosan-graft-maltodextrin copolymer were analysed by
dynamic light scattering and electron microscopy techniques.

140 CHITOSAN-N-MALTODEXTRIN CONJUGATES
6.1.6.1.6.1.6.1. Experimental SectionExperimental SectionExperimental SectionExperimental Section
6.1.1.6.1.1.6.1.1.6.1.1. ChemicalsChemicalsChemicalsChemicals
Chitosan (Ch) 20 kDa (degree of deacetylation > 92%) was supplied by
Altakitin (Portugal). DNA (deoxyribonucleic acid sodium salt from calf thymus,
type I), acetic acid, sodium cyanoborohydride and sodium tripolyphosphate
(TPP) were purchased from Sigma and Maltodextrin (DE 18-20) was from
Grain Processing Corporation. All reagents were used without further
purification. Ultrapure water was obtained using a Milli-Q apparatus with the
specific resistance of 18.2 MΩ∙cm. Uranyl acetate was purchased from
Electron Microscopy Sciences.
6.1.2.6.1.2.6.1.2.6.1.2. Synthesis of chitosanSynthesis of chitosanSynthesis of chitosanSynthesis of chitosan----graftgraftgraftgraft----
maltodextrmaltodextrmaltodextrmaltodextrin in in in
The synthesis of the graft copolymer is based on reductive amination
(Janciauskaite, 2008; Kaneko, 2007; Park, 2001). Chitosan 20 kDa was
dissolved in 1% acetic acid, followed by the addition of maltodextrin solution,
according to the molar ratio of chitosan glucosamine units and maltodextrin
of 1:1 (Chn:MD 1:1) and 1:5 (Chn:MD 1:5). Sodium cyanoborohydride (molar
ratio 10:1 with respect to maltodextrin) was added to the mixture under
magnetic stirring. The reaction was carried out for 4 days at 40°C under
stirring. The unreacted maltodextrin was removed by dialysis for 4 days using
Float-A-Lyzer G2 (Spectrum) dialysis membrane (MWCO 3.5-5 kDa) against
ultrapure water. The reaction product (chitosan:maltodextrin 1:1 or 1:5) was
lyophilised at -80°C using a Virtis BT6K EL lyophiliser.

CHITOSAN-N-MALTODEXTRIN CONJUGATES 141
6.1.3.6.1.3.6.1.3.6.1.3. FourierFourierFourierFourier----transform infraredtransform infraredtransform infraredtransform infrared (FTIR)(FTIR)(FTIR)(FTIR)
spectroscopy spectroscopy spectroscopy spectroscopy
The infrared spectroscopy measures the frequency of the vibrations of
chemical bonds between atoms when occurs excitation, at the medium
infrared (4 000 to 200 cm-1
) electromagnetic spectrum (Reichenbächer, 2012).
The absorption frequencies of radiation depend on the functional groups
present and the configuration of the atoms in the molecule. The infrared
vibrational spectrum of a molecule consists of a sequence of bands, each of
which results from a transition between pairs of vibrational levels related to
the ground electronic state (Ramachandran, 2001).
The main goal of an infrared experiment is to determine the intensity
ratio between the transmitted radiation by the sample () and the incident
radiation () as a function of the frequency of the light:
=
(6.1)
where is the transmittance (Ebnesajjad, 2006). The infrared spectrum is
usually plotted as a function of transmittance or absorbance. The absorbance
() is related to the transmittance by the Lambert-Beer Law:
= − log = (6.2)
where is the molar absorptivity at the measured frequency, is the
concentration of chemical bonds responsible for the absorption of infrared
radiation and is the optical path length (Evans, 1992).
FTIR spectroscopy is a multiplexing spectroscopy, where all optical
frequencies from the source are observed simultaneously over a period of
time. The resulting signal, which is a time domain digital signal, is called an
interferogram and contains intensity information about all frequencies
present in the infrared beam. This information can be extracted by switching

142 CHITOSAN-N-MALTODEXTRIN CONJUGATES
the signal from a time domain digital signal to a frequency domain digital
signal, which is accomplished by applying a Fourier transform over the
interferogram (frequency-domain functions) (Griffiths, 2007).
The infrared spectra were recorded using an ALPHA FTIR spectrometer
(Bruker) in absorbance mode with a high sensitivity DLATGS detector at room
temperature. Pellets of potassium bromide (KBr) with 1% (w:w) were
prepared and pressed at a pressure point of 10 000 g.
6.1.4.6.1.4.6.1.4.6.1.4. Nuclear magnetic resonance (NMR) Nuclear magnetic resonance (NMR) Nuclear magnetic resonance (NMR) Nuclear magnetic resonance (NMR)
spectroscopyspectroscopyspectroscopyspectroscopy
Nuclear magnetic resonance spectroscopy is based on the magnetic
properties of the atomic nucleus and, therefore, is a non-invasive and non-
destructive technique. This technique provides information about the
molecule structure and bonds through the interaction between the magnetic
moments of the sample nuclei and an applied electromagnetic wave (Schnell,
2001).
NMR is a quantum phenomenon based on the magnetic properties of
atoms nuclei. Subatomic particles (protons, neutrons and electrons) have the
intrinsic quantum property of spin. Atoms with no overall spin (12
C, 16
O) have
electrons pair up in atomic orbitals, meaning that the electron energy cancel
each other. However atoms where their electrons cannot pair up (1H,
13C,
19F,
31P) will have magnetic moments (µ) and, consequently, will possess an
overall spin (I). The nuclear magnetic moment of the nucleus will line up with
the externally applied magnetic field of strength B0 (Becker, 2000). The NMR
method introduces into the system a beam of electromagnetic radiation that
will induce in the nucleus a transition from a lower state of energy to a higher
one. The nuclei will be distributed throughout the various spin states available

CHITOSAN-N-MALTODEXTRIN CONJUGATES 143
and the number of nuclei (N) in each spin state can be determined by the
Boltzmann distribution:
= !/#$% (6.3)
where γm is the magnetogyric ratio, h is the Planck constant, B0 is the external
magnetic field strength, &! is the Boltzmann constant and T refers to the
temperature (Becker, 2000).
Hydrogen atoms are present in most of the molecules and its nucleus
has one of the strongest resonances, thus the applicability of 1H NMR is vast.
Two kinds of information are retrieved from the analysis of a NMR spectrum.
Identical nuclei have different absorption positions if they have different
chemical surroundings, meaning that one atom can be located by studying
their position and the closest atoms. The different absorption peaks usually
are denominated as chemical shifts. The second information retrieved from
the spectra relates with the peak area. For the same type of nuclei (with the
same chemical shift) it is possible to predict the number of nuclei since it is
proportional to the area of the absorption peak in study (Gerothanassis,
2002). Carbon isotopes (12
C and 13
C) are also used to retrieve information
about the atoms distribution in one molecule, although it is far less sensitive
when compared to 1H NMR.
13C spectra have a separate resonance peak for
each chemical shift, due to the characteristics of the proton nuclei, that has a
precise chemical shift dependent on the attached atoms and their
electronegativity. This way, 13
C spectra have a very low overlapping of the
resonance peaks (Günther, 1994).
The NMR spectra were recorded on a Bruker Avance III 400, operating
at 400.15 MHz for protons and 100.62 MHz for carbons, in deuterium oxide
(D2O) solution at a temperature of 25°C and 80°C. To improve the solubility of
Ch, few drops of trifluoroacetic acid were added to the solution. The chemical
shifts in the spectra were referenced to internal sodium trimethylsilyl-[2,2,3,3-

144 CHITOSAN-N-MALTODEXTRIN CONJUGATES
d4]-propionate (TSP). Standard 1D 1H NMR experiments with 30° pulses,
acquisition time 2 s, relaxation delay 2 s, 64 transients of a spectral width of
4000 Hz were collected into 32 K time domain points. Two-dimensional (2D)
1H/
1H correlation spectra (COSY),
1H/
1H total correlation spectra (TOCSY),
gradient-selected 1H/
13C heteronuclear single quantum coherence (HSQC) and
1H/
13C heteronuclear multiple bond coherence (HMBC) spectra were acquired
using the standard Bruker software. 2D 1H/
1H COSY spectra were acquired
with a multiple quantum filter, gradient pulses for selection, a gradient ratio
of 16:12:40 and a relaxation delay of 1.5 s. A total of 2048 data points in F2
and 512 data points in F1 over a spectral width of 4000 Hz were collected. The
1H/
1H TOCSY spectra were recorded by use of homo-nuclear Hartman-Hahn
transfer and dipsi2 sequence for proton–proton transfer, with a mixing time
of 60 ms (Cavanagh, 1990). A total of 4096 data points in F2 and 512 data
points in F1 over a spectral width of 4000 Hz were collected. 1H/
13C HSQC
experiments via double inept transfer, using sensitivity improvement and
decoupling during the acquisition were carried out with a spectral width of ca.
4000 Hz for 1H and 10000 Hz for
13C, a relaxation delay of 1.5 s, FT size 2 K ×
256 W. 1H/
13C HMBC spectra with a spectral width of 12000 Hz in the carbon
dimension and 4000 Hz in the proton dimension were recorded and typical
acquisition parameters: 90° pulses for protons and carbons, 7 µs and 12.5 µs,
respectively, a relaxation delay of 1.5 s, 512 increments and an FT size of 2 K x
1 K.
6.1.5.6.1.5.6.1.5.6.1.5. Preparation of nanoparticlesPreparation of nanoparticlesPreparation of nanoparticlesPreparation of nanoparticles
Chitosan and chitosan-graft-maltodextrin nanoparticles were prepared
with sodium tripolyphosphate (TPP). All solutions were prepared in 0.3%
acetic acid solutions to ensure complete dissolution of chitosan. Nanoparticles

CHITOSAN-N-MALTODEXTRIN CONJUGATES 145
were obtained by adding the TPP solution drop wise to the chitosan or
copolymer solutions under magnetic stirring for about 15 minutes at room
temperature. Solutions with a desirable volume were mixed to have the final
concentrations of 1.00 and 1.25 mg/mL of chitosan or chitosan-graft-
maltodextrin, and 0.20 and 0.25 mg/mL of TPP; the volume ratio of initial
solutions of chitosan/TPP was 2.5.
6.1.6.6.1.6.6.1.6.6.1.6. Preparation of polyplexesPreparation of polyplexesPreparation of polyplexesPreparation of polyplexes
Complexes of chitosan or chitosan-graft-maltodextrin nanoparticles
and DNA were prepared at different mass ratios of polymer/DNA ranging from
0.25 to 5. The DNA concentration was kept constant for all assays (0.025
mg/mL). Stock solutions of the polymers were prepared according to the mass
ratios and to mix equal volumes of both solutions. DNA solution was added
drop wise to the nanoparticles and the mixture was kept under magnetic
stirring for at least 30 minutes.
6.1.7.6.1.7.6.1.7.6.1.7. DLSDLSDLSDLS and zeta potential measurementsand zeta potential measurementsand zeta potential measurementsand zeta potential measurements
Particle size distribution and zeta potential were determined by
dynamic light scattering and laser Doppler velocimetry, respectively, using a
Zetasizer Nano ZS (Malvern Instruments Ltd., Malvern, UK), at 25°C. These
techniques are described in sections 4.1.3. and 4.1.4. Size measurements
were carried out at a scattering angle of 173°. Zeta potential was given by
means of electrophoretic mobility and the light is collected at the scattered
angle of 17°. Experimental data were statistically analysed applying one-way
analysis of variance (ANOVA) following Tukey test approach.

146 CHITOSAN-N-MALTODEXTRIN CONJUGATES
6.1.8.6.1.8.6.1.8.6.1.8. Transmission electron micTransmission electron micTransmission electron micTransmission electron microscopy roscopy roscopy roscopy
(TEM)(TEM)(TEM)(TEM)
Each sample (5 μL) was placed on copper grids (Formvar/carbon on
400 mesh – Agar) and let to adsorb for 5 minutes. The staining was performed
with 2% (w/v) of filtered aqueous solution of uranyl acetate for 45 seconds.
The grids were visualised using a Jeol JEM 1400 electron microscope at 80 kV.
A description of this technique can be found in section 4.1.6.
6.1.9.6.1.9.6.1.9.6.1.9. Scanning electron microscopy (SEM)Scanning electron microscopy (SEM)Scanning electron microscopy (SEM)Scanning electron microscopy (SEM)
Scanning electron microscopy (SEM) allows a direct observation and
characterisation of the sample either at micrometer or nanometer scale. It
produces three-dimensional images of the surface by scanning the sample
holder with a focused beam of electrons. The electron interaction emits a
signal that is converted into valuable information about the topography,
morphology, crystallography and composition of the sample surface. Due to
the focused electron beam, SEM micrographs have a large depth of field,
generating sample surface images with high resolution, allowing superior
magnifications. The visualisation of details can go up to 1 nanometer in size
(Goldstein, 1981).
The nanoparticles were characterised by Cryo-SEM (JEOL JSM 6301F/
Oxford INCA Energy 350 / Gatan Alto 2500). Solutions were placed on the
support and frozen in liquid nitrogen. A sectional cut was applied to observe
the nanoparticles. Polyplexes were observed using SEM (FEI QUANTA 400 FEG
/ EDAX Pegasus X4M) at a voltage of 15 kV. Liquid state samples were allowed
to dry on a mica surface pre-coated with a gold-palladium (Au-Pd) layer,
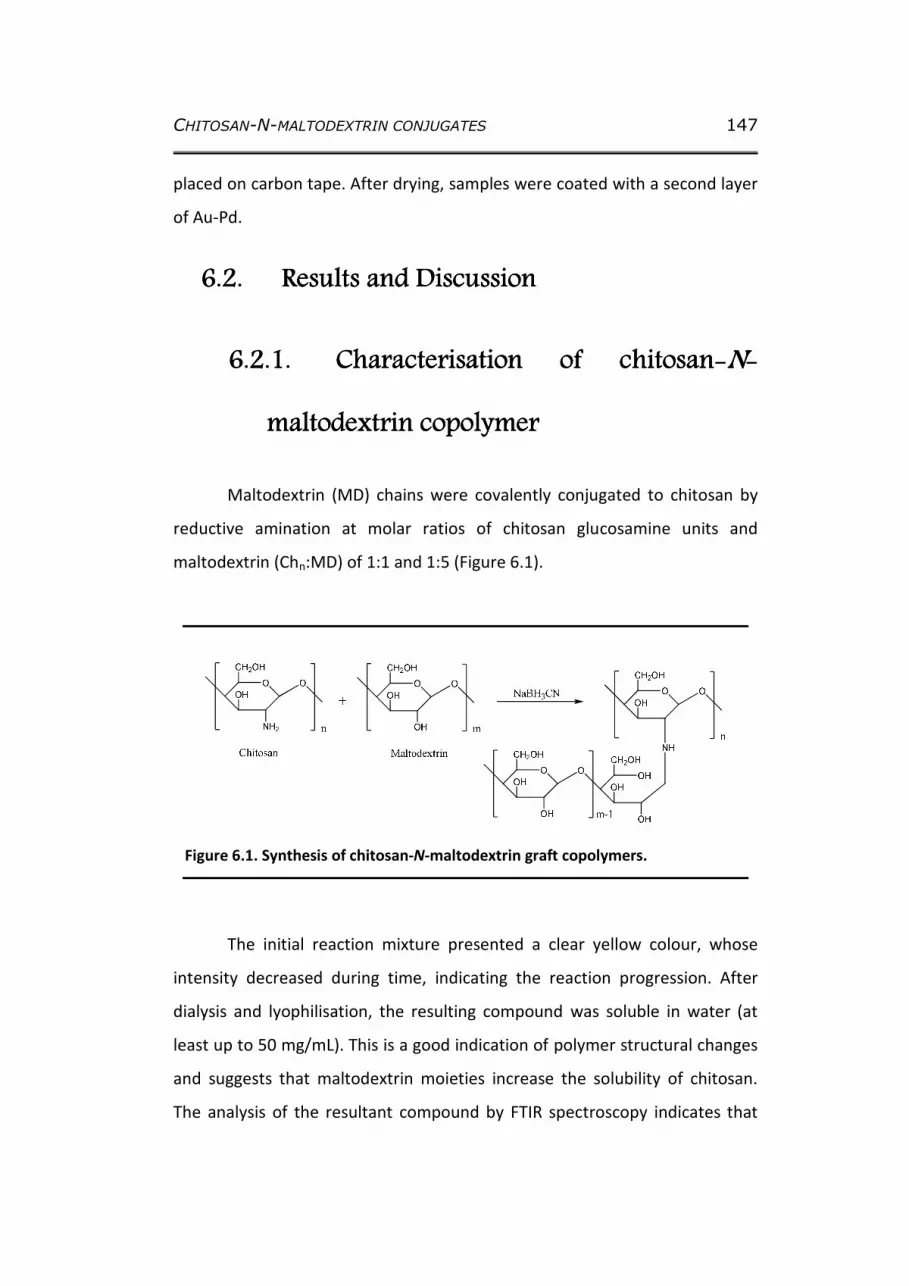
CHITOSAN-N-MALTODEXTRIN CONJUGATES 147
placed on carbon tape. After drying, samples were coated with a second layer
of Au-Pd.
6.2.6.2.6.2.6.2. Results and DiscussionResults and DiscussionResults and DiscussionResults and Discussion
6.2.1.6.2.1.6.2.1.6.2.1. CharacterisCharacterisCharacterisCharacterisationationationation of chitosanof chitosanof chitosanof chitosan----NNNN----
maltodextrinmaltodextrinmaltodextrinmaltodextrin cocococopolymerpolymerpolymerpolymer
Maltodextrin (MD) chains were covalently conjugated to chitosan by
reductive amination at molar ratios of chitosan glucosamine units and
maltodextrin (Chn:MD) of 1:1 and 1:5 (Figure 6.1).
The initial reaction mixture presented a clear yellow colour, whose
intensity decreased during time, indicating the reaction progression. After
dialysis and lyophilisation, the resulting compound was soluble in water (at
least up to 50 mg/mL). This is a good indication of polymer structural changes
and suggests that maltodextrin moieties increase the solubility of chitosan.
The analysis of the resultant compound by FTIR spectroscopy indicates that
Figure 6.1. Synthesis of chitosan-N-maltodextrin graft copolymers.

148 CHITOSAN-N-MALTODEXTRIN CONJUGATES
NH2 groups of chitosan were substituted (Figure 6.2). Chitosan and
maltodextrin show similar bands in the FTIR spectra, except in the region
between 1500 and 1700 cm-1
(Figure 6.2).
Chitosan has a broad band between 1550 and 1700 cm-1
characteristic
of N-H bend of primary amines (Park, 2001). This broad band disappears after
reacting with maltodextrin and only the characteristic band at 1650 cm-1
from
the maltodextrin molecule is visible. The absence of the N-H band from
primary amines suggests that the substitution was successful (Park, 2001).
Further analyses were carried out by NMR spectroscopy. Typical 400 MHz 1H
NMR spectrum of Chn:MD 1:1 is presented in Figure 6.3. The spectra obtained
for chitosan and maltodextrin are also included for comparison.
1500 1550 1600 1650 1700 1750 1800
0.0
0.5
1.0
1.5
2.0
2.5
3.0
3.5
4.0
4.5
5.0
5.5
6.0
Absorb
ance
x 1
02 (
a. u
.)
Wavenumber (cm-1)
Chitosan
Chitosan:Maltodextrin 1:1
Maltodextrin
Figure 6.2. Region range between 1500 and 1800 cm-1
of the FTIR spectra of
chitosan, maltodextrin and chitosan-graft-maltodextrin (chitosan
glucosamine:maltodextrin ratio of 1:1).

CHITOSAN-N-MALTODEXTRIN CONJUGATES 149
The assignment of the resonance signals in the spectra of chitosan-
graft-maltodextrin (Ch-MD) was based on the analysis of the one- (1D) and
two-dimensional (2D: 1H/
1H COSY,
1H/
1H TOCSY,
1H/
13C HSQC),
1H/
13C HMBC)
NMR spectroscopic data. The results were compared and are consistent with
the NMR data published before for chitosan and maltodextrin (Hirai, 1991;
Lavertu, 2003; Peres, 2010; Pigman, 1970). However, the appearance of new
resonance signals was observed in 1H NMR spectra of Ch-MD, as a result of
Figure 6.3. 400.15 MHz 1H NMR spectra of chitosan (Ch), maltodextrin (MD) and
chitosan-graft-maltodextrin (Ch-MD at ratio Chn:MD 1:1) polymers in D2O, at
80°°°°C. The assignment of 1H resonances is included and the new signals due to
the reaction of reductive amination are indicated by asterisk.

150 CHITOSAN-N-MALTODEXTRIN CONJUGATES
the reductive amination process for preparation of chitosan-graft-
maltodextrin. The assignments of the resonance signals in the spectra of Ch-
MD, chitosan and maltodextrin are shown in Figure 6.3. The 1H NMR spectra
of Ch-MD are dominated by the intense, broad and overlapped resonance
signals of the hydroxymethine and hydroxymethylene protons of the
saccharide residues of the polysaccharide structures of chitosan and
maltodextrin. Characteristic signals due to the anomeric protons of the
chitosan glucosamine and maltodextrin glucose units were detected at ca.
4.75 ppm and 5.40 - 4.90 ppm, respectively. The broadening of the anomeric
resonance signal of chitosan (4.75 ppm) indicates more restricted mobility of
the molecules in Ch-MD and suggests higher molecular mass of the polymer
structures. The broad signals at 5.40, 5.23 and 4.97 ppm were attributed to
the anomeric protons of α(1→4)- and α(1→6)-linked glucose units of
maltodextrin connected in chains of variable length. A doubling of H2
resonance of chitosan and appearance of additional signals with identical
intensity at 2.89, 3.03 and 5.11 ppm was observed in the 1H NMR spectra of
Ch-MD compared to the spectra of chitosan and maltodextrin. The analysis of
2D 1H/
1H COSY,
1H/
1H TOCSY,
1H/
13C HSQC,
1H/
13C HMBC) spectra confirmed a
covalent bonding of maltodextrin to the chitosan amino group by reductive
amination. The broad signals at 2.89 (d, J= 8.8 Hz) and 3.03 (dd, J=8.8, 11.7 Hz)
ppm were assigned to the protons of the new imino-methylene group formed
due to coupling the reaction between maltodextrin and amino group of
chitosan (Figure 6.1). The signal at 5.11 (d, J= 8.8 Hz) ppm was attributed to
the anomeric proton of the second glucose units in the maltodextrin chain
included in the reductive amination process of chitosan. The two resonance
signals for H2 (HCNH2) of chitosan observed in 1H NMR spectra of Ch-MD were
assigned to H2 of N-substituted (2.59 ppm, dd, J=7.8, 8.5 Hz) and N-non-
substituted (2.76 ppm, dd, J=7.8, 8.5 Hz) glucosamine residues of Ch. The

CHITOSAN-N-MALTODEXTRIN CONJUGATES 151
mole fraction of the substituted and non-substituted chitosan glucosamine
residues in Ch-MD was found to be 3:1, as it was determined from the relative
peak intensities of the corresponding proton resonances. The results indicate
that the Ch-MD samples are composed of chitosan-N-maltodextrin graft
copolymers. The content of 2-acetamido-2-deoxy-β-D-glucopyranose units
(2.5%) in Ch-MD was calculated from the ratio of the integral intensity of the
signal at 2 ppm due to acetyl protons in residual chitin and those of chitosan
anomeric protons (4.75 ppm). From here, the actual content of 2-amino-2-
deoxy-β-D-glucopyranose units available to participate in the reaction of
reductive amination was estimated. The degree of substitution of
maltodextrin to chitosan was defined from the integral intensity of the
resonance signal at 4.75 ppm (H1 of Ch, corrected for the content of 2-
acetamido-2-deoxy-β-D-glucopyranose) and the signal at 2.59 ppm due to H2
of N-substituted chitosan glucosamine residues. An alternative possibility is
the ratio of the integral intensity of the signals of H2 of N-substituted (2.59
ppm) and N-non-substituted (2.76 ppm) glucosamine residues. The degree of
substitution of 74% and 81% was calculated for Chn:MD 1:1 and Chn:MD 1:5,
respectively. The molar ratio of saccharide residues of the polysaccharide
structures of maltodextrin and chitosan (MD:Ch) for these samples was found
to be 6:1 and 11:1, as it was determined from the integral intensity of the
resonance signal of the corresponding anomeric protons in their 1H NMR
spectra. Janciauskaite et al. synthetised chitosan-graft-dextran polymers and
achieved similar degrees of substitution for dextrans with different molecular
weight for the same molar ratio of chitosan glucosamine units and dextran,
discarding the molecular weight of the graft copolymer as a property to take
into consideration. For the tested ratio 1:1, they obtained a degree of
substitution of 47% by NMR. In our case, a maltodextrin substitution of 74%
was obtained for the same ratio. This difference may be related to the

152 CHITOSAN-N-MALTODEXTRIN CONJUGATES
different degrees of deacetylation of chitosan, because a low content of
deacetylated groups leads to more amine groups available for reaction. The
molecular weight of chitosan might also play a role because larger molecules
could present problems derived from stereo chemical conformations
(Janciauskaite, 2008). An increase of maltodextrin molar concentration did not
significantly increase the degree of substitution. Above Chn:MD 1:1 ratio, it is
difficult to attach more maltodextrin molecules to chitosan chains, probably
due stereo chemical constrains of the NH2 groups. Chn:MD 1:5 sample was not
considered for further studies because its high substitution degree (81%)
leads to fewer free NH2 groups available for interacting with charged
molecules.
6.2.2.6.2.2.6.2.2.6.2.2. ChitosanChitosanChitosanChitosan----NNNN----maltodextrin maltodextrin maltodextrin maltodextrin
nanoparticlesnanoparticlesnanoparticlesnanoparticles
Ch-MD self-assembles into nanoparticles with mean diameters of 310
± 90 nm and a zeta potential of 29 ± 3 mV (Table 6.1). These nanoparticles
present a high polydispersity index (PdI = 0.71) probably due to the
polydispersity of the copolymer. The size of nanoparticles prepared with Ch-
MD copolymer (Chn:MD 1:1 ratio) and TPP as cross-linking agent (normally
used to prepare chitosan nanoparticles) was not significantly different from
that of Ch-MD nanoparticles (P>0.05) (Table 6.1 and Figure 6.4). Both Ch-MD
and Ch-MD:TPP nanoparticles show similar morphology to that of
chitosan:TPP nanoparticles (Figure 6.4). Calvo et al. observed a strong
influence of both chitosan and TPP concentrations on the size of chitosan
nanoparticles (Calvo, 1997). Chen et al. observed as well this phenomenon for
chitosan/dextran nanoparticles prepared by complex coacervation (Chen,
2007).

CHITOSAN-N-MALTODEXTRIN CONJUGATES 153
The concentration effect of both species used in nanoparticle
formation should be considered carefully because of the generated forces
between the oppositely charged species. High concentrations of one of the
species might lead to aggregation since it interferes with their stability as
individual colloids (Gaspar, 2011; Richardi, 2009). Csaba et al. studied the
impact of TPP on the properties and DNA transfection efficiency of the
nanoparticles. Nanoparticles of chitosan cross-linked with TPP and then
complexed with DNA show higher transfection efficiency than the system
obtained by direct complexion of DNA to chitosan (Csaba, 2009).
Nanoparticles of chitosan and cyclodextrin, prepared by ionotropic
gelification using TPP, resulted in vectors with high DNA association capacity
and low cytotoxicity (Teijeiro-Osorio, 2009). Using complex coacervation
Chitosan-graft-maltodextrin
Polymer concentration a
(mg/mL)
TPP concentration a
(mg/mL) 1.00 1.25
0.00
310 ± 90 nm
PdI = 0.71
29 ± 3 mV
0.20
400 ± 200 nm
PdI = 0.64
15 ± 1 mV
240 ± 40 nm
PdI = 0.57
18 ± 1 mV
0.25
300 ± 100 nm
PdI = 0.69
14 ± 1 mV
200 ± 40 nm
PdI = 0.77
15 ± 1 mV a Final concentration in nanoparticle suspension
Table 6.1. Mean particle diameter (z-average diameter), polydispersity index
(PdI) and zeta potential of chitosan-graft-maltodextrin nanoparticles.

154 CHITOSAN-N-MALTODEXTRIN CONJUGATES
method, Chen et al. prepared small nanoparticles based on chitosan and
dextran that were used to encapsulate positively charged drugs (Chen, 2007).
The zeta-potential values of Ch-MD decrease with the addition of TPP,
indicating less positive charges available, which can be an advantage when
considering the compatibility with cellular membranes (Table 6.1) (Gao,
2008). The high polydispersity of Ch-MD-TPP particles might be explained by
maltodextrin chains located at the surface of the nanoparticles (Csaba, 2009).
It can also result from the inhomogeneity of intermolecular cross-linking by
TPP.
Figure 6.4. Morphological characterisation of chitosan-graft-maltodextrin (A),
chitosan-TPP (B) and chitosan-graft-maltodextrin-TPP (C) nanoparticles at the
final concentrations of 1.25 mg/mL of polymers and 0.25 mg/mL of TPP by Cryo-
SEM (up, scale bar 2 µm) and TEM (down, scale bar 500 nm).
A B C

CHITOSAN-N-MALTODEXTRIN CONJUGATES 155
6.2.3.6.2.3.6.2.3.6.2.3. ChitosanChitosanChitosanChitosan----NNNN----maltodextrin/DNA maltodextrin/DNA maltodextrin/DNA maltodextrin/DNA
complexescomplexescomplexescomplexes
Alatorre-Meda et al. suggested that DNA compaction is completely
achieved when polyplexes reach a positive zeta potential (above the
isoneutrality point) (Alatorre-Meda, 2011; De Smedt, 2000; Tang, 1997). The
transition of the zeta potential signal of a DNA solution to which chitosan was
added occurs at a ratio of polymer:DNA between 0.5 and 1 (Figure 6.5). The
positive values in the case of titration of DNA solution with Ch-TPP
nanoparticles appear at polymer:DNA ratios between 0.25 and 0.5. The
isoelectric point of Ch-MD nanoparticles:DNA appears at ratio of 3.5 and Ch-
MD-TPP particles:DNA at 2. The results indicate that more Ch-MD and Ch-MD-
TPP are required to neutralize the same amount of DNA when compared to,
respectively, chitosan and Ch-TPP, which might be explained by the lower
number of free positive charges in Ch-MD copolymer. The primary amine
groups become unavailable when chitosan reacts with maltodextrin, thus DNA
might complex with Ch-MD copolymer not only through electrostatic
interactions but also through hydrogen bonding and hydrophobic interactions
(Mao, 2010).
SEM images show that Ch-TPP and Ch-MD particles (with TPP or not)
have a rough surface (Figure 6.6, bigger particles were considered for
visualisation purposes). The complexes of nanoparticles and DNA exhibit a
smooth surface, evidencing that a layer may be coating the particles, which is
consistent with the presence of DNA around the nanoparticles (Gaspar, 2011).
EDS (Energy dispersive X-ray spectroscopy) analysis confirmed the presence of
both DNA and chitosan macromolecules.

156 CHITOSAN-N-MALTODEXTRIN CONJUGATES
0.25 0.5 1 1.5 2 2.5 3 3.5 4 4.5 5
-40
-20
0
20
40
60
Ch
Ch-MD
Ze
ta P
ote
ntia
l (m
V)
Polymer:DNA (w:w)
A
0.25 0.5 1 2 3 4 5-40
-20
0
20
40
60
Ch-TPP
Ch-MD-TPP
Ze
ta P
ote
ntia
l (m
V)
Polymer:DNA (w:w)
B
Figure 6.5. Zeta potential of chitosan:DNA and chitosan-maltodextrin:DNA
polyplexes at different polymer:DNA mass ratios. DNA concentration is 0.025
mg/mL.

CHITOSAN-N-MALTODEXTRIN CONJUGATES 157
6.3.6.3.6.3.6.3. ConclusionsConclusionsConclusionsConclusions
A copolymer based on chitosan and maltodextrin molecules for the
preparation of DNA vectors is proposed. This compound shows improved
properties as water solubility and self-assembly into spherical nanoparticles
when compared to chitosan. Nanoparticles with diameters of about 200 nm
can be obtained by cross linking chitosan-graft-maltodextrin with TPP. Their
spherical shape and lower zeta-potential values (about 15 mV) when
compared with chitosan particles (55 mV) may favour their uptake by cells. In
Figure 6.6. Morphology of chitosan and chitosan:maltodextrin nanoparticles
complexed with DNA, characterised by SEM: (A) Ch-TPP, (B) Ch-TPP:DNA 2:1, (C)
Ch-MD, (D) Ch-MD:DNA 2:1 (E) Ch-MD-TPP, (F) Ch-MD-TPP:DNA 2:1.
A C E
B D F

158 CHITOSAN-N-MALTODEXTRIN CONJUGATES
addition, the maltodextrin chains, which are expected to be at the particle
surface, will contribute to the stabilisation of the system.
6.4.6.4.6.4.6.4. ReferencesReferencesReferencesReferences
Alatorre-Meda, M.; Taboada, P.; Hartl, F.; Wagner, T.; Freis, M.; Rodríguez, J.R.
(2011). The influence of chitosan valence on the complexation and
transfection of DNA: The weaker the DNA–chitosan binding the
higher the transfection efficiency, Colloids and Surfaces B:
Biointerfaces, 82, 54.
Becker, E.; High Resolution NMR: Theory and Chemical Applications, 3rd
Edition, Academic Press, United States of America, 2000.
Calvo, P.; Remuñán-López, C.; Vila-Jato, J.L.; Alonso, M.J. (1997). Novel
hydrophilic chitosan-polyethylene oxide nanoparticles as protein
carriers, Journal of Applied Polymer Science, 63, 125.
Cavanagh, J.; Rance, M. (1990). Sensitivity improvement in isotropic mixing
(TOCSY) experiments, Journal of Magnetic Resonance (1969), 88, 72.
Chen, Y.; Mohanraj, V.J.; Wang, F.; Benson, H.A. (2007). Designing chitosan-
dextran sulfate nanoparticles using charge ratios, AAPS
PharmSciTech, 8, E98.
Csaba, N.; Köping-Höggård, M.; Alonso, M.J. (2009). Ionically crosslinked
chitosan/tripolyphosphate nanoparticles for oligonucleotide and
plasmid DNA delivery, International Journal of Pharmaceutics, 382,
205.
De Smedt, S.C.; Demeester, J.; Hennink, W.E. (2000). Cationic Polymer Based
Gene Delivery Systems, Pharmaceutical Research, 17, 113.
Ebnesajjad, S.; Surface Treatment of Materials for Adhesion Bonding, William
Andrew, United States of America, 2006.

CHITOSAN-N-MALTODEXTRIN CONJUGATES 159
Evans, C.; Brundle, R.; Wilson, S.; Encyclopedia of Materials Characterization,
Butterworth-Heinemann, United States of America, 1992.
Gao, Y.; Xu, Z.; Chen, S.; Gu, W.; Chen, L.; Li, Y. (2008). Arginine-chitosan/DNA
self-assemble nanoparticles for gene delivery: In vitro characteristics
and transfection efficiency, International Journal of Pharmaceutics,
359, 241.
Gaspar, V.M.; Sousa, F.; Queiroz, J.A.; Correia, I.J. (2011). Formulation of
chitosan–TPP–pDNA nanocapsules for gene therapy applications,
Nanotechnology, 22, 015101.
Gerothanassis, I.P.; Troganis, A.; Exarchou, V.; Barbarossou, K. (2002).
NUCLEAR MAGNETIC RESONANCE (NMR) SPECTROSCOPY: BASIC
PRINCIPLES AND PHENOMENA, AND THEIR APPLICATIONS TO
CHEMISTRY, BIOLOGY AND MEDICINE, Chemistry Education Research
and Practice, 3, 229.
Goldstein, J.; Newbury, D.; Joy, D.; Echlin, P.; Lifshin, E.; Fiori, C.; Scanning
Electron Microscopy and x-Ray Microanalysis, Plenum Press, Unites
States of America, 1981.
Griffiths, P.R.; Haseth, J.A.; Fourier Transform Infrared Spectrometry, 2nd,
John Wiley & Sons, Inc., New Jersey, USA, 2007.
Günther, H.; NMR spectroscopy : basic principles, concepts, and applications in
chemistry, 2nd Edition, Wiley, United Satates of America, 1994.
Hirai, A.; Odani, H.; Nakajima, A. (1991). Determination of degree of
deacetylation of chitosan by 1H NMR spectroscopy, Polymer Bulletin,
26, 87.
Huang, C.-Y.; Ma, S.S.; Lee, S.; Radhakrishnan, R.; Braun, C.S.;
Choosakoonkriang, S.; Wiethoff, C.M.; Lobo, B.A.; Middaugh, C.R.
(2002). Enhancements in gene expression by the choice of plasmid

160 CHITOSAN-N-MALTODEXTRIN CONJUGATES
DNA formulations containing neutral polymeric excipients, Journal of
Pharmaceutical Sciences, 91, 1371.
Janciauskaite, U.; Rakutyte, V.; Miskinis, J.; Makuska, R. (2008). Synthesis and
properties of chitosan-N-dextran graft copolymers, Reactive and
Functional Polymers, 68, 787.
Kaneko, Y.; Matsuda, S.I.; Kadokawa, J.I. (2007). Chemoenzymatic synthesis of
amylose-grafted chitin and chitosan, Biomacromolecules, 8, 3959.
Lavertu, M.; Xia, Z.; Serreqi, A.N.; Berrada, M.; Rodrigues, A.; Wang, D.;
Buschmann, M.D.; Gupta, A. (2003). A validated 1H NMR method for
the determination of the degree of deacetylation of chitosan, Journal
of Pharmaceutical and Biomedical Analysis, 32, 1149.
Mao, S.; Sun, W.; Kissel, T. (2010). Chitosan-based formulations for delivery of
DNA and siRNA, Advanced Drug Delivery Reviews, 62, 12.
Park, I.K.; Park, Y.H.; Shin, B.A.; Choi, E.S.; Kim, Y.R.; Akaike, T.; Cho, C.S.
(2001). Galactosylated chitosan-graft-dextran as hepatocyte-
targeting DNA carrier, Journal of Controlled Release, 75, 433.
Peres, I.; Rocha, S.; Pereira, M.d.C.; Coelho, M.; Rangel, M.; Ivanova, G. (2010).
NMR structural analysis of epigallocatechin gallate loaded
polysaccharide nanoparticles, Carbohydrate Polymers, 82, 861.
Pigman, W.W.; Horton, D.; Herp, A.; The carbohydrates : chemistry and
biochemistry, Volume 1, 2nd Edition, Academic Press, United States
of America, 1970.
Ramachandran, V.S.; Beaudoin, J.J.; Handbook of Analytical Techniques in
Concrete Science and Technology, William Andrew, United States of
America, 2001.
Reichenbächer, M.; Popp, J.; Challenges in molecular Structure Determination,
Springer, Germany, 2012.

CHITOSAN-N-MALTODEXTRIN CONJUGATES 161
Richardi, J. (2009). One-dimensional assemblies of charged nanoparticles in
water: A simulation study, Journal of Chemical Physics, 130, 044701.
Schnell, I.; Spiess, H.W. (2001). High-Resolution 1H NMR Spectroscopy in the
Solid State: Very Fast Sample Rotation and Multiple-Quantum
Coherences, Journal of Magnetic Resonance, 151, 153.
Tang, M.X.; Szoka, F.C. (1997). The influence of polymer structure on the
interactions of cationic polymers with DNA and morphology of the
resulting complexes, Gene Therapy, 4, 823.
Teijeiro-Osorio, D.; Remuñán-López, C.; Alonso, M.J. (2009).
Chitosan/cyclodextrin nanoparticles can efficiently transfect the
airway epithelium in vitro, European Journal of Pharmaceutics and
Biopharmaceutics, 71, 257.


CONCLUDING REMARKS 163
Chapter 7
7.7.7.7. Concluding remarksConcluding remarksConcluding remarksConcluding remarks
In this thesis three different systems are proposed with impact on
gene therapy. The study of physical, chemical and biological properties of
these systems allowed a better understanding of the process involved on the
transport and release of DNA. They have shown potential as gene carriers
and, therefore, further studies either in vitro or in vivo can be performed.
The use of F7-cholesterol as helper lipid in cationic (DOTAP) non-viral
gene vectors is proposed. This fluorinated derivative of cholesterol was
chosen because previous studies highlighted the efficient gene transfer by
lipids containing fluorinated hydrophobic chains. Studying the physical forces
between two lipids in a monolayer is of great importance to understand their
behaviour when they are part of a bilayer structure like a liposome.
Monolayer studies showed that the mixture of DOTAP with F7-cholesterol is
completely miscible. Regarding the interaction of the lipid monolayer with
DNA molecules, the monolayer system adsorbs DNA even at ionic strength
close to the physiological values, thus F7-cholesterol is a promising candidate
for the preparation of gene delivery vectors.

164 CONCLUDING REMARKS
Liposomes of DOTAP and fluorinated cholesterol were prepared and
compared to the DOTAP/cholesterol system in terms of biophysical properties
when complexed with DNA. The results showed that a higher lipid amount is
required to form complexes with DNA in the case of DOTAP/F7-cholesterol
system. However, the aggregation-disaggregation model predicts that, even if
more DOTAP:F7-CHOL liposomes are needed, most of the DNA is involved in
the complexation process when the lipoplexes are formed. Also, both systems
showed similar stability in the presence of DNA and have identical
transfection efficiency. This study confirmed that fluorinated cholesterol
molecule could be included in cationic liposomes without dramatically
changing their properties.
A new synthesised bolaamphiphile was used to prepare two different
systems for DNA delivery. The layer-by-layer assembly was used to deposit
layers of DNA and bolaamphiphile at the surface of the particles. The zeta
potential variation gives an indication of the layer deposition through the
signal reversal, according to the charge of the molecule used. Further assays
were done to ensure the presence of DNA within the layers as well as the
presence of the bolaamphiphile. CLSM images confirm the uniform presence
of both compounds on the particles.
A type of vesicles that combine bolaamphiphile with cationic lipids is
also proposed to form stable and positively charged liposomes capable of
condensing efficiently genetic material by electrostatic interactions.
Comparing the carrier made of BA:DOTAP 1:5 with DOTAP vesicles, they
present similar properties with respect to size and zeta potential values. The
transfection studies show that the bolaamphiphile mixed system has a higher
transfection potential when compared to DOTAP vesicles.

CONCLUDING REMARKS 165
Chitosan-N-maltodextrin was synthesised via reductive amination by
covalently conjugating chitosan molecules to maltodextrin chains. This
copolymer is proposed for the preparation of DNA polymer-based vectors.
This compound shows improved properties as water solubility and self-
assembly into spherical nanoparticles when compared to chitosan.
Nanoparticles with diameters of about 200 nm can be obtained by cross
linking chitosan-graft-maltodextrin with TPP. Their spherical shape and lower
zeta-potential values (about 15 mV) when compared with chitosan particles
(55 mV) may favour their uptake by cells. In addition the maltodextrin chains,
which are expected to be at the particle surface, will contribute to the
stabilisation of the system.


LIST OF ABBREVIATIONS 167
List of AbbreviationsList of AbbreviationsList of AbbreviationsList of Abbreviations
AbbreviationsAbbreviationsAbbreviationsAbbreviations
AIDS Acquired immunodeficiency syndrome
ANOVA One-way analysis of variance
AuNPs Gold nanoparticles
BA 22-hydroxy-N,N,N-trimethyldocosan-1-aminium (Bolaamphiphile)
BAM Brewster angle microscopy
Ca. Approximately
CCC Critical coagulation concentration
CCD Charge-coupled device
CD Circular dichroism
β-CD β-cyclodextrin
Ch Chitosan
Ch-MD Chitosan-N-maltodextrin
CHOL Cholesterol
CLSM Confocal laser scanning microscopy
COSY Two-dimensional (2D) 1H/1H correlation spectroscopy
CSC Critical stabilisation concentration
ctDNA Calt thymus DNA
d Doublet
dd Double of doublets
DAPI 4’,6-diamidino-2-phenylindole

168 LIST OF ABBREVIATIONS
DC-Chol 3β-[N-(N',N'-dimethylaminoethane)-carbamoyl]cholesterol
hydrochloride
DDAB Didodecyldimethylammonium bromide
DE Dextrose equivalent
DLATGS Deuterated l-alanine-doped triglycine sulfate
DLS Dynamic light scattering
DMPC 1,2-dimyristoyl-sn-glycero-3-phosphocholine
DMPG 1,2-dimyristoyl-sn-glycero-3-[phospho-rac-(1-glycerol)]
DNA Deoxyribonucleic acid
DOGS Dioctadecylaminoglycylspermine
DOPE 1,2-dioleoyl-sn-glycero-3-phosphoethanolamine
DOPG 1,2-dioleoyl-sn-glycero-3-[phospho-rac-(1-glycerol)]
DOSPA 2,3 Dioleyloxy-N-[2(sperminecarboxaminino)ethyl]-N,N-dimethyl-1-
propanaminium trifluroacetate
DOTAP 1,2-dioleoyl-3-trimethylammonium-propane (chloride salt)
DOTMA 1,2-di-O-octadecenyl-3-trimethylammonium propane
EDL Electrical double layer
EDS Energy dispersive X-ray spectroscopy
Et al. and co-workers
EtBr 3,8-Diamino-5-ethyl-6-phenylphenanthridinium bromide (Ethidium
Bromide)
F7-CHOL 25,26,26,26,27,27,27-heptafluorocholesterol (F7-cholesterol)
FACS Fluorescence-activated cell sorter
FBS Heat inactivated fetal bovine serum
FTIR Fourier transform infrared spectroscopy
G Gaseous
GC Classical Gouy-Chapman model
GFP Green fluorescent protein
HEK 293 Human embryonic kidney 293 cells
HeLa Human cervical cancer immortal cell line
HEPES 4-(2-Hydroxyethyl) piperazine-1-ethanesulfonic acid

LIST OF ABBREVIATIONS 169
HIV Human immunodeficiency virus infection
HMQC 1H/13C heteronuclear multiple bond coherence spectroscopy
HSQC 1H/13C heteronuclear single quantum coherence spectroscopy
i. e. That is
iep Isoelectric point
IR Infrared
IRRAS Infrared reflection absorption spectroscopy
J Coupling constant
JL1 Antigen of human cortical thymocyte
KRS-5 Thallium bromide and iodide mixed crystal
LbL Layer-by-layer
LC Liquid-condensed
L/D Liposome/DNA mass ratio
(L/D)0 Liposome/DNA mass ratio at isoelectric point
LDV Laser Doppler velocimetry
LE Liquid-expanded
LUV Large unilamellar vesicles
MC Monte Carlo simulations
MCT Mercury cadmium telluride
MD Maltodextrin
MEM Minimum essential medium
miRNA Mediated gene regulation circuits of ribonucleic acid
MLV Multilamellar vesicles
MNPs Magnetic nanoparticles
Mw Molecular weight
MWCO Molecular weight cut off
NMR Nuclear magnetic resonance
N/P Nitrogen/phosphate
NPs Nanoparticles
PAH Poly(allylamine hydrochloride)
PAMAM Polyamidoamine

170 LIST OF ABBREVIATIONS
PBS Phosphate buffered saline
PdI Polydispersity index
pDNA Plasmid DNA (pEGFP-N1)
PEG Polyethylene glycol
PEI Polyethylenimine
pH Potential hydrogen
PhD Doctor of philosophy
PLGA Poly(lactic-co-glycolic acid)
PLL Poly(L-lysine)
PS Polystyrene
PSS Poly(sodium 4-styrenesulfonate)
PTFE Polytetrafluoroethylene
pzc point of zero charge
QDs Quantum dots
Rhod PE 1,2-dipalmitoyl-sn-glycero-3-phosphoethanolamine-N-(lissamine
rhodamine B sulfonyl) (ammonium salt)
RNA Ribonucleic acid
S Solid
S.D. Standard deviation
SEM Scanning electron microscopy
SH-SY5Y Human neuroblastoma cell line
siRNA Small interfering ribonucleic acid
SPIONs Super paramagnetic iron oxide nanoparticles
SUV Small unilamellar vesicles
T-cells T lymphocites cells
TEM Transmission electron microscopy
TOCSY 1H/1H total correlation spectroscopy
TPP Sodium tripolyphosphate
Tris 2-amino-2-(hydroxymethyl)-1,3-propanediol
TSP Sodium trimethylsilyl-[2,2,3,3-d4]-propionate
UV-VIS Ultraviolet-visible spectroscopy

LIST OF ABBREVIATIONS 171
ZP Zeta potential
SymbolsSymbolsSymbolsSymbols
A Area
Absorbance
Am Average molecular area
a.u. Arbitrary units
a Liposome radius
B0 External magnetic field strength
C Molar concentration
Ce Liposome electrical capacitance
D Diffusion coefficient
Dielectric constant
E0 DNA-liposome interaction energy
Stokes coefficient
Henry’s function
ℎ Planck’s constant
Transmitted radiation
Incident radiation
Fluorescence intensity
Boltzmann’s constant
kr Rate constant for rapid coagulation regime
ks Rate constant for slow coagulation regime
l Optical path length
N Number of nuclei
P DNA concentration
P0 DNA concentration in equilibrium with lipoplexes
Q Liposome charge
q Charge of DNA segment
Hydrodynamic radius

172 LIST OF ABBREVIATIONS
Sa(P) Liposome concentration at aggregation
Sd(P) Liposome concentration at disaggregation
Absolute temperature
Transmittance
W Fuchs stability ratio
X Molar fraction
Greek lyrics
α Brewster angle
γ Surface tension
γm Magnetogyric ratio
ε Relative permittivity
ε0 Absolute permittivity of vacuum
Molar absorptivity
∆ε Extinction coefficient
∆V Surface potential
ζ Zeta potential
Viscosity
θ Ellipticity
κD Reciprocal Debye length
λ Wavelength
Magnetic moment
Electrophoretic mobility
µ⊥,m Vertical component of the molecular dipole moment
ν Wavenumber
π Lateral surface pressure
πc Critical lateral surface pressure
Diffuse double layer contribution

LIST OF ABBREVIATIONS 173
UnitsUnitsUnitsUnits
% (v/v) Volume percent
% (w/v) Weight-volume percent
% (w/w) Weight percent
m Length (meter)
Å Length (10-10 m)
g Mass (gram)
mol Mole
M (mol/m3) Molar concentration
kg/m3 Mass concentration
m3 = 103 L Volume (cubic meter or liter)
Da= g/mol Unified atomic mass unit
ppm parts per million
s Time (seconds)
min Time (minutes)
h Time (hours)
° degree
°C Temperature (Celsius)
K Temperature (Kelvin)
V Voltage (Volts)
Hz = s-1 Frequency (Hertz)
W Power (watt)
N Force (newton)
Ω∙m Electrical resistivity (ohm∙meter)
Units prefix
G giga 109
M mega 106

174 LIST OF ABBREVIATIONS
k kilo 103
unit 100
d deci 10-1
c centi 10-2
m mili 10-3
µ micro 10-6
n nano 10-9
p pico 10-12

LIST OF FIGURES 175
List of FiguresList of FiguresList of FiguresList of Figures
Figure 2.1. Schematic representation of the DNA transfection process (Patil, 2005a). ....................... 8
Figure 2.2. Schematic representation of possible arrangements of asymmetrical bolamphiphiles in
crystals: a) parallel a,a; b) parallel a,b; c) antiparallel a,b and b,a (Fuhrhop, 2004). ........ 18
Figure 3.1. Chemical structures of DOTAP, CHOL (cholesterol) and F7-CHOL
(heptafluorocholesterol). .................................................................................................. 47
Figure 3.2. Representative phases of a surface pressure-area isotherm of a langmuir monolayer. .. 48
Figure 3.3. Langmuir film balance system. ......................................................................................... 49
Figure 3.4. Pressure-area isotherms of monolayers of DOTAP, cholesterol (CHOL), F7-cholesterol
(F7-CHOL), DOTAP/cholesterol 1:1 mixture (DOTAP/CHOL) and DOTAP/F7-cholesterol 1:1
mixture (DOTAP/F7-CHOL) on PBS buffer and of DOTAP/F7-cholesterol 1:1 mixture on
0.1 mg/ml of DNA dissolved in PBS. Brewster angle microscopy images of the mixtures of
DOTAP and the sterols at different surface pressures are also shown. ............................ 54
Figure 3.5. Surface potential isotherms of monolayers of DOTAP, cholesterol (CHOL), F7-cholesterol
(F7-CHOL), DOTAP/cholesterol 1:1 (DOTAP/CHOL) and DOTAP/F7-cholesterol 1:1
(DOTAP:F7-chol) on PBS buffer. ........................................................................................ 56
Figure 3.6. Different regions of the IRRAS spectra of monolayers of (1) DOTAP, (2) DOTAP/F7-
cholesterol 1:1, (3) F7-cholesterol, (4) DOTAP/cholesterol 1:1 and (5) cholesterol on PBS
buffer (dashed line) and on 0.1 mg/ml DNA dissolved in PBS buffer (solid line) subphases.
Different regions of the IRRA spectra are presented in separate plots and the spectra are

176 LIST OF FIGURES
offset for clarity: DNA marker bands (a), CH2 stretching vibrations (b), and OH stretching
band (c). The surface pressure is in all cases 35 mn/m. .................................................... 60
Figure 4.1. Lipid film hydration method. ............................................................................................ 74
Figure 4.2. Representative scheme of DNA A-, B- and C-form (Lu, 2003). .......................................... 84
Figure 4.3. Electrophoretic mobility (A) and hydrodynamic diameter (B) of DOTAP:CHOL-DNA
lipoplexes at different lipid-DNA (L/D) mass ratios in HEPES buffer (10 mm, pH 7.4). The
DOTAP:CHOl molar ratio is 1:1 and DNA concentration is 0.05 mg/ml. ........................... 88
Figure 4.4. Electrophoretic mobility (A) and hydrodynamic diameter (B) of DOTAP:F7-CHOL-DNA
lipoplexes at different lipid-DNA (L/D) mass ratios in HEPES buffer (10 mm, pH 7.4). The
DOTAP:F7-CHOL molar ratio is 1:1 and DNA concentration is 0.05 mg/ml. ...................... 89
Figure 4.5. (A) Emission fluorescence spectra of DNA:EtBr (6:1) in the presence of DOTAP:F7-CHOL
liposomes at the lipid/DNA (L/D) mass ratios from 0 to 10; dotted line shows the
emission fluorescence spectrum of EtBr in HEPES buffer solution without liposomes and
lipoplexes. (B) Emission fluorescence intensity of DNA:EtBr (6:1) at 590 nm in the
presence of DOTAP:CHOL and DOTAP:F7-CHOL liposomes at L/D ratios form 0 to 10. The
values were normalised to the maximum fluorescence intensity (DNA:EtBr in the
absence of liposomes). DOTAP:sterol ratio is 1:1 and the DNA concentration is 0.025
mg/ml. ............................................................................................................................... 92
Figure 4.6. TEM micrographs of liposomes in the absence of DNA (A and D) and of lipoplexes at
L/D<(L/D)0 (B, C, E, F). (A-C) refers to DOTAP:CHOL system and (D-F) to DOTAP:F7-CHOL.
Scale bar: 100 nm. ............................................................................................................. 94
Figure 4.7. Details extrated from the original TEM micrographs of lipoplexes at L/D>(L/D)0. (A-C)
refers to DOTAP:CHOL system and (D-F) to DOTAP:F7-CHOL. Scale bar: 100 nm. ............ 95
Figure 4.8. Boundary concentration lines, Sa(P) and Sd(P), for dotap:chol/dna (up) and DOTAP:F7-
CHOL/DNA (down) lipoplexes, according to the aggregation-disaggregation theory. ...... 98
Figure 4.9. Fuchs stability ratio W (stability factor) of liposomes DOTAP:CHOL (A) and DOTAP:F7-
CHOL (B), as a function of DNA concentration. Data are presented on the logarithmic
scale. ............................................................................................................................... 100

LIST OF FIGURES 177
Figure 4.10. CD spectra of ctDNA and pDNA in TRIS buffer (pH=7.4). ................................................ 102
Figure 4.11. CD spectra of ctDNA (up) and pDNA (down) for DNA alone and complexes of DNA with
DOTAP:CHOL and DOTAP:F7-CHOL at the L/D ratio of 10:1. .......................................... 103
Figure 4.12. Transfection of SH-SY5Y and HeLa cell lines with green fuorescent protein (GFP plasmid
(pDNA): cytometry analysis of levels of transfection of cells using DOTAP:CHOL and
DOTAP:F7-CHOL systems. The L/D ratio was 10:1. Results are expressed as mean ± S.D. (n
= 3). ................................................................................................................................. 104
Figure 4.13. Illustrative confocal images of GFP expression for SH-SY5Y and HeLa cell lines when
transfected with naked plasmid DNA (A), DOTAP:CHOL/pDNA (B) and DOTAP:F7-
CHOL/pDNA (C). The scale bar is 50 µm. ........................................................................ 105
Figure 5.1. Schematic representation of the Layer-by-Layer process (Donath, 1998). .................... 118
Figure 5.2. Chemical structure of 22-hydroxy-n,n,n-trimethyldocosan-1-aminium (BA). ................ 119
Figure 5.3. Zeta potential of the successive layers added to the PS cores by the LbL technique. .... 123
Figure 5.4. CLSM images of multilayered microparticles with PS cores showing the presence of DNA
(blue chanel - left), BA layer (red chanel - center) and the sobreposition of both chanels
(right). Scale bar is 12 µm. .............................................................................................. 124
Figure 5.5. Self-assembled bolaamphiphile structure observed by TEM (top) and CLSM (bottom).
Scale bar is, respectively, 3 and 10 µm. .......................................................................... 129
Figure 5.6. Hydrodynamic diameter of vesicles of BA, DOTAP and their mixture at different molar
ratios. .............................................................................................................................. 130
Figure 5.7. Zeta potential values for the studied formulations, before and after complexation. .... 131
Figure 5.8. Transfection of HEK cell line with green fluorescent protein (GFP) plasmid (pDNA) at 10:1
L/D ratio: (A) cytometry analysis of transfection levels for DOTAP and BA:DOTAP 1:5
systems. Results are expressed as mean ± S.D. (n=3). (B) Illustrative confocal images of
GFP expression when transfected with naked pDNA (B1), DOTAP (B2) and BA:DOTAP 1:5
(B3). The scale bar is 50 µm. ........................................................................................... 133

178 LIST OF FIGURES
Figure 6.1. Synthesis of chitosan-N-maltodextrin graft copolymers. ................................................ 147
Figure 6.2. Region range between 1500 and 1800 cm-1 of the FTIR spectra of chitosan, maltodextrin
and chitosan-graft-maltodextrin (chitosan glucosamine:maltodextrin ratio of 1:1)....... 148
Figure 6.3. 400.15 MHz 1H NMR spectra of chitosan (Ch), maltodextrin (MD) and chitosan-graft-
maltodextrin (Ch-MD at ratio Chn:MD 1:1) polymers in D2O, at 80°C. The assignment of
1H resonances is included and the new signals due to the reaction of reductive
amination are indicated by asterisk. ............................................................................... 149
Figure 6.4. Morphological characterisation of chitosan-graft-maltodextrin (A), chitosan-TPP (B) and
chitosan-graft-maltodextrin-TPP (C) nanoparticles at the final concentrations of 1.25
mg/ml of polymers and 0.25 mg/ml of TPP by Cryo-SEM (up, scale bar 2 µm) and TEM
(down, scale bar 500 nm). ............................................................................................... 154
Figure 6.5. Zeta potential of chitosan:DNA and chitosan-maltodextrin:DNA polyplexes at different
polymer:DNA mass ratios. DNA concentration is 0.025 mg/ml. ..................................... 156
Figure 6.6. Morphology of chitosan and chitosan:maltodextrin nanoparticles complexed with DNA,
characterised by SEM: (A) Ch-TPP, (B) Ch-TPP:DNA 2:1, (C) Ch-MD, (D) Ch-MD:DNA 2:1
(E) Ch-MD-TPP, (F) Ch-MD-TPP:DNA 2:1. ........................................................................ 157

LIST OF TABLES 179
List of TablesList of TablesList of TablesList of Tables
Table 3.1. More common Mid-IR group frequencies of phospholipids and DNA (Banyay, 2003;
Blume, 1996; Gromelski, 2006). ........................................................................................ 52
Table 3.2. Average molecular area (Am) and surface potential (∆v) of the lipid monolayers at
constant surface pressures. .............................................................................................. 55
Table 3.3. Symmetric CH2 vibration band of the lipid monolayers obtained by IRRAS. .................... 62
Table 4.1. Phenomenological parameters P0 and E0 for each system and the required experimental
conditions for their calculation. ........................................................................................ 96
Table 6.1. Mean particle diameter (z-average diameter), polydispersity index (PdI) and zeta
potential of chitosan-graft-maltodextrin nanoparticles. ................................................ 153
