can systems biology advance clinical precision oncology?
TRANSCRIPT

cancers
Review
Can Systems Biology Advance Clinical Precision Oncology?
Andrea Rocca 1,* and Boris N. Kholodenko 2,3,4,*
�����������������
Citation: Rocca, A.; Kholodenko,
B.N. Can Systems Biology Advance
Clinical Precision Oncology?. Cancers
2021, 13, 6312. https://doi.org/
10.3390/cancers13246312
Academic Editor: Samuel C. Mok
Received: 4 December 2021
Accepted: 10 December 2021
Published: 16 December 2021
Publisher’s Note: MDPI stays neutral
with regard to jurisdictional claims in
published maps and institutional affil-
iations.
Copyright: © 2021 by the authors.
Licensee MDPI, Basel, Switzerland.
This article is an open access article
distributed under the terms and
conditions of the Creative Commons
Attribution (CC BY) license (https://
creativecommons.org/licenses/by/
4.0/).
1 Hygiene and Public Health, Local Health Unit of Romagna, 47121 Forlì, Italy2 Systems Biology Ireland, School of Medicine, University College Dublin, Belfield, D04 V1W8 Dublin, Ireland3 Conway Institute of Biomolecular and Biomedical Research, University College Dublin, Belfield,
D04 V1W8 Dublin, Ireland4 Department of Pharmacology, Yale University School of Medicine, New Haven, CT 06520, USA* Correspondence: [email protected] (A.R.); [email protected] (B.N.K.)
Simple Summary: Omics technologies and targeted drugs are revolutionizing the clinical oncologylandscape, portending the promise of precision oncology. However, our abilities to define thebest treatment for the individual tumor, based on its molecular characterization, are still limited.Systems biology, by studying the collective behavior of the different types of molecules involvedin a biological process, allows us to reconstruct the complex behavior of biological systems and tocompute the system’s response to perturbations, such as targeted therapies. This helps to dissectdrug resistance phenomena, as well as to establish the best drug combinations for a specific tumor.Patient-specific biomarkers can be built from dynamical models of signaling networks and can havea greater prognostic value than conventional biomarkers. In this paper, we review current systemsbiology methods to highlight how they can contribute to advance clinical and translational researchin precision oncology.
Abstract: Precision oncology is perceived as a way forward to treat individual cancer patients.However, knowing particular cancer mutations is not enough for optimal therapeutic treatment,because cancer genotype-phenotype relationships are nonlinear and dynamic. Systems biologystudies the biological processes at the systems’ level, using an array of techniques, ranging fromstatistical methods to network reconstruction and analysis, to mathematical modeling. Its goal isto reconstruct the complex and often counterintuitive dynamic behavior of biological systems andquantitatively predict their responses to environmental perturbations. In this paper, we reviewthe impact of systems biology on precision oncology. We show examples of how the analysisof signal transduction networks allows to dissect resistance to targeted therapies and inform thechoice of combinations of targeted drugs based on tumor molecular alterations. Patient-specificbiomarkers based on dynamical models of signaling networks can have a greater prognostic valuethan conventional biomarkers. These examples support systems biology models as valuable tools toadvance clinical and translational oncological research.
Keywords: cancer systems biology; statistical methods; network analysis; mathematical models;signaling networks; drug resistance; patient-specific network modeling; precision oncology
1. Introduction
Research in clinical oncology has always been confronted with the limited efficacyof single drugs and the need to identify the best treatment for a specific patient. Yet, thecornerstone of clinical cancer research, phase 3 randomized controlled trials (RCTs), aimsto define the average treatment effect in a population of patients [1]. Not surprisingly,criticisms have emerged, questioning whether “average” results can apply to single pa-tients [2]. Over the past decades, two key advances have changed the landscape of cancerresearch: a predominantly reductionist approach in biological research has given way tothe widespread use of omics and high-throughput techniques [3–6], while the therapeutic
Cancers 2021, 13, 6312. https://doi.org/10.3390/cancers13246312 https://www.mdpi.com/journal/cancers

Cancers 2021, 13, 6312 2 of 26
armamentarium, previously based on chemotherapy and a few hormonal drugs, has beenenriched with a large variety of targeted drugs [7]. The complexity [8,9] and heterogene-ity [10,11] of tumors has prompted the development of precision oncology, aiming to tailortreatments to individual patients [12–17]. Methods have been developed to deal with theheterogeneity of treatment effects in RCT [18–20], and new clinical trial designs have beenproposed, often adopting Bayesian methods and adaptive principles, to deal with the needto develop treatments based on tumor biological features [21–24].
Nonetheless, there remains a gap between the current possibilities to characterize theentire spectrum of molecular alterations of a single tumor and our capacity to define thebest treatment based on those molecular alterations. In this paper, we will review currentsystems biology methods and provide examples of how they can be valuable tools to fillthis gap and further the development of cancer treatment. We avoid most technicalitiesand primarily target an audience of medical oncologists.
2. Precision Oncology Challenges
Precision oncology emerged as a new paradigm with the advent of drugs whosemolecular targets are precisely defined. The targeted activity depends on the status ofthe target itself, often constitutively active [25,26]. Many new drugs target intracellularsignaling pathways, but others target processes occurring in the microenvironment, suchas neo-angiogenesis, or the immune system. The fundamental intent of precision oncologyis to match treatments to the molecular alterations that are present in the individual tumorto increase the chances of efficacy.
Precision oncology requires a deep biological characterization of tumors, usually per-formed through omics studies. This has led to the identification of tumor subtypes withinvarious primary tumors [27,28], useful to stratify patients for prognostic and therapeuticpurposes. More detailed classifiers have been derived from the joint analysis of differenttypes of omics data [29–33].
A key aspect of precision oncology is predicting the individual response to treatments.The presence of the target, often represented by a mutant (e.g., kinase-activating mutationin EGFR, BRAFV600E), overexpressed (e.g., HER2), or fusion protein (e.g., BCR/ABLand NTRK), is often the prerequisite for the use of a molecularly targeted drug [34,35].Identification of the target, by gene or protein expression analyses, is therefore commonlysufficient to set the indication for the use of a targeted drug in clinical practice [36,37].However, the predictivity of such single biomarkers is limited, and predictors formed bypanels of biomarkers are being widely studied.
Transcriptomic assays are used to predict the benefit of adjuvant chemotherapy in pa-tients with hormone receptor-positive, human epidermal growth factor receptor 2 (HER2)-negative breast cancer [38–40]. They have also been applied to predict the benefit ofradiation therapy [41].
Transcriptomic predictor panels could be even more relevant for therapies targetingintracellular signaling pathways, as exemplified by the HER2 pathway in breast cancer.The PAM50 transcriptomic predictor has been shown to predict response to HER2-targetedtherapies better than the standard evaluation of HER2 overexpression or gene amplifica-tion [42]. In genomic alteration studies, considering groups of alterations affecting thesame pathway yields a better prediction of response to anti-HER2 therapies than mutationsin single genes [43]. The measurement of the total and phosphorylated levels of signalingmolecules could help to further refine predictions [44,45], while integrating phosphopro-teomics with genomics and transcriptomics analyses can increase the capacity to identifydriver molecular alterations and therapeutic targets [46–48].
Similar efforts have recently been undertaken to predict the response to immunecheckpoint inhibitors (ICIs). The tumor or immune cell expression of Programmed cellDeath-Ligand 1 (PD-L1), assessed by immunohistochemistry, is a standard method to selectpatients for treatment with ICIs, but has limited predictivity and standardization [49,50].Mismatch repair deficiency and a high tumor mutational burden are tumor “agnostic”

Cancers 2021, 13, 6312 3 of 26
markers that qualify patients for treatment with pembrolizumab [51]. The acknowledgmentof the complex, multifactorial nature of the interactions between tumor and the immunesystem has suggested the introduction of the “cancer immunogram” as a collection ofmultiple biomarkers to guide treatment choice [52]. Gene expression signatures have beenstudied as predictors of response to ICIs (e.g., an interferon-γ signaling signature) [53], oras predictors of resistance [54]. Although most of these panels have not entered clinicalpractice so far, these examples show that predictors based on panels of biomarkers canoutperform single biomarkers.
Another key aspect of precision oncology is deciphering the mechanisms of resistanceto targeted drugs and identifying strategies to overcome them. Resistance may be dueto alterations in the target itself, which is no longer present (e.g., after the emergence ofHER2-negative clones in a tumor originally HER2-positive) [55] or undergoes secondarymutations that make it resistant to inhibition by the drug (e.g., EGFRT790M in non-smallcell lung cancer (NSCLC)) [56]. Sometimes mutations arise in molecules downstream of thedrug target (e.g., mutations in RAS, RAF, and PI3K during EGFR inhibitor therapy) [56,57],leading to the constitutive activation of a pathway. However, drug resistance may alsodepend on network adaptation mechanisms, including facilitation of resistance by feedbackmechanisms (e.g., multiple feedbacks present in the MAPK pathway) [58], or activation ofparallel pathways that bypass inhibition (e.g., amplification of MET or HER2 in NSCLCtreated with EGFR inhibitors; and crosstalk between estrogen receptor and HER2 pathwaysin breast cancer) [56,57,59].
A further critical goal of precision oncology is to identify optimal drug combinationsthat can increase therapeutic efficacy and overcome drug resistance. The dual targetingof a receptor with two drugs acting with different mechanisms (e.g., trastuzumab incombination with pertuzumab or lapatinib as anti-HER2 drugs) has led to improved efficacyin RCTs [60,61]. The same occurred with the combination of two drugs acting on differentmolecules along the same pathway, e.g., a BRAF inhibitor and a MEK inhibitor [62–64].
The complexity of intracellular signaling networks and cell-cell interactions amongthe various systems in the tumor microenvironment makes it particularly challenging toidentify the interactions responsible for drug resistance and design strategies to overcomeit. The various aspects considered above suggest that a systems approach is essential inprecision oncology.
3. Systems Biology
Systems biology studies the collective behavior of different types of molecules in-volved in a biological process, aiming to reconstruct the system behavior. Systems of manydifferent molecules have behaviors that cannot be simply deduced from the properties oftheir constitutive elements, requiring a higher level of analysis to be understood, pertainingto systems theory [65–67]. Biological entities are dynamical systems that evolve in spaceand time. A snapshot of the system at a certain time point, showing the spatial dispositionand the concentrations and activities of molecules, is called a state. As intrinsic noiseand environmental perturbations inevitably occur over time, the system evolves passingthrough different states. The sequence of the states, describing the evolution of the system,can be represented graphically as a trajectory in the so-called state space. The aim ofsystems analysis is to describe the evolution of the system, e.g., following the occurrence ofmutation or a drug treatment. Knowing the state of the system at a certain initial time, thisanalysis aims to predict the state of the system at a future time and the contributions ofdifferent constituents into the control of system evolution.
Biological systems have usually a network configuration, resulting from the interactionof smaller functional modules, also called motifs, each characterized by some specificdynamic behavior. The connections between modules quantify how a module affectsanother module and include feedback and feedforward loops [68]. The interplay of thesemodules leads to the acquisition of properties that characterize complex systems, called“emergent properties” [69].

Cancers 2021, 13, 6312 4 of 26
Dynamical systems evolve towards specific states, called attractors. These may bea fixed, steady state, but also a closed trajectory in the state space, called limit cycle,and presenting oscillating behavior. There may also be more complicated trajectories inthe state space that have completely irregular shapes, called strange attractors. Thesecharacterize chaotic dynamics, resembling a completely irregular stochastic behavior,although determined by deterministic non-linear rules [70]. A system can have morethan one attractor, e.g., two different stable steady states (a condition called bistability)and evolve toward one or the other depending on the starting state of the system. Thebehavior of a dynamical system depends on the value of parameters (such as the rateconstants of enzymatic reactions); as these vary, the behavior changes in a quantitativeor qualitative way. The condition, in which the system dynamics undergoes an abruptqualitative change, when one or more parameters cross some critical values, is called“bifurcation”. For example, a system that tended to converge towards one of two steadystates, can begin to oscillate between the two.
Cancers as Dynamical Systems
The typical emergent properties of systems are their robustness, which defines theability of a system to keep its function despite external or internal perturbations, andadaptation, referring to the ability of a system to adjust its behavior in response to envi-ronmental changes. Robustness and adaptation characterize tumors as complex systems,which almost inevitably adapt to anticancer drugs and develop resistance [71,72]. Ways toovercome resistance are among major goals and promises of precision clinical oncology.
An array of statistical and mathematical modeling techniques can be applied todescribe, with different levels of accuracy, dynamical biological processes. We will illustratesome approaches, referring the reader to recent excellent reviews for more comprehensivedescriptions [73–80].
4. Statistical Methods
Statistical models aim to find associations among variables and are commonly appliedto analyze medical and biological datasets. Supervised statistical methods deal withdifferent predefined classes of objects (e.g., responders versus non-responders) and try toidentify a set of variable values that help us discriminate among classes. Unsupervisedmethods consider the whole set of data without prior classification and aim to identifyrelevant inherent subsets in the data. Supervised methods include the different types ofregression models: linear, logistic, Cox proportional hazards regression, etc. [81]. To enablethe analysis of omics data, in which the number of variables is much larger than the numberof samples, the so-called robust regressions are commonly adopted [82]. Unsupervisedmethods include cluster analysis [83], aiming to identify relevant inherent subsets (clusters)in a dataset, and principal component analysis [84], pointing to reduce the number ofvariables (dimensionality reduction) by combining original variables into a few new,condensed variables (principal components) with minimal loss of information. Partialleast squares regression makes the same dimensionality reduction, but in a supervisedcontext [84,85].
The statistical methods applied to omics data typically yield long, ranked lists ofvariables that are significantly associated with a phenotype or response variable. A usefultool is gene set analysis [86] that considers groups of related genes, defined by theirinvolvement in a specific cellular process, function, or pathway. It then assesses theassociation of each gene set to the phenotype of interest, pointing out the processes orpathways that subtend the phenotype.
In addition to identifying tumor subtypes and differences between groups, as high-lighted in the section on precision oncology, omics studies have been used to identify genesand pathways of clinical relevance. In many patients, cancer cells develop resistance to ion-izing radiation (IR). Recently, an integrative bioinformatics analysis was applied to publiclyavailable transcriptomic datasets of human cancer cells of different tissue origins treated

Cancers 2021, 13, 6312 5 of 26
with IR [87]. Supplemented with literature data, this analysis led to the identification of apanel of interconnected genes, belonging to pathways involved in neoplastic processes andimplicated in the mechanisms of resistance to IR. Transcriptome profiles from microdis-sected cancer-associated fibroblasts and ovarian cancer cells have been analyzed with acomputational model to decipher the stroma-cancer crosstalk based on ligand-receptorinteractions and downstream signaling networks. This analysis identified Smad signalingas a poor prognostic factor in a cohort of ovarian cancer patients, while Smad inhibitionby calcitriol, found through a drug repositioning program, inhibited tumor progression inovarian tumor bearing mice [88].
A limitation of omics studies is that only a few papers report data of cell responses tosystematic perturbations, although such data appear to be the most informative datasets [89–91].Merely identifying an association between variables does not imply the existence of acausal relationship. Future analyses will require perturbation omics data, and the termperturbation biology was recently coined [92].
Machine learning is the part of artificial intelligence (AI) that uses computer algo-rithms to analyze big datasets to generate predictive models. These algorithms employstatistical tools, both supervised and unsupervised, and are capable to iteratively self-adjust to optimize the performance [93]. They require big training sets and cannot providepredictions on drugs or targets that were not included in the training set. The AI tools haverecently been discussed in several excellent reviews [93–96].
5. Network Analysis
Another tool to decipher high throughput data is constructing networks of intercon-nected molecules, followed by the network analysis [97,98]. Different types of networkrepresentation exist [99], including graphs where the variables and their interactions aresymbolized by circles, called “nodes”, and lines, called “edges”, connecting the nodes(Figure 1). The connections may involve a physical interaction or a functional linkagebetween two variables. The edges may be undirected, showing only connections betweennodes, whereas directed edges specify a direction of the relationship from a source node toa target node. In the field of proteomics, for instance, the first are used to reconstruct theoccurrences of physical binding among proteins in the so called “protein interaction net-works” or “interactomes”, and the latter to reconstruct the flow of protein phosphorylationevents in “protein signaling networks” [98]. Directed edges may be activating or inhibitory.
Network analysis aims first to define the structure or topology of a network. Topologyrefers to a set of geometrical properties (those not affected by continuous deformations) ofa network and is linked to the functional properties. Nodes are characterized by variousattributes, such as the degree, which represents the number of edges attached to a node.Based on nodes features, some network features can be defined, such as their averagedegree and their degree distribution, representing the percentages of nodes for each degree.Most biological networks show many low-degree nodes and a few high-degree nodescalled hubs. These types of networks, also called scale-free networks, are contraposed tothe so-called random networks, where the degree distribution is more concentrated arounda mean. General features of scale-free networks are their robustness against accidentalfailures due to random nodal damage, and vulnerability to targeted attacks against hubnodes [98]. However, this generic network description provides limited insights intodirectionality of signal flow, the regulation and functions calling for a dynamic quantitativenetwork description.

Cancers 2021, 13, 6312 6 of 26Cancers 2021, 13, x FOR PEER REVIEW 6 of 26
Figure 1. Interaction network of MAPK1. The network is built using the STRING database [100]. The top 20 first neighbors and top 20 second neighbors of MAPK1 (aka ERK1) are shown. The thick-ness of the edges is proportional to the confidence of the edges and the highest interaction score of 0.90 is selected to remove low-confidence connections.
A major task of systems biology is to quantify and reconstruct the dynamic connec-tions between genes, as well as proteins, which determine network responses. Biological networks can be reconstructed following a “bottom-up” (or knowledge-based) approach, whereby the selection of molecules and interactions to be included in the network is based on information extracted from the literature and public databases. Alternatively, a top-down (or data-driven) approach can be followed, reconstructing the network directly from experimental data, for example from omics studies [99].
Data-driven network analysis attempts to reconstruct intracellular networks from high throughput data, a task called the “reverse engineering” [101,102]. High throughput data are collected under different cellular states, e.g., before and after some perturbation, yielding several snapshots of the molecular profile of the cell population in different con-ditions. Then the interactions among the measured molecules are reconstructed, by as-sessing hints, such as which molecules vary synchronously or in temporal sequences. Dif-ferent tools are used to reconstruct the interactions among molecules. Some are statistical tools based on correlation or regression [103]. A typical tool are Bayesian networks [104]. The Bayes theorem allows to estimate the probability of an event A conditional to B (that is, given a certain value of the event B) starting from the probability of B conditional to A (inverse probability). Bayesian networks allow to estimate the probability of a certain set of molecular interactions from the different snapshots of molecular profiles given the ex-perimental data. The Bayesian formalism is also used to estimate parameters and derive models from experimental data [105]. Bayesian networks can combine variables of differ-ent nature, but cannot infer feedback loops [101]. Dynamic Bayesian networks represent an extension of Bayesian networks to model the temporal evolution of a dynamical sys-tem, inferred from time-course data [106,107]. By representing each variable multiple times, one for each time point considered, these models can reproduce the activation of sets of nodes and/or edges along time, including cyclic regulatory relationships such as feedbacks [107].
Figure 1. Interaction network of MAPK1. The network is built using the STRING database [100]. Thetop 20 first neighbors and top 20 second neighbors of MAPK1 (aka ERK1) are shown. The thicknessof the edges is proportional to the confidence of the edges and the highest interaction score of 0.90 isselected to remove low-confidence connections.
A major task of systems biology is to quantify and reconstruct the dynamic connec-tions between genes, as well as proteins, which determine network responses. Biologicalnetworks can be reconstructed following a “bottom-up” (or knowledge-based) approach,whereby the selection of molecules and interactions to be included in the network is basedon information extracted from the literature and public databases. Alternatively, a top-down (or data-driven) approach can be followed, reconstructing the network directly fromexperimental data, for example from omics studies [99].
Data-driven network analysis attempts to reconstruct intracellular networks fromhigh throughput data, a task called the “reverse engineering” [101,102]. High throughputdata are collected under different cellular states, e.g., before and after some perturbation,yielding several snapshots of the molecular profile of the cell population in differentconditions. Then the interactions among the measured molecules are reconstructed, byassessing hints, such as which molecules vary synchronously or in temporal sequences.Different tools are used to reconstruct the interactions among molecules. Some are statisticaltools based on correlation or regression [103]. A typical tool are Bayesian networks [104].The Bayes theorem allows to estimate the probability of an event A conditional to B (thatis, given a certain value of the event B) starting from the probability of B conditional toA (inverse probability). Bayesian networks allow to estimate the probability of a certainset of molecular interactions from the different snapshots of molecular profiles given theexperimental data. The Bayesian formalism is also used to estimate parameters and derivemodels from experimental data [105]. Bayesian networks can combine variables of differentnature, but cannot infer feedback loops [101]. Dynamic Bayesian networks represent anextension of Bayesian networks to model the temporal evolution of a dynamical system,inferred from time-course data [106,107]. By representing each variable multiple times, onefor each time point considered, these models can reproduce the activation of sets of nodesand/or edges along time, including cyclic regulatory relationships such as feedbacks [107].
Another reverse engineering approach applies concepts from information theory, suchas mutual information, a measure of relatedness, to identify sets of coregulated genes, and

Cancers 2021, 13, 6312 7 of 26
the “data processing inequality”, to eliminate indirect relationships among genes and tohighlight direct interactions. Contrary to methods based on statistical correlation, it cancapture also non-linear dependencies among nodes. Compared to Bayesian networks, thismethod proved superior in reconstructing the interactions of a synthetic genetic networkmodel, and was successfully used, for instance, to reverse engineer the regulatory networksof human B lymphocytes [108]. From networks, it is possible to identify “master regulators”,key molecules affecting specific disease-related phenotypes [109].
Reverse engineering can also be tackled by dynamical system-based approaches, suchas modular response analysis (MRA), which addresses this task by dividing a global signal-ing network into several smaller functional units or modules and focusing on intermodularinteractions. MRA quantifies network connections in terms of a response of a single moduleto a perturbation of another module that directly affect that module, assuming that allother modules are fixed to prevent the propagation of this perturbation through the entirenetwork. By making perturbations to each module and measuring the global networkresponses, it is possible to retrieve the connections between single modules, including feed-back loops, thereby quantitatively reconstructing the interaction map, including feedbackloops [110,111]. A recent benchmarking of reverse engineering methods found that MRAperformance surpassed correlation and mutual information-based methods [112]. MRAcan be combined with a Bayesian variable selection algorithm to account for biologicalnoise and measurement errors. When used to infer the ERBB and G1/S transition pathwaysin breast cancer cell lines, it successfully identified many known pathway interactions aswell as feedback interactions promoting trastuzumab resistance [113]. This Bayesian imple-mentation of MRA (termed BMRA) has been further developed to improve the inferenceprecision [114]. In contrast with classic Bayesian network methods, BMRA reconstructsthe normalized Jacobian (the matrix of all first-order partial derivatives) of a dynamicalsystem, commonly described by ordinary differential equations (ODEs). Therefore, BMRAallows to build a mechanistic, dynamic ODE model based on the inferred quantitativetopology of a network. BMRA can reconstruct the network circuitry using much smallerdatasets than Bayesian network methods, because the BMRA likelihood function is basedon the deterministic equations of MRA. In addition, BMRA requires fewer perturbationsthan deterministic MRA, is tolerant to noise, and allows to incorporate existing pathwayknowledge as a prior network to improve the inference precision [115]. Even when thisknowledge is inaccurate for half of the network edges, BMRA recovers a nearly perfectnetwork topology as validated in independent experiments [114]. Based on BMRA recon-struction of EGFR and insulin-like growth factor 1 receptor (IGF1R) pathways, ODE modelswere built for six different colorectal cancer cell lines [114]. These models highlighted cellline specific network rewiring and identified a negative feedback from p70S6K to insulinreceptor substrate 1 (IRS1) as responsible of resistance to EGFR inhibition in some cell lines.Model simulations suggested that disrupting this feedback may restore sensitivity to EGFRinhibitors, a prediction that has been experimentally validated in cell cultures and in azebrafish xenograft model [114].
6. Logic Models
Logic models represent the interaction between two molecules in a system as a logicalstatement, spanning among three levels of accuracy: binary (Boolean) logic, multi-state,and fuzzy logic [78,99,116]. In Boolean logic, each variable (molecular species) can be inone of two possible states (true or false, on or off, 1 or 0). A Boolean network is formed by aset of Boolean variables, representing the nodes of the network, and the connections amongvariables are defined by Boolean functions. The latter are represented, in the so-called“truth tables”, by couples of attributes, specifying the states of the two variables. Anactivating signal may be represented as 1/1, meaning that when the first node is activated(1, on), also the second becomes activated. An inhibitory signal may be represented as1/0, meaning that when the first node is activated, the second is inhibited (0, off). Logicmodeling does not require knowledge of the detailed mechanistic relationship between

Cancers 2021, 13, 6312 8 of 26
nodes, but simply represents the direction and the type (e.g., activating or inhibitory)of relationship. By combining more couples of attributes, it is possible to specify thelogic operators AND (when two activated upstream nodes are needed to activate thedownstream node), OR (when the activation of any of two upstream nodes is sufficientto activate the downstream node), and other logical gates [117]. The state of a variabletherefore depends on the combination of the logical relationships in which it is involved.This modeling approach, despite its oversimplification, can reproduce the functioning ofbiological networks. Increased accurateness, at the expense of computational cost andcomplexity, can be acquired by considering multi-state discrete models, which specifyadditional discrete levels between 0 and 1 (corresponding, for instance, to no, low, and highactivity of a molecule), and by fuzzy logic models, which consider the infinite spectrum ofreal numbers between 0 and 1 as possible truth values of a variable. Although logic modelsmainly yield qualitative results, they can reproduce the evolution of a system, highlightingthe attractors toward which the system tends to evolve. They are suitable to predict theeffects of perturbations, such as mutations or exposure to drugs, on a system’s behavior.
Logic models were used to analyze the immediate-early responses of human hepato-cellular carcinoma cells to seven cytokines and growth factors, in presence or absence ofseven small-molecule kinase inhibitors [118]. Starting from a literature-derived network of82 proteins mediating this response, they measured the abundance and phosphorylationstate of 16 molecules, before and 30 min after the exposure to each cytokine or growth factor,with or without an inhibitor. After reducing this system into a “compressed” network with31 nodes and 53 edges, the authors considered all the possible Boolean models, selectingthe model with the least possible number of variables, which more closely simulated theexperimental data. The final model turned out to include considerably fewer connectionsthan the “compressed” network, dismissing the connections not relevant in that cellularcontext. It also added a few connections, not present in the original network, that increasedmodel data fitting, and that turned out to have literature support. To validate the model,hepatocellular carcinoma cells were exposed to a combination of two cytokines or growthfactors, in the presence or absence of one of four kinase inhibitors. The model fitted thisvalidation set of data nearly as well as the training set from the previous experiment,showing a good predictive power in terms of false-negative and false-positive results.Nevertheless, logic network modeling has several limitations. The exponential increasein the number of states with the number of logical network nodes makes the number ofattractors computationally intractable and hinder biological interpretation of computednetwork responses [119].
7. Mechanistic Models
Mechanistic models that are based on systems of differential equations require a moredetailed knowledge of the molecule structures and biochemical reactions involved. Build-ing a mathematical model of a biological process requires (i) establishing which moleculesand interactions to consider, (ii) choosing mathematical expressions to describe each inter-action, (iii) finding suitable values for the parameters involved, and then (iv) solving theequations to simulate the behavior of the system, thereby making predictions about systemresponses to a perturbation of one or more components [65,99,120–122].
The simplest form of differential equations are ODEs. These models use the mean fieldapproximation and can accurately describe the time evolution of a biochemical systems ifthe number of molecules of each species is large enough [123]. ODEs relate a function (orseveral functions) with its (their) derivative. The concentration or activity of a molecule is afunction of time, and its derivative represents the rate of change of this concentration. ODEsare therefore particularly suitable to study the dynamics of a biological system, describingits evolution over time. Modeling such systems with ODEs, typically involves consideringall the processes that modify the level or activity of each relevant molecule, such as synthesisand degradation, import, and export from a cell or compartment, activation or inhibition(e.g., by phosphorylation or dephosphorylation), binding or dissociation, while taking

Cancers 2021, 13, 6312 9 of 26
into account the stoichiometries (the quantitative relationships among the substances thatparticipate in a chemical reaction) of each reaction. These processes are characterized byrate parameters, such as kinetic constants, appearing in the ODEs, and whose values mustbe measured or estimated experimentally. Solutions to ODEs are functions of time, whichare therefore represented not as single values, but as plots on Cartesian axes, depicting theevolution of the state of the system over time. Beyond depending on the values attributed tothe parameters of the model, the solutions depend also on the so-called “initial conditions”,such as the initial concentrations.
The biochemical reactions can be modeled according to the laws of chemical kinet-ics [120,124]. The most basic reactions, called also elementary reactions, follow the law ofmass action, whereby the rate of the reaction is proportional to the concentrations of thereagents. This reaction rate is equal to the rate constant multiplied by the product of theconcentration of the reactants (with possible exponents depending on the stoichiometry andorder of the reaction). From the elementary reactions, the kinetic laws of more complicatedreactions can be derived, such as the Michaelis-Menten enzyme kinetics, which assumes aquasi-steady state, or rapid equilibrium of the enzyme-substrate complex [125]. When thebiochemical kinetics of reactions involved are not known in detail, the relationship betweentwo interacting molecules can be approximated by means of generic functions, such as theHill function, commonly used to model the receptor activity as a function of the ligand ordrug concentration. This is a sigmoidal function, one of whose parameters, called the Hillcoefficient, is responsible for the steepness of the curve. If the Hill coefficient is 1, there isthe Michaelis-Menten relationship between the ligand concentration and the activity ofthe receptor, whereas for increasing values of the Hill coefficient, the curve becomes morestep-like, simulating the existence of a threshold.
If the assumption of high molecule numbers (more than 1000) are not fulfilled, stochas-tic models must be used, such as the chemical master equations (CME), which, insteadof considering only numerical values of variables, consider a probability distribution foreach variable [126–129]. These models, based on stochastic differential equations, allow totake into account stochasticity and heterogeneity inherent into biological processes andrandom errors in their measurements, at the cost of the increase in computational effort.While analytical solutions can be found only for very simple CMEs, these can be solved bycommon numerical methods. More frequently, as CMEs represent probability distributions,they are analyzed by the so-called stochastic simulation algorithms (SSAs), such as theGillespie algorithm and several of its approximations [130,131].
A precise modeling of chemical reactions requires to represent each different state ofany single molecule (e.g., unphosphorylated, or phosphorylated at one site, or at two sites,etc., or unbound, or bound to one or more molecules in a complex, etc.) as an individualvariable. This leads to an exponential increase in the number of variables, and of thecorresponding ODEs, involved in each reaction, to account for all possible combinations ofmolecular states and relationships. To overcome this combinatorial explosion of variables,the approach of rule-based modeling has been developed. Each rule determines a set ofchemical reactions, whose rates depend on the conformational, phosphorylation and spatiallocalization states of molecules [132]. These rules are directly transformed into systems ofODEs by specific software packages, such as BioNetGen [133,134]. Models that are built inBioNetGen can be integrated by the Network-Free Stochastic Simulator (NFsim) [135,136].NFsim can use the Gillespie SSA and consider noise, intrinsically present in biologicalsystems, for instance, in transcription factor networks [78].
8. Emerging Network Properties Captured by Differential Equation Models
Differential equations are widely used to model complex biological networks thatmediate responses to intracellular and extracellular inputs, activating cellular functions,such as proliferation, differentiation, senescence, and apoptosis [122,137]. The derange-ment of these networks, due to genetic or epigenetic alterations, is at the basis of cancerdevelopment and progression [8,9,138]. Cellular receptors share a common downstream

Cancers 2021, 13, 6312 10 of 26
network, and the specificity of the output depends not only on the ligand-receptor pair,but also on subtle differences in the temporal and spatial dynamics of signal transductionthroughout the network, including different signal features, such as amplitude, duration,frequency and spatial distribution [67]. For instance, epidermal growth factor induces atransient extracellular signal-regulated kinase (ERK) activation in MCF-7 breast cancercells, eliciting proliferation, whereas heregulin induces sustained ERK activation causingdifferentiation [139].
Signal transduction in most cellular networks occurs via cascades of protein(de)phosphorylation cycles (Figure 2A). A typical cycling motif is formed by two ormore states of a protein, phosphorylated and dephosphorylated, which are controlledby opposing enzymes, a protein kinase and a phosphatase (Figure 2B,C). Even mono-phosphorylation cycles show peculiar behaviors, such as ultrasensitivity, whereby, whenthe converting enzymes operate near saturation, the response to an input becomes abrupt,and is represented by an extremely steep sigmoidal curve, instead of the more commonhyperbolic curve describing enzyme kinetics [140]. Ultrasensitivity increases as the num-ber of interconnected cycles in a signaling cascade increases [68], and is further potenti-ated in multi-site phosphorylated proteins (Figure 2C), which can produce switch-likeresponses [141].
Cancers 2021, 13, x FOR PEER REVIEW 10 of 26
8. Emerging Network Properties Captured by Differential Equation Models Differential equations are widely used to model complex biological networks that
mediate responses to intracellular and extracellular inputs, activating cellular functions, such as proliferation, differentiation, senescence, and apoptosis [122,137]. The derange-ment of these networks, due to genetic or epigenetic alterations, is at the basis of cancer development and progression [8,9,138]. Cellular receptors share a common downstream network, and the specificity of the output depends not only on the ligand-receptor pair, but also on subtle differences in the temporal and spatial dynamics of signal transduction throughout the network, including different signal features, such as amplitude, duration, frequency and spatial distribution [67]. For instance, epidermal growth factor induces a transient extracellular signal-regulated kinase (ERK) activation in MCF-7 breast cancer cells, eliciting proliferation, whereas heregulin induces sustained ERK activation causing differentiation [139].
Signal transduction in most cellular networks occurs via cascades of protein (de)phosphorylation cycles (Figure 2A). A typical cycling motif is formed by two or more states of a protein, phosphorylated and dephosphorylated, which are controlled by op-posing enzymes, a protein kinase and a phosphatase (Figure 2B,C). Even mono-phosphor-ylation cycles show peculiar behaviors, such as ultrasensitivity, whereby, when the con-verting enzymes operate near saturation, the response to an input becomes abrupt, and is represented by an extremely steep sigmoidal curve, instead of the more common hyper-bolic curve describing enzyme kinetics [140]. Ultrasensitivity increases as the number of interconnected cycles in a signaling cascade increases [68], and is further potentiated in multi-site phosphorylated proteins (Figure 2C), which can produce switch-like responses [141].
Figure 2. A cascade of protein (de)phosphorylation cycles. (A) The 3-tier cascade has a similar struc-ture to MAPK cascades (KKK/KK/K). The phosphorylation of two sites is necessary for full activa-tion of the kinases KK and K. Feedback loop is shown by a dashed line. (B,C) Typical cascade motifs are mono- and double (de)phosphorylation cycles.
Another fundamental feature of networks are feedback loops. Positive feedbacks am-plify the signal, whereas negative feedbacks attenuate it, facilitating system’s adaptation and robustness to noise [142]. However, feedbacks can also favor the occurrence of insta-bilities, leading to a radical change in the state of the system. Too strong, long negative feedbacks induce damped or sustained oscillations, usually with a sinusoidal shape [143] (Figure 3A). Positive feedbacks can cause bistability and hysteresis, where the threshold
Figure 2. A cascade of protein (de)phosphorylation cycles. (A) The 3-tier cascade has a similarstructure to MAPK cascades (KKK/KK/K). The phosphorylation of two sites is necessary for fullactivation of the kinases KK and K. Feedback loop is shown by a dashed line. (B,C) Typical cascademotifs are mono- and double (de)phosphorylation cycles.
Another fundamental feature of networks are feedback loops. Positive feedbacksamplify the signal, whereas negative feedbacks attenuate it, facilitating system’s adapta-tion and robustness to noise [142]. However, feedbacks can also favor the occurrence ofinstabilities, leading to a radical change in the state of the system. Too strong, long negativefeedbacks induce damped or sustained oscillations, usually with a sinusoidal shape [143](Figure 3A). Positive feedbacks can cause bistability and hysteresis, where the thresholdfor jumping from one steady state to the other differs depending on the direction of changeof an external signal or parameter (Figure 3B). Hysteresis has been found in experimentson cell cycle control in Xenopus oocytes. Progressively adding cyclin leads to gradualactivation of cyclin-dependent kinase 1 (CDK1), until when, beyond a certain threshold(Chigh), activation of CDK1 jumps to remarkably higher levels. When cyclin levels areprogressively reduced, CDK1 activation diminishes gradually, but only when cyclin levelsdiminish below a threshold Clow, much lower than Chigh, does CDK1 activation drop to its

Cancers 2021, 13, 6312 11 of 26
original level [144,145]. Therefore, hysteresis prevents the easy reversal of a system state,committing to its sustainability. Positive feedbacks occurring in combination with negativefeedbacks can give rise to sustained oscillations, called relaxation oscillations, typicallyobserved in cell cycle regulation. They are characterized by a pulsatory shape, producingalternating “off” and “on” states of the system. The presence of bistability/hysteresis andrelaxation oscillations driving cell cycle had been suggested by mathematical models ofthe cell cycle long before being experimentally observed [146].
Figure 3. Oscillations and hysteresis brought about by negative and positive feedback loops. (A) Typical sinusoidal shapesof oscillations caused by strong negative feedback. (B) Hysteresis, a hallmark of bistability, is often triggered by positivefeedback. When the input signal increases over the threshold (T1), the output pathway activity, which initially graduallyincreased with the input signal, abruptly jumps to a much greater value and then again gradually increases with the furthersignal increase (the direction of the changes is shown by dashed brown arrows). Following this jump to the higher activitystate, the output activity remains high with the decrease in the input signal, and only when this signal reduces to the value(T2) that is much smaller than T1, the output activity returns to the low activity state (dashed green arrows).
Under some conditions, hysteresis gives way to an irreversible switch to one of thetwo steady states, marking the commitment to a cellular fate, thus converting a transientstimulus in an irreversible response. Maturation of oocytes in Xenopus, in response toa short exposure to progesterone, is determined by positive feedbacks within the p42mitogen-activated protein kinase (MAPK)/cell-division cycle protein kinase Cdc2 path-way [147]. Hysteresis and irreversible switches allow the control of multiple irreversibletransitions in cellular processes, such as those occurring at cell cycle checkpoints. Usingsingle cell analyses and mathematical modeling, it has been shown, for instance, that theRetinoblastoma-E2F pathway functions as a bistable switch, converting graded mitogenicstimuli into an all-or-none proliferative response [148].
Whereas ODE models precisely describe the time evolution of the mean concentrationand activity values, external and internal noise intrinsic, for instance, for transcription canchange the systems dynamics [149,150]. If a dynamical system state is in the vicinity ofthe border between two basins of attraction, noise can flip the system to a new attractor,for instance, to a new steady state of a multi-stable system. In this case, fluctuations areno longer small corrections to the time evolution of the mean values, but a key eventthat causes switching of cell states. The introduction of stochastic terms into equationsdescribing the behavior of multi-stable systems has led to a quantitative interpretation of

Cancers 2021, 13, 6312 12 of 26
Waddington’s epigenetic landscape in terms of nonlinear stochastic dynamics [151,152].The original and now prominent Waddington’s model viewed cells moving through alandscape of mountains and valleys as rolling marbles from one state to another. In recentstochastic approaches, Waddington’s landscape is treated as a landscape of the probabilitiesfor the system states in the presence of noise, while the local minima of this landscape arethe steady states determined by ODEs. This view allows determining the rate of transitionsbetween different basins of attraction, that is, different cell states, based on the circuitry ofthe network governing cell fate decision [153,154].
9. Modeling Spatiotemporal Network Behavior by Partial Differential Equations
The use of ODE models requires the fulfillment of the assumptions that the moleculesare evenly distributed in the modeled compartment, and this condition is not fulfilled formolecules bound to membranes or molecular scaffolds. Often, opposing enzymes, suchas a kinase and phosphatase in signal transduction cascades, are localized to differentcellular compartments (e.g., a kinase resides at the cell membrane, whereas a phosphataseis homogeneously distributed in the cytosol). This results in the emergence of gradientsof phosphorylated and unphosphorylated forms of the protein substrate [155]. Becausein this and similar cases, the variables (concentrations) depend not only on time, but alsoon the spatial coordinates, describing the rate of change of these concentrations requiresso called “partial differential equations” (PDEs), introducing a further level of complexity.PDEs describe the spatiotemporal behavior of species and are derived by coupling the ODEdynamics with species diffusion and membrane transport [156]. Recently, the minimalautonomous biochemical machinery of RhoA GTPase necessary and sufficient to governcell movement was established using experiments and PDE modeling [157]. Ras homologfamily member A (RhoA) controls the contractility at the cell rear, whereas Ras-relatedC3 botulinum toxin substrate 1 (Rac1) controls protrusions and retractions at the leadingedge [158,159]. In the cell rear and body, RhoA and Rac1 mutually inhibit each other, butat the leading edge of a migrating cell, RhoA activates Rac1 via the effector, diaphanous-related formin-1 (DIA1) [160]. In the ODE model, this combination of negative and positivefeedforward and feedback loops lead to bistability and oscillations but coupled withspecies diffusion in the PDE model these dynamics result in periodic, propagating wavesof RhoA and Rac1 activities that control cell migration [157]. When a periodic wave thatstarts at the leading edge reaches the cell rear, it induces transient RhoA-Rac1 oscillations,RhoA activity spikes and retraction of the rear. After the rear retracts, the initial GTPasenetwork dynamic pattern resumes. These PDE model predictions were fully confirmedby live cell imaging. Thus, PDE modeling, combined with experiments, suggested a newconcept in cell migration research by showing that distinct GTPase dynamics at the cellleading and trailing edges reported previously are coordinated by periodic, propagatingRhoA-Rac1 waves.
10. Mechanistic Models Help Us Understand Resistance to Targeted Therapies
Cellular network adaptations are involved in the development of resistance to targetedtherapies. Resistance occurs due to reactivation of the same signaling pathway or the activa-tion of alternative pathways. To better understand resistance, signaling networks, includingreceptor tyrosine kinases and their downstream MAPK and PI3K/AKT/mTOR pathwaysthat are often associated with resistance, have been intensively modeled [67,161–164].
A classic example is resistance to BRAF inhibitors in patients with melanoma, charac-terized by the paradoxical activation of the MAPK pathway due to increased formationof RAF homo- and hetero-dimers, particularly BRAF-CRAF heterodimers [165,166]. RAFdimerization is a key step in the physiological activation of RAF kinases, dramaticallyincreasing their catalytic activity [167]. It is induced by binding of RAF kinases to RAS, butis also increased by treatments with RAF inhibitors, which induce conformational changesin RAF molecules leading to increased dimerization affinity. If only one RAF protomeris inhibited in a RAF-dimer, the inhibited protomer allosterically activates the other RAF

Cancers 2021, 13, 6312 13 of 26
protomer. A quantitative model suggests that upon RAF dimerization, for thermodynamicreasons, the affinity of a BRAF inhibitor for one of the RAF protomers increases, but theaffinity for the other protomer sharply decreases. This favors the formation of RAF dimerswhere only one protomer is bound to the inhibitor, with consequent allosteric activation ofthe inhibitor-free protomer and sustained MAPK signaling activity [168].
ATP-competitive inhibitors can be classified into type I, I 12 , and II based on their
preferential binding for one of the kinase conformations. The same model suggests thata combination of two structurally different inhibitors, binding to different RAF confor-mations, can overcome resistance, also when the two inhibitors are ineffective on theirown, and even if given at doses lower than those used in monotherapy. To confirmthis prediction, a more comprehensive mechanistic, rule-based ERK pathway model hasbeen developed, which integrates the structural, thermodynamic, and kinetic analyses ofRAF (BRAF and CRAF) kinases-RAF inhibitors interactions, their interactions with othermolecules of the pathway (RAS, MEK, and ERK), as well as cellular genetic profiles (RASand RAF mutation status) [132]. The model’s predictions were compared with experimen-tal interventions on melanoma cell lines. The model faithfully predicted RAF inhibitorresponses in BRAF-mutant, RAS wild-type cells, as well as in RAS-mutant cell lines, con-firming the effectiveness of a combination of two structurally different RAF inhibitors, suchas vemurafenib plus sorafenib, in inhibiting ERK signaling, cell proliferation and colonyformation, even in RAS-mutant cell lines. This paradoxical pathway activation can befacilitated by negative feedback loops, when the alleviation of the feedback induced by akinase inhibitor leads to further increase in kinase dimerization [169]. The model allows toestimate the levels of synergy or antagonism between RAF inhibitors and MEK inhibitors,based on the type of RAF inhibitor and the level of RAS activity. In cells with low RASactivity, such as wild-type RAS, BRAFV600E melanoma cells, there is synergy betweentype I 1
2 RAF inhibitors (e.g., dabrafenib or encorafenib) and MEK inhibitors (trametinib orbinimetinib). On the contrary, in cells with high RAS activity, such as those with mutantRAS, this combination may turn antagonistic at low drug concentrations, or even at highdrug concentrations for vemurafenib, that has a wide dose range of paradoxical activation.Type II RAF inhibitors, such as TAK632, have a narrower range of paradoxical activation,but antagonism with MEK inhibitors is still present at low inhibitor doses and higher dosesare required for synergy. A combination of types I 1
2 and II RAF inhibitors reduces thedose ranges of paradoxical activation, yielding synergy over a wider dose range than acombination of RAF and MEK inhibitors in RAS-mutant cells. Experiments conductedon RAS-mutant melanoma and acute myeloid leukemia cell lines support these modelpredictions [169].
Negative feedbacks have been held responsible for the development of acquired resis-tance to many targeted drugs [170–175]. This hypothesis was addressed by a systematicanalysis of network adaptation mechanisms as a cause of drug resistance [169]. The unbi-ased analysis and mechanistic modeling demonstrated that feedback loops, by themselves,could not completely reactivate steady state signaling. Following drug inhibition, negativefeedbacks, mediated by either post-translational modifications or de novo synthesized nega-tive regulators, can lead to a transient reactivation or overshoot, but cannot fully restoreoutput signaling (Figure 4A,B). Only partial reactivation, proportional to the strength ofthe feedback, can be brought about by a negative feedback loop, but a complete signalingreactivation can never occur [169].
Cancers 2021, 13, 6312 14 of 26Cancers 2021, 13, x FOR PEER REVIEW 14 of 26
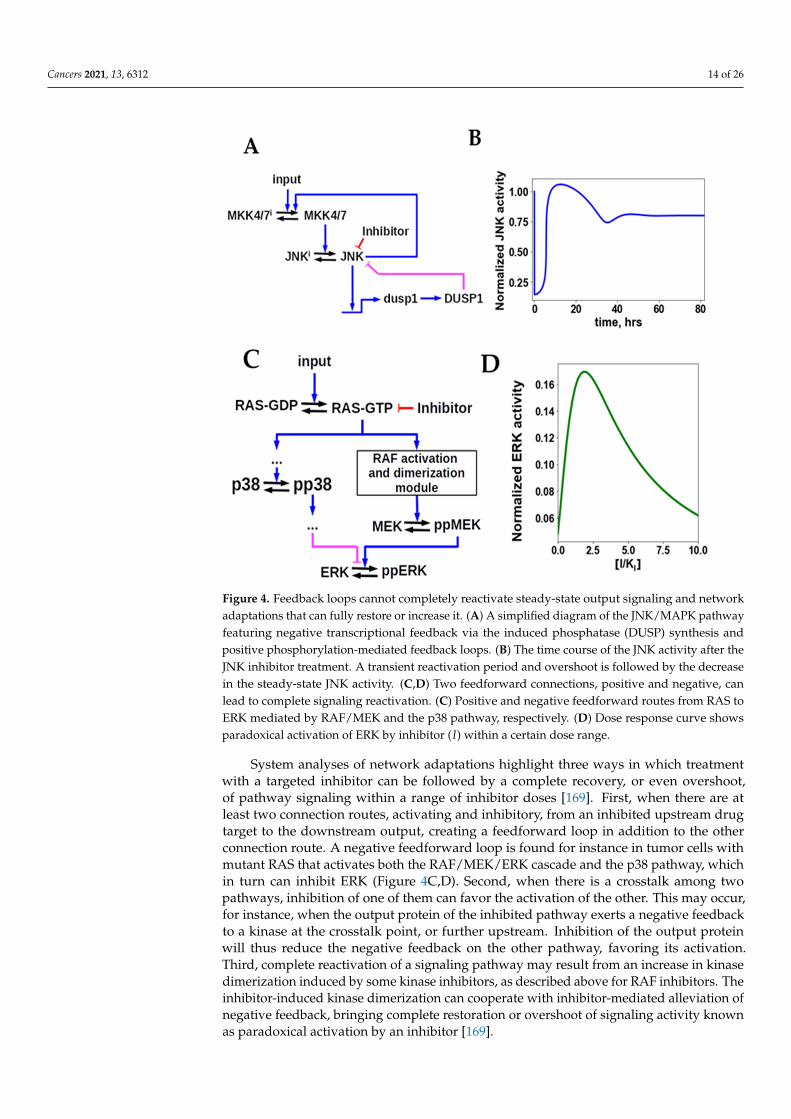
Figure 4. Feedback loops cannot completely reactivate steady-state output signaling and network adaptations that can fully restore or increase it. (A) A simplified diagram of the JNK/MAPK path-way featuring negative transcriptional feedback via the induced phosphatase (DUSP) synthesis and positive phosphorylation-mediated feedback loops. (B) The time course of the JNK activity after the JNK inhibitor treatment. A transient reactivation period and overshoot is followed by the decrease in the steady-state JNK activity. (C,D) Two feedforward connections, positive and negative, can lead to complete signaling reactivation. (C) Positive and negative feedforward routes from RAS to ERK mediated by RAF/MEK and the p38 pathway, respectively. (D) Dose response curve shows para-doxical activation of ERK by inhibitor (𝐼) within a certain dose range.
System analyses of network adaptations highlight three ways in which treatment with a targeted inhibitor can be followed by a complete recovery, or even overshoot, of pathway signaling within a range of inhibitor doses [169]. First, when there are at least two connection routes, activating and inhibitory, from an inhibited upstream drug target to the downstream output, creating a feedforward loop in addition to the other connection route. A negative feedforward loop is found for instance in tumor cells with mutant RAS that activates both the RAF/MEK/ERK cascade and the p38 pathway, which in turn can inhibit ERK (Figure 4C,D). Second, when there is a crosstalk among two pathways, inhi-bition of one of them can favor the activation of the other. This may occur, for instance, when the output protein of the inhibited pathway exerts a negative feedback to a kinase at the crosstalk point, or further upstream. Inhibition of the output protein will thus re-duce the negative feedback on the other pathway, favoring its activation. Third, complete reactivation of a signaling pathway may result from an increase in kinase dimerization induced by some kinase inhibitors, as described above for RAF inhibitors. The inhibitor-induced kinase dimerization can cooperate with inhibitor-mediated alleviation of nega-tive feedback, bringing complete restoration or overshoot of signaling activity known as paradoxical activation by an inhibitor [169].
Figure 4. Feedback loops cannot completely reactivate steady-state output signaling and networkadaptations that can fully restore or increase it. (A) A simplified diagram of the JNK/MAPK pathwayfeaturing negative transcriptional feedback via the induced phosphatase (DUSP) synthesis andpositive phosphorylation-mediated feedback loops. (B) The time course of the JNK activity after theJNK inhibitor treatment. A transient reactivation period and overshoot is followed by the decreasein the steady-state JNK activity. (C,D) Two feedforward connections, positive and negative, canlead to complete signaling reactivation. (C) Positive and negative feedforward routes from RAS toERK mediated by RAF/MEK and the p38 pathway, respectively. (D) Dose response curve showsparadoxical activation of ERK by inhibitor (I) within a certain dose range.
System analyses of network adaptations highlight three ways in which treatmentwith a targeted inhibitor can be followed by a complete recovery, or even overshoot,of pathway signaling within a range of inhibitor doses [169]. First, when there are atleast two connection routes, activating and inhibitory, from an inhibited upstream drugtarget to the downstream output, creating a feedforward loop in addition to the otherconnection route. A negative feedforward loop is found for instance in tumor cells withmutant RAS that activates both the RAF/MEK/ERK cascade and the p38 pathway, whichin turn can inhibit ERK (Figure 4C,D). Second, when there is a crosstalk among twopathways, inhibition of one of them can favor the activation of the other. This may occur,for instance, when the output protein of the inhibited pathway exerts a negative feedbackto a kinase at the crosstalk point, or further upstream. Inhibition of the output proteinwill thus reduce the negative feedback on the other pathway, favoring its activation.Third, complete reactivation of a signaling pathway may result from an increase in kinasedimerization induced by some kinase inhibitors, as described above for RAF inhibitors. Theinhibitor-induced kinase dimerization can cooperate with inhibitor-mediated alleviation ofnegative feedback, bringing complete restoration or overshoot of signaling activity knownas paradoxical activation by an inhibitor [169].

Cancers 2021, 13, 6312 15 of 26
11. Signaling Network Models Can Predict Drug Sensitivity
Modeling the dynamics of signaling pathways to drug perturbations can predict celltype-specific responses to small-molecule therapeutics and prioritize primary drug targetsand their combinations. Cell type-specific dynamic logic models of signaling networkswere built for 14 colorectal cancer cell lines based on a large-scale signaling perturbationscreening, encompassing 43 different perturbations that included 5 ligands that stimulatedifferent receptors and 7 small-molecule kinase inhibitors [176]. Simulated signaling dy-namics correlated with some drug sensitivities. A drug combination predicted to overcomeresistance to MEK inhibitors by co-blockade of GSK3 was validated experimentally, therebysuggesting an advantage of simulating the dynamic signaling responses to drugs overstatic genotype data.
A dynamic model of the estrogen (E) receptor (ER)-induced proliferation of MCF-7breast cancer cells was built to predict responses to endocrine therapy [177]. This ODEmodel described the ER binding of its ligand E2, the facilitation of ER degradation byfulvestrant, the main interactions of ER signaling, the cell cycle machinery, including thetranscription factor c-Myc, and cell proliferation as functions of retinoblastoma 1 (RB1)phosphorylation and the current number of cells. Experimental data on the abundance ofkey proteins, proliferation, and endocrine therapy treatments over a 7-day course wereused for model calibration. Although oversimplified, this model was able to predict theresponses to the combination treatment of E2 deprivation (endocrine therapy) and thedrug Palbociclib that inhibited Cdk4/6 kinase [177]. Another ODE model described thetransitions among different estrogen sensitivity phenotypes in breast cancer, known as sen-sitive, hypersensitive, and independent, aimed at optimizing sequential and intermittentendocrine treatments [178].
Immune checkpoint inhibitors (ICIs) greatly enhanced cancer treatment, yet manypatients are intrinsically resistant to anti-programed cell death protein 1 (anti-PD1) and anti-cytotoxic T-lymphocyte-associated protein 4 (anti-CTLA4) therapies or they become resis-tant after initial response. A logic network model encompassing not only PD1 and CTLA4immune checkpoints, but also three other inhibiting checkpoints (T-cell immunoglobulinand immunoreceptor tyrosine-based inhibition motif (TIGIT), lymphocyte activation gene3 (LAG3), and T-cell immunoglobulin and mucin domain-containing protein 3 (TIM3))and three activating checkpoints (inducible T-cell costimulatory (ICOS), cluster of differen-tiation 226 (CD226), and tumor necrosis factor receptors (TNFRs)) were built to exploreefficient combinations of ICIs that can increase the sensitivity to immunotherapy [179].First, this dynamic logic model recapitulated results of existing experimental studies ofanti-PD1 and anti-CTLA4 therapies on T-cell activation. Then, the model suggested ICIscombinations predicted to be efficient with TIGIT as the most promising drug target. Futureexperimental immune checkpoint treatments may use results of dynamic models as theinitial guide.
12. Patient-Specific Network Modeling
Models can be used to carry out patient-specific network simulations and to constructpatient-specific dynamic biomarkers.
Pioneering studies exploiting the systems-level models of apoptosis to predict thepatient responses to chemotherapy were reported during the last decade. An ODEs-based model of the intrinsic apoptotic pathway, mediating the apoptotic effects of somechemotherapeutic agents, was shown to accurately predict the induction of apoptoticcell death based on the concentrations of the five key proteins pro-caspases 3 and 9, sec-ond mitochondria-derived activator of caspases (SMAC), apoptotic protease-activatingfactor 1 (APAF-1), and X-linked-inhibitor-of-apoptosis protein (XIAP) in HeLa tumorcells [180]. Patient-specific models of apoptosis execution, based on the concentrationsof these molecules determined in samples of stage II and III colorectal tumors, showeda trend towards impaired apoptosis execution with advanced disease stage and corre-lated with disease relapse after adjuvant chemotherapy. They were the only significant

Cancers 2021, 13, 6312 16 of 26
predictor of patient outcome at multivariate analysis and outperformed predictors basedon statistical analyses of apoptotic molecules [181]. Another computational model of theintrinsic apoptotic pathway, integrating data on the interaction of pro- and antiapoptoticBCL2 proteins, allowed to predict the sensitivity of colorectal cancer cell lines and tumorsamples to chemotherapy [182]. Apoptotic models might be harnessed to select the betterchemotherapeutic agent for each single tumor, based on the mechanisms of induction ofapoptosis, or to predict the efficacy of targeted pro-apoptotic molecules [183]. Althoughthis pioneering work led to remarkable advances in our understanding of chemoresis-tance resulting from the inability to elicit apoptosis, these models were limited to themitochondria-dependent execution of apoptosis, whereas a number of major signalingpathways are frequently altered in cancer.
Logical models can be tailored to individual patient tumor samples by incorporatingmutation, copy number variation, and expression data into the changes of the network nodeactivities and state transition rates [184]. Stochastic simulations using a Monte Carlo kineticalgorithm have been used to compute the state probabilities. The resulting predictions ofcancer phenotypes allow to formulate a proof of principle that clinical patient stratificationcan be obtained using personalized logical models [184].
Another recent study built a knowledge-based, logic model of the intrinsic and extrin-sic apoptosis pathways, where logic states were formulated as ODEs to allow the use ofcontinuous scales [185]. A microfluidic perturbation screening platform was used to testthe apoptotic response to different drugs or drug combinations in cells collected from fourpancreatic tumor biopsies and two tumor cell lines. The model represented the activationof caspase 3 as the final effector of apoptosis, after exposure of tumor cells to 1 or 2 drugs,chosen among 10 different compounds, including 7 kinase inhibitors, 1 cytokine, and 2chemotherapeutic drugs. Dynamic models trained on data from cancer cell lines were usedto simulate the effects of perturbations, allowing to predict effective drug combinationsthat were confirmed experimentally. Patient-specific dynamic models, trained on datacollected from tumor biopsies, allowed to assess the heterogeneity of pancreatic cancers,highlighting differentially regulated signaling, especially in the PI3K-Akt pathway. Fur-ther development of similar computational models can make them suitable to determinepersonalized combinatorial treatments of cancer [186].
Other methods to define the best combination therapy according to the set of drivergenes of an individual tumor are based on structural network controllability principles,which refer to the task of controlling the transition of complex networks from one stateto another by intervening on a minimum set of nodes [187]. After applying network re-construction methods on single tumor sample data obtained from breast and lung cancerdatasets from The Cancer Genome Atlas (TCGA), a nonlinear structural network control-lability method has been shown to outperform other existing synergistic combinatorialstrategies in identifying clinical efficacious paired combinatorial drugs [188].
Individualized protein-protein interaction networks, which are developed from RNA-seq transcriptomic and genetic variants data, allow to discriminate among disease pheno-types [189].
Biochemical networks, in particular genome-wide metabolic networks, are oftenmodeled through flux balance analysis, a constraint-based computational approach for pre-dicting steady-state metabolic fluxes [190]. This approach can be integrated with metaboliteconcentrations and kinetic constants, yielding more realistic models [191–193]. Furthercombining this with multi-omics, kinetic, and thermodynamic information, personal-ized genome-scale models have been constructed, allowing to investigate the metabolicdifferences subtending different tumor phenotypes, such as resistance or sensitivity to radi-ation therapy, and to identify personalized therapeutic strategies for individual radiation-resistant patients [194].
The c-Jun N-terminal kinase (JNK) pathway is a MAPK cascade mediating apoptosisin response to different types of stress, including chemotherapeutic agents. JNK mayundergo either a gradual activation in response to growth factors, promoting cell survival

Cancers 2021, 13, 6312 17 of 26
and proliferation, or an ultrasensitive, switch-like activation in response to stress, leadingto apoptosis. The reconstruction of the JNK pathway in the SH-SY5Y neuroblastoma cellline identified a positive feedback from JNK to MKK7 as responsible for the ultrasensitiveswitch-like apoptotic response [195]. An ODEs-based model of JNK pathway was cali-brated to fit experimental data obtained from the SH-SY5Y neuroblastoma cell line. Somepredictions of the model, such as that ZAK overexpression would impair JNK activation,were experimentally confirmed, and the model was validated on different neuroblastomacell lines and with different stressors. The model can be filled with data from a patient,instead of data from a cell line, to generate a patient-specific simulation of JNK pathway.For this purpose, data from gene expression profiles (as proxy to protein abundances) froma training cohort of neuroblastoma patients were used to generate a model simulation foreach patient. The main output of the model, a curve describing the relationship betweenthe amount of stress stimulus and the level of JNK activation (phosphorylation), can becharacterized with three descriptors: maximal amplitude, activation threshold, and Hillexponent describing the ultrasensitivity of JNK response. An impaired ability to activateJNK is highlighted by high values of activation threshold and low values of maximalamplitude and Hill exponent. JNK response appeared to be increasingly impaired withincreasing stage of the disease. After defining cutoff values for the output descriptorswithin the training cohort, able to maximally discriminate between good and poor prog-nosis patients, the prognostic value of the descriptors was confirmed on two validationpatients’ cohorts, with the Hill exponent providing the greatest prognostic value. The Hillexponent was significantly associated with overall survival in both MYCN-amplified andnon-MYCN-amplified patients’ subgroups and retained its independent prognostic role inmultivariate analysis [195].
13. Conclusions
Despite major advances, cancer treatment remains an open challenge in many respects.Identifying the driver molecular alterations in a tumor is only a partial solution [4]. Al-though targeted therapies have produced outstanding results in specific tumor subtypes,treatments selected based on “agnostic” molecular alterations [24,196] produce modestresults [197–200], highlighting the need for a systemic approach [201].
Relatively “simple” tumors, such as some cases of chronic myeloid leukemia orHER2-positive breast cancer, whose growth is driven by a key molecular alteration, canexperience long-lasting remissions and likely cure with targeted treatments [202–205].They may represent a proof of principle of the possibility to obtain long-term control, oreven cure, of more complex tumors when (i) their key molecular alterations are correctlytargeted, and (ii) network adaptations causing drug resistance are prevented by properlydesignated drug combinations. Describing and analyzing the intrinsic behavior of thebiological processes that underlie tumor pathology, dynamical models will potentiallyallow to identify the key points for effective interventions with target drugs, substantiallydelaying or preventing resistance.
Patient-specific network models require the incorporation of multiple types of data,including gene expression levels and key protein activities, post-translational modifications,and mutations that encompass the major driver alterations present in a single tumor. Thesedynamic models allow to perform patient-specific simulations of drug treatments andcan help to identify the best drug or drug combination for an individual tumor. Thepersonalized drug combinations can be validated in preclinical experiments, such as cellcultures, organoids, or patient-derived xenografts, and then tested in modern clinical trials.
Clinical development would require shifting from drug-centered clinical trials topatient-centered designs [26], allowing to administer a personalized drug combinationto each patient. This could involve the use of multiple N-of-1 trials [206,207], or to adoptsuitable biomarker strategy designs or other designs for predictive biomarker valida-tion [208–212]. This may represent a future avenue for clinical and translational research.

Cancers 2021, 13, 6312 18 of 26
In summary, the techniques of systems biology allow to reconstruct the dynamicsof biological processes. The information yielded is therefore potentially superior, bothquantitatively and qualitatively, to that pertaining to single biomarkers or to panels ofbiomarkers [213]. We strongly endorse a wider application of systems biology methodsin clinical and translational research, with a joint effort between scientists and clinicians,which should be the prerogative of academic institutions and cancer research centersand groups.
Author Contributions: A.R. and B.N.K. conceived the study and wrote the manuscript. All authorshave read and agreed to the published version of the manuscript.
Funding: Supported by NIH/NCI grant R01 CA244660, EU NanoCommons grant 731032.
Acknowledgments: We thank O. Rukhlenko for thoughtful discussions.
Conflicts of Interest: AR has received fees for the participation in advisory boards from Pfizer,Novartis, and Lilly, and congress, travel, and accommodation fees from Roche. BK and coauthorsfiled a patent application (WO2019224216A1) on inhibitor combinations to inhibit kinases whoseactivation includes dimerization or oligomerization.
References1. Yusuf, S.; Collins, R.; Peto, R. Why do we need some large, simple randomized trials? Stat. Med. 1984, 3, 409–420. [CrossRef]2. Greenhalgh, T.; Howick, J.; Maskrey, N.; Brassey, J.; Burch, D.; Burton, M.; Chang, H.; Glasziou, P.; Heath, I.; Heneghan, C.; et al.
Evidence based medicine: A movement in crisis? BMJ 2014, 348, 1–7. [CrossRef] [PubMed]3. Campbell, P.J.; Getz, G.; Korbel, J.O.; Stuart, J.M.; Jennings, J.L.; Stein, L.D.; Perry, M.D.; Nahal-Bose, H.K.; Ouellette, B.F.F.;
Li, C.H.; et al. Pan-cancer analysis of whole genomes. Nature 2020, 578, 82–93. [CrossRef]4. Bailey, M.H.; Tokheim, C.; Porta-Pardo, E.; Sengupta, S.; Bertrand, D.; Weerasinghe, A.; Colaprico, A.; Wendl, M.C.; Kim, J.;
Reardon, B.; et al. Comprehensive Characterization of Cancer Driver Genes and Mutations. Cell 2018, 173, 371–385. [CrossRef]5. Tsimberidou, A.M.; Fountzilas, E.; Bleris, L.; Kurzrock, R. Transcriptomics and solid tumors: The next frontier in precision cancer
medicine. Semin. Cancer Biol. 2020. [CrossRef]6. Kolch, W.; Pitt, A. Functional proteomics to dissect tyrosine kinase signalling pathways in cancer. Nat. Rev. Cancer 2010, 10,
618–629. [CrossRef] [PubMed]7. Lee, Y.T.; Tan, Y.J.; Oon, C.E. Molecular targeted therapy: Treating cancer with specificity. Eur. J. Pharmacol. 2018, 834, 188–196.
[CrossRef]8. Hanahan, D.; Weinberg, R.A. Hallmarks of Cancer: The Next Generation. Cell 2011, 144, 646–674. [CrossRef]9. Sanchez-Vega, F.; Mina, M.; Armenia, J.; Chatila, W.K.; Luna, A.; La, K.C.; Dimitriadoy, S.; Liu, D.L.; Kantheti, H.S.;
Saghafinia, S.; et al. Oncogenic Signaling Pathways in The Cancer Genome Atlas. Cell 2018, 173, 321–337. [CrossRef] [PubMed]10. Lawrence, M.S.; Stojanov, P.; Polak, P.; Kryukov, G.V.; Cibulskis, K.; Sivachenko, A.; Carter, S.L.; Stewart, C.; Mermel, C.H.;
Roberts, S.A.; et al. Mutational heterogeneity in cancer and the search for new cancer-associated genes. Nat. Cell Biol. 2013, 499,214–218. [CrossRef] [PubMed]
11. Janiszewska, M. The microcosmos of intratumor heterogeneity: The space-time of cancer evolution. Oncogene 2020, 39, 2031–2039.[CrossRef]
12. Yates, L.; Seoane, J.; Le Tourneau, C.; Siu, L.; Marais, R.; Michiels, S.; Soria, J.; Campbell, P.; Normanno, N.; Scarpa, A.; et al. TheEuropean Society for Medical Oncology (ESMO) Precision Medicine Glossary. Ann. Oncol. 2018, 29, 30–35. [CrossRef]
13. Abrams, J.; Conley, B.; Mooney, M.; Zwiebel, J.; Chen, A.; Welch, J.J.; Takebe, N.; Malik, S.; McShane, L.; Korn, E.; et al. NationalCancer Institute’s Precision Medicine Initiatives for the New National Clinical Trials Network. Am. Soc. Clin. Oncol. Educ. Book2014, 34, 71–76. [CrossRef] [PubMed]
14. Hood, L.; Friend, S.H. Predictive, personalized, preventive, participatory (P4) cancer medicine. Nat. Rev. Clin. Oncol. 2011, 8,184–187. [CrossRef] [PubMed]
15. Filipp, F.V. Precision medicine driven by cancer systems biology. Cancer Metastasis Rev. 2017, 36, 91–108. [CrossRef]16. Du, W.; Elemento, O. Cancer systems biology: Embracing complexity to develop better anticancer therapeutic strategies. Oncogene
2014, 34, 3215–3225. [CrossRef] [PubMed]17. Stéphanou, A.; Fanchon, E.; Innominato, P.F.; Ballesta, A. Systems Biology, Systems Medicine, Systems Pharmacology: The What
and The Why. Acta Biotheor. 2018, 66, 345–365. [CrossRef]18. Kent, D.M.; Steyerberg, E.; van Klaveren, D. Personalized evidence based medicine: Predictive approaches to heterogeneous
treatment effects. BMJ 2018, 363, k4245. [CrossRef]19. Kent, D.M.; Paulus, J.K.; van Klaveren, D.; Agostino, D.; Goodman, S.; Hayward, R.; John, P.A.; Patrick-lake, B.; Morton, S.;
Pencina, M.; et al. The Predictive Approaches to Treatment effect Heterogeneity (PATH) Statement. Ann. Intern. Med. 2020, 172,35–45. [CrossRef]

Cancers 2021, 13, 6312 19 of 26
20. Kent, D.M.; van Klaveren, D.; Paulus, J.K.; Agostino, D.; Goodman, S.; Hayward, R.; John, P.A.; Patrick-lake, B.; Morton, S.;Pencina, M.; et al. The PATH Statement Explanation and Elaboration Document. Ann. Intern. Med. 2020, 172, 1–50. [CrossRef]
21. Lu, Y.; Lee, J.J.; Ford, J.M. Statistical Methods in Precision Oncology. J. Clin. Oncol. 2020, 38, 660–661. [CrossRef] [PubMed]22. Angus, D.C.; Alexander, B.M.; Berry, S.; Buxton, M.; Lewis, R.; Paoloni, M.; Woodcock, J. The Adaptive Platform Trials Coalition
Adaptive platform trials: Definition, design, conduct and reporting considerations. Nat. Rev. Drug Discov. 2019, 18, 797–807.23. Woodcock, J.; LaVange, L.M. Master Protocols to Study Multiple Therapies, Multiple Diseases, or Both. N. Engl. J. Med. 2017, 377,
62–70. [CrossRef] [PubMed]24. Adashek, J.J.; Subbiah, V.; Kurzrock, R. From Tissue-Agnostic to N-of-One Therapies: (R) Evolution of the Precision Paradigm.
Trends Cancer 2021, 7, 15–28. [CrossRef] [PubMed]25. Ciardiello, F.; Arnold, D.; Casali, P.G.; Cervantes, A.; Douillard, J.-Y.; Eggermont, A.; Eniu, A.; McGregor, K.; Peters, S.;
Piccart, M.; et al. Delivering precision medicine in oncology today and in future—the promise and challenges of personalisedcancer medicine: A position paper by the European Society for Medical Oncology (ESMO). Ann. Oncol. 2014, 25, 1673–1678.[CrossRef]
26. Tsimberidou, A.M.; Fountzilas, E.; Nikanjam, M.; Kurzrock, R. Review of precision cancer medicine: Evolution of the treatmentparadigm. Cancer Treat. Rev. 2020, 86, 102019. [CrossRef] [PubMed]
27. Perou, C.M.; Sørlie, T.; Eisen, M.B.; van de Rijn, M.; Jeffrey, S.S.; Rees, C.A.; Pollack, J.R.; Ross, D.T.; Johnsen, H.; Akslen, L.A.;et al. Molecular portraits of human breast tumours. Nature 2000, 406, 747–752. [CrossRef] [PubMed]
28. Alizadeh, A.A.; Eisen, M.B.; Davis, R.E.; Ma, C.; Lossos, I.S.; Rosenwald, A.; Boldrick, J.C.; Sabet, H.; Tran, T.; Yu, X.; et al. Distincttypes of diffuse large B-cell lymphoma identified by gene expression profiling. Nat. Cell Biol. 2000, 403, 503–511. [CrossRef]
29. The Cancer Genome Atlas Network. Comprehensive molecular portraits of human breast tumours. Nature 2012, 490, 61–70.[CrossRef]
30. Collisson, E.A.; Campbell, J.D.; Brooks, A.N.; Berger, A.H.; Lee, W.; Chmielecki, J.; Beer, D.G.; Cope, L.; Creighton, C.J.; Danilova,L.; et al. Comprehensive molecular profiling of lung adenocarcinoma: The cancer genome atlas research network. Nature 2014,511, 543–550. [CrossRef]
31. Zhang, B.; Wang, J.; Wang, X.; Zhu, J.; Liu, Q.; Shi, Z.; Chambers, M.C.; Zimmerman, L.J.; Shaddox, K.F.; Kim, S.; et al.Proteogenomic characterization of human colon and rectal cancer. Nature 2014, 513, 382–387. [CrossRef]
32. Curtis, C.; Shah, S.P.; Chin, S.-F.; Turashvili, G.; Rueda, O.M.; Dunning, M.J.; Speed, D.; Lynch, A.G.; Samarajiwa, S.; Yuan, Y.; et al.The genomic and transcriptomic architecture of 2000 breast tumours reveals novel subgroups. Nature 2012, 486, 346–352.[CrossRef]
33. Ali, H.R.; Rueda, O.M.; Chin, S.-F.; Curtis, C.; Dunning, M.J.; Aparicio, S.A.; Caldas, C. Genome-driven integrated classification ofbreast cancer validated in over 7500 samples. Genome Biol. 2014, 15, 1–14. [CrossRef]
34. Montor, W.R.; Salas, A.R.O.S.E.; de Melo, F.H.M. Receptor tyrosine kinases and downstream pathways as druggable targets forcancer treatment: The current arsenal of inhibitors. Mol. Cancer 2018, 17, 1–18. [CrossRef]
35. Dupont, C.A.; Riegel, K.; Pompaiah, M.; Juhl, H.; Rajalingam, K. Druggable genome and precision medicine in cancer: Currentchallenges. FEBS J. 2021, 288, 6142–6158. [CrossRef] [PubMed]
36. Kalemkerian, G.P.; Narula, N.; Kennedy, E.B.; Biermann, W.A.; Donington, J.; Leighl, N.B.; Lew, M.; Pantelas, J.; Ramalingam, S.S.;Reck, M.; et al. Molecular Testing Guideline for the Selection of Patients With Lung Cancer for Treatment With Targeted TyrosineKinase Inhibitors: American Society of Clinical Oncology Endorsement of the College of American Pathologists/InternationalAssociation for the Study of Lung Cancer/Association for Molecular Pathology Clinical Practice Guideline Update. J. Clin. Oncol.2018, 36, 911–919. [CrossRef]
37. Wolff, A.C.; Hammond, M.E.H.; Allison, K.H.; Harvey, B.E.; Mangu, P.B.; Bartlett, J.M.S.; Bilous, M.; Ellis, I.O.; Fitzgibbons, P.;Hanna, W.; et al. Human Epidermal Growth Factor Receptor 2 Testing in Breast Cancer: American Society of Clinical On-cology/College of American Pathologists Clinical Practice Guideline Focused Update. J. Clin. Oncol. 2018, 36, 2105–2122.[CrossRef]
38. Cardoso, F.; van’t Veer, L.J.; Bogaerts, J.; Slaets, L.; Viale, G.; Delaloge, S.; Pierga, J.Y.; Brain, E.; Causeret, S.; Delorenzi, M.; et al.70-Gene Signature as an Aid to Treatment Decisions in Early-Stage Breast Cancer. N. Engl. J. Med. 2016, 375, 717–729. [CrossRef][PubMed]
39. Sparano, J.A.; Gray, R.J.; Makower, D.F.; Pritchard, K.I.; Albain, K.S.; Hayes, D.F.; Geyer, C.E., Jr.; Dees, E.C.; Goetz, M.P.;Olson, J.A.; et al. Adjuvant Chemotherapy Guided by a 21-Gene Expression Assay in Breast Cancer. N. Engl. J. Med. 2018, 379,111–121. [CrossRef]
40. Andre, F.; Ismaila, N.; Henry, N.L.; Somerfield, M.R.; Bast, R.C.; Barlow, W.; Collyar, D.E.; Hammond, M.E.; Kuderer, N.M.;Liu, M.C.; et al. Use of Biomarkers to Guide Decisions on Adjuvant Systemic Therapy for Women With Early-Stage InvasiveBreast Cancer: ASCO Clinical Practice Guideline Update—Integration of Results From TAILORx. J. Clin. Oncol. 2019, 37,1956–1964. [CrossRef] [PubMed]
41. Sjöström, M.; Chang, S.L.; Fishbane, N.; Davicioni, E.; Zhao, S.G.; Hartman, L.; Holmberg, E.; Feng, F.Y.; Speers, C.W.;Pierce, L.J.; et al. Clinicogenomic Radiotherapy Classifier Predicting the Need for Intensified Locoregional Treatment AfterBreast-Conserving Surgery for Early-Stage Breast Cancer. J. Clin. Oncol. 2019, 37, 3340–3349. [CrossRef] [PubMed]

Cancers 2021, 13, 6312 20 of 26
42. Llombart-Cussac, A.; Cortes, J.; Pare, L.; Galván, P.; Bermejo, B.; Martínez, N.; Vidal, M.; Pernas, S.; López, R.L.; Munoz, M.; et al.HER2-enriched subtype as a predictor of pathological complete response following trastuzumab and lapatinib without chemother-apy in early-stage HER2-positive breast cancer (PAMELA): An open-label, single-group, multicentre, phase 2 trial. Lancet Oncol.2017, 18, 545–554. [CrossRef]
43. Shi, W.; Jiang, T.; Nuciforo, P.; Hatzis, C.; Holmes, E.; Harbeck, N.; Sotiriou, C.; Peña, L.; Loi, S.; Rosa, D.D.; et al. Pathway levelalterations rather than mutations in single genes predict response to HER2-targeted therapies in the neo-ALTTO trial. Ann. Oncol.2017, 28, 128–135. [CrossRef] [PubMed]
44. Wulfkuhle, J.D.; Berg, D.; Wolff, C.; Langer, R.; Tran, K.; Illi, J.; Espina, V.; Pierobon, M.; Deng, J.; DeMichele, A.; et al. MolecularAnalysis of HER2 Signaling in Human Breast Cancer by Functional Protein Pathway Activation Mapping. Clin. Cancer Res. 2012,18, 6426–6435. [CrossRef] [PubMed]
45. Wulfkuhle, J.D.; Yau, C.; Wolf, D.M.; Vis, D.J.; Gallagher, R.I.; Brown-Swigart, L.; Hirst, G.; Voest, E.E.; DeMichele, A.;Hylton, N.; et al. Evaluation of the HER/PI3K/AKT Family Signaling Network as a Predictive Biomarker of Pathologic CompleteResponse for Patients With Breast Cancer Treated With Neratinib in the I-SPY 2 TRIAL. JCO Precis. Oncol. 2018, 2, 1–20. [CrossRef]
46. Mertins, P.; Cptac, N.; Mani, D.R.; Ruggles, K.V.; Gillette, M.A.; Clauser, K.R.; Wang, P.; Wang, X.; Qiao, J.W.; Cao, S.; et al.Proteogenomics connects somatic mutations to signalling in breast cancer. Nat. Cell Biol. 2016, 534, 55–62. [CrossRef] [PubMed]
47. Sengupta, S.; Sun, S.Q.; Huang, K.-L.; Oh, C.; Bailey, M.H.; Varghese, R.; Wyczalkowski, M.A.; Ning, J.; Tripathi, P.; McMichael,J.F.; et al. Integrative omics analyses broaden treatment targets in human cancer. Genome Med. 2018, 10, 1–20. [CrossRef]
48. Hahn, W.C.; Bader, J.S.; Braun, T.P.; Califano, A.; Clemons, P.A.; Druker, B.J.; Ewald, A.J.; Fu, H.; Jagu, S.; Kemp, C.J.; et al. Anexpanded universe of cancer targets. Cell 2021, 184, 1142–1155. [CrossRef]
49. Kim, H.; Chung, J.-H. PD-L1 Testing in Non-small Cell Lung Cancer: Past, Present, and Future. J. Pathol. Transl. Med. 2019, 53,199–206. [CrossRef]
50. Miglietta, F.; Griguolo, G.; Guarneri, V.; Dieci, M.V. Programmed Cell Death Ligand 1 in Breast Cancer: Technical Aspects,Prognostic Implications, and Predictive Value. Oncologist 2019, 24, 24. [CrossRef]
51. Stein, M.; Oluoha, O.; Patel, K.; VanderWalde, A. Precision Medicine in Oncology: A Review of Multi-Tumor Actionable MolecularTargets with an Emphasis on Non-Small Cell Lung Cancer. J. Pers. Med. 2021, 11, 518. [CrossRef] [PubMed]
52. Blank, C.U.; Haanen, J.B.; Ribas, A.; Schumacher, T.N. The “cancer immunogram”. Science 2016, 352, 658–660. [CrossRef]53. Grasso, C.S.; Tsoi, J.; Onyshchenko, M.; Abril-Rodriguez, G.; Ross-Macdonald, P.; Wind-Rotolo, M.; Champhekar, A.; Medina, E.;
Torrejon, D.Y.; Shin, D.S.; et al. Conserved Interferon-γ Signaling Drives Clinical Response to Immune Checkpoint BlockadeTherapy in Melanoma. Cancer Cell 2020, 38, 500–515. [CrossRef] [PubMed]
54. Hugo, W.; Zaretsky, J.M.; Sun, L.; Song, C.; Moreno, B.H.; Hu-Lieskovan, S.; Berent-Maoz, B.; Pang, J.; Chmielowski, B.;Cherry, G.; et al. Genomic and Transcriptomic Features of Response to Anti-PD-1 Therapy in Metastatic Melanoma. Cell 2016,165, 35–44. [CrossRef]
55. Zhang, Y. The root cause of drug resistance in HER2-positive breast cancer and the therapeutic approaches to overcoming theresistance. Pharmacol. Ther. 2021, 218, 107677. [CrossRef] [PubMed]
56. Murtuza, A.; Bulbul, A.; Shen, J.P.; Keshavarzian, P.; Woodward, B.D.; Lopez-Diaz, F.J.; Lippman, S.M.; Husain, H. NovelThird-Generation EGFR Tyrosine Kinase Inhibitors and Strategies to Overcome Therapeutic Resistance in Lung Cancer. CancerRes. 2019, 79, 689–698. [CrossRef] [PubMed]
57. Leonetti, A.; Sharma, S.; Minari, R.; Perego, P.; Giovannetti, E.; Tiseo, M. Resistance mechanisms to osimertinib in EGFR-mutatednon-small cell lung cancer. Br. J. Cancer 2019, 121, 725–737. [CrossRef]
58. Lake, D.; Corrêa, S.A.L.; Müller, J. Negative feedback regulation of the ERK1/2 MAPK pathway. Cell. Mol. Life Sci. 2016, 73,4397–4413. [CrossRef] [PubMed]
59. Arpino, G.; Wiechmann, L.; Osborne, C.K.; Schiff, R. Crosstalk between the Estrogen Receptor and the HER Tyrosine KinaseReceptor Family: Molecular Mechanism and Clinical Implications for Endocrine Therapy Resistance. Endocr. Rev. 2008, 29,217–233. [CrossRef]
60. Swain, S.M.; Baselga, J.; Kim, S.-B.; Ro, J.; Semiglazov, V.; Campone, M.; Ciruelos, E.; Ferrero, J.-M.; Schneeweiss, A.;Heeson, S.; et al. Pertuzumab, Trastuzumab, and Docetaxel in HER2-Positive Metastatic Breast Cancer. N. Engl. J. Med. 2015, 372,724–734. [CrossRef]
61. Blackwell, K.L.; Burstein, H.J.; Storniolo, A.M.; Rugo, H.S.; Sledge, G.; Aktan, G.; Ellis, C.; Florance, A.; Vukelja, S.; Bischoff, J.; et al.Overall Survival Benefit With Lapatinib in Combination With Trastuzumab for Patients With Human Epidermal Growth FactorReceptor 2–Positive Metastatic Breast Cancer: Final Results From the EGF104900 Study. J. Clin. Oncol. 2012, 30, 2585–2592.[CrossRef] [PubMed]
62. Larkin, J.; Ascierto, P.A.; Dréno, B.; Atkinson, V.; Liszkay, G.; Maio, M.; Mandalà, M.; Demidov, L.; Stroyakovskiy, D.;Thomas, L.; et al. Combined Vemurafenib and Cobimetinib in BRAF-Mutated Melanoma. N. Engl. J. Med. 2014, 371, 1867–1876. [CrossRef]
63. Robert, C.; Karaszewska, B.; Schachter, J.; Rutkowski, P.; Mackiewicz, A.; Stroiakovski, D.; Lichinitser, M.; Dummer, R.; Grange, F.;Mortier, L.; et al. Improved overall survival in melanoma with combined dabrafenib and trametinib. N. Engl. J. Med. 2015, 372,30–39. [CrossRef] [PubMed]

Cancers 2021, 13, 6312 21 of 26
64. Dummer, R.; Ascierto, P.A.; Gogas, H.J.; Arance, A.; Mandala, M.; Liszkay, G.; Garbe, C.; Schadendorf, D.; Krajsova, I.; Gutzmer, R.;et al. Overall survival in patients with BRAF-mutant melanoma receiving encorafenib plus binimetinib versus vemurafenib orencorafenib (COLUMBUS): A multicentre, open-label, randomised, phase 3 trial. Lancet Oncol. 2018, 19, 1315–1327. [CrossRef]
65. Kholodenko, B.N. Cell-signalling dynamics in time and space. Nat. Rev. Mol. Cell Biol. 2006, 7, 165–176. [CrossRef]66. Kholodenko, B.N.; Hancock, J.; Kolch, W. Signalling ballet in space and time. Nat. Rev. Mol. Cell Biol. 2010, 11, 414–426. [CrossRef]67. Kolch, W.; Halasz, M.; Granovskaya, M.; Kholodenko, B. The dynamic control of signal transduction networks in cancer cells.
Nat. Rev. Cancer 2015, 15, 515–527. [CrossRef] [PubMed]68. Kholodenko, B.; Hoek, J.; Westerhoff, H.; Brown, G.C. Quantification of information transfer via cellular signal transduction
pathways. FEBS Lett. 1997, 414, 430–434. [CrossRef]69. Bhalla, U.S.; Iyengar, R. Emergent Properties of Networks of Biological Signaling Pathways. Science 1999, 283, 381–387. [CrossRef]70. Uthamacumaran, A. A review of dynamical systems approaches for the detection of chaotic attractors in cancer networks. Gene
Expr. Patterns 2021, 2, 100226. [CrossRef]71. Citri, A.; Yarden, Y. EGF–ERBB signalling: Towards the systems level. Nat. Rev. Mol. Cell Biol. 2006, 7, 505–516. [CrossRef]
[PubMed]72. Kitano, H. Cancer as a robust system: Implications for anticancer therapy. Nat. Rev. Cancer 2004, 4, 227–235. [CrossRef] [PubMed]73. Hastings, J.F.; O’Donnell, Y.E.; Fey, D.; Croucher, D.R. Applications of personalised signalling network models in precision
oncology. Pharmacol. Ther. 2020, 212, 107555. [CrossRef] [PubMed]74. Tavassoly, I.; Goldfarb, J.; Iyengar, R. Systems biology primer: The basic methods and approaches. Essays Biochem. 2018, 62,
487–500. [CrossRef]75. Ebata, K.; Yamashiro, S.; Iida, K.; Okada, M. Building patient-specific models for receptor tyrosine kinase signaling networks.
FEBS J. 2021. advance online publication. [CrossRef]76. Yurkovich, J.T.; Tian, Q.; Price, N.D.; Hood, L. A systems approach to clinical oncology uses deep phenotyping to deliver
personalized care. Nat. Rev. Clin. Oncol. 2019, 17, 183–194. [CrossRef]77. Karlebach, G.; Shamir, R. Modelling and analysis of gene regulatory networks. Nat. Rev. Mol. Cell Biol. 2008, 9, 770–780.
[CrossRef]78. Barbuti, R.; Gori, R.; Milazzo, P.; Nasti, L. A survey of gene regulatory networks modelling methods: From differential equations,
to Boolean and qualitative bioinspired models. J. Membr. Comput. 2020, 2, 207–226. [CrossRef]79. Tyson, J.J.; Laomettachit, T.; Kraikivski, P. Modeling the dynamic behavior of biochemical regulatory networks. J. Theor. Biol.
2019, 462, 514–527. [CrossRef]80. Clarke, M.A.; Fisher, J. Executable cancer models: Successes and challenges. Nat. Rev. Cancer 2020, 20, 343–354. [CrossRef]81. Jaqaman, K.; Danuser, G. Linking data to models: Data regression. Nat. Rev. Mol. Cell Biol. 2006, 7, 813–819. [CrossRef]82. Kristensen, V.N.; Lingjærde, O.C.; Russnes, H.G.; Vollan, H.K.M.; Frigessi, A.; Børresen-Dale, A.-L. Principles and methods of
integrative genomic analyses in cancer. Nat. Rev. Cancer 2014, 14, 299–313. [CrossRef]83. Clarke, R.; Ressom, H.W.; Wang, A.; Xuan, J.; Liu, M.C.; Gehan, E.A.; Wang, Y. The properties of high-dimensional data spaces:
Implications for exploring gene and protein expression data. Nat. Rev. Cancer 2008, 8, 37–49. [CrossRef]84. Janes, K.A.; Yaffe, M.B. Data-driven modelling of signal-transduction networks. Nat. Rev. Mol. Cell Biol. 2006, 7, 820–828.
[CrossRef] [PubMed]85. Niepel, M.; Hafner, M.; Pace, E.A.; Chung, M.; Chai, D.H.; Zhou, L.; Schoeberl, B.; Sorger, P.K. Profiles of Basal and Stim-ulated
Receptor Signaling Networks Predict Drug Response in Breast Cancer Lines. Sci. Signal. 2013, 6, ra84. [CrossRef]86. Das, S.; McClain, C.J.; Rai, S.N. Fifteen Years of Gene Set Analysis for High-Throughput Genomic Data: A Review of Statistical
Approaches and Future Challenges. Entropy 2020, 22, 427. [CrossRef] [PubMed]87. Toy, H.I.; Karakülah, G.; Kontou, P.I.; Alotaibi, H.; Georgakilas, A.G.; Pavlopoulou, A. Investigating Molecular Determinants
of Cancer Cell Resistance to Ionizing Radiation Through an Integrative Bioinformatics Approach. Front. Cell Dev. Biol. 2021, 9,620248. [CrossRef]
88. Yeung, T.-L.; Sheng, J.; Leung, C.S.; Li, F.; Kim, J.; Ho, S.Y.; Matzuk, M.M.; Lu, K.H.; Wong, S.T.C.; Mok, S.C. SystematicIdentification of Druggable Epithelial-Stromal Crosstalk Signaling Networks in Ovarian Cancer. J. Natl. Cancer Inst. 2019, 111,272–282. [CrossRef] [PubMed]
89. Saez-Rodriguez, J.; Blüthgen, N. Personalized signaling models for personalized treatments. Mol. Syst. Biol. 2020, 16, e9042.[CrossRef]
90. Cook, D.P.; Vanderhyden, B.C. Context specificity of the EMT transcriptional response. Nat. Commun. 2020, 11, 1–9. [CrossRef][PubMed]
91. Chen, W.S.; Zivanovic, N.; van Dijk, D.; Wolf, G.; Bodenmiller, B.; Krishnaswamy, S. Uncovering axes of variation amongsingle-cell cancer specimens. Nat. Methods 2020, 17, 302–310. [CrossRef]
92. Molinelli, E.J.; Korkut, A.; Wang, W.; Miller, M.L.; Gauthier, N.P.; Jing, X.; Kaushik, P.; He, Q.; Mills, G.; Solit, D.B.; et al.Perturbation Biology: Inferring Signaling Networks in Cellular Systems. PLoS Comput. Biol. 2013, 9, e1003290. [CrossRef]
93. Nagy, M.; Radakovich, N.; Nazha, A. Machine Learning in Oncology: What Should Clinicians Know? JCO Clin. Cancer Inform.2020, 4, 799–810. [CrossRef]
94. Bhinder, B.; Gilvary, C.; Madhukar, N.S.; Elemento, O. Artificial Intelligence in Cancer Research and Precision Medicine. CancerDiscov. 2021, 11, 900–915. [CrossRef] [PubMed]

Cancers 2021, 13, 6312 22 of 26
95. Goecks, J.; Jalili, V.; Heiser, L.M.; Gray, J.W. How Machine Learning Will Transform Biomedicine. Cell 2020, 181, 92–101. [CrossRef][PubMed]
96. Adam, G.; Rampášek, L.; Safikhani, Z.; Smirnov, P.; Haibe-Kains, B.; Goldenberg, A. Machine learning approaches to drugresponse prediction: Challenges and recent progress. NPJ Precis. Oncol. 2020, 4, 1–10. [CrossRef]
97. De Silva, E.; Stumpf, M.P. Complex networks and simple models in biology. J. R. Soc. Interface 2005, 2, 419–430. [CrossRef]98. Pieroni, E.; Bentem, S.D.L.F.V.; Mancosu, G.; Capobianco, E.; Hirt, H.; de La Fuente, A. Protein networking: Insights into global
functional organization of proteomes. Proteomics 2008, 8, 799–816. [CrossRef] [PubMed]99. Le Novère, N. Quantitative and logic modelling of molecular and gene networks. Nat. Rev. Genet. 2015, 16, 146–158. [CrossRef]100. Szklarczyk, D.; Gable, A.L.; Nastou, K.C.; Lyon, D.; Kirsch, R.; Pyysalo, S.; Doncheva, N.T.; Legeay, M.; Fang, T.; Bork, P.; et al.
The STRING database in 2021: Customizable protein-protein networks, and functional characterization of user-uploadedgene/measurement sets. Nucleic Acids Res. 2021, 49, D605–D612. [CrossRef] [PubMed]
101. Stolovitzky, G.; Monroe, D.; Califano, A. Dialogue on Reverse-Engineering Assessment and Methods: The DREAM of High-Throughput Pathway Inference. Ann. N. Y. Acad. Sci. 2007, 1115, 1–22. [CrossRef] [PubMed]
102. Villaverde, A.; Banga, J.R. Reverse engineering and identification in systems biology: Strategies, perspectives and challenges. J. R.Soc. Interface 2014, 11, 20130505. [CrossRef] [PubMed]
103. Haury, A.-C.; Mordelet, F.; Vera-Licona, P.; Vert, J.-P. TIGRESS: Trustful Inference of Gene REgulation using Stability Selection.BMC Syst. Biol. 2012, 6, 145. [CrossRef] [PubMed]
104. Friedman, N. Inferring Cellular Networks Using Probabilistic Graphical Models. Science 2004, 303, 799–805. [CrossRef]105. Liepe, J.; Kirk, P.; Filippi, S.; Toni, T.; Barnes, C.; Stumpf, M.P. A framework for parameter estimation and model selection from
experimental data in systems biology using approximate Bayesian computation. Nat. Protoc. 2014, 9, 439–456. [CrossRef]106. Dondelinger, F.; Mukherjee, S. Statistical Network Inference for Time-Varying Molecular Data with Dynamic Bayesian Networks.
Adv. Struct. Saf. Stud. 2018, 1883, 25–48. [CrossRef]107. Kim, Y.; Han, S.; Choi, S.; Hwang, D. Inference of dynamic networks using time-course data. Brief. Bioinform. 2013, 15, 212–228.
[CrossRef]108. Basso, K.; Margolin, A.A.; Stolovitzky, G.; Klein, U.; Dalla-Favera, R.; Califano, A. Reverse engineering of regulatory networks in
human B cells. Nat. Genet. 2005, 37, 382–390. [CrossRef]109. Califano, A.; Butte, A.J.; Friend, S.; Ideker, T.; Schadt, E. Leveraging models of cell regulation and GWAS data in integrative
network-based association studies. Nat. Genet. 2012, 44, 841–847. [CrossRef]110. Bruggeman, F.J.; Westerhoff, H.V.; Hoek, J.B.; Kholodenko, B.N. Modular Response Analysis of Cellular Regulatory Networks. J.
Theor. Biol. 2002, 218, 507–520. [CrossRef]111. Kholodenko, B.N.; Kiyatkin, A.; Bruggeman, F.; Sontag, E.; Westerhoff, H.; Hoek, J. Untangling the wires: A strategy to trace
functional interactions in signaling and gene networks. Proc. Natl. Acad. Sci. USA 2002, 99, 12841–12846. [CrossRef]112. Mekedem, M.; Ravel, P.; Colinge, J. Application of Modular Response Analysis to Medium- to Large-Size Biological Systems.
bioRxiv 2021, 453942. [CrossRef]113. Santra, T.; Kolch, W.; Kholodenko, B.N. Integrating Bayesian variable selection with Modular Response Analysis to infer
biochemical network topology. BMC Syst. Biol. 2013, 7, 57. [CrossRef]114. Halasz, M.; Kholodenko, B.N.; Kolch, W.; Santra, T. Integrating network reconstruction with mechanistic modeling to predict
cancer therapies. Sci. Signal. 2016, 9, ra114. [CrossRef]115. Santra, T.; Rukhlenko, O.; Zhernovkov, V.; Kholodenko, B.N. Reconstructing static and dynamic models of signaling pathways
using Modular Response Analysis. Curr. Opin. Syst. Biol. 2018, 9, 11–21. [CrossRef]116. Morris, M.K.; Saez-Rodriguez, J.; Sorger, P.; Lauffenburger, D.A. Logic-Based Models for the Analysis of Cell Signaling Networks.
Biochemistry 2010, 49, 3216–3224. [CrossRef]117. Mishra, D.; Bepler, T.; Teague, B.; Berger, B.; Broach, J.; Weiss, R. An engineered protein-phosphorylation toggle network with
implications for endogenous network discovery. Science 2021, 373, aav0780. [CrossRef] [PubMed]118. Saez-Rodriguez, J.; Alexopoulos, L.G.; Epperlein, J.; Samaga, R.; Lauffenburger, D.A.; Klamt, S.; Sorger, P.K. Discrete logic
modelling as a means to link protein signalling networks with functional analysis of mammalian signal transduction. Mol. Syst.Biol. 2009, 5, 331. [CrossRef]
119. Wynn, M.L.; Consul, N.; Merajver, S.D.; Schnell, S. Logic-based models in systems biology: A predictive and parameter-freenetwork analysis method. Integr. Biol. 2012, 4, 1323–1337. [CrossRef] [PubMed]
120. Priami, C.; Morine, M.J. Analysis of Biological Systems; Imperial College Press: London, UK, 2015.121. Fey, D.; Dobrzynski, M.; Kholodenko, B.N. Modeling with Ordinary Differential Equations. Available online: https://mitpress.
mit.edu/books/quantitative-biology (accessed on 9 December 2021)2018.122. Munsky, B.; Hlavacek, W.S.; Tsimring, L.S. (Eds.) Quantitative Biology: Theory, Computational Methods, and Models; The MIT Press:
Cambridge, MA, USA, 2018.123. Hurtado, P.J.; Richards, C. Building mean field ODE models using the generalized linear chain trick & Markov chain theory. J.
Biol. Dyn. 2021, 15, S248–S272. [CrossRef]124. Chen, W.W.; Niepel, M.; Sorger, P.K. Classic and contemporary approaches to modeling biochemical reactions. Genes Dev. 2010,
24, 1861–1875. [CrossRef]125. Cornish-Bowden, A. Fundamentals of Enzyme Kinetics; Portland Press: London, UK, 1995.

Cancers 2021, 13, 6312 23 of 26
126. Wilkinson, D.J. Stochastic modelling for quantitative description of heterogeneous biological systems. Nat. Rev. Genet. 2009, 10,122–133. [CrossRef] [PubMed]
127. Smith, S.; Grima, R. Spatial Stochastic Intracellular Kinetics: A Review of Modelling Approaches. Bull. Math. Biol. 2018, 81,2960–3009. [CrossRef]
128. Simoni, G.; Vo, H.T.; Priami, C.; Marchetti, L. A comparison of deterministic and stochastic approaches for sensitivity analysis incomputational systems biology. Brief. Bioinform. 2019, 21, 527–540. [CrossRef]
129. Hahl, S.K.; Kremling, A. A Comparison of Deterministic and Stochastic Modeling Approaches for Biochemical Reaction Systems:On Fixed Points, Means, and Modes. Front. Genet. 2016, 7, 7. [CrossRef]
130. Gillespie, D.T. Stochastic Simulation of Chemical Kinetics. Annu. Rev. Phys. Chem. 2007, 58, 35–55. [CrossRef]131. Simoni, G.; Reali, F.; Priami, C.; Marchetti, L. Stochastic simulation algorithms for computational systems biology: Exact,
approximate, and hybrid methods. Wiley Interdiscip. Rev. Syst. Biol. Med. 2019, 11, e1459. [CrossRef] [PubMed]132. Rukhlenko, O.; Khorsand, F.; Krstic, A.; Rozanc, J.; Alexopoulos, L.G.; Rauch, N.; Erickson, K.E.; Hlavacek, W.S.; Posner, R.G.;
Gómez-Coca, S.; et al. Dissecting RAF Inhibitor Resistance by Structure-based Modeling Reveals Ways to Overcome OncogenicRAS Signaling. Cell Syst. 2018, 7, 161–179. [CrossRef]
133. Blinov, M.; Faeder, J.; Goldstein, B.; Hlavacek, W.S. BioNetGen: Software for rule-based modeling of signal transduction based onthe interactions of molecular domains. Bioinformatics 2004, 20, 3289–3291. [CrossRef] [PubMed]
134. Borisov, N.; Kholodenko, B.; Faeder, J.; Chistopolsky, A. Domain-oriented reduction of rule-based network models. IET Syst. Biol.2008, 2, 342–351. [CrossRef] [PubMed]
135. Sneddon, M.W.; Faeder, J.R.; Emonet, T. Efficient modeling, simulation and coarse-graining of biological complexity with NFsim.Nat. Methods 2010, 8, 177–183. [CrossRef]
136. Erickson, K.E.; Rukhlenko, O.S.; Shahinuzzaman, M.; Slavkova, K.P.; Lin, Y.T.; Suderman, R.; Stites, E.C.; Anghel, M.; Posner, R.G.;Barua, D.; et al. Modeling cell line-specific recruitment of signaling proteins to the insulin-like growth factor 1 receptor. PLoSComput. Biol. 2019, 15, e1006706. [CrossRef] [PubMed]
137. Rukhlenko, O.S.; Kholodenko, B.N. Modeling the Nonlinear Dynamics of Intracellular Signaling Networks. Bio Protoc. 2021, 11,e4089. [CrossRef] [PubMed]
138. Yaffe, M.B. Why geneticists stole cancer research even though cancer is primarily a signaling disease. Sci. Signal. 2019, 12, 1–3.[CrossRef] [PubMed]
139. Nagashima, T.; Shimodaira, H.; Ide, K.; Nakakuki, T.; Tani, Y.; Takahashi, K.; Yumoto, N.; Hatakeyama, M. QuantitativeTranscriptional Control of ErbB Receptor Signaling Undergoes Graded to Biphasic Response for Cell Differentiation. J. Biol. Chem.2007, 282, 4045–4056. [CrossRef] [PubMed]
140. Goldbeter, A.; Koshland, D.E., Jr. An amplified sensitivity arising from covalent modification in biological systems. Proc. Natl.Acad. Sci. USA 1981, 78, 6840–6844. [CrossRef]
141. Markevich, N.I.; Hoek, J.; Kholodenko, B.N. Signaling switches and bistability arising from multisite phosphorylation in proteinkinase cascades. J. Cell Biol. 2004, 164, 353–359. [CrossRef]
142. Stelling, J.; Sauer, U.; Szallasi, Z.; Doyle, F.J.; Doyle, J. Robustness of Cellular Functions. Cell 2004, 118, 675–685. [CrossRef]143. Kholodenko, B.N. Negative feedback and ultrasensitivity can bring about oscillations in the mitogen-activated protein kinase
cascades. JBIC J. Biol. Inorg. Chem. 2000, 267, 1583–1588. [CrossRef]144. Pomerening, J.R.; Sontag, E.; Ferrell, J.E. Building a cell cycle oscillator: Hysteresis and bistability in the activation of Cdc2. Nat.
Cell Biol. 2003, 5, 346–351. [CrossRef] [PubMed]145. Sha, W.; Moore, J.; Chen, K.; Lassaletta, A.D.; Yi, C.-S.; Tyson, J.J.; Sible, J.C. Hysteresis drives cell-cycle transitions in Xenopus
laevis egg extracts. Proc. Natl. Acad. Sci. USA 2003, 100, 975–980. [CrossRef] [PubMed]146. Novak, B.; Tyson, J. Numerical analysis of a comprehensive model of M-phase control in Xenopus oocyte extracts and intact
embryos. J. Cell Sci. 1993, 106, 1153–1168. [CrossRef] [PubMed]147. Xiong, W.; Ferrell, J.E. A positive-feedback-based bistable ‘memory module’ that governs a cell fate decision. Nat. Cell Biol. 2003,
426, 460–465. [CrossRef] [PubMed]148. Yao, G.; Lee, T.J.; Mori, S.; Nevins, J.R.; You, L. A bistable Rb-E2F switch underlies the restriction point. Nat. Cell Biol. 2008, 10,
476–482. [CrossRef] [PubMed]149. Sevier, S.A.; Kessler, D.A.; Levine, H. Mechanical bounds to transcriptional noise. Proc. Natl. Acad. Sci. USA 2016, 113,
13983–13988. [CrossRef]150. Ham, L.; Brackston, R.D.; Stumpf, M.P.H. Extrinsic Noise and Heavy-Tailed Laws in Gene Expression. Phys. Rev. Lett. 2020, 124,
108101. [CrossRef]151. Lu, M.; Onuchic, J.; Ben-Jacob, E. Construction of an Effective Landscape for Multistate Genetic Switches. Phys. Rev. Lett. 2014,
113, 1–5. [CrossRef]152. Waddington, C.H. Organisers and Genes; Cambridge University Press: Cambridge, UK, 1940.153. Brackston, R.D.; Lakatos, E.; Stumpf, M.P.H. Transition state characteristics during cell differentiation. PLoS Comput. Biol. 2018,
14, e1006405. [CrossRef]154. Tang, Y.; Yuan, R.; Wang, G.; Zhu, X.; Gaowei, W. Potential landscape of high dimensional nonlinear stochastic dynamics with
large noise. Sci. Rep. 2017, 7, 1–11. [CrossRef]155. Brown, G.C.; Kholodenko, B.N. Spatial gradients of cellular phospho-proteins. FEBS Lett. 1999, 457, 452–454. [CrossRef]

Cancers 2021, 13, 6312 24 of 26
156. Kholodenko, B.N. Spatially distributed cell signalling. FEBS Lett. 2009, 583, 4006–4012. [CrossRef] [PubMed]157. Bolado-Carrancio, A.; Rukhlenko, O.S.; Nikonova, E.; Tsyganov, M.A.; Wheeler, A.; Garcia-Munoz, A.; Kolch, W.;
von Kriegsheim, A.; Kholodenko, B.N. Periodic propagating waves coordinate RhoGTPase network dynamics at the leading andtrailing edges during cell migration. eLife 2020, 9, 1–34. [CrossRef]
158. Heasman, S.J.; Ridley, A.J. Mammalian Rho GTPases: New insights into their functions from in vivo studies. Nat. Rev. Mol. CellBiol. 2008, 9, 690–701. [CrossRef]
159. Edelstein-Keshet, L. Flipping the Rac-Rho Switch in Cell Motility. Cell Syst. 2016, 2, 10–12. [CrossRef]160. Machacek, M.; Hodgson, L.; Welch, C.; Elliott, H.; Pertz, O.; Nalbant, P.; Abell, A.; Johnson, G.L.; Hahn, K.M.; Danuser, G.
Coordination of Rho GTPase activities during cell protrusion. Nat. Cell Biol. 2009, 461, 99–103. [CrossRef]161. Kholodenko, B.N.; Demin, O.V.; Moehren, G.; Hoek, J. Quantification of Short Term Signaling by the Epidermal Growth Factor
Receptor. J. Biol. Chem. 1999, 274, 30169–30181. [CrossRef]162. Wiley, H.S.; Shvartsman, S.Y.; Lauffenburger, D.A. Computational modeling of the EGF-receptor system: A paradigm for systems
biology. Trends Cell Biol. 2003, 13, 43–50. [CrossRef]163. Erickson, K.; Rukhlenko, O.; Posner, R.G.; Hlavacek, W.S.; Kholodenko, B.N. New insights into RAS biology reinvigorate interest
in mathematical modeling of RAS signaling. Semin. Cancer Biol. 2019, 54, 162–173. [CrossRef] [PubMed]164. Kochanczyk, M.; Kocieniewski, P.; Kozlowska, E.; Jaruszewicz-Błonska, J.; Sparta, B.; Pargett, M.; Albeck, J.G.; Hlavacek, W.S.;
Lipniacki, T. Relaxation oscillations and hierarchy of feedbacks in MAPK signaling. Sci. Rep. 2017, 7, 38244. [CrossRef]165. Hall-Jackson, C.A.; Goedert, M.; Hedge, P.; Cohen, P. Effect of SB 203580 on the activity of c-Raf in vitro and in vivo. Oncogene
1999, 18, 2047–2054. [CrossRef] [PubMed]166. Lito, P.; Rosen, N.; Solit, D.B. Tumor adaptation and resistance to RAF inhibitors. Nat. Med. 2013, 19, 1401–1409. [CrossRef]167. Rajakulendran, T.; Sahmi, M.; Lefrançois, M.; Sicheri, F.; Therrien, M. A dimerization-dependent mechanism drives RAF catalytic
activation. Nat. Cell Biol. 2009, 461, 542–545. [CrossRef]168. Kholodenko, B.N. Drug Resistance Resulting from Kinase Dimerization Is Rationalized by Thermodynamic Factors Describing
Allosteric Inhibitor Effects. Cell Rep. 2015, 12, 1939–1949. [CrossRef]169. Kholodenko, B.N.; Rauch, N.; Kolch, W.; Rukhlenko, O.S. A systematic analysis of signaling reactivation and drug resistance. Cell
Rep. 2021, 35, 109157. [CrossRef] [PubMed]170. Lito, P.; Pratilas, C.A.; Joseph, E.W.; Tadi, M.; Halilovic, E.; Zubrowski, M.; Huang, A.; Wong, W.L.; Callahan, M.K.;
Merghoub, T.; et al. Relief of Profound Feedback Inhibition of Mitogenic Signaling by RAF Inhibitors Attenuates Their Activityin BRAFV600E Melanomas. Cancer Cell 2012, 22, 668–682. [CrossRef] [PubMed]
171. Montero-Conde, C.; Ruiz-Llorente, S.; Dominguez, J.M.; Knauf, J.; Viale, A.; Sherman, E.J.; Ryder, M.; Ghossein, R.A.; Rosen, N.;Fagin, J.A. Relief of Feedback Inhibition of HER3 Transcription by RAF and MEK Inhibitors Attenuates Their Antitumor Effectsin BRAF-Mutant Thyroid Carcinomas. Cancer Discov. 2013, 3, 520–533. [CrossRef] [PubMed]
172. Prahallad, A.; Sun, C.; Huang, S.; Di Nicolantonio, F.; Salazar, R.; Zecchin, D.; Beijersbergen, R.L.; Bardelli, A.; Bernards, R.Unresponsiveness of colon cancer to BRAF(V600E) inhibition through feedback activation of EGFR. Nat. Cell Biol. 2012, 483,100–103. [CrossRef] [PubMed]
173. Ryan, M.B.; de La Cruz, F.F.; Phat, S.; Myers, D.T.; Wong, E.; Shahzade, H.A.; Hong, C.; Corcoran, R.B. Vertical Pathway InhibitionOvercomes Adaptive Feedback Resistance to KRASG12C Inhibition. Clin. Cancer Res. 2019, 26, 1633–1643. [CrossRef] [PubMed]
174. Sun, C.; Wang, L.; Huang, S.; Heynen, G.J.J.E.; Prahallad, A.; Robert, C.; Haanen, J.; Blank, C.; Wesseling, J.; Willems, S.M.; et al.Reversible and adaptive resistance to BRAF(V600E) inhibition in melanoma. Nature 2014, 508, 118–122. [CrossRef]
175. Yaeger, R.; Corcoran, R.B. Targeting Alterations in the RAF-MEK Pathway. Cancer Discov. 2019, 9, 329–341. [CrossRef] [PubMed]176. Eduati, F.; Doldàn-Martelli, V.; Klinger, B.; Cokelaer, T.; Sieber, A.; Kogera, F.; Dorel, M.; Garnett, M.J.; Blüthgen, N.;
Saez-Rodriguez, J. Drug Resistance Mechanisms in Colorectal Cancer Dissected with Cell Type-Specific Dynamic Logic Models.Cancer Res. 2017, 77, 3364–3375. [CrossRef]
177. He, W.; Demas, D.M.; Conde, I.P.; Shajahan-Haq, A.N.; Baumann, W.T. Mathematical modelling of breast cancer cells in responseto endocrine therapy and Cdk4/6 inhibition. J. R. Soc. Interface 2020, 17, 20200339. [CrossRef]
178. Chen, C.; Baumann, W.T.; Xing, J.; Xu, L.; Clarke, R.; Tyson, J.J. Mathematical models of the transitions between endocrine therapyresponsive and resistant states in breast cancer. J. R. Soc. Interface 2014, 11, 20140206. [CrossRef] [PubMed]
179. Kondratova, M.; Barillot, E.; Zinovyev, A.; Calzone, L. Modelling of Immune Checkpoint Network Explains Synergistic Effectsof Combined Immune Checkpoint Inhibitor Therapy and the Impact of Cytokines in Patient Response. Cancers 2020, 12, 3600.[CrossRef] [PubMed]
180. Rehm, M.; Huber, H.J.; Düssmann, H.; Prehn, J.H.M. Systems analysis of effector caspase activation and its control by X-linkedinhibitor of apoptosis protein. EMBO J. 2006, 25, 4338–4349. [CrossRef]
181. Hector, S.; Rehm, M.; Schmid, J.; Kehoe, J.; McCawley, N.; Dicker, P.; Murray, F.; McNamara, D.; Kay, E.W.; Concannon, C.G.; et al.Clinical application of a systems model of apoptosis execution for the prediction of colorectal cancer therapy responses andpersonalisation of therapy. Gut 2011, 61, 725–733. [CrossRef]
182. Lindner, A.; Concannon, C.G.; Boukes, G.J.; Cannon, M.D.; Llambi, F.; Ryan, D.; Boland, K.; Kehoe, J.; McNamara, D.A.;Murray, F.; et al. Systems Analysis of BCL2 Protein Family Interactions Establishes a Model to Predict Responses to Chemotherapy.Cancer Res. 2013, 73, 519–528. [CrossRef]

Cancers 2021, 13, 6312 25 of 26
183. Huber, H.J.; McKiernan, R.G.; Prehn, J.H.M. Harnessing system models of cell death signalling for cytotoxic chemotherapy:Towards personalised medicine approaches? J. Mol. Med. 2014, 92, 227–237. [CrossRef] [PubMed]
184. Béal, J.; Montagud, A.; Traynard, P.; Barillot, E.; Calzone, L. Personalization of Logical Models With Multi-Omics Data AllowsClinical Stratification of Patients. Front. Physiol. 2019, 9, 1965. [CrossRef]
185. Eduati, F.; Jaaks, P.; Wappler, J.; Cramer, T.; Merten, C.A.; Garnett, M.J.; Saez-Rodriguez, J. Patient-specific logic models ofsignaling pathways from screenings on cancer biopsies to prioritize personalized combination therapies. Mol. Syst. Biol. 2020, 16,e8664. [CrossRef]
186. Zañudo, J.G.T.; Steinway, S.; Albert, R. Discrete dynamic network modeling of oncogenic signaling: Mechanistic insights forpersonalized treatment of cancer. Curr. Opin. Syst. Biol. 2018, 9, 1–10. [CrossRef]
187. Guo, W.-F.; Zhang, S.-W.; Zeng, T.; Akutsu, T.; Chen, L. Network control principles for identifying personalized driver genes incancer. Brief. Bioinform. 2019, 21, 1641–1662. [CrossRef]
188. Guo, W.-F.; Zhang, S.-W.; Feng, Y.-H.; Liang, J.; Zeng, T.; Chen, L. Network controllability-based algorithm to target personalizeddriver genes for discovering combinatorial drugs of individual patients. Nucleic Acids Res. 2021, 49, e37. [CrossRef]
189. Maron, B.A.; Wang, R.-S.; Shevtsov, S.; Drakos, S.G.; Arons, E.; Wever-Pinzon, O.; Huggins, G.S.; Samokhin, A.O.; Oldham,W.M.; Aguib, Y.; et al. Individualized interactomes for network-based precision medicine in hypertrophic cardiomyopathy withimplications for other clinical pathophenotypes. Nat. Commun. 2021, 12, 1–11. [CrossRef]
190. Orth, J.D.; Thiele, I.; Palsson, B.O. What is flux balance analysis? Nat. Biotechnol. 2010, 28, 245–248. [CrossRef] [PubMed]191. Stanford, N.J.; Lubitz, T.; Smallbone, K.; Klipp, E.; Mendes, P.; Liebermeister, W. Systematic Construction of Kinetic Models from
Genome-Scale Metabolic Networks. PLoS ONE 2013, 8, e79195. [CrossRef]192. Chowdhury, A.; Maranas, C.D. Personalized Kinetic Models for Predictive Healthcare. Cell Syst. 2015, 1, 250–251. [CrossRef]
[PubMed]193. Bordbar, A.; McCloskey, D.; Zielinski, D.C.; Sonnenschein, N.; Jamshidi, N.; Palsson, B.O. Personalized Whole-Cell Kinetic Models
of Metabolism for Discovery in Genomics and Pharmacodynamics. Cell Syst. 2015, 1, 283–292. [CrossRef] [PubMed]194. Lewis, J.; Forshaw, T.E.; Boothman, D.A.; Furdui, C.M.; Kemp, M.L. Personalized Genome-Scale Metabolic Models Identify
Targets of Redox Metabolism in Radiation-Resistant Tumors. Cell Syst. 2021, 12, 68–81. [CrossRef] [PubMed]195. Fey, D.; Halasz, M.; Dreidax, D.; Kennedy, S.P.; Hastings, J.F.; Rauch, N.; Munoz, A.G.; Pilkington, R.; Fischer, M.;
Westermann, F.; et al. Signaling pathway models as biomarkers: Patient-specific simulations of JNK activity predict the survivalof neuroblastoma patients. Sci. Signal. 2015, 8, ra130. [CrossRef]
196. Flaherty, K.T.; Gray, R.J.; Chen, A.P.; Li, S.; McShane, L.M.; Patton, D.; Hamilton, S.R.; Williams, P.M.; Iafrate, A.J.; Sklar, J.; et al.Molecular Landscape and Actionable Alterations in a Genomically Guided Cancer Clinical Trial: National Cancer InstituteMolecular Analysis for Therapy Choice (NCI-MATCH). J. Clin. Oncol. 2020, 38, 3883–3894. [CrossRef]
197. André, F.; Bachelot, T.; Commo, F.; Campone, M.; Arnedos, M.; Dieras, V.; Lacroix-Triki, M.; Lacroix, L.; Cohen, P.;Gentien, D.; et al. Comparative genomic hybridisation array and DNA sequencing to direct treatment of metastatic breast cancer:A multicentre, prospective trial (SAFIR01/UNICANCER). Lancet Oncol. 2014, 15, 267–274. [CrossRef]
198. Turner, N.C.; Kingston, B.; Kilburn, L.; Kernaghan, S.; Wardley, A.M.; Macpherson, I.R.; Baird, R.; Roylance, R.; Stephens, P.;Oikonomidou, O.; et al. Circulating tumour DNA analysis to direct therapy in advanced breast cancer (plasmaMATCH): Amulticentre, multicohort, phase 2a, platform trial. Lancet Oncol. 2020, 21, 1296–1308. [CrossRef]
199. Cobain, E.F.; Wu, Y.-M.; Vats, P.; Chugh, R.; Worden, F.; Smith, D.C.; Schuetze, S.M.; Zalupski, M.M.; Sahai, V.; Alva, A.; et al.Assessment of Clinical Benefit of Integrative Genomic Profiling in Advanced Solid Tumors. JAMA Oncol. 2021, 48109, 1–9.[CrossRef]
200. Sicklick, J.K.; Kato, S.; Okamura, R.; Schwaederle, M.; Hahn, M.E.; Williams, C.B.; De, P.; Krie, A.; Piccioni, D.E.; Miller, V.A.; et al.Molecular profiling of cancer patients enables personalized combination therapy: The I-PREDICT study. Nat. Med. 2019, 25,744–750. [CrossRef] [PubMed]
201. Yang, R.; Niepel, M.; Mitchison, T.K.; Sorger, P.K. Dissecting Variability in Responses to Cancer Chemotherapy Through SystemsPharmacology. Clin. Pharmacol. Ther. 2010, 88, 34–38. [CrossRef] [PubMed]
202. Niikura, N.; Shimomura, A.; Fukatsu, Y.; Sawaki, M.; Ogiya, R.; Yasojima, H.; Fujisawa, T.; Yamamoto, M.; Tsuneizumi, M.;Kitani, A.; et al. Durable complete response in HER2-positive breast cancer: A multicenter retrospective analysis. Breast CancerRes. Treat. 2018, 167, 81–87. [CrossRef]
203. Witzel, I.; Müller, V.; Abenhardt, W.; Kaufmann, M.; Schoenegg, W.; Schneeweiß, A.; Jänicke, F. Long-term tumor remission undertrastuzumab treatment for HER2 positive metastatic breast cancer-results from the HER-OS patient registry. BMC Cancer 2014, 14,806. [CrossRef]
204. Spano, J.-P.; Beuzeboc, P.; Coeffic, D.; Arnould, L.; Lortholary, A.; Andre, F.; Ferrero, J.-M. Long term HER2+ metastatic breastcancer survivors treated by trastuzumab: Results from the French cohort study LHORA. Breast 2015, 24, 376–383. [CrossRef]
205. Jabbour, E.; Kantarjian, H. Chronic myeloid leukemia: 2020 update on diagnosis, therapy and monitoring. Am. J. Hematol. 2020,95, 691–709. [CrossRef] [PubMed]
206. Schork, N.J. Personalized medicine: Time for one-person trials. Nat. Cell Biol. 2015, 520, 609–611. [CrossRef]207. Lillie, E.O.; Patay, B.; Diamant, J.; Issell, B.; Topol, E.J.; Schork, N.J. The n-of-1 clinical trial: The ultimate strategy for individualizing
medicine? Pers. Med. 2011, 8, 161–173. [CrossRef] [PubMed]

Cancers 2021, 13, 6312 26 of 26
208. Antman, E.; Weiss, S.; Loscalzo, J. Systems pharmacology, pharmacogenetics, and clinical trial design in network medicine. WileyInterdiscip. Rev. Syst. Biol. Med. 2012, 4, 367–383. [CrossRef] [PubMed]
209. Hu, C.; Dignam, J.J. Biomarker-Driven Oncology Clinical Trials: Key Design Elements, Types, Features, and Practical Considera-tions. JCO Precis. Oncol. 2019, 2019, 1–12. [CrossRef] [PubMed]
210. Simon, R. Review of Statistical Methods for Biomarker-Driven Clinical Trials. JCO Precis. Oncol. 2019, 1–9. [CrossRef]211. Antoniou, M.; Jorgensen, A.L.; Kolamunnage-Dona, R. Biomarker-Guided Adaptive Trial Designs in Phase II and Phase III: A
Methodological Review. PLoS ONE 2016, 11, e0149803. [CrossRef]212. Antoniou, M.; Kolamunnage-Dona, R.; Jorgensen, A.L. Biomarker-Guided Non-Adaptive Trial Designs in Phase II and Phase III:
A Methodological Review. J. Pers. Med. 2017, 7, 1. [CrossRef]213. Kolch, W.; Fey, D. Personalized Computational Models as Biomarkers. J. Pers. Med. 2017, 7, 9. [CrossRef]