can scientific observations of early life stages be scaled up to the level of a fished population? a...
TRANSCRIPT
Fisheries Research 65 (2003) 33–46
Can scientific observations of early life stagesbe scaled up to the level of a fished population?
A case study usingHomarus americanus
Lewis S. Incze∗,1, Nicholas Wolff1, Richard A. WahleBigelow Laboratory for Ocean Sciences, West Boothbay Harbor, ME 04575, USA
Abstract
Ecological studies of the early life stages of benthic crustaceans are typically conducted at small scale to measure processessuch as settlement and survival and the factors that affect them. A test of the measurements is whether or not the results of suchstudies can be extrapolated successfully to the level of a population. Do the data and inferences fit within the geographic spaceand the relatively few, available population reference points? We address this question for the lobster fishery forHomarusamericanus in Lincoln County, Maine, USA, by constructing a life table linking all stages from egg production to the fisheryusing an age-structured model. We used early life history data (postlarvae and early benthic stages) from 1989 to 1995 andfisheries data from 1995 to 2001, a time lag that is appropriate for newly settled lobsters to enter the fishery. We used inversemethods to estimate the total number of settlers (Young-of-Year) needed to maintain the population and harvest of the late1990s at steady state; we then estimated the amount of habitat needed to accommodate those settlers based on observedsettlement densities. This was compared to the available space identified using a geographic information system (GIS). Wepredict that the population of lobsters from which the fishery is extracted can be supported by YOY settlement in 7–16% of thesublittoral area shallower than 20 m, a proportion that surveys confirm is available. We obtained an average larval mortalityrate of≤0.07 per day and we estimated that∼2.5% of planktonic postlarvae settle successfully. The amount of egg productioninferred by the model is easily accounted for by the abundance of sexually mature females in a recent survey.© 2003 Elsevier B.V. All rights reserved.
Keywords: Lobster;Homarus americanus; Life table; Recruitment; Settlement; Mortality; Larvae; Postlarvae
1. Introduction
Collectively, studies of early life stages provide in-sight into the diversity of mechanisms by which ma-rine animal populations maintain themselves, and thebiotic and abiotic factors that influence their distribu-tion and abundance. Studies of individual taxa may be
∗ Corresponding author.E-mail address: [email protected] (L.S. Incze).
1 Present address: Bioscience Research Institute, University ofSouthern Maine, 96 Falmouth St., Portland, ME 04104-9300, USA.
conducted for heuristic or practical reasons. Vital ratesimportant in such studies include fecundity, egg con-dition, feeding, growth, predation and disease (factorsaffecting survival), while environmental forcing suchas temperature, transport and turbulence can modifythese rates or directly impact distributions. Interactionsamong the factors can be complex, leading to greatuncertainty when predicting future population trendsor attempting to explain observed changes. For com-mercially exploited species, a fundamental challengeis simply distinguishing between fishery-related andnatural fluctuations. It is difficult to maintain support
0165-7836/$ – see front matter © 2003 Elsevier B.V. All rights reserved.doi:10.1016/j.fishres.2003.09.005
34 L.S. Incze et al. / Fisheries Research 65 (2003) 33–46
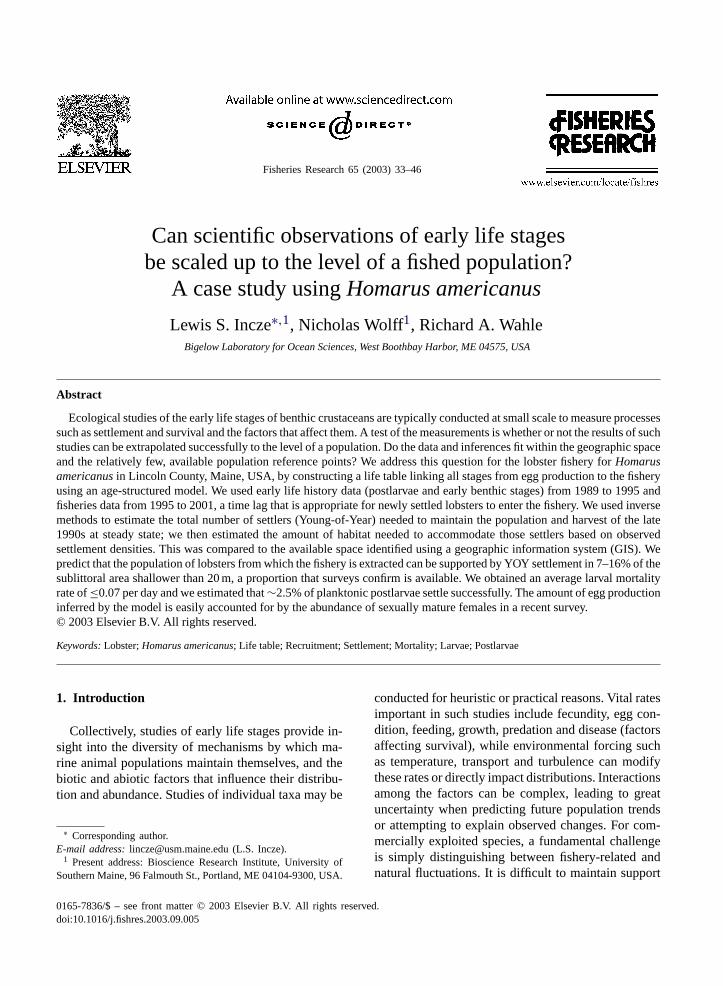
Fig. 1. Gulf of Maine (left panel) showing the 100 m isobath, the postlarvae sampling area off Seabrook, NH, and the location of LincolnCounty, ME (study area). Right panel shows an enlargement of Lincoln County, Maine with the 50 m isobath. Locations north of the heavylines were not included in calculations of benthic habitat area for settlement.
for regulatory actions when this distinction cannot bemade convincingly.
Fisheries surveys and process-level research areconducted at different scales. The high resolution re-quired for process-oriented research usually dictatesfocus on a small area or a small portion of the pop-ulation. For benthic crustaceans, one area of focus isthe distribution, abundance and vital rates of small,early life stages where rate-determining processescan have large numerical impacts on recruitment (seereview byWahle, 2003). Results of such studies canindicate important population processes, but one facesthe question of whether the findings can be quanti-tatively scaled up to cover a much larger segment ofthe population. We examine this question for lobsters,Homarus americanus, in the western Gulf of Maine(Fig. 1), where we attempt to link data on postlarvaeand settlers with the fishery.
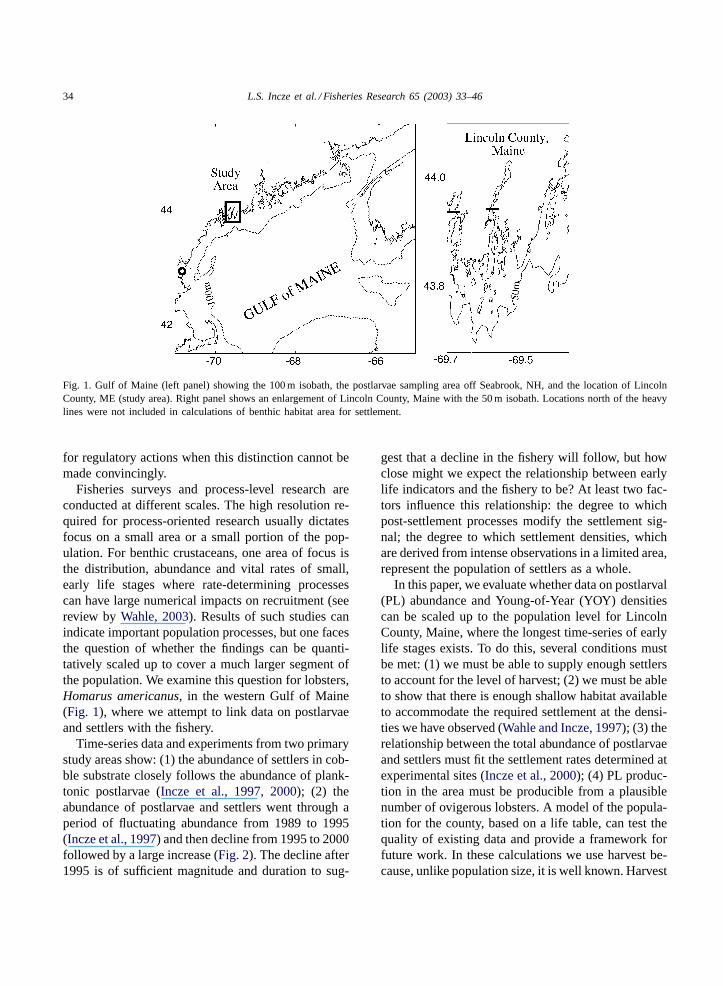
Time-series data and experiments from two primarystudy areas show: (1) the abundance of settlers in cob-ble substrate closely follows the abundance of plank-tonic postlarvae (Incze et al., 1997, 2000); (2) theabundance of postlarvae and settlers went through aperiod of fluctuating abundance from 1989 to 1995(Incze et al., 1997) and then decline from 1995 to 2000followed by a large increase (Fig. 2). The decline after1995 is of sufficient magnitude and duration to sug-
gest that a decline in the fishery will follow, but howclose might we expect the relationship between earlylife indicators and the fishery to be? At least two fac-tors influence this relationship: the degree to whichpost-settlement processes modify the settlement sig-nal; the degree to which settlement densities, whichare derived from intense observations in a limited area,represent the population of settlers as a whole.
In this paper, we evaluate whether data on postlarval(PL) abundance and Young-of-Year (YOY) densitiescan be scaled up to the population level for LincolnCounty, Maine, where the longest time-series of earlylife stages exists. To do this, several conditions mustbe met: (1) we must be able to supply enough settlersto account for the level of harvest; (2) we must be ableto show that there is enough shallow habitat availableto accommodate the required settlement at the densi-ties we have observed (Wahle and Incze, 1997); (3) therelationship between the total abundance of postlarvaeand settlers must fit the settlement rates determined atexperimental sites (Incze et al., 2000); (4) PL produc-tion in the area must be producible from a plausiblenumber of ovigerous lobsters. A model of the popula-tion for the county, based on a life table, can test thequality of existing data and provide a framework forfuture work. In these calculations we use harvest be-cause, unlike population size, it is well known. Harvest
L.S. Incze et al. / Fisheries Research 65 (2003) 33–46 35
Fig. 2. Panel A shows the annual mean integrated PL abundance at Seabrook, NH with 1 S.D. bars. Panel B shows the mean annual YOYdensity from eight Lincoln County sites with standard error bars.
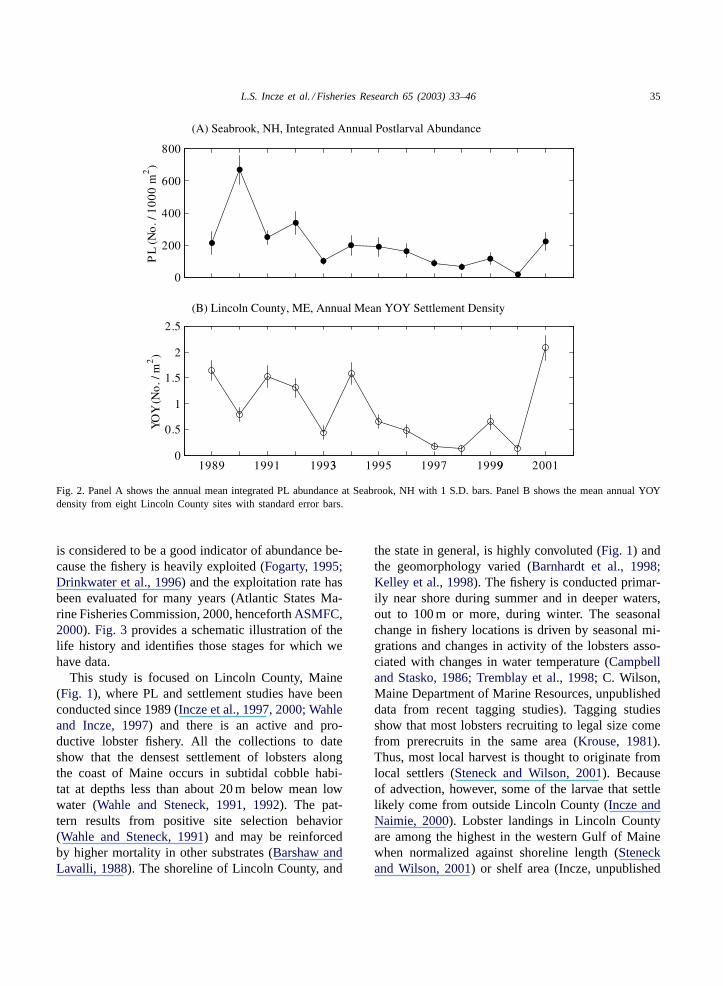
is considered to be a good indicator of abundance be-cause the fishery is heavily exploited (Fogarty, 1995;Drinkwater et al., 1996) and the exploitation rate hasbeen evaluated for many years (Atlantic States Ma-rine Fisheries Commission, 2000, henceforthASMFC,2000). Fig. 3 provides a schematic illustration of thelife history and identifies those stages for which wehave data.
This study is focused on Lincoln County, Maine(Fig. 1), where PL and settlement studies have beenconducted since 1989 (Incze et al., 1997, 2000; Wahleand Incze, 1997) and there is an active and pro-ductive lobster fishery. All the collections to dateshow that the densest settlement of lobsters alongthe coast of Maine occurs in subtidal cobble habi-tat at depths less than about 20 m below mean lowwater (Wahle and Steneck, 1991, 1992). The pat-tern results from positive site selection behavior(Wahle and Steneck, 1991) and may be reinforcedby higher mortality in other substrates (Barshaw andLavalli, 1988). The shoreline of Lincoln County, and
the state in general, is highly convoluted (Fig. 1) andthe geomorphology varied (Barnhardt et al., 1998;Kelley et al., 1998). The fishery is conducted primar-ily near shore during summer and in deeper waters,out to 100 m or more, during winter. The seasonalchange in fishery locations is driven by seasonal mi-grations and changes in activity of the lobsters asso-ciated with changes in water temperature (Campbelland Stasko, 1986; Tremblay et al., 1998; C. Wilson,Maine Department of Marine Resources, unpublisheddata from recent tagging studies). Tagging studiesshow that most lobsters recruiting to legal size comefrom prerecruits in the same area (Krouse, 1981).Thus, most local harvest is thought to originate fromlocal settlers (Steneck and Wilson, 2001). Becauseof advection, however, some of the larvae that settlelikely come from outside Lincoln County (Incze andNaimie, 2000). Lobster landings in Lincoln Countyare among the highest in the western Gulf of Mainewhen normalized against shoreline length (Steneckand Wilson, 2001) or shelf area (Incze, unpublished
36 L.S. Incze et al. / Fisheries Research 65 (2003) 33–46
Fig. 3. Schematic illustration of the life history model used in this study. OAF: ovigerous adult females; SI=>PL are planktonic stages,larval stages I–III and the postlarva; YOY: Young-of-Year (settlers); 1–8+ are benthic stages where number denotes age, in years. Underlinedportions are stages/ages with field data. Three rates connecting life history stages are shown: 0.64 is the proportion of extruded eggs thathatch; settlement is the proportion of postlarvae that settle as YOY; 0.74 is the annual fishing mortality rate.
data). For the year 2000, harvests were approximately5.6× 103 kg/km of shoreline and 3.4× 10⁶ kg/km2 ofshelf area<100 m deep (precise numbers differ withthe database used).
Landings data are collected by county, and recentlyinstituted local management zones are only slightlydifferent in size. This makes the county a practicalscale at which to attempt a life history model. Seasampling aboard commercial fishing boats using mod-ified (no escape vents) and unmodified commercialtraps provides data on sublegal (<83 mm CL) and pro-tected (e.g., ovigerous) lobsters that do not appear inthe commercial catch statistics. A recent trawl surveyof inshore waters provides abundance estimates forlobsters by size and sex for trawlable bottom.
2. Materials and methods
We divided our calculations into two sections deal-ing separately with benthic and pelagic life stages.Both sections were solved by inverse procedures toanswer the following questions, assuming a popula-tion in steady state (same annual fecundity, recruit-ment, growth, mortality, and fishing harvest): (1) Howmany YOY are needed to maintain the population and
yield the recent average levels of harvest in LincolnCounty? (2) Can the total population of YOY fit intothe amount of space available in the county basedon scientific observations of settlement densities andhabitat association? (3) If the local benthic populationand processes are typical of a larger area, and advec-tive gains and losses are equal, what are the inferredaverage larval mortality and settlement rates? (4) Howwell do the modeled abundances fit the observations?
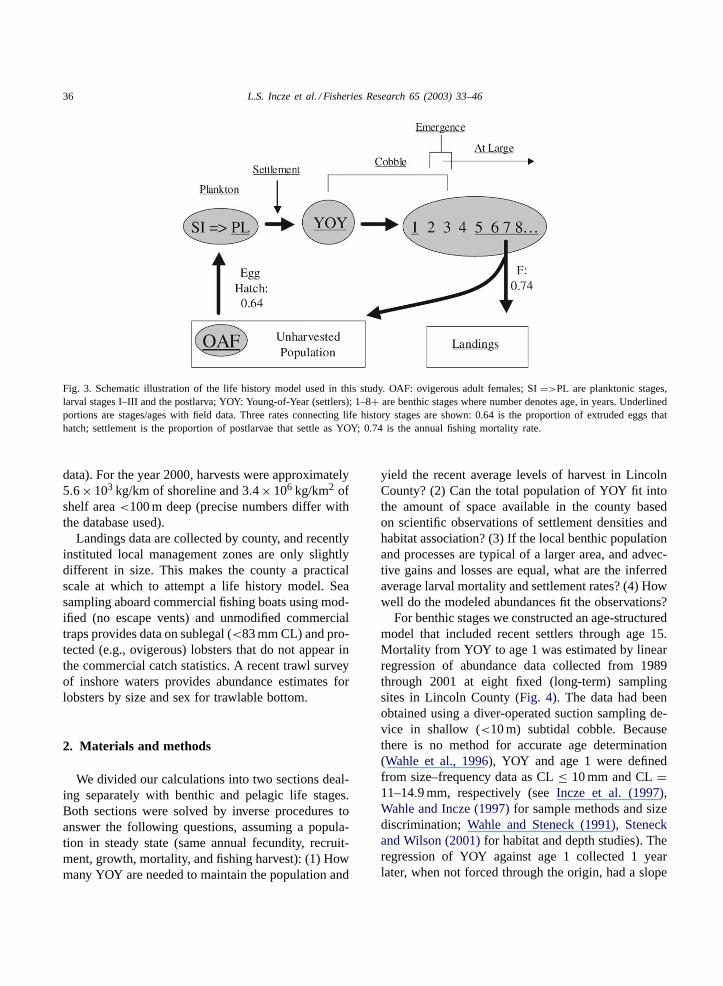
For benthic stages we constructed an age-structuredmodel that included recent settlers through age 15.Mortality from YOY to age 1 was estimated by linearregression of abundance data collected from 1989through 2001 at eight fixed (long-term) samplingsites in Lincoln County (Fig. 4). The data had beenobtained using a diver-operated suction sampling de-vice in shallow (<10 m) subtidal cobble. Becausethere is no method for accurate age determination(Wahle et al., 1996), YOY and age 1 were definedfrom size–frequency data as CL≤ 10 mm and CL=11–14.9 mm, respectively (seeIncze et al. (1997),Wahle and Incze (1997)for sample methods and sizediscrimination;Wahle and Steneck (1991), Steneckand Wilson (2001)for habitat and depth studies). Theregression of YOY against age 1 collected 1 yearlater, when not forced through the origin, had a slope

L.S. Incze et al. / Fisheries Research 65 (2003) 33–46 37
Fig. 4. Regression results for mean YOY densities versus mean 1-year-old densities the following year. Linear regressions are shown withand without forcing through the origin. Linear and non-linear regressions forced through the origin were not statistically significant.
(=survivorship) of 0.46 and was statistically signifi-cant (P = 0.0021). In theory, the regression shouldpass through the origin because there is no detectableemigration or immigration at this size (Wahle andIncze, 1997). However, linear (slope= 0.81) andnon-linear regressions forced through the origin werenot statistically significant (P > 0.05; Fig. 4). Wedid not know if the positivey-intercept in the firstregression was the result of an incorrect slope (mea-surement bias at one end of the YOY data range), ora correct slope with a consistent bias toward highery values (i.e., upward translation of the otherwisecorrect relationship). We bracketed the uncertaintyby using three natural mortality rates (M) defined bythe two linear regressions and an intermediate slope.Thus, the estimates forM during the first year ofbenthic life were 0.2, 0.4 and 0.6.
The abundance of age-classes 2 and 3 in the settle-ment habitat is difficult to assess because of unknownmolt frequencies (which affect size composition of acohort) and increasing potential to migrate (which af-fects abundance:Wahle and Incze, 1997). We there-fore estimatedM for ages 2 and 3 as either the sameas the first year, in the case of the lowest initial mor-
tality rate, or slightly decreasing after age 1 (Tables 1and 2). For ages 5 onward we usedM = 0.15 fromthe stock assessment documents (ASMFC, 2000). Forage 4 we assigned values midway between those usedfor ages 3 and 5. We usedF = 0.74 for the annualfishing mortality rate (ASMFC, 2000). The quality ofthese assumptions and their effects on model calcula-tions are addressed inSection 4. We followed the twosexes independently because of unequal fishery effects(see below).
We used the mortality schedules discussed above toinversely solve for the number of YOY needed to sup-ply adult lobsters to the fished population. Because ofvariable growth and development within a population,
Table 1Natural mortality schedules used from YOY through age 4
Age at end of year Mortality schedules
M1 M2 M3
1 0.2 0.4 0.62 0.2 0.3 0.43 0.2 0.3 0.34 0.175 0.225 0.225

38 L.S. Incze et al. / Fisheries Research 65 (2003) 33–46
Table 2Model results beginning at age 5a
Age at end of year Males remaining Females remaining Reproductive females Males harvested Females harvested
5 1060 1068 27 204 1966 666 721 152 302 2417 251 381 257 275 1938 103 272 272 113 569 42 234 234 46 b
10 17 202 202 1911 7 174 174 812 3 149 149 313 1 129 129 114 0.5 111 111 0.515 0.2 95 95 0.2
a Results are based on 10,000 YOY and M2 for the first 4 years (see above). “Remaining” lobsters are at the end of the year. Harvestedlobsters are total for the year. F= 0.74 and M= 0.15.
b The drop-off in females after age 8 is due to conservation measures, which are modeled with 100% compliance.
a cohort recruits to commercial legal size and repro-ductive maturity over a number of years (Fogarty,1995). We assumed that 10% of individuals were sex-ually mature at the time they first entered legal size forthe fishery (83 mm CL), regardless of age, and that theremainder of the group that attained legal size togetherreached sexual maturity 1 year later. The first assump-tion is a good fit to the observed maturity ogives basedon egg extrusion, whereas the latter may be too rapidfor females based on molt frequencies (see Fig. 4 ofFogarty (1995)). Entry into the fishery begins at age5 in the model and all individuals are recruited to thefishery and sexually mature by the end of year 8. En-try into legal size was modeled as being normally dis-tributed with a standard deviation of 1 about a meanage of 6.5 years. Thus, growth itself was not modeled,but its variation within a cohort was represented by the4-year entry period into the fishery and the staggeredattainment of sexual maturity. The age composition ofthe catch resulted from the above specifications in themodel and was not determineda priori. The sex ratioremained 1:1 except when lobsters entered the fishery,after which the ratio becomes skewed by a prohibi-tion on harvesting ovigerous females and the practiceof marking egg-bearing females that are caught todeter subsequent harvest of brood stock (the mark ismade by cutting a V-shaped notch into a uropod). Ourmodel assumed 100% compliance with this practice.
The model assumed a steady state (constant annualreproduction, recruitment, growth and mortality) andwas run iteratively to yield one female lobster at age
8. This resulted in a distribution of numbers acrossthe other age classes, which can be interpreted as thechange in abundance of a single cohort through timeor the frequency distribution of ages in a steady statepopulation. Age 8 was selected as a benchmark be-cause it is the first age we specified as completely re-cruited to the reproductively mature population. Wecompared the number of legal lobsters harvested withthe number of mature females in the model for com-parison with harvest and survey statistics in order toevaluate model performance.
The number of YOY needed to support the current,exploited population in Lincoln County was estimatedfrom model results by multiplying YOY needed perharvested lobster by the average number of lobsterslanded. The latter was taken as the average harvestfrom 1995 to 2000 (2,044,150 kg per year, coefficientof variation = 8.4%) divided by the average weightper harvested lobster (0.59 kg) to give an estimatedannual harvest of 4.7 × 10⁶ lobsters. The amount ofhabitat required to support the YOY was determinedby dividing the total YOY by the mean density of set-tlers from 1989 to 1995 (1.14 m−2; Incze et al., 1997;the time separation of the two sets of field data is com-mensurate with the approximate growth rate of lob-sters). We compared the total space required for set-tlement with the available space (area and substratetypes) at depths<20 m deep using a geographic in-formation system (GIS) database based onBarnhardtet al. (1998)and Kelley et al. (1998). We excludedlarge sections of upper estuaries (the Damariscotta and

L.S. Incze et al. / Fisheries Research 65 (2003) 33–46 39
Sheepscot rivers, seeFig. 1) where there appears to belittle settlement (Wahle, 1993).
We estimated the mortality rate from stage I (SI)larvae (just after hatching) to YOY lobsters for spawn-ing frequencies of 0.33 and 0.50. These ratios meanthat a sexually mature female produces a clutch ofeggs once every other year (frequency= 0.5) orevery third year (0.33). Alternatively, one-half orone-third of the females are egg-bearing in any givenyear. For egg production we used a 90 mm carapacelength female, the fecundity relationship published byEstrella and Cadrin (1995), and an egg survival rateof 0.64 from extrusion to hatching (Perkins, 1971).The “mortality” from SI to YOY as calculated aboveactually involves two distinct loss terms: the averagemortality experienced in the plankton (larval stagesI–III and the postlarvae) and the average proportionof competent postlarvae that failed to settle. We triedto narrow the range of likely values for these two pro-cesses by estimating PL production (postlarvae perunit area per season) in the model (we divided post-larvae per unit area by development time) and com-paring it with previously published field estimates forLincoln County (Incze et al., 1997). Using the fielddata, we were able to constrain our estimates of theproportion of postlarvae settling, and that constraintenabled us to narrow our estimates of larval mortalityrates.
We used a planktonic development time of 35 daysto produce postlarvae at midpoint of their develop-ment, thereby competent to settle (Cobb et al., 1989).This development time is a compromise between thetemperature-dependent rates derived from laboratorystudies (MacKenzie, 1988; Incze et al., 1997) and theshorter development times reported in rearing experi-ments byWaddy et al. (1995)and suggested by othercalculations (Incze and Naimie, 2000). Caddy (1979)and Hudon and Fradette (1988)reported field esti-mates of about 35 days at temperatures similar to thosein our field studies in Lincoln County. We tested thesensitivity of the relationship using the fastest and theslowest development times predicted by the above ci-tations.
Finally, we used the estimated planktonic mortal-ity and spawning frequencies to calculate the numberof ovigerous females needed to produce the requiredsettlement and compared it with recent trawl surveyresults. We also calculated the ratio of landed lobsters
to ovigerous lobsters in the model and compared thatwith sea-sampling data from fishing vessels.
3. Results
The mortality schedules used in the model are givenin Tables 1 and 2. Table 1lists the three sets of nat-ural mortality rates used from YOY through age 4.Table 2shows the single natural mortality scheduleused for age 5 and above, and gives model results fora fished population based on an initial year-class of10,000 YOY and the middle (M2) mortality schedulefrom Table 1. Fishing mortality affected only the le-gal portion of the population, resulting in a divergenceof sex ratios beginning at age 5 due to protection ofovigerous and V-notched females. The high initial set-tlement was used so that all ages would have somenumbers. The numbers can be interpreted as the abun-dance of a single cohort through time or as the abun-dance of age groups in a steady state population withannual settlement of 10,000 YOY.
The composition of the catch is shown inFig. 5A,indicating that most of the harvest is from 5 to 7 yearsold with a peak at age 6. Model results indicate thatfemales comprise a significant portion of the catchthrough age 8. The drop in female harvest from age8 to 9 is a function of the modeled parameters offull maturity and full compliance with conservationmeasures after age 8. This assumption leads to a highlyskewed sex ratio among older individuals.Fig. 5Billustrates the change in abundance of females andthe phasing in of sexual maturity in the unharvestedportion of the fished population. The peak abundanceof sexually mature female lobsters in this scenariooccurs at age 8.
Tables 3 and 4give results when the model illus-trated inTables 1 and 2is used to solve for the num-ber of YOY needed to producex lobsters of a given
Table 3Number of YOY required to produce one reproductive female atage 8 (peak abundance) for the three mortality schedules
Mortality schedule Fished Unfished
M1 23.5 7.9M2 36.6 12.4M3 49.5 16.7

40 L.S. Incze et al. / Fisheries Research 65 (2003) 33–46
2 4 6 8 10 12 140
0.05
0.1
0.15
0.2
Prop
ortio
n
MaleFemale
2 4 6 8 10 12 140
0.1
0.2
0.3
Age
Prop
ortio
n
TotalMature
(A) Harvested Age Distribution
(B) Unharvested Female Age Distribution
Fig. 5. Using mortality schedule M2 fromTables 3 and 4, panelA shows the age and sex distribution of harvested lobsters andpanel B shows the age distribution of the total of unharvestedfemales+ reproductive females.
characteristic. To produce one sexually mature femaleat age 8, the fished population requires approximatelythree times the number of settlers as an unfished pop-ulation. The difference is the result of exploitation,which removes a large portion of females before theyreach age 8. The number of settlers required per har-vested lobster is about one-sixth the number requiredto produce one female at age 8 in the fished popu-lation, i.e., six harvested lobsters are taken for every
Table 4Number of YOY required to sustain fishery for both per harvested lobster and for total landings (also shown is the proportion of the0–20 m habitat (1.59× 10⁸ m2) in Lincoln County required by the total YOY at a density of 1.14 m2)
Mortality schedule YOY for per lobster harvested YOY for total landings Proportion 0–20 m habitat needed
M1 3.8 1.3× 10⁷ 0.07M2 6.0 2.1× 10⁷ 0.12M3 8.1 2.8× 10⁷ 0.16
female that attains age 8. The ratio of legal:age 8 fe-males in an unfished population model run is 2.
The number of YOY required to sustain the pop-ulation of lobsters in Lincoln County under presentlevels of exploitation ranges from 1.3 to 2.8×10⁷ de-pending on the mortality schedule used for the first 4years after settlement (Tables 3 and 4). Using the es-timated YOY needed per harvested lobster (Table 4)and an average density of 1.14 YOY/m2, we projecta need for 1.28 to 2.10 × 10⁷ m2 of settled habitat.Lincoln County has 1.82× 10⁸ m2 of subtidal bottomarea shallower than 20 m. Thus, 7–11.5% of that depthzone would be required for settlement. The 0–20 m(subtidal) area is classified as 54% mud, 41% rock,4.6% sand and 0.4% gravel. The relationship betweenthese broad substrate characterizations and the knownsettlement substrates is deferred toSection 4.
The total number of ovigerous females was calcu-lated by back-calculating from the average total num-ber of YOY needed to produce the population, ac-counting for the average losses from egg extrusion tosettlement. This gave 1.66 × 10⁶ ovigerous femalesand a ratio of harvested lobsters:ovigerous females of3.9. The total sexually mature female population wasestimated as 3.31 to 4.97× 10⁶ lobsters using spawn-ing frequencies of 0.5 and 0.33, respectively. A trawlsurvey transect in Lincoln County in 2000 gave an es-timate of 9.8 × 10⁶ sexually mature female lobstersfor the county based on the size-at-maturity ogivesgiven inFogarty (1995); (unpublished trawl data fromC. Wilson, Maine Department of Marine Resources,Boothbay Harbor, ME).
The number of mid-development postlarvae (com-petent to settle) that are needed to support the aboveYOY totals was derived as
No. of competent PL= YOY
PPLS(1)
where PL is the postlarvae, YOY the Young-of-Year,and PPLS the proportion of postlarvae that settle. Tak-

L.S. Incze et al. / Fisheries Research 65 (2003) 33–46 41
Fig. 6. Relationship between annual PL production (PL/1000 m2) and total YOY settlement for various proportions of postlarvae that settle(PPLS). The shaded area is the range of PL production estimates from field studies conducted during 1989–1995 (fromIncze et al., 1997);the mean for the period was 119 PL/1000 m2 (heavy dashed line).
ing the number of postlarvae fromEq. (1) and theshelf area inside the 50 m isobath (350× 108 m2), weestimated the total number of postlarvae (=net pro-duction) per area:
No. of PL/m2 = total no. of PLs
350× 108 m2(2)
CombiningEqs. (1) and (2), we calculated the rela-tionship between predicted YOY needed (determinedby our model) and the per unit area production ofpostlarvae expected in the waters of Lincoln County(Fig. 6). The range of possible values for PL pro-duction is large, but can be constrained by observedvalues for postlarvae during the period leading to thecurrent harvests. PL production estimated byInczeet al. (1997)averaged 119/1000 m2, with a standarddeviation of 57/1000 m2 and a median of 92/1000 m2
(range= 68–227/1000 m2). This constraint indicatesthat a good estimate of PPLS is about 0.025 (Fig. 6).That is, approximately 2.5% of all postlarvae withinthe 50 m isobath settle. Corresponding larval mortality
rates (Fig. 7) are 0.07 per day using a spawning fre-quency of 0.5 (Fig. 7A) and the average YOY needed(mortality schedule M2;Fig. 7B) and a developmenttime of 35 days (Fig. 7C).
4. Discussion
The main objective of this paper was to determinewhether the findings of spatially limited scientific stud-ies of recruitment processes inH. americanus couldbe scaled up to a larger geographic area and accountfor the landings in a commercial fishery. This is a nec-essary step in the process of building a mechanisticunderstanding of the stock and its fluctuations. To dothis required that we construct a life table for the ben-thic stages. We chose an age-structured model becauseof its relative simplicity, an approach that worked rea-sonably well for the types of calculations we neededto perform. There are enough data to constrain andcheck the model’s performance at several steps in the

42 L.S. Incze et al. / Fisheries Research 65 (2003) 33–46
PPL
SPP
LS
0
0.05
0.1
0.15
0
.05
0.1
0 0.05 0.10
0.05
0.1
0.15
0.2
PPL
S
Larval mortality rate (d -1)
Days = 45.5
35
24.5
YOY= 8.14
6.03
3.84
ProportionSpawning = 0.33
0.50
(A)
(B)
(C)
Fig. 7. Relationship between larval mortality rate and the propor-tion of postlarvae settling (PPLS) for three modeled conditions. Inpanel A, the variable is the proportion (0.5 and 0.33) of maturefemales spawning in any 1 year when 6.03 YOY are needed foreach harvested lobster. The planktonic duration,D = 35 days. Inpanel B, the variable is the number of YOY needed for each har-vested lobster whenD = 35 days and the proportion of maturefemales spawning is 0.5. The YOY varies with the post-settlementmortality schedule used (fromTables 3 and 4). In panel C, thevariable is the duration (D) of the planktonic period from hatch-ing to midpoint in PL development when 6.03 YOY are neededfor each harvested lobster and the proportion of mature femalesspawning is 0.5. The dashed line (PPLS= 0.025) is a best-fitestimaion fromFig. 6.
life history, although there remains a great deal of un-certainty in the early benthic mortality rates in partic-ular. As with any model, an important function is toidentify gaps in knowledge. The rates presented hereremain first approximations of average processes. Notonly is it likely that these approximations can be im-proved, but it is also true that any year-to-year ob-servations in nature will reveal considerable variationfrom a modeled, steady state. Indeed, differences inmortality over space and time, and under different bi-otic and abiotic environmental conditions, are impor-tant aspects of population biology that require furtherstudy. Our results provide a framework and target ratesfor comparison. Perhaps most significantly, they indi-cate rough quantitative agreement between early lifehistory data and the fishery. Although the fit betweenthe total YOY needed and the amount of space avail-able is very good, a much better characterization andassessment of settlement and nursery habitat is needed,along with emigration and mortality studies. This in-formation could improve the design and use of YOYsurveys as a forecasting tool.
Our estimates of planktonic mortality were basedon the assumption that advective gains and losses wereequal. The assumption was necessitated by a lackof detailed knowledge of hatching distributions andocean circulation, but recognition that the local popu-lation is almost certainly not a closed one (Incze andNaimie, 2000). The assumption has a minor effecton calculations if the relative contribution of distantsources of larvae is not too large, or if the externalsource region(s) have similar female populations andlarval concentrations. None of these conditions canbe verified presently. Yet, the calculated mortality rate(∼0.07 per day) is not out of line with other studies ofcrustacean larvae (see later discussion). This strength-ens the conclusion that the early life history data fromLincoln County are consistent with the population dy-namics required to support the large commercial fish-ery. This suggests that additional knowledge of theearly life stages and factors affecting their abundance(for example, the variations shown inFig. 2) shouldlead to improved understanding and prediction of pop-ulation trends. Knowledge of larval source and sinkpatterns is important to this understanding.
Our results indicate that the amount of settlementrequired to support the fishery can be accommodatedin 7–16% of the subtidal area shallower than 20 m in

L.S. Incze et al. / Fisheries Research 65 (2003) 33–46 43
Lincoln County, following the restricted area schemeshown inFig. 1. The range of values corresponds tothe mortality schedules used (Tables 3 and 4). This cal-culation depends only on the inverse solution for ben-thic stages and involves a fairly broad range of mor-tality rates for the first 4 years. The estimate shouldtherefore be quite robust. In an earlier assessment ofbottom habitat in Johns Bay, Lincoln County,Inczeand Wahle (1991)estimated that 16% of the shore-line length was associated with appropriate sublittoralhabitat for lobster settlement, an excellent fit withthese independent calculations and typical of much ofthe Maine coast (Kelley, 1987; Kelley and Belknap,1991). Unfortunately, the geological classifications inthe GIS database are often too general to fully describegood settlement habitat. For example, “rock” includeslarge areas of hard ledge as well as areas with subor-dinate gravel where small lobsters can settle and live.Likewise, side-scan sonar surveys show that areas cur-rently classified as “mud” include areas with signif-icant cobble nursery habitat (Barnhardt et al., 1998),although mud itself does not support high settlementdensities (Wahle and Steneck, 1992). Unfortunately,the side-scan sonar surveys cover only about 10% ofthe area—not enough to make corrections to the gen-eral classification scheme. At this time we have to re-strict our assessment of space needs to the total areainside the 20 m isobath exclusive of the upper estuar-ine areas. An extension of the more detailed character-ization of the benthic habitat would prove extremelyuseful in furthering these analyses and designing sur-vey and experimental work.
Another test of our calculated rates is a comparisonof population settlement rates from the PL stage (thisstudy) with local settlement rates measured byInczeet al. (2000). The area inside the 20 m isobath (1.8 ×10⁸ m2) is 35% of the area inside the 50 m isobathused for the PL population estimate (5.2 × 10⁸ m2).If we use 13% of the area<20 m for settlement (thespace required using mortality schedule 2 to estimatethe number of YOY), then the settlement area is 4.6%of the area inside the 50 m isobath.Incze et al. (2000)calculated that about 0.4% of postlarvae that were ad-vected over a site settled there. If there were no ad-vection, we would expect only 0.018% of the postlar-vae inside the 50 m isobath to settle (0.004× 0.046=1.8×10⁻⁴). However, tidal advection over the knownsettlement sites accounts for about two orders of mag-
nitude increase in average density from PL to YOYover the course of the season (Incze et al., 2000), theactual increase being a function of currents and gen-eral delivery patterns at the particular site in question(Wahle and Incze, 1997). We have used this model tosuccessfully predict settlement densities in subsequentyears in other locations. Using an increase of 100×brings the estimated settlement to approximately 1.8%of all postlarvae inside of 50 m. This is without anypositive effects that wind forcing may have on trans-porting postlarvae toward shore (Incze and Naimie,2000). Our model calculations suggest that∼2.5% ofthe PL population settles (Fig. 6). The two estimatesare not very far apart.
Unexpected results from the model include the largenumber of older female lobsters compared with malesin the exploited population (Tables 1 and 2). We donot know if this is accurate, but the skewed sex ratiosdid not have a large impact on our other calculations.One factor that contributes to the high female ratioamong older individuals is the model specificationthat females are fully protected from harvest after Age8. This cannot be true. Compliance with “V-notching”of ovigerous females is not 100% and, even if itwere, it could not be fully implemented by age 9.V-notching can be done only on ovigerous femalesthat are caught, and alternate years of spawning canresult in many individuals not being notched duringtheir first egg-bearing period. These could be legallycaught and retained in the subsequent year. A certainproportion of the population is probably “missed”in this way for several years. In addition, ovigerousfemales may be less susceptible to trapping due totheir distribution patterns and behavior, thus reducingthe proportion of V-notching. Finally, females maybecome reproductive more slowly than we prescribed,thus prolonging their vulnerability to the fishery.
Our estimate of total sexually mature females isconsiderably lower than the trawl survey, by a factorof 2–3 for spawning frequencies of 0.33–0.5, respec-tively. While it is encouraging to see that the requiredegg production in our life table is easily accounted forby the local population, the difference is large enoughto warrant a closer look at both forms of estimation(models and trawls). It is worth remembering that thedistribution of females contributing to the local settle-ment is unknown, since both local and distant sourcesof hatching are probably involved in supplying post-
44 L.S. Incze et al. / Fisheries Research 65 (2003) 33–46
larvae to this area (Incze and Naimie, 2000). Also, ad-vection probably causes some of the local reproductiveeffort to be lost from the shelf during larval develop-ment, a process that is not explicitly incorporated intothe present calculations. Finally, the recent trawl sur-veys were conducted at an apparent peak of the pop-ulation, whereas the modeled egg production was fora period at the beginning of the 1990s leading up tothe current population. The population size during thisperiod, as indicated by harvest, nearly doubled. Thisaccounts for some of the difference between the es-timated female population in the model and the mostrecent survey.
Our estimated instantaneous mortality rates ofabout 0.07 per day for planktonic stages are similarto field estimates forNephrops norvegicus (Nicholset al., 1987), Cancer pagurus (Nichols et al., 1982),Pandalus jordani (Rothlisberg and Miller, 1982) andCancer magister (Hobbs et al., 1992). Scarratt (1973)reported lower planktonic survival rates forH. ameri-canus larvae and postlarvae in Northumberland Strait(0.11–0.13%), but his rates may have been affectedby uneven gains and losses in the mean circulationthrough his sampling area.Harding et al. (1982)esti-mated survival of 0.2–0.44% from stage I to the fish-ery. This is close to the rate we derive if we accountfor the multiple age- and year-class composition ofthe fishery (seeTables 1 and 2).
Mortality rates probably vary between stages(Sulkin and McKeen, 1989; McConaugha, 1992)due to size, feeding capabilities, energy storage, ver-tical distribution, sensory development and escaperesponses. It can be shown that a wide range ofstage-specific mortality rates could exist within theaverage rate we calculated in the model. These wouldbe important to recognize in any field studies wherea population is being tracked. Furthermore, it wouldbe important for considering the impact of delayedsettlement on the population dynamics. If the PLstage delays settlement if it does not locate suitablehabitat, then the predicted impact of such delays onabundance will vary according to the stage-specificmortality rates (Pechenik, 1990).
If, as our model suggests, only about 2.5% ofpostlarvae settle, then this is a significant filter in re-cruitment, reducing the YOY abundance to∼1% ofthe original SI larvae hatched. Strictly speaking, thisis a pre-settlement filter, but it is distinct from the
“larval mortality” process. Some postlarvae probablysettle elsewhere, in habitats where settlement den-sity or survival is low enough that settlers have notbeen detected (seePalma et al., 1998, 1999; Hecket al., 2001). The contribution of such settlement tothe overall population is unknown at this time. Inter-estingly, our calculations of the required number ofYOY and the amount of shallow (<20 m) settlementhabitat suggest that settlement in deeper water is notneeded to explain the fishery.
Variations in PPLS probably contribute to vari-ations in settlement. This term includes the effectsof variable transport into shallow settlement areas,propensity to settle, survival during the explorationand settlement process (Incze and Wahle, 1991), anddensity-dependent effects at high levels of PL sup-ply/settlement (Incze et al., 2000). While all thesemay play a role, PL abundance alone explained >80%of the variance in YOY abundance from 1989 to 1995at our Lincoln County study sites (Incze et al., 1997).This suggests that larval production, planktonic mor-tality or large-scale advection (into the settlementarea, or not) were the main determinants of initialrecruitment to the benthos. The sampling of YOYlobsters provides an efficient means for documentinginterannual variations in settlement and may prove tobe a useful indicator of future harvests, particularlywhen settlement exhibits multi-year trends. Samplingof egg production patterns, transport and PL survivalmay provide the best clues to the processes causingsettlement to vary.
While better measurement of all the above life his-tory processes is interesting and useful, a completeand accurate accounting for every generation willalways be difficult. We believe that an understand-ing of how specific processes and rates change overspace and time can be fruitful avenues for research,however, particularly with the advent of increasinglysophisticated models that include highly resolvedcirculation and habitat space. We have demonstratedthat a number of research-focused measurements fitwithin the spatial and biological characteristics of afished population, and this context should be usefulfor designing future work. The melding of fisheriesand survey data with local rates of PL supply, YOYand the study of rate-determining steps (pre- andpost-settlement) can help build a mechanistic under-standing of the population that can bridge the gap

L.S. Incze et al. / Fisheries Research 65 (2003) 33–46 45
between ecological investigations and managementapproaches.
Acknowledgements
We thank Carl Wilson, Bob Steneck, Mike Fogarty,Joe Kelley and numerous fishermen for helpful discus-sions en route to this analysis, and Andrew Boyce forGIS data processing. An anonymous reviewer stimu-lated changes that helped clarify the manuscript. Whilemany people have assisted us in the field over thepast 13 years, we wish to especially acknowledge andhonor the contributions of Ms. Terri Ainaire, who diedin a tragic accident, February 2002. Data collectionand analysis was supported at various times by grantsfrom the National Science Foundation, the Maine SeaGrant Program, NOAA/NESDIS, the Maine Depart-ment of Marine Resources, and the Northeast Consor-tium at the University of New Hampshire.
References
Atlantic States Marine Fisheries Commission, 2000. StockAssessment Peer Review Report No. 00-01: Terms of Reference& Advisory Report for the American Lobster Stock AssessmentPeer Review. Atlantic States Marine Fisheries Commission,Washington, DC.
Barnhardt, W.A., Kelley, J.T., Dickson, S.M., Belknap, D.F., 1998.Mapping the gulf of Maine with side-scan sonar: a new bottom-type classification for complex seafloors. J. Coastal Res. 14,646–659.
Barshaw, D.E., Lavalli, K.L., 1988. Predation upon postlarvallobsters Hommarus americanus by cunners Tautogolabrusadspersus and mud crabsNeopanope sayi on three naturalsubstrates: eelgrass, mud and rocks. Mar. Ecol. Prog. Ser. 48,119–123.
Caddy, J.F., 1979. The influence of variations in the seasonaltemperature regime on survival of larval stages of the Americanlobster (Homarus americanus) in the southern Gulf of St.Lawrence. Rapp. P. -v. Reun. Cons. Int. Explor. Mer. 175, 204–216.
Campbell, A., Stasko, A.B., 1986. Movements of the lobsterHomarus americanus tagged in the Bay of Fundy, Canada. Mar.Biol. 92, 393–404.
Cobb, J.S., Wang, D., Campbell, D.B., 1989. Timing ofsettlement by postlarval lobsters (Homarus americanus): fieldand laboratory evidence. J. Crust. Biol. 9, 60–66.
Drinkwater, K.F., Harding, G.C., Mann, K.H., Tanner, N., 1996.Temperature as a possible factor in increased abundance ofAmerican lobster,Homarus americanus, during the 1980s andearly 1990s. Fish. Oceanogr. 5, 176–193.
Estrella, B.T., Cadrin, S.X., 1995. Fecundity of the Americanlobster (Homarus americanus) in Massachusetts coastal waters.ICE Mar. Sci. Symp. 199, 61–72.
Fogarty, M.J., 1995. Population, fisheries and management. In:Factor, J.R. (Ed.), Biology of the LobsterHomarus americanus.Academic Press, San Diego, pp. 47–88.
Harding, G.C., Vass, W.P., Drinkwater, K.F., 1982. Aspects oflarval American lobster (Homarus americanus) ecology in St.Georges Bay, Nova Scotia. Can. J. Fish. Aquat. Sci. 39, 1117–1129.
Heck, J.K.L., Coen, L.D., Morgan, S.G., 2001. Pre- and post-settlement factors as determinants of juvenile blue crabCallinectes sapidus abundance: results from the north-centralGulf of Mexico. Mar. Ecol. Prog. Ser. 222, 163–176.
Hobbs, R.C., Botsford, L.W., Thomas, A., 1992. Influence ofhydrographic conditions and wind forcing on the distributionand abundance of dungeness crab,Cancer magister, larvae.Can. J. Fish. Aquat. Sci. 49, 1379–1388.
Hudon, C., Fradette, P., 1988. Planktonic growth of larval lobster(Homarus americanus) off iles de la Madeleine (Quebec), Gulfof St. Lawrence. Can. J. Fish. Aquat. Sci. 45, 868–878.
Incze, L.S., Naimie, C.E., 2000. Modeling the transport of lobster(Homarus americanus) larvae and postlarvae in the Gulf ofMaine. Fish. Oceanogr. 9, 99–113.
Incze, L.S., Wahle, R.A., 1991. Recruitment from pelagic to earlybenthic phase in lobstersHomarus americanus. Mar. Ecol. Prog.Ser. 79, 77–97.
Incze, L.S., Wahle, R.A., Cobb, J.S., 1997. Quantitativerelationships between postlarval production and benthicrecruitment in lobsters,Homarus americanus. Mar. FreshwaterRes. 48, 729–743.
Incze, L.S., Wahle, R.A., Palma, A., 2000. Advection andsettlement rates in a benthic invertebrate: recruitment to firstbenthic stage inHomarus americanus. ICES J. Mar. Sci. 57,430–437.
Kelley, J., 1987. Sedimentary environments along Maine’sestuarine coastline. In: FitzGerald, D.M., Rosen, P.S. (Eds.),A Treatise on Glaciated Coasts. Academic Press, New York,pp. 151–176.
Kelley, J.T., Belknap, D.F., 1991. Physiography, surficial sedimentsand quaternary stratigraphy of the inner continental shelf andnearshore region of central Maine, United States of America.Cont. Shelf Res. 11, 1265–1283.
Kelley, J.T., Barnhardt, W.A., Belknap, D.F., Dickson, S.M., Kelley,A.R., 1998. The seafloor revealed: the geology of Maine’s innercontinental shelf. A Report to the Regional Marine ResearchProgram. Maine Geological Survey Open-File Report 98-6.
Krouse, J.S., 1981. Movement, growth and mortality of Americanlobsters along the coast of Maine. NOAA Technical ReportNMFS SSRF, 747.
MacKenzie, B.R., 1988. Assessment of temperature effectson interrelationships between stage durations, mortality, andgrowth in laboratory-rearedHomarus americanus MilneEdwards. J. Exp. Mar. Biol. Ecol. 116, 87–98.
McConaugha, J.R., 1992. Decapod larvae: dispersal, mortality, andecology. A working hypothesis. Am. Zool. 32, 512–523.
Nichols, J.H., Thompson, B.M., Cryer, M., 1982. Production, driftand mortality of the planktonic larvae of the edible crab (Cancer

46 L.S. Incze et al. / Fisheries Research 65 (2003) 33–46
pagurus) off the north-east coast of England. J. Sea Res. 16,173–184.
Nichols, J.H., Bennett, D.B., Symonds, D.J., Grainger, R., 1987.Estimation of the stock size of adultNephrops norvegicus (L.)from larvae surveys in the western Irish Sea in 1982. J. Nat.Hist. 21, 1433–1450.
Palma, A.T., Wahle, R.A., Steneck, R.S., 1998. Different earlypost-settlement strategies between American lobstersHomarusamericanus and rock crabsCancer irroratus in the Gulf ofMaine. Mar. Ecol. Prog. Ser. 162, 215–225.
Palma, A.T., Steneck, R.S., Wilson, C.J., 1999. Settlement-driven,multiscale demograhic patterns of large benthic decapods inthe Gulf of Maine. J. Exp. Mar. Biol. Ecol. 241, 107–136.
Pechenik, J.A., 1990. Delayed metamorphosis by larvae of benthicmarine invertebrates: does it occur? Is there a price to pay?Ophelia 32, 63–94.
Perkins, H.C., 1971. Egg losses during incubation from offshorenorthern lobsters (Decapoda: Homaridae). Fish. Bull. 69, 451–453.
Rothlisberg, P.C., Miller, C.B., 1982. Factors affecting thedistribution, abundance, and survival ofPandalus jordani(Decapoda, Pandalidae) larvae off the Oregon coast. Fish. Bull.81, 455–472.
Scarratt, D.J., 1973. Abundance, survival, and vertical anddiurnal distribution of lobster larvae in Northumberland Strait,1962–1963, and their relationships with commercial stocks. J.Fish. Res. B. Can. 30, 1819–1824.
Steneck, R.S., Wilson, C.J., 2001. Large-scale and long-term,spatial and temporal patterns in demography and landings ofthe American lobster,Homarus americanus, in Maine. Mar.Freshwater Res. 52, 1303–1319.
Sulkin, S.D., McKeen, G.L., 1989. Laboratory study of survival andduration of individual zoeal stages as a function of temperaturein the brachyuran crabCancer magister. Mar. Biol. 103, 31–37.
Tremblay, M.J., Eagles, M.D., Black, G.A.P., 1998. Movements ofthe lobster,Homarus americanus, off northeastern Cape BretonIsland, with notes on lobster catchability. Can. Tech. Rep. Fish.Aquat. Sci. 2220, 1–32.
Waddy, S.L., Aiken, D.E., de Kleijn, D.P.V., 1995. Control ofgrowth and reproduction. In: Factor, J.R. (Ed.), Biology ofthe LobsterHomarus americanus. Academic Press, San Diego,pp. 47–88.
Wahle, R.A., 1993. Recruitment to American lobster populationsalong an estuarine gradient. Estuaries 16, 731–738.
Wahle, R.A., Incze, L.S., 1997. Pre- and post-settlement processesin recruitment of the American lobster. J. Exp. Mar. Biol. Ecol.217, 179–207.
Wahle, R.A., Steneck, R.S., 1991. Recruitment habitats and nurserygrounds of the American lobsterHomarus americanus: ademographic bottleneck? Mar. Ecol. Prog. Ser. 69, 231–243.
Wahle, R.A., Steneck, R.S., 1992. Habitat restrictions in earlybenthic life: experiments on habitat selection and in situpredation with the American lobster. J. Exp. Mar. Biol. Ecol.157, 91–114.
Wahle, R.A., 2003. Revealing stock-recruitment relationships inlobsters and crabs: is experimental ecology the key? Fish. Res.65, 3–32.
Wahle, R.A., Tully, O., O’Donovan, V., 1996. Lipofuscin as anindicator of age in crustaceans: analysis of the pigment in theAmerican lobsterHomarus americanus. Mar. Ecol. Prog. Ser.138, 117–123.