can individuals with autism abstract prototypes of natural faces?
TRANSCRIPT
Can Individuals 1
Running head: CAN INDIVIDUALS WITH AUTISM ABSTRACT PROTOTYPES
Can Individuals with Autism Abstract Prototypes of Natural Faces?
Holly Zajac Gastgeb
University of Pittsburgh
Desirée A. Wilkinson
University of Pittsburgh
Nancy J. Minshew
University of Pittsburgh School of Medicine
Mark S. Strauss
University of Pittsburgh
In press: Journal of Autism and Developmental Disabilities
Can Individuals 2
Abstract
There is a growing amount of evidence suggesting that individuals with autism have difficulty
with face processing. One basic cognitive ability that may underlie face processing difficulties is
the ability to abstract a prototype. The current study examined prototype formation with natural
faces using eye-tracking in high-functioning adults with autism and matched controls.
Individuals with autism were found to have significant difficulty forming prototypes of natural
faces. The eye-tracking data did not reveal any between group differences in the general pattern
of attention to the faces, indicating that these difficulties were not due to attentional factors.
Results are consistent with previous studies that have found a deficit in prototype formation and
extend these deficits to natural faces.
Keywords: prototype, autism, face perception, cognition

Can Individuals 3
Can Individuals with Autism Abstract Prototypes of Natural Faces?
It is well-known that individuals with autism have difficulties perceiving and recognizing
faces, including deficits in the categorization of facial gender (e.g., Behrmann et al., 2006; Best,
Minshew, & Strauss, 2010), discrimination of facial expressions, (e.g., Celani, Battacchi, &
Arcidiacono, 1999; Rump, Giovannelli, Minshew, & Strauss, 2009), and face recognition (e.g.,
Klin, Sparrow, de Bildt, Cicchetti, Cohen, & Volkmar, 1999; Lahaie, Mottron, Arguin,
Berthiaume, Jemel, & Saumier, 2006; Newell, Best, Gastgeb, Rump, & Strauss, 2010).
Traditional explanations for these deficits have suggested that individuals with autism focus
more on discrete facial features rather than processing configural information and perceiving
faces in a holistic manner (for review see Dawson, Webb, & McPartland, 2005). In particular, it
has been found that individuals with autism are less affected by the face inversion effect than
typically developing individuals (e.g., Boucher & Lewis, 1992; Klin et al., 1999). Since the
viewing of inverted faces disrupts configural and holistic processes, it has been argued that
individuals with autism rely more on featural processing.
Researchers have traditionally used bottom-up, perceptual explanations to account for
face processing difficulties, arguing that individuals with autism are biased toward processing
local features and are less likely to perceive global patterns (Frith & Happé, 1994; Mottron et al.,
2006). These explanations suggest that the difficulties that arise in face processing are caused by
underlying differences in how the perceptual aspects of faces are processed. Although
differences in these bottom-up processes may exist, it is also clear that the development of
expertise in face processing requires extensive learning that does not reach full maturity until

Can Individuals 4
adolescence or adulthood in typically developing individuals (e.g., Rump et al., 2009; Scherf,
Behrmann, Kimchi, & Luna, 2009). With development, children encounter an increasing number
of people in their environment and learn about faces and how facial dimensions vary. Therefore,
it is critical to consider the impact that top-down processes may have on the face processing
abilities of both typically developing individuals and individuals with autism.
One of the most useful models for understanding how typically developing individuals
organize their developing knowledge of facial information is Valentine’s (1991)
multidimensional experience-based framework for representing and storing faces. This
framework explains how faces are recognized with top-down processing through the
development of an organizational structure that guides face perception. Valentine suggested that
exemplars and prototypical information about faces are stored in an n-dimensional “face space”
representing all possible features used to encode a face, including both featural and configural
information, as well as information used to discriminate faces (e.g., age, gender, and race). The
values of the n-dimensions encoded in the face space depend on an individual’s experience with
faces. The center of this multi-dimensional framework represents the central tendency of all
facial information (prototype), and the distribution of facial features and facial information is
normally distributed around this central tendency. For example, in human faces, there are
variations in dimensions such as the distance between the eyes, the height of the forehead, the
width of the mouth, and so on. The prototype would thus reflect the combined central values
across all of these varying dimensions. As an individual gains experience with faces, these faces
are represented in the face space framework according to the values of facial information. With
experience, the distributions become more refined as more subtle variations are included in the
face space, and the central tendencies of facial dimensions become more accurate. When
Can Individuals 5
presented with a new face, individuals compare it to their learned prototype and use this
information to guide perception, categorization, and recognition.
Valentine’s (1991) face-space theory provides a framework for understanding many face
perception and recognition effects, including the recognition advantage for distinctive faces and
caricatures (e.g., Best & Strauss, 2007; Humphreys, 2003; Rhodes, Brennan, & Carey, 1987), the
classification advantage of gender-typical faces in gender classification tasks (e.g., O’Toole et
al., 1998), and the preference for attractive faces over unattractive faces (e.g., Rubenstein,
Kalakanis, & Langlois, 1999). Thus, the ability to form a face space and a prototype is critical
for multiple aspects of face perception and recognition. Studies have demonstrated that within
the first year, typically-developing infants can form prototypes of faces (Rubenstein et al., 1999;
Strauss, 1979), objects (Younger, 1990) and dot patterns (Younger & Gotlieb, 1998). Evidence
of prototype formation in children and adults comes from studies of the prototype effect—the
tendency to falsely remember a prototype as previously seen despite never actually seeing it. In a
classic study by Posner and Keele (1968), adults trained on dot patterns varying in distortion
levels from a prototype tended to falsely remember the unseen prototype and considered it to be
as familiar as previously seen dot patterns.
Although there has been relatively little research on prototype formation in autism, a few
studies have suggested that individuals with autism are unable to abstract a prototype and do not
exhibit the prototype effect. Klinger and Dawson (2001) found that low-functioning children
with autism were unable to abstract a prototype of simple animal-like categories, a finding that
has recently been replicated with high-functioning children and adults with autism (Klinger,
Klinger, & Pohlig, 2006; Plaisted, 2000). In contrast, Molesworth, Bowler, & Hampton (2005,
2008) did not find evidence of a lack of prototype formation in high-functioning children with

Can Individuals 6
autism spectrum disorder; however, their results may not reflect intact prototype formation
abilities. Aspects of the study design (e.g., the use of obvious features, lacking subtle variation
between feature values, the use of the exact same feature values in the familiarization and test
phase) may have permitted individuals with autism to show a prototype effect due to
memorization of specific features or by focusing on the variations in one feature rather than
forming a prototype.
Only one study to date has examined the ability of individuals with autism to form a
prototype of faces. Gastgeb et al. (2009) tested high-functioning children and adults with autism
and matched controls on a face prototype task using schematic drawings of faces. This task was
patterned after a study originally conducted on both adults and 10-month-old infants (Strauss,
1979). Results indicated that 78% of the adults in the control group chose the prototype face as
more familiar than the face comprised of features that were more frequently seen, while only
55% of the adults with autism chose the prototype. These results add to those of Klinger and
colleagues (2001, 2006) suggesting that in addition to having difficulty with forming a prototype
of animal-like categories, individuals with autism also have difficulty forming prototypes of
facial information.
An inability to form a face space and prototype may contribute to the well-known deficits
in face processing and recognition in autism that were discussed earlier. Therefore, research on
prototype formation and other top-down processes may impact how interventions to improve
face processing and memory are developed. There is growing recognition that interventions
aimed at improving the abilities of individuals with autism need to be tailored to the specific
deficits associated with autism. Interventions aimed at improving the face processing ability of
individuals with autism are beginning to address the specific face processing deficits that appear
Can Individuals 7
to be associated with the disorder (e.g., Tanaka et al., 2010). Thus, the extent to which we can
better understand these deficits, particularly whether they involve basic perceptual bottom-up
processes or higher learning top-down processes, will be critical to the continued development of
effective intervention strategies.
The current study aimed to replicate the findings of previous prototype studies using
natural faces in a group of high-functioning adults with autism. The only previous study on face
prototype formation in autism (Gastgeb et al., 2009) used schematic line drawings of faces rather
than natural faces. The current study utilized natural faces in order to more closely replicate the
facial information that is abstracted in real life categorization. Participants were familiarized with
sets of faces, and after each set, they chose which face was more familiar, the prototype face or a
face comprised of features that were previously seen (mode face). If individuals with autism are
unable to abstract a prototype of facial information, they should not show a prototype effect and
should not choose the prototype faces as more familiar. It is also possible that individuals with
autism who perform well on the face prototype task may differ from those who perform poorly
on the task. Therefore, the current study also explored the distribution of performance in both
groups and the relationship between performance and measures of intelligence or behavioral
symptoms of autism in the autism group.
Participants’ eye movements were also recorded in order to gather vital information about
which areas of the faces individuals with autism and control individuals looked at when viewing
the familiarization stimuli (learning). If there are between group differences in prototype
formation ability, one potential explanation for these differences could be that the groups
differed in the way in which they distributed their attention to the faces and/or facial features.
For example, if the autism group spent less time looking at the faces and more time looking at
Can Individuals 8
the background, they would be less likely to form a prototype during the familiarization phase.
Similarly, if the autism group spent less time looking at relevant facial features such as the eyes,
nose, mouth, and forehead and more time looking at irrelevant features such as the cheeks or
hairline, they would be less likely to form a prototype. Finally, if the autism group focused solely
on one facial feature, this would affect their ability to form a prototype of the entire face.
Therefore, unlike previous prototype formation studies, the current study addressed both if
individuals with autism have difficulty forming prototypes or categories in addition to why they
may have difficulty.
Method
Participants
Participants consisted of 20 high-functioning, adult males with autism and 20 healthy,
control adult males recruited by the Autism Center for Excellence (ACE) at the University of
Pittsburgh. Control participants were matched with participants in the autism group on age, full
scale IQ (FSIQ), verbal IQ (VIQ), and performance IQ (PIQ). All participants had IQ scores
greater than 80 as determined by the Wechsler Abbreviated Scale of Intelligence (WASI;
Wechsler, 1999). Table 1 summarizes the participants’ demographic characteristics. No
significant differences were found between the two groups on age, FSIQ, VIQ, or PIQ.
[place Table 1 about here]
Individuals with autism were recruited through informational visits to service providers
throughout the state of Pennsylvania and the surrounding states, fliers at autism meetings,
advertisements in autism newsletters, and posters. All participants with autism met criteria for
autism on the Autism Diagnostic Observation Schedule (Lord et al., 1989) and the Autism
Diagnostic Interview-Revised (Lord, Rutter, & Le Couteur, 1994), which was verified by expert
Can Individuals 9
clinical opinion. Participants with Asperger’s disorder or Pervasive Developmental Disorder
were excluded. Potential participants with autism were excluded if found to have a history of
seizures or evidence of an associated neurologic, genetic, infectious, or metabolic disorder.
Exclusions were based on physical examination, neurologic history and examination, and
chromosomal analysis.
Control participants were volunteers recruited from the community through
advertisements. Potential control participants were screened by completing family and personal
history questionnaires of medical, neurological, and psychiatric disorders (Adult Symptom
Inventory-4, Gadow, Sprafkin, & Weiss, 1999; Family History Screen, Weissman,
Wickramaratne, Adams, Wolk, Verdeli, & Olfson, 2000). Exclusion criteria included a personal
history of neurological or psychiatric disorders, learning disability, brain injury prior to or after
birth; loss of consciousness; poor school attendance; a medical disorder with implications for the
central nervous system or requiring regular medication usage; a family history in first-degree
relatives of learning disability, mood disorder, or anxiety disorder; and a family history of autism
in first-, second-, or third-degree relatives.
Apparatus
Testing occurred in a quiet, dark laboratory room that simulated a small movie theater
and provided maximum comfort. Each participant was seated in a modified desk chair in front of
a large rear projection movie screen (69 X 91 cm). The testing area was surrounded by black
curtains to reduce distractions. A stand-alone eye-tracker that required no attachments to the
participant was positioned on a table in front of the participant. Stimuli were rear projected onto
the screen using Tobii Studio software, and eye movements were recorded by a Tobii X120
stand-alone eye tracker at a sampling rate of 60 Hz, accuracy of 0.5 degrees of visual angle,

Can Individuals 10
spatial resolution of 0.2 degrees, and drift of 0.3 degrees. The eye-tracker sat 81 cm in front of
the projection screen, and the participants were positioned approximately 162 cm from the
screen. A Dell Dimension 9200 displayed experimental stimuli and recorded eye-movement and
behavioral accuracy data. Responses were recorded by keypad response using a two button
Ergodex DX1 input system response pad. Eye-tracking and behavioral data were processed using
Tobii Studio software, Version 2.0.6.
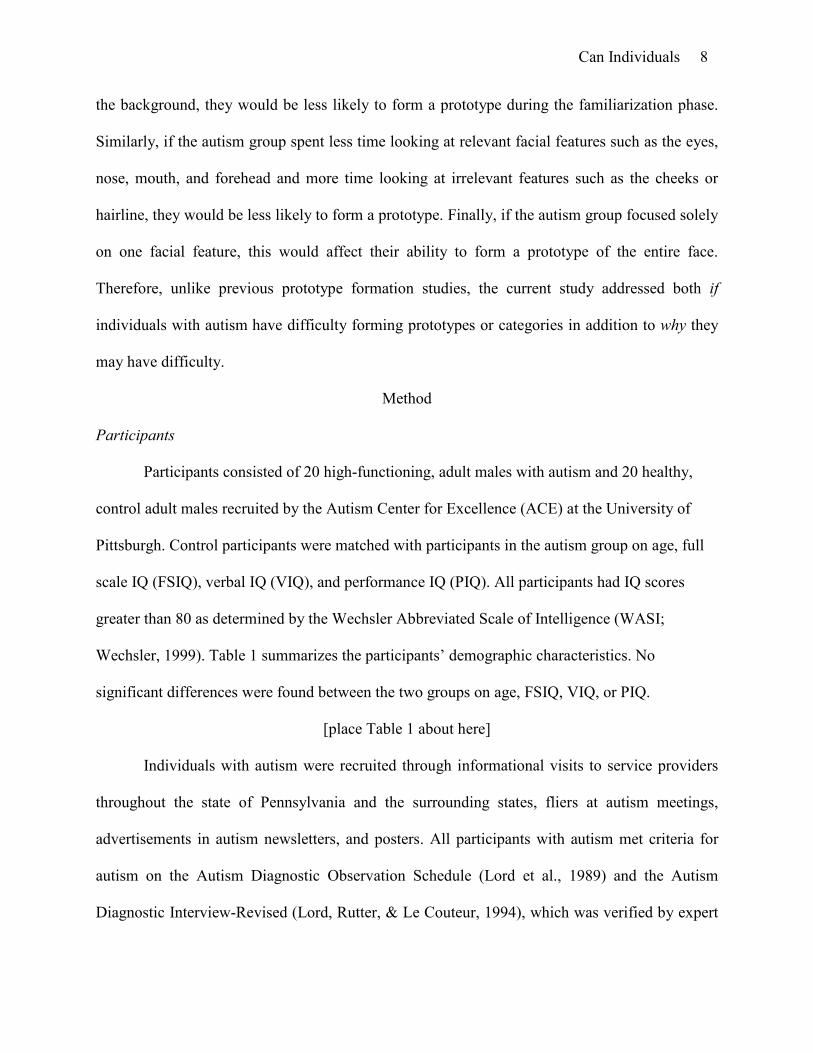
Stimuli
Stimuli consisted of six sets of faces (three sets of male faces and three sets of female
faces) that were approximately 12 x 19 degrees of visual angle. Each set included 20 stimuli (16
familiarization stimuli and four test stimuli) that were created by manipulating specific features
and spatial distances between features of a photograph of a natural face with average features.
The features and spatial distances that were manipulated included nose/mouth distance, nose
width, forehead height, and lip thickness. The non-manipulated original face was designated as
the “Prototype” (see Figure 1).
[place Figure 1 about here]
Faces were generated by manipulating each of the four facial aspects or distances to
either be larger or wider than the original (values 3 and 4) or smaller or narrower than the
original (values 1 and 2) using the Face Fun facial morphing program. No face had the same
feature values as the original, and the facial aspects were manipulated by equal amounts from
one value to the next. For each set of faces, the familiarization stimuli consisted of 16 stimuli and
within these stimuli, each value for each facial aspect or distance was seen four times. For
example, for nose width, four faces had a nose width value of 1, four had a value of 2, four had a
value of 3, and four had a value of 4. Two “Mode” faces, which were comprised of values that

Can Individuals 11
were seen an equal number of times during the familiarization trials but were perceptually the
most different from the prototype value, were also created for each set of faces. One mode face
(Mode 1) was comprised of all of the smallest values of each facial aspect (i.e., all values of 1)
and the other mode face (Mode 2) was comprised of all of the largest values (i.e., all values of 4).
Finally, four possible test stimuli were created for each set of faces in which the prototype face
(original non-manipulated face) was paired with one of the mode faces. For two test stimuli, the
prototype was on the right side of the pair, and for the other two stimuli, the prototype was on the
left side of the pair. Table 2 shows example values of the modified facial aspects for all stimuli
(familiarization, mode, prototype) and includes a note that defines the test stimuli.
[place Table 2 about here]
Familiarization and test stimuli were programmed into four different presentation orders
using Tobii Studio. For each presentation order, the six sets of faces were presented in a different
predetermined order in blocks. In each block, the familiarization stimuli for one set of faces were
presented in randomized order followed by the test trial. This was repeated for a total of six
blocks. Each test stimulus was presented an equal number of times across the four different
presentation orders, and the prototype was presented on the left and on the right an equal number
of times within each presentation order.
Procedure
Participants were told that they would be viewing a series of faces and asked to answer
questions about the faces by making button-press responses. Participants were familiarized with
the eye-tracking equipment and seated in front of the eye-tracker and projection screen. During
the calibration, participants were required to look at the calibration points on the screen in front
of them. The calibration procedure was repeated until it was successful. After the calibration,
Can Individuals 12
participants were instructed to look at the faces on the screen but were not given any other
instructions.
Participants were then shown the first block of familiarization trials consisting of 16
manipulated face stimuli in a randomized order. Based on prior face prototype research (Gastgeb
et al., 2009), the familiarization faces remained on the screen for two seconds with an
interstimulus interval of one second in which a plain white screen was presented. At the end of
the familiarization period, participants were given a response pad with two buttons. Above the
left button was an arrow pointing to the left side of the screen, and above the right button was an
arrow pointing to the right side of the screen. Participants were instructed to press the button
corresponding to the face that looked most familiar to them. Once the participants were ready,
the test trial was presented. This was done to ensure that the participants were attending when the
test trials were presented. There was minimal variation in the time between the familiarization
trials and test trial within and across participants. Each test trial remained on the screen until the
participants responded by pressing a button. This procedure was repeated until all six blocks of
trials were completed. During the entire procedure, the participants’ eye movements and
responses were recorded by Tobii Studio.
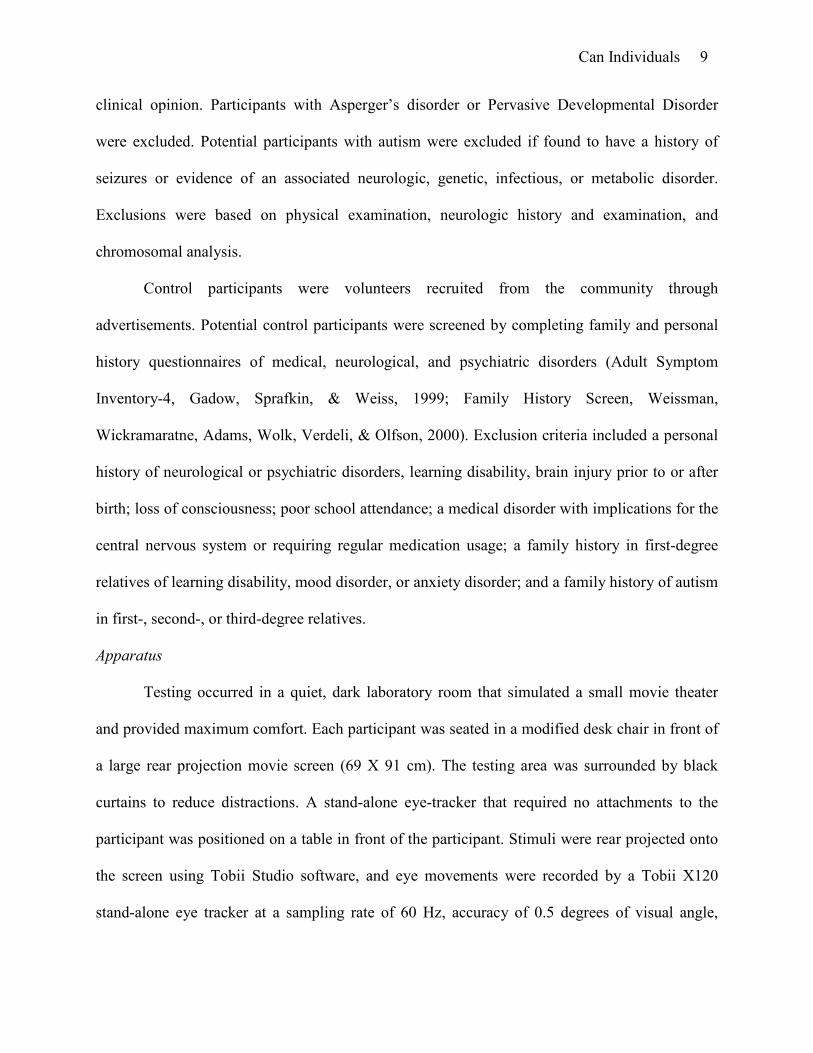
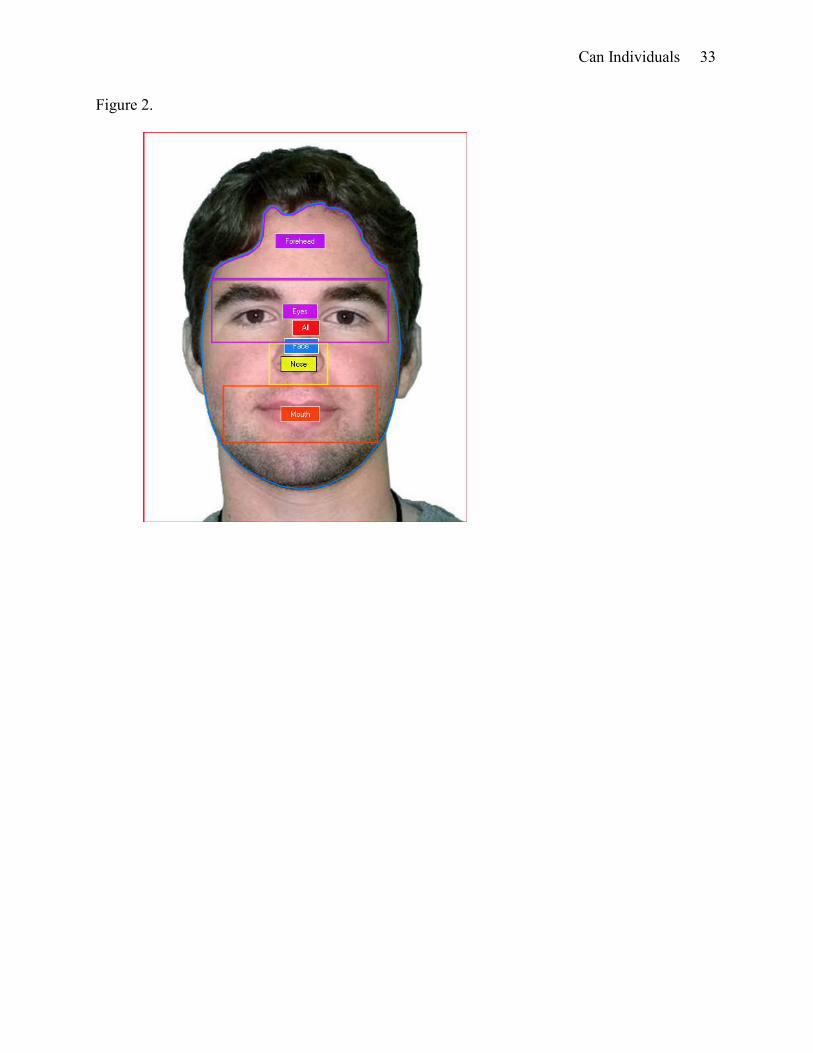
Eye-tracking Data Preparation (Areas of Interest - AOIs)
All familiarization stimuli were partitioned into areas of interest (AOIs) corresponding to
the following areas: eyes (Eyes), nose (Nose), mouth (Mouth), forehead (Forehead), face (Face),
and whole stimulus (All). Figure 2 shows an example of all AOIs.
[place Figure 2 about here]
Results
Can Individuals 13
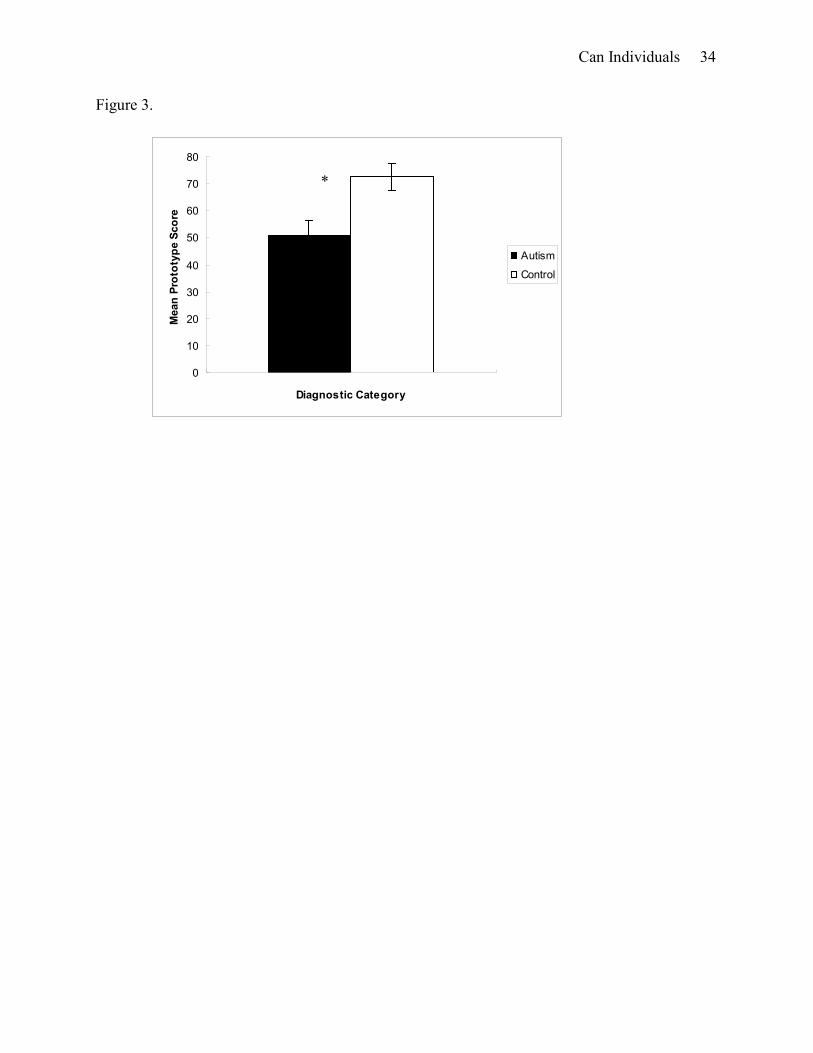
Percent Prototype Selection Data
Between Group Analyses.
A Mean Prototype Score (MPS) was calculated to reflect the average number of times
that the prototype was chosen as familiar across the six test trials. The MPS data is presented in
Figure 3. As can be seen, the autism (M = 50.83%) and control (M = 72.5%) groups significantly
differed in their MPSs, with the control group selecting the prototype faces as familiar more
often than the autism group (t = -2.96, p < .01). While the autism group did not select the
prototype faces as familiar more often than chance (50%) (t = .17, p = .87), the control group
showed clear familiarity for the prototype faces (t = 4.13, p < .01).
[place Figure 3 about here]
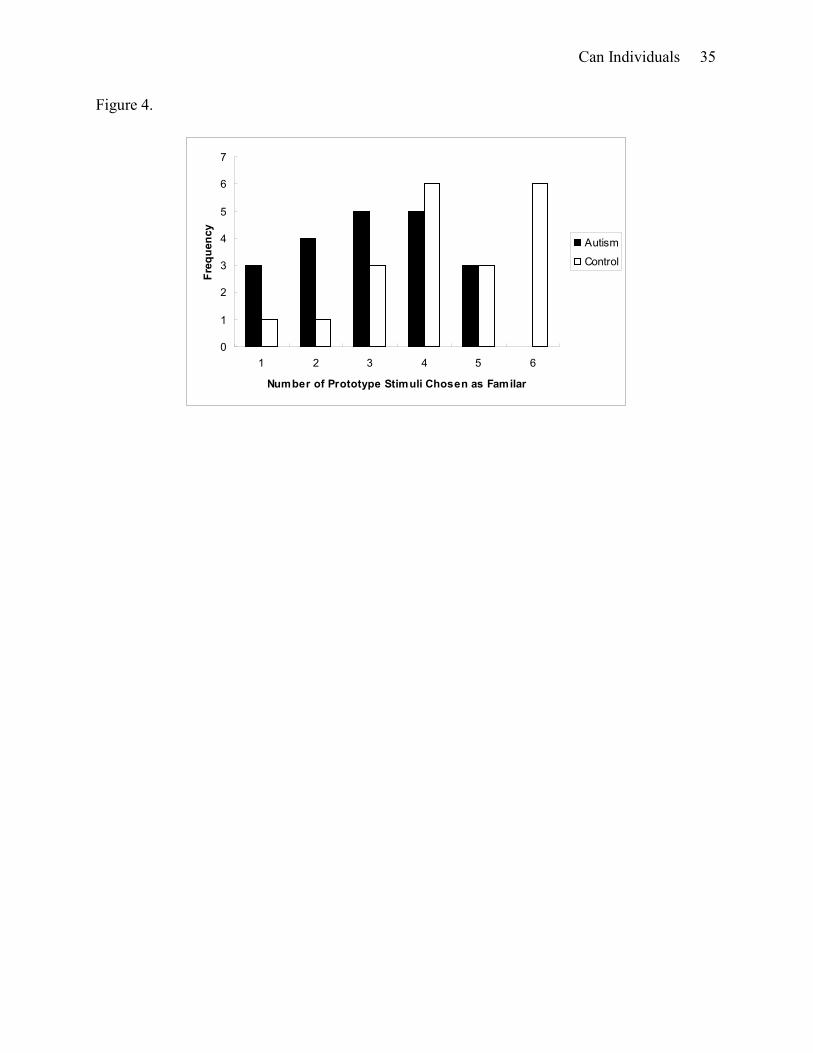
In addition to these overall group differences, analyses were conducted to address
potential differences in the range or distribution of scores between the two groups. Figure 4
presents the distribution of performance across groups. While 75% of the participants in the
control group chose the prototype faces as familiar in at least four out of six trials, only 40% of
the autism group performed at this level. In order to analyze the distribution of performance
across groups, the groups were divided into subgroups of “good performers” and “poor
performers.” Good performers were defined as participants who performed as well as the
majority of the control group and chose the prototype face as familiar in at least four out of six
trials while poor performers were defined as those who chose the prototype face as familiar in
three or fewer trials. A chi-square analysis comparing the distribution of good performers (n = 8
in the autism group, n = 15 in the control group) and poor performers (n = 12 in the autism
group, n = 5 in the control group) revealed a significant association between diagnosis and
prototype formation, χ2(1) = 5.01, p < .05. Based on the odds ratio, individuals in the control

Can Individuals 14
group were 4.50 times more likely to show clear evidence of prototype formation than were
individuals in the autism group.
[place Figure 4 about here]
Within Autism Group Analyses.
Participants with autism who were able to successfully form a prototype (good
performers) were compared to those who performed poorly on the face prototype task (poor
performers) on measures of intelligence (VIQ, PIQ, FSIQ) or behavioral symptoms of autism as
measured by the ADOS (ADOS Social Interaction Total Score, ADOS Communication Total
Score, ADOS Social Interaction and Communication Total Score, and ADOS Stereotyped
Behavior and Restricted Interests Total Score). The means and standard deviations for the
measures of intelligence and symptoms of autism are presented in Table 3. Independent samples
t-tests showed that the only significant difference between the two subgroups was that the good
performers had significantly lower Stereotyped Behavior and Restricted Interests Total Scores
(M = 1.13) on the ADOS than the poor performers (M = 3.00), t = 3.04, p < .01. No other
between-group comparisons were significant.
[place Table 3 about here]
Eye-Tracking Results
Of the 20 individuals with autism and the 20 control individuals, 14 individuals in each
group were included in the eye-tracking analyses. Six participants in each group were excluded
due to poor eye-tracking data (e.g., poor calibration or lack of accurate eye-tracking). As with the
full participant set, no significant differences were found between the two groups on age, FSIQ,
VIQ, or PIQ. There were also no significant differences between the participants who were

Can Individuals 15
included in the eye-tracking analyses and those that were excluded on age, FSIQ, VIQ, PIQ, or
MPS.
Face vs. Background of Stimulus.
The first question is whether the autism and the control groups differed in the proportion
of time that they spent looking at the face vs. the background of the stimulus (% Face). The %
Face was calculated by dividing the total amount of time that participants spent looking at the
Face AOI (across all familiarization trials) by the total amount of time that they spent looking at
the Stimulus AOI (across all familiarization trials) and multiplying the result by 100. An
independent samples t-test determined that the autism group (M = 93.03%) and the control group
(M = 91.21%) did not differ in the percentage of time that they spent looking at the faces, t =
1.14, p = .26.
Relevant vs. Irrelevant Aspects of the Face.
The second question is whether the autism and control groups differed in the amount of
time that they spent looking at relevant aspects of the face vs. irrelevant aspects of the face (%
Relevant). The % Relevant score was calculated by dividing the total amount of time that the
participants spent looking at the Eyes, Mouth, Nose, and Forehead AOIs (across all
familiarization trials) by the total amount of time that they spent looking at the Face AOI (across
all familiarization trials) and multiplying the result by 100. An independent samples t-test
indicated that there was not a significant difference between the autism group (M = 95.09%) and
control group (M = 98.69%) in the amount of time that they spent looking at the relevant aspects
of the face, t = -1.75, p = .09. However, a possible trend emerged, such that the control group
spent slightly more time looking at the relevant aspects of the faces than the autism group.

Can Individuals 16
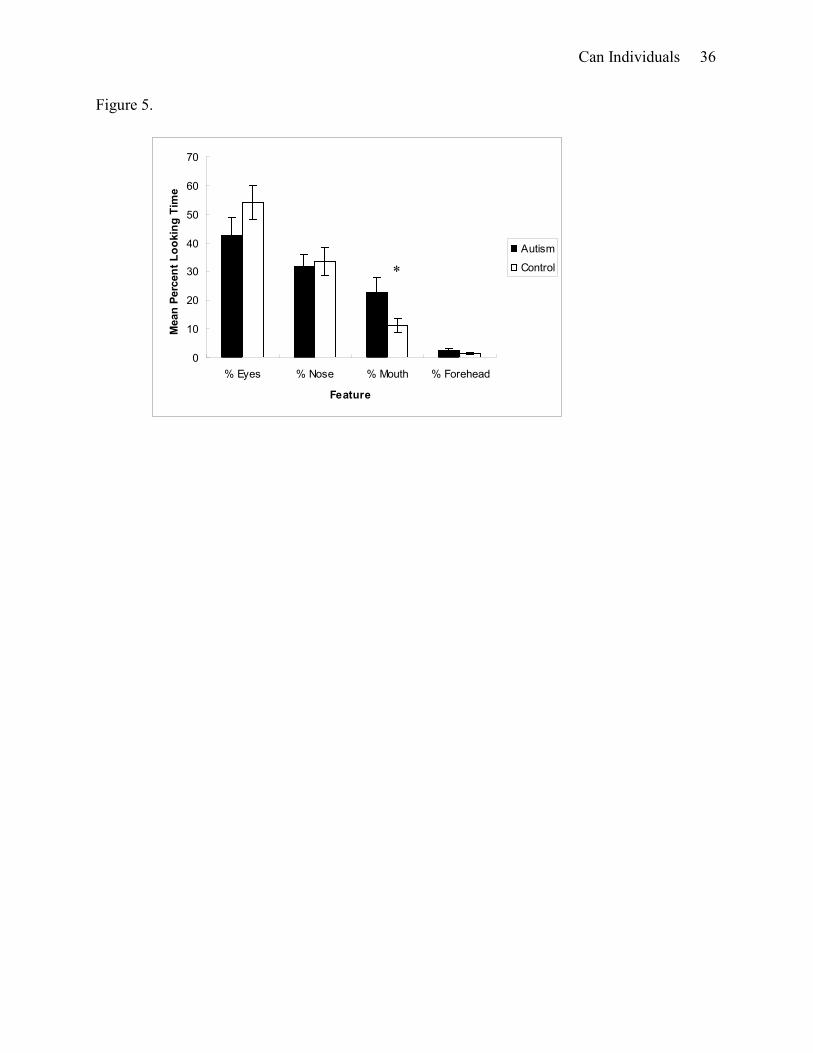
Individual Features.
Finally, the proportion of time that each group spent looking at individual features was
analyzed in order to examine differences in the distribution of time spent looking at the relevant
features between the autism group and the control group. The proportion of time spent looking at
each feature (e.g., % Eyes) was calculated by dividing the total amount of time each participant
spent looking at each AOI (e.g., Eyes) by the total amount of time the participant spent looking
at all of the relevant features (i.e., Eyes + Nose + Mouth + Forehead) and multiplying the result
by 100. This data is presented in Figure 5. A 2 (Group) x 4 (Feature) ANOVA indicated a
significant main effect of Feature, F (3, 78) = 33.23, p < .01. Post-hoc comparisons (Holm-
Bonferroni) resulted in significant differences between all of the features indicating that both
groups spent the largest proportion of time looking at the eyes (M = 48.33%) followed by the
nose (M = 32.81%), mouth (M = 16.99%), and forehead (M = 1.87%) (p < .01 for all
comparisons except Eyes vs. Nose, p < .05). There was no significant main effect for Group, (F
(1, 26) = 1.74, p = .20) nor a significant interaction between Group and Feature (F (3, 78) = 1.90,
p = .14). In general, the control group (M = 25.00%) did not differ from the autism group (M =
25.00%) in the mean percent of time that they spent looking at the features.
[place Figure 5 about here]
Also of interest was determining whether there were any between-group differences in
the percentage of time spent looking at each feature. Independent samples t-tests were performed
on the data for each feature. As can be seen in Figure 5, the groups did not differ in the
percentage of time spent looking at noses or foreheads (t = -.26, p = .80 for % Nose and t = 1.34,
p = .19 for % Forehead). The autism group (M = 42.65%) spent a smaller percentage of time
looking at eyes than the control group (M = 54.01%), but this difference did not reach

Can Individuals 17
significance, t = -1.31, p = .20. In contrast, the autism group (M = 22.95%) spent a larger
percentage of time looking at mouths than the control group (M = 11.02%). This difference
reached statistical significance, t = 2.16, p < .05.
Discussion
One objective of the current study was to investigate whether individuals with autism, in
contrast to typically developing individuals, experience difficulty abstracting prototypes of facial
information. As expected, typically developing individuals were able to distinguish the prototype
faces from the mode faces and found the prototype faces to be more familiar than faces
comprised of features that were previously seen. In contrast, the individuals with autism did not
choose the prototype faces as familiar at a level greater than chance, indicating a deficit in face
prototype formation. A closer examination of individual participant’s data in the autism group
indicated that there was a subset of individuals with autism (n = 8) who performed well and
appeared to form a prototype of facial information. These individuals had lower Stereotyped
Behavior and Restricted Interests Total Scores on the ADOS than those who performed poorly.
An equally important objective of the current study was to use eye-tracking to address
potential reasons why the autism group did not choose the prototype faces as more familiar.
Examination of eye fixation patterns indicated that the autism and control groups did not differ in
the amount of time that they spent looking at the faces or relevant facial features. Even though
the autism group spent more time looking at the eyes than any other facial feature, they spent a
smaller percentage of time looking at eyes and a larger percentage of time looking at mouths
than the control group. However, the general pattern of attention to the faces for both groups was
similar, suggesting that differential attention to faces or features does not explain the difficulty
that the individuals with autism had in abstracting facial prototypes.
Can Individuals 18
In general, the results of the current study are consistent with past research that has found
a deficit in prototype formation in individuals with autism (Gastgeb et al., 2009; Klinger &
Dawson, 1995, 2001; Klinger et al., 2006; Plaisted, 2000). While these results are inconsistent
with prior research by Molesworth et al. (2005, 2008), methodological differences between the
current study and Molesworth’s studies are likely responsible for these divergent findings.
Specifically, the current study improved on prior studies by using more subtle, quantitative
spatial variations when designing the stimuli in addition to never showing the mean prototype
values during the familiarization phase, making it less likely that participants would have
selected the prototype face as familiar without having truly abstracted the prototype.
In addition to determining whether individuals with autism have a deficit in prototype
and category formation, it is important to determine why individuals with autism have difficulty
with prototype formation. The results of the current study could be explained as a generalized
difficulty in processing faces, since it is well known that individuals with autism have deficits in
face recognition, gender categorization, and emotion recognition (e.g., Behrmann et al., 2006;
Klin et al., 1999; Newell, et al, 2010 1999; Rump et al., 2009). However, since prior research has
demonstrated prototype deficits with objects (Klinger & Dawson, 1995, 2001; Klinger et al.,
2006; Plaisted, 2000), more general explanations need to be explored. Another possibility is that
individuals with autism do not pay sufficient attention to faces. However, the eye-tracking data
suggests that this is not the case since the individuals with autism did not differ from the
typically developing individuals in the percentage of time they spent looking at the faces in
general or to the relevant features.
Even though there were no overall differences in attention to the stimuli, there were some
interesting differences in the way in which individuals with autism distributed their attention to

Can Individuals 19
the facial information during the familiarization phase. Despite the fact that the individuals with
autism spent more time looking at the eyes than any other feature of the face, they spent less time
looking at the eyes and more time looking at the mouths compared to typically developing
individuals. These results are consistent with other eye-tracking studies that suggest individuals
with autism devote less attention to the eye region than do control individuals (e.g., Klin, Jones,
Schultz, Volkmar, & Cohen, 2002; Norbury et al., 2009; Pelphrey et al., 2002). However, the
general pattern of attention to the faces for both groups was similar, suggesting that differential
attention to features does not explain the difficulty that individuals with autism had in the
abstraction of facial prototypes. Thus, prototype formation difficulties cannot solely be
accounted for by differential attention to features or different attentional patterns to the faces.
Difficulties in prototype formation may also be related to differences in the way in which
individuals with autism cognitively process information. Two theories that address potential
differences in perceptual processing are weak central coherence (Frith & Happé, 1994) and
enhanced perceptual functioning (Mottron et al., 2006). According to these theories, individuals
with autism prefer parts over wholes, have a local processing bias, and focus on details. If
individuals with autism have weak central coherence or enhanced perceptual functioning, this
would likely affect their ability to form a prototype. The differences between individuals with
autism who performed well on the task and those who performed poorly provide some support
for these explanations. Individuals with autism who performed poorly had higher Stereotyped
Behavior and Restricted Interests Total Scores on the ADOS than those who performed well.
The Stereotyped Behavior and Restricted Interests Total Score is a summary score made up of
subscores including unusual sensory interest in play materials or people, hand and finger and
other complex mannerisms, excessive interest in unusual or highly specific topics or objects, and
Can Individuals 20
compulsions or rituals. This result suggests that individuals with autism who tend to focus
intensely on details, parts or irrelevant aspects of objects, or topics of interest may be more likely
to focus on specific aspects of the face rather than the whole face, which would negatively affect
prototype formation.
As discussed in the introduction, traditional theories of face perception deficits in autism
are bottom-up, perceptual explanations that argue that individuals with autism are biased toward
processing local features and are less likely to perceive global patterns. The current study
suggests that individuals with autism may also have difficulty with top-down learning processes.
That is, individuals with autism may not develop a well-defined face space, an organizational
structure that is critical for face processing. Having a well-defined face space has implications
for several aspects of face processing and underlies the ability to recognize distinctive faces (e.g.,
Best & Strauss, 2007), discriminate subtle emotional expressions (Rump et al., 2009), and
efficiently process and categorize facial information such as gender and age (e.g., O’Toole et al.,
1998). It is known that the development of the face space occurs throughout the lifespan and
continues to develop through adolescence (e.g., Rump et al., 2009). If individuals with autism
have difficulty developing a face space and abstracting prototypes, they may never be able to
process faces at the same level of expertise as a typically developing adult. Due to the important
role that face processing plays in social interactions, a lack of a well developed face space and
difficulty with prototype abstraction would likely impact the general social abilities of
individuals with autism as well.
Even though the current study expands and improves on previous research on prototype
formation, there are some limitations. One limitation is that participants in the autism group were
all high-functioning males. Therefore, the results may not generalize to the full spectrum of
Can Individuals 21
autism disorders or to females with autism. Another limitation that occurs in studies of cognitive
abilities in high-functioning individuals with autism is that it is difficult to determine whether
successful performance on the task reflects intact ability or whether alternative strategies or
compensatory mechanisms are used to perform the task. The results of the current study should
be replicated in other large samples of individuals with autism with a wide variety of ability
levels using both social and non-social stimuli to determine whether prototype formation deficits
are domain general and extend to low-functioning individuals with autism. Future studies should
also further examine the relationship between prototype formation and symptoms of autism.
Although the current study is an important first step and highlights the importance of research on
top-down cognitive processes, many more studies need to be conducted to determine the exact
role that prototype formation deficits and other top-down cognitive processes play in the
syndrome of autism.
Can Individuals 22
References
Behrmann, M., Avidan, G., Leonard, G. L., Kimchi, R., Luna, B., Humphreys, K., et al. (2006).
Configural processing in autism and its relationship to face processing.
Neuropsychologia, 44, 110-129.
Best, C.A., Minshew, N. J., & Strauss, M. S. (2010). Gender discrimination of eyes and mouths
by individuals with autism. Autism Research, 3, 88-93.
Best, C. A., & Strauss, M. S. (2007, April). A face in the crowd: Recognition memory for
distinctive faces in infancy. Paper presented at the biennial meeting of the Society for
Research in Child Development, Boston, MA.
Boucher, J., & Lewis, V. (1992). Unfamiliar face recognition in relatively able autistic children.
Journal of Child Psychology and Psychiatry, 33, 843-859.
Celani, G., Battacchi, M. W., & Arcidiacono, L. (1999). The understanding of the emotional
meaning of facial expressions in people with autism. Journal of Autism and
Developmental Disorders, 29, 57-66.
Dawson, G., Webb, S. J., & McPartland, J. (2005). Understanding the nature or face processing
impairment in autism: Insights from behavioral and electrophysiological studies.
Developmental Neuropsychology, 27, 403-424.
Frith, U., & Happé, F. (1994). Autism: Beyond "theory of mind". Cognition, 50, 115-132.
Gadow, K., Sprafkin, J., & Weiss, M., (1999). Adult Symptom Inventory-4. Stony Brook, NY:
Checkmate Plus.
Can Individuals 23
Gastgeb, H. Z., Rump, K. M., Best, C. A., Minshew, N, J, & Strauss, M. S. (2009). Prototype
formation: Can individuals with autism abstract facial prototypes? Autism Research, 2,
279-284.
Humphreys, K. (2003). The development of face-space: An exploration. Unpublished doctoral
dissertation, University of London, London, England.
Kelly, D.J., Quinn, P.C., Slater, A.M., Lee, K., Liezhong, G., Pascalis, O. (2007). The other-race
effect develops during infancy. Psychological Science, 18, 1084-1089.
Klin, A., Jones, W., Schultz, R., Volkmar, F., & Cohen, D. (2002). Visual fixation patterns
during viewing of naturalistic social situations as predictors of social competence in
individuals with autism. Archives of General Psychiatry, 59, 809-816.
Klin, A., Sparrow, S. S., de Bildt, A., Cicchetti, D. V., Cohen, D. J., & Volkmar, F. R. (1999). A
normed study of face recognition in autism and related disorders. Journal of Autism and
Developmental Disorders, 29, 499-508.
Klinger, L. G., & Dawson, G. (2001). Prototype formation in autism. Development and
Psychology, 13, 111-124.
Klinger, L. G., Klinger, M. R., & Pohlig, R. L. (2006). Implicit learning impairments in autism
spectrum disorders: Implications for treatment. In J.M. Perez, P. M. Gonzalez, M. L.
Comi, & C. Nieto (Eds.), New Developments in Autism: The Future is Today (pp. 75-
102). Kingsley Press: London.
Lahaie, A., Mottron, L., Arguin, M., Berthiaume, C., Jemel, B., & Saumier, D. (2006). Face
perception in high-functioning autistic adults: Evidence for superior processing of face
parts, not for a configural face-processing deficit. Neuropsychology, 20, 30-41.
Can Individuals 24
Lord, C., Rutter, M., Goode, S., Heemsbergen, J., Jordan, H., Mawhood, L., et al. (1989). Autism
diagnostic observation schedule: A standardized observation of communicative and
social behavior. Journal of Autism and Developmental Disorders, 19, 185-212.
Lord, C., Rutter, M., & Le Couteur, A. (1994). Autism Diagnostic Interview-Revised: A revised
version of a diagnostic interview for caregivers of individuals with possible pervasive
developmental disorders. Journal of Autism and Developmental Disorders, 24, 659-695.
Molesworth, C. J., Bowler, D. M., & Hampton, J. A. (2005). The prototype effect in recognition
memory: Intact in autism? Journal of Child Psychology and Psychiatry, 46, 661-672.
Molesworth, C. J., Bowler, D. M., & Hampton, J. A. (2008). When prototypes are not best:
Judgments made by children with autism. Journal of Autism and Developmental
Disorders, 38, 1721-1730.
Mottron, L., Dawson, M., Soulières, I., Hubert, B., & Burack, J. (2006). Enhanced perceptual
functioning in autism: An update, and eight principles of autistic perception. Journal of
Autism and Developmental Disorders, 36, 27-43.
Newell, L. C., Best, C. A., Gastgeb, H., Rump, K. M., & Strauss, M. S. (2010). The development
of categorization and facial knowledge: Implications for the study of autism. In L. M.
Oakes, C. H. Cashon, M. Casasola, & D. H. Rakison (Eds.) Infant Perception and
Cognition: Recent Advances, Emerging Theories, and Future Directions, New York:
Oxford Press.
Norbury, C.F., Brock, J., Cragg, L., Einav, S., Griffiths, H., & Nelson, K. (2009). Eye-movement
patterns are associated with communicative competence in autistic spectrum disorders.
Journal of Child Psychology and Psychiatry, 50, 834-842.
O’Toole, A.J., Deffenbacher, K.A., Valentine, K., McKee, K., Huff, D., & Abdi, H. (1998). The
Can Individuals 25
perception of face gender: The role of stimulus structure in recognition and classification.
Memory and Cognition, 26, 146-160.
Pascalis, O., de Haan, M., & Nelson, C. A. (2002). Is face processing species-specific during the
first year of life? Science, 296,1321-1323.
Pelphrey, K.A., Sasson, N.J., Reznick, J.S., Paul, G., Goldman, B.D., Piven, J. (2002). Visual
scanning of faces in autism. Journal of Autism and Developmental Disorders, 26, 146-
160.
Plaisted, K. C. (2000). Aspects of autism that theory of mind cannot explain. In Baron-Cohen, S.,
Tager-Flusberg, H. & Cohen, D. J. (Eds.), Understanding Other Minds: Perspectives
from Developmental Cognitive Neuroscience. New York: Oxford University Press.
Posner, M. I., & Keele, S. W. (1968). On the genesis of abstract ideas. Journal of Experimental
Psychology, 77, 353-36.
Rhodes, G., Brennan, S., & Carey, S. (1987). Identification and ratings of caricatures:
Implication for mental representations of faces. Cognitive Psychology, 19, 473-497.
Rubenstein, A. J., Kalakanis, L., & Langlois, J. H. (1999). Infant preferences for attractive faces:
A cognitive explanation. Developmental Psychology, 35, 848-855.
Rump, K.M., Giovannelli, J.L., Minshew, N.J., & Strauss, M.S. (2009). The development of
emotion recognition in individials with autism. Child Development, 80, 1434-1447.
Scherf, K.S., Behrmann, M., Kimchi, R., & Luna, B. Emergence of global shape processing
continues through adolescence. Child Development, 80, 162-177.
Strauss, M. S. (1979). The abstraction of prototypical information by adults and 10-month old
infants. Journal of Experimental Psychology: Human Learning and Memory, 50, 618-
632.
Can Individuals 26
Tanaka, J.W., Wolf, J.M., Klaiman, C., Koenig, K., Cockburn, J., Herlihy, L., et al. (2010).
Using computerized games to teach face recognition skills to children with autism
spectrum disorder: The Let’s Face It! Program. Journal of Child Psychology and
Psychiatry, 51, 944-952.
Valentine, T. (1991). A unified account of the effects of distinctiveness, inversion, and race in
face recognition. The Quarterly Journal of Experimental Psychology, 43A, 161-204.
Wechsler, D. (1999). Wechsler Abbreviated Scale of Intelligence. San Antonio: The
Psychological Corporation.
Weissman, M.M., Wickramaratne, P., Adams, P., Wolk, S., Verdeli, H., & Olfson, M. (2000).
Brief screening for family psychiatric history: The family history screen. Archives of
General Psychiatry, 57, 675-682.
Younger, B. (1990). Infant categorization: Memory for category-level and specific item
information. Journal of Experimental Child Psychology, 50, 131-155.
Younger, B., & Gotlieb, S. (1988). Development of categorization skills: Changes in the nature
or structure of infant form categories. Developmental Psychology, 24, 611-619.
Can Individuals 27
Author Note
Holly Zajac Gastgeb, Department of Psychology, University of Pittsburgh; Desirée A.
Wilkinson, Department of Psychology, University of Pittsburgh; Nancy J. Minshew, Department
of Psychiatry, University of Pittsburgh School of Medicine; Mark S. Strauss, Department of
Psychology, University of Pittsburgh.
Holly Zajac Gastgeb is now at Department of Psychiatry, University of Pittsburgh School
of Medicine.
This study was supported by NIH/NICHD HD055748 and PA Dept. of Health SAP #
4100047862. The data presented here was submitted by Holly Zajac Gastgeb as part of her Ph.D.
dissertation (Department of Psychology, University of Pittsburgh). We are grateful to Catherine
Best, Keiran Rump, Sarah Hannigen, Eva Dundas, Sara Green, and Kao-Wei Chua for testing
participants involved in the current study and Carla Mazefsky, Ph.D. for commenting on prior
versions of the manuscript.
Correspondence regarding this article should be addressed to Mark S. Strauss,
Department of Psychology, University of Pittsburgh, 210 South Bouquet Street, Pittsburgh, PA
15260. Electronic mail may be sent to [email protected].
Can Individuals 28
Table 1 Participants’ Diagnostic and Demographic Characteristics _ _________________________________________________________
Autism Group (n = 20) Control Group (n = 20) ______________________________________________________________________________
M (SD) (Range) M (SD) (Range) CA 22.85 (6.16) (17-39) 25.45 (6.29) (18 – 42) VIQ 107.40 (10.77) (88 – 127) 111.00 (7.20) (94 – 122) PIQ 108.30 (13.24) (83 – 131) 110.50 (8.96) (93 – 125) FSIQ 108.65 (9.17) (92 – 128) 112.35 (7.90) (97 – 122)
Note. CA = Chronological Age in years; VIQ = Verbal IQ; PIQ = Performance IQ; FSIQ = Full Scale IQ
Can Individuals 29
Table 2 Example Values of Modified Facial Aspects for Face Stimuli
Stimulus Nose/Mouth Nose Forehead Lip Distance Width Height Thickness 1 1 1 2 4
2 1 2 3 3
3 1 3 4 1
4 1 4 1 2
5 2 1 3 2
6 2 2 4 1
7 2 3 1 4
8 2 4 2 3
9 3 1 4 2
10 3 2 1 3
11 3 3 2 4
12 3 4 3 1
13 4 1 3 4
14 4 2 4 3
15 4 3 1 2
16 4 4 2 1
Mode 1 1 1 1 1
Mode 2 4 4 4 4
Prototype A A A A
Note. A = Average Familiarization Stimuli = Stimulus 1-16 Mode1, Mode 2, and Prototype were combined in pairs to form Test Stimuli Test Stimuli = Mode 1-Prototype, Prototype-Mode 1, Mode 2-Prototype, Prototype-Mode 2

Can Individuals 30
Table 3 Means and Standard Deviations for Measures of Intelligence and Symptoms of Autism
for Good Performers and Poor Performers
Variable
Good Performers
(n = 8) M (SD)
Poor Performers
(n = 12) M (SD)
VIQ 109. 38 (10.10) 106.08 (11.43) PIQ 105.87 (13.27) 109.92 (13.55) FSIQ 108.00 (6.91) 109.08 (10.70) ADOS Social Interaction Total 9.50 (1.60) 8.92 (1.24) ADOS Communication Total 5.25 (1.58) 5.17 (.83) ADOS Social Interaction and Communication Total 14.75 (3.11) 14.08 (1.38) ADOS Stereotyped Behavior and Restricted Interests Total ** 1.13 (.83) 3.00 (1.60)
** p < .01

Can Individuals 31
Figure Captions
Figure 1. Prototype and mode stimulus examples.
Figure 2. Example areas of interest (AOIs).
Figure 3. Mean prototype scores by diagnosis (* p < .01).
Figure 4. Distribution of performance across groups.
Figure 5. Mean percent looking time by feature (* p < .05).
Can Individuals 32
Figure 1.
Mode 1 Prototype Mode 2 (1111) (AAAA) (4444)
Can Individuals 33
Figure 2.
Can Individuals 34
Figure 3.
0
10
20
30
40
50
60
70
80
Diagnostic Category
Mea
n Pr
otot
ype
Scor
e
Autism
Control
*
Can Individuals 35
Figure 4.
0
1
2
3
4
5
6
7
1 2 3 4 5 6
Number of Prototype Stimuli Chosen as Familar
Freq
uenc
y
Autism
Control
Can Individuals 36
Figure 5.
0
10
20
30
40
50
60
70
% Eyes % Nose % Mouth % Forehead
Feature
Mea
n Pe
rcen
t Loo
king
Tim
e
Autism
Control
*