calcium and iron oxide reactivity studies for chemical
TRANSCRIPT
Calcium and Iron Oxide Reactivity Studies for Chemical Looping Applications of
Clean Energy Conversion
DISSERTATION
Presented in Partial Fulfillment of the Requirements for the Degree Doctor of Philosophy
in the Graduate School of The Ohio State University
By
Niranjani Deshpande
Graduate Program in Chemical Engineering
The Ohio State University
2015
Dissertation Committee:
Professor Liang-Shih Fan, Advisor
Professor Bhavik R. Bakshi
Professor David L. Tomasko

Copyright by
Niranjani Deshpande
2015
ii
Abstract
The following study entails independent investigations carried out on the reactivity of
metal oxides involved in the calcium and chemical looping applications. The Chapters 2
through 5 involve studies on the various applications and aspects of the calcium looping
process, and Chapter 6 and 7 discuss two independent investigations of chemical looping
oxygen carrier particles.
The hydration of calcium oxide (CaO) sorbent has been investigated as a reactivation
method in the three step calcium looping process for pre and post combustion carbon
dioxide (CO2) capture. The feasibility of the process concept was established using lab
scale fixed bed reactor setup, and reactivation of sorbent was achieved with high
temperature steam at 500°C over multiple cycles. Further development of the design and
operation of a fluidized bed hydrator is reported upon, and fast fluidization regime was
identified as the most suitable for a scalable steam hydrator design. Further, a screening
study was conducted on multiple egg and sea shells as a renewable source of the CaO
sorbent, and excellent reactivity towards CO2 is reported. A novel method for the
simultaneous cleanup of CO2, SOx and NOx impurities from coal combustion flue gas is
proposed based on the calcium looping process. Proof of concept experiments were
performed and 90% CO2 and NO and 100% SO2 removal was demonstrated at 1 atm,
650°C fixed bed experiments, using the calcium sorbent and coal char. For pre-
iii
combustion application of the calcium looping process (CLP), the fate of sulfurous
species is explored, which are formed as a byproduct of the coal to H2 plant with the
CLP. The CaS formed in the carbonator at the operating conditions of about 600°C and
23 bar is found to be oxidized to CaSO4 at the calciner operating conditions of the CLP.
Treatment options for the purge stream are discussed for the oxidation of unreacted CaS
for the safe disposal and integration with the cement industry.
In the latter half of the present study, the iron-based metal oxide oxygen carriers are
investigated for the chemical looping partial oxidation (CLPO) of CH4 for the production
of syngas at elevated pressures. The favorable impact of increased pressure on the redox
reaction rates is illustrated through experiments conducted on the iron-titanium complex
metal oxide (ITCMO) particles between 1 and 10 atm at 900-950°C in a
thermogravimetric setup. The observed change in morphology through SEM and BET
analysis at increased pressures is related to the change in reactivity obtained. Lastly, an
application of chemical looping gasification (CLG) for the coproduction of H2 and
electricity is explored. Specifically, the recyclability of iron based oxygen carriers is
investigated in steam redox environments using a specialized thermogravimetric setup.
Isothermal tests are conducted for 20 redox cycles using steam as the oxidizing agent for
iron and cobalt based metal oxide oxygen carriers at 900°C. MgAl2O4 is used as an inert
support. While cobalt-based samples exhibited a loss in reactivity, the excellent
recyclability of iron-based oxygen carriers has thus been established.

iv
This document is dedicated to my little brother, Sukumar. Your memory always inspires
me to be a better person, and gives me warmth in my darkest hour.
v
Acknowledgments
I would like to express my deepest gratitude towards my advisor, Professor Liang-Shih
Fan, for offering me the opportunity to work on such a fast and exciting field as chemical
looping. I am thankful to the Ohio State University and particularly the William G.
Lowrie Department of Chemical and Biomolecular Engineering (CBE) for all the
excellent resources and infrastructure that was provided for my easy use that made my
graduate research experience such a joy. The state-of-the-art facilities available for
students gave me a one of kind experience and a unique flavor of academic research. The
CBE family at large, and the Fan group in particular, has helped shape my keen research
acumen over the last five years, and instilled in me a deep appreciation of the role of
scientific investigation in the overall human development. I would also like to thank Prof.
James Rathman, Prof. Bhavik Bakshi, Prof. David Tomasko and Prof. Lisa Hall for
serving on my qualifier, candidacy, and dissertation committees. Their discussions
always provided me with new ideas to further my research objectives.
Dr. Fan has been a constant source of inspiration to me, not only in his role as a direct
advisor for my research progress, but also leading by example a life of dedication and
discipline. His endless enthusiasm and optimism towards researching solutions for
various technological challenges is something I will always aspire to imbibe in myself.
vi
Dr. Nihar Phalak, who was a colleague and a senior in the calcium looping sub-group,
shared the better part of his graduate career with mine. Nihar has been invaluable to me
in his steadfast friendship, guidance, mentorship and support. I am forever indebted to
him for his close involvement and interest in my graduate career development, as well as
the close personal friendship, which made my doctoral study a fulfilling and enriching
experience. In addition, Dr. Shwetha Ramkumar played a key role in my initial mentoring
in the Fan lab. William Wang was always available to discuss any doubts I may have had
about the calcium looping system. His in-depth understanding of the process and the
power generation process always provided me fodder for new ideas. My other seniors
Deepak Sridhar, Ray Kim, Liang Zeng, and Andrew Tong guided me in various
capacities, and I am thankful for their guidance and support. I also enjoyed working with
Alan Wang for the steam hydration process for reactivation of the calcium sorbent. Dr.
Lang Qin provided me her immense expertise in the FIB, EDS and various microscopy
techniques. Discussions with her were invaluable to the development of oxygen carrier
studies. Ankita Majumder, Elena Chung, and Mandar Kathe were a delight to work with,
and transcended the boundaries of co-workers and formed close personal friendships with
me. To all three of them, I am forever indebted. Other members of my Fan group family
include Dr. Samuel Bayham, Dr. Qiang Zhou, Dr. Dawei Wang, Omar McGiveron,
Aining Wang, Cheng Chung, Dikai Xu, and Tien-Lin Hseh; who were always available
to discuss any concepts, and lend support in the best team spirit and great rapport.
I would also like to mention Nicholas Blum, who I had the pleasure to mentor in his
undergraduate research efforts. His insightful questions and keen interest in research were
vii
extremely helpful for my development as well. I must also mention Brian Yuh, who I
mentored for his high school summer internship. The Yuh family’s kindness and warmth
will stay with me forever.
Dr. Robert Statnick (ClearSkies Consulting) and Mr. Dan Connell (CONSOL Energy
R&D) provided great insight from their vast industrial experience, through our many
discussions, conference calls, and collaborative efforts that I was a part of. I am thankful
for the contributions of Mr. Bob Brown in an advisory capacity for the development of
the calcium study funded the Ohio Coal Development Office (OCDO). I would like to
gratefully acknowledge Mr. Joe Eutizi (San Miguel Electric Cooperative Inc.) and Mr.
David Martin (Walnut Creek Mining Company) for providing the lignite coal samples,
and Mr. Daniel Wilson (CONSOL Energy R&D) for help in char production from the
coal samples. I am grateful for the financial support provided by projects funded through
OCDO as well as the United States Department of Energy (USDOE).
Special thanks to Mr. Paul Green and Mr. Michael Wilson. Their skills in the machine
shop and their willingness to always help were key to the successful and timely
completion of many of my lab scale studies. I must mention Dr. Carlo Scaccia, under
whose guidance I completed my teaching assignments as a part of my doctoral studies. I
learnt a great deal about professional ethics and maintaining good professional
relationships from him. Angela Bennett, Lynn Flanagan, and Susan Tesfai of the CBE
department always provided professional and timely assistance in all my administrative
tasks. I greatly appreciate all their help.

viii
Special thanks to my extended family, your love keeps me strong even from halfway
across the world. My friends near and far, who are always ready to lend me a patient
hearing, or provide good counsel when I need it. Last but most importantly, I want to
mention my family, my parents Ashwini and Rajendra, who have supported me
unconditionally in every endeavor, who are my biggest pillars of strength and support.
They are shiny examples of a purposeful life well-lived, I aspire to be like them every
day. Also, my fiancé, Harshavardhan, who is my rock. Your love uplifts and inspires me.
ix
Vita
June 2003 ...........................S.S.C., Balmohan Vidyamandir
June 2005 ...............................H.S.C., Mumbai University
June 2009 ...............................B. Chem., Mumbai University, Institute of Chemical
Technology
Sept 2009 to present ..............Graduate Research Associate, Department of Chemical and
Biomolecular Engineering, The Ohio State University
Publications
Deshpande, N.; Majumder, A.; Qin, L.; Fan, L.-S. High-Pressure Redox Behavior of
Iron-Oxide-Based Oxygen Carriers for Syngas Generation from Methane. Energy Fuels
2015.
Deshpande, N.; Phalak, N.; Fan, L.-S.; Sankaran, S. Carbon Dioxide (CO2) Capture from
Coal-Fired Power Plants Using Calcium Looping. Chem. Eng. Educ. 2015.
Fan, L.-S.; Deshpande, N.; Phalek, N. United States Patent: 8877150 - Single-Step
Process for the Simultaneous Removal of CO2, SOx and NOx from a Gas Mixture.
8877150, November 4, 2014.
Wang, A.; Deshpande, N.; Fan, L.-S. Steam Hydration of Calcium Oxide for Solid
Sorbent Based CO2 Capture: Effects of Sintering and Fluidized Bed Reactor Behavior.
Energy Fuels 2014, 29, 321–330
x
Luo, S.; Zeng, L.; Xu, D.; Kathe, M.; Chung, E.; Deshpande, N.; Qin, L.; Majumder, A.;
Hsieh, T.-L.; Tong, A.; Sun, Z.; Fan, L.-S. Shale Gas-to-Syngas Chemical Looping
Process for Stable Shale Gas Conversion to High Purity Syngas with a H2:CO Ratio of
2:1. Energy Environ. Sci. 2014, 7, 4104–4117.
Deshpande, N.; Yuh, B. Screening of Multiple Waste Animal Shells as a Source of
Calcium Sorbent for High Temperature CO2 Capture. Sustain. Eng. Res. 2013, 23, 227–
232.
Wang, A.; Wang, D.; Deshpande, N.; Phalak, N.; Wang, W.; Fan, L.-S. Design and
Operation of a Fluidized Bed Hydrator for Steam Reactivation of Calcium Sorbent. Ind.
Eng. Chem. Res. 2013, 52, 2793–2802.
Phalak, N.; Deshpande, N.; Fan, L.-S. Investigation of High-Temperature Steam
Hydration of Naturally Derived Calcium Oxide for Improved Carbon Dioxide Capture
Capacity over Multiple Cycles. Energy Fuels 2012, 26, 3903–3909.
Phalak, N.; Ramkumar, S.; Deshpande, N.; Wang, A.; Wang, W.; Statnick, R. M.; Fan,
L.-S. Calcium Looping Process for Clean Coal Conversion: Design and Operation of the
Subpilot-Scale Carbonator. Ind. Eng. Chem. Res. 2012, 51, 9938–9944.
Fields of Study
Major Field: Chemical Engineering
xi
Table of Contents
Abstract ............................................................................................................................... ii
Acknowledgments............................................................................................................... v
Vita ..................................................................................................................................... ix
Table of Contents ............................................................................................................... xi
List of Tables .................................................................................................................... xv
List of Figures .................................................................................................................. xvi
CHAPTER 1: Introduction ................................................................................................. 1
1.1 Type I and type II chemical looping systems ....................................................... 1
1.2 Major demonstration plants .................................................................................. 3
1.3 Outline of chapters ............................................................................................... 5
CHAPTER 2: Steam Hydration as Reactivation for the Calcium Sorbent ....................... 11
2.1 Introduction ........................................................................................................ 11
2.2 Feasibility of steam hydration ............................................................................ 17
2.2.1 Experimental materials and methods .......................................................... 17
2.2.2 Recyclablility of the sorbents over steam hydration ................................... 25
2.2.3 Change in sorbent morphology ................................................................... 28
2.2.4 Extended number of cycles ......................................................................... 32
2.3 Bench scale semi-batch fluidized bed hydrator .................................................. 37
2.4 Continuous hydration on entrained bed reactor ................................................. 39
2.4.1 Experimental setup...................................................................................... 39
2.4.2 Cold/dry flow tests ...................................................................................... 42
2.4.3 High temperature experiments .................................................................... 44
2.5 Conclusions ........................................................................................................ 52
CHAPTER 3: Screening of Multiple Waste Animal Shells as a Source of Calcium
Sorbent .............................................................................................................................. 53
xii
3.1 Introduction ........................................................................................................ 53
3.2 Experimental ...................................................................................................... 55
3.2.1 Materials and methods ................................................................................ 55
3.3 Observations and discussion .............................................................................. 61
3.4 Conclusions ........................................................................................................ 71
CHAPTER 4: A Novel Calcium-Char (Cal-C) Process for the Simultaneous Removal of
NOx, SOx and CO2 from Combustion Flue Gas ................................................................ 72
4.1 Introduction ........................................................................................................ 72
4.1.1 Process overview ........................................................................................ 75
4.2 Experimental section .......................................................................................... 80
4.3 Results and discussion ........................................................................................ 83
4.3.1 Effect of temperature on NO reduction in presence of CaO: ...................... 83
4.3.2 Effect of addition of CaO (presence and absence of calcium) .................... 86
4.3.3 Effect of O2 concentration .......................................................................... 90
4.3.4 Effect of inlet NO concentration ................................................................. 93
4.3.5 Simultaneous capture of NO, SO2, and CO2 ............................................... 95
4.4 ASPEN simulations ............................................................................................ 97
4.5 Conclusion ........................................................................................................ 105
CHAPTER 5: Calcium Looping Process for Coal-to-H2 Production: Fate of Sulfur ..... 107
5.1 Introduction ...................................................................................................... 107
5.2 Motivation/Problem statement ......................................................................... 110
5.3 Background and literature review .................................................................... 115
5.4 Conditions tested .............................................................................................. 117
5.5 Materials ........................................................................................................... 119
5.5.1 Experimental setup and procedure ............................................................ 119
5.6 Results and discussion ...................................................................................... 123
5.6.1 Reaction of CaS with CO2 as the oxidizing agent .................................... 123
5.6.2 Reaction of CaS with H2O as the oxidizing agent .................................... 125
5.6.3 Reaction of CaS with O2 as the oxidizing agent ....................................... 128
5.6.4 Reaction of CaO with SO2 released from oxycombustion of coal ............ 131
5.6.5 Reaction of CaSO4 with H2 ....................................................................... 135
xiii
5.6.6 Reaction of CaSO4 with CO ..................................................................... 139
5.6.7 Reaction of CaSO4 with H2 and CO ......................................................... 144
5.6.8 Treatment of purge stream ........................................................................ 149
5.7 Commercial implications and conclusions ....................................................... 156
CHAPTER 6: Chemical Looping Applications: High Pressure Redox Behavior of Iron-
Oxide Based Oxygen Carriers ........................................................................................ 162
6.1 Introduction ...................................................................................................... 162
6.2 Thermodynamic analysis.................................................................................. 168
6.3 Experimental setup, materials and procedure: ................................................. 178
6.4 Results and discussion ...................................................................................... 180
6.4.1 Reduction in H2 ......................................................................................... 181
6.4.2 Reduction in CH4 ...................................................................................... 190
6.4.3 Pressure correction .................................................................................... 198
6.4.4 Air oxidation ............................................................................................. 200
6.4.5 XRD, SEM, EDS, and BET analysis ........................................................ 202
6.5 Conclusions ...................................................................................................... 208
CHAPTER 7: Chemical Looping Applications: Redox Reactivity of Steam Oxidation for
Chemical Looping Particles ............................................................................................ 211
7.1 Introduction ...................................................................................................... 211
7.2 Thermodynamic analysis.................................................................................. 218
7.3 Materials and methods ..................................................................................... 221
7.4 Results and discussion ...................................................................................... 222
7.4.1 Fe-based oxygen carriers .......................................................................... 222
7.4.2 Co-based oxygen carriers .......................................................................... 226
7.5 Conclusions ...................................................................................................... 231
FUTURE DIRECTIONS ................................................................................................ 233
APPENDIX: Supplemental Data ................................................................................... 236
A.1 Calcium sorbent reactivation by hydration ......................................................... 236
A.1.1 Steam hydration TGA experiments ............................................................... 236
A.1.2 Decay in reactivity of CaO sorbent over continuous TGA testing ................ 238
A.2 Fate of Sulfur ........................................................................................................ 242
xiv
A.2.1 Soot formation ............................................................................................... 242
A.2.2 The Buoyancy change .................................................................................... 242
A.2.3 Investigation of CaSO4 reaction .................................................................... 244
A.3 Reduction of ITCMO particles under pressure .................................................... 245
A.3.1 CH4 reduction at 900°C ................................................................................. 245
A.3.2 H2 reduction at 900°C .................................................................................... 246
A.4 Steam oxidation of reduced oxygen carrier samples ............................................ 247
A.4.1 Sample calculation of extent of oxidation for Fe-based oxygen carriers ...... 247
A.4.2 Raw data of 20 redox cycles of Fe-based oxygen carriers ............................ 250
A.4.3 Co-based oxygen carriers upon re-oxidation ................................................. 252
REFERENCES ............................................................................................................... 254
xv
List of Tables
Table 1: Properties for sorbents generated from different limestones .............................. 19
Table 2: Different animal shells tested and their sources, with initial CO2 capture
capacities ..................................................................................................................... 58
Table 3: Calcined and hydrated CO2 capture capacities of sorbents after 30 min, tested in
TGA ............................................................................................................................ 62
Table 4. Bulk pore volume and surface area analysis using BET theory ......................... 64
Table 5: Modeling parameters for CCR Process. ............................................................. 98
Table 6: 550 MWe coal-fired power plant – process conditions for Case 1 ..................... 99
Table 7: Modeling parameters for NO removal for the Cal-C process ........................... 100
Table 8: Summary of simulation results for the four cases ............................................ 101
Table 9: Calciner equilibrium gas concentrations from Aspen Plus simulations ........... 118
Table 10: Carbonator equilibrium gas concentrations derived from Aspen Plus
simulations ................................................................................................................ 118
Table 11: Cost comparison for H2 and electricity generation for coal to H2 plant, base
case and CLP plant.................................................................................................... 160
Table 12: Methane optimum equilibrium conversion results for partial oxidation using
ITCMO particles ....................................................................................................... 175
Table 13: YH2 as a function of total system pressure and PPH2 for section 6.4.1.1 ........ 184
Table 14: The thermodynamic properties for reactions of the various oxidation states of
Fe and Co with steam, per mole of H2 produced, at 900°C ...................................... 220
Table 15: Calculation of extent of steam oxidation of the Fe-based oxygen carriers by the
three methods. ........................................................................................................... 249
Table 16: Raw weight data for the 20 redox cycles for Fe-based oxygen carriers ......... 251
xvi
List of Figures
Figure 1: Concept of type I and type II chemical looping, for post combustion scenario .. 2
Figure 2: The steam pressure as a function of temperature for the hydration reaction. ... 14
Figure 3: Exponential increase in the equilibrium reaction pressure with temperature, in
the temperature range of interest. ...................................................................................... 16
Figure 4: Fixed bed reactor setup for the high temperature steam hydration. Figure from 39
........................................................................................................................................ 21
Figure 5: The post-hydration capture capacity of the CaO sorbents derived from the six
different limestones over five hydration cycles ................................................................ 26
Figure 6: Comparison of the post-hydration CO2 capture capacities of the calcitic
sorbents, on calcium and hydrate basis. ............................................................................ 27
Figure 7: Particle size distribution post calcination and post hydration for (a) MV and (b)
sorbent ............................................................................................................................... 29
Figure 8: Calcined MV sorbent (a) cycle 1 and (b) cycle 5 .............................................. 30
Figure 9: Calcined BR sorbent, (1) cycle 1 and (2) cycle 5 .............................................. 30
Figure 10: BR sorbent cycle 5 (a)calcined and (b) steam hydrated followed by
dehydration in TGA .......................................................................................................... 31
Figure 11: MV sorbent cycle 5 (a) calcined and (b) steam hydrated followed by
dehydration in TGA .......................................................................................................... 31
Figure 12: Extended number of cycles showing the effectiveness of hydration as
reactivation mechanism. ................................................................................................... 34
Figure 13: Hydration conversion as a function of number of cycles. ............................... 36
Figure 14: Hydration performance of the semi-batch fluidized bed hydrator40
................ 38
Figure 15: Schematic of the sub-pilot scale riser reactor used for continuous steam
hydration experiments. ...................................................................................................... 41
Figure 16: Degree of entrainment obtained as function of gas velocity, cold flow
experiments ....................................................................................................................... 43
Figure 17: Maximum steam partial pressures achievable as a function of temperature, at
different gas velocities. ..................................................................................................... 46
Figure 18: Wall coating observed in the entrained bed reactor ........................................ 47
Figure 19: Hydration conversions obtained in the entrained and bed samples as a function
of steam partial pressures used ......................................................................................... 48
xvii
Figure 20: Comparison of entrained bed performance and conversions predicted by
Schaube et.al. .................................................................................................................... 50
Figure 21: Predictions of hydration conversion at OSU’s test conditions using equation 1.
........................................................................................................................................... 51
Figure 22: Original shells from which samples were prepared. ....................................... 56
Figure 23: CO2 capture capacity (wt%) for (a) calcined sorbents and (b) hydrated
sorbents ............................................................................................................................. 63
Figure 24: X-ray diffraction patterns obtained from CH-E, OS-E and OY-S samples:
determining crystallographic differences. ......................................................................... 68
Figure 25: SEM images of egg and sea-shell derived sorbents. (a) CH-E (b) OS-E and (c)
OY-S. ................................................................................................................................ 69
Figure 26: The Cal-C process – conceptual schematic. .................................................... 76
Figure 27: Experimental setup of reactor and gas analysis system. ................................. 81
Figure 28: TPR of NO reduction using bituminous and lignite chars. Total flow rate =
210 ml/min, inlet NO concentration = 924 ppm, inlet O2 concentration = 1.5%, Ca:char
loading = 10:1 (by wt.) ..................................................................................................... 85
Figure 29: Effect of addition of calcium sorbent on the NO-char reduction reaction using
(a) BC, (b) LC-1 and (c) LC-2. Gas flow rate = 210 ml/min, inlet NO concentration = 924
ppm, O2 concentration = 1.5%, temperature = 650 ̊C. Ca:char loading = 10:1 by wt.
Hollow symbols indicate absence of calcium sorbent and solid symbols indicate presence
of calcium.......................................................................................................................... 88
Figure 30: Effect of different Ca(OH)2:char loading (by wt) on the selectivity of NO-char
reaction, LC-2. Total flow rate = 210 ml/min, inlet NO concentration = 600 ppm, inlet O2
concentration = 3%, temperature = 650 ̊C. ....................................................................... 89
Figure 31: Effect of inlet O2 concentration on the selectivity of char-NO reduction
reaction in presence of calcium sorbent and LC-2. Total gas flow rate = 210 ml/min, inlet
NO concentration = 600 ppm, temperature = 650 ̊C, Ca:char loading = 10:1 by wt. ....... 91
Figure 32: Effect of O2 concentration on NO-char isothermal reduction reaction in
presence of calcium sorbent and LC-2, pre-breakthrough periods. Inlet NO concentration
= 1800 ppm, Ca:char loading = 10:1 by wt, total gas flow rate = 210 ml/min, temperature
= 650 ̊C. ............................................................................................................................. 92
Figure 33: Effect on inlet NO concentration on the selectivity of char-NO reduction
reaction in presence of calcium sorbent and LC-2. Total gas flow rate = 210 ml/min, inlet
O2 concentration = 1.5%, temperature = 650 ̊C, Ca:char loading = 10:1 by wt. .............. 94
Figure 34: The simultaneous removal of NO, SO2 and CO2 from a simulated gas mixture,
in presence of calcium sorbent and lignite coal char LC-2. Inlet CO2 concentration =
13%, Inlet NO = 1800 ppm, Inlet SO2 = 3050 ppm, Inlet O2 = 1.5%, Ca:char loading =
10:1 by wt. Temperature = 650 ̊C. .................................................................................... 96
xviii
Figure 35: CCR process block flow diagram - heat exchangers not shown for simplicity.
......................................................................................................................................... 102
Figure 36: The block flow diagram of CCR process with NOx control – Cal-C process.
......................................................................................................................................... 103
Figure 37: Schematic of the three-step CLP process for high purity H2 production from
coal-derived syngas39
...................................................................................................... 110
Figure 38: The Aspen Plus flowsheet showing the CLP system applied to a coal-to-H2
plant. The red dotted arrows indicate the locations of high quality heat recovery to run an
auxiliary steam turbine cycle for the coproduction of electricity. .................................. 112
Figure 39: Schematic of the Rubotherm MSB setup used for performing
thermogravimetric experiments. ..................................................................................... 122
Figure 40: CaS conversion to CaSO4 as a function of time, at different isothermal
temperatures.CO2 concentration fixed at 80%, total pressure = 1 atm. .......................... 124
Figure 41: CaS conversion to CaSO4 as a function of time, at different H2O
concentrations. Isothermal experiments at (a) 875°C, (b) 900°C, and (c) 925°C........... 127
Figure 42: Oxidation of CaS with oxygen at calciner operating conditions. Varying the O2
concentration at isothermal conditions, product is CaSO4 at (a) 875°C, (b) 900°C, and (c)
925°C .............................................................................................................................. 129
Figure 43: Oxidation of CaS to CaSO4 with different oxidizing agents at concentrations
relevant to calciner operating conditions, H2O = 24%, CO2 = 80% and O2 = 5%, always
balance N2. Total gas flow rate was maintained at ~600 ml/min (at room T) for all
experiments and Texperiment = 900°C. ............................................................................... 131
Figure 44: Typical TGA graph for reaction between CaO and SO2/O2 mixture, starting
from CaCO3 decomposition in inert N2 .......................................................................... 132
Figure 45: CaSO4 formation from CaO at calciner operating conditions at various
temperatures. 1% O2, 2000 ppm SO2 .............................................................................. 134
Figure 46: Equilibrium constant of CaSO4 decomposition reactions as a function of
temperature ..................................................................................................................... 136
Figure 47: XRD analysis of (a) reactant and (b) product solid samples - Matched against
CaSO4 and CaS............................................................................................................... 138
Figure 48: Carbon deposition indicated by weight increase upon injection of CO. 650°C,
5 atm, 30% CO. ............................................................................................................... 140
Figure 49: Equilibrium constants of CaSO4 reduction, Boudouard and WGS reactions as
a function of temperature ................................................................................................ 141
Figure 50: 30% CO experiment with prior steam injection, 650°C and 8 atm (a) outlet gas
concentrations, and (b) sample weight change measured by the MSB. .......................... 143
xix
Figure 51: Typical experiment showing weight change (TGA) and outlet gas composition
(micro-GC) as a function of time, upon injection of reactive gases. 30% CO, 30% H2 and
steam injection before the experiment. T = 650°C and P = 10 atm. ............................... 145
Figure 52: Comparison of weight changes, when using (a) CaSO4 and (b) CaO solids in
the TGA at 650°C, 10 atm, 30% H2 and CO. ................................................................. 147
Figure 53: Process flow diagram of the CLP unit as applied to the coal-to-H2 process.
Dotted line indicates the solid purge stream and possible treatment locations for the
sulfurous species (original figure from reference 93
). ..................................................... 150
Figure 54: CaS oxidation between 700 and 900°C at (a) 5% O2, (b) 10% O2 and (c) 21%
O2. ................................................................................................................................... 153
Figure 55: reaction rate data as a function of reaction conversion X, for (a) 5% O2, (b)
10% O2 and (c) 21% O2. The graph clearly shows an initial fast reaction rate followed by
a slow diffusion controlled regime of reaction. .............................................................. 154
Figure 56: Base case coal-to-H2 plant with 2-stage Selexol and Claus plant for sulfur
removal93
......................................................................................................................... 159
Figure 57: Schematic of Fe-oxide based system for syn-gas generation from partial
oxidation of CH4 ............................................................................................................. 167
Figure 58: Effect of temperature on the methane conversion and syngas purity for
different metal oxide systems. (a) CeO2, (b) NiO, (c) Fe2O3 and (d) ITCMO system .... 170
Figure 59: Simulated equilibrium iron oxide phases and fractional carbon deposition as a
function of inlet gas:solid ratios at elevated pressure. T = 950 ˚C, P = 5 atm. ............... 173
Figure 60: Gas composition profiles and methane conversion at 900C, 1 atm with respect
to loading of Fe2O3.......................................................................................................... 176
Figure 61: Gas composition profiles and methane conversion at 900C, 10 atm with
respect to loading of Fe2O3 ............................................................................................. 176
Figure 62: The effect of total system pressure on rates of reduction at X = 0.75, and
constant partial pressure of H2. T = 900 ˚C ..................................................................... 183
Figure 63: The effect of mole fraction of reducing gas (YH2) on rates of reduction at X =
0.75, and constant partial pressures. T = 900°C ............................................................. 186
Figure 64: The effect of sysyem pressure on rates of reduction at X = 0.5 and X = 0.75,
and constant mole fraction of reducing gas YH2 = 50%, T = 900 ˚C .............................. 188
Figure 65: The effect of partial pressure of reducing gas PPH2 on (a) conversion curves
obtained and (b) rates of reduction at constant system pressure P = 5 atm. T = 900°C . 189
Figure 66: Reduction conversion curves obtained using CH4 from the thermogravimetric
analysis between 1 and 10 atm at constant mole fraction of reducing gas YCH4 = 50%. T =
950 ˚C.............................................................................................................................. 191
Figure 67: The effect of system pressure on reaction rate for the three-step reduction with
CH4 as the reducing gas. YCH4 = 50%, T = 950°C, P = 1 to 10 atm ............................... 194
xx
Figure 68: Effect of gas dispersion in the reduction kinetics of ITCMO particles in
presence of CH4. ............................................................................................................. 197
Figure 69: Pressure data and Reduction conversion obtained based on the original data
and the data obtained by applying pressure correction. Reducing gas = CH4 with YCH4 =
50%, T = 950°C, and P = 8 atm. ..................................................................................... 199
Figure 70: Oxidation conversion curves obtained from the thermogravimetric analysis
between 1 and 10 atm at YO2 = 0.1, T = 900 ˚C ............................................................. 201
Figure 71: XRD analysis of (a) reduced and (b) oxidized samples at 1 and 10 atm, 900°C.
Reducing environment is under H2 with YH2 = 0.5, and oxidizing environment is air... 203
Figure 72: SEM and EDS elemental mapping of cross sections of reduced particles.
Samples reduced under H2, YH2 = 0.5 and T= 900 ˚C. (a) 1 atm and (b) 10 atm ........... 205
Figure 73: Surface grains in samples reduced under H2, YH2 = 50% and T= 900 ˚C. (a) 1
atm and (b) 10 atm .......................................................................................................... 206
Figure 74: Simplified block flow diagram of chemical looping combustion. ................ 216
Figure 75: Simplified process schematic for the chemical looping gasification process
using steam to produce H2 .............................................................................................. 217
Figure 76: Thermodynamic equilibrium constants as a function of temperature for various
oxidation states of Fe and Co based materials ................................................................ 219
Figure 77: Effect of pressure on reaction rates for Fe samples, using at 900°C for (a)
reduction with 50% H2 as reducing agent, and (b) oxidation with steam. ...................... 223
Figure 78: The 20 cycle redox reactivity of Fe-based oxygen carriers at 900°C. .......... 225
Figure 79: Effect of pressure on reaction rates for Co samples, using at 900°C for (a)
reduction with 50% H2 as reducing agent, and (b) oxidation with steam. ...................... 228
Figure 80: The 20 cycle redox reactivity of Co-based oxygen carriers at 900°C ........... 229
Figure 81: SEM of the cross section of reduced Co sample at 5 atm, and 900°C. The EDS
mapping clearly shows the presence of Co, Mg, Al, and O phases in a single
microparticle tested here. ................................................................................................ 230
Figure 82: Hydration of CaO sorbent, 50% steam, 3 atm, 400°C .................................. 237
Figure 83: Hydration of CaO sorbent, 50% steam, 1.5 atm, 400°C ............................... 237
Figure 84: Carbonation-calcination cycles performed in the TGA, effect of calcination
environment on sintering. ............................................................................................... 238
Figure 85: Effect of CO2 concentration on sintering of the limestone and dolomite
sorbent. ............................................................................................................................ 239
Figure 86: Modeling the decay in reactivity by the equation given by equation A1 for MV
sorbent ............................................................................................................................. 241
Figure 87: Carbon deposition observed at the coupling zone of the Rubotherm MSB .. 242
Figure 88: Simultaneous addition of ~30% CO and ~20% H2 to the TGA in presence of
CaSO4 solids. Temperature maintained at 650 C and pressure of 5 atm. The outlet gas
xxi
concentrations are shown on primary y-axis and sample weight recorded by the MSB is
shown on the secondary y-axis. ...................................................................................... 243
Figure 89: Product XRD analysis after experiment with high purity (95%) H2, 650°C, 10
atm................................................................................................................................... 244
Figure 90: ITCMO particles reduced under 50% CH4 at 900 °C, effect of pressure on
reaction rates ................................................................................................................... 245
Figure 91: ITCMO particles reduced under 50% H2 at 900 °C, effect of pressure on
reaction rates ................................................................................................................... 246
Figure 92: ITCMO particles reduced under constant partial pressure of H2 of 1.5 atm at
900 °C, effect of pressure on reaction rates .................................................................... 246
Figure 93: The 20 redox cycles of Fe-based oxygen carriers supported on MgAl2O4, each
series corresponds to a new day of testing. Compiled data ............................................ 250
Figure 94: Reoxidized Co-based sample, SEM image of the surface. Sample reoxidized at
5 atm using steam, 900°C ............................................................................................... 252
Figure 95: EDS mapping of MgAl2O4 support used in steam oxidation experiments for
chemical looping ............................................................................................................. 253
1
CHAPTER 1: Introduction
The field of chemical looping research has made great strides in the recent years, and
emerged as one of the foremost leading technologies for the efficient fossil fuel
conversion in a carbon constrained world energy scenario1. This research work has been
conducted at the Ohio State University (OSU) in one of the topmost research centers,
recognized as an authority on various aspects and applications of the chemical looping
processes. In that capacity, this work deals with reactivity studies for the solid metal
oxides for various applications of the type I and type II chemical looping systems.
1.1 Type I and type II chemical looping systems
The chemical looping systems can be broadly classified as type I and type II looping,
according to the applications and the type of solids circulating in the system.2,3
The
schematics of the two process concepts are seen in Figure 1. The type I chemical looping
consists of a metal-metal oxide solid loop circulating between two (or more) reactors, and
this involves the transport of oxygen between reactor blocks via the solid metal oxides.
Type I chemical looping is an example of oxycombustion of fuel, i.e. a controlled
formation of carbon dioxide (CO2) and other combustion products via fuel oxidation by
the solid metal oxides. This results in the formation of an inherently separate and pure
CO2 stream, in applications involving complete combustion. On the other hand, the type
II chemical looping consists of a solid loop of metal oxides-metal carbonate circulating
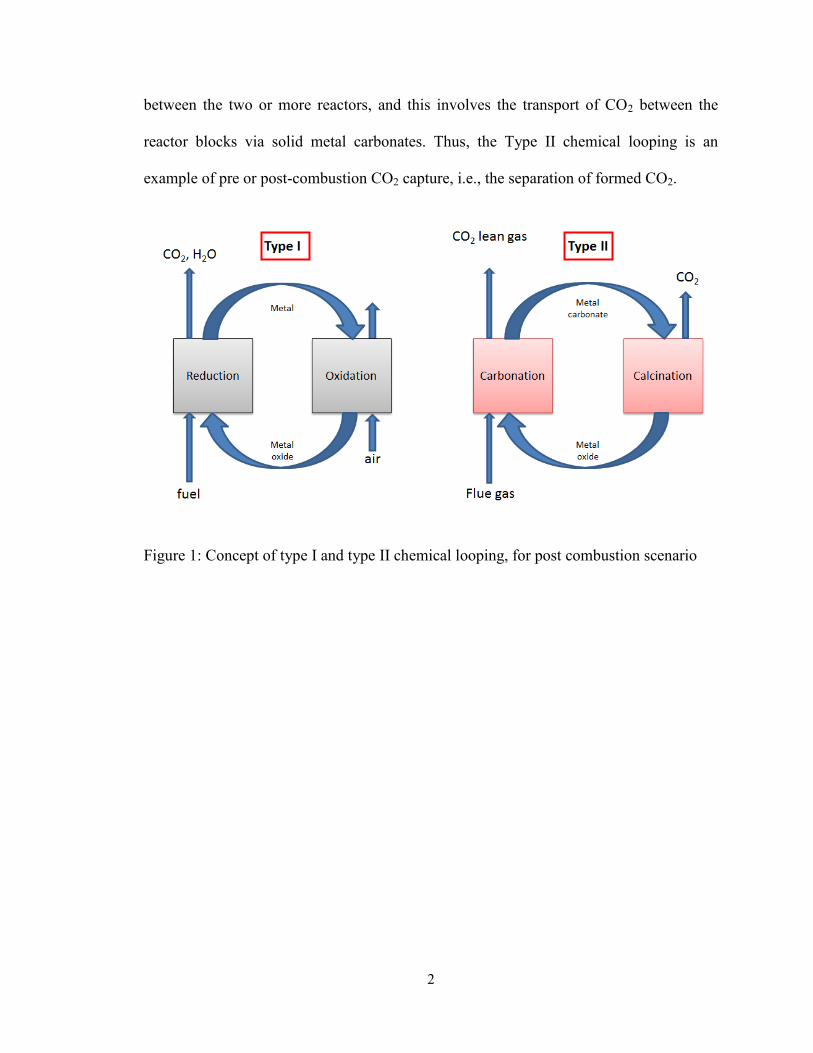
2
between the two or more reactors, and this involves the transport of CO2 between the
reactor blocks via solid metal carbonates. Thus, the Type II chemical looping is an
example of pre or post-combustion CO2 capture, i.e., the separation of formed CO2.
Figure 1: Concept of type I and type II chemical looping, for post combustion scenario
3
1.2 Major demonstration plants
The individual chapters of the present study pertain to specific applications of the type I
and type II chemical looping, and each chapter contains a review of the literature relevant
to the application being discussed. This section outlines the major demonstration efforts
of these two chemical looping concepts throughout the world.
Both type I and type II chemical looping systems have made significant technological
advances in the recent years. The type I technology was developed for various
applications such as chemical looping gasification, chemical looping combustion, and
partial oxidation. These processes were developed at OSU and demonstrated on various
lab scale, bench scale and subpilot scale units.4,5
The 25 kWth subpilot demonstration
units were constructed and tested for the syngas chemical looping (SCL) for testing
gaseous fuels6,7
and coal direct chemical looping (CDCL) for conversion of solid
fuels8,9,10
. One particular application of the SCL process is currently under construction
for the 250 kWth pilot scale demonstration at the National Carbon Capture Center
(NCCC) in Wilsonville, Alabama, to be operated under pressurized syngas combustion,
using OSU’s iron-titanium complex metal oxide (ITCMO) particles as the oxygen
carriers.5 The lab scale studies reported on in chapters 6 and 7 are in support of this
effort.
Elsewhere in the world also, the chemical looping processes are being demonstrated over
large scales. Recently, a 10 MW pilot plant has been designed by the Cenovus Energy
Inc., in association with Vienna University of Technology (TUV), and is proposed to be
constructed in Canada by the year 2020 for CLC application for the production of
4
electricity.11 The proposed plant is a CLC steam generator, for combustion of natural gas
that is used for Bitumen recovery from oil sands. Coupling of CLC and biomass
gasification plants has also been tested at the TUV for the co-production of syngas and
electricity in 120 and 100 kWth dual fluidized bed systems.12 The Technical University of
Darmstadt (TUD) has a 1 MWth unit operating with an interconnected circulating
fluidized bed CFB) system using the iron-titanium ore ilmenite as the oxygen carrier
materials for coal conversion.13,14
Alstom, U.S. has demonstrated the type I chemical
looping concept on a 3 MWth pilot plant for the conversion of coal using CaSO4 oxygen
carriers.15
Type II chemical looping uses solid metal oxides that can easily react reversibly with
CO2 to form metal carbonates. Calcium oxide (CaO) is the main metal oxide that is
researched in type II chemical looping, and it is also renamed calcium looping. Since the
concept was first proposed using twin fluidized bed reactors by Shimizu et al,16
it has
been widely researched for both pre and post combustion applications.17,18
The majority
of the present study is focused on various applications of this system.
The three-step calcium looping technology was pioneered at the OSU, through
synthetically derived19
and limestone-based20
calcium sorbents.21
>90% CO2 capture and
100% SO2 capture from coal-combustion flue gas has been demonstrated by the highly
reactive calcium hydroxide (Ca(OH)2) sorbent at a 120 kWth sub-pilot scale.22
This
technology has been licensed to Industrial Technology Research Institute (ITRI), and will
be demonstrated on a 1.9 MWth scale in Taiwan for a plant integrated with the cement
industry.23
The pre-combustion application of the calcium looping technology was also
5
demonstrated at OSU for H2 production from simulated coal-derived syngas on a 25
kWth scale.24
The calcium looping system has also been demonstrated on large scales
worldwide. The La-Pereda power plant by HUNOSA company in Spain has been
supplemented with a 1.7 MWth pilot plant designed to remove 70-90% CO2 under the
CaOling project using the calcium looping process.25
At TUD at Darmstadt, Germany, a
dual circulating fluidized bed reactor system is used for a 1 MWth demonstration of the
calcium looping process.26
1.3 Outline of chapters
Due to the rising greenhouse gas concentrations, such as CO2, in the atmosphere; major
research activities have been currently focused in the field of carbon capture from point
sources. Calcium looping, which uses calcium oxide (CaO) sorbent derived from
naturally occurring sources such as limestone, is a viable high temperature technology
that is in advanced stages of development. The CO2 capture from power generation is an
energy intensive step and therefore the competent CO2 capture technology is the one
which is economical, and incurs minimum energy production penalty. One way of
achieving this is a method which uses inexpensive and abundant natural resources.
The CaO sorbent derived from naturally occurring limestone loses its reactivity towards
CO2 over multiple high temperature cycles through a process called sintering. This decay
in reactivity of the sorbent has been a major focus area in this field of research in recent
years. The three step calcium looping process developed at OSU proposes hydration of
sintered CaO as the third step in the solids loop to reactivate the sorbent to overcome this
decay. Chapter 2 dwells on the significant development in this process block achieved
6
over the course of 3-4 years, from proof of concept experiments to bench scale
demonstration. Lab scale fixed bed experiments showed the feasibility of high
temperature steam hydration to effectively reactivate the CaO sorbent. The process
concept was further investigated in semi-batch and continuous modes in fluidized bed
reactors. The fluidization behavior of steam and CaO system was investigated, and fast
fluidized bed was identified as the best design for operation of the hydrator reactor.
In Chapter 3, the CaO sorbent obtained from various waste egg and sea shells is
demonstrated for its successful CO2 capture properties. Five different animal shells were
selected, which are common waste of the food industry. All shells were also sintered at
high temperature (950 °C) and subsequently regenerated using hydration. The inherent
differences in the capture capacities of the different shells are further investigated using
different analysis techniques such as bulk surface property analysis, X-ray diffraction and
scanning electron microscopy. The successful achievement of CaO sorbent from all shells
gives us a viable method of converting the waste material such as animal shells, which is
a nuisance to the environment, into a useful resource as a sorbent for CO2 capture.
A novel process – termed as the Cal-C process – is conceived in Chapter 4 for the
simultaneous removal of NO, SO2 and CO2 from coal-combustion flue gas. The Cal-C
process consists of three reactors, while the gas cleanup reactions occur in a single gas-
solid reactor with CaO sorbent and coal chars. The char is consumed in the process of
NO reduction and CaO is converted into calcium carbonate (CaCO3) and calcium sulfate
(CaSO4). The calciner regenerates the calcium sorbent and consumes any unreacted char.
The third reactor, hydrator, reactivates the calcium sorbent to restore its reactivity.
7
Results from laboratory-scale tests are presented which verify the process concept. A
detailed study of the NO-char reduction reaction was performed isothermally at 650 ̊C,
and in presence of the calcium sorbent. Complete NO reduction was achieved for various
process conditions tested. The process analysis was conducted using the ASPEN
simulation software. This new process is capable of 90% CO2 and NO removal and 100%
SO2 removal in a single process step, thereby reducing post-combustion processing steps
for coal-combustion power plants.
The work in Chapter 5 was undertaken to investigate the side-reactions involving
sulfurous species formed in the application of the calcium looping process (CLP) to a
coal-to-H2 plant with CO2 capture. The sulfur present in the coal is converted to gaseous
species such as hydrogen sulfide (H2S) and carbonyl sulfide (COS) in the gasifier, where
coal is converted to syngas (CO and H2). High purity H2 can be produced from this
syngas by subjecting it to the water gas shift reaction (WGS). The CaO sorbent aids this
equilibrium limited reaction by consuming the CO2 reaction product. The WGS and
carbonation reaction is carried out in a single reactor in the CLP system. In addition to
CO2, the CaO sorbent also removes the sulfurous (and halide) species by fixing them in
the solid form of calcium sulfide (CaS) in the same reactor. Thus, the CLP system causes
the multi-gas removal, enabling the production of high purity H2 and results in process
intensification by combining several unit operations in a single reactor.
The specific work in this chapter was undertaken to explore the fate of the solid sulfurous
species formed in the carbonator reactor. The CaS is converted to calcium sulfate
(CaSO4) under oxidizing conditions in the calciner. The CaSO4 so formed is recirculated
8
to the carbonator with the solid sorbent. The possible reductive decomposition of CaSO4
under the carbonator operating conditions was probed and it was revealed to be stable and
unreactive at reducing conditions of the carbonator tested, at 650°C and 10 atm. Thus, it
is concluded that CaSO4, once formed, is the stable species at the CLP operating
conditions, and the sulfur will exit the solids loop as such, along with the unreacted CaS,
via the purge stream of solids. Possible recommendations are made towards the end of
this chapter for the treatment of this unreacted CaS in the purge stream, including
possible treatment locations; gas concentrations; operating temperatures; and
modifications to existing process scheme.
In Chapters 6 and 7 of this study, experimental investigations of two specific applications
of type I chemical looping processes are illustrated. For gas to liquid (GTL) type of
applications, partial oxidation of methane (CH4) is a viable route for conversion of
natural gas to valuable chemicals. The oxygen for this partial oxidation process can be
supplied using solid oxygen carriers, which can be single or mixed metal oxides. A
particular partial oxidation scheme for CH4 conversion is called chemical looping partial
oxidation (CLPO). The CLPO reaction scheme consists of two reactors, using Fe-based
oxygen carrier particles which circulate within the two units and undergo cyclic
reduction-oxidation (redox) reactions. The solid carriers therefore serve as a vehicle for
oxygen between the units, enabling clean conversion of the fossil fuel with high purity
product streams generated. Unlike the conventional combustion and/or gasification, the
gaseous products of the two reactors are inherently separated. This allows minimization
9
of downstream processing and gas separation, making it a highly efficient energy
conversion process.
For applications involving high pressure downstream processing (such as producing
syngas as intermediate feedstock for liquid fuels and chemical synthesis), it may be
advantageous to operate this gas-solid CLPO system at elevated pressures. Thus, it is
desirable to study the effect of pressure on the reaction kinetics of the various reactions
involved. Therefore in Chapter 6, the high pressure experiments were conducted for
reduction and oxidation of oxygen carrier particles in a specialized thermogravimetric
analyzer (TGA). The relative reactions rates were computed for all experiments
conducted in the range of 1-10 atm. Specifically, the rate of reduction under H2 was
observed to double when pressure was increased from 1 to 10 atm, compared to a fivefold
increase in reduction rate under CH4. By comparison, oxidation reaction rate under air
was observed to increase by ~50%. The reduced and oxidized samples were analyzed
using SEM, XRD and BET techniques to determine the possible role of pressure in
producing a more reactive particle, which explains the superior reaction rates observed at
elevated pressures.
Similar to CLPO, which produces syngas, the versatile Fe-based oxygen carrier materials
can be used in another application called chemical looping gasification (CLG) to co-
produce high purity H2 and electricity. In this configuration, the chemical looping
reaction scheme is split over three reactors. The reducer is used to completely oxidize a
carbonaceous fuel, and the reduced metal oxides produced as a result are oxidized
sequentially in two reactors. In the first reactor, called the oxidizer, steam (H2O) is used
10
to partially re-oxidize the reduced metal oxides and produce H2 as a result. The solids are
further fully oxidized in the combustor, where the high exothermic heat of the oxidation
reactions is harnessed to produce electricity. This process concept has been previously
verified as the syngas chemical looping (SCL) process at OSU at the 25kWth scale, with
>99.99% purity H2 produced during steady state operation.
The Fe-based oxygen carriers used in the SCL process are typically
thermogravimetrically tested for their recyclability under redox conditions, under
conventional air oxidation. Chapter 7 reports on TGA tests conducted to verify the
reactivity and recyclability of the Fe-based oxygen carriers under redox conditions
involving steam. The reactive Fe2O3 supported on MgAl2O4 was subjected to up to 20
redox cycles in the TGA. Identical test conditions were also repeated on Co3O4 supported
on MgAl2O4 for comparison. Unlike Co-based samples, which showed sluggish reaction
rates and loss in reactivity over cycles, the Fe-based oxygen carriers exhibited excellent
reactivity and recyclability over the 20 cycles tested. The steam oxidation resulted in
Fe3O4 formation after every cycle, verifying the stability and suitability of Fe-based
materials for CLG applications.
11
CHAPTER 2: Steam Hydration as Reactivation for the Calcium
Sorbent
2.1 Introduction
The calcium oxide (CaO) sorbent is a high temperature sorbent for the capture of carbon
dioxide (CO2) for pre-and post-combustion applications. Several unique characteristics of
the calcium sorbent make it highly amenable to CO2 capture from large point sources
such as coal combustion power plants.
1. It is derived from naturally occurring limestone, making it a highly inexpensive
sorbent.
2. It is an environmentally benign sorbent which is available in large quantities.
3. The sorbent material is robust towards other impurities that may be present in the
syngas or flue gas, such as fly-ash, halide, sulfur, and heavy metal impurities.
4. Unlike other physical and chemical CO2 scrubbing techniques which use lower
temperature solvents/sorbents, the calcium looping process is a high temperature
process, which allows high temperature heat recovery and therefore reduces the
energy penalty of the CO2 separation step.
Traditionally, the CO2 removal by calcium sorbent is achieved by employing the
reversible reaction between CaO and CO2 in a closed solids loop, in an aptly named
12
calcium-looping technology. CaO reacts with the dilute CO2 present in the gas mixture
(~10-15% in coal combustion flue gas) and thereby fixes the CO2 in the solid calcium
carbonate (CaCO3) form in a high temperature reactor (carbonator, 600-700°C). This
CaCO3 is separated from the gas mixture by any high temperature gas-solid separation
technique, and transported to second reactor (calciner, 900°C). Here, the high
temperature endothermic decomposition of CaCO3 takes place to release CO2 in a
concentrated form. This concentrated stream of CO2 may then be used for other
applications or sequestered. The regenerated CaO sorbent is then recycled back to the
carbonator, closing the solids loop.
In this two-step process, the CaO sorbent loses its reactivity towards CO2 over multiple
cycles. The high temperature thermal decomposition (calcination) reaction causes
sintering of the CaO particles, resulting in loss of surface morphological characteristics.
Thus, over an extended number of cycles, a large excess of CaO sorbent is required to
achieve the same amount of CO2 removal. This results in large solid circulation rates
and/or large purge and makeup rates to achieve the desired level of CO2 removal.
The traditional calcium loop requires repeated cycling of the CaO sorbent through high
temperature calcination, resulting in rapid degeneration of the sorbent reactivity towards
CO2 due to sintering. Over the last decade or so, various methods have been researched,
developed and proposed to overcome this decay in sorbent reactivity.27,28,29
Some of these
methods include structurally engineered sorbents to improve their mechanical strength30
,
doping the sorbents with chemical additives to resist sintering31,32
, use of dolomitic
sorbents (which results in more robust sorbents which resist sintering, but at the expense
13
of lower CO2 carrying capacity)33
, thermal pre-treatment34
, recarbonation35
etc. One such
method of overcoming the loss in reactivity is the regeneration of the calcined sorbent
through its conversion to Ca(OH)2. It is a well-established fact that the conversion of
CaO to Ca(OH)2 leads to increased reactivity of the sorbent towards CO2.22
Thus, various
options exist for applying hydration as a sorbent reactivation method, such as: sorbent
pre-treatment with water/steam, and a regeneration step of hydration after a specific
number of cycles, or in-line partial/complete hydration of spent sorbent stream every
cycle.36,37
The last option necessitates the inclusion of hydration as a separate unit of the
calcium looping process. Not only that, in order for hydration to become a viable third
step of this high temperature cyclic process, it is imperative to operate this step at
appropriately high temperatures. This concept forms the basis of the development of
Ohio State’s 3-step calcium looping technology.
In this envisioned process, the hydration is a separate step between the high temperature
thermal calcination and carbonation. In this step, the CaO is hydrated to calcium
hydroxide (Ca(OH)2), which shows superior reactivity towards CO2 as compared to CaO
sorbent. Due to this high reactivity of Ca(OH)2 towards CO2, the solid to gas ratios as
well as the overall solid circulation rates, and makeup and purge rates of the system are
reduced greatly. This fact was first demonstrated at the 120KWth scale using an actual
coal combustion flue gas for post combustion CO2 capture.22
Here, using Ca(OH)2
instead of CaO, near stoichiometric gas: solid ratios were found to be sufficient to
achieve ~90% CO2 removal and also 100% SO2 removal in a single reactor in a matter of
seconds. Also, on this scale, the effectivity of hydration as a reactivation treatment for the
14
multicyclic use of CaO sorbent was tested for the first time. Offline hydration was
performed after each cycle on a commercial lime hydration unit and the reactivity of this
re-activated solid was found to be maintained over the 5 cycles tested.22
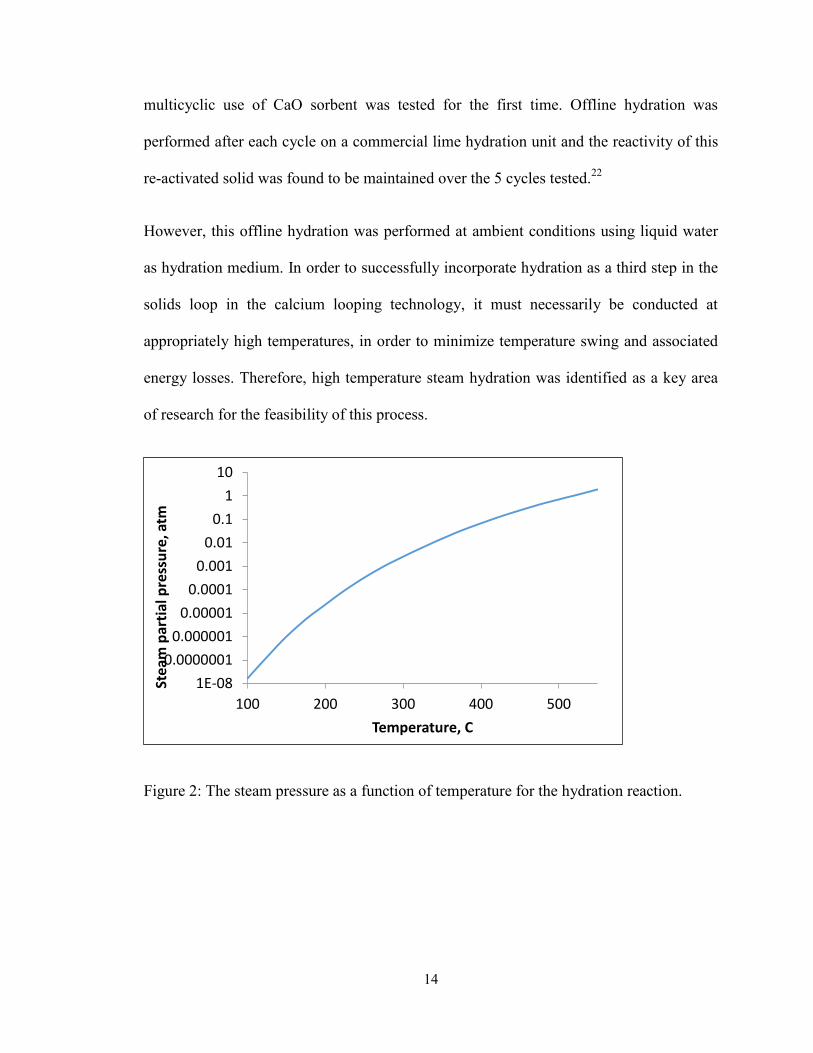
However, this offline hydration was performed at ambient conditions using liquid water
as hydration medium. In order to successfully incorporate hydration as a third step in the
solids loop in the calcium looping technology, it must necessarily be conducted at
appropriately high temperatures, in order to minimize temperature swing and associated
energy losses. Therefore, high temperature steam hydration was identified as a key area
of research for the feasibility of this process.
Figure 2: The steam pressure as a function of temperature for the hydration reaction.
1E-08
0.0000001
0.000001
0.00001
0.0001
0.001
0.01
0.1
1
10
100 200 300 400 500
Stea
m p
arti
al p
ress
ure
, atm
Temperature, C
15
The steam hydration reaction is given below:
CaO + H2O(g) → Ca(OH)2 Rxn 1
The equilibrium relationship between the partial pressure of steam and temperature is
shown in Figure 2. At a constant temperature, for steam pressures above the equilibrium
curve, the forward reaction is favored and the solid product is Ca(OH)2. For steam
pressures below the equilibrium curve at the same temperature, the backward reaction is
favored and the stable product is CaO. In pure steam environments, at 512°C, the
equilibrium steam pressure is 1 atm. Thus, this places an upper boundary for the
operating temperature of the steam hydration reactor, as operation above 512°C will
require elevated pressures to carry out the hydration reaction. According to process
integration simulations performed by Wang et.al., a minimum hydrator operating
temperature of 350°C is required for the effective heat recovery of the exothermic heat of
hydration.38
Also, with the hydrator operation at 500°C, the drop in electricity generation
efficiency is predicted to be around 20-22%, as compared to 25% using oxycombustion
and 27% using amine scrubbing. Therefore temperature range of 350-512°C is thus
chosen for the hydrator reactor to successfully integrate into the solid sorbent loop of the
calcium looping technology.
16
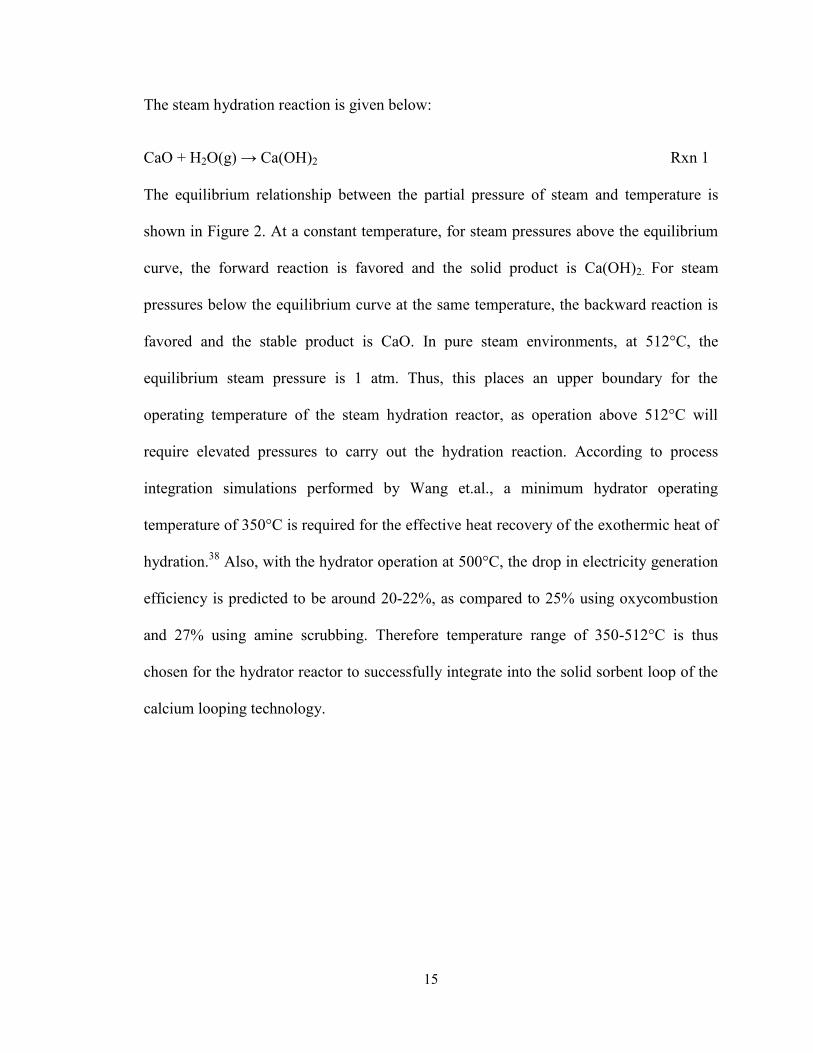
The Figure 3 shows the equilibrium pressure curve in the temperature range of interest. It
can be appreciated that the equilibrium pressure rises exponentially in the narrow
operating window of 350 to 500°C. Further, the hydration reaction rate is proportional to
the difference between operating steam pressure and the equilibrium pressure, i.e. R α
(PH2O – PH2O*)n. Therefore, the challenge of the successful operation of hydration reactor
is to achieve reaction rates comparable to that of carbonation and calcination, while
attaining as high temperatures of operation as possible.
Figure 3: Exponential increase in the equilibrium reaction pressure with temperature, in
the temperature range of interest.
0
0.1
0.2
0.3
0.4
0.5
0.6
0.7
0.8
0.9
1
300 350 400 450 500
Stea
m p
arti
al p
ress
ure
, atm
Temperature, C
Ca(OH)2
CaO
17
Thus, the feasibility of high temperature steam hydration was studied in the present work,
using lab scale fixed bed testing. Hydration was carried out using steam at 500°C on
different sorbents. The sorbents were derived from various limestones as precursors, and
were subjected to up to 5 cycles of carbonation, calcination and hydration. The reactivity
of the sorbents upon hydration was found to be restored after every cycle, with negligible
decay in reactivity observed over the five cycles tested. One of the limestones was further
selected to carry out extended number of cycles (over 15 cycles) and its reactivity was
compared to the traditional two step cycles which were also conducted on the same
sorbent. The hydration resulted in superior sorbent morphology, with the pore size
distribution shifting towards mesopores formation upon hydration.
2.2 Feasibility of steam hydration
Reproduced in part with permission from Phalak, N.; Deshpande, N.; Fan, L.-S.
Investigation of High-Temperature Steam Hydration of Naturally Derived Calcium Oxide
for Improved Carbon Dioxide Capture Capacity over Multiple Cycles. Energy Fuels
2012, 26 (6), 3903–3909. Copyright [2012] American Chemical Society.
2.2.1 Experimental materials and methods
Six different limestones were procured from various regions of the US Midwest. The
three limestones obtained from Graymont Inc. were Pleasant Gap, PA (PG), Genoa, OH
(GN) and Townsend, MT (TS). The three limestones obtained from Carmeuse Lime and
Stone were Maysville, KY (MV), Blackriver, KY (BR) and Toledo, OH (TL). The GN
and TL samples were dolomitic in origin, while the rest were calcitic. The composition
and initial CO2 capture capacity of these limestone sorbents is shown in Table 1. The
18
limestones were crushed and sieved to the desired particle size of 250-300μ. The CaO
sorbent was then obtained from the crushed limestone sample by calcining in a muffle
furnace at 950°C for 2 hours in air environment. The CaO sorbent thus produced was
hydrated using a fixed bed reactor setup at 500°C for 30 minutes, using 90% steam. After
hydration, the sample particle size was found to be reduced to less than 20μ, and no
further effort was expended on controlling particle size of the samples. The fixed bed
reactor setup is shown in Figure 4. The carbonation was conducted in the same fixed bed
reactor at 650°C using 12% CO2 for 2 hours.
19
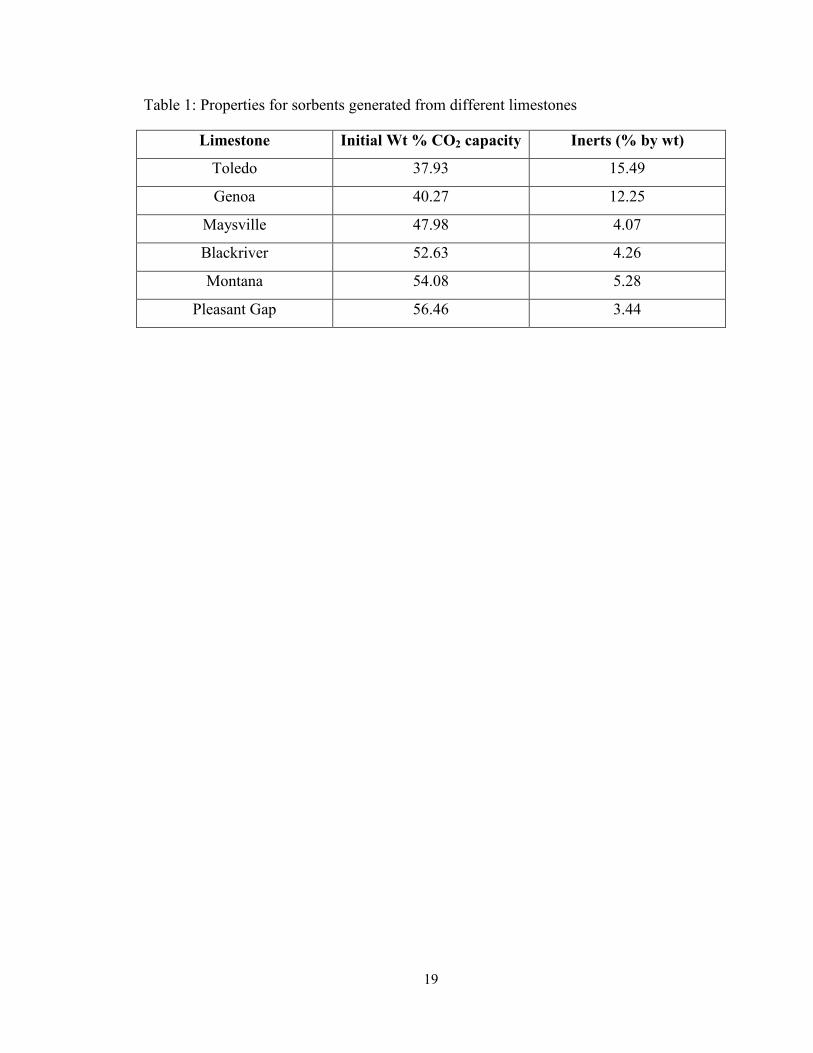
Table 1: Properties for sorbents generated from different limestones
Limestone Initial Wt % CO2 capacity Inerts (% by wt)
Toledo 37.93 15.49
Genoa 40.27 12.25
Maysville 47.98 4.07
Blackriver 52.63 4.26
Montana 54.08 5.28
Pleasant Gap 56.46 3.44
20
The desired gas flowrates were obtained by using a battery of mass flow controllers and a
gas mixing panel. The gas was preheated in an electrically heated zone. Water was
injected in the preheater section using a high precision syringe pump (ISCO 100DM).
This preheater zone was filled with quartz-wool to increase the contact area between the
water and the heated gas, thereby producing steam in situ. The steam-gas mixture was
injected from the top of the fixed bed reactor, which was encased in an electrically heated
furnace. The solids bed was contained in the fixed bed reactor. Downstream of the fixed
bed reactor, the gas passed through a condenser before being vented to the atmosphere.
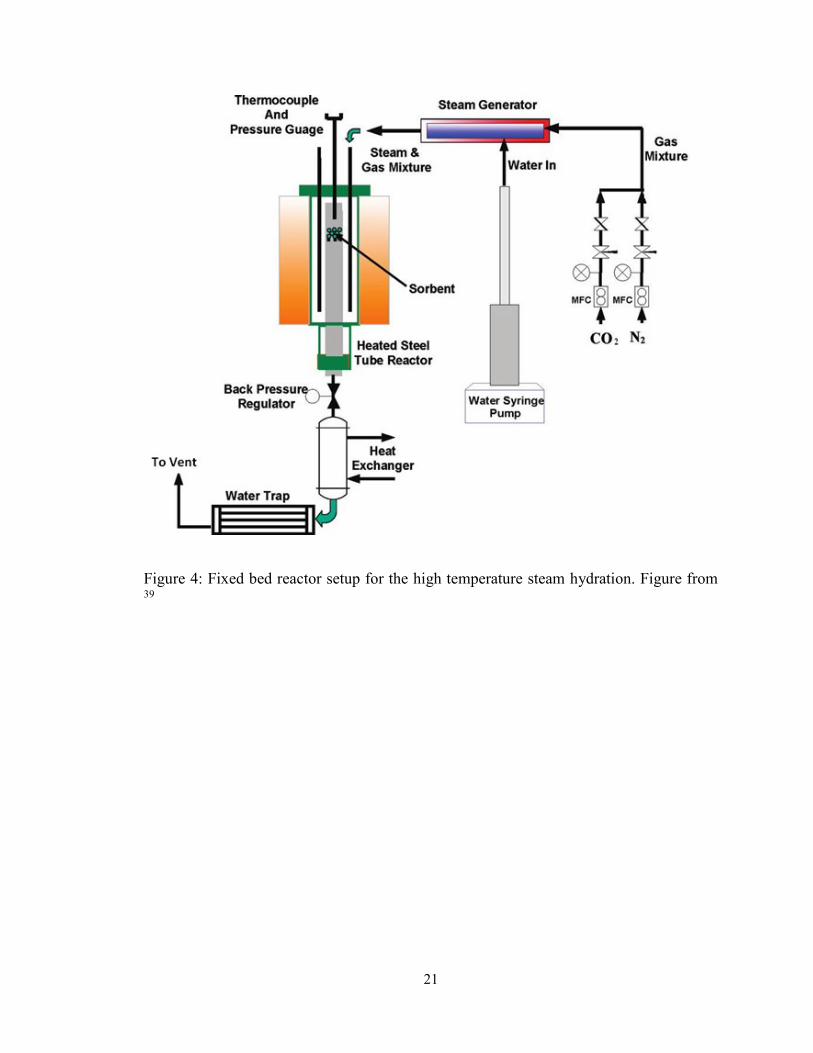
21
Figure 4: Fixed bed reactor setup for the high temperature steam hydration. Figure from 39
22
The samples were tested for their carbonate, hydrate, and oxide content after each step in
the cycle using a thermogravimetric analyzer (TGA) to decompose the sample under inert
N2 environment. After each hydration step, the sorbents’ reactivity towards CO2 was also
tested using the same. The sorbent reactivity is quantified by means of “wt % CO2
capture”, which is defined as
𝑊𝑒𝑖𝑔ℎ𝑡 % 𝐶𝑂2𝑐𝑎𝑝𝑡𝑢𝑟𝑒 =𝑤𝑒𝑖𝑔ℎ𝑡 𝑜𝑓 𝐶𝑂2𝑐𝑎𝑝𝑡𝑢𝑟𝑒𝑑
𝑤𝑒𝑖𝑔ℎ𝑡 𝑜𝑓 𝐶𝑎𝑂 𝑠𝑜𝑟𝑏𝑒𝑛𝑡∗ 100
The physical morphological changes in the sample were studied using qualifying and
quantifying techniques such as scanning electron microscopy (SEM) and N2
physisorption analysis respectively.
The weight of inerts in the original sample from the TGA analysis is defined as weight of
all species excluding CaCO3.This weight is assumed to be constant, i.e. unreactive and
inert with respect to temperature. This assumption is an approximation, since the
limestone contains other species which, though being non-reactive toward CO2 capture at
high temperatures of operation, yet undergo decomposition to release gaseous species
during the initial TGA analysis.
For the calcitic stones, this assumption is valid since the fraction of inerts present in the
original sorbent is very low, and the weight loss upon heating is not appreciable with the
analysis instrument available, viz. TGA. However, the dolomitic sorbents contain
appreciable amounts of other species which are not fully inert (they undergo perceivable
weight loss due to decomposition upon being heated in an inert atmosphere, which can be
distinguished from the weight loss of CO2 from CaCO3). Therefore, this assumption
23
cannot be extended to the dolomitic sorbents to calculate the active fraction of dehydrated
sorbent in TGA, for comparing the sorbents on calcium and hydrate basis.
Thus, the dolomitic sorbents are excluded from the following analysis.
Calculation of calcium basis:
𝑤𝑡% 𝐶𝑂2𝑐𝑎𝑝𝑡𝑢𝑟𝑒 𝑜𝑛 𝑐𝑎𝑙𝑐𝑖𝑢𝑚 𝑏𝑎𝑠𝑖𝑠 =𝐶𝑂2 𝑐𝑎𝑝𝑡𝑢𝑟𝑒𝑑 (𝑔𝑚)
𝑤𝑒𝑖𝑔ℎ𝑡 𝑜𝑓 𝑎𝑐𝑡𝑖𝑣𝑒 𝑠𝑜𝑟𝑏𝑒𝑛𝑡 (𝑔𝑚)× 100
Active weight is defined as weight of the sample present in the form of CaO and
therefore capable of capturing CO2. It is calculated as follows:
𝑊𝑎𝑐𝑡𝑖𝑣𝑒 = 𝑊𝑐𝑎𝑙𝑐𝑖𝑛𝑒𝑑 × (1 – 𝑓𝑖)
𝑓𝑖 =𝑤𝑖
𝑤𝐶𝑎𝑂 + 𝑤𝑖
where, 𝑤𝐶𝑎𝑂 = 𝑓𝐶𝑎𝐶𝑂3× 𝑊𝑜 ×
56
100
and 𝑤𝑖 = (1 − 𝑓𝐶𝑎𝐶𝑂3) × 𝑊𝑜
Wactive = weight of active sorbent (gm)
WCalcinced = weight of sample in TGA after dehydration and before carbonation, in CaO
fi = fraction of inerts in weight of dehydrated sample in TGA
wi = weight of inerts in original sample Wo, in TGA
wCaO = weight of CaO in dehydrated sample in TGA
Calculation of hydrate basis:
24
Not all of the sorbent is hydrated during the steam hydration step. Also, the degree of
hydration is believed to be different for different sorbents for fixed duration of steam
hydration. Therefore, the weight % CO2 capture of all sorbents is compared on the basis
of the actual hydrate present in each sorbent during each cycle.
To this end, estimation of the degree of hydration was required. For the purpose of the
following calculations, it is assumed that weight of H2O evolved during dehydration prior
to carbonation in TGA is indicative of the degree of hydration of sorbent.
𝑥ℎ𝑦𝑑𝑟𝑎𝑡𝑒 𝑏𝑎𝑠𝑖𝑠 = 𝑊𝐶𝑂2,ℎ𝑦𝑑𝑟𝑎𝑡𝑒𝑑 𝑠𝑜𝑟𝑏𝑒𝑛𝑡
𝑊ℎ𝑦𝑑𝑟𝑎𝑡𝑒𝑑× 100
where 𝑊𝐶𝑂2,ℎ𝑦𝑑𝑟𝑎𝑡𝑒𝑑 𝑠𝑜𝑟𝑏𝑒𝑛𝑡 = 𝑊𝐶𝑂2,𝑡𝑜𝑡𝑎𝑙– 𝑊𝐶𝑂2,𝑢𝑛ℎ𝑦𝑑𝑟𝑎𝑡𝑒𝑑 𝑠𝑜𝑟𝑏𝑒𝑛𝑡
𝑊ℎ𝑦𝑑𝑟𝑎𝑡𝑒𝑑 =𝑊𝐻2𝑂
18× 56
𝑊𝑢𝑛ℎ𝑦𝑑𝑟𝑎𝑡𝑒𝑑 = 𝑊𝑎𝑐𝑡𝑖𝑣𝑒– 𝑊ℎ𝑦𝑑𝑟𝑎𝑡𝑒𝑑
𝑊𝐶𝑂2,𝑢𝑛ℎℎ𝑦𝑑𝑟𝑎𝑡𝑒𝑑 𝑠𝑜𝑟𝑏𝑒𝑛𝑡 =𝑥𝑐𝑎𝑙𝑐𝑖𝑛𝑒𝑑
100× 𝑊𝑢𝑛ℎ𝑦𝑑𝑟𝑎𝑡𝑒𝑑
𝑊𝐶𝑂2,𝑡𝑜𝑡𝑎𝑙= total weight of CO2 captured
𝑊𝐶𝑂2,𝑢𝑛ℎ𝑦𝑑𝑟𝑎𝑡𝑒𝑑 𝑠𝑜𝑟𝑏𝑒𝑛𝑡= weight of CO2 captured by unhydrated sorbent
𝑊ℎ𝑦𝑑𝑟𝑎𝑡𝑒𝑑= weight of hydrated sorbent, in the form of CaO
𝑊𝑎𝑐𝑡𝑖𝑣𝑒= weight of active sorbent, in the form of CaO
𝑊𝑢𝑛ℎ𝑦𝑑𝑟𝑎𝑡𝑒𝑑= weight of unhydrated sorbent, in the form of CaO
25
𝑥𝑐𝑎𝑙𝑐𝑖𝑛𝑒𝑑= weight % capture for calcined sorbent in the corresponding cycle
2.2.2 Recyclablility of the sorbents over steam hydration
All the sorbents tested showed excellent recyclability upon being subjected to the five
cycles of carbonation, calcination and hydration. The sorbents showed negligible loss in
reactivity over five cycles, thus showing the effectiveness of steam hydration as a
reactivation treatment of CaO sorbent. The following Figure 5 shows the five-cycle
performance of the six sorbents tested here. It was also observed that the sorbents derived
from different limestone precursors exhibited different reactivity towards CO2 despite
being treated at identical reaction conditions. However, this disparity in the reactivities
may be explained in part by the different amounts of inerts present in the sorbent. When
the weight % CO2 capture is considered on the basis of the active calcium content of the
sorbent, the difference in reactivity is reduced. Further, the sorbents are also observed to
hydrate to dissimilar extents despite being subjected to identical hydration reaction
conditions. The gap in the measured reactivity is further diminished when the CO2
capture is considered only on the fraction of the sorbent that is hydrated (hydrate basis in
Figure 6).
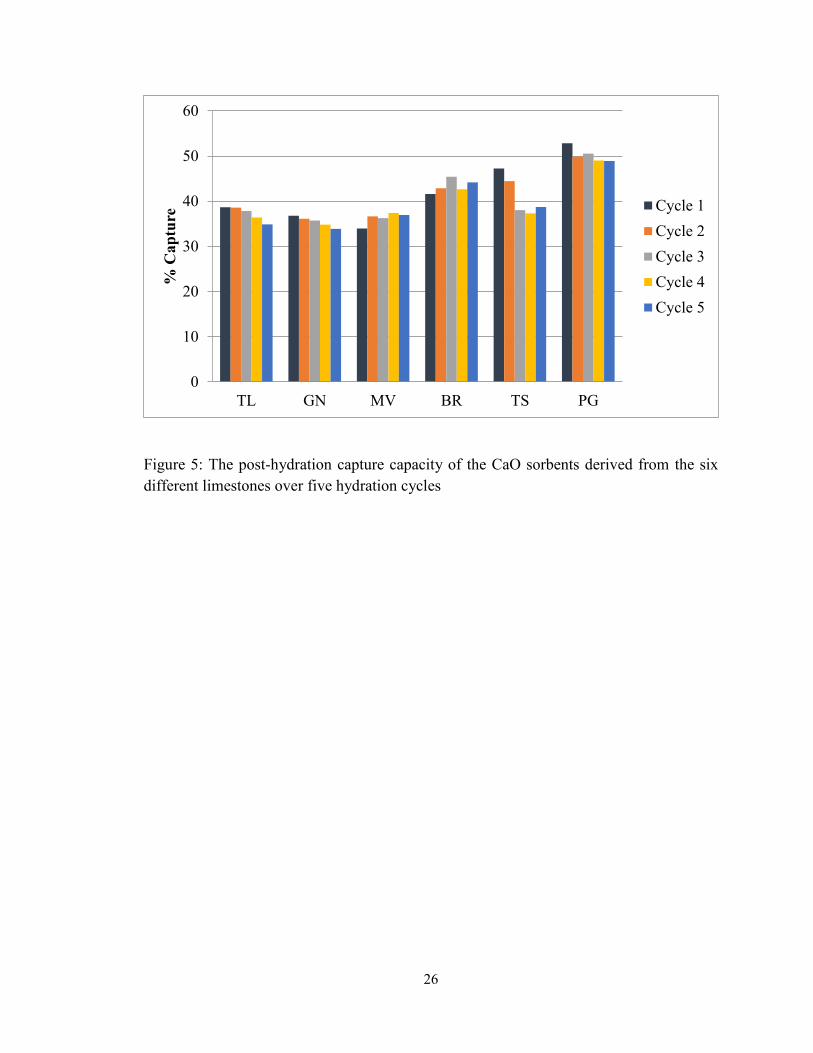
26
Figure 5: The post-hydration capture capacity of the CaO sorbents derived from the six
different limestones over five hydration cycles
0
10
20
30
40
50
60
TL GN MV BR TS PG
% C
ap
ture
Cycle 1
Cycle 2
Cycle 3
Cycle 4
Cycle 5
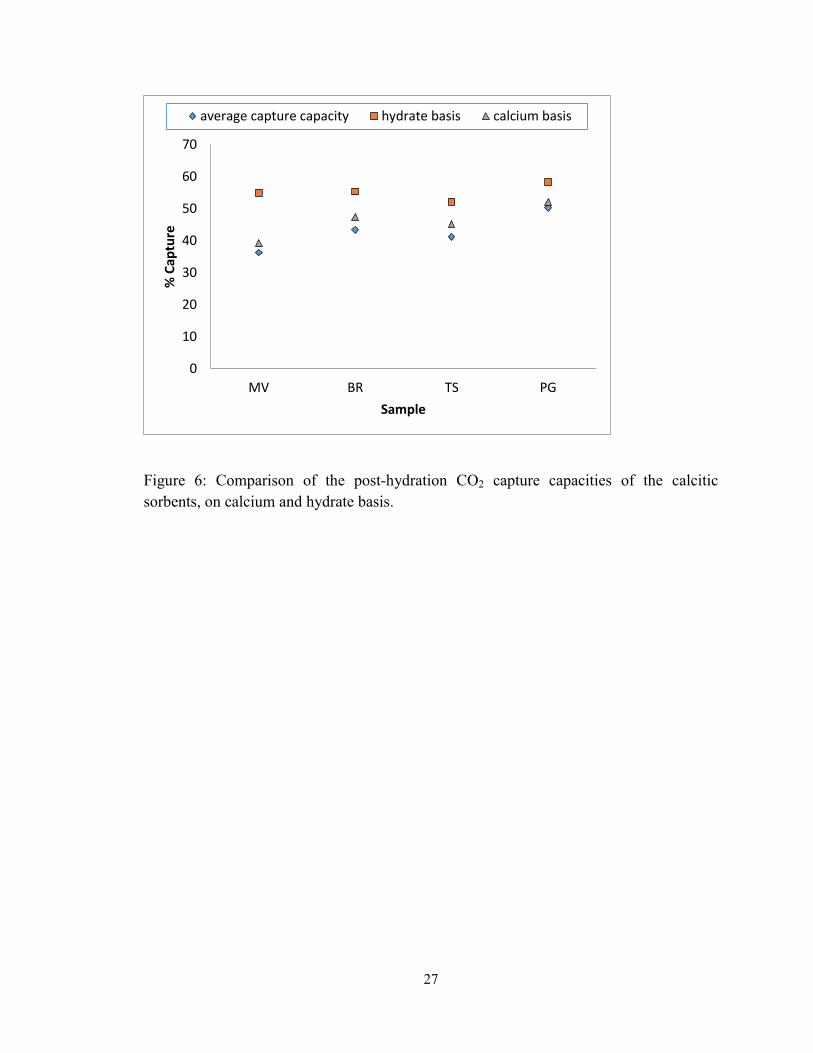
27
Figure 6: Comparison of the post-hydration CO2 capture capacities of the calcitic
sorbents, on calcium and hydrate basis.
0
10
20
30
40
50
60
70
MV BR TS PG
% C
aptu
re
Sample
average capture capacity hydrate basis calcium basis
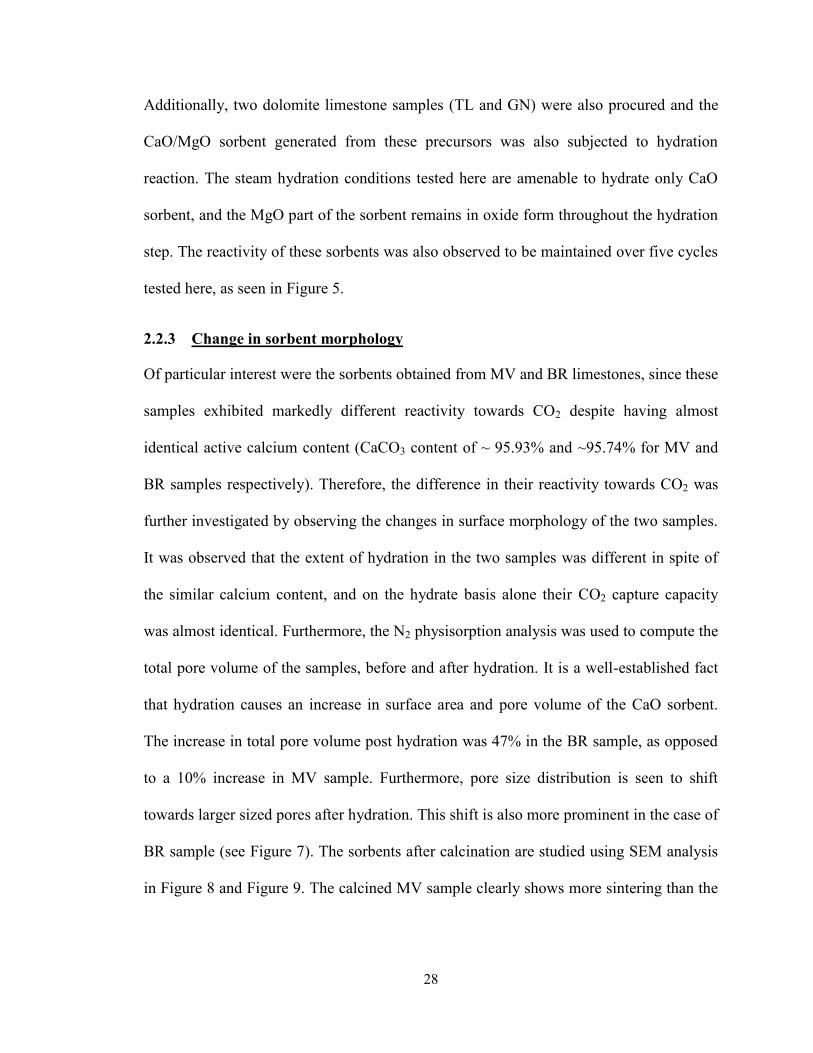
28
Additionally, two dolomite limestone samples (TL and GN) were also procured and the
CaO/MgO sorbent generated from these precursors was also subjected to hydration
reaction. The steam hydration conditions tested here are amenable to hydrate only CaO
sorbent, and the MgO part of the sorbent remains in oxide form throughout the hydration
step. The reactivity of these sorbents was also observed to be maintained over five cycles
tested here, as seen in Figure 5.
2.2.3 Change in sorbent morphology
Of particular interest were the sorbents obtained from MV and BR limestones, since these
samples exhibited markedly different reactivity towards CO2 despite having almost
identical active calcium content (CaCO3 content of ~ 95.93% and ~95.74% for MV and
BR samples respectively). Therefore, the difference in their reactivity towards CO2 was
further investigated by observing the changes in surface morphology of the two samples.
It was observed that the extent of hydration in the two samples was different in spite of
the similar calcium content, and on the hydrate basis alone their CO2 capture capacity
was almost identical. Furthermore, the N2 physisorption analysis was used to compute the
total pore volume of the samples, before and after hydration. It is a well-established fact
that hydration causes an increase in surface area and pore volume of the CaO sorbent.
The increase in total pore volume post hydration was 47% in the BR sample, as opposed
to a 10% increase in MV sample. Furthermore, pore size distribution is seen to shift
towards larger sized pores after hydration. This shift is also more prominent in the case of
BR sample (see Figure 7). The sorbents after calcination are studied using SEM analysis
in Figure 8 and Figure 9. The calcined MV sample clearly shows more sintering than the
29
corresponding BR sample, after 1 as well as 5 cycles. This indicates towards the lower
reactivity of the MV sample observed. The MV and BR samples are compared for their
morphological changes before and after hydration. After hydration, the ‘popcorn effect’
is also observed in both samples (Figure 10 and Figure 11). All of these observations
serve to explain the difference in reactivity of the two samples towards hydration, and
therefore subsequently, carbonation.
Figure 7: Particle size distribution post calcination and post hydration for (a) MV and (b)
sorbent
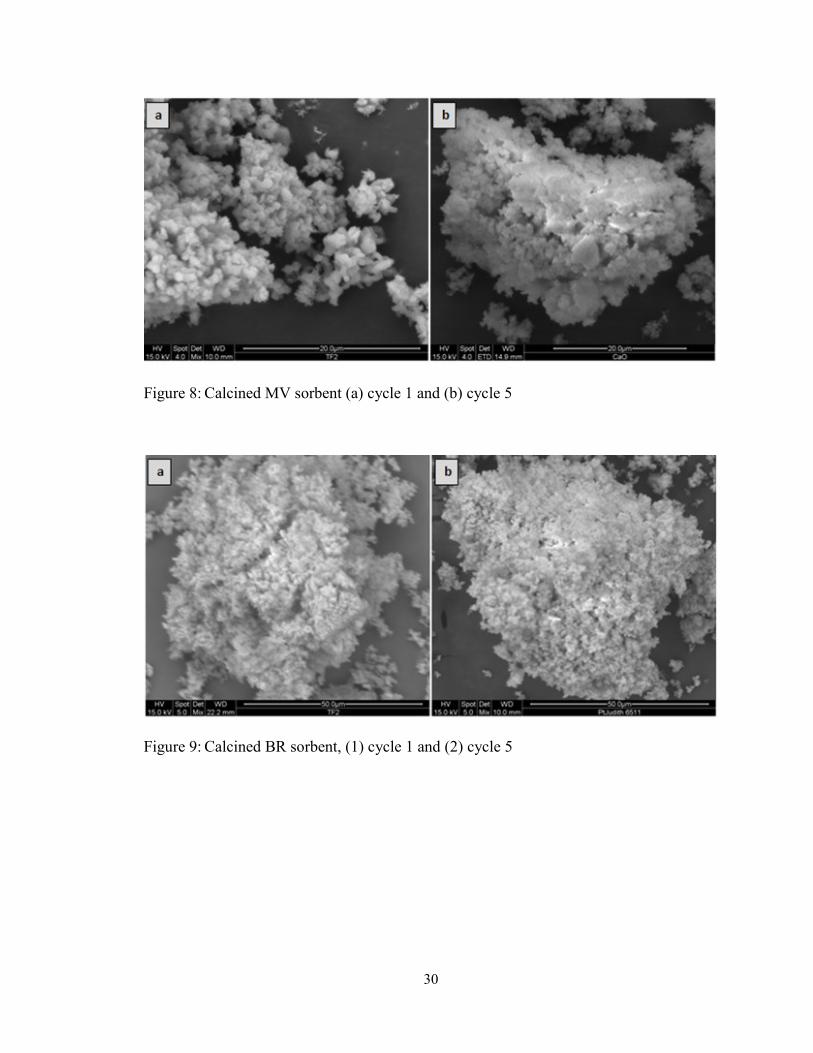
30
Figure 8: Calcined MV sorbent (a) cycle 1 and (b) cycle 5
Figure 9: Calcined BR sorbent, (1) cycle 1 and (2) cycle 5
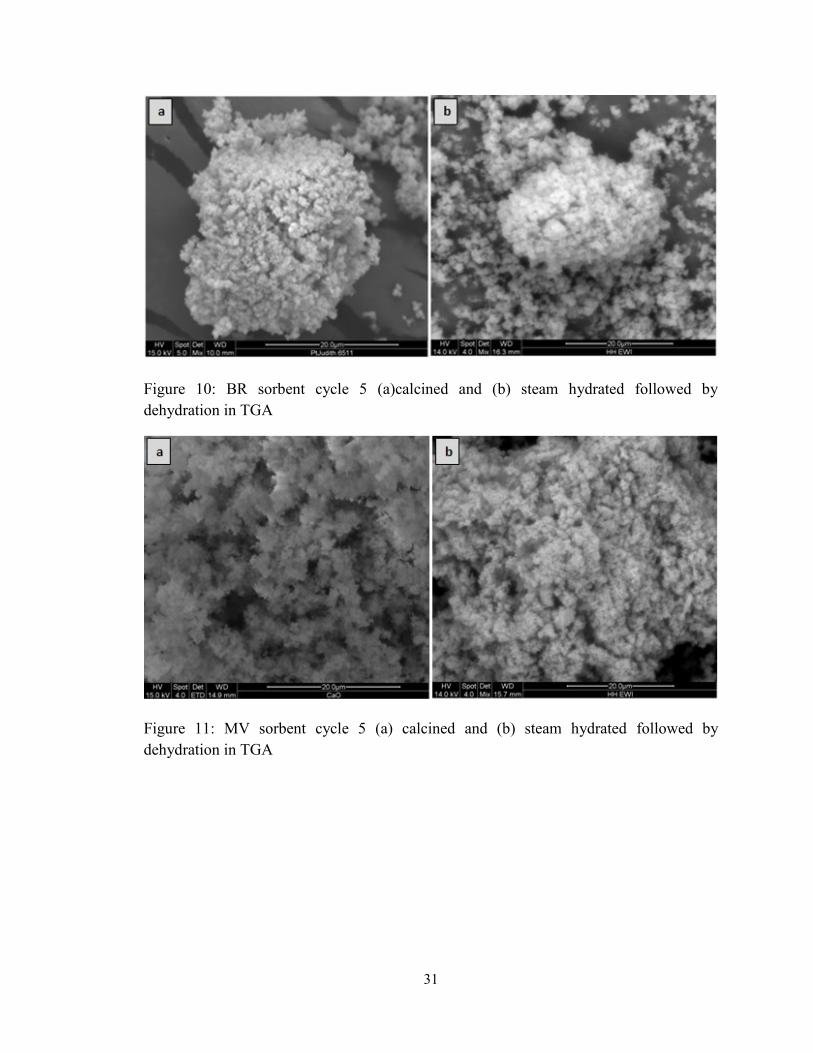
31
Figure 10: BR sorbent cycle 5 (a)calcined and (b) steam hydrated followed by
dehydration in TGA
Figure 11: MV sorbent cycle 5 (a) calcined and (b) steam hydrated followed by
dehydration in TGA
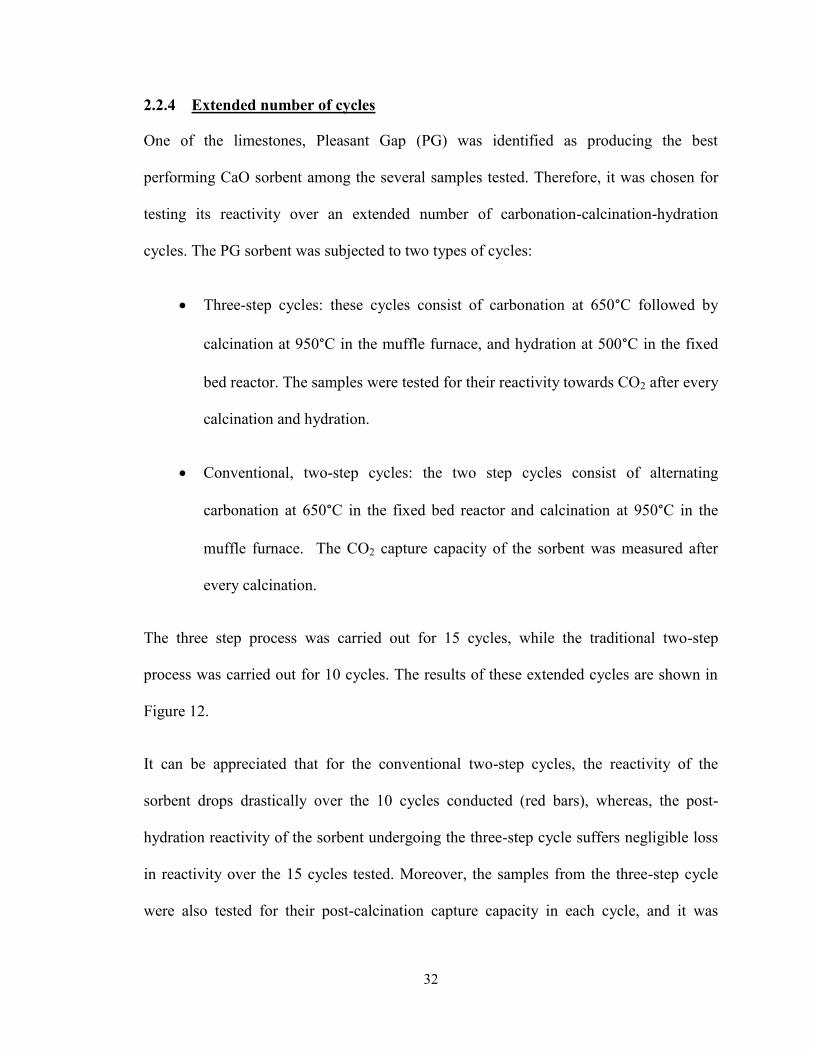
32
2.2.4 Extended number of cycles
One of the limestones, Pleasant Gap (PG) was identified as producing the best
performing CaO sorbent among the several samples tested. Therefore, it was chosen for
testing its reactivity over an extended number of carbonation-calcination-hydration
cycles. The PG sorbent was subjected to two types of cycles:
Three-step cycles: these cycles consist of carbonation at 650°C followed by
calcination at 950°C in the muffle furnace, and hydration at 500°C in the fixed
bed reactor. The samples were tested for their reactivity towards CO2 after every
calcination and hydration.
Conventional, two-step cycles: the two step cycles consist of alternating
carbonation at 650°C in the fixed bed reactor and calcination at 950°C in the
muffle furnace. The CO2 capture capacity of the sorbent was measured after
every calcination.
The three step process was carried out for 15 cycles, while the traditional two-step
process was carried out for 10 cycles. The results of these extended cycles are shown in
Figure 12.
It can be appreciated that for the conventional two-step cycles, the reactivity of the
sorbent drops drastically over the 10 cycles conducted (red bars), whereas, the post-
hydration reactivity of the sorbent undergoing the three-step cycle suffers negligible loss
in reactivity over the 15 cycles tested. Moreover, the samples from the three-step cycle
were also tested for their post-calcination capture capacity in each cycle, and it was

33
observed that even this capture capacity, though less than half that of post-hydration,
remains constant over the 15 cycles tested here.
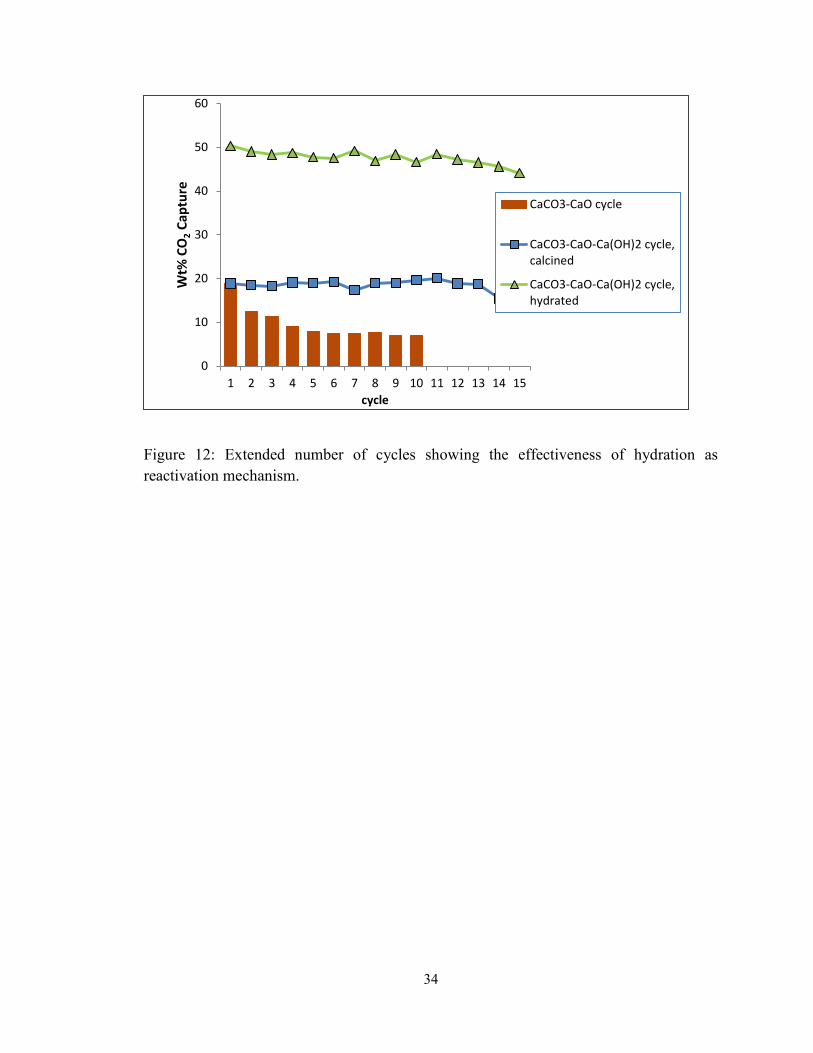
34
Figure 12: Extended number of cycles showing the effectiveness of hydration as
reactivation mechanism.
0
10
20
30
40
50
60
1 2 3 4 5 6 7 8 9 10 11 12 13 14 15
Wt%
CO
2 C
aptu
re
cycle
CaCO3-CaO cycle
CaCO3-CaO-Ca(OH)2 cycle,calcined
CaCO3-CaO-Ca(OH)2 cycle,hydrated
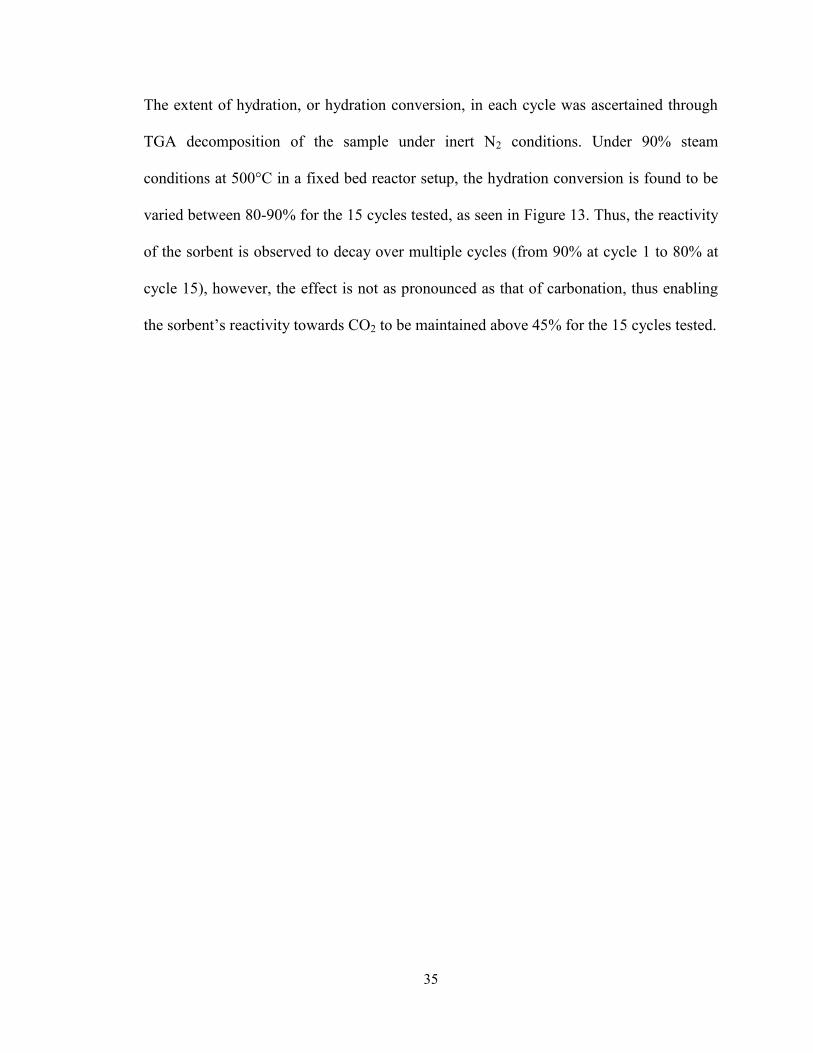
35
The extent of hydration, or hydration conversion, in each cycle was ascertained through
TGA decomposition of the sample under inert N2 conditions. Under 90% steam
conditions at 500°C in a fixed bed reactor setup, the hydration conversion is found to be
varied between 80-90% for the 15 cycles tested, as seen in Figure 13. Thus, the reactivity
of the sorbent is observed to decay over multiple cycles (from 90% at cycle 1 to 80% at
cycle 15), however, the effect is not as pronounced as that of carbonation, thus enabling
the sorbent’s reactivity towards CO2 to be maintained above 45% for the 15 cycles tested.
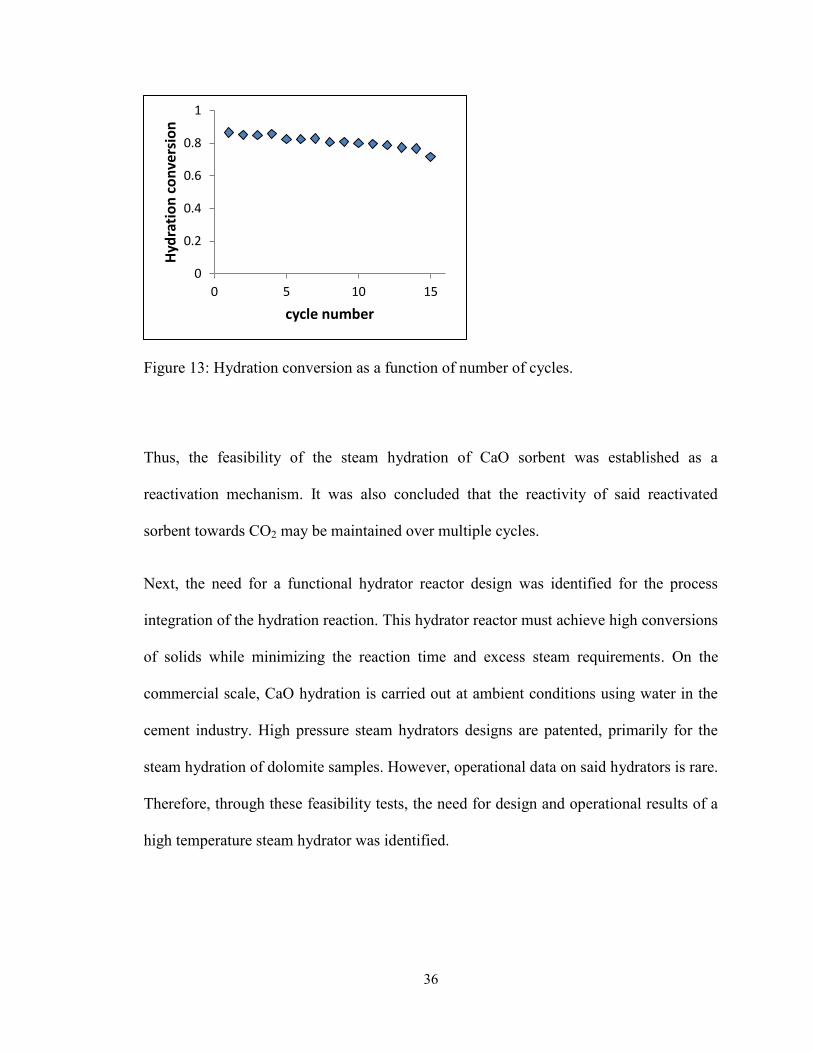
36
Figure 13: Hydration conversion as a function of number of cycles.
Thus, the feasibility of the steam hydration of CaO sorbent was established as a
reactivation mechanism. It was also concluded that the reactivity of said reactivated
sorbent towards CO2 may be maintained over multiple cycles.
Next, the need for a functional hydrator reactor design was identified for the process
integration of the hydration reaction. This hydrator reactor must achieve high conversions
of solids while minimizing the reaction time and excess steam requirements. On the
commercial scale, CaO hydration is carried out at ambient conditions using water in the
cement industry. High pressure steam hydrators designs are patented, primarily for the
steam hydration of dolomite samples. However, operational data on said hydrators is rare.
Therefore, through these feasibility tests, the need for design and operational results of a
high temperature steam hydrator was identified.
0
0.2
0.4
0.6
0.8
1
0 5 10 15
Hyd
rati
on
co
nve
rsio
n
cycle number
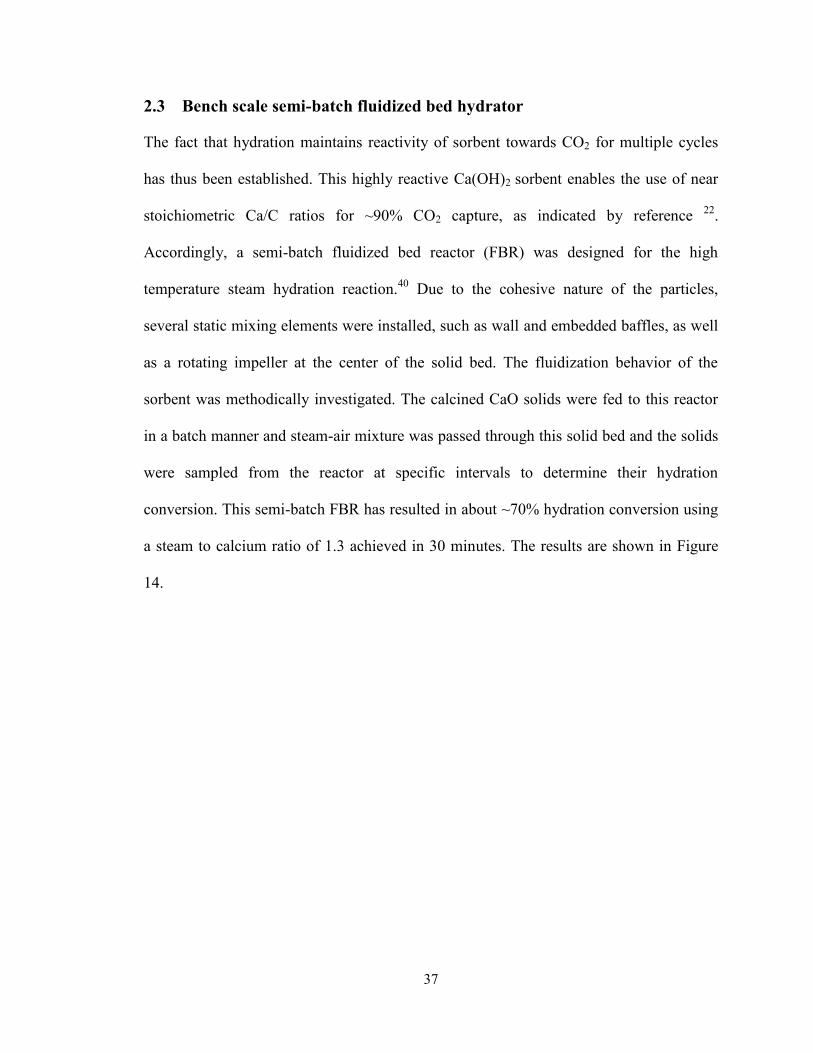
37
2.3 Bench scale semi-batch fluidized bed hydrator
The fact that hydration maintains reactivity of sorbent towards CO2 for multiple cycles
has thus been established. This highly reactive Ca(OH)2 sorbent enables the use of near
stoichiometric Ca/C ratios for ~90% CO2 capture, as indicated by reference 22
.
Accordingly, a semi-batch fluidized bed reactor (FBR) was designed for the high
temperature steam hydration reaction.40
Due to the cohesive nature of the particles,
several static mixing elements were installed, such as wall and embedded baffles, as well
as a rotating impeller at the center of the solid bed. The fluidization behavior of the
sorbent was methodically investigated. The calcined CaO solids were fed to this reactor
in a batch manner and steam-air mixture was passed through this solid bed and the solids
were sampled from the reactor at specific intervals to determine their hydration
conversion. This semi-batch FBR has resulted in about ~70% hydration conversion using
a steam to calcium ratio of 1.3 achieved in 30 minutes. The results are shown in Figure
14.
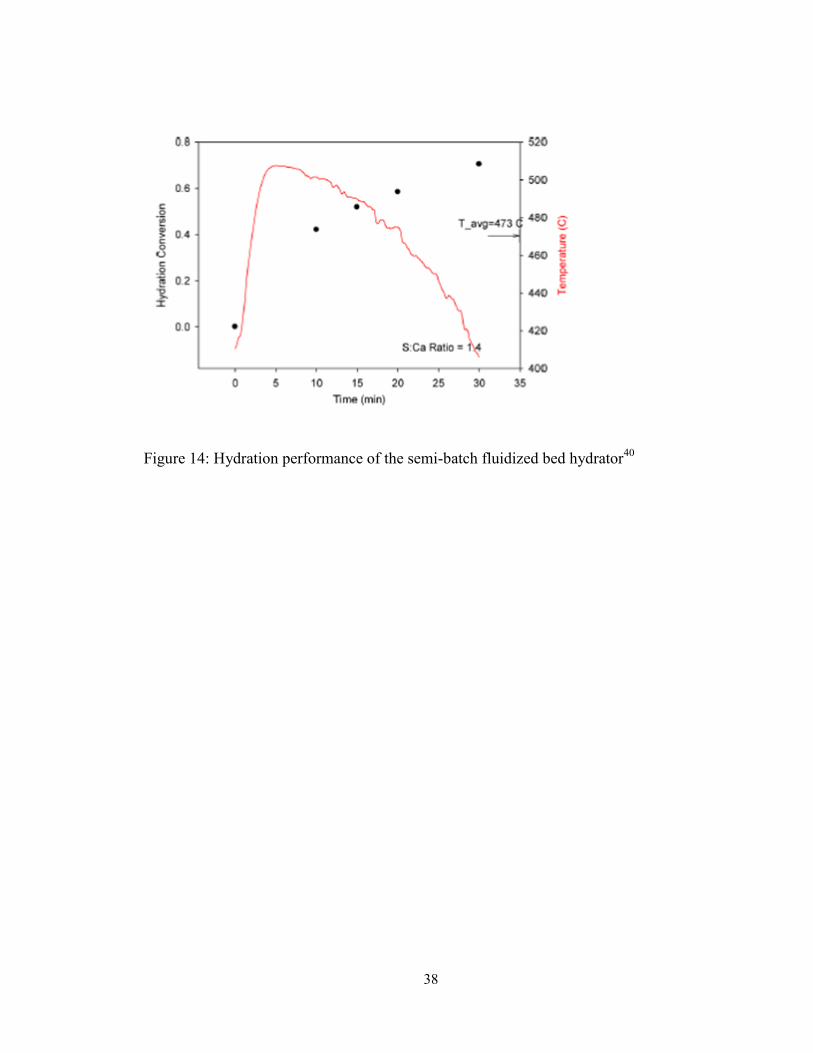
38
Figure 14: Hydration performance of the semi-batch fluidized bed hydrator40
39
One of the key outcomes of these FBR experiments was the recognition of the need for
effective heat removal from the reactor. As can be seen from Figure 14, due to the highly
exothermic nature of the CaO hydration reaction, isothermal experimentation is not
feasible in experiments dealing with a large batch of solids. The semi-batch nature of the
operation of this FBR resulted in a considerable increase of the temperature of solids as
the reaction progressed. Operating this FBR as the hydrator in a fully integrated solid
loop with a calciner and carbonator will enable isothermal operation by continuous gas-
solid feeding. A continuous system will enable further study of parameters such as steam
to calcium ratio, residence time of solids, and design of efficient heat recovery system.
The hydrator fluidization behavior may thus be improved further; to result in higher
hydration conversion, reduced residence time of the solids in the reactor, and reduced
excess steam requirement.
2.4 Continuous hydration on entrained bed reactor
2.4.1 Experimental setup
The sub-pilot scale fluidized bed reactor situated at west campus high-bay lab facilities
was used to carry out the continuous high temperature steam hydration experiments. The
schematic of this reactor setup as modified for steam injection is shown in Figure 15.
This reactor is a riser, which consists of four flanged sections of 2.25 ft. height. The ID of
this riser is 4 in. Each flanged section is supplied with two temperature ports for
thermocouples and one pressure port. An inclined solids feeding section is attached to the
bottom flanged section. The solids are fed through a solids hopper by means of a screw
40
feeder and two gate valves which function as double-dump valves by alternate opening
and closing mechanisms. At the base of the flanged section, a porous sintered plate
functions as the gas distributor for the fluidization gas and also supports the bed of solids
that may accumulate through the solid feeding mechanism. Sufficiently large velocities
may be chosen such that majority of the solids fed to the reactor are entrained out through
the top of the riser section. The solids exiting the top of the riser can be captured and
tested for the solids hydration conversion. More details of this riser reactor are given in
reference 24
.
The reactor is heated by means of electrical heaters maintained at isothermal conditions
through a temperature control program using DaQ-Factory software. Steam is generated
by means of two stainless steel coils which are electrically heated and water is fed to
these coils via metered pumps calibrated for specific volumetric flow. Air is used as a
carrier gas to provide motive force for the steam so produced.
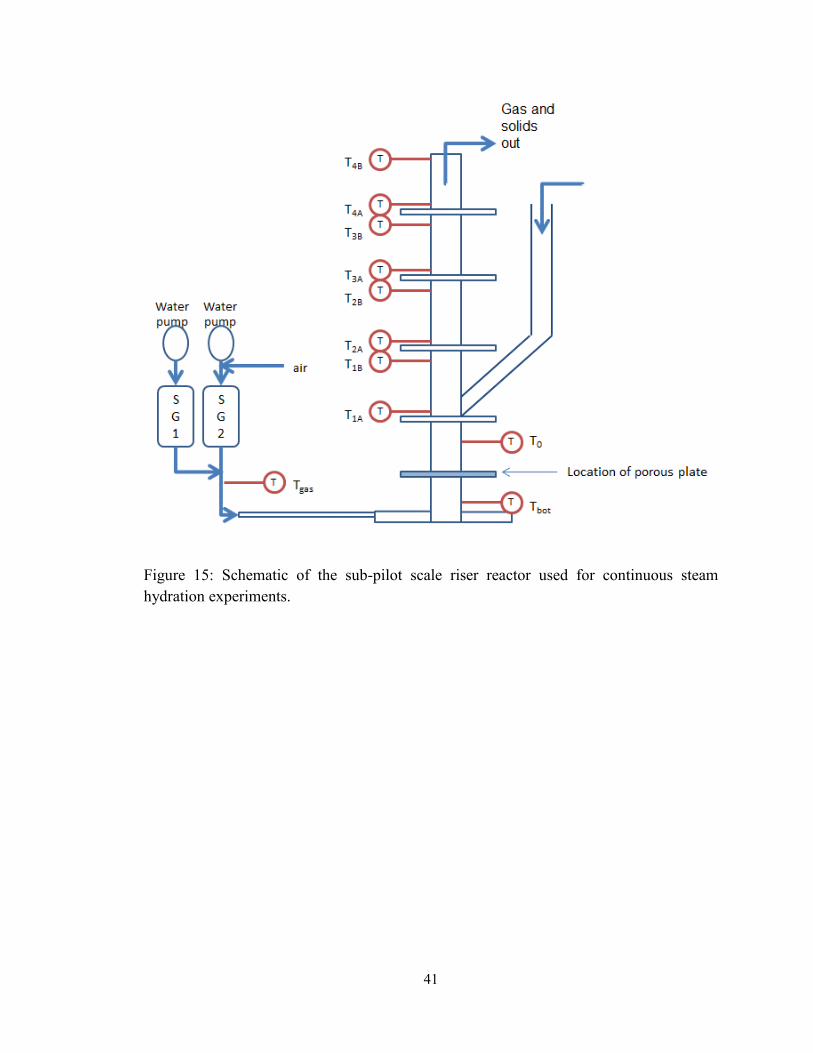
41
Figure 15: Schematic of the sub-pilot scale riser reactor used for continuous steam
hydration experiments.
42
2.4.2 Cold/dry flow tests
Before conducting actual hydration experiments, certain cold and/or dry experiments
were performed for determination of the operating velocities to achieve > 80%
entrainment. These experiments were performed using air as the fluidization medium
using mixtures of CaO and Ca(OH)2. Due to the highly cohesive nature of the Geldart C
type particles of the sorbent, extremely high velocities of gas were needed to achieve
appreciable entrainment.
The water pumps for steam generation, as well as the screw feeder for solids feeding,
were calibrated at the time of the experiments. The screw feeder is a volumetric feeder
and therefore, the actual feeding rate may vary depending on the packing density of the
solids in the hopper. Thus, the solids fed to the hopper were measured prior to the
experiment, and the solids remaining in the hopper after the experiment were weighed, to
calculate the total solids fed and thus the solid flow rate during experiment. Very high
velocities of up to 2 m/s were used to achieve >80% solid entrainment. The entrainment
as a function of gas velocity is seen in Figure 16.
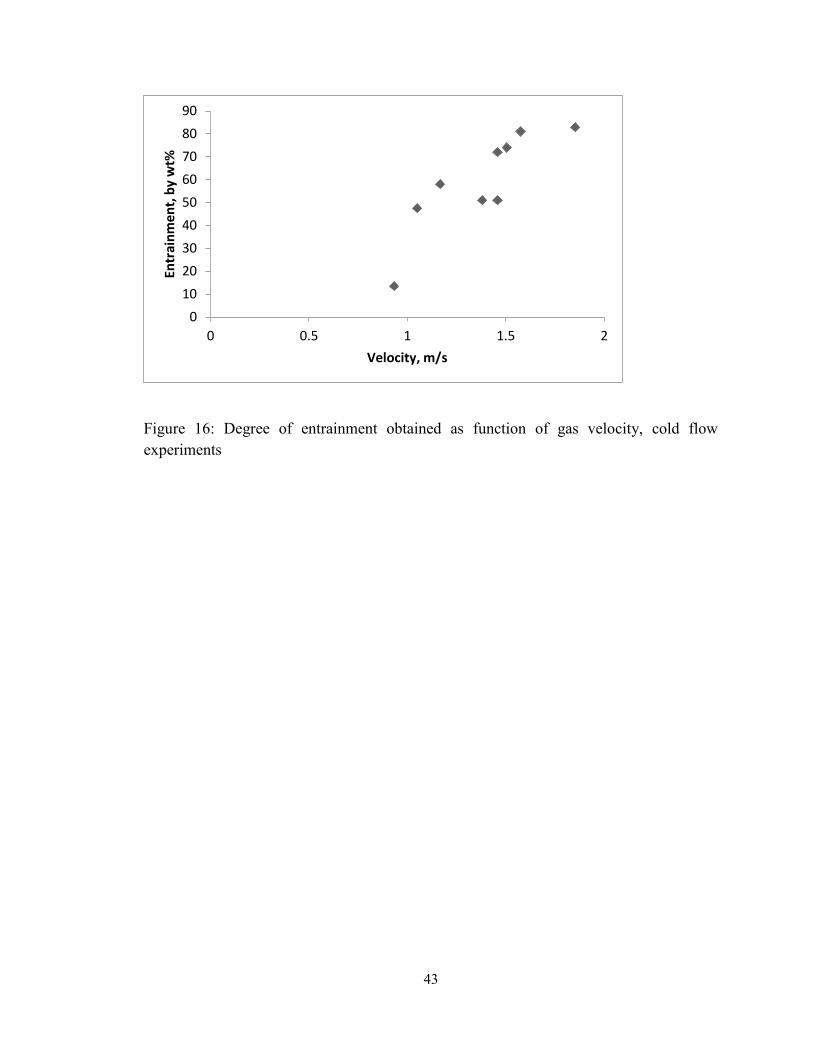
43
Figure 16: Degree of entrainment obtained as function of gas velocity, cold flow
experiments
0
10
20
30
40
50
60
70
80
90
0 0.5 1 1.5 2
Entr
ain
me
nt,
by
wt%
Velocity, m/s
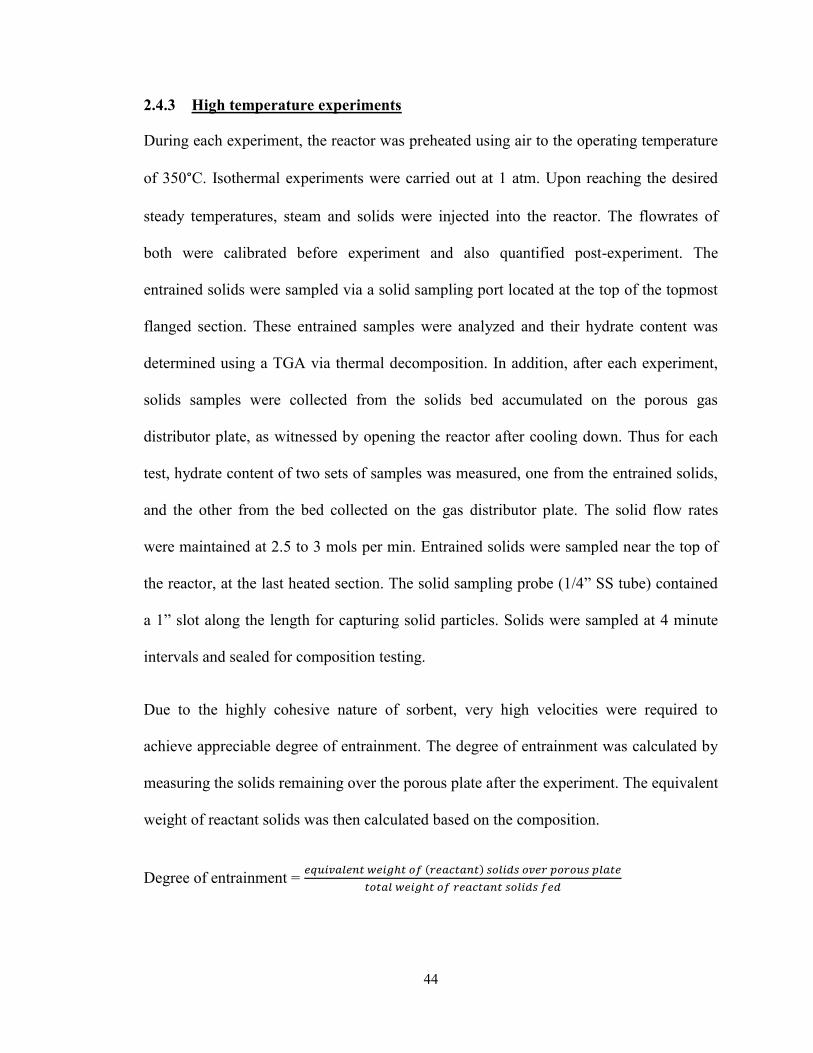
44
2.4.3 High temperature experiments
During each experiment, the reactor was preheated using air to the operating temperature
of 350°C. Isothermal experiments were carried out at 1 atm. Upon reaching the desired
steady temperatures, steam and solids were injected into the reactor. The flowrates of
both were calibrated before experiment and also quantified post-experiment. The
entrained solids were sampled via a solid sampling port located at the top of the topmost
flanged section. These entrained samples were analyzed and their hydrate content was
determined using a TGA via thermal decomposition. In addition, after each experiment,
solids samples were collected from the solids bed accumulated on the porous gas
distributor plate, as witnessed by opening the reactor after cooling down. Thus for each
test, hydrate content of two sets of samples was measured, one from the entrained solids,
and the other from the bed collected on the gas distributor plate. The solid flow rates
were maintained at 2.5 to 3 mols per min. Entrained solids were sampled near the top of
the reactor, at the last heated section. The solid sampling probe (1/4” SS tube) contained
a 1” slot along the length for capturing solid particles. Solids were sampled at 4 minute
intervals and sealed for composition testing.
Due to the highly cohesive nature of sorbent, very high velocities were required to
achieve appreciable degree of entrainment. The degree of entrainment was calculated by
measuring the solids remaining over the porous plate after the experiment. The equivalent
weight of reactant solids was then calculated based on the composition.
Degree of entrainment = 𝑒𝑞𝑢𝑖𝑣𝑎𝑙𝑒𝑛𝑡 𝑤𝑒𝑖𝑔ℎ𝑡 𝑜𝑓 (𝑟𝑒𝑎𝑐𝑡𝑎𝑛𝑡) 𝑠𝑜𝑙𝑖𝑑𝑠 𝑜𝑣𝑒𝑟 𝑝𝑜𝑟𝑜𝑢𝑠 𝑝𝑙𝑎𝑡𝑒
𝑡𝑜𝑡𝑎𝑙 𝑤𝑒𝑖𝑔ℎ𝑡 𝑜𝑓 𝑟𝑒𝑎𝑐𝑡𝑎𝑛𝑡 𝑠𝑜𝑙𝑖𝑑𝑠 𝑓𝑒𝑑
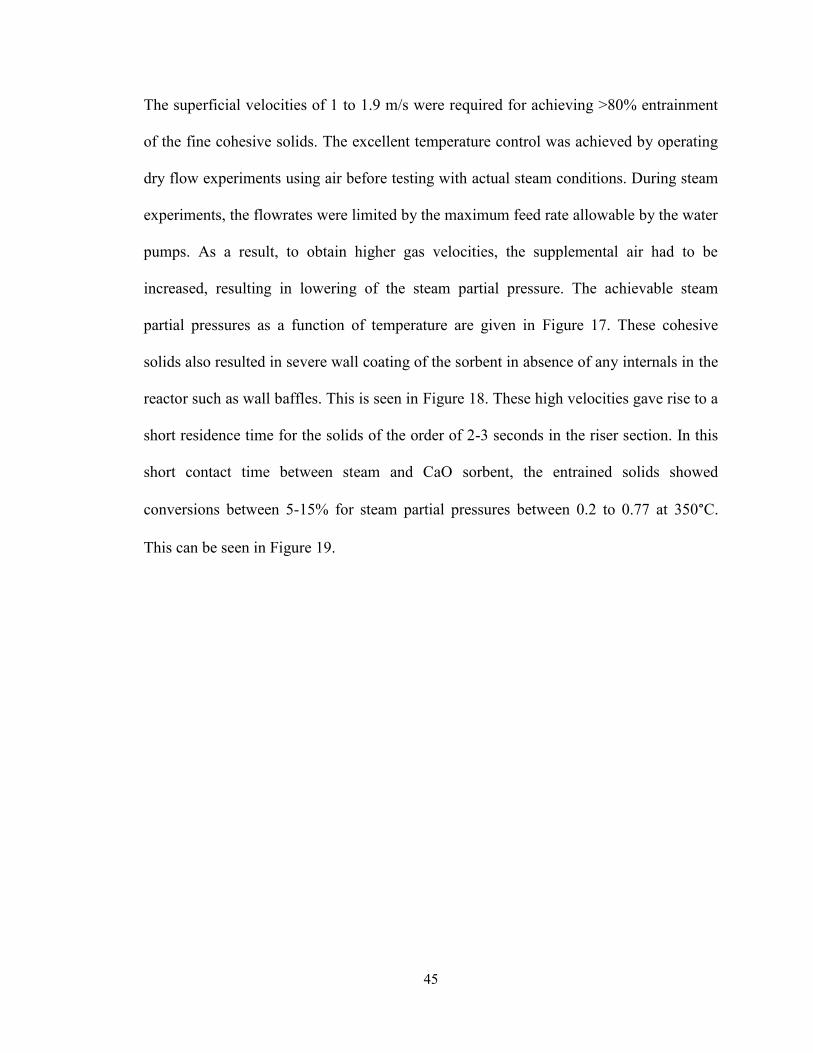
45
The superficial velocities of 1 to 1.9 m/s were required for achieving >80% entrainment
of the fine cohesive solids. The excellent temperature control was achieved by operating
dry flow experiments using air before testing with actual steam conditions. During steam
experiments, the flowrates were limited by the maximum feed rate allowable by the water
pumps. As a result, to obtain higher gas velocities, the supplemental air had to be
increased, resulting in lowering of the steam partial pressure. The achievable steam
partial pressures as a function of temperature are given in Figure 17. These cohesive
solids also resulted in severe wall coating of the sorbent in absence of any internals in the
reactor such as wall baffles. This is seen in Figure 18. These high velocities gave rise to a
short residence time for the solids of the order of 2-3 seconds in the riser section. In this
short contact time between steam and CaO sorbent, the entrained solids showed
conversions between 5-15% for steam partial pressures between 0.2 to 0.77 at 350°C.
This can be seen in Figure 19.
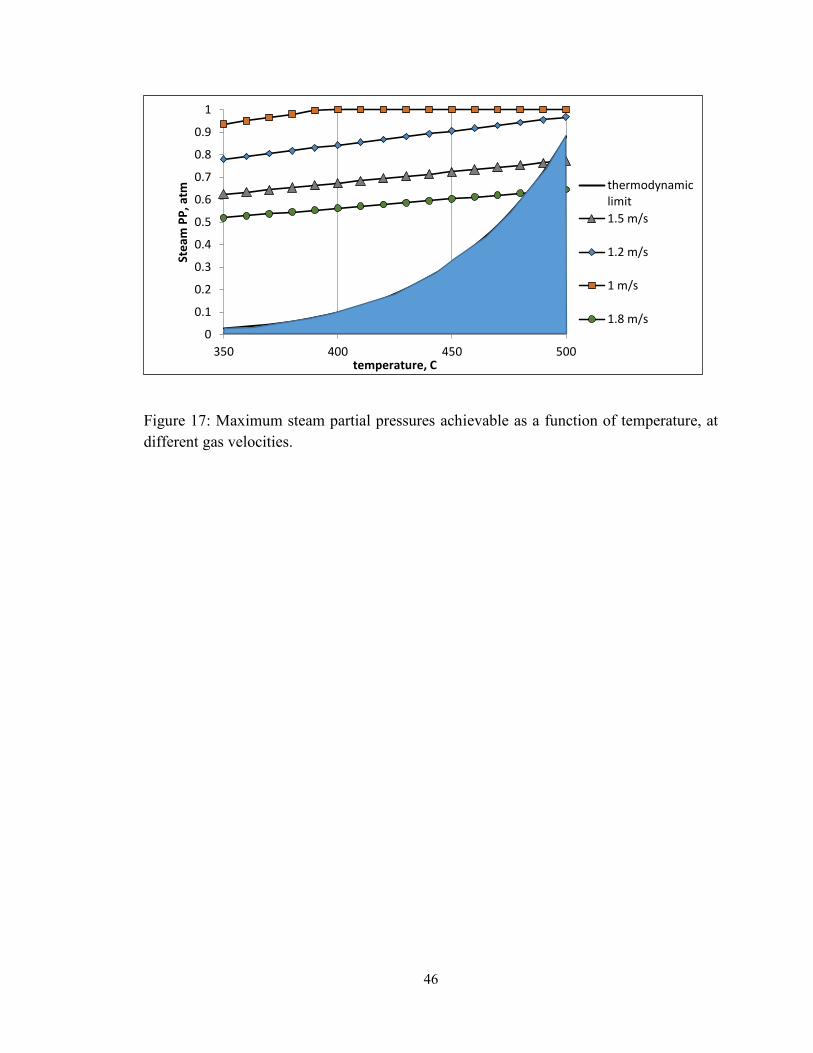
46
Figure 17: Maximum steam partial pressures achievable as a function of temperature, at
different gas velocities.
0
0.1
0.2
0.3
0.4
0.5
0.6
0.7
0.8
0.9
1
350 400 450 500
Ste
am P
P, a
tm
temperature, C
thermodynamiclimit
1.5 m/s
1.2 m/s
1 m/s
1.8 m/s
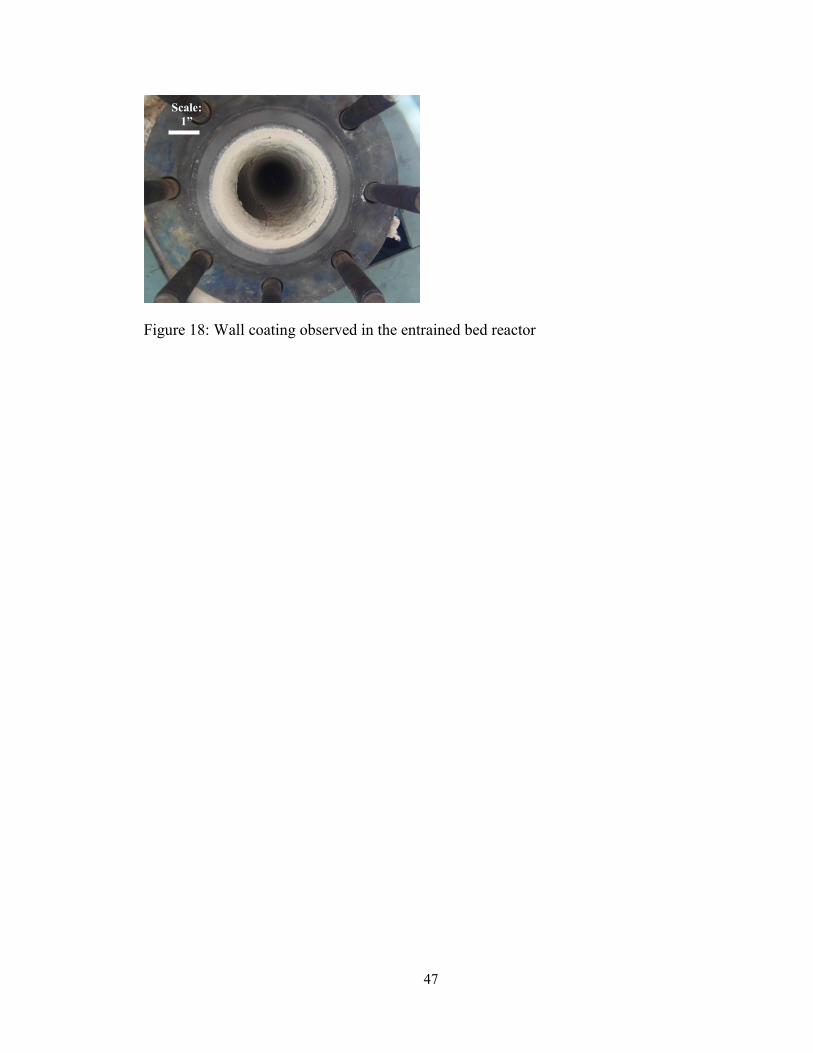
47
Figure 18: Wall coating observed in the entrained bed reactor
Scale: 1”
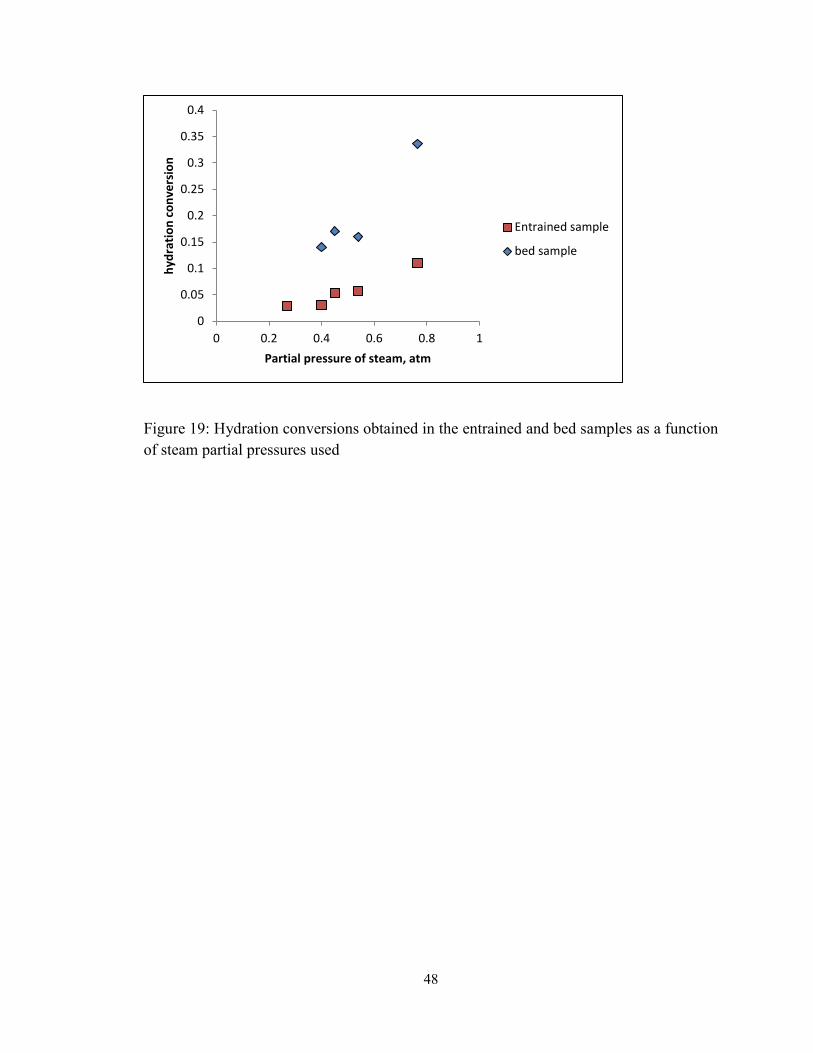
48
Figure 19: Hydration conversions obtained in the entrained and bed samples as a function
of steam partial pressures used
0
0.05
0.1
0.15
0.2
0.25
0.3
0.35
0.4
0 0.2 0.4 0.6 0.8 1
hyd
rati
on
co
nve
rsio
n
Partial pressure of steam, atm
Entrained sample
bed sample
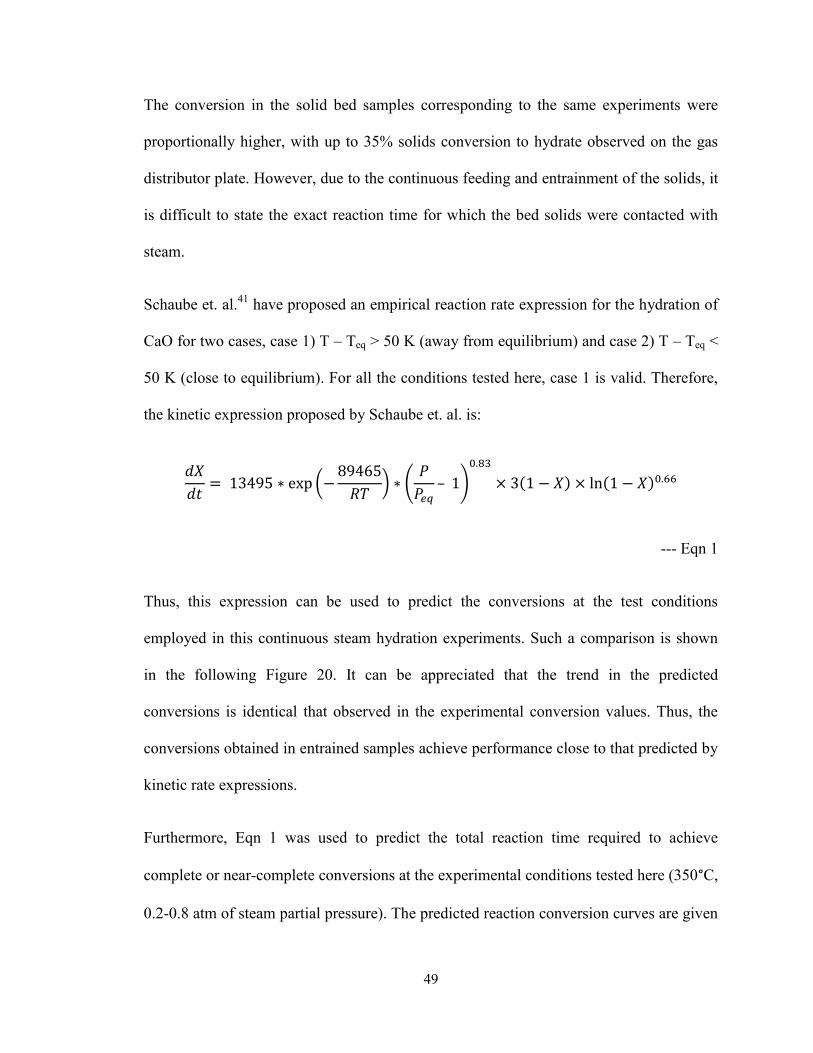
49
The conversion in the solid bed samples corresponding to the same experiments were
proportionally higher, with up to 35% solids conversion to hydrate observed on the gas
distributor plate. However, due to the continuous feeding and entrainment of the solids, it
is difficult to state the exact reaction time for which the bed solids were contacted with
steam.
Schaube et. al.41
have proposed an empirical reaction rate expression for the hydration of
CaO for two cases, case 1) T – Teq > 50 K (away from equilibrium) and case 2) T – Teq <
50 K (close to equilibrium). For all the conditions tested here, case 1 is valid. Therefore,
the kinetic expression proposed by Schaube et. al. is:
𝑑𝑋
𝑑𝑡= 13495 ∗ exp (−
89465
𝑅𝑇) ∗ (
𝑃
𝑃𝑒𝑞– 1)
0.83
× 3(1 − 𝑋) × ln(1 − 𝑋)0.66
--- Eqn 1
Thus, this expression can be used to predict the conversions at the test conditions
employed in this continuous steam hydration experiments. Such a comparison is shown
in the following Figure 20. It can be appreciated that the trend in the predicted
conversions is identical that observed in the experimental conversion values. Thus, the
conversions obtained in entrained samples achieve performance close to that predicted by
kinetic rate expressions.
Furthermore, Eqn 1 was used to predict the total reaction time required to achieve
complete or near-complete conversions at the experimental conditions tested here (350°C,
0.2-0.8 atm of steam partial pressure). The predicted reaction conversion curves are given
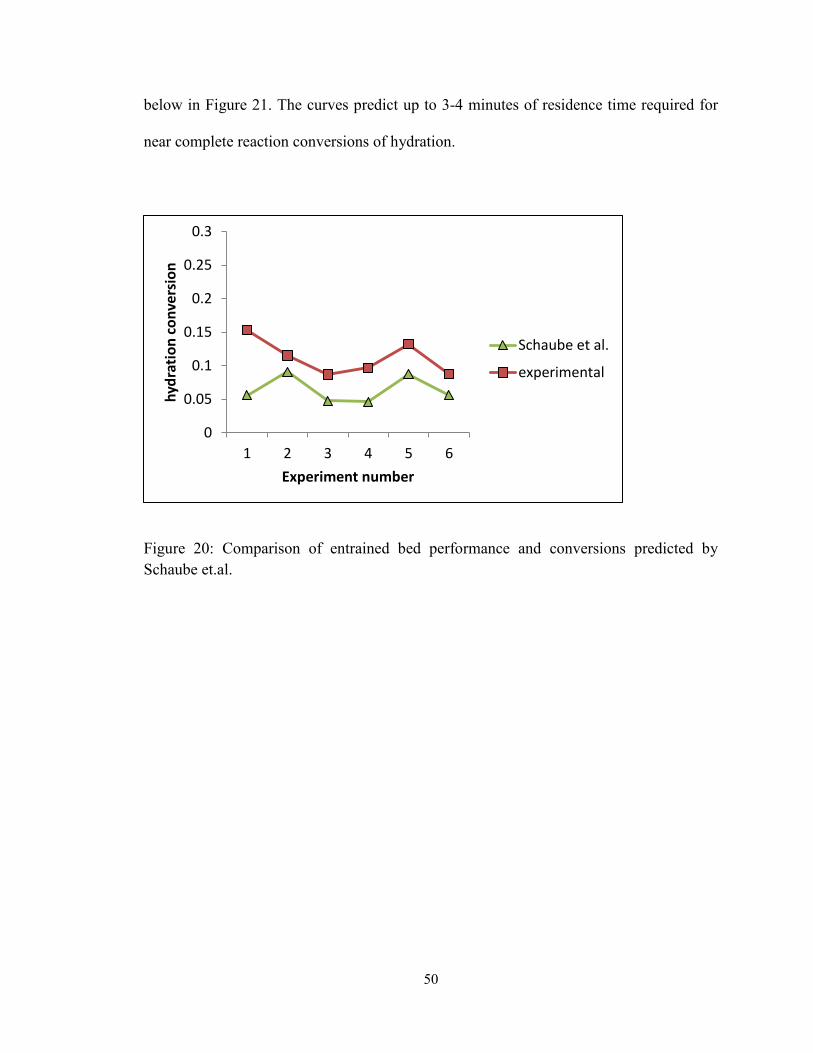
50
below in Figure 21. The curves predict up to 3-4 minutes of residence time required for
near complete reaction conversions of hydration.
Figure 20: Comparison of entrained bed performance and conversions predicted by
Schaube et.al.
0
0.05
0.1
0.15
0.2
0.25
0.3
1 2 3 4 5 6
hyd
rati
on
co
nve
rsio
n
Experiment number
Schaube et al.
experimental
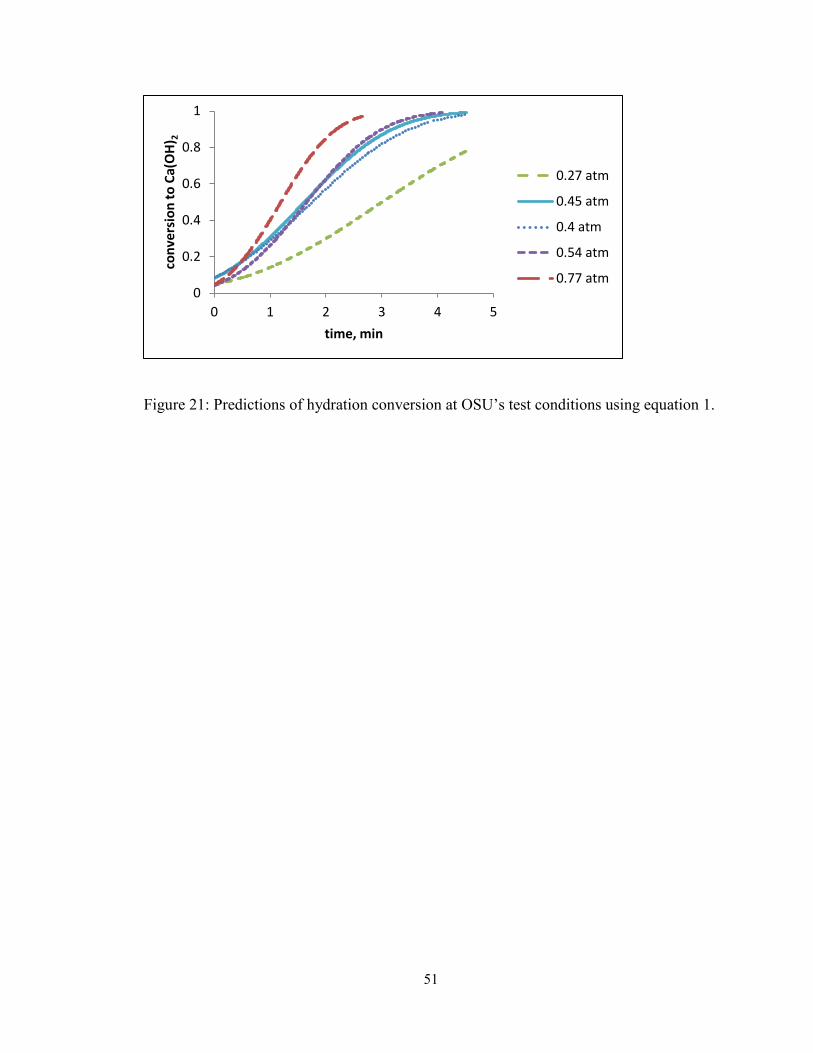
51
Figure 21: Predictions of hydration conversion at OSU’s test conditions using equation 1.
0
0.2
0.4
0.6
0.8
1
0 1 2 3 4 5
con
vers
ion
to
Ca(
OH
) 2
time, min
0.27 atm
0.45 atm
0.4 atm
0.54 atm
0.77 atm
52
2.5 Conclusions
Thus, these experiments conclusively proved that using a fast fluidized bed, the mass
transfer limitations for the high temperature steam hydration reaction may be easily
overcome and near-kinetic performance may be achieved. However, the short residence
times of 2-3 seconds provided by the entrained bed riser reactor employed here is not
sufficient to achieve appreciable solids conversion for hydration reaction. Nevertheless,
kinetic expressions proposed in the literature predict up to 3-4 minutes residence time
required for near-complete hydration conversion. Thus, the hydrator reactor may be
envisioned as a fast/turbulent fluidized bed reactor with a solids residence time on the
order of a few minutes. Additionally, the intense solids wall-coating observed in these
experiments confirmed the need for baffles and other internals for the uniform
fluidization of these cohesive Ca(OH)2 powders.
53
CHAPTER 3: Screening of Multiple Waste Animal Shells as a Source of
Calcium Sorbent
3.1 Introduction
The rise in atmospheric carbon dioxide (CO2) levels in the last few centuries which was
sparked by the industrial revolution, has spurred a plethora of research activities on the
potential carbon capture and sequestration (CCS) technologies. The world energy market
continues to grow due to the ever increasing demand, with the energy consumption
estimated to grow from 5.3 x 10¹⁷
in 2008 to 8.1 x 1017
kJ by 2035. Fossil fuels continue
to supply majority of the total energy required in the projected near future.42
The
unmistakable rising trend in atmospheric CO2 levels is therefore a concern that demands
urgent attention. Many CCS technologies are currently in various stages of development,
with the focus being on the separation of CO2 from the emission gases43,44
, and recent
efforts are also focused on reutilization of the captured CO2 to convert it to energy
products 45,46
. The various capture techniques can be categorized as absorption and
adsorption techniques, with either physical or reactive separation; membrane separation,
oxycombustion, etc. Commercial or near-commercial technologies include using solvents
such as amines (viz. monoethanol amine)47
and other specialty solvents such as Selexol,
or the chilled ammonia process.48
The molecular sieves, physical adsorbents, low
temperature chemisorbents, membrane separation technologies are some of the other
54
leading areas of research in the field of CO2 separation and capture. The high temperature
reactive chemisorption using solid sorbents is of particular interest due to its relatively
high CO2 carrying capacity, greater possibility of effective heat integration,
comparatively lower energy penalty, etc1,49,17,50
The use of metal oxides, particularly calcium oxide (CaO), for dry CO2 removal has been
theoretically proven for a few decades, and the first successful demonstration of calcium
oxide for CO2 capture was in the 1970s with the CO2 Acceptor Process.51
The underlying
reactions for this process are
CaO + CO2 → CaCO3 Rxn 2
CaCO3 → CaO + CO2 Rxn 3
The exothermic forward reaction, carbonation, captures CO2 from the gas stream and
converts the CaO sorbent into solid calcium carbonate (CaCO3). The subsequent
endothermic high temperature thermal decomposition of CaCO3 releases the captured
CO2 and regenerates the CaO sorbent via the backward reaction. Thus, the CaO sorbent
can be used over multiple cycles to achieve high temperature CO2 removal from point
sources such as combustion flue gases emitted from power plants. The process has also
been successfully demonstrated at lab and bench scale level for pre-combustion CO2
capture from synthesis gas for various applications.52,53,24
The availability of limestone as an inexpensive, abundant, and environmentally benign
source of the sorbent makes this technology viable and economically attractive. Current
research efforts in this area are focused on improving the degradation of the reactivity of
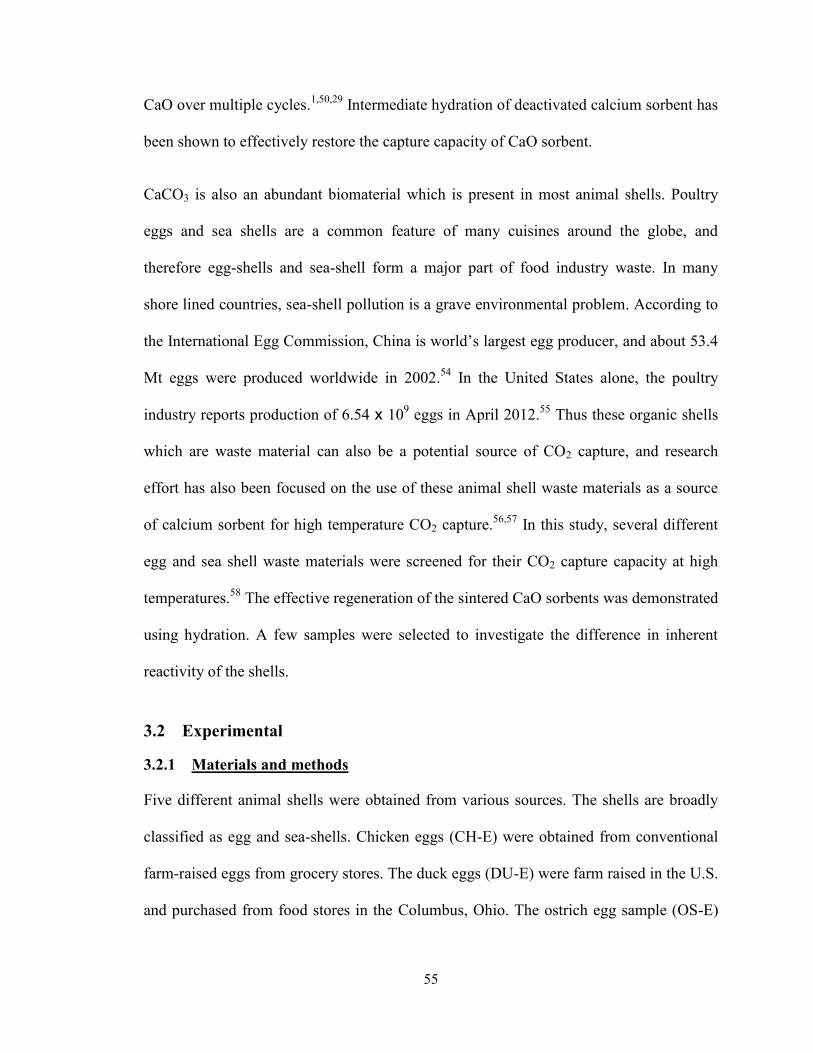
55
CaO over multiple cycles.1,50,29
Intermediate hydration of deactivated calcium sorbent has
been shown to effectively restore the capture capacity of CaO sorbent.
CaCO3 is also an abundant biomaterial which is present in most animal shells. Poultry
eggs and sea shells are a common feature of many cuisines around the globe, and
therefore egg-shells and sea-shell form a major part of food industry waste. In many
shore lined countries, sea-shell pollution is a grave environmental problem. According to
the International Egg Commission, China is world’s largest egg producer, and about 53.4
Mt eggs were produced worldwide in 2002.54
In the United States alone, the poultry
industry reports production of 6.54 x 10⁹ eggs in April 2012.
55 Thus these organic shells
which are waste material can also be a potential source of CO2 capture, and research
effort has also been focused on the use of these animal shell waste materials as a source
of calcium sorbent for high temperature CO2 capture.56,57
In this study, several different
egg and sea shell waste materials were screened for their CO2 capture capacity at high
temperatures.58
The effective regeneration of the sintered CaO sorbents was demonstrated
using hydration. A few samples were selected to investigate the difference in inherent
reactivity of the shells.
3.2 Experimental
3.2.1 Materials and methods
Five different animal shells were obtained from various sources. The shells are broadly
classified as egg and sea-shells. Chicken eggs (CH-E) were obtained from conventional
farm-raised eggs from grocery stores. The duck eggs (DU-E) were farm raised in the U.S.
and purchased from food stores in the Columbus, Ohio. The ostrich egg sample (OS-E)
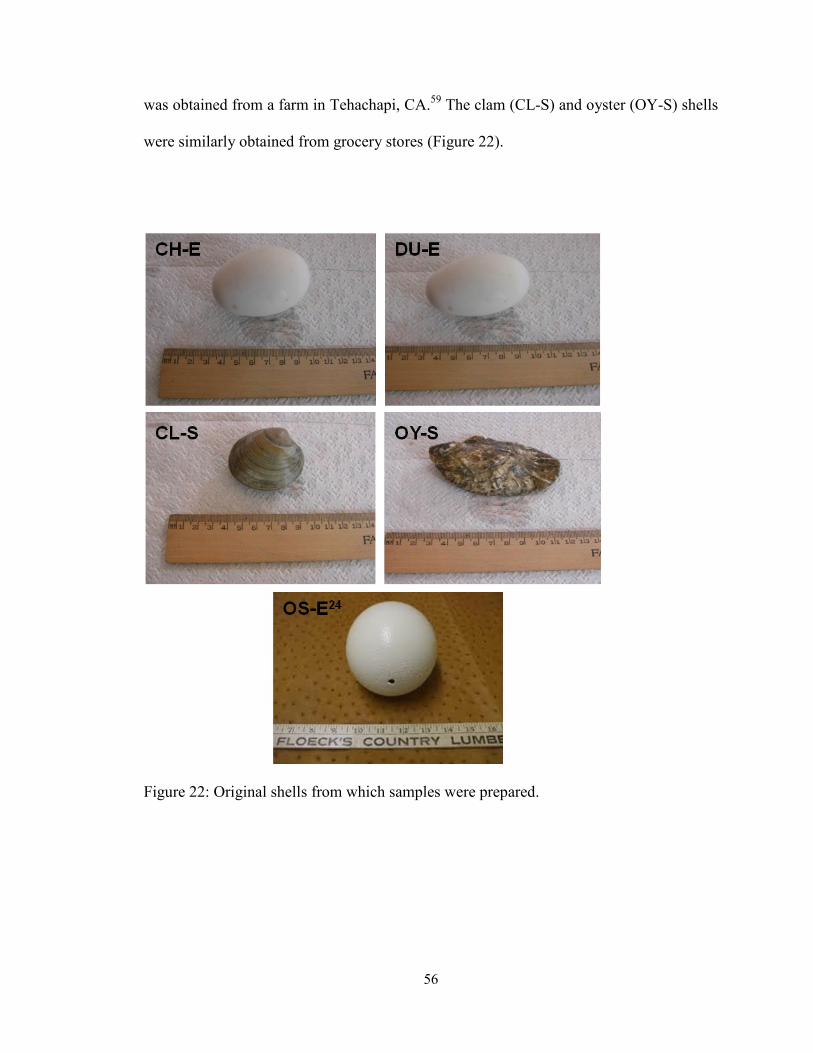
56
was obtained from a farm in Tehachapi, CA.59
The clam (CL-S) and oyster (OY-S) shells
were similarly obtained from grocery stores (Figure 22).
Figure 22: Original shells from which samples were prepared.
57
The powdered sorbent was obtained from the shells by the following procedure: The
samples from egg shells were prepared by pretreating the egg shells to a solution of 0.2
M acetic acid for 30 min. This step was carried out to separate the collagen and other
proteinaceous material from the shell to obtain dry sorbent. After the wash with acetic
acid, the samples were filtered and further treated with a water wash. The sea shell
samples were cleaned of any meat by scraping and washing in soap solution followed by
deionized water. The shells were then dried overnight and crushed and sieved until a
required particle size was achieved (< 250 μm). Samples were stored in air-tight
containers for testing. The samples were screened for their initial capture capacity, given
in Table 2.
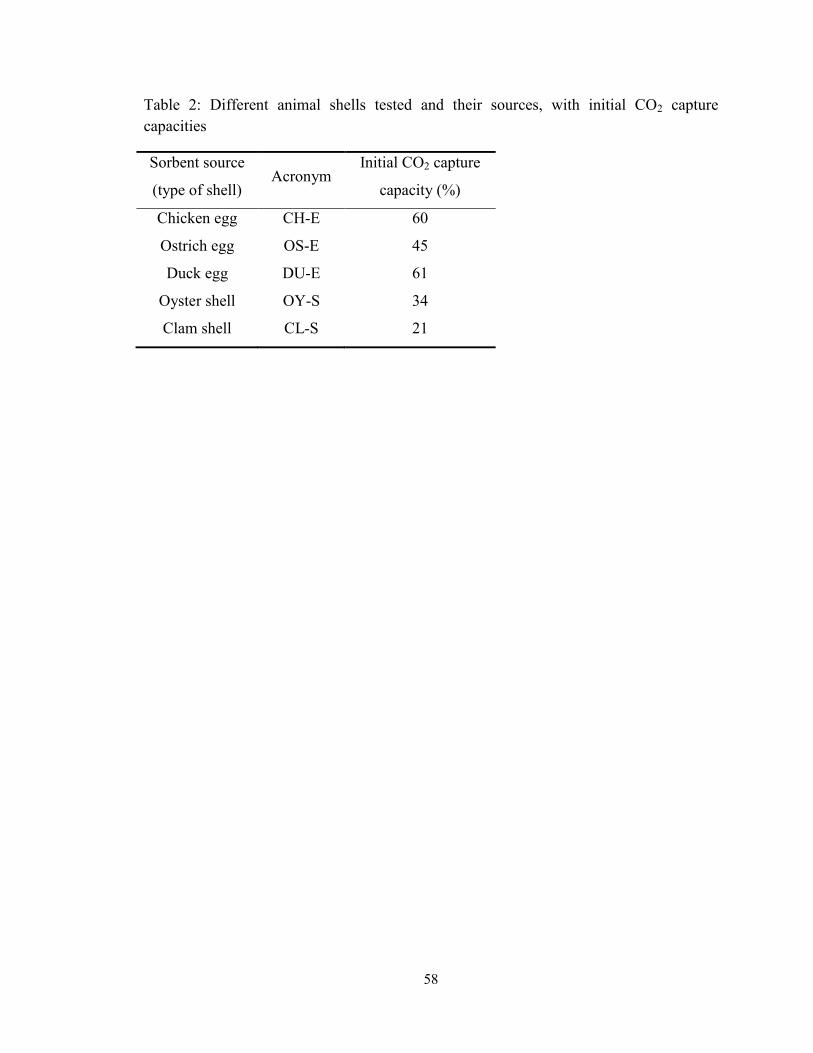
58
Table 2: Different animal shells tested and their sources, with initial CO2 capture
capacities
Sorbent source
(type of shell) Acronym
Initial CO2 capture
capacity (%)
Chicken egg CH-E 60
Ostrich egg OS-E 45
Duck egg DU-E 61
Oyster shell OY-S 34
Clam shell CL-S 21
59
The wt% CO2 capture capacity of the sorbent, also referred to as sorbent reactivity, is
calculated as weight of CO2 captured in g at the end of 30 min g-1
sorbent, expressed in
percentage value.
𝑤𝑡% 𝑐𝑎𝑝𝑡𝑢𝑟𝑒 𝑐𝑎𝑝𝑎𝑐𝑖𝑡𝑦 =𝑤𝑒𝑖𝑔ℎ𝑡 𝑜𝑓 𝐶𝑂2𝑐𝑎𝑝𝑡𝑢𝑟𝑒𝑑
𝑤𝑒𝑖𝑔ℎ𝑡 𝑜𝑓 𝐶𝑎𝑂 𝑠𝑜𝑟𝑏𝑒𝑛𝑡 100%
The characterization of all sorbent samples for their CO2 capture capacities was carried
out using thermogravimetric analysis (TGA) equipment (Perkin Elmer) with carbonation
carried out using 10% concentration of CO2 (balance N2) so as to emulate realistic flue
gas CO2 concentrations. The details of reactivity testing using the TGA have been
published elsewhere60
.
The CaO sorbent needs to be subjected to high temperature calcination reaction to
recover the CO2 in a pure form. This high temperature calcination causes the CaO sorbent
to lose its reactivity toward CO2, and thus this deactivated sorbent is subjected to
hydration to recover the reactivity. The samples used in the current study were
accordingly tested for the calcination and hydration steps, with reactivity testing carried
out after each step to monitor changes in reactivity. Thus the samples were first subjected
to high temperature thermal sintering at 950 °C for 2 h. This step was carried out in an
Isotemp Muffle Furnace oven (Fisher Scientific). Following the sintering the samples are
termed as calcined. Further, the samples were hydrated with excess water and dried
overnight by placing the wet samples in controlled temperature fume hood.
The reactivity of the samples was tested after each step using TGA equipment. The
morphological properties of the samples such as surface area and pore volume were

60
analyzed using BET techniques using a surface morphology analyzer (Qauntachrome).
Three samples were selected for further testing using X-ray diffraction (XRD) analysis
and Scanning electron microscopy (SEM).
61
3.3 Observations and discussion
The following key observations are made: one, the sorbents obtained from various
sources of waste animal shells exhibit inherently different CO2 sorption capacities. Two,
all sorbents responded well to the regeneration by water hydration. Three, calcined
samples exhibited a loss in reactivity, and the subsequently hydrated samples showed
improved reactivity (Table 3, Figure 23) which is in agreement with previous studies.57,60
Note that evidence exists in published literature supporting regenerability of sorbent
derived from oyster shell using hydration techniques.56
The BET analysis confirms the
regeneration by increase in pore volume of the sorbent samples, as seen in Table 4.
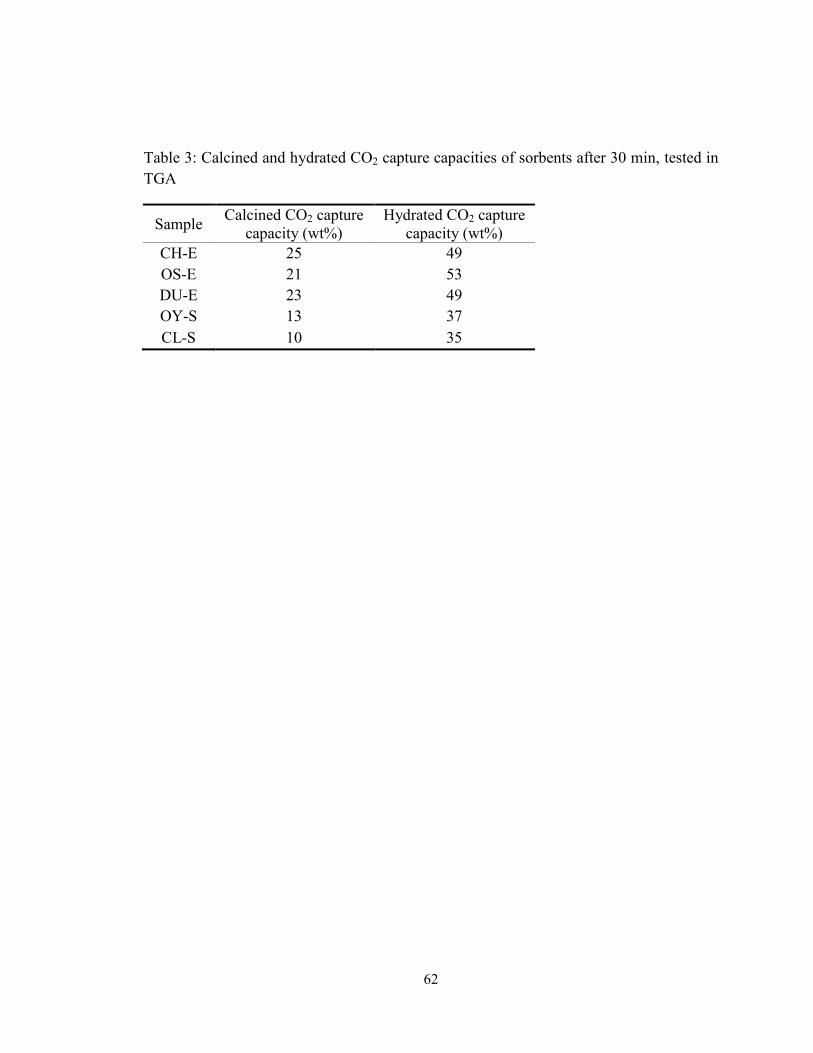
62
Table 3: Calcined and hydrated CO2 capture capacities of sorbents after 30 min, tested in
TGA
Sample Calcined CO2 capture
capacity (wt%)
Hydrated CO2 capture
capacity (wt%)
CH-E 25 49
OS-E 21 53
DU-E 23 49
OY-S 13 37
CL-S 10 35
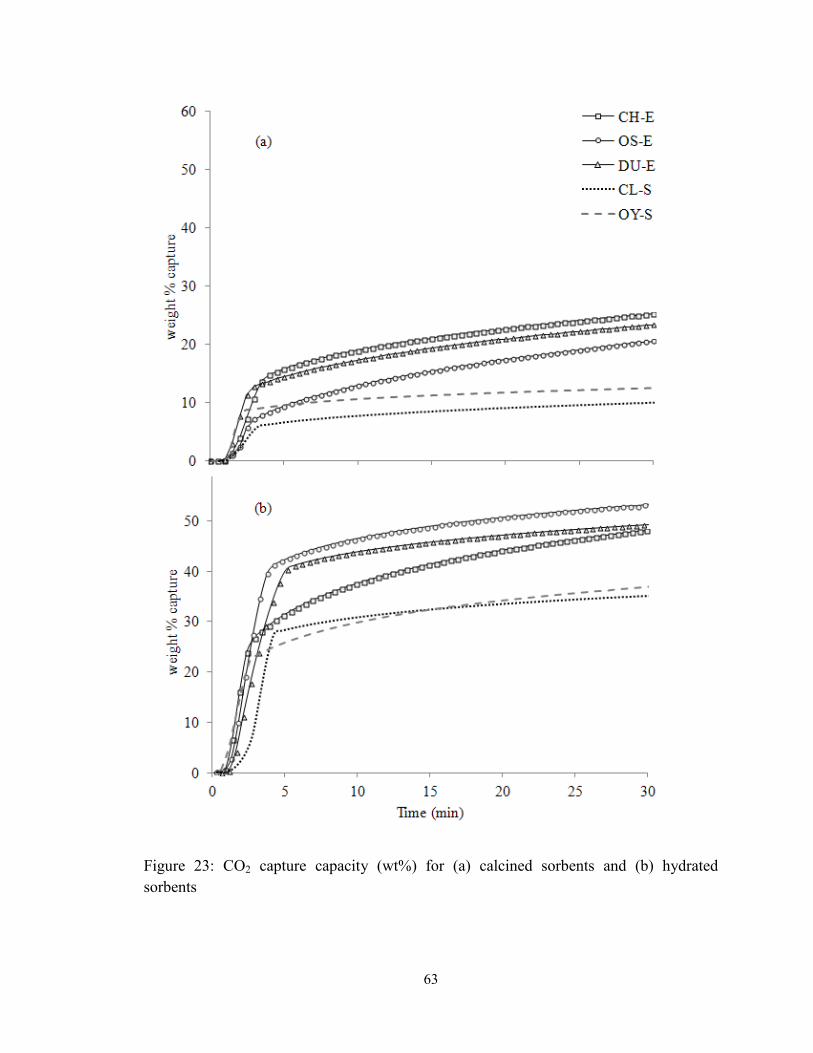
63
Figure 23: CO2 capture capacity (wt%) for (a) calcined sorbents and (b) hydrated
sorbents
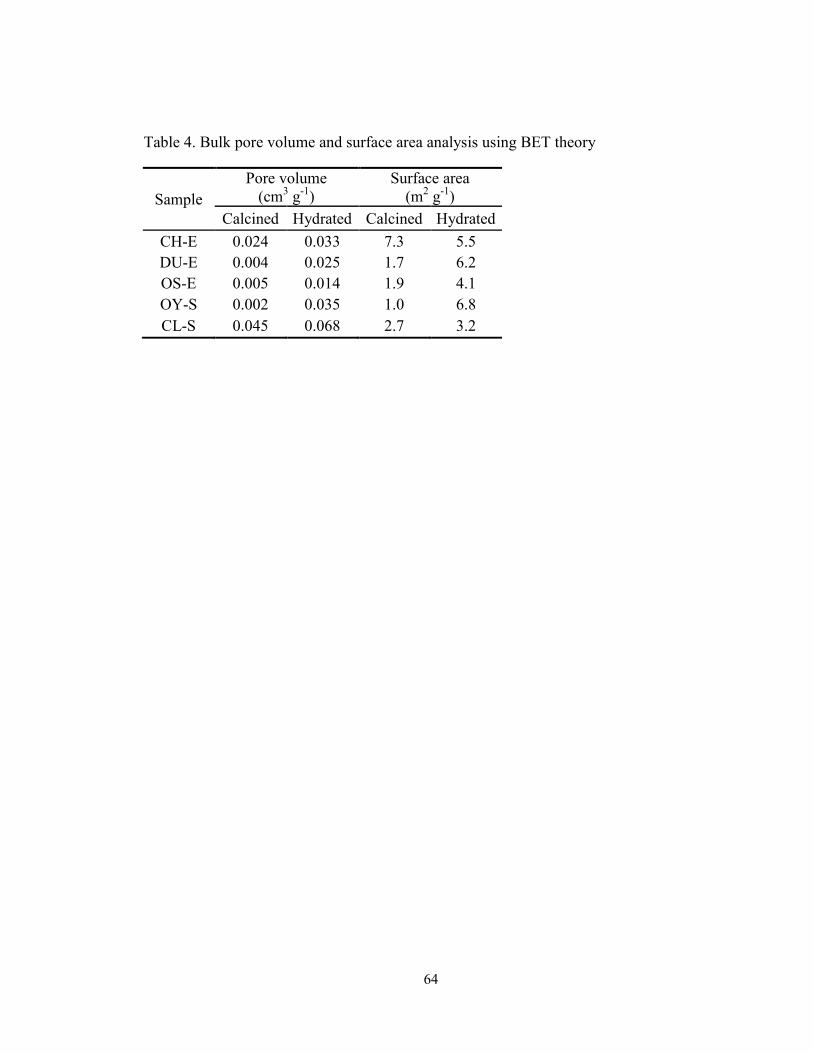
64
Table 4. Bulk pore volume and surface area analysis using BET theory
Sample
Pore volume
(cm3 g
-1)
Surface area
(m2 g
-1)
Calcined Hydrated Calcined Hydrated
CH-E 0.024 0.033 7.3 5.5
DU-E 0.004 0.025 1.7 6.2
OS-E 0.005 0.014 1.9 4.1
OY-S 0.002 0.035 1.0 6.8
CL-S 0.045 0.068 2.7 3.2
65
It must be noted that the initial sample capture capacity for all samples is higher than that
of the same after hydration. This is because, the solid sorbent initial capture capacity,
shown in Table 2, is evaluated by first calcining the original samples (CaCO3) in pure N2
environment at lower temperatures of 700 °C, followed by immediate reactivity testing
by exposure to 10% CO2 stream at 650 °C. Due to this low temperature ideal condition
calcination, the original sample does not undergo any process of sintering and therefore
exhibits higher reactivity. However, such ‘ideal conditions’ of calcination in pure N2 is
not practical for actual cyclic process considerations, and therefore some sintering is
inevitable in the actual process which is reflected in the lower reactivity even upon
hydration.
The fourth key observation is that the samples derived from egg-shells consistently
showed better reactivity toward CO2 than their sea-shell derived counterparts, as seen in
Figure 23. OY-S and CL-S samples exhibit lower reactivity toward CO2 than their egg-
shell counterparts in all forms. The difference in reactivity of the samples can be due to
various factors; such as inherently different chemical compositions, differences in the
reaction surfaces of the different samples, different crystal structures or dominance of
certain crystallographic planes, etc. Each of these factors was investigated using different
analysis techniques, which are briefly discussed below.
The decomposition curve of the samples obtained via TGA was considered for estimating
the active calcium component of each of the samples. This analysis confirmed that all
samples contained similar fractions of active calcium component (~96 wt% CaCO3).
Therefore, this phenomenon was thought to be an attribute of the difference in surface
66
morphology of the sorbents and therefore their reactivity toward CO2. From the BET
analysis carried out, the bulk surface properties such as total pore volume and surface
area values (Table 4) do not indicate significant differences either. However, microscopic
morphological differences play an important role in the overall reactivity of solid
reactants. To better understand these microscopic morphological differences between the
samples, two egg-shell derived samples and one sea-shell derived sample were chosen for
XRD and SEM analysis. The results obtained can be seen in Figure 24 and Figure 25.
From the Figure 24, all samples are calcite in the original crystal form, and were matched
to JCPD 86-2335 C as the reference pattern. Only minute differences in peak heights of
certain crystal planes are observed. The number associated with each peak represents a
particular crystallographic plane, as matched to the reference calcite crystal form. The
diffraction patterns of CH-E and OS-E samples match almost completely. The pattern of
OY-S sample shows higher concentration of planes 104, 006 and 018, and lower
concentration than the egg-shell samples in a few minor peaks. However, these
differences between the egg and shell derived samples from XRD analysis were
insignificant to account for the large difference in reactivities observed. Finally, SEM
analysis was carried out for the three selected samples. The major microscopic
morphological differences are clearly evident in the SEM images, seen in Figure 25. CH-
E and OS-E samples (Figure 25a and b) have a porous surface structure exhibiting the so-
called ‘popcorn effect’, whereas OY-S (Figure 25c) samples are seen to have much
smoother surface morphology. Thus the higher reactivity of the egg-shell derived samples
can be attributed to their enhanced microscopic surface characteristics, which lend them
advantage over the sea-shell derived samples which do not exhibit such microscopic

67
surface enhancement. This advantage is apparent in the higher reactivity of these samples
despite having the same bulk surface properties and chemical composition as well as
crystal structure.
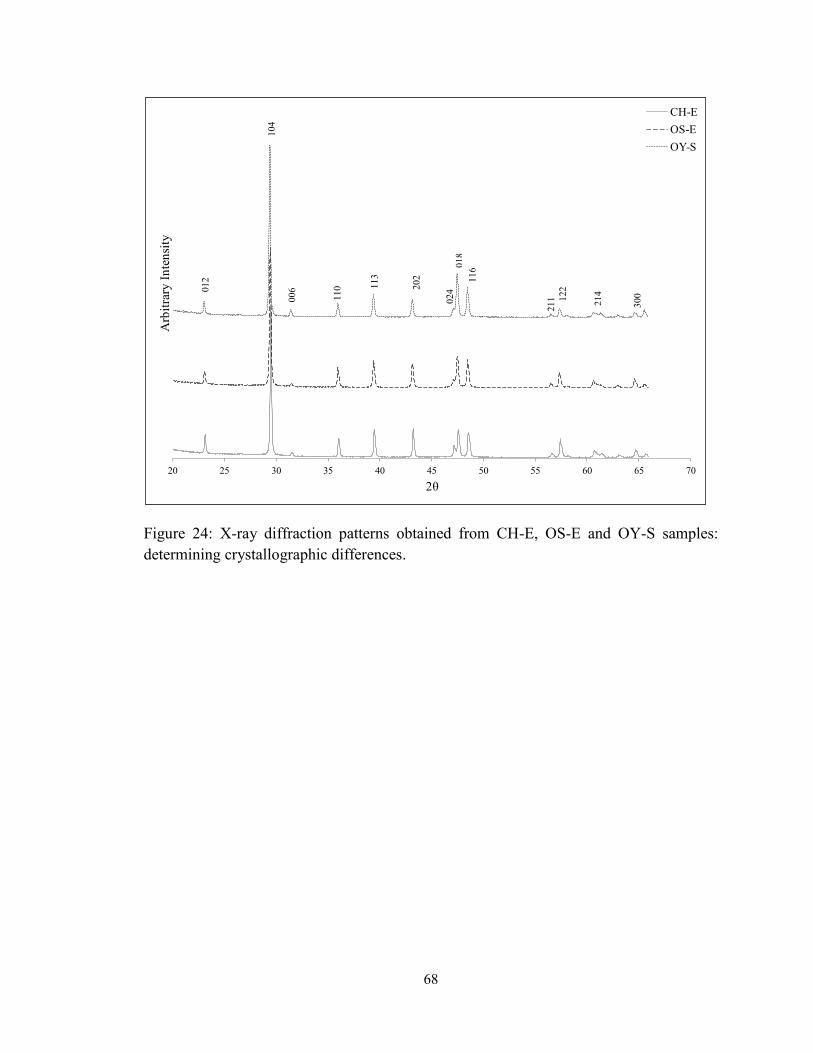
68
Figure 24: X-ray diffraction patterns obtained from CH-E, OS-E and OY-S samples:
determining crystallographic differences.
20 25 30 35 40 45 50 55 60 65 70
Arb
itra
ry I
nte
nsi
ty
2θ
CH-E
OS-E
OY-S
012
104
00
6
11
0 11
3
20
2
024
018
11
6
21
1 122
214
300
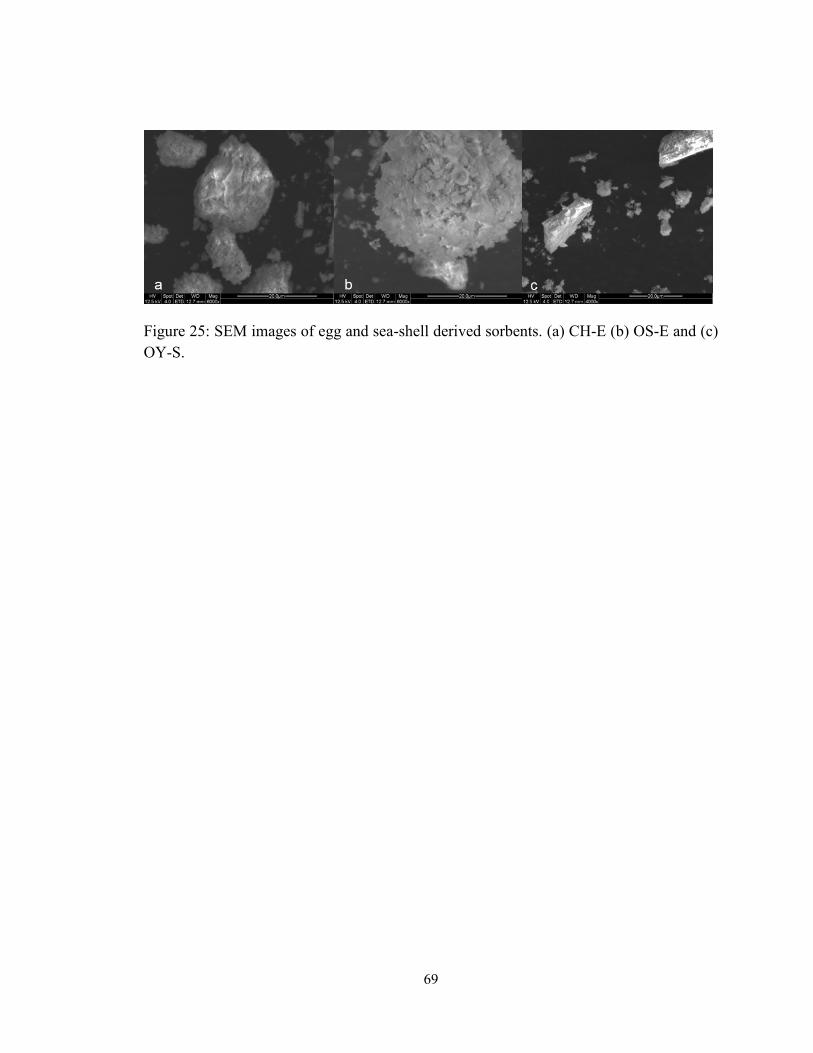
69
Figure 25: SEM images of egg and sea-shell derived sorbents. (a) CH-E (b) OS-E and (c)
OY-S.
70
The analysis techniques employed here reveal that the sea-shell derived samples exhibit
lower affinities toward CO2 for carbonation reaction due to poor reaction surface area
available as compared to the egg-shell derived samples. It is well documented that the
acetic acid pretreatment of calcium sorbents increases the reactivity of the sorbents
toward CO2.61,62
From our results, the acetic acid wash given to egg-shell samples to
separate the collagen membrane from the calcitic shell is believed to have enhanced the
surface properties of the egg shell samples, resulting in higher reactivity.
71
3.4 Conclusions
In this study, it was successfully demonstrated that the calcium sorbent derived from
different waste animal shells are cost-effective sorbents for CO2 capture from effluent gas
streams of coal fired power plants. Three bird egg shells and two sea shells were tested.
Further, all the sorbents showed near complete re-activation or recovery of the CO2
sorption capacity upon hydration. The reactivity was confirmed using TGA as well as
surface morphology measurements such as pore volume and surface area. The calcium
sorbent obtained from all shells was confirmed to be predominantly in the carbonate form
(> 95%). Two egg-shell and one sea-shell sample were selected for studying the
difference in reactivity. XRD analysis revealed the presence of calcite as the dominant
crystal structure in all three samples. SEM revealed clear differences in surface
morphology, indicating that the sea-shell sample has lower surface area for reaction, with
appearance of smoother particle surfaces, which correlates well with the lower reactivity
observed. The difference in the pretreatment of the egg and sea shells, viz. the acetic acid
wash given to the egg shell samples to remove collagen membrane, is offered as an
explanation to the general trend of lower reactivity of sea-shell samples towards CO2. As
a result, acetic acid pretreatment is offered as a viable method of pretreatment of sorbent
derived from waste animal shells.
72
CHAPTER 4: A Novel Calcium-Char (Cal-C) Process for the
Simultaneous Removal of NOx, SOx and CO2 from Combustion Flue
Gas
4.1 Introduction
The increase in anthropogenic gaseous emissions due to fossil fuel combustion has been
accompanied in recent years with an increase in research efforts to curb them. Oxides of
nitrogen (NOx) and sulfur (SOx) are common fossil fuel combustion pollutants that have
been classified as criteria pollutants, with their ambient air quality standards defined from
as early as 1971.63
Since then, numerous techniques have been developed for
continuously improving the efficiency and/or extent of removal of these gases from
varied combustion sources.64,65
NOx, chiefly nitric oxide (NO), is produced mainly
through high-temperature oxidation of atmospheric nitrogen (N2) that occurs during fuel
combustion (thermal NOx) or from oxidation of nitrogen present in the fuel (fuel NOx).
The measures of reducing NO emissions include high-temperature techniques such as
combustion modifications which entail producing environments that abate the formation
of NO by staged combustion, low NOx burners, etc.66
The medium- and low-temperature
post-combustion techniques include selective catalytic or non-catalytic reduction (SCR
and SNCR) of NO by a reducing agent (commonly ammonia),67, 68
reburning of fuel,69
or
ozone oxidation with subsequent removal of NO2, etc.70
For sulfur dioxide (SO2)
73
removal, the flue gas desulfurization (FGD) unit is an integral part of post-combustion
flue gas processing in the majority of coal-fired power plants. The most common method
of removing SO2 is using lime-based slurry, with the occasional dry sorbent injection also
involving predominantly calcium oxide (CaO), and less commonly other alkali metal
oxides such as sodium (Na) or magnesium (Mg).65
The worldwide increasing energy demand is resulting in ever-increasing amount of
carbon dioxide (CO2) emission, particularly from large point sources such as coal-fired
power plants42
. Due to the greenhouse effect caused by CO2, there are several
technologies being considered for addressing CO2 reduction71
; among which the
limestone-based calcium looping technology is one of the most promising, having been
demonstrated at various pilot-scale facilities around the world.17
The reversible reaction
between CO2 and CaO forms the basis of this technology. This is a high-temperature
technique in which the CO2 capture reaction occurs at 550-650°C. Based on this concept,
the Carbonation Calcination Reaction (CCR) process was developed at The Ohio State
University (OSU) for the simultaneous removal of CO2 and SO2 from coal-combustion
flue gas.20,2,22,38
The CCR process comprises a three-reactor system, with hydration as the
preferred method of reactivating the CaO that otherwise loses its reactivity over multiple
cycles.60
The CCR process has successfully demonstrated >90% CO2 and 100% SO2
removal from flue gas generated from actual coal combustion in a 120 kWth unit at
OSU.22
The reaction of SO2 with CaO is virtually complete, with 100% capture achieved
at 600-650 ̊C, which is lower than typical furnace dry sorbent injection temperatures.
This high extent of capture is feasible at lower temperatures owing to the extremely high
74
calcium-to-sulfur mol ratio – approximately 50:1 for a flue gas generated from a typical
medium (4%) sulfur coal.22
Similar to SO2, NO is also present in the flue gas at very low concentration of a few
hundred to thousand ppm. This NO can be reduced to N2 in the presence of a
carbonaceous material such as coal char.72
Oxygen (O2) present in the flue gas also
catalyzes NO reduction using char at small concentrations.73
It is also well established
that the presence of certain alkali and alkaline earth metals catalyze the NO reduction
reaction.74,75
Various studies have quantified the effect of these metals, either present
inherently in the char or added externally through experimental catalytic loading
techniques.76,77,78,79
The effect of the presence of ash in the char has also been quantified
on the basis of reaction temperature, total NO conversion, etc. Chang et al. noted that the
activity of raw char is higher than that of de-ashed char.80
They also corroborated the
known fact that the char reactivity toward NO decreases with increasing rank of the coal
by testing anthracite, lignite, and bituminous coal chars. Activated lignite coal chars with
a high Na content have been demonstrated to successfully remove NO from simulated
flue gas at a pilot scale at Energy and Environment Research Center (North Dakota) in a
demonstration of the CARBONOX process, which was developed at OSU.72
Synthetics
chars with artificial CaO catalytic loading have also been reported to exhibit enhanced
reactivity toward NO for the reduction reaction.81
If the char is chosen such that it
possesses appropriate kinetics for NO reduction at the CCR process conditions (reaction
time, temperature, etc.), then the simultaneous removal of NO, SO2, and CO2 may be
75
achieved in a single reactor by using a mixture of calcium sorbent and char. This forms
the basis of the conceived Calcium-Char (Cal-C) process.82
This study provides an overview of the Cal-C process. The process concept has been
verified by performing experiments in a fluidized bed reactor. Process analysis using
Aspen Plus simulation software has been performed and is also presented.
4.1.1 Process overview
A simplified block flow diagram of the process is shown in Figure 26. The process
consists of a three-reactor loop; the simultaneous removal of the NO, SO2, and CO2 takes
place in a single reactor, i.e. the Cal-C reactor.
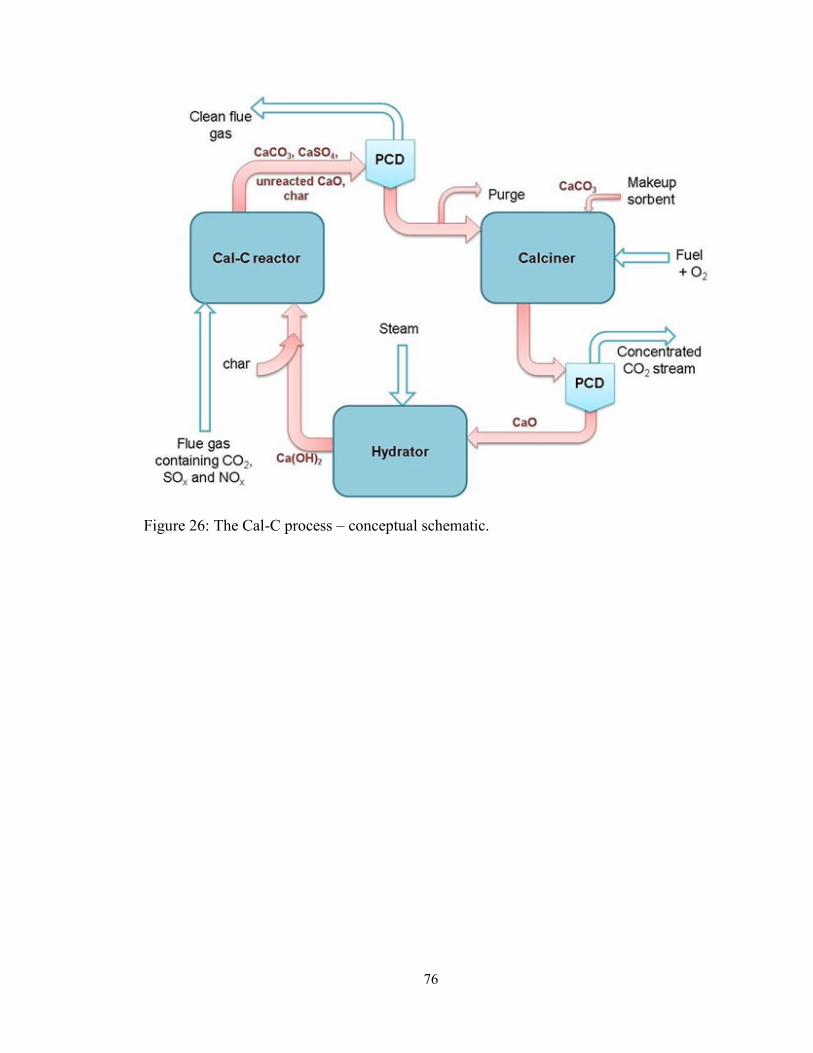
76
Figure 26: The Cal-C process – conceptual schematic.
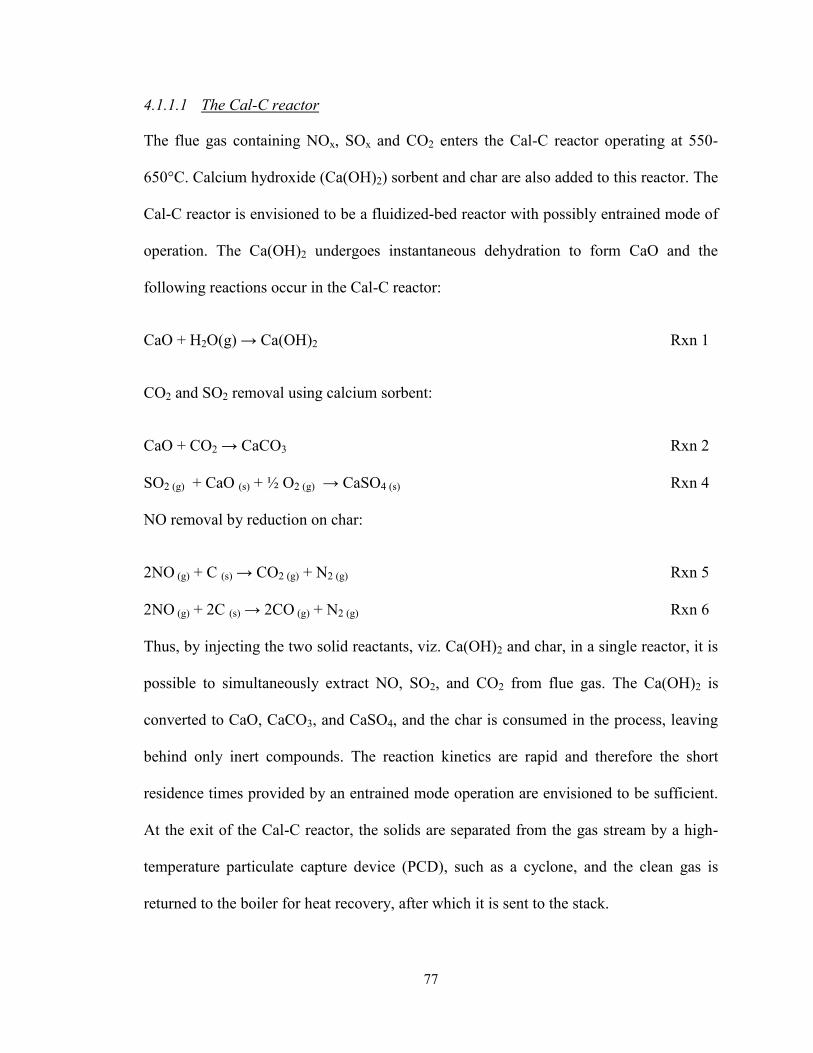
77
4.1.1.1 The Cal-C reactor
The flue gas containing NOx, SOx and CO2 enters the Cal-C reactor operating at 550-
650°C. Calcium hydroxide (Ca(OH)2) sorbent and char are also added to this reactor. The
Cal-C reactor is envisioned to be a fluidized-bed reactor with possibly entrained mode of
operation. The Ca(OH)2 undergoes instantaneous dehydration to form CaO and the
following reactions occur in the Cal-C reactor:
CaO + H2O(g) → Ca(OH)2 Rxn 1
CO2 and SO2 removal using calcium sorbent:
CaO + CO2 → CaCO3 Rxn 2
SO2 (g) + CaO (s) + ½ O2 (g) → CaSO4 (s) Rxn 4
NO removal by reduction on char:
2NO (g) + C (s) → CO2 (g) + N2 (g) Rxn 5
2NO (g) + 2C (s) → 2CO (g) + N2 (g) Rxn 6
Thus, by injecting the two solid reactants, viz. Ca(OH)2 and char, in a single reactor, it is
possible to simultaneously extract NO, SO2, and CO2 from flue gas. The Ca(OH)2 is
converted to CaO, CaCO3, and CaSO4, and the char is consumed in the process, leaving
behind only inert compounds. The reaction kinetics are rapid and therefore the short
residence times provided by an entrained mode operation are envisioned to be sufficient.
At the exit of the Cal-C reactor, the solids are separated from the gas stream by a high-
temperature particulate capture device (PCD), such as a cyclone, and the clean gas is
returned to the boiler for heat recovery, after which it is sent to the stack.
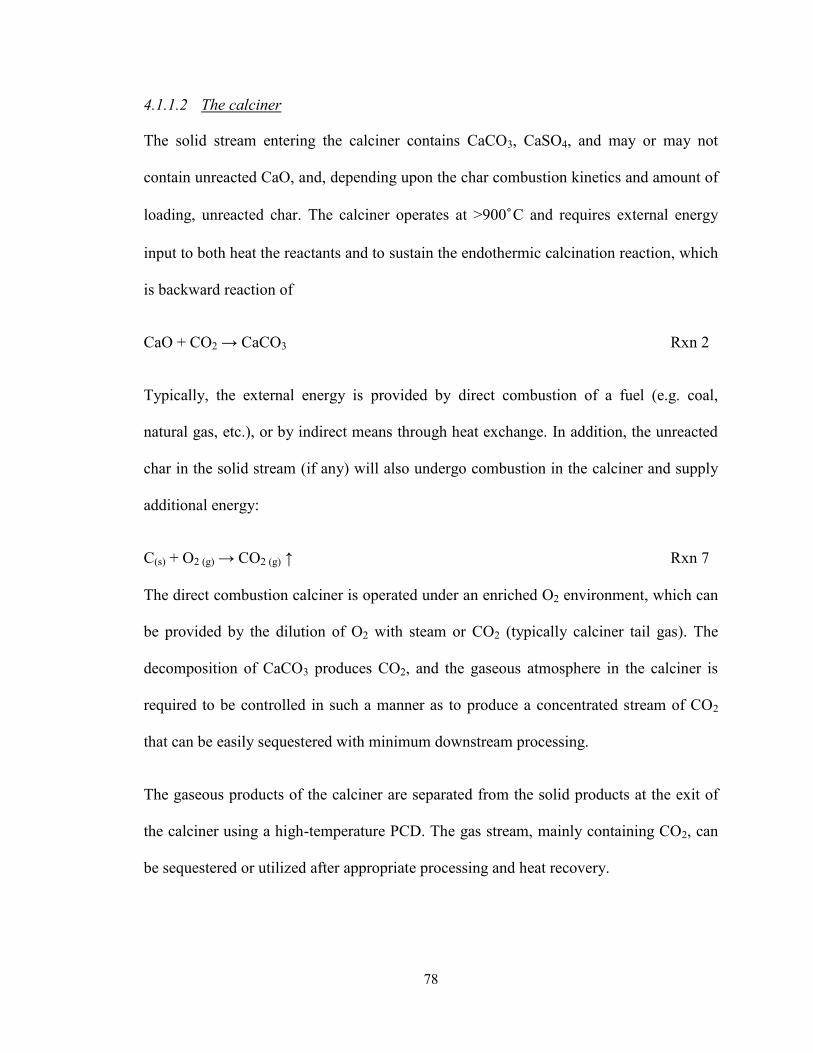
78
4.1.1.2 The calciner
The solid stream entering the calciner contains CaCO3, CaSO4, and may or may not
contain unreacted CaO, and, depending upon the char combustion kinetics and amount of
loading, unreacted char. The calciner operates at >900 ̊C and requires external energy
input to both heat the reactants and to sustain the endothermic calcination reaction, which
is backward reaction of
CaO + CO2 → CaCO3 Rxn 2
Typically, the external energy is provided by direct combustion of a fuel (e.g. coal,
natural gas, etc.), or by indirect means through heat exchange. In addition, the unreacted
char in the solid stream (if any) will also undergo combustion in the calciner and supply
additional energy:
C(s) + O2 (g) → CO2 (g) ↑ Rxn 7
The direct combustion calciner is operated under an enriched O2 environment, which can
be provided by the dilution of O2 with steam or CO2 (typically calciner tail gas). The
decomposition of CaCO3 produces CO2, and the gaseous atmosphere in the calciner is
required to be controlled in such a manner as to produce a concentrated stream of CO2
that can be easily sequestered with minimum downstream processing.
The gaseous products of the calciner are separated from the solid products at the exit of
the calciner using a high-temperature PCD. The gas stream, mainly containing CO2, can
be sequestered or utilized after appropriate processing and heat recovery.
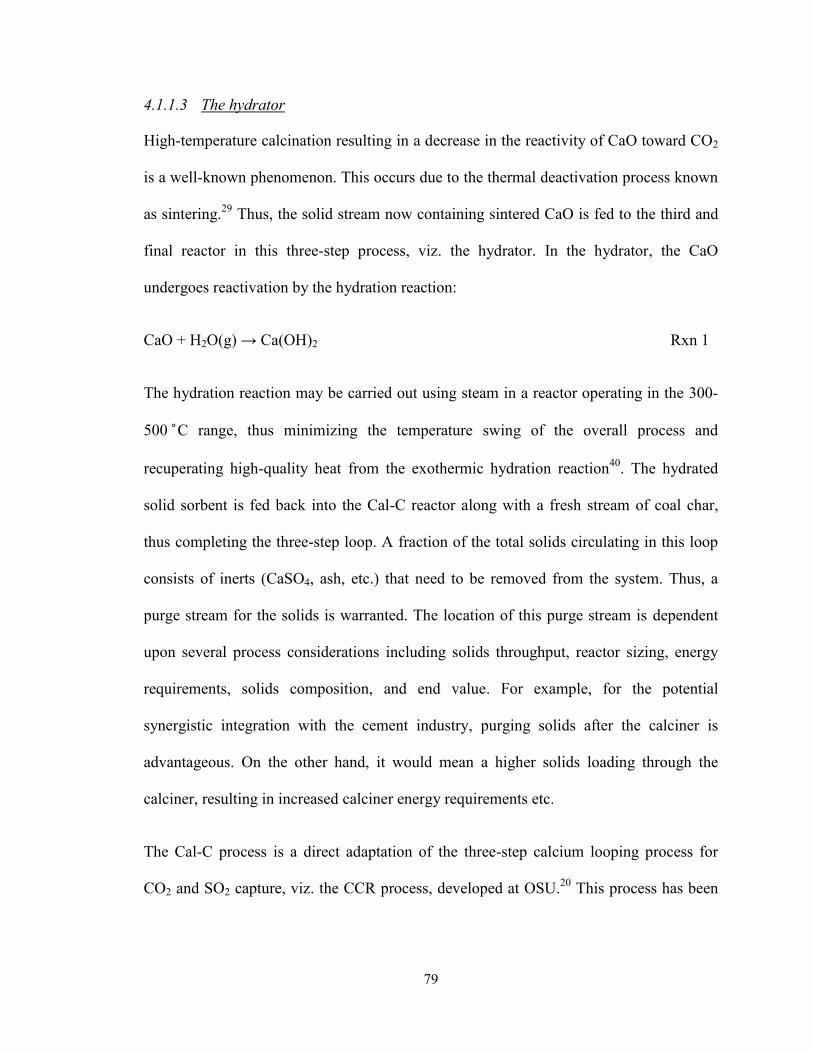
79
4.1.1.3 The hydrator
High-temperature calcination resulting in a decrease in the reactivity of CaO toward CO2
is a well-known phenomenon. This occurs due to the thermal deactivation process known
as sintering.29
Thus, the solid stream now containing sintered CaO is fed to the third and
final reactor in this three-step process, viz. the hydrator. In the hydrator, the CaO
undergoes reactivation by the hydration reaction:
CaO + H2O(g) → Ca(OH)2 Rxn 1
The hydration reaction may be carried out using steam in a reactor operating in the 300-
500 ̊C range, thus minimizing the temperature swing of the overall process and
recuperating high-quality heat from the exothermic hydration reaction40
. The hydrated
solid sorbent is fed back into the Cal-C reactor along with a fresh stream of coal char,
thus completing the three-step loop. A fraction of the total solids circulating in this loop
consists of inerts (CaSO4, ash, etc.) that need to be removed from the system. Thus, a
purge stream for the solids is warranted. The location of this purge stream is dependent
upon several process considerations including solids throughput, reactor sizing, energy
requirements, solids composition, and end value. For example, for the potential
synergistic integration with the cement industry, purging solids after the calciner is
advantageous. On the other hand, it would mean a higher solids loading through the
calciner, resulting in increased calciner energy requirements etc.
The Cal-C process is a direct adaptation of the three-step calcium looping process for
CO2 and SO2 capture, viz. the CCR process, developed at OSU.20
This process has been
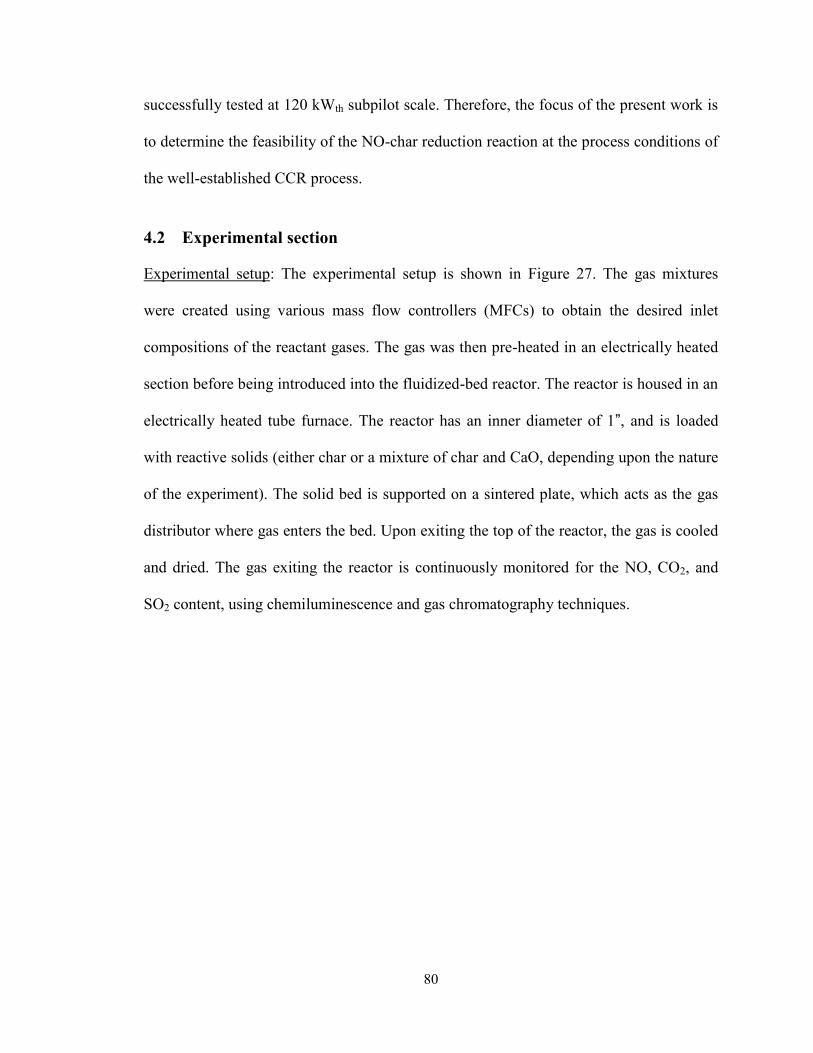
80
successfully tested at 120 kWth subpilot scale. Therefore, the focus of the present work is
to determine the feasibility of the NO-char reduction reaction at the process conditions of
the well-established CCR process.
4.2 Experimental section
Experimental setup: The experimental setup is shown in Figure 27. The gas mixtures
were created using various mass flow controllers (MFCs) to obtain the desired inlet
compositions of the reactant gases. The gas was then pre-heated in an electrically heated
section before being introduced into the fluidized-bed reactor. The reactor is housed in an
electrically heated tube furnace. The reactor has an inner diameter of 1”, and is loaded
with reactive solids (either char or a mixture of char and CaO, depending upon the nature
of the experiment). The solid bed is supported on a sintered plate, which acts as the gas
distributor where gas enters the bed. Upon exiting the top of the reactor, the gas is cooled
and dried. The gas exiting the reactor is continuously monitored for the NO, CO2, and
SO2 content, using chemiluminescence and gas chromatography techniques.
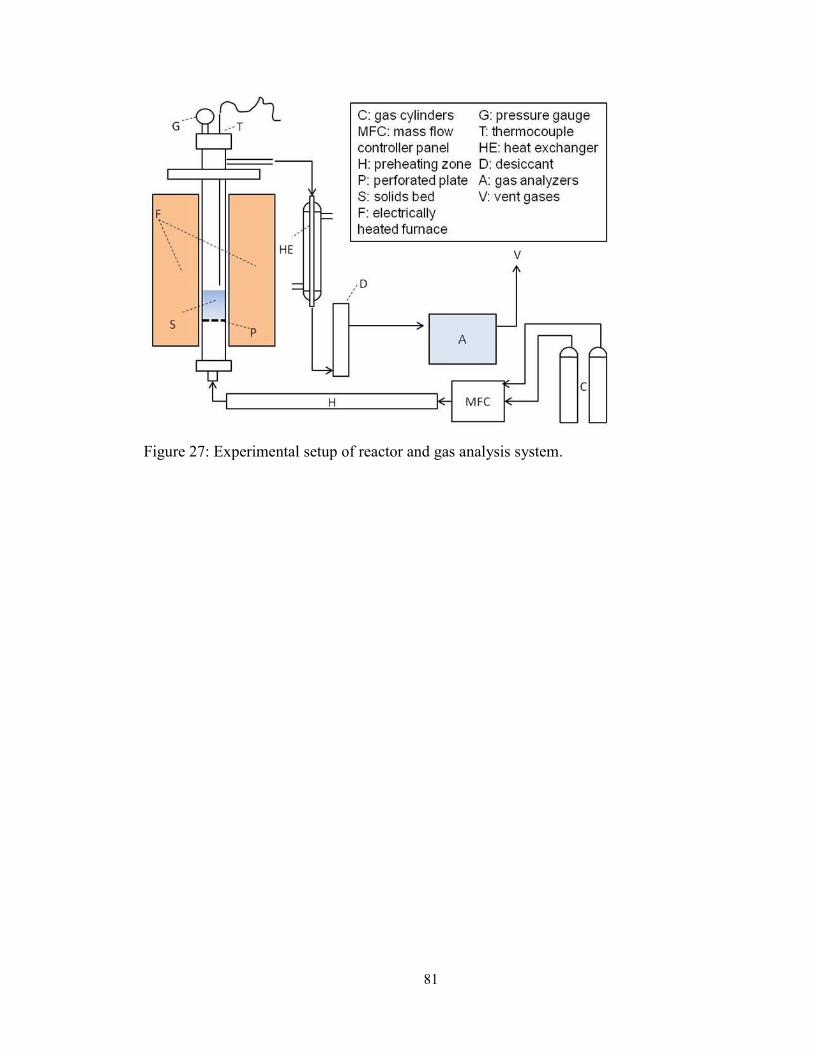
81
Figure 27: Experimental setup of reactor and gas analysis system.
82
Materials and methods: Different concentrations of inlet gases were achieved by creating
gas mixtures of relevant compositions. The different gases used were O2, CO2, SO2, and
NO. The balance was always N2. Lignite coal samples were obtained from San Miguel
Electric Cooperative Inc., Texas and Walnut Creek Mining Company, Texas. Chars were
prepared by thermal pretreatment (devolatilization) in N2 at more than 400 ̊C until tar
ceased to evolve. The resulting char samples are hereafter termed LC-1 and LC-2,
respectively. Bituminous coal char (BC) was obtained from Asbury Carbons. Laboratory
grade (98%) Ca(OH)2 (ACROS Organics) was used as precursor for CaO. Both char and
CaO were taken in a fine powder form (<50 μm) to match the particle size used in the
entrained flow operation of CCR process carbonator. However, in the lab-scale reactor,
gas velocities were chosen so as to obtain a semi-batch operation, with solids being
maintained in a fixed-fluidized bed mode.
Procedure: For the temperature programmed reduction (TPR), the reactor was loaded
with a mixture of CaO and char and brought to the starting temperature (150°C) in N2.
Upon reaching the reaction temperature, the gases were switched to a mixture of ~900
ppm NO, 1.5% O2, and N2 and the TPR was performed at a ramp rate of 10 ̊C/min. The
temperature was ramped until complete NO reduction was confirmed by the outlet NO
concentration reaching zero. For the isothermal tests, the reactor was loaded with char or
a mixture of CaO and char and brought to the reaction temperature (~650°C) in N2. Upon
reaching this temperature, the inlet gas was switched to the reactant gas. The gas flow
rate was always maintained at 210 ml/min (NTP). The progress of reactions was
83
monitored by measuring outlet gas concentrations. Breakthrough curves were obtained
for each experiment.
4.3 Results and discussion
4.3.1 Effect of temperature on NO reduction in presence of CaO:
Based on the published literature, NO dissociatively chemisorbs onto the surface of coal
char and is reduced at temperatures as low as 300°C.83
Nitrogen escapes in gaseous
molecular form while the O is bound to the surface in various C(O) and C(O2)
complexes.84
The energy required for desorption of these complexes is higher than that of
the desorption of gaseous N2. However, at sufficiently high temperatures, these
complexes can also be desorbed from the surface of coal char. When the C(O) complexes
are released from the surface of the char (in the form of CO or CO2), they leave behind
active sites for fresh NO molecules to chemisorb.85
Therefore, sustained NO removal
necessitates that the rate of desorption of C(O) complexes be equal to or higher than the
rate of chemisorption of NO molecules.
The presence of CaO on the surface of the coal char aids in the contact between the (O)
and C on the char surface, thereby facilitating the regeneration of the active sites for
further NO chemisorption.81
Also, the presence of O2 in small concentrations aids the
formation of active sites by gasification and aforesaid desorption of complexes. This
results in lowering of the temperature of NO reduction. The O2 present in the flue gas and
CaO present for the removal of CO2 and SO2 thereby facilitate the char-NO reaction
further. Therefore, TPR tests were carried out on the chars in presence of the CaO sorbent
and O2 in the gas stream. The TPR showed a decrease in the outlet NO concentration
84
with an increase in temperature, as seen in Figure 28. For bituminous char, higher
temperature may be necessary to achieve complete NO reduction, and the outlet NO
concentration trend agrees with that reported by Gupta et.al73
The peak in NO
concentration and subsequent rapid decrease around 550-600°C corresponds to the
change in the availability of active sites on the char surface due to desorption of C(O)
complexes. The temperature was not ramped above 700°C as the thermodynamics of the
carbonation reaction prevent CO2 removal to the desired degree above this temperature,
thus bituminous char seems incompatible with the desired process requirements.
However, in the presence of CaO, lignite chars exhibited complete NO removal at 650°C.
The feasibility of NO reduction at this temperature makes this process perfectly amenable
with the CO2 and SO2 removal using calcium sorbent.
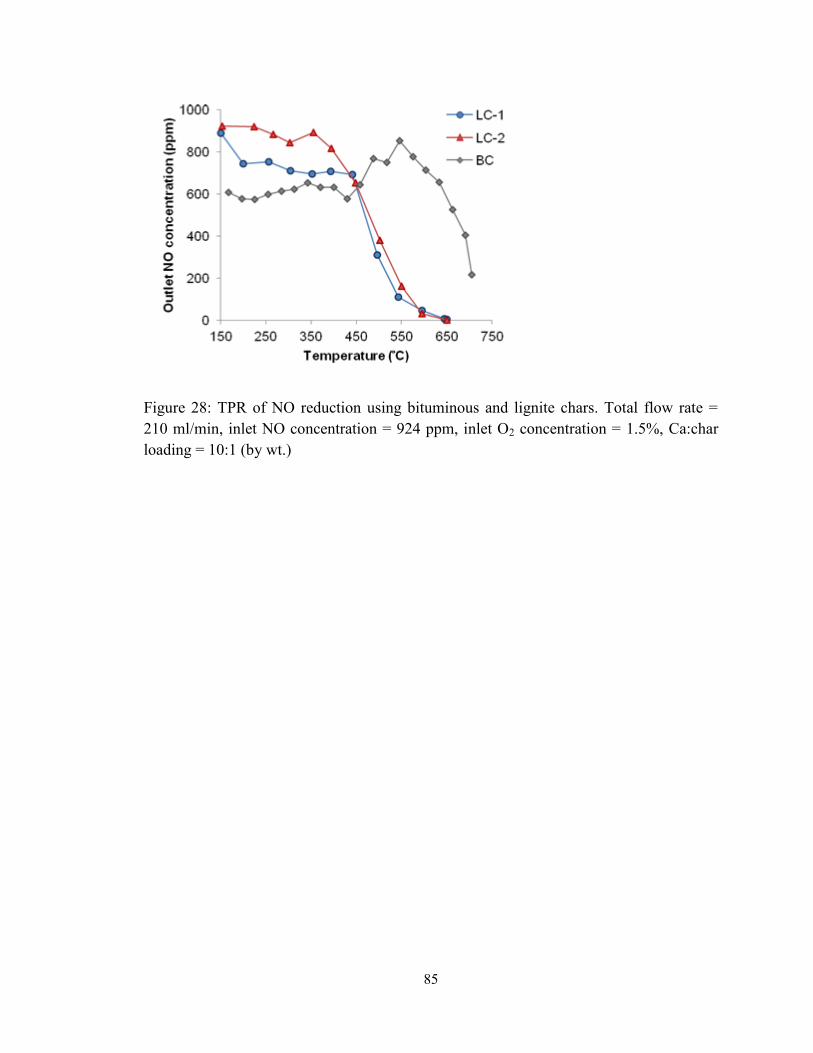
85
Figure 28: TPR of NO reduction using bituminous and lignite chars. Total flow rate =
210 ml/min, inlet NO concentration = 924 ppm, inlet O2 concentration = 1.5%, Ca:char
loading = 10:1 (by wt.)
86
4.3.2 Effect of addition of CaO (presence and absence of calcium)
The presence of CaO is documented to have a catalytic effect on the NO reduction by
char. This is due to metallic oxides facilitating the transfer of gaseous oxygen to the
active sites on char by readily providing temporary binding sites for the (O) radical.81
For
oxides having multiple oxidation states, this effect is more pronounced since there is a
greater affinity towards oxygen by the metal oxide.81,86
The catalytic effect of CaO on the
NO-char reduction reaction has been quantified in earlier studies, where the CaO was
loaded onto the char surface in small quantities by using methods such as solution
impregnation.76,81
However, the samples prepared for the present study involved only
physical mixing of Ca(OH)2 and char in pre-determined weight proportions. During the
pre-heating of the reactor bed to the reaction temperature, Ca(OH)2 decomposes to
produce the desired CaO sorbent by the reverse of reaction 1, as confirmed by the
presence of moisture in the exit of the reactor.
It was observed that the addition of calcium sorbent to the char bed resulted in the
enhancement of the NO reduction reaction. Using BC, sustained NO reduction was not
observed in isothermal experiments carried out at 650 ̊C, as higher temperatures are
known to be required for the reaction of NO with bituminous char.73
However, the
breakthrough curve for outlet NO concentration exhibited a definite shift towards lower
concentrations (Figure 29a) indicating increased reactivity of char. The same trend was
also observed in case of the lignite chars, shown in Figure 29b for LC-1, in which a clear
pre-breakthrough period was observed indicating complete and sustained NO reduction
87
during the same. Similar trends were also obtained for tests carried out with LC-2 (Figure
29c).
Since the char is also consumed by the competing reaction with O2 at a much higher rate
(reaction 7 and 8), the total amount of char used for NO reduction is calculated using
selectivity, defined as total weight of NO reduced per unit weight of char consumed. The
total amount of NO reduced can be obtained by calculating the cumulative area under the
plot, in these isothermal experiments. Figure 30 shows the effect of various Ca(OH)2 to
char ratios (referred to as Ca:char loading by wt) on the selectivity of NO reduction
reaction for LC-2. The selectivity of NO reduction increased with an increase in the
calcium loading. In the actual process, the solid loading ratios will be dictated by the
relative concentrations of the corresponding reacting gases. Since the CO2 concentration
in coal-combustion flue gas is orders of magnitude higher (12-15%) than the
concentration of NO (in ppm), the calcium sorbent is expected to be in large excess as
compared to the char in the Cal-C reactor.
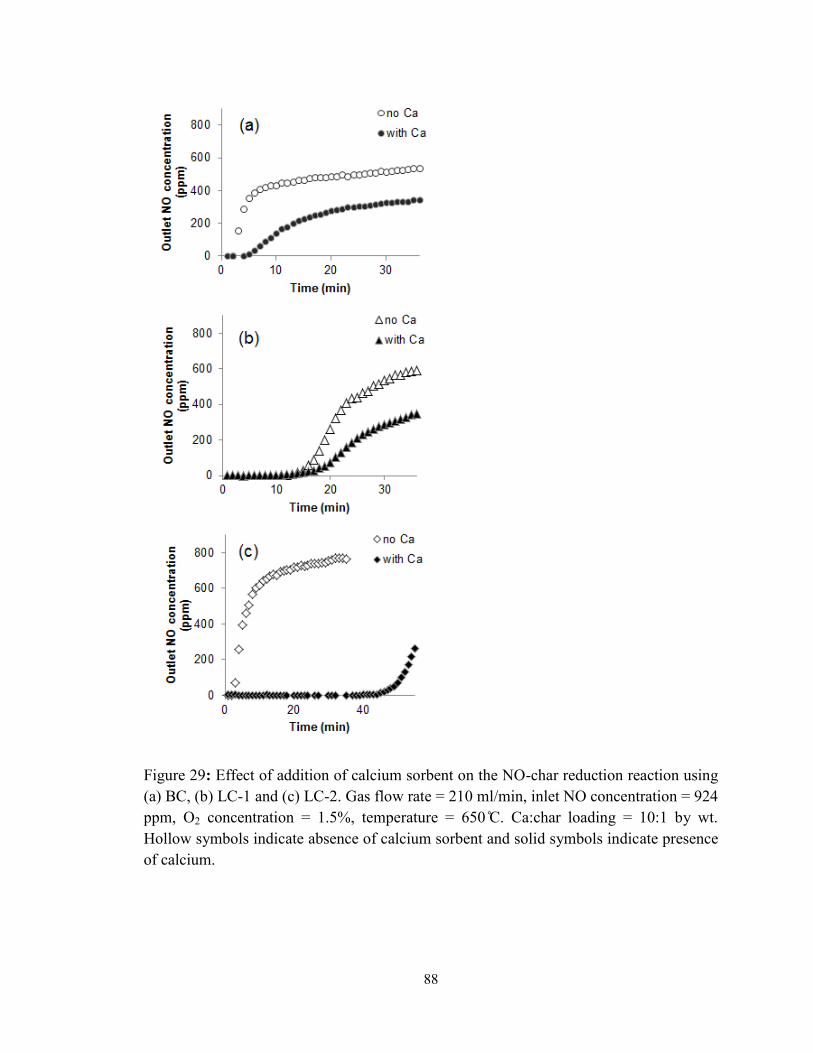
88
Figure 29: Effect of addition of calcium sorbent on the NO-char reduction reaction using
(a) BC, (b) LC-1 and (c) LC-2. Gas flow rate = 210 ml/min, inlet NO concentration = 924
ppm, O2 concentration = 1.5%, temperature = 650 ̊C. Ca:char loading = 10:1 by wt.
Hollow symbols indicate absence of calcium sorbent and solid symbols indicate presence
of calcium.
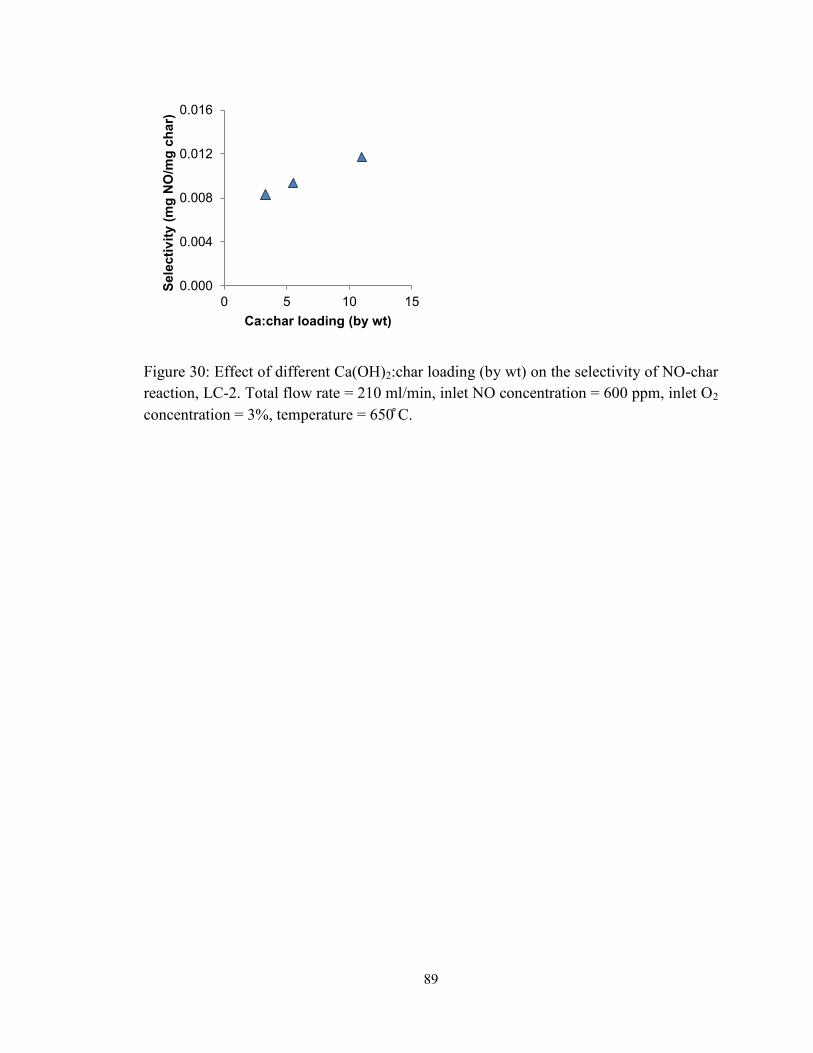
89
Figure 30: Effect of different Ca(OH)2:char loading (by wt) on the selectivity of NO-char
reaction, LC-2. Total flow rate = 210 ml/min, inlet NO concentration = 600 ppm, inlet O2
concentration = 3%, temperature = 650 ̊C.
0.000
0.004
0.008
0.012
0.016
0 5 10 15
Sele
cti
vit
y (
mg
NO
/mg
ch
ar)
Ca:char loading (by wt)
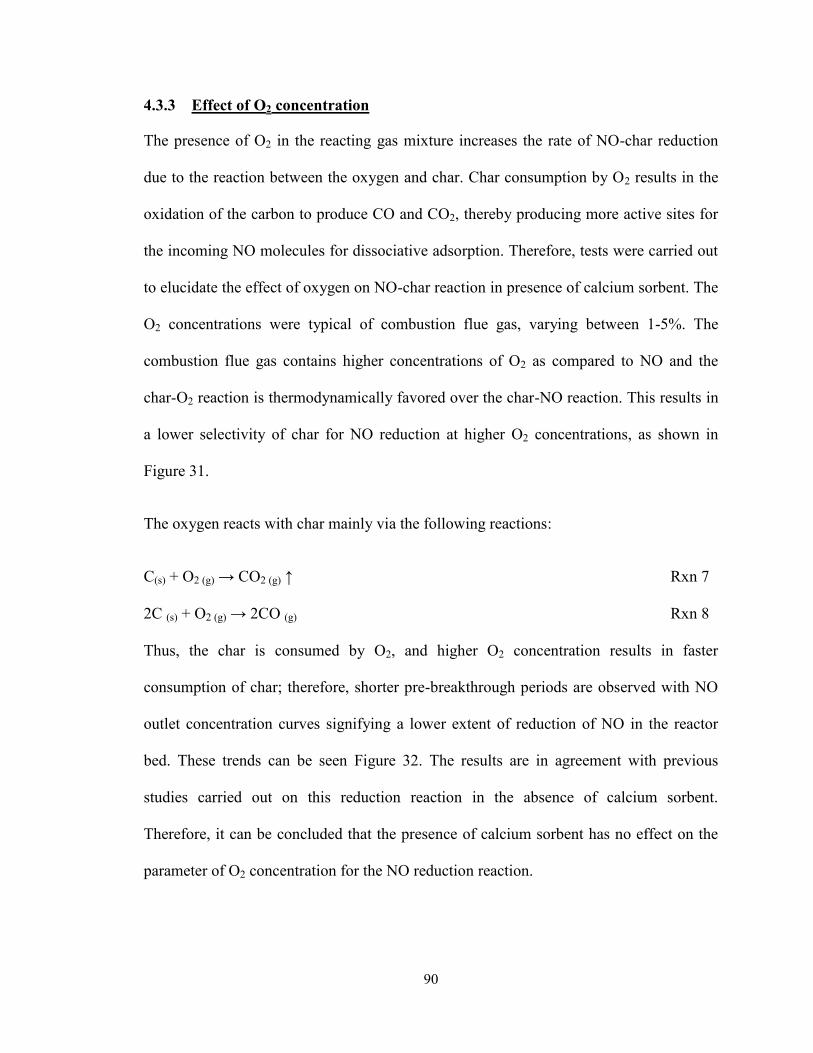
90
4.3.3 Effect of O2 concentration
The presence of O2 in the reacting gas mixture increases the rate of NO-char reduction
due to the reaction between the oxygen and char. Char consumption by O2 results in the
oxidation of the carbon to produce CO and CO2, thereby producing more active sites for
the incoming NO molecules for dissociative adsorption. Therefore, tests were carried out
to elucidate the effect of oxygen on NO-char reaction in presence of calcium sorbent. The
O2 concentrations were typical of combustion flue gas, varying between 1-5%. The
combustion flue gas contains higher concentrations of O2 as compared to NO and the
char-O2 reaction is thermodynamically favored over the char-NO reaction. This results in
a lower selectivity of char for NO reduction at higher O2 concentrations, as shown in
Figure 31.
The oxygen reacts with char mainly via the following reactions:
C(s) + O2 (g) → CO2 (g) ↑ Rxn 7
2C (s) + O2 (g) → 2CO (g) Rxn 8
Thus, the char is consumed by O2, and higher O2 concentration results in faster
consumption of char; therefore, shorter pre-breakthrough periods are observed with NO
outlet concentration curves signifying a lower extent of reduction of NO in the reactor
bed. These trends can be seen Figure 32. The results are in agreement with previous
studies carried out on this reduction reaction in the absence of calcium sorbent.
Therefore, it can be concluded that the presence of calcium sorbent has no effect on the
parameter of O2 concentration for the NO reduction reaction.
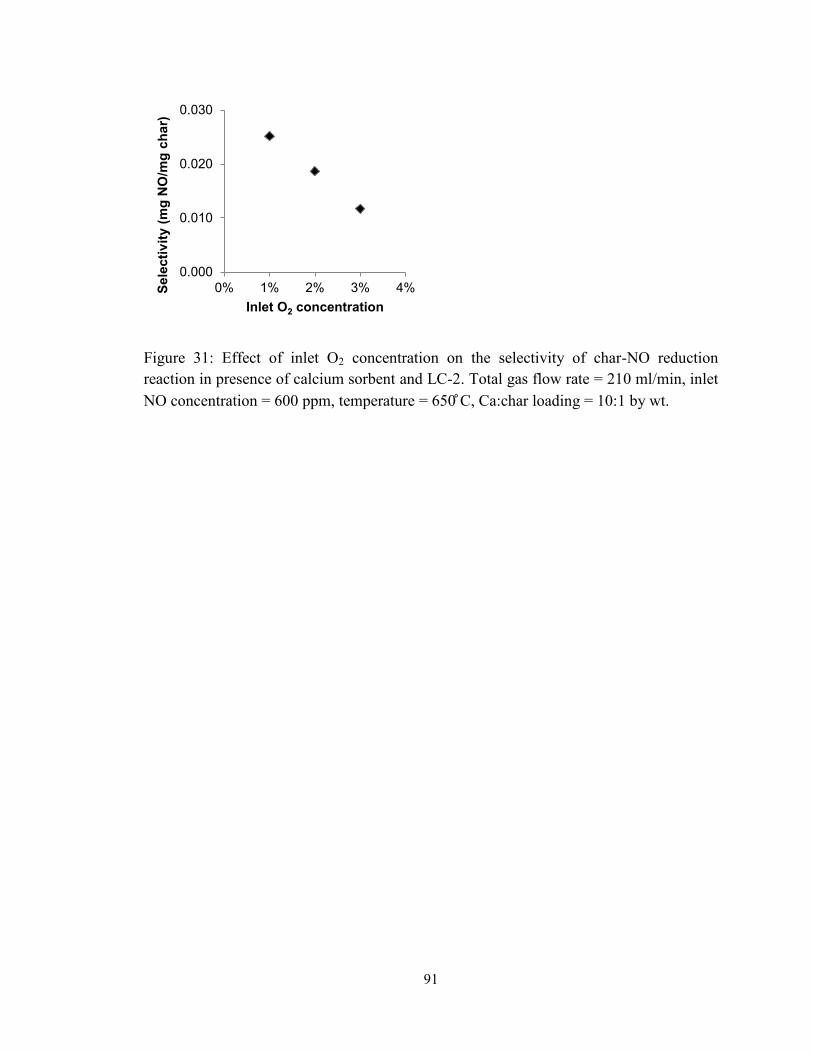
91
Figure 31: Effect of inlet O2 concentration on the selectivity of char-NO reduction
reaction in presence of calcium sorbent and LC-2. Total gas flow rate = 210 ml/min, inlet
NO concentration = 600 ppm, temperature = 650 ̊C, Ca:char loading = 10:1 by wt.
0.000
0.010
0.020
0.030
0% 1% 2% 3% 4%Sele
cti
vit
y (
mg
NO
/mg
ch
ar)
Inlet O2 concentration
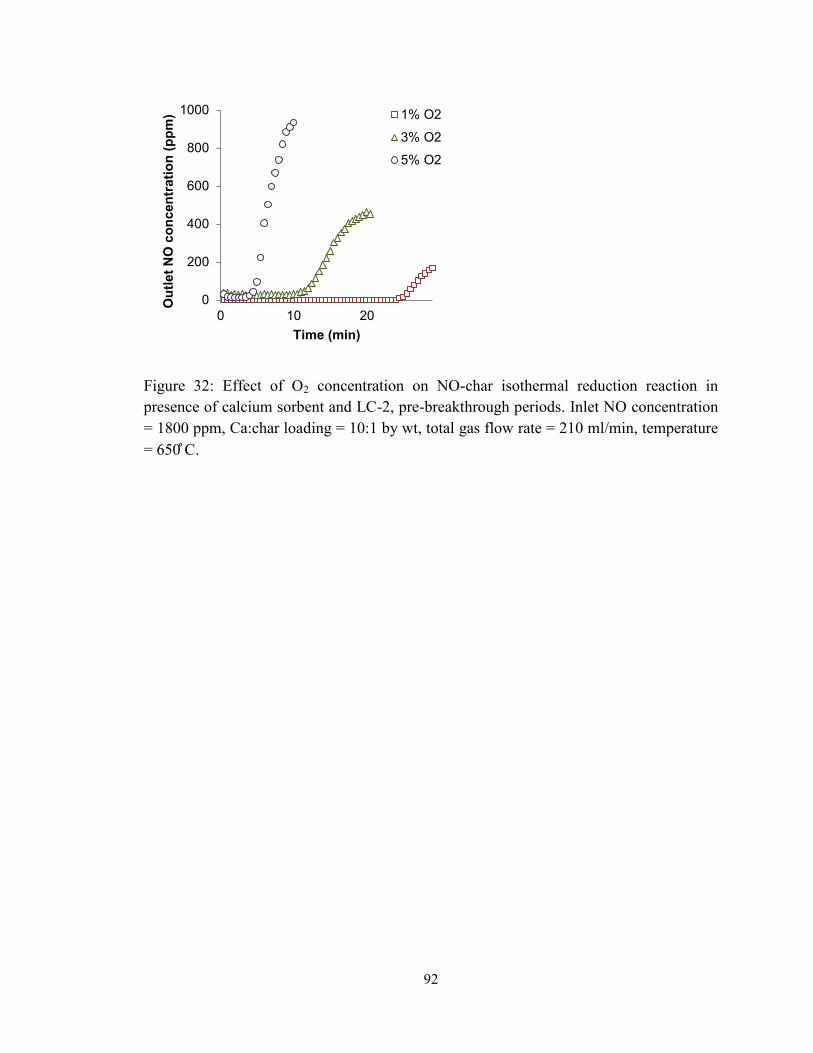
92
Figure 32: Effect of O2 concentration on NO-char isothermal reduction reaction in
presence of calcium sorbent and LC-2, pre-breakthrough periods. Inlet NO concentration
= 1800 ppm, Ca:char loading = 10:1 by wt, total gas flow rate = 210 ml/min, temperature
= 650 ̊C.
0
200
400
600
800
1000
0 10 20
Ou
tlet
NO
co
ncen
trati
on
(p
pm
)
Time (min)
1% O2
3% O2
5% O2
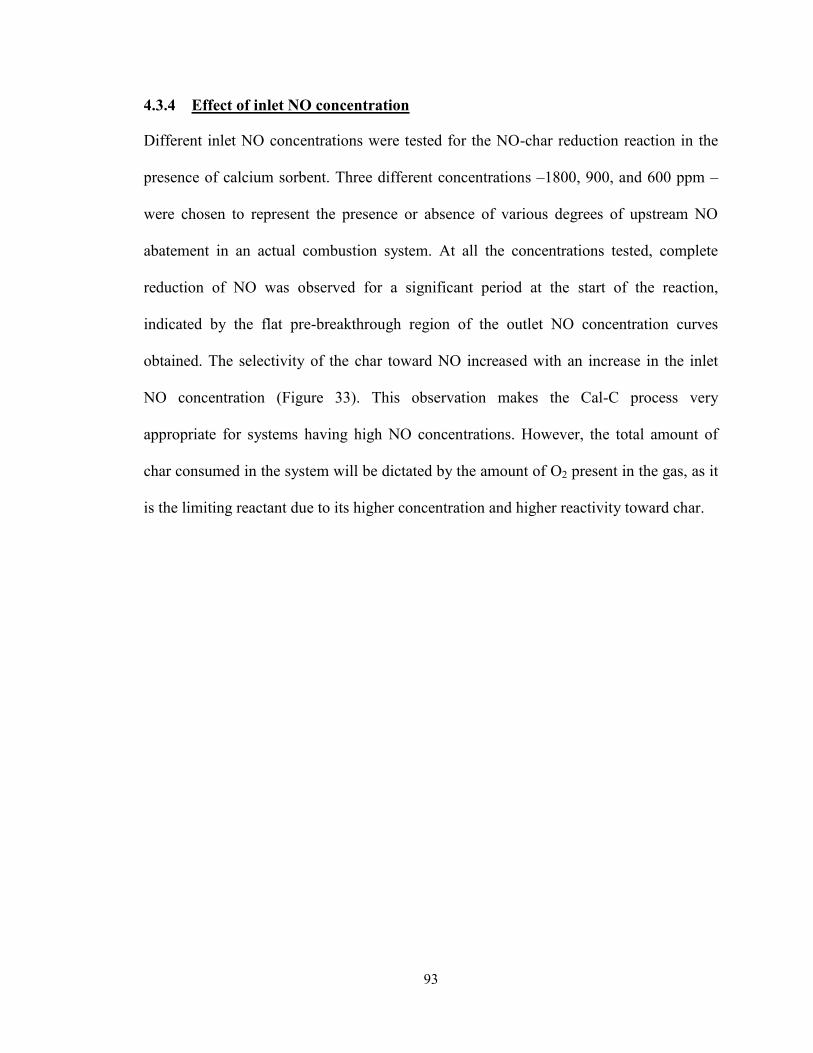
93
4.3.4 Effect of inlet NO concentration
Different inlet NO concentrations were tested for the NO-char reduction reaction in the
presence of calcium sorbent. Three different concentrations –1800, 900, and 600 ppm –
were chosen to represent the presence or absence of various degrees of upstream NO
abatement in an actual combustion system. At all the concentrations tested, complete
reduction of NO was observed for a significant period at the start of the reaction,
indicated by the flat pre-breakthrough region of the outlet NO concentration curves
obtained. The selectivity of the char toward NO increased with an increase in the inlet
NO concentration (Figure 33). This observation makes the Cal-C process very
appropriate for systems having high NO concentrations. However, the total amount of
char consumed in the system will be dictated by the amount of O2 present in the gas, as it
is the limiting reactant due to its higher concentration and higher reactivity toward char.
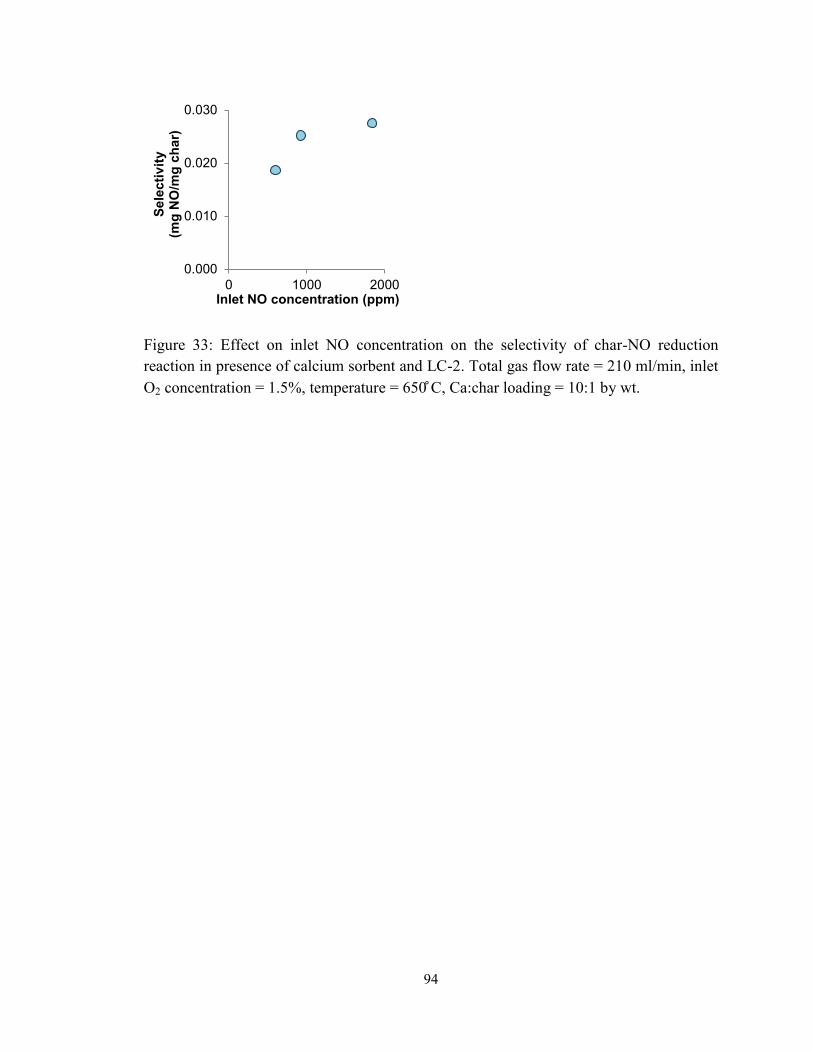
94
Figure 33: Effect on inlet NO concentration on the selectivity of char-NO reduction
reaction in presence of calcium sorbent and LC-2. Total gas flow rate = 210 ml/min, inlet
O2 concentration = 1.5%, temperature = 650 ̊C, Ca:char loading = 10:1 by wt.
0.000
0.010
0.020
0.030
0 1000 2000
Sele
cti
vit
y
(mg
NO
/mg
ch
ar)
Inlet NO concentration (ppm)
95
4.3.5 Simultaneous capture of NO, SO2, and CO2
So far, the focus of this study has been the effect of several parameters on the NO-char
reduction reaction, owing to a multitude of research material that has already extensively
covered the topic of CO2 and SO2 removal using calcium sorbent. Previous experiments
carried out at OSU have successfully demonstrated >90% CO2 removal and 100% SO2
removal using Ca(OH)2 sorbent, in the demonstration of the CCR process.22
The scope of
the present study was therefore limited to ascertaining the suitability of the CCR process
conditions for the reduction of NO by using inexpensive carbonaceous material such as
char in conjunction with the calcium sorbent. Nevertheless, the simultaneous removal of
all the species under consideration was also investigated, and the results are shown in
Figure 34. The duration of this test was 60 minutes, inlet gas stream contained 1800 ppm
NO, 3050 ppm SO2, 13% CO2, 1.5% O2, and the balance was N2. The temperature of the
reactor was maintained at 650 ̊C. The Ca:char loading was set at 10. The reactor was
heated to the reaction temperature by the electric furnace, while passing a stream of N2.
It was observed that outlet CO2 was maintained below 10% of the inlet value for a little
over the first half of the experiment, after which it gradually increased and reached its
inlet value by the end of the experiment. The pre-breakthrough period of the NO
concentration curve lasted longer (~40 minutes), after which the char was completely
consumed with unreacted NO evolving from the reactor, indicated by the gradual rise in
outlet NO concentration in the latter half of the experiment. Finally, the SO2 was
observed to react completely for the entire duration of the experiment, with the outlet
concentrations at near zero values. Since SO2 can also react with the reaction product of
96
CaO and CO2, i.e. CaCO3, complete SO2 removal is possible well after the CaO reactant
bed is exhausted by CO2 capture.
Figure 34: The simultaneous removal of NO, SO2 and CO2 from a simulated gas mixture,
in presence of calcium sorbent and lignite coal char LC-2. Inlet CO2 concentration =
13%, Inlet NO = 1800 ppm, Inlet SO2 = 3050 ppm, Inlet O2 = 1.5%, Ca:char loading =
10:1 by wt. Temperature = 650 ̊C.
0
2
4
6
8
10
12
14
16
0
500
1000
1500
2000
2500
3000
0 20 40 60
CO
2 c
on
cen
trati
on
(%
)
Ou
tlet
NO
, S
O2 c
on
cen
trati
on
(p
pm
)
Time (min)
NO out (ppm)
SO2 out (ppm)
CO2 out (%)
CO2 inlet
NO inlet
SO2 inlet
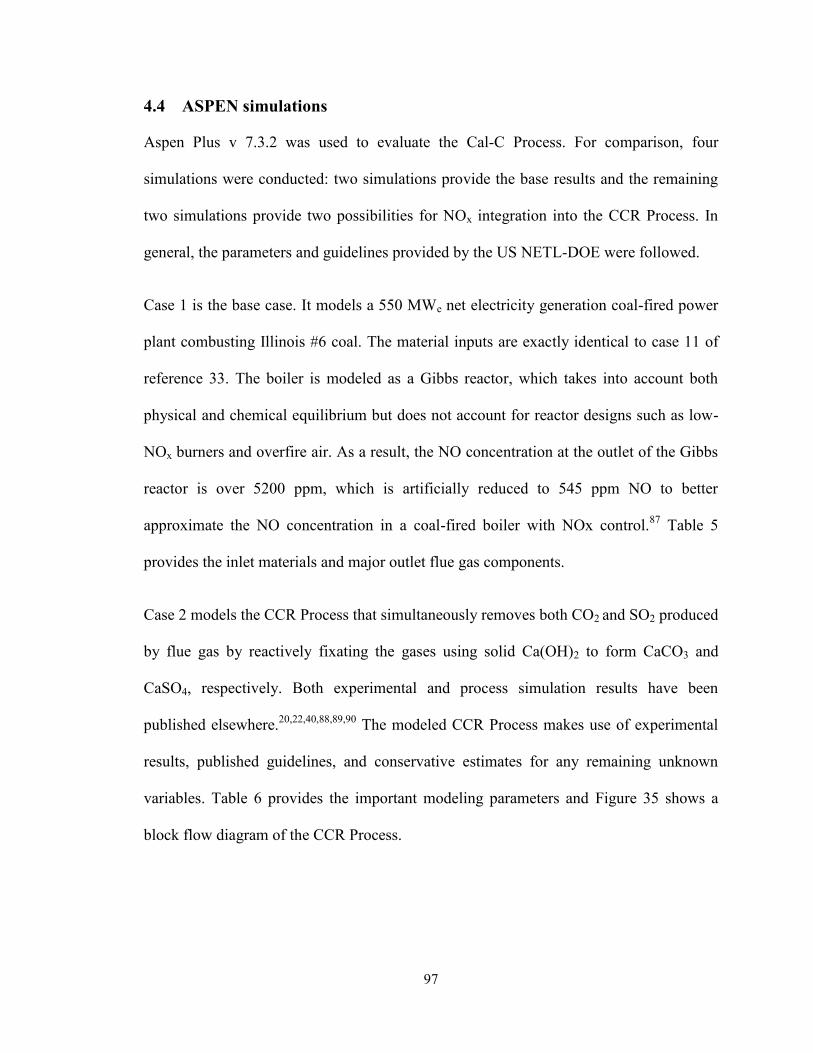
97
4.4 ASPEN simulations
Aspen Plus v 7.3.2 was used to evaluate the Cal-C Process. For comparison, four
simulations were conducted: two simulations provide the base results and the remaining
two simulations provide two possibilities for NOx integration into the CCR Process. In
general, the parameters and guidelines provided by the US NETL-DOE were followed.
Case 1 is the base case. It models a 550 MWe net electricity generation coal-fired power
plant combusting Illinois #6 coal. The material inputs are exactly identical to case 11 of
reference 33. The boiler is modeled as a Gibbs reactor, which takes into account both
physical and chemical equilibrium but does not account for reactor designs such as low-
NOx burners and overfire air. As a result, the NO concentration at the outlet of the Gibbs
reactor is over 5200 ppm, which is artificially reduced to 545 ppm NO to better
approximate the NO concentration in a coal-fired boiler with NOx control.87
Table 5
provides the inlet materials and major outlet flue gas components.
Case 2 models the CCR Process that simultaneously removes both CO2 and SO2 produced
by flue gas by reactively fixating the gases using solid Ca(OH)2 to form CaCO3 and
CaSO4, respectively. Both experimental and process simulation results have been
published elsewhere.20,22,40,88,89,90
The modeled CCR Process makes use of experimental
results, published guidelines, and conservative estimates for any remaining unknown
variables. Table 6 provides the important modeling parameters and Figure 35 shows a
block flow diagram of the CCR Process.
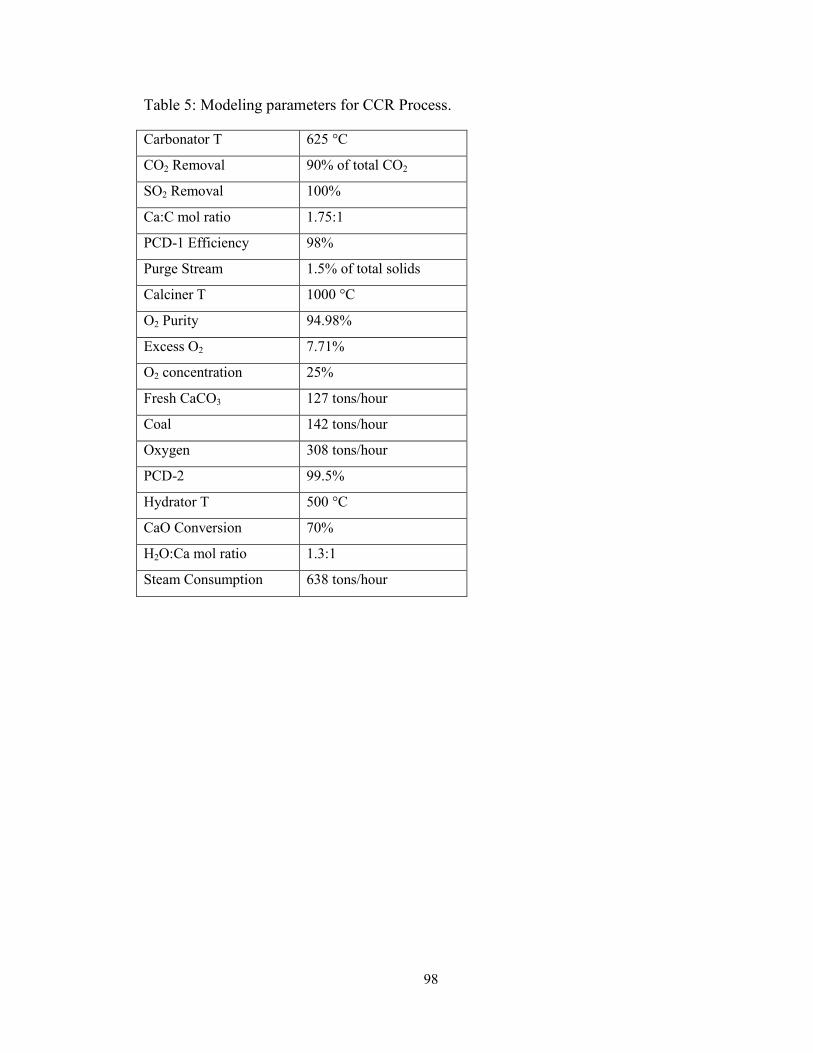
98
Table 5: Modeling parameters for CCR Process.
Carbonator T 625 °C
CO2 Removal 90% of total CO2
SO2 Removal 100%
Ca:C mol ratio 1.75:1
PCD-1 Efficiency 98%
Purge Stream 1.5% of total solids
Calciner T 1000 °C
O2 Purity 94.98%
Excess O2 7.71%
O2 concentration 25%
Fresh CaCO3 127 tons/hour
Coal 142 tons/hour
Oxygen 308 tons/hour
PCD-2 99.5%
Hydrator T 500 °C
CaO Conversion 70%
H2O:Ca mol ratio 1.3:1
Steam Consumption 638 tons/hour
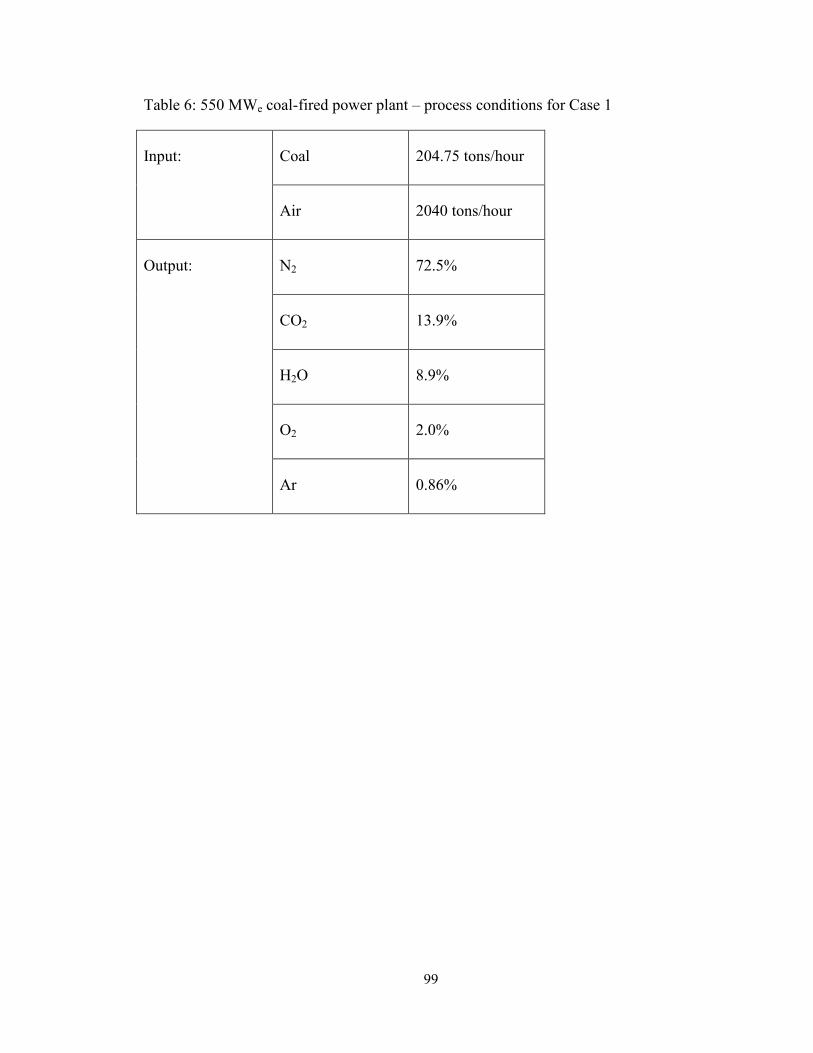
99
Table 6: 550 MWe coal-fired power plant – process conditions for Case 1
Input: Coal 204.75 tons/hour
Air 2040 tons/hour
Output: N2 72.5%
CO2 13.9%
H2O 8.9%
O2 2.0%
Ar 0.86%
100
Table 7: Modeling parameters for NO removal for the Cal-C process
Reactor T = (Carbonator T) 625 °C
NO removal 90%
Char Carbon (solid)
Reaction Route C + 2 NO → CO2 + N2
Case 3: Excess char combustion in calciner
Case 4: Excess char combustion in Cal-C reactor
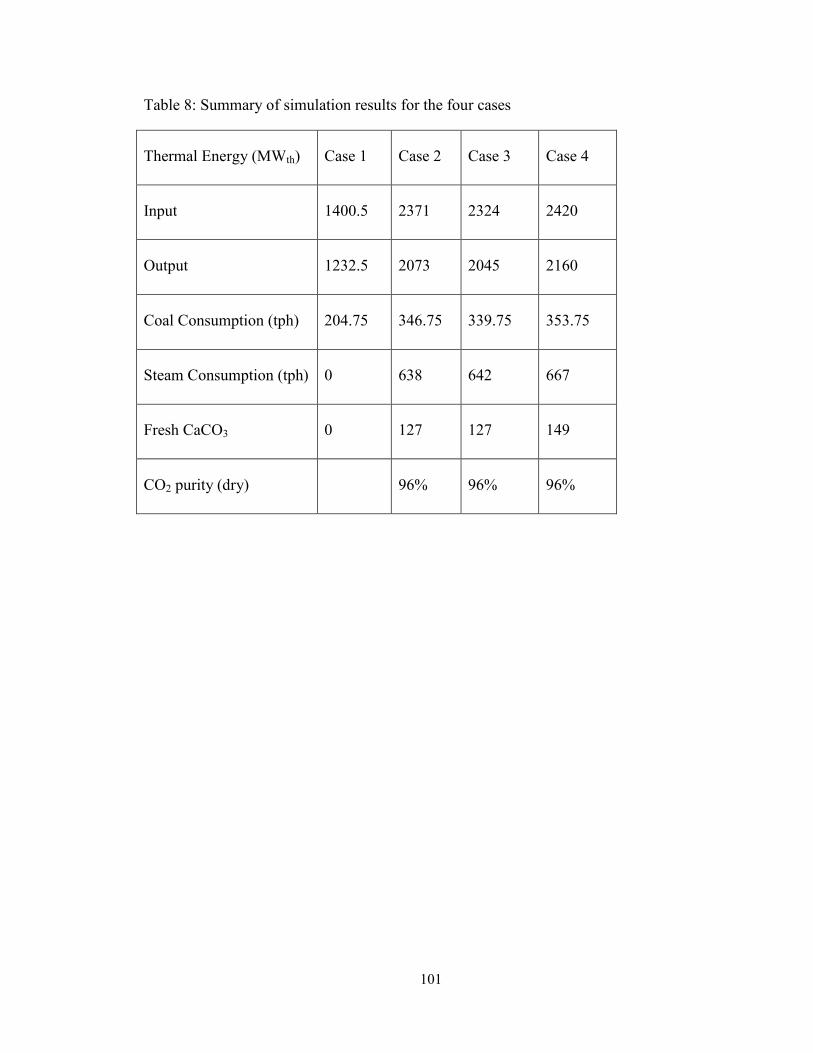
101
Table 8: Summary of simulation results for the four cases
Thermal Energy (MWth) Case 1 Case 2 Case 3 Case 4
Input 1400.5 2371 2324 2420
Output 1232.5 2073 2045 2160
Coal Consumption (tph) 204.75 346.75 339.75 353.75
Steam Consumption (tph) 0 638 642 667
Fresh CaCO3 0 127 127 149
CO2 purity (dry) 96% 96% 96%
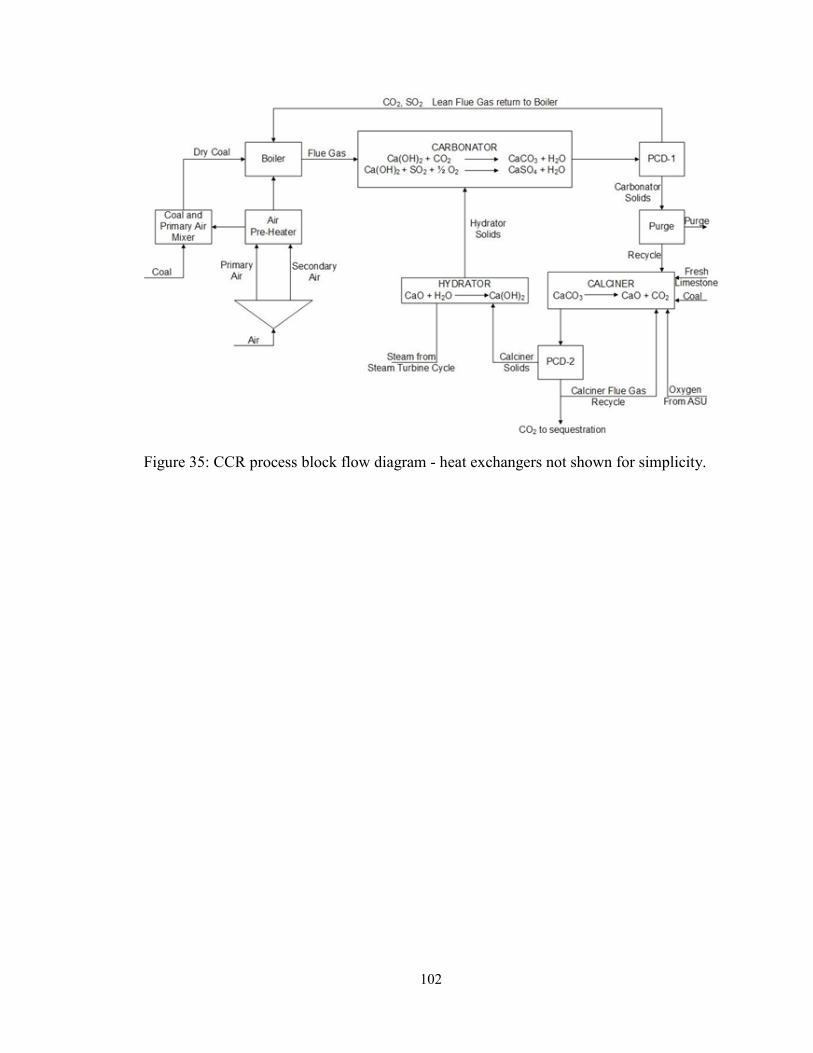
102
Figure 35: CCR process block flow diagram - heat exchangers not shown for simplicity.
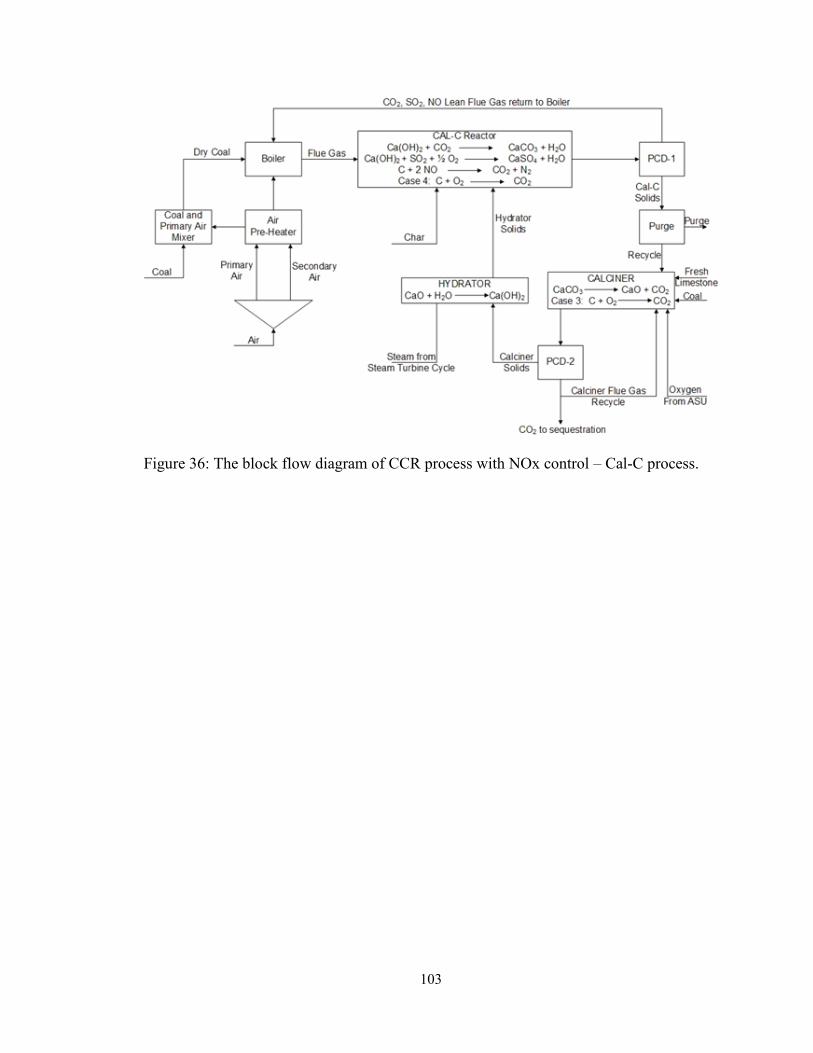
103
Figure 36: The block flow diagram of CCR process with NOx control – Cal-C process.
104
Cases 3 and 4 consider NOx removal occurring with the CCR Process, i.e. the Cal-C
process. This is achieved through char injection into the Cal-C reactor (Carbonator).
Although char can react with NOx through more than one reaction routes, only the
reaction producing CO2 during NO destruction is considered, since formation of other
species such as CO will not have any implication on the calcium sorbent. Another
potential side reaction occurs with the char combusting with the O2 in the flue gas to form
CO2. Maximum CO2 production from the NOx removal process occurs when the char
reacts with NO to form N2 and CO2 and the char completely combusts with the O2 in the
Cal-C reactor. While complete char combustion is thermodynamically favorable, the
possibility exists that it may not due to kinetic limitations, given the short residence time
in the entrained bed Cal-C reactor and 625°C reactor temperature. Case 3 considers 90%
NO reduction with char without char combustion while Case 4 is identical to Case 3
except considering complete char combustion in the Cal-C reactor. Table 7 provides the
additional modeling parameters necessary to complete the NOx removal process and
Figure 36 shows the block diagram of the simulation.
From an energetics view, the CCR Process is a favorable method for carbon capture from
coal-fired power plants. It also has the distinct advantage of removal of additional acid
gases and maintaining the electric output of the process. Additional process
intensification can occur by including a NOx removal step with the CCR Process. In one
reactor, it is possible to achieve DOE target goals for carbon capture, remove additional
unwanted acid gases, and also remove NO to below current environmental limits. Table 8
provides a summary of key results.
105
4.5 Conclusion
The Calcium-Char (Cal-C) process has been described for the single-stage removal of
NOx, SOx and CO2 from combustion flue gases from point sources and has been verified
at laboratory-scale. Specifically, the NO-char reduction reaction has been studied in some
detail and at process conditions suitable for CO2 and SO2 capture using a calcium
sorbent. It is found that the presence of the calcium sorbent enhances the NO reduction
reaction, evidenced by the breakthrough curves obtained in the presence and absence of
CaO. The well-known phenomenon of CaO catalyzing the char-NO reaction is observed
by the simple physical mixing of the two solids employed here. Near complete reduction
of NO over lignite chars is obtained at temperatures suitable for CO2 and SO2 removal
using CaO. The O2 present in the flue gas is known to improve the extent of NO
reduction. However, the higher concentration of O2 over NO, and the higher reaction rate
between char and O2, results in parasitic consumption of char via combustion. The
selectivity of char for the NO reduction is therefore higher at lower concentrations of O2.
This selectivity is also found to be higher at higher NO concentrations, making this
process highly suitable for applications with low O2 and high NO emissions. The process
simulation results corroborate the experimental findings and additionally highlight the
opportunity for significant heat recovery in the two cases considered. In the case of char
combustion in the calciner, the coal requirement of the calciner is reduced due to the heat
produced by excess char combustion. In the case of char combustion in the Cal-C reactor,
the exothermicity of char combustion enables lower inlet flue gas temperature, resulting
in greater heat recovery in the steam turbine cycle prior to the Cal-C reactor. The Cal-C
process uses bulk consumable raw materials such as coal char and limestone; and the

106
exothermic high-temperature reactions involved offer the opportunity for efficient heat
recovery, offsetting some of the energy penalty for the removal of these species, and
making the Cal-C process economically attractive.
107
CHAPTER 5: Calcium Looping Process for Coal-to-H2 Production:
Fate of Sulfur
5.1 Introduction
The three stage Calcium Looping Process (CLP) has been proposed for the production of
high purity hydrogen (H2) from syngas derived from coal and methane (CH4).91,92
The
process primarily consists of three reactors, much like the post-combustion calcium
looping CO2 capture process. The schematic of the process is given in Figure 37.
In a conventional coal-to-H2 process, coal is gasified to produce syngas, which is the
mixture of carbon monoxide (CO) and H2. This syngas is subjected to the water gas shift
(WGS) reaction in presence of steam (H2O) to produce carbon dioxide (CO2) and more
H2 in presence of high and low temperature WGS catalysts. A large amount of excess
steam is used to overcome the equilibrium limitation of the WGS reaction. The acid gas
removal is necessitated due to the formation of considerable amount of CO2 in this setup.
Additional steps of purification such as pressure swing adsorption (PSA) are also
required downstream to enhance the purity of the H2 thus produced.
In the three step CLP shown in Figure 37, in the carbonator reactor the calcium oxide
(CaO) sorbent is generated from the decomposition of calcium hydroxide (Ca(OH)2).
This CaO then reacts with CO2 generated from the WGS reaction, by fixing it in solid
108
calcium carbonate (CaCO3) format and thereby pushing the equilibrium limited WGS
reaction towards the right hand side. The use of solid sorbent reduces the excess steam
requirement of the process, with the decomposition of Ca(OH)2 sufficiently supplying all
the steam necessary to carry out the WGS reaction. The carbonator operates at ~600-
650°C.
The spent sorbent, in the form of CaCO3, is then transported to the calciner reactor, which
operates at ~900°C. In this reactor, the CaO sorbent is regenerated by the endothermic
decomposition of CaCO3. This high temperature regeneration step, however, causes
deactivation of the sorbent through sintering. Therefore, the sorbent is ‘reactivated’
through steam hydration in a separate reactor, termed as the hydrator, at ~500°C. The
Ca(OH)2 thus formed is recirculated to the carbonator. The reactions are shown below.
Carbonator:
Ca(OH)2 → CaO + H2O Rxn 9
CO + H2O → CO2 + H2 Rxn 10
CaO + CO2 → CaCO3 Rxn 2
Calciner:
CaCO3 → CaO + CO2 Rxn 3
109
Hydrator:
CaO + H2O(g) → Ca(OH)2 Rxn 1
In addition to these main reactions (9), (10) and (2) from the carbonator reactor, the CaO
sorbent also results in the removal of additional pollutants such as gaseous sulfur and
halides.
Sulfur removal:
CaO + H2S → CaS + H2O Rxn 11
CaO + COS → CaS + CO2 Rxn 12
Halide removal:
CaO + 2HCl → CaCl2 + H2O Rxn 13
The use of the three step CLP system therefore results in process intensification through
multipollutant removal. Therefore, several process units such as syngas scrubber, high
and low temperature WGS reactors, two-stage Selexol unit, can all be replaced by the
single CLP system to produce high purity H2.93
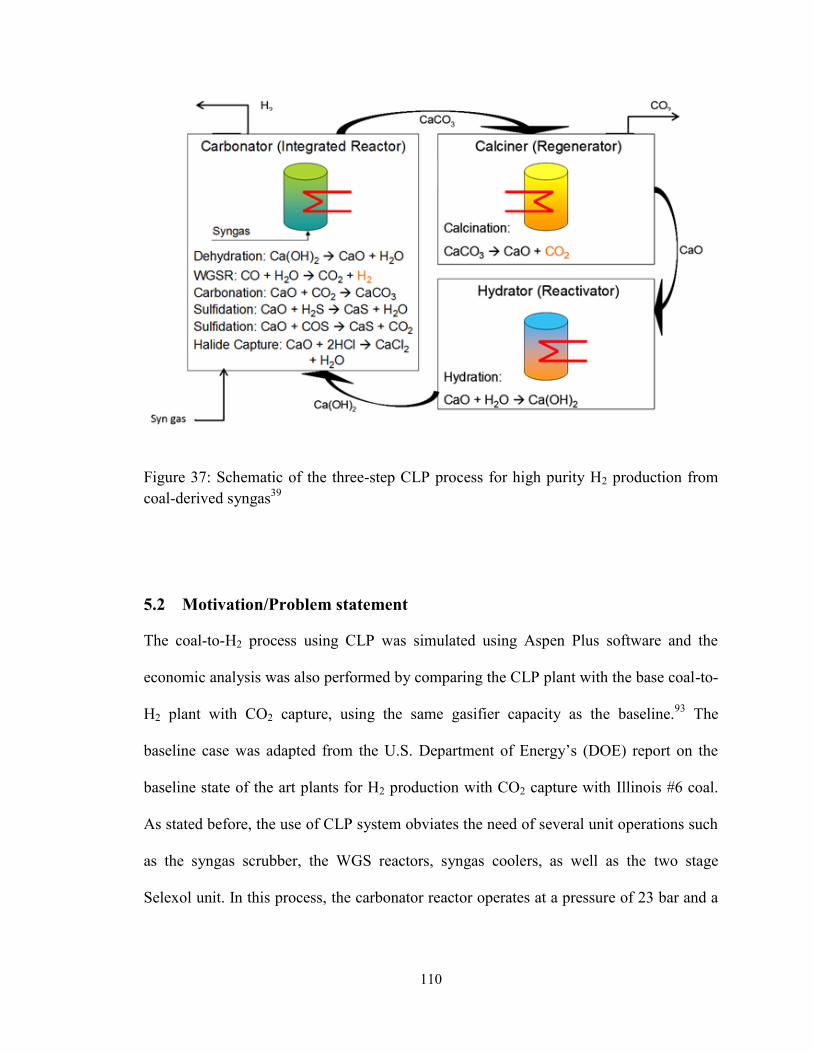
110
Figure 37: Schematic of the three-step CLP process for high purity H2 production from
coal-derived syngas39
5.2 Motivation/Problem statement
The coal-to-H2 process using CLP was simulated using Aspen Plus software and the
economic analysis was also performed by comparing the CLP plant with the base coal-to-
H2 plant with CO2 capture, using the same gasifier capacity as the baseline.93
The
baseline case was adapted from the U.S. Department of Energy’s (DOE) report on the
baseline state of the art plants for H2 production with CO2 capture with Illinois #6 coal.
As stated before, the use of CLP system obviates the need of several unit operations such
as the syngas scrubber, the WGS reactors, syngas coolers, as well as the two stage
Selexol unit. In this process, the carbonator reactor operates at a pressure of 23 bar and a
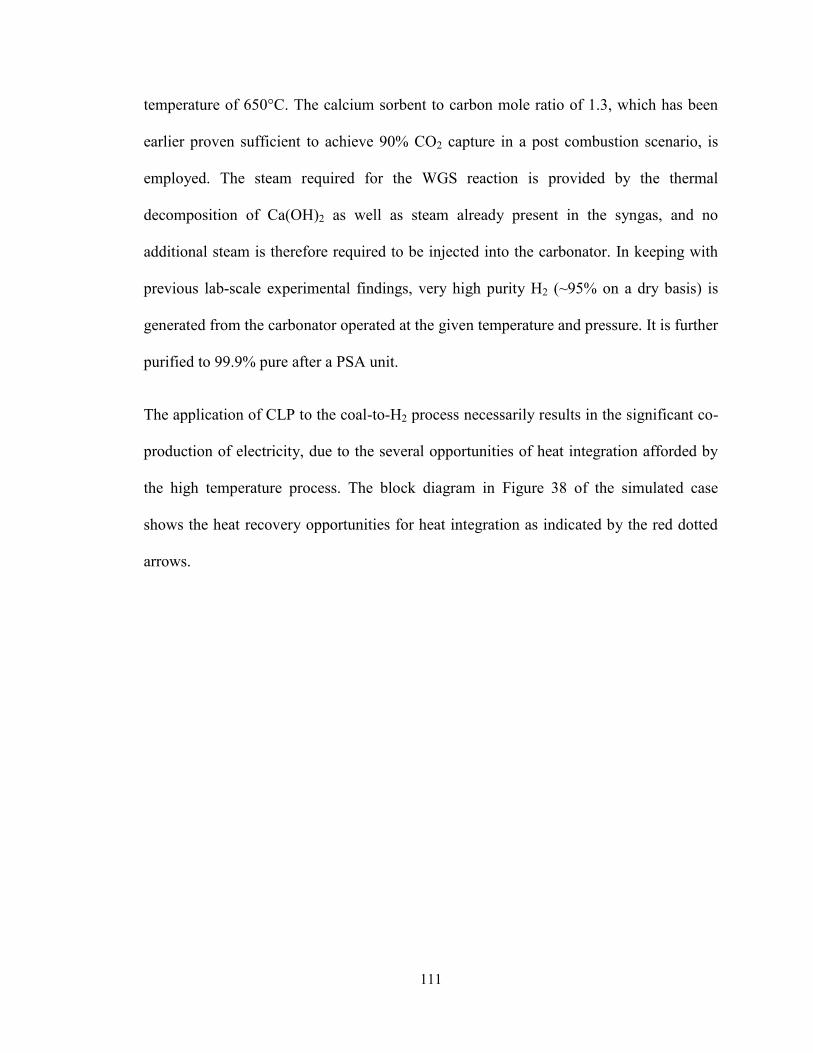
111
temperature of 650°C. The calcium sorbent to carbon mole ratio of 1.3, which has been
earlier proven sufficient to achieve 90% CO2 capture in a post combustion scenario, is
employed. The steam required for the WGS reaction is provided by the thermal
decomposition of Ca(OH)2 as well as steam already present in the syngas, and no
additional steam is therefore required to be injected into the carbonator. In keeping with
previous lab-scale experimental findings, very high purity H2 (~95% on a dry basis) is
generated from the carbonator operated at the given temperature and pressure. It is further
purified to 99.9% pure after a PSA unit.
The application of CLP to the coal-to-H2 process necessarily results in the significant co-
production of electricity, due to the several opportunities of heat integration afforded by
the high temperature process. The block diagram in Figure 38 of the simulated case
shows the heat recovery opportunities for heat integration as indicated by the red dotted
arrows.
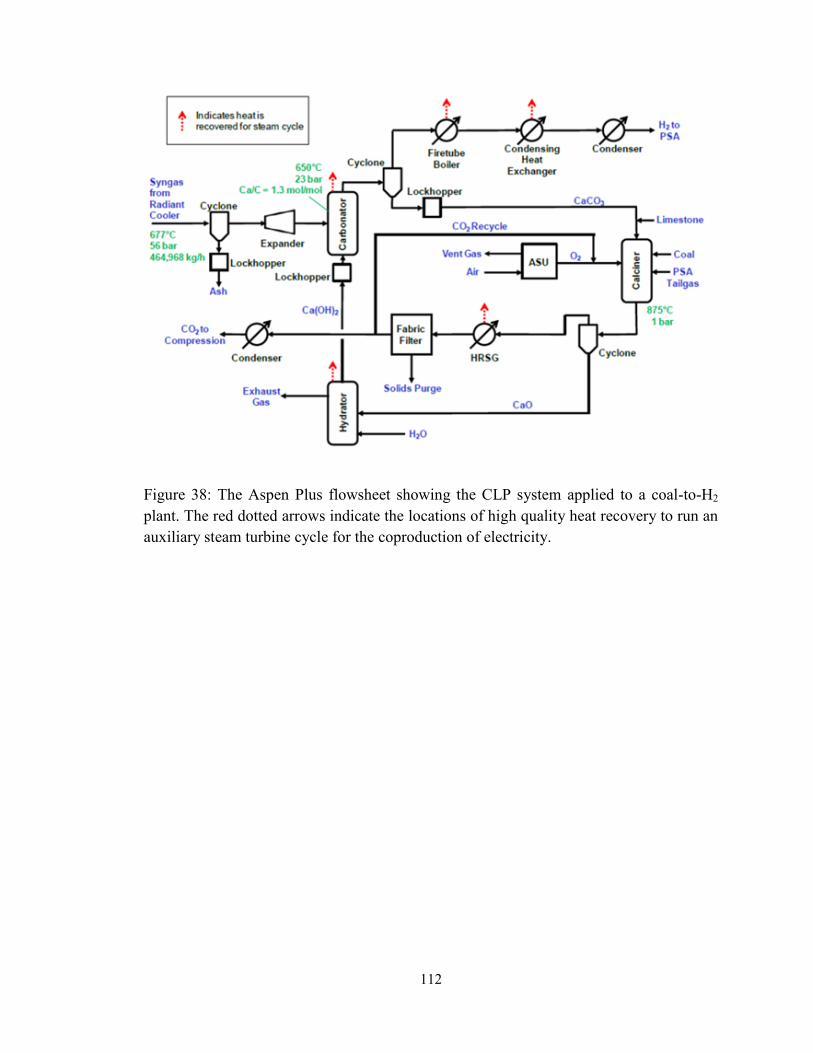
112
Figure 38: The Aspen Plus flowsheet showing the CLP system applied to a coal-to-H2
plant. The red dotted arrows indicate the locations of high quality heat recovery to run an
auxiliary steam turbine cycle for the coproduction of electricity.
113
The CLP plant requires substantially more fuel (coal) than the base plant, due to the high
temperature exothermic reaction of calcination, but it also automatically provides
substantially towards a significant co-production of electricity through heat recovery
steam generation. While the base case 26 tph H2 power plant generates 7.2 MWe of net
electric power, the CLP system applied to the identical coal-to-H2 process results in the
generation of 320 MWe of net electric power, according to the process analysis
conducted by CONSOL Energy.93
One of the uncertainties pointed out at the time of this techno-economic analysis was that
of fate of sulfur. The sulfur that is removed from the syngas stream in the carbonator is
fixed in the form of calcium sulfide (CaS). This CaS may undergo additional oxidation
reactions at the calciner operating conditions. The sulfur enters the calciner via two
routes, 1) in the form of CaS solids, and 2) in the form of sulfur dioxide (SO2) from the
coal combustion. This CaS can undergo several reactions with the oxidizing agents in the
calciner such as oxygen (O2), CO2, H2O and result in the formation of calcium sulfate
(CaSO4).
CaS + 4CO2 → CaSO4 + 4CO Rxn 14
CaS + 2O2 → CaSO4 Rxn 15
CaS + 4H2O → CaSO4 + 4H2 Rxn 16
The CaSO4 thus formed will circulate back to the carbonator with the active solids stream
and may react with H2 or CO component of the syngas and reduce the H2 yield of the
process by parasitically consuming the gases.
114
CaSO4 + 4CO → CaS + 4CO2 Rxn 17
CaSO4 + 4H2 → CaS + 4H2O Rxn 18
Alternatively, the CaSO4 formed in the calciner may also participate in a solid-solid
reaction with CaS and thus produce CaO and release SO2.
CaS + CaSO4 → 2CaO + 2SO2 Rxn 19
Thermodynamically, all these reactions (14), (15), (16), and (19) are feasible at the
calciner operating conditions.
From the standpoint of the techno-economic evaluation, the release of sulfur in the
gaseous phase was desirable in the calciner in the form of gaseous SO2. There are twofold
reasons for this. One, the sulfur would then exit the loop via the CO2-rich gaseous stream,
where it would be treated with a dry CaO sorbent at lower temperature conditions.
Theoretically, if feasible, this would prevent buildup of the sulfurous species in the solid
sorbent loop. Two, and more importantly, if the sulfur remains fixed in the solid loop in
the form of CaSO4, there exists a possibility of it being to the detriment of the overall H2
yield of the carbonator, by parasitic consumption of CO and H2 at the carbonator
operating conditions via reactions (17) and (18).
The CaS remaining unreacted in the calciner is the least desirable outcome. This
unreacted CaS would then be present in the purge stream, which is located after the
calciner, and this would pose waste disposal issues.
115
With this background, the techno-economic analysis was performed with the process
design that assumed the release of sulfur in the form of gaseous SO2. The current work
was therefore proposed as experimental substantiation/rebuttal of this design.
5.3 Background and literature review
The different routes of oxidation of CaS have been subject of a plethora of research for
specific application in PFBC-CC (Pressurized Fluidized Bed Combustion-Combined
Cycle) and IGCC (Integrated Gasification Combined Cycle). In both processes, the sulfur
in the coal is released and is mainly converted to hydrogen sulfide (H2S). Addition of
calcium sorbents like dolomite and limestone is a popular way of capturing H2S, but this
generates large quantities of hazardous CaS. Hence researchers have suggested the
oxidation of CaS by O2, CO2 and H2O as a means to safely dispose the waste. Oxidation
of CaS mainly produces CaSO4 which is benign and stable at ambient conditions.
Qiu et.al. have previously investigated reaction 10 at 500-1000 °C with 1-40% O2 in N2.94
They reported the formation of both CaSO4 and CaO via reaction 10 and 15, respectively.
The kinetic data in that study revealed reaction 10 to be a first order reaction with respect
to O2. Song et.al. reported that the molar contents of CaSO4 and CaO increased with
temperature substantially and CaS content decreases accordingly, between 700-900°C.95
The oxidation of CaS by reaction with CO2 and H2O was studied by Anthony et.al.96
They concluded that CO2 is the more important oxidant as compared to H2O. According
to results of Marbán et. al.97
, reaction 11 is the prominent reaction below <890°C, and
this temperature is identified as the upper limit for suitability of CaS conversion to
CaSO4. In these studies, the aim was to ‘destroy’ CaS and the formation of CaSO4 was
116
favored because of ease of disposal. Though prior work performed by other researchers
provides a strong indication that reactions 14-12, and 19 will occur in the calciner, the
existing data does not allow us to predict the extents of these reactions in the residence
time of interest. The CLP-calciner is expected to operate at a solids residence time which
is of the order of seconds. Hence, the goal of the work is to establish if these reactions
occur to a significant extent in such a short time, or if they are insignificant enough to be
neglected. Finally, the competitive kinetics of CaS oxidation in the presence of different
oxidants also needs to be investigated to draw accurate conclusions.
The reductive decomposition of CaSO4 by CO was investigated by Wheelock and Boylan
at temperatures above 1100 °C.98
Their findings indicated that at higher temperatures, the
formation of CaO was favored over CaS. Diaz-Bossio et.al. investigated the same using
both CO and H2 between 900-1180°C and found the reactions to be of first order with
respect to CO and H2.99
Thus, the reductive decomposition of CaSO4 has been
extensively investigated, however, at much higher temperatures than the 550-700°C
range expected in the CLP carbonator. In general, the gas compositions, particle sizes and
composition, temperature and pressure range of investigation in the proposed work were
quite different from the existing literature. Therefore, in spite of a large body of work
already existing on the solid compounds of interest involved in the sulfur chemistry in the
CLP system, a substantial knowledge gap from the standpoint of CLP conditions existed
at the time that this work was undertaken. Thus, the present work was conducted to study
the kinetics of reactions of the various calcium-sulfur species (reactions 14 to 19) as
applicable to the CLP system.
117
5.4 Conditions tested
The calciner equilibrium concentrations are given in the following Table 9. These gas
concentrations have been obtained from the Aspen Plus simulations performed on the
three cases of H2 production with CLP system. For the present work, only the
concentrations from the first column were selected (highlighted). In the ASPEN
simulations, the calciner operates at 875°C and 1 atm.
Laboratory grade CaSO4 and CaS samples were used for the experiments conducted. Pure
gas bottles were used to create the appropriate gas concentrations using a battery of mass
flow controllers for simulating the carbonator and calciner operating conditions, as
explained further in section 5.4.2. The
Table 10 shows the carbonator concentrations on dry basis derived from Aspen Plus
simulations.
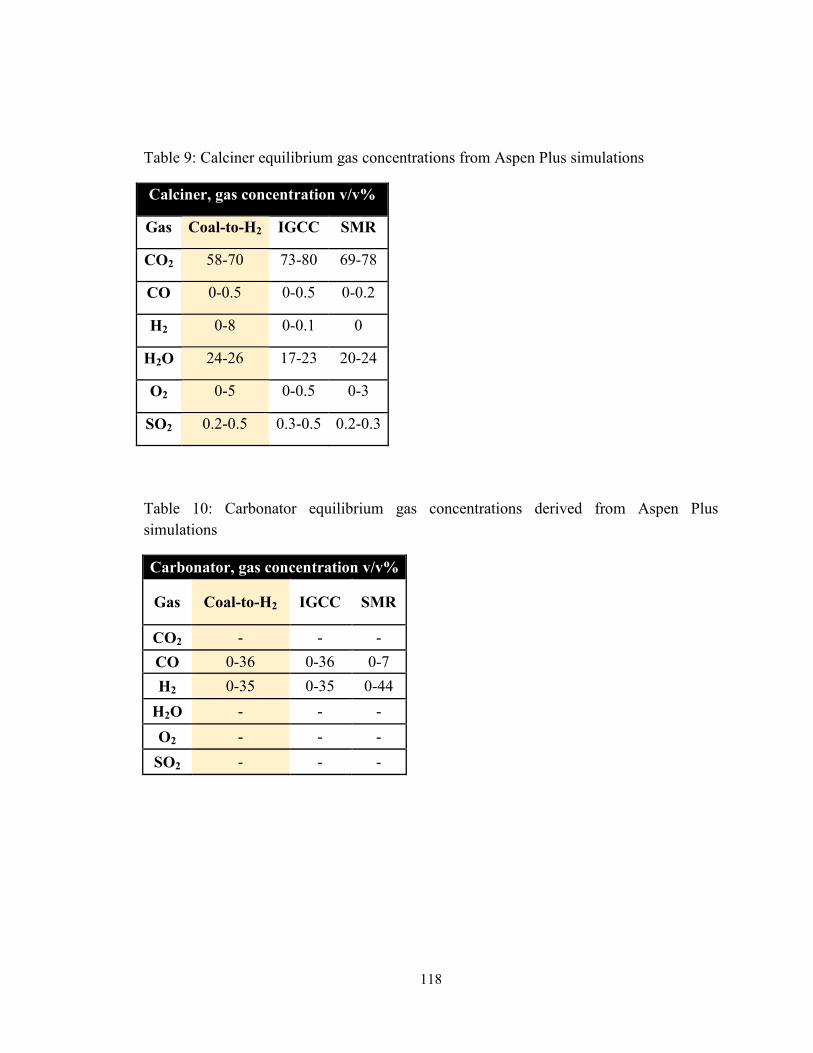
118
Table 9: Calciner equilibrium gas concentrations from Aspen Plus simulations
Calciner, gas concentration v/v%
Gas Coal-to-H2 IGCC SMR
CO2 58-70 73-80 69-78
CO 0-0.5 0-0.5 0-0.2
H2 0-8 0-0.1 0
H2O 24-26 17-23 20-24
O2 0-5 0-0.5 0-3
SO2 0.2-0.5 0.3-0.5 0.2-0.3
Table 10: Carbonator equilibrium gas concentrations derived from Aspen Plus
simulations
Carbonator, gas concentration v/v%
Gas Coal-to-H2 IGCC SMR
CO2 - - -
CO 0-36 0-36 0-7
H2 0-35 0-35 0-44
H2O - - -
O2 - - -
SO2 - - -
119
5.4.1 Materials
Calcium sulfide (CaS, 99% purity, <1% Mg) was obtained from Fisher Scientific. Pure
CO2, N2, and air gases were used to create gas mixtures of required concentrations.
Various temperatures within the range of 800-950°C were chosen and CO2 concentrations
were chosen between 60-80% (total pressure = 1 atm). A total flowrate of 430 ml/min
was maintained and a sample size of 0.12-0.14 g was used for each experiment. H2O
concentrations of 17, 20 and 24% were used to match the calciner conditions, and 3
different temperatures of 875, 900 and 925°C were tested. For oxidation by O2,
concentrations of 1,3, and 5% were used according to Table 9. In addition, ppm quantities
of SO2 gas were introduced in the thermogravimetric (TGA) reactor to observe the
reaction kinetics of CaO conversion to CaSO4.
5.4.2 Experimental setup and procedure
Isothermal experiments were carried out in the Rubotherm thermogravimetric analyzer
(TGA) employing a magnetic suspension balance (MSB). This MSB equipped TGA
would be used for all future tests as it is capable of handling high pressure experiments
proposed in this work, which are not achievable using typical TGA apparatus. Also, due
to the unique weight measurement technique of this MSB, it is possible to carry out
experiments involving high concentrations of steam, a feature absent from traditional
TGAs. The schematic of the Rubotherm MSB is shown in Figure 39. A battery of mass
flow controllers (MFC) was used to control the flowrates of individual gases, in order to
simulate various required concentrations of reacting species. Valves 1 through 7 were
used to control flow towards reactor. The MSB is coupled to the sample weight through
120
magnetic coupling; therefore the balance chamber is decoupled from the sample cell and
does not require a separate purge gas. Thus, higher concentrations of reactant gases are
achievable in the sample cell. The gas mixture is heated prior to the inlet of the sample
cell by means of electrical heating tapes, resulting in gas temperatures of 250-300°C at
the sample cell inlet. The sample cell is maintained at reaction temperature by means of
electrical heaters. The section between the sample cell inlet and electrical heaters is
heated by a heated oil jacket connected to a circulating oil bath (Corning 550). The
temperature and pressure of the sample cell is measured by the thermocouple (TC) and a
pressure transducer respectively. The desired pressure in the system is achieved by the
help of a back pressure regulator (BPR) situated downstream of the sample cell. Steam
was generated by injecting metered water through a precision syringe pump (ISCO series
100DM). The water was injected into the heated gas inlet line, which was filled with
quartz wool to increase contact area between the heated gas and water, to convert it to
steam. For experiments with O2 reaction, the desired concentration was obtained by
mixing air and N2 in appropriate ratios. The carrier gas (usually N2) passing through this
preheater section aids the vaporization of this water and carries the produced steam to the
reactor (sample cell). Due to this method, it is not possible to maintain precise control
over the concentration of steam experienced by the sample. However, the total amount of
water injected is found to be sufficient to maintain a steam environment throughout the
course of 60-80 minutes duration of experiment. In addition, the outlet gases were
analyzed using a micro-GC (CP-4900, Varian) to identify the species present in the
gaseous product stream of certain experiments. In addition, the on-campus center for
121
microscopy and analysis (CEMAS) facility was used to carry out the XRD analysis
(Rigaku SmartLab XRD) of the solid product.
The sample weight and temperature was continuously recorded by a computer as the
reaction progressed. Conversion was estimated from the change in weight by assuming
that increase in weight is only caused by the reaction (10).
Molar conversion (X) of CaS into CaSO4 is calculated as:
𝑋 =𝑚𝑜𝑙𝑒𝑠 𝑜𝑓 𝐶𝑎𝑆 𝑟𝑒𝑎𝑐𝑡𝑒𝑑
𝑚𝑜𝑙𝑒𝑠 𝑜𝑓 𝐶𝑎𝑆 𝑝𝑟𝑒𝑠𝑒𝑛𝑡=
𝑀𝑊𝐶𝑎𝑆 ∗ ∆𝑊
(𝑀𝑊𝐶𝑎𝑆𝑂4 − 𝑀𝑊𝐶𝑎𝑆) ∗ 𝑊𝑖
Where,
MWm is the molecular weight of species ‘m’,
ΔW = Total increase in weight, mg
Wi = initial weight of CaS sample, mg
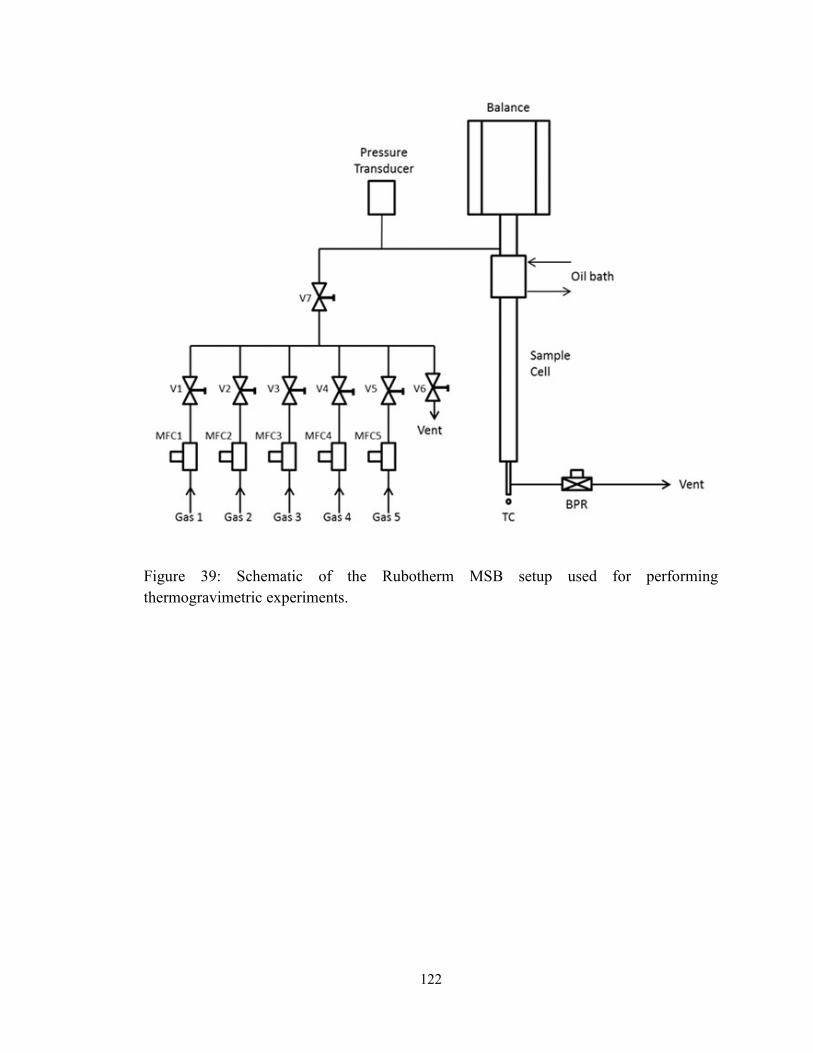
122
Figure 39: Schematic of the Rubotherm MSB setup used for performing
thermogravimetric experiments.
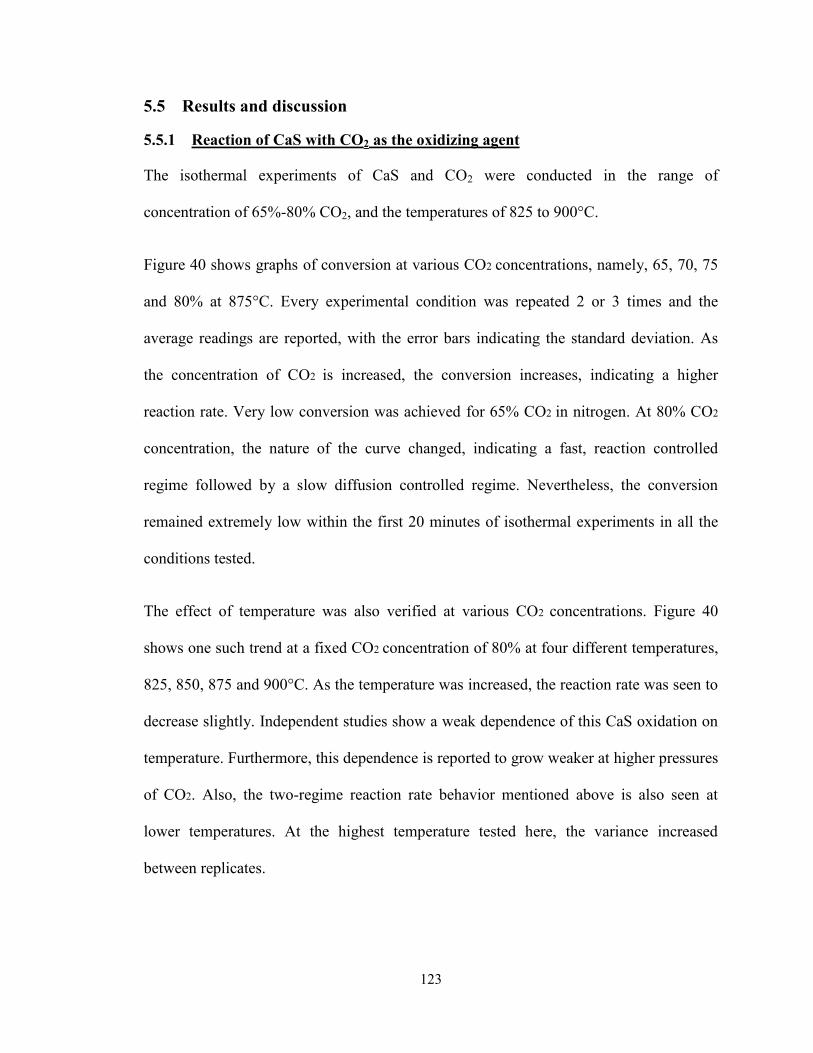
123
5.5 Results and discussion
5.5.1 Reaction of CaS with CO2 as the oxidizing agent
The isothermal experiments of CaS and CO2 were conducted in the range of
concentration of 65%-80% CO2, and the temperatures of 825 to 900°C.
Figure 40 shows graphs of conversion at various CO2 concentrations, namely, 65, 70, 75
and 80% at 875°C. Every experimental condition was repeated 2 or 3 times and the
average readings are reported, with the error bars indicating the standard deviation. As
the concentration of CO2 is increased, the conversion increases, indicating a higher
reaction rate. Very low conversion was achieved for 65% CO2 in nitrogen. At 80% CO2
concentration, the nature of the curve changed, indicating a fast, reaction controlled
regime followed by a slow diffusion controlled regime. Nevertheless, the conversion
remained extremely low within the first 20 minutes of isothermal experiments in all the
conditions tested.
The effect of temperature was also verified at various CO2 concentrations. Figure 40
shows one such trend at a fixed CO2 concentration of 80% at four different temperatures,
825, 850, 875 and 900°C. As the temperature was increased, the reaction rate was seen to
decrease slightly. Independent studies show a weak dependence of this CaS oxidation on
temperature. Furthermore, this dependence is reported to grow weaker at higher pressures
of CO2. Also, the two-regime reaction rate behavior mentioned above is also seen at
lower temperatures. At the highest temperature tested here, the variance increased
between replicates.
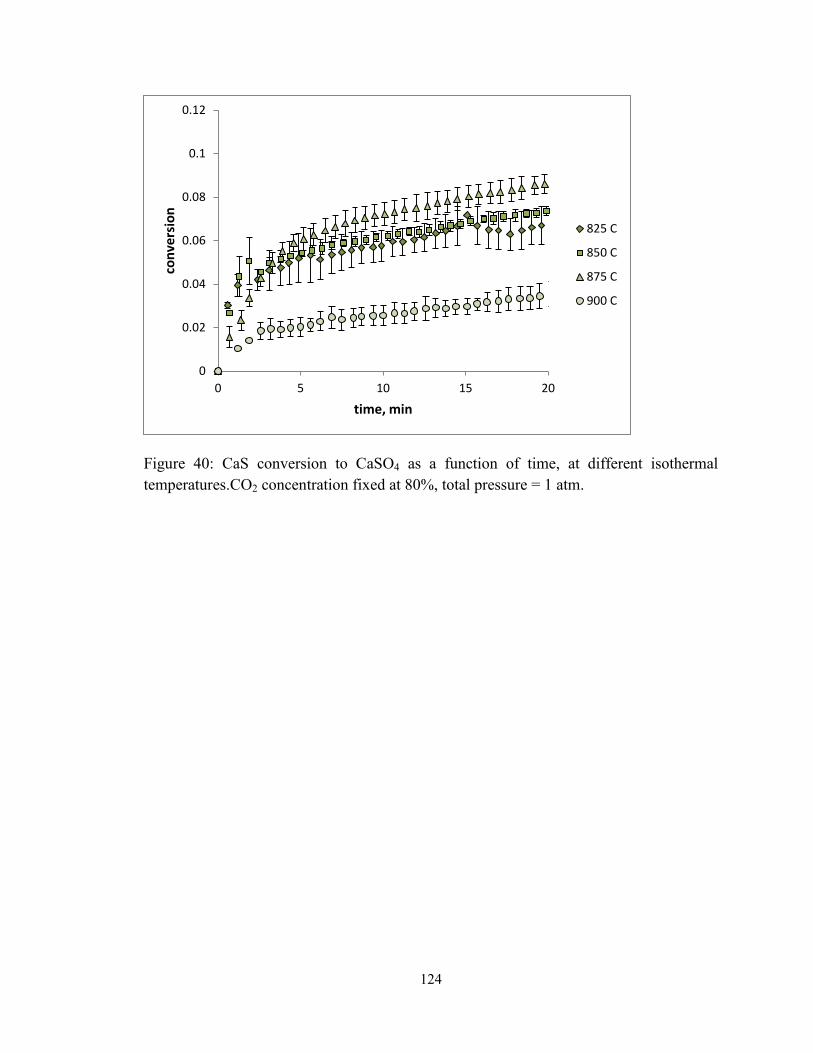
124
Figure 40: CaS conversion to CaSO4 as a function of time, at different isothermal
temperatures.CO2 concentration fixed at 80%, total pressure = 1 atm.
0
0.02
0.04
0.06
0.08
0.1
0.12
0 5 10 15 20
con
vers
ion
time, min
825 C
850 C
875 C
900 C
125
At all conditions tested, the CaS conversion to CaSO4 is very low, and never exceeded
10% over a period of 20 minutes of isothermal reaction. The product samples were stored
in airtight containers from tests conducted, and these samples were analyzed using XRD
techniques. Also, the spectra obtained were compared with that of the lab grade reactant
CaS sample. The product spectrum was not significantly different from the reactant, as
predicted by the very low conversions obtained in the TGA over the duration of each test.
Although not a quantifying technique, the areas of each peak were used to obtain
qualitative information about the relative amounts of various species present in the
product sample. It was evident that majority of the product was CaS (>90%). Other
species identified were CaCO3, CaO (trace) and CaSO4 (trace). Therefore it was
concluded that CaSO4 can react with CaS further in presence of CO2 to give CaCO3 if the
conditions are amenable to carbonation – however, it is not of consequence in the real
system, as temperatures of operation of the calciner will be maintained above the
maximum temperature of carbonation at given CO2 concentration levels.
5.5.2 Reaction of CaS with H2O as the oxidizing agent
Similar to CO2, full parametric tests were performed for the oxidation of CaS with H2O.
Very small weight changes were observed with the addition of steam at high
temperatures of calcination. The results are shown in Figure 41.
Following reaction is considered:
CaS + 4H2O → CaSO4 + 4H2 Rxn 16

126
CaS seems to be very mildly reactive towards steam at the calciner operating conditions.
At all concentrations and temperatures tested, the conversion did not rise above ~5% in
10 minutes. Also, in the narrow range of conditions tested, no significant change was
seen in the reactivity with temperature or partial pressure of steam.
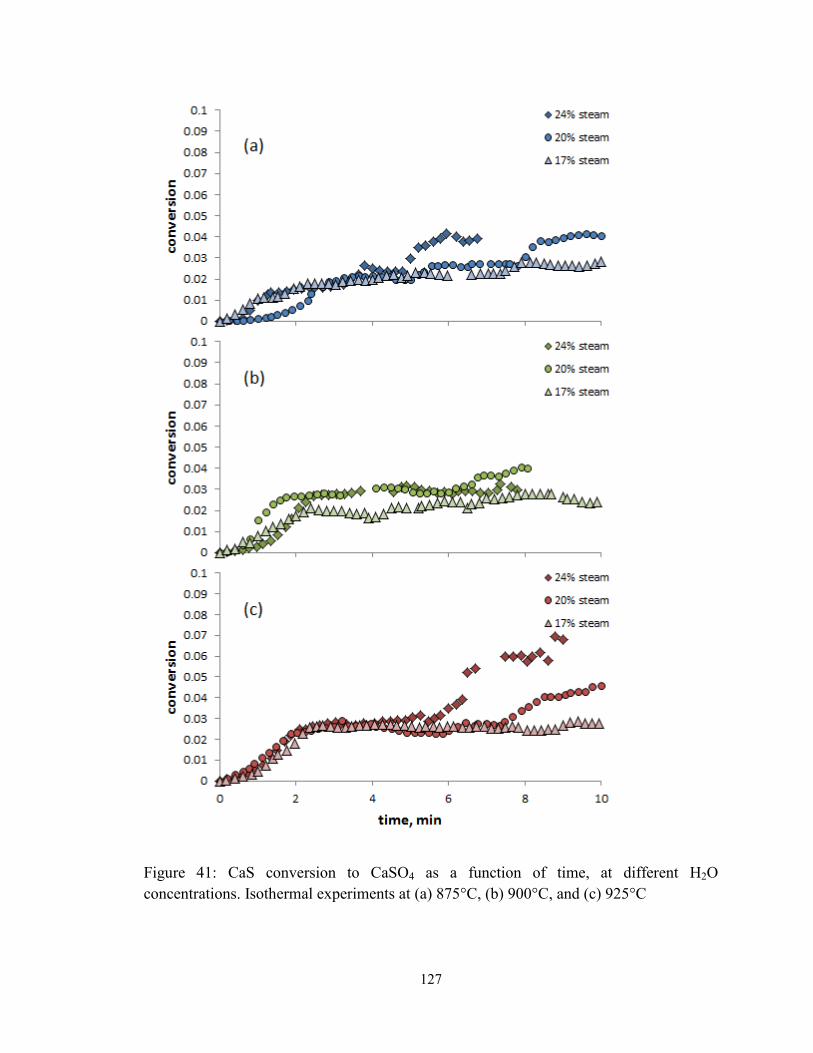
127
Figure 41: CaS conversion to CaSO4 as a function of time, at different H2O
concentrations. Isothermal experiments at (a) 875°C, (b) 900°C, and (c) 925°C
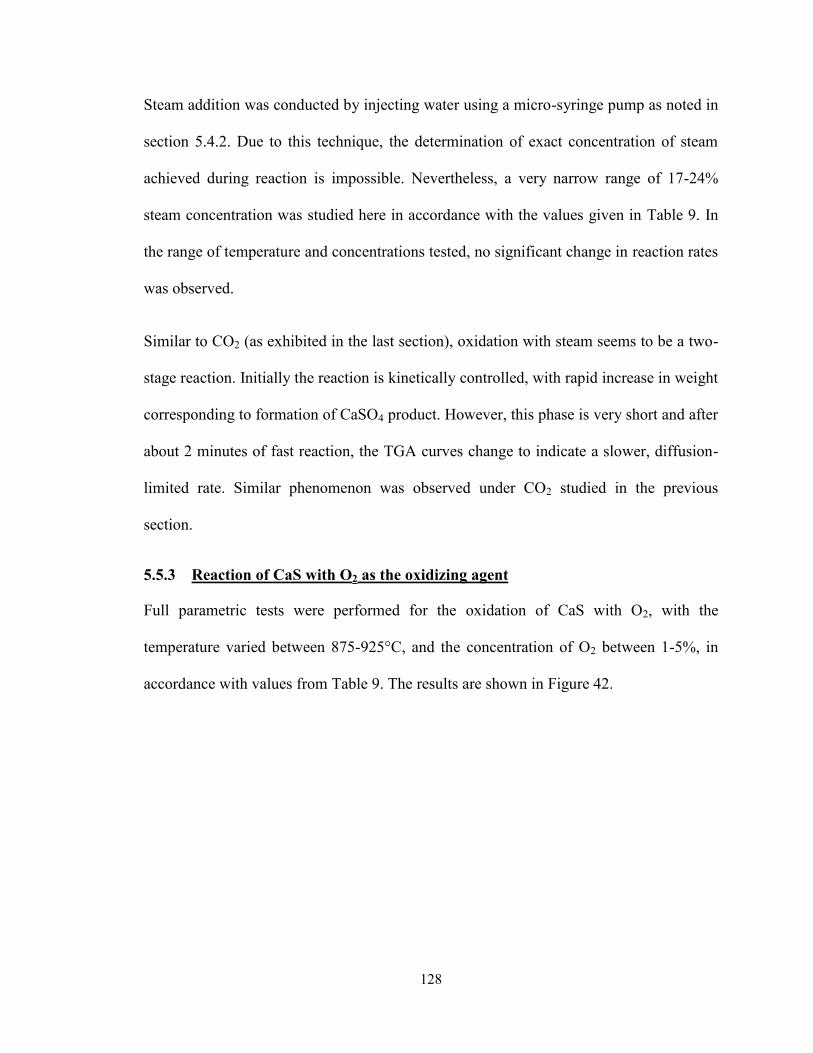
128
Steam addition was conducted by injecting water using a micro-syringe pump as noted in
section 5.4.2. Due to this technique, the determination of exact concentration of steam
achieved during reaction is impossible. Nevertheless, a very narrow range of 17-24%
steam concentration was studied here in accordance with the values given in Table 9. In
the range of temperature and concentrations tested, no significant change in reaction rates
was observed.
Similar to CO2 (as exhibited in the last section), oxidation with steam seems to be a two-
stage reaction. Initially the reaction is kinetically controlled, with rapid increase in weight
corresponding to formation of CaSO4 product. However, this phase is very short and after
about 2 minutes of fast reaction, the TGA curves change to indicate a slower, diffusion-
limited rate. Similar phenomenon was observed under CO2 studied in the previous
section.
5.5.3 Reaction of CaS with O2 as the oxidizing agent
Full parametric tests were performed for the oxidation of CaS with O2, with the
temperature varied between 875-925°C, and the concentration of O2 between 1-5%, in
accordance with values from Table 9. The results are shown in Figure 42.
129
Figure 42: Oxidation of CaS with oxygen at calciner operating conditions. Varying the O2
concentration at isothermal conditions, product is CaSO4 at (a) 875°C, (b) 900°C, and (c)
925°C
130
As expected, the reactivity of CaS increases with increase in O2 concentration at all
temperatures tested. However, as temperature is increased, any increase in the O2
concentration starts having a more pronounced increase in the CaS conversion or
reactivity. The highest reactivity is obtained at 925°C with 5% O2, which is the upper
boundary of O2 concentrations expected at the calciner conditions. Also, an interesting
phenomenon of two-step reaction is observed only at this reaction condition. This
indicates that a combination of high temperature and O2 concentration results in a fast
kinetic controlled reaction followed by product layer diffusion resistance.
To compare these rates with that obtained due to oxidation by steam and CO2, the three
oxidation curves at 900°C are given on the same plot in Figure 43. O2 is observed to be
far more effective in converting CaS to CaSO4 even at the low concentrations it is
expected to be present at in the calciner.
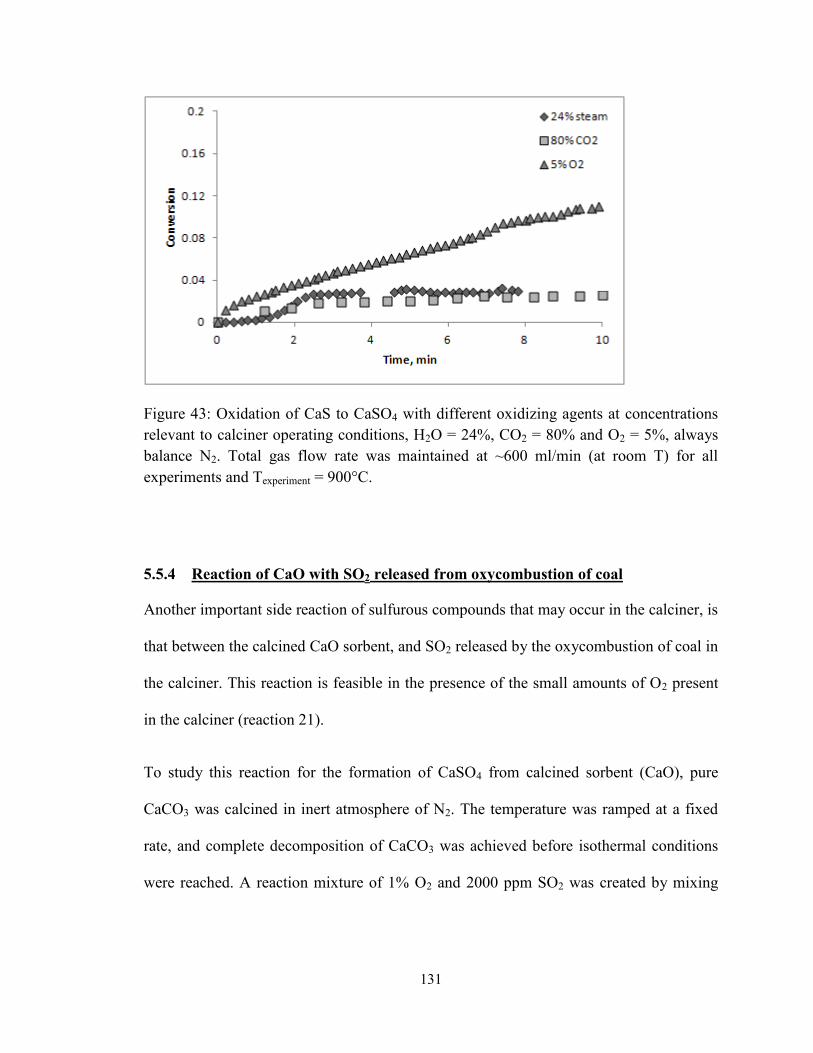
131
Figure 43: Oxidation of CaS to CaSO4 with different oxidizing agents at concentrations
relevant to calciner operating conditions, H2O = 24%, CO2 = 80% and O2 = 5%, always
balance N2. Total gas flow rate was maintained at ~600 ml/min (at room T) for all
experiments and Texperiment = 900°C.
5.5.4 Reaction of CaO with SO2 released from oxycombustion of coal
Another important side reaction of sulfurous compounds that may occur in the calciner, is
that between the calcined CaO sorbent, and SO2 released by the oxycombustion of coal in
the calciner. This reaction is feasible in the presence of the small amounts of O2 present
in the calciner (reaction 21).
To study this reaction for the formation of CaSO4 from calcined sorbent (CaO), pure
CaCO3 was calcined in inert atmosphere of N2. The temperature was ramped at a fixed
rate, and complete decomposition of CaCO3 was achieved before isothermal conditions
were reached. A reaction mixture of 1% O2 and 2000 ppm SO2 was created by mixing
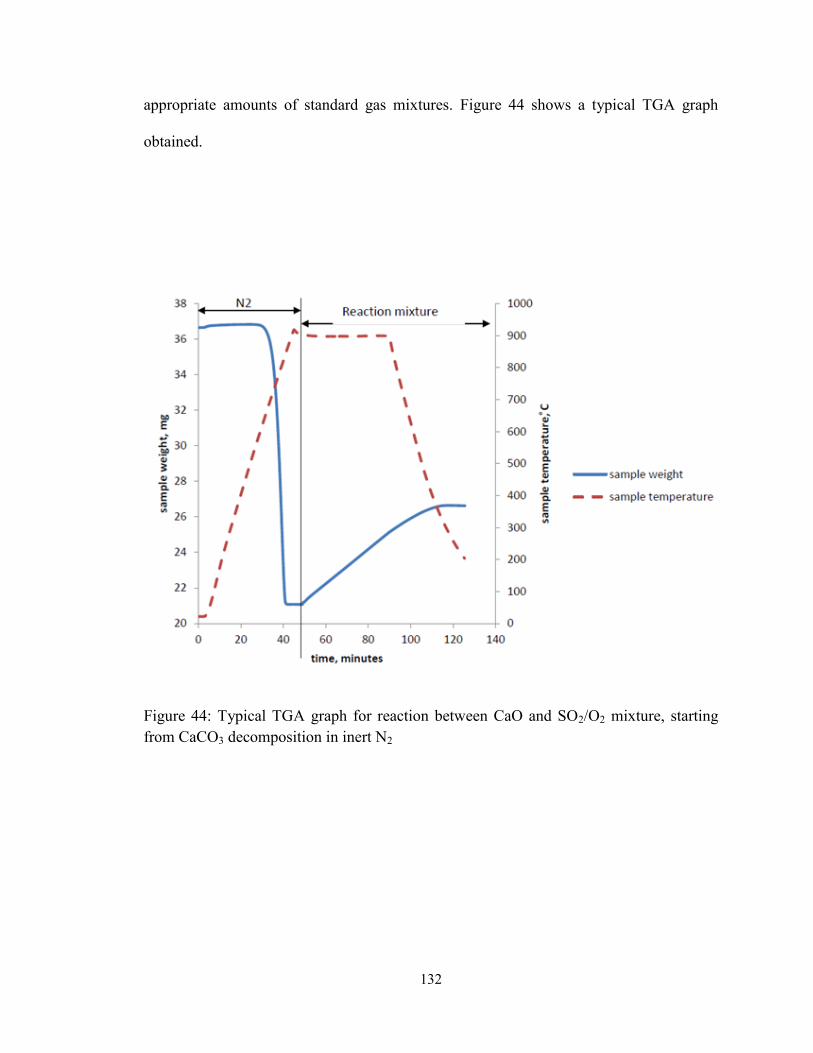
132
appropriate amounts of standard gas mixtures. Figure 44 shows a typical TGA graph
obtained.
Figure 44: Typical TGA graph for reaction between CaO and SO2/O2 mixture, starting
from CaCO3 decomposition in inert N2
133
The following reaction takes place:
CaO + 0.5 O2 + SO2 → CaSO4 Rxn 20
Figure 45 shows the effect of temperature on CaSO4 formation at a fixed O2 and SO2
concentration. Substantial CaSO4 formation is observed at higher temperatures, however
the reaction rate is low at T ≤ 900°C.
The conversion is calculated using the following formula:
𝑐𝑜𝑛𝑣𝑒𝑟𝑠𝑖𝑜𝑛 = 𝑚𝑜𝑙𝑒𝑠 𝑜𝑓 𝐶𝑎𝑂 𝑟𝑒𝑎𝑐𝑡𝑒𝑑
𝑚𝑜𝑙𝑒𝑠 𝑜𝑓 𝐶𝑎𝑂 𝑎𝑣𝑎𝑖𝑙𝑎𝑏𝑙𝑒=
∆𝑤80⁄
𝑤𝑜56⁄
Where Δw = weight increase upon injection of reactive gas mixture
wo = calcined sample weight
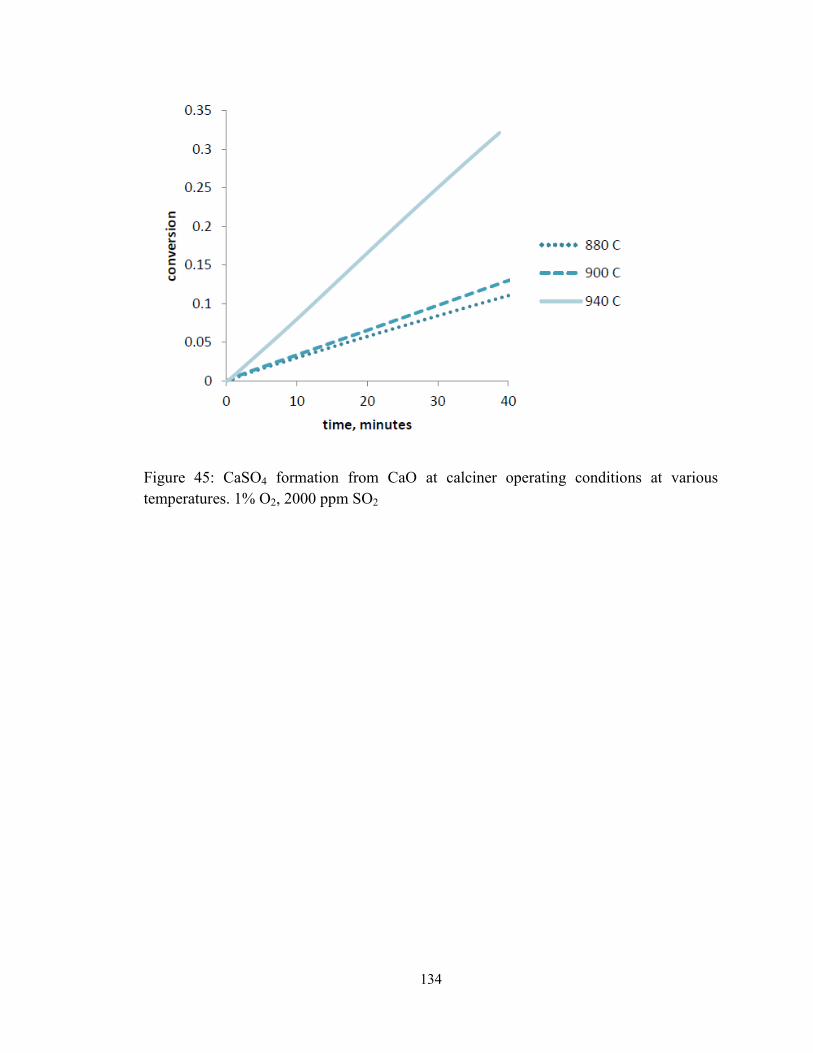
134
Figure 45: CaSO4 formation from CaO at calciner operating conditions at various
temperatures. 1% O2, 2000 ppm SO2
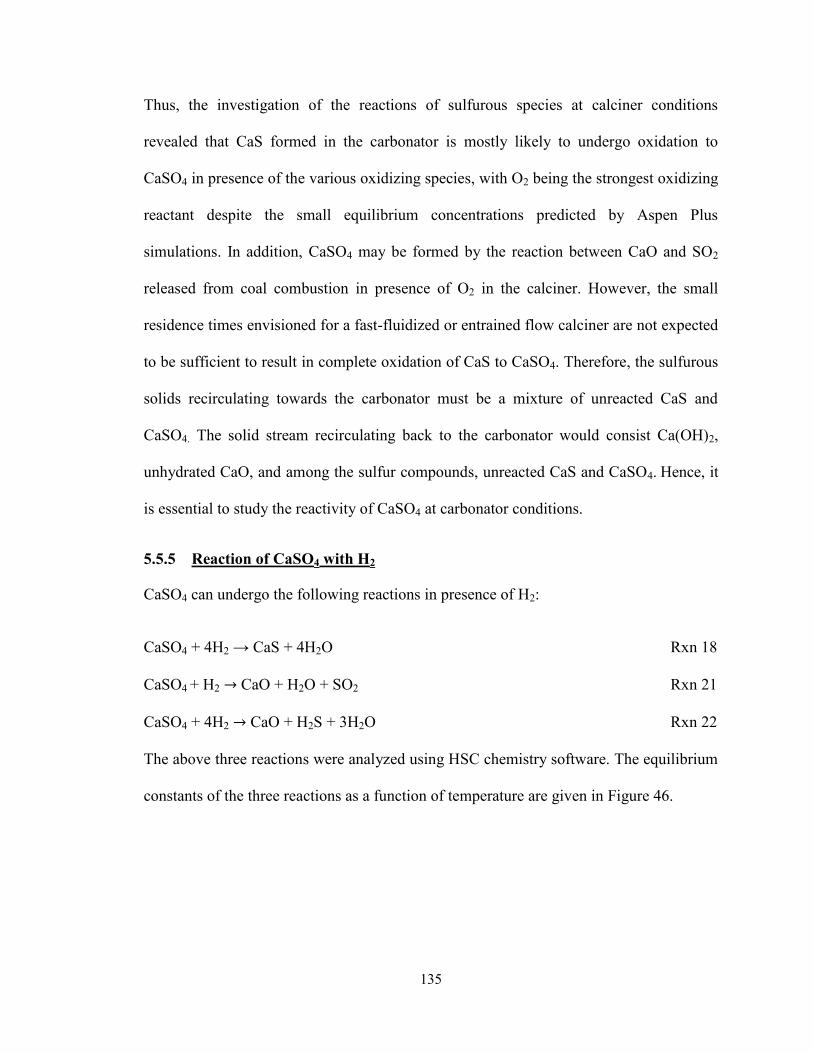
135
Thus, the investigation of the reactions of sulfurous species at calciner conditions
revealed that CaS formed in the carbonator is mostly likely to undergo oxidation to
CaSO4 in presence of the various oxidizing species, with O2 being the strongest oxidizing
reactant despite the small equilibrium concentrations predicted by Aspen Plus
simulations. In addition, CaSO4 may be formed by the reaction between CaO and SO2
released from coal combustion in presence of O2 in the calciner. However, the small
residence times envisioned for a fast-fluidized or entrained flow calciner are not expected
to be sufficient to result in complete oxidation of CaS to CaSO4. Therefore, the sulfurous
solids recirculating towards the carbonator must be a mixture of unreacted CaS and
CaSO4. The solid stream recirculating back to the carbonator would consist Ca(OH)2,
unhydrated CaO, and among the sulfur compounds, unreacted CaS and CaSO4. Hence, it
is essential to study the reactivity of CaSO4 at carbonator conditions.
5.5.5 Reaction of CaSO4 with H2
CaSO4 can undergo the following reactions in presence of H2:
CaSO4 + 4H2 → CaS + 4H2O Rxn 18
CaSO4 + H2 → CaO + H2O + SO2 Rxn 21
CaSO4 + 4H2 → CaO + H2S + 3H2O Rxn 22
The above three reactions were analyzed using HSC chemistry software. The equilibrium
constants of the three reactions as a function of temperature are given in Figure 46.
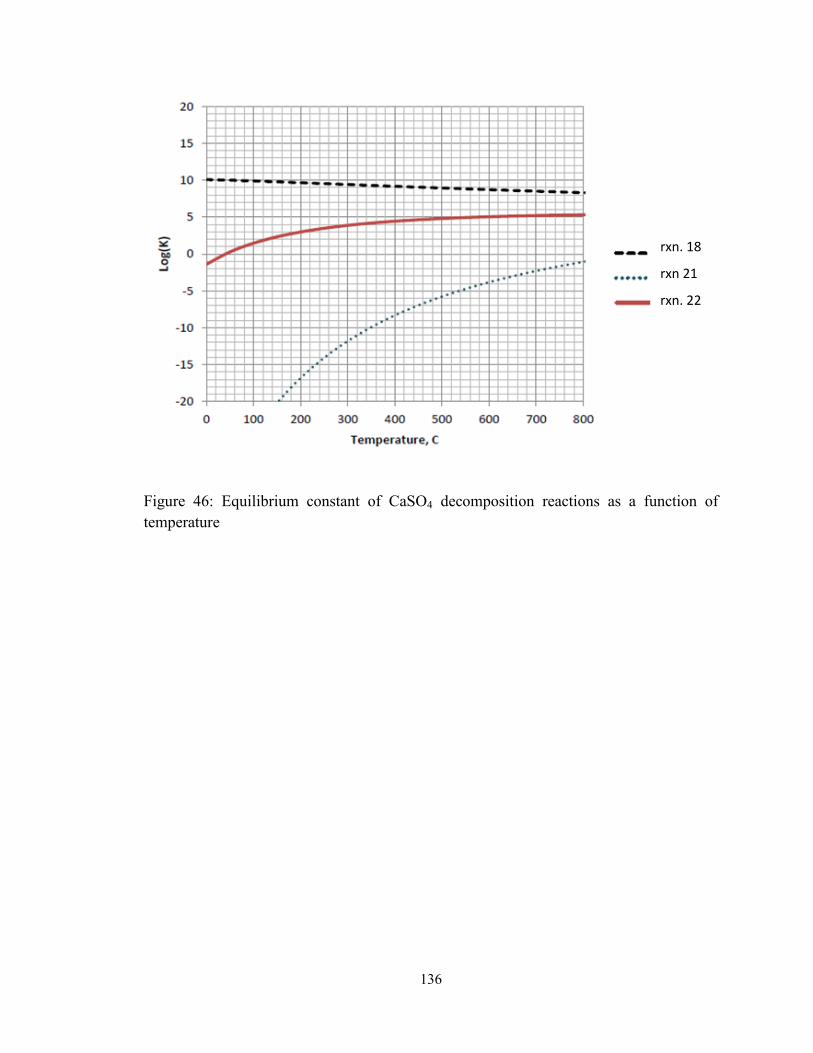
136
Figure 46: Equilibrium constant of CaSO4 decomposition reactions as a function of
temperature
rxn. 18
rxn 21
rxn. 22
137
The pressure of the system was successively ramped with every test. Since the sample
weight is highly sensitive to the pressure, as the pressure increases the weight decreases
of the system. Therefore the pressure was ramped after the reaction temperature had been
reached, in presence of N2. Once pressure stabilized, the H2 gas was introduced. The
samples were collected after the experiment and sealed in an airtight container. They
were analyzed using X-ray diffraction (XRD) to identify the product phases formed. The
following Figure 47 shows the results. The XRD analysis did not reveal significant new
insights, that is, the product and reactant spectra don’t look much different with product
sample also predominantly CaSO4 after 40 minutes of reaction with 30% H2. The sample
was collected at the end of several runs carried out at 8-10 atm.
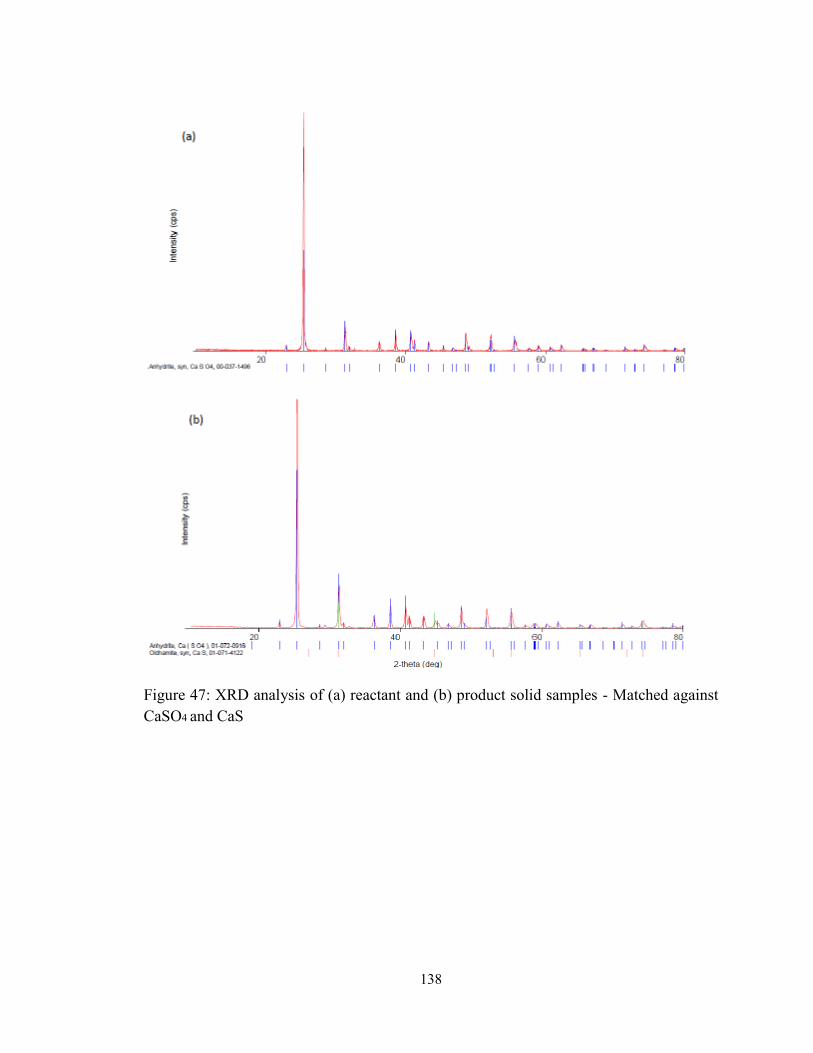
138
Figure 47: XRD analysis of (a) reactant and (b) product solid samples - Matched against
CaSO4 and CaS
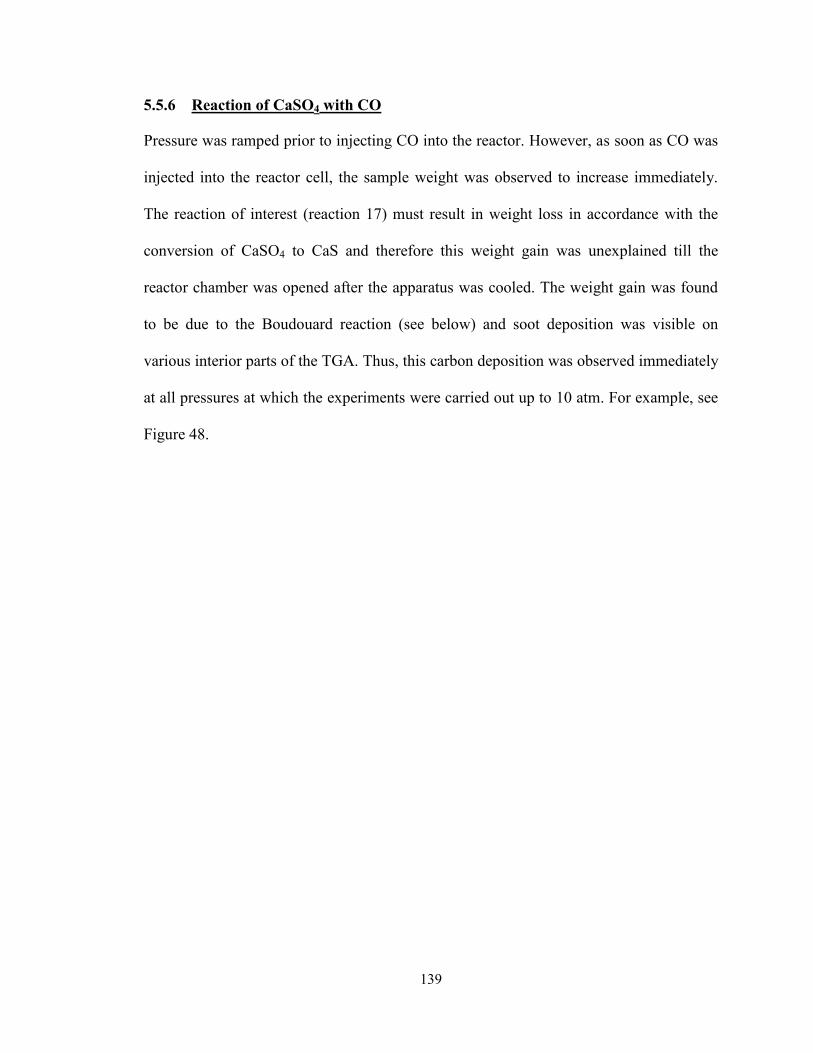
139
5.5.6 Reaction of CaSO4 with CO
Pressure was ramped prior to injecting CO into the reactor. However, as soon as CO was
injected into the reactor cell, the sample weight was observed to increase immediately.
The reaction of interest (reaction 17) must result in weight loss in accordance with the
conversion of CaSO4 to CaS and therefore this weight gain was unexplained till the
reactor chamber was opened after the apparatus was cooled. The weight gain was found
to be due to the Boudouard reaction (see below) and soot deposition was visible on
various interior parts of the TGA. Thus, this carbon deposition was observed immediately
at all pressures at which the experiments were carried out up to 10 atm. For example, see
Figure 48.
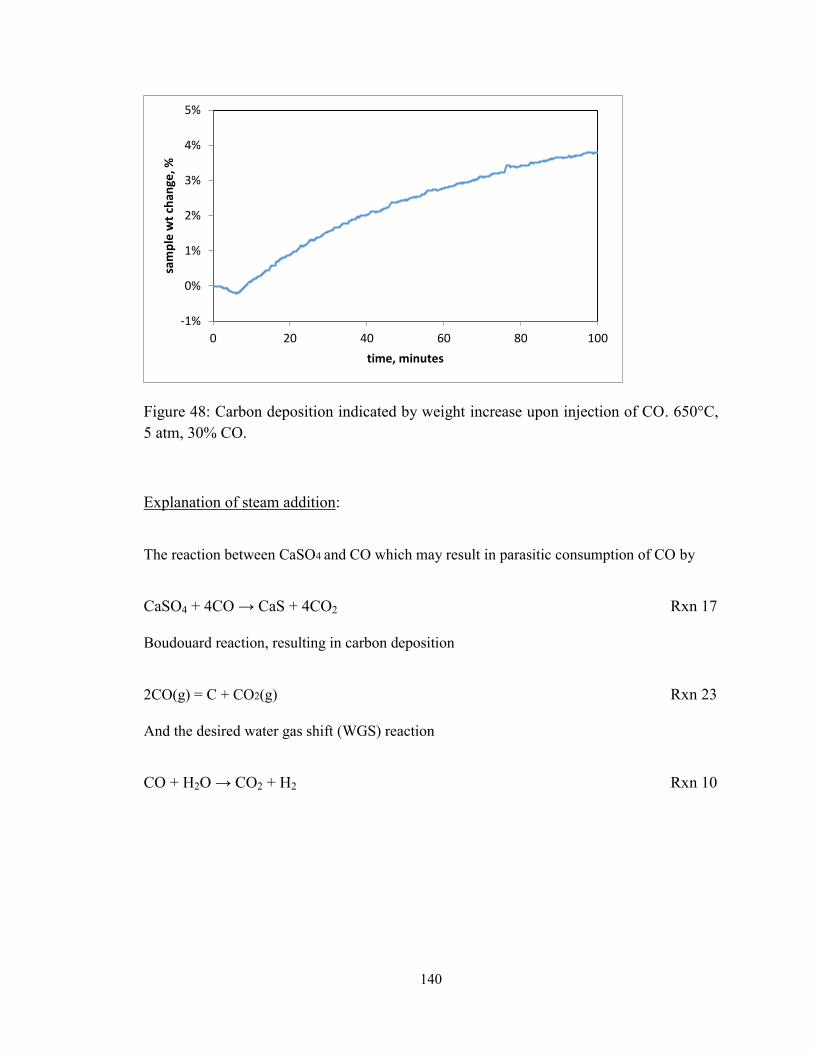
140
Figure 48: Carbon deposition indicated by weight increase upon injection of CO. 650°C,
5 atm, 30% CO.
Explanation of steam addition:
The reaction between CaSO4 and CO which may result in parasitic consumption of CO by
CaSO4 + 4CO → CaS + 4CO2 Rxn 17
Boudouard reaction, resulting in carbon deposition
2CO(g) = C + CO2(g) Rxn 23
And the desired water gas shift (WGS) reaction
CO + H2O → CO2 + H2 Rxn 10
-1%
0%
1%
2%
3%
4%
5%
0 20 40 60 80 100
sam
ple
wt
chan
ge, %
time, minutes
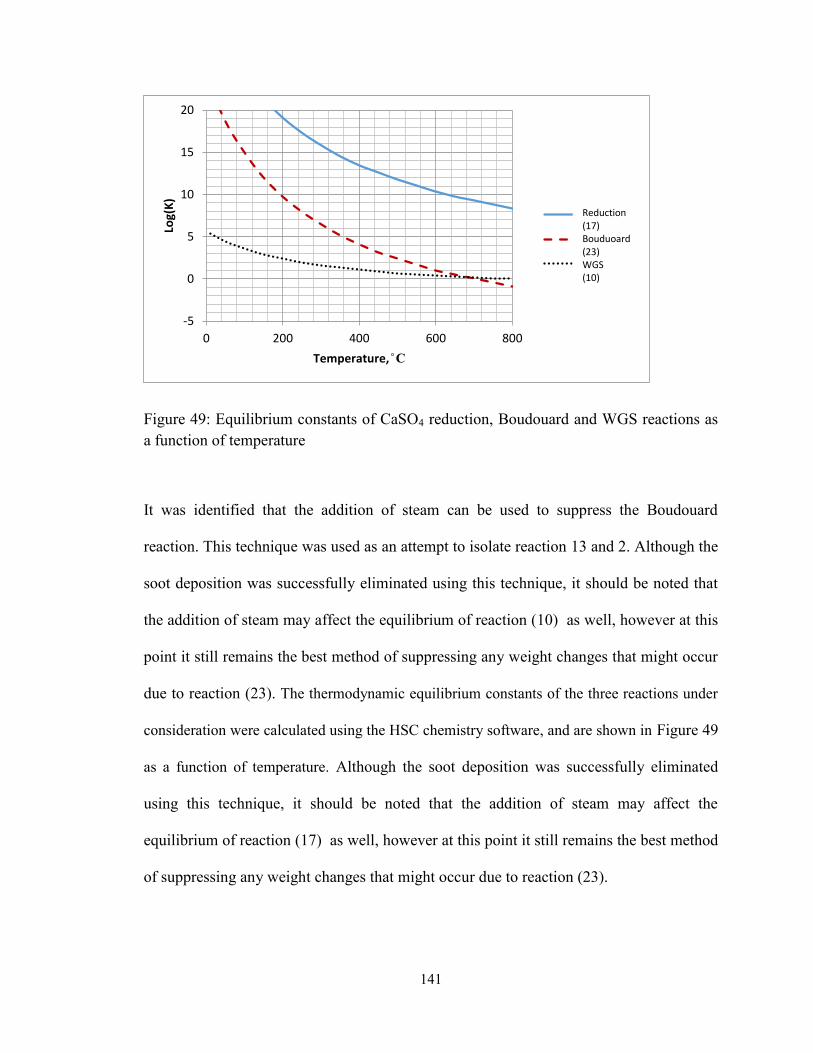
141
Figure 49: Equilibrium constants of CaSO4 reduction, Boudouard and WGS reactions as
a function of temperature
It was identified that the addition of steam can be used to suppress the Boudouard
reaction. This technique was used as an attempt to isolate reaction 13 and 2. Although the
soot deposition was successfully eliminated using this technique, it should be noted that
the addition of steam may affect the equilibrium of reaction (10) as well, however at this
point it still remains the best method of suppressing any weight changes that might occur
due to reaction (23). The thermodynamic equilibrium constants of the three reactions under
consideration were calculated using the HSC chemistry software, and are shown in Figure 49
as a function of temperature. Although the soot deposition was successfully eliminated
using this technique, it should be noted that the addition of steam may affect the
equilibrium of reaction (17) as well, however at this point it still remains the best method
of suppressing any weight changes that might occur due to reaction (23).
-5
0
5
10
15
20
0 200 400 600 800
Log(
K)
Temperature, ̊ C
reaction 1
reaction 2
reaction 3
Reduction (17) Bouduoard (23) WGS (10)
142
Steam was injected for up to 10 minutes prior to the injection of CO. Under these
conditions, different pressures were tested for CO reaction and outlet gas was analyzed.
Due to the occurrence of WGS reaction in these experiments, the micro-GC detected
presence of H2 in the outlet gas. The Boudouard reaction is known to occur at
atmospheric pressure too as evidenced in the sub-pilot testing of the CLP unit, and it is
suppressed through the addition of external steam injection.24
However, from these
experiments it is evident that parasitic CO consumption due to reaction 23 is more
significant than that due to reaction 17 (the original reaction of interest). Secondly, during
the experiments with steam injection, reaction 23 was found to be suppressed (absence
of/reduced degree of soot deposition). Further, even if WGS reaction occurs, the sample
weight change would only be due to the reaction 17 in the present system. No significant
weight loss is observed, as evidenced in Figure 50. This indicates that reaction 17 does
not occur at a rate significant to the CLP system, at the conditions employed here.
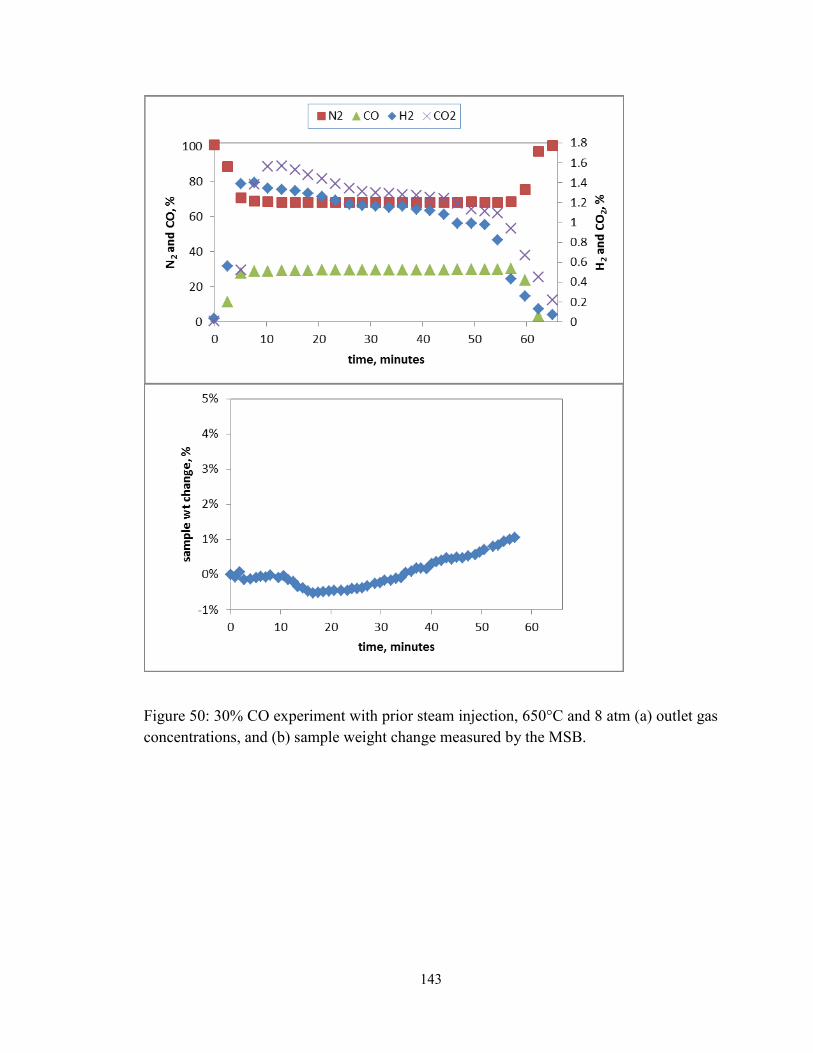
143
Figure 50: 30% CO experiment with prior steam injection, 650°C and 8 atm (a) outlet gas
concentrations, and (b) sample weight change measured by the MSB.
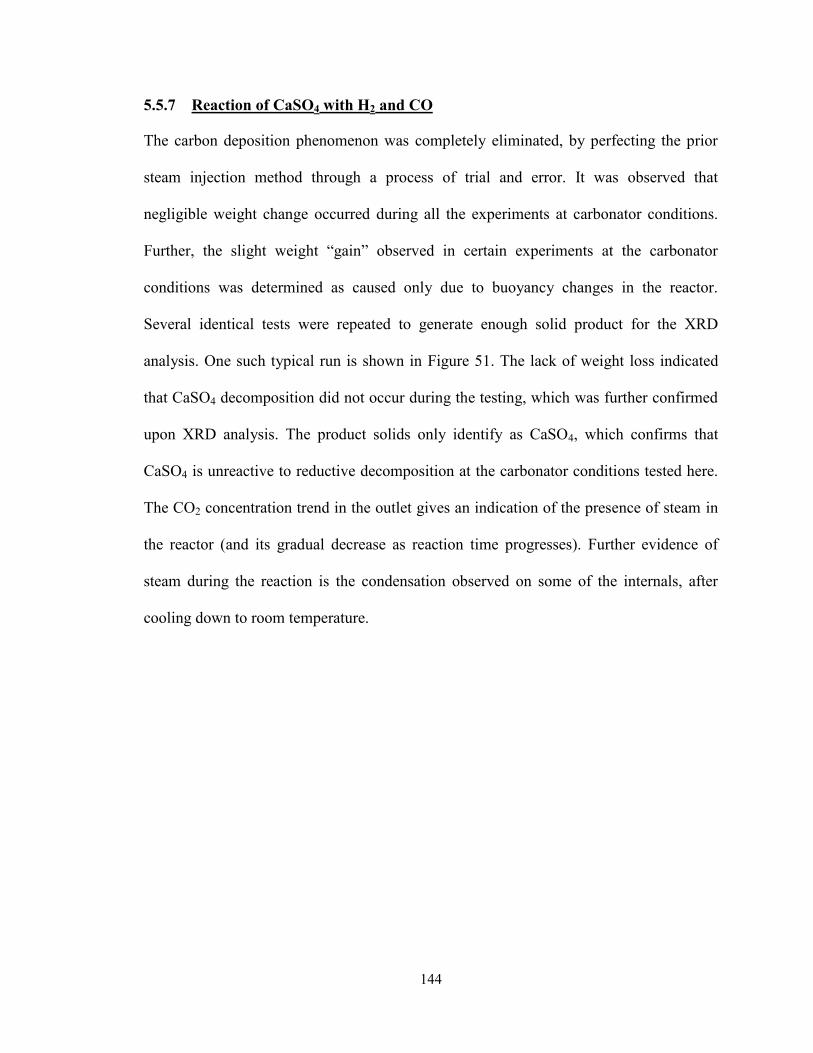
144
5.5.7 Reaction of CaSO4 with H2 and CO
The carbon deposition phenomenon was completely eliminated, by perfecting the prior
steam injection method through a process of trial and error. It was observed that
negligible weight change occurred during all the experiments at carbonator conditions.
Further, the slight weight “gain” observed in certain experiments at the carbonator
conditions was determined as caused only due to buoyancy changes in the reactor.
Several identical tests were repeated to generate enough solid product for the XRD
analysis. One such typical run is shown in Figure 51. The lack of weight loss indicated
that CaSO4 decomposition did not occur during the testing, which was further confirmed
upon XRD analysis. The product solids only identify as CaSO4, which confirms that
CaSO4 is unreactive to reductive decomposition at the carbonator conditions tested here.
The CO2 concentration trend in the outlet gives an indication of the presence of steam in
the reactor (and its gradual decrease as reaction time progresses). Further evidence of
steam during the reaction is the condensation observed on some of the internals, after
cooling down to room temperature.
145
Figure 51: Typical experiment showing weight change (TGA) and outlet gas composition
(micro-GC) as a function of time, upon injection of reactive gases. 30% CO, 30% H2 and
steam injection before the experiment. T = 650°C and P = 10 atm.
0.0%
0.2%
0.4%
0.6%
0.8%
1.0%
1.2%
1.4%
0%
5%
10%
15%
20%
25%
30%
35%
0 20 40 60 80 100
CO
2 co
nce
ntr
atio
n
% w
eig
ht
chan
ge, a
nd
gas
co
nce
ntr
atio
n
time, minutes
CO, %
H2, %
TGA wt% change
CO2, %
146
At the same operating conditions, the main reaction occurring in the carbonator was also
tested, which is the water gas shift reaction in presence of CaO sorbent. In this case, the
exact same experimental conditions were employed except that CaO solids were used
instead of CaSO4. This was accomplished by generating the CaO in-situ by heating
limestone sample to decomposition temperatures prior to the injection of CO/H2 mixture.
The comparison is shown in Figure 52.
It can be seen that the CaO sorbent undergoes almost complete carbonation at the
reaction conditions tested.
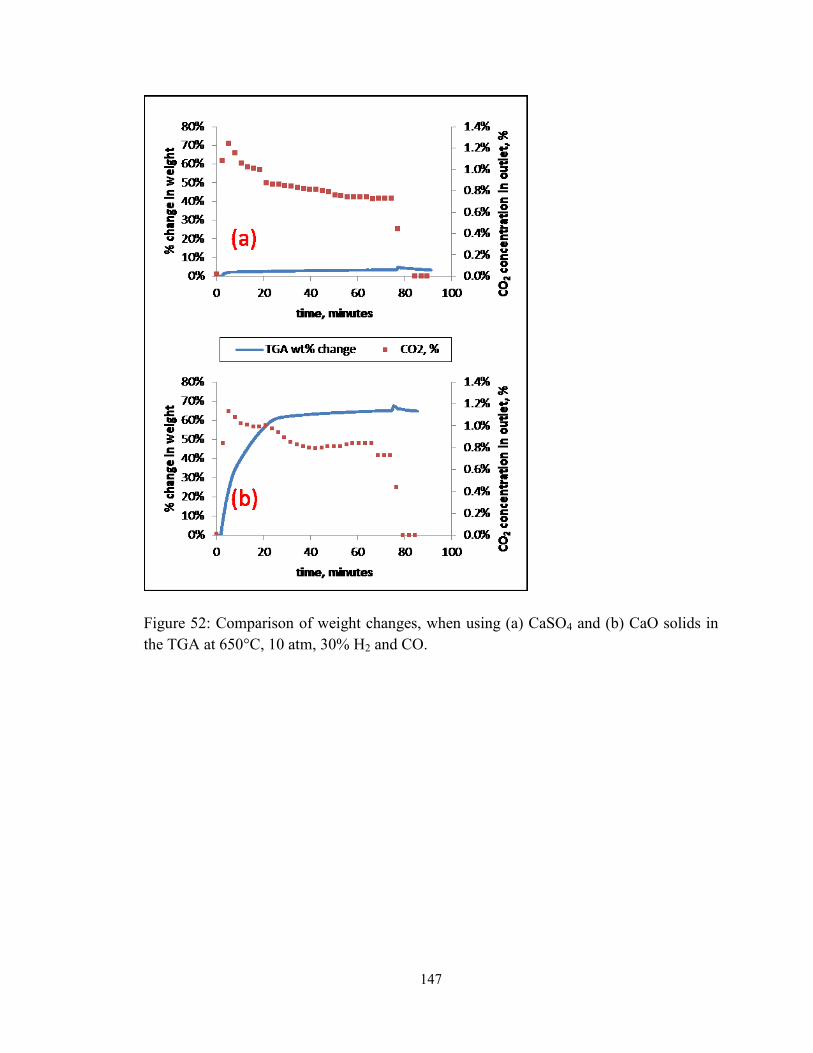
147
Figure 52: Comparison of weight changes, when using (a) CaSO4 and (b) CaO solids in
the TGA at 650°C, 10 atm, 30% H2 and CO.
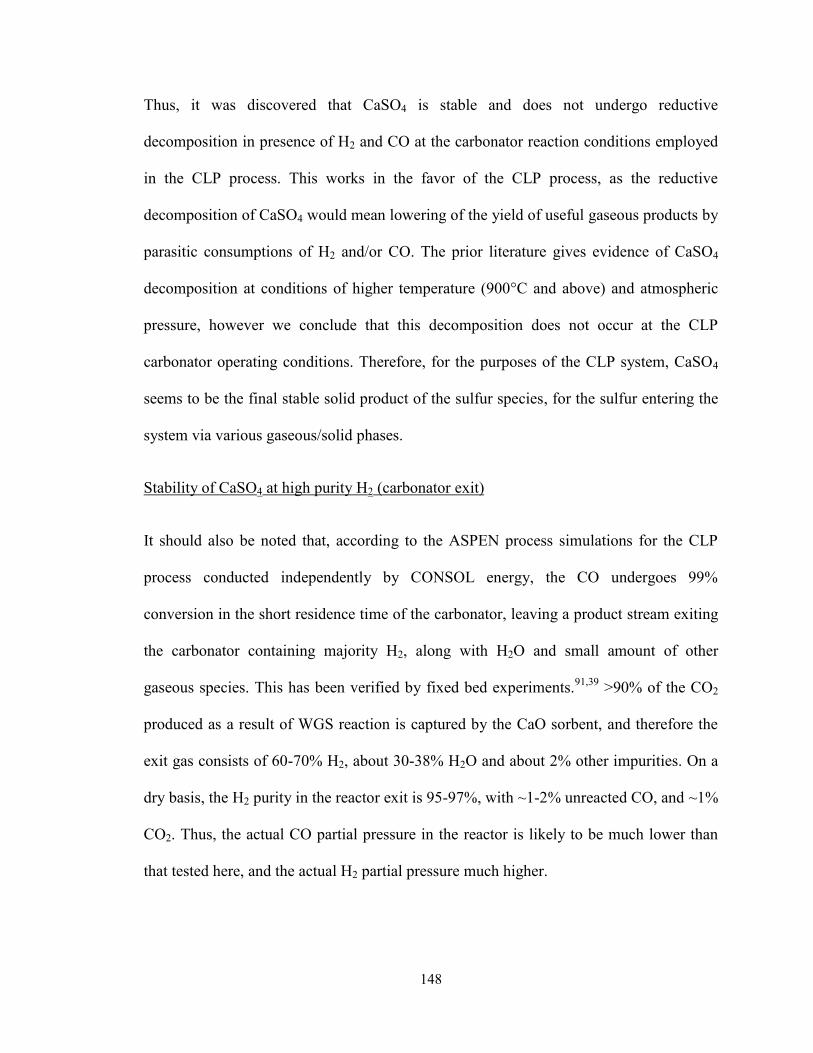
148
Thus, it was discovered that CaSO4 is stable and does not undergo reductive
decomposition in presence of H2 and CO at the carbonator reaction conditions employed
in the CLP process. This works in the favor of the CLP process, as the reductive
decomposition of CaSO4 would mean lowering of the yield of useful gaseous products by
parasitic consumptions of H2 and/or CO. The prior literature gives evidence of CaSO4
decomposition at conditions of higher temperature (900°C and above) and atmospheric
pressure, however we conclude that this decomposition does not occur at the CLP
carbonator operating conditions. Therefore, for the purposes of the CLP system, CaSO4
seems to be the final stable solid product of the sulfur species, for the sulfur entering the
system via various gaseous/solid phases.
Stability of CaSO4 at high purity H2 (carbonator exit)
It should also be noted that, according to the ASPEN process simulations for the CLP
process conducted independently by CONSOL energy, the CO undergoes 99%
conversion in the short residence time of the carbonator, leaving a product stream exiting
the carbonator containing majority H2, along with H2O and small amount of other
gaseous species. This has been verified by fixed bed experiments.91,39
>90% of the CO2
produced as a result of WGS reaction is captured by the CaO sorbent, and therefore the
exit gas consists of 60-70% H2, about 30-38% H2O and about 2% other impurities. On a
dry basis, the H2 purity in the reactor exit is 95-97%, with ~1-2% unreacted CO, and ~1%
CO2. Thus, the actual CO partial pressure in the reactor is likely to be much lower than
that tested here, and the actual H2 partial pressure much higher.
149
Therefore, a test was carried out to determine the formation of CaS at the conditions
corresponding to the above discussion. On a dry basis, ~95% H2 (rest N2) was injected in
the sample cell at 650°C and 10 atm. Steam was also present during the experiment,
generated by the method outlined on page 2. The sample did not exhibit any weight loss
during a 60 minute test. The weight of sample remained the same (~0.1 g) as the starting
weight upon turning off the H2 gas at the end of the 60 minute period. The product
sample was collected to be analyzed using XRD technique. The XRD analysis of this
stored sample conducted on Rigaku SmartLab XRD identified CaSO4 as the only solid
phase. The lack of weight loss at these test conditions also strongly indicates that CaSO4
is stable at the carbonator outlet conditions.
5.5.8 Treatment of purge stream
Once it has been established that CaSO4 does not adversely affect the desired reactions
and/or reactive species in the CLP system, the focus now shifted to the safe disposal of
the sulfurous species that leave the system via solids purge stream. It was concluded that
the strongest oxidant for CaS is the oxygen that is present in the calciner, up to 5% in
concentration. Therefore the tests were initiated for the CaS oxidation using oxygen/air at
temperatures below the operating conditions of the calciner, in accordance with the
conditions of the solid purge stream (identified in Figure 53 by the dotted line).
150
Figure 53: Process flow diagram of the CLP unit as applied to the coal-to-H2 process.
Dotted line indicates the solid purge stream and possible treatment locations for the
sulfurous species (original figure from reference 93
).
151
It can be comprehended from this schematic that conditions of treatment of this purge
stream for CaS oxidation are <900°C temperature and O2 concentration between 5-25%;
as the upper limit on temperature is placed by the operating temperature of the calciner,
and the upper limit of O2 concentration is placed by the O2 composition of the gas inlet of
the calciner (gas stream coming from ASU diluted by recycled CO2).
Accordingly, the temperature range of 700-900°C and O2 concentration of 5-21% was
selected for experiments.
Variation of CaS oxidation with O2 concentration and temperature
Isothermal experiments were carried out for CaS oxidation in the ranges of 700-900°C
and 5-21% O2. For each experiment, the sample was ramped to desired temperature in
inert N2 gas, and the gas flow was switched to desired concentrations upon reaching the
isothermal conditions. The weight increase in the sample was measured as a function of
time, and the reaction conversion was calculated considering the following oxidation
reaction:
CaS + 2O2 → CaSO4 Rxn 15
The following Figure 54 shows the results obtained from the isothermal testing. The
variation of reactivity with temperature is shown. Figure 54(a) shows the reaction
conversion curves generated at various temperatures in the range considered at a fixed O2
concentration of 5%. Similarly, Figure 54(b) corresponds to a 10% O2 concentration and
Figure 54(c) indicates results obtained by using pure air (21% O2). The reaction rate is
observed to be a strong function of temperature at all concentrations tested. At all
152
reaction conditions, the typical two step reaction conversion curve is observed, which
becomes more prominent at higher O2 concentrations. This two-step reaction curve is
consistent with the well-established mechanism of initial surface controlled reaction
followed by a slower reaction rate, controlled by the diffusion of reacting gas through a
product layer of CaSO4 formed on the surface. This result is in accordance with that
published previously in literature (reference 100
and 97
).
The two-step reaction can be highlighted further by plotting the dX/dt (rate) values
against the reaction conversion, as seen in Figure 55. At lower conversion values, the
reaction rates are high for all concentrations, as can be clearly seen from the Figure 55.
The inflection point occurs at progressively higher conversion values at higher
temperatures.
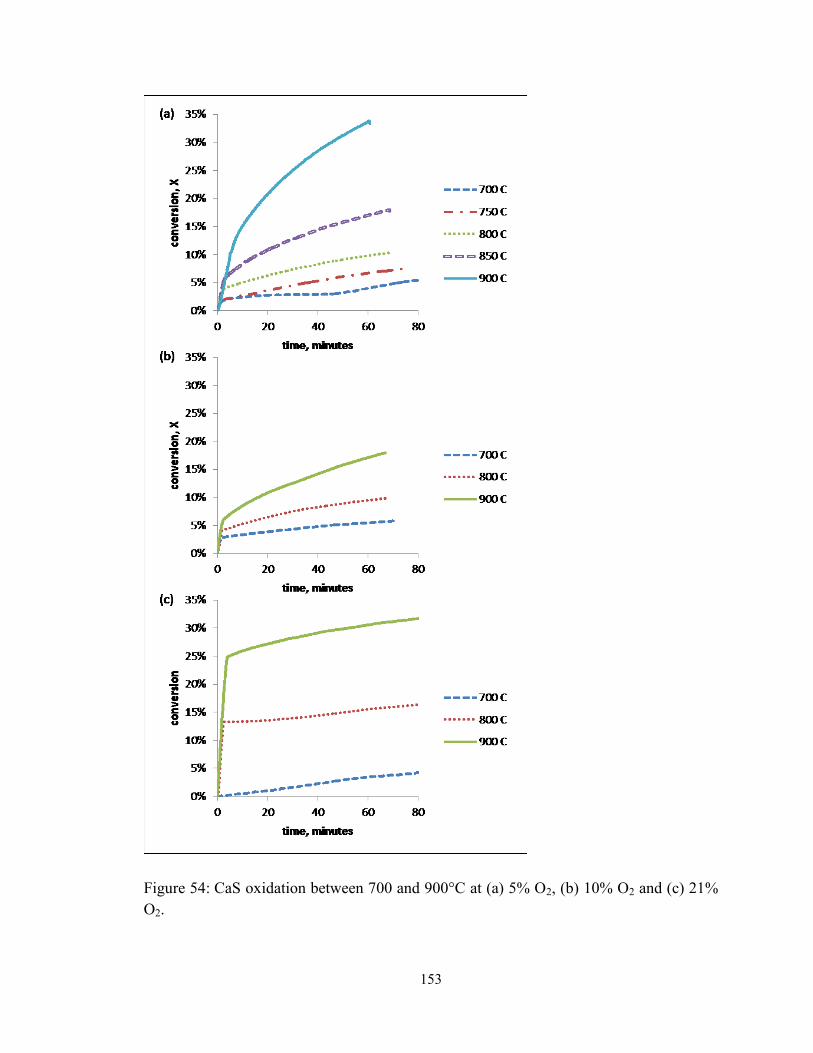
153
Figure 54: CaS oxidation between 700 and 900°C at (a) 5% O2, (b) 10% O2 and (c) 21%
O2.
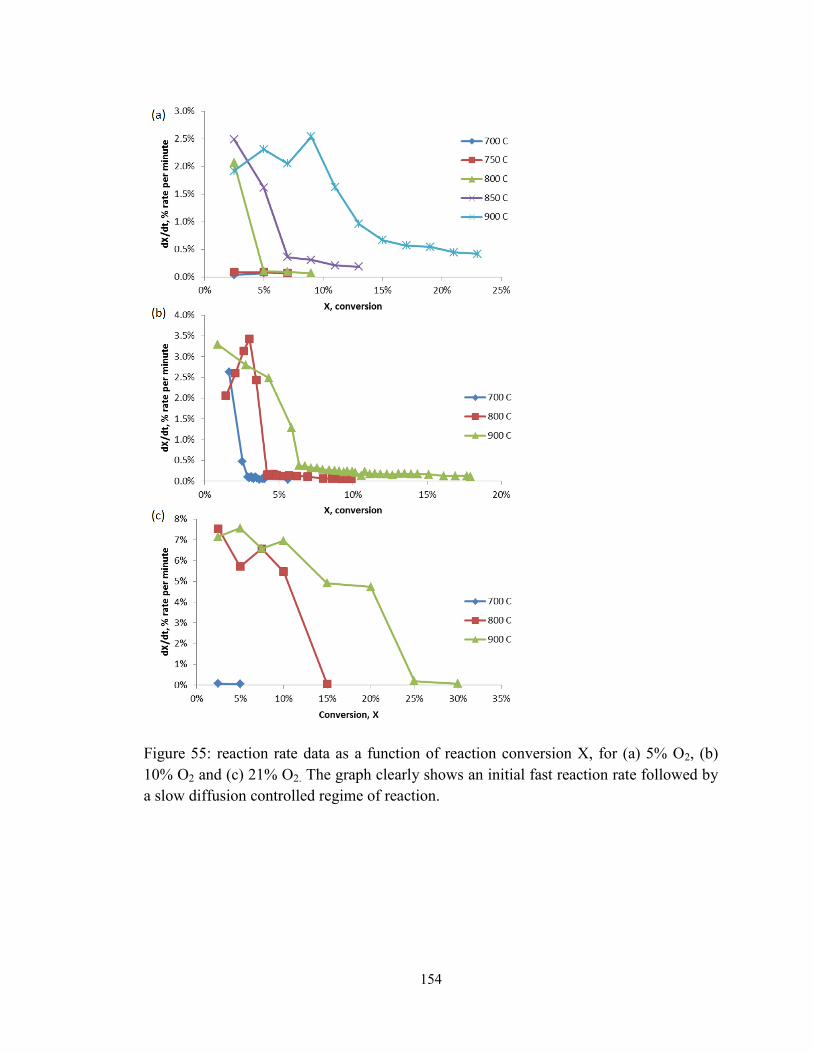
154
Figure 55: reaction rate data as a function of reaction conversion X, for (a) 5% O2, (b)
10% O2 and (c) 21% O2. The graph clearly shows an initial fast reaction rate followed by
a slow diffusion controlled regime of reaction.
155
According to results of Marbán et. al.97
, reaction 11 is the prominent reaction below
<890°C, and this temperature is identified as the upper limit for suitability of CaS
conversion to CaSO4. This temperature range has been termed as ‘regime of low SO2
release’ for the applications of pressurized fluidized bed combustors (PFBC) for the
stabilization of sulfurous compounds. At these conditions, reaction 11 is the only
observed reaction, which is in agreement with the results obtained in the present study.
Thermal decomposition of CaSO4 to CaO is reported elsewhere in literature at higher
temperatures (~1175°C).101
The temperature range of 900-1175°C is termed as ‘regime of
high SO2 release’ due to the observed formation of CaO and CaSO4 products
simultaneously. However, no CaO formation was detected at the conditions tested in the
present study (up to 950°C). Therefore, it is concluded that a very slim chance – if at all –
of SO2 release exists in only the calciner reactor. However, the SO2 release is ruled out
for the purge stream, as the temperature of this stream is slightly lower than the calciner
operating temperatures.
Thus, it is concluded that the purge stream temperature must be maintained lower than
900°C to eliminate the chances of SO2 evolution by thermal decomposition of CaSO4.
Further, considering the kinetic advantage of temperature for operating the oxidation of
CaS, the reaction may be preferred to be conducted at just below the calciner operating
temperature on the purge stream. Therefore, the oxidation is visualized to be carried out
between the cyclone and the heat recovery steam generator unit on the purge stream. A
slip stream from the gas inlet of the calciner may be introduced for the oxidation of the
156
purge stream to realize the advantage of faster kinetics obtained at higher O2
concentrations.
5.6 Commercial implications and conclusions
The objective of this work was to investigate the chemistry of the sulfur in the application
of the CLP system for H2 generation from coal. The CLP system can be applied for
pushing the WGS reaction forward in the H2 generation process from coal-derived
syngas. In addition, the sulfurous species evolved from the coal are also captured or fixed
in the solid state by reaction with the CaO sorbent. The fate of these sulfur species was
investigated in this work by small lab-scale kinetic experiments, in order to eliminate one
of the process uncertainties.
However, this CLP system can be applied to a wide variety of H2 and/or electricity
generation methods, especially in the carbon constrained scenario. The multipollutant
removal advantage of the CaO sorbent makes this a highly attractive technology. The
high temperature calcination step affords the opportunity for high-quality heat recovery,
and thus applying the CLP system for a coal-to H2 case necessarily results in a co-
production of electricity. As stated in section 5.2, the preliminary process analysis
indicates the advantage of operating the coal-to-H2 plant with the CLP system. While the
base case 25.7 tph H2 power plant generates 7.2 MWe of net electric power, the CLP
system applied to the identical coal-to-H2 process results in the generation of 320 MWe
of net electric power.
157
The biggest byproduct of the process is the solid purge or waste stream exiting the
process. The solid purge exiting the calciner for coal to H2 case is 68,675 kg/hr. This
stream predominantly contains spent CaO, CaCO3 and CaSO4 along with some ash
elements. This solid stream can be sold to the cement industry, potentially decarbonizing
it. Since the cement industry produces clinker from limestone by calcining it, the purge
stream from CLP can be used to offset this process. The energy of operating the cement
kiln to produce clinker can, in this manner, be potentially halved.50
The CaSO4 and ash
present in the purge stream can also supplement the clay and silicate additives usually
used to produce the cement.
This work concluded that the sulfur may exit the CLP system in the form of the solid
purge stream, where it will be treated for complete oxidation to CaSO4. As stated above,
the presence of CaSO4 in the purge stream makes it a viable candidate for the integration
of the CLP technology with the cement industry. Therefore the results on experiments
carried out on the carbonator block revealed that CaSO4 does not contribute to reducing
the yield of the H2 product. Therefore, by eliminating this critical uncertainty of the
process design; the present work bridges a technology gap, and presents the CLP system
in a more favorable light than before.
Compared to a base coal-to-H2 plant, the CLP system uses ~53% more coal. This excess
coal requirement comes from the coal-fired calciner, which requires auxiliary fuel to
drive the endothermic regeneration of the spent sorbent. In addition to the extra coal
being utilized by the CLP system, it also results in a ~310 MWe more coproduction of
electricity over the base case. Therefore, in a carbon-constrained scenario, applying this
158
technology to produce H2 from Ohio coal would result in a significant increase in coal
consumption. Pittsburgh #8 coal is the most heavily mined coal in Ohio. Although these
simulations were performed on the Illinois #6 bituminous coal according to US-DOE’s
guidelines, the results can be easily applied to Ohio’s Pittsburgh #8 coal, owing to the
similar sulfur content of the two coals. However, to determine the increased use of Ohio
coal by application of the CLP system along with reduced emissions, a rigorous analysis
should be conducted on a plant-by-plant basis.
Since the application of CLP system to a coal-to-H2 plant results in a co-production of
electricity from the heat recovery steam generation system, establishing a CLP-enabled
coal-to-H2 plant is considered similar to a combined H2 plant with a pulverized coal fired
boiler of similar commercial size. Since this process is developed for the purpose of
higher efficiency generation of H2 from coal, the cost of individual pollutant removal
such as sulfur/mercury/ash has not been calculated per ton of coal or per ton of pollutant
removed. However, the use of CLP system results in removal of several process units of
pollutant removal/gas cleanup by combining them in the calcium looping system. The
following figure shows the base case coal-to-H2 plant with conventional sulfur removal
blocks highlighted.
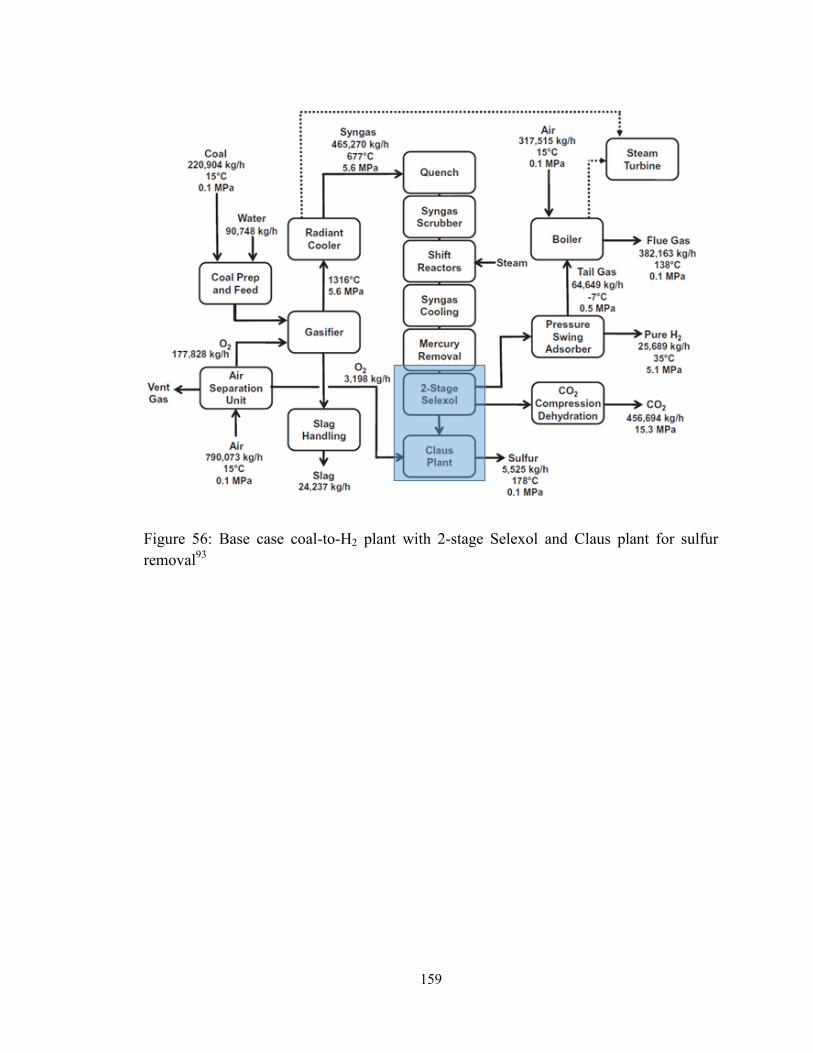
159
Figure 56: Base case coal-to-H2 plant with 2-stage Selexol and Claus plant for sulfur
removal93
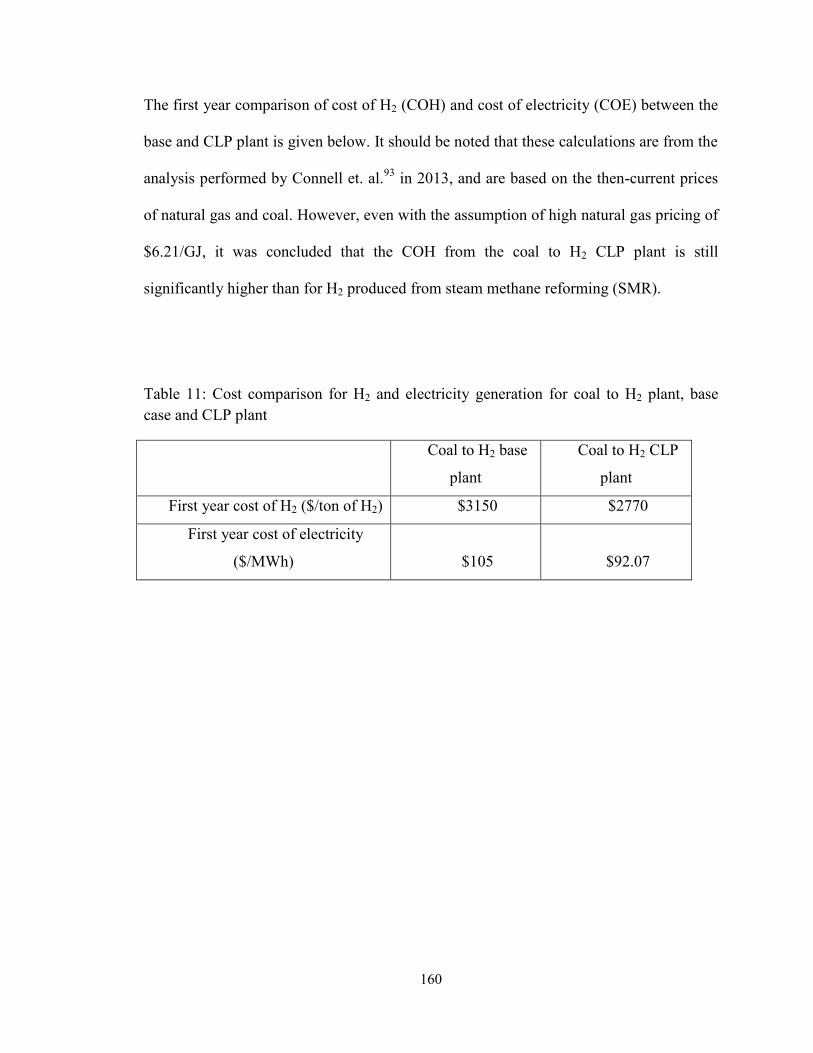
160
The first year comparison of cost of H2 (COH) and cost of electricity (COE) between the
base and CLP plant is given below. It should be noted that these calculations are from the
analysis performed by Connell et. al.93
in 2013, and are based on the then-current prices
of natural gas and coal. However, even with the assumption of high natural gas pricing of
$6.21/GJ, it was concluded that the COH from the coal to H2 CLP plant is still
significantly higher than for H2 produced from steam methane reforming (SMR).
Table 11: Cost comparison for H2 and electricity generation for coal to H2 plant, base
case and CLP plant
Coal to H2 base
plant
Coal to H2 CLP
plant
First year cost of H2 ($/ton of H2) $3150 $2770
First year cost of electricity
($/MWh) $105 $92.07
161
The SMR method of producing H2 may be modified by applying the CLP system to
further improve the COH, by operating the calciner in a coal-fired configuration. The
sulfur compounds in such a hybrid system may only enter the solid circulation loop via
the oxycombustion of coal in the calciner. Thus the formation of calcium sulfide under
reducing conditions is not anticipated in such a system.
From the technical standpoint, several key technology gaps need to be addressed next to
propel the CLP system for H2 production towards commercialization. Work has already
been initiated to probe the kinetics of the hydration reaction; as reactivation by hydration
is a critical component in the success of CLP system which enables it to maintain low
solid circulation rates. A high temperature steam hydrator reactor design is yet another
technology gap that needs to be bridged. Solids handling and particulate removal
efficiencies at high temperatures amenable to the CLP system also need to be studied for
the overall success of this technology.
With the US-EPA’s proposed regulations for reducing CO2 emissions, the continued
development of technologies such as CLP, which can achieve carbon abatement in
addition to multipollutant cleanup, is essential.102
By eliminating the key technology gaps
through rigorous scientific studies, the development of the CLP system can be
strengthened, and a greater confidence may be instilled in future scale up efforts. With
the backing of both government policies and scientific research initiative, the successful
development of such technologies may be secured.
162
CHAPTER 6: Chemical Looping Applications: High Pressure Redox
Behavior of Iron-Oxide Based Oxygen Carriers
Reproduced with permission from Deshpande, N.; Majumder, A.; Qin, L.; Fan, L.-S.
High-Pressure Redox Behavior of Iron-Oxide-Based Oxygen Carriers for Syngas
Generation from Methane. Energy Fuels 2015, 29 (3), 1469–1478. Copyright [2015]
American Chemical Society.
6.1 Introduction
Transition metal oxides are one of the most technologically versatile materials that have
found their applications in various fields. In electronics, they are used in making
conductor and semiconductor materials.103
In electrochemistry, they have applications in
solid oxide fuel cells, lithium-ion batteries etc.104,105
But perhaps they are the most widely
used in the chemical industry as catalysts, catalyst precursors and oxygen donors in
various processes.106
Selective oxidation, dehydrogenation107
and chemical looping108
constitute some of the most important processes that are based on the reduction-oxidation
(redox) properties of the transition metal oxides. In these processes, lattice oxygen from
the metal oxides participates in the reaction while the vacancies left behind are
replenished by molecular oxygen. The redox behavior of the metal oxides influences their
crystal phases and their morphologies and consequently their optical, electrical and
chemical properties.
163
In the chemical industry, partial and selective oxidation processes often need to be
operated at conditions suitable for the downstream product applications and the process
economics. For example, in the recent past, a portion of the chemical industry has shifted
its focus towards natural gas or methane (CH4) for the synthesis of valuable chemicals
like gasoline, MTBE, alcohols and oxygenates through such oxidation processes.109
A
number of important processes like methanol, ammonia and Fischer-Tropsch synthesis,
which are used to synthesize these valuable chemicals, use syngas as their feedstock.110
Syngas for these processes is preferably derived from CH4 because of the lower capital
costs and the higher efficiency of the CH4 to syngas conversion systems as compared to
coal derived syngas. CH4 is preserved in natural gas fields at high pressures. Also
processes like Fischer-Tropsch synthesis and methanol synthesis, which use syngas as
their feedstock, operate at elevated pressures between 2-4 MPa.111,112
Thus for the
conventional syngas generation at ambient pressure, the syngas needs to be compressed
prior to being introduced in the system. Hence, it is economically beneficial to carry out
syngas generation processes at pressures compatible with downstream applications in
order to minimize the energy losses associated with compressing the syngas feedstock for
these processes. Studies on syngas generation at elevated pressures are, however, very
limited. Gas-to-liquid (GTL) processes, like synthesis of gasoline, diesel and methanol,
also require a hydrogen-rich syngas feed with a 2:1 ratio of hydrogen: carbon monoxide
(H2:CO).113
Existing syngas generation processes like steam methane reforming,
autothermal reforming, and catalytic partial oxidation of methane are unable to achieve
the required syngas quality in a single unit and need additional processing steps.110
Thus,
the single step partial oxidation of CH4 over metal oxides offers an attractive alternative
164
to the existing CH4-to-syngas conversion methods, and the concept is widely utilized in
the process of chemical looping reforming. The economic advantages, and the limited
knowledge, of high-pressure partial oxidation of CH4 necessitate a comprehensive study
of the impact of elevated pressures on the reactions involved.
Chemical looping has been regarded as one of the most promising technologies in the U.
S. Department of Energy’s CO2 capture roadmap.1 The technology is based on high
temperature cyclic redox reactions of metal oxide based oxygen carriers between two or
more reactors – reducer, combustor and oxidizer - for the conversion of carbonaceous
fuel to generate electricity and/or H2.114
It is designed to produce a sequestration-ready
stream of CO2 from the reducer. So far, the chemical looping process has been used to
generate H2 and/or electricity using syngas, coal and biomass as feedstock.115,116,117
Nevertheless, it is a highly versatile process and can be used for syngas generation using
natural gas/CH4 as its feedstock. CH4 is converted to syngas in the reducer via oxygen
transferred from the metal oxide based oxygen carriers. Such a process was
conceptualized at the Ohio State University (OSU) for the utilization of shale gas, termed
as the Shale gas to Syngas (STS) Process.118
The schematic of this process is seen in
Figure 57. Syngas with a 2:1 H2: CO ratio can be obtained by controlling the oxygen
carrier circulation rate in the system, and thereby the extent of reduction of the oxygen
carriers in the reducer. This process has been demonstrated experimentally at various
scales at atmospheric pressure.118
Therefore, syngas generation via chemical looping can
be developed into an efficient, economic and environment friendly process that
overcomes the issues associated with the existing processes. However, experimental
165
kinetic investigations for the effect of pressure on this system are relatively sparse. Most
existing studies on CH4-to-syngas conversion using metal oxides are focused on Nickel
(Ni) based complex oxides, due to its catalytic capabilities for the reforming
reaction.111,119,13
Some of the other metal oxides studied for CH4-to-syngas application
include copper (Cu), iron (Fe), and manganese (Mn).120,121
This study has been conducted
from the perspective of such redox systems using iron (Fe)-based oxides, which have the
potential to be more economical if operated at elevated pressures. The bimetallic system
has been investigated at OSU for the STS process in the form of iron-titanium complex
metal oxides (ITCMO) particles designed for this process. The operating conditions of
STS process have been determined through detailed thermodynamic and process
analysis.118
Therefore, it is essential that the ITCMO particles be tested for the effect of
pressure on the reactions rates. The present study is intended to accomplish this objective.
Developing the solid oxide based redox system for high pressure partial oxidation of CH4
is a multi-optimization problem, which requires careful manipulation of each operating
parameter to maximize performance, and to reduce the overall cost. These parameters
include (but are not limited to) gas to solid loading ratio, choice of reactor operation such
as moving bed vs fluidized bed, co-current and countercurrent gas solid flow, precise
control of the gas and solids residence times in each reactor to obtain the desired
oxidation state of the solids. Each of these parameters is equally crucial and deserves
separate attention and in-depth analysis. Nevertheless, in this study, the reduction and
oxidation kinetics of ITCMO oxygen carriers, developed at OSU, have been studied at
pressures ranging from 1-10 atm using H2/CH4 for reduction and air for oxidation.122
166
Change in reaction kinetics may influence the reducer sizes, the processing capacity and
consequently, the process economics. The purpose of this study is to demonstrate the
effect of pressure on the reaction rates of the ITCMO particles for CH4-to-syngas
conversion. Although the reducing environment of interest is CH4, H2 has been used as
the reducing gas for a major part of the study as H2 reduction reaction is well understood
and relatively easier to operate. It provides a clear understanding of the kinetics without
the interference of coking, which is observed with CH4 as the reducing gas. Furthermore,
the effect of pressure that is discussed in case of H2 can be extrapolated to other reducing
environments. The results presented are that of kinetic experiments carried out in a
thermogravimetric apparatus. It has been demonstrated in this work that higher pressures
are kinetically favorable for H2 and CH4 reduction and to a lesser extent air re-oxidation
of the metal oxides. This work also briefly discusses the advent of coking and its
response to elevated pressures.
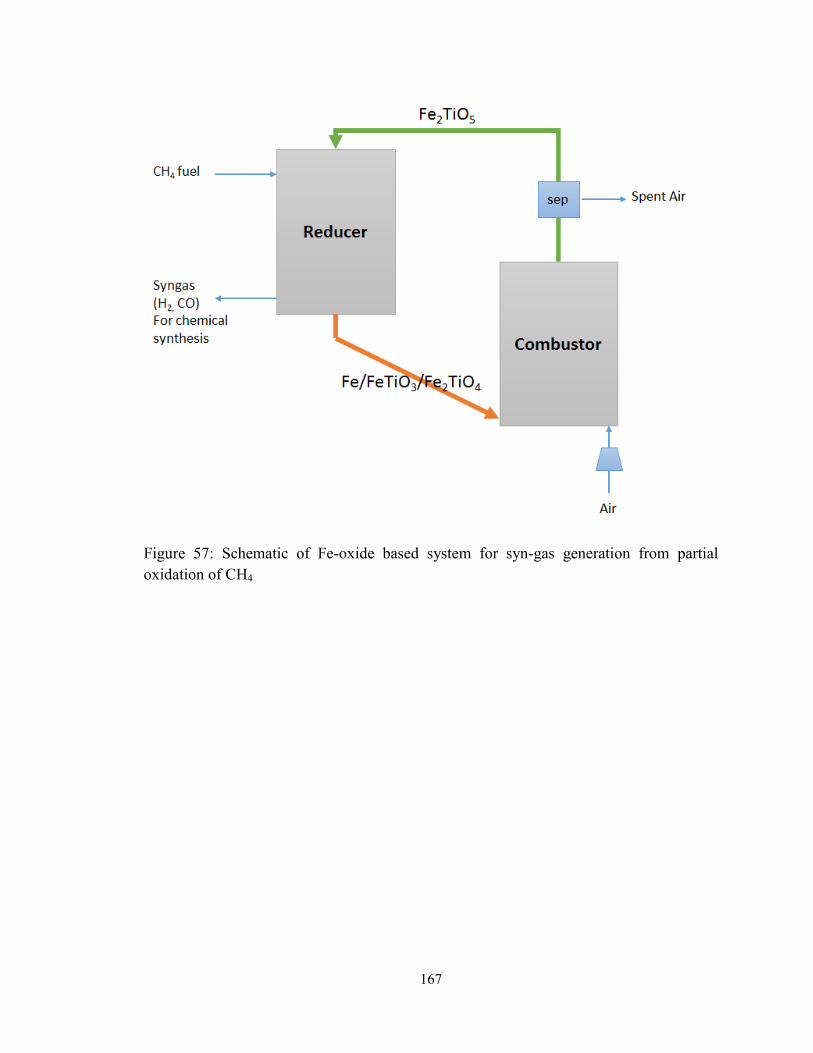
167
Figure 57: Schematic of Fe-oxide based system for syn-gas generation from partial
oxidation of CH4
168
6.2 Thermodynamic analysis
The thermodynamic analysis of the reducer was conducted using HSC Chemistry
(OutoKumptu Research Oy, version 6.0). As stated earlier, the process of partially
oxidizing CH4 for production of syngas using the oxygen carrier particles causes coking
or C soot formation123
. Operating the system at elevated pressures exacerbates this
condition. To understand the thermodynamic equilibrium limits of operating this system
at elevated pressures and its effect on the soot formation, the reducer species were
simulated via Gibbs free energy minimization at elevated pressures (up to 10 atm). The
Fe-Ti bimetallic system is used for simulating the ITCMO oxygen carrier particles.
Various metal oxides are widely studied in literature for partial oxidation of CH4 for
syngas production. Of these, the single metal oxides such as Ce, Ni, and Fe oxide systems
were selected for their comparison with the ITCMO system. A temperature sensitivity
analysis was performed for these systems. The parameters studied were syngas purity,
and overall CH4 conversion. The syngas purity is defined as
𝑆𝑦𝑛𝑔𝑎𝑠 𝑃𝑢𝑟𝑖𝑡𝑦 =𝑚𝑜𝑙𝑒𝑠 𝑜𝑓 𝐶𝑂 + 𝑚𝑜𝑙𝑒𝑠 𝑜𝑓𝐻2
𝑚𝑜𝑙𝑒𝑠 𝑜𝑓 𝑎𝑙𝑙 𝑔𝑎𝑠𝑒𝑜𝑢𝑠 𝑠𝑝𝑒𝑐𝑖𝑒𝑠
The temperature range selected was 900 to 1100°C as applicable to a partial oxidation
system operation. An equimolar ratio of active metal oxide to CH4 was simulated.
Pressures of 1 and 10 bar were used. The results are shown in Figure 58.
Ce-CH4 system shows excellent syngas purity as well as high CH4 conversion (Figure
58a), making Ce-based systems thermodynamically most suitable for partial oxidation
169
applications. However, the slow kinetics of the Ce-oxides coupled with the high cost
inhibits further development of Ce-based oxygen carriers for commercial applications.
The Ni-based system exhibits lower syngas purity as compared to the Ce system,
although the overall CH4 conversion is high (Figure 58b). As compared to Ce and Ni
systems, the Fe-based systems show superior CH4 conversions at the conditions
employed here. The syngas purity as well as CH4 overall conversion is negatively
affected by increase in pressure, in accordance to le-Chatelier’s principle for the volume
expansion reactions of partial and complete oxidation of CH4. The CH4 conversion
increases with temperature for all the systems, at both pressures considered here. For the
Fe and Fe-Ti system (Figure 58(c) and (d)), the syngas purity drops with increase in
temperature, but the total CH4 conversion goes on increasing. In other words, at higher
temperatures, complete oxidation of CH4 to CO2 and H2O is more favorable than at lower
temperatures. The syngas purity obtained in the pure Fe system (Figure 58c) is much
lower than that of Fe-Ti system (Figure 58d), indicating a higher propensity of complete
oxidation of CH4 in presence of Fe-oxide alone.
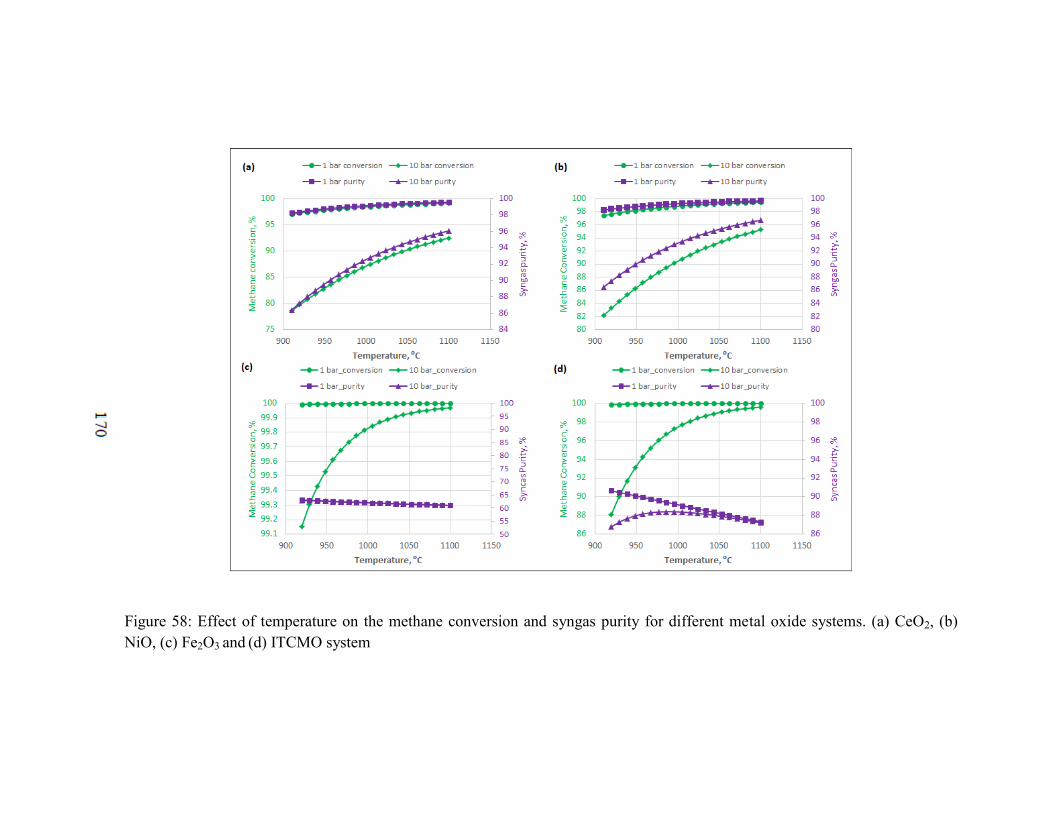
170
Figure 58: Effect of temperature on the methane conversion and syngas purity for different metal oxide systems. (a) CeO2, (b)
NiO, (c) Fe2O3 and (d) ITCMO system
171
Additionally, the ITCMO system was studied at isothermal and isobaric conditions.
Conversion of CH4 to syngas is carried out by partial oxidation using hematite (Fe2O3) as
the reactive phase from the ITCMO oxygen carriers. The titanium oxide (TiO2) phase is
assumed to be non-reactive. In its simplest form, the theoretical desirable reaction is
1/3 Fe2O3 + CH4 → CO + 2H2 + 2/3 Fe Rxn 24
Thus CH4 is partially oxidized to form syngas, a mixture of CO and H2, and the Fe2O3 is
completely reduced to elemental Fe. However, thermodynamically, the reduction of
Fe2O3 goes through the progressively different reduced phases of iron oxide, namely
magnetite (Fe3O4), wüstite (FeO), and finally the completely reduced form of elemental
Fe. All of these phases are likely to be present. Similarly, along with the formation of H2
and CO, CH4 oxidation also results in complete combustion (to CO2 and H2O) as well as
formation of elemental C. Accordingly, the reactive system was simulated with the
following species in the gaseous state: CH4, H2, CO, CO2, H2O, and following species in
solid state: C, Fe, FeO, Fe3O4, Fe2O3, Fe2TiO5 and FeTiO3. Isothermal and isobaric
systems were simulated at 950 ˚C, and 1, 5, and 10 atm. The solid loading was assumed
to be in the forms of fully oxidized Fe and Ti metallic species. The gaseous input of CH4
was incrementally added, and the outlet species were analyzed for solid and gas
equilibrium compositions at minimum Gibbs free energy, at fixed T and P values.
As expected, TiO2 remains largely unreacted while compounds of Fe undergo sequential
reduction with increasing CH4 loading, from fully oxidized to fully reduced form, both in
pure Fe-O as well as Fe-Ti-O complex phases. The equilibrium amount of FeTiO3 and
172
Fe2TiO5 are found to be negligible, and therefore for simplicity, only pure Fe-O phases
are considered for the remainder of this discussion.
For all pressures, overall CH4 conversion was found to be >99% for the range of gas:
solid ratios tested, which was varied between 0.05 to 1.5 of moles of CH4 per mole of
Fe2O3. This range was chosen due to the fact that all four oxidation states of Fe are found
to exist in this range. The conversion was found to increase as the gas: solid ratio was
increased. As expected, solid C formation is observed simultaneously with the formation
of elemental Fe. This C amount is higher at higher pressures. This is in agreement with
our experimental findings, discussed further in section 6.4.2. For example, at the
CH4:Fe2O3 ratio of 1.5, comparison of the C formed at 10 atm and 1 atm reveals that the
equilibrium C amount at 10 atm is approximately 8 times that of 1 atm. The same
comparison between 5 and 1 atm shows that equilibrium C formation at the same ratio is
4.5 times that of 1 atm. The C deposition is shown as a function of gas-solid ratio in
Figure 59 at 5 atm and 950 ˚C. The figure clearly shows the simultaneous onset of
elemental Fe formation and C deposition.
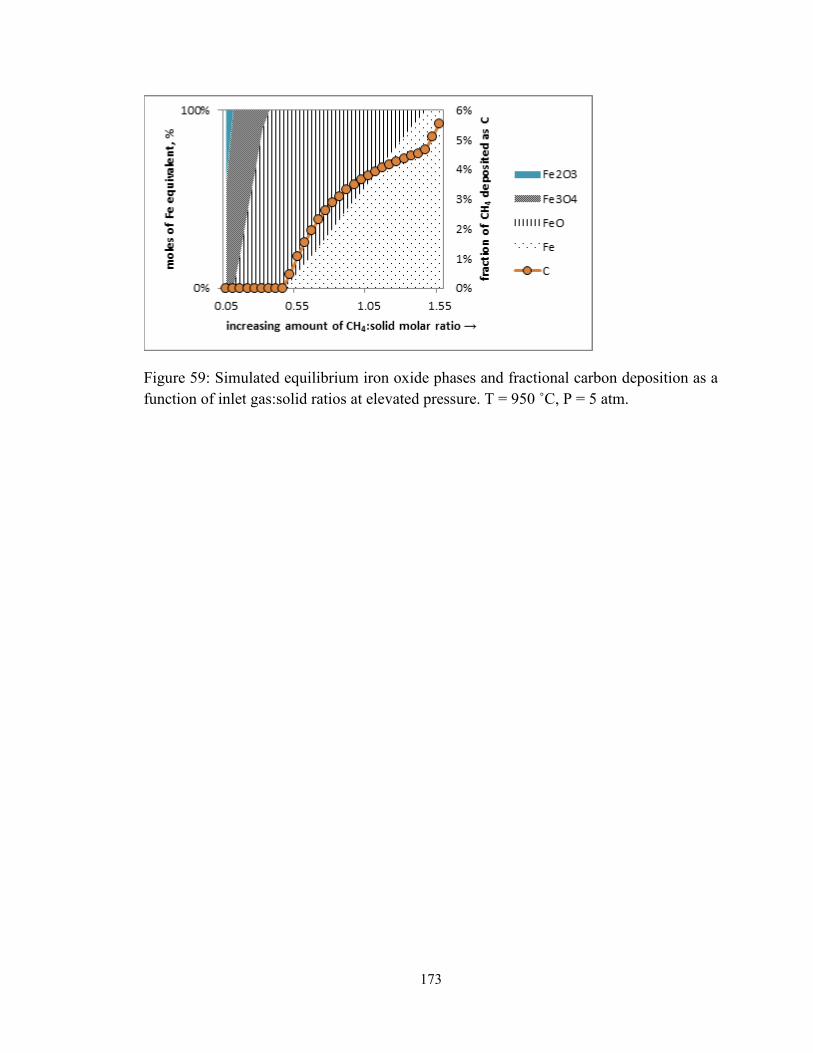
173
Figure 59: Simulated equilibrium iron oxide phases and fractional carbon deposition as a
function of inlet gas:solid ratios at elevated pressure. T = 950 ˚C, P = 5 atm.
174
In addition, this thermodynamic analysis reveals that increase in system pressure from 1
to 10 atm results in an increase in the formation of CO2 and H2O, along with a slight
decrease in the formation of desirable H2 and CO, as well as overall CH4 conversion.
However, increase in system pressure is found to have a favorable impact on equilibrium
H2:CO ratio, which is desired ~2 for downstream processing such as Fischer-Tropsch
synthesis. The carbon deposition can be managed by careful manipulation of the gas solid
ratios in the moving bed reducer reactor system.118
The HSC Chemistry thermodynamic software (version 6.0, Outokumptu Research Oy)
was used to calculate the equilibrium composition of the heterogeneous reaction mixture.
The Gibbs free energy minimization technique is used to calculate the composition of all
reactants and product species.
Equilibrium composition of the specified system is a function of temperature, pressure,
and the relative ratios of raw/starting materials. If complete reduction of the metal oxide
particle is considered, 1 mole of Fe2O3 oxidizes 3 moles of CH4 according to reaction 24
above.
Due to the various oxide species of Fe, different gas compositions are in equilibrium with
the solid at the reaction conditions at different Fe2O3 inlet loading. The goal is to
maximize the amount of conversion of methane while using minimum loading of Fe2O3.
This optimum conversion of methane will achieve close to 2:1 ratio of H2 and CO in the
syngas product.
The following results in Table 12 are obtained for optimum conversion of CH4.
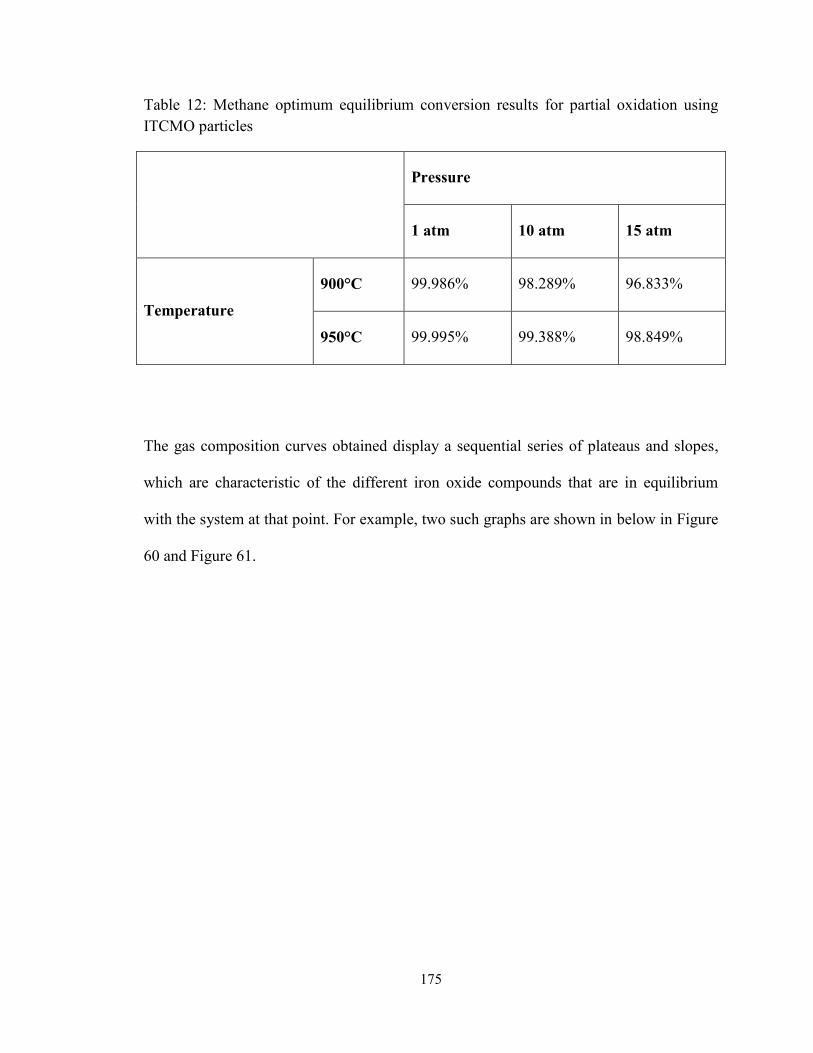
175
Table 12: Methane optimum equilibrium conversion results for partial oxidation using
ITCMO particles
Pressure
1 atm 10 atm 15 atm
Temperature
900°C 99.986% 98.289% 96.833%
950°C 99.995% 99.388% 98.849%
The gas composition curves obtained display a sequential series of plateaus and slopes,
which are characteristic of the different iron oxide compounds that are in equilibrium
with the system at that point. For example, two such graphs are shown in below in Figure
60 and Figure 61.
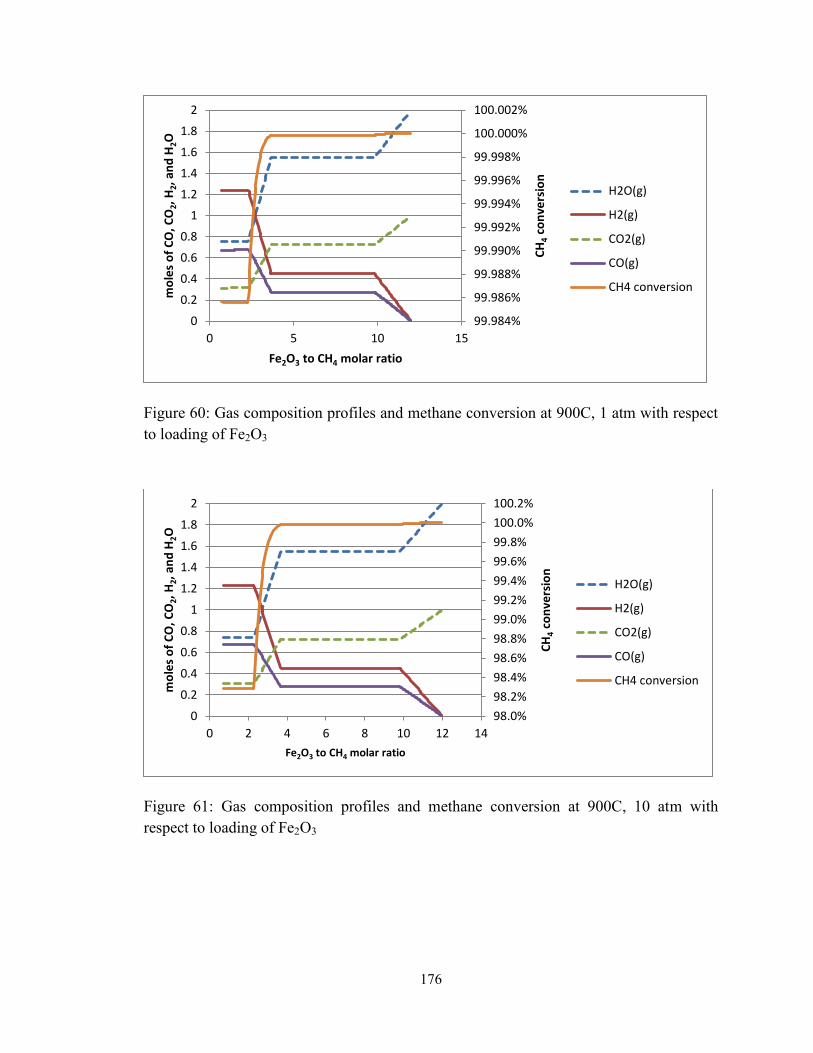
176
Figure 60: Gas composition profiles and methane conversion at 900C, 1 atm with respect
to loading of Fe2O3
Figure 61: Gas composition profiles and methane conversion at 900C, 10 atm with
respect to loading of Fe2O3
99.984%
99.986%
99.988%
99.990%
99.992%
99.994%
99.996%
99.998%
100.000%
100.002%
0
0.2
0.4
0.6
0.8
1
1.2
1.4
1.6
1.8
2
0 5 10 15
CH
4 co
nve
rsio
n
mo
les
of
CO
, CO
2, H
2, a
nd
H2O
Fe2O3 to CH4 molar ratio
H2O(g)
H2(g)
CO2(g)
CO(g)
CH4 conversion
98.0%
98.2%
98.4%
98.6%
98.8%
99.0%
99.2%
99.4%
99.6%
99.8%
100.0%
100.2%
0
0.2
0.4
0.6
0.8
1
1.2
1.4
1.6
1.8
2
0 2 4 6 8 10 12 14
CH
4 c
on
vers
ion
mo
les
of
CO
, CO
2, H
2, a
nd
H2O
Fe2O3 to CH4 molar ratio
H2O(g)
H2(g)
CO2(g)
CO(g)
CH4 conversion
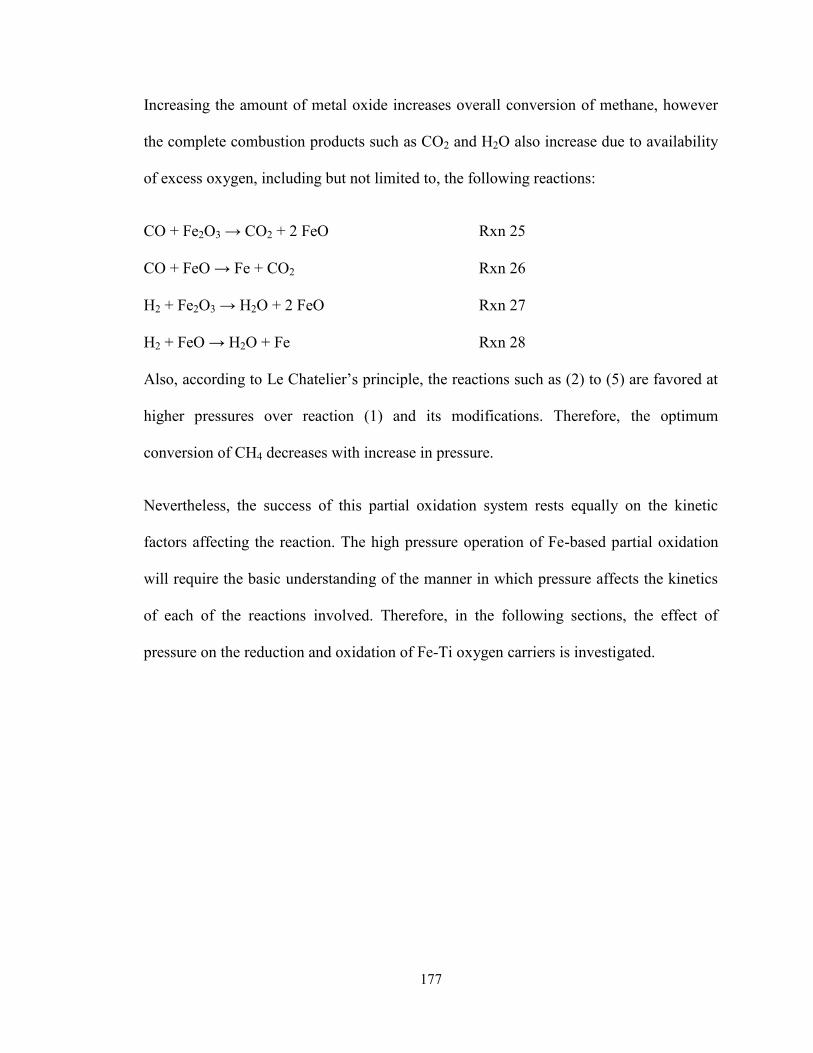
177
Increasing the amount of metal oxide increases overall conversion of methane, however
the complete combustion products such as CO2 and H2O also increase due to availability
of excess oxygen, including but not limited to, the following reactions:
CO + Fe2O3 → CO2 + 2 FeO Rxn 25
CO + FeO → Fe + CO2 Rxn 26
H2 + Fe2O3 → H2O + 2 FeO Rxn 27
H2 + FeO → H2O + Fe Rxn 28
Also, according to Le Chatelier’s principle, the reactions such as (2) to (5) are favored at
higher pressures over reaction (1) and its modifications. Therefore, the optimum
conversion of CH4 decreases with increase in pressure.
Nevertheless, the success of this partial oxidation system rests equally on the kinetic
factors affecting the reaction. The high pressure operation of Fe-based partial oxidation
will require the basic understanding of the manner in which pressure affects the kinetics
of each of the reactions involved. Therefore, in the following sections, the effect of
pressure on the reduction and oxidation of Fe-Ti oxygen carriers is investigated.
178
6.3 Experimental setup, materials and procedure:
A magnetic suspension balance (MSB, Rubotherm GmbH, US-2004-00162) was used for
the high pressure thermogravimetric analysis (TGA) experiments. The schematic of the
MSB setup is shown in Figure 39 in Chapter 5, section 5.4.2. Different pure gas bottles
(H2, CH4, N2, and Air) were connected through a battery of mass flow controllers and
valves to the TGA assembly. A pressure transducer upstream of the sample cell measures
and records the pressure of the sample during the experiment. Downstream of the sample
cell, a back pressure regulator (BPR) is installed to regulate the pressure in the sample
cell. The gas was preheated prior to entering the TGA assembly by means of heating
tapes. The unique working principle of the MSB allows the sample weight and the
balance to be connected via magnetic coupling, and therefore the balance is isolated from
(and not affected by) the reaction environment. This principle allows the use of high
pressure and highly corrosive environments in the sample cell. The section of the TGA
housing the magnetic coupling is maintained at 140oC by means of a heat jacket
connected to an oil bath. The reaction temperature in the sample cell is maintained
independently by means of an electric furnace.
179
The gas mass flow rates were fixed such that the gas space velocity experienced by the
sample was constant at all pressure experiments (~1 min-1
for the volume of the sample
cell). The sample was heated in the inert flow of N2. When the reaction pressure and
temperature were achieved, the gases were switched to introduce the reaction mixture in
the sample cell. The sample weight, temperature and pressure were recorded as a function
of time.
Knowing the composition of the oxygen carrier particle, the theoretical maximum weight
loss (complete reduction) and gain (complete oxidation) was calculated. These numbers
were used to calculate the extent of each reaction. Specifically, for each sample the
theoretical maximum weight loss during reduction (∆𝑤𝑚𝑎𝑥𝑟𝑒𝑑 ) is calculated on the basis of
the active weight of the sample. During the experiment, the weight change due to
reduction (∆𝑤𝑟) at any instant is then used to compute the extent of reduction by the
following formula:
𝑒𝑥𝑡𝑒𝑛𝑡 𝑜𝑓 𝑟𝑒𝑑𝑢𝑐𝑡𝑖𝑜𝑛 = ∆𝑤𝑟
∆𝑤𝑚𝑎𝑥𝑟𝑒𝑑 𝑥100%
Similarly, in case of oxidation,
𝑒𝑥𝑡𝑒𝑛𝑡 𝑜𝑓 𝑜𝑥𝑖𝑑𝑎𝑡𝑖𝑜𝑛 = ∆𝑤𝑜
∆𝑤𝑚𝑎𝑥𝑜𝑥 𝑥100%
Where
∆𝑤𝑜= weight change due to oxidation
180
∆𝑤𝑚𝑎𝑥𝑜𝑥 = theoretical maximum weight gain during oxidation
Through the remainder of this article, a general term X is used to indicate the reaction
conversion, or extent of reaction for reduction and oxidation alike, as applicable to the
discussion. The X values were plotted for each experiment vs time (minutes), to obtain
the thermogravimetric conversion curves. These curves were then used to compute the
instantaneous rates of reaction, denoted by dX/dt, per minute.
Samples of ITCMO particles (0.1 g) were collected after selected experiments and
mechanically crushed to a powdered form and sieved to the appropriate particle size. X-
Ray Diffraction (XRD) was performed on the powdered specimens with a Rigaku
SmartLab X-ray diffractometer. Additionally, specimens were also examined by
Scanning Electron Microscopy (SEM) using e-beam imaging of an FEI Helios
NanoLab600 DualBeam system. To obtain high quality cross-section imaging, focused
ion beam (FIB) was generated using gallium ion source at an accelerating voltage of 30
kV for cross-sectional milling for in-situ SEM observation. The 2-D material mapping
was obtained using Oxford Energy Dispersive X-ray Spectrometry (EDS) at an
accelerating voltage of 20 kV. Additionally, a NOVA 4200e Quantachrome Brunauer-
Emmett-Teller (BET) analyzer was used to measure the pore volume and surface area of
samples using N2 sorption.
6.4 Results and discussion
To study the effect of pressure on the rates of reactions involved in partial oxidation
system, isothermal experiments of reduction and oxidation were conducted in reducing
181
environment of H2 and CH4, and the oxidizing environment of air. The rates of reactions
were then compared by calculating the rates from the solid conversion curves obtained
from the TGA.
6.4.1 Reduction in H2
The reduction of the oxygen carrier samples was conducted isothermally at 900°C using
H2 as the reducing agent, at various operating conditions of gas concentration and partial
pressure. The parameters studied for H2 reduction include partial pressure (𝑃𝑃𝐻2), total
system pressure, and mole fraction of H2 (𝑌𝐻2).
The weight loss of the sample corresponds to the total amount of oxygen lost by the
sample during reduction. Therefore, the reduction conversion is calculated assuming
100% reduction at complete weight loss of sample, or the most reduced state of Fe. In
this manner, reduction conversion was calculated and plotted. The rates of reaction are
calculated graphically calculated at X = 0.5 and 0.75 reduction conversion values at the
various conditions tested, and exhibit similar trends.
6.4.1.1 Constant partial pressure of H2 (𝑷𝑷𝑯𝟐)
The isothermal isobaric experiments were conducted to observe the rates of reaction at
different total gas pressures, with constant partial pressure of reducing agent. The TGA
conversion curves were compared at different total pressures of the system, at three
different partial values of 𝑃𝑃𝐻2 of 1, 1.5 and 3 atm. At a constant value of 𝑃𝑃𝐻2
, the
increase in the overall system pressure resulted in decrease in mole fraction of H2 (𝑌𝐻2).
The rate of reaction is found to decrease with increase in total pressure of the system at
182
each value of constant 𝑃𝑃𝐻2. Similar results have been reported in the past on metal oxide
reduction reactions. For example, Garcı´a-Labiano et al. have reported decrease in
reduction reaction rate with an increase in system pressure at 𝑃𝑃𝐻2 and 𝑃𝑃𝐶𝑂 values of 1
atm for Fe, Cu, and Ni based metal oxides.124
The negative effect of pressure on various
reactions has been previously observed by other researchers, and explained by factors
such as increase in product gas volume upon reaction, or increased diffusion resistance
through the product layer at higher pressures.125,126,127
Thus, the same set of data is
plotted in two different ways. In Figure 62 the rates of reaction are plotted against the
total system pressure, and in Figure 63 the same rate values are plotted against the
respective 𝑌𝐻2 values. For example, comparing the experiments conducted at system
pressure of 3 atm, the three different experiments at this pressure value would correspond
to the three different values of 𝑃𝑃𝐻2 of 1, 1.5 and 3 atm. The rates of reduction for these
three experiments fall on a vertical straight line of Figure 62, at x axis value of 3 atm. At
this system pressure of 3 atm, the mole fractions 𝑌𝐻2 are, however, widely different.
𝑃𝑃𝐻21 atm at a system pressure of 3 atm results in a 𝑌𝐻2
value of 33%. 𝑃𝑃𝐻2 = 1.5 atm at
the system pressure of 3 atm is at a 𝑌𝐻2 = 50%. And finally, at 𝑃𝑃𝐻2
= 3 atm, 𝑌𝐻2 is
obviously 100%. This is true for all the values of pressure along the x-axis of Figure 62,
i.e. the curve for 𝑃𝑃𝐻2 = 3 atm is always at highest mole fractions of the reducing gas
(𝑌𝐻2), which seems to be a crucial factor contributing to the superior rates of reaction
observed. The entire set of experimental conditions is given in Table 13.
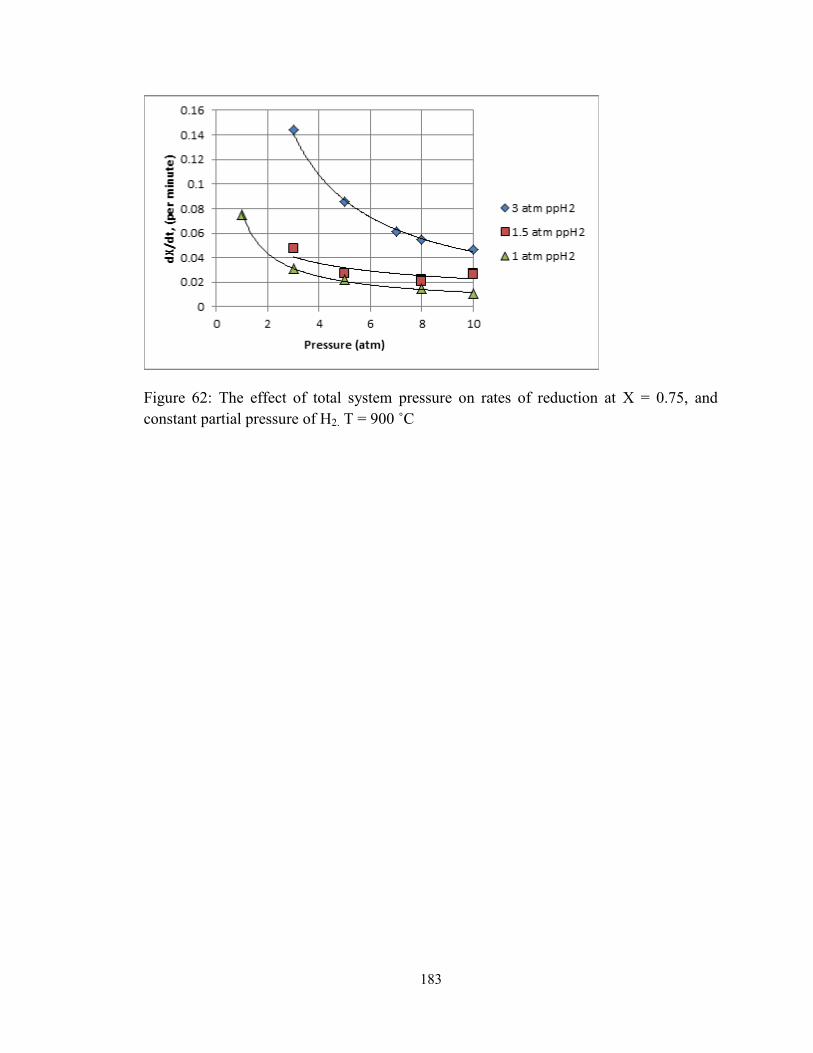
183
Figure 62: The effect of total system pressure on rates of reduction at X = 0.75, and
constant partial pressure of H2. T = 900 ˚C
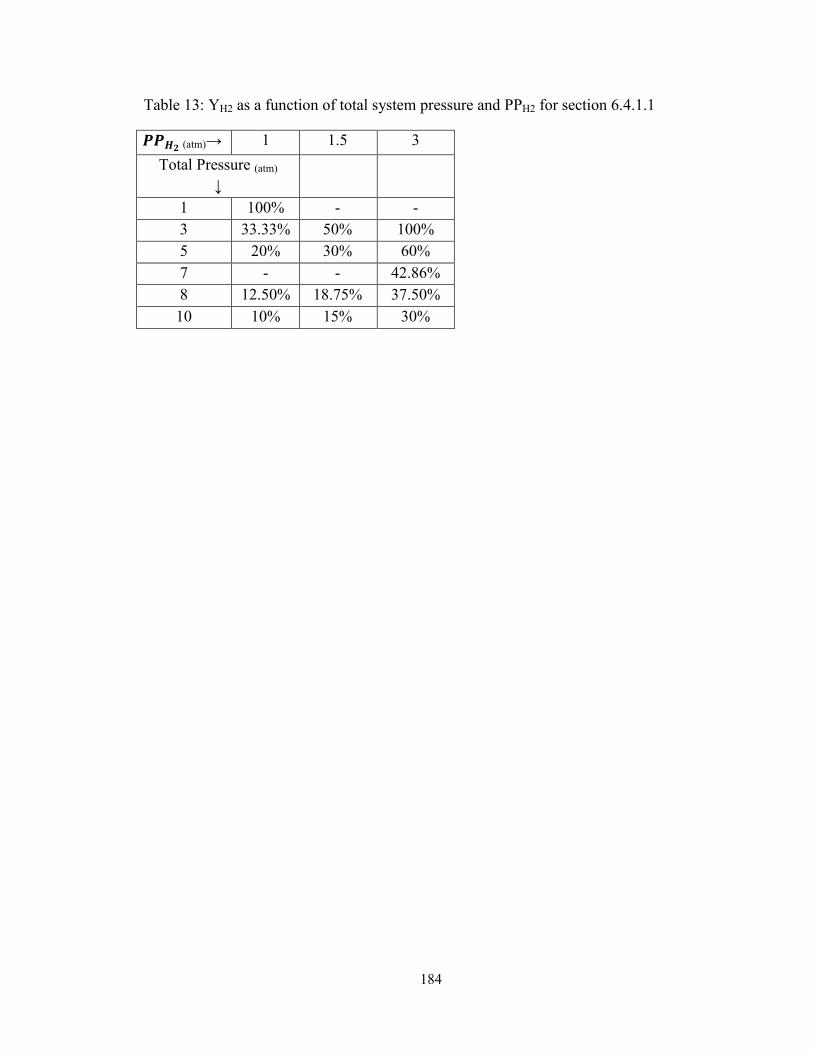
184
Table 13: YH2 as a function of total system pressure and PPH2 for section 6.4.1.1
𝑷𝑷𝑯𝟐 (atm)→ 1 1.5 3
Total Pressure (atm)
↓
1 100% - -
3 33.33% 50% 100%
5 20% 30% 60%
7 - - 42.86%
8 12.50% 18.75% 37.50%
10 10% 15% 30%
185
The curves of rate vs system pressure seem to converge at higher pressure. This can be
explained by the fact that the 𝑃𝑃𝐻2 values chosen here are relatively low, and therefore at
high system pressures the 𝑌𝐻2 values are closer. By contrast, at lower system pressure, the
rate curves are further apart which correspond to the disparity in 𝑌𝐻2 values at those
conditions (see Table 13), which increases at lower pressure.
In Figure 63, the same data is plotted against mole fraction of H2 (𝑌𝐻2). Following the
same logic, the rates can be compared at similar values of 𝑌𝐻2. In the vicinity of 𝑌𝐻2
= 30-
33%, even though the mole fraction of H2 is so similar, the system pressure values for the
three curves are 3, 5 and 10 atm. Therefore, it is observed that the higher 𝑃𝑃𝐻2 values
expectedly play a part in increasing the rate of reduction. When the rate values are plotted
in this manner as a function of 𝑌𝐻2, the plots are linear; indicating a direct proportionality
between the rate and mole fraction of reacting gas. However, the plots converge at lower
𝑌𝐻2 values (which correspond to the high pressure experiments, towards the positive x-
axis direction in Figure 62). Regardless of the manner of analysis, it is plainly seen that at
higher values of constant partial pressure of the reducing gas a higher rate of the
reduction of solid oxide ITCMO particles is achieved.
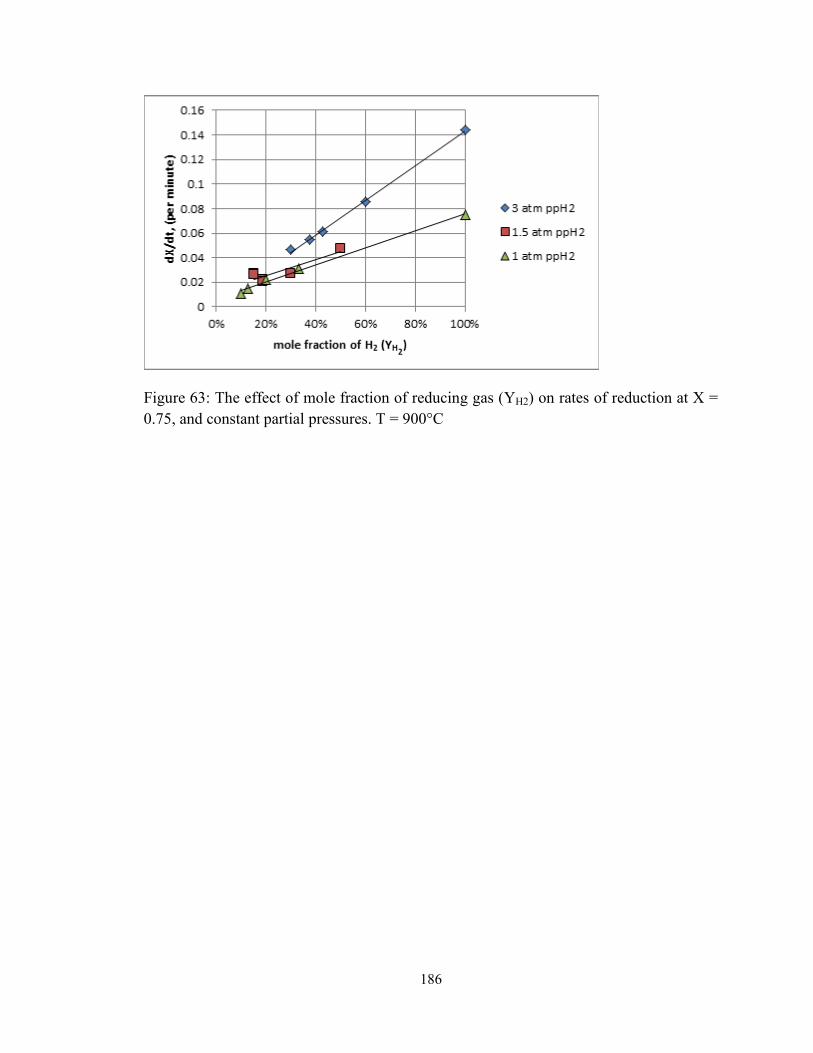
186
Figure 63: The effect of mole fraction of reducing gas (YH2) on rates of reduction at X =
0.75, and constant partial pressures. T = 900°C
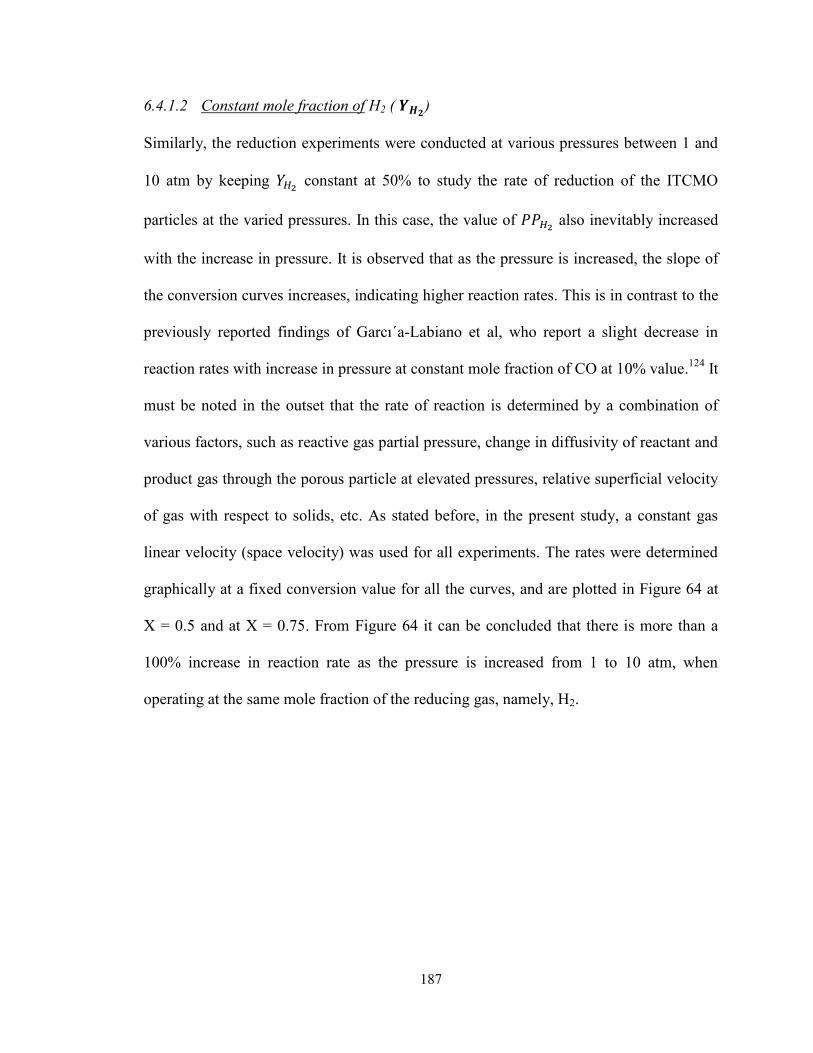
187
6.4.1.2 Constant mole fraction of H2 ( 𝒀𝑯𝟐)
Similarly, the reduction experiments were conducted at various pressures between 1 and
10 atm by keeping 𝑌𝐻2 constant at 50% to study the rate of reduction of the ITCMO
particles at the varied pressures. In this case, the value of 𝑃𝑃𝐻2 also inevitably increased
with the increase in pressure. It is observed that as the pressure is increased, the slope of
the conversion curves increases, indicating higher reaction rates. This is in contrast to the
previously reported findings of Garcı´a-Labiano et al, who report a slight decrease in
reaction rates with increase in pressure at constant mole fraction of CO at 10% value.124
It
must be noted in the outset that the rate of reaction is determined by a combination of
various factors, such as reactive gas partial pressure, change in diffusivity of reactant and
product gas through the porous particle at elevated pressures, relative superficial velocity
of gas with respect to solids, etc. As stated before, in the present study, a constant gas
linear velocity (space velocity) was used for all experiments. The rates were determined
graphically at a fixed conversion value for all the curves, and are plotted in Figure 64 at
X = 0.5 and at X = 0.75. From Figure 64 it can be concluded that there is more than a
100% increase in reaction rate as the pressure is increased from 1 to 10 atm, when
operating at the same mole fraction of the reducing gas, namely, H2.
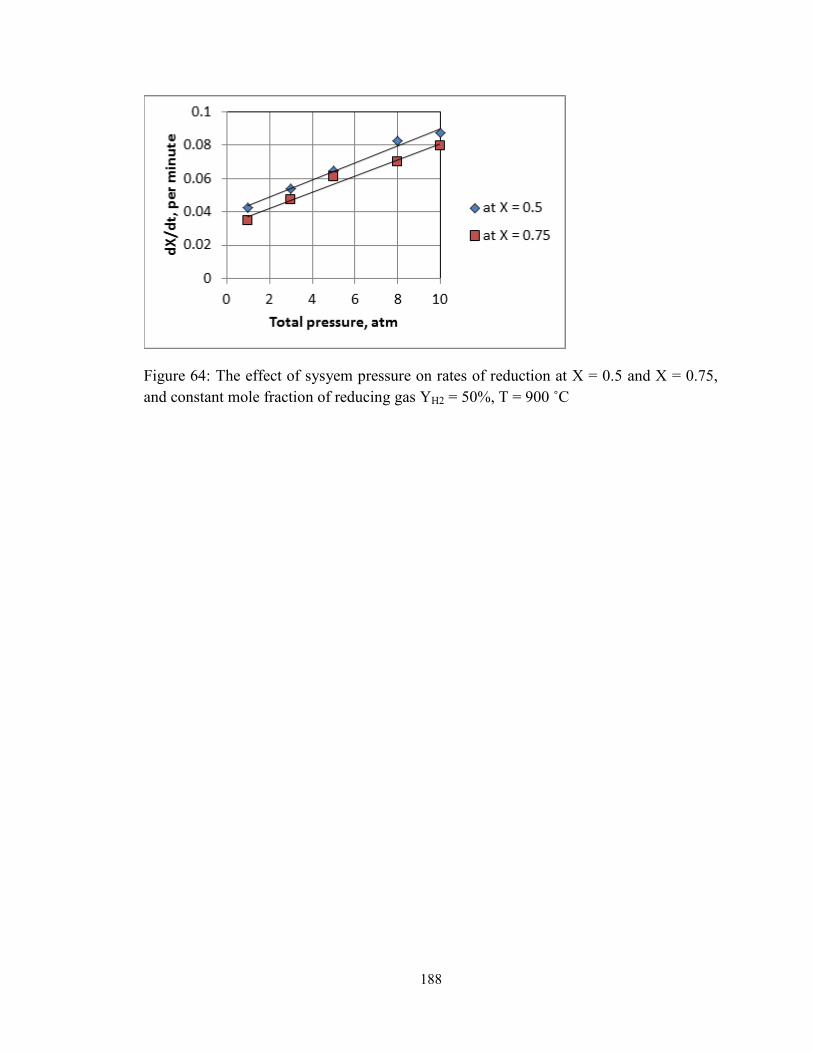
188
Figure 64: The effect of sysyem pressure on rates of reduction at X = 0.5 and X = 0.75,
and constant mole fraction of reducing gas YH2 = 50%, T = 900 ˚C
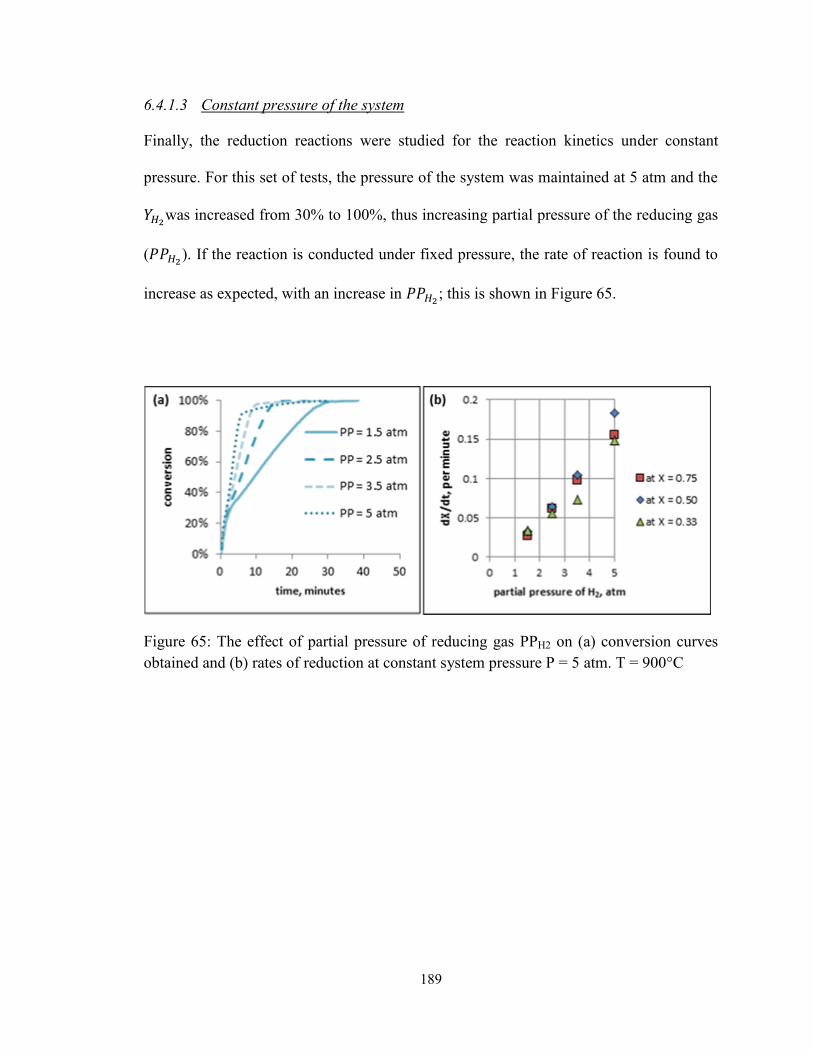
189
6.4.1.3 Constant pressure of the system
Finally, the reduction reactions were studied for the reaction kinetics under constant
pressure. For this set of tests, the pressure of the system was maintained at 5 atm and the
𝑌𝐻2was increased from 30% to 100%, thus increasing partial pressure of the reducing gas
(𝑃𝑃𝐻2). If the reaction is conducted under fixed pressure, the rate of reaction is found to
increase as expected, with an increase in 𝑃𝑃𝐻2; this is shown in Figure 65.
Figure 65: The effect of partial pressure of reducing gas PPH2 on (a) conversion curves
obtained and (b) rates of reduction at constant system pressure P = 5 atm. T = 900°C
190
6.4.2 Reduction in CH4
The same experiments as section 6.4.1 of this chapter were repeated with CH4 as the
reducing gas instead of H2. As indicated in section 6.2, it was observed that the reduction
of oxygen carrier particles with CH4 as the reducing agent results in the formation of
elemental C. This is evidenced by the soot formation and weight increase of the sample
beyond a certain point. The C deposition is observed when the oxygen carrier reaches a
certain degree of reduction conversion, and is always after elemental Fe phase has been
formed. Thus, in order to study the reaction kinetics of the reduction of oxygen carrier
materials in presence of CH4, the reaction is arrested at or before the initiation of C
deposition. Accordingly, experiments were conducted by adjusting the procedure and
allowing the maximum possible reduction of particles, till the onset of C deposition.
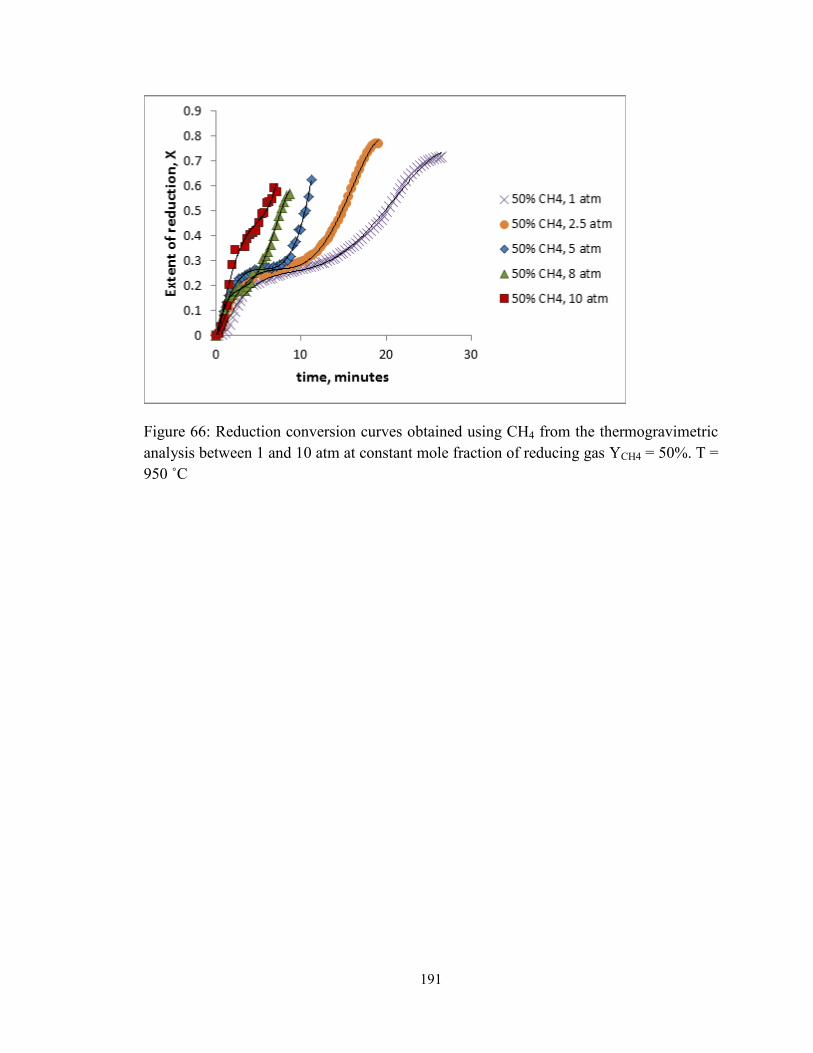
191
Figure 66: Reduction conversion curves obtained using CH4 from the thermogravimetric
analysis between 1 and 10 atm at constant mole fraction of reducing gas YCH4 = 50%. T =
950 ˚C
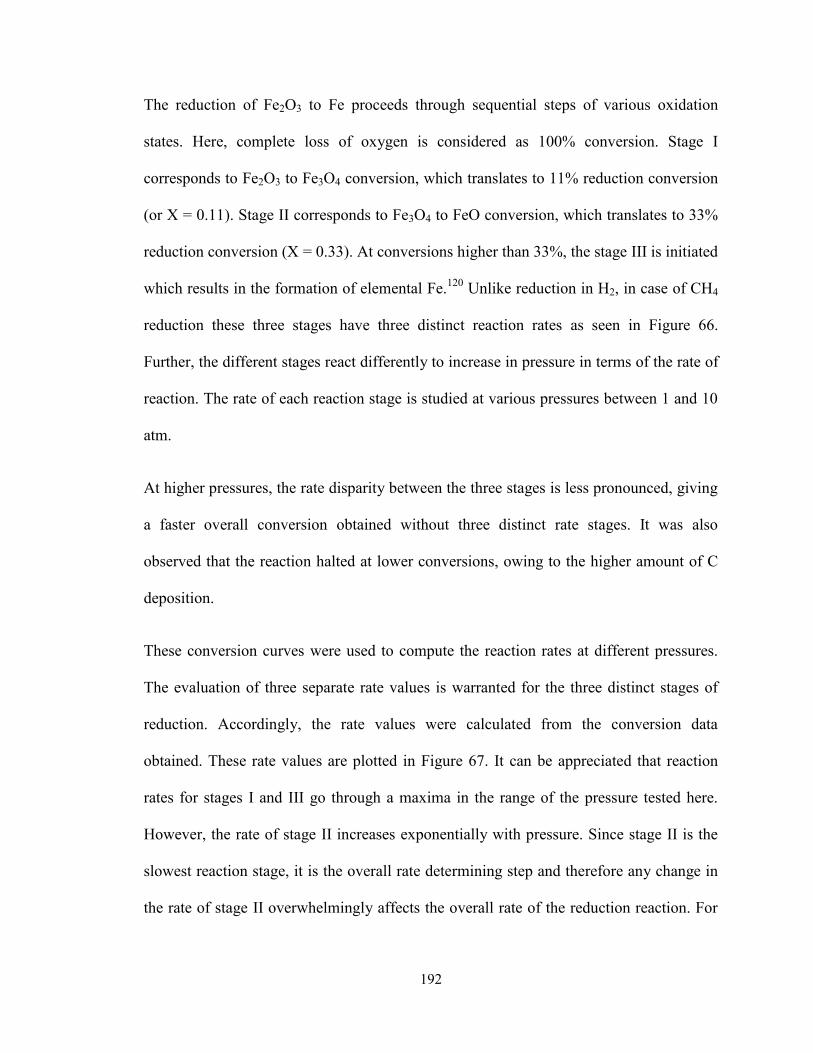
192
The reduction of Fe2O3 to Fe proceeds through sequential steps of various oxidation
states. Here, complete loss of oxygen is considered as 100% conversion. Stage I
corresponds to Fe2O3 to Fe3O4 conversion, which translates to 11% reduction conversion
(or X = 0.11). Stage II corresponds to Fe3O4 to FeO conversion, which translates to 33%
reduction conversion (X = 0.33). At conversions higher than 33%, the stage III is initiated
which results in the formation of elemental Fe.120
Unlike reduction in H2, in case of CH4
reduction these three stages have three distinct reaction rates as seen in Figure 66.
Further, the different stages react differently to increase in pressure in terms of the rate of
reaction. The rate of each reaction stage is studied at various pressures between 1 and 10
atm.
At higher pressures, the rate disparity between the three stages is less pronounced, giving
a faster overall conversion obtained without three distinct rate stages. It was also
observed that the reaction halted at lower conversions, owing to the higher amount of C
deposition.
These conversion curves were used to compute the reaction rates at different pressures.
The evaluation of three separate rate values is warranted for the three distinct stages of
reduction. Accordingly, the rate values were calculated from the conversion data
obtained. These rate values are plotted in Figure 67. It can be appreciated that reaction
rates for stages I and III go through a maxima in the range of the pressure tested here.
However, the rate of stage II increases exponentially with pressure. Since stage II is the
slowest reaction stage, it is the overall rate determining step and therefore any change in
the rate of stage II overwhelmingly affects the overall rate of the reduction reaction. For

193
example it can be seen from Figure 66 that at 10 atm, 33% reduction is achieved in
almost 1/7th
of the time taken at 1 atm; and similarly, 60% reduction is achieved in 1/3rd
of the time.
194
Figure 67: The effect of system pressure on reaction rate for the three-step reduction with
CH4 as the reducing gas. YCH4 = 50%, T = 950°C, P = 1 to 10 atm
195
Increase in pressure, specifically at constant mole fraction of the reacting gas, results in
increase in concentration of the active species in the gas phase. This increased
concentration of gaseous species inevitably results in increased reaction rate, which is
also reported earlier in section 6.4.1.2 (for H2). Specifically, the role of pressure in the
reaction rate is observed to be particularly pronounced in case of reduction of ITCMO
particles with CH4. The effect of pressure on reduction kinetics for chemical looping
combustion (CLC) scenario has previously been investigated by Garcı´a-Labiano et al.124
They studied the reduction kinetics on Fe, Cu and Ni based oxygen carriers at pressures
up to 30 atm. At a low constant mole fraction of 10% of H2 and CO, no significant
increase in reaction rate was observed with an increase in pressure. However, it was
noted that the actual reaction rate was influenced to a certain degree by several factors, of
which an important factor was ‘gas dispersion’ that occurs particularly during the initial
stage of the reacting gas introduction to the sample cell. The use of a constant molar
flowrate across all pressures resulted in a progressively increased gas dispersion effect in
the reaction cell at increased pressures. To minimize the progressive gas dispersion effect
due to an increase in pressures in the present study, the ITCMO particles were reduced at
constant space velocity across all pressures. The use of the constant space velocity leads
to an increase in reaction rate of the reduction reaction of the ITCMO particle with
increased pressure, as seen in Figure 67.
To explain the effect of gas-dispersion, Figure 68 can be seen. This figure shows the
evolution of reduction conversion of the ITCMO particles between 1 and 10 atm, with
constant space velocity and with constant molar flowrate. The dotted line indicates
196
reduction conversion curve at space velocity same as that at 1 atm. The dashed line
denotes the reduction conversion curve at molar flowrate same as that at 1 atm. If space
velocity is held constant, the advantage of operating the system at elevated pressure can
be easily verified (comparison of the solid line and dotted line). On the other hand, if the
molar flowrate is held constant, the kinetic advantage is not apparent due to the gas-
dispersion or end-effect. At constant molar flowrate, a fixed reactor volume equilibrates
over longer duration of time at higher pressure. Therefore, at the beginning the sample
‘sees’ much lower concentration of the active species than the setpoint. This results in a
tradeoff between the positive effect of higher pressure, and the negative effect of lower
concentration of the active species. In such experiments, the difference in reaction rates is
found to diminish significantly, confirming that the negligible effect of increased pressure
on reduction rate observed in reference 124
is attributed to the ‘gas dispersion’ effect with
pressures.
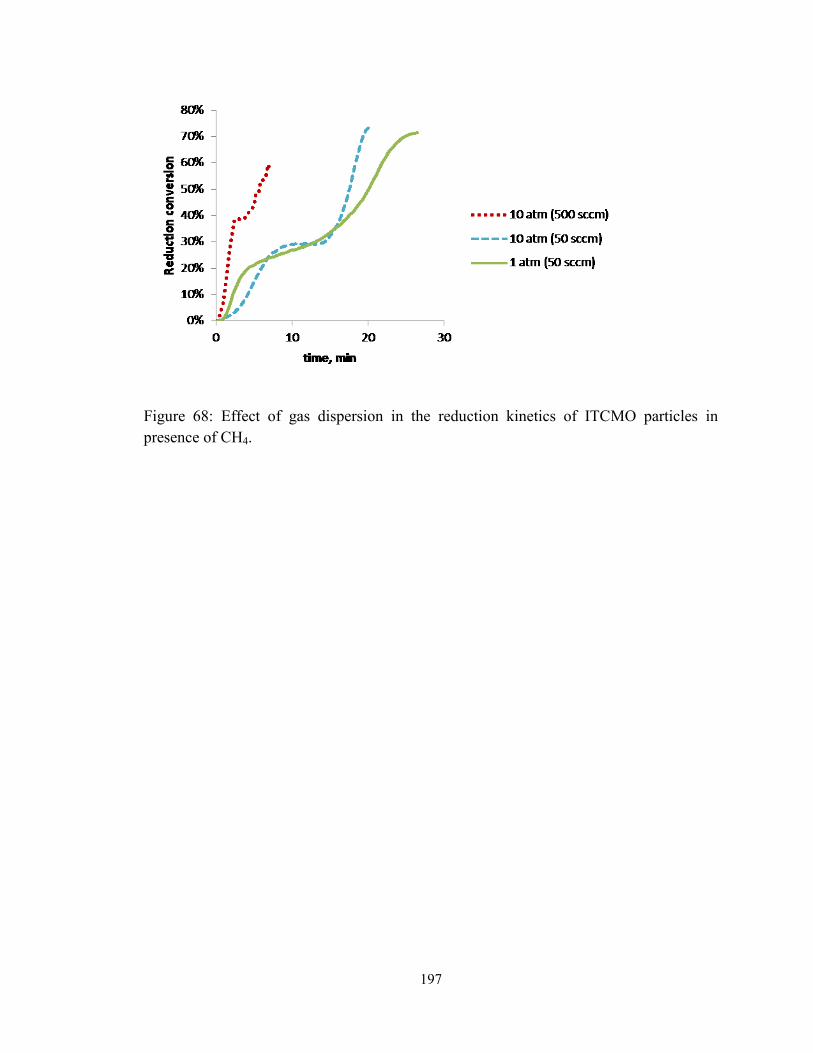
197
Figure 68: Effect of gas dispersion in the reduction kinetics of ITCMO particles in
presence of CH4.
198
6.4.3 Pressure correction
The sample weight measurement in the MSB is extremely sensitive to pressure changes
in the cell. The system pressure is regulated by the BPR situated downstream of the
sample cell. Usually, this BPR enables the system to be maintained at steady pressure
value for all the experiments. Thus, all the changes in the sample weight measurement are
‘true’ weight changes, aka attributed to the reaction alone. However, the reduction
reaction in presence of CH4 is a volume expansion reaction, where one mole of reactant
gas is converted to three moles of product according to the reaction 24 above (other side
reactions, such as complete combustion, also result in volume expansion).
The rate of this volume expansion is directly proportional to the rate of the reaction. In
the fixed volume of the sample cell of MSB, rapid gas volume expansion thus results in a
temporary increase in system pressure. The faster reaction results in more volume
expansion, and thus has a more pronounced effect on the temporary system pressure
change. The three stages in the CH4 reduction reaction occur at different reaction rates as
shown in section 6.4.2. The difference in these rates is also reflected in the trend in the
system pressure. During stage I, the pressure increases due to volume expansion (faster
reaction = more pronounced effect on pressure). At the onset of stage II, there is sudden
appreciable decrease in the rate of reduction reaction, and therefore the pressure buildup
starts dissipating by returning to the setpoint value (and further shows a slight increase
after stage III initiation). These pressure changes in the system inevitably affect the
measurement of sample weight, causing it to change. Therefore, in order to discern the
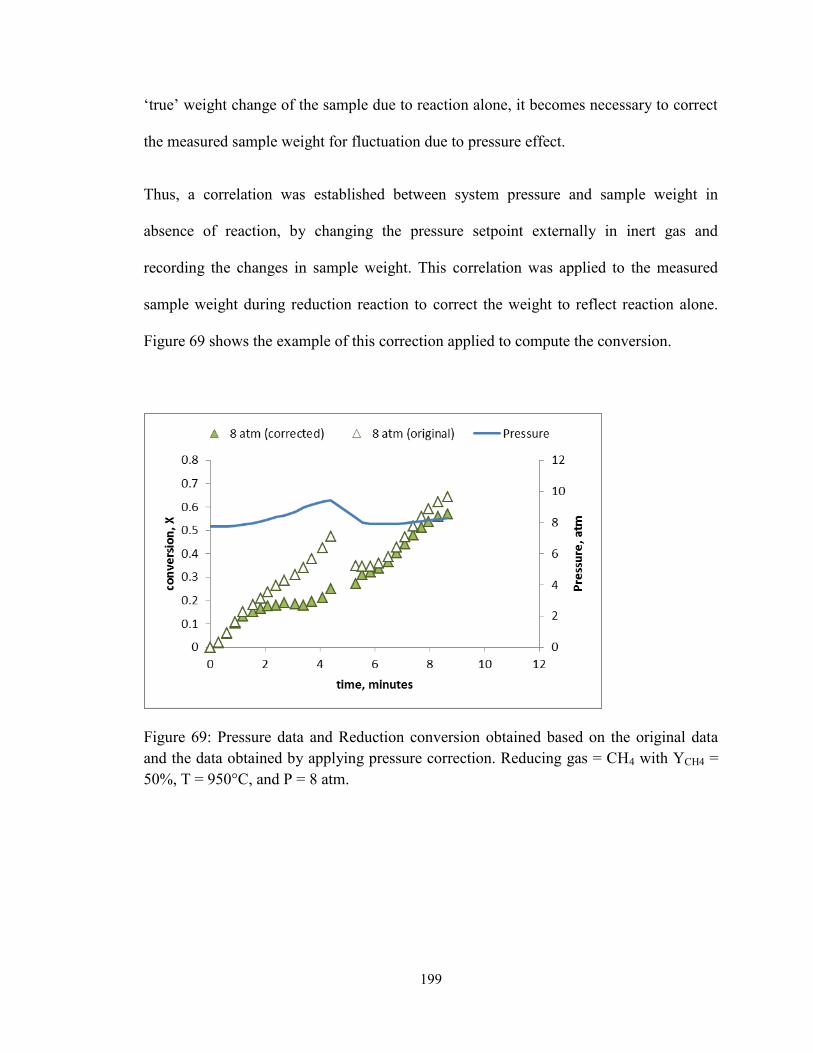
199
‘true’ weight change of the sample due to reaction alone, it becomes necessary to correct
the measured sample weight for fluctuation due to pressure effect.
Thus, a correlation was established between system pressure and sample weight in
absence of reaction, by changing the pressure setpoint externally in inert gas and
recording the changes in sample weight. This correlation was applied to the measured
sample weight during reduction reaction to correct the weight to reflect reaction alone.
Figure 69 shows the example of this correction applied to compute the conversion.
Figure 69: Pressure data and Reduction conversion obtained based on the original data
and the data obtained by applying pressure correction. Reducing gas = CH4 with YCH4 =
50%, T = 950°C, and P = 8 atm.
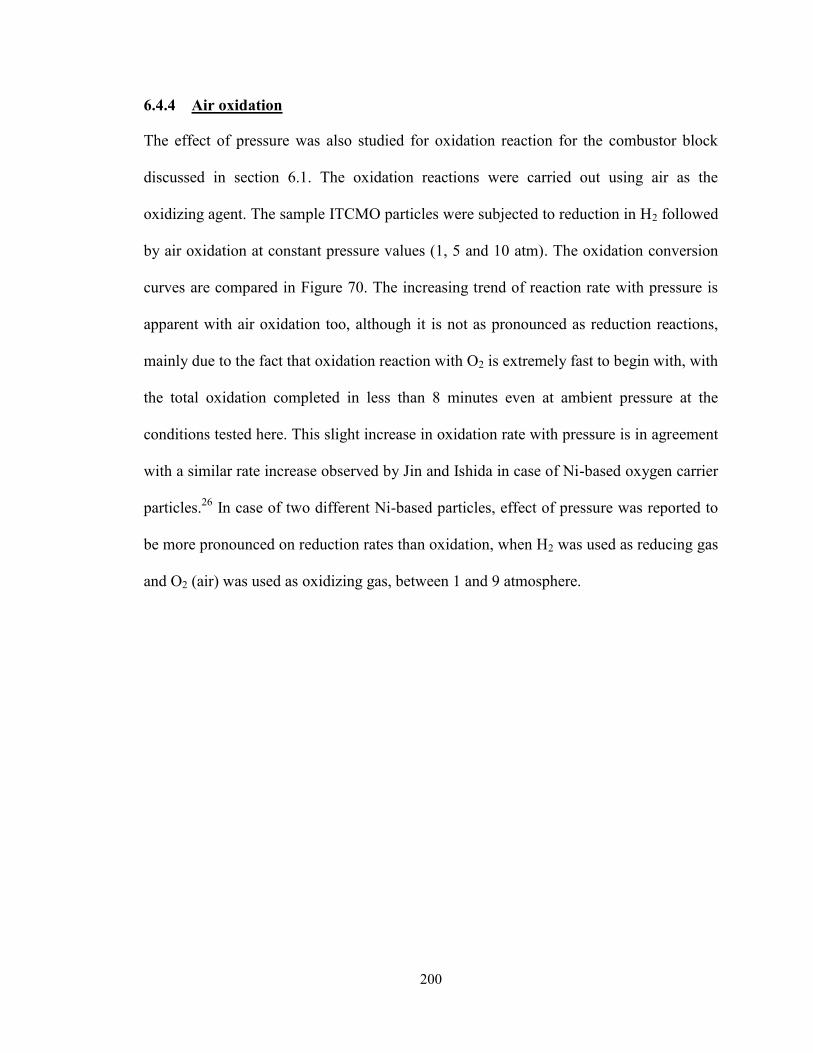
200
6.4.4 Air oxidation
The effect of pressure was also studied for oxidation reaction for the combustor block
discussed in section 6.1. The oxidation reactions were carried out using air as the
oxidizing agent. The sample ITCMO particles were subjected to reduction in H2 followed
by air oxidation at constant pressure values (1, 5 and 10 atm). The oxidation conversion
curves are compared in Figure 70. The increasing trend of reaction rate with pressure is
apparent with air oxidation too, although it is not as pronounced as reduction reactions,
mainly due to the fact that oxidation reaction with O2 is extremely fast to begin with, with
the total oxidation completed in less than 8 minutes even at ambient pressure at the
conditions tested here. This slight increase in oxidation rate with pressure is in agreement
with a similar rate increase observed by Jin and Ishida in case of Ni-based oxygen carrier
particles.26
In case of two different Ni-based particles, effect of pressure was reported to
be more pronounced on reduction rates than oxidation, when H2 was used as reducing gas
and O2 (air) was used as oxidizing gas, between 1 and 9 atmosphere.
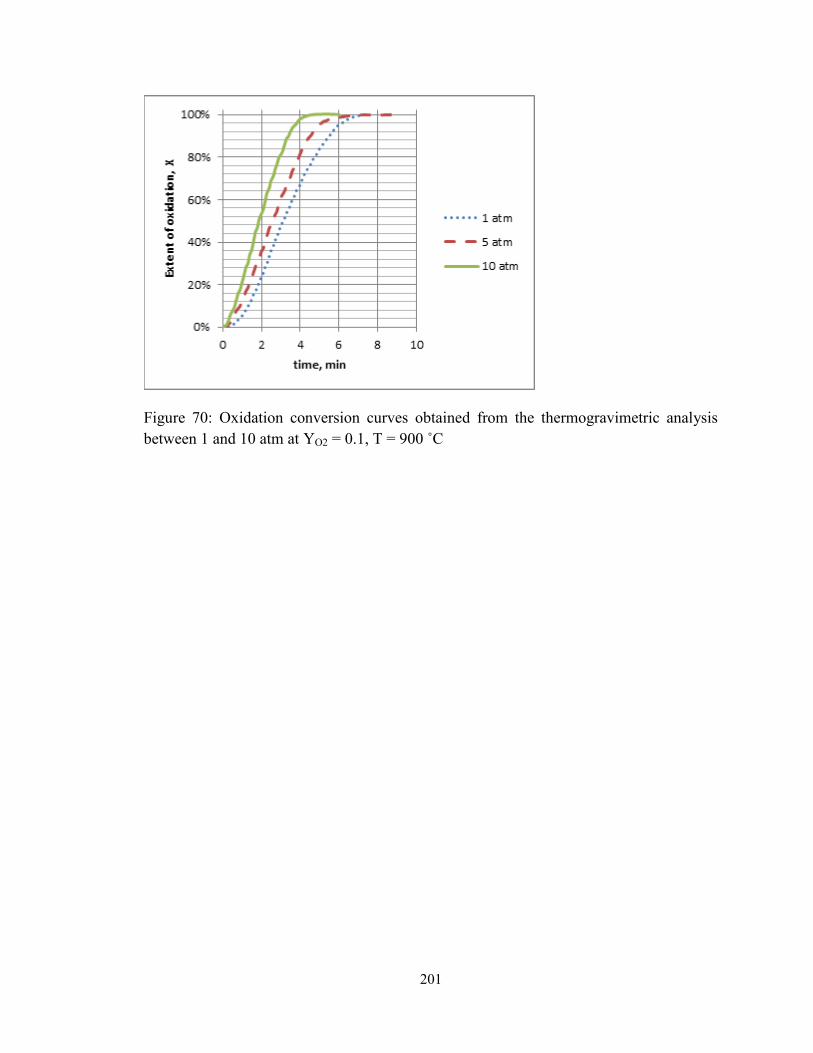
201
Figure 70: Oxidation conversion curves obtained from the thermogravimetric analysis
between 1 and 10 atm at YO2 = 0.1, T = 900 ˚C
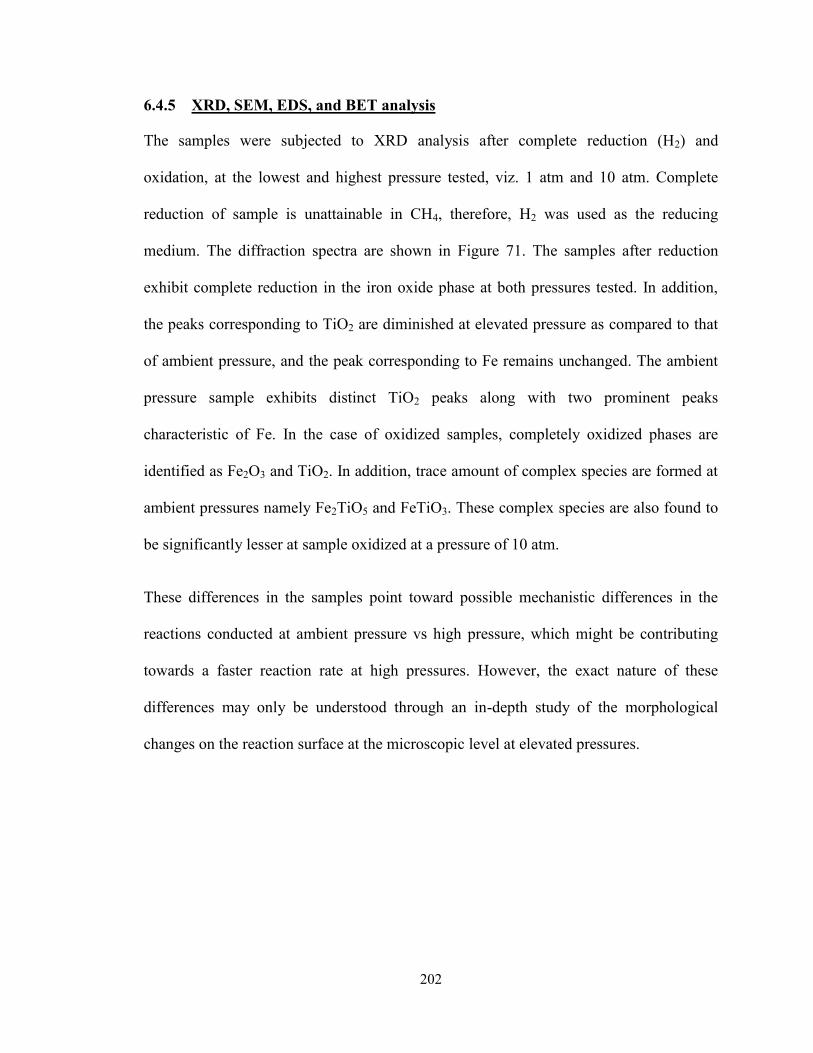
202
6.4.5 XRD, SEM, EDS, and BET analysis
The samples were subjected to XRD analysis after complete reduction (H2) and
oxidation, at the lowest and highest pressure tested, viz. 1 atm and 10 atm. Complete
reduction of sample is unattainable in CH4, therefore, H2 was used as the reducing
medium. The diffraction spectra are shown in Figure 71. The samples after reduction
exhibit complete reduction in the iron oxide phase at both pressures tested. In addition,
the peaks corresponding to TiO2 are diminished at elevated pressure as compared to that
of ambient pressure, and the peak corresponding to Fe remains unchanged. The ambient
pressure sample exhibits distinct TiO2 peaks along with two prominent peaks
characteristic of Fe. In the case of oxidized samples, completely oxidized phases are
identified as Fe2O3 and TiO2. In addition, trace amount of complex species are formed at
ambient pressures namely Fe2TiO5 and FeTiO3. These complex species are also found to
be significantly lesser at sample oxidized at a pressure of 10 atm.
These differences in the samples point toward possible mechanistic differences in the
reactions conducted at ambient pressure vs high pressure, which might be contributing
towards a faster reaction rate at high pressures. However, the exact nature of these
differences may only be understood through an in-depth study of the morphological
changes on the reaction surface at the microscopic level at elevated pressures.
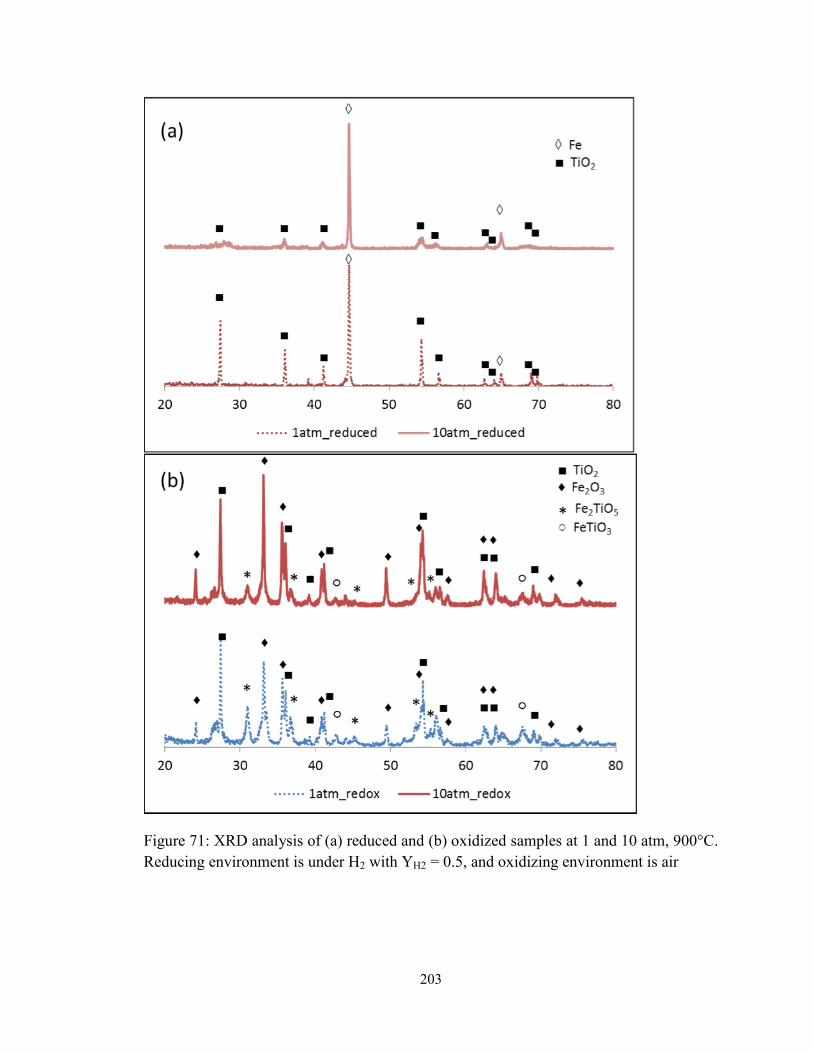
203
Figure 71: XRD analysis of (a) reduced and (b) oxidized samples at 1 and 10 atm, 900°C.
Reducing environment is under H2 with YH2 = 0.5, and oxidizing environment is air
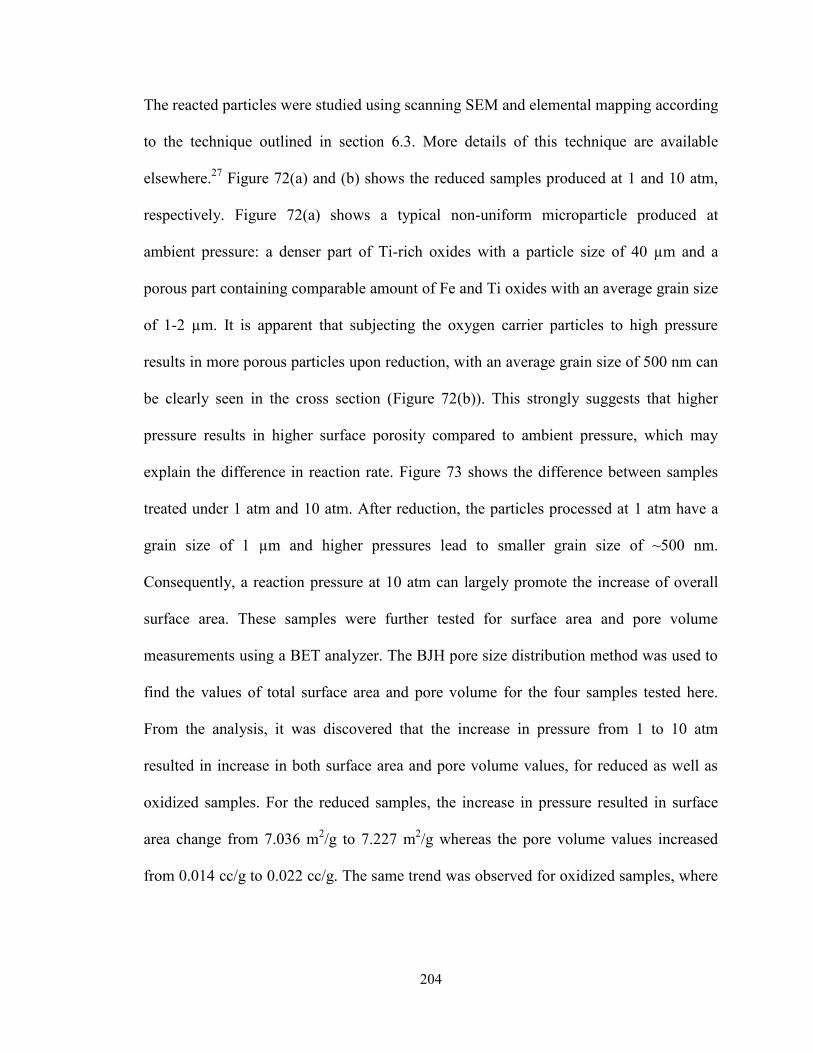
204
The reacted particles were studied using scanning SEM and elemental mapping according
to the technique outlined in section 6.3. More details of this technique are available
elsewhere.27
Figure 72(a) and (b) shows the reduced samples produced at 1 and 10 atm,
respectively. Figure 72(a) shows a typical non-uniform microparticle produced at
ambient pressure: a denser part of Ti-rich oxides with a particle size of 40 µm and a
porous part containing comparable amount of Fe and Ti oxides with an average grain size
of 1-2 µm. It is apparent that subjecting the oxygen carrier particles to high pressure
results in more porous particles upon reduction, with an average grain size of 500 nm can
be clearly seen in the cross section (Figure 72(b)). This strongly suggests that higher
pressure results in higher surface porosity compared to ambient pressure, which may
explain the difference in reaction rate. Figure 73 shows the difference between samples
treated under 1 atm and 10 atm. After reduction, the particles processed at 1 atm have a
grain size of 1 µm and higher pressures lead to smaller grain size of ~500 nm.
Consequently, a reaction pressure at 10 atm can largely promote the increase of overall
surface area. These samples were further tested for surface area and pore volume
measurements using a BET analyzer. The BJH pore size distribution method was used to
find the values of total surface area and pore volume for the four samples tested here.
From the analysis, it was discovered that the increase in pressure from 1 to 10 atm
resulted in increase in both surface area and pore volume values, for reduced as well as
oxidized samples. For the reduced samples, the increase in pressure resulted in surface
area change from 7.036 m2/g to 7.227 m
2/g whereas the pore volume values increased
from 0.014 cc/g to 0.022 cc/g. The same trend was observed for oxidized samples, where
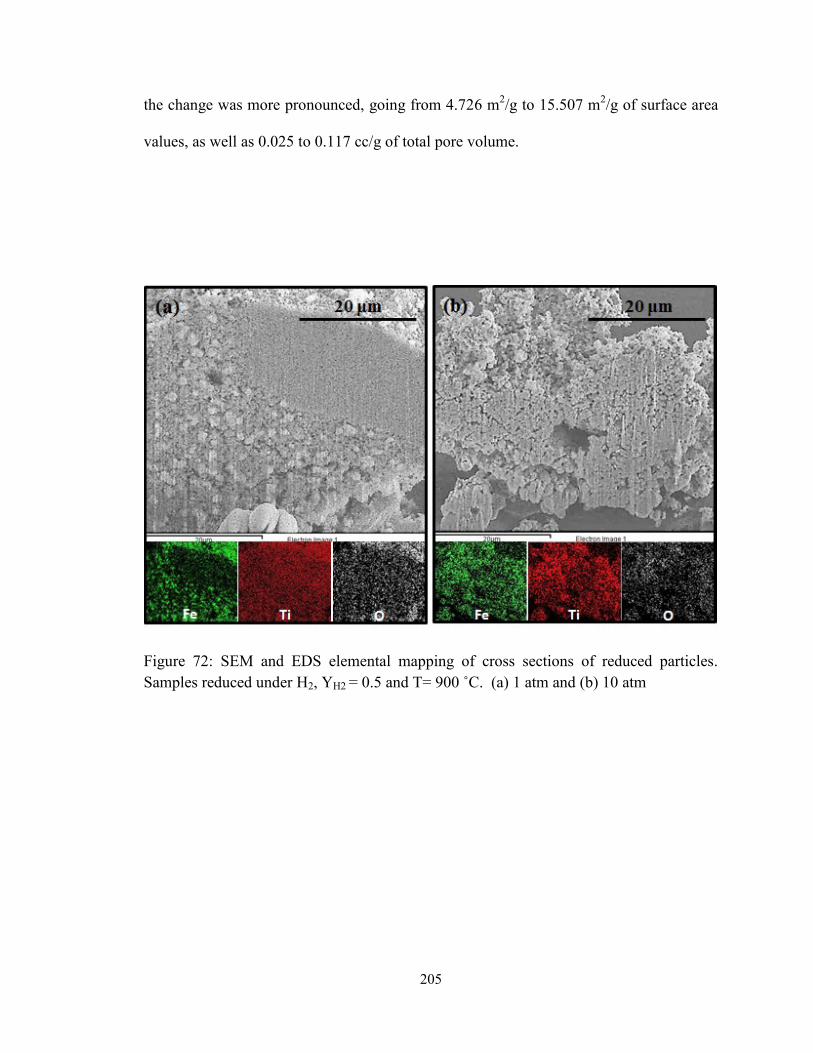
205
the change was more pronounced, going from 4.726 m2/g to 15.507 m
2/g of surface area
values, as well as 0.025 to 0.117 cc/g of total pore volume.
Figure 72: SEM and EDS elemental mapping of cross sections of reduced particles.
Samples reduced under H2, YH2 = 0.5 and T= 900 ˚C. (a) 1 atm and (b) 10 atm
206
Figure 73: Surface grains in samples reduced under H2, YH2 = 50% and T= 900 ˚C. (a) 1
atm and (b) 10 atm
207
All of these observations serve to explain the increased reduction rates for oxygen carrier
particles with increased pressure. Using this preliminary analysis, we conclude that
reduction carried out at elevated pressures results in particles with superior surface &
intra-particle morphology, as well as uniform small grain structure, which contribute to
the high reaction rates observed. A detailed analysis of the relationship between the
particle morphology and the reaction rates will result in greater understanding of the
mechanism of high pressure redox reactions involved in Fe-based partial oxidation
system. Such a study is currently underway and will be published separately.
It should be noted that upon re-oxidation no significant morphological difference was
found in samples treated at 1 and 10 atm, which is consistent with the small difference in
the oxidation reaction rates observed.
208
6.5 Conclusions
For chemical synthesis applications, Fe-based partial oxidation process can be applied to
produce pressurized syngas from CH4 suitable for downstream GTL applications. One
such process developed at OSU has been termed as the Shale gas to Syngas (STS)
process. The use of the STS process for downstream GTL applications requires the
system to be operated at elevated pressures. Thus, it is imperative to investigate the effect
of pressure on the operation of such a system, specifically, on the metal oxide particles
that supply the oxygen. This study was conducted in order to determine the effect of
pressure on the rates of reduction and oxidation reactions for OSU’s ITCMO particles
developed for applications such as the STS process. Extensive testing was carried out on
the reducer block at the conditions amenable to such a process. It is found that increase in
the mole fraction or partial pressure of the reducing gas has a favorable effect on the rate
of the reduction reaction of the ITCMO particles in the range of conditions tested.
Overall, operating the system at higher pressure results in superior reduction reaction
rates observed. Although the primary goal of the present work is to ascertain the effect of
pressure on the reaction rates ITCMO particles for CH4 partial oxidation using the STS
process, extensive parametric study for reduction was carried out using H2 as the
reducing gas. It is found that the experiments carried out with CH4 exhibit the same
trends with the variation of pressure and therefore the pressure effects can be
extrapolated. By choosing the experimental methodology to eliminate any gas dispersion
effects, the kinetic advantage of higher pressure operation was successfully realized in
this study.
209
With CH4 as the reducing gas, the ITCMO particles exhibit three distinct reaction stages
for reduction. Stage II, which is the slowest and therefore rate determining stage, is the
most sensitive to change in pressure; undergoing a 10 fold increase in rate with the
increase in pressure from 1 to 10 atm. Thus, any increase in pressure results in a
favorable change in rate of reduction reaction by CH4. The improvement in reaction rate
is also observed in case of oxidation of reduced ITCMO particles, albeit to a smaller
degree.
The reacted particles were analyzed using SEM, XRD, and BET techniques to understand
the morphological changes on surface and intra-particle level, and the role of these
changes in the observed differences in reaction rates. This analysis indicates that
conducting the reduction reactions at elevated pressures results in product particle which
shows more uniformity with respect to grain sizes, porosity and reactive iron-oxide
distribution, with increased surface and intra-particle porosity. The formation in this
uniform particle significantly contributes to the superior reaction kinetics.
One of the major issues of syngas production using CH4 is the formation of C soot.
However, the soot deposition can be managed or eliminated entirely using the control of
various other process parameters such as gas to solid loading, reactor residence times, gas
injection location and mode of gas-solid contact. Therefore, the advantages of faster
reaction kinetics at higher pressures can be realized by circumventing the soot deposition
through precise process operation. The advantages of operating the Fe-based partial
oxidation system at elevated pressures include increased processing capacity or reduced
reactor sizes and capital cost. The optimum operating pressures of the process can be

210
determined through rigorous experimental testing on various scales, and thorough process
and economic analyses.
211
CHAPTER 7: Chemical Looping Applications: Redox Reactivity of
Steam Oxidation for Chemical Looping Particles
7.1 Introduction
The concept of chemical looping for energy conversion systems has been around for
some time now, the first mention of chemical looping for indirect fuel oxidation is found
in the steam-iron process around 1939.128
In Chapter 6, it was discussed in the context of
chemical looping partial oxidation (CLPO) for the oxidation of methane (CH4). The
oxygen for partial or complete oxidation of carbonaceous fuel is supplied by means of
metal oxide solid materials at high temperature. The metal oxide (MeOx) are reduced in
the process, and can be re-oxidized in a separate reactor called the combustor in the
presence of air. Thus, the carbon dioxide (CO2), and other combustion gases produced,
are not diluted with N2 from air and can be obtained in high purity form. This process
concept is known as chemical looping combustion and a simplified schematic of the same
is represented in Figure 74.
Originally, this concept was proposed solely for the clean combustion of fossil fuels.
However, oxidation of reduced metal oxides may also be carried out in presence of steam
(H2O) as oxidizing agent, producing hydrogen (H2) as a byproduct of the process. In the
case of some single metal oxides such as Fe, steam is inadequate to fully regenerate the
metal oxides, and supplemental air oxidation of the metal oxides may be required for
212
restoring the metal oxides to their fully oxidized form, to be recycled back into the
reducer. This concept forms the basis of the chemical looping gasification process. Any
carbonaceous fuel may be used as the fuel for the reducer, resulting in CO2 and H2O as
the complete combustion products. Many small and large scale demonstrations of the
process concept have been carried out the world over. The process can be configured to
use gaseous fuels such as syngas (CO + H2), or CH4; or solid fuels such as coal or
biomass. The overall process schematic is shown in Figure 75. The fuel is fed to the
reducer unit, where it contacts with metal oxide MeOx. The reaction is typically carried
out on the solid oxide surface and results in complete combustion of the fuel. The
chemical energy of the fuel fed to the reducer is thus ‘stored’ in the form of the reduced
metal oxide, and is regenerated in the combustor/oxidizer block. The gas stream exiting
this reducer is mainly composed of the combustion products of CO2 and H2O. The CO2
may then be purified by condensing out the H2O and used for other applications or
compressed for sequestration. The reduced metal oxides, in the form of MeOz (where z<
x) are transported to the second block, namely, oxidizer. Here, the metal oxide is partially
oxidized to MeOy (where z<y<x) using steam as the oxidizing agent. H2 is produced as
the gaseous product of this oxidation. The gaseous product exiting the oxidizer can be
purified by condensing out the unreacted steam. This oxidizer unit is slightly exothermic
when using the Fe-based system. By adjusting inlet steam temperature to this block, the
oxidizer may be operated adiabatically.
The partially oxidized metal oxides MeOy are further completely oxidized to MeOx form
in a separate unit, namely the combustor. This oxidation is identical to that of the CLC
213
configuration, and is carried out using air as the oxidizing agent in a conventional gas-
solid fluidized bed reactor. This reactor is exothermic in operation, and the heat of
reaction is recovered in a heat recovery steam generation cycle for co-production of
electricity along with H2. It is possible to operate this system in the hybrid configuration,
by completely or partially bypassing the oxidizer block and feeding the reduced solids to
the combustor directly. In this case, the heat evolved from the oxidation process increases
and thus the net electricity generation increases at the expense of the H2 production from
the oxidizer block. Thus, a tradeoff exists for the coproduction of H2 and electricity from
the CLG configuration.
The three step syngas chemical looping (SCL) process was proposed at OSU, using iron
oxide (Fe2O3) based oxygen carrier materials for clean combustion of coal-derived
syngas to produce a highly pure and sequestration-ready CO2 stream. The process utilizes
coal and may result in the co-production of H2 and electricity. Various bench scale
studies have been conducted on the reducer block of the SCL process.115
The reducer is
operated as countercurrent moving bed reactor. The solid products exiting the reactor are
a mixture of Fe and FeO.in accordance with the thermodynamic equilibrium attained in
contact with the specific partial pressures of the gaseous reactant/product mixture. A near
complete conversion of the syngas fed to the reactor is achieved, along with a 50%
conversion of the Fe2O3 metal oxides.
In order to be suitable candidates for H2 production by CLG application, metal oxides for
CLG application must possess the following desirable properties. The metal oxide must
exhibit thermodynamic feasibility of producing H2 from steam at CLG operating
214
conditions. In addition, the reaction kinetics for the reduction and oxidation reactions
should be sufficiently rapid to allow realistic reactor sizes and processing time. The metal
oxides should possess high oxygen carrying capacity, to reduce the amount of inert
weight circulating in the system. The metal oxides should maintain the reactivity over
multiple cycles and should possess good mechanical strength and attrition resistance.
Nickel (Ni) and cobalt (Co) metals have been investigated in their mixed metal ferrites
form for the chemical looping gasification applications.129
Without the support of reactive
materials such as ferrites, single metal systems such as Ni/NiO and Co/CoO are
unsuitable for H2 production using chemical looping gasification scheme.130
High
pressure H2 is reported to be generated from Fe2O3 supported on alumina (Al2O3) at a
pressure 12 bar in a fixed bed reactor setup.131
FeO is known to form complexes with the
alumina support which reduces the reactivity of the oxygen carrier samples, therefore,
mixed metal ferrites are suggested as novel oxygen carrier materials.132,133
Based on the results obtained on the experimental bench scale setup as well as from the
process simulations using Aspen Plus software, a 25 kWth unit was built for the
continuous demonstration of the SCL process.6 This unit has demonstrated the excellent
high purity H2 generation (>99.99% pure) over continuous operation of the integrated
process for over 300 hours.7 Here, the oxidizer operating condition was that of
countercurrent moving bed operation, and a temperature of 800 °C. This reactor is
operated with dual injection of solids and with non-mechanical valves, in this manner, a
robust operation of the integrated system was successfully demonstrated5.
215
The reactivity of the metal oxides towards steam needs to be maintained over cyclic
operation of the system. Although steady state high purity H2 production has been
achieved using the iron-titanium complex metal oxide (ITCMO) particles in the 25kWth
unit on a sub-pilot scale, the redox reactivity and recyclability of the Fe-based oxygen
carriers with respect to steam oxidation was not independently established. Thus, the
following study was undertaken to verify the redox reactivity and recyclability of the Fe-
based metal oxides in repeated cycles of steam environment. The thermogravimetric type
of experiments were performed using the magnetic suspension balance (MSB) setup
described in previous chapters, to verify the recyclability of the metal oxides in the
controlled environment of steam oxidation. Fe and Co-based oxygen carriers were
identified as primary candidates that can be used for the redox reactions in the three-step
cycle, where H2 may be produced from H2O. Thus, Co-based samples were chosen for
the comparison with the Fe oxide samples. These metal oxides were selected in the form
of Fe2O3 and Co3O4, and supported on MgAl2O4. The samples thus prepared were
subjected to reduction using H2 as reducing agent, and oxidation using H2O, to produce
H2. The reactivity and recyclability of these materials was tested in the MSB setup over
multiple cycles. In addition, a few tests were conducted at elevated pressures to test the
reactivity of the metal oxide solids under higher pressure.
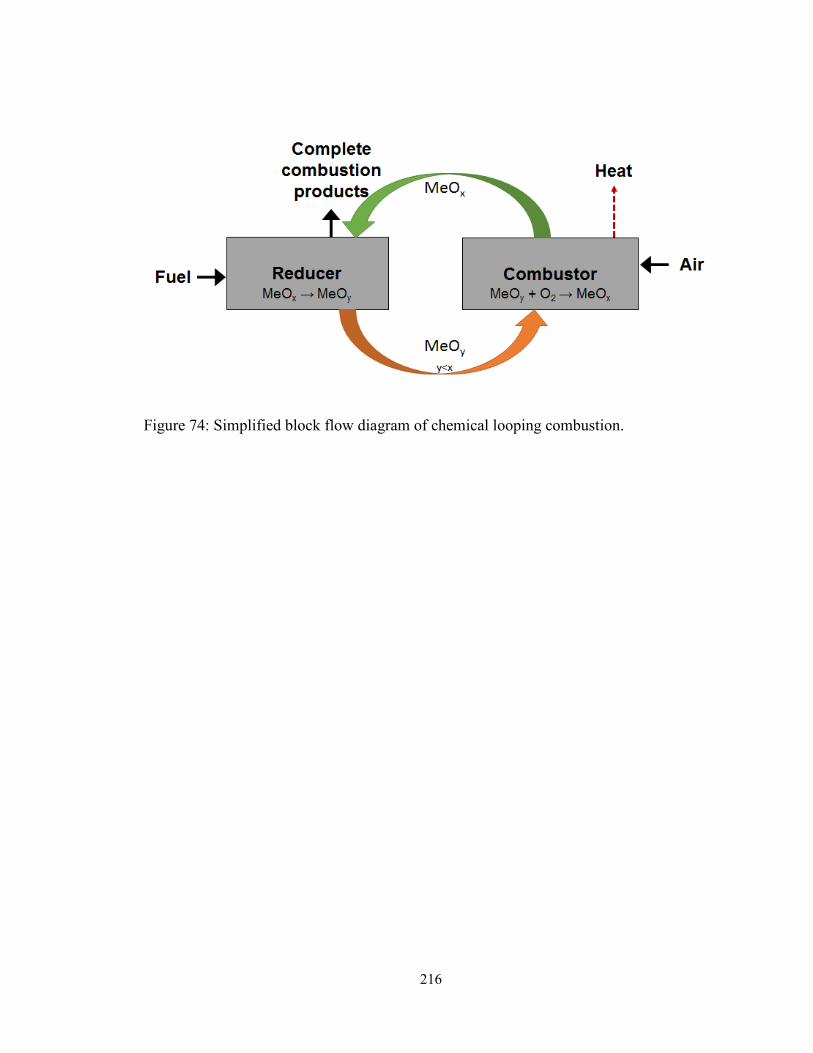
216
Figure 74: Simplified block flow diagram of chemical looping combustion.
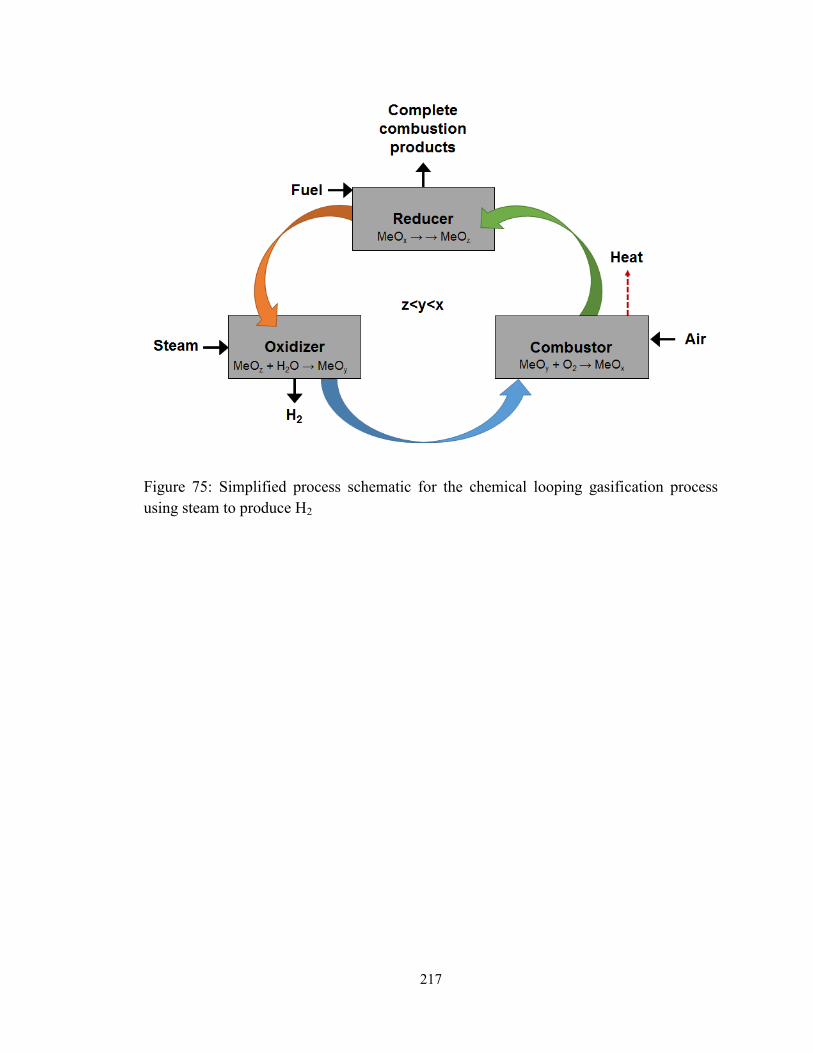
217
Figure 75: Simplified process schematic for the chemical looping gasification process
using steam to produce H2
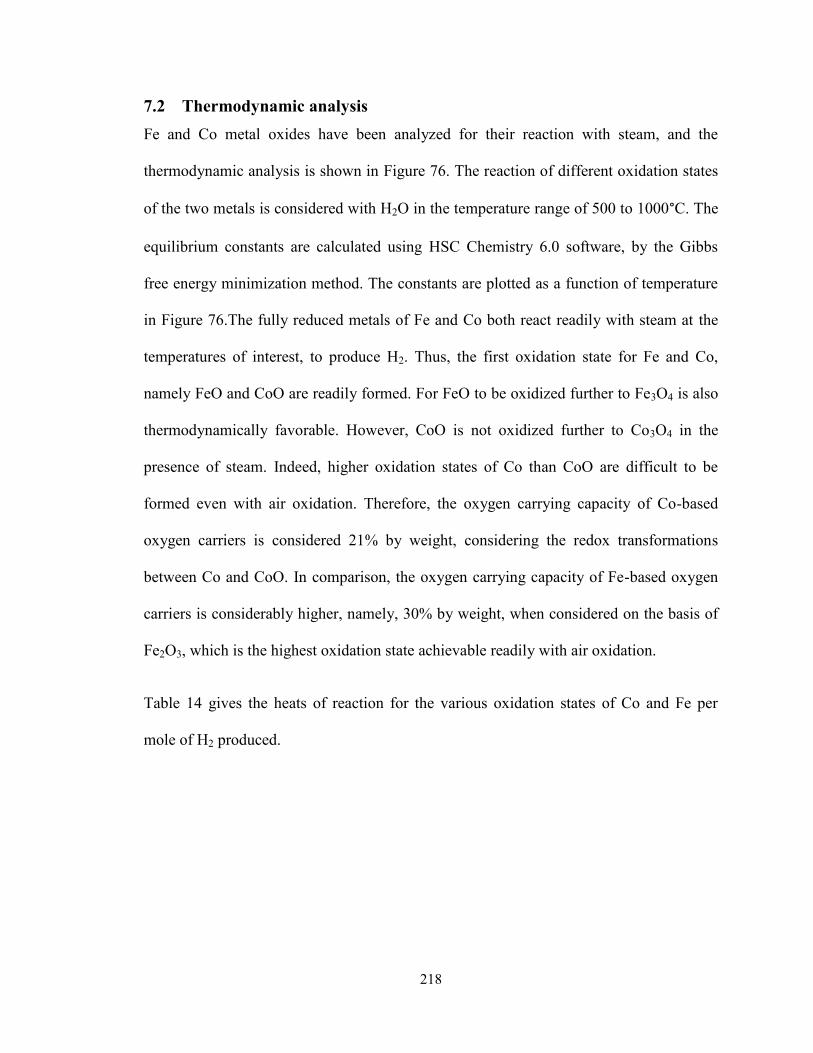
218
7.2 Thermodynamic analysis
Fe and Co metal oxides have been analyzed for their reaction with steam, and the
thermodynamic analysis is shown in Figure 76. The reaction of different oxidation states
of the two metals is considered with H2O in the temperature range of 500 to 1000°C. The
equilibrium constants are calculated using HSC Chemistry 6.0 software, by the Gibbs
free energy minimization method. The constants are plotted as a function of temperature
in Figure 76.The fully reduced metals of Fe and Co both react readily with steam at the
temperatures of interest, to produce H2. Thus, the first oxidation state for Fe and Co,
namely FeO and CoO are readily formed. For FeO to be oxidized further to Fe3O4 is also
thermodynamically favorable. However, CoO is not oxidized further to Co3O4 in the
presence of steam. Indeed, higher oxidation states of Co than CoO are difficult to be
formed even with air oxidation. Therefore, the oxygen carrying capacity of Co-based
oxygen carriers is considered 21% by weight, considering the redox transformations
between Co and CoO. In comparison, the oxygen carrying capacity of Fe-based oxygen
carriers is considerably higher, namely, 30% by weight, when considered on the basis of
Fe2O3, which is the highest oxidation state achievable readily with air oxidation.
Table 14 gives the heats of reaction for the various oxidation states of Co and Fe per
mole of H2 produced.
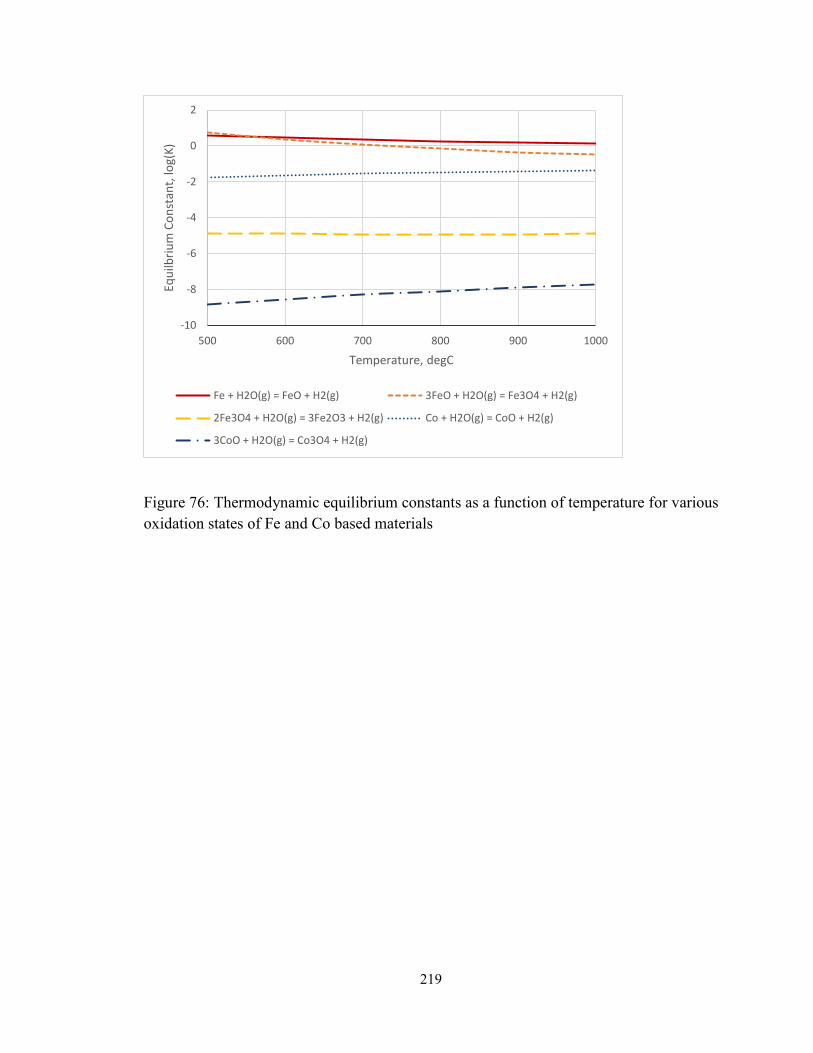
219
Figure 76: Thermodynamic equilibrium constants as a function of temperature for various
oxidation states of Fe and Co based materials
-10
-8
-6
-4
-2
0
2
500 600 700 800 900 1000
Equ
ilbri
um
Co
nst
ant,
log(
K)
Temperature, degC
Fe + H2O(g) = FeO + H2(g) 3FeO + H2O(g) = Fe3O4 + H2(g)
2Fe3O4 + H2O(g) = 3Fe2O3 + H2(g) Co + H2O(g) = CoO + H2(g)
3CoO + H2O(g) = Co3O4 + H2(g)
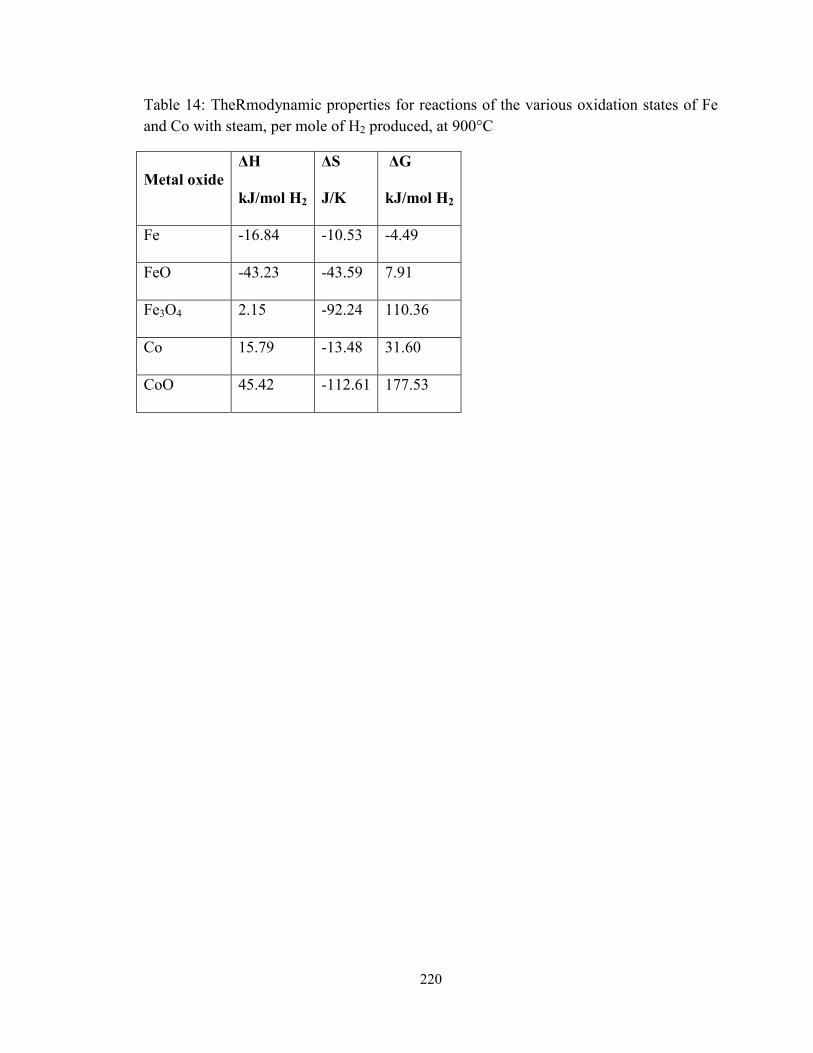
220
Table 14: TheRmodynamic properties for reactions of the various oxidation states of Fe
and Co with steam, per mole of H2 produced, at 900°C
Metal oxide
ΔH
kJ/mol H2
ΔS
J/K
ΔG
kJ/mol H2
Fe -16.84 -10.53 -4.49
FeO -43.23 -43.59 7.91
Fe3O4 2.15 -92.24 110.36
Co 15.79 -13.48 31.60
CoO 45.42 -112.61 177.53
221
7.3 Materials and methods
Fe2O3 and Co3O4 were used as the active components of the solids, and MgAl2O4 was
used as a support material. The support and active component were mixed in 50 wt%
proportions and sintered at high temperatures.
The MSB setup shown in Figure 39 of Chapter 5, section 5.4.2. The detailed
experimental procedure is same as that explained in the previous chapter for the partial
oxidation of CH4. The isothermal oxidation-reduction experiments were carried out at
900 °C. The reducing environment was 50% H2 in N2, and oxidation environment was
50% steam, with N2 as the sweep gas. Water injection was conducted for 7 minutes,
followed by flushing for 53 minutes. Total of 60 minutes of oxidation time was allowed.
The complete cycle was carried out for 2 hours. Up to 20 redox cycles were performed on
each sample, and the experiment was carried out over multiple days. After each reduction
step, the sample cell was flushed with inert N2 flow for 10 minutes. The samples
collected after the redox cycles were analyzed using XRD and SEM techniques.
In addition, some single cycle reduction and redox tests were carried out on the Fe and
Co-based samples to determine the role of pressure in enhancing the reaction rates. Up to
5 atm of pressure was tested. The samples were ramped in inert N2 flow till reaction
temperature and pressure was reached, thereafter, reactive gases were injected into the
sample cell for a specified period of time. Half and full cycles of Co and Fe samples were
conducted to obtain samples for XRD and SEM analysis. The samples were stored in
airtight containers for analysis later. Some select Co samples were also subjected to cross
222
sectional analysis by Focused Ion Beam (FIB) milling technique described in earlier
chapters.
7.4 Results and discussion
7.4.1 Fe-based oxygen carriers
The samples were subjected to reduction and steam oxidation reactions using ambient
and 5 atm test conditions. The reaction conversion curves obtained are shown in Figure
77. Increasing the pressure resulted in improved kinetics in some cases, when the reaction
rates at ambient pressure were sufficiently low. For Fe2O3 samples, increase in pressure
resulted in no significant change in reduction reaction rate, as the reaction rates were
found to be considerably fast even at ambient pressure conditions. After reduction, the
reduced samples were analyzed using XRD technique and identified as completely
reduced Fe form for all pressures. The re-oxidation of reduced Fe sample with steam is
inherently slower than the reduction with H2. Thus, for re-oxidation using steam, a
definite improvement in reaction rates was observed. This can be seen in Figure 77(b).
After oxidation reaction, the samples were similarly analyzed using XRD. The evidence
of slight formation of Fe2O3 was found in the XRD spectra for oxidation at ambient
pressures. However, this Fe2O3 formation is of no practical significance from the process
standpoint, considering the large excess of steam that will be required given the
thermodynamic unfavorability of the reaction. The other phases identified were Fe3O4
and MgAl2O4. No complexes were formed with the reaction between the reactive metal
oxide and the support material, unlike Al2O3 which is known to form complex FeAl2O4,
hindering further reaction132
.
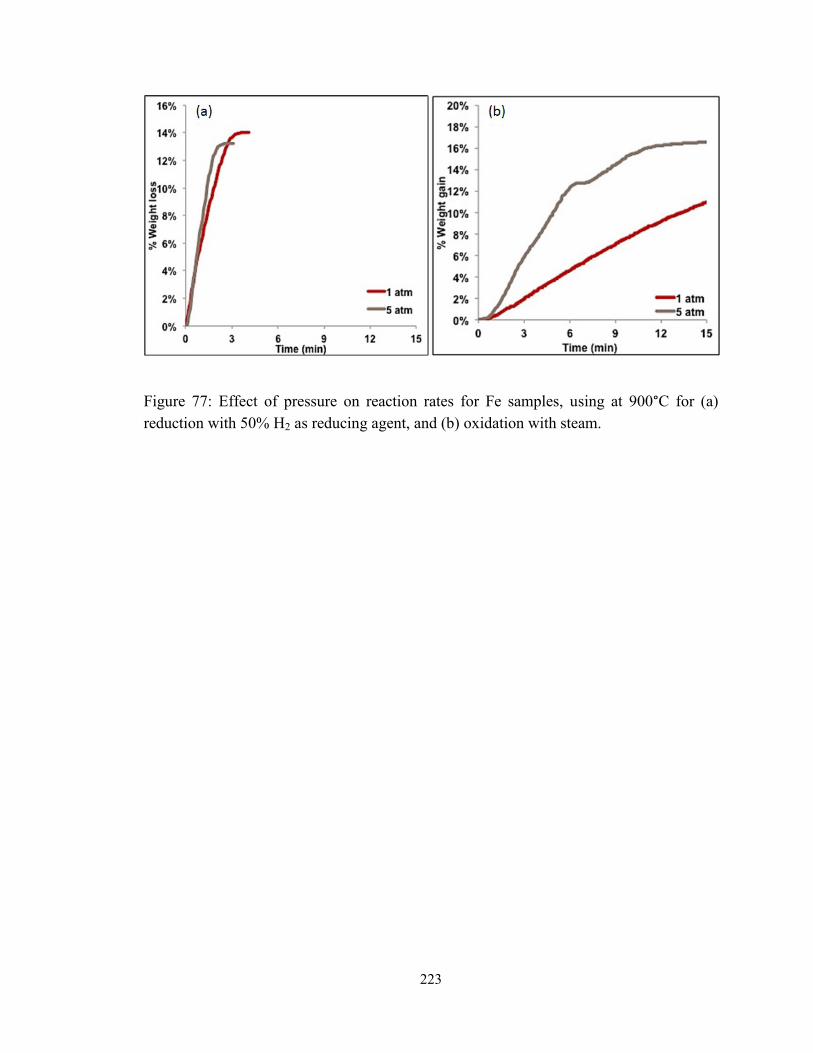
223
Figure 77: Effect of pressure on reaction rates for Fe samples, using at 900°C for (a)
reduction with 50% H2 as reducing agent, and (b) oxidation with steam.
224
This sample was tested for the recyclability under redox environment involving steam.
The recyclability of the Fe-based oxygen carriers was tested for 20 consecutive cycles. In
these cycles, the oxidation was halted after conversion corresponding Fe3O4 phase
formation was achieved. After this, the sample cell was flushed with N2 for 10 minutes
before beginning the next reduction step. As a result, the initial weight loss of the sample
during the first reduction is larger than subsequent cycles, owing to the complete
reduction from Fe2O3 phase to Fe. The following cycles correspond to a transformation
between Fe3O4 and Fe. The overall reactivity of the samples is found to be maintained
over the 20 redox cycles tested here. The 20 cycles of the samples are shown in Figure
78.
The XRD analysis after 20 cycles showed the inert support MgAl2O4 as well as Fe3O4 as
the only two phases present, which agrees with the conversion data obtained from the
thermogravimetric experiments.
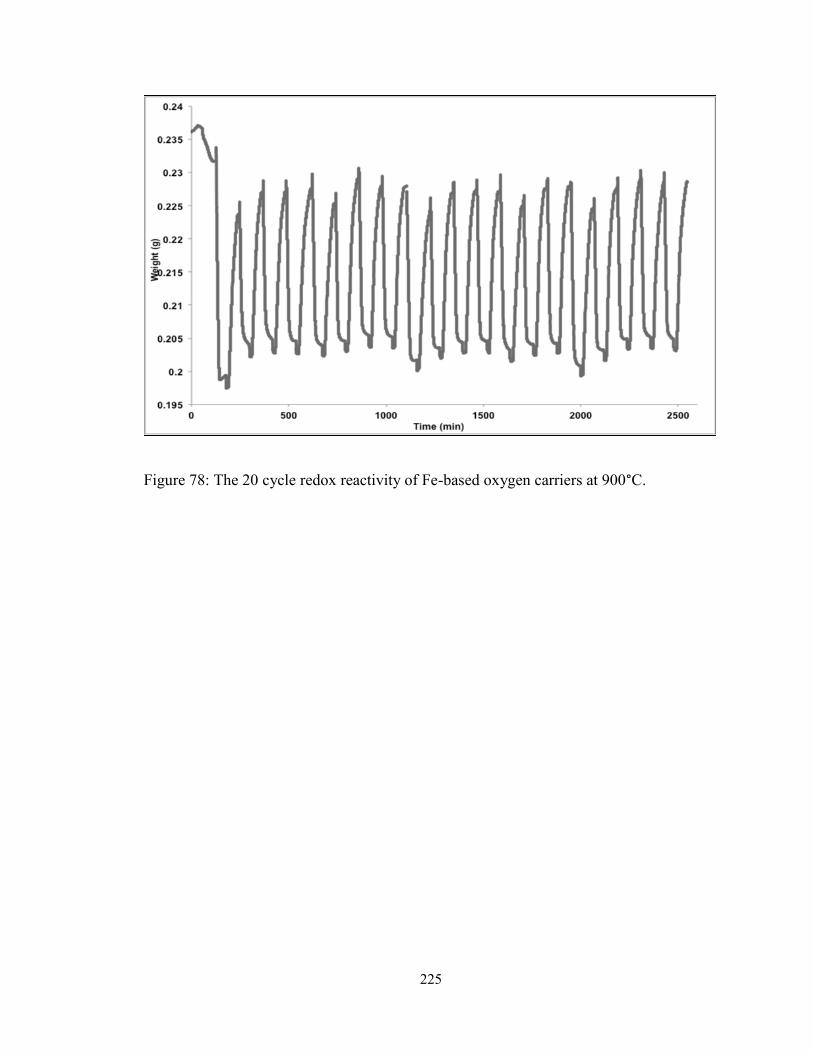
225
Figure 78: The 20 cycle redox reactivity of Fe-based oxygen carriers at 900°C.
226
7.4.2 Co-based oxygen carriers
Similar experiments were performed with the Co3O4 based samples. As compared to Fe
samples, the Co samples showed much slower kinetics of both reduction with H2 and
oxidation with steam. For these samples, the increase in pressure showed more
pronounced effect on the reaction rates as compared to the Fe samples. Specifically
during reduction, the Co3O4 sample showed significantly faster reaction rates at 5 atm as
compared to ambient atmospheric conditions. This is seen in Figure 79. No appreciable
difference was observed in case of oxidation for Co samples with steam. The oxidation of
Co samples at elevated pressures proved to be problematic, and stable oxidation was
never achieved. Furthermore, the loss of all the oxygen from a Co3O4 sample with 50%
inerts should necessarily result in 13% weight loss during reduction. However, the
samples never showed a 13% weight loss. The maximum amount of weight loss exhibited
by the samples was ~8%, indicating that the starting sample was not entirely composed of
fully oxidized phase of Co3O4, and rather contained some lower oxidation states of Co.
The XRD analysis of the initial sample showed evidence of CoO in addition to Co3O4,
further confirming this fact. The XRD analysis of the reduced samples showed only Co
as the active metal phase. The XRD analysis of the oxidized samples indicated that
complete oxidation does not occur at the test conditions, with unreacted Co also being
found in the samples along with CoO.
The Co-based samples were also subjected to extended number of redox cycles, with 20
cycles. The results of this cyclic testing are shown in Figure 80. As can be seen, the
reactivity of Co samples was not constant over the cycles, and the weight loss and gain
227
varied for every cycle (the figure shows processed data which is adjusted for the same
starting weight at the beginning of every reduction cycle.). The XRD analysis was
performed on the sample after subjecting it to 20 cycles. The sample showed unconverted
Co at the end of the final oxidation, further substantiating the loss in reactivity observed
during the thermogravimetric experiments.
The samples were tested for SEM and EDS analysis. The internal structure of the Co-
based samples was examined using the FIB milling technique. The full technique is
described in detail in the previous chapter. The Figure 81 shows the EDS mapping of the
cross section of a reduced microparticle. The particles showed uniform distribution of the
active metal and support material. Additionally, few separate microparticles of support
material MgAl2O4 were also observed. The EDS mapping of one such microparticle is
given in the section A.4.3 of the appendix.
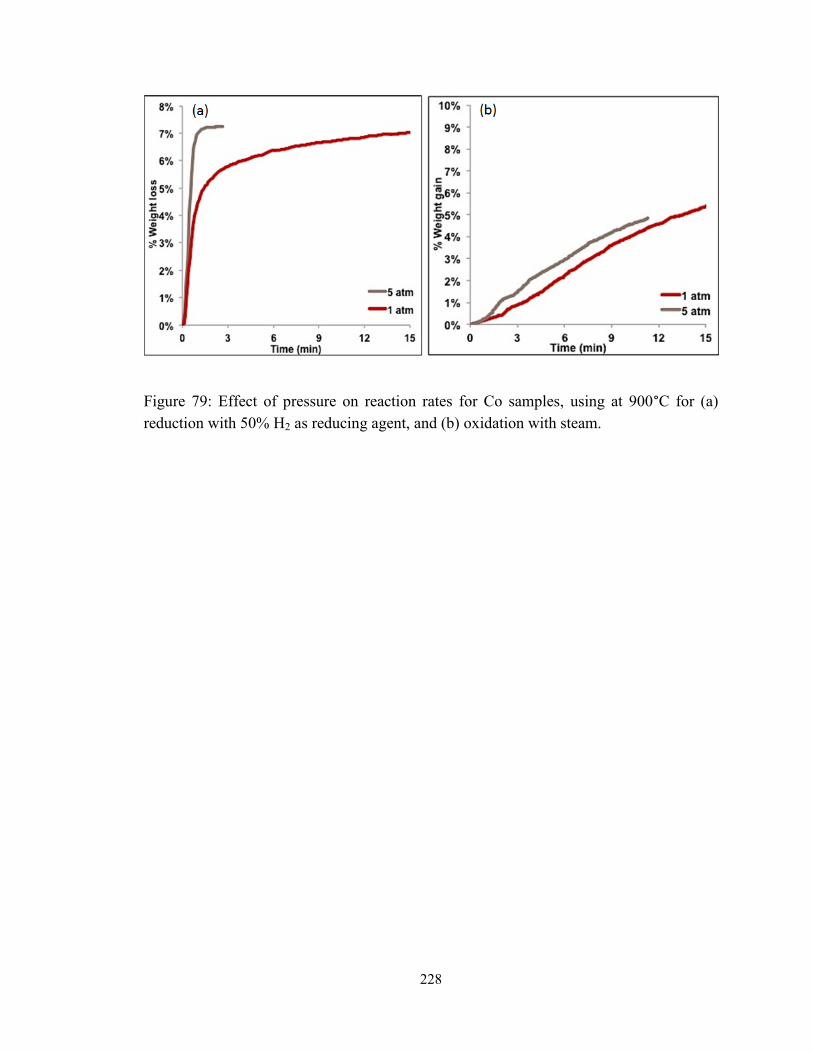
228
Figure 79: Effect of pressure on reaction rates for Co samples, using at 900°C for (a)
reduction with 50% H2 as reducing agent, and (b) oxidation with steam.
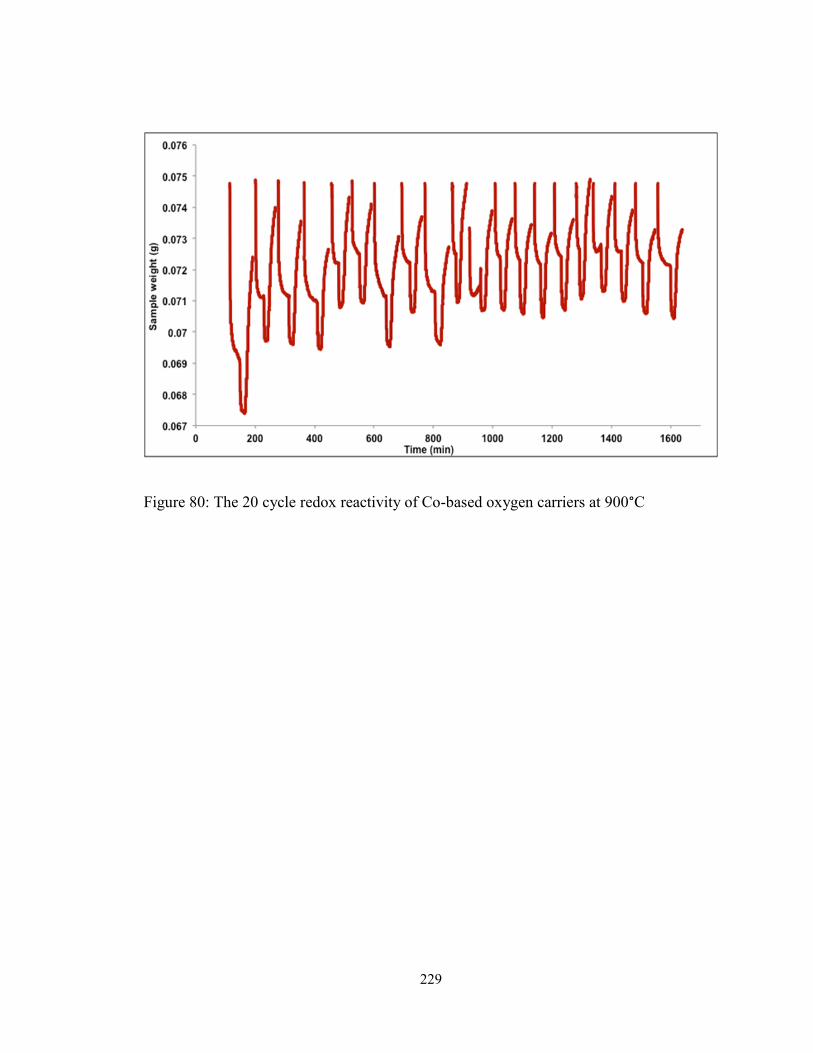
229
Figure 80: The 20 cycle redox reactivity of Co-based oxygen carriers at 900°C
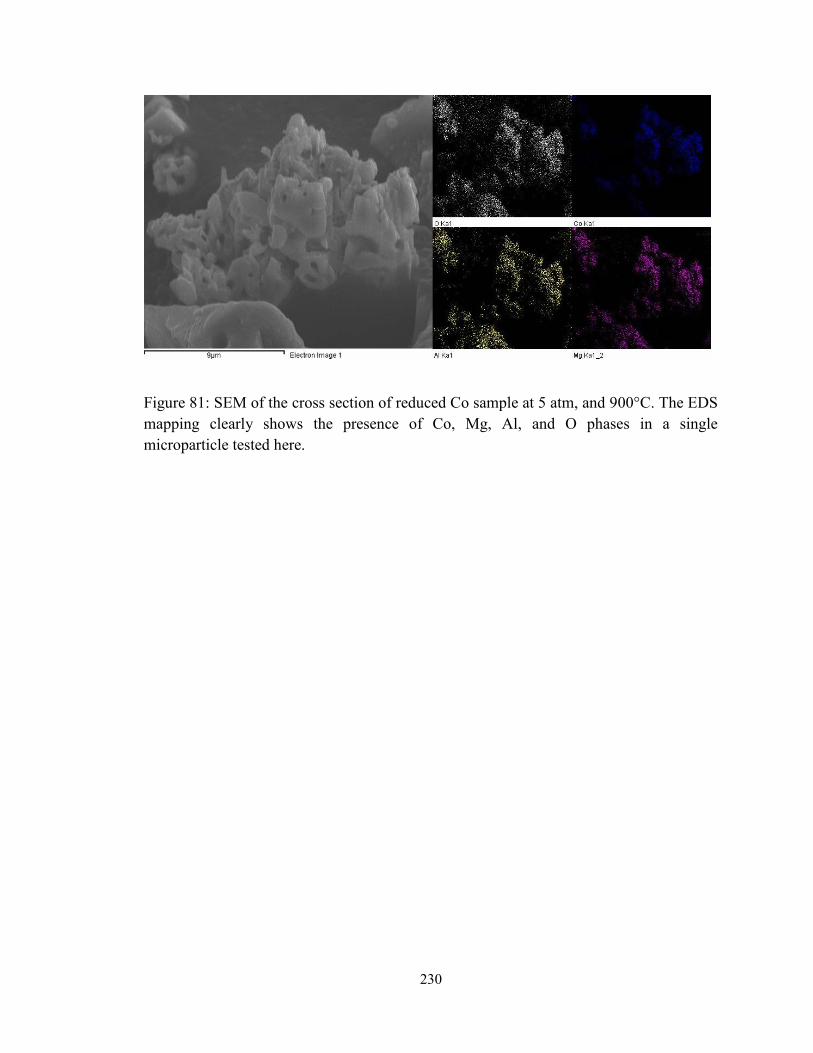
230
Figure 81: SEM of the cross section of reduced Co sample at 5 atm, and 900°C. The EDS
mapping clearly shows the presence of Co, Mg, Al, and O phases in a single
microparticle tested here.
231
7.5 Conclusions
Chemical looping gasification is an attractive process scheme for the cogeneration of H2
and electricity from carbonaceous fuels such as coal. The iron oxide based syngas
chemical looping (SCL) process has already been demonstrated at various scales of
operation. The production of high purity H2 from steam (>99.99% H2) has been achieved
in the reducer block of the three step SCL process through systematic testing. The Fe-
based SCL process uses the iron-titanium complex metal oxide particles as the oxygen
carriers for achieving this high purity H2. The favorable thermodynamics and kinetics of
oxides of Fe in the redox system makes this the most commonly studied material for
chemical looping gasification applications. Thus, it was essential to study the reactivity
and recyclability of the Fe-based oxygen carriers under steam oxidation conditions. The
present work was undertaken to achieve this purpose. Cobalt based oxygen carriers were
also chosen for comparison purposes.
The MgAl2O4 material was used as support material for all the tests carried out under this
work. This material was found to be an excellent inert support and did not interact in any
way with the active metal oxide component of the oxygen carriers for Co as well as Fe
samples. Excellent oxidation and reduction kinetics were observed for the Fe-based
samples. The samples exhibited high oxygen carrying capacity, with full oxidation to
Fe3O4 phase being observed in the steam oxidation step. Further, the recyclability of the
Fe-based oxygen carriers was verified over 20 redox cycles with reduction under H2 and
re-oxidation using steam. Also, increase in pressure resulted in faster reaction kinetics for
the H2 production step for this Fe-based system. In comparison, the Co-based oxygen
232
carriers were found to exhibit substantially slower kinetics of reduction as well as
oxidation. With steam, only oxidation up to CoO is observed, which results in
substantially lower oxygen carrying capacity of the Co-based oxygen carriers.
Furthermore, the samples treated with 20 redox cycles exhibited a loss in reactivity, and
the final oxidized sample showed the presence of unreacted Co. The co-based samples
also showed favorable response to increase in pressure, with increased reaction rates
observed at elevated pressures for reduction.
The SEM analysis of the samples showed that the Fe-based samples were more porous
than their Co-based counterparts, showing larger amounts of surface area available for
reactions. Generally, the reduced samples were observed to be more porous than the
samples oxidized with steam for both systems. Overall, this study conclusively proves the
excellent recyclability of the Fe-based oxygen carriers for the H2 production using syngas
chemical looping process.
233
FUTURE DIRECTIONS
The chemical looping research field stands at an exciting juncture right now, with several
important milestones in the offing in the near future.
For the calcium looping technology, some of the remaining uncertainties of the process
need to be addressed before the road to scale up and possible commercialization is
cleared. The biggest technological uncertainty for pre and post combustion calcium
looping technology remains the design and successful operation of a fluidized bed steam
hydrator that can be easily scaled up and integrated into the system. Presently, batch and
semi-batch experiments reported in this study have yielded promising results, and point
towards a fast fluidized bed reactor design as the most suitable mode of operation of this
reactor. Research effort should be focused towards maximizing the reaction conversion of
hydration (beyond current best of 70%) while minimizing the excess steam and the
reaction time required. Additionally, the kinetics of the hydration reaction may be
explored for the conditions amenable to the calcium looping process, for pre and post
combustion application, to help maximize the hydration reaction conversion and optimize
the reactor design.
The continuous demonstration of the integrated system over long term testing is next
logical step in the development of the calcium looping technology. Once each individual
234
unit is optimized for the reactor performance, the high temperature solids circulation in
the three reactor units will be the biggest engineering challenge which will have to be
addressed. The particle capture efficiency of high temperature separation devices such as
cyclones have been tested under cold conditions and given >99% efficiency for the
~10µm size calcium sorbent particles. This should be confirmed at actual operating
conditions at high temperatures in the integrated operation. The long term removal of
trace impurities and the buildup of inert species in the system will have to be studied in
this integrated setup, and their implications on the purge and makeup rates verified. On
the basis of the success of demonstration of the integrated operation of the three step
calcium loop, several modifications to the current process simulations analysis will be
made and a new techno-economic analysis should be performed to assess the impact of
this carbon capture technology on the overall power generation process efficiency, cost of
CO2 avoided, and purity of other gaseous products in the case of pre-combustion
applications.
Several of type I chemical looping technology applications are on the verge of being
established at pilot scale demonstrations, especially the Syngas Chemical Looping 250
kWth pilot plant at the National Carbon Capture Center. This unit designed to
demonstrate the chemical looping process concept through pressurized combustion of
syngas. Excellent purity of H2 (>99.99%) has already been demonstrated at the 25kwth
operation of the SCL sub-pilot unit with continuous operation. The successful
demonstration of this technology at the 250 kWth plant will be the stepping stone of the
launching of this technology platform towards large scale, commercial application.
235
At the same time, fundamental research effort is being expended simultaneously to
develop superior metal oxide oxygen carrier particles suitable for this technology.
Through these fundamental studies, the actual reaction mechanisms on the gas-solid
interface level can be better understood, which will lead to the development of
engineered solid particles with excellent attrition resistance, superior mechanical strength
and high reactivity at the same time. While the experience of large pilot scale
demonstrations bolsters the technological and engineering knowhow and develops high
confidence in operational expertise, the ongoing development through fundamental
scientific studies of the excellent oxygen carrier particle possessing desired qualities will
propel this technology platform towards successful commercialization.
236
APPENDIX: Supplemental Data
A.1 Calcium sorbent reactivation by hydration
A.1.1 Steam hydration TGA experiments
The hydration of CaO sorbent can be carried out in a specialized TGA setup using the
MSB apparatus to inject steam, as mentioned in Chapters 5 and 7. In this manner,
investigation of hydration reaction rates is possible for various parameters such as steam
partial pressure, temperature, etc. The following Figure 82 and Figure 83 shows examples
of such tests carried out at 400°C.
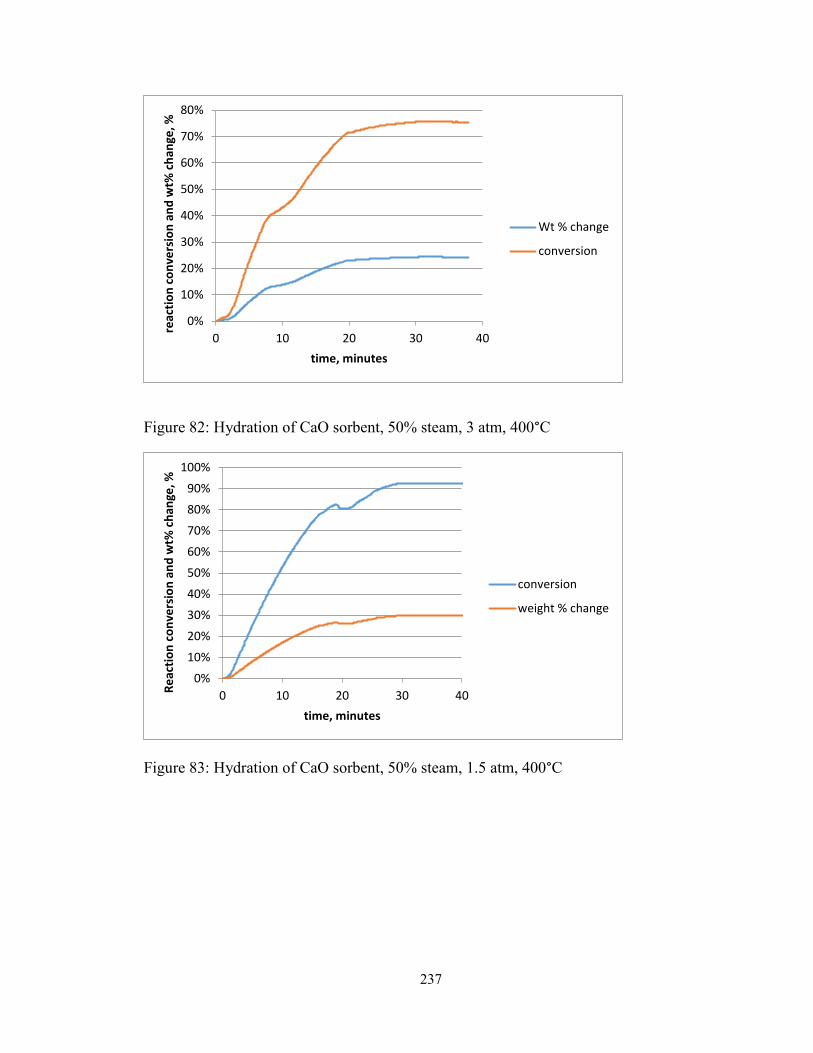
237
Figure 82: Hydration of CaO sorbent, 50% steam, 3 atm, 400°C
Figure 83: Hydration of CaO sorbent, 50% steam, 1.5 atm, 400°C
0%
10%
20%
30%
40%
50%
60%
70%
80%
0 10 20 30 40
reac
tio
n c
on
vers
ion
an
d w
t% c
han
ge, %
time, minutes
Wt % change
conversion
0%
10%
20%
30%
40%
50%
60%
70%
80%
90%
100%
0 10 20 30 40Re
acti
on
co
nve
rsio
n a
nd
wt%
ch
ange
, %
time, minutes
conversion
weight % change
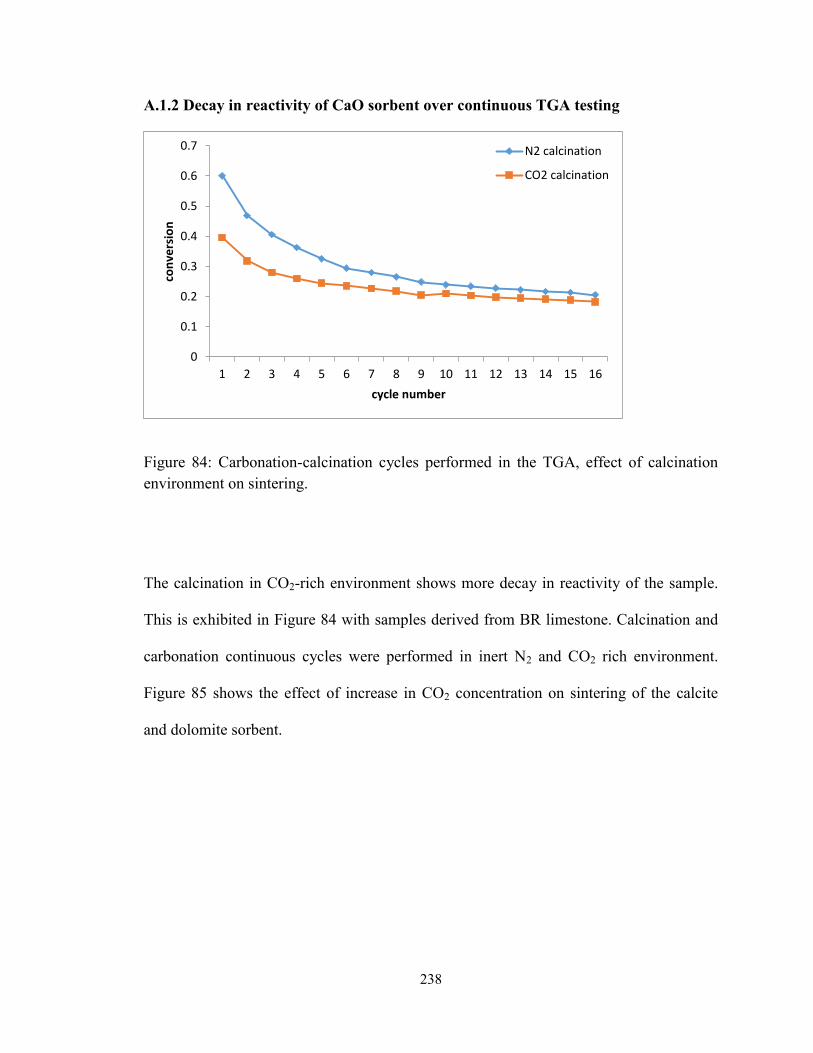
238
A.1.2 Decay in reactivity of CaO sorbent over continuous TGA testing
Figure 84: Carbonation-calcination cycles performed in the TGA, effect of calcination
environment on sintering.
The calcination in CO2-rich environment shows more decay in reactivity of the sample.
This is exhibited in Figure 84 with samples derived from BR limestone. Calcination and
carbonation continuous cycles were performed in inert N2 and CO2 rich environment.
Figure 85 shows the effect of increase in CO2 concentration on sintering of the calcite
and dolomite sorbent.
0
0.1
0.2
0.3
0.4
0.5
0.6
0.7
1 2 3 4 5 6 7 8 9 10 11 12 13 14 15 16
con
vers
ion
cycle number
N2 calcination
CO2 calcination
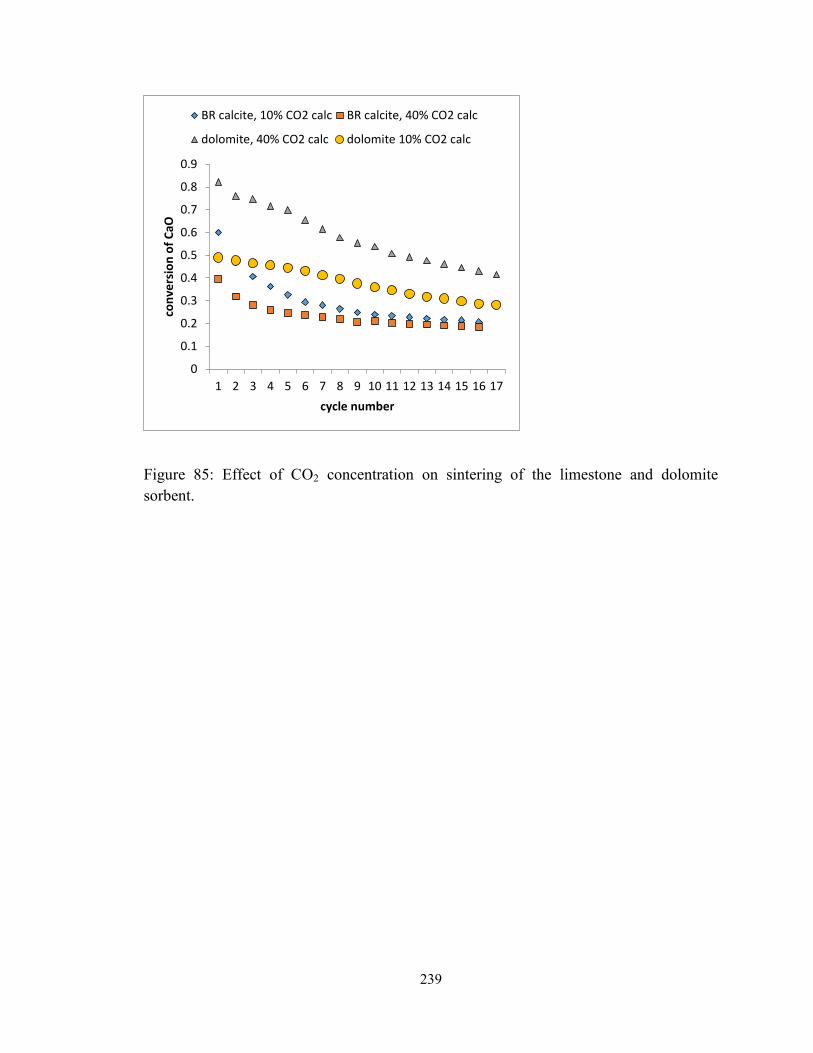
239
Figure 85: Effect of CO2 concentration on sintering of the limestone and dolomite
sorbent.
0
0.1
0.2
0.3
0.4
0.5
0.6
0.7
0.8
0.9
1 2 3 4 5 6 7 8 9 10 11 12 13 14 15 16 17
con
vers
ion
of
CaO
cycle number
BR calcite, 10% CO2 calc BR calcite, 40% CO2 calc
dolomite, 40% CO2 calc dolomite 10% CO2 calc

240
………. Equation A1
Equation A1 is given by Grasa and Abanades134
to explain the loss in reactivity of the
CaO sorbent over multiple cycles, Here, the decay in reactivity of CaO derived from MV
limestone is fitted with equation A1 in Figure 86, with the parameters
𝑎∞ = 0.08
k = 1.2
Where 𝑎∞ is the residual conversion of the sample (approaching the asymptotic value),
and k is an empirical constant to quantify the rate of decay. Different forms of equation
A1 have been proposed in the literature in an attempt to model the decay in reactivity of
the CaO sorbent over multiple cycles.17
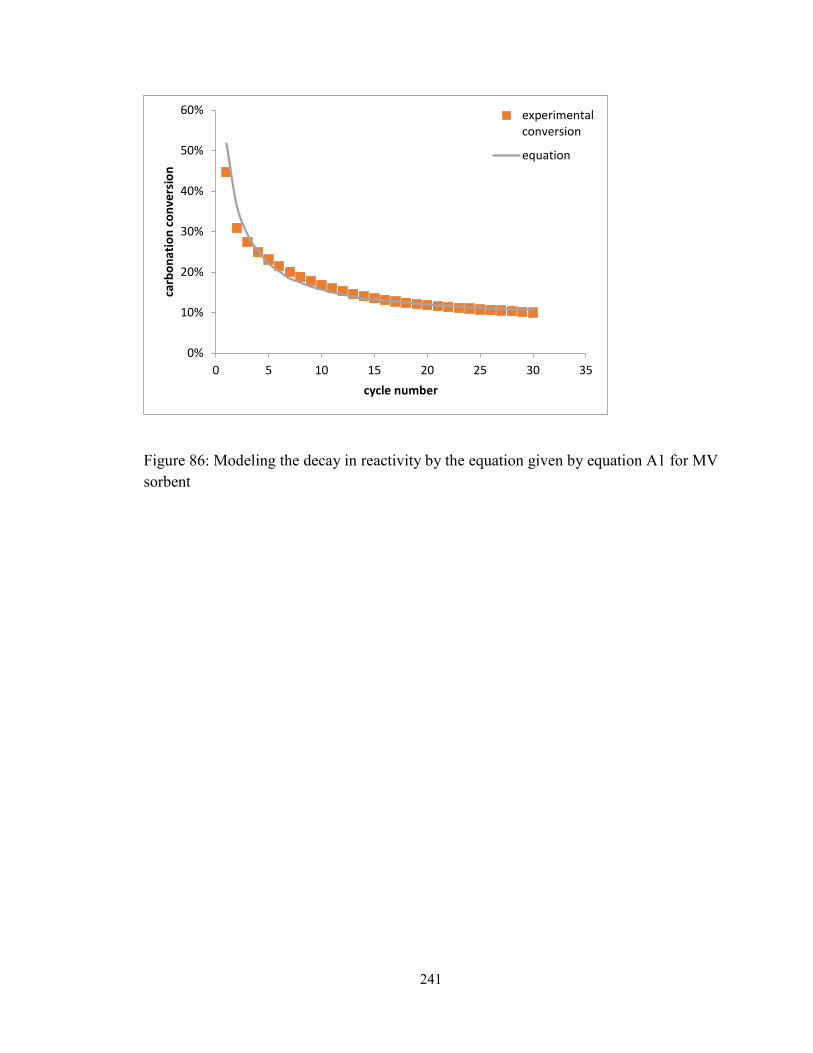
241
Figure 86: Modeling the decay in reactivity by the equation given by equation A1 for MV
sorbent
0%
10%
20%
30%
40%
50%
60%
0 5 10 15 20 25 30 35
carb
on
atio
n c
on
vers
ion
cycle number
experimentalconversion
equation
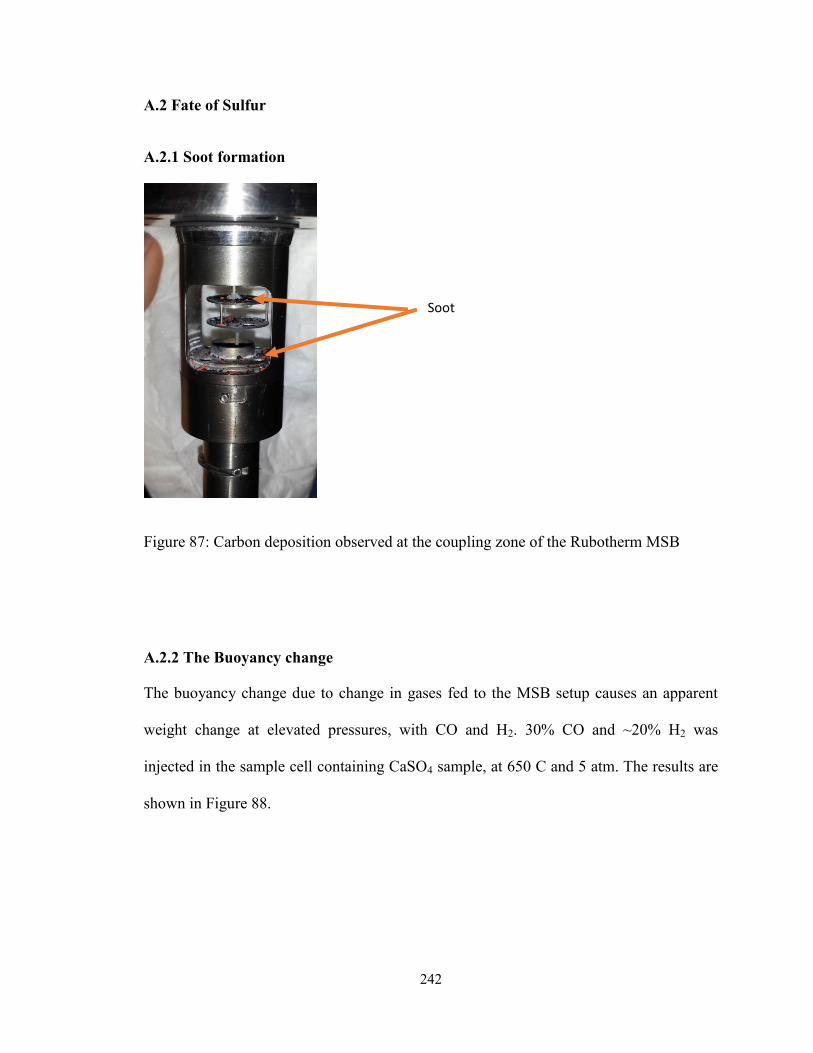
242
A.2 Fate of Sulfur
A.2.1 Soot formation
Figure 87: Carbon deposition observed at the coupling zone of the Rubotherm MSB
A.2.2 The Buoyancy change
The buoyancy change due to change in gases fed to the MSB setup causes an apparent
weight change at elevated pressures, with CO and H2. 30% CO and ~20% H2 was
injected in the sample cell containing CaSO4 sample, at 650 C and 5 atm. The results are
shown in Figure 88.
Soot
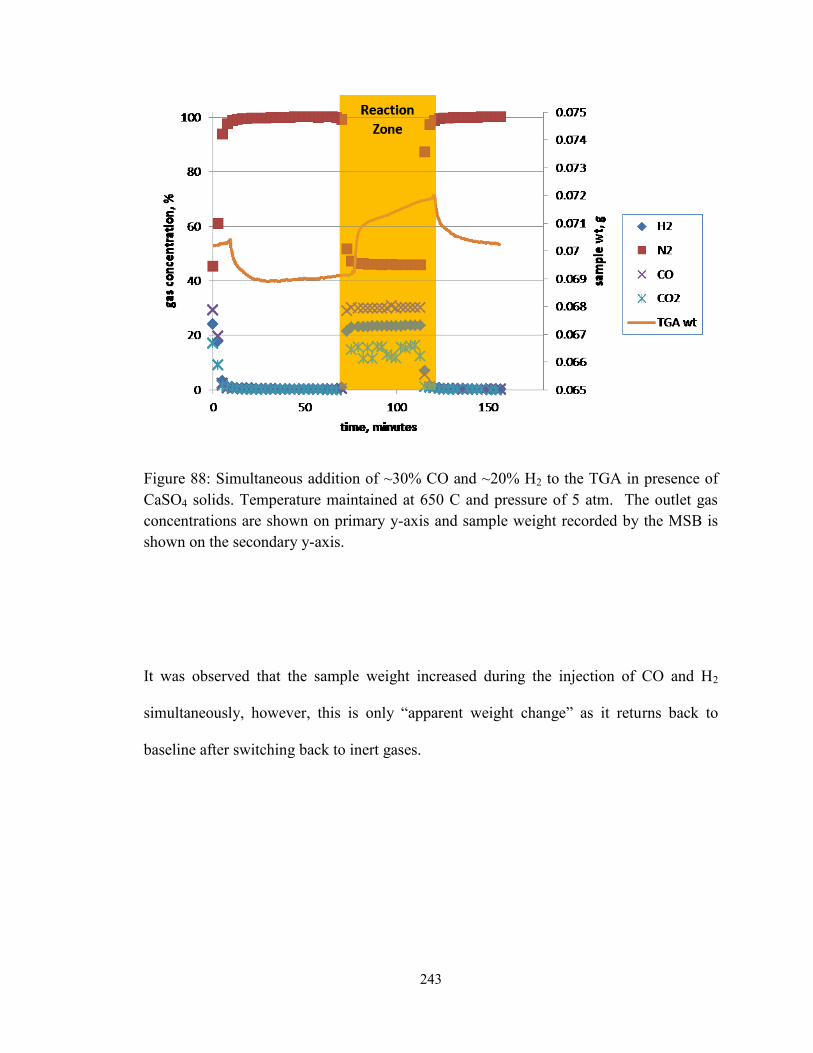
243
Figure 88: Simultaneous addition of ~30% CO and ~20% H2 to the TGA in presence of
CaSO4 solids. Temperature maintained at 650 C and pressure of 5 atm. The outlet gas
concentrations are shown on primary y-axis and sample weight recorded by the MSB is
shown on the secondary y-axis.
It was observed that the sample weight increased during the injection of CO and H2
simultaneously, however, this is only “apparent weight change” as it returns back to
baseline after switching back to inert gases.
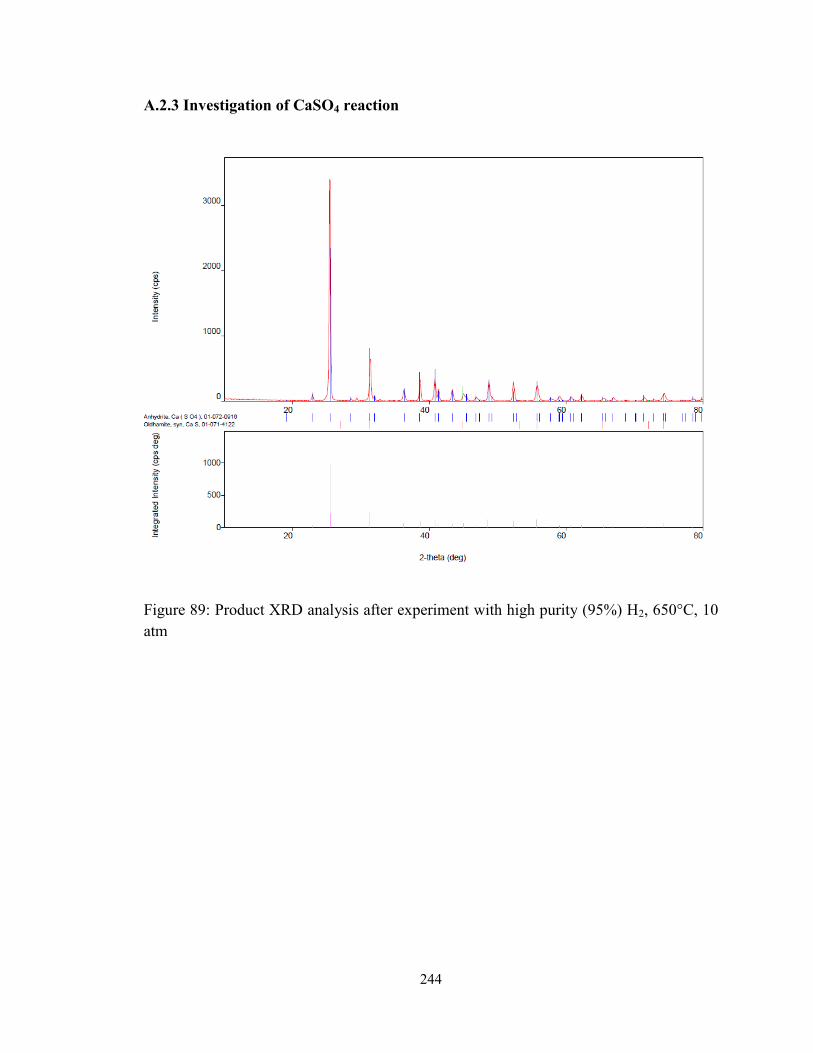
244
A.2.3 Investigation of CaSO4 reaction
Figure 89: Product XRD analysis after experiment with high purity (95%) H2, 650°C, 10
atm
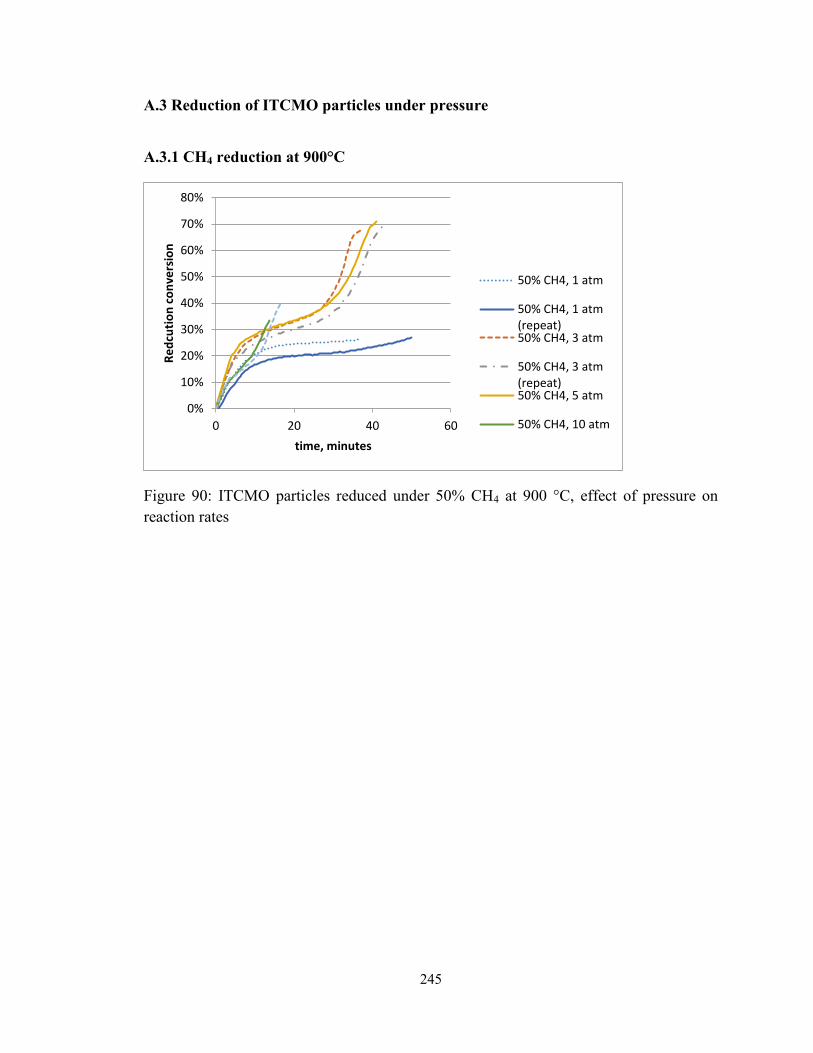
245
A.3 Reduction of ITCMO particles under pressure
A.3.1 CH4 reduction at 900°C
Figure 90: ITCMO particles reduced under 50% CH4 at 900 °C, effect of pressure on
reaction rates
0%
10%
20%
30%
40%
50%
60%
70%
80%
0 20 40 60
Re
dcu
tio
n c
on
vers
ion
time, minutes
50% CH4, 1 atm
50% CH4, 1 atm(repeat)50% CH4, 3 atm
50% CH4, 3 atm(repeat)50% CH4, 5 atm
50% CH4, 10 atm
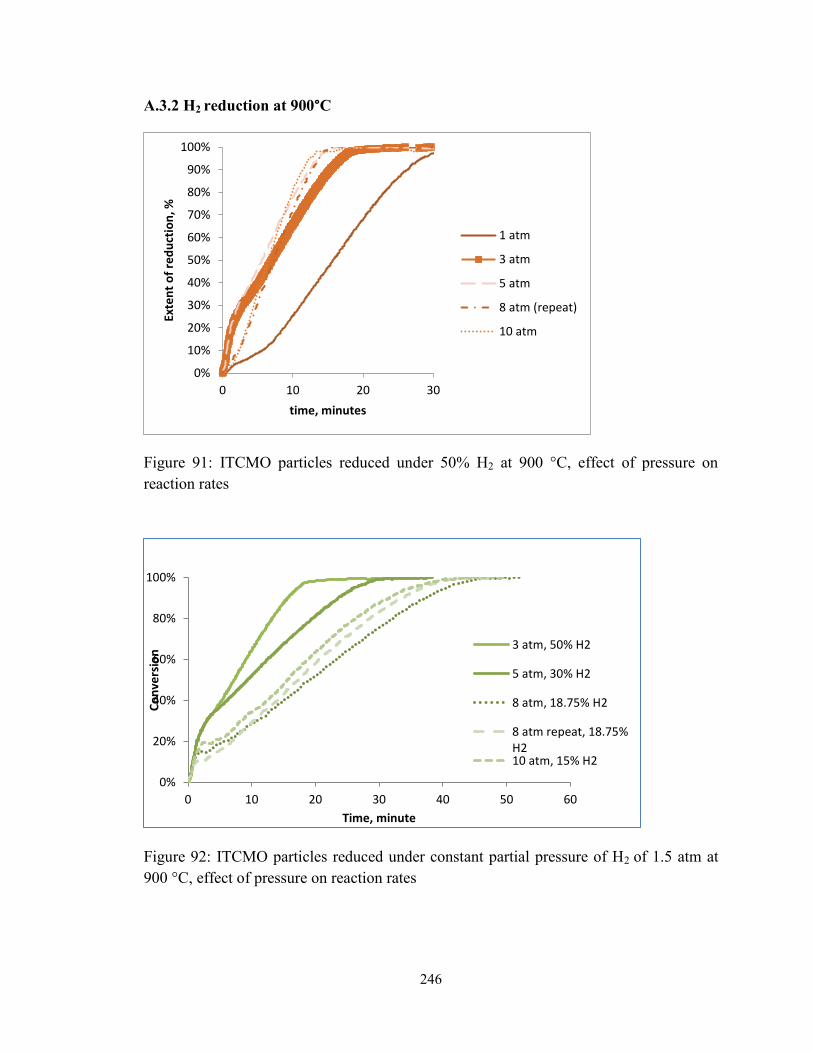
246
A.3.2 H2 reduction at 900°C
Figure 91: ITCMO particles reduced under 50% H2 at 900 °C, effect of pressure on
reaction rates
Figure 92: ITCMO particles reduced under constant partial pressure of H2 of 1.5 atm at
900 °C, effect of pressure on reaction rates
0%
10%
20%
30%
40%
50%
60%
70%
80%
90%
100%
0 10 20 30
Exte
nt
of
red
uct
ion
, %
time, minutes
1 atm
3 atm
5 atm
8 atm (repeat)
10 atm
0%
20%
40%
60%
80%
100%
0 10 20 30 40 50 60
Co
nve
rsio
n
Time, minute
3 atm, 50% H2
5 atm, 30% H2
8 atm, 18.75% H2
8 atm repeat, 18.75%H210 atm, 15% H2
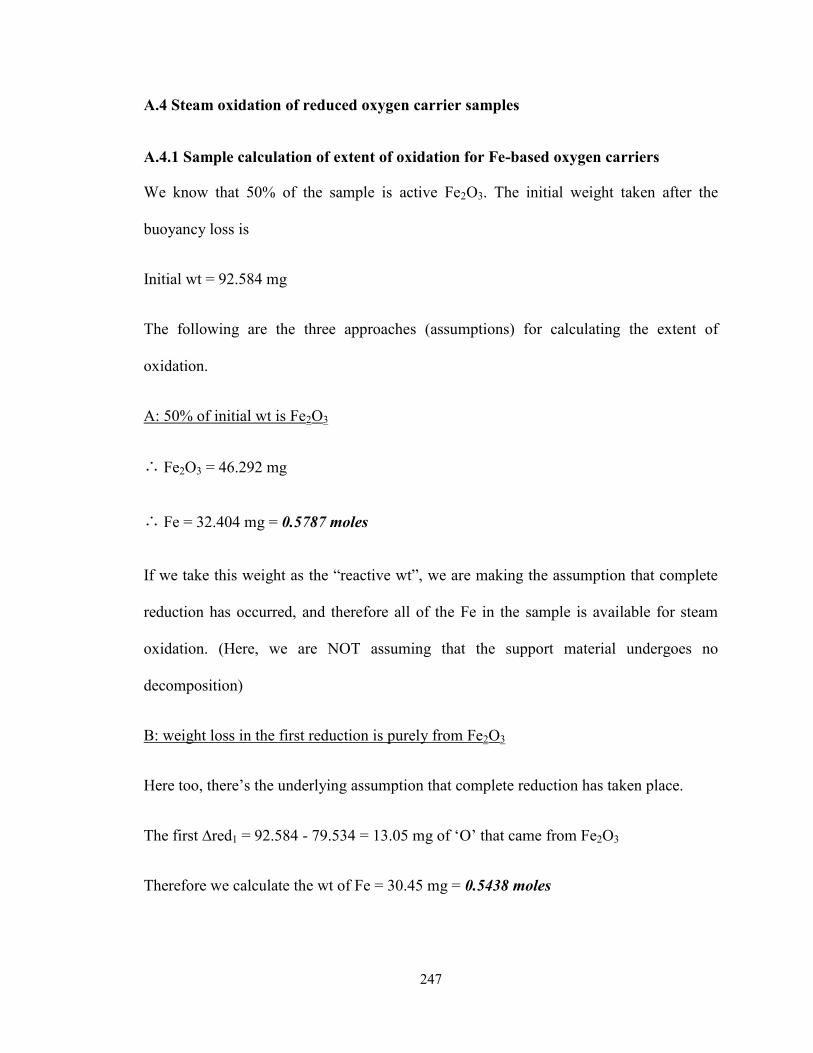
247
A.4 Steam oxidation of reduced oxygen carrier samples
A.4.1 Sample calculation of extent of oxidation for Fe-based oxygen carriers
We know that 50% of the sample is active Fe2O3. The initial weight taken after the
buoyancy loss is
Initial wt = 92.584 mg
The following are the three approaches (assumptions) for calculating the extent of
oxidation.
A: 50% of initial wt is Fe2O3
∴ Fe2O3 = 46.292 mg
∴ Fe = 32.404 mg = 0.5787 moles
If we take this weight as the “reactive wt”, we are making the assumption that complete
reduction has occurred, and therefore all of the Fe in the sample is available for steam
oxidation. (Here, we are NOT assuming that the support material undergoes no
decomposition)
B: weight loss in the first reduction is purely from Fe2O3
Here too, there’s the underlying assumption that complete reduction has taken place.
The first ∆red1 = 92.584 - 79.534 = 13.05 mg of ‘O’ that came from Fe2O3
Therefore we calculate the wt of Fe = 30.45 mg = 0.5438 moles
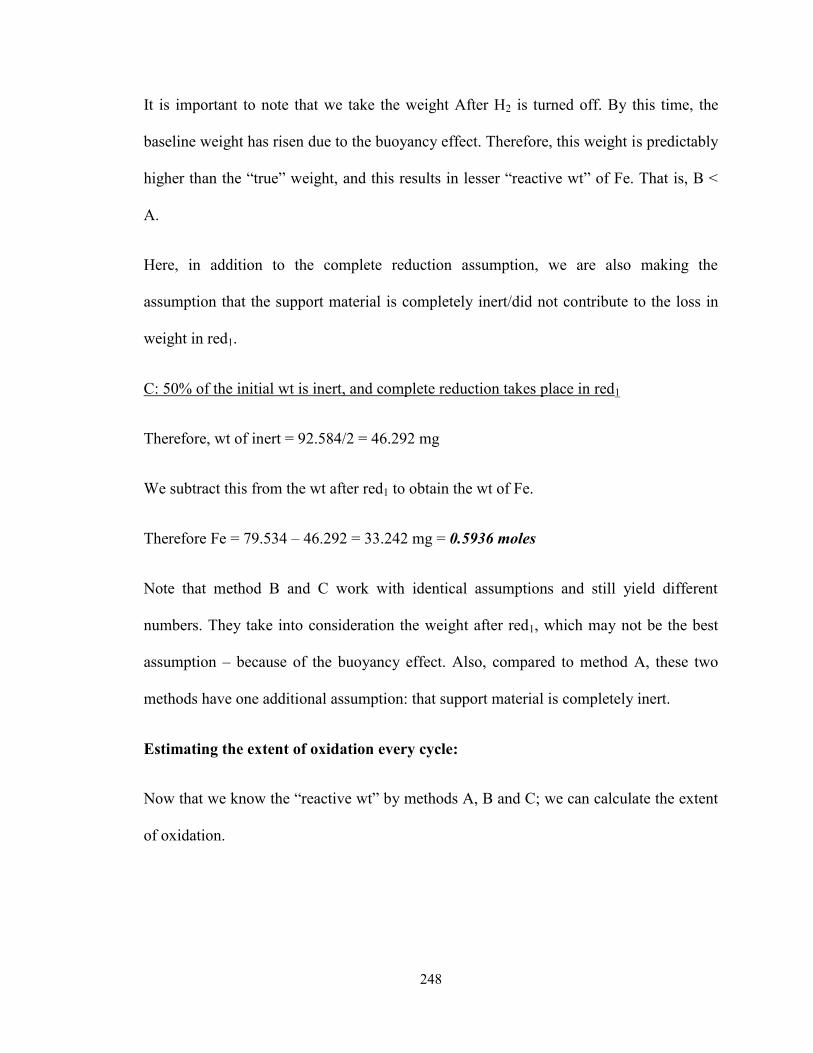
248
It is important to note that we take the weight After H2 is turned off. By this time, the
baseline weight has risen due to the buoyancy effect. Therefore, this weight is predictably
higher than the “true” weight, and this results in lesser “reactive wt” of Fe. That is, B <
A.
Here, in addition to the complete reduction assumption, we are also making the
assumption that the support material is completely inert/did not contribute to the loss in
weight in red1.
C: 50% of the initial wt is inert, and complete reduction takes place in red1
Therefore, wt of inert = 92.584/2 = 46.292 mg
We subtract this from the wt after red1 to obtain the wt of Fe.
Therefore Fe = 79.534 – 46.292 = 33.242 mg = 0.5936 moles
Note that method B and C work with identical assumptions and still yield different
numbers. They take into consideration the weight after red1, which may not be the best
assumption – because of the buoyancy effect. Also, compared to method A, these two
methods have one additional assumption: that support material is completely inert.
Estimating the extent of oxidation every cycle:
Now that we know the “reactive wt” by methods A, B and C; we can calculate the extent
of oxidation.
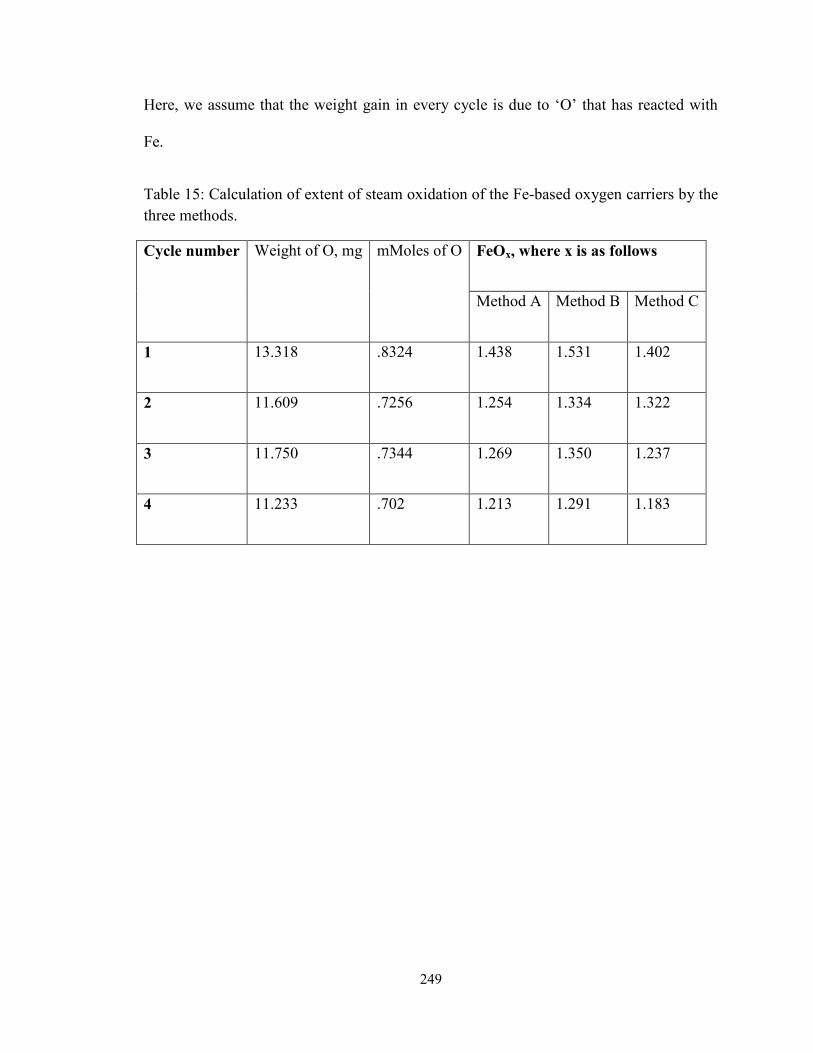
249
Here, we assume that the weight gain in every cycle is due to ‘O’ that has reacted with
Fe.
Table 15: Calculation of extent of steam oxidation of the Fe-based oxygen carriers by the
three methods.
Cycle number Weight of O, mg mMoles of O FeOx, where x is as follows
Method A Method B Method C
1 13.318 .8324 1.438 1.531 1.402
2 11.609 .7256 1.254 1.334 1.322
3 11.750 .7344 1.269 1.350 1.237
4 11.233 .702 1.213 1.291 1.183
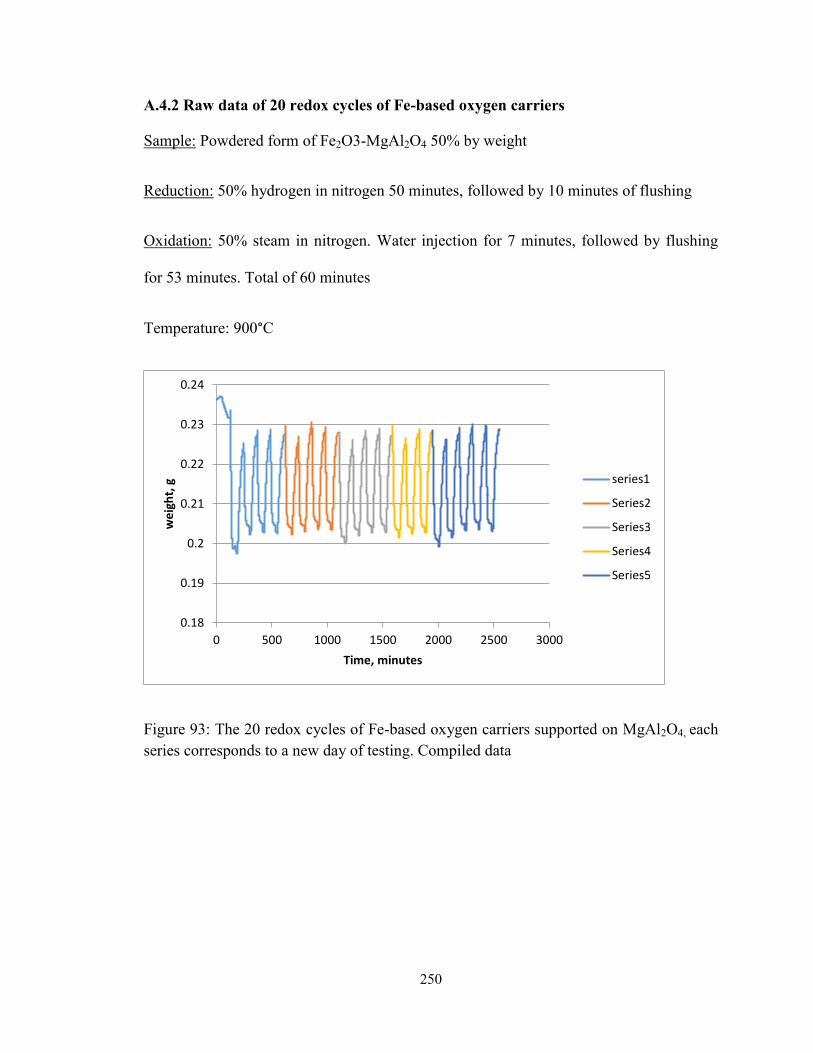
250
A.4.2 Raw data of 20 redox cycles of Fe-based oxygen carriers
Sample: Powdered form of Fe2O3-MgAl2O4 50% by weight
Reduction: 50% hydrogen in nitrogen 50 minutes, followed by 10 minutes of flushing
Oxidation: 50% steam in nitrogen. Water injection for 7 minutes, followed by flushing
for 53 minutes. Total of 60 minutes
Temperature: 900°C
Figure 93: The 20 redox cycles of Fe-based oxygen carriers supported on MgAl2O4, each
series corresponds to a new day of testing. Compiled data
0.18
0.19
0.2
0.21
0.22
0.23
0.24
0 500 1000 1500 2000 2500 3000
we
igh
t, g
Time, minutes
series1
Series2
Series3
Series4
Series5
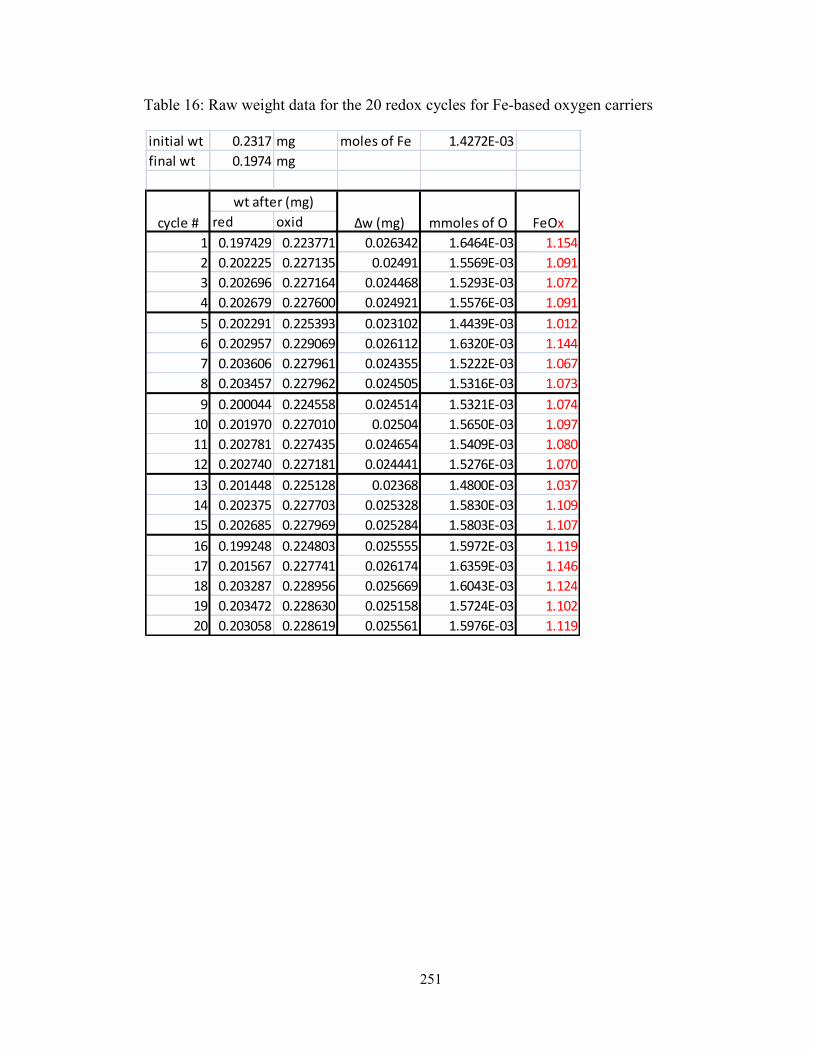
251
Table 16: Raw weight data for the 20 redox cycles for Fe-based oxygen carriers
initial wt 0.2317 mg moles of Fe 1.4272E-03
final wt 0.1974 mg
red oxid
1 0.197429 0.223771 0.026342 1.6464E-03 1.154
2 0.202225 0.227135 0.02491 1.5569E-03 1.091
3 0.202696 0.227164 0.024468 1.5293E-03 1.072
4 0.202679 0.227600 0.024921 1.5576E-03 1.091
5 0.202291 0.225393 0.023102 1.4439E-03 1.012
6 0.202957 0.229069 0.026112 1.6320E-03 1.144
7 0.203606 0.227961 0.024355 1.5222E-03 1.067
8 0.203457 0.227962 0.024505 1.5316E-03 1.073
9 0.200044 0.224558 0.024514 1.5321E-03 1.074
10 0.201970 0.227010 0.02504 1.5650E-03 1.097
11 0.202781 0.227435 0.024654 1.5409E-03 1.080
12 0.202740 0.227181 0.024441 1.5276E-03 1.070
13 0.201448 0.225128 0.02368 1.4800E-03 1.037
14 0.202375 0.227703 0.025328 1.5830E-03 1.109
15 0.202685 0.227969 0.025284 1.5803E-03 1.107
16 0.199248 0.224803 0.025555 1.5972E-03 1.119
17 0.201567 0.227741 0.026174 1.6359E-03 1.146
18 0.203287 0.228956 0.025669 1.6043E-03 1.124
19 0.203472 0.228630 0.025158 1.5724E-03 1.102
20 0.203058 0.228619 0.025561 1.5976E-03 1.119
cycle #
wt after (mg)
∆w (mg) mmoles of O FeOx
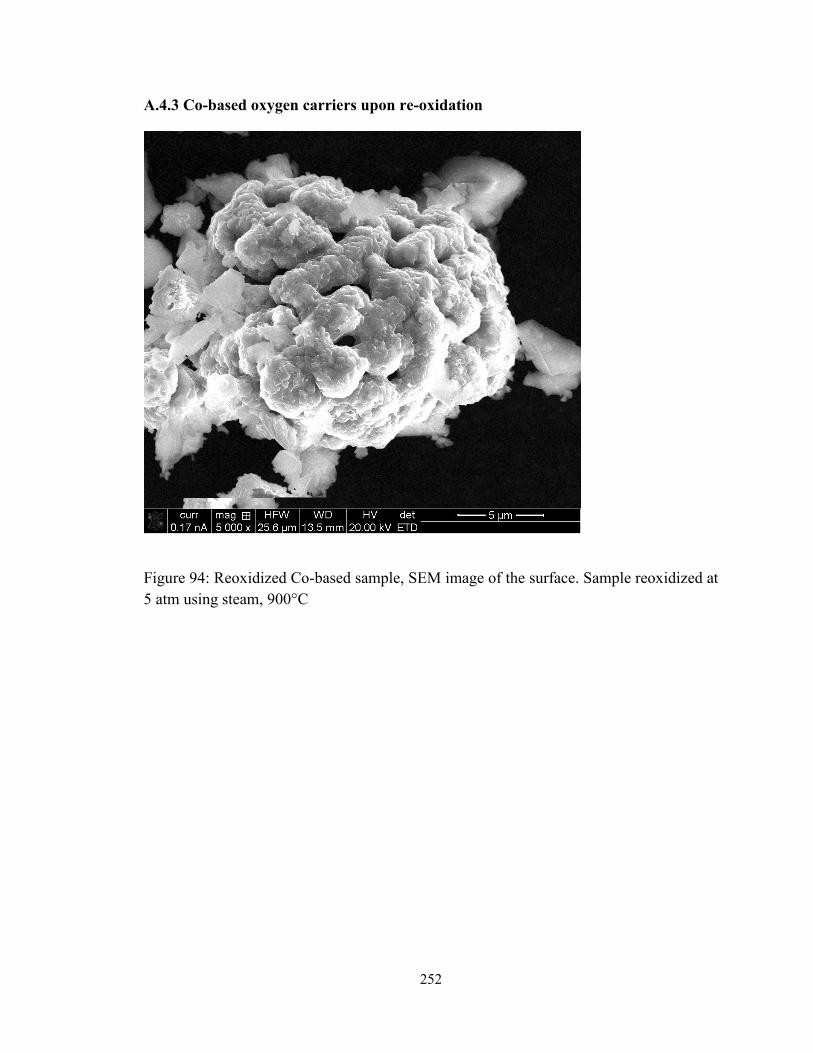
252
A.4.3 Co-based oxygen carriers upon re-oxidation
Figure 94: Reoxidized Co-based sample, SEM image of the surface. Sample reoxidized at
5 atm using steam, 900°C
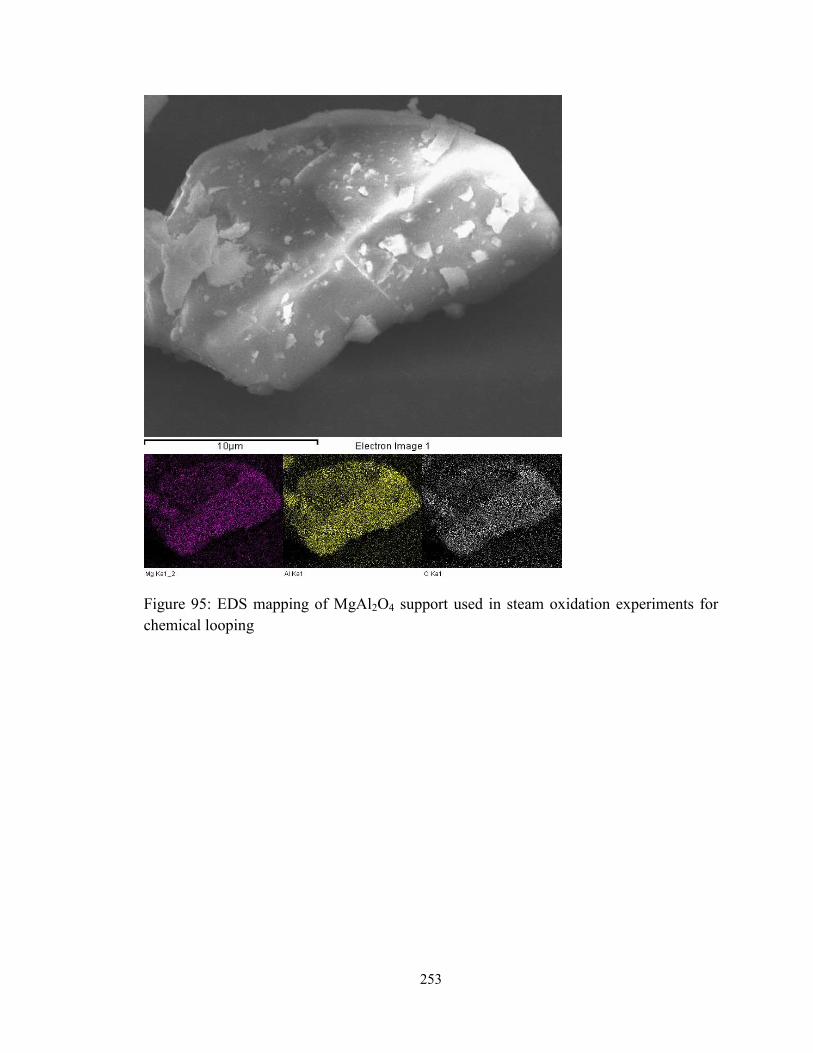
253
Figure 95: EDS mapping of MgAl2O4 support used in steam oxidation experiments for
chemical looping
254
REFERENCES
(1) Figueroa, J. D.; Fout, T.; Plasynski, S.; McIlvried, H.; Srivastava, R. D. Advances
in CO2 Capture technology—The U.S. Department of Energy’s Carbon
Sequestration Program. Int. J. Greenh. Gas Control 2008, 2 (1), 9–20.
(2) Fan, L.-S. Chemical Looping Systems for Fossil Energy Conversions; John Wiley
& Sons, 2011.
(3) Fan, L.-S.; Zeng, L.; Wang, W.; Luo, S. Chemical Looping Processes for CO2
Capture and Carbonaceous Fuel Conversion – Prospect and Opportunity. Energy
Environ. Sci. 2012, 5 (6), 7254–7280.
(4) Fan, L.-S.; Li, F. Chemical Looping Technology and Its Fossil Energy
Conversion Applications. Ind. Eng. Chem. Res. 2010, 49 (21), 10200–10211.
(5) Tong, A.; Bayham, S.; Kathe, M. V.; Zeng, L.; Luo, S.; Fan, L.-S. Iron-Based
Syngas Chemical Looping Process and Coal-Direct Chemical Looping Process
Development at Ohio State University. Appl. Energy 2014, 113, 1836–1845.
(6) Sridhar, D.; Tong, A.; Kim, H.; Zeng, L.; Li, F.; Fan, L.-S. Syngas Chemical
Looping Process: Design and Construction of a 25 kWth Subpilot Unit. Energy
Fuels 2012, 26 (4), 2292–2302.
(7) Tong, A.; Sridhar, D.; Sun, Z.; Kim, H. R.; Zeng, L.; Wang, F.; Wang, D.; Kathe,
M. V.; Luo, S.; Sun, Y.; Fan, L.-S. Continuous High Purity Hydrogen Generation
from a Syngas Chemical Looping 25 kWth Sub-Pilot Unit with 100% Carbon
Capture. Fuel 2013, 103, 495–505.
(8) Kim, H. R.; Wang, D.; Zeng, L.; Bayham, S.; Tong, A.; Chung, E.; Kathe, M. V.;
Luo, S.; McGiveron, O.; Wang, A.; Sun, Z.; Chen, D.; Fan, L.-S. Coal Direct
Chemical Looping Combustion Process: Design and Operation of a 25-kWth
Sub-Pilot Unit. Fuel 2013, 108, 370–384.
(9) Zeng, L.; He, F.; Li, F.; Fan, L.-S. Coal-Direct Chemical Looping Gasification
for Hydrogen Production: Reactor Modeling and Process Simulation. Energy
Fuels 2012, 26 (6), 3680–3690.
(10) Bayham, S. C.; Kim, H. R.; Wang, D.; Tong, A.; Zeng, L.; McGiveron, O.;
Kathe, M. V.; Chung, E.; Wang, W.; Wang, A.; Majumder, A.; Fan, L.-S. Iron-
Based Coal Direct Chemical Looping Combustion Process: 200-H Continuous
Operation of a 25-kWth Subpilot Unit. Energy Fuels 2013, 27 (3), 1347–1356.
(11) Sit, S. P.; Reed, A.; Hohenwarter, U.; Horn, V.; Marx, K.; Proell, T. Cenovus 10
MW CLC Field Pilot. Energy Procedia 2013, 37, 671–676.
(12) Penthor, S.; Mayer, K.; Kern, S.; Kitzler, H.; Wöss, D.; Pröll, T.; Hofbauer, H.
Chemical-Looping Combustion of Raw Syngas from Biomass Steam Gasification
255
– Coupled Operation of Two Dual Fluidized Bed Pilot Plants. Fuel 2014, 127,
178–185.
(13) Adanez, J.; Abad, A.; Garcia-Labiano, F.; Gayan, P.; de Diego, L. F. Progress in
Chemical-Looping Combustion and Reforming Technologies. Prog. Energy
Combust. Sci. 2012, 38 (2), 215–282.
(14) Ströhle, J.; Orth, M.; Epple, B. Design and Operation of a 1 MWth Chemical
Looping Plant. Appl. Energy 2014, 113, 1490–1495.
(15) Abdulally, I.; Beal, C.; Andrus, H.; Epple, B.; Lyngfelt, A.; Lani, B. W. Alstom’s
Chemical Looping Prototypes, Program Update. In Proceedings from 37th
International Technical Conference on Clean Coal & Fuel Systems; Clearwater,
FL, USA, 2012.
(16) Shimizu, T.; Hirama, T.; Hosoda, H.; Kitano, K.; Inagaki, M.; Tejima, K. A Twin
Fluid-Bed Reactor for Removal of CO2 from Combustion Processes. Chem. Eng.
Res. Des. 1999, 77 (1), 62–68.
(17) Blamey, J.; Anthony, E. J.; Wang, J.; Fennell, P. S. The Calcium Looping Cycle
for Large-Scale CO2 Capture. Prog. Energy Combust. Sci. 2010, 36 (2), 260–279.
(18) Sánchez-Biezma, A.; Ballesteros, J. C.; Diaz, L.; de Zárraga, E.; Álvarez, F. J.;
López, J.; Arias, B.; Grasa, G.; Abanades, J. C. Postcombustion CO2 Capture
with CaO. Status of the Technology and next Steps towards Large Scale
Demonstration. Energy Procedia 2011, 4, 852–859.
(19) Fan, L.; Gupta, H. Separation of Carbon Dioxide (CO2) from Gas Mixtures by
Calcium Based Reaction Separation (CaRS-CO2) Process. 20060039853,
February 23, 2006.
(20) Fan, L.-S.; Ramkumar, S.; Wang, W.; Statnick, R. Carbonation Calcination
Reaction Process for CO2 Capture Using a Highly Regenerable Sorbent.
US8512661 B2, August 20, 2013.
(21) Deshpande, N.; Phalak, N.; Fan, L.-S.; Sankaran, S. Carbon Dioxide (CO2)
Capture from Coal-Fired Power Plants Using Calcium Looping. Chem. Eng.
Educ.
(22) Wang, W.; Ramkumar, S.; Li, S.; Wong, D.; Iyer, M.; Sakadjian, B. B.; Statnick,
R. M.; Fan, L.-S. Subpilot Demonstration of the Carbonation−Calcination
Reaction (CCR) Process: High-Temperature CO2 and Sulfur Capture from Coal-
Fired Power Plants. Ind. Eng. Chem. Res. 2010, 49 (11), 5094–5101.
(23) Chang, M.-H.; Huang, C.-M.; Liu, W.-H.; Chen, W.-C.; Cheng, J.-Y.; Chen, W.;
Wen, T.-W.; Ouyang, S.; Shen, C.-H.; Hsu, H.-W. Design and Experimental
Investigation of Calcium Looping Process for 3-kWth and 1.9-MWth Facilities.
Chem. Eng. Technol. 2013, 36 (9), 1525–1532.
(24) Phalak, N.; Ramkumar, S.; Deshpande, N.; Wang, A.; Wang, W.; Statnick, R. M.;
Fan, L.-S. Calcium Looping Process for Clean Coal Conversion: Design and
Operation of the Subpilot-Scale Carbonator. Ind. Eng. Chem. Res. 2012, 51 (30),
9938–9944.
(25) Arias, B.; Diego, M. E.; Abanades, J. C.; Lorenzo, M.; Diaz, L.; Martínez, D.;
Alvarez, J.; Sánchez-Biezma, A. Demonstration of Steady State CO2 Capture in a
1.7 MWth Calcium Looping Pilot. Int. J. Greenh. Gas Control 2013, 18, 237–
245.
256
(26) Plötz, S.; Bayrak, A.; Galloy, A.; Kremer, J.; Orth, M.; Wieczorek, M.; Ströhle,
J.; Epple, B. First Carbonate Looping Experiments with a 1 MWth Test Facility
Consisting of Two Interconnected CFBs. 21st Int. Conf. Fluid. Bed Combust.
2012, 421–428.
(27) Florin, N. H.; Blamey, J.; Fennell, P. S. Synthetic CaO-Based Sorbent for CO2
Capture from Large-Point Sources. Energy Fuels 2010, 24 (8), 4598–4604.
(28) Manovic, V.; Anthony, E. J. Lime-Based Sorbents for High-Temperature CO2
Capture—A Review of Sorbent Modification Methods. Int. J. Environ. Res.
Public. Health 2010, 7 (8), 3129–3140.
(29) Yu, F.-C.; Phalak, N.; Sun, Z.; Fan, L.-S. Activation Strategies for Calcium-
Based Sorbents for CO2 Capture: A Perspective. Ind. Eng. Chem. Res. 2012, 51
(4), 2133–2142.
(30) Liu, F.-Q.; Li, W.-H.; Liu, B.-C.; Li, R.-X. Synthesis, Characterization, and High
Temperature CO2 Capture of New CaO Based Hollow Sphere Sorbents. J. Mater.
Chem. A 2013, 1 (27), 8037–8044.
(31) Liu, W.; Low, N. W.; Feng, B.; Wang, G.; Diniz da Costa, J. C. Calcium
Precursors for the Production of CaO Sorbents for Multicycle CO2 Capture.
Environ. Sci. Technol. 2010, 44 (2), 841–847.
(32) Li, Y.; Sun, R.; Liu, H.; Lu, C. Cyclic CO2 Capture Behavior of Limestone
Modified with Pyroligneous Acid (PA) during Calcium Looping Cycles. Ind.
Eng. Chem. Res. 2011, 50 (17), 10222–10228.
(33) Albrecht, K. O.; Wagenbach, K. S.; Satrio, J. A.; Shanks, B. H.; Wheelock, T. D.
Development of a CaO-Based CO2 Sorbent with Improved Cyclic Stability. Ind.
Eng. Chem. Res. 2008, 47 (20), 7841–7848.
(34) Li, Z.; Cai, N.; Huang, Y. Effect of Preparation Temperature on Cyclic CO2
Capture and Multiple Carbonation−Calcination Cycles for a New Ca-Based CO2
Sorbent. Ind. Eng. Chem. Res. 2006, 45 (6), 1911–1917.
(35) Arias, B.; Grasa, G. S.; Alonso, M.; Abanades, J. C. Post-Combustion Calcium
Looping Process with a Highly Stable Sorbent Activity by Recarbonation. Energy
Environ. Sci. 2012, 5 (6), 7353–7359.
(36) Liu, W.; An, H.; Qin, C.; Yin, J.; Wang, G.; Feng, B.; Xu, M. Performance
Enhancement of Calcium Oxide Sorbents for Cyclic CO2 Capture—A Review.
Energy Fuels 2012, 26 (5), 2751–2767.
(37) Sun, Z.; Chi, H.; Fan, L.-S. Physical and Chemical Mechanism for Increased
Surface Area and Pore Volume of CaO in Water Hydration. Ind. Eng. Chem. Res.
2012, 51 (33), 10793–10799.
(38) Wang, W.; Ramkumar, S.; Wong, D.; Fan, L.-S. Simulations and Process
Analysis of the Carbonation–calcination Reaction Process with Intermediate
Hydration. Fuel 2012, 92 (1), 94–106.
(39) Ramkumar, S.; Fan, L.-S. Thermodynamic and Experimental Analyses of the
Three-Stage Calcium Looping Process. Ind. Eng. Chem. Res. 2010, 49 (16),
7563–7573.
(40) Wang, A.; Wang, D.; Deshpande, N.; Phalak, N.; Wang, W.; Fan, L.-S. Design
and Operation of a Fluidized Bed Hydrator for Steam Reactivation of Calcium
Sorbent. Ind. Eng. Chem. Res. 2013, 52 (8), 2793–2802.
257
(41) Schaube, F.; Koch, L.; Wörner, A.; Müller-Steinhagen, H. A Thermodynamic and
Kinetic Study of the de- and Rehydration of Ca(OH)2 at High H2O Partial
Pressures for Thermo-Chemical Heat Storage. Thermochim. Acta 2012, 538, 9–
20.
(42) International Energy Outlook-2011; DOE/EIA-0484; 2011.
(43) Ouyang, S.; Hsu, H. W.; Tong, L. T.; Liao, C. W.; Hu, R. Y. Z. Carbon Capture
and Sequestration Technology Development in ITRI. Sustain. Environ. Res. 2011,
21 (1), 21–28.
(44) Chiao, C. H.; Chen, J. L.; Lan, C. R.; Chen, S.; Hsu, H. W. Development of
Carbon Dioxide Capture and Storage Technology - Taiwan Power Company
Perspective. Sustain. Environ. Res. 2011, 21 (1), 1–8.
(45) Shie, J. L.; Chang, C. Y.; Chiou, C. S.; Chen, Y. H.; Chen, Y. W.; Chang, C. C.
Photocatalytic Reduction of Gaseous and Solution CO2 to Energy Products Using
Ag/TiO2 and Cu/TiO2 in CuCl2 Solution. Sustain. Environ. Res. 2012, 22 (4),
237–246.
(46) Lin, C. J.; Liou, Y. H.; Chen, S. Y.; Tsai, M. C. Visible-Light Photocatalytic
Conversion of CO2 to Methanol Using Dye-Sensitized Mesoporous
Photocatalysts. Sustain. Environ. Res. 2012, 22 (3), 167–172.
(47) Rao, A. B.; Rubin, E. S. Identifying Cost-Effective CO2 Control Levels for
Amine-Based CO2 Capture Systems. Ind. Eng. Chem. Res. 2006, 45 (8), 2421–
2429.
(48) Li, F.; Fan, L.-S. Clean Coal Conversion Processes – Progress and Challenges.
Energy Environ. Sci. 2008, 1 (2), 248–267.
(49) Anthony, E. J. (Ben). Ca Looping Technology: Current Status, Developments and
Future Directions. Greenh. Gases Sci. Technol. 2011, 1 (1), 36–47.
(50) Dean, C. C.; Blamey, J.; Florin, N. H.; Al-Jeboori, M. J.; Fennell, P. S. The
Calcium Looping Cycle for CO2 Capture from Power Generation, Cement
Manufacture and Hydrogen Production. Chem. Eng. Res. Des. 2011, 89 (6), 836–
855.
(51) George p. Curran; Carl e. Fink; Everett Gorin. CO2 Acceptor Gasification
Process. In Fuel Gasification; Advances in Chemistry; AMERICAN
CHEMICAL SOCIETY, 1967; Vol. 69, pp 141–165.
(52) Balasubramanian, B.; Lopez Ortiz, A.; Kaytakoglu, S.; Harrison, D. P. Hydrogen
from Methane in a Single-Step Process. Chem. Eng. Sci. 1999, 54 (15–16), 3543–
3552.
(53) Barelli, L.; Bidini, G.; Gallorini, F.; Servili, S. Hydrogen Production through
Sorption-Enhanced Steam Methane Reforming and Membrane Technology: A
Review. Energy 2008, 33 (4), 554–570.
(54) IEC, The World Egg Industry - A Few Facts and Figures. International Egg
Comission, 2012.
(55) Egg Industry Fact Sheet. United Egg Producers, 2012.
(56) Ma, K.-W.; Teng, H. CaO Powders from Oyster Shells for Efficient CO2 Capture
in Multiple Carbonation Cycles. J. Am. Ceram. Soc. 2010, 93 (1), 221–227.
258
(57) Sacia, E. R.; Ramkumar, S.; Phalak, N.; Fan, L.-S. Synthesis and Regeneration of
Sustainable CaO Sorbents from Chicken Eggshells for Enhanced Carbon Dioxide
Capture. ACS Sustain. Chem. Eng. 2013, 1 (8), 903–909.
(58) Deshpande, N.; Yuh, B. Screening of Multiple Waste Animal Shells as a Source
of Calcium Sorbent for High Temperature CO2 Capture. Sustain. Eng. Res. 2013,
23, 227–232.
(59) Bargain Empty Ostrich Eggshell. 24. Floeck’s Country Ranch, Product
Catalogue, 2012.
(60) Phalak, N.; Deshpande, N.; Fan, L.-S. Investigation of High-Temperature Steam
Hydration of Naturally Derived Calcium Oxide for Improved Carbon Dioxide
Capture Capacity over Multiple Cycles. Energy Fuels 2012, 26 (6), 3903–3909.
(61) Li, L.; Zhao, N.; Wei, W.; Sun, Y. A Review of Research Progress on CO2
Capture, Storage, and Utilization in Chinese Academy of Sciences. Fuel 2013,
108, 112–130.
(62) Li, Y.; Zhao, C.; Duan, L.; Liang, C.; Li, Q.; Zhou, W.; Chen, H. Cyclic
Calcination/carbonation Looping of Dolomite Modified with Acetic Acid for
CO2 Capture. Fuel Process. Technol. 2008, 89 (12), 1461–1469.
(63) Federal Register / Vol. 77, No. 64 / Tuesday, April 3, 2012 / Rules and
Regulations.
(64) Bowman, C. T. Control of Combustion-Generated Nitrogen Oxide Emissions:
Technology Driven by Regulation. Symp. Int. Combust. 1992, 24 (1), 859–878.
(65) Srivastava, R. K. Controlling SO2 Emissions–a Review of Technologies; United
States Environmental Protection Agency, Office of Research and Development
Washington, DC, 2000.
(66) Spliethoff, H.; Greul, U.; Rüdiger, H.; Hein, K. R. G. Basic Effects on NOx
Emissions in Air Staging and Reburning at a Bench-Scale Test Facility. Fuel
1996, 75 (5), 560–564.
(67) Srivastava, R. K.; Hall, R. E.; Khan, S.; Culligan, K.; Lani, B. W. Nitrogen
Oxides Emission Control Options for Coal-Fired Electric Utility Boilers. J. Air
Waste Manag. Assoc. 2005, 55 (9), 1367–1388.
(68) Radojevic, M. Reduction of Nitrogen Oxides in Flue Gases. Environ. Pollut.
1998, 102 (1, Supplement 1), 685–689.
(69) Smoot, L. D.; Hill, S. C.; Xu, H. NOx Control through reburning1. Prog. Energy
Combust. Sci. 1998, 24 (5), 385–408.
(70) Kasper, J. M.; III, C. A. C.; Cooper, C. D. Control of Nitrogen Oxide Emissions
by Hydrogen Peroxide-Enhanced Gas-Phase Oxidation of Nitric Oxide. J. Air
Waste Manag. Assoc. 1996, 46 (2), 127–133.
(71) Metz, B.; Davidson, O.; Coninck, H.; Loos, M.; Meyer, L. Carbon Dioxide
Capture and Storage; IPCC, Cambridge University Press, UK, 2005.
(72) Gupta, H.; Benson, S. A.; Fan, L.-S.; Laumb, J. D.; Olson, E. S.; Crocker, C. R.;
Sharma, R. K.; Knutson, R. Z.; Rokanuzzaman, A. S. M. Pilot-Scale Studies of
NOx Reduction by Activated High-Sodium Lignite Chars: A Demonstration of
the CARBONOX Process. Ind. Eng. Chem. Res. 2004, 43 (18), 5820–5827.
259
(73) Gupta, H.; Fan, L.-S. Reduction of Nitric Oxide from Combustion Flue Gas by
Bituminous Coal Char in the Presence of Oxygen. Ind. Eng. Chem. Res. 2003, 42
(12), 2536–2543.
(74) Illán-Gómez, M. J.; Brandán, S.; Salinas-Martı́nez de Lecea, C.; Linares-Solano,
A. Improvements in NOx Reduction by Carbon Using Bimetallic Catalysts. Fuel
2001, 80 (14), 2001–2005.
(75) Zhao, Z.; Qiu, J.; Li, W.; Chen, H.; Li, B. Influence of Mineral Matter in Coal on
Decomposition of NO over Coal Chars and Emission of NO during Char
Combustion☆. Fuel 2003, 82 (8), 949–957.
(76) Zhao, Z.; Li, W.; Li, B. Catalytic Reduction of NO by Coal Chars Loaded with
Ca and Fe in Various Atmospheres. Fuel 2002, 81 (11–12), 1559–1564.
(77) Yamashita, H.; Yoshida, S.; Tomita, A. Local Structures of Metals Dispersed on
Coal. 2. Ultrafine FeOOH as Active Iron Species for Steam Gasification of
Brown Coal. Energy Fuels 1991, 5 (1), 52–57.
(78) Zhong, B. J.; Tang, H. Catalytic NO Reduction at High Temperature by de-Ashed
Chars with Catalysts. Combust. Flame 2007, 149 (1–2), 234–243.
(79) Illan-Gomez, M. J.; Linares-Solano, A.; Radovic, L. R.; Salinas-Martinez de
Lecea, C. NO Reduction by Activated Carbons. 5. Catalytic Effect of Iron.
Energy Fuels 1995, 9 (3), 540–548.
(80) Chang, H.; Li, B.; Li, W.; Chen, H. The Influence of Mineral Matters in Coal on
NO-Char Reaction in the Presence of SO2. Fuel 2004, 83 (6), 679–683.
(81) Illan-Gomez, M. J.; Linares-Solano, A.; Radovic, L. R.; Salinas-Martinez de
Lecea, C. NO Reduction by Activated Carbons. 4. Catalysis by Calcium. Energy
Fuels 1995, 9 (1), 112–118.
(82) Fan, L.-S.; Deshpande, N.; Phalek, N. United States Patent: 8877150 - Single-
Step Process for the Simultaneous Removal of CO2, SOx and NOx from a Gas
Mixture. 8877150, November 4, 2014.
(83) Illán-Gómez, M. J.; Linares-Solano, A.; Radovic, L. R.; Salinas-Martínez de
Lecea, C. NO Reduction by Activated Carbons. 7. Some Mechanistic Aspects of
Uncatalyzed and Catalyzed Reaction. Energy Fuels 1996, 10 (1), 158–168.
(84) Pevida, C.; Arenillas, A.; Rubiera, F.; Pis, J. J. Heterogeneous Reduction of Nitric
Oxide on Synthetic Coal Chars. Fuel 2005, 84 (17), 2275–2279.
(85) Mahajan, O. P.; Yarzab, R.; Walker Jr, P. L. Unification of Coal-Char
Gasification Reaction Mechanisms. Fuel 1978, 57 (10), 643–646.
(86) Illan-Gomez, M. J.; Linares-Solano, A.; Radovic, L. R.; Salinas-Martinez de
Lecea, C. NO Reduction by Activated Carbons. 2. Catalytic Effect of Potassium.
Energy Fuels 1995, 9 (1), 97–103.
(87) Black, J.; Haslbeck, J. L.; Kuehn, N. J.; Lewis, E. G.; Pinkerton, L. L.; Simpson,
J.; Turner, M. J.; Varghese, E.; Woods, M. C. Cost and Performance Baseline for
Fossil Energy Plants; DOE/NETL-2010/1397; Pittsburgh, PA, 2010.
(88) Wong, D. High Temperature Reactive CO2 Separation from Flue Gas Using
Calcium Based Sorbents. Masters Thesis, The Ohio State University: Columbus,
2007.
260
(89) Wang, W. Experimental Results and Computer Simulations for Post-Combustion
Carbon Dioxide Removal Using Limestone. Masters Thesis, The Ohio State
University: Columbus, 2009.
(90) Wang, W.; Ramkumar, S.; Fan, L.-S. Energy Penalty of CO2 Capture for the
Carbonation–Calcination Reaction (CCR) Process: Parametric Effects and
Comparisons with Alternative Processes. Fuel 2013, 104, 561–574.
(91) Ramkumar, S.; Fan, L.-S. Calcium Looping Process (CLP) for Enhanced
Noncatalytic Hydrogen Production with Integrated Carbon Dioxide Capture.
Energy Fuels 2010, 24 (8), 4408–4418.
(92) Ramkumar, S.; Phalak, N.; Fan, L.-S. Calcium Looping Process (CLP) for
Enhanced Steam Methane Reforming. Ind. Eng. Chem. Res. 2011, 51 (3), 1186–
1192.
(93) Connell, D. P.; Lewandowski, D. A.; Ramkumar, S.; Phalak, N.; Statnick, R. M.;
Fan, L.-S. Process Simulation and Economic Analysis of the Calcium Looping
Process (CLP) for Hydrogen and Electricity Production from Coal and Natural
Gas. Fuel 2013, 105, 383–396.
(94) Qiu, K.; Mattisson, T.; Steenari, B.-M.; Lindqvist, O. Thermogravimetric
Combined with Mass Spectrometric Studies on the Oxidation of Calcium Sulfide.
Thermochim. Acta 1997, 298 (1–2), 87–93.
(95) Song, Z.; Zhang, M.; Ma, C. Study on the Oxidation of Calcium Sulfide Using
TGA and FTIR. Fuel Process. Technol. 2007, 88 (6), 569–575.
(96) Anthony, E. J.; Jia, L.; Qiu, K. CaS Oxidation by Reaction with CO2 and H2O.
Energy Fuels 2003, 17 (2), 363–368.
(97) Marbán, G.; Garcı́a-Calzada, M.; Fuertes, A. B. Kinetics of Oxidation of CaS
Particles in the Regime of Low SO2 Release. Chem. Eng. Sci. 1999, 54 (1), 77–
90.
(98) Wheelock, T. D.; Boylan, D. R. Reductive Decomposition of Gypsum by Carbon
Monoxide. Ind. Eng. Chem. 1960, 52 (3), 215–218.
(99) Diaz-Bossio, L. M.; Squier, S. E.; Pulsifer, A. H. Reductive Decomposition of
Calcium Sulfate Utilizing Carbon Monoxide and Hydrogen. Chem. Eng. Sci.
1985, 40 (3), 319–324.
(100) Davies, N. H.; Laughlin, K. M.; Hayhurst, A. N. The Oxidation of Calcium
Sulphide at the Temperatures of Fluidised-Bed Combustors. Symp. Int. Combust.
1994, 25 (1), 211–218.
(101) Uemiya, S.; Kobayashi, T.; Kojima, T. Desulfurization Behavior of Ca-Based
Absorbents under Periodically Changing Condition between Reducing and
Oxidizing Atmosphere. Energy Convers. Manag. 2001, 42 (15–17), 2029–2041.
(102) US EPA. Clean Power Plan Proposed Rule http://www2.epa.gov/carbon-
pollution-standards/clean-power-plan-proposed-rule (accessed Nov 24, 2014).
(103) Hoffman, M. R.; Martin, S. T.; Choi, W.; Bahnemann, D. W. Environmental
Applications of Semiconductor Photocatalysis. Chem. Rev. U. S. 1995, 95 (1),
69–96.
(104) Adler, S. B. Factors Governing Oxygen Reduction in Solid Oxide Fuel Cell
Cathodes. Chem. Rev. 2004, 104 (10), 4791–4843.
261
(105) Poizot, P.; Laruelle, S.; Grugeon, S.; Dupont, L.; Tarascon, J.-M. Nano-Sized
Transition-Metal Oxides as Negative-Electrode Materials for Lithium-Ion
Batteries. Nature 2000, 407 (6803), 496–499.
(106) Kung, H. H. Transition Metal Oxides: Surface Chemistry and Catalysis; Elsevier,
1989.
(107) T Punniyamurthy, S. V. Recent Advances in Transition Metal Catalyzed
Oxidation of Organic Substrates with Molecular Oxygen. Chem. Rev. 2005, 105
(6), 2329–2363.
(108) Li, F.; Kim, H. R.; Sridhar, D.; Wang, F.; Zeng, L.; Chen, J.; Fan, L.-S. Syngas
Chemical Looping Gasification Process: Oxygen Carrier Particle Selection and
Performance. Energy Fuels 2009, 23 (8), 4182–4189.
(109) Lunsford, J. H. Catalytic Conversion of Methane to More Useful Chemicals and
Fuels: A Challenge for the 21st Century. Catal. Today 2000, 63 (2–4), 165–174.
(110) Wilhelm, D. J.; Simbeck, D. R.; Karp, A. D.; Dickenson, R. L. Syngas Production
for Gas-to-Liquids Applications: Technologies, Issues and Outlook. Fuel
Process. Technol. 2001, 71 (1–3), 139–148.
(111) Kobayashi, Y.; Horiguchi, J.; Kobayashi, S.; Yamazaki, Y.; Omata, K.; Nagao,
D.; Konno, M.; Yamada, M. Effect of NiO Content in Mesoporous NiO–Al2O3
Catalysts for High Pressure Partial Oxidation of Methane to Syngas. Appl. Catal.
Gen. 2011, 395 (1–2), 129–137.
(112) Nagaoka, K.; Okamura, M.; Aika, K. Titania Supported Ruthenium as a Coking-
Resistant Catalyst for High Pressure Dry Reforming of Methane. Catal. Commun.
2001, 2 (8), 255–260.
(113) Rostrup-Nielsen, J. R. New Aspects of Syngas Production and Use. Catal. Today
2000, 63 (2–4), 159–164.
(114) Welty, J. A. B. Apparatus for Conversion of Hydrocarbons. US2550741 A, May
1, 1951.
(115) Li, F.; Zeng, L.; Velazquez-Vargas, L. G.; Yoscovits, Z.; Fan, L.-S. Syngas
Chemical Looping Gasification Process: Bench-Scale Studies and Reactor
Simulations. AIChE J. 2010, 56 (8), 2186–2199.
(116) Fan, L.; Li, F.; Ramkumar, S. Utilization of Chemical Looping Strategy in Coal
Gasification Processes. Particuology 2008, 6 (3), 131–142.
(117) Shen, L.; Wu, J.; Xiao, J.; Song, Q.; Xiao, R. Chemical-Looping Combustion of
Biomass in a 10 kWth Reactor with Iron Oxide As an Oxygen Carrier. Energy
Fuels 2009, 23 (5), 2498–2505.
(118) Luo, S.; Zeng, L.; Xu, D.; Kathe, M.; Chung, E.; Deshpande, N.; Qin, L.;
Majumder, A.; Hsieh, T.-L.; Tong, A.; Sun, Z.; Fan, L.-S. Shale Gas-to-Syngas
Chemical Looping Process for Stable Shale Gas Conversion to High Purity
Syngas with a H2:CO Ratio of 2:1. Energy Environ. Sci. 2014, 7 (12), 4104–4117.
(119) Rydén, M.; Lyngfelt, A.; Mattisson, T. Chemical-Looping Combustion and
Chemical-Looping Reforming in a Circulating Fluidized-Bed Reactor Using Ni-
Based Oxygen Carriers. Energy Fuels 2008, 22 (4), 2585–2597.
(120) Go, K. S.; Son, S. R.; Kim, S. D. Reaction Kinetics of Reduction and Oxidation
of Metal Oxides for Hydrogen Production. Int. J. Hydrog. Energy 2008, 33 (21),
5986–5995.
262
(121) Abad, A.; García-Labiano, F.; de Diego, L. F.; Gayán, P.; Adánez, J. Reduction
Kinetics of Cu-, Ni-, and Fe-Based Oxygen Carriers Using Syngas (CO + H2) for
Chemical-Looping Combustion. Energy Fuels 2007, 21 (4), 1843–1853.
(122) Deshpande, N.; Majumder, A.; Qin, L.; Fan, L.-S. High-Pressure Redox Behavior
of Iron-Oxide-Based Oxygen Carriers for Syngas Generation from Methane.
Energy Fuels 2015.
(123) Steinfeld, A.; Frei, A.; Kuhn, P. Thermoanalysis of the Combined Fe3O4-
Reduction and CH4-Reforming Processes. Metall. Mater. Trans. B 1995, 26 (3),
509–515.
(124) García-Labiano, F.; Adánez, J.; de Diego, L. F.; Gayán, P.; Abad, A. Effect of
Pressure on the Behavior of Copper-, Iron-, and Nickel-Based Oxygen Carriers
for Chemical-Looping Combustion. Energy Fuels 2006, 20 (1), 26–33.
(125) Mess, D.; Sarofim, A. F.; Longwell, J. P. Product Layer Diffusion during the
Reaction of Calcium Oxide with Carbon Dioxide. Energy Fuels 1999, 13 (5),
999–1005.
(126) Chauk, S. S.; Agnihotri, R.; Jadhav, R. A.; Misro, S. K.; Fan, L.-S. Kinetics of
High-Pressure Removal of Hydrogen Sulfide Using Calcium Oxide Powder.
AIChE J. 2000, 46 (6), 1157–1167.
(127) Agnihotri, R.; Chauk, S. S.; Misro, S. K.; Fan, L.-S. High-Pressure Reaction
Kinetics of Hydrogen Sulfide and Uncalcined Limestone Powder. Ind. Eng.
Chem. Res. 1999, 38 (10), 3802–3811.
(128) Hurst, S. Production of Hydrogen by the Steam-Iron Method. Oil Soap 1939, 16
(2), 29–35.
(129) Zafar, Q.; Mattisson, T.; Gevert, B. Integrated Hydrogen and Power Production
with CO2 Capture Using Chemical-Looping Reforming Redox Reactivity of
Particles of CuO, Mn2O3, NiO, and Fe2O3 Using SiO2 as a Support. Ind. Eng.
Chem. Res. 2005, 44 (10), 3485–3496.
(130) Svoboda, K.; Siewiorek, A.; Baxter, D.; Rogut, J.; Pohořelý, M. Thermodynamic
Possibilities and Constraints for Pure Hydrogen Production by a Nickel and
Cobalt-Based Chemical Looping Process at Lower Temperatures. Energy
Convers. Manag. 2008, 49 (2), 221–231.
(131) Nestl, S.; Voitic, G.; Lammer, M.; Marius, B.; Wagner, J.; Hacker, V. The
Production of Pure Pressurised Hydrogen by the Reformer-Steam Iron Process in
a Fixed Bed Reactor System. J. Power Sources 2015, 280, 57–65.
(132) Liu, W.; Ismail, M.; Dunstan, M. T.; Hu, W.; Zhang, Z.; Fennell, P. S.; Scott, S.
A.; Dennis, J. S. Inhibiting the Interaction between FeO and Al2O3 during
Chemical Looping Production of Hydrogen. RSC Adv. 2014, 5 (3), 1759–1771.
(133) Aston, V. J.; Evanko, B. W.; Weimer, A. W. Investigation of Novel Mixed Metal
Ferrites for Pure H2 and CO2 Production Using Chemical Looping. Int. J. Hydrog.
Energy 2013, 38 (22), 9085–9096.
(134) Grasa, G. S.; Abanades, J. C. CO2 Capture Capacity of CaO in Long Series of
Carbonation/Calcination Cycles. Ind. Eng. Chem. Res. 2006, 45 (26), 8846–8851.