cajeput tree bark derived activated carbon for the practical electrochemical detection of vanillin
TRANSCRIPT

This journal is©The Royal Society of Chemistry and the Centre National de la Recherche Scientifique 2015 New J. Chem., 2015, 39, 9109--9115 | 9109
Cite this: NewJ.Chem., 2015,
39, 9109
Cajeput tree bark derived activated carbon for thepractical electrochemical detection of vanillin
Vediyappan Veeramani,a Rajesh Madhu,a Shen-Ming Chen,*a
Pitchaimani Veerakumar,b Jhe-Jhen Syua and Shang-Bin Liu*bc
Cajeput tree bark derived activated carbon (TBAC) has been prepared and exploited for the electro-
chemical detection of vanillin (VAN). The physicochemical properties of the TBACs graphitized at different
temperatures were characterized using a variety of analytical and spectroscopic techniques, which include
X-ray diffraction, field emission-scanning/transmission electron microscopy (FE-SEM/TEM), N2 adsorption/
desorption isotherm measurements, and thermogravimetric analysis (TGA). Utilized as VAN sensors, the
electrochemical activities of various TBAC modified electrodes were assessed using cyclic voltammetry
(CV) and linear sweep voltammetry (LSV). The observed superior electrocatalytic activity for the oxidation
of VAN is attributed to the high surface area and desirable porosities possessed by TBAC. The VAN
sensor exhibited a wide linear range (5–1150 mM), low detection limit (0.68 mM), and excellent sensitivity
(0.32 mA mM�1 cm�2), which surpass the existing carbon-based electrodes reported in the literature. The
facile VAN sensor subsequently realized is also advantaged by its simplicity, stability, reliability, durability,
and low cost, which render real sample analysis and practical industrial applications.
1. Introduction
Biomass-derived activated carbon (AC) has been widely employedas an electrode material for applications in electrochemicalbiosensing, energy storage, removal of pollutants (e.g. dyesand toxic metal ions) from aqueous solutions.1–6 This is mainlydue to its favorable properties such as low cost, high surfacearea, and good electrical conductivity of porous carbon-basedelectrode materials.7–9 ACs prepared from renewable resourcesand biomass feedstocks, such as water bamboo,3 mango leaves,6
coconut shells,7 guava leaves,10 water hyacinth,11 pumpkinstems,12 eggplant,13 have been reported and widely applied ascost-effective raw materials.
Melaleuca leucadendron (family: Myrtaceae), which is theCajeput tree or Melaleuca tree, also commonly known as weepingpaper bark, white paper bark, or punk tree,14 is a tall-growingtree (typically 20–30 m in height) and is highly cultivatedin eastern Australia, Burma, New Guinea, the Solomon Islands,and the East Indies.15 One of the most striking features of theCajeput tree is its almost pure-white papery bark, which maypeel off in sheets. Parts of the plant are commonly prescribed
traditionally as a remedy for diabetes mellitus. Melaleuca oil,whose primary constituent is cineol, is also used in medicine.Extracted solid terpineol, on the other hand, contains severalaldehydes such as valeric, butyric, and benzoic aldehyde.16 Itsspongy tree bark is also commonly used as timber or to makeshields, canoes, and roofs. The paper bark of the tree is theoutermost layer of the stem and root of the woody plant. Cajeputtrees are also enriched in lignocellulosic materials, however, it isnecessary to break down the structure of its feedstock to obtainsugars from celluloses and hemicelluloses.17 The abundance oflignocelluloses in the Cajeput tree makes it a useful raw materialfor the fabrication of AC. Herein, the tree bark has been chosenas the precursor to prepare Cajeput tree bark derived activatedcarbon (TBAC).
Vanillin (VAN) is considered to be one of the most popularflavouring additive agents in beverages and cooking and is alsoused as an aromatic additive in candles, incense, potpourri,fragrances, perfumes, and air fresheners.18–20 VAN is alsoused as a starting material for the synthesis of drugs, such asL-dopa, which is used to treat patients with Parkinson’s disease.Basically, it is a phenolic aldehyde, which is obtained fromthe extracts of vanilla bean. However, excessive ingestion ofVAN may cause serious adverse effects, such as allergies21 andheadaches,22 and may also affect liver and kidney function.23
Another use of VAN is for the amelioration of depression, evenat relatively low concentrations.24 Several techniques have beenreported for the quantitative determination of VAN, whichinclude gas chromatography (GC),25 high-performance liquid
a Department of Chemical Engineering and Biotechnology, National Taipei
University of Technology, Taipei 10608, Taiwan.
E-mail: [email protected]; Fax: +886-2-2702523; Tel: +886-2-27017147b Institute of Atomic and Molecular Sciences, Academia Sinica, Taipei 10617,
Taiwanc Department of Chemistry, National Taiwan Normal University, Taipei 11677,
Taiwan. E-mail: [email protected]; Fax: +886-2-23620200
Received (in Montpellier, France)25th June 2015,Accepted 8th September 2015
DOI: 10.1039/c5nj01634g
www.rsc.org/njc
NJC
PAPER
Publ
ishe
d on
10
Sept
embe
r 20
15. D
ownl
oade
d by
Aca
dem
ia S
inic
a -
Tai
pei o
n 26
/11/
2015
02:
43:3
5.
View Article OnlineView Journal | View Issue
9110 | New J. Chem., 2015, 39, 9109--9115 This journal is©The Royal Society of Chemistry and the Centre National de la Recherche Scientifique 2015
chromatography (HPLC),26 capillary electrophoresis (CE),27
spectrophotometry,28 and colorimetric analysis.29 However,the use of these techniques, which involve sophisticated instru-mentation, is expensive, time-consuming, and also requires askilled operator to perform the experiment. Therefore, thedevelopment of a facile technique for the rapid, sensitive, andhighly selective detection of VAN is an urgent task.30–32
Recently, the advancements in electrochemical sensors haveattracted considerable attention due to their advantages of rapidresponse, easy operation, high sensitivity, excellent selectivity,and capacity for real-time in situ detection. For example, Zhenget al.33 reported the biosynthesis of Au–Ag alloy nanoparticles(NPs) by means of yeast cells and applied them to fabricate anelectrochemical sensor for the sensitive detection of VAN. Alongthe same line, an arginine functionalized graphene (Arg–G)nanocomposite was developed for the electrochemical sensingof VAN.34 A nitrogen-doped graphene/carbon nanotube (NGR–NCNT) nanocomposite prepared via the electrodepositionmethod has also been developed for the simultaneous determi-nation of caffeine and VAN.35 Likewise, a hexagonal silvernanoparticle containing graphene (AgNPs–GN) nanocompositemodified glassy carbon electrode (GCE) has been applied as anelectrochemical sensor for VAN detection.36 Under optimizedconditions, the calibration curve showed a linear range from 2 to100 mM for the detection of VAN with a detection limit of 3.32 �10�7 M. Moreover, a new type of poly(allylamine hydrochloride)stabilized gold nanoparticles (AuNP–PAH) was also employed assensors for the detection of VAN using the square-wave voltam-metry (SWV) technique, which exhibited a linear range from0.90 to 15.0 mmol L�1 with a detection limit of 55 nmol L�1 andremarkable cycling stability.37 These nanocomposite materialshave been explored as promising materials in the developmentof electrochemical sensors for the detection of vanillin.33–40
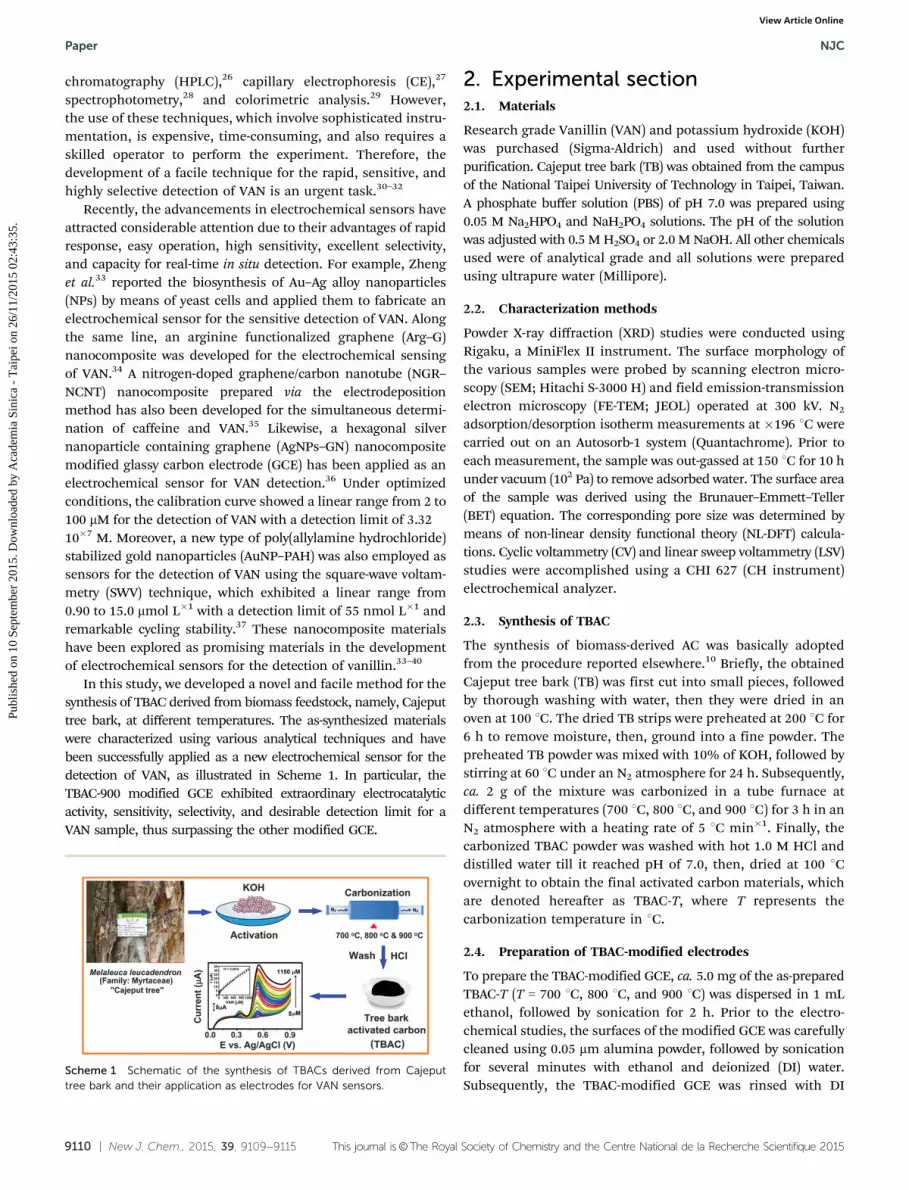
In this study, we developed a novel and facile method for thesynthesis of TBAC derived from biomass feedstock, namely, Cajeputtree bark, at different temperatures. The as-synthesized materialswere characterized using various analytical techniques and havebeen successfully applied as a new electrochemical sensor for thedetection of VAN, as illustrated in Scheme 1. In particular, theTBAC-900 modified GCE exhibited extraordinary electrocatalyticactivity, sensitivity, selectivity, and desirable detection limit for aVAN sample, thus surpassing the other modified GCE.
2. Experimental section2.1. Materials
Research grade Vanillin (VAN) and potassium hydroxide (KOH)was purchased (Sigma-Aldrich) and used without furtherpurification. Cajeput tree bark (TB) was obtained from the campusof the National Taipei University of Technology in Taipei, Taiwan.A phosphate buffer solution (PBS) of pH 7.0 was prepared using0.05 M Na2HPO4 and NaH2PO4 solutions. The pH of the solutionwas adjusted with 0.5 M H2SO4 or 2.0 M NaOH. All other chemicalsused were of analytical grade and all solutions were preparedusing ultrapure water (Millipore).
2.2. Characterization methods
Powder X-ray diffraction (XRD) studies were conducted usingRigaku, a MiniFlex II instrument. The surface morphology ofthe various samples were probed by scanning electron micro-scopy (SEM; Hitachi S-3000 H) and field emission-transmissionelectron microscopy (FE-TEM; JEOL) operated at 300 kV. N2
adsorption/desorption isotherm measurements at �196 1C werecarried out on an Autosorb-1 system (Quantachrome). Prior toeach measurement, the sample was out-gassed at 150 1C for 10 hunder vacuum (102 Pa) to remove adsorbed water. The surface areaof the sample was derived using the Brunauer–Emmett–Teller(BET) equation. The corresponding pore size was determined bymeans of non-linear density functional theory (NL-DFT) calcula-tions. Cyclic voltammetry (CV) and linear sweep voltammetry (LSV)studies were accomplished using a CHI 627 (CH instrument)electrochemical analyzer.
2.3. Synthesis of TBAC
The synthesis of biomass-derived AC was basically adoptedfrom the procedure reported elsewhere.10 Briefly, the obtainedCajeput tree bark (TB) was first cut into small pieces, followedby thorough washing with water, then they were dried in anoven at 100 1C. The dried TB strips were preheated at 200 1C for6 h to remove moisture, then, ground into a fine powder. Thepreheated TB powder was mixed with 10% of KOH, followed bystirring at 60 1C under an N2 atmosphere for 24 h. Subsequently,ca. 2 g of the mixture was carbonized in a tube furnace atdifferent temperatures (700 1C, 800 1C, and 900 1C) for 3 h in anN2 atmosphere with a heating rate of 5 1C min�1. Finally, thecarbonized TBAC powder was washed with hot 1.0 M HCl anddistilled water till it reached pH of 7.0, then, dried at 100 1Covernight to obtain the final activated carbon materials, whichare denoted hereafter as TBAC-T, where T represents thecarbonization temperature in 1C.
2.4. Preparation of TBAC-modified electrodes
To prepare the TBAC-modified GCE, ca. 5.0 mg of the as-preparedTBAC-T (T = 700 1C, 800 1C, and 900 1C) was dispersed in 1 mLethanol, followed by sonication for 2 h. Prior to the electro-chemical studies, the surfaces of the modified GCE was carefullycleaned using 0.05 mm alumina powder, followed by sonicationfor several minutes with ethanol and deionized (DI) water.Subsequently, the TBAC-modified GCE was rinsed with DI
Scheme 1 Schematic of the synthesis of TBACs derived from Cajeputtree bark and their application as electrodes for VAN sensors.
Paper NJC
Publ
ishe
d on
10
Sept
embe
r 20
15. D
ownl
oade
d by
Aca
dem
ia S
inic
a -
Tai
pei o
n 26
/11/
2015
02:
43:3
5.
View Article Online
This journal is©The Royal Society of Chemistry and the Centre National de la Recherche Scientifique 2015 New J. Chem., 2015, 39, 9109--9115 | 9111
water again to remove any unbound TBAC material, followed bythe introduction of an optimized concentration of test vanillinsample, using the drop casting method, onto the TBAC-modifiedGCE at 30 1C in an air oven. Finally, the TBAC-modified GCE wasemployed as the working electrode, whereas Ag/AgCl (undersaturated KCl) was used as the reference electrode, and platinumwire was used as the counter electrode.
3. Results and discussion3.1. Textural properties of TBAC materials
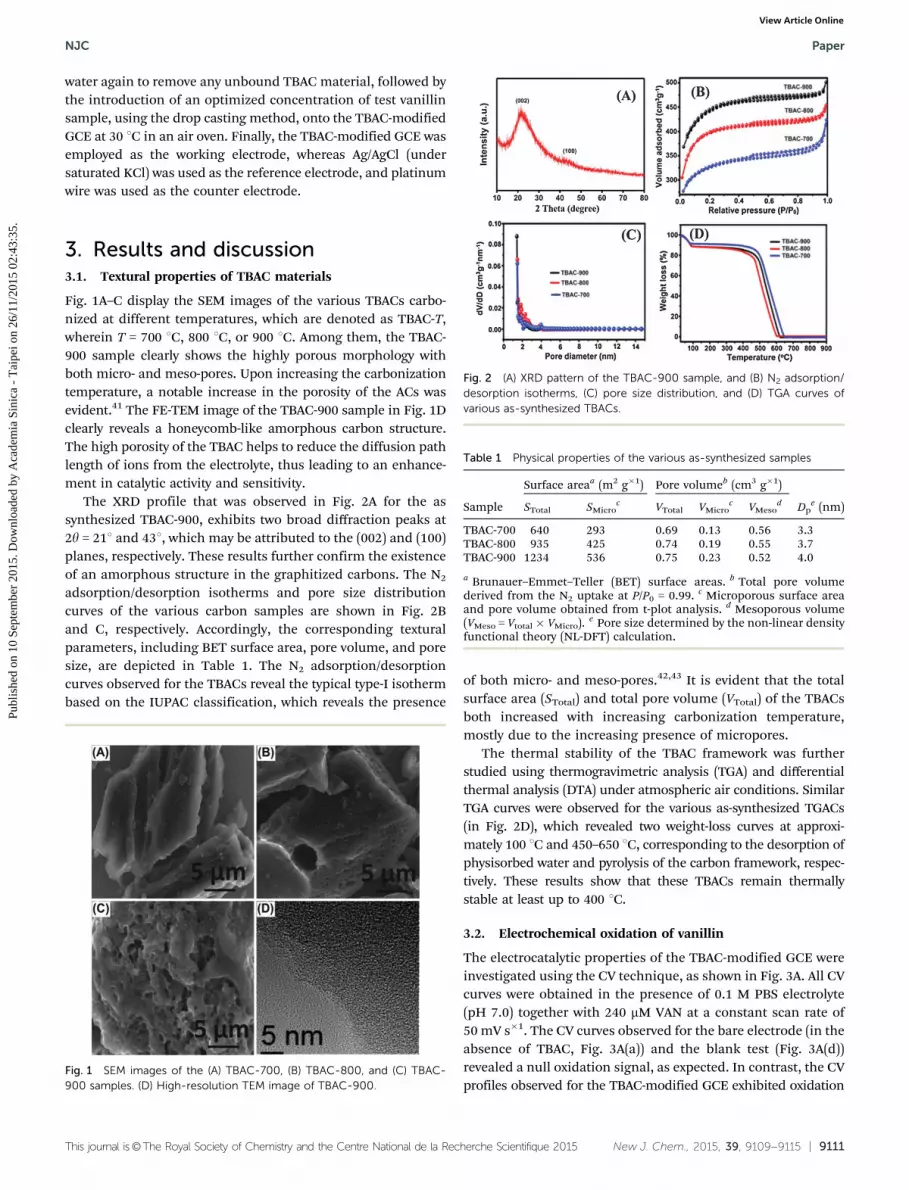
Fig. 1A–C display the SEM images of the various TBACs carbo-nized at different temperatures, which are denoted as TBAC-T,wherein T = 700 1C, 800 1C, or 900 1C. Among them, the TBAC-900 sample clearly shows the highly porous morphology withboth micro- and meso-pores. Upon increasing the carbonizationtemperature, a notable increase in the porosity of the ACs wasevident.41 The FE-TEM image of the TBAC-900 sample in Fig. 1Dclearly reveals a honeycomb-like amorphous carbon structure.The high porosity of the TBAC helps to reduce the diffusion pathlength of ions from the electrolyte, thus leading to an enhance-ment in catalytic activity and sensitivity.
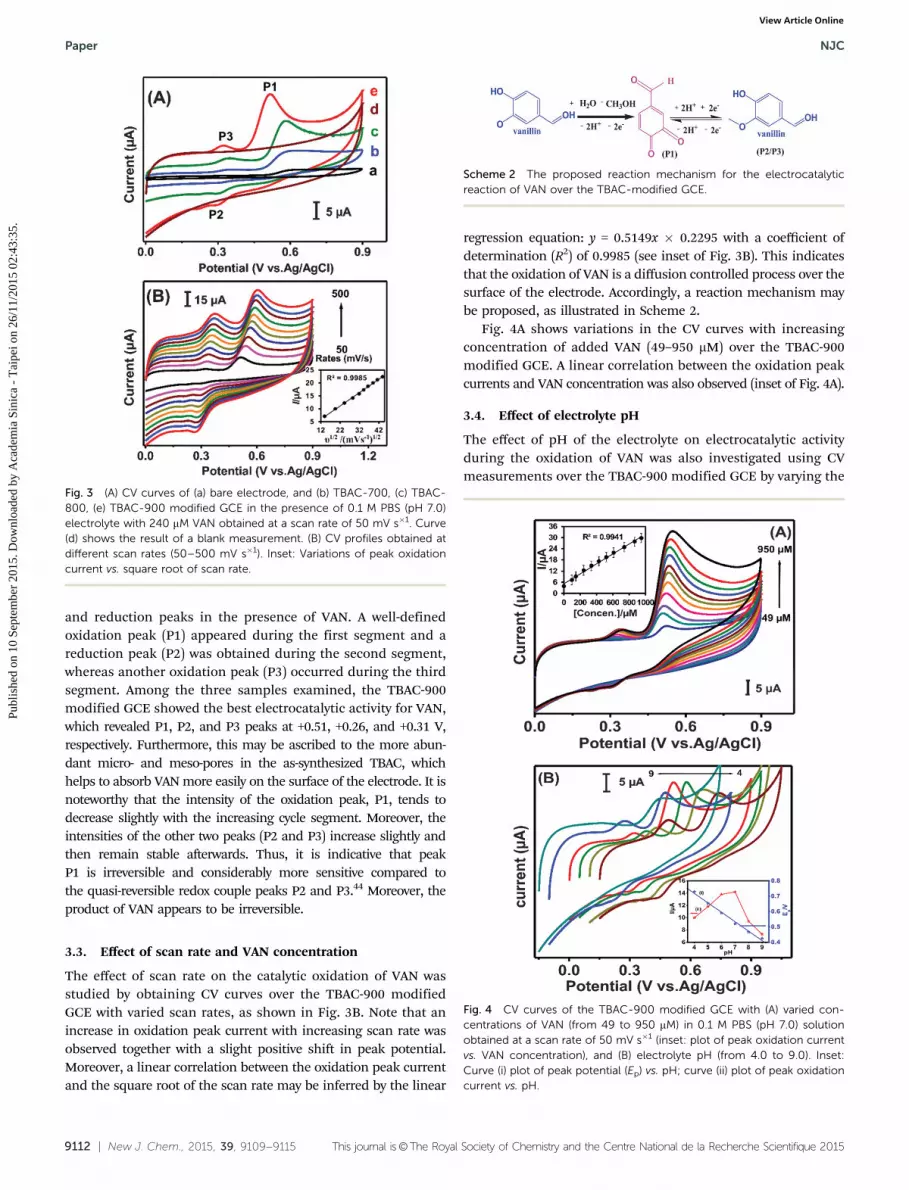
The XRD profile that was observed in Fig. 2A for the assynthesized TBAC-900, exhibits two broad diffraction peaks at2y = 211 and 431, which may be attributed to the (002) and (100)planes, respectively. These results further confirm the existenceof an amorphous structure in the graphitized carbons. The N2
adsorption/desorption isotherms and pore size distributioncurves of the various carbon samples are shown in Fig. 2Band C, respectively. Accordingly, the corresponding texturalparameters, including BET surface area, pore volume, and poresize, are depicted in Table 1. The N2 adsorption/desorptioncurves observed for the TBACs reveal the typical type-I isothermbased on the IUPAC classification, which reveals the presence
of both micro- and meso-pores.42,43 It is evident that the totalsurface area (STotal) and total pore volume (VTotal) of the TBACsboth increased with increasing carbonization temperature,mostly due to the increasing presence of micropores.
The thermal stability of the TBAC framework was furtherstudied using thermogravimetric analysis (TGA) and differentialthermal analysis (DTA) under atmospheric air conditions. SimilarTGA curves were observed for the various as-synthesized TGACs(in Fig. 2D), which revealed two weight-loss curves at approxi-mately 100 1C and 450–650 1C, corresponding to the desorption ofphysisorbed water and pyrolysis of the carbon framework, respec-tively. These results show that these TBACs remain thermallystable at least up to 400 1C.
3.2. Electrochemical oxidation of vanillin
The electrocatalytic properties of the TBAC-modified GCE wereinvestigated using the CV technique, as shown in Fig. 3A. All CVcurves were obtained in the presence of 0.1 M PBS electrolyte(pH 7.0) together with 240 mM VAN at a constant scan rate of50 mV s�1. The CV curves observed for the bare electrode (in theabsence of TBAC, Fig. 3A(a)) and the blank test (Fig. 3A(d))revealed a null oxidation signal, as expected. In contrast, the CVprofiles observed for the TBAC-modified GCE exhibited oxidation
Fig. 1 SEM images of the (A) TBAC-700, (B) TBAC-800, and (C) TBAC-900 samples. (D) High-resolution TEM image of TBAC-900.
Fig. 2 (A) XRD pattern of the TBAC-900 sample, and (B) N2 adsorption/desorption isotherms, (C) pore size distribution, and (D) TGA curves ofvarious as-synthesized TBACs.
Table 1 Physical properties of the various as-synthesized samples
Sample
Surface areaa (m2 g�1) Pore volumeb (cm3 g�1)
Dpe (nm)STotal SMicro
c VTotal VMicroc VMeso
d
TBAC-700 640 293 0.69 0.13 0.56 3.3TBAC-800 935 425 0.74 0.19 0.55 3.7TBAC-900 1234 536 0.75 0.23 0.52 4.0
a Brunauer–Emmet–Teller (BET) surface areas. b Total pore volumederived from the N2 uptake at P/P0 = 0.99. c Microporous surface areaand pore volume obtained from t-plot analysis. d Mesoporous volume(VMeso = Vtotal� VMicro). e Pore size determined by the non-linear densityfunctional theory (NL-DFT) calculation.
NJC Paper
Publ
ishe
d on
10
Sept
embe
r 20
15. D
ownl
oade
d by
Aca
dem
ia S
inic
a -
Tai
pei o
n 26
/11/
2015
02:
43:3
5.
View Article Online
9112 | New J. Chem., 2015, 39, 9109--9115 This journal is©The Royal Society of Chemistry and the Centre National de la Recherche Scientifique 2015
and reduction peaks in the presence of VAN. A well-definedoxidation peak (P1) appeared during the first segment and areduction peak (P2) was obtained during the second segment,whereas another oxidation peak (P3) occurred during the thirdsegment. Among the three samples examined, the TBAC-900modified GCE showed the best electrocatalytic activity for VAN,which revealed P1, P2, and P3 peaks at +0.51, +0.26, and +0.31 V,respectively. Furthermore, this may be ascribed to the more abun-dant micro- and meso-pores in the as-synthesized TBAC, whichhelps to absorb VAN more easily on the surface of the electrode. It isnoteworthy that the intensity of the oxidation peak, P1, tends todecrease slightly with the increasing cycle segment. Moreover, theintensities of the other two peaks (P2 and P3) increase slightly andthen remain stable afterwards. Thus, it is indicative that peakP1 is irreversible and considerably more sensitive compared tothe quasi-reversible redox couple peaks P2 and P3.44 Moreover, theproduct of VAN appears to be irreversible.
3.3. Effect of scan rate and VAN concentration
The effect of scan rate on the catalytic oxidation of VAN wasstudied by obtaining CV curves over the TBAC-900 modifiedGCE with varied scan rates, as shown in Fig. 3B. Note that anincrease in oxidation peak current with increasing scan rate wasobserved together with a slight positive shift in peak potential.Moreover, a linear correlation between the oxidation peak currentand the square root of the scan rate may be inferred by the linear
regression equation: y = 0.5149x � 0.2295 with a coefficient ofdetermination (R2) of 0.9985 (see inset of Fig. 3B). This indicatesthat the oxidation of VAN is a diffusion controlled process over thesurface of the electrode. Accordingly, a reaction mechanism maybe proposed, as illustrated in Scheme 2.
Fig. 4A shows variations in the CV curves with increasingconcentration of added VAN (49–950 mM) over the TBAC-900modified GCE. A linear correlation between the oxidation peakcurrents and VAN concentration was also observed (inset of Fig. 4A).
3.4. Effect of electrolyte pH
The effect of pH of the electrolyte on electrocatalytic activityduring the oxidation of VAN was also investigated using CVmeasurements over the TBAC-900 modified GCE by varying the
Fig. 3 (A) CV curves of (a) bare electrode, and (b) TBAC-700, (c) TBAC-800, (e) TBAC-900 modified GCE in the presence of 0.1 M PBS (pH 7.0)electrolyte with 240 mM VAN obtained at a scan rate of 50 mV s�1. Curve(d) shows the result of a blank measurement. (B) CV profiles obtained atdifferent scan rates (50–500 mV s�1). Inset: Variations of peak oxidationcurrent vs. square root of scan rate.
Scheme 2 The proposed reaction mechanism for the electrocatalyticreaction of VAN over the TBAC-modified GCE.
Fig. 4 CV curves of the TBAC-900 modified GCE with (A) varied con-centrations of VAN (from 49 to 950 mM) in 0.1 M PBS (pH 7.0) solutionobtained at a scan rate of 50 mV s�1 (inset: plot of peak oxidation currentvs. VAN concentration), and (B) electrolyte pH (from 4.0 to 9.0). Inset:Curve (i) plot of peak potential (Ep) vs. pH; curve (ii) plot of peak oxidationcurrent vs. pH.
Paper NJC
Publ
ishe
d on
10
Sept
embe
r 20
15. D
ownl
oade
d by
Aca
dem
ia S
inic
a -
Tai
pei o
n 26
/11/
2015
02:
43:3
5.
View Article Online

This journal is©The Royal Society of Chemistry and the Centre National de la Recherche Scientifique 2015 New J. Chem., 2015, 39, 9109--9115 | 9113
pH of the PPS solution from 4.0 to 9.0 in the presence of 240 mMVAN. The results are depicted in Fig. 4B, which revealed anoptimized pH of ca. 7.0 (curve (ii); inset), therefore indicating thatthe reaction process was invoked by proton (H+) mobility in theelectrolyte solution. Moreover, notable shifting of the oxidationpeak towards a more negative potential was also found. As shownin Fig. 4B, a linear dependence between the peak potential (Ep) andelectrolyte pH was observed (curve (ii); inset) and may be fittedas: Ep (V) = �0.0616 (pH) + 0.9647 (R2 = 0.9912). It is noted thata relative shift of 61.6 mV per pH unit, which is slightly higherthan the theoretical value (57.6 mV pH�1) may be inferred.45
Accordingly, it is conclusive that the electron-transfer processduring the oxidation of VAN invoked an equal number of protons.
3.5. Accumulation studies
The influence of accumulation time and potential on the electro-oxidation of VAN were also examined and the results are shown inFig. 5. This was also tested by obtaining CV curves over the TBAC-900 modified GCE under standard conditions (electrolyte: 0.1 MPBS, pH 7.0; VAN concentration 240 mM; scan rate of 50 mV s�1). Byvarying the accumulation time, with a null accumulated potential of0.0 V (Fig. 5A), a notable increase in the peak oxidation current wasobserved, which reached a maximum at 72 s, then declinedgradually with a prolonged accumulation time (Fig. 5C). Likewise,CV profiles were also obtained with varied accumulation potentialsfrom �0.1 to +0.3 V (Fig. 5B), in which a maximum peak oxidationcurrent was observed at an accumulated peak potential of 0.0 V(Fig. 5D). Thus, for experiments conducted hereafter, an accumula-tion potential of 0.0 V and an accumulation time of 72 s were used.
3.6. LSV studies
To further assess the sensitivity of the VAN sensor reported herein,LSV profiles were obtained under optimized experimental con-ditions (electrolyte pH 7.0, accumulated time 72 s and
accumulated potential 0.0 V) with varied VAN concentrations.The results in Fig. 6 clearly show that the peak oxidation currentincreases linearly with increasing concentration of VAN, asverified by the calibration plot (inset of Fig. 6). It is noted thata linear regression equation may be fitted over a wide range ofVAN concentrations (5–1150 mM): I (mA) = 0.0253 (mM) + 3.4311(R2 = 0.9878). Accordingly, a sensitivity and a detection limit of0.32 mA mM�1 cm�2 and 0.684 mM, respectively, may be derivedfor the VAN sensor, whose performance surpassed most GCEsreported in the literature (Table 2).
3.7. Reproducibility, selectivity, and stability
The reproducibility, selectivity, and stability of the VAN sensor, whichrepresent key parameters for practical applications, were also exam-ined by the TBAC-900 modified GCE. To afford an assessment ofreproducibility, three independent TBAC-900 modified electrodeswere tested in the presence of 240 mM VAN, under the standardconditions as abovementioned. The measurements resulted in arelative standard deviation (RSD) of 2.5%, which reveals goodreproducibility. For selectivity studies, various potential interferences,such as NO3�, K+, Mg2+, Fe3+, Co2+, Ni2+, glucose, sucrose, andfructose, were added with an excessive relative concentration of 1000fold to VAN. As a result, no observable change in the peak current ofVAN was observed. In the co-presence of a 50 fold excessiveconcentration of ascorbic acid (AA), dopamine (DA), and uric acid(UA) with 240 mM VAN containing PBS solution, only slight change inthe observed peak oxidation current was found. Herein, these resultsreveal the promising selectivity of the VAN sensor reported. Forstability testing, a tested electrode was intentionally stored at roomtemperature for 25 days, and more than 90% of its original peakoxidation current was retained, which suggests that the TBAC-modified electrode is suitable for practical catalytic applications.
3.8. Real sample analysis
The proposed VAN sensor was further tested using real foodsamples, such as a chocolate and a biscuit sample, purchased
Fig. 5 Optimization of sensors: CV curves of the TBAC-900 modifiedGCE in 0.1 M PBS (pH 7.0) solution obtained with 240 mM VAN, obtained ata scan rate of 50 mV s�1 with varied (A) accumulation times and (B)accumulated potentials and their corresponding variation with oxidationpeak current are shown in (C) and (D), respectively (see text).
Fig. 6 LSV curves of the TBAC-900 modified GCE with varied concen-trations of VAN from 5 to 1150 mM in 0.1 M PBS (pH 7.0) solution, obtainedat a scan rate of 50 mV s�1. Inset: Plot of anodic oxidation peak current (Ipa)vs. VAN concentration (mM).
NJC Paper
Publ
ishe
d on
10
Sept
embe
r 20
15. D
ownl
oade
d by
Aca
dem
ia S
inic
a -
Tai
pei o
n 26
/11/
2015
02:
43:3
5.
View Article Online

9114 | New J. Chem., 2015, 39, 9109--9115 This journal is©The Royal Society of Chemistry and the Centre National de la Recherche Scientifique 2015
from a local mart in Taipei, Taiwan. The chocolate and biscuitsamples were pretreated first by thorough grounding in an agatemortar, which led to samples in the form of a fine powder. Then,typically ca. 1.0 g of the powder sample was dispersed in 5%ethanol and 95% buffer solution (pH = 7), followed by sonicationtreatment for 1 h and then filtration.
For the test studies, pre-treated food sample was addedconsecutively to 10 mL PBS solution, as shown in Fig. 7(A)and (B) for the chocolate and biscuit sample, respectively. TheLSV results in Fig. 7 clearly demonstrate that the TBAC-900modified electrode is indeed highly suitable for real foodsample analysis.
4. Conclusions
We have demonstrated that Cajeput tree bark derived activatedcarbon (TBAC) possesses high surface areas and porosities,which are desirable for the sensitive detection of vanillin (VAN).When applied as VAN sensor, the TBAC-modified electrodeexhibited a low overpotential, wide linear range, suitable detec-tion limit, and excellent sensitivity, reproducibility, selectivity,and stability even in presence of various interferences. Thereported VAN sensor showed improved electrochemical perfor-mances compared to other carbon-based electrodes reported inthe literature and showed prospective applications in real foodsample analysis.
Acknowledgements
Financial supports for this study by the Ministry of Scienceand Technology (MOST), Taiwan (NSC101-2113-M-027-001-MY3to SMC; NSC101-2113-M-001-020-MY3 to SBL) are gratefullyacknowledged.
References
1 G. A. Ferrero, M. Sevilla and A. B. Fuertes, Carbon, 2015, 88,239–251.
2 S. T. Senthilkumar, R. K. Selvan, J. S. Melo and C. Sanjeeviraja,ACS Appl. Mater. Interfaces, 2013, 5, 10541–10550.
3 J. Li and Q. Wu, New J. Chem., 2015, 39, 3859–3864.4 Y. Chen and Y. Liu, J. Mater. Chem. A, 2014, 2, 9193–9199.5 K. Kadirvelu, M. Kavipriya, C. Karthika, M. Radhika,
N. Vennilamani and S. Pattabhi, Bioresour. Technol., 2003,87, 129–132.
6 R. Madhu, K. V. Sankar, S. M. Chen and R. K. Selvan, RSCAdv., 2014, 4, 1225–1233.
7 Z. Hu, M. P. Srinivasan and Y. Ni, Adv. Mater., 2000, 12,62–65.
8 J. Wang and S. Kaskel, J. Mater. Chem., 2012, 22, 23710–23725.9 M. Sevilla and R. Mokaya, Energy Environ. Sci., 2014, 7,
1250–1280.10 R. Madhu, V. Veeramani, S. M. Chen, P. Veerakumar and
S. B. Liu, Chem. – Eur. J., 2015, 21, 8200–8206.
Table 2 Electrochemical performances of the various carbon-based electrode materials as a sensor for the detection of vanillin
Material Linear range (mM) Detection limit (mM) Technique Ref.
Ara–Grb/GCEc 2–70 1 DPVi 34ENGRd–CNTse/GCE 0.01–10 0.02 SWVj 37Gr–PVPf/ABPEg 0.02–2, 2.0–40, and 40–100 0.01 DVk 44AuPd–Gr/GCE 0.1–7 and 10–40 0.02 DPV 46AgNPsh–Gr/GCE 2–100 0.33 SWV 47Fe@Fe3C–C/GCE 0.01–50 0.0026 DPV 48MnO2–Gr/GCE 0.03–8 0.0015 DPV 49Gr/GCE 0.6–48 0.05 DPV 50GCE 50–300 0.16 SWV 51TBAC-900/GCE 5–1150 0.68 LSV This work
a Arginine. b Graphene. c Glassy carbon electrode. d Nitrogen-doped graphene. e Carbon nanotubes. f Polyvinylpyrrolidone. g Acetylene blackpaste electrode. h Nanoparticles. i Differential pulse voltammetry. j Square wave voltammetry. k Derivative voltammetry.
Fig. 7 LSV curves of the TBAC-900 modified GCE in (A) chocolate and(B) biscuit samples. The food samples containing VAN was added con-secutively to 0.1 M PBS (pH 7.0) buffer solution. All LSV curves wereobtained at a scan rate of 50 mV s�1.
Paper NJC
Publ
ishe
d on
10
Sept
embe
r 20
15. D
ownl
oade
d by
Aca
dem
ia S
inic
a -
Tai
pei o
n 26
/11/
2015
02:
43:3
5.
View Article Online

This journal is©The Royal Society of Chemistry and the Centre National de la Recherche Scientifique 2015 New J. Chem., 2015, 39, 9109--9115 | 9115
11 X. Liu, Y. Zhou, W. Zhou, L. Li, S. Huang and S. Chen,Nanoscale, 2015, 7, 6136–6142.
12 R. Madhu, V. Veeramani, S. M. Chen, J. Palanisamy andA. T. E. Vilian, RSC Adv., 2014, 4, 63917–63921.
13 Z. Li, W. Lv, C. Zhang, B. Li, F. Kang and Q. H. Yang, Carbon,2015, 92, 11–14.
14 N. Ahmed, S. P. Santoso, P. L. Tran-Nguyen, L. H. Huynh,S. Ismadji and Y. H. Ju, Bioresour. Technol., 2013, 139, 410–414.
15 K. A. Hammer, C. F. Carson, T. V. Riley and J. B. Nielsen,Food Chem. Toxicol., 2006, 44, 616–625.
16 R. C. Padalia, R. S. Verma, A. Chauhan and C. S. Chanotiya,Ind. Crops Prod., 2015, 69, 224–227.
17 I. N. Ahmed, P. L. T. Nguyen, L. H. Huynh, S. Ismadji andY. H. Ju, Bioresour. Technol., 2013, 136, 213–221.
18 E. Anklam, S. Gaglione and A. Muller, Food Chem., 1997, 60,43–51.
19 N. J. Walton, M. J. Mayer and A. Narbad, Phytochemistry,2003, 63, 505–515.
20 L. Shang, F. Zhao and B. Zeng, Food Chem., 2014, 151, 53–57.21 H. van Assendelft, Br. Med. J., 1987, 294, 576–577.22 M. Saint-Denis, M. W. Coughtrie, J. C. Guilland, B. Verges,
M. Lemesle and M. Giroud, Presse Med., 1996, 25, 2043.23 Y. Ni, G. Zhang and S. Kokot, Food Chem., 2005, 89, 465–473.24 J. Xu, H. Xu, Y. Liu, H. He and G. Li, Psychiatry Res., 2015,
225, 509–514.25 T. Sostaric, M. C. Boyce and E. E. Spickett, J. Agric. Food
Chem., 2000, 48, 5802–5807.26 G. Lamprect, F. Pichlmayer and E. R. Schmid, J. Agric. Food
Chem., 1994, 42, 1722–1727.27 M. C. Boyce, P. R. Haddad and T. Sostaric, Anal. Chim. Acta,
2003, 485, 179–186.28 Y. Ni, G. Zhang and S. Kokot, Food Chem., 2005, 89, 465–473.29 H. Peng, S. Wang, Z. Zhang, H. Xiong, J. Li, L. Chen and
Y. Li, J. Agric. Food Chem., 2012, 60, 1921–1928.30 M. A. Xinying, Int. J. Electrochem. Sci., 2014, 9, 3181–3189.31 G. M. Duran, A. M. Contento and A. Rıos, Talanta, 2015, 131,
286–291.32 F. Bettazzi, I. Palchetti, S. Sisalli and M. Mascini, Anal. Chim.
Acta, 2006, 555, 134–138.
33 D. Zheng, C. Hua, T. Gan, X. Dang and S. Hu, Sens.Actuators, B, 2010, 148, 247–252.
34 Y. Zhao, Y. Du, D. Lu, L. Wang, D. Ma, T. Ju and M. Wu,Anal. Methods, 2014, 6, 1753–1758.
35 J. Y. Peng, C. T. Hou and X. Y. Hu, Int. J. Electrochem. Sci.,2012, 7, 1722–1733.
36 L. Huang, K. Houb, X. Jia, H. Pan and M. Du, Mater. Sci.Eng., C, 2014, 38, 39–45.
37 S. Luo and Y. Liu, Int. J. Electrochem. Sci., 2012, 7,6396–6405.
38 L. Jiang, Y. Ding, F. Jiang, L. Li and F. Mo, Anal. Chim. Acta,2014, 833, 22–28.
39 T. R. Silva, D. Brondani, E. Zapp and I. C. Vieira, Electro-analysis, 2015, 27, 465–472.
40 J. Sun, T. Gan, K. Wang, Z. Shi, J. Li and L. Wang, Anal.Methods, 2014, 6, 5639–5646.
41 L. Qie, W. Chen, H. Xu, X. Xiong, Y. Jiang, F. Zou, X. Hu,Y. Xin, Z. Zhang and Y. Huang, Energy Environ. Sci., 2013, 6,2497–2504.
42 Z. Hu, M. P. Srinivasan and Y. Ni, Adv. Mater., 2000, 12,62–65.
43 G. Xu, J. Han, B. Ding, P. Nie, J. Pan, H. Dou, H. Li andX. Zhang, Green Chem., 2015, 17, 1668–1674.
44 P. Deng, Z. Xu, R. Zeng and C. Ding, Food Chem., 2015, 180,156–163.
45 J. Bard and L. R. Faulkner, Electrochemical methods: Funda-mentals applications, Wiley, New York, 2nd edn, 2001.
46 L. Shang, F. Zhao and B. Zeng, Food Chem., 2014, 151,53–57.
47 L. Huang, K. Hou, X. Jia, H. Pan and M. Du, Mater. Sci. Eng.,C, 2014, 38, 39–45.
48 J. Sun, T. Gan, K. Wang, Z. Shi, J. Li and L. Wang,Anal. Methods, 2014, 6, 5639–5646.
49 T. Gan, Z. Shi, Y. Deng, J. Sun and H. Wang, Electrochim.Acta, 2014, 147, 157–166.
50 J. Peng, C. Hou and X. Hu, Int. J. Electrochem. Sci., 2012, 7,1724–1733.
51 J. L. Hardcastle, C. J. Paterson and R. G. Compton,Electroanalysis, 2001, 13, 899–905.
NJC Paper
Publ
ishe
d on
10
Sept
embe
r 20
15. D
ownl
oade
d by
Aca
dem
ia S
inic
a -
Tai
pei o
n 26
/11/
2015
02:
43:3
5.
View Article Online