ca224, a non-planar analog of fascaplysin inhibits cdk4 and tubulin polymerization: evaluation of in...
TRANSCRIPT

This document is confidential and is proprietary to the American Chemical Society and its authors. Do not copy or disclose without written permission. If you have received this item in error, notify the sender and delete all copies.
CA224, a non-planar analog of fascaplysin inhibits Cdk4 and
tubulin polymerization: Evaluation of in vitro and in vivo anticancer activity
Journal: Journal of Medicinal Chemistry
Manuscript ID: jm-2014-01407a
Manuscript Type: Article
Date Submitted by the Author: 13-Sep-2014
Complete List of Authors: Mahale, Sachin; De Montfort University, School of Pharmacy Manda, Sudhakar; Indian Institute of Integrative Medicine (CSIR), Medicinal Chemistry Division joshi, prashant; IIIM, Bharate, Sonali; Indian Institute of Integrative Medicine (CSIR), Preformulation Laboratory Jenkins, Paul; University of Leicester, Department of Chemistry Vishwakarma, Ram; Indian Institute of Integrative Medicine, Medicinal Chemistry Division Bharate, Sandip; Indian Institute of Integrative Medicine, Medicinal
Chemistry Chaudhuri, Bhabatosh; De Montfort University, School of Pharmacy
ACS Paragon Plus Environment
Journal of Medicinal Chemistry

1
CA224, a non-planar analog of fascaplysin inhibits
Cdk4 and tubulin polymerization: Evaluation of in
vitro and in vivo anticancer activity
Sachin Mahale, ‡, Sudhakar Manda,† Prashant Joshi,† Sonali S. Bharate,⊥ Paul R. Jenkins,∞ Ram A.
Vishwakarma,‡ Sandip B. Bharate,*, † Bhabatosh Chaudhuri*,‡
‡School of Pharmacy, De Montfort University, Leicester, LE1 9BH, UK
†Medicinal Chemistry Division, Indian Institute of Integrative Medicine (CSIR), Canal Road, Jammu-
180001, India
⊥Preformulation Laboratory, Indian Institute of Integrative Medicine (CSIR), Canal Road, Jammu-
180001, India
∞Department of Chemistry, University of Leicester, Leicester, LE1 7RH, UK
Page 1 of 43
ACS Paragon Plus Environment
Journal of Medicinal Chemistry
123456789101112131415161718192021222324252627282930313233343536373839404142434445464748495051525354555657585960

2
ABSTRACT
CA224 is a non-planar analog of fascaplysin that specifically inhibits Cdk4-cyclin D1 enzyme in-vitro.
It was found that CA224 blocks growth of cancer cells at G0/G1 phase of the cell division cycle. It also
blocks at G2/M phase which is explained by the fact that CA224 inhibits tubulin polymerization which
is essential for mitotic spindle assembly and chromosomal movements. Besides, it acts as an enhancer
of depolymerization for taxol-stabilized tubulin. CA224’s ability to inhibit Cdk4-cyclin D1 and thereby
block growth at the G0/G1 phase of cell-cycle proved crucial in the Calu-1 cell line which has an
impaired mitotic spindle checkpoint. Western blot analyses of p53-positive cancer cells treated with
CA224 indicated up-regulation of the p53, p21 and p27 proteins together with down-regulation of cyclin
B1 and Cdk1. CA224 selectively induces apoptosis in SV40 large T-antigen transformed cells and
significantly reduces colony formation efficiency, in a dose-dependent manner of lung cancer cells,
A549 (p53-positive) and Calu-1 (p53-null). CA224 is efficacious at 1/10th the MTD (1000 mg/kg),
against human tumors derived from HCT-116 and NCI-H460 cells in SCID mice models. These
findings may have significant implications in designing more potent molecules that simultaneously
target Cdk4-cyclin D1 inhibition and tubulin polymerization, for identification of potential candidates
for clinical development.
KEYWORDS
Cdk4-cyclin D1, tubulin polymerization, fascaplysin, anti-cancer, chemotherapeutic, cell division cycle
Page 2 of 43
ACS Paragon Plus Environment
Journal of Medicinal Chemistry
123456789101112131415161718192021222324252627282930313233343536373839404142434445464748495051525354555657585960

3
INTRODUCTION
The mammalian cell division is a highly controlled process and the loss of this control results in
development of cancer phenotype. Mammalian cells undergo various stages of the cell cycle (G0, G1, S,
G2, M-phase), and the transition of cells from one phase to another involves various check-point
mechanisms including cyclin-dependent kinases, checkpoint kinases, and their partner cyclins.
Malfunctioning of any of these checkpoint mechanisms leads to uncontrolled cell division and
proliferation.1-5 Cyclin-dependent kinase 4 and its cyclin partner D1 (check-point mechanism) controls
transition of the cells from G1 to S phase of the cell cycle.6-9 Active Cdk4/cyclin D complexes inactivate
retinoblastoma protein (pRb) by phosphorylating specifically at Ser780 and Ser795 residues, which
allows the G1/S transition of cells during the cell cycle.6, 10 Hyperphosphorylation of pRb leads to loss of
control over gene transcription through the E2F family of transcription factors, which ultimately turns
into uncontrolled cell division. In contrast, pRb phosphorylation by Cdk2 or Cdk3 along with their
cyclin partners A or C is not sufficient to inactivate pRb functions.11-13 A large number of human tumors
(around 96%) lose normal cell cycle transition check-point mechanism due to variety of genetic and
biochemical adaptations including the hyperactivity of the Cdk4 protein, down-regulation of Cdk4
positive regulator p16INK4A and mutations in pRb. The vital role of Cdk4-cyclin D1 in tumor
development has been confirmed by experiments in Cdk4 and cyclin D1 knock-out mice which have
been shown to be resistant to tumor development. On the other hand, antisense nucleotides based
targeting of cyclin D decreases tumor size and growth in-vivo. Based on these experimental
observations, Cdk4/cyclin D complex protein is considered as a promising target for combating
cancer.14-16
Inhibition of Cdk4-cyclin D1 with small molecules has been an area of major interest in the field of
anticancer drug discovery since last two decades. There have been numerous scientific reports
highlighting the role of Cdk4-cyclin D1 inhibitors in cancer treatment.17-21 Pfizer's palbociclib, a
selective inhibitor of Cdk4 and Cdk6 has received FDA approval for treatment of patients with breast
Page 3 of 43
ACS Paragon Plus Environment
Journal of Medicinal Chemistry
123456789101112131415161718192021222324252627282930313233343536373839404142434445464748495051525354555657585960

4
cancer.22 Other Cdk4/Cdk6 dual inhibitors LY2835219 and P1446A-05 are in phase I clinical studies for
breast and advanced refractory malignancies, respectively (Source: http://clinicaltrials.gov). Most of the
research has been focused on finding ATP-competitive inhibitors of Cdk4-cyclin D1 using methods of
structure-based chemical design.23
The main objective of our studies was to develop potent and specific small molecule inhibitors of
Cdk4-cyclin D1 based on the structure of fascaplysin which is a pentacyclic quaternary salt originally
isolated from the Fijian sponge Fascaplysinopsis Bergquist sp.24 It is known to possess antimicrobial
and antimalarial activity.24, 25 It also displays potent cytotoxicity against small cell lung cancer cells and
induces cell cycle arrest in G0/G1 at lower and S-phase at higher concentrations, respectively.26
Fascaplysin also showed anti-tumor effects in sarcoma mice model through apoptotic and anti-
angiogenesis pathways.27 We have reported fascaplysin as one of the specific inhibitors of Cdk4-cyclin
D1.9, 28 It inhibits Cdk4-cyclin D1 in-vitro and blocks the growth of normal and cancer cells at the
G0/G1 phase of the cell cycle, which correlates with the accumulation of hypo-phosphorylated pRb,
implying there is no phosphorylation at Cdk4-specific serine residues.9 Fascaplysin has also been
reported to inhibit Cdc25B with an IC50 of 1 µg/ml.29, 30 An analogue of fascaplysin 1-
deoxysecofascaplysin A, has been reported to inhibit cell growth of breast cancer MCF-7 and ovarian
cancer OVCAR-3 cell lines in-vitro.31
Nonetheless, it is unlikely that fascaplysin will ever be used therapeutically as an anticancer agent
because it is highly toxic. The potential for its planar structure to intercalate with double-stranded DNA
has been suggested as a possible explanation for its unusual biological activity and toxicity. The DNA
binding property of fascaplysin is similar to structurally related DNA intercalating agents like
cryptolepine and ellipticine.32 We have explored the possibility of separating the DNA intercalating
ability of fascaplysin from its potent Cdk4-specific inhibitory activity. The aim of the current study was
therefore to devise non-planar (non-toxic) Cdk4-cyclin D1 inhibitors based on the structure of
fascaplysin.33-36
Page 4 of 43
ACS Paragon Plus Environment
Journal of Medicinal Chemistry
123456789101112131415161718192021222324252627282930313233343536373839404142434445464748495051525354555657585960

5
CA224 was initially identified as a Cdk4 specific inhibitor lacking the ability to intercalate DNA.37
As expected, CA224 manifested its Cdk4-specific inhibitory ability by blocking cancer cells at the
G0/G1 phase of the cell cycle. Surprisingly however, CA224 also inhibited the G2/M phase in a Cdk-
independent manner. Further investigations showed that the CA224 inhibited the growth of a panel of
ten cancer cell lines (some of them potentially resistant to cancer chemotherapy) at a low micromolar
range. The validity of these results was corroborated by the observation that CA224 has the ability to
diminish the colony formation efficiency of cancer cells. The Cdk-independent G2/M block was found
to be associated with its anti-tubulin activity. CA224 inhibited the polymerization of tubulin in-vitro and
also showed an enhancing effect on tubulin depolymerization in live cells. It was found in microarray
studies that genes, related to apoptosis and stress, were up-regulated more profoundly in p53-negative
(p53-) cells than in cells that were p53-positive (p53+). The apoptotic inhibitory proteins were found to
be down-regulated in both p53+ and p53- cells. In human xenograft models CA224 was found to inhibit
the growth of HCT-116 and H-460 tumor growth at 1/10th of the MTD, 100 mg/kg. Here, we present the
biological activity including efficacy in xenograft models of CA224 in detail.
RESULTS AND DISCUSSION
Chemistry. Our efforts towards discovery of non-toxic analogs of fascaplysin led to the
identification of CA224, a non-planar analog of fascaplysin. Briefly, the synthesis of CA224 involves
three steps starting from commercially available tryptamine (1). The detailed lead optimization and SAR
have been described in previous publications.33-37 The synthetic scheme for CA224 is shown in Scheme
1. It was interesting to note that the non-planar analogs with opened C and D rings of fascaplysin, lost
its DNA intercalation activity. Among C/D-ring opened analogs, compounds with p-substituted D-rings
(e.g. CA223, CA224, CA225, structure shown in Table 1) maintained their ability to inhibit Cdk4 in a
selective manner.
Page 5 of 43
ACS Paragon Plus Environment
Journal of Medicinal Chemistry
123456789101112131415161718192021222324252627282930313233343536373839404142434445464748495051525354555657585960

6
NH
NH
NH
N
O
Cl
O
NH
NH
O
O
NH
NH2
1 2 3
4
a b
c
CA224 (5)
+
Scheme 1. Reagents and conditions. (a) Ethyl chloroformate, NaOH 4 N, CH2Cl2, 3 h, 90%; (b) LiAlH4,
THF, N2, reflux, 1 h, 85%; (c) NaOH 4 N, CH2Cl2, 3 h, 45%.
Selective inhibition of Cdk4-cyclin D1. A series of new compounds based on the structure of
fascaplysin were identified as specific inhibitors of enzyme Cdk4–cyclin D1 (Table 1). CA224 was
found to be the most potent inhibitor of Cdk4-cyclin D1 (IC50 = 6 µM) and selective when the Cdk4
IC50 was compared with the IC50s obtained in Cdk2-cyclin A, Cdk1-cyclin B1 and Cdk9-cyclin T1
assays. Unlike fascaplysin, CA224 does not intercalate with DNA 37. CA224 was also tested against 58
represenative kinases at Millipore Bioscience Division, UK. It was found that CA224 was inactive at the
concentration of 10 µM against all kinases including Cdk5-p35, Cdk6-cyclin D1, Cdk7-cyclin H,
EGFR, GSK3β, MAPK1, MEK1, PDGFR, Plk3, PKA, PKCα, IGF-1R etc. These results support
CA224’s selective ability to inhibit Cdk4-cyclin D1 enzyme in-vitro while having much reduced or no
affinity for other kinases tested.
Page 6 of 43
ACS Paragon Plus Environment
Journal of Medicinal Chemistry
123456789101112131415161718192021222324252627282930313233343536373839404142434445464748495051525354555657585960

7
Table 1. Activity of fascaplysin and its non-planar analogs in in-vitro kinase and DNA binding assays a
Cell lines Cl
NH
N
O
A B
CD
E
Fascaplysin
NH
N
O
Cl
CA223
NH
N
O
EA B
CA224
NH
N
O
CA225
Cdk4/cyclin
D1
0.41 ± 0.04 38 ± 6 6.2 ± 0.9 49 ± 6.5
Cdk2/cyclin A >250 731 ± 26 521 ± 11 658 ± 23
Cdk2/cyclin E >250 ND ND ND
Cdk1/cyclin
B1
>250 >500 >500 >500
Cdk9/cyclin
T1
>250 >1000 >1000 >1000
EtBr
displacement
5 ± 0.4 Does not dispalce Does not dispalce Does not dispalce
aIC50 values are presented in µM. All the fascaplyin analogs were dissolved in 100% DMSO and were further diluted in the kinase assay buffer or the ethidium bromide displacement assay buffer.
In order to understand the observed selectivity towards Cdk4-cyclin D1 versus Cdk2-cyclin A,
molecular modeling studies were carried out. The ATP binding sites of these Cdks are well conserved
and share 45% sequence homology to each other, however CA224 displayed varying degree of affinity
to these Cdks. The two Cdks differ from each other by these residue sequences: 94-97(Glu-His-Val-
Asp)Cdk4/81-84(Glu-Phe-Leu-His)Cdk2,101-102(Arg-Thr)Cdk4/88-89(Lys-Lys)Cdk2 and
Glu144Cdk4/Gln131Cdk2. CA224 interacts flexibly to ATP binding pockets of Cdk4/Cdk2 with 84-fold
selectivity towards Cdk4 due to flexible conformational movement of the CA224 amide bond (CA224
interacts with Cdk4 and Cdk2 in two different conformational states), which allows free rotation of
biphenyl ring. This subsequently leads to loss of major hydrophobic interactions with Cdk2. Two
conformations of CA224 include (a) trans-conformation (green colored ligand in Figure 1a; dihedral
Page 7 of 43
ACS Paragon Plus Environment
Journal of Medicinal Chemistry
123456789101112131415161718192021222324252627282930313233343536373839404142434445464748495051525354555657585960

8
angle is Ψ = -151.5) which was found to interact selectively with side chains of Arg101 residue of Cdk4
by hydrophobic π-cation interaction; however in Cdk2, this interaction is missing because
corresponding Lys88 residue side chain orient away from CA224 binding cavity; (b) cis-conformation
(orange colored ligand in Figure 1a; dihedral angle Ψ = 2.6) which interacts with Cdk2. On another
hand, the trans-conformation of CA224 is stabilized in Cdk4 binding site because negatively-charged
Glu144 side chain oppose biphenyl aromatic ring. In case of Cdk2, the cis-conformation is stabilized
because biphenyl aromatic rings are well accommodated by the corresponding neutral Gln131. The
amino acid comparison of Cdk4 and Cdk2 binding site residues are shown in Figure 1b and 1c.
(a) (b)
Protein Amino acid sequence
CDK4 94 95 96 97 101 102 144
Glu His Val Asp Arg Thr Glu
CDK2 81 82 83 84 88 89 131
Glu Phe Leu His Lys Lys Gln
(c)
Figure 1. Molecular modeling studies. (a) Interactions of cis/trans-conformations of CA224 with Cdk2
and Cdk4, respectively (orange conformation is with Cdk2 and green with Cdk4). (b) CA224-Ck4
interaction histogram with different binding site residues during 10 ns MD simulation of CA224-Cdk4
protein complex (c) amino acid comparision between Cdk4 and Cdk2 at ATP binding site (black
colored residues indicates commonly interacting residues of Cdk4/Cdk2, while red colored residues are
Page 8 of 43
ACS Paragon Plus Environment
Journal of Medicinal Chemistry
123456789101112131415161718192021222324252627282930313233343536373839404142434445464748495051525354555657585960

9
those which differ in interaction pattern in these two Cdks).
Cancer cell growth inhibition. All the fascaplysin analogues including the most potent compound
in the series, CA224, were tested in a panel of ten different cancer cell lines (some of them are known to
be relatively resistant to known chemotherapeutic agents) for their ability to inhibit cancer cell growth
in-vitro. The inhibitory effects of compounds were quantified using the MTT assay and IC50s were
determined (i.e. the concentration, expressed in µM, of a compound at which 50% cell growth was
inhibited). The results of these cell proliferation assays indicated that CA224 inhibits the growth of
cancer cells in-vitro at low micromolar concentrations (Table 2). Amongst all the analogues,37 CA224
was found to be the most potent molecule even at cellular level. The inhibition of cell growth was both
p53 and pRb-independent, the latter indicating that Cdk4-cyclin D1 inhibition is not the only cellular
target for the mechanism of action of these molecules.
Table 2. IC50 concentrations expressed in µM for in-vitro cell growth inhibition induced by exposure to
CA224, and its analogues CA225 and CA22337 for 48 h.
Cell lines Fascaplysin CA223 CA224 CA225
LS174T (colorectal carcinoma; p53+, pRb+) 0.88 ± 0.04 42 ± 2.5 3.5 ± 0.9 18 ± 1
PC-3 (prostate; p53 null, pRb+) 0.92 ± 0.06 47 ± 3 6.2 ± 1.1 15 ± 1.5
MiaPaCa (pancreatic; p53His273 mut, pRb+) ND 31± 2.2 4.0 ± 0.3 10.2 ± 0.9
A549 (NSCLC; p53+, pRb+) 0.69 ± 0.03 27 ± 2.5 3.5 ± 0.6 12 ± 1.8
Calu-1 (NSCLC; p53 null, pRb+) 1.3 ± 0.1 78 ± 3.0 11.5 ± 2.5 52 ± 3.5
NCI-H460 (NSCLC; p53+, pRb+) ND 24 ± 1.8 2.0 ± 0.3 9.8 ± 1.0
NCI-H1299 (NSCLC; p53 null, pRb+) ND 21 ± 0.9 2.5 ± 0.3 11.5 ± 1.6
NCI-H358 (NSCLC; p53 null, pRb null) ND 26 ± 2.0 2.2 ± 0.6 14 ± 1.4
Page 9 of 43
ACS Paragon Plus Environment
Journal of Medicinal Chemistry
123456789101112131415161718192021222324252627282930313233343536373839404142434445464748495051525354555657585960
10
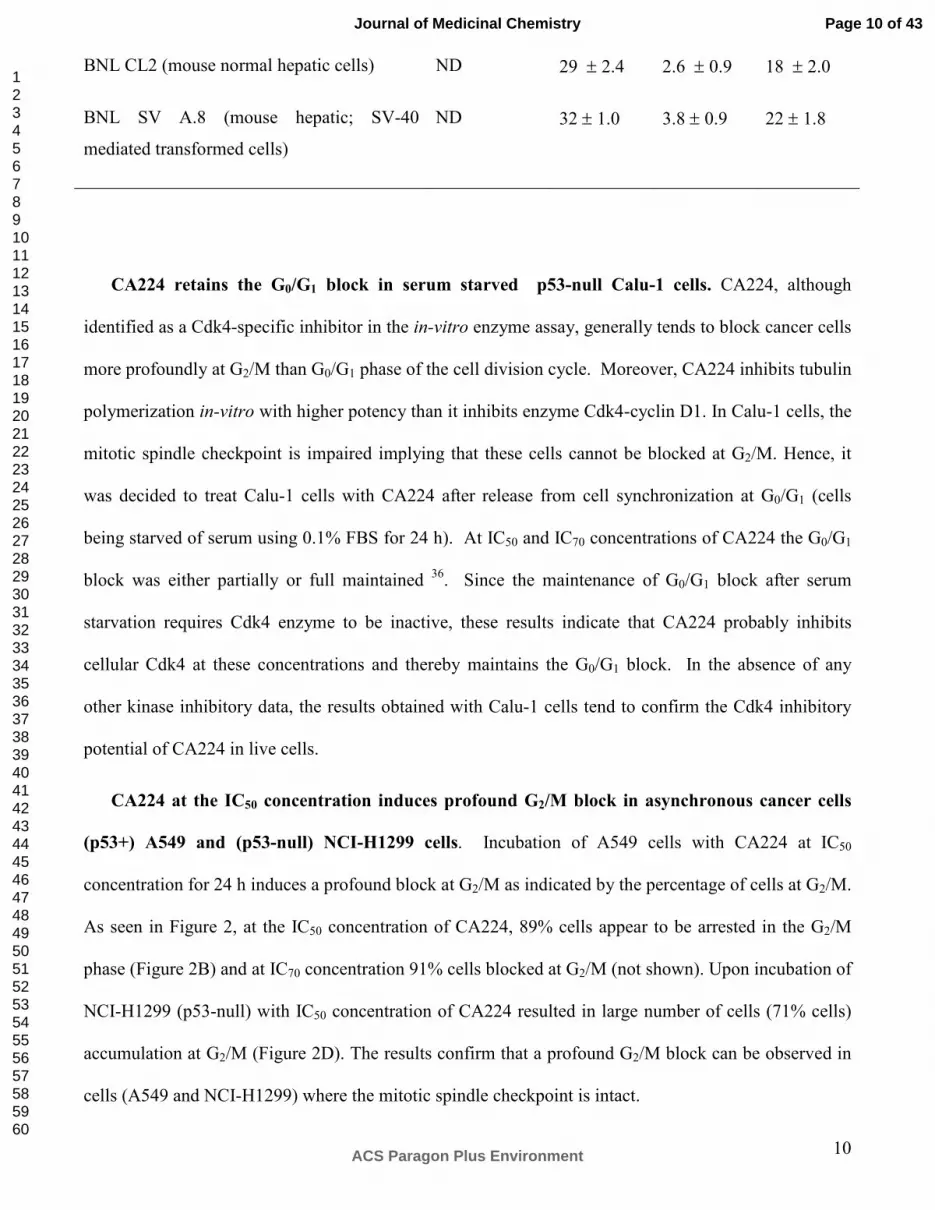
BNL CL2 (mouse normal hepatic cells) ND 29 ± 2.4 2.6 ± 0.9 18 ± 2.0
BNL SV A.8 (mouse hepatic; SV-40
mediated transformed cells)
ND 32 ± 1.0 3.8 ± 0.9 22 ± 1.8
CA224 retains the G0/G1 block in serum starved p53-null Calu-1 cells. CA224, although
identified as a Cdk4-specific inhibitor in the in-vitro enzyme assay, generally tends to block cancer cells
more profoundly at G2/M than G0/G1 phase of the cell division cycle. Moreover, CA224 inhibits tubulin
polymerization in-vitro with higher potency than it inhibits enzyme Cdk4-cyclin D1. In Calu-1 cells, the
mitotic spindle checkpoint is impaired implying that these cells cannot be blocked at G2/M. Hence, it
was decided to treat Calu-1 cells with CA224 after release from cell synchronization at G0/G1 (cells
being starved of serum using 0.1% FBS for 24 h). At IC50 and IC70 concentrations of CA224 the G0/G1
block was either partially or full maintained 36. Since the maintenance of G0/G1 block after serum
starvation requires Cdk4 enzyme to be inactive, these results indicate that CA224 probably inhibits
cellular Cdk4 at these concentrations and thereby maintains the G0/G1 block. In the absence of any
other kinase inhibitory data, the results obtained with Calu-1 cells tend to confirm the Cdk4 inhibitory
potential of CA224 in live cells.
CA224 at the IC50 concentration induces profound G2/M block in asynchronous cancer cells
(p53+) A549 and (p53-null) NCI-H1299 cells. Incubation of A549 cells with CA224 at IC50
concentration for 24 h induces a profound block at G2/M as indicated by the percentage of cells at G2/M.
As seen in Figure 2, at the IC50 concentration of CA224, 89% cells appear to be arrested in the G2/M
phase (Figure 2B) and at IC70 concentration 91% cells blocked at G2/M (not shown). Upon incubation of
NCI-H1299 (p53-null) with IC50 concentration of CA224 resulted in large number of cells (71% cells)
accumulation at G2/M (Figure 2D). The results confirm that a profound G2/M block can be observed in
cells (A549 and NCI-H1299) where the mitotic spindle checkpoint is intact.
Page 10 of 43
ACS Paragon Plus Environment
Journal of Medicinal Chemistry
123456789101112131415161718192021222324252627282930313233343536373839404142434445464748495051525354555657585960

11
Nocodazole and paclitaxel induced G2/M block is maintained by CA224 in NCI-H358 lung
cancer cells. NCI-H358 (p53-null) cells were treated with nocodazole (1 µM, a sub-optimal
concentration) only for 18 h in order to induce a partial block at G2/M so that treated cells are minimally
stressed. The blocked cells were released in fresh medium when cells readily entered the cell cycle
without any apoptosis. When blocked cells were released in the presence of CA224 for 12 h, cells not
only maintained the G2/M block but also >50% of G0/G1 and S phase cells entered G2/M (compare
Figure 2E-H). Although only representative histograms of nocodazole treatment are shown, similar
results were obtained when paclitaxel blocked cells were released in the presence of CA224 for 12 h.
These observations suggest that, at least, in p53-null/pRb-null NCI-H358 cells, CA224 maintains the
pro-metaphase block induced by nocadozole or paclitaxel during mitosis.
CA224 blocks NCI-H358 cells in G2/M after release from hydroxyurea-mediated G1/S cell
synchronization. Hydroxyurea (250 µM, 18 h) was used to block cells at G1/S (77%; Figure 2J), at a
stage of the cell cycle where Cdk2-specific inhibitors normally act. When released in the presence of
CA224, cells proceed from G1/S, confirming that CA224 does not inhibit cellular Cdk2. Cells
ultimately accumulate at G2/M (72%; Figure 2L). These results again indicate that CA224 have an
inherent tendency to induce block at G2/M phase of the cell cycle at least in cells where mitoic spindle
checkpoint is normal.
Selective killing of SV40 large T-antigen transformed normal mouse embryonic liver cells by
CA224. SV40 large T-antigen inactivates both the tumor suppressor proteins, p53 and pRb, and thereby
transforms normal cells into tumorigenic cells. We used normal mouse embryonic hepatic (liver) cells
BNL CL2 and its SV-40 large T-antigen transformed counterpart BNL SV A.8 to study the effects of
CA224. The normal cells, upon 48 h incubation with CA224, exhibited prominent G2/M arrest at both
IC50 and IC70 concentrations with less than 5% cells detected in the sub-G0/G1 phase (Figure 2N) and
more than 50% cells appearing at G2/M phase of the cell cycle. Interestingly, in the SV40 large T-
antigen transformed cell line significant apoptotic cell death was observed. After 48 h treatment at the
Page 11 of 43
ACS Paragon Plus Environment
Journal of Medicinal Chemistry
123456789101112131415161718192021222324252627282930313233343536373839404142434445464748495051525354555657585960

12
IC50 concentration of CA224, 31% cells were detected in sub-G1 phase (Figure 2P) indicating apoptosis.
The percent apoptosis increased further from 31 to 44% at the IC70 concentration after 48 h incubation
(data not shown). Similar results were obtained using normal and SV-40 large T-antigen transformed
human lung fibroblast cells, WI-38 (data not shown).
BControl CA224, IC50, 24 h
G0/G1 = 49% G0/G1 = 3%
S = 29% S = 4%
G2/M = 89%G2/M = 22%
A549 NCI-H1299Control CA224, IC50, 24 hG0/G1 = 56% G0/G1 = 22%
S = 21% S = 10%
G2/M = 18% G2/M = 71%
A C D
PMT4 dna Lin PMT4 dnaLin PMT4 dnaLin PMT4 dnaLin
Control Hydroxyurea, 250 µM, 18 hHydroxyurea, 250 µM, 18 h Released in fresh medium, 18 h
Hydroxyurea, 250 µM, 18 h Released in CA224, IC50, 18 h
I J K LG0/G1=59% G0/G1=77% G0/G1=50% G0/G1=16%
S=21% S=16% S=12% S=10%
G2/M=18% G2/M=6% G2/M=33% G2/M=72%
E F G H
Control
Nocodazole, 18 h;
Released in medium, 12 hNocodazole, 18 h
Nocodazole, 18 h;
Released in CA224, IC50, 12 h
G0/G1=59% G0/G1=22% G0/G1=40% G0/G1=7%
S=21% S=24% S=10% S=10%
G2/M=18% G2/M=48% G2/M=42% G2/M=74%
NCI-H358
PMT4 dna Lin PMT4 dnaLin PMT4 dna Lin PMT4 dnaLin
PMT4 dna Lin PMT4 dnaLin PMT4 dna Lin PMT4 dnaLin
Page 12 of 43
ACS Paragon Plus Environment
Journal of Medicinal Chemistry
123456789101112131415161718192021222324252627282930313233343536373839404142434445464748495051525354555657585960

13
Control ControlCA224, IC50, 48 h CA224, IC50, 48 h
G0/G1 = 57% G0/G1 = 34% G0/G1 = 64% G0/G1=31%
S = 15% S=21%S = 23%S = 9%
G2/M = 23% G2/M=14%G2/M=13%G2/M = 54%
BNL CL2 (mouse normal hepatic cell line) BNL SV A. 8 (mouse SV40 transformed hepatic cell line)
Sub G1 = 2%Sub G1 = 0% Sub G1 =31%Sub G1 =0%
Sub G1 Sub G1
Sub G1Sub G1
M N O P
PMT4 dna Lin PMT4 dnaLin PMT4 dnaLin PMT4 dnaLin
Figure 2. (A-D) Response of mitotic spindle checkpoint-proficient human lung cancer cell lines, A549
and NCI-H1299 to CA224. Flow cytometric analysis of asynchronous cells show that majority of cells
are arrested in G2/M phase of cell cycle (4n DNA content) in both the cell lines. A549 untreated (A),
treatment with IC50 concentration of CA224 for 24 h (B), NCI-H1299 untreated or control (C) and
treatment with IC50 concentration of CA224 for 24 h (D). (E-L) Analysis of NCI-H358 cells using flow
cytometer. The G2/M and G1/S synchronized cells by nocodazole and hydroxyurea respectively were
released either in fresh medium or in fresh medium containing IC50 concentration of CA224 compound
exhibit greater tendency of CA224 to block the cell growth at G2/M. For nocodazole block experiment,
figure show untreated or control cells (E), treated with 1 µM nocodazole for 18 h (F), treated with 1 µM
nocodazole for 18 h and released in fresh medium (G) and treated with 1 µM nocodazole for 18 h and
released in the presence of CA224, IC50 (H). For hydroxyurea block experiment, figure show untreated
or control cells (I), treated with 250 µM hydroxyurea for 18 h (J), treated with 250 µM hydroxyurea for
18 h and released in fresh medium (K) and treated with 250 µM hydroxyurea for 18 h and released in
the presence of CA224, IC50 (L). (M-P) Selective apoptosis in SV-40 transformed cells by CA224,
analysed by FACS. BNL CL2 (mouse embryonic normal hepatic cells) when exposed to CA224 for 48
h at IC50 and IC70 concentrations, show prominent G2/M arrest. As seen in the figure untreated cells
(M), treated with IC50 concentration of CA224, 48 h (N). BNL SV A. 8 (mouse embryonic SV-40
transformed hepatic cells) underwent apoptotic cell death upon incubation with CA224. The apoptosis
Page 13 of 43
ACS Paragon Plus Environment
Journal of Medicinal Chemistry
123456789101112131415161718192021222324252627282930313233343536373839404142434445464748495051525354555657585960

14
was quantitated by measuring the % cells appeared in SubG1 peak, 31% and 44% cells were found in
SubG1 peak after 48 h exposure with CA224, IC50 (P) concentration. The untreated cells (O) do not
show any apoptosis.
Effects of CA224 on the cellular level of cyclin B1, Cdk1, p53, p21CIP1/WAF1
(p21) and p27KIP1
(p27); analyses in p53+ cells. Western-blot analyses of p53+ cells, A549 and LS174T, after treatment
with CA224 (at the IC50 concentration) for 24 h demonstrated more than 10-fold induction of p53.
Thereby, probably the global Cdk inhibitorp21CIP1/WAF1 (p21) was also induced. The levels of p27KIP1
(p27) were also elevated after CA224 treatment (Figure 3). The proteins Cdk1 and cyclin B1 were
down-regulated in the treated cells as compared with untreated control cells. Repression of cyclin B1
and Cdk1 and elevated levels of p21 and p27 is a possible explanation of the G2/M block seen in A549
and LS174T cells that bear functional copies of the tumor supressor protein, p53 (Figure 3).
The effects on the cellular level of cyclin B1, Cdk1, p53, p21CIP1/WAF1 (p21) and p27KIP1 (p27);
analyses in p53-negative cells were also investigated. Western-blot analyses on proteins from
MIAPaCa-2 cells (carrying a p53 mutation) showed that p53, p21 and p27 levels remained unchanged
indicating that the p21 and p27 induction seen in p53-positive cells is probably p53 dependent.
Interestingly cyclin B1 and Cdk1 levels were elevated and phosphorylation of Cdk1 at the residue Tyr15
remains unaffected (data not shown) indicating that Cdk1-cyclin B1 is still active in p53 mutated cells,
after CA224 treatment.
Page 14 of 43
ACS Paragon Plus Environment
Journal of Medicinal Chemistry
123456789101112131415161718192021222324252627282930313233343536373839404142434445464748495051525354555657585960

15
LS174T
Control Treated Control Treated
A549
p53
p21
p27
CyclinB1
Cdk1
Actin
Figure 3. Western-blot analysis of p53+ cells, A549 and LS174T. The treatment with CA224, IC50 concentration for 24 h
resulted in induction of tumor suppressor protein p53 and thereby global Cdk inhibitor p21CIP1/WAF1 (p21) was also induced.
The levels of global p27KIP1 (p27) were elevated while cyclin B1 and Cdk1 levels were down regulated.
Cell-free tubulin polymerization assays in-vitro indicate inhibition of tubulin polymerization
by CA224. CA224 inhibited growth of cancer cells in-vitro at relatively low concentrations than it
inhibited the enzyme Cdk4-cyclin D1. FACS analysis and mitotic index experiments (data not shown)
had indicated that CA224 blocked cell growth at the pro-metaphase of the cell cycle. In addition to
these observations, the 2-3 fold increase of CA224 IC50 in cells with impaired mitotic spindle
checkpoint suggested another cellular role for CA224, possibly as a antimicrotubule agent. We
investigated the action of CA224 on tubulin polymerization in-vitro. The results indicated strong
antitubulin activity of CA224 (Figure 4a) while fascaplysin does not show any interaction with tubulin
(data not shown). Representative polymerization curves of CA224, paclitaxel and nocodazole are shown
in Figure 4a. CA224 inhibits the polymerization of tubulin which is concluded from the dose-dependent
decrease in Vmax (mOD/min) and reduction of final polymer mass (Figure 4a). When tested at four
different concentrations, CA224 decreased the Vmax from 17 mOD/min to 6.2, 2.1, 1.1 and 0.4
Page 15 of 43
ACS Paragon Plus Environment
Journal of Medicinal Chemistry
123456789101112131415161718192021222324252627282930313233343536373839404142434445464748495051525354555657585960

16
mOD/min at 2.5, 5, 10 and 25 µM respectively. As a consequence of decreased Vmax, upto 80%
reduction in final polymer mass has been observed.
Microtubules, the key components of cytoskeleton are made up of α/β-tubulin heterodimers.
Microtubule assembly has been targeted using number of polymerization inhibitors and inducers, by
binding at different sites including a) colchicine binding site; at interphase of the α/β tubulin
heterodimer and b) taxol and vinblastine binding site deep inside β-tubulin. The mechanism of tubulin
polymerization inhibitor involves binding at the interphase of the α/β tubulin and forming complex with
tubulin like colchicine. This complex is added to the microtubule assembly, where it induces
unfavorable conformational changes in tubulin dimer (M-loop) and thus further polymerization process
gets stopped. Furthermore, tubulin-polymerization inhibitor complex perturbs microtubule growth by
sterically blocking further addition of the tubulin dimers to form microtubule assembly.38-40 Upon
molecular docking studies, it was observed that CA224 binds at α/β-tubulin interphase by H-bonding.
CA224 interacts with the Thr353 residue of β tubulin by H-bonding. In addition to this, the hydrophobic
biphenyl ring fits in hydrophobic core of the β-tubulin formed by Leu248, Ala250, Leu252, Cys241,
Leu255, Ala316, Ala317 and Ala354 (Figure 4b). Interestingly, these interactions were missing in
fascaplysin. CA224 binding at interphase of α/β-tubulin, is supposed to induce conformational changes
in protein which further perturbs tubulin polymerization to form microtubule assembly.
Page 16 of 43
ACS Paragon Plus Environment
Journal of Medicinal Chemistry
123456789101112131415161718192021222324252627282930313233343536373839404142434445464748495051525354555657585960

17
0.1
0.2
0.3
0.4
0.5
0.6
0.7
0.8
0 1000 2000 3000 4000
Time (s)
M 3
40
0.1
0.2
0.3
0.4
0.5
0.6
0.7
0.8
0 1000 2000 3000 4000
Time (s)
M 340
0.1
0.2
0.3
0.4
0.5
0.6
0.7
0.8
0 1000 2000 3000 4000
Time (s)
M 340
0.1
0.2
0.3
0.4
0.5
0.6
0.7
0.8
0 1000 2000 3000 4000
Time (s)
M 3
40
0.1
0.2
0.3
0.4
0.5
0.6
0.7
0.8
0 1000 2000 3000 4000
Time (s)
M 3
40
0.1
0.2
0.3
0.4
0.5
0.6
0.7
0.8
0 1000 2000 3000 4000
Time (s)
M 3
40
0.1
0.2
0.3
0.4
0.5
0.6
0.7
0.8
0 1000 2000 3000 4000
Time (s)
M 3
40
Cell free Tubulin
polymerization assay
in vitro
control; Vmax = 19 mOD/min
paclitaxel, 10 µM; Vmax = 61 mOD/min
nocodazole, 10 µM; Vmax = 4.5 mOD/min
CA224, 2.5 µM; Vmax = 6.2 mOD/min
CA224, 25 µM; Vmax = 0.4 mOD/min
CA224, 10 µM; Vmax = 1.1 mOD/min
CA224, 5 µM; Vmax = 2.1 mOD/min
(a) (b)
Figure 4. (A) Purified tubulin polymerization assay in vitro. The ability of CA224 to inhibit tubulin polymerization in vitro
was investigated as described in materials and methods. Paclitaxel and nocodazole were used in the assay as known
enhancer and inhibitor of tubulin polymerization. CA224 was tested for a range of concentrations at which it show inhibition
of in vitro cell growth. The change in Vmax value was used as an indicator of tubulin/ligand interactions. The
polymerization curves indicate 2.5 µM, 5 µM, 10 µM and 25 µM of CA224 reduced the Vmax value from 19 mOD/min
(control) to 6.2, 2.1, 1.1 and 0.4 mOD/min respectively. The curves shown are average of three independent experiments. (b)
CA224 interactions at α/β-tubulin interphase.
CA224 inhibits paclitaxel-mediated tubulin polymerization and enhances tubulin
depolymerization in live cells. The tubulin polymerization experiments performed on whole cells
(A549, NSCLC, with intact mitotic spindle checkpoint) confirmed the observation that CA224 inhibits
polymerization of tubulin. Moreover CA224 also enhances the depolymerization of stabilized tubulin
protein. The polymerized and depolymerized (soluble) forms of tubulin were gauged (via Western-
blotting) from the accumulation/ disappearence of tubulin protein from pellet and from supernatant
fractions of cell lysates treated with IC50 concentration of CA224. In the first set of experiments where
cells were treated with CA224 in the presence of microtubule stabilizing agent paclitaxel, CA224
Page 17 of 43
ACS Paragon Plus Environment
Journal of Medicinal Chemistry
123456789101112131415161718192021222324252627282930313233343536373839404142434445464748495051525354555657585960

18
showed prevention of tubuin polymerization (mediated by paclitaxel) in a dose-dependent manner
(Figure 5, upper two panels). In a second set of experiment where intracellular tubulin was stabilised
with paclitaxel and then subjected to CA224 treatment, results show enhancement of tubulin
depolymerization with the increasing concentrations of CA224 (Figure 5, lower two panels).
simultaneous treatment of paclitaxel and CA224
paclitaxel treatment followed by CA224
supernatant
pellet
pellet
supernatant
Figure 5. Tubulin polymerization assay in vivo. Western blots show the response of CA224 to tubulin polymerization in the
presence of paclitaxel and the effect of CA224 on paclitaxel stabilized tubulin. The assay is performed in whole cells (A549)
after 30 min compound treatment at the concentrations indicated in figure. Supernatant and pellet represent unassembled and
assembled tubulin respectively. Tubulin polymerization is detectable by the increase of tubulin in pellet and its disappearance
from supernatant. Simultaneous treatment of paclitaxel and CA224 show inhibition of tubulin polymerization by CA224 in a
dose dependent manner and resulted in accummulation of unassembled tubulin in supernatant. It was observed that CA224
also act as an enhancer for tubulin depolymerization in dose dependent manner when paclitaxel stabilized tubulin was
subjected CA224 treatment.
Page 18 of 43
ACS Paragon Plus Environment
Journal of Medicinal Chemistry
123456789101112131415161718192021222324252627282930313233343536373839404142434445464748495051525354555657585960

19
Colony formation assay. The ability of CA224 in killing cancer cells was explored in the long term
survival assay which monitors cancer cells’ colony-forming capacity in-vitro. A549 (with normal
mitotic spindle checkpoint normal, pRb+) and Calu-1 (with mitotic spindle checkpoint impaired, pRb+)
cells were used in colony formation assays. The colony formation efficiency of A549 and Calu-1 cells is
significantly reduced after CA224 treatment (Figure 6). The concentration at which 50% colony
formation efficiency is observed is comaparatively lower than the IC50 concentration for cell growth
inhibition in MTT assay indicating that a large number of cells loose the ability to form colonies or do
not survive for a long time after CA224 treatment. For A549 cells, 50% colony formation efficiency was
observed at an average 1.4 µM concentration of CA224 (cell growth inhibition IC50 = 3.5 µM) and for
Calu-1 cells 50% colony formation efficiency was observed at an average of 3 µM concentration of
CA224 (cell growth inhibition IC50 = 11.5 µM) (Table 2; Figure 6) indicating that CA224 may be quite
efficacious in in vivo mouse tumor models.
Page 19 of 43
ACS Paragon Plus Environment
Journal of Medicinal Chemistry
123456789101112131415161718192021222324252627282930313233343536373839404142434445464748495051525354555657585960

20
a
c
b
h
f
d
g
je
i
A
B
0
20
40
60
80
100
1 10 100
CA224 concentration (µM)
colo
ny f
orm
atio
n ef
fici
ency
(% u
ntre
ated
cel
ls)
A549
Calu1
A549 Calu-1
Figure 6. CA224 in colony formation assay. A549 and Calu-1 cells were investigated for their long term survival
efficiency after the treatment with different concentrations of CA224. The colony formation efficiency is expressed as the
percentage of colonies formed in the treated cultures compaired with untreated cultures. (A) The representative plates show
A549 untreated (a), treated with CA224, 3.12 µM (b), treated with CA224 6.25 µM (c), treated with CA224, 12.5 µM (d)
treated with fascaplysin 0.8 µM (e); Calu-1 untreated (f), treated with CA224, 3.12 µM (g), treated with CA224 6.25 µM (h),
treated with CA224, 12.5 µM (i) treated with fascaplysin 1 µM (j). (B) The curves representing colony formation efficiencies
of A549 and Calu-1 cells with increasing concentrations of CA224. All results represent the means and standard deviations
of three independent experiments.
CA224 induces apoptotic cell death in cancer cells. When A549 cells were treated with increasing
concentrations of CA224 for 24 h, dose-dependent induction of fragmented nuclei, disrupted cell
membrane and apoptotic cell death was observed (Figure 7A-c,d,e). The induction of apoptosis in NCI-
H460, NCI-H358 and NCI-H1299 cells was also measured with flow cytometry (Figure 7B). Dose-
dependent and time-dependent increase in apoptotic cell death was observed.
Page 20 of 43
ACS Paragon Plus Environment
Journal of Medicinal Chemistry
123456789101112131415161718192021222324252627282930313233343536373839404142434445464748495051525354555657585960

21
0
10
20
30
40
50
60
24h 48h 72h
time of incubation
% a
popt
osis
NCI-H460; IC50
NCI-H460; IC70
NCI-H1299; IC50
NCI-H1299; IC70
NCI-H358; IC50
NCI-H358; IC70
A
B
a b c
d e
Figure 7. Induction of apoptotic cell death analysed by DAPI staining and FACS. Incubation of A549 cells with
increasing concentration of CA224 for 24 h show the dose dependent induction of fragmented nuclei, distrupted cell
membrane and apoptotic cell death (A) The fluorescence microscopic images captured at 40X magnification after staing with
DAPI. (A) A549 untreated (a) treated with CA224, 1 µM (b), treated with CA224, 2.5 µM (c), treated with CA224, 5 µM
(d), and treated with CA224, 10 µM (e). The pre-apoptotic and apoptotic cells are indicated with arrows. (B) The percent
apoptosis induced in three cancer cell lines by the treatment with CA224 and determined by FACS analysis. The percent
apoptosis is depicted from the percent of cells appeare in Sub G1 peak during cell cycle analysis. The apoptosis show
increase with concentration used and time of incubation with CA224.
Aqueous solubility, pharmacokinetics, CYP450 liability and caco-2 permeability. The solubility
of CA224 in water, PBS, SGF and SIF was found to be 80, 125, 125 and 5 µg/ml, respectively. In order
to check the plasma exposure of the compound in animals, the pharmacokinetics of CA224 was studied
Page 21 of 43
ACS Paragon Plus Environment
Journal of Medicinal Chemistry
123456789101112131415161718192021222324252627282930313233343536373839404142434445464748495051525354555657585960

22
in BALB/c mice following a single 10 mg/kg dose administration by oral route and 1.0 mg/kg dose
administration by IV route. CA224 showed good plasma exposure with Cmax of 190 and 371 ng/mL
(537 and 1048 nM) by PO and IV routes, respectively. The AUC0-∞ values were 182 and 189 ng·h/mL
(514 and 534 nM), respectively. In CYP-liability studies, at 10 µM, CA224 showed 50, 14, 51 and 19%
inhibition of CYP3A4, CYP2D6, CYP2C9 and CYPC19, respectively. In permeability experiment,
efflux ratio [Papp (B–A)/Papp (A–B)] was 1.1, indicating that CA224 is not a substrate of Pgp.
In vivo experiments: Maximum tolerated dose (MTD). The studies which allowed determination
of MTD-s were performed in Swiss albino mice for two weeks. The concentration at which CA224
would be tested in vivo was thus ascertained. The loss in animal body weight was considered as a
measure of over-toxicity for the test compound. The concentration of the compound at which >10%
weight loss was observed was determined and designated as MTD, although usually a weight loss which
is below 20% of the initial weight is harmless and animals can recover once the treatment is stopped.
The toxicity results obtained from these studies indicated that for CA224 the MTD in mice was ~1000
mpk (mg/kg). Based on the MTD experiment and PK data, CA224 was tested at 1/10th of MTD
concentration i.e. 100 mg/kg in in-vivo xenograft studies.
Effects on HCT-116 and NCI-H460 tumor growth inhibition. SCID (Severe Combined Immuno
Deficient) mouse, lacking both T and B immune cells, is an established model to study in vivo efficacy
of molecules that has potential for the treatment of human cancers. When evaluated, CA224 showed
statistically significant (p<0.05) tumor growth inhibition (Figure 8A) at 1/10th of MTD concentration
(100 mg/kg) in the HCT-116 tumor model. Mice injected with CA224 exhibited approximately 80%
tumor growth inhibition as compared to the untreated mice injected with the vehicle solution alone. In
the second set of experiments the anti-tumor potential of CA224 was confirmed when it was proven to
be highly efficacious in NCI-H460 tumor models at 100 mg/kg concentration (Figure 8C-D). These
results indicate CA224 has strong anti-cancer properties in vivo when administered at a concentration 10
times less than the MTD. Thus, with these studies CA224 has shown efficacy as a new class of
Page 22 of 43
ACS Paragon Plus Environment
Journal of Medicinal Chemistry
123456789101112131415161718192021222324252627282930313233343536373839404142434445464748495051525354555657585960

23
anticancer compound. Further chemical-biological optimization could lead to the identification of a
potential candidate for clinical development.
During this study, the effect on animal body weight due to compound treatment was also noted. The
weight loss observed in treated animals was found to be <10% of the starting weights of the animals
(Figure 8B) in the HCT-116 tumor model. This loss of weight can be considered to be statistically
insignificant indicating that compound treatment caused no major toxicity or harm to the animals. The
body weight of the animals at the beginning of treatment was measured and this was considered to be
100%. The percentage weight loss or gain was calculated using the initial weight as a reference. Similar
results were obtained in NCI-H460 tumor model (data not shown). CA224 shows minimal toxicity in
animal models and can be tolerated up to 1000 mg/kg concentration without any significant toxicity.
Anti-tumour activity of CA224 in SCID mice using
human colon cancer cell, HCT116, xenografts
10
210
410
610
810
1010
0 5 10 15 20
No. of days (9-day treatment followed by a 9-day period of no-treatment)
tumour volume, mg
ControlCA224 100mpk
(A)
90%
Statistically insignificant (< 10%) loss in body weight after 9
days treatment with CA224
60
80
100
120
140
0 2 4 6 8 10 12 14
mean body weights normalised
to 100%
of starting value
Control
CA224 100 mg/kg
No. of days (9-day treatment followed by a 5-day period of no-treatment)
(B)
0
500
1000
1500
2000
2500
0 2 4 6 8 10 12
tumor volume, mg
No. of days
Anti-tumor activity of CA224 in SCID mice using human lung cancer NCI-H-460, xenografts
Control
CA224 100 mg/kg
(C)
Control or untreated mice with NCI-H460 xenografts Mice treated with CA224 100mpk
tumors removed from control or untreated
mice (human lung cancer, NCI-H460)
tumors removedfrom mice treated
with CA224 100mpk
(D)
Figure 8. (A) Tumor growth inhibition curves for CA224 in in vivo HCT116 xenograft model. Graphs depict tumor growth
inhibition in a group of animals treated with CA224 at the concentration 100 mpk which is compared with the untreated
group of animals (shown in the graphs as the control group). Tumor sizes were recorded at 2-5 day intervals. Tumor weight
Page 23 of 43
ACS Paragon Plus Environment
Journal of Medicinal Chemistry
123456789101112131415161718192021222324252627282930313233343536373839404142434445464748495051525354555657585960

24
(in mg) was estimated according to the formula for a prolate ellipsoid: [Length (mm) x [width (mm)2] x 0.5] assuming
specific gravity to be one and π to be three. CA224 shows statistically significant tumor growth inhibition in vivo. p < 0.05
(Student t test was used for multiple comparisons of different groups versus control); (B). Animal weight profile in the
HCT116 SCID mice xenograft model. The body weights of untreated and treated with CA224 (100 mpk) animals were
monitored by taking measurements daily during the treatment schedule. By considering the body weight at the start of
treatment as 100%, the percentage weight loss was calculated on subsequent days of treatment. (C). Tumor growth inhibition
curves for CA224 in in vivo NCI-H460 tumor model. Graphs depict tumor growth inhibition in a group of animals treated
with a specific compound which is compared with the untreated group of animals (shown in the graphs as the control group).
Tumor sizes were recorded at 2-5 day intervals. Tumor weight (in mg) was estimated according to the formula for a prolate
ellipsoid: [Length (mm) x [width (mm)2] x 0.5] assuming specific gravity to be one and π to be three. CA224 shows
statistically significant tumor growth inhibition in vivo. p < 0.05 (Student t test was used for multiple comparisons of
different groups versus control). (D). Control and treatment groups of SCID mice showing NCI-H460 tumor growth
inhibition followed by treatment with CA224 as labeled in the figure. These pictures were obtained after treatment with
CA224 at the concentration 100 mpk. The treatments were continued for 9 consecutive days intra-peritoneally when tumor
growth had reached about 4-6 mm in diameter after about 6 days followed by the tumor cell injection.
CONCLUSION
In summary, we have presented data that supports the notion that CA224 has the potential of being a
novel anticancer agent. The finding of dual inhibitors of Cdk4-cyclin D1 and tubulin polymerization,
may address the problems of resistance which currently limit the efficacy of valuable anti-microtubule
agents. The promising efficacy of CA224 in xenograft models (HCT-116 and NCI-H-460 tumor
models) with an excellent therapeutic window indicates promise of this compound to develop as
anticancer agent.
EXPERIMENTAL SECTION
General. All chemicals were obtained from Sigma-Aldrich Company and used as received. 1H, 13C
and DEPT NMR spectra were recorded on Bruker-Avance DPX FT-NMR 500 and 400 MHz
Page 24 of 43
ACS Paragon Plus Environment
Journal of Medicinal Chemistry
123456789101112131415161718192021222324252627282930313233343536373839404142434445464748495051525354555657585960

25
instruments. Chemical data for protons are reported in parts per million (ppm) downfield from
tetramethylsilane and are referenced to the residual proton in the NMR solvent CDCl3. Carbon nuclear
magnetic resonance spectra (13C NMR) were recorded at 125 MHz or 100 MHz: chemical data for
carbons are reported in parts per million (ppm, δ scale) downfield from tetramethylsilane and are
referenced to the carbon resonance of the solvents (CDCl3: 77.00 ppm). ESI-MS spectra were recorded
on Agilent 1100 LC-Q-TOF machine.
Synthesis of [2-(1H-Indol-3yl-ethyl]-carbamic acid ethyl ester (2): To the suspension of
tryptamine 1 (1.2 mmol) in CH2Cl2 (3 ml) at 0 °C was added slowly an aqueous solution of 4 N NaOH
(1.2 mmol). After 5 min stirring at 0 °C, ethyl chloroformate (1.2 mmol) was added dropwise. The
resulting mixture was stirred for 5 min at 0 °C and further stirred at rt for 3 h. Completion of the
reaction was monitored by TLC. After completion of the reaction, reaction mixture was diluted with
CH2Cl2 and was washed with water. Organic layer was separated and dried over anhydrous sodium
sulfate. Solvent was evaporated under reduced pressure and crude product was purified by silica gel
(#100-200) column chromatography using EtOAc: Hexane as mobile phase to get title compound 2.
Light pink oil; yield: 90%; 1H NMR (400 MHz, CDCl3, ppm): δ 8.15 (1H, brs, NH), 7.60 (1H, d, J =
8Hz), 7.36 (1H, d, J = 8 Hz), 7.25 – 7.10 (2H, m), 7.01 (1H, s), 4.75 (1H,brs, NH), 4.13 – 4.08 (2H, m),
3.52 (2H, d, J = 4 Hz), 2.97 (2H, t, J = 8 Hz), 1.27 – 1.20 (3H, m); ESI-MS: m/z 233.10 [M+1]+.
Synthesis of [2-(1H-Indol-3-yl)-ethyl]-methylamine (3): To the solution of 2 (0.1 g, 59.4 mmol) in
dry THF (5 mL) under N2 flux at 0 °C was added portionwise LAH (178 mmol). After the addition was
completed, the mixture was heated under reflux for 1 h. The reaction was then cooled to 0 °C and the
excess of LAH was hydrolyzed by adding successively and very carefully water (2 mL), 15% aqueous
solution of NaOH (2ml) and water (3 ml). During these steps, it was necessary to add THF (10 ml) to
avoid the mixture becoming very thick. The suspension was filtered and the white solid, made up of
LiOH and Al(OH)3, was washed with THF (10 ml). The organic layer was dried (Na2SO4) and
evaporated under reduced pressure to give the title compound 3; Beige solid, yield: 85%; 1H NMR (400
Page 25 of 43
ACS Paragon Plus Environment
Journal of Medicinal Chemistry
123456789101112131415161718192021222324252627282930313233343536373839404142434445464748495051525354555657585960

26
MHz, CDCl3, ppm): δ 8.81 (1H,brs, NH), 7.60 (1H, s), 7.30 (1H, s), 7.17 – 7.10 (2H, m), 6.94 (1H, s),
2.97 – 2.91 (4H, m), 2.41 (3H, s); ESI-MS: m/z 175.0 [M+1]+.
Synthesis of biphenyl-4-carboxylic acid [2-(1H-indol-3-yl)-ethyl]-methyl amide (CA224, 5): To
the suspension of [2-(1H-Indol-3-yl)-ethyl]-methylamine 3 (1.2 mmol) in CH2Cl2 (3 ml) at 0 °C was
added slowly an aqueous solution of 4 N NaOH (1.2 mmol). After 5 min stirring at 0 °C, 4-biphenyl
carbonychloride (1.2 mmol) was added dropwise. Mixture was stirred for 5 min at 0 °C and further
stirred at rt for 3 h. Completion of the reaction was monitored by TLC. After completion of the reaction,
reaction mixture was diluted with CH2Cl2 and was washed with water. Organic layer was separated and
dried over anhydrous sodium sulfate. Solvent was evaporated under reduced pressure and crude product
was purified by silica gel (#100-200) column chromatography using EtOAc: Hexane as mobile phase to
get title compound 5. Beige solid ; yield: 45%; 1H NMR (400 MHz, CDCl3, ppm): δ 8.21 (1H, brs, NH),
7.58 – 7.09 (13H, m), 6.88 (1H, t, J = 8Hz), 3.88 (1H, t, J = 8Hz), 3.61 (1H, t, J = 4Hz), 3.20 (3H, s),
2.98 (2H, t, J = 4Hz); δ (distinct peaks for minor rotamer) 7.58 (1H, d, J = 8Hz), 7.01 (1H, d, J = 8Hz),
2.93 (1H, d, J = 8Hz); 13C NMR (100 MHz, DMSO-d6, ppm): δ (major rotamer) 170.58 (CO), 139.42
(C), 136.18 (C), 128.99 (CH), 127.76 (CH), 127.47 (CH), 126.91 (C), 126.69 (CH), 126.41 (CH),
120.88 (C), 120.87 (CH), 118.06 (CH), 117.82 (C), 117.81 (CH), 111.34 (CH), 51.43 (CH2), 32.33
(CH3), 23.84 (CH2). δ (distinct peaks for minor rotamer) 169.55 (CO), 140.55 (C), 135.72 (C), 123.06
(CH), 118.28 (CH), 110.40 (C), 47.87 (CH2), 37.44 (CH3), 22.52 (CH2); ESI-MS: m/z 355.10 [M+1]+.
Kinase profiling. CA224 was tested against a panel of kinases at 10 µM. The in-vitro kinase assays
for testing against Cdk4-cyclin D1, Cdk2-cyclin A, Cdk2-cyclin E, Cdk1-cyclin B1 and Cdk9-cyclin T1
were performed in house. The methodology and results have been reported previously.33-37 The kinase
profiling for 58 representative kinases was done commercially at Millipore Bioscience Division, UK.
In-vitro cell proliferation assays. All ten human cancer cell lines were maintained at 37 ºC in 5%
CO2 in RPMI-1640 medium, supplemented with 10% fetal calf serum and 100 µg/ml NormocinTM. The
Page 26 of 43
ACS Paragon Plus Environment
Journal of Medicinal Chemistry
123456789101112131415161718192021222324252627282930313233343536373839404142434445464748495051525354555657585960

27
ten cancer cell lines used for screening were non-small cell lung carcinoma (NSCLC; a form of cancer
which is resistant to chemotherapy) lines: NCI-H460 (pRb+, p53+), A549 (pRb+, p53+) obtained from
the Glenfield Hospital, Leicester in June 2006; and Calu-1 (pRb+, p53-null), NCI-H1299 (pRb+, p53-
null), NCI-H358 (pRb-null, p53-null) obtained from Mr Pat Browne (Morvus Technology) in July 2007.
The colon cancer line LS174T (pRb+, p53+), and the prostate cancer line PC3 (pRb+, p53-null) were also
gifts from Mr Pat Browne (Morvus Technology) in July 2007. The pancreatic cancer line MiaPaca
(pRb+, p53-mutant) was kindly provided by Prof Bill Greenhalf (University of Liverpool) in July 2007.
The genotypes within brackets indicate the status of the tumor suppressor proteins pRb and p53. The
mouse embryonic normal hepatic cell line (BNL CL2) and its SV-40 large T-antigen transformed
counterpart cell line (BNL SV A.8) were purchased from ATCC in January 2006. The large T antigen
inactivates the tumor suppressor proteins p53 and pRb. The obtained cell lines were tested and
authenticated via (a) short tandem repeat (STR) profiling; (b) monitoring of cell morphology; (c)
karyotyping; and (d) cytochrome C oxidase I (COI) assay. The last tests were performed by ATCC
before the cell lines were bought. The cell lines were resuscitated immediately after receipt. The
detailed procedure of cell proliferation (MTT) assay and IC50 determination was described previously.36
Flow cytometric analysis. The untreated (control) and treated (with test compounds) cells were
harvested by trypsinization, washed once with PBS and then fixed in 70% chilled (-20ºC) ethanol for
minimum 1 h. After the fixation step, cells were centrifuged for 5 min at 3000X g at room temperature
and then the pellet was suspended in PBS containing 50 µg/ml propidium iodide (Sigma Cat No P-
4170) and 0.5 mg/ml DNase-free ribonuclease (Sigma Cat No R-5503). The cells were stained for 1 h
in the dark at 4°C. Cell cycle analysis was performed on the Beckman Coulter (Epics® AltraTM)
fluorescence-activated cell sorter. In order to gate all the events which represent single cells, and not
cell doublets or cell clumps, the following analyses were performed on the samples. Cytograms of
propidium iodide fluorescence peak signal versus integrated fluorescence or the linear signal were
plotted. All data points on the straight line were isolated in a single gate and the gated data further used
Page 27 of 43
ACS Paragon Plus Environment
Journal of Medicinal Chemistry
123456789101112131415161718192021222324252627282930313233343536373839404142434445464748495051525354555657585960

28
for plotting a histogram that represents a complete cell cycle. The total number of events was not
allowed to exceed 200 events/second. Data acquisition was stopped after a minimum of 10,000 events
had been collected.
Western-blotting. A549, LS174T and MIAPaCa cells were seeded in 25 cm2 tissue culture flasks in
the complete growth medium. When the culture flasks reached 40-50% confluency, cells were treated
with CA224 (IC50 concentration) for 24 h. Cells were harvested by trypsinization, washed in ice-cold
PBS and then lysed in buffer (Sigma Cat No C-2978) containing protease inhibitor cocktail (Sigma Cat
No P8340). The lysates were centrifuged at 14,000 rpm for 10 min at 4ºC and the total protein
concentrations were estimated in the clear supernatants using the Bradford method. Equal amounts of
protein (40 µg) were loaded and electrophoresed on 10% SDS-polyacrylamide gels and blotted on
Immobilon–P Transfer Membrane (Millipore Cat No IPVH20200). The blots were probed with
respective primary antibodies (at 4 ºC, overnight) at the following dilutions: cdc2 (New England
Biolabs Cat No 9110) at 1:1000 to detect Cdk1; cyclin B1 (CR-UK Cat No V152) at 1:1500 dilution to
detect cyclin B1; Pab 1801 (Santa Cruz Biotechnology Cat No sc-98) at 1: 500 dilution to detect p53; N-
20 (Santa Cruz Biotechnology Cat No sc-469) at 1:500 dilution to detect p21; C-19 (SantaCruz
Biotechnology Cat No sc-528) at 1:250 dilution to detect p27; AC-40 (Sigma-Aldrich Cat No. A4700)
at 1:2000 dilution to detect actin. Appropriate secondary antibodies conjugated with horseradish
peroxidase were used and the protein bands were visualised by chemiluminescence using the ECL kit
(SantaCruz Biotechnology Cat No sc-2048).
Tubulin polymerization assay in-vitro. The purified tubulin was obtained commercially
(Cytoskeleton Inc. Denver USA) and the polymerization assays were carried out according to the
method previously described.41, 42 Tubulin polymerization assay is based on the adaptation of the
original method of Lee and Timasheff (1977) which demonstrated that light is scattered by microtubules
to an extent that is proportional to the concentration of the microtubule polymer. The resulting
polymerization curves is representative of three phases of microtubule polymerization, namely
Page 28 of 43
ACS Paragon Plus Environment
Journal of Medicinal Chemistry
123456789101112131415161718192021222324252627282930313233343536373839404142434445464748495051525354555657585960

29
nucleation, growth and steady-state equilibrium. Paclitaxel and nocodazole were used in the assay as a
known enhancer and inhibitor of tubulin polymerization, respectively. The ability of CA224 to inhibit
tubulin polymerization in-vitro was determined according to the manufacturer’s instructions. Briefly,
tubulin protein (3 mg/ml) was polymerized in GTP buffer (80 mM PIPES pH 6.9, 2 mM MgCl2, 0.5
mM EGTA, 10.2% glycerol and 1 mM GTP) in the presence of a range of CA224 concentrations at 37
ºC in a temperature-regulated Biotech spectrophotometer. The absorbance kinetic (at 340 nm) of 61
cycles for each sample was studied and the readings were recorded at intervals of 1 min.
Western-blot analysis to test effects of CA224 on tubulin polymerization and depolymerization
of stabilized tubulin in live cells. A549 cells were plated at a concentration of 10,000 cells per well in
1 ml complete growth medium in 24 well/15 mm plates. The plates were incubated for 24 h for the
stabilization. In the first set of experiments the cells were treated for 30 min with 10 nM paclitaxel and
different concentrations of CA224 (simultaneous treatment of paclitaxel and CA224). In the second set,
in order to study the effect of CA224 on the stabilised form of tubulin, the cells were treated first with
10 nM paclitaxel for 30 min. The cell monolayer was then washed twice with sterile PBS and fresh
growth medium containing different concentrations of CA224 were added. The plates were further
incubated for 30 min, the cell monolayers were washed twice with sterile PBS at room temperature and
then 100 µl tubulin extraction buffer (1 mM MgCl2, 2 mM EGTA, 0.5% NP40 and 20 mM Tris–HCl pH
6.8) supplemented with 2 mM phenylmethylsulfonyl fluoride, and a protease inhibitor cocktail (Sigma
Cat No P8340) was added per well. After a brief and vigorous vortex, the cell lysates were incubated at
room temperature for 5 min and then centrifuged at 16,000X g for 10 min in order to separate the
soluble and polymerized tubulin fractions. Each supernatant and pellet fraction was mixed with 10X
sample buffer, heated for 7 min at 95ºC and resolved on 10% SDS-polyacrylamide gels. The resolved
proteins were then subjected to Western blotting (as described above) with a specific α-tubulin antibody
B-7 (Santa Cruz Biotechnology Cat No sc-5286).
Detection of apoptosis using DAPI staining. The apoptosis and nuclear fragmentation was
Page 29 of 43
ACS Paragon Plus Environment
Journal of Medicinal Chemistry
123456789101112131415161718192021222324252627282930313233343536373839404142434445464748495051525354555657585960

30
detected using DAPI staining followed by observations under fluorescence microscope.43 A549 cells
were seeded at the concentration of 50,000 cells per well in 35 mm/6 well plates in a total of 2 ml
complete growth medium. After 24 h stabilization period, cells were further incubated in the presence of
different concentrations of CA224 for 24 h. Followed by exposure to CA224, the cells along with the
floating cells were collected by trypsinization, washed in sterile PBS and fixed in ethanol:acetic acid
(3:1) for 10 min. The cell suspension was dropped on to a glass slide in order to break open the cells
allowing them to be dried in air. The smear formed on the slide was mounted in a medium containing 1
µg/ml DAPI and covered with coverslip. The slides were observed using a fluorescence microscope
(Olympus) and a minimum of 500 nuclei were counted for each sample.
Clonogenic assay. A549 and Calu-1 cells were plated at a concentration of 500 cells per well in 35
mm/6 well plates in 2 ml complete medium. The plates were incubated for 24 h stabilization and further
incubated with a range of concentrations of fascaplysin and CA224 (0.1-10 µM) for 24 h. Plates were
then gently washed with PBS, replaced with fresh medium and incubated at 37 ºC. After 10-12 days,
cells were fixed in methanol:acetic acid (2:1) for 10 min, washed, air dried and stained with 1% crystal
violet. The colonies were evaluated by visual counts. The number of colonies in treated cultures was
expressed as a percentage of the control cultures. All results represents means and standard deviations
from at least three independent experiments.
Determination of aqueous solubility by 96-well plate-based assay. The solublity was determined as
described earlier.44 Briefly, the compound was loaded into 96-well plate in the form of methanolic
solution, followed by evaporation of solvent to get 1, 2, 4, 8, 16, 25, 40, 80, 160 and 300 µg of
compound in solid form in wells. Thereafter, 200 µl of dissolution medium was added to the wells and
plates were shaken horizontally at 300 rpm for 4 h at room temperature (25±1 °C). The plates were
covered with aluminium foil and were kept overnight at room temperature for equilibration. Later, the
plates were centrifuged at 3000 rpm for 15 min (Jouan centrifuge BR4i). Supernatant (50 µl) was
withdrawn into UV 96-well plates (Corning® 96 Well Clear Flat Bottom UV-Transparent Microplate)
Page 30 of 43
ACS Paragon Plus Environment
Journal of Medicinal Chemistry
123456789101112131415161718192021222324252627282930313233343536373839404142434445464748495051525354555657585960

31
for analyses with microplate reader (Molecular Devices, USA) at corresponding λmax of the sample. The
analysis was performed in triplicate for each compound. The solubility curve of concentration (µg/mL)
vs absorbance was plotted to find out saturation point and the corresponding concentration was noted.
hrCYP P450 isoenzyme assay. hrCYP P450 isoenzyme were aliquoted as per the total
concentration required to conduct the study and stored at -70 °C until use. Total assay volume was
adjusted to 200 µl and consists of three components: cofactors, inhibitor/vehicle and enzyme-substrate
(ES) mix. The 50 µl of working cofactor stock solution was dispensed to all the specified wells in a
black coloured nunc microtiter polypropylene plate. The 50 µl of diluted working concentrations of test
compounds/ positive control /vehicle were dispensed in triplicates to the specified wells as per the plate
map design. Reaction plate with cofactor and test item was preincubated at 37±1 °C in shaking
incubator for 10 min. Simultaneously, ES mix was prepared by mixing the hrCYP P450 isoenzyme.
Remaining volume was made up with the buffer and preincubated for 10 min at 37 ± 1 °C. 100 µL of
ES mix was dispensed per well as per the plate map design and incubated at 37 ± 1 °C in shaking
incubator for predetermined time. A set of controls were incubated with hrCYP P450 isoenzymes and
substrate without test or reference item. A set of blanks were incubated with substrate and test or
reference item, in the absence of hrCYP P450 isoenzymes. Reaction was terminated by adding specific
quenching solutions (for CYP1A2, CYP2C19 and CYP3A4 – 75 µl of 100% acetonitrile; for CYP2C9 –
20 µl of 0.25 M Tris in 60% methanol; for CYP2D6 – 75 µl of 0.25 M Tris in 60% methanol). The
reaction was quenched by thoroughly mixing the final contents of the wells by repeated pippeting using
multichannel pipette. The product fluorescence per well was measured using a multimode reader at
excitation and emission wavelengths of respective hrCYP P450 isoenzyme flourogenic metabolites.
Data was analyzed using Excel spreadsheet and the % inhibition was calculated.45
Caco-2 permeability assay. Permeability study was conducted with the Caco-2 monolayer cultured
for 21days (TEER full form values >500 cm2 in each well) and by adding an appropriate volume of
buffer (HBSS buffer containing 10 mM HEPES) containing test compounds to apical chamber. Test
Page 31 of 43
ACS Paragon Plus Environment
Journal of Medicinal Chemistry
123456789101112131415161718192021222324252627282930313233343536373839404142434445464748495051525354555657585960

32
sample was taken from both apical and basolateral chambers at 0 and 90 min after incubation at 37ºC
and analyzed by LC-MS/MS. Same experiment was repeated by adding an appropriate volume of
buffer (HBSS buffer containing 10 mM HEPES) containing test compound to basolateral chamber. The
AUC defined the net influx and outflow of the test compound across the Caco-2 cell monolayer.
Pharmacokinetics study. Oral and intravenous (IV) pharmacokinetic studies of CA224 were
carried out in Balb C male mice of age 4-6 weeks, by administering CA224 orally and IV formulation at
dose of 10 mg/kg for oral and 1 mg/kg for IV. Plasma samples were collected at appropriate time points
between the range of 0 hours to 24 hours and analyzed by LC-MS-MS. Mean plasma concentration
calculated and data were further analyzed for PK parameters evaluation using WinNonlin 5.3 software
package.
Maximum tolerated dose (MTD) finding studies for in vivo experiments. Swiss albino mice were
used to determine the maximum tolerated dose for the compound. CA224 was weighed and mixed with
0.5 % (w/v) carboxymethylcellulose (CMC) and triturated with Tween 20 (secundum artum) with
gradual addition of water to make up the final concentration. Care was taken not to exceed > 0.25% of
Tween 20 in the final formulation of the CA224. In this study 6 animals per group were administered
with CA224 at different doses for five days (Q1D x 5) via intraperitoneal route. Animals were
monitored for weight loss, morbidity symptoms and mortality for up to two weeks, which was the end
of treatment. Significant weight loss was considered when mean animal weight dropped by >10% and
was considered highly significant when the drop was >20%.
In vivo efficacy study in SCID mice. The in vivo efficacy was determined in two xenograft
models: HCT-116 and NCI-H460 tumor models.
HCT-116 experiments: A group of 60 Severely Combined Immune-Deficient (SCID strain-
CBySmn.CB17-Prkdcscid/J, The Jackson Laboratory, Stock # 001803) male mice weighing 18-25 g and
6-8 weeks old were used for the studies. Human colon carcinoma, HCT-116 cells (ATCC Cat No CCL-
Page 32 of 43
ACS Paragon Plus Environment
Journal of Medicinal Chemistry
123456789101112131415161718192021222324252627282930313233343536373839404142434445464748495051525354555657585960

33
247) were grown in McCoy’s 5A medium supplemented with 10% FBS (Sigma-Aldrich). The cultured
cells were injected subcutaneously into dorsal side of SCID mice at the dose of 6.6 × 10⁶ cells in 0.2 ml
of suspension. When the tumor growth reached to about 4-6 mm in diameter (about 5 days), the animals
were randomly divided into eight groups, each containing 7 mice. The treatments were continued for 9
consecutive days intraperitoneally.
NCI-H460 experiments: A group of 65 Severely Combined Immune-Deficient (SCID strain-
CBySmn.CB17-Prkdcscid/J, The Jackson Laboratory, Stock # 001803) female mice weighing 15-24 g
and 6-8 weeks old were used. Human non-small-cell lung carcinoma, NCI-H460 (ATCC Cat No HTB-
177) cells were grown in RPMI-1640 medium supplemented with 10% FBS (Sigma-Aldrich). The
cultured cells were injected subcutaneously into the dorsal side of SCID mice at a tune of 5.3 × 10⁶ cells
in 0.2 ml of suspension. When the tumor growth reached about 4-6 mm in diameter (about 6 days), the
animals were randomly divided into eight groups, each containing 6 or 7 mice. The treatments were
continued for 9 consecutive days intraperitoneally.
Tumor weight measurements: Tumor size was recorded at 2-5 day intervals. Tumor weight (mg)
was estimated according to the formula for a prolate ellipsoid: (Length (mm) x (width (mm)2) x 0.5)
assuming specific gravity to be one and π to be 3. Tumor growth in compound treated animals was
calculated as T/C (treated/control) x 100% and growth inhibition percent (% GI) was [100-% T/C]46-48.
Body weight measurements: The body weights of animals in different treatment and control groups
were monitored by taking the measurements daily during the treatment schedule. By considering the
body weight at the start of the treatment as 100%, the percent weight loss was calculated on subsequent
days of treatments.
Statistical analysis: Data from each experiment was analysed by Microsoft Excel 2000. Statistically
significant differences were identified and analyzed using student t-test for multiple comparisons versus
control group.46-48
Page 33 of 43
ACS Paragon Plus Environment
Journal of Medicinal Chemistry
123456789101112131415161718192021222324252627282930313233343536373839404142434445464748495051525354555657585960

34
Molecular docking and molecular dynamic simulation. The available crystal structures of Cdk4
are in the apo-form and have several missing residues, thus they cannot be used for molecular
modeling.49 In the present study, we have used a hybrid homology model of Cdk4 described by Shafiq
et al,50 which was developed from the Cdk4/cyclin D apo-crystal structure (PDB: 2W96) by
incorporating positions of missing gaps and activation loops from Cdk2 (PDB: 1FIN).51 This hybrid
homology model was subjected to protein preparation wizard for H-bond optimization, heterogeneous
state generation, protonation and overall minimization. Grid file of docking was constructed using XYZ
co-ordinates of the N atom of Val96 residue with a binding site of 12 Å radius grid box (X = −10.521, Y
= 208.683, Z = 107.944). For Cdk2 docking, the Cdk2 apo-protein (PDB ID: 1FIN) was subjected to
protein preparation wizard for filling missing loops and side chains (using prime), ionization, H-bond
optimization, heterogeneous state generation, protonation and overall minimization. Grid file of docking
was constructed using XYZ co-ordinates of the N atom of Leu83 residue with a binding site of 12 Å
radius grid box (X = − 10.406, Y = 209.105, Z = 107.576).
For tubulin docking, the tubulin-colchicine complex (PDB ID: 1SA0) was retrieved from the
protein data bank.52 In this complex, protein is heterodimeric in nature, consisting of two α-chains (451
residues), two β-chains (452 residues) and the Stathmin like domain (142 residues). Crystal structure
was subjected to protein preparation wizard for filling missing loops and side chains (using prime),
ionization, H-bond optimization, heterogeneous state generation, protonation and overall minimization.
All other ligands, water and ions were removed except colchicine. Grid file for docking was constructed
considering colchicine ligand as centroid of grid box of 10 Å size at interphase of α/β tubulin (C and D
chains). All ligands were sketched in Maestro, prepared using ligprep and docked by Glide molecular
docking software in XP mode.
The Cdk4-CA224 docked complex obtained from XP-docking was subjected to system builder, in
which TIP4P-Ew was used as an aqueous solvent model. The cubic box of 12 Å radius was used to
define the core and overall complex was neutralized by adding one Cl- counter ion for simulation.
Page 34 of 43
ACS Paragon Plus Environment
Journal of Medicinal Chemistry
123456789101112131415161718192021222324252627282930313233343536373839404142434445464748495051525354555657585960

35
Further this complex was minimized by steepest descent method followed by the Broyden–Fletcher–
Goldfarb–Shanno algorithm with convergence threshold of 2.0 Kcal/mol and overall 1000 iterations.
MD simulations were carried out at normal temperature and pressure (300°K and 1.01325 bar,
respectively). Thermostat and barostat method opted was langevin with ensemble pathway comprising
NVT (constant number of particles, volume and temperature) and isotropic coupling method. Overall
model system was relaxed before 10 ns simulation and coulombic interactions were defined by short-
range cut-off radius of 9.0 Å and by long-range smooth particle mesh Ewald tolerance to 1e-09.
AUTHOR INFORMATION.
Corresponding Author
* Tel: 44(0)116 250 7280; Fax: +44(0) 116 257 7287; E-mail: [email protected] (B.C.)
*Tel: +91-191-2569000 (Ext. 345). Fax: +91-191-2569333. E-mail: [email protected] (S.B.B.)
*Tel: +91-191-2569111. Fax: +91-191-2569333. E-mail: [email protected] (R.A.V.).
Notes
The authors declare no competing financial interest.
Author Contributions. SM (Sachin Mahale) performed all Cdk assays and in-vitro biology
experiments; PRJ designed fascaplysin analogues for chemical syntheses; BC designed all biology
experiments both in vitro and in vivo; SM (Sudhakar Manda) synthesized CA224 for pharmacokinetic
studies; PJ carried out molecular modeling studies; PJ and SBB interpreted modeling results; SSB
determined solubility of CA224 in various biological fluids; SBB, RAV and BC contributed to
manuscript writing.
ACKNOWLEDGEMENT.
Page 35 of 43
ACS Paragon Plus Environment
Journal of Medicinal Chemistry
123456789101112131415161718192021222324252627282930313233343536373839404142434445464748495051525354555657585960

36
This research work was funded by Cancer Research UK (BC and PRJ) and CSIR 12th FYP BSC-0205
project.
ABBREVIATIONS.
Cdk4, cyclin-dependent kinase 4; D/w, distilled water; min, minute; mpk, milligrams per kilogram of
body weight; MTD, maximum tolerated dose; rpm, revolutions per minute; SCID, Severe Combined
Immuno Deficient; t1/2,ß. terminal half life; AUC0-t, the area under the plasma concentration-time curve
from 0 to last measurable time point; AUC0-∞, area under the plasma concentration-time curve from time
zero to infinity; Cmax, maximum observed plasma concentration; C0, extrapolated concentration at zero
time point; CL, clearance; Vd, volume of distribution; Vdss, volume of distribution at steady state; Tlast,
time at which last concentration was found; F, oral bioavailability.
ASSOCIATED CONTENT.
Supporting information. Kinase profiling results of CA224. This material is available free of charge
via the Internet at http://www.pubs.acs.org.
REFERENCES
(1) Lim, S.; Kaldis, P. Cdks, cyclins and CKIs: roles beyond cell cycle regulation. Development
2013, 140, 3079-3093.
(2) Collins, I.; Garrett, M. D. Targeting the cell division cycle in cancer: CDK and cell cycle
checkpoint kinase inhibitors. Curr Opin Pharmacol 2005, 5, 366-373.
(3) Hirai, H.; Kawanishi, N.; Iwasawa, Y. Recent advances in the development of selective small
molecule inhibitors for cyclin-dependent kinases. Curr Top Med Chem 2005, 5, 167-179.
(4) Marahatta, S. B.; Sharma, N.; Koju, R.; Makaju, R. K.; Petmitr, P.; Petmitr, S. Cancer:
Page 36 of 43
ACS Paragon Plus Environment
Journal of Medicinal Chemistry
123456789101112131415161718192021222324252627282930313233343536373839404142434445464748495051525354555657585960

37
determinants and progression. Nepal Med Coll J 2005, 7, 65-71.
(5) Malumbres, M.; Barbacid, M. Cell cycle, CDKs and cancer: a changing paradigm. Nat Rev
Cancer 2009, 9, 153-166.
(6) Connell-Crowley, L.; Harper, J. W.; Goodrich, D. W. Cyclin D1/Cdk4 regulates retinoblastoma
protein-mediated cell cycle arrest by site-specific phosphorylation. Mol Biol Cell 1997, 8, 287-
301.
(7) Morgan, D. O. Cyclin-dependent kinases: engines, clocks, and microprocessors. Annu Rev Cell
Dev Biol 1997, 13, 261-291.
(8) Sherr, C. J. Cancer cell cycles. Science 1996, 274, 1672-1677.
(9) Soni, R.; Muller, L.; Furet, P.; Schoepfer, J.; Stephan, C.; Zumstein-Mecker, S.; Fretz, H.;
Chaudhuri, B. Inhibition of cyclin-dependent kinase 4 (Cdk4) by fascaplysin, a marine natural
product. Biochem Biophys Res Commun 2000, 275, 877-884.
(10) Geng, Y.; Yu, Q.; Sicinska, E.; Das, M.; Bronson, R. T.; Sicinski, P. Deletion of the p27Kip1
gene restores normal development in cyclin D1-deficient mice. Proc Natl Acad Sci USA 2001, 98,
194-199.
(11) Kitagawa, M.; Higashi, H.; Jung, H. K.; Suzuki-Takahashi, I.; Ikeda, M.; Tamai, K.; Kato, J.;
Segawa, K.; Yoshida, E.; Nishimura, S.; Taya, Y. The consensus motif for phosphorylation by
cyclin D1-Cdk4 is different from that for phosphorylation by cyclin A/E-Cdk2. EMBO J 1996,
15, 7060-7069.
(12) Martin, A.; Odajima, J.; Hunt, S. L.; Dubus, P.; Ortega, S.; Malumbres, M.; Barbacid, M. Cdk2 is
dispensable for cell cycle inhibition and tumor suppression mediated by p27(Kip1) and
p21(Cip1). Cancer Cell 2005, 7, 591-598.
(13) Tetsu, O.; McCormick, F. Proliferation of cancer cells despite CDK2 inhibition. Cancer Cell
Page 37 of 43
ACS Paragon Plus Environment
Journal of Medicinal Chemistry
123456789101112131415161718192021222324252627282930313233343536373839404142434445464748495051525354555657585960

38
2003, 3, 233-245.
(14) Landis, M. W.; Pawlyk, B. S.; Li, T.; Sicinski, P.; Hinds, P. W. Cyclin D1-dependent kinase
activity in murine development and mammary tumorigenesis. Cancer Cell 2006, 9, 13-22.
(15) Malumbres, M.; Barbacid, M. Is Cyclin D1-CDK4 kinase a bona fide cancer target? Cancer Cell
2006, 9, 2-4.
(16) Yu, Q.; Sicinska, E.; Geng, Y.; Ahnstrom, M.; Zagozdzon, A.; Kong, Y.; Gardner, H.; Kiyokawa,
H.; Harris, L. N.; Stal, O.; Sicinski, P. Requirement for CDK4 kinase function in breast cancer.
Cancer Cell 2006, 9, 23-32.
(17) Breault, G. A.; Ellston, R. P.; Green, S.; James, S. R.; Jewsbury, P. J.; Midgley, C. J.; Pauptit, R.
A.; Minshull, C. A.; Tucker, J. A.; Pease, J. E. Cyclin-dependent kinase 4 inhibitors as a
treatment for cancer. Part 2: identification and optimisation of substituted 2,4-bis anilino
pyrimidines. Bioorg Med Chem Lett 2003, 13, 2961-2966.
(18) Sanchez-Martinez, C.; Shih, C.; Faul, M. M.; Zhu, G.; Paal, M.; Somoza, C.; Li, T.; Kumrich, C.
A.; Winneroski, L. L.; Xun, Z.; Brooks, H. B.; Patel, B. K.; Schultz, R. M.; DeHahn, T. B.;
Spencer, C. D.; Watkins, S. A.; Considine, E.; Dempsey, J. A.; Ogg, C. A.; Campbell, R. M.;
Anderson, B. A.; Wagner, J. Aryl[a]pyrrolo[3,4-c]carbazoles as selective cyclin D1-CDK4
inhibitors. Bioorg Med Chem Lett 2003, 13, 3835-3839.
(19) Toogood, P. L.; Harvey, P. J.; Repine, J. T.; Sheehan, D. J.; VanderWel, S. N.; Zhou, H.; Keller,
P. R.; McNamara, D. J.; Sherry, D.; Zhu, T.; Brodfuehrer, J.; Choi, C.; Barvian, M. R.; Fry, D.
W. Discovery of a potent and selective inhibitor of cyclin-dependent kinase 4/6. J Med Chem
2005, 48, 2388-2406.
(20) VanderWel, S. N.; Harvey, P. J.; McNamara, D. J.; Repine, J. T.; Keller, P. R.; Quin, J., 3rd;
Booth, R. J.; Elliott, W. L.; Dobrusin, E. M.; Fry, D. W.; Toogood, P. L. Pyrido[2,3-d]pyrimidin-
Page 38 of 43
ACS Paragon Plus Environment
Journal of Medicinal Chemistry
123456789101112131415161718192021222324252627282930313233343536373839404142434445464748495051525354555657585960

39
7-ones as specific inhibitors of cyclin-dependent kinase 4. J Med Chem 2005, 48, 2371-2387.
(21) Beattie, J. F.; Breault, G. A.; Ellston, R. P.; Green, S.; Jewsbury, P. J.; Midgley, C. J.; Naven, R.
T.; Minshull, C. A.; Pauptit, R. A.; Tucker, J. A.; Pease, J. E. Cyclin-dependent kinase 4
inhibitors as a treatment for cancer. Part 1: identification and optimisation of substituted 4,6-bis
anilino pyrimidines. Bioorg Med Chem Lett 2003, 13, 2955-2960.
(22) Dickson, M. A.; Tap, W. D.; Keohan, M. L.; D'Angelo, S. P.; Gounder, M. M.; Antonescu, C. R.;
Landa, J.; Qin, L. X.; Rathbone, D. D.; Condy, M. M.; Ustoyev, Y.; Crago, A. M.; Singer, S.;
Schwartz, G. K. Phase II trial of the CDK4 inhibitor PD0332991 in patients with advanced
CDK4-amplified well-differentiated or dedifferentiated liposarcoma. J Clin Oncol 2013, 31,
2024-2028.
(23) Welburn, J. P.; Endicott, J. A. Inhibition of the cell cycle with chemical inhibitors: a targeted
approach. Semin Cell Dev Biol 2005, 16, 369-381.
(24) Segraves, N. L.; Robinson, S. J.; Garcia, D.; Said, S. A.; Fu, X.; Schmitz, F. J.; Pietraszkiewicz,
H.; Valeriote, F. A.; Crews, P. Comparison of fascaplysin and related alkaloids: a study of
structures, cytotoxicities, and sources. J Nat Prod 2004, 67, 783-792.
(25) Bharate, S. B.; Manda, S.; Mupparapu, N.; Battini, N.; Vishwakarma, R. A. Chemistry and
biology of fascaplysin, a potent marine-derived CDK-4 inhibitor. Mini Rev. Med. Chem. 2012,
12, 650-664.
(26) Hamilton, G. Cytotoxic effects of fascaplysin against small cell lung cancer cell lines. Mar Drugs
2014, 12, 1377-1389.
(27) Yan, X.; Chen, H.; Lu, X.; Wang, F.; Xu, W.; Jin, H.; Zhu, P. Fascaplysin exert anti-tumor effects
through apoptotic and anti-angiogenesis pathways in sarcoma mice model. Eur J Pharm Sci 2011,
43, 251-259.
Page 39 of 43
ACS Paragon Plus Environment
Journal of Medicinal Chemistry
123456789101112131415161718192021222324252627282930313233343536373839404142434445464748495051525354555657585960

40
(28) Shafiq, M. I.; Steinbrecher, T.; Schmid, R. Fascaplysin as a specific inhibitor for CDK4: insights
from molecular modelling. PLoS One 2012, 7, e42612.
(29) Cao, S.; Foster, C.; Lazo, J. S.; Kingston, D. G. Sesterterpenoids and an alkaloid from a
Thorectandra sp. as inhibitors of the phosphatase Cdc25B. Bioorg Med Chem 2005, 13, 5094-
5098.
(30) Kirsch, G.; Kong, G. M.; Wright, A. D.; Kaminsky, R. A new bioactive sesterterpene and
antiplasmodial alkaloids from the marine sponge hyrtios cf. erecta. J Nat Prod 2000, 63, 825-829.
(31) Charan, R. D.; McKee, T. C.; Boyd, M. R. Cytotoxic alkaloids from the marine sponge
Thorectandra sp. Nat Prod Res 2004, 18, 225-229.
(32) Hormann, A.; Chaudhuri, B.; Fretz, H. DNA binding properties of the marine sponge pigment
fascaplysin. Bioorg Med Chem 2001, 9, 917-921.
(33) Aubry, C.; Jenkins, P. R.; Mahale, S.; Chaudhuri, B.; Marechal, J. D.; Sutcliffe, M. J. New
fascaplysin-based CDK4-specific inhibitors: design, synthesis and biological activity. Chem
Commun (Camb) 2004, 1696-1697.
(34) Aubry, C.; Patel, A.; Mahale, S.; Chaudhuri, B.; Maréchal, J.-D.; Sutcliffe, M. J.; Jenkins, P. R.
The design and synthesis of novel 3-[2-indol-1-yl-ethyl]-1H-indole derivatives as selective
inhibitors of CDK4. Tetrahedron Lett. 2005, 46, 1423-1425.
(35) Aubry, C.; Wilson, A. J.; Jenkins, P. R.; Mahale, S.; Chaudhuri, B.; Marechal, J. D.; Sutcliffe, M.
J. Design, synthesis and biological activity of new CDK4-specific inhibitors, based on
fascaplysin. Org Biomol Chem 2006, 4, 787-801.
(36) Mahale, S.; Aubry, C.; Jenkins, P. R.; Marechal, J. D.; Sutcliffe, M. J.; Chaudhuri, B. Inhibition
of cancer cell growth by cyclin dependent kinase 4 inhibitors synthesized based on the structure
of fascaplysin. Bioorg Chem 2006, 34, 287-297.
Page 40 of 43
ACS Paragon Plus Environment
Journal of Medicinal Chemistry
123456789101112131415161718192021222324252627282930313233343536373839404142434445464748495051525354555657585960

41
(37) Mahale, S.; Aubry, C.; James Wilson, A.; Jenkins, P. R.; Marechal, J. D.; Sutcliffe, M. J.;
Chaudhuri, B. CA224, a non-planar analogue of fascaplysin, inhibits Cdk4 but not Cdk2 and
arrests cells at G0/G1 inhibiting pRB phosphorylation. Bioorg Med Chem Lett 2006, 16, 4272-
4278.
(38) Hastie, S. B. Interactions of colchicine with tubulin. Pharmacol Ther 1991, 51, 377-401.
(39) Brossi, A.; Yeh, H. J.; Chrzanowska, M.; Wolff, J.; Hamel, E.; Lin, C. M.; Quin, F.; Suffness, M.;
Silverton, J. Colchicine and its analogues: recent findings. Med Res Rev 1988, 8, 77-94.
(40) Bhattacharyya, B.; Panda, D.; Gupta, S.; Banerjee, M. Anti-mitotic activity of colchicine and the
structural basis for its interaction with tubulin. Med Res Rev 2008, 28, 155-183.
(41) Jordan, M. A.; Ojima, I.; Rosas, F.; Distefano, M.; Wilson, L.; Scambia, G.; Ferlini, C. Effects of
novel taxanes SB-T-1213 and IDN5109 on tubulin polymerization and mitosis. Chem Biol 2002,
9, 93-101.
(42) Lee, J. C.; Timasheff, S. N. In vitro reconstitution of calf brain microtubules: effects of solution
variables. Biochemistry 1977, 16, 1754-1764.
(43) Sandra, F.; Hendarmin, L.; Nakao, Y.; Nakamura, N.; Nakamura, S. Inhibition of Akt and MAPK
pathways elevated potential of TNFalpha in inducing apoptosis in ameloblastoma. Oral Oncol
2006, 42, 39-45.
(44) Jain, S. K.; Singh, S.; Khajuria, A.; Guru, S. K.; Joshi, P.; Meena, S.; Nadkarni, J. R.; Singh, A.;
Bharate, S. S.; Bhushan, S.; Bharate, S. B.; Vishwakarma, R. A. Pyrano-isochromanones as IL-6
Inhibitors: Synthesis, in Vitro and in Vivo Antiarthritic Activity. J Med Chem 2014, 57, 7085-
7097.
(45) Crespi, C. L. Microplate plate assays for inhibition of human drug metabolizing cytochrome
P450. Anal. Biochem. 1997, 248, 188-190.
Page 41 of 43
ACS Paragon Plus Environment
Journal of Medicinal Chemistry
123456789101112131415161718192021222324252627282930313233343536373839404142434445464748495051525354555657585960

42
(46) Mohammad, R. M.; Dugan, M. C.; Mohamed, A. N.; Almatchy, V. P.; Flake, T. M.; Dergham, S.
T.; Shields, A. F.; Al-Katib, A. A.; Vaitkevicius, V. K.; Sarkar, F. H. Establishment of a human
pancreatic tumor xenograft model: potential application for preclinical evaluation of novel
therapeutic agents. Pancreas 1998, 16, 19-25.
(47) Mohammad, R. M.; Mohamed, A. N.; Hamdan, M. Y.; Vo, T.; Chen, B.; Katato, K.; Abubakr, Y.
A.; Dugan, M. C.; al-Katib, A. Establishment of a human B-CLL xenograft model: utility as a
preclinical therapeutic model. Leukemia 1996, 10, 130-137.
(48) Tashiro, T.; Inaba, M.; Kobayashi, T.; Sakurai, Y.; Maruo, K.; Ohnishi, Y.; Ueyama, Y.; Nomura,
T. Responsiveness of human lung cancer/nude mouse to antitumor agents in a model using
clinically equivalent doses. Cancer Chemother Pharmacol 1989, 24, 187-192.
(49) Day, P. J.; Cleasby, A.; Tickle, I. J.; O'Reilly, M.; Coyle, J. E.; Holding, F. P.; McMenamin, R.
L.; Yon, J.; Chopra, R.; Lengauer, C.; Jhoti, H. Crystal structure of human CDK4 in complex
with a D-type cyclin. Proc Natl Acad Sci USA 2009, 106, 4166-4170.
(50) Shafiq, M. I.; Steinbrecher, T.; Schmid, R. Fascaplysin as a specific inhibitor for CDK4: insights
from molecular modelling. PLoS One 2012, 7, e42612.
(51) Jeffrey, P. D.; Russo, A. A.; Polyak, K.; Gibbs, E.; Hurwitz, J.; Massague, J.; Pavletich, N. P.
Mechanism of CDK activation revealed by the structure of a cyclinA-CDK2 complex. Nature
1995, 376, 313-320.
(52) Ravelli, R. B.; Gigant, B.; Curmi, P. A.; Jourdain, I.; Lachkar, S.; Sobel, A.; Knossow, M. Insight
into tubulin regulation from a complex with colchicine and a stathmin-like domain. Nature 2004,
428, 198-202.
Page 42 of 43
ACS Paragon Plus Environment
Journal of Medicinal Chemistry
123456789101112131415161718192021222324252627282930313233343536373839404142434445464748495051525354555657585960

43
TOC Graphic
Cl
NH
N
O
NH
N
O
Fascaplysin CA224
Cdk4/D1: IC50 = 0.41 µM
Cdk2/A: IC50 = >250 µM
EtBr displacement: 5 µM
Cdk4/D1: IC50 = 6.2 µM
Cdk2/A: IC50 = 521 µM
EtBr displacement: Does not displace
NCI-H460: IC50 = 2 µM
0
500
1000
1500
2000
2500
0 2 4 6 8 10 12
tumor volume, mg
No. of days
Anti-tumor activity of CA224 in SCID mice using human lung cancer NCI-H-460, xenografts
Control
CA224 100 mg/kg
(C)
Page 43 of 43
ACS Paragon Plus Environment
Journal of Medicinal Chemistry
123456789101112131415161718192021222324252627282930313233343536373839404142434445464748495051525354555657585960