bus rapid transit – a review
TRANSCRIPT
BUS RAPID TRANSIT (BRT) – A REVIEW
S.C.Wirasinghe, Professor
L. Kattan, Associate Professor
M.M. Rahman, Ph.D. student
J. Hubbell, Adjunct Associate Professor
R. Thilakaratne, Ph.D. student
S. Anowar, Ph.D. student
Department of Civil Engineering
Schulich School of Engineering
University of Calgary
Calgary
Alberta T2N 1N4
CANADA
1 | P a g e
1 Introduction
The success of sustainable urban transportation is based on selecting the optimal design and
service aspects of a transit system that best meet and balance the needs of both operators and
customers. A typical urban public transit planning process is concerned with providing a good
level of service at a reasonable cost to the transit operator and to the users. A good level of
service is provided by a transit system that is easily accessible in time (e.g., low waiting times)
and space (e.g., low access distances), is reliable, requires a minimal number of transfers for a
trip, and provides an affordable, safe, fast and comfortable journey with minimal environmental
impact.
A variety of transit technologies are available for public transit, ranging from several bus modes
to tram, light rail transit (LRT), commuter rail and metropolitan rail (metro) systems. There are
few strict definitions of each transit mode. Within each transit mode, the design and service
aspects may vary to produce the optimal solution for specific urban environments and service
requirements. Bus rapid transit (BRT) is a bus mode that is being increasingly used across the
world.
When greater speed or capacity is desired, there are numerous strategies that may be applied to
influence passenger throughput and travel speeds. Articulated buses with multiple doors can be
introduced, if additional capacity is required for essentially the same labor cost and bus dwell
times need to be reduced to increase the mean speed. Bus dwell times can be further reduced by
having electronic fare collection systems. The mean speed can be further increased by running
the buses in bus-only lanes on regular roads.
The most basic characteristic of BRT is that it is a bus service operated on the basis of limited
stops. When BRT is operating on separate rights of way, the system is called a busway. Though
busways operate on an all-stop mode (as opposed to limited stops), the spacing of the stops is
much larger than that of local buses. While not essential, modern BRT systems typically
incorporate the use of information and communications technology, such as bus tracking through
GPS (Global Positioning System), smart cards, traffic signal priority and electronic bus arrival
time displays on board buses and at bus stands.
The main reasons for providing a BRT system are speed and capacity, although reliability is also
usually increased. As a transit corridor evolves over time and regular all-stop type bus service
reaches its limit, the corridor can be improved considerably by superimposing limited stop
(BRT) service. BRT can have dedicated lanes on regular streets (thus reducing the capacity for
private transportation) or a busway. A metro system is in a class by itself and is needed when the
demand is expected to exceed the capacity of BRT and LRT systems and when much higher
mean speeds are warranted.
Similar to other high-frequency transit modes, BRT has been shown to be successful in attracting
high ridership from private automobile modes and to have environmental, social and economic
benefits. However, these benefits may vary widely from one urban area to another, depending on
the network characteristics, BRT characteristics, type of transit vehicles used, level of
congestion, among other factors.

2 | P a g e
The introduction of a BRT or LRT system is based on the physical characteristics of a corridor,
the current and estimated future passenger demand, and the financial capacity of the community
at specific points in time. BRT may be selected as the desired transit mode to serve a corridor or
it may be utilized as part of a corridor development strategy with higher order transit modes
considered for the future. If the characteristics of LRT and BRT are well understood and the
future demand for travel can be estimated with reasonable accuracy, the decisions regarding the
technology to be used can be made in a rational manner. Thus, it is important to review each of
these two modes in some detail.
In this paper, we review the characteristics of BRT systems. This paper covers some topics
discussed by other reviews, e.g., Deng and Nelson (2011), Miller (2009) and Federal Transit
Administration (2004), as well as several topics that have not been previously discussed. We take
no side in the BRT versus LRT debate, but attempt to review BRT characteristics in a fair
manner. LRT will be reviewed in a future paper.
2 A Brief History of BRT
It can be argued that the modern concept of bus rapid transit (BRT) was first implemented in
Curitiba, Brazil, in 1974 as Rede Integrada de Transporte (RIT), which can be translated as
Integrated Transportation Network (Weinstock et al., 2011). The success of the project inspired
the implementation of many BRT projects. There are now about 146 cities with BRT systems or
priority bus corridors around the world, serving nearly 24 million passengers per day (Global
BRT Data, 2012).
Although there has been a greater emphasis on BRT in recent years, the BRT concept is not new.
Plans and studies for various BRT-type alternatives have been prepared since the 1930s. For
instance, BRT proposals were developed for Chicago in 1937, Washington D.C. between 1956
and 1959, and St. Louis in 1959 (Weinstock et al., 2011). The concept of BRT was first
suggested in Chicago and called for conversion of three west-side rapid rail transit lines to
express bus operation on freeways with on-street distribution in the central areas and downtown
of Chicago (Harrington et al., 1937). In the years of 1955 to 1959, a Washington D.C. transit
plan included design studies for an 86-mile BRT system, of which 42 miles were to be on special
grade-separated busways (W. C. Gilman and Co., 1959).
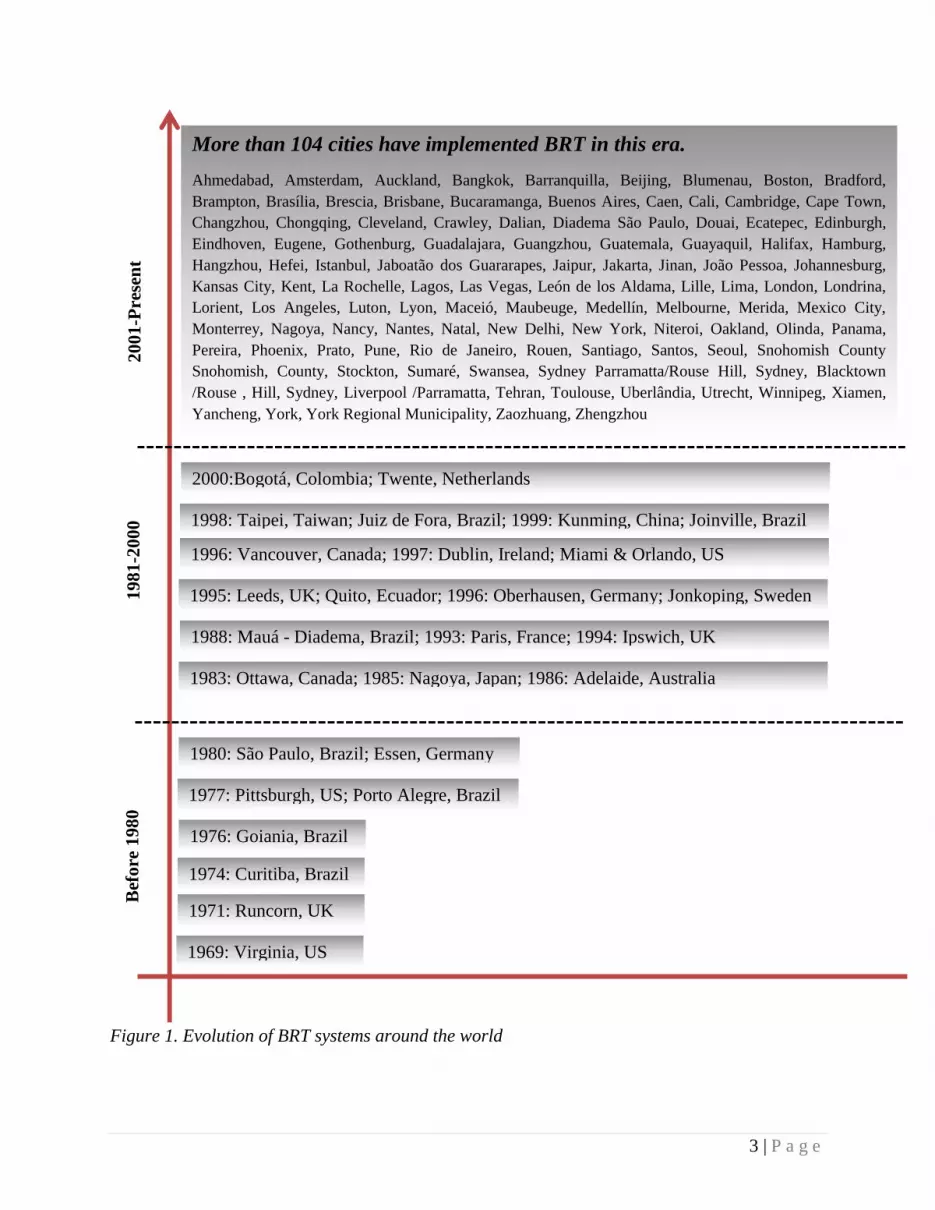
A list of cities that have implemented BRT systems are shown in Figure 1. One of the early
concept busways was placed on the Henry G. Shirley Memorial Highway in 1969 in Northern
Virginia, USA (Grava, 2003). Runcorn opened its first busway corridor (an elevated section
connecting to a retail center) in the UK in 1971. The 22-kilometer Runcorn busway played a
significant role in reshaping the urban form (Wright, 2007).
Bi-articulated buses and tube-shaped stations were successfully used in Curitiba’s BRT system
(i.e., RIT) in 1974 to expand corridor capacity. In 1980, Essen opened the first guided busway in
Germany. The Ottawa Transitway opened in 1983, constructed primarily on a railroad right of
way. It consisted of 60 kilometers of roadway, including 26 kilometers of bus-only grade-
separated roadway, with most of the remaining distance on reserved lanes (Canadian Urban
Transit Association, 2004). In Japan, the Key Route Bus System was introduced in Nagoya in
1985 to operate on an exclusive median bus lane.
3 | P a g e
Figure 1. Evolution of BRT systems around the world
Bef
ore
1980
1981-2
000
2001-P
rese
nt
1969: Virginia, US
1971: Runcorn, UK
1974: Curitiba, Brazil
1977: Pittsburgh, US; Porto Alegre, Brazil
1980: São Paulo, Brazil; Essen, Germany
1976: Goiania, Brazil
1983: Ottawa, Canada; 1985: Nagoya, Japan; 1986: Adelaide, Australia
1988: Mauá - Diadema, Brazil; 1993: Paris, France; 1994: Ipswich, UK
1995: Leeds, UK; Quito, Ecuador; 1996: Oberhausen, Germany; Jonkoping, Sweden
1996: Vancouver, Canada; 1997: Dublin, Ireland; Miami & Orlando, US
1998: Taipei, Taiwan; Juiz de Fora, Brazil; 1999: Kunming, China; Joinville, Brazil
2000:Bogotá, Colombia; Twente, Netherlands
More than 104 cities have implemented BRT in this era.
Ahmedabad, Amsterdam, Auckland, Bangkok, Barranquilla, Beijing, Blumenau, Boston, Bradford,
Brampton, Brasília, Brescia, Brisbane, Bucaramanga, Buenos Aires, Caen, Cali, Cambridge, Cape Town,
Changzhou, Chongqing, Cleveland, Crawley, Dalian, Diadema São Paulo, Douai, Ecatepec, Edinburgh,
Eindhoven, Eugene, Gothenburg, Guadalajara, Guangzhou, Guatemala, Guayaquil, Halifax, Hamburg,
Hangzhou, Hefei, Istanbul, Jaboatão dos Guararapes, Jaipur, Jakarta, Jinan, João Pessoa, Johannesburg,
Kansas City, Kent, La Rochelle, Lagos, Las Vegas, León de los Aldama, Lille, Lima, London, Londrina,
Lorient, Los Angeles, Luton, Lyon, Maceió, Maubeuge, Medellín, Melbourne, Merida, Mexico City,
Monterrey, Nagoya, Nancy, Nantes, Natal, New Delhi, New York, Niteroi, Oakland, Olinda, Panama,
Pereira, Phoenix, Prato, Pune, Rio de Janeiro, Rouen, Santiago, Santos, Seoul, Snohomish County
Snohomish, County, Stockton, Sumaré, Swansea, Sydney Parramatta/Rouse Hill, Sydney, Blacktown
/Rouse , Hill, Sydney, Liverpool /Parramatta, Tehran, Toulouse, Uberlândia, Utrecht, Winnipeg, Xiamen,
Yancheng, York, York Regional Municipality, Zaozhuang, Zhengzhou

4 | P a g e
One of the world’s longest and fastest guided busways was opened in Adelaide, Australia, in
1986 (Currie, 2006b). Australia also has some of the world’s newest systems: the Brisbane
Southeast Busway, the Brisbane Inner Northern Busway, the cross-corridor Sydney Transitways
from Parramatta to Liverpool, and the cross-corridor Sydney Transitways Parramatta to Rouse
Hill. These systems opened in 2001, 2004, 2003 and 2007, respectively.
TransMilenio of Bogotá, Columbia, which is a well-known BRT system, began operation in
2000. It is comprised of a dedicated busway, articulated buses, enhanced stations, a smart card
based fare collection system, an advanced control system and an affordable ticket price. It has
achieved impressive results in travel time savings, high passenger satisfaction, high capacity,
accident and emission reduction, and operation without a financial subsidy (Cain et al., 2007).
Los Angeles’ Metro Orange Line opened in 2005 and operates on a previously abandoned
railroad corridor. This line is an advanced-featured BRT system, designed with characteristics
similar to an LRT system, such as two dedicated lanes, automated ticket machines, fast boarding,
and park and ride facilities. In China, BRT systems have recently been deployed in many cities,
including Beijing, Changzhou, Hangzhou, Kunming, Ji’nan, Chongqing, Dalian, Xiamen, Hefei
and Zhengzhou (Deng and Nelson, 2009).
Africa’s first BRT system, BRT-Lite, opened in Lagos, Nigeria, in 2008. To provide a high-
quality transport service for the 2010 World Cup Soccer tournament, the first phase of the Rea
Vaya system opened in 2009 in Johannesburg, South Africa. To improve transport service, it
used fully segregated bus lanes with prepaid platform-level boarding stations (Institute for
Transportation and Development Policy, 2007; Walters, 2008).
BRT has now become a worldwide phenomenon; its current operation area around the world is
shown in Figure 2 and Table 1.
Weinstock et al. (2011) have developed a tiered scoring scheme, the BRT Standard, aimed at
ranking the performance of BRT systems. The BRT Standard allows BRT systems to be
classified into three categories – gold, silver and bronze – that roughly reflect passenger travel
time and quality of the service, based on speed and capacity and other indicators. Table 2 shows
the criteria and weightings that were adopted as the BRT Standard according by the Institute for
Transportation and Development Policy (ITDP). A total score of 85 or above classifies a BRT
system as gold, a score of 70 to 84 as silver, and a score of 50 to 69 as bronze. ITDP reported the
four highest ranking international BRT systems:
Gold: Bogotá (93), Guangzhou (89)
Silver: Johannesburg (79), Ahmedabad (76)
In the last decade, excellent BRT systems have rapidly emerged around the world, demonstrating
that BRT can provide levels of speed and capacity comparable, in some cases, to some rail
systems (Weinstock et al., 2011).

5 | P a g e
Figure 2. BRT systems around the world [Source: http://www.itdp.org]
Table 1. Global overview of the current BRT systems [Source: Global BRT Data, 2012]
Regions Passengers / Day Number of Cities Length (km)
Africa 238,000 3 62
Asia 6,255,872 25 890
Europe 936,970 42 632
Latin America 15,067,311 49 1,183
North America 849,286 20 563
Oceania 327,074 7 328
Nigeria

6 | P a g e
Table 2. Definition of the BRT standard [Source: Weinstock et al., 2011]
Item Max. Score
SERVICE PLANNING
Off-vehicle fare collection 7
Multiple routes use same BRT infrastructure 4
Peak period frequency 4
Routes in top 10 demand corridors 4
Integrated fare collection with other public transport 3
Limited and local stop services 3
Off-peak frequency 3
Part of (planned) multi-corridor BRT network 3
Performance-based contracting for operators 3
Enforcement of right-of-way 2
Operates late nights and weekends 2
Operational control system to reduce bus bunching 2
Peak-period pricing 2
STATION DESIGN AND STATION-BUS INTERFACE
Platform-level boarding 5
Buses have 3+ doors on articulated buses or 2+ very wide doors on standard buses 4
Multiple docking bays and sub-stops 3
INFRASTRUCTURE
Bus lanes in central verge of the road 7
Physically separated right-of-way 7
Intersection treatments (elimination of turns across busways and signal priority) 4
Physically separated passing lanes at station stops 4
Stations occupy former road/median space (not sidewalk space) 3
Stations set back from intersections (100 feet min.) 3
Stations are in center and shared by both directions of service 2
QUALITY OF SERVICE AND PASSENGER INFORMATION SYSTEMS
Branding of vehicles and system 3
Safe, wide, weather-protected stations with artwork (≥ 8 feet wide) 3
Passenger information at stops and on vehicles 2
INTEGRATION AND ACCESS
Bicycle lanes in corridor 2
Bicycle sharing systems at BRT stations 2
Improved safe and attractive pedestrian access system and corridor environment 2
Secure bicycle parking at station stops 2

7 | P a g e
3 Elements of BRT System
BRT is considered an innovative and unique transit solution, because of the way it combines
various facilities, services, amenities and technologies to create a higher quality of service. An
in-depth understanding of the key characteristics of various BRT elements is crucial for planners,
designers and developers. Diaz and Schneck (2000) indicated the following six major elements
comprise a BRT system:
Running ways / guide ways
Vehicles
Stations
Fare collection systems
Operations control systems
Passenger information systems
The following subsections provide a detailed discussion of these elements.
3.1 Running Ways / Guide Ways
Running ways / guide ways are a BRT system’s central elements and its infrastructural
foundation (Levinson et al., 2003a). Although running ways for BRT can range from mixed
traffic operations to fully grade-separated busways, these can be broadly categorized into three
types: on-street, on-freeway and off-street (Xu and Zheng, 2012). On-street and on-freeway
running ways include mixed traffic lanes, curb bus lanes, median bus lanes and bus-only streets.
Off-street facilities are comprised of at-grade busways, bus tunnels and bridges. Several pros and
cons are associated with each type of running way, and different types have been adopted in
different parts of the world. For instance, it has been observed that providing separate or
segregated running ways for BRT is a common practice in North America, while median arterial
bus ways are widely used in South America (Levinson et al., 2003b).
BRT systems often operate in mixed traffic flow where geometric, traffic, land use,
environmental or cost constraints can prevent implementation of fully dedicated bidirectional
busways or bus lanes in residential locations. The advantages of operating in mixed traffic are
low costs and quick implementation with minimum construction efforts. However, right-of-way
constraints and traffic can result in reduced speeds and service reliability.
There are wide ranges of site-specific improvements that can help reduce operational delays:
bidirectional lanes, reversible lanes and peak-hour-only exclusive lanes (Levinson et al., 2003a).
Conceptually, a bidirectional BRT lane is an exclusive single lane in which BRT vehicles are
allowed to pass through a constrained section. If another BRT vehicle is approaching from the
opposite direction, it has to wait at a station or designated bypass area until the other vehicle has
cleared the section. The associated signal system needs to be carefully designed to ensure that
only one BRT vehicle occupies the constrained section at a time. In a recent study, Iswalt et al.
(2011) found that a bidirectional lane can generate significant operating benefits for BRT
vehicles and, at the same time, result in travel time savings for other modes and general traffic as
well.

8 | P a g e
Reversible bus lane systems are similar to the bidirectional lanes. The direction of movement of
the BRT vehicles depends on the direction of the peak hour traffic. Thus, BRT vehicles can be
separated from peak period traffic and provided with priority. In other words, during a particular
peak period, the BRT vehicles operate contraflow on a separate lane in the off-peak direction.
The restriction of a curbside general-purpose lane or parking lanes for the operation of BRT
vehicles during the morning and evening rush hour traffic periods is another type of running
way. Dedicated curb bus lanes are commonly used in central business districts and can operate at
all times of the day. They are easier and less costly to implement, because only pavement
markings and traffic signs are required. Other positive aspects of curb bus lanes are that they
provide good pedestrian access and are more convenient to integrate with turns at intersections.
Dedicated curb bus lanes can be categorized into three types: concurrent or normal flow curb bus
lanes, concurrent flow inside bus lanes, and contraflow curb bus lanes. The implementation of
concurrent flow curb bus lanes is generally considered when other on-street BRT service options
are not feasible. They are easy to implement and can operate during any time of the day. In order
to eliminate the conflict between BRT vehicles and illegally parked vehicles along the curb,
concurrent flow inside BRT lanes can be provided. These lanes are located adjacent to the curb
parking lanes and thus allow curbside parking.
Contraflow lanes allow BRT vehicles to operate in the opposite direction of normal traffic flow.
These types of guide ways are usually implemented on one-way streets and are self-enforcing.
However, the conflicting direction of vehicular movements is confusing for pedestrians and may
create safety hazards for pedestrians. Additionally, curb side lanes appear to be less effective in
reducing travel times, due to frequent interference from general traffic, especially if right turns
are allowed (Xu and Zheng, 2012).
Typically, median bus lanes are located in the center of the existing roadway and the direction of
travel would depend on the travel environment and available space. The station platforms can be
located in the centre or on the side. One of the primary benefits of such system is reduced
construction costs, due to the utilization of existing medians (Rathwell and King, 2011).
Moreover, the separation between transit and general traffic lanes can be accomplished through
painted lines, rumble strips and/or mountable curbs. However, this type of running way is hard to
enforce, due to continuous access.
Bus-only streets separate BRT from the general traffic and are warranted when there are higher
bus volumes. One major advantage of this system is that it is easy to enforce. This design may
also provide improved walking and movement space for pedestrians as well as waiting space for
passengers. The removal of BRT vehicles from general traffic not only enhances the system’s
identity, but also improves the ambience of the surrounding area (Miller, 2009). General traffic
may be moved to parallel streets.
All off-street running ways provide a physical separation of the BRT system from normal traffic.
As a result, they allow for a faster travel speed of buses and minimize interference from and
conflicts with general traffic. Therefore, these facilities not only enhance the efficiency of the
system, but also provide a strong sense of the system’s identity. For instance, Chen et al. (2007)
found that simultaneous application of exclusive bus lanes and signal priority effectively
improves the operational performance of a BRT system. High capital cost and extended
9 | P a g e
construction periods are two disadvantages of these guide ways. However, once the
infrastructure is developed and the ridership is formed, these facilities may provide an
opportunity for future conversion to rail or other fixed guide ways.
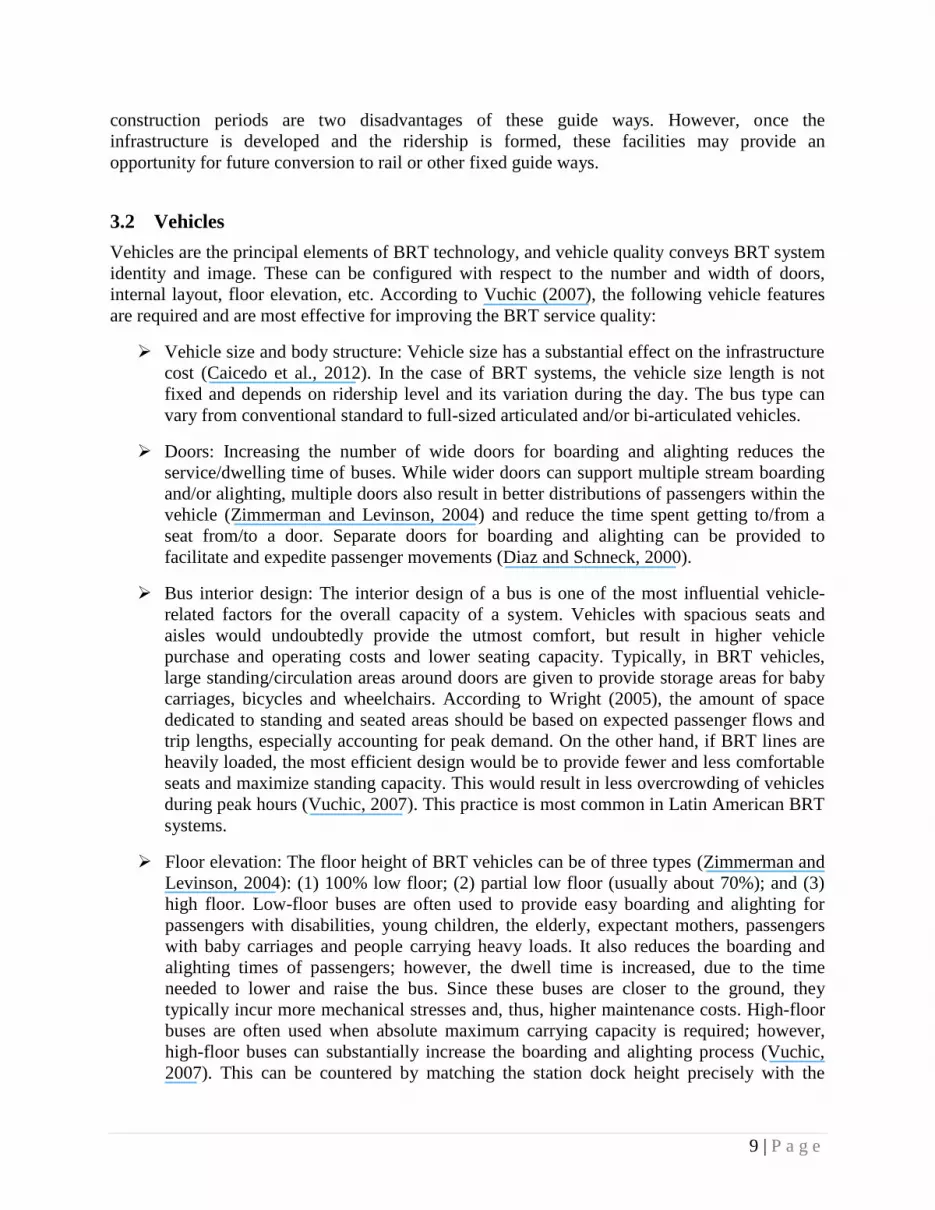
3.2 Vehicles
Vehicles are the principal elements of BRT technology, and vehicle quality conveys BRT system
identity and image. These can be configured with respect to the number and width of doors,
internal layout, floor elevation, etc. According to Vuchic (2007), the following vehicle features
are required and are most effective for improving the BRT service quality:
Vehicle size and body structure: Vehicle size has a substantial effect on the infrastructure
cost (Caicedo et al., 2012). In the case of BRT systems, the vehicle size length is not
fixed and depends on ridership level and its variation during the day. The bus type can
vary from conventional standard to full-sized articulated and/or bi-articulated vehicles.
Doors: Increasing the number of wide doors for boarding and alighting reduces the
service/dwelling time of buses. While wider doors can support multiple stream boarding
and/or alighting, multiple doors also result in better distributions of passengers within the
vehicle (Zimmerman and Levinson, 2004) and reduce the time spent getting to/from a
seat from/to a door. Separate doors for boarding and alighting can be provided to
facilitate and expedite passenger movements (Diaz and Schneck, 2000).
Bus interior design: The interior design of a bus is one of the most influential vehicle-
related factors for the overall capacity of a system. Vehicles with spacious seats and
aisles would undoubtedly provide the utmost comfort, but result in higher vehicle
purchase and operating costs and lower seating capacity. Typically, in BRT vehicles,
large standing/circulation areas around doors are given to provide storage areas for baby
carriages, bicycles and wheelchairs. According to Wright (2005), the amount of space
dedicated to standing and seated areas should be based on expected passenger flows and
trip lengths, especially accounting for peak demand. On the other hand, if BRT lines are
heavily loaded, the most efficient design would be to provide fewer and less comfortable
seats and maximize standing capacity. This would result in less overcrowding of vehicles
during peak hours (Vuchic, 2007). This practice is most common in Latin American BRT
systems.
Floor elevation: The floor height of BRT vehicles can be of three types (Zimmerman and
Levinson, 2004): (1) 100% low floor; (2) partial low floor (usually about 70%); and (3)
high floor. Low-floor buses are often used to provide easy boarding and alighting for
passengers with disabilities, young children, the elderly, expectant mothers, passengers
with baby carriages and people carrying heavy loads. It also reduces the boarding and
alighting times of passengers; however, the dwell time is increased, due to the time
needed to lower and raise the bus. Since these buses are closer to the ground, they
typically incur more mechanical stresses and, thus, higher maintenance costs. High-floor
buses are often used when absolute maximum carrying capacity is required; however,
high-floor buses can substantially increase the boarding and alighting process (Vuchic,
2007). This can be countered by matching the station dock height precisely with the

10 | P a g e
vehicle floor height. According to Diaz and Schneck (2000), the most common strategy
to improve speed, reliability and user-friendliness is the matching of the boarding
platform height to the vehicle floor height by raising the platform to meet a high-platform
bus, such as the BRT systems in Curitiba and Sao Paulo, Brazil, and Quito, Ecuador.
Vehicle propulsion: Vehicle propulsion systems range from diesel powered buses to more
recent alternative fuel applications, such as electric power and fuel cells. Cleaner and
quieter operation of BRT vehicles enhances the overall image of the system and results in
greater environmental benefits.
Vehicle form and aesthetics: Vehicles of distinctive design, aesthetic features and color
schemes should be used to make the system more inviting and appealing to potential
users.
Wi-Fi: Wi-Fi service can be provided both on-board of BRT vehicles and at BRT
stations. It can be provided either free of charge, for a fixed fee or pay per use.
Passengers can utilize their commuting/in-vehicle travel time for entertainment or work,
which may make their transit travel more enjoyable or productive and, at the same time,
decrease their perceived travel time. Wi-Fi is not a critically important element; however,
it is an example of a high-quality customer amenity that can promote the BRT image,
create additional appeal to the customers and be a significant symbol of BRT brand
identity (APTA, 2010).
3.3 Stations
Successful BRT systems are largely dependent on the location, spacing and design of their
stations, which serve as the links between the systems and their customers. BRT station
characteristics include length, platform height, fare collection practices and amenities provided
for passengers (Vuchic, 2007). These may vary from system to system.
Stations can be located on streets, adjacent to busways or expressways or in off-street transit
centres that can serve more than one transit route. The station location needs to be coordinated
with the adjacent urban development. Moreover, the appearance of the station should be
distinctive and consistent with the appearance of the BRT vehicles to promote brand identity. For
example, in Curitiba, the stations are tube-shaped, made of glass and steel, allowing them to be
transparent and have the capability of accommodating a full busload of passengers.
Consideration should also be given to passengers with reduced mobility by providing a
wheelchair lift (Grava, 2003). For the TransJakarta system, the BRT stations are connected to the
sidewalk by a pedestrian bridge and ramps to facilitate the movement of wheelchairs (Ernst,
2005). Other passenger amenities may include newspaper boxes, drink and fare vending
machines, trash containers, heating, cooling and public telephones. Electronic signs indicating
bus arrival times are also very important features. In order to ensure passenger safety and
security, both actual and perceived, emergency telephones and alarms should also be provided.
In short, BRT stations should provide more comfort and amenities for passengers than standard
bus stops.
11 | P a g e
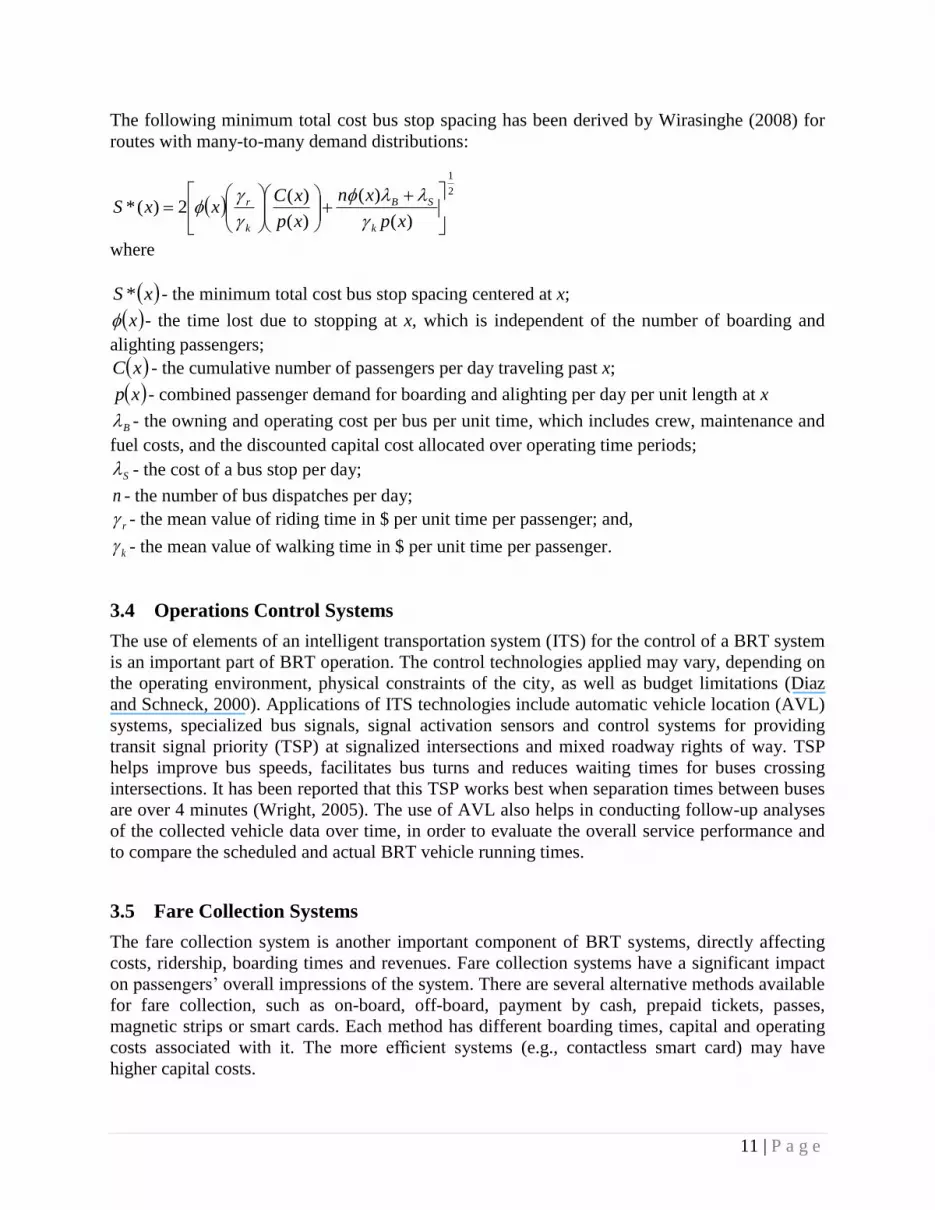
The following minimum total cost bus stop spacing has been derived by Wirasinghe (2008) for
routes with many-to-many demand distributions:
2
1
)(
)(
)(
)(2)(*
xp
xn
xp
xCxxS
k
SB
k
r
where
xS * - the minimum total cost bus stop spacing centered at x;
x - the time lost due to stopping at x, which is independent of the number of boarding and
alighting passengers;
xC - the cumulative number of passengers per day traveling past x;
xp - combined passenger demand for boarding and alighting per day per unit length at x
B - the owning and operating cost per bus per unit time, which includes crew, maintenance and
fuel costs, and the discounted capital cost allocated over operating time periods;
S - the cost of a bus stop per day;
n - the number of bus dispatches per day;
r - the mean value of riding time in $ per unit time per passenger; and,
k - the mean value of walking time in $ per unit time per passenger.
3.4 Operations Control Systems
The use of elements of an intelligent transportation system (ITS) for the control of a BRT system
is an important part of BRT operation. The control technologies applied may vary, depending on
the operating environment, physical constraints of the city, as well as budget limitations (Diaz
and Schneck, 2000). Applications of ITS technologies include automatic vehicle location (AVL)
systems, specialized bus signals, signal activation sensors and control systems for providing
transit signal priority (TSP) at signalized intersections and mixed roadway rights of way. TSP
helps improve bus speeds, facilitates bus turns and reduces waiting times for buses crossing
intersections. It has been reported that this TSP works best when separation times between buses
are over 4 minutes (Wright, 2005). The use of AVL also helps in conducting follow-up analyses
of the collected vehicle data over time, in order to evaluate the overall service performance and
to compare the scheduled and actual BRT vehicle running times.
3.5 Fare Collection Systems
The fare collection system is another important component of BRT systems, directly affecting
costs, ridership, boarding times and revenues. Fare collection systems have a significant impact
on passengers’ overall impressions of the system. There are several alternative methods available
for fare collection, such as on-board, off-board, payment by cash, prepaid tickets, passes,
magnetic strips or smart cards. Each method has different boarding times, capital and operating
costs associated with it. The more efficient systems (e.g., contactless smart card) may have
higher capital costs.

12 | P a g e
Among the different options, off-board fare collection is desirable, because it is more convenient
for customers. It permits multiple-door and/or all-door boarding, thereby reducing station dwell
times and bus operating costs and expediting passenger flows (Levinson et al., 2002). Goodman
et al. (2005) reported that, in the case of the Curitiba BRT system, same-level bus boarding
combined with preboarding fare payment result in a typical dwell time of no more than 15 to 19
seconds at a stop, although that may increase with higher passenger flows. Tirachini and Hensher
(2011) found that off-board fare payment is the most cost-effective system, particularly when the
demand is high.
Some on-board fare collection mechanisms, however, can also support multiple-door boarding,
but they must be carefully selected. Smart card technology can be applied at multiple doors to
help facilitate simultaneous on-board fare payment and multiple-door boarding without
increasing revenue shrinkage (Levinson et al., 2002). Smart card data combined with AVL data
also provide an accurate and valuable database that can be used to monitor the online and offline
performance of a BRT system, including schedule adherence, dwell time, transit origin
destination, ridership, passenger transit times and passenger kilometers driven. These data are
valuable for ridership analyses and planning and operation of transit systems.
3.6 Passenger Information System
Efficient, accurate and easily accessible passenger information technologies are important to
enhancing the overall user-friendliness and attractiveness of the system and riders’ perceptions of
the quality of service (Rahman et al., 2012b). For example, it has been reported that real-time
information, especially the at-stop variable-message displays regarding bus arrival times,
significantly influences passengers’ decisions to use the BRT service (Rahman, 2011a; Dziekan
and Kottenhoff, 2007). Thus, these are critically important characteristics of a BRT system.
Transit information for passengers can take many forms, including information before, during
and at the termination of the trip. The main sources of information that need to be provided are
route guidance and schedule details that can be accessed via telephone and/or Internet before
making a trip to help with trip planning; real-time information of upcoming bus arrivals and
service disruption alerts at stations or other points prior to boarding a transit vehicle; periodic
location information, time to next stop, next-stop announcements and possible transfer
connections during the trip. The provision of real-time at-stop information displays significantly
reduce uncertainties in transit arrival times and perceived waiting times at a transit stop (Dziekan
and Vermeulen, 2006; Lehtonen and Kulmala, 2002; Nijkamp et al., 1996).
The term BRT refers to the integration of all the above components forming one functional
system; however, the mix of elements depends on the local market and attributes, operational and
physical environments, and the availability of resources (Hidalgo and Graftieaux, 2008). The
options available for the various BRT components are extensive and lead to a large variety of
integrated systems so that no two are the same, even within different metropolitan areas of a
region (Federal Transit Administration (FTA), 2004).
The performance of BRT system can be described in terms of speed, capacity, reliability,
accessibility and safety.
13 | P a g e
3.7 Speed
The speed of a BRT line is influenced by stop spacing, TSP measures and the design of the rights
of way. The spacing of stops has a measurable impact on the BRT system’s operating speed and
passengers travel time. Since a BRT system concentrates passengers at limited stops, passengers
typically travel longer distances than conventional bus passengers. BRT vehicles stop and
encounter delays at fewer locations along the route and sustain higher mean travel speeds.
TSP technologies deployed with BRT systems can be used to extend or advance green times or
swap left turns to allow buses that are behind schedule to get back on schedule, improving
schedule adherence, reliability and speed. The combined presence of an exclusive right of way
and TSP for at-grade traffic are the most effective ways to increase bus travel speeds, allowing
BRT systems to compete with most heavy rail and exclusive right-of-way light rail systems
(TCRP, 2003; FTA, 2004). Dedicated transit ways / busways, limited-stop / express services, and
exclusive bus lanes / freeways have become part of BRT systems, significantly enhancing
performance. Higher speeds help compensate for the increased amount of time required to walk,
take transit or drive to BRT stations.
3.8 Capacity
Transit capacity is defined in terms of either passengers or transit vehicles. Passenger capacity
refers to the maximum number of seated and standing passengers (capacity in passengers per
hour per direction) that a BRT system can safely and comfortably accommodate. Transit vehicle
capacity is expressed as the maximum number of transit vehicles (capacity in vehicles per hour
per direction) that can be moved past a point by a BRT system. In practice, the operator of a
BRT system attempts to provide capacity for the required passenger demand. However, when
passenger demand is not accommodated, many service qualities of the BRT line (e.g., operating
speed, comfort and reliability) may be negatively affected. Therefore, ensuring adequate capacity
for BRT systems is important.
There are three key elements that determine BRT system capacity: BRT vehicle (passenger)
capacity; BRT station (vehicle and passenger) capacity; and, BRT running way (vehicle)
capacity. Limitations in any one of these elements constrain the throughput of the total BRT
system.
The characteristics of the BRT system running ways and station capacities mainly govern the
vehicle capacity. For both running ways and stations, capacity is enhanced by either operating
strategies or design elements that increase the speed and capacity of the system. Examples of
such design elements imply investment in infrastructure, such as the use of multiple running way
lanes, larger vehicles and larger stations. On the other hand, operating strategies that reduce
delays and improve the service rate of the system include traffic prioritization systems, access
control and strategies to reduce dwell time (FTA, 2004; Thilakaratne et al., 2011).
Capacity is also a function of the desired level of service (LOS) of a BRT system. The
parameters affecting LOS include: (1) availability of service (dispatch rate, headway and
coverage); (2) level of comfort (standee density); (3) travel time; and, (4) Reliability. An
illustration of various concepts of capacity is presented in Figure 3. The dispatch rate of service
and the size of the actual vehicles are the main determinants of actual operating capacity.

14 | P a g e
In general, BRT systems start their operation at a lower frequency or with smaller vehicles than
the system can accommodate, as often the initial passenger demand does not require the
maximum capacity of the system. As the demand varies during the service span, the frequency
and vehicle size are adjusted to meet demand and take advantage of any unused capacity (FTA,
2004; Thilakaratne et al., 2011).
Figure 3. Relationship between aspects of capacity [Source: FTA, 2004]
Table 3. The Best and Most Familiar Closest Fits for capacity and speed of BRT
[Source: Thilakaratne et al., 2011]
Bus Rapid Transit The Best Fit
(Chi-Squared Value)
The Most Familiar Closest Fit
(Chi-Squared Value)
Average Observed
route capacity Weibull (0.49) Normal (1.24)
Average Speed Burr (0.50) Beta (1.43)
Standard probability distribution functions of the speed and flow data can be examined (Table 3).
For example, the histograms for the average speed and observed route capacity of the BRT are
shown in Figures 4 and 5, respectively. The blue and red color functions represent the best and
Maximum Capacity
Design Capacity
Operated Capacity
Early Morning AM Peak Midday PM Peak Night
Per
son C
apac
ity (
Pas
sen
ger
s/H
our)

15 | P a g e
the most familiar probability distributions in terms of closest fits, respectively (Thilakaratne,
2011).
Figure 4. Histogram for the average speed of a BRT system (Source: Thilakaratne, 2011)
Figure 5. Histogram for the observed route capacity of a BRT system (Source: Thilakaratne,
2011)
The mean and standard deviation of the average speed and average observed maximum
directional passenger flow were 18 and 4 (km/h) and 7669 and 4359 (passengers per hour per
direction, pphpd), respectively. The wide variations in the speed and line capacity data were due
to the significant effects of other factors (discussed in Section 3), which were not considered in
this analysis. Figures 6 and 7 illustrate the average speed and observed minimum and maximum
capacities of various modes, respectively, in ascending order from regular line (local) bus to
metro to compare the relative performance of BRT systems (Thilakaratne et al., 2011). It can be
seen that BRT and busways when considered together have performance characteristics similar
to LRT, in terms of both speed and capacity.
Probability Density Function
Histogram Normal Weibull (3P)
x
1400012000100008000600040002000
f(x)
0.28
0.24
0.2
0.16
0.12
0.08
0.04
0
Average Speed (kph)
Pro
bab
ilit
y d
ensi
ty v
alu
e
Probability Density Function
Histogram Beta Burr (4P)
x
40353025201510
f(x)
0.4
0.35
0.3
0.25
0.2
0.15
0.1
0.05
0Pro
bab
ilit
y d
ensi
ty v
alu
e
Observed maximum flow (pphpd)

16 | P a g e
Figure 6. Average speed by mode [Source: Thilakaratne et al., 2011]
Figure 7. Observed minimum and maximum passenger capacities by mode (Source: Thilakaratne
et al., 2011)
3.9 Reliability
Passengers are more likely to use a transit service that is highly reliable. Passengers may switch
to other transportation choices if a transit service does not consistently provide the expected
levels of service. There are many features that can improve BRT reliability. The three main
aspects of reliability are running time reliability (ability to maintain consistent travel times),
station dwell time reliability (ability for patrons to board and alight within a set time frame) and
Ob
serv
ed M
in/M
ax P
erso
n C
apac
ity
(Pas
sen
gers
/Ho
ur/
Dir
ecti
on
)
Reg_Bus Exp_Bus BRT Busway LRT Metro
17 | P a g e
service reliability (availability of consistent service) (TCRP, 2003; FTA, 2004). The first two
aspects “relate to ability of the system to meet a schedule or a specified travel time consistently,
while service reliability captures the characteristics of the system that contribute to passengers
perception of service availability and dependability” (FTA, 2004).
In addition to the above factors, there still can be wide variations in overall reliability, since BRT
service (like other transit modes) can be affected by external sources of uncertainty, such as
traffic conditions, vehicle breakdowns due to unforeseen mechanical or non-mechanical
problems, traffic signals, route length, recovery times built into the route schedules, number of
stops, evenness of passenger demand, and the frequency of request of the use of wheelchair
lifts/ramps if present (Wirasinghe, 1993; Wirasinghe and Liu, 1995a, 1995b; Liu et al., 2003;
FTA, 2004; Vuchic, 2007; Rahman et al., 2010; Rahman et al., 2011b).
The reliability of a BRT system can be improved by making some of the stops time-points. In the
case of busways, which are similar to LRT systems, each stop can be a time-point. Wirasinghe
and Liu (1995a) suggested a dynamic programming method for determining the optimal number
of time-points and travel time schedules for the case of high headways when buses can be
assumed to be independent of prior buses.
3.10 Accessibility and Safety Improvement
Accessibility to BRT vehicles and circulation within vehicles are governed by several features,
which can significant impacts on dwell time, capacity, passenger comfort, and community and
rider acceptance of a BRT system (TCRP, 2003; FTA, 2004). These features are seat layout
(increases in aisle width within the vehicle increase the standing capacity of the vehicle as well
as providing additional space for passenger circulation), additional door channels (facilitate the
boarding process by allowing multiple queues of passengers to enter the BRT vehicle at one
time), and enhanced wheelchair securement (reduces the amount of time to secure wheelchairs in
bus operation) (FTA, 2004).
The level and frequency of accidents and injuries experienced by passengers and employees of
the transit system is a measure of safety. Nevertheless, collisions involving buses are a serious
safety concern, due to their size and operational and occupancy characteristics (Rahman et al.,
2012). The level of safety managed by a transit agency is defined with two performance
measures: accident rates (per service hours or service miles) and public perception of safety. The
public perception of safety is often measured using passenger surveys or information gathered
from customer feedback (FTA, 2004).
In general, BRT systems have high safety and security levels, resulting from high service
frequencies that reduce perceived vulnerability at stations, separated rights of way (BRTs run on
dedicated lanes) that reduce hazards and conflict with other vehicles, low floors that decrease
tripping hazards, electronic fare collection that limits passenger vulnerability during cash
transactions and advanced camera technologies that facilitate active management of the BRT
system, deterring crime and enabling responses to incidents (FTA, 2004; Vuchic, 2007).

18 | P a g e
4 Users’ Perception and Modal Shift
The ability of BRT to provide high-quality transit service results in high user satisfaction. This
increase in transit quality was shown to lead to modal shifts from private vehicle to transit, as
identified in several studies conducted in a number of cities in Asia and North and South
America (Rabinovitch and Hoehn, 1995; Deng and Nelson, 2010a).
A recent passenger survey from Beijing’s Southern Axis BRT Line 1 showed that BRT has
gained great popularity among passengers. It was also reported that the majority of passengers
are work-related commuters and use BRT more than once a day. Captive users had even higher
satisfaction than choice users, in terms of reliability, comfort and cleanliness, and overall
satisfaction (Deng and Nelson, 2012a). Another study (Deng and Nelson, 2010a) indicated that
BRT was a competitive alternative to private vehicles, especially during the rush hour. Although
they had a car alternative for the journey, 12.4% of the passengers still chose to use the BRT
system.
Cain et al. (2009) conducted an attitudinal survey of 2400 transit users and non-users in the Los
Angeles area to quantify the importance of the image of the BRT system. This survey used a set
of factors to categorize the perceived differences among BRT, LRT and metro. It was revealed
that the public had a good perception of the BRT service. The Orange Line (BRT) attained
ratings akin to the Gold Line (LRT), in terms of both tangible and intangible factors. From the
survey results, it was concluded that a BRT system could compete with an LRT system, at least
based on public perception. A survey conducted by Callaghan and Vincent (2007) found that the
Orange Line successfully attracted choice users, with 18% of riders switching from private car to
BRT. Although more than a third of passengers had a car available for their trip, 79% of
passengers accessed the BRT stations by transit rather than car.
A survey of commuters traveling on New Delhi’s BRT corridor was conducted by the Centre for
Science and Environment, Delhi Greens and the Indian Youth Climate Network (2008). It was
found that 83% of commuters were pleased with the dedicated BRT lanes and believed that the
BRT system should continue operating. If the BRT system had an extensive network and
connected with the metro, 26% of car and two-wheeler commuters were willing to shift from
their current transport mode to BRT. It has been argued that Janmarg, India’s first advanced-
featured BRT service with median stations, level boarding and central control, which opened in
Ahmedabad in 2009, had the potential to help revive the image of public transport in India
(Institute for Transportation and Development Policy, 2009).
A user survey piloted in Dartford and Gravesham, UK, by Fastrack Delivery Executive (2006)
revealed that 19% of passengers previously using a car shifted to the BRT system; and, 95% of
customers graded the overall Fastrack experience as excellent or good. This system achieved a
high level of customer satisfaction with travel demand 50% above forecasted levels.
Another survey in Curitiba, Brazil, indicated that 25% of the commuters who previously used a
private car had switched to the BRT system, although it has one of the highest car ownership
rates in Brazil (Rabinovitch and Hoehn, 1995).
The U.S. Federal Transit Administration (2004) reported that there have been significant
increases in transit ridership in virtually all of the corridors where BRT has been implemented:

19 | P a g e
ridership gains of between 5 and 25% were common. The significantly higher gain of 85% on
Boston’s Silver Line represents the potential for BRT systems.
5 Social, Environmental and Economic Impacts of BRT
BRT systems are often associated with positive environmental, social and economic benefits.
BRT is shown to have a powerful influence in attracting new economic development and
sustainable growth along its corridor and around its stations (Munoz-Raskin, 2010; Rodríguez
and Mojica, 2009; Rodríguez and Targa, 2004; Cervero and Kang, 2011). BRT stations often
facilitate transit-oriented development (TOD) with increased residential and business densities
(Currie, 2006a), a diversity of land uses and, thus, shorter distances to trip destinations. TOD
results in improved accessibility to employment and other service opportunities.
As discussed in Section 4, the improved comfort, convenience and travel time savings of BRT,
compared to regular bus service, may induce a modal shift from private car to a BRT system,
leading to short- and medium-term traffic reduction along the BRT corridor, which in turn leads
to reduced air pollution and lower greenhouse gas emissions. The likely reduction in vehicular
traffic also results in improved road safety.
Wright (2007) reported that, when measured in terms of economic, environmental and social
benefits, BRT’s track record provides a compelling case for more cities to consider BRT as a
transit priority. Table 4 outlines some of the direct benefits that BRT has provided to developing
cities.
Most of the existing literature on the assessment of the impact of BRT has been focused on
developing countries, with few findings related to developed countries. In the following
subsections, some of the findings regarding environmental, economic and social benefits of BRT
are examined. These impacts are shown to differ from one city to another, depending on the
network characteristics, congestion levels, BRT characteristics and the modal shares before and
after the implementation of a BRT system.
5.1 Environmental Impacts
Like other successful transit services, BRT has a major role to play in reducing the impact of air
pollution from transportation sources. The factors contributing to these improvements are mainly
the decrease in the number of vehicles in the BRT corridor, resulting from a shift in modal share
from auto users to BRT and the selection of alternative fuels, propulsion systems and pollutant
emission controls that are usually used by BRT systems (Federal Transit Administration, 2004).
In addition, transit agencies may serve passengers with fewer hours of vehicle operation,
potentially reducing emissions.
The level of reported improvements depend on many factors, such as the resulting percentages of
modal shift, traffic improvement, travel time savings for both transit users and general traffic, the
type of transit vehicle used for BRT operation, and the extent of reductions in time exposure to
pollution.
Vincent et al. (2012) reviewed the environmental benefits of the BRT systems in México City,

20 | P a g e
México, Guangzhou, China, and Bogotá, Colombia. They showed a 61.8% reduction in CO2 and
a 50% reduction in diesel consumption compared with operation prior to the implementation of a
BRT system. In Bogotá, Echeverry et al. (2004) reported a drop in particulate matter pollution in
some parts of the city by up to 9%.
Table 4. Benefits of BRT [Source: Wright, 2007]
Benefits Description
Economic
Reduced travel times More reliable product deliveries Increased economic productivity Increased employment Improved work conditions
Social More equitable access throughout the city Reduced accidents and illness Increased civic pride and sense of community
Environmental Reduced emissions of pollutants related to human health (i.e.
CO, SOx, NOx, particulates, CO2) Reduced noise levels
Urban form
More sustainable urban form, including densification of major
corridors Reduced cost of delivering services, such as electricity,
sanitation, and water
Political
Delivery of mass transit system within one political term Delivery of high-quality resource that will produce positive
results for virtually all voting groups
Wöhrnschimmel et al. 2008, analyzed commuters’ exposure to carbon monoxide (CO),
particulate matter (PM) and benzene. Data was collected both before and after the
implementation of a BRT system along a 20-kilometer corridor in Mexico. The pollutants were
measured inside the buses and mini buses during the morning commute. The results showed a
significant reduction of CO (25-45%), benzene (54-69%), and PM2.5 (20-30%). It was also
suggested that the resulting lower commuting times further reduced total commuters’ exposures
to the pollutants. However, no significant reduction in PM10 exposure was observed.
Nugroho et al. (2011) estimated the impact of BRT on the concentration of secondary pollutants
in the roadside areas near transit corridors in Jakarta, Indonesia. The analysis was based on field
data collected at five continuous ambient air quality monitoring stations located near
TransJakarta BRT corridors in 2005. The introduction of the BRT system and the modal shift it
produced were shown to have a greater influence on rapidly decaying pollutants, such as PM10,
than on ozone. However, no clear improvement in the ozone concentration could be attributed to
the BRT system.
A North American study that examined the environmental impact of BRT was conducted by

21 | P a g e
Vincent and Callaghan (2006). It focused on estimating the potential reduction in CO2 that would
result from a BRT system for commute trips in a typical North American city. Three scenarios
were analyzed: a no-build scenario; an LRT scenario; and, a BRT system using 40- or 60-ft low-
emission buses. The findings highlighted the potential of BRT in providing significant reduction
in greenhouse gases with 40-ft compressed natural gas (CNG) buses.
5.2 Economic Impacts
One of the significant benefits of BRT is its positive long-term influence on TOD (transit-
oriented development) and mixed-use and high-density land development policies (Currie,
2006a). Such development policies, if properly supported with transportation policies, result in
changes in the location decisions of residences and firms, resulting in increased land values and
improved accessibility to employment and other opportunities. BRT implementation has been
shown to result in positive property development impacts in Bogotá, Columbia (Munoz-Raskin,
2010; Rodríguez and Mojica, 2009; Rodríguez and Targa, 2004) and Seoul, Korea (Cervero and
Kang, 2011). Similarly, experiences from cities that adopted BRT, such as Boston, Pittsburgh,
Ottawa and Vancouver, show that there have been significant positive development effects in
locations where there was investment in transit infrastructure (FTA, 2004).However, it is likely
that LRT and metro systems also have similar benefits.
5.2.1 Change in Densities, Land Use and Location Decisions
It is argued that modern BRT systems can increase density around transit nodes and, thus, lead to
TOD (Currie, 2006a; TCRP, 2003; Cervero and Kang, 2011). Vincent and Callaghan (2008) also
examined TOD projects in York Region, Ontario, and El Monte, California, and concluded that
the type and level of investment occurring near BRT stations was comparable to that of TOD
near rail transit.
Kang (2010) confirmed that BRT is associated with the location of creative industries and
service sectors within 500 meters of bus stops in Seoul, Korea. The BRT operation was shown to
increase the employment density in the vicinity of stations by up to 54%.
Deng and Nelson (2012b) conducted a survey to evaluate the impact of the Beijing Southern
Axis BRT system. The results showed that a large majority of respondents (46.1%) had moved to
a location near a BRT station after full operation of Line 1 began in December 2005. In addition,
49.5% of non-locally resident respondents showed interest in residential properties along the
BRT corridor. In Latin American cities, the increased likelihood of living close to BRT stops
was shown to be associated with a decrease in auto ownership and use (Zegras, 2010).
5.2.2 Land Values
The improved accessibility to land in the proximity of BRT stations is reported to have a positive
impact on property values. Many residential projects, specifically high-density apartments, were
built after the implementation of the BRT system in Beijing. Deng and Nelson (2012b)
quantified the impact of BRT Line 1 in Beijing on the value of residential apartments in a series
of catchment and control areas. They found that the average price of apartments adjacent to a
BRT station had a relatively faster increase than those not served by the BRT system.

22 | P a g e
Similarly, positive property development impacts resulting from BRT implementation have been
identified in Bogotá, Columbia (Munoz-Raskin, 2010; Rodríguez and Mojica, 2009; Rodríguez
and Targa, 2004), Seoul, Korea (Cervero and Kang, 2011) and in the U.S,. Canada and Australia
(Vincent and Callaghan, 2008). According to the analysis of a survey of developers conducted in
Brisbane, Cleveland, Boston and Ottawa, roughly half of the participants indicated that
proximity to BRT increased property value by a minimum of 3-5%, compared with similar
properties not in proximity to BRT (Vincent and Callaghan, 2008).
5.2.3 Mobility Benefits
BRT has been shown to lead to significant travel time savings and improved travel reliability for
transit vehicles, resulting in higher quality service and a high modal shift from private cars.
These improvements are significant, although their level has been found to vary greatly.
Vincent et al. (2012) stated that the Brisbane Southeast BRT system has reduced overall travel
times by up to 70%. Echeverry et al. (2004) reported that the Bogotá BRT system was
responsible for a 32% reduction in travel time for BRT users. The Metrobús BRT system in
Mexico City was reported to result in travel time savings of 40% (Molina, 2010). Callaghan and
Vincent (2007) indicated that, since the opening of the Orange Line in Los Angeles, the
southbound traffic flow had improved at around 7% during the morning peak time, and the
northbound traffic flow in the evening rush hour had improved by 6%. With the opening of a
BRT system in Toulouse, France, the average traffic speed increased by 3% between 2007 and
2008 (Rabuel, 2010). However, it is questionable as to whether these improvements will last.
Most importantly, the reliability of travel time has also been shown to improve significantly.
While previous transit riders had a 25% chance of being 7 minutes late or more and a 5% chance
of being 30 minutes late or more, riders of the new BRT system in Mexico were found to be 5
minutes late or more less than 5% of the time (Molina, 2010).
Tiwari and Jain (2012) stated that the time savings were not consistent among the different
groups of travelers on the New Delhi BRT corridor. They varied for different transport modes
and depended on the distance traveled. They reported a 33.33% reduction in travel time for bus
users. Surprisingly, since the number of private vehicles along the corridor also increased, the
author reported a 14% increase in travel time for private autos. However, by weighting the
vehicles by occupancy, they reported an overall total travel time saving of 19.7% for the entire
corridor for all users.
5.3 Social Impacts
5.3.1 Safety Benefits
A BRT system can also result in traffic safety improvements, which are attributable to the
reduced number of private vehicles resulting from the high modal shift to BRT and to the use of
exclusive lanes for buses, which reduce conflicts between buses and other vehicles. However, the
range of improvements can vary greatly. For instance, while the Bogotá BRT system has been
reported to result in a decrease in accident rates along the route by 90% (Echeverry et al., 2004),
the Mexico BRT corridor has reduced collisions by up to 20% (Molina, 2010).

23 | P a g e
Tiwari and Dain (2012) compared the safety improvements for different modes of transportation
after the implementation of the New Delhi BRT corridor. The analysis showed that safety of
pedestrians who were affected by the bus operation improved.
5.3.2 Improved Accessibility to Employment and Other Opportunities
The BRT benefits of shorter travel times, improved mobility and more choices of transportation
modes are also indicators of improved accessibility to employment and other service
opportunities. Tiwari and Jain (2012) quantified the improved accessibility options to
opportunities to be 120% for cyclists and 730% for people who walk to access buses on the New
Delhi BRT corridor.
5.3.3 Equity
The implementation of a BRT system results in improved social equity, due to its direct and
indirect benefits to a wide spectrum of users. Transit users benefit from improved service and
travel times, which result in a high shift from private vehicles to BRT.
In Bogotá, since bus users tend to be more socially disadvantaged, the BRT system was expected
to bring more direct mobility and accessibility benefits to this particular group of passengers.
While some findings in the literature supported this hypothesis, other findings did not. According
to Cain (2006), a good equity outcome was achieved in Bogotá, due to the reduction in the
average transit travel times. These mobility benefits were mainly attributed to the less privileged
group who tend to live at the edges of the city.
Accessibility benefits for less privileged passengers, however, were not supported in a recent
study conducted for the newly implemented BRT system in Cali, Colombia (Delmelle and Casas,
2012). In this study, accessibility was examined in terms of both access to the transit system
itself and access to three activities – health care, education and recreation – around the city and
in relation to neighborhood socioeconomic strata. The results indicated that around 80% of the
total population was within a 15-minute walk of the BRT system. However, walking access to
the BRT system was found to be greatest for middle-income groups and was rather limited for
neighborhoods with the highest and lowest socioeconomic strata. The accessibility to activities
by BRT was shown to be largely limited to the spatial distribution pattern of the activities. For
instance, recreation facilities had the most equitable accessibility as a result of BRT, due to their
dispersed locations; however, hospitals had the least equitable accessibility due to their spatially
clustered locations.
5.4 Health
Although no studies have been reported on the impact of BRT on health, BRT’s capability of
generating shorter destinations and walkable cityscape designs is expected to result in a higher
percentage of active modes, such as biking and walking, thereby encouraging more healthy
lifestyles, as with LRT and metro systems.
In the short term, the high quality of transit service offered by a BRT system may encourage a
high modal shift towards transit, resulting in decreased traffic congestion and, thus, significant
social, economic and environmental benefits. However, as indicated in the New Delhi study of

24 | P a g e
Tiwari and Dain (2012), these short-term benefits can be offset over the longer run by the
demand induced from the additional BRT-generated improvements. Although this finding has
not been supported by other studies, if BRT deployment is not properly supported with transport
and travel demand policies, the resulting decreased travel time for private vehicles that is
realized through BRT deployment may make travel more appealing, which consequently leads to
an increase in private vehicle travel demand. This induced auto demand results in a
transportation system with even more vehicles, creating more congestion, energy use and
emissions. Thus, BRT development policies must be supported with transportation demand
management policies, such as parking management and high-occupancy vehicle (HOV) lanes,
suggesting the need for integrating strategies for both sustainable transportation system
performance and energy use.
6 Costs and Benefits
BRT systems need a relatively low capital investment per kilometer compared with other mass
transit systems (Federal Transit Administration, 2004). Levinson et al. (2003a) showed that BRT
is a cost-effective way of providing high-quality transit service with significant user and operator
benefits. This relative cost-effectiveness has made BRT an attractive and affordable transit
alternative, especially for budget-constrained cities that cannot afford rail transit.
It has been reported that overall capital and operational costs of BRT systems are typically less
than those of an LRT system, although ridership and operating speeds can be, in some cases,
comparable between BRT and LRT systems (Deng and Nelson, 2011). In the construction of a
similar route, a BRT system typically costs 4 to 20 times less than an LRT system and 10 to 100
times less than a metro system.
In another study, Menckhoff (2005) indicated that investment cost for BRT is often less than
one-tenth per kilometer than other mass rapid transit alternatives. In other words, with the same
budget, BRT may be able to deliver greater network coverage than rail systems. Hossain (2006)
showed that BRT could cost US$1.3 million per kilometer, whereas the cost for the metro of
Bangkok’s mass transit project was US$43.4 million per kilometer. Table 5 shows a comparison
of capital and operating costs for different mass transit systems.
Table 5. Costs of different mass transit systems [Source: Deng and Nelson, 2011]
Bus Rapid Transit Light Rail Transit Metro
Average Capital Cost (2000
US$/mile in millions) 13.46 34.70 168.51
Average Operating Cost (2000 US$ / vehicle revenue
mile in millions)
4.73 12.22 8.54
Although the exact capital cost depends greatly on local circumstances, 20 existing BRT lines
were reviewed by the U.S. Government Accountability Office ( 2001), finding that BRT was a
cost-effective solution. In another study, Hidalgo and Graftieaux (2008) observed that the capital
25 | P a g e
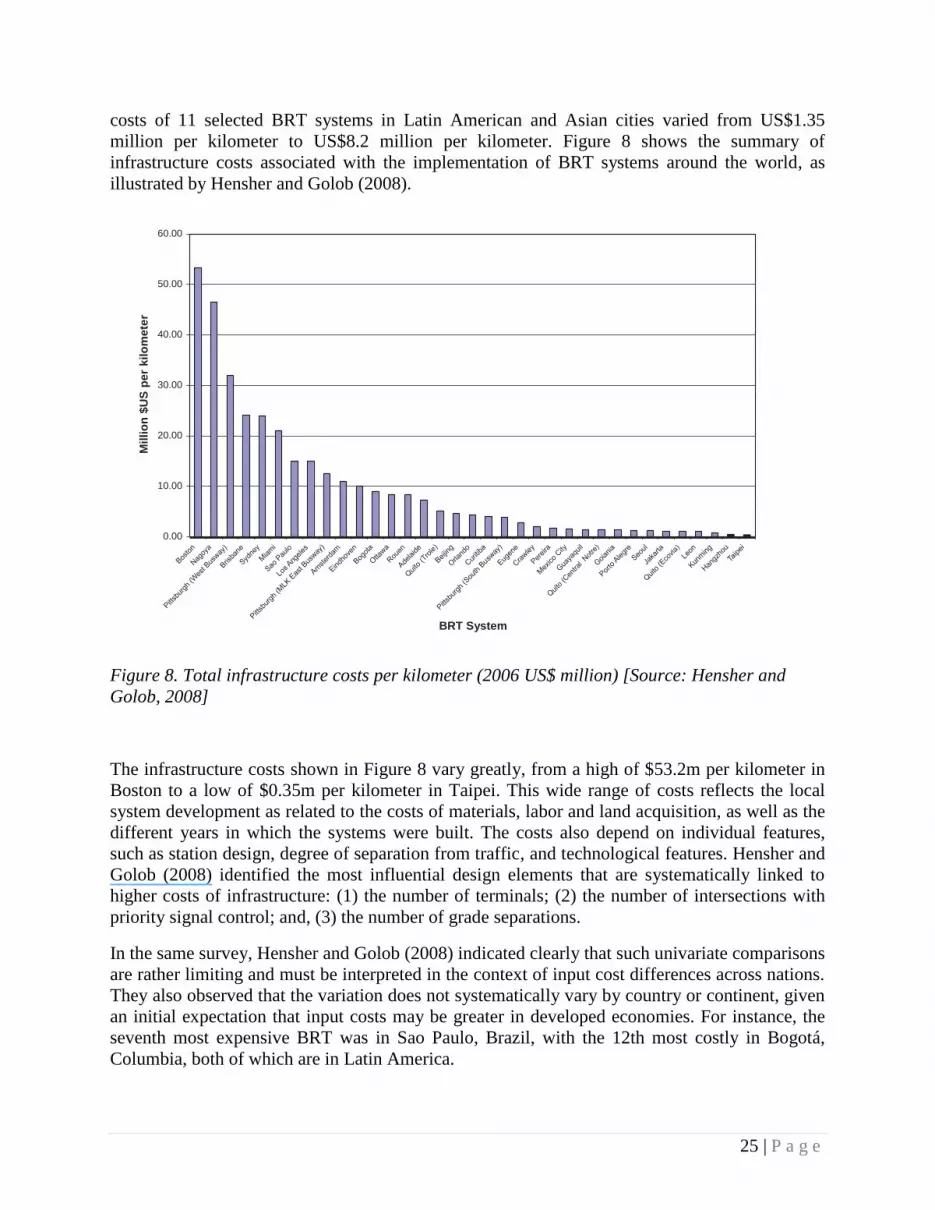
costs of 11 selected BRT systems in Latin American and Asian cities varied from US$1.35
million per kilometer to US$8.2 million per kilometer. Figure 8 shows the summary of
infrastructure costs associated with the implementation of BRT systems around the world, as
illustrated by Hensher and Golob (2008).
Milli
on
$U
S p
er
kil
om
ete
r
60.00
50.00
40.00
30.00
20.00
10.00
0.00
BRT System
Figure 8. Total infrastructure costs per kilometer (2006 US$ million) [Source: Hensher and
Golob, 2008]
The infrastructure costs shown in Figure 8 vary greatly, from a high of $53.2m per kilometer in
Boston to a low of $0.35m per kilometer in Taipei. This wide range of costs reflects the local
system development as related to the costs of materials, labor and land acquisition, as well as the
different years in which the systems were built. The costs also depend on individual features,
such as station design, degree of separation from traffic, and technological features. Hensher and
Golob (2008) identified the most influential design elements that are systematically linked to
higher costs of infrastructure: (1) the number of terminals; (2) the number of intersections with
priority signal control; and, (3) the number of grade separations.
In the same survey, Hensher and Golob (2008) indicated clearly that such univariate comparisons
are rather limiting and must be interpreted in the context of input cost differences across nations.
They also observed that the variation does not systematically vary by country or continent, given
an initial expectation that input costs may be greater in developed economies. For instance, the
seventh most expensive BRT was in Sao Paulo, Brazil, with the 12th most costly in Bogotá,
Columbia, both of which are in Latin America.
26 | P a g e
The most tangible benefits of BRT are additional ridership, cost-effectiveness and operating
efficiencies; however, increases in transit-oriented land development and environmental quality
are also closely linked to the implementation of BRT systems (Federal Transit Administration,
2004). Furthermore, travel time savings and higher reliability enable transit agencies to operate
more vehicle miles of service for each vehicle hour operated.
Beyond the previously discussed positive impacts of BRT, there exist multiplier impacts that can
further increase the value of a BRT system to a municipality. As with other mass transit systems,
BRT can reduce public costs associated with vehicle emissions and accidents. Such impacts may
include costs borne by the health care system, police force and judicial system. By decreasing
these costs, municipal resources can be used in other important areas, such as preventative health
care, education and nutrition (Wright, 2007).
7 Planning Aspects & Optimality
The design of a new BRT system affects the operational, physical and environmental settings of
the surroundings it will serve. BRT planning may lead to significant improvement in service
aspects, such as frequency, directness, understandability, comfort, reliability, operational
efficiency and, above all, rapid service. New BRT systems may vary in different corridors, cities
and regions, depending on the available capital and operating budgets, passenger demand,
available rights of way and potential route configurations (FTA, 2004; Thilakaratne, 2011). The
following subsections detail some of the basic planning aspects and optimality in providing a
new BRT system.
7.1 Route Length
The route length affects the destinations the passengers can directly access with or without
transferring. Route length is also an important input for the assessment of resources required to
serve the route. Longer routes may minimize the need for transfers, but may require more capital
investment and labor resources and result in higher variability in operation. Although shorter
routes may require passengers to transfer to reach locations not served by the route, they
generally provide higher travel time reliability (FTA, 2004; Hensher, 2008; Thilakaratne, 2011).
BRT route length has been considered in detail in Thilakaratne (2011) with the determination of
the optimal length of a public transit corridor when the local bus system evolves to become an
express bus system at a minimal cost. He found the optimal BRT stops, given that local buses
stop at all stops, and determined the frequency of service, so as to minimize the costs to the bus
system as well as the time costs to passengers.
7.2 Route Structure
Various vehicle types and sizes can be accommodated on a BRT system, based on the route
patterns and structures. Simple route structures with just one or two routes are easy for new
passengers to understand and navigate. Clarity and choice are two key principles to be
highlighted when determining the route structure. There are three types of BRT route structure
options to be considered (FTA, 2004):

27 | P a g e
A single route is the simplest BRT service, with only one type of service for the corridors
serving several activity centres and attracting passengers at stations all along the route.
This has been further analyzed by Wirasinghe at el. (2011) in the route layout analysis for
express buses.
An overlapping route with skip stop or express variations encompasses various transit
services, including the base BRT service for passengers traveling between particular
origin-destination pairs, but with a number of routes that may create crowding at stations
and result in confusion for infrequent riders.
An integrated or network system may include local buses, express buses and combined
line-haul / feeders (e.g., BRT network in Calgary)
7.3 Service Span
The period of time that a service is available for use is defined as the service span. Service span
may be considered where both local bus and BRT systems operate in the same corridor to give
passengers a choice between the two services. There are two service span options for BRT
service (FTA, 2004): (1) all-day BRT service; and, (2) peak hour only service.
7.4 Service Frequency
Service frequency is one of the most important elements in planning and operating a BRT
system. It determines how long passengers must wait for BRT service. Rapid transit systems
generally provide high-frequency service, especially in the morning/evening peak hours. The
optimal service frequencies of combined local bus / BRT systems affect the service regularity
and the ability of peak hour passengers to rely on the BRT service, which can increase revenue.
There are two methods of schedule control (FTA, 2004):
Schedule-based control dictates that operators must arrive within a certain scheduled time
at specific locations along the route. Dispatchers monitor vehicle locations for schedule
adherence and facilitate connections with other services when schedules are coordinated
to match.
Headway-based control focuses on maintaining headways rather than meeting specific
schedules. Dispatchers monitor vehicle locations and issue directions to regulate
headways and capacity (traveling with maximum speed, minimizing wait times and
vehicle bunching), but do not indicate a specified time of arrival at the end of the route.
Wirasinghe (1990) examined this situation with many-to-many time-varing demand on a bus
route, re-examining Newell’s dispatching policy on how the optimal frequency can be estimated
to minimize the cost of dispatching plus the cost of waiting time, using analytical methods. He
allowed the maximum load point to be varied from bus to bus.

28 | P a g e
7.5 Station Spacing
BRT stations are typically spaced farther apart than conventional stops that serve the local bus
service. From an economic point of view, optimal stop spacing of a combined local bus / BRT
system greatly influences passengers’ access time cost, station cost, travel time cost and transfer
costs (Wirasinghe et al., 1981; Wirasinghe, 2011).
7.6 Cost Effectiveness
As discussed in Section 6, BRT capital costs generally range from low to moderate relative to
rail systems. BRT systems that operate in mixed traffic have relatively low capital costs per unit
distance, while BRT systems operating on dedicated lanes (busways) require moderate capital
costs per unit distance (FTA, 2004; Vuchic, 2007).
7.7 Operating Cost Efficiency
BRT systems result in operating efficiency and service productivity for the effective deployment
of resources in serving transit passengers. Experience shows that corridor performance indicators
(e.g., passengers per revenue hour, subsidy per passenger mile and subsidy per passenger)
improve, when BRT operates in corridors where passengers have the option to switch to a BRT
system. It enables economic productivity resulting from travel time savings and higher reliability
for the optimality of combined transit operation (FTA, 2004).
7.8 Ridership
Generally, corridors where BRT has been implemented are associated with significant increases
in transit ridership (Thilakaratne, 2011). The ridership level is a clear indicator of the image of
the transit system. The BRT demand increases with existing transit passengers switching from
parallel public transit mode(s) on other routes/corridors and by attracting new transit users who
previously used private vehicles.
7.9 Environmental Quality
Environmental quality is an indicator of the regional quality of life, supporting public health and
well-being and the attractiveness and sustainability of the urban and natural environment (FTA,
2004). Transit operators provide passengers with fewer hours (mostly in the morning and
evening peak times) of BRT operation (environmental impact per unit time) and with higher
ridership (environmental impact per passenger), in order to potentially reduce the emissions of
pollutants per passenger per unit time (FTA, 2004; Vuchic, 2007).
8 Barriers to BRT
Although there is evidence around the world that BRT is a sustainable strategy for improving
travel conditions, some challenges are inevitably encountered with the implementation of a BRT
system. These challenges may be of political, technical, operational and/or institutional nature
29 | P a g e
(Weinstock et al., 2011). Wright (2007) summarized several barriers that have prevented wider
utilization of BRT systems, especially for developing countries:
Political will
Existing operators
Institutional biases
Lack of information
Institutional capacity
Technical capacity
Financing
Geographical/physical limitations
For developed and car-oriented cities, Weinstock et al. (2011) reported that, by far, the most
important reason for not implementing BRT is that these cities have much fewer transit riders
and far more private car owners than most of the cities that have successfully implemented good
BRT systems. Weinstock et al. (2011) also reported that there are political obstacles, which
include lack of awareness, politicians’ lack of control over transit systems, presence of a less
politically powerful, transit-riding constituency, and lack of a corporate lobby in support of BRT.
In many cases, local motorists are more empowered in developed countries and able to oppose
changes proposed by the government, and this provides another obstacle to BRT development.
Political will is one of the most important challenges facing BRT. As mentioned by Wright
(2007), lobby groups from rail and automobile interests may devise a powerful political
argument against BRT implementation. Although automobiles may represent less than 15% of
the modal share in developing cities, the owners of such vehicles signify the most influential
sociopolitical grouping. The idea of prioritizing road space to public transport may seem to
counter the benefits of such owners (Wright, 2007).
Administrative and institutional barriers to BRT development have been observed in many
countries; and, in several cases, even traffic engineers were found to be initially resistant to
change (Wright, 2007). However, in many cases, powerful politicians backed by leading
international engineers managed to overrule local engineers’ resistance.
In spite of the advances in the accessibility of global information, a lack of knowledge about the
concept of BRT remains a very real barrier (Wright, 2007). However, it has been reported that
financing is usually less of a problem with BRT than with other transit options. In some cases,
local conditions, such as geographical and topographical factors, can create barriers to the
implementation of a BRT system. For example, narrow roadways and steep hills can present
design challenges. However, in general, there are technical solutions for each of these issues
(Wright, 2007).
The New Delhi BRT project has been criticized by media since its first trial run, due to poor
design and lack of coordination with different stakeholders (Pucher et al., 2005). Overcrowding,
especially in the dense cities, can also pose some challenges for the planning and implementation
of BRT systems (Gilbert, 2008). For instance, extreme crowding problems often occur on
TransMilenio in Bogotá, which has caused passenger dissatisfaction with the service.

30 | P a g e
According to the Federal Transit Administration (2004), the most significant physical challenge
in planning BRT is the availability of right of way, whether on an arterial roadway, adjacent to a
highway, or on a separate right of way. Similarly, the availability of physical property for
stations is another key factor in station location. These two factors always impose tension among
the different groups involved in planning a BRT system (Federal Transit Administration, 2004).
9 Conclusion
Similar to other higher order transit systems, such as LRT and metro networks, BRT has
demonstrated an ability to increase transit ridership within defined corridors. The attractiveness
of a BRT system is that it can achieve these advantages with relatively lower investment and
community disruption than systems that require more significant infrastructure, such as LRT and
metro systems. Local land use policies that support high-density developments, improved BRT
accessibility and mobility attract potential developments around BRT stations and along its
corridor.
On the other hand, a BRT system can bring changes in two opposing directions by shaping the
spatial distribution of land use within a metropolitan area. The impacts of a BRT system on the
reinforcement of decentralization and on increasing land values are well reported in the
literature; however, the impact of the additional mobility and accessibility to decentralized areas
that a BRT system can offer have still not been examined in the literature. By linking affordable
residence locations in suburbs to high-density development in centralized urban areas, BRT may
encourage further decentralization in the form of growing urban sprawl.
Integrated growth management, travel demand management and land use policies may offer
solutions to these challenges and achieve sustainable transportation system performance.
The short history of public bus transport, as described in Section 2, shows that transit operators
have since the 1930s attempted to organize the design elements of bus systems to improve
customer service, capacity, speed and reliability. It was only in the 1970s that the elements of a
rapid bus service were described as Bus Rapid Transit or BRT. Today there are at least 150 BRT
systems around the world carrying approximately 25 million passengers per day on over 3700
kilometres of right of way.
The uniqueness of each BRT systems comes from how the basic design elements are organized
to achieve the desired functional outcomes. Section 3 provides an overview of the elements of
BRT systems; the running ways, vehicles, stations, operational control systems, fare collection
systems and passenger information systems. Sections 3 and 7 also describe how the organization
of these elements allows BRT services to achieve the speed, capacity, reliability, accessibility
and operational safety characteristics that distinguishes BRT systems from regular express bus
services.
Section 4 reports on a number of studies which document very positive customer perceptions of
BRT service and successes in attracting significant numbers of new customers to BRT.
Section 5 documents the positive social, environmental and economic benefits of BRT systems.
31 | P a g e
One of the very attractive aspects of BRT is described in Section 6, wherein the relatively low
capital cost to implement is recognized. Although there is a wide range in capital costs per
kilometre of running way, it is generally recognized that BRT systems cost significantly less than
rail based systems. The relative spread in per passenger operating costs may be less given system
capacity and operating cost differences around the world.
Although BRT systems now operate throughout the world and have achieved significant success
in customer satisfaction and ridership gains in many cities there are still barriers to
implementation. Many aspects of BRT are still poorly understood by political and institutional
decision makers which may lead to suboptimal transit corridor development decisions. Only
through a more through understanding of transit corridor requirements and the elements of a Bus
Rapid Transit system will better decisions be made.
The review of Bus Rapid Transit clearly indicates that it achieves many of the general
advantages of all higher order transit systems, but also has many unique characteristics that set it
apart for consideration.
10 References
American Public Transportation Association (APTA). (2010). Implementing BRT Intelligent
Transportation Systems. Retrieved November 2012 from
http://www.aptastandards.com/Portals/0/Bus_Published/005_RP_BRT_ITS.pdf
Caicedo, B., Ocampo, M., and Sanchez-Silva, M. (2012). An integrated method to optimise the
infrastructure costs of bus rapid transit systems. Structure and Infrastructure Engineering,
8(11), 1017-1033.
Cain, A., Darido, G., Baltes, M., Rodrigues, P. and Barrios, J. (2006). Applicability of Bogotá’s
TransMilenio BRT system to the United States. Federal Transit Administration. Report
number FL-26-7104-01. May 2006.
Cain, A., Darido, G. B., Baltes, M. R., Rodriguez, P. and Barrios, J. (2007). Applicability of
TransMilenio bus rapid transit system of Bogotá, Colombia, to the United States.
Transportation Research Record, 2034, pp. 45-54.
Cain, A., Flynn, J., McCourt, M. and Reyes, T. (2009). Quantifying the Importance of Image and
Perception to Bus Rapid Transit. Washington, DC: U.S. Department of Transportation,
Federal Transit Administration, Office of Research, Demonstration and Innovation-TRI.
Calgary Transit Website, BRT Network (2011). Accessed August to December, 2012 from:
http://www.calgarytransit.com/html/brt.html
Callaghan, L. and Vincent, W. (2007) Preliminary evaluation of Metro Orange Line bus rapid
transit project. Transportation Research Record, 2034, pp. 37-44.
Canadian Urban Transit Association (CUTA). (2004). Bus Rapid Transit: A Canadian
Perspective. Research report: McCormick Rankin Corporation for CUTA, Toronto.
Accessed August to December, 2012 from: www.cutaactu.ca/en/note/1630.

32 | P a g e
Centre for Science and Environment, Delhi Greens and the Indian Youth Climate Network
(2008) The perception survey: bus rapid transit system (BRT). Accessed August to
December, 2012 from: www.cseindia.org/pdf/brt.pdf
Cervero, R. and Kang, C. D. (2011). Bus Rapid Transit impacts on land uses and land values in
Seoul, Korea. Transport Policy, 18(1), pp. 102- 116.
Chen, X. M., Yu, L. and Guo, S. X. (2007). Impacts of exclusive lanes and signal priority on bus
rapid transit effectiveness. Paper presented at the International Conference on
Transportation Engineering.
Currie, G. (2006a). Bus transit oriented development strengths and challenges relative to rail.
Journal of Public Transportation, 9(4), pp. 1-21.
Currie, G. (2006b) Bus rapid transit in Australasia: Performance, lessons learned and futures,
Journal of Public Transportation, BRT Special Edition, pp. 1-22.
DeLeuw, Cather & Co. (1959). Mass transportation survey - National capital region, civil
engineering report. January.
Delmelle, E. C. and Casas, I. (2012). Evaluating the spatial equity of bus rapid transit-based
accessibility patterns in a developing country: The case of Cali, Colombia. Transport
Policy, 20(March), pp. 36-46.
Deng, T. T. and Nelson, J. D. (2009). Analysis of an efficient urban transport system: lessons
learned from Beijing Southern Axis Bus Rapid Transit Line 1, Proceedings of the 14th
HKSTS International Conference, 2, pp. 719-727.
Deng, T. and Nelson, J. D. (2010a). The impact of Bus Rapid Transit on land development: A
case study of Beijing, China. World Academy of Science, Engineering and Technology,
66, pp. 1196-1206.
Deng, T. and Nelson, J. D. (2010b) The perception of bus rapid transit: a passenger survey from
Beijing Southern Axis Line 1. Paper presented at the 42nd Annual Conference of the
Universities’ Transport Studies Group, Plymouth, January, CD ROM.
Deng, T., and Nelson, J.D. (2011). Recent Developments in Bus Rapid Transit: A Review of the
Literature, Transport Reviews: A Transnational Transdisciplinary Journal, 31(1), pp. 69-
96.
Deng, T., and Nelson, J.D. (2012a). The perception of Bus Rapid Transit: a passenger survey
from Beijing Southern Axis BRT Line 1. Transportation Planning and Technology, 35(2),
pp. 201-219.
Deng, T. and Nelson, J. D. (2012b). Bus Rapid Transit implementation in Beijing: An evaluation
of performance and impacts. Research in Transportation Economics, Accessed August to
December, 2012 from: http://dx.doi.org/10.1016/j.retrec.2012.06.002

33 | P a g e
Diaz, R. and Schneck, D. (2000). Bus Rapid Transit Technologies in the Americas: An
Overview. Transportation Research Record: Journal of the Transportation Research
Board, 1731, pp. 3-9.
Dziekan, K. and Kottenhoff, K. (2007). Dynamic At-Stop Real-Time Information Displays for
Public Transport: Effects on Customers. Transportation Research Part A: Policy and
Practice, 41(6), pp. 489-501.
Dziekan, K. and Vermeulen, A. (2006). Psychological Effects of and Design Preferences for
Real-Time Information Displays. Journal of Public Transportation, 9(1), pp.71-89.
Echeverry, J. C., Ibanez, A.M. and Hillon, L.C. (2004). The economics of TransMilenio, a mass
transit system for Bogotá. Economia 5, pp. 151-195.
Ernst, J. (2005). Initiating Bus Rapid Transit in Jakarta, Indonesia. Transportation Research
Record: Journal of the Transportation Research Board, 1903, pp. 20-26.
Fastrack Delivery Executive. (2006). Could not improve any more-what more could want?
Passenger comment, October 2006 surveys. Accessed August to December, 2012 from:
www.go-fastrack.co.uk
Federal Transit Administration (FTA). (2004). Characteristics of Bus Rapid Transit for Decision
Making Project No: FTA-VA-26-7222-2004.1.
Gilbert, A. (2008) Bus rapid transit: is Transmilenio a miracle cure? Transport Reviews, 28(4),
pp. 439-467.
Global BRT Data (2012). Database of Bus Rapid Transit systems around the world. Accessed
August to December, 2012 from: http://brtdata.org/#/location
Goodman, J., Laube, M. and Schwenk, J. (2005). Curitiba's bus system is model for rapid transit.
Race, Poverty & the Environment. Accessed August to December, 2012 from:
http://urbanhabitat.org/files/25.Curitiba.pdf
Grava, S. (2003). Urban Transportation System: Choices for Communities. New York: McGraw-
Hill.
Harrington, P., Kelker, R. F. and DeLeuw, C. E. (1937). A comprehensive local transportation
plan for the City of Chicago.
Hensher, D. A. (2007). Sustainable public transport systems: Moving towards a value for money
and network-based approach and away from blind commitment, Transport Policy, 14, pp.
98-102.
Hensher, D. A. and Golob, T. F. (2008) .Bus Rapid Transit systems: A comparative assessment,
Transportation, 34(4), pp. 501-518.

34 | P a g e
Hidalgo, D., and Graftieaux, P. (2008). Bus Rapid Transit Systems in Latin America and Asia:
Results and Difficulties in 11 Cities. Transportation Research Record: Journal of the
Transportation Research Board, 2072, pp. 77-88.
Hossain, M. (2006) The issues and realities of BRT planning initiatives in developing Asian
cities, Journal of Public Transportation, BRT Special Edition, pp. 69-87.
Iswalt, M., Wong, C. and Connolly, K. (2011). Innovative Operating Solutions for Bus Rapid
Transit Through a Congested Segment of San Jose, California. Transportation Research
Record: Journal of the Transportation Research Board, 2218, pp. 27-38.
Institute for Transportation and Development Policy (ITDP). (2007). Rea Vaya operational
design: executive summary. Accessed August to December, 2012 from:
www.itdp.org/index.php/microsite/johannesburg brt/
Institute for Transportation and Development Policy (ITDP). (2009). Janmarg, the people's way.
Sustainable Transport, 21. Accessed August to December, 2012 from:
http://www.itdp.org/documents/st_magazine/itdp-sustran-20100101.pdf
Kang, C.D. (2010). The Impact of Bus Rapid Transit on Location Choice of Creative Industries
and Employment Density in Seoul, Korea. International Journal of Urban Sciences.
Volume 14, Issue 2, pp. pages 123-151.
Kittelson and Associates, Inc. et al. (2007). Bus Rapid Transit Practitioners Guide. TCRP Report
118, Transportation Research Board.
Lehtonen, M. and Kulmala, R. (2002). Benefits of Pilot Implementation of Public Transport
Signal Priorities and Real-Time Passenger Information. Transportation Research Record:
Journal of the Transportation Research Board, 1799, pp. 18-25.
Levinson, H. S., Zimmerman, S., Clinger, J. and Rutherford, S. (2002). Bus Rapid Transit: An
Overview. Journal of Public Transportation, 5(2), pp. 1-30.
Levinson, H., Zimmerman, S., Clinger, J., Rutherford, S., Smith, R. L., Cracknell, J. et al.
(2003a). Bus Rapid Transit: Case Studies in Bus Rapid Transit, Vol 1. TCRP Report 90,
Transportation Research Board.
Levinson, H. S., Zimmerman, S., Clinger, J., Gast, J., Rutherford, S., and Bruhn, E. (2003b). Bus
Rapid Transit, Vol. 2: Implementation Guidelines, TCRP Report 90, Transportation
Research Board.
Liu, G. and Wirasinghe, S. C. (2001). A Simulation Model of Schedule Design for a Fixed
Transit Route. Journal of Advanced Transportation, 35(2), pp. 145-174.
Menckhoff, G. (2005) Latin American experience with bus rapid transit. Paper presented at the
World Bank Annual Meeting-Institute of Transportation Engineers, Melbourne. Accessed
August to December, 2012 from:
http://www.gobrt.org/Latin_American_Experience_with_Bus_Rapid_Transit.pdf

35 | P a g e
Miller, M. A. (2009). Bus lanes/bus rapid transit systems on highways: Review of the literature.
California PATH program. California PATH Working Paper UCB-ITS-PWP-2009-1.
Accessed August to December, 2012 from:
http://www.path.berkeley.edu/PATH/Publications/PDF/PWP/2009/PWP-2009-01.pdf.
Molina, Luisa T. (2010). Sustainable Transportation in Latin America and the Caribbean.
Massachusetts Institute of Technolog/MCE2, September 15, 2010. 15th IUAPPA World
Clean Air Congress Session 6E: Greener Transport, Vancouver, Canada. Adobe Acrobat
File.
Munoz-Raskin, R. (2010). Walking accessibility to bus rapid transit: Does it affect property
values? The case of Bogotá, Colombia. Transport Policy, 17, pp. 72-84.
Nijkamp, P., Pepping, G., Banister, D. and Argyrakos, Y. (1996). Telematics And Transport
Behaviour. Springer.
Nugroho, S. B., Fujiwara, A. and Zhang, J. (2011). An empirical analysis of the impact of a bus
rapid transit system on the concentration of secondary pollutants in the roadside areas of
the TransJakarta corridors. A structural equation model and artificial neural network
approach. Stochastic Environmental Research and Risk Assessment, 25, pp. 655-669.
Patankar, V. M., Kumar, R. and Tiwari, G. (2007). Impacts of bus rapid transit lanes on traffic
and commuter mobility. Journal of Urban Planning and Development, 133(2), pp. 99-
106.
Pucher, J., Korattyswaropam, N., Mittal, N. and Ittyerah, N. (2005). Urban transport crisis in
India. Transport Policy, Vol. 12, Issue 3, pp. 185-198.
Rabinovitch, J. and Hoehn, J. (1995) A Sustainable Urban Transportation System: The Surface
Metro in Curitiba, Brazil, Working Paper No. 19, United Nations Development
Programme – UNDP.
Rabuel, S. (Ed.), (2010). Buses with a high level of services: Choosing and implementing the
right system. Lyon: Certu. Accessed August to December, 2012 from:
http://ctcqyjs.cqjtu.com/upload/2010-06/10062311509554.pdf
Rahman, M. M., Kattan, L., Wirasinghe, S. C. and Morgan, D. (2010). Bus arrival time
estimation using existing signal database & shock wave theory, World Conference for
Transportation Research (WCTR), Lisbon.
Rahman, M. M. (2011). Real-Time Bus Information Provision: Users' Views and Some Aspects
of Bus Travel Time in Calgary. M.Sc. Thesis, Department of Civil Engineering, Schulich
School of Engineering, University of Calgary, Canada.
Rahman, M. M., Kattan, L. and Wirasinghe, S. C. (2011b). Factors Affecting Bus Travel Time In
Moderate Frequency Transit Bus Routes - A Case Study Of Calgary Transit. Computers
in Urban Planning and Urban Management Conference, Lake Louise, Canada.

36 | P a g e
Rahman, M. M., Kattan, L. and Tay, R. (2012). Injury Risks In Collisions Involving Buses In
Alberta, Transportation Research Record: Journal of the Transportation Research Board,
2265, pp. 13-26.
Rahman, M. M., Wirasinghe, S. C. and Kattan, L. (2012a). Users’ Views on Current and Future
Real-Time Bus Information Systems. Journal of Advanced Transportation. DOI:
10.1002/atr.1206.
Rahman, M. M., Wirasinghe, S. C. and Kattan, L. (2012b). Optimal Busway Length in an Urban
Corridor, working paper, Department of Civil Engineering, Schulich School of
Engineering, University of Calgary, Canada.
Rathwell, S. and King, M. (2011). Considerations for Median BRT on Arterial Roads. ITE
Journal, 81(1), pp. 44-48.
Rodríguez, D. A. and Mojica, C. H. (2009). Capitalization of BRT network expansions effects
into prices of non-expansion areas. Transportation Research Part A, 43, pp. 560-571.
Rodríguez, D. A., and Targa, F. (2004). Value of accessibility to Bogotá’s Bus Rapid Transit
system. Transport Reviews, 24(5), pp. 587 - 610.
TDM (Transportation Demand Management) Encyclopedia. (2012). Bus Rapid Transit Bus
System Design Features That Significantly Improve Service Quality And Cost
Efficiency. Victoria Transport Policy Institute. Accessed August to December, 2012
from: http://www.vtpi.org.
Thilakaratne, R. S. (2011). Mode Succession in a Public Transit Corridor, M.Sc. Thesis
Department of Civil Engineering, Schulich School of Engineering, University of Calgary,
Canada.
Thilakaratne, R. S., Wirasinghe, S. C. and Hubbell, J. (2011). Analysis of Flows and Speeds of
Urban Transit Systems for Consideration of Modal Transition in a Corridor, Urban
Transport XVII: Urban Transport and the Environment in the 21st Century, 116, pp, 251-
261, WIT Press, ISBN: 978-1-84564-520-5,.
Tirachini, A. and Hensher, D. A. (2011). Bus congestion, optimal infrastructure investment and
the choice of a fare collection system in dedicated bus corridors. Transportation Research
Part B: Methodological, 45(5), pp. 828-844.
Tiwari, G. and Jain, D. (2012). Accessibility and safety indicators for all road users: Case study
of Delhi BRT. Journal of Transport Geography, 22, pp. 87-95.
Tiwari, G., Mohan, D., Gandhi, S., Sriram, B., Kapoor, S., Verma, R., and Gaur, M. (2005). First
Delhi BRT Corridor: A Design Summary: Ambedkar Nagar to Delhi Gate.
Transportation Research and Injury Prevention Programme. Accessed August to
December, 2012 from:
http://tripp.iitd.ernet.in/delhibrts/brts/hcbs/hcbs/BRTdesignsum.pdf

37 | P a g e
Transit Cooperative Research Program (TCRP) (2003). Transit Capacity and Quality of Service
Manual and Quality of Service Manual, 2nd Edition, TCRP Report # 100. Transportation
Research Board, Washington, D.C., Part 4.
U.S. Government Accountability Office (GAO). (2001). Bus Rapid Transit Shows Promise,
GAO-01-984. Accessed August to December, 2012 from:
http://www.gao.gov/new.items/d01984.pdf
Vincent, W. and Jerram, L. C. (2006). The Potential for Bus Rapid Transit to Reduce
Transportation-Related CO2 Emissions. Journal of Public Transportation, 2006 BRT
Special Edition,. pp. 219-237.
Vincent, W. and Callaghan, L. J. (2008). Bus Rapid Transit and Transit Oriented Development:
Case Studies on Transit Oriented Development Around Bus Rapid Transit Systems in
North America and Australia. Breakthrough Technologies Institute. Accessed August to
December, 2012 from:
http://www.crcog.org/publications/TransportationDocs/NBHBusway/2010/BRT-TOD-
Report.pdf.
Vincent, W., Delmont, E. and Hughes, C. (2012). Energy and Environmental Impacts of BRT in
APEC Economies. Breakthrough Technologies Institute. Accessed August to December,
2012 from: http://esci-ksp.org
Vuchic, V. R. (2007). Urban transit systems and technology. Hoboken, N.J.: John Wiley & Sons.
W. C. Gilman and Co. 1959. St. Louis metropolitan area transportation study. Prepared for the
City of St. Louis and St. Louis County, August.
Walters, J. (2008). Overview of public transport policy developments in South Africa. Research
in Transport Economics, 22, pp. 98-108.
Weinstock, A., Hook, W., Replogle, M. and Cruz, R. (2011). Recapturing Global Leadership in
Bus Rapid Transit: A Survey of Select U.S. Cities. Accessed August to December, 2012
from: http://www.itdp.org/documents/20110526ITDP_USBRT_Report-LR.pdf
Wirasinghe, S. C. and Ghoneim, N. (1981). Location of Bus-Stops for Many to Many Travel
Demand. Transportation Science, 15(3).
Wirasinghe, S. C. (1990). Re-Examination of Newell’s Dispatching Policy and Extension To a
Bus Route with Many to Many Time Varying Demand. Transportation and Traffic
Theory (Ed. Koshi, M.), Elsevier, pp. 363-378.
Wirasinghe, S. C. (1993). Cost Based Approach to Scheduling Travel Time on a Transportation
Route. Transportation and Traffic Theory (Ed. Daganzo, C.), Elsevier, pp. 205-216.
Wirasinghe, S.C. and Liu, G. (1995a). Determination of number and locations of time points in
transit schedule design – case of a singe run. Annals of Operations Research, 60, pp. 161-
191.
38 | P a g e
Wirasinghe, S.C. and Liu, G. (1995b). Optimal Schedule for a Transit Route with One
Intermediate Time Point. Transportation Planning and Technology, 19, pp. 121-145.
Wirasinghe, S.C. (2008). Bus Route and Stop Locations – Chapter 2, ENCI 711 Course Notes,
Department of Civil Engineering, Schulich School of Engineering, University of Calgary,
pp. 29-40.
Wirasinghe, S. C. (2008). Bus Dispatching Policy, Schedule and Fleet Size – Chapter 3, ENCI
711 Course Notes, Department of Civil Engineering, Schulich School of Engineering,
University of Calgary.
Wirasinghe, S.C. and Vandebona, U. (2011). “Route Layout Analysis for Express Buses”,
Transportation Research C, Vol. 19, 2011, pp: 374-385
Wöhrnschimmel, H., Zuk, M., Martínez-Villa, G., Cerón, J., Cárdenas, B., Rojas-Bracho, L., et
al. (2008) The impact of a bus rapid transit system on commuters’ exposure to benzene,
CO, PM2.5 and PM10 in Mexico City, Atmospheric Environment, 42, pp. 8194–8203.
Wright, L. (2005). Bus Rapid Transit. In: GTZ Sustainable Transport: A Sourcebook for Policy-
makers in Developing Cities.
Wright, L. (2007). Sustainable Transport: Sourcebook for Developing Cities - Module 3b: Bus
Rapid Transit. Accessed August to December, 2012 from:
http://www.itdp.org/documents/brtplanningguidedec04.pdf
Wright, L. and Hook, W. (2007). Bus Rapid Transit Planning Guide. New York: Institute for
Transportation and Development Policy.
Xu, H. and Zheng, M. (2012). Impact of bus-only lane location on the development and
performance of the logic rule-based bus rapid transit signal priority. Journal of
Transportation Engineering, 138(3), pp. 293-314.
Zegras, C. (2010). The built environment and motor vehicle ownership and use: Evidence from
Santiago de Chile. Urban Studies, 49(8), pp. 1793-1817.
Zhang, M. (2009). Bus versus rail meta-analysis of cost characteristics: Carrying capacities, and
land use impacts. Transportation Research Record, 2110, pp. 87-95.
Zimmerman, S. and Levinson, H. (2004). Vehicle selection for BRT: Issues and options. Journal
of Public Transportation, 7(1), pp. 83-102.