brf s.a. - aws
TRANSCRIPT
BRF S.A.
FORM 20-F(Annual and Transition Report (foreign private issuer))
Filed 04/26/17 for the Period Ending 12/31/16
Telephone 551123225061
CIK 0001122491Symbol BRFS
SIC Code 2011 - Meat Packing PlantsIndustry Food Processing
Sector Consumer Non-CyclicalsFiscal Year 12/31
http://www.edgar-online.com© Copyright 2017, EDGAR Online, Inc. All Rights Reserved.
Distribution and use of this document restricted under EDGAR Online, Inc. Terms of Use.
UNITED STATES SECURITIES AND EXCHANGE COMMISSION
Washington, D.C. 20549
FORM 20-F¨ REGISTRATION STATEMENT PURSUANT TO SECTION 12(b) OR (g) OF THE SECURITIES EXCHANGE ACT OF 1934
ORx ANNUAL REPORT PURSUANT TO SECTION 13 OR 15(d) OF THE SECURITIES EXCHANGE ACT OF 1934
For the fiscal year ended December 31, 2016 OR
¨ TRANSITION REPORT PURSUANT TO SECTION 13 OR 15(d) OF THE SECURITIES EXCHANGE ACT OF 1934OR
¨ SHELL COMPANY REPORT PURSUANT TO SECTION 13 OR 15(d) OF THE SECURITIES EXCHANGE ACT OF 1934Commission file number 001-15148
BRF S.A.(Exact Name of Registrant as Specified in its charter)
N/A(Translation of Registrant’s name into English)
Federative Republic of Brazil (Jurisdiction of Incorporation or Organization)
R. Hungria, 1400 - 5th Floor Jd. Europa – 01455-000São Paulo – SP, Brazil
(Address of principal executive offices)
Pedro de Andrade Faria, Global Chief Executive, Financial and Investor Relations Officer Tel. (5511) 2322-5005, Fax (5511) 2322-5740
R. Hungria, 1400 - 5th Floor Jd. Europa - 01455-000São Paulo – SP, Brazil
(Name, Telephone, E-mail and/or Facsimile number and Address of Company Contact Person)
Securities registered or to be registered pursuant to Section 12(b) of the Act:
Title of each class Name of each exchange on
Common Shares, no par value*American Depositary Shares (as evidenced by American Depositary Receipts), each representing one share of common stock
which registeredThe New York Stock ExchangeThe New York Stock Exchange
____________________* Not for trading purposes, but only in connection with the registration of American Depositary Shares representing those common shares.
Securities registered or to be registered pursuant to Section 12(g) of the Act:
None
Securities for which there is a reporting obligation pursuant to Section 15(d) of the Act:
None
Indicate the number of outstanding shares of each of the issuer’s classes of capital or common stock as of the close of the period covered by the annual report:
At December 31, 2016 812,473,246 shares of common stock
Indicate by check mark if the registrant is a well-known seasoned issuer, as defined in Rule 405 of the Securities Act. Yes x No ¨
If this report is an annual or transition report, indicate by check mark if the registrant is not required to file reports pursuant to Section 13 or 15(d) of the Securities Exchange Act of 1934. Yes ¨ No x
Note- Checking the box above will not relieve any registrant required to file reports pursuant to Section 13 or 15(d) of the Securities Exchange Act of 1934 from their obligations under those Sections.
Indicate by check mark whether the registrant (1) has filed all reports required to be filed by Section 13 or 15(d) of the Securities Exchange Act of 1934 during the preceding 12 months (or for such shorter period thatthe registrant was required to file such reports), and (2) has been subject to such filing requirements for the past 90 days. Yes x No ¨
Indicate by check mark whether the registrant has submitted electronically and posted on its corporate Web site, if any, every Interactive Data File required to be submitted and posted pursuant to Rule 405 ofRegulation S-T (§232.405 of this chapter) during the preceding 12 months (or for such shorter period that the registrant was required to submit and post such files). Yes ¨ No ¨
Note: Not required for registrant.
Indicate by check mark whether the registrant is a large accelerated filer, an accelerated filer, a non-accelerated filer or an emerging growth company. See definitions of “large accelerated filer,” “accelerated filer,”and “emerging grwoth company” in Rule 12b-2 of the Exchange Act.
Large accelerated filer x Accelerated filer ¨
Non-accelerated filer ¨ Emerging growth company ¨
If an emerging growth company that prepares its financial statements in accordance with U.S. GAAP, indicate by check mark if the registrant has elected not to use the extended transition period for complying withany new or revised financial accounting standards† provided pursuant to Section 13(a) of the Exchange Act. ¨
† The term “new or revised financial accounting standard” refers to any update issued by the Financial Accounting Standards Board to its Accounting Standards Codification after April 5, 2012.
Indicate by check mark which basis of accounting the registrant has used to prepare the financial statements included in this filing:
¨U.S. GAAP xInternational Financial Reporting Standards as issued by the International Accounting Standards Board ¨Other
If “Other” has been checked in response to the previous question, indicate by check mark which financial statement item the registrant has elected to follow.
Item 17 ¨ Item 18 ¨.
If this is an annual report, indicate by check mark whether the registrant is a shell company (as defined in Rule 12b-2 of the Exchange Act).
Yes ¨ No x
TABLE OF CONTENTS
Page
PART I INTRODUCTION 1
ITEM 1. IDENTITY OF DIRECTORS, SENIOR MANAGEMENT AND ADVISERS 1
ITEM 2. OFFER STATISTICS AND EXPECTED TIMETABLE 2
ITEM 3. KEY INFORMATION 2
A. Selected Financial Data 2
B. Capitalization and Indebtedness 4
C. Reasons for the Offer and Use of Proceeds 4
D. Risk Factors 4
ITEM 4. INFORMATION ON THE COMPANY 26
A. History and Development of the Company 26
B. Business Overview 31
C. Organizational Structure 51
D. Property, Plant and Equipment 52
ITEM 4A. UNRESOLVED STAFF COMMENTS 58
ITEM 5. OPERATING AND FINANCIAL REVIEW AND PROSPECTS 59
A. Operating Results 59
B. Liquidity and Capital Resources 88
C. Research and Development, Patents and Licenses, etc 95
D. Trend Information 97
E. Off-Balance Sheet Arrangements 100
F. Tabular Disclosure of Contractual Obligations 100
G. Safe Harbor 101
ITEM 6. DIRECTORS, SENIOR MANAGEMENT AND EMPLOYEES 101
A. Directors and Senior Management 101
B. Compensation 106
C. Board Practices 107
D. Employees 108
E. Share Ownership 111
ITEM 7. MAJOR SHAREHOLDERS AND RELATED PARTY TRANSACTIONS 113
A. Major Shareholders 113
B. Related Party Transactions 114
C. Interests of Experts and Counsel 116
ITEM 8. FINANCIAL INFORMATION 116
A. Consolidated Statements and Other Financial Information 116
i
B. Significant Changes 123
ITEM 9. THE OFFER AND LISTING 124
A. Offer and Listing Details 124
B. Plan of Distribution 125
C. Markets 125
D. Selling Shareholders 128
E. Dilution 128
F. Expenses of the Issue 128
ITEM 10. ADDITIONAL INFORMATION 128
A. Share Capital 128
B. Memorandum and Articles of Association 128
C. Material Contracts 151
D. Exchange Controls 151
E. Taxation 151
F. Dividends and Paying Agents 160
G. Statement by Experts 160
H. Documents on Display 160
I. Subsidiary Information 160
ITEM 11. QUANTITATIVE AND QUALITATIVE DISCLOSURES ABOUT MARKET RISK 160
ITEM 12. DESCRIPTION OF SECURITIES OTHER THAN EQUITY SECURITIES 169
A. Debt Securities 169
B. Warrants and Rights 169
C. Other Securities 169
D. American Depositary Shares 169
PART II 170
ITEM 13. DEFAULTS, DIVIDEND ARREARAGES AND DELINQUENCIES 170
ITEM 14. MATERIAL MODIFICATIONS TO THE RIGHTS OF SECURITY HOLDERS AND USE OF PROCEEDS 170
ITEM 15. CONTROLS AND PROCEDURES 170
A. Disclosure Controls and Procedures 170
B. Management’s Annual Report on Internal Control Over Financial Reporting 171
C. Attestation Report of the Registered Public Accounting Firm 172
D. Changes in Internal Control Over Financial Reporting 172
ITEM 16. [RESERVED] 172
ITEM 16A. AUDIT COMMITTEE FINANCIAL EXPERT 172
ITEM 16B. CODE OF ETHICS 172
ITEM 16C. PRINCIPAL ACCOUNTANT FEES AND SERVICES 173
ii

ITEM 16D. EXEMPTIONS FROM THE LISTING STANDARDS FOR AUDIT COMMITTEES 174
ITEM 16E. PURCHASES OF EQUITY SECURITIES BY THE ISSUER AND AFFILIATED PURCHASERS 174
ITEM 16F. CHANGE IN REGISTRANT’S CERTIFYING ACCOUNTANT 174
ITEM 16G. CORPORATE GOVERNANCE 174
ITEM 16H. MINE SAFETY DISCLOSURE 176
PART III 176
ITEM 17. FINANCIAL STATEMENTS 176
ITEM 18. FINANCIAL STATEMENTS 176
ITEM 19. EXHIBITS 176
INDEX TO FINANCIAL STATEMENTS 177
iii
Table of Contents
PART I
INTRODUCTION
Unless otherwise indicated, all references herein to (1) “BRF” are references to BRF S.A., a corporation organized under the laws of the Federative Republic of Brazil (“Brazil”), and its consolidated subsidiaries, (2)the “Company,” “we,” “us,” “our” or “our company” are references to BRF, and (3) “common shares” are references to the Company’s authorized and outstanding common stock, designated ordinary shares ( açõesordinárias), each without par value. All references herein to the “ real,” “ reais” or “R$” are to the Brazilian real, the official currency of Brazil. All references to “U.S. dollars,” “dollars” or “U.S.$” are to the United States dollar. Sadia S.A. (“Sadia”), formerly our wholly-owned subsidiary, was incorporated by BRF on December 31, 2012.
Market data and certain industry forecasts used herein were obtained from internal surveys, market research, publicly available information and industry publications. While we believe that market research, publiclyavailable information and industry publications we use are reliable, we have not independently verified market and industry data from third-party sources. Moreover, while we believe our internal surveys are reliable, theyhave not been verified by any independent source.
We have made rounding adjustments to reach some of the figures included herein. As a result, numerical figures shown as totals in some tables may not be an arithmetic aggregation of the figures that preceded them.
Forward-Looking Statements
This Annual Report on Form 20-F contains information that constitute forward-looking statements. They appear in a number of places and include statements regarding the intent, belief or current expectations of theCompany, its directors or its executive officers with respect to (i) the implementation of the principal operating strategies of the Company, including integration of current acquisitions as well as the conclusion of acquisitionsor joint venture transactions or other investment opportunities that may occur in the future, (ii) general economic, political and business conditions in our company’s markets, both in Brazil and abroad, (iii) the cyclicality andvolatility of raw materials and selling prices, (iv) health risks related to the food industry, (v) the risk of outbreak of animal diseases (vi) more stringent trade barriers in key export markets and increased regulation of foodsafety and security, (vii) strong international and domestic competition, (viii) interest rate fluctuations, inflation and exchange rate movements of the real in relation to the U.S. dollar and other currencies, (ix) the declarationor payment of dividends, (x) the direction and future operation of the Company, (xi) the implementation of the Company’s financing strategy and capital expenditure plans, (xii) the Company’s financial condition or results ofoperations and (xiii) other factors identified or discussed under “Item 3. Key Information––D. Risk Factors.”
Prospective investors are cautioned that any such forward-looking statements are not guarantees of future performance and involve risks and uncertainties, and that actual results may differ materially from those inthe forward-looking statements. The accompanying information contained in this Annual Report on Form 20-F, including without limitation the information set forth under the heading “Item 5. Operating and FinancialReview and Prospects,” identifies important factors that could cause such differences. In light of the risks, uncertainties and assumptions associated with forward-looking statements, you should not place undue reliance onany forward-looking statements. Additional risks that we may currently deem immaterial or that are not presently known to us could also cause the forward-looking events discussed in this Annual Report on Form 20-F not tooccur.
Our forward-looking statements speak only as of the date of this Annual Report on Form 20-F or as of the date they are made, and except as otherwise required by applicable securities laws, the Company undertakesno obligation to publicly update any forward-looking statement, whether because of new information, future events or otherwise.
ITEM 1. IDENTITY OF DIRECTORS, SENIOR MANAGEMENT AND ADVISERS
Not applicable.
1
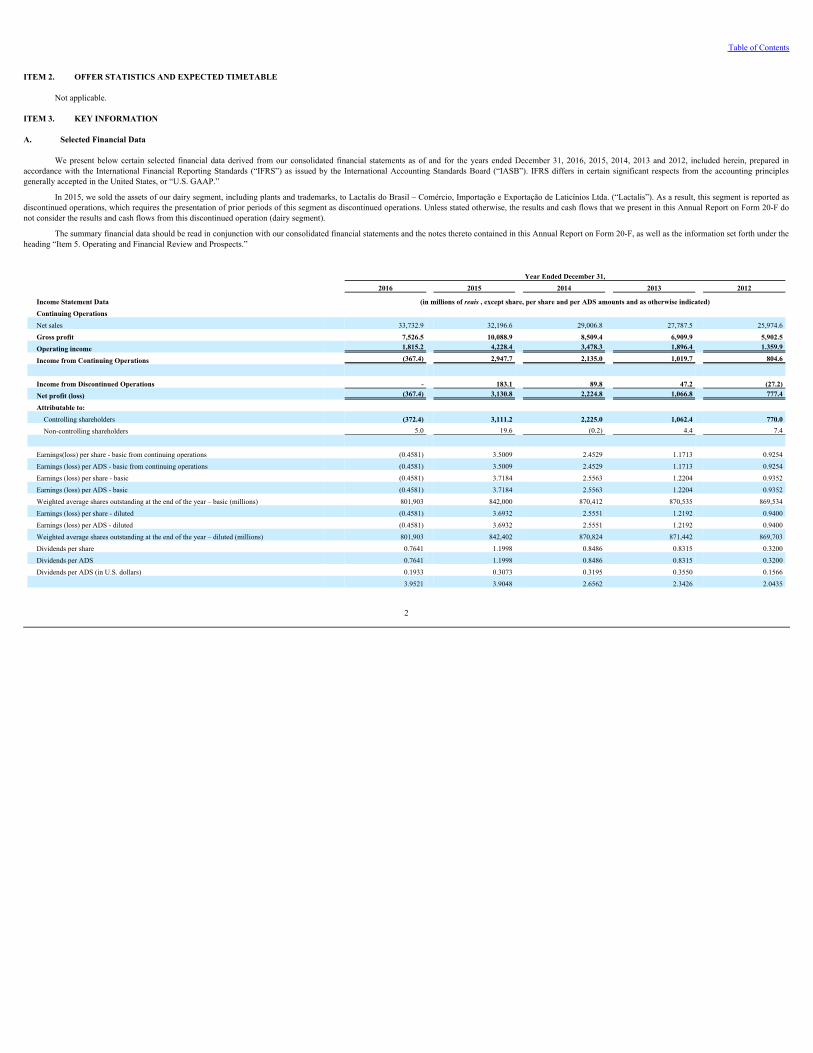
Table of Contents
ITEM 2. OFFER STATISTICS AND EXPECTED TIMETABLE
Not applicable.
ITEM 3. KEY INFORMATION
A. Selected Financial Data
We present below certain selected financial data derived from our consolidated financial statements as of and for the years ended December 31, 2016, 2015, 2014, 2013 and 2012, included herein, prepared inaccordance with the International Financial Reporting Standards (“IFRS”) as issued by the International Accounting Standards Board (“IASB”). IFRS differs in certain significant respects from the accounting principlesgenerally accepted in the United States, or “U.S. GAAP.”
In 2015, we sold the assets of our dairy segment, including plants and trademarks, to Lactalis do Brasil – Comércio, Importação e Exportação de Laticínios Ltda. (“Lactalis”). As a result, this segment is reported asdiscontinued operations, which requires the presentation of prior periods of this segment as discontinued operations. Unless stated otherwise, the results and cash flows that we present in this Annual Report on Form 20-F donot consider the results and cash flows from this discontinued operation (dairy segment).
The summary financial data should be read in conjunction with our consolidated financial statements and the notes thereto contained in this Annual Report on Form 20-F, as well as the information set forth under theheading “Item 5. Operating and Financial Review and Prospects.”
Year Ended December 31, 2016 2015 2014 2013 2012
Income Statement Data (in millions of reais , except share, per share and per ADS amounts and as otherwise indicated)Continuing Operations Net sales 33,732.9 32,196.6 29,006.8 27,787.5 25,974.6Gross profit 7,526.5 10,088.9 8,509.4 6,909.9 5,902.5Operating income 1,815.2 4,228.4 3,478.3 1,896.4 1.359.9
Income from Continuing Operations (367.4) 2,947.7 2,135.0 1,019.7 804.6
Income from Discontinued Operations - 183.1 89.8 47.2 (27.2)Net profit (loss) (367.4) 3,130.8 2,224.8 1,066.8 777.4
Attributable to: Controlling shareholders (372.4) 3,111.2 2,225.0 1,062.4 770.0Non-controlling shareholders 5.0 19.6 (0.2) 4.4 7.4
Earnings(loss) per share - basic from continuing operations (0.4581) 3.5009 2.4529 1.1713 0.9254Earnings (loss) per ADS - basic from continuing operations (0.4581) 3.5009 2.4529 1.1713 0.9254Earnings (loss) per share - basic (0.4581) 3.7184 2.5563 1.2204 0.9352Earnings (loss) per ADS - basic (0.4581) 3.7184 2.5563 1.2204 0.9352Weighted average shares outstanding at the end of the year – basic (millions) 801,903 842,000 870,412 870,535 869,534Earnings (loss) per share - diluted (0.4581) 3.6932 2.5551 1.2192 0.9400Earnings (loss) per ADS - diluted (0.4581) 3.6932 2.5551 1.2192 0.9400Weighted average shares outstanding at the end of the year – diluted (millions) 801,903 842,402 870,824 871,442 869,703Dividends per share 0.7641 1.1998 0.8486 0.8315 0.3200Dividends per ADS 0.7641 1.1998 0.8486 0.8315 0.3200Dividends per ADS (in U.S. dollars) 0.1933 0.3073 0.3195 0.3550 0.1566
3.9521 3.9048 2.6562 2.3426 2.0435
2
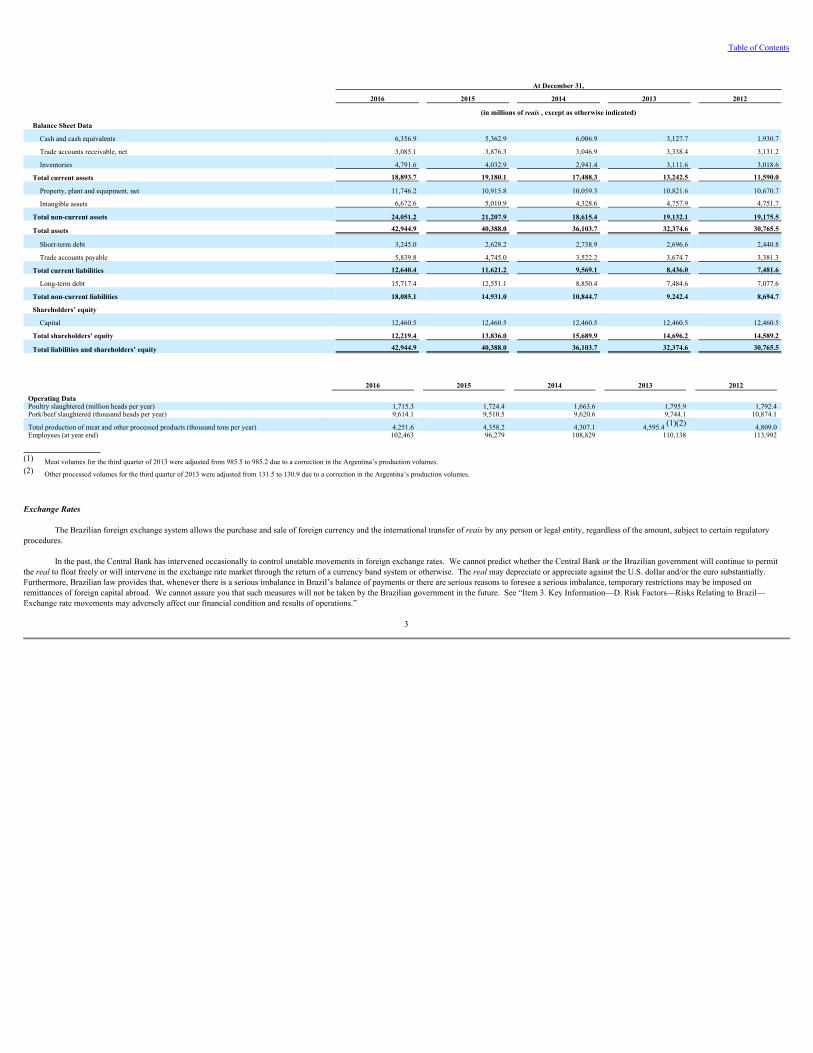
Table of Contents
At December 31,
2016 2015 2014 2013 2012
(in millions of reais , except as otherwise indicated)
Balance Sheet Data Cash and cash equivalents 6,356.9 5,362.9 6,006.9 3,127.7 1,930.7
Trade accounts receivable, net 3,085.1 3,876.3 3,046.9 3,338.4 3,131.2
Inventories 4,791.6 4,032.9 2,941.4 3,111.6 3,018.6
Total current assets 18,893.7 19,180.1 17,488.3 13,242.5 11,590.0
Property, plant and equipment, net 11,746.2 10,915.8 10,059.3 10,821.6 10,670.7
Intangible assets 6,672.6 5,010.9 4,328.6 4,757.9 4,751.7
Total non-current assets 24,051.2 21,207.9 18,615.4 19,132.1 19,175.5
Total assets 42,944.9 40,388.0 36,103.7 32,374.6 30,765.5
Short-term debt 3,245.0 2,628.2 2,738.9 2,696.6 2,440.8
Trade accounts payable 5,839.8 4,745.0 3,522.2 3,674.7 3,381.3
Total current liabilities 12,640.4 11,621.2 9,569.1 8,436.0 7,481.6
Long-term debt 15,717.4 12,551.1 8,850.4 7,484.6 7,077.6
Total non-current liabilities 18,085.1 14,931.0 10,844.7 9,242.4 8,694.7
Shareholders’ equity Capital 12,460.5 12,460.5 12,460.5 12,460.5 12,460.5
Total shareholders' equity 12,219.4 13,836.0 15,689.9 14,696.2 14,589.2
Total liabilities and shareholders’ equity 42,944.9 40,388.0 36,103.7 32,374.6 30,765.5
2016 2015 2014 2013 2012
Operating Data Poultry slaughtered (million heads per year) 1,715.3 1,724.4 1,663.6 1,795.9 1,792.4Pork/beef slaughtered (thousand heads per year) 9,614.1 9,510.5 9,620.6 9,744.1 10,874.1
Total production of meat and other processed products (thousand tons per year) 4,251.6 4,358.2 4,307.1 4,595.4 (1)(2) 4,809.0Employees (at year end) 102,463 96,279 108,829 110,138 113,992
(1) Meat volumes for the third quarter of 2013 were adjusted from 985.5 to 985.2 due to a correction in the Argentina’s production volumes.(2) Other processed volumes for the third quarter of 2013 were adjusted from 131.5 to 130.9 due to a correction in the Argentina’s production volumes.
Exchange Rates
The Brazilian foreign exchange system allows the purchase and sale of foreign currency and the international transfer of reaisby any person or legal entity, regardless of the amount, subject to certain regulatoryprocedures.
In the past, the Central Bank has intervened occasionally to control unstable movements in foreign exchange rates. We cannot predict whether the Central Bank or the Brazilian government will continue to permitthe realto float freely or will intervene in the exchange rate market through the return of a currency band system or otherwise. The realmay depreciate or appreciate against the U.S. dollar and/or the euro substantially. Furthermore, Brazilian law provides that, whenever there is a serious imbalance in Brazil’s balance of payments or there are serious reasons to foresee a serious imbalance, temporary restrictions may be imposed onremittances of foreign capital abroad. We cannot assure you that such measures will not be taken by the Brazilian government in the future. See “Item 3. Key Information—D. Risk Factors—Risks Relating to Brazil—Exchange rate movements may adversely affect our financial condition and results of operations.”
3
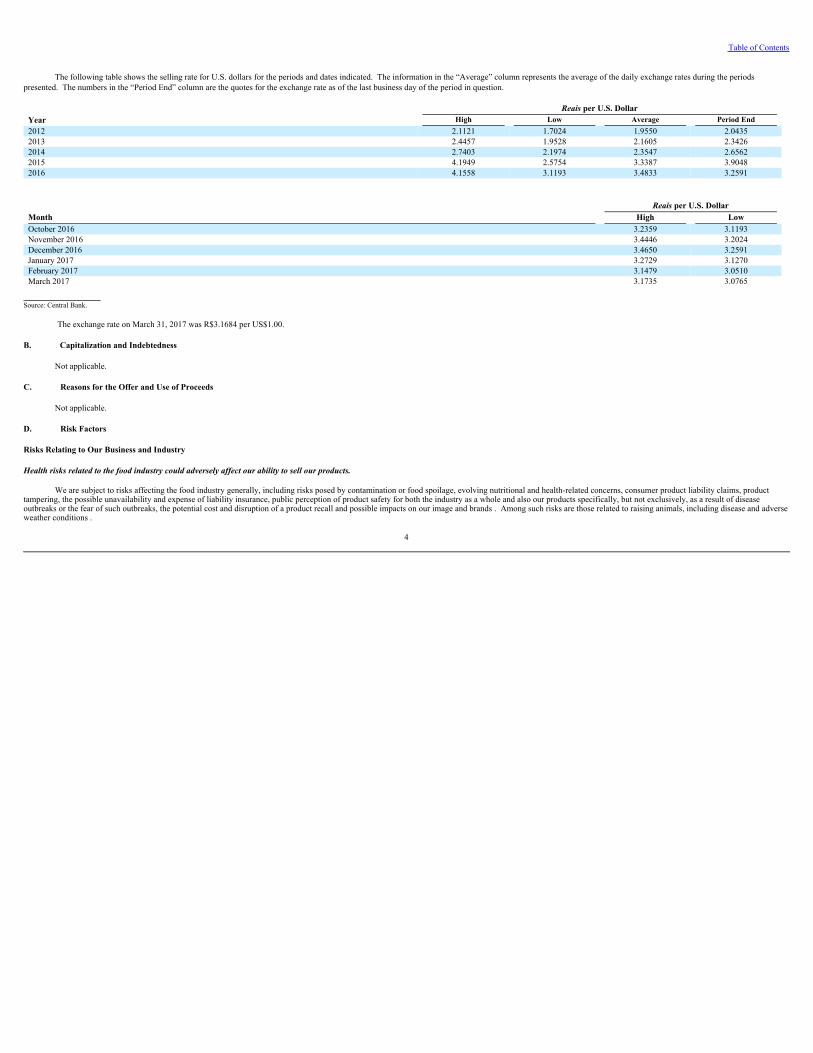
Table of Contents
The following table shows the selling rate for U.S. dollars for the periods and dates indicated. The information in the “Average” column represents the average of the daily exchange rates during the periods
presented. The numbers in the “Period End” column are the quotes for the exchange rate as of the last business day of the period in question.
Reais per U.S. DollarYear High Low Average Period End2012 2.1121 1.7024 1.9550 2.04352013 2.4457 1.9528 2.1605 2.34262014 2.7403 2.1974 2.3547 2.65622015 4.1949 2.5754 3.3387 3.90482016 4.1558 3.1193 3.4833 3.2591
Reais per U.S. DollarMonth High LowOctober 2016 3.2359 3.1193November 2016 3.4446 3.2024December 2016 3.4650 3.2591January 2017 3.2729 3.1270February 2017 3.1479 3.0510March 2017 3.1735 3.0765
Source: Central Bank.
The exchange rate on March 31, 2017 was R$3.1684 per US$1.00. B. Capitalization and Indebtedness
Not applicable.
C. Reasons for the Offer and Use of Proceeds
Not applicable.
D. Risk Factors
Risks Relating to Our Business and Industry
Health risks related to the food industry could adversely affect our ability to sell our products.
We are subject to risks affecting the food industry generally, including risks posed by contamination or food spoilage, evolving nutritional and health-related concerns, consumer product liability claims, producttampering, the possible unavailability and expense of liability insurance, public perception of product safety for both the industry as a whole and also our products specifically, but not exclusively, as a result of diseaseoutbreaks or the fear of such outbreaks, the potential cost and disruption of a product recall and possible impacts on our image and brands . Among such risks are those related to raising animals, including disease and adverseweather conditions .
4
Table of Contents
Meat is subject to contamination during processing and distribution. In particular, processed meat may become exposed to various disease-producing pathogens, including listeria monocytogenes, salmonella and
generic E. coli. These pathogens can also be introduced to our products during production or as a result of improper handling by third-party food processors, franchisees, distributors, foodservice providers or consumers.Spoilage, especially spoilage due to failure of temperature-control storage and transportation systems, is also a risk. We maintain systems designed to monitor food safety risks throughout all stages of production anddistribution, but these systems could fail to function properly and product contamination could still occur. Failures in our systems to ensure food safety could result in harmful publicity that could cause damage to our brands,reputation and image and negatively impact sales, which could have a material adverse impact on our business, results of operations, financial condition and prospects.
Even if our own products are not affected by contamination, our industry may face adverse publicity in certain of its markets if the products of other producers become contaminated, which could result in negative
public perception about the safety of our products and reduced consumer demand for our products in the affected category . Significant lawsuits, widespread product recalls, and other negative events faced by us or ourcompetitors could result in a widespread loss of consumer confidence in the safety and quality of our products. Our sales are ultimately dependent on consumer preferences, and any actual or perceived health risks associatedwith our products could cause customers to lose confidence in the safety and quality of our products and have a material adverse impact on our business, results of operations, financial condition and prospects.
Raising animals and meat processing involve animal health and disease control risks, which could have an adverse impact on our results of operations and financial condition.
Our operations involve raising poultry and hogs and processing their meat, which require us to maintain certain standards of animal health and control disease. We could be required to destroy animals or suspend thesale or export of some of our products to customers in Brazil and abroad, in the event of an outbreak of disease affecting animals, such as the following: (1) in the case of hogs and certain other animals, foot-and-mouthdisease and A(H5N1) influenza (discussed below); and (2) in the case of poultry, avian influenza and Newcastle disease. In addition, if the Porcine Reproductive and Respiratory Syndrome and Porcine Epidemic Diarrhea,which have broken out in Europe and the United States, were to outbreak in Brazil, we could be required to destroy hogs, however currently there is no legislation supporting this action. Destruction of poultry, hogs or otheranimals would preclude recovery of costs incurred in raising or purchasing these animals and result in additional expense for the disposal of such animals and loss of inventory. An outbreak of foot-and-mouth disease couldhave an effect on livestock we own, the availability of livestock for purchase. Also, the global effects of avian influenza would impact consumer perception of certain protein products and our ability to access certain markets,which would adversely affect our results of operations and financial condition.
Outbreaks, or fears of outbreaks, of any animal diseases may lead to cancellation of orders by our customers and, particularly if the disease has the potential to affect humans, create adverse publicity that may have amaterial adverse effect on consumer demand for our products. Moreover, outbreaks of animal diseases in Brazil may result in foreign governmental action to close export markets to some or all of our products, whichmay result in the destruction of some or all of these animals. Our poultry business in Brazilian and export markets could also be negatively affected by avian influenza.
Chicken and other birds in some countries, particularly in Asia but also in Europe, the Americas and Africa, have on occasion become infected by highly pathogenic avian influenza in recent years. In a small numberof highly-publicized cases, the avian influenza has been transmitted from birds to humans, resulting in illness and, at times, death. Accordingly, health authorities in many countries have taken steps to prevent outbreaks of thisviral disease, including destruction of afflicted poultry flocks.
5
Table of Contents
Between 2003 and the first week of 2017, there have been 856 human cases of avian influenza and 452 related deaths, according to the World Health Organization (“WHO”). The cases reported were caused by the
H5N1 virus. In 2013, direct human-to-human transmission of the H7N9 virus was proven. Various countries in Asia, the Middle East and Africa reported human cases in the last five years and various European countriesreported avian flu cases in poultry. In 2014, there were reports of human cases of avian influenza in Egypt, Indonesia, Cambodia, China and Vietnam. In the Americas, there were reports of human cases of avian influenza inboth Canada and the United States. In early 2015, new cases of H5N1 and H5N2 reported in the United States resulted in restrictions on US exports. In 2016, new outbreaks occurred in bird populations across NorthernEurope, including France, the Netherlands, Switzerland, Finland, and Germany. Middle Eastern and African countries also had outbreaks during 2016.
To date, Brazil has not had a documented case of avian influenza, although there are concerns that an outbreak of avian influenza may occur in the country in the future. Any outbreak of avian influenza in Brazilcould lead to required destruction of our poultry flocks, which would result in decreased sales in the poultry industry, prevent recovery of costs incurred in raising or purchasing poultry, and result in additional expense for thedisposal of destroyed poultry. In addition, any outbreak of avian influenza in Brazil would likely lead to immediate restrictions on the export of some of our products to key export markets. Preventive actions adopted byBrazilian authorities, if any, may not be effective in precluding the spread of avian influenza within Brazil. In early 2017, Chile, a neighboring country, confirmed the occurrence of avian influenza.
Whether or not an outbreak of avian influenza occurs in Brazil, further outbreaks of avian influenza anywhere in the world could have a negative impact on the consumption of poultry in our key export markets or inBrazil, and a significant outbreak would negatively affect our results of operation and financial condition. Any outbreak could lead to the imposition of costly preventive controls on poultry imports in our export markets.Accordingly, any spread of avian influenza, or increasing concerns about this disease, may have a material and adverse effect on our company.
We may also be subject from time to time to additional outbreaks of animal-related diseases, such as Porcine Epidemic Diarrhea and foot-and-mouth disease affecting cattle. See “Item 5: Operating and FinancialReview and Prospects—A. Operating Results—Effect of Animal Diseases—Other Animal Diseases” for further information.
Climate change may negatively affect our business and results of operations.
We consider the potential effects of climate change when evaluating and managing our operations and supply chain, recognizing the vulnerability of natural resources and agricultural inputs that are essential for ouractivities. The main risks we have identified relate to the alterations in temperature (average and extreme), changes in rainfall (average and extreme, such as drought, flooding and storms) and lack of water , which could affectagricultural productivity, the quality and availability of pasture areas, animal wellbeing and the availability of energy. These changes could have a direct impact on our costs, raising the price of agricultural commodities as aresult of long periods of drought or excessive rainfall, increasing operating costs to ensure animal wellbeing, increasing the risk of rationing and raising the price of electrical energy through water shortages and the need forother energy sources to supply the demand for electricity. We also consider potential regulatory changes and monitor trends in changes to licensing legislation for greenhouse gas emissions at the domestic and internationallevels.
Our operations are largely dependent on electricity, and energy-related expenses are one of our highest fixed costs. Energy costs have historically fluctuated significantly over time, and increases in energy costs could
result in reduced profits. A significant interruption in power supply or outright loss of power at any of our production facilities or distribution centers could result in a temporary disruption in production and delivery ofproducts to customers and additional costs.
6
Table of Contents
A significant portion of Brazil’s installed electric generation capacity is currently dependent upon hydroelectric generation facilities. Hydroelectric production is vulnerable to a variety of factors, including water
supply. If the amount of water available to energy producers becomes increasingly scarce due to drought or diversion for other uses, as has occurred in recent years, our energy expenses may increase. For example, followingthe 2015 drought conditions in the Southeast of Brazil, the availability of power generation from hydroelectric sources was reduced.
Although Brazil holds nearly a fifth of the world’s water reserves, the World Bank warned in August 2016 that water crises, such as the ones recently experienced in São Paulo, Rio de Janeiro and Minas Gerais,
could become commonplace in Brazil over the next four decades. The severe drought in Brazil in 2014 to 2015 was the region’s worst in 80 years, affecting farm and factory output while driving up the price of corn. Althoughwe use a methodology developed by us to evaluate water-related risks in our areas of operation, this methodology may fail to accurately assess the water supply or anticipate water-related risks. This could result in us or ourkey suppliers encountering water shortages. In addition, the increased industrial use of water by water-intensive business may also adversely affect the continuing availability and quality of water in Brazil. Whetherunexpected or expected, the shortage or lack of water could materially adversely affect our business and results of operations.
Among the initiatives we have taken to reduce our exposure to climate change and to maintain our competitiveness in terms of costs is the monitoring of stocks in grains purchases and the constant monitoring of the
weather in agricultural regions to guide buying decisions, as well as anticipating price movements in the commodity markets. We also undertake efficiency projects to develop more efficient processes that consume lessenergy. Other initiatives include technological innovations in the animal-raising installations to improve the environment and acclimatization and safeguard the animal’s wellbeing. We may fail to continue to implementprograms to mitigate effects of climate change, which may affect our business and results of operations in the future.
Any shortage or lack of water could materially adversely affect our business and results of operations.
A study conducted by the Food and Agriculture Organization indicates that, in the next two decades, the demand for water will increase 50% on a global scale. In connection with that, it is estimated that by 2025, 1.8billion people will live in places with absolute shortage of water and two thirds of the global population will live in water-stressed places. By 2050, the demand for water will jump 55%, according to the Food and AgricultureOrganization, on a global scale, including some of our key markets, such as North Africa and the Middle East. Water is an essential raw material for our businesses, being present from the production of grains and inputs, theagricultural chain through our production processes. As a result, the shortage or lack of water represents a critical risk for our business. On the other hand, we are aware that the industrial use of water may adversely affect itsavailability.
In order to mitigate these risks, in 2015, we began developing a methodology to evaluate water-related risks in the locations where we have operations in order to understand the specific impacts of our company and
others in those regions and, consequently, reduce our water consumption and exposure to water supply risks in each location. It is an initiative regarding water-related risks through which we can assess internal and externalaspects impacting water supply and quality and generate a score for each unit. The objective is to carry out internal and external actions to reduce consumption and comply with applicable rules in order to minimize our impacton the environment and the community. We analyzed the micro and macro watersheds composing the region, as well as the industrial activities and characteristics of the use of water resources, in order to understand the localdemand growth, anticipating risks. In 2016, we conducted a vulnerability assessment in all productive units in Brazil. As the methodology is composed of internal and external aspects, we applied a complete assessment forthe internal aspects, in which the data was available in its entirety. For the external aspects, which involve information of river basins, information was difficult to obtain, which led us to review indicators in order to have datafor all units. The assessment for external aspects will be fully applied in 2017.
The shortage or lack of water could materially adversely affect our business and results of operations.
7
Table of Contents
We have a governance structure and compliance processes designed to sustain our positive image and reputation in the marketplace, but they may fail to ensure compliance with relevant anti-corruption, anti-bribery,anti-money laundering and other international trade laws and regulations.
We have a framework of antifraud initiatives - including anti-bribery and anti-corruption - that supports all business segments and their commercial standards worldwide. However, we may not be able to mitigate allfraud risk entirely. Any negative reflection on our image or our brand from these or other activities could have a negative impact on our results of operations, as well as our ability to achieve our growth strategy.
We are subject to anticorruption, anti-bribery, anti-money laundering and other international trade laws and regulations. We are required to comply with the laws and regulations of Brazil and various jurisdictionswhere we conduct operations. In particular, we are subject to the Brazilian Anti-Corruption Law nº 12,846, the U.S. Foreign Corrupt Practices Act of 1977 ( “FCPA”), the United Kingdom Bribery Act of 2010, as well aseconomic sanction programs, including those administered by the United Nations, the European Union and the United States, including the U.S. Treasury Department’s Office of Foreign Assets Control (“OFAC”). The FCPAprohibits providing anything of value to foreign officials for the purposes of obtaining or retaining business or securing any improper business advantage. As part of our business, we may deal with entities and employees thatare considered foreign officials for purposes of the FCPA. In addition, economic sanctions programs restrict our dealings with certain sanctioned countries, individuals and entities.
Although we have internal policies and procedures designed to ensure compliance with applicable anti-fraud, anti-bribery and anti-corruption laws and sanctions regulations, potential violations of anti-corruption
laws have been identified on occasion as part of our compliance and internal control processes. In addition, we were recently notified of allegations involving potential misconduct by some of our employees in the context ofthe “Weak Flesh Operation.” For more details, see “Item 8. Financial Information – B. Significant Changes.”
When allegations of non-compliance with applicable anti-fraud, anti-bribery and anti-corruption laws and sanctions regulations arise, we attempt to act promptly to learn relevant facts, conduct appropriate due
diligence, and take any appropriate remedial action to address the risk. Given the size of our operations and the complexity of the production chain, there can be no assurance our internal policies and procedures will besufficient to prevent or detect all inappropriate or unlawful practices, fraud or violations of law or our internal policies and procedures by our employees, directors, officers, partners, or any third-party agents and serviceproviders or that such persons will not take actions in violation of our policies and procedures (or otherwise in violation of the relevant anti-corruption laws and sanctions regulations) for which we or they may be ultimatelyheld responsible. Violations of anti-bribery and anti-corruption laws and sanctions regulations could have a material adverse effect on our business, reputation, brand, selling prices, results of operations and financialcondition, including as a result of the closure of international markets. We may be subject to one or more enforcement actions, investigations and proceedings by authorities for alleged infringements of these laws. Theseproceedings may result in penalties, fines, sanctions or other forms of liability. Potential bad developments in the “Weak Flesh Operation” may also negatively affect the market price of our common shares and ADRs. Our failure to continually innovate and successfully launch new products, as well as maintain our brand image, could adversely impact our operating results.
Our financial success depends on our ability to anticipate changes in consumer preferences and dietary habits and our ability to successfully develop and launch new products and product variations that are desirableto consumers. We devote significant resources to new product development and product extensions; however, we may not be successful in developing innovative new products or our new products may not be commerciallysuccessful. For example, trends towards prioritizing health and wellness present a challenge for developing and marketing successful new lines of products to address these consumer preferences. To the extent that we are notable to effectively gauge the direction of our key markets and successfully identify, develop, manufacture and market new or improved products in these changing markets, in a timely or cost-effective manner, our products,brands, our financial results and our competitive position may suffer, which could have a material adverse effect on our business, results of operations, financial condition and prospects.
8
Table of Contents
We also seek to maintain and extend the image of our brands through marketing, including advertising, consumer promotions and trade spending. Due to inherent risks in the marketplace associated with advertising,
promotions and new product introductions, including uncertainties about trade and consumer acceptance, our marketing investments may not prove successful in maintaining or increasing our market share. Continuing globalfocus on health and wellness, including weight management, increasing media attention to the role of food marketing and bad press about our quality controls and products, including in connection with the “Weak FleshOperation,” could adversely affect our brand image or lead to stricter regulations and greater scrutiny of food marketing practices.
Our success in maintaining, extending and expanding our brand image also depends on our ability to adapt to a rapidly changing media environment, including increasing reliance on social media and onlinedissemination of advertising campaigns. The growing use of social and digital media increases the speed and extent that information or misinformation and opinions can be shared.
Negative posts or comments about us, our brands or our products on social or digital media could seriously damage our reputation and brand image. If we do not maintain or improve our brand image, then ourproduct sales, financial condition and results of operations could be materially and adversely affected.
Recent and future acquisitions or joint ventures may divert management resources or prove to be disruptive to our company.
We regularly review and pursue opportunities for strategic growth through acquisitions, joint ventures and other initiatives. We have completed several acquisitions in recent years, such as Golden Foods Siam(“GFS”) in Thailand, Campo Austral and Calchaqui in Argentina, Universal Meats in the United Kingdom, Al Khan Foodstuff LLC (“AFK”) in Oman, and Qatar National Import and Export Co.’s (“QNIE”) frozendistribution business in Qatar. We have also entered into an agreement with FFM Berhad providing for cooperation in FFM Further Processing SDN BHD and an agreement to acquire Banvit in Turkey, (the completion of thistransaction is subject to the satisfaction of the conditions precedent set forth in the definitive documents, including anti-trust approvals). F or more details on these and other transactions, see “Item 4. Information on theCompany—A. History and Development of the Company—Other Acquisitions and Investments in 2016.” Acquisitions, new businesses and joint ventures, especially involving sizeable enterprises, may present financial,managerial, operational and compliance risks and uncertainties, including:
challenges in realizing the anticipated benefits of the transaction; diversion of management attention from existing businesses; difficulty with integrating personnel, especially to different managerial practices; disruptions when integrating financial, technological and other systems;
9
Table of Contents
difficulty identifying suitable candidate businesses or consummating a transaction on terms that are favorable to us; challenges in retaining an acquired company’s customers and key employees; increased compensation expenses for newly-hired employees; exposure to unforeseen liabilities or problems of the acquired companies or joint ventures; warranty claims and claims for damages which may be limited in content, timeframe and amount; challenges arising from a lack of familiarity with new markets with differing commercial and social norms and customs ,which may adversely impact our strategic goals or require us to adapt our marketingand sales model for specific countries; compliance with foreign legal and regulatory systems; and difficulties in transferring capital to new jurisdictions.
Acquisitions outside of Brazil may present additional difficulties and new political and countries risks, such as compliance with foreign legal and regulatory systems, difficulties to transfer capital, integration ofpersonnel to different managerial practices and would increase our exposure to risks associated with international operations.
We may be unable to realize synergies and efficiency gains from our recent acquisitions in the timeframe we anticipate or at all, because of integration or other challenges. In addition, we may be unable to identify,negotiate or finance future acquisitions or other strategic initiatives particularly as part of our international growth strategy, successfully or at favorable terms, or to effectively integrate these acquisitions or joint venturebusinesses with our current businesses. Any future joint ventures or acquisitions of businesses, technologies, services or products might require us to obtain additional equity or debt financing, which may not be available onfavorable terms, or at all. Future acquisitions and joint ventures may also result in unforeseen operating difficulties and expenditures, as well as strain on our organizational culture.
Political and economic risks in regions and countries where we have exposure could limit the profitability of our operations and our ability to execute our strategy in these regions.
Since we have expanded our operations around the world, we are subject to a variety of situations that may adversely affect our financial results. In the regions where we have production and distribution activities,we are subject, among others, to the following risks:
governmental inertia; geopolitical risk (including terrorism); imposition of exchange or price controls; imposition of restrictions on exports of our products or imports of raw materials necessary for our production; fluctuation of local currencies against the real;
10
Table of Contents
nationalization of our property; increase in export tax and income tax rates for our products; and unilateral (governmental) institutional and contractual changes, including controls on investments and limitations on new projects.
As a result of these factors, our results of operations and financial condition in the regions where we have production and distribution activities may be adversely affected, and we may experience in the futuresignificant variability in our revenue on both an annual and a quarterly basis from those operations. The impact of these changes on our ability to deliver on our planned projects and execute our strategy cannot be ascertainedwith any degree of certainty, and these changes may, therefore, have an adverse effect on our operations and financial results.
Deterioration of general economic and political conditions could negatively impact our business.
Our business may be adversely affected by changes in Brazilian and global economic and political conditions, which may result in increased volatility in our markets and contribute to net losses . Since the end of2015, the price of oil has declined significantly and has led to lower economic growth in relevant oil-dependent regions, such as several countries in the Middle East, Russia, Venezuela and Angola. Thus, per capita meatconsumption in these areas could be affected as well. In addition, concerns about the Chinese economy and its inability to grow at rates as high as the ones we had in prior years could affect the prices and consumption of allcommodities, including chicken and hogs. Because of the global nature of our business, we remain subject to the risk of economic volatility worldwide, and economic and political disruptions around the world can have amaterial adverse effect on our business and results of operations.
Furthermore, on June 23, 2016, the United Kingdom held an in-or-out referendum on the United Kingdom’s membership within the European Union, the result of which favored the exit of the United Kingdom fromthe European Union, or “Brexit.” A process of negotiation will determine the future terms of the United Kingdom’s relationship with the European Union. The potential impact of Brexit on our market share, sales, profitabilityand results of operations is unclear. Depending on the terms of Brexit, economic conditions in the United Kingdom, the European Union and global markets may be adversely affected by reduced growth and volatility. Theuncertainty before, during and after the period of negotiation could also have a negative economic impact and increase volatility in the markets, particularly in the Eurozone. The volatility and negative economic impact thatmay result not only from Brexit, but also from the European elections in 2017 could adversely affect our business.
Our results of operations are subject to cyclicality and volatility affecting both our raw material prices and our selling prices.
Our business is largely dependent on the cost and supply of corn, soy meal, soybeans, hogs and other raw materials, as well as the selling prices of our poultry and pork. These prices are determined by supply anddemand, which may fluctuate significantly, and other factors over which we have little or no control. These other factors include, among others, fluctuations in local and global poultry and hog production levels,environmental and conservation regulations, economic conditions, weather, animal and crop diseases, cost of international freight and exchange rate and interest rate fluctuations.
Our industry, both in Brazil and abroad, is generally characterized by cyclical periods of higher prices and profitability, followed by overproduction, leading to periods of lower prices and profitability. We are notable to mitigate these risks entirely.
11
Table of Contents
Natural disasters, pandemics or extreme weather, including floods, excessive cold or heat, hurricanes or other storms, as well as any interruption we can observe in our plants that may require the temporary re-
allocation of plant functions to other facilities could impair the health or growth of livestock or interfere with our operations due to power outages, damage to our production and processing facilities or disruption intransportation channels or information systems, among other issues.
Our international sales are subject to a broad range of risks associated with international operations.
International sales account for a significant portion of our net sales in line with our global strategy, representing 46.8% in 2014, 50.2 % in 2015 and 52.3% in 2016. Our major international markets include the MiddleEast (particularly Saudi Arabia), Asia (particularly Japan, Hong Kong, Singapore and China), Europe, Eurasia (particularly Russia) Africa and Americas (particularly Argentina), where we are subject to many of the samerisks described below in relation to Brazil. Our future financial performance will depend, to a significant extent, on the economic, political and social conditions in our main export markets.
Our future ability to conduct business in our export markets could be adversely affected by factors beyond our control, such as the following:
exchange rate and interest rate fluctuations; commodities price volatility; deterioration in international economic conditions; political risks, such as turmoil, government policies, difficulties to transfer capital and political instability; decreases in demand, particularly from large markets such as China; imposition of increased tariffs, anti-dumping duties or other trade barriers; strikes or other events affecting ports and other transport facilities; compliance with differing foreign legal and regulatory regimes; strikes, not only of our employees, but also of port employees, truck drivers, customs agents, sanitary inspection agents and other government agents at the Brazilian ports from which we export ourproducts; sabotage affecting our products; and bad press related to the Brazilian meat processing industry, including in connection with the “Weak Flesh Operation.”
The market dynamics of our important export markets can change quickly and unpredictably due to these factors, the imposition of trade barriers of the type described above and other factors, which together cansignificantly affect our export volumes, selling prices and results of operations.
12
Table of Contents
Any of these risks could adversely affect our business and results of operations. In addition, flooding and similar events affecting the infrastructure necessary for the export of our products could adversely affect our
revenues and results of operations.
More stringent trade barriers in key export markets may negatively affect our results of operations.
Because of the growing market share of Brazilian poultry, pork and beef products in the international markets, Brazilian exporters are increasingly being affected by measures taken by importing countries to protectlocal producers. The competitiveness of Brazilian companies has led certain countries to establish trade barriers to limit the access of Brazilian companies to their markets. Trade barriers can consist of both tariffs and non-tariff barriers. In our industry, non-tariff barriers are a particular concern, especially sanitary and technical restrictions.
Some countries, such as Russia and South Africa, have a history of erecting trade barriers to imports of food products. In Europe, another of our key markets, the European Union has adopted a quota system forcertain chicken products and prohibitive tariffs for certain products that do not have quotas in order to mitigate the effects of Brazil’s lower production costs on local producers over European producers.
Many developed countries use direct and indirect subsidies to enhance the competitiveness of their producers in other markets. In addition, local producers in some markets may exert political pressure on theirgovernments to prevent foreign producers from exporting to their market, particularly during unfavorable economic conditions. Any of the above restrictions could substantially affect our export volumes and, consequently,our export sales and financial performance. If new trade barriers arise in our key export markets, we may face difficulties in reallocating our products to other markets on favorable terms, and our business, financial conditionand results of operations might be adversely affected.
We face significant competition from Brazilian and foreign producers, which could adversely affect our financial performance.
We face strong competition from other Brazilian producers in our domestic market and from Brazilian and foreign producers in our international markets. The Brazilian market for whole poultry, poultry and porkcuts is highly fragmented. Small producers can also be important competitors, some of which operate in the informal economy and are able to offer lower prices by meeting lower quality standards. Competition from smallproducers is a primary reason why we sell most of our frozen ( innatura) meat products in the export markets and is a barrier to expanding our sales of those products in the domestic market. With respect to exports, wecompete with other large, vertically integrated Brazilian producers that have the ability to produce quality products at low cost, as well as with foreign producers.
In addition, the potential growth of the Brazilian market for processed food, poultry, pork and beef and Brazil’s low production costs are attractive to international competitors. Although the main barrier to thesecompanies has been the need to build a comprehensive distribution network and a network of outgrowers, international competitors with significant resources could undertake to build these networks or acquire and expandexisting networks.
The Brazilian poultry and pork cuts markets, in particular, are highly price-competitive and sensitive to product substitution. Even if we remain a low-cost producer, customers may seek to diversify their sources ofsupply by purchasing a portion of the products they need from producers in other countries, as some of our customers in key export markets have begun to do. We expect that we will continue to face strong competition in allof our markets and anticipate that existing or new competitors may broaden their product lines and extend their geographic scope. Any failure by us to respond to product, pricing and other moves by competitors maynegatively affect our financial performance.
13
Table of Contents
Increased regulation of food safety and animal welfare could increase our costs and adversely affect our results of operations.
Our manufacturing facilities and products are subject to Brazilian federal, state and local, as well as foreign, governmental inspections and extensive regulation in the food safety area, including governmental foodprocessing controls. We already incur significant costs in connection with the compliance with applicable rules, and changes in government regulations relating to food safety or animal welfare could require us to makeadditional investments or incur additional costs to meet the necessary specifications for our products. Our products are often inspected by foreign food safety officials, and any failure to pass those inspections can result in ourbeing required to return all or part of a shipment to Brazil, recall certain products, destroy all or part of a shipment or incur costs because of delays in delivering products to our customers. Any tightening of food safety oranimal welfare regulations could result in increased costs and could have a material adverse effect on our business and results of operations, financial condition and prospects. In addition, Brazil has no specific regulationregarding animal welfare; however, we adopt worldwide practices to serve our clients.
Our performance depends on favorable labor relations with our employees and our compliance with labor laws. Any deterioration of those relations or increase in labor costs could adversely affect our business.
As of December 31, 2016, we had approximately 102,000 employees worldwide. All of our production employees, in Brazil and in countries where there is a labor union force, are represented by labor unions. Uponthe expiration of existing collective bargaining agreements or other collective labor agreements, we may not reach new agreements without union action and any such agreements may not be on terms satisfactory to us, whichcould result in us paying higher wages or benefits to union workers. If we are unable to negotiate acceptable union agreements, we may become subject to work stoppages or strikes.
Labor costs are among our most significant expenditures. In 2016, they represented 14.2% of our cost of sales, representing a decrease of 1.2 percentage points compared to 2015. In the event of an employeecontractual structure review, additional operational expenses could be incurred. Additionally, during our normal business operation, we outsource some of our labor force, therefore being subject to the contingencies that mayarise from this relationship. These contingencies may involve claims directly against us as if we were the direct employer of those outsourced workers or claims seeking our subsidiary liability. In the event that a significantamount of these contingencies materialize in an unfavorable outcome against us, we may be held liable for amounts higher than our provisions, which may have a material adverse effect on our business, financial andoperational condition and results of operations. In addition, if the outsourced activities are deemed by the authorities to be core activities, outsourcing may be considered illegal and the outsourced workers may be consideredour employees, which would result in a significant increase in our costs and could subject us to administrative and judicial procedures by the relevant authorities and fines. We are also subject to increases in our labor costsdue to Brazilian inflation and increases in health insurance. Material increases in our labor costs could have a material adverse effect on our business, results of operations and financial condition and prospects.
Environmental laws and regulations require increasing expenditures for compliance.
We, like other Brazilian food producers, are subject to extensive Brazilian federal, state and local environmental laws, regulations, authorizations and licenses concerning, among other things, the interference withprotected areas (conservation units, archeological areas and permanent preservation areas), handling and disposal of waste, discharges of pollutants into the air, water and soil, atmospheric emissions, noise and clean-up ofcontamination, all of which affect our business. Water management is especially crucial, posing many challenges to our operations. In Brazil, water use regulations impact farming operations, industrial production andhydroelectric power. Any failure to comply with any of these laws and regulations or any lack of authorizations or licenses could result in administrative and criminal penalties, such as fines, cancellation of authorizations orrevocation of licenses, in addition to negative publicity and civil liability for remediation or compensation for environmental damage without any caps. We cannot operate a plant if the required environmental permit is notvalid or updated. Civil penalties may include summons, fines, temporary or permanent bans, the suspension of subsidies by public bodies and the temporary or permanent shutdown of commercial activities. Criminal penaltiesinclude fines, temporary interdiction of rights and prison (for individual offenders) and liquidation, temporary interdiction of rights, fines and community services (for legal entities).
14
Table of Contents
Furthermore, pursuant to Brazilian environmental legislation, the corporate entity of a company will be disregarded (such that the owners of the company will be liable for its debts) if necessary to guarantee thepayment of costs related to the recovery of environmental damages, whenever the legal entity is deemed by a court to be an obstacle to reimbursement of damages caused to the quality of the environment.
We have incurred, and will continue to incur, capital and operating expenditures to comply with these laws and regulations. Because of the possibility of unanticipated regulatory measures or other developments,particularly as environmental laws become more stringent in Brazil, the amount and timing of future expenditures required to maintain compliance could increase from current levels and could adversely affect the availabilityof funds for capital expenditures and other purposes. Compliance with existing or new environmental laws and regulations, as well as obligations in agreements with public entities, could result in increased costs andexpenses.
Our plants are subject to environmental and operational licensing, based on their pollution potential and usage of natural resources. If, for example, one of our plants is built or expanded without an environmentallicense or if our environmental licenses expire, are not timely renewed or have their request of renewal dismissed by the competent environmental authority, we may incur fines and other administrative penalties, such assuspension of operations or closing of the facilities in question. Those same penalties may also be applicable in the case of failure to fulfill the conditions of validity foreseen in the environmental licenses already held by us.Currently, some of our environmental licenses are in the renewal process, and we cannot guarantee that environmental agencies will approve our renewal requests within the required legal period. Brazilian ComplementaryLaw No. 140/2011 establishes that renewal of environmental licenses must be requested at least 120 days in advance of its expiration, so that the license may be automatically extended until a final decision from theenvironmental authority is reached. In the interim, we are permitted to continue operations under the respective license, during the renewal process. In addition, if since the issuance of a license under renewal there have beenregulatory changes in the environmental standards that the plant is required to meet, the environmental agency may condition the renewal upon expensive facility upgrades, which might result in delays or disruptions, or, inthe worst case scenario, result in a denial of the license.
Unfavorable outcomes in legal proceedings may reduce our liquidity and negatively affect us.
We are defendants in civil, labor and tax proceedings and are also subject to consent agreements ( TermodeAjustamentodeConduta, or “TAC”). Under IFRS, we classify the risk of adverse results in legalproceedings as “remote,” “possible” or “probable.” We disclose the aggregate amounts of these proceedings that we have judged possible or probable, to the extent the amounts are known or reasonably estimable, and werecord provisions only for losses that we consider probable. See “Item 8. Financial Information—Legal Proceedings” and Note 27 of our consolidated financial statements.
15
Table of Contents
We are not required to disclose or record provisions for proceedings in which our management judges the risk of loss to be possible or remote. However, the amounts involved in some of these proceedings are
substantial, and eventual losses on them could be significantly high. Even for the amounts recorded as provisions for probable losses, a judgment against us would have an impact on our cash flow if we were required to paythose amounts and the eventual losses could be higher than the provisions we have recorded. Unfavorable decisions in our legal proceedings may, therefore, reduce our liquidity and have a material adverse impact on ourbusiness, results of operations, financial condition and prospects.
With regard to tax contingencies, we are currently defendants in a number of cases, which include, for example, disputes about the offset of tax credits and the use of tax incentives in several states that have not yetreached a final ruling at Brazilian courts. In addition, we may face risks arising from potential impairment of input state VAT that we accumulate on exportations. We have a case involving Tax on the Circulation ofMerchandise and Services ( ImpostoSobreaCirculaçãodeMercadoriaseServiços), or “ICMS,” on sales of staple foods ( cestabásica) on which the Supreme Court of Brazil has ruled against us. The case is currentlypending judgement of a last appeal and, if the final decision is upheld against some or all of BRF’s operations, it could have a significant impact on our liquidity and financial results. See “Item 8. Financial Information—A.Consolidated Statements and Other Financial Information—Legal Proceedings—Tax Proceedings.”
As of December 31, 2016, we had R$122.4 million in provisions for civil contingencies, R$281.7 million in provisions for tax contingencies and R$479.6 million in provisions for labor contingencies. See Note 27 toour consolidated financial statements. We cannot assure you that we will obtain favorable decisions in these proceedings or that our reserves will be sufficient to cover potential liabilities resulting from unfavorable decisions.
We are currently being investigated in the “Weak Flesh Operation,” which may result in penalties, fines, sanctions or other forms of liability.
In addition, our ability to compete effectively depends in part on our rights to trademarks, logos and other intellectual property rights we own or license. We have not sought to register or protect every one of ourtrademarks in every country in which they are or may be used, which means that third parties may be able to limit or challenge our trademark rights there. Furthermore, because of the differences in foreign intellectualproperty or proprietary rights laws, we may not receive the same level of legal protection in every country in which we operate. Litigation may be necessary to enforce our intellectual property rights, and if we do not prevail,we could suffer a material adverse impact on our business, goodwill, financial position, results of operations and cash flows. Further, third parties may allege that our intellectual property and/or business activities infringetheir own intellectual property or proprietary rights, and any litigation in this regard would be costly, regardless of the merits. If we are unsuccessful in defending any such third party claims, or to settle such claims, we couldbe required to pay damages and/or enter into license agreements, which might not be available under favorable terms. We may also be forced to rebrand or redesign our products to avoid the infringement, which could resultin significant costs in certain markets. If we are found to infringe any third party’s intellectual property, we could suffer a material adverse impact on our reputation, business, financial position, results of operations and cashflows. Damages not covered by our insurance policies might result in losses for us, which could have an adverse effect on our business.
Certain kinds of losses cannot be insured against via third-party insurance, and our insurance policies are subject to liability limits and exclusions. For example, ammonia leakage, natural disasters or othercatastrophic events may cause damage or disruption to our operations, international commerce and the global economy, and thus could have a material adverse effect on us. Additionally, we are exposed to certain productquality risks, such as criminal contamination, bird flu and salmonella that can impact our operations and which are not covered under insurance. If an event that cannot be insured occurs, or the damages are higher than ourpolicy limits, we may incur significant costs. In addition, we could be required to pay indemnification to parties affected by such an event. In addition, even where we incur losses that are ultimately covered by insurance, wemay incur additional expenses to mitigate the loss, such as shifting production to different facilities. These costs may not be fully covered by our insurance.
16
Table of Contents
From time to time, our installations may be affected by fires as was the case with our Toledo unit in 2014 and other units in 2016, such as Chapecó/SC and Paranaguá/PR, besides electrical damages or explosion in
substations, or widespread truck driver strikes. Although our business interruption insurance covers certain losses in connection with disruptions to our operations, all of our direct and indirect costs and intangible costs maynot be covered by our insurance. Any similar event at these or other facilities in the future could have a material adverse impact on our business, results of operations, financial condition and prospects
We depend on members of our senior management and on our ability to recruit and retain qualified professionals to implement our strategy.
We depend on members of our senior management and other qualified professionals to implement our business strategies. Efforts to recruit and retain professionals may result in significant additional expenses,which could adversely affect our results. In addition, the loss of key professionals may adversely affect our ability to implement our strategy, as well as the expenses associated to these losses can impact our results.
Breaches, disruptions, or failures of our information technology systems could disrupt our operations and negatively impact our business.
Information technology is an important part of our business operations and we increasingly rely on information technology systems to manage business data and increase efficiencies in our production and distributionfacilities and inventory management processes. We also use information technology to process financial information and results of operations for internal reporting purposes and to comply with regulatory, legal and taxrequirements. In addition, we depend on information technology for digital marketing and electronic communications between our facilities, personnel, customers and suppliers. Like other companies, our informationtechnology systems may be vulnerable to a variety of interruptions, including during the process of upgrading or replacing software, databases or components thereof, natural disasters, terrorist attacks, telecommunicationsfailures, computer viruses, cyber-attacks, hackers, unauthorized access attempts and other security issues. Integrating newly-acquired companies into the system can be uniquely problematic. We have implemented technologysecurity initiatives and disaster recovery plans to mitigate our exposure to these risks, but these measures may not be adequate. A significant failure of our systems, including failures that prevent our systems from functioningas intended, could cause transaction errors, processing inefficiencies, loss of customers and sales, have negative consequences on our employees and our business partners and have a negative impact on our operations orbusiness reputation.
In addition, if we are unable to prevent security breaches, we may suffer financial and reputational damage or penalties because of the unauthorized disclosure of confidential information belonging to us or to ourpartners, customers, consumers or suppliers. Also, the disclosure of non-public sensitive information through external media channels could lead to the loss of intellectual property or damage our reputation and brand image.
Risks Relating to Our Indebtedness
We have substantial indebtedness, and our leverage could negatively affect our ability to refinance our indebtedness and grow our business.
At December 31, 2016, our total consolidated debt (comprised of short-term and long-term debt) was R$18,962.4 million (US$5,818.3 million).
17
Table of Contents
Our substantial indebtedness could have major consequences for us, including:
requiring that a substantial portion of our cash flows from operations be used for the payment of principal and interest on our debt, reducing the funds available for our operations or other capital needs; limiting our flexibility in planning for, or reacting to, changes in our business and the industry in which we operate because our available cash flow after paying principal and interest on our debt might notbe sufficient to make the capital and other expenditures necessary to address these changes; increasing our vulnerability to general adverse economic and industry conditions because, during periods in which we experience lower earnings and cash flows, we would be required to devote aproportionally greater amount of our cash flows to paying principal and interest on debt; limiting our ability to obtain additional financing in the future to fund working capital, capital expenditures, acquisitions and general corporate requirements; increasing our expenditures due to depreciations of the Brazilian real, which can lead to an increased amount of capital needed to service indebtedness that are denominated in U.S. dollars; making it difficult for us to refinance our indebtedness or to refinance such indebtedness on terms favorable to us, including with respect to existing accounts receivable securitizations; placing us at a competitive disadvantage compared to competitors that are relatively less leveraged and that may be better positioned to withstand economic downturns; and exposing our current and future borrowings made at floating interest rates to increases in interest rates.
We have substantial debt that matures in each of the next several years.
As of December 31, 2016, we had R$2,674.4 million of debt that matures in 2018, R$3,188.7 million of debt that matures in 2019, R$1,412.7 million of debt that matures in 2020, R$8,441.6 million of debt thatmatures in in 2021 and thereafter.
A substantial portion of our outstanding debt is denominated in foreign currencies, primarily U.S. dollars. As of December 31, 2016, we had R$10,318.7 million of foreign currency debt, including R$1,257.1 millionof short-term foreign currency debt. Our U.S. dollar-denominated debt must be serviced by funds generated from sales by our subsidiaries, the majority of which are not denominated in U.S. dollars. Consequently, when wedo not generate sufficient U.S. dollar revenues to cover that debt service, we must use revenues generated in reaisor other currencies to service our U.S. dollar-denominated debt. Depreciation in the value of the realor any ofthe other currencies of the countries in which we operate, compared to the U.S. dollar, could adversely affect our ability to service our debt. Foreign currency hedge agreements may not be effective in covering these currency-related risks.
Any future uncertainty in the stock and credit markets could also negatively impact our ability to access additional short-term and long-term financing, which could negatively impact our liquidity and financialcondition. If, in future years:
the pressures on credit return as a result of disruptions in the global stock and credit markets, our operating results worsen significantly, we are unable to complete any necessary divestitures of non-core assets and our cash flow or capital resources prove inadequate, or
18
Table of Contents
we are unable to refinance any of our debt that becomes due,
We could face liquidity problems and may not be able to pay our outstanding debt when due, which could have a material adverse effect on our consolidated business and financial condition.
The terms of our indebtedness impose significant restrictions on us.
The instruments governing our consolidated indebtedness impose significant restrictions on us. These restrictions may limit, directly or indirectly, our ability, among other things, to undertake the following actions:
borrow money; make investments; sell assets, including capital stock of subsidiaries; guarantee indebtedness; enter into agreements that restrict dividends or other distributions from certain subsidiaries; enter into transactions with affiliates; create or assume liens; and engage in mergers or consolidations.
Although the covenants to which we are subject have exceptions and qualifications, the breach of any of these covenants could result in a default under the terms of other existing debt obligations. Upon theoccurrence of such an event of default, all amounts outstanding under the applicable debt instruments and the debt issued under other debt instruments containing cross-default or cross-acceleration provisions, together withaccrued and unpaid interest, if any, might become or be declared immediately due and payable. If such indebtedness were to be accelerated, we may have insufficient funds to repay in full any such indebtedness. In addition,in connection with the entry into new financings or amendments to existing financing arrangements, our subsidiaries’ financial and operational flexibility may be further reduced as a result of the imposition of covenants thatare more restrictive, the requirements for additional security, and other terms.
Risks Relating to Brazil
Brazilian economic, political and other conditions, and Brazilian government policies or actions in response to these conditions, may negatively affect our business, results of operations and the market prices of ourcommon shares or the ADRs.
The Brazilian economy has historically been characterized by interventions by the Brazilian government and unstable economic cycles. The Brazilian government has often changed monetary, price controls, taxation,credit, tariff and other policies to influence the course of Brazil’s economy. Our business, results of operations, financial condition and prospects as well as the market prices of our common shares or the American DepositaryReceipts (“ADRs”) may be adversely affected by, among others, the following factors:
exchange rate fluctuations; expansion or contraction of the Brazilian economy, as measured by rates of growth in gross domestic product (GDP); high inflation rates;
19
Table of Contents
changes in fiscal or monetary policies; commodities price volatility; increase in interest rates; exchange controls and restrictions on remittances abroad; volatility and liquidity of domestic capital and credit markets; natural disasters and changes in climate or weather patterns; energy or water shortages or rationalization, particularly in light of water shortages in parts of Brazil; changes in environmental regulation; social and political instability, particularly in light of recent protests against the government; strikes, not only of our employees, but also of port employees, truck drivers, other transport facilities, customs agents, sanitary inspection agents and other government agents; and other economic, political, diplomatic and social developments in or affecting Brazil, including with respect to alleged unethical or illegal conduct of certain figures in the Brazilian government andlegislators, which are currently under investigation.
The Brazilian economy has recently experienced a slowdown. In recent years, GDP growth rates were 1.8%, 2.7% and 0.1% in 2012, 2013 and 2014, respectively, but GDP decreased 3.8% and 3.6% in 2015 and2016, respectively. Inflation and interest rates decreased, but remained in historically high levels, while unemployment had a significant increase. For 2017, there is an expectation of a slight improvement of the economicindicators (especially, interest rates and inflation), but the economy will probably continue to grow at a very slow pace.
Our results of operations and financial condition may be adversely affected by the economic conditions in Brazil and, in addition, protests, strikes and corruption scandals have led to a decrease in confidence and a
political crisis. After the legal and administrative process for the impeachment, Brazil’s Senate removed president Dilma Rousseff from office on August 31, 2016 for infringing budgetary laws. Michel Temer, the former vice
president, who has been de facto president Brazil since Ms. Rousseff’s suspension in May, was sworn in by the Senate to serve out the remainder of the presidential term until 2018. However, the resolution of the political andeconomic crisis in Brazil still depends on the outcome of the “Lava Jato” investigation and approval of reforms that are expected to be promoted by the new president. We cannot predict which policies Mr. Temer may adoptor change during his mandate or the effect that any such policies might have on our business and on the Brazilian economy. Any such new policies or changes to current policies may have a material adverse impact on ourbusiness, results of operations, financial condition and prospects.
The political crisis could worsen the economic conditions in Brazil, which may increase production and supply chain costs and adversely affect our results of operations and financial condition. Uncertainty as towhether the Brazilian government will implement changes in policies or regulations affecting these or other factors in the future may contribute to economic uncertainty in Brazil and to heightened volatility in our productionoperations.
20
Table of Contents
Inflation, and government measures to curb inflation, may adversely affect the Brazilian economy, the Brazilian securities market, our business and operations, financial condition and the market prices of our commonshares or the ADRs.
Brazil experienced high inflation rates in the past. According to the National Amplified Consumer PriceIndex (Índice Nacional de Preços ao Consumidor Amplo, or “IPCA”), published by the Brazilian Institute ofGeography and Statistics (Instituto Brasileiro de Geografia e Estatística, or the “IBGE”), Brazilian consumer price inflation rates were 5.8% in 2012, 5.9% in 2013, 6.4% in 2014, 10.7% in 2015 and 6.29% in 2016. See “Item5. Operating and Financial Review and Prospects—A. Operating Results—Principal Factors Affecting Our Results of Operations—Brazilian and Global Economic Conditions” and “—Effects of Exchange Rate Variationsand Inflation.”
Although the market is currently forecasting that the inflation level will return to the Central Bank’s target in 2017, it is impossible to dismiss the possibility of higher inflation, taking into account the historicbehavior of the country’s economy and the recurring political instability. Periods of higher inflation slow the growth rate of the Brazilian economy, which may lead to lower growth in consumption of food products. Inflationalso is likely to continue to put pressure on industry costs of production and expenses, which will force companies to search for innovative solutions in order to remain competitive. We may not be able to pass this cost ontoour customers and, as a result, it may reduce our profit margins and net profit. In addition, high inflation generally leads to higher domestic interest rates, and, as a result, the costs of servicing our debt may increase, resultingin lower net profit. In addition, inflation and its effect on domestic interest rates can lead to reduced liquidity in the domestic capital and lending markets, which could affect our ability to refinance our indebtedness in thosemarkets and may have an adverse effect on our business, results of operations, financial condition and the market prices of our common shares and the ADRs.
Fluctuations in interest rates may have an adverse effect on our business, financial condition and the market prices of our common shares or the ADRs.
The interest rate is one of the instruments used by the Central Bank to keep inflation under control or to stimulate the economy. If interest rates decrease, the population has greater access to credit and consumesmore. This increase in demand can push prices if the industry is not prepared to meet higher consumption. On the other hand, if interest rates go up, the monetary authority inhibits consumption and investment once they getmore expensive. Another consequence is the greater return paid by government securities, directly impacting other investments that become less attractive. Investment in public debt absorbs money that would fund theproductive sector.
At December 31, 2016, 28.7% of our total liabilities with respect to indebtedness and derivative instruments corresponding to the amount of R$19,491.9 million were either (1) denominated in (or swapped into) reaisand bears interest based on Brazilian floating interest rates, such as the Long-Term Interest Rate ( TaxadeJurosdeLongoPrazo), or “TJLP,” the interest rate used in our financing agreements with Brazilian National Bankfor Economic and Social Development ( BancoNacionaldeDesenvolvimentoEconômicoeSocial), or “BNDES,” and the Interbank Deposit Certificate Rate ( CertificadodeDepósitoInterbancário), or “CDI” rate, aninterbank certificate of deposit rate that applies to our foreign currency swaps and some of our other real-denominated indebtedness, or (2) U.S. dollar-denominated and bears interest based on the London Interbank OfferedRate, or “LIBOR.” Any increase in the CDI, TJLP or LIBOR rates may have an adverse impact on our financial expenses and our results of operations.
Exchange rate movements may adversely affect our financial condition and results of operations.
From time to time, there have been significant fluctuations in the exchange rate between the Brazilian currency and the U.S. dollar and other currencies. In 2012, 2013, 2014 and 2015, the real depreciated 8.9%,14.6%, 13.4% and 47.0%, respectively, against the U.S. dollar, while, in 2016, the real appreciated 16.5%.
Appreciation of the Brazilian realagainst the U.S. dollar may lead to a dampening of export-driven growth. Our production costs are denominated in reais, but our international sales are mostly denominated in U.S.dollars. Revenues generated by exports are reduced when translated to reaisin the periods in which the realappreciates in relation to the U.S. dollar. Any appreciation could reduce the competitiveness of our exports andadversely affect our net sales and our cash flows from exports. On the other hand, a depreciation of Brazilian realagainst the U.S. dollar may lead to higher exports and revenues, but costs may be higher.
21
Table of Contents
Costs are also directly impacted by the exchange rate. Any depreciation of the realagainst the U.S. dollar could create additional inflationary pressures in Brazil by increasing the price of imported products and
requiring deflationary government policies. In addition, the prices of soy meal and soybeans, important ingredients of our animal feedstock, are closely linked to the U.S. dollar, and many of the mineral nutrients added to ourfeedstock must be purchased in U.S. dollars. The price of corn, another important ingredient of our feedstock, is also linked to the U.S. dollar to a lesser degree. In addition to feedstock ingredients, we purchase sausagecasings, breeder eggs, packaging and other raw materials, as well as equipment for use in our production facilities, from suppliers located outside Brazil whom we must pay in U.S. dollars or other foreign currencies. Whenthe realdepreciates against the U.S. dollar, the cost in reaisof our U.S. dollar-linked raw materials and equipment increases, and these increases could materially adversely affect our results of operations.
We have established policies and procedures to manage our sensitivity to such risks, such as the Financial Risk Management Policy. This policy, however, may not cover 100% of our revenue and cost exposure toexchange rates.
We had total foreign currency-denominated debt obligations in an aggregate amount of R$10,318.7 million at December 31, 2016, representing 54.4% of our total consolidated indebtedness at that date. Although wemanage a portion of our exchange rate risk through foreign currency derivative instruments and future cash flows from exports in U.S. dollars and other foreign currencies, our foreign currency debt obligations are notcompletely hedged. A significant devaluation of the realin relation to the U.S. dollar or other currencies would increase the amount of reaisthat we would need in order to meet debt service requirements of our foreigncurrency-denominated obligations.
Changes in tax laws or changes in their interpretation may increase our tax burden and, as a result, negatively affect our profitability.
The Brazilian government regularly implements changes to tax regimes that may increase our and our customers’ tax burdens. These changes include modifications in the tax rates and, on occasion, enactment oftemporary taxes, the proceeds of which are earmarked for designated governmental purposes. In the past, the Brazilian government has presented certain tax reform proposals, which have been mainly designed to simplify theBrazilian tax system, to avoid internal disputes within and between the Brazilian states and municipalities, and to redistribute tax revenues. The tax reform proposals provide for changes in the rules governing the federalSocial Integration Program ( ProgramadeIntegraçãoSocial,or“PIS”)and Contribution for Social Security Funding (ContribuiçãoparaoFinanciamentodaSeguridadeSocial,or“COFINS”)taxes, the ICMS and someother taxes, such as increases in payroll taxes. These proposals may not be approved and passed into law. Others, such as the LeidoBemincentive program and the deduction of interest on shareholders’ equity, may berevoked. The effects of these proposed tax reform measures and any other changes that result from enactment of additional tax reforms have not been, and cannot be, quantified. However, some of these measures, if enacted,may result in increases in our overall tax burden, which could negatively affect our overall financial performance. Moreover, for as long as the Provisional Measure No. 774/17 related to social contributions is in effect or if itis passed into law, our overall tax burden will be increased, which could negatively affect our overall financial performance. For more information, see “Item 8. Financial Information – B. Significant Changes – SocialContributions.”
Risks Relating to Our Common Shares and ADRs
Holders of ADRs may find it difficult to exercise voting rights at our shareholders’ meetings.
Holders of ADRs may exercise voting rights with respect to our common shares represented by ADSs and evidenced by ARSs only in accordance with the deposit agreement governing the ADRs. Holders of ADRsface practical limitations in exercising their voting rights because of the additional steps involved in our communications with ADRs holders. For example, we are required to publish a notice of our shareholders’ meetings inspecified newspapers in Brazil. Holders of our common shares are able to exercise their voting rights by attending a shareholders’ meeting in person or voting by proxy. By contrast, holders of ADRs will receive notice of ashareholders’ meeting by mail from the ADR depositary if we give notice to the depositary requesting the depository to do so. To exercise their voting rights, holders of ADRs must instruct the ADR depositary on a timelybasis. This voting process necessarily takes longer for holders of ADRs than for holders of our common shares. If the ADR depositary fails to receive timely voting instructions for all or part of the ADRs, the depositary willassume that the holders of those ADRs are instructing it to give a discretionary proxy to a person designated by us to vote their ADRs, to the extent permitted by the New York Stock Exchange rules.
22
Table of Contents
Holders of ADRs also may not receive the voting materials in time to instruct the depositary to vote our common shares underlying the ADSs that are evidenced by their ADRs. In addition, the depositary and its
agents are not responsible for failing to carry out voting instructions of the holders of ADRs or for the manner of carrying out those voting instructions. Accordingly, holders of ADRs may not be able to exercise voting rights,and they have little, if any, recourse if the common shares underlying the ADSs that are evidenced by their ADRs are not voted as requested.
Non-Brazilian holders of ADRs and common shares may face difficulties in protecting their interests because we are subject to different corporate rules and regulations as a Brazilian company, and our shareholdersmay have less extensive rights.
Holders of ADRs are not direct shareholders of our company and are unable to enforce the rights of shareholders under our bylaws and the Brazilian Corporation Law.
Our corporate affairs are governed by our bylaws and the Brazilian Corporation Law, which differ from the legal principles that would apply if we were incorporated in a jurisdiction in the United States, such as theState of Delaware or New York, or elsewhere outside Brazil. Even if a holder of ADRs surrenders its ADRs and becomes a direct shareholder, its rights as a holder of our common shares under the Brazilian Corporation Lawto protect its interests relative to actions by our board of directors or executive officers may be fewer and less well-defined than under the laws of those other jurisdictions.
Although insider trading and price manipulation are crimes under Brazilian law, the Brazilian securities markets are subject to different levels of regulations and supervision than the U.S. securities markets or themarkets in some other jurisdictions. In addition, rules and policies against self-dealing or for preserving shareholder interests may be less well defined and enforced in Brazil than in the United States and certain othercountries, which may put holders of our common shares and ADRs at a potential disadvantage. Corporate disclosures also may be less complete or informative than for a public company in the United States or in certain othercountries.
Non-Brazilian holders of ADRs and common shares may face difficulties in serving process on or enforcing judgments against us and other persons.
We are a corporation ( sociedadeanônima) organized under the laws of Brazil, and all of our directors and executive officers and our independent public accountants reside or are based in Brazil. Most of the assetsof our company and of these other persons are located in Brazil. As a result, it may not be possible for non-Brazilian holders of ADRs and common shares to effect service of process upon us or these other persons within theUnited States or other jurisdictions outside Brazil or to enforce against us or these other persons judgments obtained in the United States or other jurisdictions outside Brazil. Because judgments of U.S. courts for civilliabilities based upon the U.S. federal securities laws may only be enforced in Brazil if certain conditions are met, holders may face greater difficulties in protecting their interests in the case of actions by us or our directors orexecutive officers than would shareholders of a U.S. corporation.
Judgments of Brazilian courts with respect to our common shares may be payable only in reais.
If proceedings are brought in the courts of Brazil seeking to enforce our obligations in respect of the common shares, we may not be required to discharge our obligations in a currency other than reais. UnderBrazilian exchange control limitations, an obligation in Brazil to pay amounts denominated in a currency other than reaismay only be satisfied in Brazilian currency at the exchange rate, as determined by the Central Bank, ineffect on the date the judgment is obtained, and such amounts are then adjusted to reflect exchange rate variations through the effective payment date. The then prevailing exchange may not afford non-Brazilian investors withfull compensation for any claim arising out of or related to our obligations under the common shares or the ADRs.
23
Table of Contents
Holders of ADRs and non-Brazilian holders of our common shares may be unable to exercise preemptive rights and tag-along rights with respect to our common shares underlying the ADSs evidenced by their ADRs.
Holders of ADRs and non-Brazilian holders of our common shares may be unable to exercise the preemptive rights and tag-along rights relating to our common shares (including common shares underlying the ADSsevidenced by their ADRs) unless a registration statement under the U.S. Securities Act of 1933, as amended, or the “Securities Act,” is effective with respect to those rights or an exemption from the registration requirementsof the Securities Act is available. We are not obligated to file a registration statement with respect to the shares relating to these preemptive rights, and we cannot assure you that we will file any such registration statement.Unless we file a registration statement or an exemption from registration is available, a holder may receive only the net proceeds from the sale of his or her preemptive rights or tag-along rights, or if these rights cannot besold, they will lapse and the holder will receive no value from them.
Provisions in our bylaws may prevent efforts by our shareholders to change our control or management.
Our bylaws contain provisions that may discourage, delay or make more difficult a change in control of our company or removal of our directors. Subject to limited exceptions, these provisions require anyshareholder that acquires shares representing 33.3% or more of our share capital to disclose such information immediately through a filing with the Brazilian Securities and Exchange Commission ( ComissãodeValoresMobiliários) or “CVM” and, within 30 days from the date of such acquisition or event, commence a public tender offer with respect to all of our shares for a price per share that may not be less than the greater of: (i) 140%of the average trading price on the stock exchange trading the greatest volume of shares of the capital stock of the Company during the last 120 trading sessions prior to the date on which the public offer became obligatory;and (ii) 140% of the average trading price on the stock exchange trading the greatest volume of shares of the capital stock of the Company during the last 30 trading days prior to the date on which the public offer becameobligatory.
These provisions of our bylaws may delay, defer or prevent a transaction or a change in control that might otherwise be in the best interests of our shareholders.
Holders of ADRs could be subject to Brazilian income tax on capital gains from sales of ADRs.
Historically, any capital gain realized on a sale or other disposition of ADRs between non-Brazilian holders outside Brazil was not subject to Brazilian income tax. However, a December 2003 Brazilian law (LawNo. 10,833, of December 29, 2003) provides that “the acquirer, individual or legal entity resident or domiciled in Brazil, or the acquirer’s attorney-in-fact, when such acquirer is resident or domiciled abroad, shall beresponsible for the retention and payment of the income tax applicable to capital gains earned by the individual or legal entity resident or domiciled abroad who disposes of property located in Brazil.” The Brazilian taxauthorities have issued a normative instruction confirming that they intend to assess income tax on capital gains earned by non-Brazilian residents whose assets are located in Brazil. It is unclear whether ADSs representingour common shares and evidenced by ADRs, which are issued by the ADR depositary outside Brazil, will be deemed to be “property located in Brazil” for purposes of this law. Accordingly, we cannot determine whetherBrazilian tax authorities will attempt to tax any capital gains arising from the sale or other disposition of the ADRs, even when the transaction is consummated outside Brazil between non-Brazilian residents.
Brazilian taxes may apply to a gain realized by a non-Brazilian holder on the disposition of common shares to another non-Brazilian holder.
The gain realized by a non-Brazilian holder on the disposition of common shares to another non-Brazilian holder (other than a disposition of shares held pursuant to Resolution No. 4,373, as amended, of the BrazilianNational Monetary Council (Conselho Monetário Nacional), or “CMN”), is generally viewed as being subject to taxation in Brazil. Pursuant to Article 26 of Law No. 10,833/03, Brazilian tax authorities may assess income taxon capital gains earned by non-Brazilian residents in transactions involving assets that are located in Brazil. In the case of a non-Brazilian holder, the withholding tax rate applicable upon the capital gain would be 15% (or25% in the case of a non-Brazilian holder organized under the laws of or a resident of a tax haven).
24
Table of Contents
For additional discussion of the tax consequences of a disposition of our common shares, see “Item 10. Additional Information––E. Taxation.”
The relative volatility and limited liquidity of the Brazilian securities markets may negatively affect the liquidity and market price of our common shares and ADRs.
The Brazilian securities markets are substantially smaller, less liquid and more volatile than major securities markets in the United States. The Novo Mercado of BM&FBovespa (the “BM&FBOVESPA” or the “SãoPaulo Stock Exchange”) had a total traded volume of R$694.8 billion, or US$201.2 billion, and an average daily trading volume of R$1.9 billion, or US$576.4 million for the year in 2016. The New York Stock Exchange hada market traded volume of US$10.2 trillion (U.S. domestic listed companies) and an average daily trading volume of US$44.0 billion for the year in 2016. The Brazilian securities markets are also characterized byconsiderable share concentration.
The ten largest companies in terms of market capitalization represented approximately 43% of the aggregate market capitalization of the São Paulo Stock Exchange as of December 31, 2016. In addition, the ten mostwidely traded stocks in terms of trading volume accounted for approximately 46% of all shares traded on the São Paulo Stock Exchange in 2016. These market characteristics may substantially limit the ability of holders ofthe ADRs to sell common shares underlying ADSs evidenced by ADRs at a price and at a time when they wish to do so and, as a result, could negatively impact the market prices of these securities.
Developments and the perception of risks in other countries, especially emerging market countries, may adversely affect the market price of our common shares and ADRs.
The market for securities issued by Brazilian companies is influenced, to varying degrees, by economic and market conditions in other emerging markets. Although economic conditions are different in each country,the reaction of investors to developments in one country may cause the capital markets in other countries to fluctuate. Developments or adverse economic conditions in other emerging markets have at times resulted insignificant outflows of funds from, and declines in, the amount of foreign currency invested in Brazil. In addition, economic and political crises in Latin America or other emerging markets may significantly affect perceptionsof the risk inherent in investing in the region, including Brazil.
The Brazilian economy, as well as the market for securities issued by Brazlian companies, is also affected, to a varying degree, by international economic and market conditions generally, especially economic andmarket conditions in the United States. Share prices on the São Paulo Stock Exchange, for example, have historically been sensitive to fluctuations in U.S. interest rates as well as movements of the major U.S. stock indexes.
Developments in other countries and securities markets could adversely affect the market prices of our common shares or the ADRs and could also make it more difficult for us to access the capital markets andfinance our operations in the future on acceptable terms or at all.
We may become a passive foreign investment company, which could result in adverse U.S. tax consequences to U.S. investors.
Based on our financial statements, relevant market and shareholder data, and the projected composition of our income and valuation of our assets, including goodwill, we do not believe that we were a passive foreigninvestment company, or “PFIC,” for U.S. federal income tax purposes for 2016, and we do not expect to be a PFIC for 2017 or in the future, although we can provide no assurances in this regard. If we become a PFIC, U.S.holders of our common shares or ADRs may become subject to increased tax liabilities under U.S. tax laws and regulations and will become subject to burdensome reporting requirements. The determination of whether or notwe are a PFIC is made on an annual basis and will depend on the composition of our income and assets from time to time. Specifically, for any taxable year we will be classified as a PFIC for U.S. tax purposes if either(i) 75% or more of our gross income in that taxable year is passive income or (ii) the average percentage of our assets (which includes cash) by value in that taxable year which produce or are held for the production of passiveincome is at least 50%. The calculation of the value of our assets will be based, in part, on the quarterly market value of our common shares and ADRs, which is subject to change. See “Item 10. Additional Information––E.Taxation––U.S. Federal Income Tax Considerations––Passive Foreign Investment Company.”
25
Table of Contents
ITEM 4. INFORMATION ON THE COMPANY
A. History and Development of the Company
BRF S.A. is a publicly-held company in Brazil and is therefore subject to the requirements of the Brazilian Corporation Law and the rules and regulations of the CVM.
We were founded as Perdigão by the Brandalise and Ponzoni families in 1934 as Ponzoni, Brandalise e Cia. in the southern State of Santa Catarina and remained under the Brandalise family’s management untilSeptember 1994. In 1940, we expanded our operations from general trading, with an emphasis on food and food-related products, to include pork processing. During the 1950s, we entered the poultry processing business.During the 1970s, we broadened the distribution of our products to include export markets, starting with Saudi Arabia. From 1980 through 1990, we expanded our export markets to include Japan in 1985 and Europe in 1990.We also undertook a series of acquisitions in the poultry and pork processing business and made investments in other businesses.
From 1990 through 1993, we suffered substantial losses because of increased financial expenses, underinvestment in product development, limited capacity and modest marketing of our products. By September1994, we faced a liquidity crisis, as a result of which the Brandalise family sold their interest in our company, consisting of 80.68% of our common shares and 65.54% of our preferred shares, to eight pension funds:
PREVI – Caixa de Previdência dos Funcionários do Banco do Brasil, or “PREVI,” the pension fund of employees of Banco do Brasil S.A.; SISTEL – Fundação Telebrás de Seguridade Social, or “SISTEL,” the pension fund of employees of Telecomunicações Brasileiras S.A. – Telebrás; PETROS – Fundação Petrobras de Seguridade Social, or “PETROS,” the pension fund of employees of Petróleo Brasileiro S.A. Petrobras; Real Grandeza Fundação de Assistência e Previdência Social, or “Real Grandeza,” the pension fund of employees of Furnas Centrais Elétricas S.A. – Furnas; Fundação de Assistência e Previdência Social do BNDES-FAPES, or “FAPES,” the pension fund of employees of Banco Nacional de Desenvolvimento Econômico e Social – BNDES; PREVI-BANERJ – Caixa de Previdência dos Funcionários do Banerj, or “PREVI-BANERJ,” the pension fund of employees of Banco do Estado do Rio de Janeiro S.A.; VALIA – Fundação Vale do Rio Doce de Seguridade Social, or “VALIA,” the pension fund of employees of Vale S.A.; and TELOS – Fundação Embratel de Seguridade Social, or “TELOS,” the pension fund of employees of Empresa Brasileira de Telecomunicações-Embratel.
Upon acquiring control of our company, the eight original pension funds hired a new team of executive officers who restructured management and implemented capital increases and modernization programs. Ournew management engaged in a corporate restructuring, disposed of or liquidated non-core business operations and improved our financial structure.
26
Table of Contents
For recent information about our major shareholders, see “Item 7. Major Shareholders and Related Party Transactions––A. Major Shareholders.
Our principal executive offices are located at Rua Hungria, 1400 - 5th Floor, Jd. Europa, 01455-000, São Paulo, SP, Brazil, and our telephone number at this address is +55-11-2322-5000/5355/5048. Our internetaddress is www.brf-br.com/ir. From time to time, we may use our website as a channel of distribution of material company information. Financial and other material information regarding us is routinely posted on andaccessible at www.brf-br.com/ir. The information on our website is not incorporated by reference into this Annual Report on Form 20-F.
Business Combination with Sadia
Agreement with Sadia
On May 19, 2009, we signed a merger agreement with Sadia for a business combination of the two companies. Holders of common shares and preferred shares of Sadia received common shares of BRF, and holdersof American Depositary Shares (“ADS”) representing preferred shares of Sadia, received ADRs evidencing ADSs representing common shares of BRF.
A number of steps of the merger were approved at separate extraordinary general meetings, held on July 8, 2009, of the common shareholders of Perdigão S.A. (“Perdigão”), Sadia, and HFF Participações S.A.(“HFF”), a holding company formed by the controlling shareholders of Sadia for purposes of the acquisition. In connection with the business combination, we changed our name from Perdigão S.A. to BRF – Brasil Foods S.A. The business combination became fully effective on September 22, 2009, and Sadia became our wholly owned subsidiary.
On December 31, 2012, we incorporated Sadia S.A., then a wholly-owned subsidiary, into BRF, and Sadia ceased to exist as a separate legal entity.
Antitrust Approvals
The business combination was reviewed by antitrust authorities both in Brazil and in Europe. Approval by the European antitrust authorities was received on June 29, 2009, followed by the Administrative Councilfor Economic Defense ( ConselhoAdministrativodeDefesaEconômica, or “CADE”) on July 13, 2011, conditioned upon compliance with the terms of a Performance Commitment Agreement ( TermodeCompromissodeDesempenho, or “TCD”) that we entered into with the CADE on July 18, 2011. Under the TCD, we agreed to a number of measures, including, among others, the suspension of use of certain brands for a range from three tofive years and the divestment of certain trademarks, plants, and distribution centers in the domestic market. In March 2012, we entered into an agreement with Marfrig Alimentos S.A., or “Marfrig,” pursuant to which weagreed to transfer certain assets in compliance with our agreement with the CADE. The last suspension of use of brands imposed by CADE in connection with the business combination with Sadia expires July 3, 2017. Aftersuch date, BRF will only be prohibited from having exclusivity on sales, publicity or merchandising in points of sale in Brazil. The TCD does not restrict our ability to act freely in the Brazilian food service market or outsidethe Brazilian market.
Agreement with Marfrig
In July 2011, we received Brazilian antitrust approval for our business combination with Sadia from CADE, but that approval was subject to a number of conditions set forth in a TCD, including, among others, thesuspension of use of certain brands for a range from three to five years and the divestment of certain trademarks, plants, and distribution centers in the domestic market. On March 20, 2012, we entered into an agreement withMarfrig pursuant to which we have agreed to transfer certain assets in compliance with the TCD. In exchange, we acquired the right to receive from Marfrig an amount corresponding to R$350.0 million to be paid as follows:
27
Table of Contents
R$25.0 million paid on June 11, 2012; R$25.0 million, adjusted by the General Market Price Index ( ÍndiceGeraldePreçosdoMercado, or “IGP-M”), paid on July 1, 2012; R$250.0 million to be paid by Marfrig to BRF in 72 monthly and successive installments, which are due from August 1, 2012, being the first installment in the amount of R$4.4 million and other remaininginstallments in the amount of R$4.8 million, subject to the fixed rate of 12.1% per year.
As disclosed in the quarterly information for the nine month period ended September 30, 2012, BRF and Marfrig renegotiated the payment terms of the amount correspondent to R$50.0 million which previoussettlement was expected to occur on October 1, 2012. As a consequence, this amount has been received as from January 2, 2013 in 67 monthly and successive installments in the amount of R$964 thousand.
All the installments were properly paid by Marfrig.
The Asset Exchange agreements between Marfrig and BRF also included as part of the payment for this transaction the acquisition of the total shareholding stake in Quickfood S.A. (equivalent to 90.05% of itscapital stock), a publicly held Argentine food corporation. For more details on these agreements, see “Item 4. Information on the Company—A. History and Development of the Company—Business Combination withSadia.”
Agreement with Lactalis
On September 3, 2014, BRF entered into a binding memorandum of understanding with Lactalis, a company controlled by Parmalat S.p.A., an Italian publicly held company pertaining to the Groupe Lactalis S.A., or“Groupe Lactalis,” for the sale of its dairy division, including: (i) manufacturing facilities located in the cities of Bom Conselho (PE), Carambeí (PR), Ravena (MG), Concórdia (SC), Teutônia (RS), Itumbiara (GO), Terenos(MS), Ijuí (RS), Três de Maio I (RS), Três de Maio II (RS) and Santa Rosa (RS), and (ii) related assets and trademarks (Batavo, Elegê, Cotochés, Santa Rosa and DoBon) dedicated to such segment. The transaction closed onJuly 1, 2015 for a total consideration of US$697.8 million.
Establishment of OneFoods
On June 30, 2016, we approved the establishment of our subsidiary One Foods Holding Ltd. (“OneFoods”), formerly known as Sadia Halal, dedicated to the production, distribution and sale of halal products. Suchrestructuring process will contemplate the transfer of several assets related to the production and distribution of halal products, including: (i) grain storage facilities, feed mills, agreements with outgrowers (outsourcedfarmers), hatcheries and eight slaughtering and processing plants in Brazil; (ii) one processing plant in United Arab Emirates; (iii) the equity participation in FFM Further Processing SDN BHD and (iv) the equity participationheld by us in certain distribution companies based in Saudi Arabia, Qatar, United Arab Emirates, Sultanate of Oman and Kuwait . These assets were transferred to SHB Comércio e Indústria de Alimentos S.A. (“SHB”), acontrolling shareholder of OneFoods, or directly to OneFoods. We will also transfer or license to OneFoods some brands that we use in some halal markets. We are analyzing strategic alternatives for the expansion of ourhalal business in our current markets as well as in those not currently served by us, as well as alternatives for the capitalization of OneFoods. OneFoods, based in Dubai, United Arab Emirates, started operations on January 2,2017. Other Acquisitions and Investments in 2016
Campo Austral – Argentina On December 1, 2015, BRF signed a binding offer with Pampa Agribusiness Fund L.P. and Pampa Agribusiness Follow-on Fund L.P. relating to the acquisition of all the shares issued by Eclipse Holding Cooperatief
UA, a Dutch company that controls Campo Austral, a group of companies with fully integrated business operations in the hog segment in Argentina, including the cold cuts market, for the total consideration of US$68.2million. This transaction was completed on April 15, 2016.
28
Table of Contents
Calchaquí – Argentina
On March 22, 2016, BRF, through its subsidiaries BRF GmbH and BRF Holland B.V., entered into a share purchase agreement for the acquisition of all the shares issued by Alimentos Calchaquí Productos 7 S.A.,for the total consideration of US$104.7 million. This transaction was completed on May 10, 2016. Al Khan Foodstuff – Oman
On April 25, 2016, BRF, through its subsidiary BRF GmbH, entered into a share purchase agreement with the shareholders of Al Khan Foodstuff LLC, or “AKF.” After completion of the transaction on June 20,2016, BRF GmbH held all of AKF’s economic interest. The valuation of AKF within the context of the transaction (enterprise value for 100% of AKF) was of US$32.6 million. FFM Further Processing – Malaysia
On September 9, 2016, BRF, through its subsidiary BRF Foods GmbH, entered into an agreement with FFM Berhad, providing for the cooperation of both parties in FFM Further Processing SDN BHD, a foodprocessing company based in Malaysia, along with an investment by BRF Foods GmbH in FFP in the amount of approximately US$16.0 million. After completion of the transaction on October 4, 2016, BRF Foods GmbHheld 70% of the shares of FFP, and FFM Berhad held the remaining 30%. Banvit - Turkey
On January 9, 2017, we entered into a share purchase agreement with the controlling shareholders of Banvit Bandirma Vitaminli Yem Sanayii A.Ş. (“Banvit”) for the acquisition of all the Banvit shares held by them,which represent 79.5% of the Banvit shares. Banvit is the largest poultry producer in Turkey, with fully integrated operations and the highest brand awareness in the sector in Turkey.
Additionally, we and Qatar Investment Authority (“QIA”), the sovereign wealth fund of the State of Qatar, have entered into definitive agreements related to the incorporation of a new company, which will acquirethe Banvit shares referred to above, and the relationship between this new company and Banvit. The rights arising from these agreements will be assigned to OneFoods, which will hold 60% of this new company and QIA willhold the remaining 40%.
Pursuant to the terms of the share purchase agreement described above and subject to the financial performance of Banvit for 2016, the enterprise value for 100% of Banvit is approximately US$470.0 million. Basedon the net debt position of Banvit as of September 30, 2016, the equity value of Banvit would therefore be approximately US$340.0 million.
Following the consummation of this transaction, the new company will launch a mandatory tender offer to acquire the remaining 20.5% of the Banvit shares from the minority shareholders on the same terms and
conditions offered to the Banvit controlling shareholders.
The completion of this transaction is subject to the satisfaction of the conditions precedent set forth in the definitive documents, including anti-trust approvals.
Weak Flesh Operation
We are currently being investigated in the context of the “Weak Flesh Operation.” For more information, see “Item 8. Financial Information – B. Significant Changes – Weak Flesh Operation.”
29
Table of Contents
Capital Expenditures
The table below sets forth our capital expenditures for the periods indicated:
As of December 31, 2016 2015 2014 (in millions of reais )Expansion and enhancement of production facilities 686.2 495.0 292.8
UAE Facility 7.7 51.8 236.9Other expansion investments 678.5 443.1 55.9
Productivity investments 348.4 435.1 267.8Automation 115.0 257.6 124.9Other productivity investments 233.4 177.6 142.9
Other capital expenditures 481.6 554.8 387.5Subtotal capital expenditures 1,516.2 1,485.0 948.1Biological Assets 784.2 598.9 517.5Acquisitions and other investments 3,084.1 376.9 514.4Leasing 82.0 21.3 67.8Total capital expenditures 5,466.5 2,482.0 2,047.8
The main capital expenditures in 2014, 2015 and 2016 are described below:
Acquisitions . For the main acquisitions in 2016, see “—Other Acquisitions and Investments in 2016”.
Logistics Management: BRF invested R$53.4 million in 2016 in the Vitória de Santo Antão distribution center in order to better serve all the states in the northeastern region of Brazil and some states in the north ofthe country.
Tatui (SP-Brazil): In 2014, BRF continued the development of a production line for sliced cold cut products to be sold in an exclusive single package. This new line was installed in the Tatui Industrial Complex,located in the state of São Paulo (Brazil). This new product aims at strengthening the presence of the Sadia brand in the cold cuts category, offering a differentiated pre-sliced product, with clear identification of the brand andfood security assurance. BRF is a leader in the cold cuts category and wants to expand the portfolio of products that reach the consumer needs, such as single fresh slices. The sliced cold cuts line Soltissimooffers thin andsingle slices that do not stick together, with “easy-open” and storage packaging and fresh products.
Automation: In 2016, BRF invested nearly R$115.0 million for the automation of company processes. The goal has been to improve efficiency by increasing productivity and reducing production costs. In 2016,investments on automating the chicken leg deboning processes continued, which not only drastically reduced costs, but also improved ergonomics in the factory and increased product quality. In 2015 and 2014, BRF investedR$375.8 million for the automation of company processes. The goal has been to improve efficiency by increasing productivity and reducing production costs. In 2015, the focus of automation investments was on deboningprocesses and poultry packaging.
Internationalization Project : BRF is working on a broad long-term internationalization project. In 2016, we increased our investments in Argentina, including in the San Jorge burger factory and in Rio Cuarto in theamount of R$17.9 million and R$101.5 million, respectively. In 2014, the company opened a processed products facility in the UAE, with production capacity of 70 thousand tons/year, which represented a total investment ofaround US$160.0 million.
Demand : Despite the decrease in demand growth in the Brazilian market, which is closely related to the poor performance of the Brazilian economy, demand should resume its growth in the following years.Therefore, BRF invested in projects to keep up with demand growth, such as the investments made in the Toledo, Uberlândia and Lucas do Rio Verde plants, in the aggregate amount of R$90.6 million in 2016.
30
Table of Contents
Operational footprint: In 2015, the company had a strong focus on improving its operational complex, investing on growth and optimization of production between plants in order to minimize the cost to produce and
deliver each product. The optimization takes into account aspects of production cost, logistics, tax, quality and production specialization. At this point, the review also takes this opportunity to improve the mix of theCompany's products, maximizing investments in higher value-added products, in line with the strategy of BRF. The revaluation of footprint also provides greater flexibility and agility in the production process.
In 2017, in addition to existing projects, BRF is focused on increasing production – specially of pork meat, developing new products and improving efficiency. In accordance with BRF’s commitment to a more
efficient use of its employed capital, we will also analyze divestiture opportunities (such as inactive real estate assets) should they allow us to increase our focus on the core business and generate higher returns forshareholders.
B. Business Overview
BRF S.A. is one of the largest producers of fresh and frozen protein foods in the world, with a portfolio of over five thousand stock keeping units (“SKUs”). Our processed products include marinated and frozenchicken, Chester® rooster and turkey meat, specialty meats, frozen processed foods, frozen prepared entrees, portioned products and sliced products. We also sell margarine, sweet specialties, sandwiches, mayonnaise, andanimal feed. We are the holder of brands such as Sadia,Perdigão,Qualy,Perdix, Paty,Bocatti,Vienissima,Dánica,Confidence,SpeedyPoloand Hilal. In December 2016, BRF was responsible for 16.3% of the world tradein poultry.
Our portfolio strategy is focused on creating new, convenient, practical and healthy products for our consumers based on their needs. We seek to achieve that goal through strong innovation to provide us withincreasing value-added items that will differentiate us from our competitors and strengthen our brands.
With 35 plants in Brazil, BRF has among its main assets a widespread distribution network that enables its products to reach Brazilian consumers through 551,050 monthly deliveries and 47 distribution centers, 20 ofwhich are in the domestic market and 27 of which are in our export markets.
In the international market, BRF has a leading brand, Sadia, in various categories in Middle Eastern countries. We maintain 27 sales offices outside of Brazil serving customers of more than 150 countries on fivecontinents. We have nine industrial units in Argentina, five in Thailand, two in Europe (BRF UK and BRF Holland), one in Abu Dhabi and one in Malaysia.
We are able to reach substantially all of the Brazilian population through a nationwide network of 20 distribution centers.
In Brazil, we operate 35 meat processing plants, three margarine processing plants, three pasta processing plants, one dessert processing plant and three soybean crushing plants, all of them near our raw materialsuppliers or the main consumer centers. We have an advanced logistic system in our domestic market, with 20 distribution centers, being eight owned by us and 12 leased by third parties, all of which serve supermarkets, retailstores, wholesale stores, restaurants and other clients.
In our international markets, we operate 12 meat processing plants in Argentina, Netherlands, United Kingdom, Thailand, the United Arab Emirates and Malaysia one margarine and oil processing plant Argentina,one sauce and mayonnaise processing plant Argentina, and one frozen vegetables processing plant Argentina. We have 27 distribution centers located overseas, as well as commercial offices in the United Kingdom, France,Spain, Italy, Austria, Hungary, Netherlands, Russia, Singapore, South Korea, China, Japan, Saudi Arabia, the United Arab Emirates, Qatar, Oman, Kuwait, South Africa, Argentina, Uruguay, Chile, Turkey and Malaysia.
Our domestic distribution network uses 20 distribution centers in several Brazilian states. Refrigerated trucks transport our products from our processing plants to the distribution centers and from the distributioncenters to our customers. We have 30 transit points, previously referred to as cross-docking points, in several areas of the country that enable us to unload products from large refrigerated trucks onto smaller trucks or vans fortransportation to our customers. We own eight of our distribution centers and lease the remaining 12 centers, which are listed below under “—Property, Plant and Equipment.” We do not own the vehicles used to transport ourproducts, and we contract with several carriers to provide this service for us on an exclusive basis.
31
Table of Contents
BRF has been a public company since 1980. Our shares have been listed on the BM&FBovespa as BRFS3 since 2006, and we are also traded on the New York Stock Exchange (NYSE - ADR level III). Since 2005,
BRF has been part of BM&FBovespa’s Corporate Sustainability Index (ISE) portfolio in acknowledgement of its strong commitment to sustainable development. This commitment has been reinforced and internationallyrecognized since 2012, upon our entrance into the portfolio of Emerging Markets of Dow Jones Sustainability Index. Competitive Strengths
We believe our major competitive strengths are as follows:
Leadership in the Brazilian Food Market with Strong Brands and a Global Presence. We are one of the largest producers of fresh and frozen protein foods in the world with a size and scale that allowsus to compete in Brazil as well as in our export markets. We are one of the largest food companies in the world in terms of market capitalization. We believe our leading position allows us to take advantageof market opportunities by expanding our business, increasing our offer of added value products and improving our initiatives in export markets. In 2016, we slaughtered approximately 1.72 billionchickens and other poultry and 9.61 million hogs and cattle. In the same year, we sold approximately 5.0 million tons of poultry, hogs, beef and processed products. Our own and licensed brands are highlyrecognized in a number of countries, such as Brazil, Argentina, Saudi Arabia, Angola, to name a few, and we are expanding the presence with local brands in key markets. Our Sadiaand Perdigãobrandswere included among the “Most Valuable Brand in Brazil” in 2016 and 2015, respectively, by MillwardBrownVermeer. Our sustainable practices have also brought BRF great recognition over the years.We are one of the leading companies in terms of transparency published by the Carbon Disclosure Project, or “CDP.” We are the only company in the food sector to have been included inBM&FBOVESPA’s Corporate Sustainability Index, or “ISE,” for the last 12 years. We became part of the Emerging Markets portfolio of the Dow Jones Sustainability Index five years ago and are alsoamong the companies listed on the United Nations Global Compact 100 Index since 2013. Extensive Distribution Network in Brazil and the Export Markets . We believe we are one of the few companies with an established distribution network that can deliver frozen and chilled products inpractically any region of Brazil. Moreover, we export products to approximately 150 countries and are developing our own distribution network in Europe, where we sell directly to food processingcompanies and local distributors. We operate in the Middle East through equity interests we have acquired in distribution companies such as Al Khan Foodstuff LLC, or “AKF,” the leader in the distributionof frozen and chilled food in the Sultanate of Oman, the retail frozen foods distribution business of Alyasra Food Company W.L.L, or “Alyasra,” the leader in the distribution of frozen, chilled and driedfood in Kuwait, and Federal Foods Limited, or “Federal Foods,” the leader in the distribution of food in the United Arab Emirates. Besides this, we also operate through Al Wafi in Saudi Arabia. InArgentina, we are working to optimize the number and increase the loyalty of our distributors. Our established distribution capabilities and logistical experience allow us to expand our national andinternational business, leading to higher sales volume and a greater coverage of our line of products. Moreover, in Europe, we partnered with Invicta Food Group Limited, or “Invicta,” and acquiredUniversal Meats (UK) Ltd, or “Universal Meats,” to strengthen our distribution of processed food in the United Kingdom, Ireland and Scandinavia. Low Cost Producers in a Growing Global Market . We believe we have a competitive advantage over producers in some of our export markets due to our lower production costs and gains of efficiency inanimal production in Brazil. We have also achieved a scale of production and quality that allows us to compete effectively with the main producers in Brazil and other countries. We set up a series ofprograms aimed at maintaining and improving our cost effectiveness, including programs to optimize our supply chain by integrating demand, production, inventory management and customer service. OurShared Service Center ( CSC-CentrodeServiçosCompartilhados) centralizes our administrative and corporate activities, and our BRF Value Generation system ( GVBRF-GeraçãodeValorBRF”)provides our managers with a more efficient use of fixed and working capital, while our Zero-Base Budget ( OBZ-OrçamentoBaseZero) is directed at enhancing the efficiency of cost management.
32
Table of Contents
Strategic and Diversified Geographic Allocation. Our slaughterhouses are strategically located in different regions of Brazil (South, Southeast and Midwest). This allows us to offset the risks from anyrestrictions on exports that may occur in particular regions of the country due to sanitary concerns. The geographical diversity of our distribution centers in 14 Brazilian states also allows us to reduce thecost of transport due to their proximity to the grain-producing regions and the country´s main export ports. We opened our first processed food plant in the Middle East in Abu Dhabi, in the United ArabEmirates in 2014. This is the largest BRF factory globally. In Argentina, in 2016, we integrated Campo Austral, through the acquisition of its controller, Eclipse Holding Cooperatief UA, and AlimentosCalchaquí Productos 7 S.A., or “Calchaquí,” both with own production capabilities and local brands to strengthen our position in the cold cuts market. Additionally, in 2016, we increased our presence inAsia by acquiring Golden Foods Siam, or “GFS,” one of the leading poultry producers in Thailand, with fully integrated operations and exporting to more than 15 markets globally, we concluded acooperation agreement with FFM Berhad in Malaysia, we signed an agreement for the acquisition of Banvit in Turkey (the completion of this transaction is subject to the satisfaction of the conditionsprecedent set forth in the definitive documents, including anti-trust approvals), and more recently, in January 2017, our subsidiary, OneFoods, focused 100% in the Halal market, started to operate. Thoseare great steps forward as part of our international expansion and aim to provide the best options to clients through local operations, which allow rapid and efficient access to strategic markets and increasethe flexibility of the adaptation of products to local wishes. This approach is always carried out according to the specific requirements of each country and follows rigorous controls in all the productiveprocesses. Emphasis on Quality, Safety and Diversified Portfolio of the Product . We are committed to food safety and quality in all of our operations to meet the specifications of our clients, prevent contaminationand reduce the risks of epidemics of animal illnesses. We monitor the treatment of our poultry and hogs raised in all the stages of their lives and throughout the entire production process. In 2013, welaunched a campaign in Brazil to publicize the Sadia Total Guarantee Program ( ProgramadeGarantiaTotalSadia) that ensures our chickens have no hormones or preservatives and are individuallyinspected. Moreover, we were the first Brazilian company approved by the European Food Safety and Inspection System, which qualified us to sell processed poultry products to European consumers. Thismeans that our clients include some of the most demanding clients in the world and that we meet their quality controls and external audits. We have a diversified variety of products that give us theflexibility to direct our production according to the market demand and the seasonality of our products. To support this continuous innovation of our product portfolio, we have been continuously investingin our Technology Center in Jundiaí, in upstate São Paulo. Committed Management Team . Our management endeavors to accentuate best practices in our operations and corporate governance standards, as demonstrated by the listing of our common shares on theNovoMercadosegment of the São Paulo stock exchange. Companies listed on this stock market must pledge to adopt the highest standards of corporate governance. We have improved our organizationalstructure and have redesigned it under the following five vice presidents: (i) VP of Finance and Management; (ii) VP of People; (iii) VP of Marketing and Innovation; (iv) VP of Operations and SupplyChain; and (v) VP of Corporate Integrity.
Business Strategy
We intend to become the most inspiring and relevant global food company. In order to achieve this, we reviewed our long-term plan in our yearly strategic planning process. We set four main targets for our companyin the next years:
Have a global brand portfolio. We are expanding our brand portfolio throughout the world. Sadia, for example, has different brand stages across our markets. In Brazil and Middle East countries, it hasimpressive penetration and preference levels, while in Russia, Angola and in some Asian countries, it is becoming increasingly stronger. Qualy is our most relevant brand for spreads, with an innovativeapproach to our consumers in Brazil. Paty and Danica are renowned brands for burgers and condiments, respectively, in Argentina. Those are just some initiatives and, for each of our brands, we look tobring the most value to our consumers.
33
Table of Contents
Focus in six key global categories. Strengthening our portfolio and its quality must be a continuous effort, therefore, we elected our most important categories, considering strategic and value importance.Our global focus is in value added poultry and pork cuts, cold cuts, cooked and coated, ready-to-eat meals, on-the-go and food service portfolio. Capture global opportunities. Internationally, we made important steps to solidify BRF as a global company. In Middle East and Africa, we continued to improve our local production (Abu-Dhabi plant),consolidated distribution and increased processed food portfolio participation. In Asia, we invested in branded portfolio and footprint expansion, such as our recent acquisition in Thailand and Malaysia. InEastern Europe, we focused on retailing presence and, in the U.K., our food service channel became even more relevant. In Argentina, we expanded our position in the cold-cuts market by acquiring twomore companies. Recently, we announced a joint venture with Banvit to enter Turkey, an important poultry market. Banvit is the largest poultry producer in Turkey, with fully integrated operations and thehighest brand awareness in the sector in Turkey. The completion of this transaction is subject to the satisfaction of the conditions precedent set forth in the definitive documents, including anti-trustapprovals. Transformational changes. In the second semester of 2016, we announced our intention to focus on the halal market. In this context, BRF analyzed strategic alternatives for its new subsidiary, OneFoods,enabling its expansion in current markets as well as in those not currently served by BRF. In the beginning of 2017, OneFoods became operational.
Products
We are a food company that focuses on the production and sale of poultry, pork and processed foods.
Poultry
We produce frozen whole and cut poultry. In 2016, we slaughtered approximately 1.72 billion heads of poultry, 0.5% decrease compared to 1.72 billion in 2015. We sold 2,006 thousand tons of frozen chicken andother poultry products in 2016, compared to 1,944 thousand tons in 2015. Most of our poultry sales are to our export markets.
Pork and Beef
In 2016, we slaughtered approximately 9.61 million hogs and cattle, compared to 9.51 million in 2015. We raise hogs but do not raise cattle at our facilities. Although most of hogs that we slaughter are used forprocessed products in the domestic market, we also produce frozen pork and beef cuts, such as loins and ribs, and whole carcasses. We are developing our international customer base for pork and beef cuts. In 2016, we sold350 thousand tons of pork and beef cuts, compared to 273 thousand tons of pork and beef cuts in 2015.
Aligned with our strategic plan (BRF 17), in 2014, we transferred our beef operations to Minerva, in exchange for an equity participation in that company.
Processed Food Products
We produce processed foods, such as marinated and frozen chicken, Chester® rooster and turkey meat, specialty meats, frozen processed foods, frozen prepared entrees, portioned products and sliced products. Partof our strategy is to develop additional processed food products in these and other categories because these products tend to be less price-sensitive than our frozen poultry and pork products. We sold 2,017 thousand tons ofprocessed foods in 2016, compared to 2,116 thousand tons in 2015. Most of our sales of processed foods are to our domestic market. We believe that there are opportunities to market value-added products like these totargeted regions and other market segments in Brazil as well as to expand our sales in the export market.
34
Table of Contents
Our processed food products strategy relies on accurate brand equity management, varied product portfolio with strategic pricing, and innovation and service excellence, which allows our products to reach thousandsof Brazilian and international homes each day.
SpecialtyMeats
We process pork to produce specialty meats, such as sausages, ham products, bologna, frankfurters, salamis, bacon and cold meats. We also process chicken and other poultry to produce specialty meats, such aschicken sausages, chicken hot dogs and chicken bologna.
FrozenProcessedMeats
We produce a range of frozen processed poultry, pork and beef products, including hamburgers, steaks, breaded meat products, kibes(a type of Middle Eastern beef patty popular in Brazil) and meatballs.
MarinatedPoultry
We produce marinated and seasoned chickens, roosters (under the Chester® brand) and turkeys. We originally developed the Chester® breed of rooster to maximize the yield of breast and leg cuts. In 2004, we soldour rights to the Chester® breed of rooster to Cobb Vantress, a U.S. poultry research and development company engaged in the production, improvement and sale of broiler breeding stock, and we entered into a technologyagreement under which Cobb Vantress manages the Chester® breed of rooster. We continue to oversee the production of Chester® roosters in Brazil from hatching to distribution, and we own the trademarks for the Chester® line of products.
HalalProducts
We offer poultry products for Muslim markets in accordance with the Halal method of animal slaughter.
FrozenPreparedEntrees
We produce a range of frozen prepared entrees, some of which contain poultry, beef and pork meat that we produce, including those listed below.
PastasandPizzas. We produce several varieties of lasagna, pizza and other ready-to-eat meals. We produce the meat used in these products and buy other raw materials in the domestic market. Vegetables. We sell a variety of frozen vegetables, such as broccoli, peas and French fries. These products are produced by third parties that deliver them to us packaged. We purchase most of theseproducts in the domestic market, but we import French fries and peas. PiesandPastries. We produce a variety of pies and pastries, such as chicken and heart-of-palm pies. We produce the meat, sauces and toppings used in our pies and pastries, and we purchase other rawmaterials, such as heart-of-palm, lime and other fillings from third parties.
Margarine
We sell margarine under Qualy, Deline and Claybom brands. We maintain our leadership with Qualy brand and in 2014 we introduced the first aerated margarine in Brazil. The aerated texture is a result of uniquemanufacturing process. We purchase the soybean oil from an agricultural cooperative supplier. We also entered into a strategic agreement with Unilever for the management of the margarine brands Beceland BecelProActivin Brazil.
35
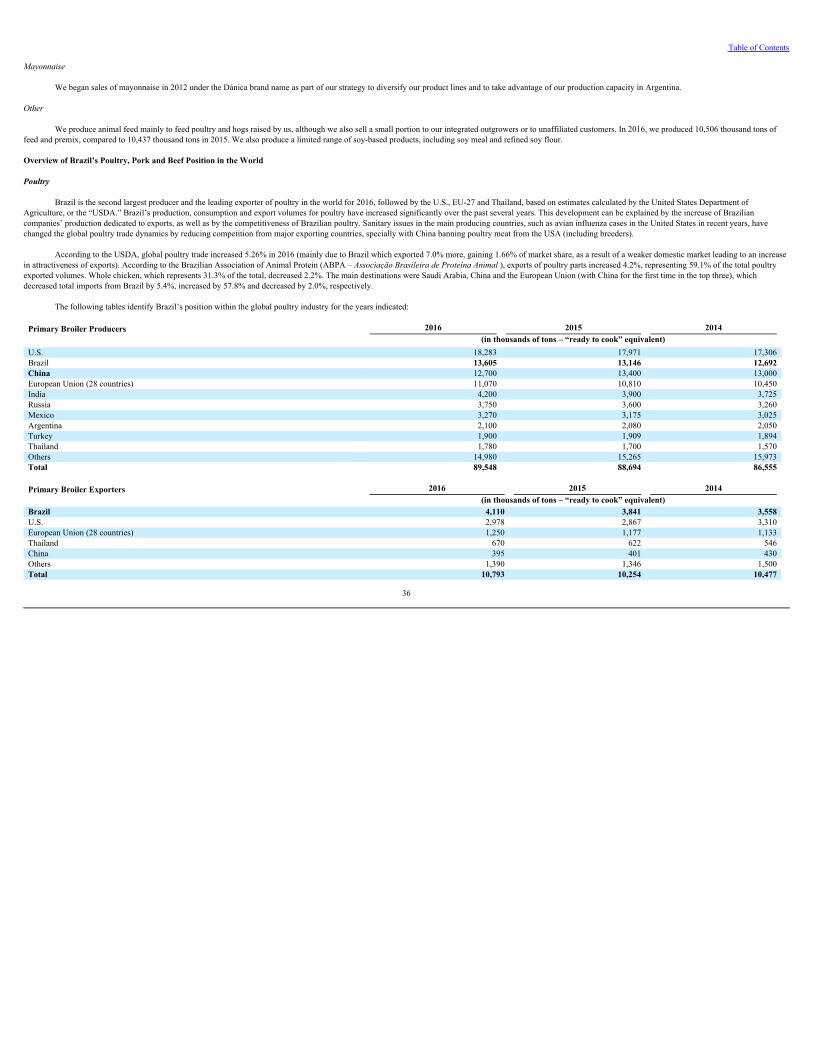
Table of Contents
Mayonnaise
We began sales of mayonnaise in 2012 under the Dánica brand name as part of our strategy to diversify our product lines and to take advantage of our production capacity in Argentina.
Other
We produce animal feed mainly to feed poultry and hogs raised by us, although we also sell a small portion to our integrated outgrowers or to unaffiliated customers. In 2016, we produced 10,506 thousand tons offeed and premix, compared to 10,437 thousand tons in 2015. We also produce a limited range of soy-based products, including soy meal and refined soy flour.
Overview of Brazil’s Poultry, Pork and Beef Position in the World
Poultry
Brazil is the second largest producer and the leading exporter of poultry in the world for 2016, followed by the U.S., EU-27 and Thailand, based on estimates calculated by the United States Department ofAgriculture, or the “USDA.” Brazil’s production, consumption and export volumes for poultry have increased significantly over the past several years. This development can be explained by the increase of Braziliancompanies’ production dedicated to exports, as well as by the competitiveness of Brazilian poultry. Sanitary issues in the main producing countries, such as avian influenza cases in the United States in recent years, havechanged the global poultry trade dynamics by reducing competition from major exporting countries, specially with China banning poultry meat from the USA (including breeders).
According to the USDA, global poultry trade increased 5.26% in 2016 (mainly due to Brazil which exported 7.0% more, gaining 1.66% of market share, as a result of a weaker domestic market leading to an increasein attractiveness of exports). According to the Brazilian Association of Animal Protein (ABPA – AssociaçãoBrasileiradeProteínaAnimal), exports of poultry parts increased 4.2%, representing 59.1% of the total poultryexported volumes. Whole chicken, which represents 31.3% of the total, decreased 2.2%. The main destinations were Saudi Arabia, China and the European Union (with China for the first time in the top three), whichdecreased total imports from Brazil by 5.4%, increased by 57.8% and decreased by 2.0%, respectively.
The following tables identify Brazil’s position within the global poultry industry for the years indicated:
Primary Broiler Producers 2016 2015 2014
(in thousands of tons – “ready to cook” equivalent)U.S. 18,283 17,971 17,306Brazil 13,605 13,146 12,692China 12,700 13,400 13,000European Union (28 countries) 11,070 10,810 10,450India 4,200 3,900 3,725Russia 3,750 3,600 3,260Mexico 3,270 3,175 3,025Argentina 2,100 2,080 2,050Turkey 1,900 1,909 1,894Thailand 1,780 1,700 1,570Others 14,980 15,265 15,973Total 89,548 88,694 86,555
Primary Broiler Exporters 2016 2015 2014 (in thousands of tons – “ready to cook” equivalent)Brazil 4,110 3,841 3,558U.S. 2,978 2,867 3,310European Union (28 countries) 1,250 1,177 1,133Thailand 670 622 546China 395 401 430Others 1,390 1,346 1,500Total 10,793 10,254 10,477
36
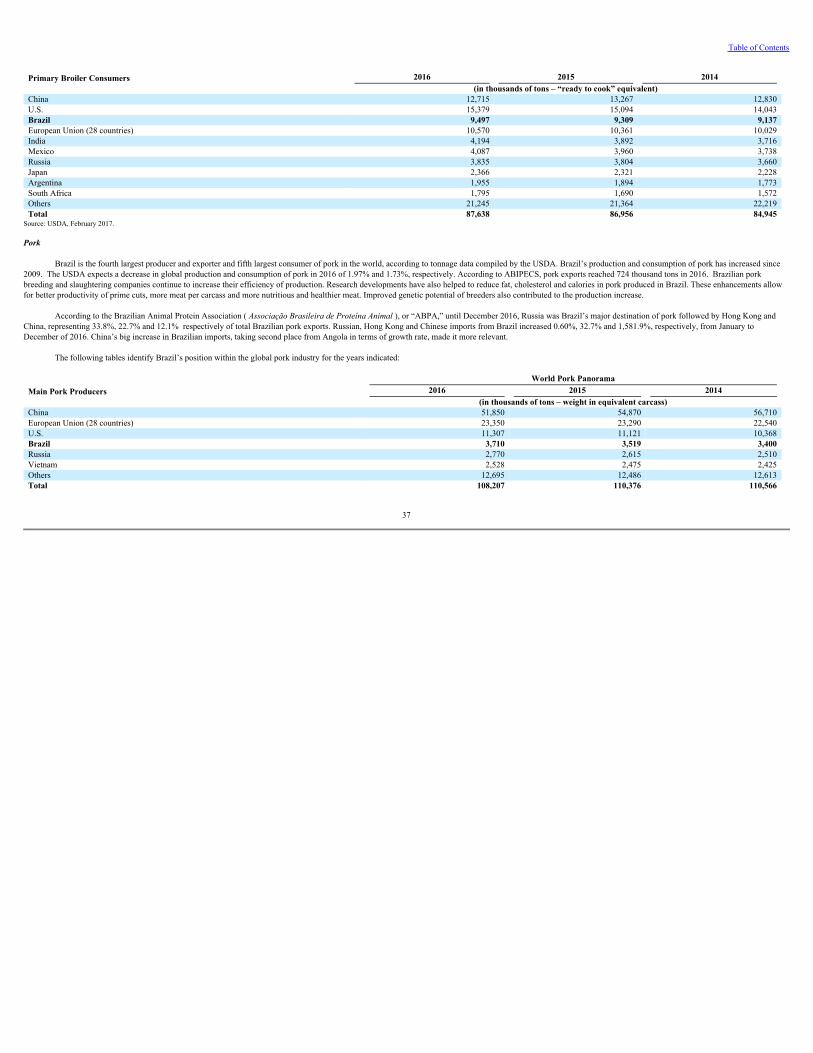
Table of Contents
Primary Broiler Consumers 2016 2015 2014
(in thousands of tons – “ready to cook” equivalent)China 12,715 13,267 12,830U.S. 15,379 15,094 14,043Brazil 9,497 9,309 9,137European Union (28 countries) 10,570 10,361 10,029India 4,194 3,892 3,716Mexico 4,087 3,960 3,738Russia 3,835 3,804 3,660Japan 2,366 2,321 2,228Argentina 1,955 1,894 1,773South Africa 1,795 1,690 1,572Others 21,245 21,364 22,219Total 87,638 86,956 84,945
Source: USDA, February 2017.
Pork
Brazil is the fourth largest producer and exporter and fifth largest consumer of pork in the world, according to tonnage data compiled by the USDA. Brazil’s production and consumption of pork has increased since2009. The USDA expects a decrease in global production and consumption of pork in 2016 of 1.97% and 1.73%, respectively. According to ABIPECS, pork exports reached 724 thousand tons in 2016. Brazilian porkbreeding and slaughtering companies continue to increase their efficiency of production. Research developments have also helped to reduce fat, cholesterol and calories in pork produced in Brazil. These enhancements allowfor better productivity of prime cuts, more meat per carcass and more nutritious and healthier meat. Improved genetic potential of breeders also contributed to the production increase.
According to the Brazilian Animal Protein Association ( AssociaçãoBrasileiradeProteínaAnimal), or “ABPA,” until December 2016, Russia was Brazil’s major destination of pork followed by Hong Kong andChina, representing 33.8%, 22.7% and 12.1% respectively of total Brazilian pork exports. Russian, Hong Kong and Chinese imports from Brazil increased 0.60%, 32.7% and 1,581.9%, respectively, from January toDecember of 2016. China’s big increase in Brazilian imports, taking second place from Angola in terms of growth rate, made it more relevant.
The following tables identify Brazil’s position within the global pork industry for the years indicated:
World Pork PanoramaMain Pork Producers 2016 2015 2014
(in thousands of tons – weight in equivalent carcass)China 51,850 54,870 56,710European Union (28 countries) 23,350 23,290 22,540U.S. 11,307 11,121 10,368Brazil 3,710 3,519 3,400Russia 2,770 2,615 2,510Vietnam 2,528 2,475 2,425Others 12,695 12,486 12,613Total 108,207 110,376 110,566
37
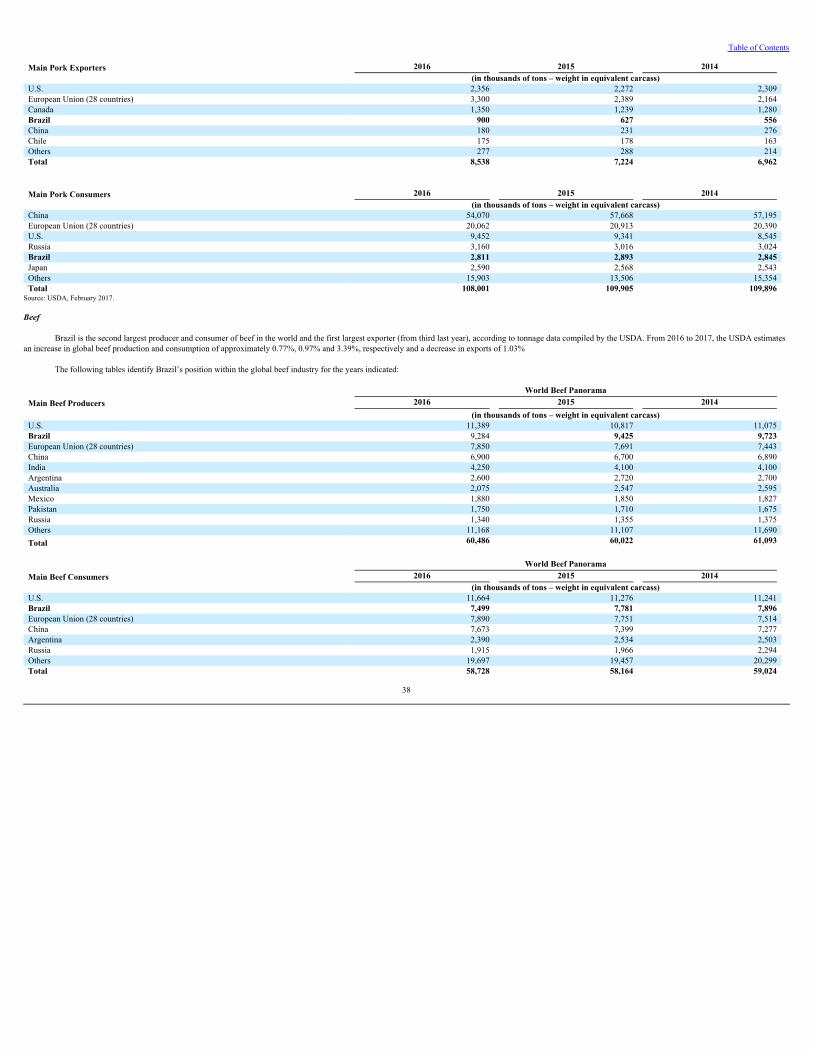
Table of Contents
Main Pork Exporters 2016 2015 2014(in thousands of tons – weight in equivalent carcass)
U.S. 2,356 2,272 2,309European Union (28 countries) 3,300 2,389 2,164Canada 1,350 1,239 1,280Brazil 900 627 556China 180 231 276Chile 175 178 163Others 277 288 214Total 8,538 7,224 6,962
Main Pork Consumers 2016 2015 2014(in thousands of tons – weight in equivalent carcass)
China 54,070 57,668 57,195European Union (28 countries) 20,062 20,913 20,390U.S. 9,452 9,341 8,545Russia 3,160 3,016 3,024Brazil 2,811 2,893 2,845Japan 2,590 2,568 2,543Others 15,903 13,506 15,354Total 108,001 109,905 109,896
Source: USDA, February 2017.
Beef
Brazil is the second largest producer and consumer of beef in the world and the first largest exporter (from third last year), according to tonnage data compiled by the USDA. From 2016 to 2017, the USDA estimatesan increase in global beef production and consumption of approximately 0.77%, 0.97% and 3.39%, respectively and a decrease in exports of 1.03%
The following tables identify Brazil’s position within the global beef industry for the years indicated:
World Beef PanoramaMain Beef Producers 2016 2015 2014 (in thousands of tons – weight in equivalent carcass)U.S. 11,389 10,817 11,075Brazil 9,284 9,425 9,723European Union (28 countries) 7,850 7,691 7,443China 6,900 6,700 6,890India 4,250 4,100 4,100Argentina 2,600 2,720 2,700Australia 2,075 2,547 2,595Mexico 1,880 1,850 1,827Pakistan 1,750 1,710 1,675Russia 1,340 1,355 1,375Others 11,168 11,107 11,690Total 60,486 60,022 61,093
World Beef PanoramaMain Beef Consumers 2016 2015 2014
(in thousands of tons – weight in equivalent carcass)U.S. 11,664 11,276 11,241Brazil 7,499 7,781 7,896European Union (28 countries) 7,890 7,751 7,514China 7,673 7,399 7,277Argentina 2,390 2,534 2,503Russia 1,915 1,966 2,294Others 19,697 19,457 20,299Total 58,728 58,164 59,024
38
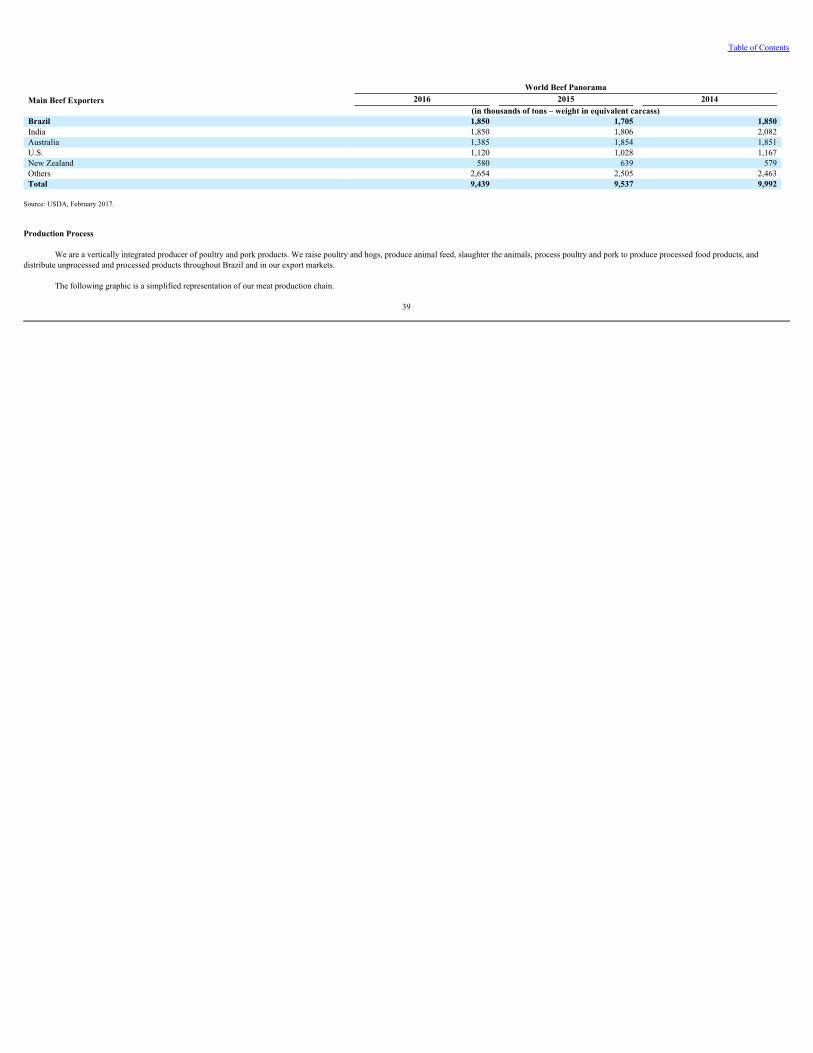
Table of Contents
World Beef PanoramaMain Beef Exporters 2016 2015 2014
(in thousands of tons – weight in equivalent carcass)Brazil 1,850 1,705 1,850India 1,850 1,806 2,082Australia 1,385 1,854 1,851U.S. 1,120 1,028 1,167New Zealand 580 639 579Others 2,654 2,505 2,463Total 9,439 9,537 9,992
Source: USDA, February 2017.
Production Process
We are a vertically integrated producer of poultry and pork products. We raise poultry and hogs, produce animal feed, slaughter the animals, process poultry and pork to produce processed food products, anddistribute unprocessed and processed products throughout Brazil and in our export markets.
The following graphic is a simplified representation of our meat production chain.
39
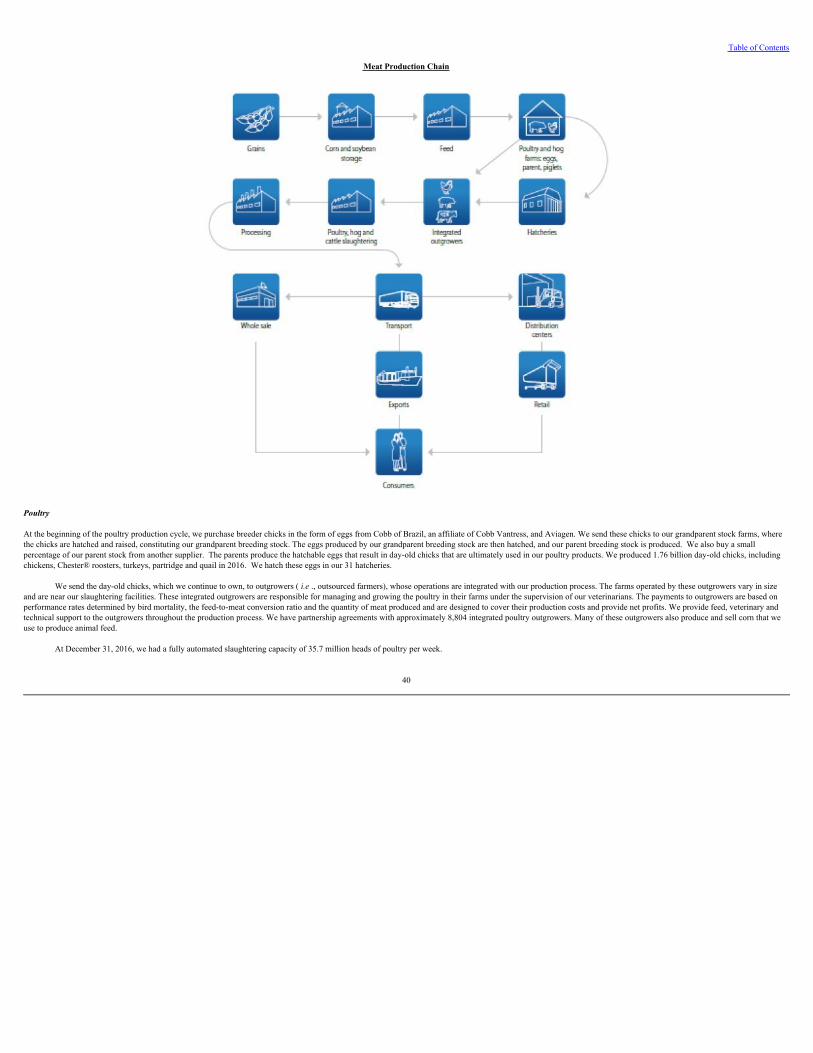
Table of Contents
Meat Production Chain
Poultry
At the beginning of the poultry production cycle, we purchase breeder chicks in the form of eggs from Cobb of Brazil, an affiliate of Cobb Vantress, and Aviagen. We send these chicks to our grandparent stock farms, wherethe chicks are hatched and raised, constituting our grandparent breeding stock. The eggs produced by our grandparent breeding stock are then hatched, and our parent breeding stock is produced. We also buy a smallpercentage of our parent stock from another supplier. The parents produce the hatchable eggs that result in day-old chicks that are ultimately used in our poultry products. We produced 1.76 billion day-old chicks, includingchickens, Chester® roosters, turkeys, partridge and quail in 2016. We hatch these eggs in our 31 hatcheries.
We send the day-old chicks, which we continue to own, to outgrowers ( i.e., outsourced farmers), whose operations are integrated with our production process. The farms operated by these outgrowers vary in sizeand are near our slaughtering facilities. These integrated outgrowers are responsible for managing and growing the poultry in their farms under the supervision of our veterinarians. The payments to outgrowers are based onperformance rates determined by bird mortality, the feed-to-meat conversion ratio and the quantity of meat produced and are designed to cover their production costs and provide net profits. We provide feed, veterinary andtechnical support to the outgrowers throughout the production process. We have partnership agreements with approximately 8,804 integrated poultry outgrowers. Many of these outgrowers also produce and sell corn that weuse to produce animal feed.
At December 31, 2016, we had a fully automated slaughtering capacity of 35.7 million heads of poultry per week.
40
Table of Contents
Pork
We produce the majority of the pork we use in our products. We also purchase some pork on the spot market.
To produce pork, we generally purchase piglets from integrated outgrowers near our production facilities, which raise the piglets until they reach a specified weight. The piglet producers either purchase parentbreeder hogs produced by our company or from producers such as Agroceres and DanBred or we purchase young piglets from farmers who own breeder hogs. We transfer these piglets to separate integrated outgrowers, whoraise the hogs until they reach slaughtering weight. We then transport the hogs from these outgrowers to our slaughtering facilities. We have agreements with a total of approximately 3,999 integrated outgrowers, includingpiglet producers and hog raisers. We monitor the production of the hogs by these outgrowers and provide support from our veterinarians.
The local producers from whom we purchase a portion of our pork needs are also located near our production facilities but are not parties to partnership agreements with us. These producers generally raise the hogsfrom birth until they reach slaughtering weight, and we provide limited technical support. We purchase the hogs raised by these local producers pursuant to contracts.
We slaughter the hogs raised by our outgrowers or purchased from local producers or on the spot market. After they are slaughtered, the hogs are immediately cut in half. The half-carcasses are then partitionedaccording to their intended use. These parts become the raw material for the production of pork cuts and specialty meats.
At December 31, 2016, we had a pork slaughtering capacity of 197,188 heads per week.
Beef
We had a beef slaughtering capacity of 14,400 heads per week until October 1, 2014 when BRF and Minerva signed an Investment Agreement pursuant to which BRF allocated its beef slaughtering plants in VárzeaGrande and Mirassol, as well as the BRF employees involved in these activities, to a closed capital company that was incorporated within Minerva, in return for an equity in Minerva. This deal closed on October 1, 2014.
BRF currently has a beef slaughtering capacity of 3,106 heads per week in a factory in Argentina.
Processed Foods
We sell a variety of processed foods, some of which contain poultry, pork and beef meat that we produce. BRF has a total production capacity of 197 thousand tons/month across 17 production units in Brazil(Chapecó, Marau, Capinzal, Toledo, Várzea Grande, Videira, Lucas do Rio Verde, Rio Verde, Uberlândia, Concórdia, Tatuí, Vitória de Santo Antão, Herval d’Oeste, Lajeado, Ponta Grossa, Paranaguá and Rio de Janeiro)processing meat products (such as mortadella, franks, sausage, hamburger and breaded) and non-meat products (such as lasagna, ready meals and pizzas) for both the domestic and international markets. In Tatuí, in the Stateof São Paulo, we produce ready-to-eat sandwiches, lasagnas, pizzas, cheese breads and other pasta and bakery items. In Ponta Grossa, in the State of Paraná, we produce pizzas, pastas, desserts ( MissDaisy) and otherprocessed products. Our Rio Verde plant is adjacent to our Rio Verde poultry and pork slaughtering facilities, and we transport pork from other production facilities to be used as raw materials. We purchase most of theremaining ingredients for our lasagnas, pizzas, pies and pastries in the domestic market from third parties. Such seasonings and secondary raw materials are applied to each product type or line according to established criteriaand procedures to ensure consistency of color, texture and flavor. The presentation of final products is achieved by shaping, casing, cooking and freezing in special machines. Products are then subjected to quality controls anddistributed to the consumer market after having been packaged, labeled and boxed.
BRF also has nine plants in Argentina for processing products such as hamburgers, franks, hams, vegetables and margarines. Their capacities are on average 15 thousand tons/month.
41
Table of Contents
In November 2014, BRF inaugurated its first plant in Middle East, with a total capacity of 70 thousand tons/year, aiming to supply the local Market, Europe and Asia. This plant produces franks, breaded, hamburger,mortadella and marinated chicken breast.
We sell a variety of frozen vegetables, such as broccoli, cauliflower, peas, French beans, French fries and cassava fries. These products are produced for us by third parties that deliver them to us packaged. Wepurchase most of these products in the Brazilian market, but we import French fries from Belgium and peas from Argentina. We also produce soy-based products, such as soy meal and refined soy flour, at our plants inVideira, located in the State of Santa Catarina in Dois Vizinhos, in the State of Paraná and in Toledo, also in the State of Paraná.
The raw material for margarine is crude soybean oil, which is subjected to refining and bleaching processes. We produce margarines in our plant in Paranaguá, State of Paraná, Uberlândia, State of Minas Gerais andVitória de Santo Antão, under the Qualy,DelineandClaybonbrands and in the State of Pernambuco under the brands Qualyand Deline. We sell these products as part of our strategy to diversify our product lines and to takeadvantage of our distribution network for refrigerated products.
We also sell halal food, which is the food allowed for Muslim consumption. The halal poultry needs to undergo through a specific religious/technical procedure of slaughter and processing, assuring that it wasproduced according to the Islamic law and that it had no contact with prohibited food or ingredient. Both BRF and OneFoods are assisted by Muslim entities that are responsible for slaughtering and certifying all our halalproducts.
Feed
We produce most of the feed consumed at the farms operated by our integrated poultry and hog outgrowers. We provide feed to most of our integrated poultry and hog outgrowers as part of our partnershiparrangements with them. We also sell animal feed to local hog producers at market rates.
We own 31 feed production plants. The basic raw materials used in animal feed production are corn and soy meal mixed with preservatives and micronutrients. In 2015 and 2016, we also purchased corn from ruralproducers and small merchants, through cooperatives and from trading companies such as Coamo, Bunge, Cargill, ADM and others. The corn is grown primarily in the states of Paraná, Santa Catarina, Rio Grande do Sul,Goiás, Mato Grosso, Mato Grosso do Sul and Minas Gerais. We buy soy meal from major producers such as Bunge, Cargill, ADM, Dreyfus and Amaggi, primarily pursuant to long-term contracts. The prices of corn,soybeans and soy meal fluctuate significantly. See “Item 5. Operating and Financial Review and Prospects—A. Operating Results—Principal Factors Affecting our Results of Operations—Commodity Prices.”
Other Raw Materials
We purchase other materials required for our products, such as prepared animal intestines (for sausage casings), cardboard boxes and plastic (for packaging), micronutrients (for animal feed), spices and veterinarydrugs from third parties, both in the domestic and international markets.
Suppliers
One of our strategies is to build more efficient relationships with our suppliers, using selection criteria to assess the suppliers in different dimensions, including the quality of the product, the product performance andreliability in terms of delivery.
In the third quarter of 2015, we started a process to enhance partnerships with some strategic suppliers through agreements that value partnership and innovation. This initiative was developed in 2016 and by now wehave entered into almost 20 contracts.
The efficient evaluation in selecting suppliers is regarded as one of our critical responsibilities, aimed at maintaining a network of accomplished suppliers and meeting our growing challenges to ensure our marketcompetitiveness. The assessment process often involves the simultaneous consideration of various important attributes of the supplier´s performance, including price, delivery time, quality and post-sales support, along withits social and environmental policies and performance.
42
Table of Contents
Our Code of Conduct, which is posted on our website and agreed in advance by our suppliers, governs and regulates our relationship and focuses on ethical behavior and social and environmental responsibility, asthe supplier’s performance is one of the determining factors of our success.
Our process follows established guidelines, supported by systems, that lay down rules and instructions to be followed by all members of procurement team, such as the Approval Chain of Command and the ServiceLevel Agreement (SLA).
Tracking and auditing are continually monitored through internal and external audits to ensure that our processes are constantly improving. Brazilian Market
Brazil is the fifth largest country in the world, both in terms of land mass and population. In August 2016, Brazil had an estimated population of 206.08 million people, according to figures from the IBGE. Brazil’sGDP amounted to R$5.77 trillion in 2014, R$6.0 trillion in 2015 and R$6.26 trillion in 2016, in current value. GDP decreased in accumulated terms in 2016 by 3.59%
Inflation measured by the National Amplified Consumer Price Index (known as the IPCA - ÍndiceNacionaldePreçosaoConsumidorAmplo), published by the IBGE, came to 6.41% in 2014, 10.67% in 2015 and6.29% in 2016, following a trend of relatively high rates. The end-of-period exchange rate, as measured by the Brazilian Central Bank, was R$2.65/US$1.00 in 2014, R$3.90/US$1.00 in 2015 and R$3.26/US$1.00 in 2016with the realapreciating by 16% in 2016.
Brazil is also one of the largest meat consumers in the world, with per capita consumption in 2016 of 96.11 kilograms, including beef, chicken and pork products, according to the USDA. Demand for poultry andpork products in the domestic market is directly affected by the country’s economic conditions. The overall trend to a deterioration in economic conditions and the lower purchasing power of Brazilians in 2016 have supportedthe decrease in demand for processed products, as well as traditional fresh food and frozen poultry and pork products.
Brazil’s domestic market is highly competitive, particularly for fresh food and frozen poultry and pork products. There are many large producers, most notably BRF, but also Cooperativa Central Aurora Alimentos(“Aurora”) and Seara Alimentos S.A. (“Seara”) (which was acquired from Marfrig by JBS S.A. (“JBS”) in 2013). The main producers in the fresh food market face strong competition from a large number of small playerswhich operate in the informal economy and sometimes offer low quality products at lower prices than those of the large producers. BRF endeavors to develop quality products, focusing on innovative solutions that meetclients’ needs and capture value for the strong brands it owns, such as Sadia and Perdigão.
The processed food sector is more concentrated than the fresh food sector in terms of the number of players. Consumption of processed products is influenced by a number of factors, including the rise in consumerincome and marketing efforts directed at meeting consumer demand for more value-added products. We believe that processed foods also represent an opportunity for growth in the coming years.
We estimate the following market information:
the Brazilian industrialized food market had revenues of approximately R$13,757 million in 2016 compared with R$13,260 million in 2015; the Brazilian frozen food market had revenues of approximately R$3,293 million in 2016 compared with R$3,385 million in 2015;
43
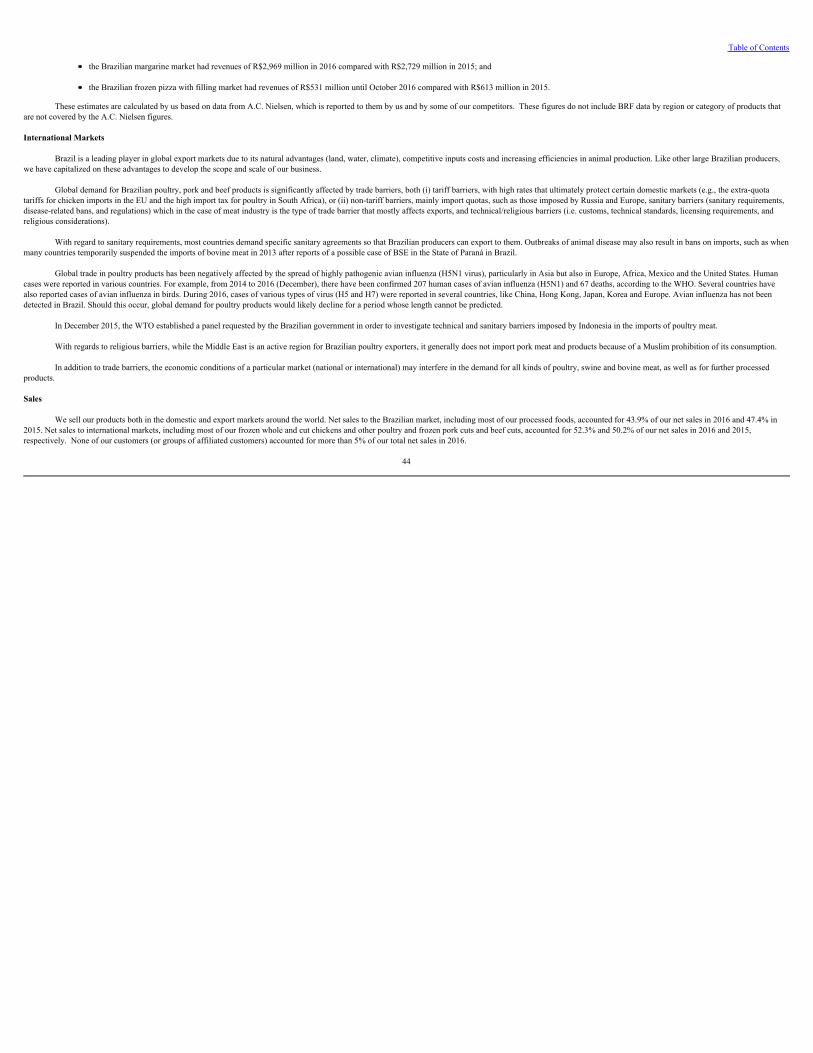
Table of Contents
the Brazilian margarine market had revenues of R$2,969 million in 2016 compared with R$2,729 million in 2015; and the Brazilian frozen pizza with filling market had revenues of R$531 million until October 2016 compared with R$613 million in 2015.
These estimates are calculated by us based on data from A.C. Nielsen, which is reported to them by us and by some of our competitors. These figures do not include BRF data by region or category of products thatare not covered by the A.C. Nielsen figures.
International Markets
Brazil is a leading player in global export markets due to its natural advantages (land, water, climate), competitive inputs costs and increasing efficiencies in animal production. Like other large Brazilian producers,we have capitalized on these advantages to develop the scope and scale of our business.
Global demand for Brazilian poultry, pork and beef products is significantly affected by trade barriers, both (i) tariff barriers, with high rates that ultimately protect certain domestic markets (e.g., the extra-quotatariffs for chicken imports in the EU and the high import tax for poultry in South Africa), or (ii) non-tariff barriers, mainly import quotas, such as those imposed by Russia and Europe, sanitary barriers (sanitary requirements,disease-related bans, and regulations) which in the case of meat industry is the type of trade barrier that mostly affects exports, and technical/religious barriers (i.e. customs, technical standards, licensing requirements, andreligious considerations).
With regard to sanitary requirements, most countries demand specific sanitary agreements so that Brazilian producers can export to them. Outbreaks of animal disease may also result in bans on imports, such as whenmany countries temporarily suspended the imports of bovine meat in 2013 after reports of a possible case of BSE in the State of Paraná in Brazil.
Global trade in poultry products has been negatively affected by the spread of highly pathogenic avian influenza (H5N1 virus), particularly in Asia but also in Europe, Africa, Mexico and the United States. Humancases were reported in various countries. For example, from 2014 to 2016 (December), there have been confirmed 207 human cases of avian influenza (H5N1) and 67 deaths, according to the WHO. Several countries havealso reported cases of avian influenza in birds. During 2016, cases of various types of virus (H5 and H7) were reported in several countries, like China, Hong Kong, Japan, Korea and Europe. Avian influenza has not beendetected in Brazil. Should this occur, global demand for poultry products would likely decline for a period whose length cannot be predicted.
In December 2015, the WTO established a panel requested by the Brazilian government in order to investigate technical and sanitary barriers imposed by Indonesia in the imports of poultry meat.
With regards to religious barriers, while the Middle East is an active region for Brazilian poultry exporters, it generally does not import pork meat and products because of a Muslim prohibition of its consumption.
In addition to trade barriers, the economic conditions of a particular market (national or international) may interfere in the demand for all kinds of poultry, swine and bovine meat, as well as for further processedproducts.
Sales
We sell our products both in the domestic and export markets around the world. Net sales to the Brazilian market, including most of our processed foods, accounted for 43.9% of our net sales in 2016 and 47.4% in2015. Net sales to international markets, including most of our frozen whole and cut chickens and other poultry and frozen pork cuts and beef cuts, accounted for 52.3% and 50.2% of our net sales in 2016 and 2015,respectively. None of our customers (or groups of affiliated customers) accounted for more than 5% of our total net sales in 2016.
44
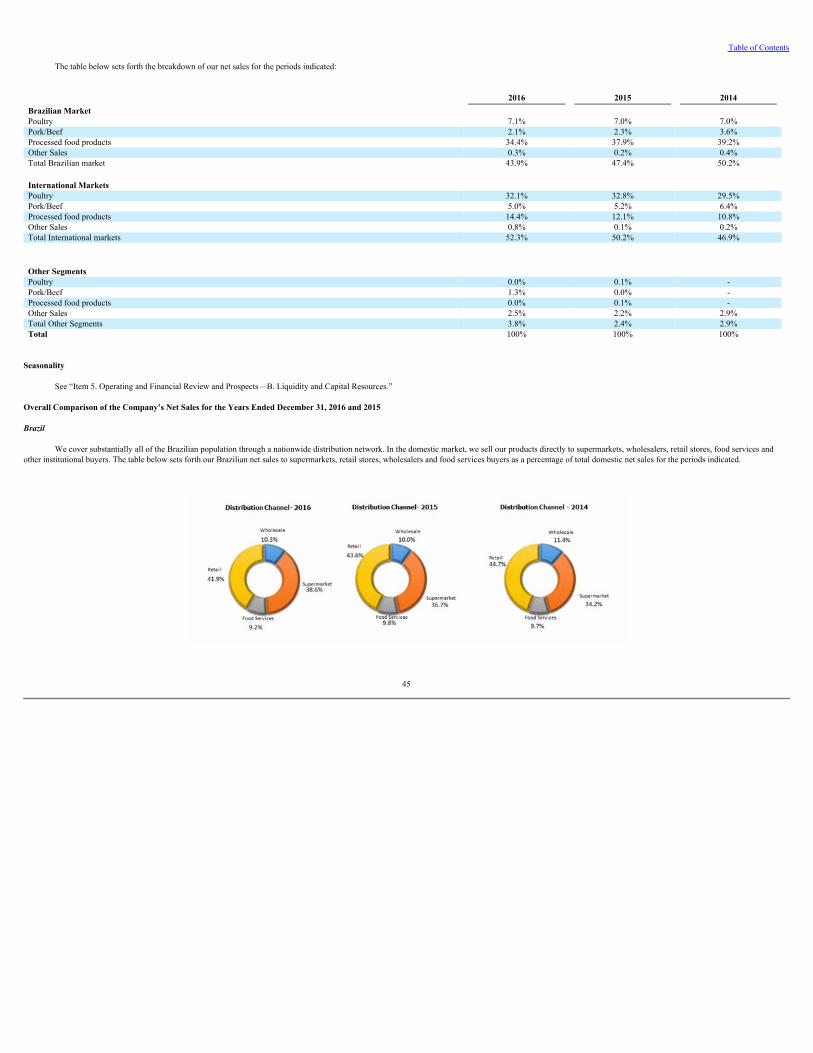
Table of Contents
The table below sets forth the breakdown of our net sales for the periods indicated:
2016 2015 2014Brazilian Market Poultry 7.1% 7.0% 7.0%Pork/Beef 2.1% 2.3% 3.6%Processed food products 34.4% 37.9% 39.2%Other Sales 0.3% 0.2% 0.4%Total Brazilian market 43.9% 47.4% 50.2% International Markets
Poultry 32.1% 32.8% 29.5%Pork/Beef 5.0% 5.2% 6.4%Processed food products 14.4% 12.1% 10.8%Other Sales 0.8% 0.1% 0.2%Total International markets 52.3% 50.2% 46.9% Other Segments
Poultry 0.0% 0.1% -Pork/Beef 1.3% 0.0% -Processed food products 0.0% 0.1% -Other Sales 2.5% 2.2% 2.9%Total Other Segments 3.8% 2.4% 2.9%Total 100% 100% 100%
Seasonality
See “Item 5. Operating and Financial Review and Prospects—B. Liquidity and Capital Resources.”
Overall Comparison of the Company’s Net Sales for the Years Ended December 31, 2016 and 2015
Brazil
We cover substantially all of the Brazilian population through a nationwide distribution network. In the domestic market, we sell our products directly to supermarkets, wholesalers, retail stores, food services andother institutional buyers. The table below sets forth our Brazilian net sales to supermarkets, retail stores, wholesalers and food services buyers as a percentage of total domestic net sales for the periods indicated.
45
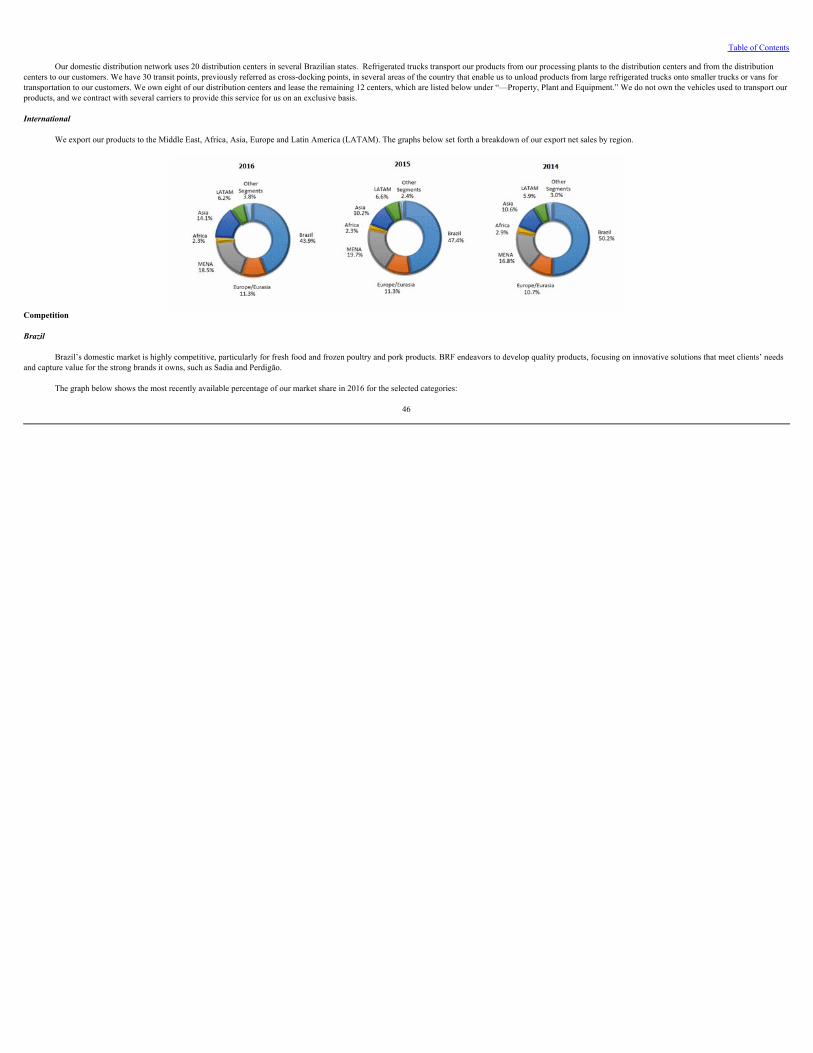
Table of Contents
Our domestic distribution network uses 20 distribution centers in several Brazilian states. Refrigerated trucks transport our products from our processing plants to the distribution centers and from the distributioncenters to our customers. We have 30 transit points, previously referred as cross-docking points, in several areas of the country that enable us to unload products from large refrigerated trucks onto smaller trucks or vans fortransportation to our customers. We own eight of our distribution centers and lease the remaining 12 centers, which are listed below under “—Property, Plant and Equipment.” We do not own the vehicles used to transport ourproducts, and we contract with several carriers to provide this service for us on an exclusive basis.
International
We export our products to the Middle East, Africa, Asia, Europe and Latin America (LATAM). The graphs below set forth a breakdown of our export net sales by region.
Competition
Brazil
Brazil’s domestic market is highly competitive, particularly for fresh food and frozen poultry and pork products. BRF endeavors to develop quality products, focusing on innovative solutions that meet clients’ needsand capture value for the strong brands it owns, such as Sadia and Perdigão.
The graph below shows the most recently available percentage of our market share in 2016 for the selected categories:
46
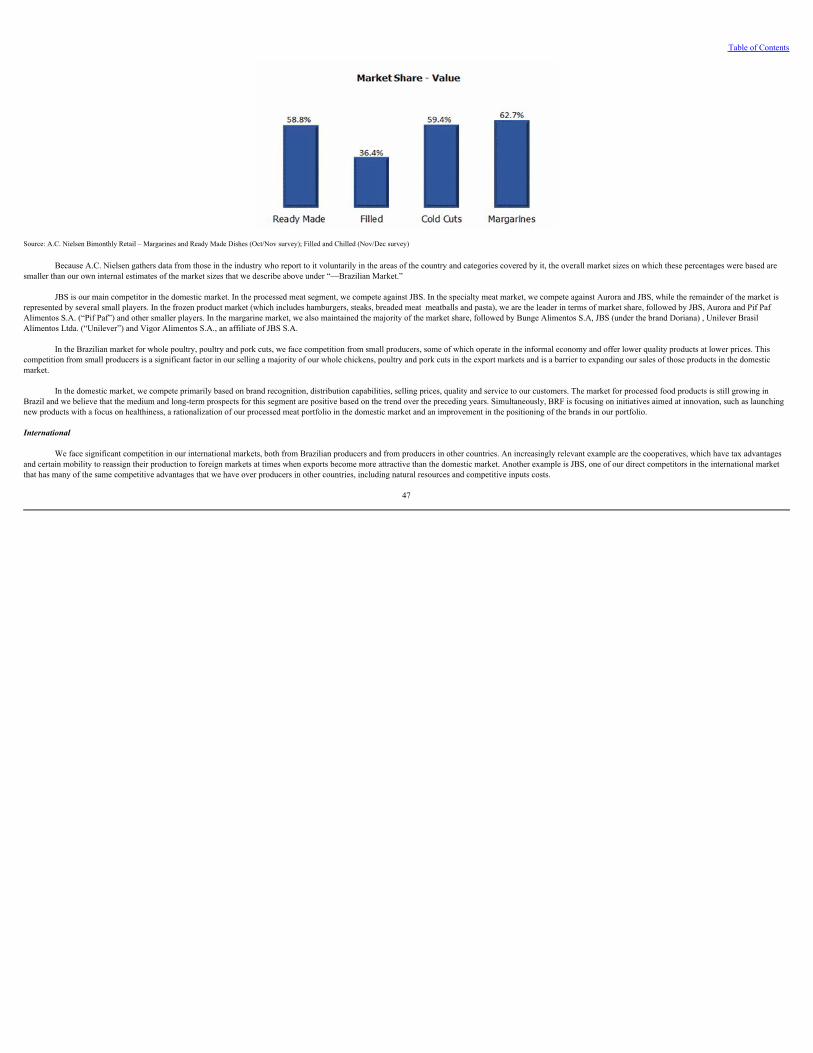
Table of Contents
Source: A.C. Nielsen Bimonthly Retail – Margarines and Ready Made Dishes (Oct/Nov survey); Filled and Chilled (Nov/Dec survey)
Because A.C. Nielsen gathers data from those in the industry who report to it voluntarily in the areas of the country and categories covered by it, the overall market sizes on which these percentages were based aresmaller than our own internal estimates of the market sizes that we describe above under “—Brazilian Market.”
JBS is our main competitor in the domestic market. In the processed meat segment, we compete against JBS. In the specialty meat market, we compete against Aurora and JBS, while the remainder of the market isrepresented by several small players. In the frozen product market (which includes hamburgers, steaks, breaded meat meatballs and pasta), we are the leader in terms of market share, followed by JBS, Aurora and Pif PafAlimentos S.A. (“Pif Paf”) and other smaller players. In the margarine market, we also maintained the majority of the market share, followed by Bunge Alimentos S.A, JBS (under the brand Doriana) , Unilever BrasilAlimentos Ltda. (“Unilever”) and Vigor Alimentos S.A., an affiliate of JBS S.A.
In the Brazilian market for whole poultry, poultry and pork cuts, we face competition from small producers, some of which operate in the informal economy and offer lower quality products at lower prices. Thiscompetition from small producers is a significant factor in our selling a majority of our whole chickens, poultry and pork cuts in the export markets and is a barrier to expanding our sales of those products in the domesticmarket.
In the domestic market, we compete primarily based on brand recognition, distribution capabilities, selling prices, quality and service to our customers. The market for processed food products is still growing inBrazil and we believe that the medium and long-term prospects for this segment are positive based on the trend over the preceding years. Simultaneously, BRF is focusing on initiatives aimed at innovation, such as launchingnew products with a focus on healthiness, a rationalization of our processed meat portfolio in the domestic market and an improvement in the positioning of the brands in our portfolio.
International
We face significant competition in our international markets, both from Brazilian producers and from producers in other countries. An increasingly relevant example are the cooperatives, which have tax advantagesand certain mobility to reassign their production to foreign markets at times when exports become more attractive than the domestic market. Another example is JBS, one of our direct competitors in the international marketthat has many of the same competitive advantages that we have over producers in other countries, including natural resources and competitive inputs costs.
47
Table of Contents
Our chicken and pork cuts, in particular, are highly competitive in price and sensitive to substitution by other products. Customers sometimes seek to diversify their sources of supply in different countries, eventhough we have the lowest cost of production.
Protectionist measures among Brazil's trading partners are also an important competitive factor. Brazilian exports of poultry and swine are increasingly affected by actions taken by other countries to protect localproducers.
Our net sales in the international market reached R$17.6 billion in 2016, an increase of 9.1% over 2015. We believe we export significantly more than our main Brazilian competitors, as BRF has approximately32.4% and 70.2% of the export market share in poultry and turkey, respectively.
In our international markets, our competition is based on quality, cost, sale prices and service to our customers.
Distribution of Products
Brazilian Market
As of December 31, 2016, we operated 20 distribution centers and 30 transit points. In 2016, we g ained productivity based on new technologies in our Brazilian distribution and an improvement in the service levelwith reduction of lead time in deliveries.
International Markets
We export our products mainly through the ports of Itajai, Navegantes and Itapoá in the state of Santa Catarina. We also export our products through Rio Grande in the state of Rio Grande do Sul, Paranaguá in thestate of Paraná and Santos in the state of São Paulo. We store our products in refrigerated storages that are owned and operated mainly by third parties located at ports in the states of Paraná, Santa Catarina and Rio Grande.We previously owned two refrigerated storages in Paranaguá, but they ceased their export operations in 2014. It is not efficient to export using our own structure due to the low volumes in comparison with the fixed costs ofstructure and employees. In 2016, we packed more than 66% of our export containers at plants, referred to as loading “fresh frozen products.” We contract with exclusive third-party carriers to transport our products from ourproduction facilities to the ports, and we ship our products to export markets through independent shipping companies.
All the ports that we use to load our cargo are private terminals from third parties. In the past, we have occasionally experienced disruptions at the ports concerning logistics challenges, including flooding, strongcurrents, small drafts, strong winds/waves and winter fog.
Our sales and distribution efforts abroad are coordinated through sales offices in the United Kingdom, France, Spain, Italy, Austria, Hungary, Netherlands, Russia, Singapore, South Korea, China, Japan, SaudiArabia, the United Arab Emirates, Qatar, Oman, Kuwait, South Africa, Argentina, Uruguay, Chile, Turkey and Malaysia. We coordinate our marketing efforts and provide sales support to customers in our main internationalmarkets through these offices. Our distribution arrangements in our international markets vary according to the market.
Europe. In Europe, we have revamped our sales and distribution network by selecting and tightening partnerships with food processors, food service operators and local distributors. A joint-venture with Invicta
Foods Limited (“Invicta Foods”), a regional leader in the food service segment, was successfully launched in April 2015, to strengthen our position in the food service market and enhance our global sourcing activity. Theacquisition of the Universal Foods in June 2016 allowed us to consolidate our position in the food service channel in the frozen and chilled segments. We are distributing our products in practically all EU markets, includingSwitzerland, improving our delivery time within approximately two days of receiving an order. Our operations are geographically divided into three major markets. We are also expanding our B2C presence in a few focusedmarkets. After the acquisition and now full integration of Plusfood in 2008, retail, food services and a few processing clients are buying goods mainly produced in our two European processing units, which allows us to offeritems closer to local preferences developed in the most efficient and rapid form. In Russia and other regions of Eurasia, we sell primarily to selected distributors, which place our products to processors, food service operatorsand some retailers. Political developments have precluded almost all of our sales in Ukraine, historically the second most important market for our pork exports. On the other hand, we have refurbished our sales to othermarkets in Central Asia and reentered in the three markets in the Caucasus region.
48
Table of Contents
Asia. China, together with Hong Kong, is our largest market in Asia where we supply a significant volume and diverse portfolio including chicken wings and paws. In Japan, our local level of service, qualitystandards and product range have made us a preferred supplier of chicken products in the market. Singapore and Hong Kong, while smaller markets, represent reference markets in Asia for us to get closer to local consumers.Through the joint-venture SATS BRF Food in Singapore and an exclusive partnership in Hong Kong, we reach our customers with distribution and factories built to suit specific local needs and are growing our retail share ofSadia branded frozen meat. In Thailand, the integration process of BRF Thailand (from the acquisition of GFS in the end of 2015) is progressing well, providing a fully-integrated supply footprint in Asia and bringing to us acomplementary set of capabilities in cooked items. In September 2016, we formed a business venture with FFM Berhad in Malaysia through the acquisition of a majority stake in its processing facility in Selangor. This in turnserves as a strategic entry point for BRF’s halal company OneFoods to extend its reach into halal markets in Asia.
MiddleEast.In Saudi Arabia and other countries of the Middle East, we sell to large distributors and small stores (traditional trade), some of which have been our customers for decades. In these markets, we
primarily sell frozen chicken in three categories: whole, cuts and processed products. We believe we are one of the preferred suppliers of these products in this region due to our quality standards and our long-standingcustomer relationships. In fact, our biggest brand, Sadia is recognized as the #1 preferred food brand in the Middle East and enjoys the highest Top of Mind brand within the frozen meat category, according to a study made byIpsos Research, a third-party consulting firm. In 2012, we took an important step in increasing our presence in the region: we acquired 49% of the capital stock of Federal Foods, a leading food company in the United ArabEmirates that caters to a full spectrum of retail, food service and wholesale clients and is responsible for the distribution of Sadia products in the region. This transaction was concluded in the beginning of 2013. Then, in 2014,we acquired the remaining economic rights owned by this company. During the year of 2014 we also announced two other strategic acquisitions of distributors following our strategy to advance in the value chain in thisregion: (1) we acquired 40% of the capital stock of AKF a company leader in the distribution of frozen food in Oman, covering a broad sector of retail, food service and wholesale clients and (2) we acquired 75% of the of theretail frozen foods distribution business of Alyasra Food Company, a leader in food distribution in Kuwait. This transaction was concluded in 2015. We finished the construction of our processed food plant in Kizad, AbuDhabi, an industrial area, which started operating in November 2014. By October 2015, the Kizad factory released all the planned products seven months ahead of schedule. In December 2015, we acquired the frozen businessof QNIE to take full control of BRF operations in the Qatari market, and this transaction was concluded in 2016. These transactions consolidates our leadership position in the retail channel with over 42% market share in theGCC (Gulf Cooperation Council) across our brands. In the first weeks of 2017, we announced the beginning of OneFoods operations. We also entred into an agreement to acquire Banvit (the completion of this transaction issubject to the satisfaction of the conditions precedent set forth in the definitive documents, including anti-trust approvals).
Africa. 2016 was a year where a great deal of energy was placed on the repositioning of strategy and focus, with all efforts towards setting the stage for success in the short and long term. A focal point for the regionwas unlocking a number of in-market opportunities that fell under the attractive and affordable processed category, mostly driven by Food Processed Products (“FPP”) segments such as franks, bologna and margarine. Thecurrent trading model of BRF in Africa remains with direct sales to distributors with the widest possible distribution, all supported by a well-developed relationship. Underpinning this model are Sadia and Perdix, whichcontinue to be the focus brands for the region. Going forward, careful consideration in identifying key selected future growth markets has been a point of focus, with the next phase of developments emphasizing more controlof the interaction between the brand and the consumer. We intend to strengthen this control by uncovering consumer insights to strengthen its value proposition and possible distribution opportunities.
AmericasandOtherCountries. We sell our products to several countries in Latin America, including Paraguay, Uruguay and Chile, where we sell primarily to trading companies that resell the products todistributors. We also sell chicken cuts, including breasts and wings, to processing companies in Canada. In Argentina, where we have local production, we distribute the products directly to big retailers and supermarkets andthrough other distributors to the small retailers.
49
Table of Contents
Sadia is an established brand and holds important market shares in Chile, Uruguay and Paraguay where we maintain local offices. We reach supermarket channels through direct distribution and traditional channelsthrough the strong partnerships with exclusive distributors. In addition to Sadia in Argentina, we have expanded on brands, such as Patty, Vienissima and Danica, which are leaders or vice leaders in all categories in which wecompete. Our brands are recognized as innovative, of high quality and pioneering. In 2016, we acquired the brands Calchaqui and Bocatti, both cold cut brands. Bocatti is a premium brand in Argentina and is well known forthe quality of its products, and Campo Austral is a company with a strong agribusiness that will help us with its cost management. These are two important acquisitions that occurred in 2016, increasingly consolidating ourposition in the region.
Intellectual Property
Our principal intellectual property consists of our domestic and international brands. We sell our products mainly under the “Sadia,” “Qualy,” “Hot Pocket”,” “Perdigão”, “Nuggets”, “Chester” and other brands in theBrazilian market and mainly under the “Perdix,” “Perdigão”, “Sadia”, “Confidence”, “Fazenda,” “Paty”, “Qualy”, “Borella,” “Sahtein,” “Hilal,” “Danica”, “Sulina”, “Deline” and other brands in our international markets, asdescribed below under “—Marketing.”. We plan to enter into certain agreements with OneFoods for its exclusive right to use the “Sadia” word and design marks and the “Perdix,” “Halal” and “Lequetreque” design marks inapproximately 50 countries in Africa and Asia upon the payment of royalties, subject to certain quality standards and branding guidelines.
We also own several brands for specific products or product lines. In the Brazilian market, these brands include, but are not limited to, “Chester,”, “Claybom,” Hot Pocket”, “Salamitos” “Perdigão Ouro,” and“Nabrasa”. Among our trademarks are: “Halal” (in the Middle East, aside from Saudi Arabia), “Unef” (in the Middle East), “Sulina” and “Fazenda” (in Europe) and “Alnoor” (in several Middle Eastern countries). We plan toenter into an assignment agreement with OneFoods to assign the “Confidence,” “Halal” and “UNEF” brands worldwide to Onefoods. The “Sadia” trademark is registered in more than 90 countries. In the Middle East, Sadia isregistered in countries such as Saudi Arabia, the United Arab Emirates, Egypt, Bahrain, Yemen, Iran, Iraq, Israel, Lebanon and Oman, as well as in the Caucasus, Asian countries and in Latin America. Sadia’s mascot isprotected both as a registered trademark and copyright pursuant to a registration with the Brazilian National Library, and this protection extends to countries other than Brazil. In addition, a healthy pre-prepared line of poultryproducts under the trademark “Sadia,” signed by the celebrity chef Jamie Oliver, was launched in 2016. A licensing agreement executed with Jamie Oliver allows us to merchandise such products using his name.
Under our agreement with CADE in connection with the approval of our business combination with Sadia S.A. in 2011, we agreed to suspend the use of the trademarks “Perdigão” and “Batavo” with respect toseveral product lines in the Brazilian market for periods ranging from three to five years. The “Batavo” trademark was included on the sale of our dairy business Lactalis, a company controlled by Parmalat S.p.A., whichclosed on July 1, 2015. On July 3, 2015, the restriction on using the “Perdigão” trademark in relation to “ham and sausages” products was terminated. On July 3, 2016, the restriction on using “Perdigão” trademark in relationto “salamis” products was terminated. As a result, we are now authorized to use such trademark in these products. By July 3, 2017, the remaining restrictions that are still applicable to other lines of products will beterminated. The only restriction that will continue to apply to BRF is the prohibition to agree on exclusivity clauses with retailers, which will terminate by July 13, 2021. See “Item 4. Information on the Company- A Historyand Development of the Company - Business Combination with Sadia.”
BRF maintains an active marketing program using both electronic and print media. In addition, we have patents registered in Brazil and more than 10 other countries. BRF has applied to have the Sadia, Perdigão andQualy trademarks recognized as “well known trademarks” by the Brazilian National Institute for Industrial Property ( InstitutoNacionaldePropriedadeIndustrial– INPI), which already granted us that recognition for Sadiain June 2011. BRF has also applied for its new corporate trademark “BRF” (and accompanying design) to be registered in over 150 countries in North and South America, Europe, Asia, Africa and the Middle East.
50
Table of Contents
Lastly, we own several internet domain names in Brazil, registered with the competent authority, such as “perdigao.com.br,” “claybom.com.br”, “qualy.com.br”, “sadia.com.br,” ,” brf-foodservices.com.br” and “brf-global.com”.
Marketing
Our marketing efforts are based on (1) adding value to existing categories and diversifying our product lines; (2) increasing convenience on our innaturaand processed products; (3) ensuring that our brands arerecognized and associated with high quality products; and (4) strengthening our reputation for quality by emphasizing high quality service to our customers. Furthermore, we intend to consolidate our brands, while continuingto tailor our appeal to specific export markets and domestic market segments.
In the Brazilian market, we sell our products primarily under the Sadia,PerdigãoandQualybrands. Apart from these major brands, we also sell our products under Sadiamaster brands :Deline,HotPocket,Soltíssimo,MissDaisy,Nuggets,FrangoFácil,JamieOliverand under Perdigãomaster brands :Chester,Ouro,NaBrasa,MeuMenuand MiniChicken.
Chester® is a well-known brand for festive products and one of the most popular brands for premium poultry products in Brazil. In 2007, we acquired from Unilever a margarine brand called Claybom, along withother brands, and entered into a joint venture with Unilever to use the margarine brand Becel.
In our international markets, our main brands are Sadia and Perdix. We also operate under tactical brands as Confidence, Hilal, and Speedy Pollo. In Argentina, we sell our products primarily under Paty and Danicabrands. The opening of the Abu Dhabi plant in Middle East and its current expansion establish an important milestone in our globalization.
Our recent acquisitions are expanding our brand portfolio internationally. In Argentina, we also have Vienissima, GoodMark, Delícia, Manty, Campo Austral, Bocatti and Calchaqui. In Malaysia, our main brand isMarina. In addition, we shall soon incorporate more brands in Turkey.
Regulation
The Brazilian Ministry of Agriculture, Livestock and Food Supply ( MinistériodaAgricultura,PecuáriaeAbastecimento, or “MAPA”) regulates our activities through the Department of Agriculture Defense (SecretariadeDefesaAgropecuária) and the Department of Inspection of Animal Products ( DepartamentodeInspeçãodeProdutosAnimais), which is responsible for regulation and inspection activities related to health,technical (including labeling) and quality criteria related to the making of animal food products in all industrial units focused on national and international markets.
The inspection activity is performed by placing teams of the Federal Inspection Service (Serviço de Inspeção Federal, or “SIF”) of MAPA in the industrial units. Their scope of work includes all stages of theproduction process (including receipt of raw materials, production, labeling and storage) and they can appoint noncompliance with applicable rules, with penalties ranging from a warning to permanent suspension of businessactivities.
C. Organizational Structure
We are an operating company incorporated under Brazilian law, and we conduct business through our operating subsidiaries. The following table sets forth our significant subsidiaries.
51
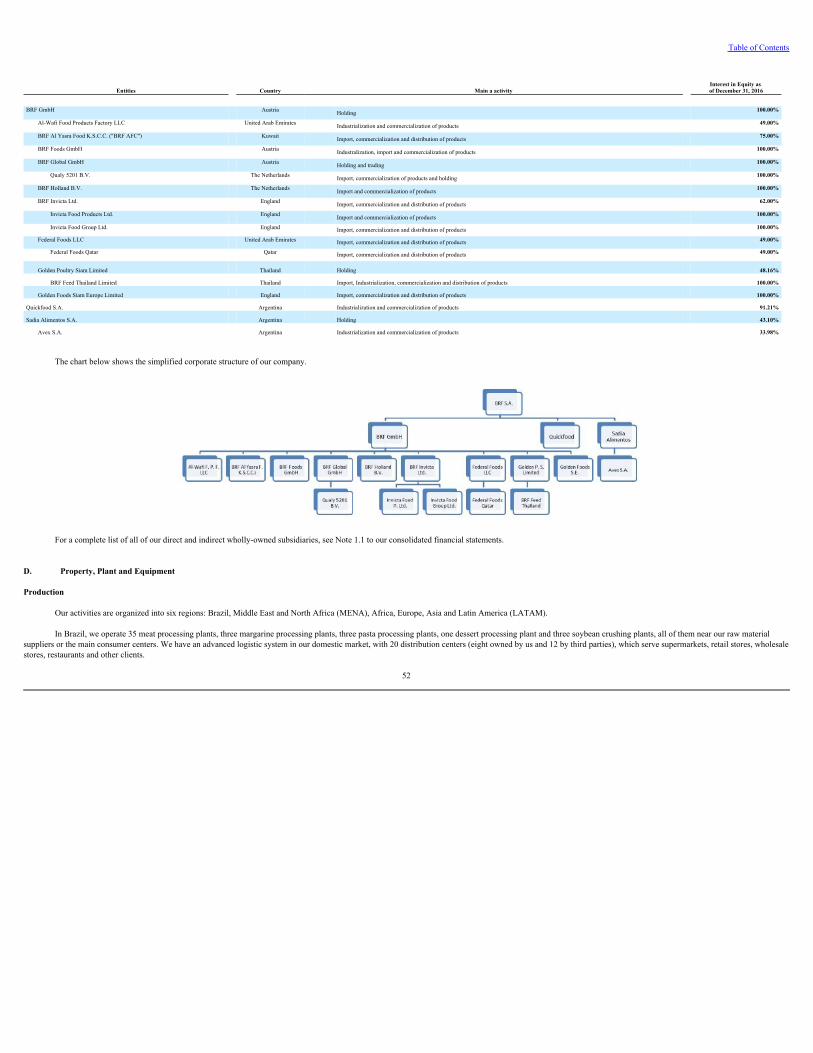
Table of Contents
Entities Country Main a activity Interest in Equity as of December 31, 2016
BRF GmbH Austria Holding 100.00%
Al-Wafi Food Products Factory LLC United Arab Emirates Industrialization and commercialization of products 49.00%
BRF Al Yasra Food K.S.C.C. ("BRF AFC") Kuwait Import, commercialization and distribution of products 75.00%
BRF Foods GmbH Austria Industralization, import and commercialization of products 100.00%
BRF Global GmbH Austria Holding and trading 100.00%
Qualy 5201 B.V. The Netherlands Import, commercialization of products and holding 100.00%
BRF Holland B.V. The Netherlands Import and commercialization of products 100.00%
BRF Invicta Ltd. England Import, commercialization and distribution of products 62.00%
Invicta Food Products Ltd. England Import and commercialization of products 100.00%
Invicta Food Group Ltd. England Import, commercialization and distribution of products 100.00%
Federal Foods LLC United Arab Emirates Import, commercialization and distribution of products 49.00%
Federal Foods Qatar Qatar Import, commercialization and distribution of products 49.00%
Golden Poultry Siam Limited Thailand Holding 48.16%
BRF Feed Thailand Limited Thailand Import, Industrialization, commercialization and distribution of products 100.00%
Golden Foods Siam Europe Limited England Import, commercialization and distribution of products 100.00%
Quickfood S.A. Argentina Industrialization and commercialization of products 91.21%
Sadia Alimentos S.A. Argentina Holding 43.10%
Avex S.A. Argentina Industrialization and commercialization of products 33.98%
The chart below shows the simplified corporate structure of our company.
For a complete list of all of our direct and indirect wholly-owned subsidiaries, see Note 1.1 to our consolidated financial statements.
D. Property, Plant and Equipment
Production
Our activities are organized into six regions: Brazil, Middle East and North Africa (MENA), Africa, Europe, Asia and Latin America (LATAM).
In Brazil, we operate 35 meat processing plants, three margarine processing plants, three pasta processing plants, one dessert processing plant and three soybean crushing plants, all of them near our raw materialsuppliers or the main consumer centers. We have an advanced logistic system in our domestic market, with 20 distribution centers (eight owned by us and 12 by third parties), which serve supermarkets, retail stores, wholesalestores, restaurants and other clients.
52
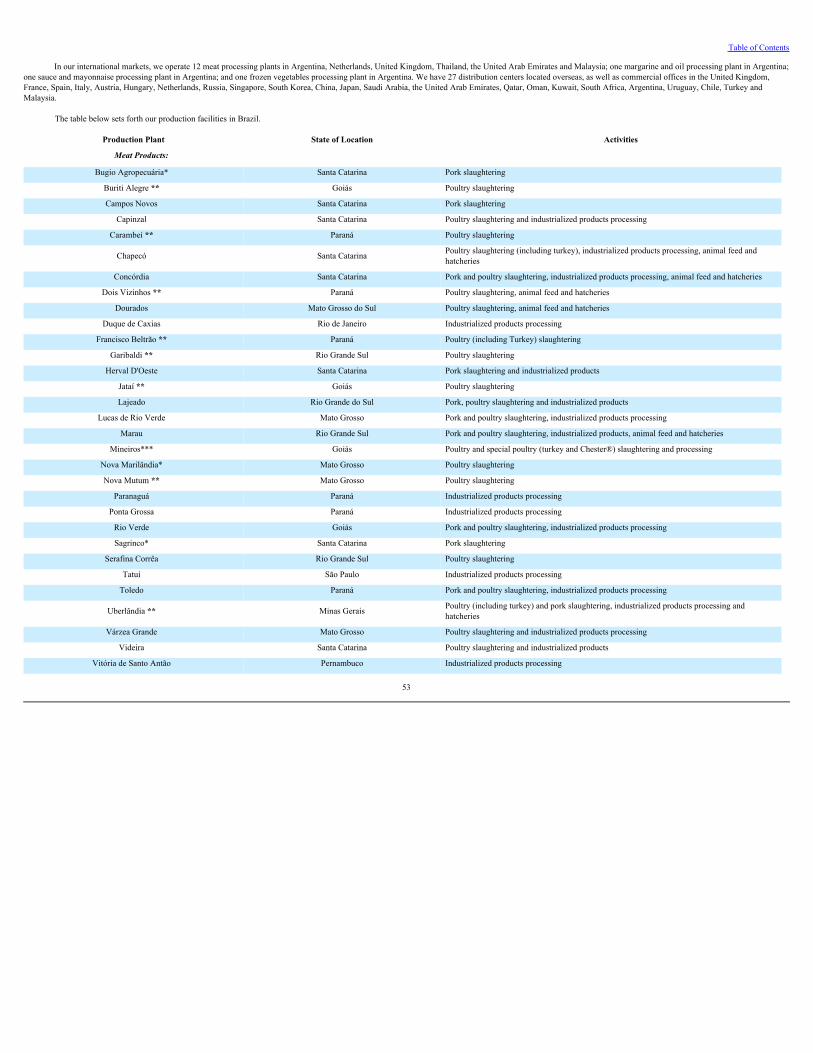
Table of Contents
In our international markets, we operate 12 meat processing plants in Argentina, Netherlands, United Kingdom, Thailand, the United Arab Emirates and Malaysia; one margarine and oil processing plant in Argentina;one sauce and mayonnaise processing plant in Argentina; and one frozen vegetables processing plant in Argentina. We have 27 distribution centers located overseas, as well as commercial offices in the United Kingdom,France, Spain, Italy, Austria, Hungary, Netherlands, Russia, Singapore, South Korea, China, Japan, Saudi Arabia, the United Arab Emirates, Qatar, Oman, Kuwait, South Africa, Argentina, Uruguay, Chile, Turkey andMalaysia.
The table below sets forth our production facilities in Brazil.
Production Plant State of Location Activities
Meat Products: Bugio Agropecuária* Santa Catarina Pork slaughtering
Buriti Alegre ** Goiás Poultry slaughtering
Campos Novos Santa Catarina Pork slaughtering
Capinzal Santa Catarina Poultry slaughtering and industrialized products processing
Carambeí ** Paraná Poultry slaughtering
Chapecó Santa Catarina Poultry slaughtering (including turkey), industrialized products processing, animal feed andhatcheries
Concórdia Santa Catarina Pork and poultry slaughtering, industrialized products processing, animal feed and hatcheries
Dois Vizinhos ** Paraná Poultry slaughtering, animal feed and hatcheries
Dourados Mato Grosso do Sul Poultry slaughtering, animal feed and hatcheries
Duque de Caxias Rio de Janeiro Industrialized products processing
Francisco Beltrão ** Paraná Poultry (including Turkey) slaughtering
Garibaldi ** Rio Grande Sul Poultry slaughtering
Herval D'Oeste Santa Catarina Pork slaughtering and industrialized products
Jataí ** Goiás Poultry slaughtering
Lajeado Rio Grande do Sul Pork, poultry slaughtering and industrialized products
Lucas de Rio Verde Mato Grosso Pork and poultry slaughtering, industrialized products processing
Marau Rio Grande Sul Pork and poultry slaughtering, industrialized products, animal feed and hatcheries
Mineiros*** Goiás Poultry and special poultry (turkey and Chester®) slaughtering and processing
Nova Marilândia* Mato Grosso Poultry slaughtering
Nova Mutum ** Mato Grosso Poultry slaughtering
Paranaguá Paraná Industrialized products processing
Ponta Grossa Paraná Industrialized products processing
Rio Verde Goiás Pork and poultry slaughtering, industrialized products processing
Sagrinco* Santa Catarina Pork slaughtering
Serafina Corrêa Rio Grande Sul Poultry slaughtering
Tatuí São Paulo Industrialized products processing
Toledo Paraná Pork and poultry slaughtering, industrialized products processing
Uberlândia ** Minas Gerais Poultry (including turkey) and pork slaughtering, industrialized products processing andhatcheries
Várzea Grande Mato Grosso Poultry slaughtering and industrialized products processing
Videira Santa Catarina Poultry slaughtering and industrialized products
Vitória de Santo Antão Pernambuco Industrialized products processing
53
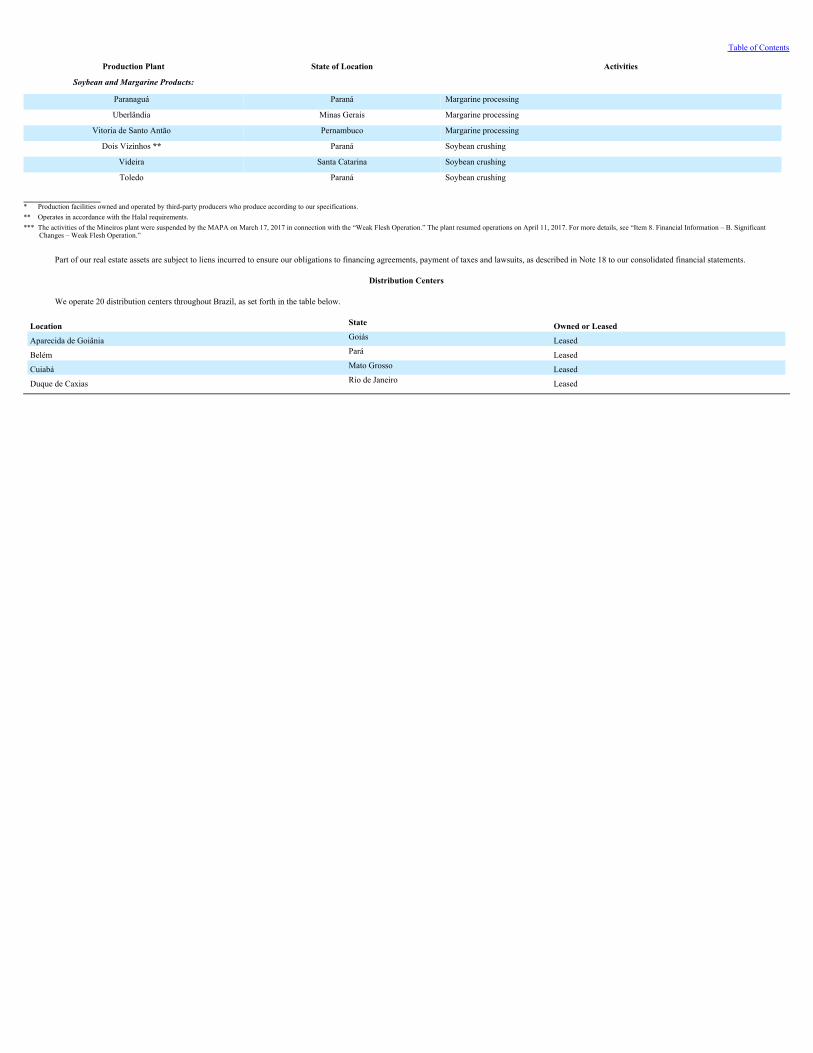
Table of Contents
Production Plant State of Location Activities
Soybean and Margarine Products: Paranaguá Paraná Margarine processing
Uberlândia Minas Gerais Margarine processing
Vitoria de Santo Antão Pernambuco Margarine processing
Dois Vizinhos ** Paraná Soybean crushing
Videira Santa Catarina Soybean crushing
Toledo Paraná Soybean crushing
* Production facilities owned and operated by third-party producers who produce according to our specifications.** Operates in accordance with the Halal requirements.*** The activities of the Mineiros plant were suspended by the MAPA on March 17, 2017 in connection with the “Weak Flesh Operation.” The plant resumed operations on April 11, 2017. For more details, see “Item 8. Financial Information – B. Significant
Changes – Weak Flesh Operation.”
Part of our real estate assets are subject to liens incurred to ensure our obligations to financing agreements, payment of taxes and lawsuits, as described in Note 18 to our consolidated financial statements.
Distribution Centers
We operate 20 distribution centers throughout Brazil, as set forth in the table below.
Location State Owned or Leased
Aparecida de Goiânia Goiás Leased
Belém Pará Leased
Cuiabá Mato Grosso Leased
Duque de Caxias Rio de Janeiro Leased
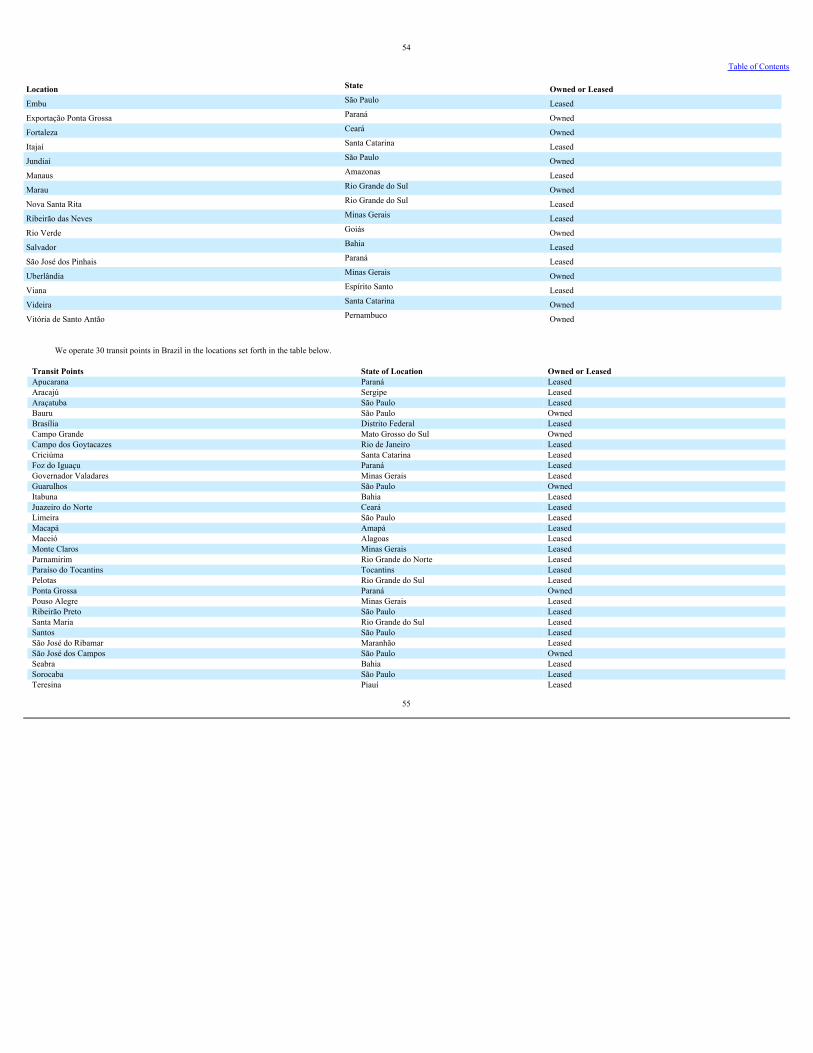
54
Table of Contents
Location State Owned or Leased
Embu São Paulo Leased
Exportação Ponta Grossa Paraná Owned
Fortaleza Ceará Owned
Itajaí Santa Catarina Leased
Jundiaí São Paulo Owned
Manaus Amazonas Leased
Marau Rio Grande do Sul Owned
Nova Santa Rita Rio Grande do Sul Leased
Ribeirão das Neves Minas Gerais Leased
Rio Verde Goiás Owned
Salvador Bahia Leased
São José dos Pinhais Paraná Leased
Uberlândia Minas Gerais Owned
Viana Espírito Santo Leased
Videira Santa Catarina Owned
Vitória de Santo Antão Pernambuco Owned
We operate 30 transit points in Brazil in the locations set forth in the table below.
Transit Points State of Location Owned or LeasedApucarana Paraná LeasedAracajú Sergipe LeasedAraçatuba São Paulo LeasedBauru São Paulo OwnedBrasília Distrito Federal LeasedCampo Grande Mato Grosso do Sul OwnedCampo dos Goytacazes Rio de Janeiro LeasedCriciúma Santa Catarina LeasedFoz do Iguaçu Paraná LeasedGovernador Valadares Minas Gerais LeasedGuarulhos São Paulo OwnedItabuna Bahia LeasedJuazeiro do Norte Ceará LeasedLimeira São Paulo LeasedMacapá Amapá LeasedMaceió Alagoas LeasedMonte Claros Minas Gerais LeasedParnamirim Rio Grande do Norte LeasedParaíso do Tocantins Tocantins LeasedPelotas Rio Grande do Sul LeasedPonta Grossa Paraná OwnedPouso Alegre Minas Gerais LeasedRibeirão Preto São Paulo LeasedSanta Maria Rio Grande do Sul LeasedSantos São Paulo LeasedSão José do Ribamar Maranhão LeasedSão José dos Campos São Paulo OwnedSeabra Bahia LeasedSorocaba São Paulo LeasedTeresina Piauí Leased
55
Table of Contents
Environment
Our activities are subject to strict environmental laws and regulations at municipal, state and federal levels, which regulate the aspects related to water, effluents, solid wastes, atmospheric emissions, noise and smells.Our operations are also subject to environmental licensing procedures at federal, state and/or municipal levels.
Failure to comply with the environmental laws and regulations can result in civil and criminal penalties against the offender, in addition to indemnification payments for environmental damages. Civil penalties mayinclude summons, fines, temporary or permanent bans, the suspension of subsidies by public bodies and the temporary or permanent shutdown of commercial activities. Criminal penalties include fines and prison (forindividual offenders) and liquidation (for legal entities). Fines for operating without a license vary from state to state in accordance with the environmental damages caused. Furthermore, under Brazil’s environmentallegislation, the corporate entity of a company will be disregarded if necessary to guarantee the payment of costs related to environmental damages.
We have an Environmental Policy that is based on the guidelines and principles established in the ISO14001 certification. This policy seeks to ensure that our activities and growth are carried out in accordance withthe environmental legislation. We have established a set of standards to be used in the company’s environmental management. The monitoring of implementation of these standards is undertaken through technical indicators,with targets that are established on an annual basis. Corrective actions are established to resolve deviations that have been found. An assessment is carried out to make sure that the environmental management system is beingobserved.
We have eight plants which have received ISO 14001 certification, of which seven are located in Brazil and one in the Netherlands. These plants were audited by regulatory bodies and undergo regular recertification.
Environmental management is part of our daily operations. Our internal controls are built to improve sustainability in our operations. We also take part in initiatives to preserve the environment and focus ondeveloping alternative technologies for the generation and use of sustainable energy and have structured a program with our integrated producers to collect animal waste.
The partnership that we have with the integrated producers is one of the strategies we use to leverage global standards in our activities and those of our suppliers. We are responsible for the licensing projects of ourintegrated producers and for providing technical support and guidance to help them deal with environmental questions in the best possible way.
We have professional technicians in the environmental area and have trained them in the main environmental aspects. Our plants are built in line with the applicable environmental regulations. Our environmentalstructure is composed by experts, engineers and environmental analysts to assist the implementation and the monitoring of legal requirements and internal guidelines. We also have the support of the environmental legaldepartment for legal assistance.
Despite our efforts to comply with the legislation and the environmental regulations, we have occasionally been required to sign environmental agreements with the Brazilian federal and local government related tothe non-compliance with environmental licensing requirements. We are required, under these agreements, among other things, to repair any damages caused. If we do not comply with these obligations, we are subject to thepayment of fines accrued on a daily basis.
56
Table of Contents
On April 10, 2007, we executed a TAC with the Environmental Resource Agency of the Bahia State, in order to recover degraded areas and enhance industrial water waste treatment, air emissions monitoring andwaste management of the facility located in São Gonçalo. The TAC is waiting for completion procedures.
On December 14, 2007, we executed a consent agreement with the public prosecutors’ office of the State of Santa Catarina in order to promote recovery and compensation of the environmental damage caused bydisposal of industrial waste without proper treatment in the Capinzal facility. The TAC is in progress.
On May 20, 2008, we executed a consent agreement with the State of Mato Grosso in order to settle environmental liabilities identified by the Environment Secretary of State aiming to make, adapt, correct, restore orminimize the effects of degradation in rural property of our facility located in Lucas do Rio Verde. The process is waiting for completion formalities.
On June 4, 2008, we executed a consent agreement with the public prosecutors’ office of the State of Minas Gerais to regularize the death of fish and air pollution through the production and emission of gasescoming from the company's activities causing smell in the facility located in Uberlândia. The process is waiting for completion formalities.
On October 16, 2008, we executed a consent agreement with the Environment Foundation ( FundaçãoAmbiental) of the Santa Catarina State relating to a missing environmental license for fire prevention thataffected our unit in Videira. It seeks the regularization of the industrial park and permits the reconstruction of the stricken area and construction of extension work through the establishment of compensatory measures. TheTAC is in progress.
On May 10, 2010, we executed a consent agreement with the Environment Secretary of the State of Mato Grosso, in order to regularize the change of water abstraction of the facility located in Mirassol D' Oeste. The process is waiting for completion formalities.
On May 30, 2011, we executed a consent agreement with the Regional Superintendencies of Environmental Regulation ( SuperintendênciasRegionaisdeRegularizaçãoAmbiental, “SUPRAM”), Uberlândia, theState of Minas Gerais, for the settlement of legal reserves of rural properties. The TAC is in progress.
On September 16, 2011, we executed a consent agreement with the Brazilian Institute for the Environment – IBAMA to plant in an area of 332.55 hectares and keep planted the equivalent to a volume of 79.813meters, based on volumetric of Eucalyptus clonal forest with high-tech application in land good natural fertility, equivalent to the forest raw materials consumed by the company of our facility in Dourados. The TAC is inprogress.
On December 7, 2011, we executed a consent agreement with the public prosecutors’ office of the Rio Grande do Sul State, whose objective is to fill the non-vegetated areas, providing adequate soil cover with nativetree species and the consequent minimization of the effects of erosion on the slope protection and the banks of the stream in the facility located in Lajeado. The TAC is in progress.
On February 28, 2012, we signed a consent agreement with the Environmental Institute of Paraná ( InstitutoAmbientaldoParaná, or “IAP”), resulting from particulate emissions at the facility in Toledo in the Stateof Paraná. We committed to implementing improvements in plant equipment and have invested R$2.5 million. The process is waiting for completion formalities.
On August 23, 2012, we executed a consent agreement with the Municipal Environment Agency of Itumbiara, in the State of Goiás, due to the need for pre-treatment of effluents directed tailing ponds of the facilitylocated in Itumbiara. The process is waiting for completion formalities.
On September 11, 2012, we executed a consent agreement with SUPRAM Triângulo Mineiro and Alto Parnaíba for the settlement of the legal reserve of the facility located in Uberlândia. The TAC is in progress.
57
Table of Contents
On October 9, 2012, we executed a consent agreement with the Municipal Department of Environment and Urban Control of Fortaleza, in the Ceará State, related to the expansion project of the distribution centerlocated in that city. The TAC is waiting for completion procedures.
On January 24, 2013, we executed a consent agreement with SUPRAM with respect to the facility located in Uberlândia, which did not have proper licenses. The unit's operating license was issued in January 2014.We are now just waiting for the approval of the conclusion of the TAC process.
On April 5, 2013, we executed a consent agreement with the civil prosecutors’ office of Rio Casca in the State of Minas Gerais for the inactivation of an old station of treatment of industrial effluents and for therestoration of the station area. The TAC is in progress.
On June 13, 2013, we executed a consent agreement with the federal public prosecutors’ office, aiming at complying with applicable rules with respect to the production and marketing of cattle obey. The TAC is inprogress.
On April 24, 2014, we executed a consent agreement with the public prosecutors’ office of the State of Goiás because of irregularities in the ground activity resulting from approximate 300 tons of solid material,which did not have proper treatment in the facility located in Rio Verde. The TAC is in progress.
On July 13, 2015, we executed a consent agreement with the SUPRAM Triângulo Mineiro and Alto Parnaíba because of irregularities in the irrigation system of the facility located in Uberlândia. The TAC is inprogress.
On July 21, 2015, we executed a consent agreement with the public prosecutor office of the Mato Grosso do Sul State in order to renew the operation license of the facility located in Dourados. The process is waitingfor completion formalities.
On September 18, 2015, we executed a consent agreement with the public prosecutor office of the Rio de Janeiro State in order to regularize the environmental license of the facility located in Duque de Caxias. TheTAC is in progress.
On February 20, 2016, we executed a consent agreement with the public prosecutor office of the Santa Catariana State in order to compensate for the environmental damage caused by the disposal of industrial wastewithout proper treatment in the Xanxerê facility. The TAC is in progress.
On April 4, 2016, we executed a consent agreement with the public prosecutor office of the Goiás State in order to compensate for the environmental damage caused by the disposal of industrial waste without propertreatment in the Jataí facility. The TAC is in progress.
New investments that involve an increase in production or alteration in the process include the analysis of environmental controls and indicators. This procedure is part of the BRF environmental management system.
Insurance Coverage
We purchase insurance to cover all of our plants, equipment and inventories for losses, including business interruption insurance. In addition, we maintain a comprehensive products liability policy, which coversdamages arising from the manufacture, distribution and sale of our products. We consider the amounts of our insurance coverage to be typical for a company of our size and adequate to meet the foreseeable risks associatedwith our operations.
ITEM 4A. UNRESOLVED STAFF COMMENTS
None.
58
Table of Contents
ITEM 5. OPERATING AND FINANCIAL REVIEW AND PROSPECTS
A. Operating Results
OverviewBRF S.A. is one of the largest producers of fresh and frozen protein foods in the world, with a portfolio of over five thousand SKUs. We are the holder of brands such as Sadia,Perdigão,Qualy,Chester,Perdix,
Paty,Bocattiand Calchaqui, among others .
BRF was created from the merger of Perdigão and Sadia, whose consolidation was announced in 2009 and completed in 2012, and operates in the frozen meat (poultry and pork), processed meat foods, margarine,pasta, pizza and frozen vegetable markets. BRF is responsible for 16.3% of the world trade in poultry.
With 35 plants in Brazil, BRF has among its main assets a widespread distribution network that enables its products to reach Brazilian consumers through 551,050 monthly deliveries and 47 distribution centers, 20 ofwhich are in the domestic market and 27 of which are in our export markets.
In Argentina, we were the leading producer, distributor and seller of hamburgers in 2016 with a market share of approximately 54.0%. In franks, our market share was 27.3% in 2016.
In the international market, BRF has a leading brand, Sadia, in various categories in Middle Eastern countries. We maintain 27 sales offices outside of Brazil serving customers of more than 150 countries on fivecontinents. We have nine industrial units in Argentina, five in Thailand, two in Europe (BRF UK and BRF Holland), one in the United Arab Emirates (Abu Dhabi) and one in Malaysia.
BRF has been a public company since 1980. Our shares have been listed on the BM&FBovespa as BRFS3 since 2006, and we are also traded on the New York Stock Exchange (NYSE - ADR level III). Since 2005,BRF has been part of BM&FBovespa’s Corporate Sustainability Index (ISE) portfolio in acknowledgement of its strong commitment to sustainable development. This commitment has been reinforced and internationallyrecognized since 2012, upon our entrance into the portfolio of Emerging Markets of Dow Jones Sustainability Index.
A breakdown of our products is as follows:
· Meat products:
frozen whole and cut chickens frozen pork cuts and beef cuts, which we refer to in this Form 20-F, together with frozen whole and cut chickens, as innaturameat
· Processed food products, such as the following:
marinated frozen whole and cut chickens, roosters (sold under the Chester® brand) and turkeys specialty meats, such as sausages, ham products, bologna, frankfurters, salami, bacon and other smoked products frozen processed meats, such as hamburgers, steaks, breaded meat products, kibesand meatballs
· Other processed products:
frozen prepared entrees, such as lasagna and pizzas, as well as other frozen foods margarine
59
Table of Contents
mayonnaise, mustard and ketchup
· Other:
soy meal and refined soy flour, as well as animal feed.
In 2016, net sales totaled R$33.7 billion and net loss was R$0.4 billion. Net equity as of December 31, 2016 totaled R$12.2 billion.
In 2016, we generated 39.3% of our net sales from innaturapoultry, 6.8% from innaturapork, 1.3% from innaturabeef, 48.8% from processed meat and other processed products, and 3.6% from other products.Our Brazil sales accounted for 43.9% of our total net sales in 2016 while our sales to international markets and other segments accounted for 56.1%.
We are able to reach substantially all of the Brazilian population through a nationwide network of 20 distribution centers.
In the Brazilian market, we operate 35 meat processing plants, three margarine processing plants, three pasta processing plants,one dessert processing plant and three soybean crushing plants, all of them near our rawmaterial suppliers or the main consumer centers. We have an advanced logistic system in our domestic market, with 20 distribution centers, being eight owned by BRF and 12 leased by third parties, which serve supermarkets,retail stores, wholesale stores, restaurants and other clients.
In our international markets, we operate 12 meat processing plants in Argentina, Netherlands, United Kingdom, Thailand, the United Arab Emirates and Malaysia; one margarine and oil processing plant in Argentina;one sauce and mayonnaise processing plant in Argentina; and one frozen vegetables processing plant in Argentina. We have 27 distribution centers located overseas, as well as commercial offices in the United Kingdom,France, Spain, Italy, Austria, Hungary, Netherlands, Russia, Singapore, South Korea, China, Japan, Saudi Arabia, the United Arab Emirates, Qatar, Oman, Kuwait, South Africa, Argentina, Uruguay, Chile, Turkey andMalaysia.
On November 1, 2013 we entered into an agreement to allocate our cattle operations to Minerva in exchange for 29 million common shares, representing on the date of the conclusion of the transaction, a percentage
equivalent to 16.8% of the total and voting capital stock of Minerva that will amount to approximately 15.2% when the entire conversion of mandatory convertible debentures issued by Minerva occurs in 2015. Thistransaction was concluded on October, 1, 2014.
In 2014, we entered into an agreement with Lactalis for the sale of the assets of our dairy segment, including plants and trademarks, which deal was closed in 2015. As a result, this segment is reported asdiscontinued operations, which requires the presentation of prior periods of this segment as discontinued operations. Unless stated otherwise, the results and cash flows that we present in this annual report do not consider theresults and cash flows from this discontinued operation (dairy segment).
Principal Factors Affecting Our Results of Operations
Our operating results, financial condition and liquidity have been and will continue to be influenced by a broad range of factors, including:
Economic conditions in Brazil and globally; The effect of trade barriers and other restrictions on imports; Concerns over bird flu and other diseases of animal origin;
60
Table of Contents
Sensibility of the domestic market to changes in global demand, including the impact of decisions by our main Brazilian competitors and temporary increases in supply from producers in other countries; Changes in commodity prices; Fluctuations in the exchange rate and inflation; Interest rates; and Freight costs. We present a more detailed description of each of these factors below.
Brazilian and Global Economic Conditions
Brazilian monetary policy framework is of inflation targeting. The National Monetary Council (Conselho Monetário Nacional - “CMN”) set the target inflation at 4.5% for 2016, with a range of two percentage pointshigher or lower. However, inflation rate has been consistently above the target at 6.41%, 10.67% and 6.29% in 2014, 2015 and 2016, respectively. Price increases reduce consumers’ purchasing power, particularly among thelower income class, which eventually limits consumption.
The Brazilian labor market registered an average unemployment rate of 11.5% in 2016, according to the IBGE’s National Household Sample Survey ( PesquisaNacionalporAmostradeDomicílios, or “PNAD”),showing deterioration from 8.5% a year before. Also, wages rose 6.4% in 2016 in nominal terms (compared to 8.7% in 2015), meaning a decrease in real terms of 2.3% (compared to a decrease of 0.3% in 2015). Additionally,after several years of rising consumption, Brazilian consumer confidence decreased to 73.3 points in December 2016, which is well below the average of the previous five years (105.7), according to a Consumer Survey ofFundação Getúlio Vargas (FGV).
Given a weak domestic demand and a strong monetary tightening cycle, inflation slowed down, pushed by the adjustment in both regulated and market prices, which declined from 18.07% and 8.51% to 4.72% and
4.78%, in 2015 and 2016, respectively. To control rising inflation and to curb inflation expectations, the Brazilian Central Bank’s monetary policy committee ( ComitêdePolíticaMonetária, or the “COPOM”) kept the baseinterest rate, known as “SELIC” ( SistemaEspecialdeLiquidaçãoedeCustódia), at 14.25% throughout almost all of 2016, only cutting the SELIC rate in October and December to 13.75%.
The Brazilian economy has been experiencing a slowdown – GDP growth rates were 1.9%, 3.0% and 0.5% in 2012, 2013 and 2014, respectively, but GDP decreased 3.8% and 3.6% in 2015 and 2016, respectively.
Regarding the currency, Brazilian Real appreciated 16.5% against the US dollar in 2016 going from R$3.90 to R$3.26 per dollar. This outlook of appreciation hindered the competitiveness of Brazilian exports byincreasing costs in US dollars. In such a scenario, the financial revenues generated by exports decreased when converted into reais.
For a discussion on the global economic conditions and further information on the conditions on our export markets and the Brazilian market, see “D. Trend Information”.
Effects of Trade and Other Barriers
Global demand for Brazilian poultry and pork products is significantly affected by trade barriers, whether: (i) tariff barriers, or high rates that ultimately protect certain markets; and (ii) non-tariff barriers, mainlyimport quotas, sanitary barriers (which are the most common type of barriers faced by the meat industry) and technical/religious barriers. In addition, some countries employ subsidies for production and exports, which tend todistort international trade and interfere with our business.
61
Table of Contents
With regard to sanitary requirements, most countries demand specific sanitary agreements so that Brazilian producers can export to them. Moreover, zoonosis outbreaks may result in banishment to imports.
In addition to trade barriers, the economic conditions of a particular market (national or international) may interfere with the demand for all types of poultry, swine and bovine meat, as well as other processedproducts.
We continuously monitor trade barriers and other import restrictions in the global poultry, pork and beef markets, since these restrictions significantly affect the demand for our products and the levels of our exports.These restrictions often change, as illustrated by the following examples:
Tariff barriers (classical form and derived from trade defense disputes)
The EU (since 2007) and Russia (since 2012) have protected their meat industries by applying import quotas and high tariffs (occasionally prohibitive) on volumes imported outside of the quota.
In September 2013, South Africa raised duties on chicken products originating in all countries except the EU (due to a free trade agreement between them that establishes zero tariff on poultry products). Tariffsincreased to 82% on whole chicken, 12% on boneless cuts and 37% on bone-in cuts.
In December 2016, Saudi Arabia has increased its import tariff for poultry meat from 5% to 20%.
Non-tariff barriers
Import quotas
In 2005, Brazil obtained a favorable result in a panel against the EU at the WTO regarding the reclassification (and tariff increase) of salted chicken breast meat exports. In return, the EU introduced quotas onimports of certain tariff codes, especially for salted chicken breast, marinated turkey breast and processed chicken, and in July 2007 Brazil was awarded the majority of these quotas.
Russia utilizes quotas to control the imports of pork, beef and poultry. As part of the negotiations surrounding its accession to the WTO, Russia has made some changes to its quota criteria as of 2013. Regardingchicken imports, Russia defined a quota of 250,000 tons of bone-in products, with no geographical breakdown. The intra-quota tariff is 25% and the extra-quota is 80%. There is also a quota of 70,000 tons of boneless cuts,of which 56,000 tons are reserved for the EU. As for swine, it was defined at a 400,000 tons quota with zero tariff on intra-quota volumes and 65% for volumes imported outside the quota. For bovine imports, Russia hasestablished a quota of 530,000 tons for all WTO members, of which 60,000 belong to the EU and 3,000 to Costa Rica.
In December 2015, Mexico renewed its import poultry meat quota of 300 thousand tons until the end of 2017.
Sanitary barriers
Several major markets (despite progress in trade negotiations) are not yet open to Brazilian meat products due to sanitary barriers. Some examples are the EU, Korea and Colombia for swine meat, and Taiwan andPanama for poultry meat.
Outbreaks of avian flu have already harmed the consumption and exports of chicken meat in several countries, like the U.S., China/Hong Kong, Mexico and many European countries.
Technical barriers
In December 2015, the WTO established a panel requested by the Brazilian government in order to investigate technical barriers imposed by Indonesia in the imports of poultry meat.
62
Table of Contents
In the short term, we must respond quickly to the imposition of new restrictions, including temporary health-related restrictions, by redirecting products to other markets or changing product specifications to complywith the new requirements in order to minimize their effect on our net export sales. In the long term, these restrictions affect the growth rate of our business.
Effect of Animal Diseases
AvianInfluenza(H5N1)
Demand for our products can be significantly affected by outbreaks of animal diseases like avian influenza. For example, global demand for poultry products decreased in 2006 due to concerns over the spread ofavian influenza. Although there have been no reported cases of this disease in Brazil, in 2006, the demand for our poultry products in our export markets was significantly lower, resulting in lower net sales of such products inour export markets in that period. Although net sales of poultry products in the domestic market increased in 2006, prices decreased due to the oversupply of products that could not be sold as easily in our export markets. Inthe second half of 2006 and in 2007 and 2008, poultry exports, demand, production and global inventories gradually improved.
However, if significant numbers of new avian influenza cases were to develop in humans, even if they do not occur in any of our markets, the demand for our poultry products both inside and outside Brazil wouldlikely be negatively affected and the extent of the effect on our business cannot be predicted. Even isolated cases of avian influenza in humans could negatively impact our business due to the public sensitivity to the disease.
The Brazilian Ministry of Agriculture established a plan for the prevention of outbreaks of avian influenza and Newcastle disease in 2006, requiring the inspection of Brazilian states’ sanitary systems. In addition tothe Brazilian government plan, we have implemented our own regional plan to minimize the transportation of raw materials and finished products across state lines and to allow us to isolate production in any state in which anoutbreak of an animal disease may occur.
2016 was a year where dozens of countries reported outbreaks of avian influenza in different regions of the world. Even though Brazil is free from his disease, if an avian influenza outbreak were to occur in Brazil,we might find it necessary to redirect a significant portion of our poultry production to cooked products. Even if we were to do so, however, we expect that demand for our products would still be adversely affected by anyinstance of avian influenza in Brazil. Exports would be affected in the short-term if a case of high pathogenic avian influenza occurred in Brazil, as markets tend to restrict imports until the exporting country proves that thesituation is under control.
A(H1N1)Influenza
In 2009, A(H1N1) influenza, spread to many countries. On June 11, 2009, the WHO declared a flu alert level six, signaling a “global pandemic.” Many countries, including Russia and China, have prohibited importsof pork from countries reporting a significant number of cases (Mexico, United States and Canada). On August 10, 2010, the WHO terminated the level six influenza pandemic alert and shifted its focus to a post-pandemicperiod. During this period, localized outbreaks of different magnitudes may show significant levels of A(H1N1) transmission. In China, for instance, at least 20 people died of A(H1N1) influenza in 2011.
According to the WHO, between September 2011 and January 2012, A(H1N1) influenza viruses circulated at very low levels in general, with some exceptions in Asia and the Americas. Regional A(H1N1) activitywas reported by a few countries in Asia and Central America, and there were sporadic human cases reported by United States of America.
Any further outbreak of A(H1N1) influenza could lead to the imposition of costly preventive controls on pork imports in our export markets and could have a negative impact on the consumption of pork in thosemarkets or in Brazil. In addition, any future significant outbreak of A(H1N1) influenza in Brazil could eventually lead to pressure to destroy our hogs, even if no link between the influenza cases and pork consumption isshown. Any such destruction of our hogs would result in decreased sales of pork, prevent recovery of costs incurred in raising or purchasing our hogs, and result in additional expense for the disposal of destroyed hogs.Accordingly, any spread of
Table of Contents
63
A(H1N1) influenza, or increasing concerns about this disease, may have a material and adverse effect on our company.
OtherAnimalDiseases
In addition, demand in our export markets may similarly be influenced by other animal diseases. For example, pork imports from most Brazilian states were banned in Russia from 2005 to 2007 due to cases of foot-and-mouth disease affecting cattle in the States of Mato Grosso do Sul and Paraná. We do not raise hogs in Mato Grosso do Sul and Paraná. However, these bans have affected Brazilian exports into Russia generally and, atthe time, required us to shift pork production for the Russian market to Rio Grande do Sul, the only Brazilian state that was not subject to the ban, until Russia lifted restrictions on imports from an additional eight Brazilianstates in December 2007.
A viral disease named as Pork and epidemic diarrhea (PED) was diagnosed in North America and Asia in the last few years. The principal clinical signs are enteric symptoms, stunting and high mortality. In theseplaces the disease was responsible for significant reduction in terminated animals and consequent increasing price due to low offer. There isn’t yet a vaccine to prevent the disease but general management and biosecurityreduce the impact.
Effect of Export Market Demand on the Domestic Market
Demand fluctuations for poultry, pork and beef products in our export markets often have an effect on the supply and selling prices of those products in the Brazilian market. This is a result of a demand decrease inkey export markets caused by the imposition of trade barriers, global economic factors, and concerns about animal disease outbreaks, among others. Brazilian exporters generally redirect the products for that market to thedomestic market, increasing the supply of those products internally and often negatively impacting the selling price. This consequently affects our net sales in the domestic market.
For example, in 2014 Russia, banned pork and poultry imports from the United States, Canada and Europe causing a lack of supply of products in the Russian market (and consequently much higher prices), whichled Brazilian players to redirect their products to Russia, causing lower supply and higher prices in Brazil. In 2015, some countries banned poultry imports from the United States, in response to the avian flu outbreak.Generally, countries have adopted a policy to ban only the specific region in which the outbreaks occurred. However, China and South Korea have been stricter, banning the country as a whole. In the last months of 2016,many cases of avian flu were reported across Europe and in some Asian countries, such as Japan and South Korea. Those cases did not have a huge impact in world trade due to the fact that importers banned specific regionsof the European countries. In Korea, until December 2016, the country was forced to cull 22.5 million poultry, which is approximately 15% of the country’s poultry stock.
We monitor the actions of our domestic competitors since they are also impacted by external market changes and may also redirect their products to the domestic market. In addition, we pay close attention tofluctuations in supply generated by producers in the U.S., the EU and other regions since increases in production in those markets can lead to a greater supply in other countries.
Commodity Prices
Many of our raw materials are commodities whose prices consistently fluctuate in response to market forces of supply and demand. We purchase large quantities of corn, soybean meal, vegetable oils and soybeans(grain), which we use to produce substantially all of our own animal feed. For the most part, the commodities we purchase are priced in reais. While input costs are real-denominated, the prices of the commodities wepurchase tend to follow international prices and are influenced by exchange rate fluctuations. Purchases of corn, soybean meal and soybeans represented approximately 29.4% of our cost of production in 2016 and 27.4% in2015. Although we produce most of the hogs we use for our pork products, in 2016 we also purchased hogs on the spot market.
64
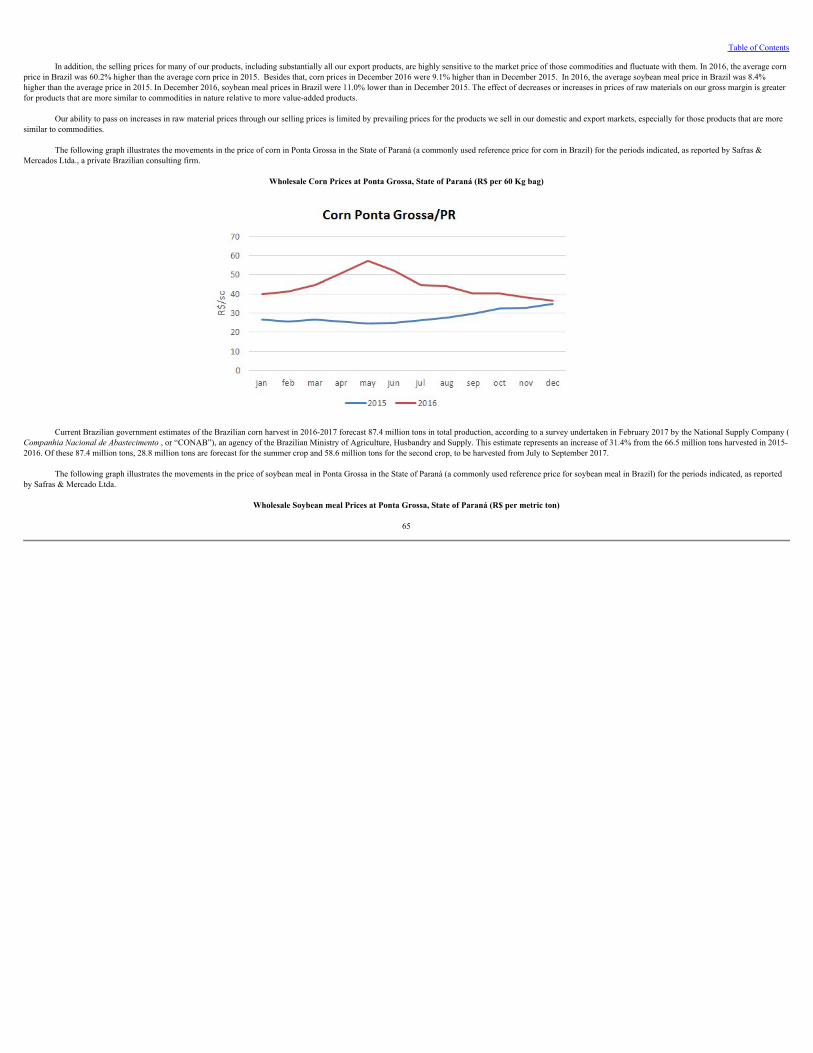
Table of Contents
In addition, the selling prices for many of our products, including substantially all our export products, are highly sensitive to the market price of those commodities and fluctuate with them. In 2016, the average cornprice in Brazil was 60.2% higher than the average corn price in 2015. Besides that, corn prices in December 2016 were 9.1% higher than in December 2015. In 2016, the average soybean meal price in Brazil was 8.4%higher than the average price in 2015. In December 2016, soybean meal prices in Brazil were 11.0% lower than in December 2015. The effect of decreases or increases in prices of raw materials on our gross margin is greaterfor products that are more similar to commodities in nature relative to more value-added products.
Our ability to pass on increases in raw material prices through our selling prices is limited by prevailing prices for the products we sell in our domestic and export markets, especially for those products that are moresimilar to commodities.
The following graph illustrates the movements in the price of corn in Ponta Grossa in the State of Paraná (a commonly used reference price for corn in Brazil) for the periods indicated, as reported by Safras &Mercados Ltda., a private Brazilian consulting firm.
Wholesale Corn Prices at Ponta Grossa, State of Paraná (R$ per 60 Kg bag)
Current Brazilian government estimates of the Brazilian corn harvest in 2016-2017 forecast 87.4 million tons in total production, according to a survey undertaken in February 2017 by the National Supply Company (CompanhiaNacionaldeAbastecimento, or “CONAB”), an agency of the Brazilian Ministry of Agriculture, Husbandry and Supply. This estimate represents an increase of 31.4% from the 66.5 million tons harvested in 2015-2016. Of these 87.4 million tons, 28.8 million tons are forecast for the summer crop and 58.6 million tons for the second crop, to be harvested from July to September 2017.
The following graph illustrates the movements in the price of soybean meal in Ponta Grossa in the State of Paraná (a commonly used reference price for soybean meal in Brazil) for the periods indicated, as reportedby Safras & Mercado Ltda.
Wholesale Soybean meal Prices at Ponta Grossa, State of Paraná (R$ per metric ton)
65
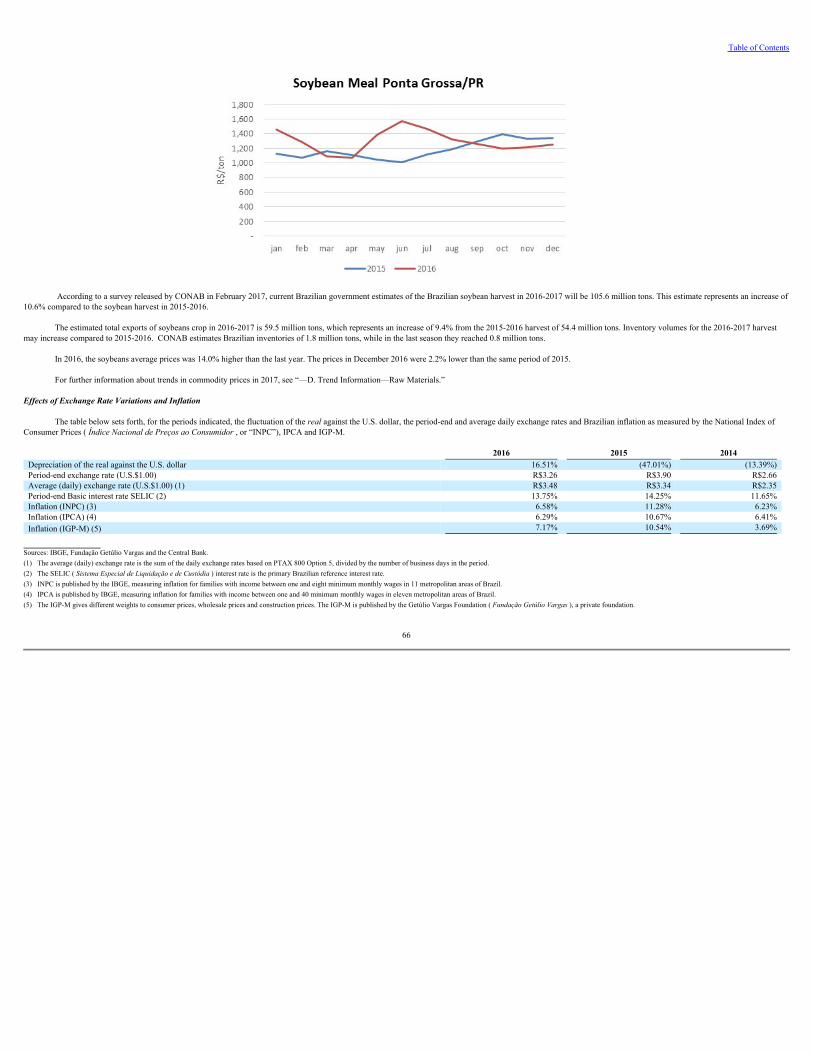
Table of Contents
According to a survey released by CONAB in February 2017, current Brazilian government estimates of the Brazilian soybean harvest in 2016-2017 will be 105.6 million tons. This estimate represents an increase of10.6% compared to the soybean harvest in 2015-2016.
The estimated total exports of soybeans crop in 2016-2017 is 59.5 million tons, which represents an increase of 9.4% from the 2015-2016 harvest of 54.4 million tons. Inventory volumes for the 2016-2017 harvestmay increase compared to 2015-2016. CONAB estimates Brazilian inventories of 1.8 million tons, while in the last season they reached 0.8 million tons.
In 2016, the soybeans average prices was 14.0% higher than the last year. The prices in December 2016 were 2.2% lower than the same period of 2015.
For further information about trends in commodity prices in 2017, see “—D. Trend Information––Raw Materials.”
Effects of Exchange Rate Variations and Inflation
The table below sets forth, for the periods indicated, the fluctuation of the realagainst the U.S. dollar, the period-end and average daily exchange rates and Brazilian inflation as measured by the National Index ofConsumer Prices ( ÍndiceNacionaldePreçosaoConsumidor, or “INPC”), IPCA and IGP-M.
2016 2015 2014Depreciation of the real against the U.S. dollar 16.51% (47.01%) (13.39%)Period-end exchange rate (U.S.$1.00) R$3.26 R$3.90 R$2.66Average (daily) exchange rate (U.S.$1.00) (1) R$3.48 R$3.34 R$2.35Period-end Basic interest rate SELIC (2) 13.75% 14.25% 11.65%Inflation (INPC) (3) 6.58% 11.28% 6.23%Inflation (IPCA) (4) 6.29% 10.67% 6.41%Inflation (IGP-M) (5) 7.17% 10.54% 3.69%
Sources: IBGE, Fundação Getúlio Vargas and the Central Bank.(1) The average (daily) exchange rate is the sum of the daily exchange rates based on PTAX 800 Option 5, divided by the number of business days in the period.(2) The SELIC ( SistemaEspecialdeLiquidaçãoedeCustódia) interest rate is the primary Brazilian reference interest rate.(3) INPC is published by the IBGE, measuring inflation for families with income between one and eight minimum monthly wages in 11 metropolitan areas of Brazil.(4) IPCA is published by IBGE, measuring inflation for families with income between one and 40 minimum monthly wages in eleven metropolitan areas of Brazil.(5) The IGP-M gives different weights to consumer prices, wholesale prices and construction prices. The IGP-M is published by the Getúlio Vargas Foundation ( FundaçãoGetúlioVargas), a private foundation.
66
Table of Contents
Our results of operations and financial condition are significantly affected by movements in the exchange rate of reaisto the U.S. dollar, the euro and the pound sterling. We invoice for our export products primarilyin U.S. dollars and, in Europe, in euros and pounds sterling, but we report our results of operations in reais. Appreciation of the realagainst those currencies decreases the amounts we receive in reaisand therefore our netsales from exports, and the opposite occurs when the realdepreciates against those currencies.
The prices of soy meal and soybeans, which are important ingredients of our animal feedstock, are closely linked to the U.S. dollar. The price of corn, another important ingredient of our feedstock, is also linked tothe U.S. dollar, albeit to a lesser degree than the price of soy meal and soybeans. In addition to soy meal, soybeans and corn, we purchase sausage casings, mineral nutrients for feed, packaging and other raw materials, as wellas equipment for use in our production facilities, from suppliers located outside Brazil whom we must pay in U.S. dollars or other foreign currencies. When the realdepreciates against the U.S. dollar, the cost in reaisof ourU.S. dollar-linked raw materials and equipment increases, and such increases could materially adversely affect our results of operations. Although the appreciation of the realhas a positive effect on our costs because part ofour costs are denominated in U.S. dollars, this reduction in U.S. dollar costs because of the appreciation of the realdoes not immediately affect our results of operations because of the length of our production cycles forpoultry and pork.
We had total foreign currency-denominated debt obligations in an aggregate amount of R$10,318.7 million at December 31, 2016, representing 54.4% of our total consolidated indebtedness at that date. Although wemanage a portion of our exchange rate risk through foreign currency derivative instruments and future cash flows from exports in U.S. dollars and other foreign currencies, our foreign currency debt obligations are notcompletely hedged. A significant devaluation of the realin relation to the U.S. dollar or other currencies would increase the amount of reaisthat we would need in order to meet debt service requirements of our foreigncurrency-denominated obligations.
Historically, our results of operations and financial condition have been affected by rates of inflation in Brazil. Demand for our products in the domestic market is sensitive to inflation in consumer prices, as reflectedin variations in the INPC and IPCA inflation indexes, and most of our costs and expenses are incurred in reais. Because long-term contracts with suppliers and customers are not customary in our industry and prices aregenerally negotiated monthly or quarterly, increases in inflation have a rapid impact on our net sales and costs.
The IGP-M index is often used as an inflation reference rate in negotiating prices we pay to suppliers. In addition, we buy energy to run our production facilities pursuant to long-term contracts that contain periodicinflation adjustments according to the IGP-M index.
In terms of personnel costs, Brazilian salaries are adjusted only once a year, based on collective agreements between employers’ syndicates and unions. Generally, unions follow the INPC as a parameter for theirnegotiations.
Effects of Interest Rates
Our financial expenses are affected by movements in Brazilian and foreign interest rates. At December 31, 2016, 23.5% of our total liabilities with respect to indebtedness and derivative instruments of R$15,845.8million bore interest based on floating interest rates, either because they were denominated in (or swapped into) reaisand bore interest based on Brazilian floating interest rates or because they were U.S. dollar-denominatedand subject to LIBOR. At that date, our primary interest rate exposure was to the LIBOR rate. The two primary Brazilian interest rates that apply to our indebtedness are the TJLP, which applies to our long-term debt from theBNDES, and the CDI rate, which applies to our currency swaps and some of our other long-term debt.
67
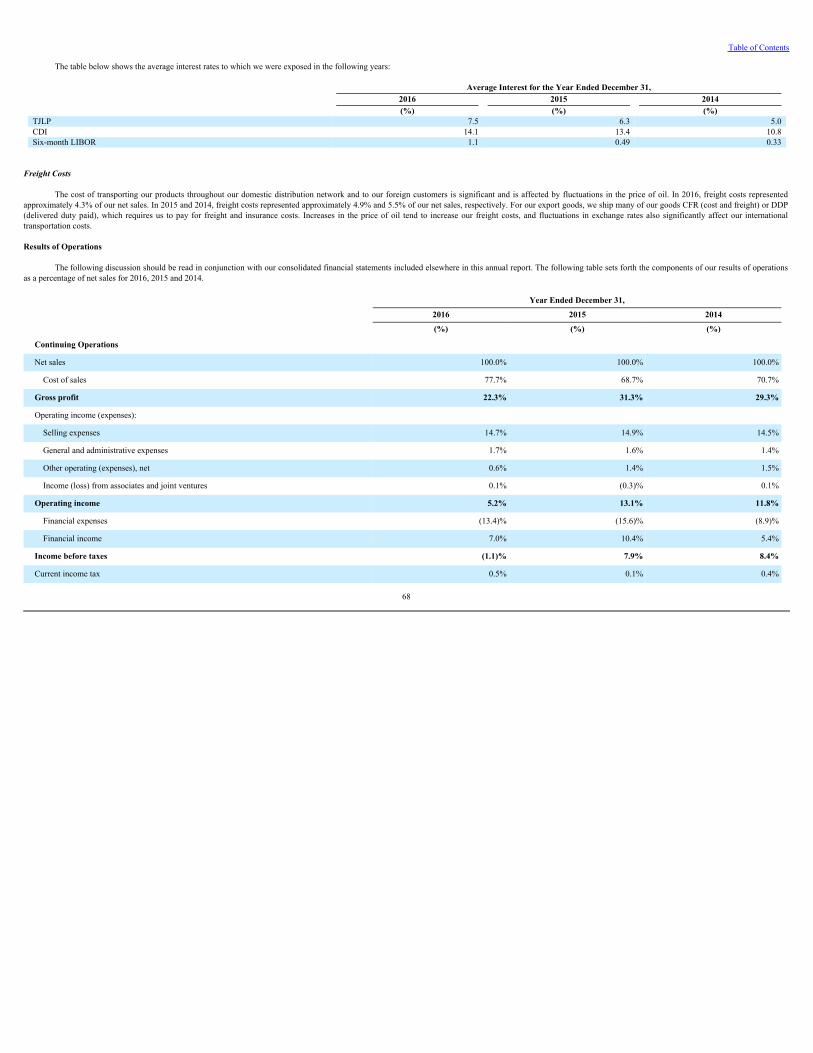
Table of Contents
The table below shows the average interest rates to which we were exposed in the following years:
Average Interest for the Year Ended December 31, 2016 2015 2014
(%) (%) (%)TJLP 7.5 6.3 5.0CDI 14.1 13.4 10.8Six-month LIBOR 1.1 0.49 0.33
Freight Costs
The cost of transporting our products throughout our domestic distribution network and to our foreign customers is significant and is affected by fluctuations in the price of oil. In 2016, freight costs representedapproximately 4.3% of our net sales. In 2015 and 2014, freight costs represented approximately 4.9% and 5.5% of our net sales, respectively. For our export goods, we ship many of our goods CFR (cost and freight) or DDP(delivered duty paid), which requires us to pay for freight and insurance costs. Increases in the price of oil tend to increase our freight costs, and fluctuations in exchange rates also significantly affect our internationaltransportation costs.
Results of Operations
The following discussion should be read in conjunction with our consolidated financial statements included elsewhere in this annual report. The following table sets forth the components of our results of operationsas a percentage of net sales for 2016, 2015 and 2014.
Year Ended December 31,
2016 2015 2014
(%) (%) (%)
Continuing Operations Net sales 100.0% 100.0% 100.0%
Cost of sales 77.7% 68.7% 70.7%
Gross profit 22.3% 31.3% 29.3%
Operating income (expenses): Selling expenses 14.7% 14.9% 14.5%
General and administrative expenses 1.7% 1.6% 1.4%
Other operating (expenses), net 0.6% 1.4% 1.5%
Income (loss) from associates and joint ventures 0.1% (0.3)% 0.1%
Operating income 5.2% 13.1% 11.8%
Financial expenses (13.4)% (15.6)% (8.9)%
Financial income 7.0% 10.4% 5.4%
Income before taxes (1.1)% 7.9% 8.4%
Current income tax 0.5% 0.1% 0.4%
68
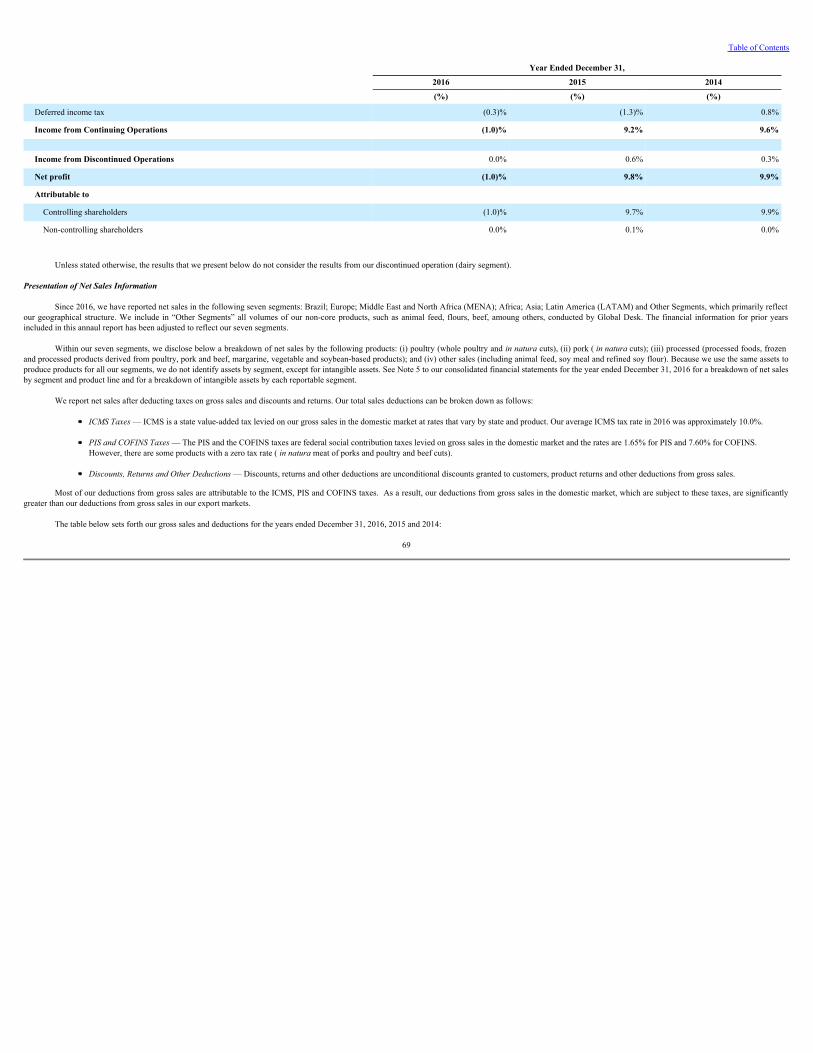
Table of Contents
Year Ended December 31,
2016 2015 2014
(%) (%) (%)
Deferred income tax (0.3)% (1.3)% 0.8%
Income from Continuing Operations (1.0)% 9.2% 9.6%
Income from Discontinued Operations 0.0% 0.6% 0.3%
Net profit (1.0)% 9.8% 9.9%
Attributable to Controlling shareholders (1.0)% 9.7% 9.9%
Non-controlling shareholders 0.0% 0.1% 0.0%
Unless stated otherwise, the results that we present below do not consider the results from our discontinued operation (dairy segment).
Presentation of Net Sales Information
Since 2016, we have reported net sales in the following seven segments: Brazil; Europe; Middle East and North Africa (MENA); Africa; Asia; Latin America (LATAM) and Other Segments, which primarily reflectour geographical structure. We include in “Other Segments” all volumes of our non-core products, such as animal feed, flours, beef, amoung others, conducted by Global Desk. The financial information for prior yearsincluded in this annaul report has been adjusted to reflect our seven segments.
Within our seven segments, we disclose below a breakdown of net sales by the following products: (i) poultry (whole poultry and innaturacuts), (ii) pork ( innaturacuts); (iii) processed (processed foods, frozenand processed products derived from poultry, pork and beef, margarine, vegetable and soybean-based products); and (iv) other sales (including animal feed, soy meal and refined soy flour). Because we use the same assets toproduce products for all our segments, we do not identify assets by segment, except for intangible assets. See Note 5 to our consolidated financial statements for the year ended December 31, 2016 for a breakdown of net salesby segment and product line and for a breakdown of intangible assets by each reportable segment.
We report net sales after deducting taxes on gross sales and discounts and returns. Our total sales deductions can be broken down as follows:
ICMSTaxes— ICMS is a state value-added tax levied on our gross sales in the domestic market at rates that vary by state and product. Our average ICMS tax rate in 2016 was approximately 10.0%. PISandCOFINSTaxes— The PIS and the COFINS taxes are federal social contribution taxes levied on gross sales in the domestic market and the rates are 1.65% for PIS and 7.60% for COFINS.However, there are some products with a zero tax rate ( innaturameat of porks and poultry and beef cuts). Discounts,ReturnsandOtherDeductions— Discounts, returns and other deductions are unconditional discounts granted to customers, product returns and other deductions from gross sales.
Most of our deductions from gross sales are attributable to the ICMS, PIS and COFINS taxes. As a result, our deductions from gross sales in the domestic market, which are subject to these taxes, are significantlygreater than our deductions from gross sales in our export markets.
The table below sets forth our gross sales and deductions for the years ended December 31, 2016, 2015 and 2014:
69
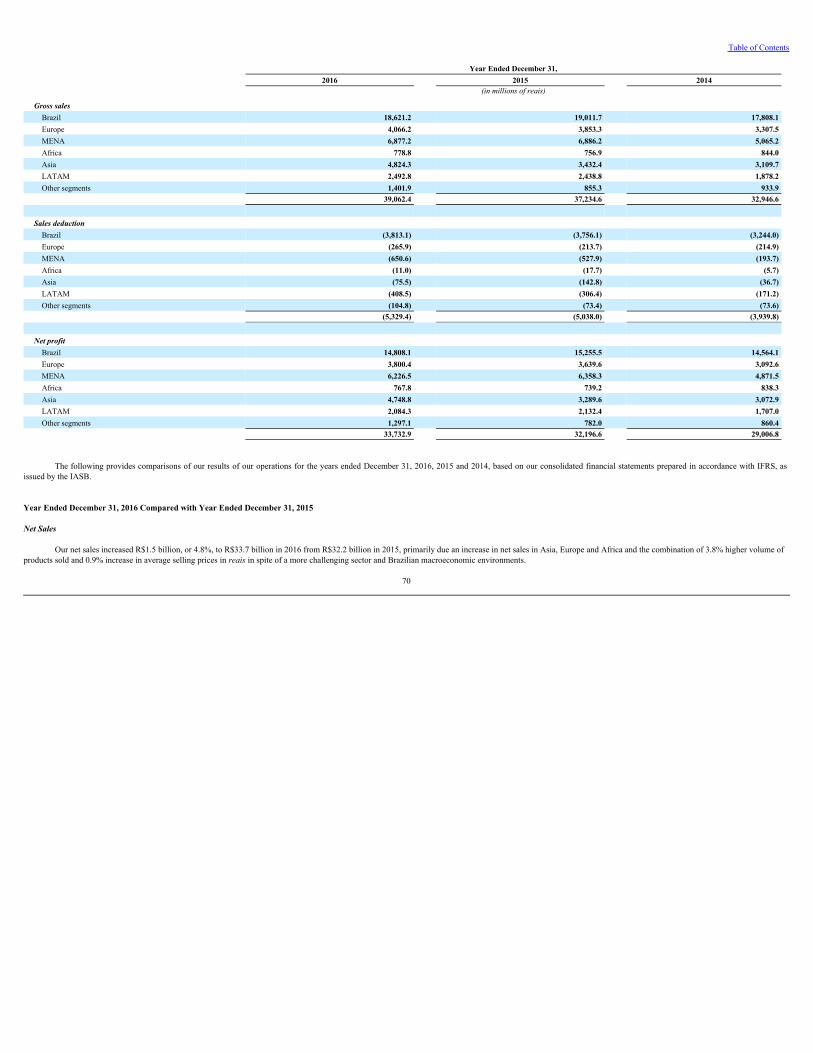
Table of Contents
Year Ended December 31, 2016 2015 2014
(inmillionsofreais)
Gross sales Brazil 18,621.2 19,011.7 17,808.1Europe 4,066.2 3,853.3 3,307.5MENA 6,877.2 6,886.2 5,065.2Africa 778.8 756.9 844.0Asia 4,824.3 3,432.4 3,109.7LATAM 2,492.8 2,438.8 1,878.2Other segments 1,401.9 855.3 933.9
39,062.4 37,234.6 32,946.6 Sales deduction
Brazil (3,813.1) (3,756.1) (3,244.0)Europe (265.9) (213.7) (214.9)MENA (650.6) (527.9) (193.7)Africa (11.0) (17.7) (5.7)Asia (75.5) (142.8) (36.7)LATAM (408.5) (306.4) (171.2)Other segments (104.8) (73.4) (73.6)
(5,329.4) (5,038.0) (3,939.8)
Net profit Brazil 14,808.1 15,255.5 14,564.1Europe 3,800.4 3,639.6 3,092.6MENA 6,226.5 6,358.3 4,871.5Africa 767.8 739.2 838.3Asia 4,748.8 3,289.6 3,072.9LATAM 2,084.3 2,132.4 1,707.0Other segments 1,297.1 782.0 860.4 33,732.9 32,196.6 29,006.8
The following provides comparisons of our results of our operations for the years ended December 31, 2016, 2015 and 2014, based on our consolidated financial statements prepared in accordance with IFRS, as
issued by the IASB.
Year Ended December 31, 2016 Compared with Year Ended December 31, 2015
Net Sales
Our net sales increased R$1.5 billion, or 4.8%, to R$33.7 billion in 2016 from R$32.2 billion in 2015, primarily due an increase in net sales in Asia, Europe and Africa and the combination of 3.8% higher volume ofproducts sold and 0.9% increase in average selling prices in reaisin spite of a more challenging sector and Brazilian macroeconomic environments.
70
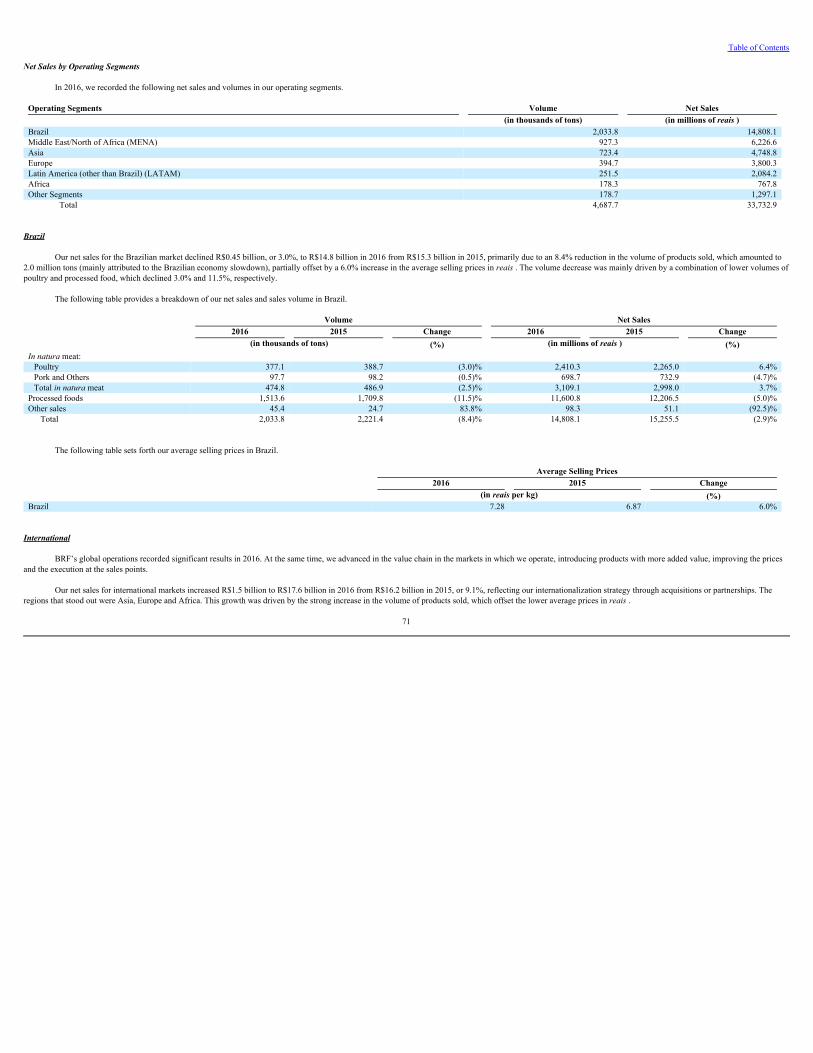
Table of Contents
Net Sales by Operating Segments
In 2016, we recorded the following net sales and volumes in our operating segments.
Operating Segments Volume Net Sales (in thousands of tons) (in millions of reais )Brazil 2,033.8 14,808.1Middle East/North of Africa (MENA) 927.3 6,226.6Asia 723.4 4,748.8Europe 394.7 3,800.3Latin America (other than Brazil) (LATAM) 251.5 2,084.2Africa 178.3 767.8Other Segments 178.7 1,297.1
Total 4,687.7 33,732.9
Brazil
Our net sales for the Brazilian market declined R$0.45 billion, or 3.0%, to R$14.8 billion in 2016 from R$15.3 billion in 2015, primarily due to an 8.4% reduction in the volume of products sold, which amounted to2.0 million tons (mainly attributed to the Brazilian economy slowdown), partially offset by a 6.0% increase in the average selling prices in reais. The volume decrease was mainly driven by a combination of lower volumes ofpoultry and processed food, which declined 3.0% and 11.5%, respectively.
The following table provides a breakdown of our net sales and sales volume in Brazil.
Volume Net Sales 2016 2015 Change 2016 2015 Change (in thousands of tons) (%) (in millions of reais ) (%)Innaturameat:
Poultry 377.1 388.7 (3.0)% 2,410.3 2,265.0 6.4%Pork and Others 97.7 98.2 (0.5)% 698.7 732.9 (4.7)%Total innaturameat 474.8 486.9 (2.5)% 3,109.1 2,998.0 3.7%
Processed foods 1,513.6 1,709.8 (11.5)% 11,600.8 12,206.5 (5.0)%Other sales 45.4 24.7 83.8% 98.3 51.1 (92.5)%
Total 2,033.8 2,221.4 (8.4)% 14,808.1 15,255.5 (2.9)%
The following table sets forth our average selling prices in Brazil.
Average Selling Prices2016 2015 Change
(in reais per kg) (%)Brazil 7.28 6.87 6.0%
International
BRF’s global operations recorded significant results in 2016. At the same time, we advanced in the value chain in the markets in which we operate, introducing products with more added value, improving the pricesand the execution at the sales points.
Our net sales for international markets increased R$1.5 billion to R$17.6 billion in 2016 from R$16.2 billion in 2015, or 9.1%, reflecting our internationalization strategy through acquisitions or partnerships. Theregions that stood out were Asia, Europe and Africa. This growth was driven by the strong increase in the volume of products sold, which offset the lower average prices in reais.
71
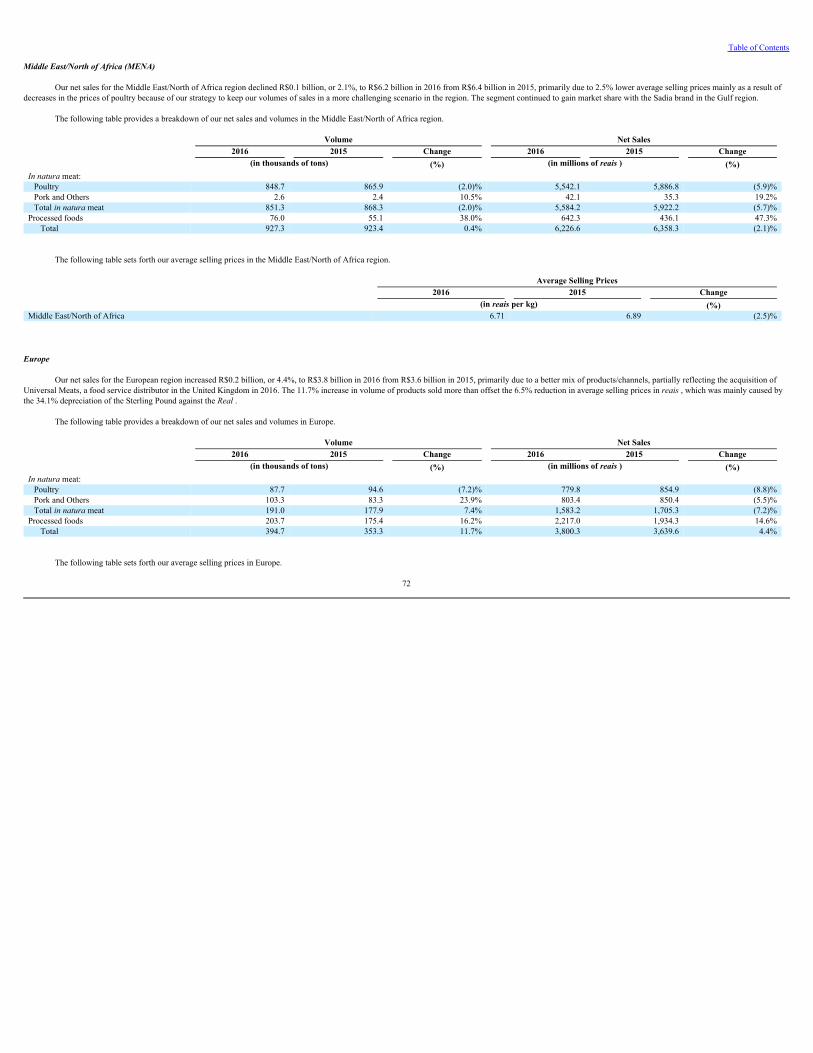
Table of Contents
Middle East/North of Africa (MENA)
Our net sales for the Middle East/North of Africa region declined R$0.1 billion, or 2.1%, to R$6.2 billion in 2016 from R$6.4 billion in 2015, primarily due to 2.5% lower average selling prices mainly as a result ofdecreases in the prices of poultry because of our strategy to keep our volumes of sales in a more challenging scenario in the region. The segment continued to gain market share with the Sadia brand in the Gulf region.
The following table provides a breakdown of our net sales and volumes in the Middle East/North of Africa region.
Volume Net Sales 2016 2015 Change 2016 2015 Change (in thousands of tons) (%) (in millions of reais ) (%)Innaturameat:
Poultry 848.7 865.9 (2.0)% 5,542.1 5,886.8 (5.9)%Pork and Others 2.6 2.4 10.5% 42.1 35.3 19.2%Total innaturameat 851.3 868.3 (2.0)% 5,584.2 5,922.2 (5.7)%
Processed foods 76.0 55.1 38.0% 642.3 436.1 47.3%Total 927.3 923.4 0.4% 6,226.6 6,358.3 (2.1)%
The following table sets forth our average selling prices in the Middle East/North of Africa region.
Average Selling Prices2016 2015 Change
(in reais per kg) (%)Middle East/North of Africa 6.71 6.89 (2.5)%
Europe
Our net sales for the European region increased R$0.2 billion, or 4.4%, to R$3.8 billion in 2016 from R$3.6 billion in 2015, primarily due to a better mix of products/channels, partially reflecting the acquisition ofUniversal Meats, a food service distributor in the United Kingdom in 2016. The 11.7% increase in volume of products sold more than offset the 6.5% reduction in average selling prices in reais, which was mainly caused bythe 34.1% depreciation of the Sterling Pound against the Real.
The following table provides a breakdown of our net sales and volumes in Europe.
Volume Net Sales 2016 2015 Change 2016 2015 Change (in thousands of tons) (%) (in millions of reais ) (%)Innaturameat:
Poultry 87.7 94.6 (7.2)% 779.8 854.9 (8.8)%Pork and Others 103.3 83.3 23.9% 803.4 850.4 (5.5)%Total innaturameat 191.0 177.9 7.4% 1,583.2 1,705.3 (7.2)%
Processed foods 203.7 175.4 16.2% 2,217.0 1,934.3 14.6%Total 394.7 353.3 11.7% 3,800.3 3,639.6 4.4%
The following table sets forth our average selling prices in Europe.
72
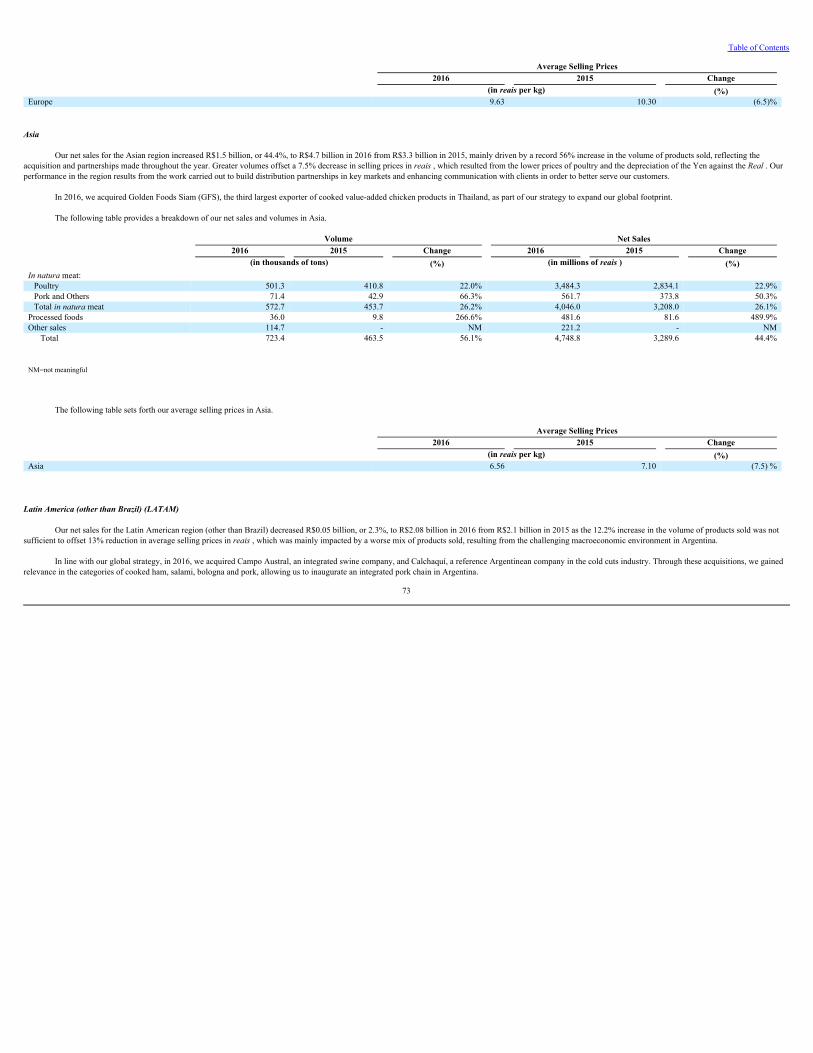
Table of Contents
Average Selling Prices2016 2015 Change
(in reais per kg) (%)Europe 9.63 10.30 (6.5)%
Asia Our net sales for the Asian region increased R$1.5 billion, or 44.4%, to R$4.7 billion in 2016 from R$3.3 billion in 2015, mainly driven by a record 56% increase in the volume of products sold, reflecting the
acquisition and partnerships made throughout the year. Greater volumes offset a 7.5% decrease in selling prices in reais, which resulted from the lower prices of poultry and the depreciation of the Yen against the Real. Ourperformance in the region results from the work carried out to build distribution partnerships in key markets and enhancing communication with clients in order to better serve our customers.
In 2016, we acquired Golden Foods Siam (GFS), the third largest exporter of cooked value-added chicken products in Thailand, as part of our strategy to expand our global footprint.
The following table provides a breakdown of our net sales and volumes in Asia.
Volume Net Sales 2016 2015 Change 2016 2015 Change (in thousands of tons) (%) (in millions of reais ) (%)Innaturameat:
Poultry 501.3 410.8 22.0% 3,484.3 2,834.1 22.9%Pork and Others 71.4 42.9 66.3% 561.7 373.8 50.3%Total innaturameat 572.7 453.7 26.2% 4,046.0 3,208.0 26.1%
Processed foods 36.0 9.8 266.6% 481.6 81.6 489.9%Other sales 114.7 - NM 221.2 - NM
Total 723.4 463.5 56.1% 4,748.8 3,289.6 44.4%
NM=not meaningful
The following table sets forth our average selling prices in Asia.
Average Selling Prices2016 2015 Change
(in reais per kg) (%)Asia 6.56 7.10 (7.5) %
Latin America (other than Brazil) (LATAM) Our net sales for the Latin American region (other than Brazil) decreased R$0.05 billion, or 2.3%, to R$2.08 billion in 2016 from R$2.1 billion in 2015 as the 12.2% increase in the volume of products sold was not
sufficient to offset 13% reduction in average selling prices in reais, which was mainly impacted by a worse mix of products sold, resulting from the challenging macroeconomic environment in Argentina. In line with our global strategy, in 2016, we acquired Campo Austral, an integrated swine company, and Calchaquí, a reference Argentinean company in the cold cuts industry. Through these acquisitions, we gained
relevance in the categories of cooked ham, salami, bologna and pork, allowing us to inaugurate an integrated pork chain in Argentina.
73
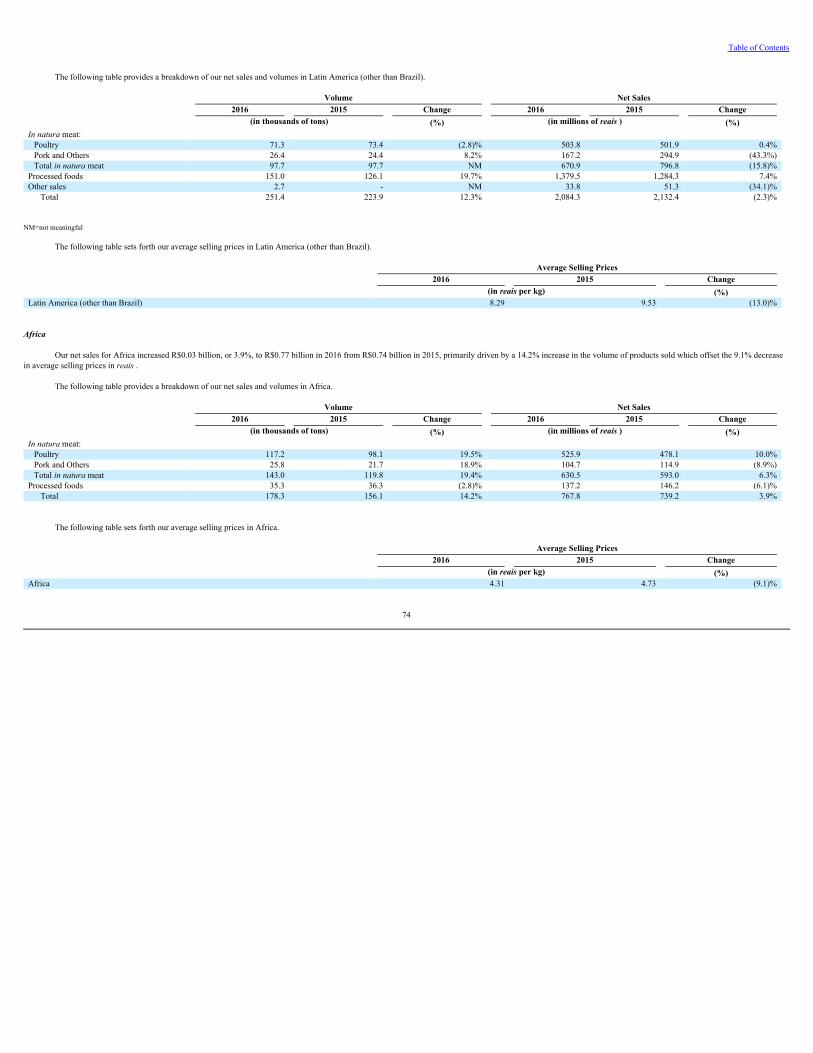
Table of Contents
The following table provides a breakdown of our net sales and volumes in Latin America (other than Brazil).
Volume Net Sales 2016 2015 Change 2016 2015 Change (in thousands of tons) (%) (in millions of reais ) (%)Innaturameat:
Poultry 71.3 73.4 (2.8)% 503.8 501.9 0.4%Pork and Others 26.4 24.4 8.2% 167.2 294.9 (43.3%)Total innaturameat 97.7 97.7 NM 670.9 796.8 (15.8)%
Processed foods 151.0 126.1 19.7% 1,379.5 1,284.3 7.4%Other sales 2.7 - NM 33.8 51.3 (34.1)%
Total 251.4 223.9 12.3% 2,084.3 2,132.4 (2.3)%
NM=not meaningful
The following table sets forth our average selling prices in Latin America (other than Brazil).
Average Selling Prices2016 2015 Change
(in reais per kg) (%)Latin America (other than Brazil) 8.29 9.53 (13.0)%
Africa Our net sales for Africa increased R$0.03 billion, or 3.9%, to R$0.77 billion in 2016 from R$0.74 billion in 2015, primarily driven by a 14.2% increase in the volume of products sold which offset the 9.1% decrease
in average selling prices in reais.
The following table provides a breakdown of our net sales and volumes in Africa.
Volume Net Sales 2016 2015 Change 2016 2015 Change (in thousands of tons) (%) (in millions of reais ) (%)Innaturameat:
Poultry 117.2 98.1 19.5% 525.9 478.1 10.0%Pork and Others 25.8 21.7 18.9% 104.7 114.9 (8.9%)Total innaturameat 143.0 119.8 19.4% 630.5 593.0 6.3%
Processed foods 35.3 36.3 (2.8)% 137.2 146.2 (6.1)%Total 178.3 156.1 14.2% 767.8 739.2 3.9%
The following table sets forth our average selling prices in Africa.
Average Selling Prices2016 2015 Change
(in reais per kg) (%)Africa 4.31 4.73 (9.1)%
74
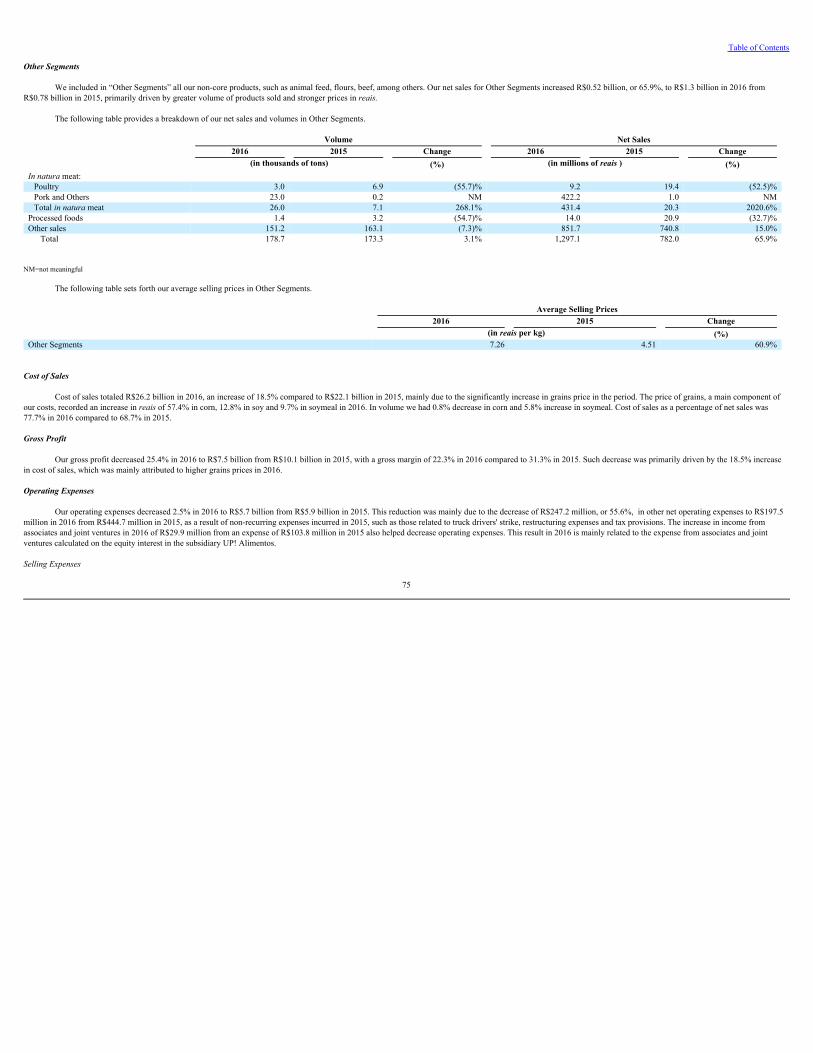
Table of Contents
Other Segments We included in “Other Segments” all our non-core products, such as animal feed, flours, beef, among others. Our net sales for Other Segments increased R$0.52 billion, or 65.9%, to R$1.3 billion in 2016 from
R$0.78 billion in 2015, primarily driven by greater volume of products sold and stronger prices in reais. The following table provides a breakdown of our net sales and volumes in Other Segments.
Volume Net Sales 2016 2015 Change 2016 2015 Change (in thousands of tons) (%) (in millions of reais ) (%)Innaturameat:
Poultry 3.0 6.9 (55.7)% 9.2 19.4 (52.5)%Pork and Others 23.0 0.2 NM 422.2 1.0 NMTotal innaturameat 26.0 7.1 268.1% 431.4 20.3 2020.6%
Processed foods 1.4 3.2 (54.7)% 14.0 20.9 (32.7)%Other sales 151.2 163.1 (7.3)% 851.7 740.8 15.0%
Total 178.7 173.3 3.1% 1,297.1 782.0 65.9%
NM=not meaningful
The following table sets forth our average selling prices in Other Segments.
Average Selling Prices2016 2015 Change
(in reais per kg) (%)Other Segments 7.26 4.51 60.9%
Cost of Sales
Cost of sales totaled R$26.2 billion in 2016, an increase of 18.5% compared to R$22.1 billion in 2015, mainly due to the significantly increase in grains price in the period. The price of grains, a main component ofour costs, recorded an increase in reaisof 57.4% in corn, 12.8% in soy and 9.7% in soymeal in 2016. In volume we had 0.8% decrease in corn and 5.8% increase in soymeal. Cost of sales as a percentage of net sales was77.7% in 2016 compared to 68.7% in 2015.
Gross Profit
Our gross profit decreased 25.4% in 2016 to R$7.5 billion from R$10.1 billion in 2015, with a gross margin of 22.3% in 2016 compared to 31.3% in 2015. Such decrease was primarily driven by the 18.5% increasein cost of sales, which was mainly attributed to higher grains prices in 2016.
Operating Expenses
Our operating expenses decreased 2.5% in 2016 to R$5.7 billion from R$5.9 billion in 2015. This reduction was mainly due to the decrease of R$247.2 million, or 55.6%, in other net operating expenses to R$197.5million in 2016 from R$444.7 million in 2015, as a result of non-recurring expenses incurred in 2015, such as those related to truck drivers' strike, restructuring expenses and tax provisions. The increase in income fromassociates and joint ventures in 2016 of R$29.9 million from an expense of R$103.8 million in 2015 also helped decrease operating expenses. This result in 2016 is mainly related to the expense from associates and jointventures calculated on the equity interest in the subsidiary UP! Alimentos.
SellingExpenses
75
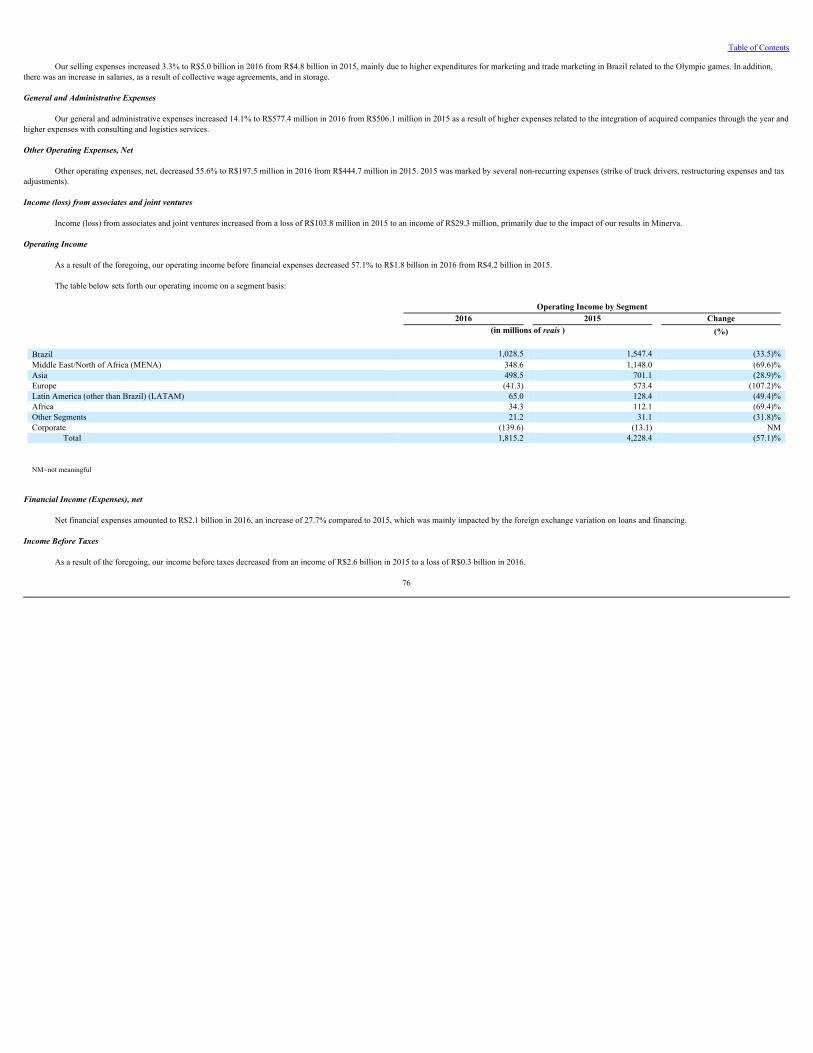
Table of Contents
Our selling expenses increased 3.3% to R$5.0 billion in 2016 from R$4.8 billion in 2015, mainly due to higher expenditures for marketing and trade marketing in Brazil related to the Olympic games. In addition,there was an increase in salaries, as a result of collective wage agreements, and in storage.
General and Administrative Expenses
Our general and administrative expenses increased 14.1% to R$577.4 million in 2016 from R$506.1 million in 2015 as a result of higher expenses related to the integration of acquired companies through the year andhigher expenses with consulting and logistics services.
Other Operating Expenses, Net
Other operating expenses, net, decreased 55.6% to R$197.5 million in 2016 from R$444.7 million in 2015. 2015 was marked by several non-recurring expenses (strike of truck drivers, restructuring expenses and taxadjustments).
Income (loss) from associates and joint ventures
Income (loss) from associates and joint ventures increased from a loss of R$103.8 million in 2015 to an income of R$29.3 million, primarily due to the impact of our results in Minerva.
Operating Income
As a result of the foregoing, our operating income before financial expenses decreased 57.1% to R$1.8 billion in 2016 from R$4.2 billion in 2015.
The table below sets forth our operating income on a segment basis:
Operating Income by Segment2016 2015 Change
(in millions of reais ) (%)
Brazil 1,028.5 1,547.4 (33.5)%Middle East/North of Africa (MENA) 348.6 1,148.0 (69.6)%Asia 498.5 701.1 (28.9)%Europe (41.3) 573.4 (107.2)%Latin America (other than Brazil) (LATAM) 65.0 128.4 (49.4)%Africa 34.3 112.1 (69.4)%Other Segments 21.2 31.1 (31.8)%Corporate (139.6) (13.1) NM
Total 1,815.2 4,228.4 (57.1)%
NM=not meaningful
Financial Income (Expenses), net
Net financial expenses amounted to R$2.1 billion in 2016, an increase of 27.7% compared to 2015, which was mainly impacted by the foreign exchange variation on loans and financing.
Income Before Taxes
As a result of the foregoing, our income before taxes decreased from an income of R$2.6 billion in 2015 to a loss of R$0.3 billion in 2016.
76
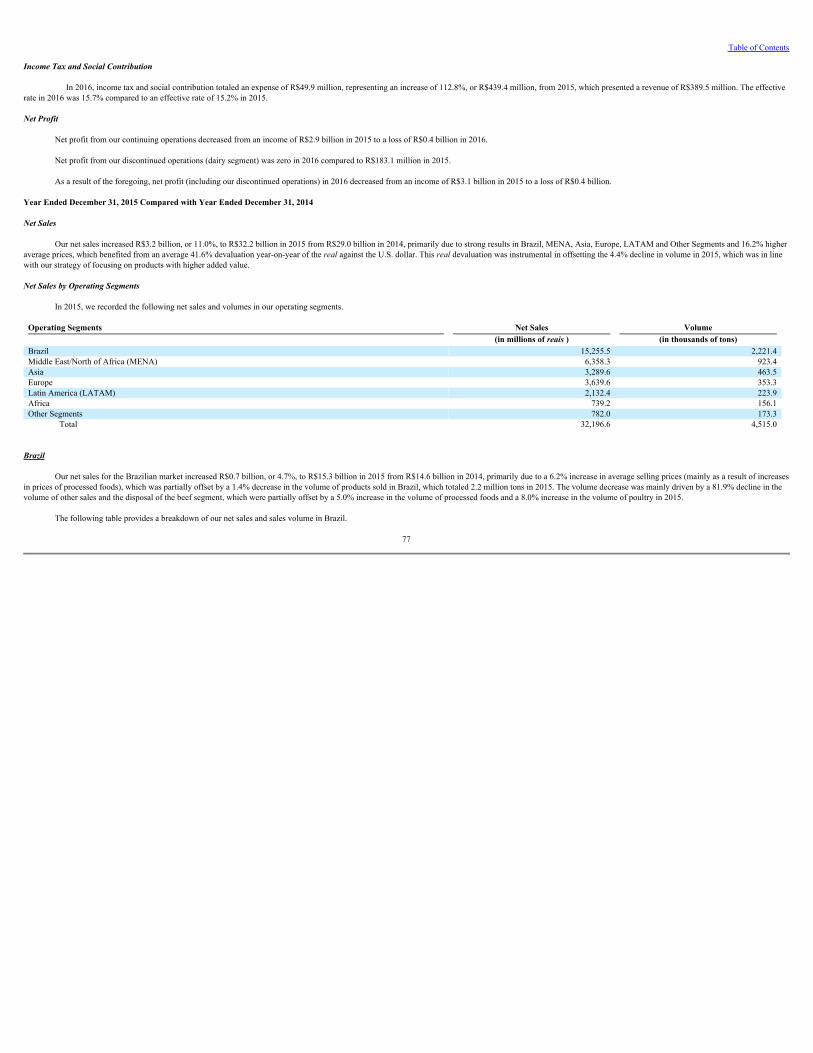
Table of Contents
Income Tax and Social Contribution
In 2016, income tax and social contribution totaled an expense of R$49.9 million, representing an increase of 112.8%, or R$439.4 million, from 2015, which presented a revenue of R$389.5 million. The effectiverate in 2016 was 15.7% compared to an effective rate of 15.2% in 2015. Net Profit
Net profit from our continuing operations decreased from an income of R$2.9 billion in 2015 to a loss of R$0.4 billion in 2016.
Net profit from our discontinued operations (dairy segment) was zero in 2016 compared to R$183.1 million in 2015.
As a result of the foregoing, net profit (including our discontinued operations) in 2016 decreased from an income of R$3.1 billion in 2015 to a loss of R$0.4 billion.
Year Ended December 31, 2015 Compared with Year Ended December 31, 2014
Net Sales
Our net sales increased R$3.2 billion, or 11.0%, to R$32.2 billion in 2015 from R$29.0 billion in 2014, primarily due to strong results in Brazil, MENA, Asia, Europe, LATAM and Other Segments and 16.2% higheraverage prices, which benefited from an average 41.6% devaluation year-on-year of the realagainst the U.S. dollar. This realdevaluation was instrumental in offsetting the 4.4% decline in volume in 2015, which was in linewith our strategy of focusing on products with higher added value.
Net Sales by Operating Segments
In 2015, we recorded the following net sales and volumes in our operating segments.
Operating Segments Net Sales Volume (in millions of reais ) (in thousands of tons)Brazil 15,255.5 2,221.4Middle East/North of Africa (MENA) 6,358.3 923.4Asia 3,289.6 463.5Europe 3,639.6 353.3Latin America (LATAM) 2,132.4 223.9Africa 739.2 156.1Other Segments 782.0 173.3
Total 32,196.6 4,515.0
Brazil
Our net sales for the Brazilian market increased R$0.7 billion, or 4.7%, to R$15.3 billion in 2015 from R$14.6 billion in 2014, primarily due to a 6.2% increase in average selling prices (mainly as a result of increasesin prices of processed foods), which was partially offset by a 1.4% decrease in the volume of products sold in Brazil, which totaled 2.2 million tons in 2015. The volume decrease was mainly driven by a 81.9% decline in thevolume of other sales and the disposal of the beef segment, which were partially offset by a 5.0% increase in the volume of processed foods and a 8.0% increase in the volume of poultry in 2015.
The following table provides a breakdown of our net sales and sales volume in Brazil.
77
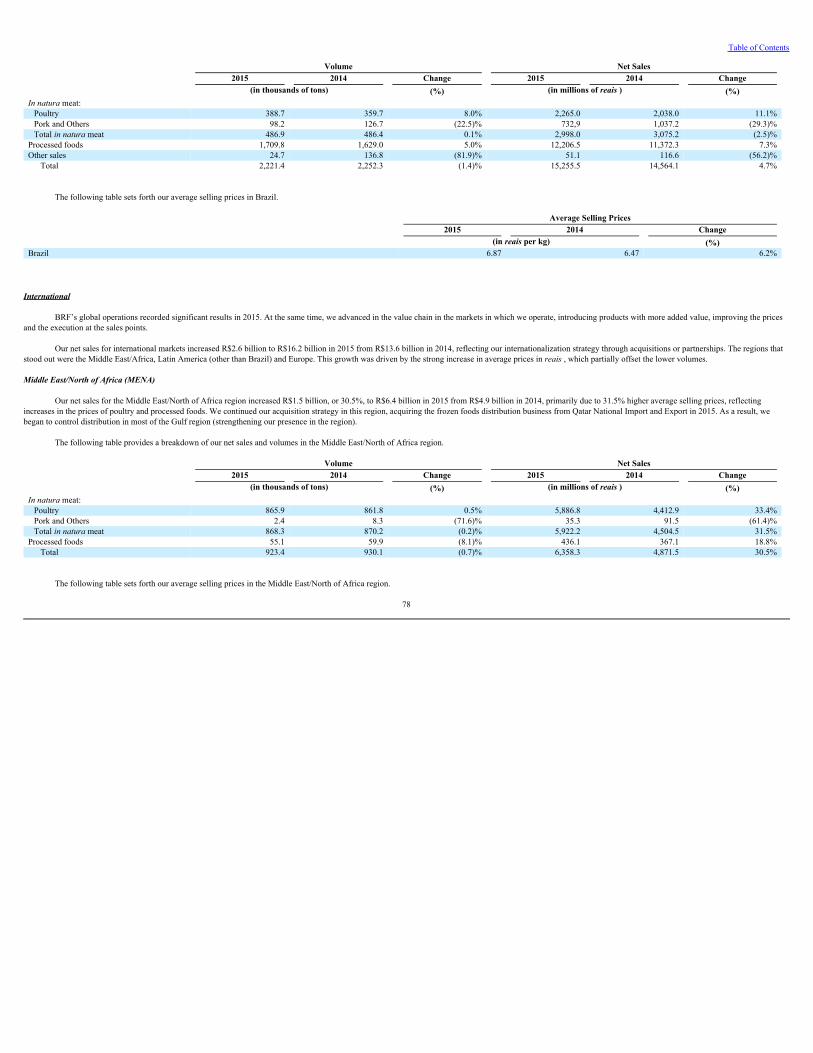
Table of Contents
Volume Net Sales 2015 2014 Change 2015 2014 Change (in thousands of tons) (%) (in millions of reais ) (%)Innaturameat:
Poultry 388.7 359.7 8.0% 2,265.0 2,038.0 11.1%Pork and Others 98.2 126.7 (22.5)% 732,9 1,037.2 (29.3)%Total innaturameat 486.9 486.4 0.1% 2,998.0 3,075.2 (2.5)%
Processed foods 1,709.8 1,629.0 5.0% 12,206.5 11,372.3 7.3%Other sales 24.7 136.8 (81.9)% 51.1 116.6 (56.2)%
Total 2,221.4 2,252.3 (1.4)% 15,255.5 14,564.1 4.7%
The following table sets forth our average selling prices in Brazil.
Average Selling Prices2015 2014 Change
(in reais per kg) (%)Brazil 6.87 6.47 6.2%
International
BRF’s global operations recorded significant results in 2015. At the same time, we advanced in the value chain in the markets in which we operate, introducing products with more added value, improving the pricesand the execution at the sales points.
Our net sales for international markets increased R$2.6 billion to R$16.2 billion in 2015 from R$13.6 billion in 2014, reflecting our internationalization strategy through acquisitions or partnerships. The regions thatstood out were the Middle East/Africa, Latin America (other than Brazil) and Europe. This growth was driven by the strong increase in average prices in reais, which partially offset the lower volumes.
Middle East/North of Africa (MENA)
Our net sales for the Middle East/North of Africa region increased R$1.5 billion, or 30.5%, to R$6.4 billion in 2015 from R$4.9 billion in 2014, primarily due to 31.5% higher average selling prices, reflectingincreases in the prices of poultry and processed foods. We continued our acquisition strategy in this region, acquiring the frozen foods distribution business from Qatar National Import and Export in 2015. As a result, webegan to control distribution in most of the Gulf region (strengthening our presence in the region).
The following table provides a breakdown of our net sales and volumes in the Middle East/North of Africa region.
Volume Net Sales 2015 2014 Change 2015 2014 Change (in thousands of tons) (%) (in millions of reais ) (%)Innaturameat:
Poultry 865.9 861.8 0.5% 5,886.8 4,412.9 33.4%Pork and Others 2.4 8.3 (71.6)% 35.3 91.5 (61.4)%Total innaturameat 868.3 870.2 (0.2)% 5,922.2 4,504.5 31.5%
Processed foods 55.1 59.9 (8.1)% 436.1 367.1 18.8%Total 923.4 930.1 (0.7)% 6,358.3 4,871.5 30.5%
The following table sets forth our average selling prices in the Middle East/North of Africa region.
78
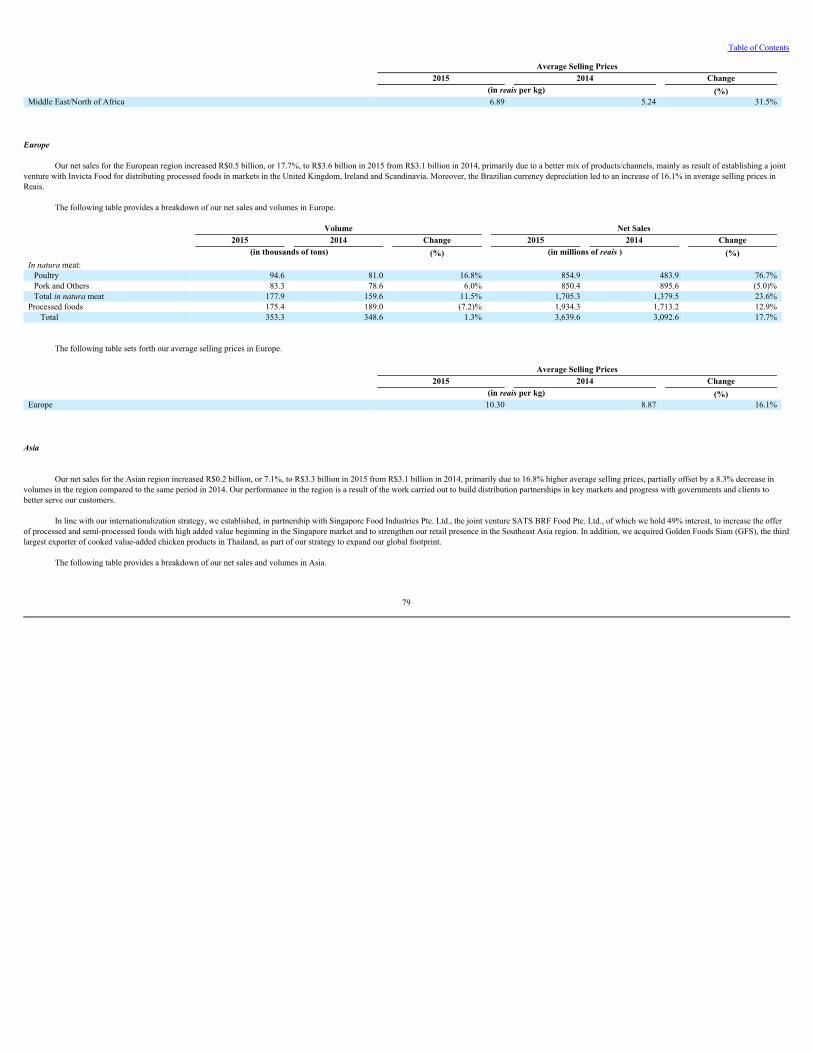
Table of Contents
Average Selling Prices2015 2014 Change
(in reais per kg) (%)Middle East/North of Africa 6.89 5.24 31.5%
Europe
Our net sales for the European region increased R$0.5 billion, or 17.7%, to R$3.6 billion in 2015 from R$3.1 billion in 2014, primarily due to a better mix of products/channels, mainly as result of establishing a jointventure with Invicta Food for distributing processed foods in markets in the United Kingdom, Ireland and Scandinavia. Moreover, the Brazilian currency depreciation led to an increase of 16.1% in average selling prices inReais.
The following table provides a breakdown of our net sales and volumes in Europe.
Volume Net Sales 2015 2014 Change 2015 2014 Change (in thousands of tons) (%) (in millions of reais ) (%)Innaturameat:
Poultry 94.6 81.0 16.8% 854.9 483.9 76.7%Pork and Others 83.3 78.6 6.0% 850.4 895.6 (5.0)%Total innaturameat 177.9 159.6 11.5% 1,705.3 1,379.5 23.6%
Processed foods 175.4 189.0 (7.2)% 1,934.3 1,713.2 12.9%Total 353.3 348.6 1.3% 3,639.6 3,092.6 17.7%
The following table sets forth our average selling prices in Europe.
Average Selling Prices2015 2014 Change
(in reais per kg) (%)Europe 10.30 8.87 16.1%
Asia
Our net sales for the Asian region increased R$0.2 billion, or 7.1%, to R$3.3 billion in 2015 from R$3.1 billion in 2014, primarily due to 16.8% higher average selling prices, partially offset by a 8.3% decrease involumes in the region compared to the same period in 2014. Our performance in the region is a result of the work carried out to build distribution partnerships in key markets and progress with governments and clients tobetter serve our customers.
In line with our internationalization strategy, we established, in partnership with Singapore Food Industries Pte. Ltd., the joint venture SATS BRF Food Pte. Ltd., of which we hold 49% interest, to increase the offerof processed and semi-processed foods with high added value beginning in the Singapore market and to strengthen our retail presence in the Southeast Asia region. In addition, we acquired Golden Foods Siam (GFS), the thirdlargest exporter of cooked value-added chicken products in Thailand, as part of our strategy to expand our global footprint.
The following table provides a breakdown of our net sales and volumes in Asia.
79
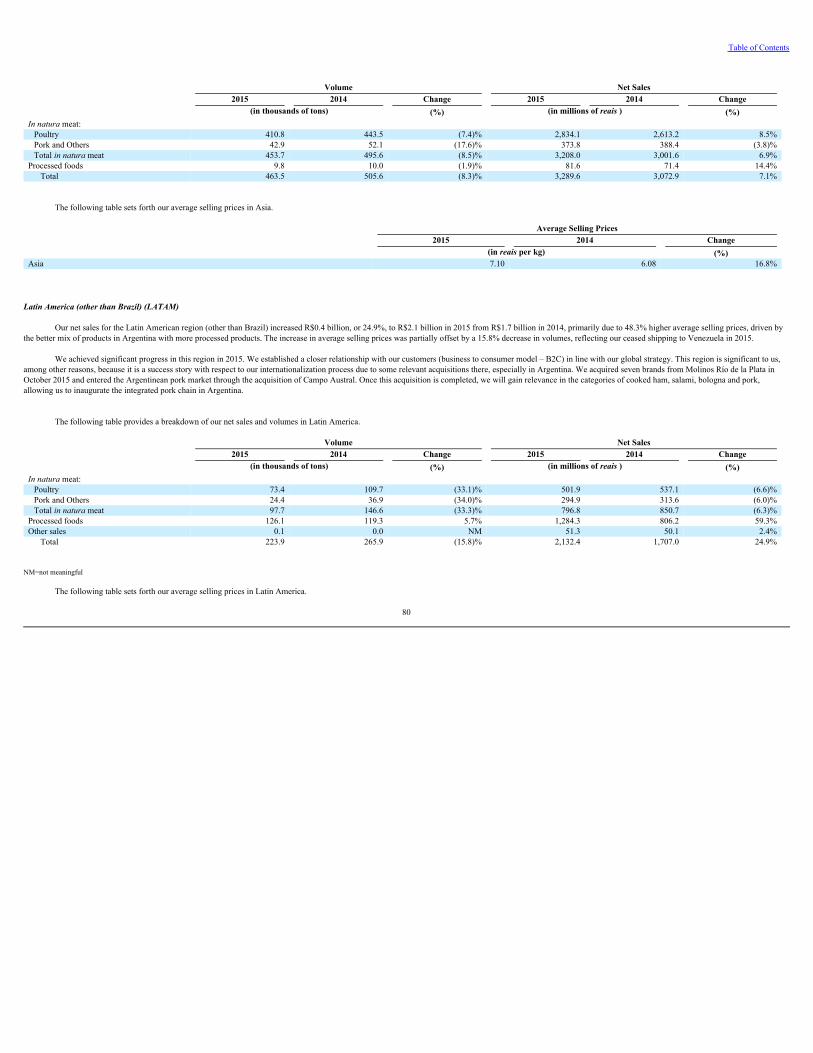
Table of Contents
Volume Net Sales 2015 2014 Change 2015 2014 Change (in thousands of tons) (%) (in millions of reais ) (%)Innaturameat:
Poultry 410.8 443.5 (7.4)% 2,834.1 2,613.2 8.5%Pork and Others 42.9 52.1 (17.6)% 373.8 388.4 (3.8)%Total innaturameat 453.7 495.6 (8.5)% 3,208.0 3,001.6 6.9%
Processed foods 9.8 10.0 (1.9)% 81.6 71.4 14.4%Total 463.5 505.6 (8.3)% 3,289.6 3,072.9 7.1%
The following table sets forth our average selling prices in Asia.
Average Selling Prices2015 2014 Change
(in reais per kg) (%)Asia 7.10 6.08 16.8%
Latin America (other than Brazil) (LATAM) Our net sales for the Latin American region (other than Brazil) increased R$0.4 billion, or 24.9%, to R$2.1 billion in 2015 from R$1.7 billion in 2014, primarily due to 48.3% higher average selling prices, driven by
the better mix of products in Argentina with more processed products. The increase in average selling prices was partially offset by a 15.8% decrease in volumes, reflecting our ceased shipping to Venezuela in 2015. We achieved significant progress in this region in 2015. We established a closer relationship with our customers (business to consumer model – B2C) in line with our global strategy. This region is significant to us,
among other reasons, because it is a success story with respect to our internationalization process due to some relevant acquisitions there, especially in Argentina. We acquired seven brands from Molinos Río de la Plata inOctober 2015 and entered the Argentinean pork market through the acquisition of Campo Austral. Once this acquisition is completed, we will gain relevance in the categories of cooked ham, salami, bologna and pork,allowing us to inaugurate the integrated pork chain in Argentina.
The following table provides a breakdown of our net sales and volumes in Latin America.
Volume Net Sales 2015 2014 Change 2015 2014 Change (in thousands of tons) (%) (in millions of reais ) (%)Innaturameat:
Poultry 73.4 109.7 (33.1)% 501.9 537.1 (6.6)%Pork and Others 24.4 36.9 (34.0)% 294.9 313.6 (6.0)%Total innaturameat 97.7 146.6 (33.3)% 796.8 850.7 (6.3)%
Processed foods 126.1 119.3 5.7% 1,284.3 806.2 59.3%Other sales 0.1 0.0 NM 51.3 50.1 2.4%
Total 223.9 265.9 (15.8)% 2,132.4 1,707.0 24.9%
NM=not meaningful
The following table sets forth our average selling prices in Latin America.
80
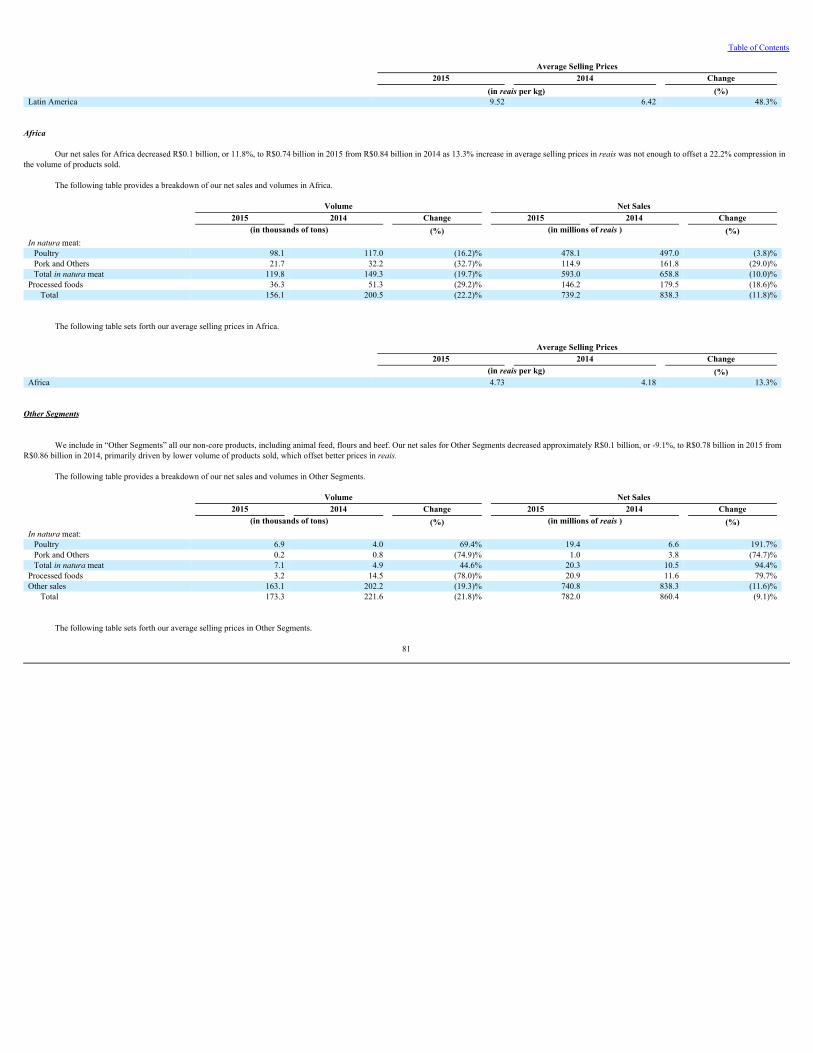
Table of Contents
Average Selling Prices2015 2014 Change
(in reais per kg) (%)Latin America 9.52 6.42 48.3%
Africa Our net sales for Africa decreased R$0.1 billion, or 11.8%, to R$0.74 billion in 2015 from R$0.84 billion in 2014 as 13.3% increase in average selling prices in reaiswas not enough to offset a 22.2% compression in
the volume of products sold.
The following table provides a breakdown of our net sales and volumes in Africa.
Volume Net Sales 2015 2014 Change 2015 2014 Change (in thousands of tons) (%) (in millions of reais ) (%)Innaturameat:
Poultry 98.1 117.0 (16.2)% 478.1 497.0 (3.8)%Pork and Others 21.7 32.2 (32.7)% 114.9 161.8 (29.0)%Total innaturameat 119.8 149.3 (19.7)% 593.0 658.8 (10.0)%
Processed foods 36.3 51.3 (29.2)% 146.2 179.5 (18.6)%Total 156.1 200.5 (22.2)% 739.2 838.3 (11.8)%
The following table sets forth our average selling prices in Africa.
Average Selling Prices2015 2014 Change
(in reais per kg) (%)Africa 4.73 4.18 13.3%
Other Segments
We include in “Other Segments” all our non-core products, including animal feed, flours and beef. Our net sales for Other Segments decreased approximately R$0.1 billion, or -9.1%, to R$0.78 billion in 2015 from
R$0.86 billion in 2014, primarily driven by lower volume of products sold, which offset better prices in reais. The following table provides a breakdown of our net sales and volumes in Other Segments.
Volume Net Sales 2015 2014 Change 2015 2014 Change (in thousands of tons) (%) (in millions of reais ) (%)Innaturameat:
Poultry 6.9 4.0 69.4% 19.4 6.6 191.7%Pork and Others 0.2 0.8 (74.9)% 1.0 3.8 (74.7)%Total innaturameat 7.1 4.9 44.6% 20.3 10.5 94.4%
Processed foods 3.2 14.5 (78.0)% 20.9 11.6 79.7%Other sales 163.1 202.2 (19.3)% 740.8 838.3 (11.6)%
Total 173.3 221.6 (21.8)% 782.0 860.4 (9.1)%
The following table sets forth our average selling prices in Other Segments.
81
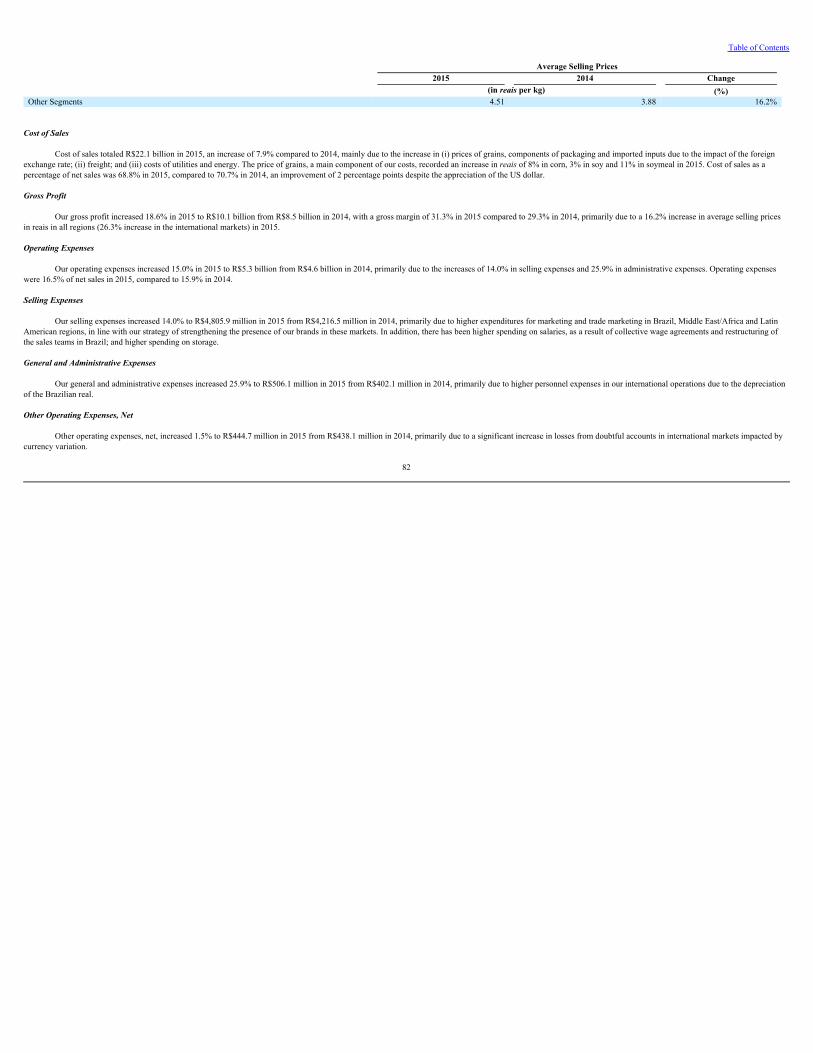
Table of Contents
Average Selling Prices2015 2014 Change
(in reais per kg) (%)Other Segments 4.51 3.88 16.2%
Cost of Sales
Cost of sales totaled R$22.1 billion in 2015, an increase of 7.9% compared to 2014, mainly due to the increase in (i) prices of grains, components of packaging and imported inputs due to the impact of the foreignexchange rate; (ii) freight; and (iii) costs of utilities and energy. The price of grains, a main component of our costs, recorded an increase in reaisof 8% in corn, 3% in soy and 11% in soymeal in 2015. Cost of sales as apercentage of net sales was 68.8% in 2015, compared to 70.7% in 2014, an improvement of 2 percentage points despite the appreciation of the US dollar.
Gross Profit
Our gross profit increased 18.6% in 2015 to R$10.1 billion from R$8.5 billion in 2014, with a gross margin of 31.3% in 2015 compared to 29.3% in 2014, primarily due to a 16.2% increase in average selling pricesin reais in all regions (26.3% increase in the international markets) in 2015.
Operating Expenses
Our operating expenses increased 15.0% in 2015 to R$5.3 billion from R$4.6 billion in 2014, primarily due to the increases of 14.0% in selling expenses and 25.9% in administrative expenses. Operating expenseswere 16.5% of net sales in 2015, compared to 15.9% in 2014.
Selling Expenses
Our selling expenses increased 14.0% to R$4,805.9 million in 2015 from R$4,216.5 million in 2014, primarily due to higher expenditures for marketing and trade marketing in Brazil, Middle East/Africa and LatinAmerican regions, in line with our strategy of strengthening the presence of our brands in these markets. In addition, there has been higher spending on salaries, as a result of collective wage agreements and restructuring ofthe sales teams in Brazil; and higher spending on storage.
General and Administrative Expenses
Our general and administrative expenses increased 25.9% to R$506.1 million in 2015 from R$402.1 million in 2014, primarily due to higher personnel expenses in our international operations due to the depreciationof the Brazilian real.
Other Operating Expenses, Net
Other operating expenses, net, increased 1.5% to R$444.7 million in 2015 from R$438.1 million in 2014, primarily due to a significant increase in losses from doubtful accounts in international markets impacted bycurrency variation.
82
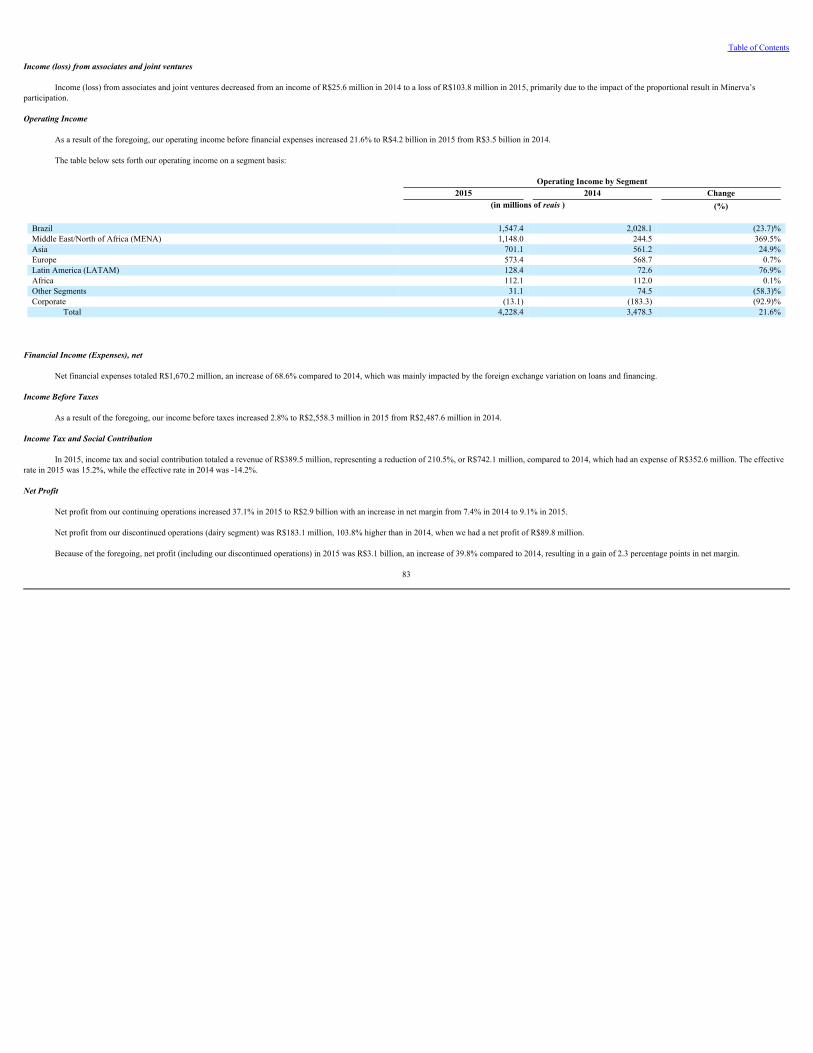
Table of Contents
Income (loss) from associates and joint ventures
Income (loss) from associates and joint ventures decreased from an income of R$25.6 million in 2014 to a loss of R$103.8 million in 2015, primarily due to the impact of the proportional result in Minerva’sparticipation.
Operating Income
As a result of the foregoing, our operating income before financial expenses increased 21.6% to R$4.2 billion in 2015 from R$3.5 billion in 2014.
The table below sets forth our operating income on a segment basis:
Operating Income by Segment2015 2014 Change
(in millions of reais ) (%)
Brazil 1,547.4 2,028.1 (23.7)%Middle East/North of Africa (MENA) 1,148.0 244.5 369.5%Asia 701.1 561.2 24.9%Europe 573.4 568.7 0.7%Latin America (LATAM) 128.4 72.6 76.9%Africa 112.1 112.0 0.1%Other Segments 31.1 74.5 (58.3)%Corporate (13.1) (183.3) (92.9)%
Total 4,228.4 3,478.3 21.6%
Financial Income (Expenses), net
Net financial expenses totaled R$1,670.2 million, an increase of 68.6% compared to 2014, which was mainly impacted by the foreign exchange variation on loans and financing.
Income Before Taxes
As a result of the foregoing, our income before taxes increased 2.8% to R$2,558.3 million in 2015 from R$2,487.6 million in 2014.
Income Tax and Social Contribution
In 2015, income tax and social contribution totaled a revenue of R$389.5 million, representing a reduction of 210.5%, or R$742.1 million, compared to 2014, which had an expense of R$352.6 million. The effectiverate in 2015 was 15.2%, while the effective rate in 2014 was -14.2%.
Net Profit
Net profit from our continuing operations increased 37.1% in 2015 to R$2.9 billion with an increase in net margin from 7.4% in 2014 to 9.1% in 2015.
Net profit from our discontinued operations (dairy segment) was R$183.1 million, 103.8% higher than in 2014, when we had a net profit of R$89.8 million.
Because of the foregoing, net profit (including our discontinued operations) in 2015 was R$3.1 billion, an increase of 39.8% compared to 2014, resulting in a gain of 2.3 percentage points in net margin.
83
Table of Contents
Critical Accounting Policies and Estimates
We have prepared our consolidated financial statements included in this Annual Report on Form 20-F in accordance with IFRS, as issued by the IASB.
The preparation of these financial statements required management to make estimates and assumptions that affected the reported amounts of assets and liabilities and the disclosure of contingent assets and liabilitiesat the date of the financial statements and the reported amounts of revenues and expenses during the reporting period. Management evaluates its estimates and judgments on an ongoing basis and bases its estimates andjudgments on historical experience and on various other factors that it believes to be reasonable under the circumstances. Actual results may differ from these estimates under different assumptions or conditions.
The following is a description of the critical accounting policies, estimates or judgments that are important to the presentation of our consolidated financial statements.
Revenue Recognition and Sales Returns
We recognize revenue in accordance with the accrual basis of accounting when all the following conditions are met: (i) the sales value is reliably measurable and when we no longer have control over the goods sold,(ii) the costs incurred or to be incurred due to the transaction can be reliably measured, and (iii) it is probable that economic benefits will be received by us and the risks and benefits were fully transferred to the purchaser.
During the holiday season, when volumes of some of our products increase, we offer certain large customers the ability to return products they are unable to sell. We monitor these product returns and record aprovision for the estimated amount of such future returns, based on historical experience and any notification received of pending returns. While we believe that we make reliable estimates for these matters, fluctuations indemand could cause our estimates and actual amounts to differ and could have a negative effect on our net sales in future periods.
Allowances for Doubtful Accounts
We maintain allowances for doubtful accounts for estimated losses from the inability of our customers to make required payments. In the event of default, collection attempts are made, which include direct contactwith customers and collection through third parties. Should these efforts prove unsuccessful, the amount credited to the estimated loss on doubtful accounts is generally reversed against a permanent write-off of the accountreceivable. If the financial condition of our customers were to deteriorate, we could be required to increase our allowances for doubtful accounts, which would be charged to our statements of income.
Accounting for Business Combinations
Business combinations are accounted for using the purchase method. The cost of an acquisition is the sum of the consideration paid, evaluated based on the fair value at the acquisition date, and the amount of anynon-controlling interests in the acquiree. For each business combination, we recognize any non-controlling interest in the acquiree either at fair value or at the non-controlling interest’s proportionate share of the acquirer’s netassets. Costs directly attributable to the acquisition are accounted for as an expense when incurred.
When acquiring a business, our management evaluates the assets acquired and the liabilities assumed in order to classify and allocate them pursuant to the terms of the agreement, economic circumstances and theconditions at the acquisition date.
Goodwill is initially measured as the excess of the consideration paid over the fair value of the net assets acquired (assets and liabilities assumed, net).
84
Table of Contents
After initial recognition, goodwill is measured at cost, net of any accumulated impairment losses. For purposes of impairment testing, the goodwill is allocated to each of our cash generating units expected to benefitfrom the acquisition.
Goodwill
As mentioned above, goodwill is initially measured as the excess of the consideration paid over the fair value of the net assets acquired (net assets identified and liabilities assumed). If the consideration is lower thanthe fair value of the net assets acquired, the difference should be recognized as a gain in the statement of income.
Under IFRS, goodwill is not amortized and is subject to an annual impairment test. The amount of impairment, if any, is measured based on discounted future free cash flow projections. We identify our reportingunits and determine the carrying value of each reporting unit by assigning the assets and liabilities, including the existing goodwill and intangible assets. We then determine the fair value of each reporting unit by expecteddiscounted operating cash flows generated by the reporting unit. If the carrying amount of a reporting unit exceeds its fair value, an impairment loss is recognized first to goodwill until it is reduced to zero and thenproportionally to other long-lived assets.
The use of different assumptions for valuation purposes, including estimates of future cash flows and discount rates, could have resulted in different estimates.
The carrying amount of goodwill and the key assumptions used in the annual impairment test are disclosed in note 19 of our consolidated financial statements.
Depreciation, Depletion, Amortization and Impairment
We recognize expenses related to the depreciation of our property, plant and equipment, the depletion of our forests and the amortization of software, patents, customers, suppliers and outgrowers relationships,import quotas and non-compete agreements. The rates of depreciation, depletion and amortization are based on our estimates of the useful lives of the assets over the periods during which these assets can be expected toprovide benefits to us. In addition, we monitor the use of our property, plant and equipment and intangibles to determine whether any impairment of those assets should be recorded. The determination of such impairmentinvolves judgments and estimates as to whether the asset is providing an adequate return in relation to its book value. While we believe that we make reliable estimates for these matters, the uncertainty inherent to thisestimate could lead to results requiring a material adjustment to the carrying amount of the assets in future periods.
Contingencies
We establish provisions when we have a present obligation, formalized or not, as a result of a past event, it is probable that an outflow of resources will be required to settle the obligation and its amount can bereliably estimated.
We are party to various lawsuits, including, tax, labor and civil claims. The assessment of the likelihood of an unfavorable outcome in these lawsuits includes the analysis of the available evidence, the hierarchy ofthe laws, available former court decisions, as well as the most recent court decisions and their importance of the legal system, as well as the opinion of external legal counsel. We review and adjust the provisions to reflectchanges in the circumstances, such as the applicable statute of limitation, conclusions of tax inspections or additional exposures identified based on new claims or court decisions.
A contingent liability recognized in a business combination is initially measured at fair value and subsequently measured at the higher of:
the amount that would be recognized in accordance with the accounting policy for the provisions above (IAS 37, Provisions,ContingentLiabilitiesandContingentAssets); or
85
Table of Contents
the amount initially recognized less, if appropriate, cumulative amortization recognized in accordance with the revenue recognition policy (IAS 18, Revenue).
As a result of the business combinations with Sadia, Avex and Dánica, we recognized contingent liabilities related to tax, civil and labor claims.
Derivative Instruments
We use derivative instruments that are actively traded on organized markets, and we determine their fair value based on the amounts quoted in the market at the balance sheet date. These financial instruments aredesignated at initial recognition, classified as other financial assets and/or liabilities, with a corresponding entry in the statement of income within “Finance income or cost” or “Cash flow hedge,” which are recorded inshareholders’ equity net of taxes.
These derivatives are used to hedge exposures to risks or change the characteristics of financial assets and liabilities, unrecognized firm commitments, highly probable transactions or net investments in transactionsabroad, and are (1) highly correlated as regards changes in their fair value in relation to the fair value of the hedged item, both at inception and throughout the life of the contract (effectiveness from 80.0% to 125.0%); (2)supported by documents that identify the transaction, the hedged risk, the risk management process and the methodology used to assess effectiveness; and (3) considered as effective in the mitigation of the risk associated withthe hedged exposure. Their accounting follows IAS 39, FinancialInstruments: RecognitionandMeasurement, which allows the application of the hedge accounting methodology with the effects of measurement at fairvalue recognized in equity and their realization in the statement of income under a caption corresponding to the hedged item.
Inventory
We record inventories at average acquisition or formation cost, not exceeding market value. The cost of finished products includes raw materials, labor, cost of production, transport and storage, which are related toall process needed to make the products ready for sale. Provisions for obsolescence, adjustments to net realizable value, impaired items and slow-moving inventories are recorded when necessary. Usual production losses arerecorded and are an integral part of the production cost of the respective month, whereas unusual losses, if any, are recorded as other operating expense.
Income Tax and Social Contribution
In Brazil, we are subject to income tax ( ImpostodeRendaPessoaJurídica, or “IRPJ”) and social contribution ( ContribuiçãoSocialsobreoLucroLíquido, or “CSLL”), which are calculated monthly on taxableincome, at the rate of 15% plus 10% surtax for IRPJ and of 9% for CSLL, after considering the offset of tax loss carryforwards, up to the limit of 30% of annual taxable income.
The income from foreign subsidiaries is subject to taxation pursuant to the local tax rates and legislation. In Brazil, this income is taxed according to the Brazilian tax rules, respecting the tax treaty signed by eachcountry with Brazil in order to avoid double taxation.
Deferred taxes are recorded on IRPJ and CSLL tax losses, assets and liabilities and temporary differences between the tax basis and the carrying amount of assets and liabilities are classified as non-current assets andliabilities, as required by IAS 01. When the Company’s analysis indicates that the realization of these credits is not probable, a valuation allowance is recorded.
Deferred tax assets and liabilities are offset if a legally enforceable right exists to set off current tax assets against current tax liabilities and they relate to income taxes levied by the same tax authority on the sametaxable entity.
Deferred tax assets and liabilities must be measured by rates that are expected to be applicable for the period when the assets are realized and liabilities are settled.
86
Table of Contents
Marketable Securities
Marketable securities are financial assets that consist of public and private fixed-income securities, classified and recorded based on the purpose for which they were acquired, in accordance with the followingcategories:
Tradingsecurities— acquired for sale or repurchase in the short term, recorded at fair value with variations directly recorded in the statement of income for the year within interest income or expense; Heldtomaturity— when the Company has the intention and ability to hold them up to maturity, investments are recorded at amortized cost, plus interest, monetary and exchange rate changes, whenapplicable, and recognized in the statement of income when incurred, within interest income or expense; and Availableforsale— this category is for the remaining securities that are not classified in any of the categories above, which are measured at fair value, with changes to fair value recorded in othercomprehensive income while the asset is not realized, net of taxes. Interest and monetary and exchange variation, when applicable, are recognized in the statement of income when incurred within interestincome or expense.
Recently Issued and Not Yet Adopted Accounting Pronouncements Under IFRS
The interpretations and amendments to the rules below were published by IASB. We have not yet adopted these rules. IFRS 15 – Revenue from Contracts with Customers
In May 2014, the IASB issued IFRS 15 that establishes a five-step model to determine the revenue to be recognized in contracts with customers. In accordance with this standard, revenues are recognized based on anamount that reflects the consideration that an entity expects to be entitled to for transferring goods or providing services to a customer. The guidelines of IFRS 15 consider a more structured approach to measure and recognizerevenue.
This standard is applicable to all entities and will replace all current requirements related to revenue recognition. On December 20, 2016, CVM issued the Deliberation CVM Instruction no. 762/16, corresponding tothis IFRS. The adoption of IFRS 15 is mandatory to periods beginning on January 1, 2018 onwards.
We are in the process of engaging an advisor for the qualitative assessment of the impacts of adopting this standard in our consolidated financial statements, which will involve (i) developing an understanding ofcurrent policies and processes (ii) identifying the necessary changes to be implemented in the information technology system, processes and internal controls arising from the adoption of this standard and (iii) individualreview of relevant contracts. It is expected that such assessment will be concluded by the end of the second quarter of 2017.
In a preliminary assessment, we believe that the adoption of this standard will affect amounts and the manner which rebates, discounts and returns will be recognized, and it will also result in further disclosures andremodeling of the internal controls environment. Due to the high volume and complexity of transactions, it is not currently possible to measure with reasonable assurance the quantitative impacts resulting from the adoption ofsuch standard. IFRS 9 – Financial Instruments
In July 2014, the IASB issued the final version of IFRS 9 – Financial Instruments, which reflects all phases of financial instruments project and replaces IAS 39 – Financial Instruments: Recognizing andMeasurement and all previous versions of IFRS 9. The standard introduces new guidance about classification and measurement, impairment loss and hedge accounting. Early adoption is not permitted and is effective fromperiods beginning on January 1, 2018. Retrospective adoption is mandatory; however, the presentation of comparative information is not required. Early adoption of previous versions of IFRS 9, issued in 2009, 2010 and 2013is permitted if the initial adoption date is prior to February 1, 2015. We are analyzing the content and the impacts of adoption of this standard in its consolidated financial statements.
87
Table of Contents
IFRS 16 – Leases
In January 2016, the IASB issued the final version of IFRS 16 – Leases, which supersedes IAS 17 – Leases and will be applicable to periods beginning on January 1, 2019. Early adoption will be permitted for entitiesthat also apply IFRS 15 – Revenue from Contracts with Customers. The adoption of this standard will affect mainly property, plant and equipment and financial liabilities, as the treatment between financial and operationallease will no longer exist and all leases will be treated similarly as a financial lease as per IAS 17. We are analyzing the impact of adoption of this standard in our consolidated financial statements. IAS 12 – Income Taxes
In January 2016, the IASB issued a review of the IAS 12 – Income Taxes, aiming to clarify how to account for deferred tax assets related to debt instruments measured at fair value. IAS 12 also provides requirementsrelated to the recognition and measurement of current and deferred tax assets and liabilities. The effectiveness of this pronouncement applies to fiscal years beginning on or after January 1, 2017, and early adoption ispermitted. We are analyzing the content and the impacts of adoption of this standard in our consolidated financial statements.
B. Liquidity and Capital Resources
As of December 31, 2016, we held R$6,356.9 million in cash and cash equivalents. Of that amount, R$2,448.6 million, or 38.5%, was held in jurisdictions outside Brazil. We regularly review the amount of cash andcash equivalents held outside of Brazil to determine the amounts necessary to fund the current operations of our foreign operations and their growth initiatives and amounts needed to service our Brazilian indebtedness andrelated obligations. If these amounts are moved out of these jurisdictions or repatriated to Brazil, we may be subject to Brazilian tax upon repatriation.
Our main cash requirements are the servicing of our debt, capital expenditures relating to expansion programs and acquisitions, and the payment of dividends and interest on shareholders’ equity. Our primary cashsources have been cash flow from operating activities, loans and other financings, offerings of our common shares and sales of marketable securities. We believe that these sources of cash will be sufficient to cover ourworking capital needs in the ordinary course of our business.
We also have a revolving credit facility, with a committed maximum capacity of US$1.0 billion to provide additional liquidity for working capital needs. As of December 31, 2016, we had not with withdrawn anyamouts under this facility.
Cash Flows from Continuing Operations
Unless stated otherwise, the comparisons below do not consider the cash flows from our discontinued operations (dairy segment).
Cash Flows from Operating Activities
We recorded net cash flows provided by operating activities of R$1,821.2 million in 2016, compared to net cash flows from operating activities of R$4,134.2 million in 2015. Our 2016 operating cash flow reflectsloss of R$372.4 million, net non-cash adjustments of R$1,581.2 million and net changes in operating assets and liabilities of R$612.4 million. The net changes in operating assets and liabilities included changes in investmentsof trading securities, net of redemptions, of R$108.1 million, trade accounts payable of R$848.5 million, supply chain finance of R$161.0 million and biological assets of R$297.2 million, partially offset by interests paid ofR$851.3 million, provisions for tax, civil and labor risks of R$401.0 million, trade accounts receivable of R$1,246.9 million, inventories of R$449.9 million, other financial assets and liabilities of R$580.2 million and otheroperating assets and liabilities of R$519.4 million, net of interest on shareholders’ equity received and payment of income tax and social contribution.
88
Table of Contents
We recorded net cash flows provided by operating activities of R$4,134.2 million in 2015, compared to net cash flows from operating activities of R$4,841.6 million in 2014. Our 2015 operating cash flow reflectsnet income of R$2,928.1 million, net non-cash adjustments of R$4,222.1 million and net changes in operating assets and liabilities of R$3,019.3 million. The net changes in operating assets and liabilities included changes ininvestments of trading securities, net of redemptions, of R$123.7 million, trade accounts payable of R$882.2 million, supply chain finance of R$719.5 million and biological assets of R$199.3 million, partially offset byinterests paid of R$693.9 million, provisions for tax, civil and labor risks of R$194.4 million, trade accounts receivable of R$1,112.5 million, inventories of R$1,066.2 million, other financial assets and liabilities of R$687.4million and other operating assets and liabilities of R$553.5 million.
Cash Flows Used in Investing Activities
We used R$4,159.9 million in cash in investing activities in 2016, compared to R$1,674.0 million in 2015. In 2016, our cash used in investing activities consisted primarily of R$1,258.0 million in restricted cash,capital expenditures in property, plant and equipment in the amount of R$1,859.5 million and the acquisition and formation of breeding stock in the amount of R$784.2 million.
We used R$1,674.0 million in cash in investing activities in 2015, compared to R$1,861.1 million in 2014. In 2015, our cash used in investing activities consisted primarily of R$1,710.9 million in restricted cash,capital expenditures in property, plant and equipment in the amount of R$1,296.7 million and the acquisition and formation of breeding stock in the amount of R$589.4 million, which were partially offset by a cash receipt ofR$1,957.2 million related to the sale of dairy segment (net of cash transferred).
Cash Flows Provided by (Used in) Financing Activities
We recorded cash flows provided by financing activities of R$3,720.7 million in 2016, compared to cash flows used in financing activities of R$4,313.9 million in 2015. In 2016, we repaid debt in the amount ofR$3,512.3 million, partially offset by proceeds from the issuance of debt in the amount of R$8,946.2 million. We acquired shares in the amount of R$543.3 to increase our treasury shares for compliance with the provisions ofour stock options plans. In addition, in 2016, we paid R$1,176.3 million related to interest on shareholders’ equity and dividends.
We recorded cash flows used in financing activities of R$4,313.9 million in 2015, compared to cash flows provided by financing activities of R$568.1 million in 2014. In 2015, we repaid debt in the amount ofR$6,031.5 million, partially offset by proceeds from the issuance of debt in the amount of R$6,290.1 million. We acquired shares in the amount of R$3,765.8 to increase our treasury shares for compliance with the provisionsof our stock options plans. In addition, in 2015, we paid R$889.1 million related to interest on shareholders’ equity and dividends.
Dividends and Interest on Shareholders’ Equity
An extraordinary meeting of the Board of Directors held on June 30, 2016 approved the distribution of R$513.2 million allocated to the payment of interest on shareholders’ equity. Payments were made on August15, 2016.
An extraordinary meeting of the Board of Directors held on February 25, 2016 approved the distribution of additional dividends available in the profit reserve in the total amount of R$98.2 million. Payments weremade on April 1, 2016.
An extraordinary meeting of the Board of Directors held on December 17, 2015 approved the distribution of R$473.4 million allocated to the payment of interest on shareholders’ equity and R$91.4 million for anadditional distribution in the form of dividends, totaling R$564.8 million. Payments were made on February 12, 2016. (See Note 28.2 to the consolidated financial statements included herein elsewhere.)
89
Table of Contents
We distributed a total of R$1,176.3 million to shareholders in 2016, of which R$986.6 million in the form of interest on shareholders’ equity and R$189.6 million in the form of dividends.
Debt
We use the net proceeds of our indebtedness primarily for capital expenditures, liquidity and purchases of raw materials. The following table sets forth our indebtedness (according to the type of debt and currency)net of cash, cash equivalents and marketable securities for the periods indicated.
As of December 31, 2016 As of December 31,
Short-term Long-term 2016 2015
(in millions of reais , except where indicated)Total debt 3,245.0 15,717.4 18,962.4 (15,179.3)Other financial assets and liabilities, net (331.5) (331.5) (537.2)Cash, cash equivalents and marketable securities: Local currency 4,520.9 807.0 5,327.9 1,710.6Foreign currency 2,676.6 148.3 2,824.9 6,669.2Total 7,197.5 955.3 8,152.7 8,379.7Net debt 3,620.9 14,762.1 11,141.2 (7,336.8)Exchange rate exposure (in millions of US$)(1) US$(183.6) US$(39.8)
(1) See Note 4.1.d to our consolidated financial statements, which includes a table showing the calculation of our exchange rate exposure on the dates presented/
We have made a strategic decision to increase our cash, cash equivalents and marketable securities to provide flexibility in responding to adverse events in our markets.
The table below provides a further breakdown of our indebtedness by the type of debt.
Short-Term Debt Long-Term Debt Total Debt as of December 31, As of December 31, 2016 2016 2015 (in millions of reais )Development bank credit lines 381.3 499.7 881.0 726.3Other secured debt 32.3 97.3 129.6 159.7Export credit facilities 72.3 1,850.0 1,922.3 -Bonds 4.1 498.8 502.9 502.0Working capital facilities 1,326.1 - 1,326.1 1,169.6PESA loan facility 3.5 248.0 251.6 234.8Agribusiness Receivables Certificate 168.1 3,462.0 3,630.1 1,025.3Other 0.1 - 0.1 1.9Local currency 1,987.9 6,655.7 8,643.7 3,819.6 Export credit facilities 312.2 998.4 1,310.6 2,152.3Bonds 489.2 8,004.4 8,493.7 8,787.8Development bank credit lines 5.9 3.0 8.9 24.2Other secured debt 0.8 - 0.8 3.5Advances on foreign exchange rate contracts 212.8 - 212.8 391.1Working capital facilities 236.1 55.8 291.9 0.8Foreign currency 1,257.1 9,061.6 10,318.7 11,359.7 Total: 3,245.0 15,717.4 18,962.4 15,179.3
90
Table of Contents
The maturity schedule of our indebtedness is as follows:
As of December 31, 2016
(in millions of reais )Current (through December 31, 2017) 3,245.02018 2,674.4
2019 3,188.7
2020 1,412.7
2021 to 2026 8,441.6
Total 18,962.4
Our principal debt instruments as of December 31, 2016 are described below. For more information on these facilities, including information on average interest rates and weighted average maturities, see Note 20 toour audited consolidated financial statements.
Local Currency Debt
DevelopmentBankCreditLines
BNDESFINEMFacilities. We have a number of outstanding obligations with BNDES, including loans under its FINEM program in the amount of R$762.4 million as of December 31, 2016. The loans from BNDESwere entered into to finance purchases of machinery and equipment and construction, improvement or expansion of our production facilities. Principal and interest on the loans are generally payable monthly, with remainingmaturity dates varying from 2017 through 2020 The principal amount of the loans is denominated in reais, the majority of which bears interest at the TJLP rate plus a margin. These loans are included in the line“Development bank credit lines—Local currency” of the table above.
FINEPFinancing. We obtained certain financing from the Brazilian Financing Agenct for Studies and Projects ( FinanciadoradeEstudoseProjetos, or “FINEP”), a public financing company under the BrazilianMinistry of Science, Technology and Innovation, with maturity dates between 2017 and 2019. The outstanding debt under this financing was R$118.7 million at December 31, 2016 . We obtained FINEP credit lines withreduced rates for projects relating to research, development and innovation. These loans are included in the line “Development bank credit lines—Local currency” of the table above.
ExportCreditFacilities
ExportCreditNotes. We have export credit notes in local currency, totaling R$1,922.3 million as of December 31, 2016. These notes bear interest at floating rates (CDI), with maturity date in 2019. These credit lines areincluded in the line “Local currency —Export credit facilities” in the table above.
WorkingCapitalFacilities
RuralCreditFinancing. We have short-term rural credit loans in the amount of R$1,326.1 million as of December 31, 2016 with several commercial banks under a Brazilian federal government program that offersfavorable interest rates of 8.9% per year , A s an incentive to invest in rural activities. We generally use the proceeds of these loans for working capital. These credit lines are included in the line “Working capital facilities—Local currency” in the table above.
OtherSecuredDebt
91
Table of Contents
IndustrialCreditNotes. We had outstanding industrial credit notes ( CédulasdeCréditoIndustrial), receiving credits from the Constitutional Fund for the Financing of the Northeast ( FundoConstitucionaldeFinanciamentodoNordeste, or “FNE”), in the amount of R$129.6 million at a rate of 8.5% per year as of December 31, 2016. The notes have maturity dates from 2017 to 2021. These titles are secured by liens on machineryand equipment and real estate mortgages. BRF S.A. guarantees the industrial credit notes with respect to the FNE in an amount in excess of the principal amount of the notes. These loans are included in the line “Othersecured debt —Local currency” in the table above.
PESALoanFacility
PESA. We have a loan facility obtained through the Special Sanitation Program for Agroindustrial Assets ( ProgramaEspecialdeSaneamentodeAtivos, or “PESA”) for an outstanding amount of R$251.0 millionas of December 31, 2016, subject to the variation of the IGP-M plus interest of 4.9% per year, secured by endorsements and pledges of public debt securities.
TaxIncentiveFinancingPrograms
StateTaxIncentiveFinancingPrograms. We also had R$0.08 million outstanding as of December 31, 2016 under credit facilities offered by the State of Goiás under tax incentive programs to promote investmentsin the states. Under these programs, we are granted credit proportional to the payment of ICMS tax generated by investments in the construction or expansion of manufacturing facilities in these states. The credit facilitieshave a 20-year term and fixed or variable interest rates based on the IGP-M plus a margin. This credit line is included in the line “Other—Local currency” in the table above.
AgribusinessReceivablesCertificate
AgribusinessReceivablesCertificate(“CRA”).On September 29, 2015, BRF concluded the CRA issuance related to the public distribution of the 1 st 3 rd Series issuance by Octante Securitizadora SA in the amountof R$1.0 billion, net of interest, which will mature on September 29, 2018 and were issued with a coupon of 96.9% per year of the CDI rate, payable every nine months. The CRAs are derived from our exports contracted withBRF Global GmbH, which have been transferred and/or pledged to the Securitization Company.
On April 19, 2016, BRF concluded the CRA issuance related to the public distribution of the 1 st series of the 9 th issuance by the Securitization Company, in the amount of R$1.0 billion net of interest, which will matureon April 19, 2019, and were issued with a coupon of 96.50% of the CDI rate, payable every nine months. The CRAs are derived from our exports contracted with BRF Global GmbH and were transferred and/or pledged to theSecuritization Company.
On December 16, 2016, BRF concluded the CRA issuance related to the public offer of distribution of the 1st and 2nd Series of the 1st Issue of Vert Companhia Securitizadora, in the amount of R$1.5 billion, net ofinterest. The CRAs of the 1st Series were issued at a cost of 96.00% p.a. of the CDI rate, with the principal maturing in a single installment on December 16, 2020 and interest paid every eight months. The 2nd Series CRAswere issued at a cost of 5.8970% p.a. restated by the variation of the IPCA, with the principal maturing in a single installment on December 18, 2023 and interest paid every 16 or 18 months.
On December 31, 2016, the balance of this transaction totaled R$3,630.1 million. This transaction is included in the line “Agribusiness Receivables Certificate” in the table above.
Foreign Currency Debt
DevelopmentBankFacilities
BNDESFacilities.The values set out in the table mainly consist of a total funding of R$33.8 million related to the BNDES Monetary Unit, or “UMBNDES,” currency basket, which are the currencies in whichBNDES borrows, and are subject to interest at the rate of UMBNDES, reflecting fluctuations in daily exchange rates of the currencies of this basket. These loans are guaranteed by BRF and, in most cases, are secured byassets. The covenants under these agreements include limitations on indebtedness, liens and mergers and sales of assets. These loans are included under “Development banks credit lines - foreign currency” in the table above.
92
Table of Contents
ExportCreditFacilities
ExportPrepaymentFacilities. We had several export prepayment facilities in an aggregate outstanding amount of R$984.3 million as of December 31, 2016. The indebtedness under these facilities is generallydenominated in U.S. dollars, with maturity dates between 2017 and 2019. Interest under these export prepayment facilities accrues LIBOR plus a spread. Under each of these facilities, we receive a loan from one or morelenders secured by the accounts receivable relating to exports of our products to specific customers. The facilities are generally guaranteed by BRF S.A. The covenants under these agreements include limitations on liens andmergers. These credit lines are included in the line “Export credit facilities—Foreign currency” in the table above.
BusinessLoanFacilities. We had several trade-related business loan facilities in an aggregate outstanding amount of R$326.3 million as of December 31, 2016. The indebtedness under these facilities is denominatedin U.S. dollars, with maturity in 2018. These facilities bear interest at Libor plus a margin, payable quarterly. The proceeds from these facilities are used to import raw materials or for other working capital needs. The facilitiesare generally guaranteed by BRF. The principal covenants under these agreements include limitations on mergers and sales of assets. These credit lines are included in the line “Export credit facilities—Foreign currency” inthe table above.
Advancesonforeignexchangecontracts
Advancesonforeignexchangecontract.We had exchange contract advances, modality for funding through exports, with a total balance of R$212.8 million on December 31, 2016, maturing in 2017 with a fixed rateof 2,39%. Since these lines are trade-related, we must provide proof of export of products later by the accounts receivable relating to exports of their products. These loans are included under “Advances on foreign exchangerate contracts” in the table above.
Working Capital Facilities
Workingcapitalinforeigncurrency. These are funds obtained from financial institutions, mainly used for working capital and short-term import financing operations of subsidiaries mainly located in Argentina inthe amount of R$291.9 million. This funding is mainly denominated in Argentine pesos, with interest rates of 14.2% per year, due to the fact that most of the debt is denominated in Argentine pesos, and with maturity between2017 and 2022. These credit lines are included in the line “Working capital facilities—Foreign currency” in the table above.
Other Secured Debt
InvestmentsFinancing. The subsidiaries of BRF in Argentina obtained financing for investment projects for the acquisition of capital goods and /or construction of necessary facilities for the production of goods and/or services and marketing of goods (excluding inventories) in the amount of R$0.8 million, denominated in Argentine pesos with an interest rate of 15.1% and maturity dates in 2017. These loans are included in the line“Other secured debt —Foreign currency” in the table above.
Bonds
BRFNotes2024. On May 15, 2014, BRF completed a Senior Notes offering totaling US$750 million (“Senior Notes BRF 2024”). The principal is due on May 22, 2024 and bears interest at 4.75% per year (yield tomaturity of 4.952%), payable semiannually from November 22, 2014. Of the proceeds from the offering, US$470.6 million was used for a tender offer to buy back part of the debt of the Sadia Overseas Bonds 2017 and BRFNotes 2020, both defined below. To implement the tender offer, BRF made a payment of US$86.4 million (equivalent to R$198.6 million) to the holders of existing bonds, which was recorded as an interest expense. As ofDecember 31, 2016, there was US$750.0 million outstanding on these bonds.
93
Table of Contents
BFFNotes2020.On January 28, 2010, BFF International Limited issued Senior Notes in the amount of US$750 million, guaranteed by BRF, bearing a nominal interest rate of 7.25% per year and effective rate of7.54% per year, and maturing on January 28, 2020 (“BFF Notes 2020”). On June 20, 2013, US$120.7 million of these Senior Notes was replaced by Senior Notes BRF 2023, defined below, and, on May 15, 2014, US$409.6million were repurchased with part of the proceeds from the Senior Notes BRF 2024. On May 28, 2015, the Company finished a tender offer of bonds in the amount of US$ 101.4 million so that the remaining balance totaledUS$118.3 million on June 30, 2015. ). On September 21, 2016, the Company finalized a repurchase offer in the amount of US$32.2 million (equivalent to R$104.9 million), and premium was paid in the transaction, net ofinterest, in the amount of US$4.1 million (equivalent to R$13.4 million). The premium paid to holders of existing bonds was recorded as a financial expense. As of December 31, 2016, there was US$86.1 million outstandingon these bonds.
SadiaOverseasBonds2017. In May 2007, Sadia issued bonds in an aggregate amount of US$250.0 million (“Sadia Overseas Bonds 2017”). The bonds are guaranteed by BRF, bear interest at a rate of 6.875% peryear and mature on May 24, 2017. On June 20, 2013, US$29.3 million of these bonds was replaced by the Senior Notes BRF 2023, defined below, and, on May 15, 2014, US$61.0 million was repurchased with part of theproceeds from the Senior Notes BRF 2024. On May 28, 2015, the Company completed a tender offer of bonds in the amount of US$ 47.0 million so that the remaining balance totaled US$112.8 million on June 30, 2015. Asof December 31, 2016, there was US$112.8 million outstanding on these bonds.
BRFNotes2023. In May 2013, we issued senior notes in an aggregate amount of US$500.0 million, with principal due on May 22, 2023 and bearing interest at a rate of 3.95% per year, payable semiannually as ofNovember 22, 2013. As of December 31, 2016, there was US$500.0 million outstanding on these bonds.
BRFNotes2018.In May 2013, we issued senior notes in an aggregate amount of R$500.0 million, with principal due on May 22, 2018, and bearing interest at a rate of 7.75% per year, payable semiannually as ofNovember 22, 2013 (“BRF Notes 2018”). As of December 31, 2016, there was R$500.0 million outstanding on these bonds.
BRFNotes2022.In June 2012, we issued senior notes in an aggregate amount of US$500.0 million. The bonds were guaranteed by BRF, bear interest at a rate of 5.875% per year and mature on June 6, 2022. Laterthe same month, we issued an additional US$250.0 million of senior notes under the same indenture and with the same terms and conditions (collectively, the “BRF Notes 2022”). On May 28, 2015, the Company completed atender offer of bonds in the amount of US$ 577.1 million so that the remaining balance totaled US$172.9 million on June 30, 2015. On September 21, 2016, we completed a repurchase offer in the amount of US$54.2 million(equivalent to R$176.7 million), and premium was paid in the transaction, net of interest, in the amount of US$5.7 milliion (equivalent to R$18.6 million). The premium paid to holders of existing bonds was recorded asfinancial expense. As of December 31, 2016, there was US$118.7 million outstanding on these bonds.
BRFNotes2022: On May 29, 2015, we completed a senior notes offering totaling EUR500,0 million, with principal due on May 3, 2022, issued with a coupon (interest) of 2.75% per year (Yield to maturity of2.822%), to be paid annually as of June 3, 2016. On December 31, 2016, there were EUR500.0 million outstanding of these notes.
BRFNotes2026: On September 29, 2016, we, through our wholly-owned subsidiary BRF GmbH, issued senior notes in the aggregate amount of US$500.0 million, with principal due on September 29, 2026, andbearing interest at a rate of 4.35% per year, payable semiannually as of March 29, 2017. As of December 31, 2016, there were US$500.0 million outstanding of these notes.
BondsQuickfood. In 2014, Quickfood again issued notes guaranteed by BRF, in the amount of ARS436.0 million with a nominal interest rate of 24.1% per year and an effective rate of 27.0% per year, with maturitydates between 2017 and 2018. In 2015, Quickfood again issued notes guaranteed by BRF, in the amount of ARS475.2 million with a nominal interest rate of 24.3% per year and an effective rate of 29.0% per year, withmaturity dates between 2018 and 2022. As of December 31, 2016, there was ARS 680.8 million outstanding on these bonds.
94
Table of Contents
Derivatives
We entered into foreign currency exchange derivatives under which we had exposure of R$331.6 million and commodity derivatives under which we had exposure of R$1.5 million, in each case as of December 31,2016. The counterparties include several Brazilian financial institutions and involve interest rate swaps, and the purchase and sale of currencies and commodities. Their maturity dates vary from 2017 through 2019. Thesetransactions do not require any guarantees and follow the rules of the São Paulo Stock Exchange or CETIP S.A., a trading and securities registration company. These derivatives are recorded in our balance sheet as otherfinancial assets and liabilities. See “Item 11—Quantitative and Qualitative Disclosures About Market Risk.”
International Credit Facilities
RevolvingCreditFacility. In order to improve our liquidity management, in 2014, BRF and its wholly owned subsidiary BRF Global GmbH entered into a revolving credit facility (“Revolver Credit Facility”) with asyndicate of 28 banks, in the amount of US$1.0 billion and maturing in May 2019. The transaction was structured so that the company and its subsidiary may make use of the credit line at any time during the contractedperiod. As of December 31, 2016, the company had not yet used any portion of this facility.
Seasonality of Continuing Operations
Brazil
Our net sales of meat and processed products in the Brazilian market are not subject to large seasonal fluctuations. However, our fourth quarter is generally slightly stronger than the others due to increased demandfor our products during the holiday season, particularly turkeys, Chester® roosters, ham and pork loins. We also market certain products specifically for the holiday season, such as gift packages of our products that someemployers distribute to their employees. Our results are also affected by the dry and rainy seasons for corn, soybeans and soy meal, which are our primary raw materials in feed production.
In 2016, the first quarter accounted for 23.9% of our total sales in the Brazilian market, the second quarter accounted for 24.1%, the third quarter accounted for 24.8% and the fourth quarter accounted for 27.3%.
International
Our sales to international markets as a whole are not materially affected by seasonality, partly because seasonal buying patterns vary according to our international markets. However, net sales in specific marketssometimes vary with the season. In the Middle East/North of Africa, for example, we experience slower net sales during Ramadan and the summer months.
In 2016, the first quarter accounted for 24.0% of our international sales, the second quarter accounted for 26.0%, the third quarter accounted for 25.8%, and the fourth quarter accounted for 24.2%.
Capital Expenditures
See “Item 4—Information on the Company—A. History and Development of the Company—Capital Expenditures.”
C. Research and Development, Patents and Licenses
Our Research, Development and Innovation activities (RD&I) incorporate agricultural research and innovation, as well as products and processes research and development.
The agricultural RD&I area aims to guarantee the international competitiveness of our company through the continuous introduction of new technologies at the appropriate time. The goal is to reduce the productioncosts, improve product quality and client satisfaction and meet consumer demands. For this purpose, we maintain a qualified and experienced team of specialists and an extensive experimental physical and laboratorialstructure. In addition, we use our production facilities in a structured manner to generate knowledge. We have partnerships with several universities, government research institutions and innovative private companies, and we use several research incentives made available by government research and development agencies.
95
Table of Contents
The agricultural RD&I area currently has dedicated researchers to the activities of innovation and technical support. This team is highly qualified, including holders of PhDs and masters degrees and specialists inanimal production. In addition to researchers, we have several veterinarians, agronomists and animal scientists working directly in the production system.
In the last years, we have been promoting the introduction of professionals with PhDs in our technical team in association with governmental agencies as FINEP, CNPq (PNPD – National Post-Doctorate Programand RHAE – Human Resources Formation in Strategic Areas Program) and the Araucária Foundation (Post-Doctorate Program in company). As a result of that, we have hired 16 researchers. We have also been developing arobust trainee and internship program as well as encouraging our employees to participate in graduate courses.
We have one of the largest poultry and swine agricultural experimental research structures in the world. Our system includes 19 facilities and an experimental feed meal plant, distributed in four experimental farmssituated in the state of Santa Catarina. We also have seven bromatological and five health laboratories supporting research and operational activities.
In addition to the company’s formal research structure, the company has a research process in the production system (field research) allowing to evaluate all technologies under real production conditions with asuitable number of samples in order to calculate the productivity and financial impact of innovations and establish the appropriate moment to introduce a technology. BRF believes that the field research system provides itwith an advantage in relation to others research centers and other companies in the sector.
We have our own swine breeding program, which we believe is better than the international breeding programs. The program used to operate with three farms, each one with two nucleus, in the state of Santa Catarinawith 126 employees and a backup farm in Minas Gerais. In order to match our growth, a new nucleus farm, located in the state of Goiás started operation in 2016, expanding the program’s production capacity. Procedures arebeing carried out for the incorporation of genomic evaluation in the selection process. In order to implement this new technology, we established partnerships with six Embrapa ( EmpresaBrasileiradePesquisaAgropecuária, or the Brazilian Company for Agricultural and Farming Research) research centers, universities, governmental agencies (BNDES, Finep, CNPq) and we keep a team of seven highly qualified geneticists.
Since 2009, we have been benefiting from tax credits from the MCTI ( MinistériodaCiência,TecnoligiaeInovação, or the Science, Technology and Innovation Ministry) to incentivize inovation research, called Lei
doBem. This benefit considers technological innovation as development of a new product or new manufacturing process and incremental improvement in actual product or process. The R&D and Innovation teams were integrated under the same business unit in 2015 in order to look for a new way of working to bring, at the same time, more speed to market, consumer and technology
connections as well as more efficiency.
More than one hundred researchers and project managers are dedicated to continuously feeding the pipeline with innovative ideas, while running cost, processes and formulation optimization. BRF has developed aunique stage gate process, which is managed by a multifunctional quorum to take bi-monthly major decisions along the funnel. This allows us to accelerate the decision-making process in a very complex chain, consideringmultiple points of view.
To do so, the first step towards it was to define the growth platforms, fully connected with the consumer agenda. Our four main platforms are healthiness and well-being, food experience, expanded convenience andconscious/ethical consumption. The project managers are now able to navigate through different categories, such as prepared meals, cold cuts, innatura, spreads, snacks and even food services, bringing a tone closer tomarket, designing and applying solutions that either fulfill an unmet need or enhance a specific consumer occasion.
96
Table of Contents
During 2016, we managed 2,353 global projects, including suspended, canceled, finalized and in progress projects with expected results in the medium and long-term, aiming at a commercial approach that resonateswith our trade and sales team agenda. Some of the most innovative launches per platform in Brazil include:
Healthiness and well-being: 30% sodium reduction in 70% of the Sadia portfolio, Qualy multigrain as the first margarine with real grains, like quinoa & linseed, and nuggets made with 100% chicken breastplus a breading of multigrain and one combined with vegetables; Food experience: turkey prepared with Jamie Oliver recipes for Christmas and a line of franks with global appealing flavors, such as German and Mexican seasoning (black pepper and chipottle pepper), inline with the Olympics momentum in Brazil; Expanded convenience: Sadia & Perdigão lines of ready-to-eat meals (moving beyond the traditional lasagna and salamitos) and the first Brazilian 100% protein snack (already one of the main contributionmargins within BRF); and Conscious/ethical consumption: Jamie Oliver’s full line of products, which strictly follows animal welfare and is composed of 100% natural ingredients and has official certification by Certified Humane.
New product launches and commercial acumen made possible to improve the participation of innovation in our total revenue from less than 1% in 2015 to 2.5% in 2016. The market is recognizing our efforts, with
the nomination of BRF by PricewaterhouseCoopers as the most innovative food company in Brazil during 2016.
We also spent five years developing our own sodium reduction technology, the HPA. The HPA is ready to be patented and presents some advantages over other sodium reduction solution, such as (1) reduced bittertaste, (2) antioxidant properties, (3) nutritional value, and (4) water activity reduction.
Some examples of innovations are:
· shelf stable and shelf life extension:
o Thermostable ingredients, stronger additives;
o Active packages, higher barriers, stronger materials;
o New thermal and non-thermal processes for dehidration, pasteurization and sterilization;
· sodium and fat reduction;
· natural additives (clean label);
· package and ingredients to improve microwave performance:
o new process for coated products production; and
o new crumbs for coated products.
We also partner with texture, scent and ingredients start-ups to open our company to multiple and distinctive ideas.
We invested R$220.2 million, R$227.3 million and R$192.8 million in research and development in 2016, 2015 and 2014, respectively.
D. Trend Information
In addition to the information set forth in this section, additional information about the trends affecting our business can be found in “—A. Operating Results—Principal Factors Affecting our Results of Operations.” You should also read our discussion of the risks and uncertainties that affect our business in “Item 3. Key Information—D. Risk Factors.”
97
Table of Contents
Global GDP is expected to grow 3.1% in 2016 and 3.4% in 2017, according to a report released in January by the International Monetary Fund (“IMF”). A threat to global economic growth is the intensification ofprotectionist pressures, because of a potential widening of global imbalances coupled with sharp exchange rate movements. According to the IMF, increased restrictions on global trade and migration would hurt productivityand incomes, and take an immediate toll on market sentiment. The IMF expects growth of 1.6% in 2016 and 2.3% in 2017 for the U.S. while their expectations remain low, at around 1.7% in 2016 and 1.6% in 2017 forWestern Europe. For developing countries, the IMF expects a growth rate of 7.2% for India and 1.1% for Russia, along with a more modest growth in China of 6.5% this year. The same study expects Brazil’s GDP to decrease3.5 in 2016 and resume growth of 0.2% in 2017. The SELIC interest rate (the primary Brazilian interest reference rate) is expected to end 2017 at 9.00%, according to reports by Focus.
With respect to BRF and our industry, there are some recent developments related to the “Weak Flesh Operation." As a result of the regulators’ inquiries and the public announcement of allegations of wrongdoingsinvolving BRF and other companies in the Brazilian meat industry in the context of this operation, some export markets have been temporarily closed and our average selling prices for some products and in some marketshave fallen. For more information about the “Weak Flesh Operation,” see “Item 8. Financial Information – B. Significant Changes – Weak Flesh Operation.”
Exports
In 2016, Brazilian volume of chicken exports was 1.9% higher than in 2015. This increase can be explained mainly by higher sales to several Asian countries, mainly China, and to African countries such as Egyptand Angola. Despite losing competitiveness due to higher feed costs and the appreciated real, Brazilian players gained market share due to disease-related opportunities. The main example is China, which faced a sharpreduction in domestic chicken production, once it banned breeders supply from U.S. and some European countries, having to approve plants in different destinations, such as Brazil.
Brazil is a leading player in the global export markets of poultry and pork due to natural advantages, including low labor costs, gains of efficiencies in animal production and, in the case of chicken meat and no highlypathogennic avian influenza cases in its territory ever. Like other large Brazilian producers, we have capitalized on these advantages to develop the scope and scale of our businesses.
In international markets, we and other Brazilian producers compete with local and other foreign producers. Traditionally, Brazilian producers have emphasized exports of frozen whole and cut poultry and frozen porkand beef cuts. These products, which are similar commodities in nature, continue to account for the substantial portion of export volumes in recent years. Brazilian food companies have also expanded the sales of processedfood products. We anticipate that, over the next several years, we and our main Brazilian competitors will sell greater volumes of frozen whole and cut poultry and frozen pork as well as increasing volumes of processed foodproducts.
Oil prices declined further in 2016, affecting several countries that have a big share over Brazilian exports, such as Russia, Venezuela, Angola and some Middle East countries. The effects of oil price drops for big oilproducers generally present themselves in two main ways: less inflow of money, which devalues the currency (if not pegged), which then negatively affects the country’s disposable income due to an increase in inflation; anddecreased GDP growth, due to smaller oil revenues. The additional drop of 11.4% in oil prices (the West Texas Intermediate index, which benchmarks oil prices, dropped from US$ 48.69 in 2015 to US$ 43.14 in 2016) hascaused and will continue to cause turmoil in oil exporting economies, reducing their ability to import Brazilian products. Food products are less sensitive than other goods to foreign exchange and to income variations. Rich oilproducing countries that are located in warm regions with low availability of grains rely on government subsidies in order to cope with much higher chicken production costs than countries with moderate climate and highavailability of grains, such as Brazil. Thus, falling oil prices will not necessarily lead to lower chicken imports from Brazil as governments might reduce subsidies leading to a decline in local production of chicken. Asopposed to top oil exporters, countries that are net importers of oil and its sub products benefit from lower price in terms of higher disposable income.
In 2017, we intend to place new products in the Middle East/Africa market to meet the demand for healthier products.
98
Table of Contents
Brazilian Market
Brazil is one of the world’s largest consumers of meat, with a per capita meat consumption in 2016 of 96.1 kilograms, including beef, broiler chicken and pork, according to the USDA. Demand for poultry, pork andbeef products is directly affected by economic conditions in Brazil. The emergence of the middle class has had a relevant impact in chicken and pork consumption in the past years whereas beef consumption remained flatover the last years. However, given the recent poor economic scenario in the past years, meat consumption declined in 2016 compared to 2015. According to the IBGE, domestic GDP shrank 3.6% in 2016 and according to theCentral Bank’s Focus report is expected to increase by only 0.48% in 2017, while inflation is expected to decelerate to 4.19%. The gap between beef and chicken prices in Brazil is expected to narrow, once higher cattlesupply (due to favorable cattle cycle) is likely to lead to lower beef prices in 2017.
The Brazilian market is highly competitive, particularly for fresh and frozen poultry and pork products. There are several large producers, most notably BRF, but also Aurora and Seara. The largest producers aresubject to significant competition from a substantial number of smaller producers that operate in the informal economy and sometimes offer lower quality products at lower prices than do the major producers. For that reason,we and our main competitors have, in recent years, focused on producing and selling processed food products because these products support better margins. We and our major competitors are generally emphasizingprocessed food products rather than fresh and frozen poultry and pork products that are more similar to commodities in nature.
The processed foods sector is more concentrated in terms of the number of players. Consumption of processed products is influenced by several factors, including the increase in consumer income and marketingefforts with a view to meeting consumer demand for more value-added products. We believe that processed food products represent an opportunity for further growth in coming years.
Given the more challenging economic context in Brazil, our priorities remain to be the implementation of initiatives emphasizing operational excellence, especially in cost management and sales, that will be driversfor growth in the market, aiming toward the recovery of our operating margins in Brazil. Price adjustment and new products will be the major growth drivers for profitability in 2017. We remain confident in our strategy andcapacity to resume growth in Brazil through more internal efforts toward reducing the cost of services, a more robust sales structure with improved execution that is focused on each region, and by strengthening our leadershipby repositioning our major brands.
Raw Materials
In the Brazilian market, average corn prices increased 53.1% in 2016 relative to the average in 2015. The increase in average corn prices began in the end of 2015 due to uncertainties of weather conditions in theharvest period and peaked in the second quarter of 2016 with the confirmation of the poor crop together with a large number of future contracts of exports, which resulted in a shortage of corn in the domestic market.Unfavorable climate conditions hampered 2015/16 corn harvest, which totaled 66.5 million tons (a decrease of 21.43% year over year), according to Conab.
In the international market, a record corn crop in the U.S. together with its lower competitiveness led an increase of 33.6% in stocks for the 2016/17 harvest, according to the USDA. Given this favorable supplyscenario, average CBOT corn prices fell 4.9%, as a whole.
Average soybean prices in Brazil for the fourth quarter of 2016 declined 6.1% relative to the third quarter of 2016, but rose 12.2% in 2016 over 2015. CBOT prices rose 4.7% in 2016, reflecting concerns regardingpotential El Niño impacts mainly in Argentine crop and stronger Chinese demand for soybean.
Social Contributions
In accordance with the Provisional Measure No. 774/17, we will be rquired to pay 20% social contribution over our payroll beginning in July 2017, which is higher than the amounts we currently pay of 1% of ourgross operating revenue for in-natura products (excluding exports) and 2.5% of our gross operating revenue for some processed products (excluding exports). This Provisional Measure may be passed into law or not or may bemodified by the Brazilian Congress. For as long as the Provisional Measure No. 774/17 is in effect or if it is passed into law, our overall tax burden will be increased, which could negatively affect our overall financialperformance.
99
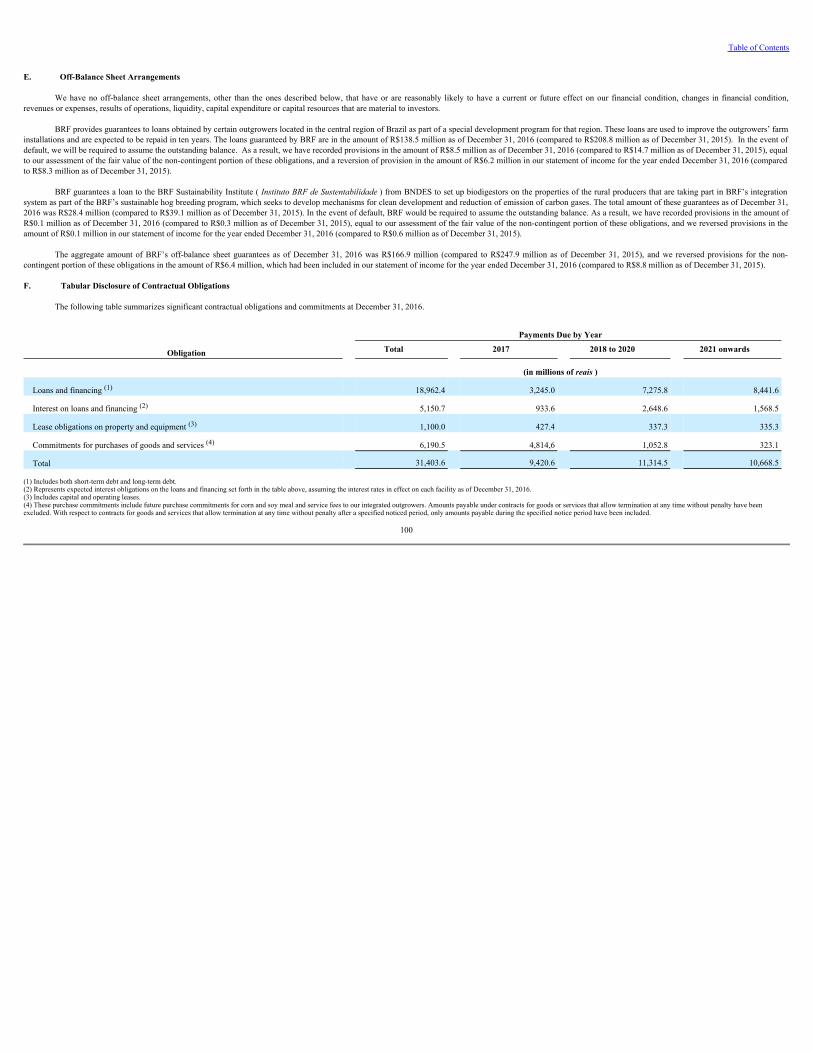
Table of Contents
E. Off-Balance Sheet Arrangements
We have no off-balance sheet arrangements, other than the ones described below, that have or are reasonably likely to have a current or future effect on our financial condition, changes in financial condition,revenues or expenses, results of operations, liquidity, capital expenditure or capital resources that are material to investors.
BRF provides guarantees to loans obtained by certain outgrowers located in the central region of Brazil as part of a special development program for that region. These loans are used to improve the outgrowers’ farminstallations and are expected to be repaid in ten years. The loans guaranteed by BRF are in the amount of R$138.5 million as of December 31, 2016 (compared to R$208.8 million as of December 31, 2015). In the event ofdefault, we will be required to assume the outstanding balance. As a result, we have recorded provisions in the amount of R$8.5 million as of December 31, 2016 (compared to R$14.7 million as of December 31, 2015), equalto our assessment of the fair value of the non-contingent portion of these obligations, and a reversion of provision in the amount of R$6.2 million in our statement of income for the year ended December 31, 2016 (comparedto R$8.3 million as of December 31, 2015).
BRF guarantees a loan to the BRF Sustainability Institute ( InstitutoBRFdeSustentabilidade) from BNDES to set up biodigestors on the properties of the rural producers that are taking part in BRF’s integrationsystem as part of the BRF’s sustainable hog breeding program, which seeks to develop mechanisms for clean development and reduction of emission of carbon gases. The total amount of these guarantees as of December 31,2016 was R$28.4 million (compared to R$39.1 million as of December 31, 2015). In the event of default, BRF would be required to assume the outstanding balance. As a result, we have recorded provisions in the amount ofR$0.1 million as of December 31, 2016 (compared to R$0.3 million as of December 31, 2015), equal to our assessment of the fair value of the non-contingent portion of these obligations, and we reversed provisions in theamount of R$0.1 million in our statement of income for the year ended December 31, 2016 (compared to R$0.6 million as of December 31, 2015).
The aggregate amount of BRF’s off-balance sheet guarantees as of December 31, 2016 was R$166.9 million (compared to R$247.9 million as of December 31, 2015), and we reversed provisions for the non-contingent portion of these obligations in the amount of R$6.4 million, which had been included in our statement of income for the year ended December 31, 2016 (compared to R$8.8 million as of December 31, 2015).
F. Tabular Disclosure of Contractual Obligations
The following table summarizes significant contractual obligations and commitments at December 31, 2016.
Payments Due by Year
Obligation Total 2017 2018 to 2020 2021 onwards
(in millions of reais )
Loans and financing (1) 18,962.4 3,245.0 7,275.8 8,441.6
Interest on loans and financing (2) 5,150.7 933.6 2,648.6 1,568.5
Lease obligations on property and equipment (3) 1,100.0 427.4 337.3 335.3
Commitments for purchases of goods and services (4) 6,190.5 4,814,6 1,052.8 323.1
Total 31,403.6 9,420.6 11,314.5 10,668.5
(1) Includes both short-term debt and long-term debt. (2) Represents expected interest obligations on the loans and financing set forth in the table above, assuming the interest rates in effect on each facility as of December 31, 2016. (3) Includes capital and operating leases. (4) These purchase commitments include future purchase commitments for corn and soy meal and service fees to our integrated outgrowers. Amounts payable under contracts for goods or services that allow termination at any time without penalty have beenexcluded. With respect to contracts for goods and services that allow termination at any time without penalty after a specified noticed period, only amounts payable during the specified notice period have been included.
100
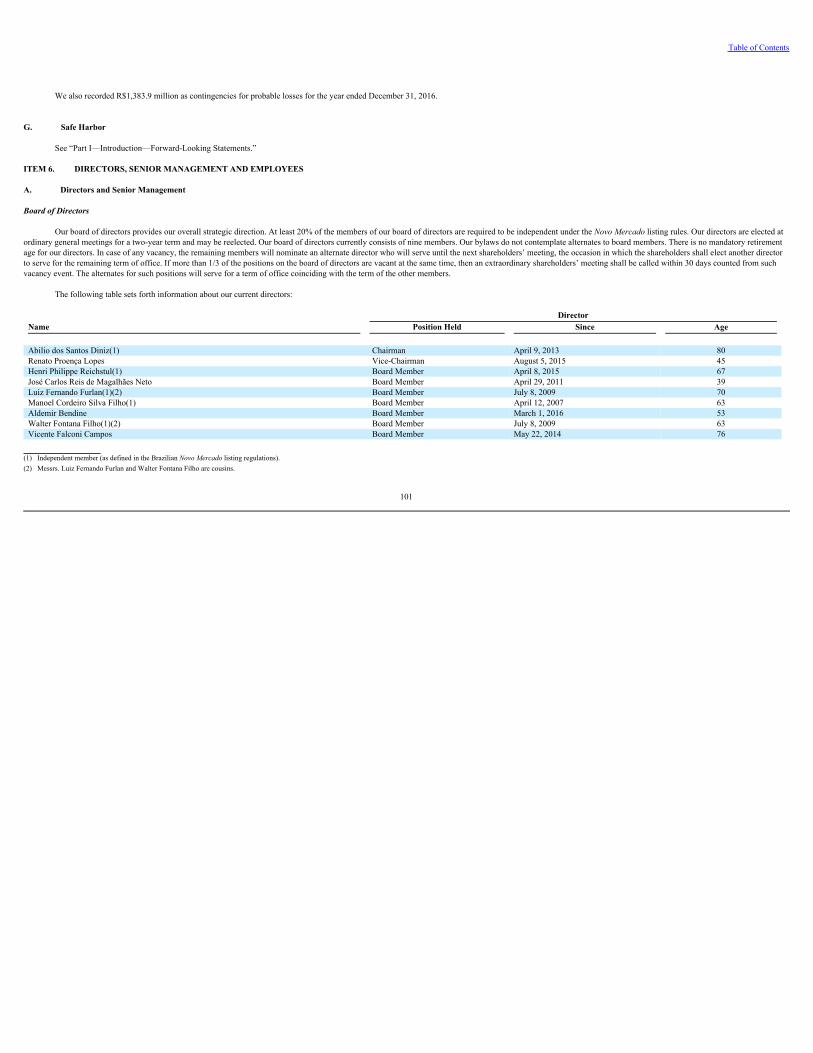
Table of Contents
We also recorded R$1,383.9 million as contingencies for probable losses for the year ended December 31, 2016.
G. Safe Harbor
See “Part I—Introduction—Forward-Looking Statements.”
ITEM 6. DIRECTORS, SENIOR MANAGEMENT AND EMPLOYEES
A. Directors and Senior Management
Board of Directors
Our board of directors provides our overall strategic direction. At least 20% of the members of our board of directors are required to be independent under the NovoMercadolisting rules. Our directors are elected atordinary general meetings for a two-year term and may be reelected. Our board of directors currently consists of nine members. Our bylaws do not contemplate alternates to board members. There is no mandatory retirementage for our directors. In case of any vacancy, the remaining members will nominate an alternate director who will serve until the next shareholders’ meeting, the occasion in which the shareholders shall elect another directorto serve for the remaining term of office. If more than 1/3 of the positions on the board of directors are vacant at the same time, then an extraordinary shareholders’ meeting shall be called within 30 days counted from suchvacancy event. The alternates for such positions will serve for a term of office coinciding with the term of the other members.
The following table sets forth information about our current directors:
DirectorName Position Held Since Age Abilio dos Santos Diniz(1) Chairman April 9, 2013 80Renato Proença Lopes Vice-Chairman August 5, 2015 45Henri Philippe Reichstul(1) Board Member April 8, 2015 67José Carlos Reis de Magalhães Neto Board Member April 29, 2011 39Luiz Fernando Furlan(1)(2) Board Member July 8, 2009 70Manoel Cordeiro Silva Filho(1) Board Member April 12, 2007 63Aldemir Bendine Board Member March 1, 2016 53Walter Fontana Filho(1)(2) Board Member July 8, 2009 63Vicente Falconi Campos Board Member May 22, 2014 76
(1) Independent member (as defined in the Brazilian NovoMercadolisting regulations).(2) Messrs. Luiz Fernando Furlan and Walter Fontana Filho are cousins.
101
Table of Contents
Below is a summary of the professional experience and areas of activity of our current board members.
AbiliodosSantosDiniz-Chairman of BRF’s Board. Mr. Diniz graduated in Business Administration at Fundação Getúlio Vargas (FGV). Together with his father, he was responsible for the establishment anddevelopment of Grupo Pão de Açúcar, whose Board of Managers he chaired until September 2013. Between 1979 and 1989, he was a member of the Brazilian National Monetary Council. Since 2010, he has been ministeringa 360º Leadership course in partnership with FGV for developing young leaders. Currently, Mr. Diniz is also president of the Board at Península Participações, the investment firm that belongs to his family, and is a memberof the Board at Carrefour Brasil.
RenatoProençaLopes–Vice-Chairman of BRF’s Board and Statutory Audit Committee member. Mr. Lopes has a bachelor’s degree in Civil Engineering Technology from the Universidade Mackenzie (São Paulo).He has a post-graduate degree in Business Administration from the Universidade Paulista (UNIP) and an MBA in Wholesale Businesses Management from FIPECAFI - Universidade de São Paulo (USP). He joined Banco doBrasil in 1992. Over the past few years, he has held various positions in the bank as Deputy Manager in New York (2013/2015), Managing Director in the USA (2013/2015), Executive Manager – Commercial Department(2010/2013) and Corporate General Manager (2006/2010). He participated in the initial development of the integration and business prospection involving the wholesale pillar portfolio of Banco do Brasil and BancoPatagônia – Argentina (2010). In June 2015, Mr. Lopes was appointed Investments Director for PREVI (the Banco do Brasil employees’ pension fund), a position he currently holds.
HenriPhilippeReichstul–Board member. Mr. Reichstul has a bachelor’s degree in economics from the Universidade de São Paulo and postgraduate studies at Hertford College, Oxford. He was CEO of IPEA,Petrobras, Globopar and Brenco. Currently, Mr. Reichstul sits on the boards of directors of Peugeot Citroen S.A., Repsol YPF, LATAM Airlines Group, Semco Partners and is Chairman of the board of Directors of FivesGroup. He is also a member of the consultative boards of Lhoist do Brasil Ltda., AES Brasil; vice president of the board of directors of the Foundation for Sustainable Development; and vice president of Einstein Hospital.Mr. Reichstul is a former member of the boards of directors of Louis Dreyfus Brasil, Ashmore Energy International, BNDES, ABDIB, COINFRA, Foster Wheeler, and Gafisa, among other companies.
JoséCarlosReisdeMagalhãesNeto–Board member. Mr. Magalhães Neto is a graduate in Business Administration from the Fundação Getúlio Vargas. He is a founder member and Chairman of the Board ofDirectors of Tarpon Investimentos S.A. He also sits on the Board of Omega Energia Renováveis. Mr. Magalhães Neto was nominated to stand for election to our Board of Directors by Tarpon.
LuizFernandoFurlan–Board member. Mr. Furlan is a member of the Boards of Directors of Telefônica Brasil S.A. (Brazil), Telefónica S.A. (Spain) and AGCO Corporation (USA). He was Chairman of the Boardof Directors of Sadia S.A. from 1993 to 2002 and from 2008 to 2009, a company where he also held several different executive positions from 1976 to 1993. He was Co-Chairman of the Board of Directors of BRF S.A. from2009 to 2011, as well as a member of the Board of AMIL Participações S.A. from 2008 to 2013, Redecard S.A. from 2007 to 2010 and a member of the Advisory Board of ABERTIS Infraestruturas S.A. (Spain) from 2013 to2015. He served as Minister of Development, Industry and Foreign Trade of Brazil from 2003 to 2007. Since 2008, he has been President of the Board of Fundação Amazonas Sustentável (FAS) and was also a member of theGlobal Commission for the Conservation of Oceans (Global Ocean Commission – USA) and is currently a member of the Superior Council of Management in public health of the São Paulo state. Mr. Furlan is a graduate inChemical Engineering from FEI (the Industrial Engineering School) and in Business Administration from the Universidade de Santana - São Paulo, having also concluded extension and specialization courses in Brazil andoverseas.
ManoelCordeiroSilvaFilho- Board member. Mr. Silva Filho has 32 years of experience at Vale S/A, was a Chief Investment Oficer of VALIA and was a coordinator of the National Investment Committee ofAssociaçãoBrasileiradasEntidadesFechadasdePrevidênciaComplementar, or “ABRAPP”. Mr. Silva Filho holds a degree in business administration from Faculdade Moraes Júnior, Rio de Janeiro, a post-graduationqualification in economic engineering from Faculdade Estácio de Sá, Rio de Janeiro and an MBA in finance from IBMEC.
AldemirBendine–Board member. Mr. Bendine has been the Chairman of Petrobras – Petróleo Brasileiro S.A. since February 9, 2015. He holds a bachelor’s degree in Business Management. He also has an MBAfor Top Executives from FIPECAFI-USP and in Finance at PUC, Rio de Janeiro. He is a civil servant, beginning his professional career as a trainee at Banco do Brasil in 1978. He served as Chairman of Banco do Brasilfrom April 2009 to February 2015. He held several positions at the bank including Vice President for Cards and New Retail Business and Vice President for Retail and Distribution, also serving as Executive Board Secretary,Executive Manager of the Retail Board and Branch Manager. Mr. Bendine has been an Executive Director of the Brazilian Federation of Banks (FEBRABAN), CEO of the Brazilian Association of Card Companies andServices (ABECS), Chairman of the Board of Directors of CBSS (Visa Vale), CEO of BB Administrador de Cartões de Crédito S.A. and BB Administrador de Consórcios S.A.
102
Table of Contents
WalterFontanaFilho–Board and Statutory Audit Committee member. Mr. Fontana Filho holds Bachelor’s and postgraduate degrees from PUC in São Paulo and a specialization course in Marketing Administrationfrom FGV. He was a member of the Board of Directors of the newspaper OEstadodeSãoPaulofrom 1999 to 2013 and the Chairman of the Board of Directors of such company from 2013 to 2016. He is also a member ofthe Board of Martins Comércio e Serviços de Distribuição S.A. since 2013. He was a Board member of ALGAR – Algar S.A. Empreendimentos e Participações. At Sadia, he was Commercial Director – Domestic Marketfrom 1983 to 1988, Commercial Executive Vice President from 1988 to 1994, Chief Executive Officer from 1994 to 2005 and Chairman of the Board of Directors from 2005 to 2008.
VicenteFalconiCampos–Board member. Mr. Falconi Campos is founder and Chairman of the Board of Directors of FALCONI - Consultores de Resultados, the largest management consulting company in Brazil.He is a consultant to the Brazilian Federal Government and various state governments and municipalities, in addition to large Brazilian companies such as AmBev, Gerdau, Vale, AMIL (United Health), PETROBRAS andB2W, among others. He graduated in Engineering in 1963 from the Universidade Federal de Minas Gerais (UFMG) and has the qualifications of M.Sc. and Ph. D. in Engineering from the Colorado School of Mines, in theU.S. He is Professor Emeritus of UFMG, was awarded the Medal of the Order of Rio Branco for services rendered to the nation, and was chosen by the American Society for Quality Control as one of the “21 voices of theXXI Century.” Currently, he is a member of the board of directors of Ambev S.A. and Chairman of the Board of Directors of ISMART – Institutio Social para Motivar, Apoiar e Reconhecer Talento and a member of theAdvisory Board of Fundação Zerrenner.
At the general shareholders’ meeting to be held on April 26, 2017, our shareholders will be asked to increase the board size to ten and elect the members of the Board of Directors. The term of office of all directors tobe elected by shareholders at the meeting called for April 26, 2017 will expire at the general shareholders’ meeting to be held in 2019. The proposed slate to the Board of Directors consists of Abilio dos Santos Diniz(Chairman), Francisco Petros Oliveira Lima Papathanasiadis (Vice-Chairman), Luiz Fernando Furlan, José Carlos Reis de Magalhães Neto, Walter Fontana Filho, Flávia Buarque de Almeida, Carlos da Costa Parcias Jr.,Marcos Guimarães Grasso, Walter Malieni Jr. and José Aurélio Drummond Jr. We cannot predict whether these proposed directors will, in fact, be elected at the shareholders’ meeting.
Below is a summary of the professional experience and areas of activity of our six new proposed board members:
FranciscoPetrosOliveiraLimaPapathanasiadis– proposed Vice-Chairman. Mr. Papathanasiadis is an economist and a lawyer specialized in corporate law, capital markets and corporate governance. He is themanaging director of Fernandes, Figueiredo, Françoso and Petros - Sociedade de Advogados. He has worked for more than 30 years in the Brazilian capital and financial market, in the areas of investment analysis, corporatefinance and asset management, in several institutions, notably Unibanco, Brasilpar and Grupo Sul América. He was vice president and president of the Brazilian Association of Capital Markets (ABAMEC - São Paulo)between 1999 and 2001 and the first president of the APIMEC Capita Market Analyst Supervisory Board (2010/2014). Since July 2015, he has been an alternate member of the Board of Directors of Petrobras. He is 53 yearsold.
CarlosdaCostaParciasJr. – proposed Board member. Mr. Parcias holds a degree in Economics from the Universidade Federal do Rio de Janeiro (UFRJ) (1984) and a Master's Degree in Economics from PUC-RJ.Since 2012, he has been Vice President of Business Development at CPFL Energia S.A. and a member of the Board of Directors of CPFL Renováveis. His previously held positions of leadership in the financial sector includechief executive officer of Icatu Gestão de Participações between 2001 and 2003, whose main activity is investment management; director of the Investment Bank Fleming Graphus from 1998 to 2000; president of BBA-Capital Asset Management from 1996 to 1998; and director of Capital Markets at Banco BBA-Creditanstalt from 1993 to 1998. He also served as an advisor to the BNDES's presidency from 1990 to 1992. He is 57 years old.
103
Table of Contents
FláviaBuarquedeAlmeida– proposed Board member. Ms. Almeida is a member of the Peninsula Capital Participações S.A. since 2013 and a board member of the "Board of Overseers" at Harvard University,GAEC S.A. - Anima Educação and wine.com.br. She was an independent member of the Board of Directors of Lojas Renner S.A. from 2011 to 2016. Between 2009 and 2013, she was a senior partner of Monitor Group(currently Monitor Deloitte). Prior to that, between 2003 and 2009, Flavia was the general director of Participações Morro Vermelho S.A., a family holding company that controls the Camargo Corrêa Group. During the years1989 to 2003, Flavia worked at McKinsey & Company, where she was a partner. Flávia holds a degree in Business Administration from Fundação Getúlio Vargas and an MBA from Harvard Business School. She is 50 yearsold.
MarcosGuimarãesGrasso– proposed Board member. Mr. Grasso holds a degree in business administration from Fundação Getúlio Vargas - FGV and in coaching from the Columbia Coaching Association (NYC).He is the managing partner of M2G Advisors. Prior to that, he served as chairman of Kraft Foods (2010 to 2013), chairman of Cadbury Adams (2013 to 2010) and regional chairman of Pfizer (1986-2003). He is 55 years old.
WalterMalieniJunior– proposed Board member. Mr. Malieni Junior holds a degree in Economics from Universidade Presbiteriana Mackenzie, an MBA in Capital Markets and Finance from Ibmec, a postgraduatedegree in General Training for Executives from USP and a Master's Degree in Business Administration from Universidade Presbiteriana Mackenzie. In 2014, he participated in an executive session for Banco do Brasil in theProgram of Digital Transformation in Business by the Massachusetts Institute of Technology (MIT). Mr. Malieni Junior has been a civil servant at Banco do Brasil since 1984, when he joined the company in the MinorApprentice program. He was state superintendent in Rio de Janeiro between January and December 2000, commercial manager and statutory commercial director of Companhia de Seguros Aliança do Brasil between January2001 and October 2006 and commercial superintendent, director of credit and director of distribution in São Paulo of Banco do Brasil between November 2006 and December 2012. Since January 2013, he has been the VicePresident of Internal Controls and Risk Management of Banco do Brasil and, since May 2016, he has been a member of the PREVI Deliberative Board. He is 46 years old.
JoséAurélioDrummondJúnior– proposed Board member. Mr. Drummond Júnior holds a degree in engineering from the Faculdade de Engenharia Industrial-FEI SP and a post-graduate degree from the WhartonBusiness School. He is a member of the Board of Directors and Chief Executive Officer of Eneva S.A. He served as President for Latin America of Alcoa (metallurgical sector), partner of Victoria Capital Partners (privateequity sector) and President for Latin America, Europe, the Middle East and Africa Of Whirlpool (appliance industry). He is 53 years old.
Executive Officers
Our executive officers are responsible for our day-to-day operations and implementation of the general policies and guidelines approved from time to time by our board of directors.
Our bylaws require that the board of executive officers consist of a chief executive officer, a chief financial officer, an investor relations officer and up to twelve additional members, each with the designation andduties assigned by our board of directors.
Our executive officers are elected by our board of directors for two-year terms and are eligible for reelection. The current term of all of our executive officers ends at our annual shareholders’ meeting to be held in2018. Our board of directors may remove any executive officer from office at any time with or without cause. Under the Brazilian Corporation Law, our executive officers must be residents of Brazil but need not beshareholders of our company. Our executive officers hold ordinary monthly meetings, as well as extraordinary meetings, when called by our Chief Executive Officer.
The following table sets forth the name, position and the year of election of each of our current executive officers.
104
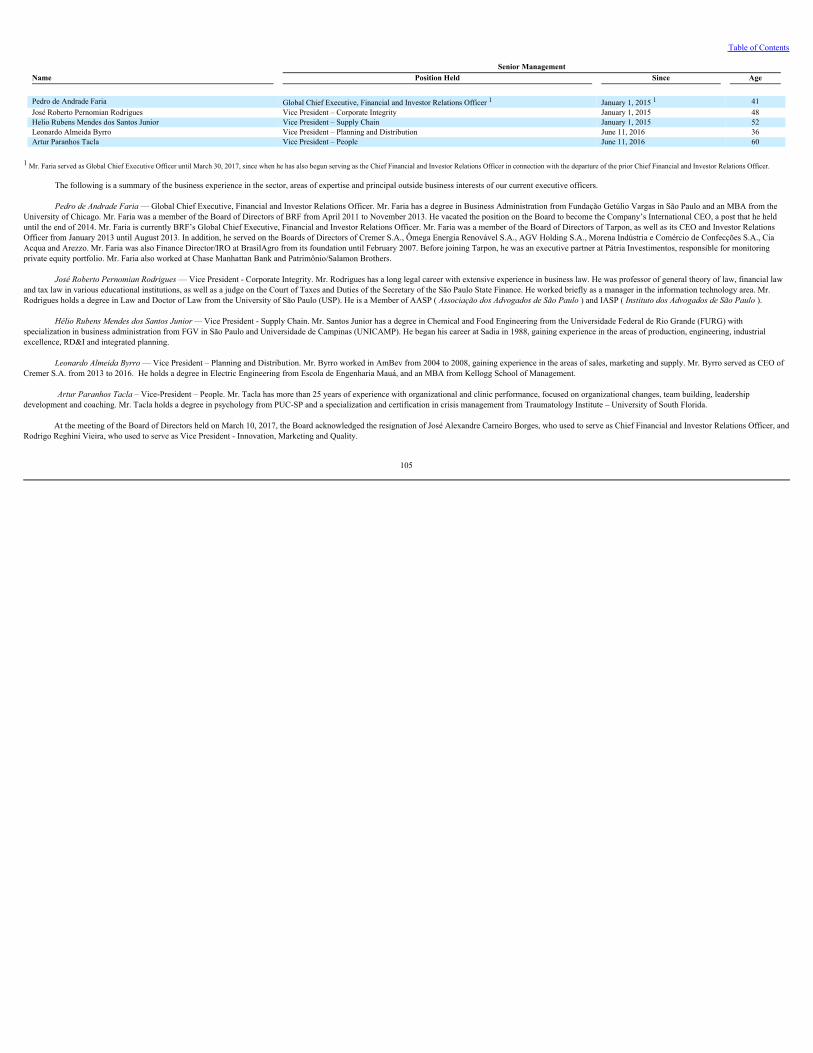
Table of Contents
Senior ManagementName Position Held Since Age
Pedro de Andrade Faria Global Chief Executive, Financial and Investor Relations Officer 1 January 1, 2015 1 41José Roberto Pernomian Rodrigues Vice President – Corporate Integrity January 1, 2015 48Helio Rubens Mendes dos Santos Junior Vice President – Supply Chain January 1, 2015 52Leonardo Almeida Byrro Vice President – Planning and Distribution June 11, 2016 36Artur Paranhos Tacla Vice President – People June 11, 2016 60
1 Mr. Faria served as Global Chief Executive Officer until March 30, 2017, since when he has also begun serving as the Chief Financial and Investor Relations Officer in connection with the departure of the prior Chief Financial and Investor Relations Officer.
The following is a summary of the business experience in the sector, areas of expertise and principal outside business interests of our current executive officers.
PedrodeAndradeFaria— Global Chief Executive, Financial and Investor Relations Officer. Mr. Faria has a degree in Business Administration from Fundação Getúlio Vargas in São Paulo and an MBA from theUniversity of Chicago. Mr. Faria was a member of the Board of Directors of BRF from April 2011 to November 2013. He vacated the position on the Board to become the Company’s International CEO, a post that he helduntil the end of 2014. Mr. Faria is currently BRF’s Global Chief Executive, Financial and Investor Relations Officer. Mr. Faria was a member of the Board of Directors of Tarpon, as well as its CEO and Investor RelationsOfficer from January 2013 until August 2013. In addition, he served on the Boards of Directors of Cremer S.A., Ômega Energia Renovável S.A., AGV Holding S.A., Morena Indústria e Comércio de Confecções S.A., CiaAcqua and Arezzo. Mr. Faria was also Finance Director/IRO at BrasilAgro from its foundation until February 2007. Before joining Tarpon, he was an executive partner at Pátria Investimentos, responsible for monitoringprivate equity portfolio. Mr. Faria also worked at Chase Manhattan Bank and Patrimônio/Salamon Brothers.
JoséRobertoPernomianRodrigues— Vice President - Corporate Integrity. Mr. Rodrigues has a long legal career with extensive experience in business law. He was professor of general theory of law, financial lawand tax law in various educational institutions, as well as a judge on the Court of Taxes and Duties of the Secretary of the São Paulo State Finance. He worked briefly as a manager in the information technology area. Mr.Rodrigues holds a degree in Law and Doctor of Law from the University of São Paulo (USP). He is a Member of AASP ( AssociaçãodosAdvogadosdeSãoPaulo) and IASP ( InstitutodosAdvogadosdeSãoPaulo).
HélioRubensMendesdosSantosJunior—Vice President - Supply Chain. Mr. Santos Junior has a degree in Chemical and Food Engineering from the Universidade Federal de Rio Grande (FURG) with
specialization in business administration from FGV in São Paulo and Universidade de Campinas (UNICAMP). He began his career at Sadia in 1988, gaining experience in the areas of production, engineering, industrialexcellence, RD&I and integrated planning.
LeonardoAlmeidaByrro— Vice President – Planning and Distribution. Mr. Byrro worked in AmBev from 2004 to 2008, gaining experience in the areas of sales, marketing and supply. Mr. Byrro served as CEO ofCremer S.A. from 2013 to 2016. He holds a degree in Electric Engineering from Escola de Engenharia Mauá, and an MBA from Kellogg School of Management.
ArturParanhosTacla– Vice-President – People. Mr. Tacla has more than 25 years of experience with organizational and clinic performance, focused on organizational changes, team building, leadershipdevelopment and coaching. Mr. Tacla holds a degree in psychology from PUC-SP and a specialization and certification in crisis management from Traumatology Institute – University of South Florida.
At the meeting of the Board of Directors held on March 10, 2017, the Board acknowledged the resignation of José Alexandre Carneiro Borges, who used to serve as Chief Financial and Investor Relations Officer, andRodrigo Reghini Vieira, who used to serve as Vice President - Innovation, Marketing and Quality.
105
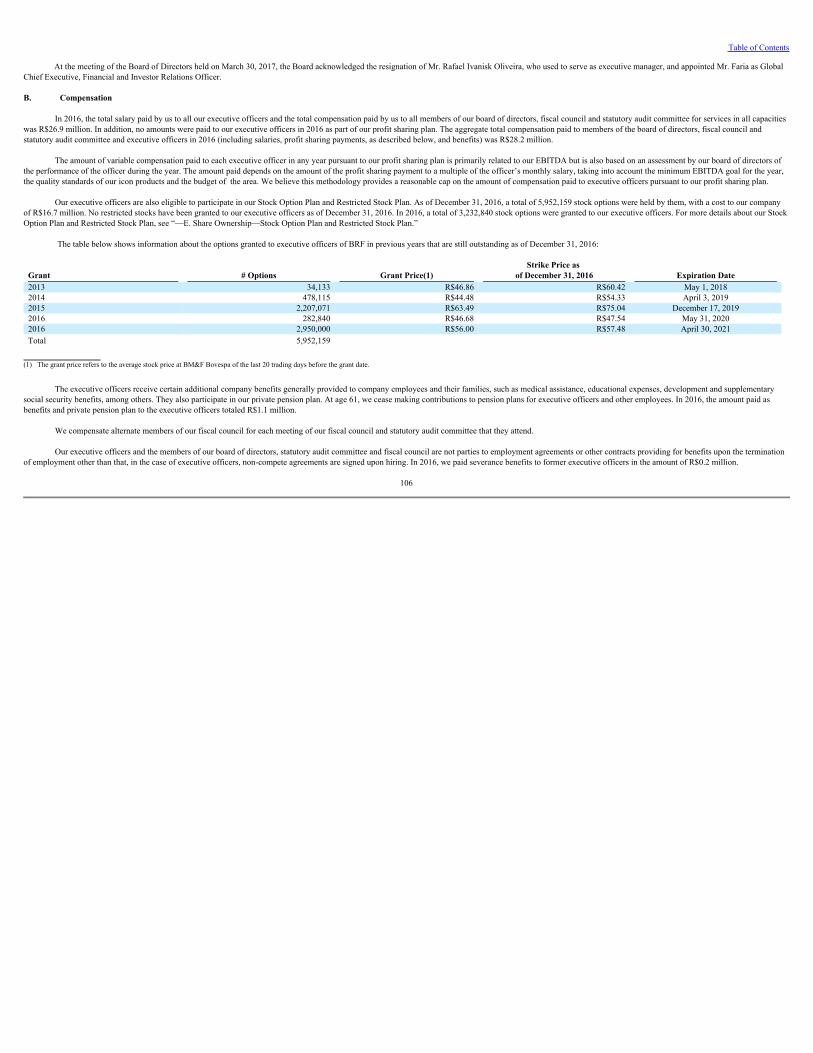
Table of Contents
At the meeting of the Board of Directors held on March 30, 2017, the Board acknowledged the resignation of Mr. Rafael Ivanisk Oliveira, who used to serve as executive manager, and appointed Mr. Faria as GlobalChief Executive, Financial and Investor Relations Officer.
B. Compensation
In 2016, the total salary paid by us to all our executive officers and the total compensation paid by us to all members of our board of directors, fiscal council and statutory audit committee for services in all capacitieswas R$26.9 million. In addition, no amounts were paid to our executive officers in 2016 as part of our profit sharing plan. The aggregate total compensation paid to members of the board of directors, fiscal council andstatutory audit committee and executive officers in 2016 (including salaries, profit sharing payments, as described below, and benefits) was R$28.2 million.
The amount of variable compensation paid to each executive officer in any year pursuant to our profit sharing plan is primarily related to our EBITDA but is also based on an assessment by our board of directors ofthe performance of the officer during the year. The amount paid depends on the amount of the profit sharing payment to a multiple of the officer’s monthly salary, taking into account the minimum EBITDA goal for the year,the quality standards of our icon products and the budget of the area. We believe this methodology provides a reasonable cap on the amount of compensation paid to executive officers pursuant to our profit sharing plan.
Our executive officers are also eligible to participate in our Stock Option Plan and Restricted Stock Plan. As of December 31, 2016, a total of 5,952,159 stock options were held by them, with a cost to our companyof R$16.7 million. No restricted stocks have been granted to our executive officers as of December 31, 2016. In 2016, a total of 3,232,840 stock options were granted to our executive officers. For more details about our StockOption Plan and Restricted Stock Plan, see “—E. Share Ownership—Stock Option Plan and Restricted Stock Plan.”
The table below shows information about the options granted to executive officers of BRF in previous years that are still outstanding as of December 31, 2016:
Grant # Options Grant Price(1)Strike Price as
of December 31, 2016 Expiration Date2013 34,133 R$46.86 R$60.42 May 1, 20182014 478,115 R$44.48 R$54.33 April 3, 20192015 2,207,071 R$63.49 R$75.04 December 17, 20192016 282,840 R$46.68 R$47.54 May 31, 20202016 2,950,000 R$56.00 R$57.48 April 30, 2021Total 5,952,159
(1) The grant price refers to the average stock price at BM&F Bovespa of the last 20 trading days before the grant date.
The executive officers receive certain additional company benefits generally provided to company employees and their families, such as medical assistance, educational expenses, development and supplementarysocial security benefits, among others. They also participate in our private pension plan. At age 61, we cease making contributions to pension plans for executive officers and other employees. In 2016, the amount paid asbenefits and private pension plan to the executive officers totaled R$1.1 million.
We compensate alternate members of our fiscal council for each meeting of our fiscal council and statutory audit committee that they attend.
Our executive officers and the members of our board of directors, statutory audit committee and fiscal council are not parties to employment agreements or other contracts providing for benefits upon the terminationof employment other than that, in the case of executive officers, non-compete agreements are signed upon hiring. In 2016, we paid severance benefits to former executive officers in the amount of R$0.2 million.
106
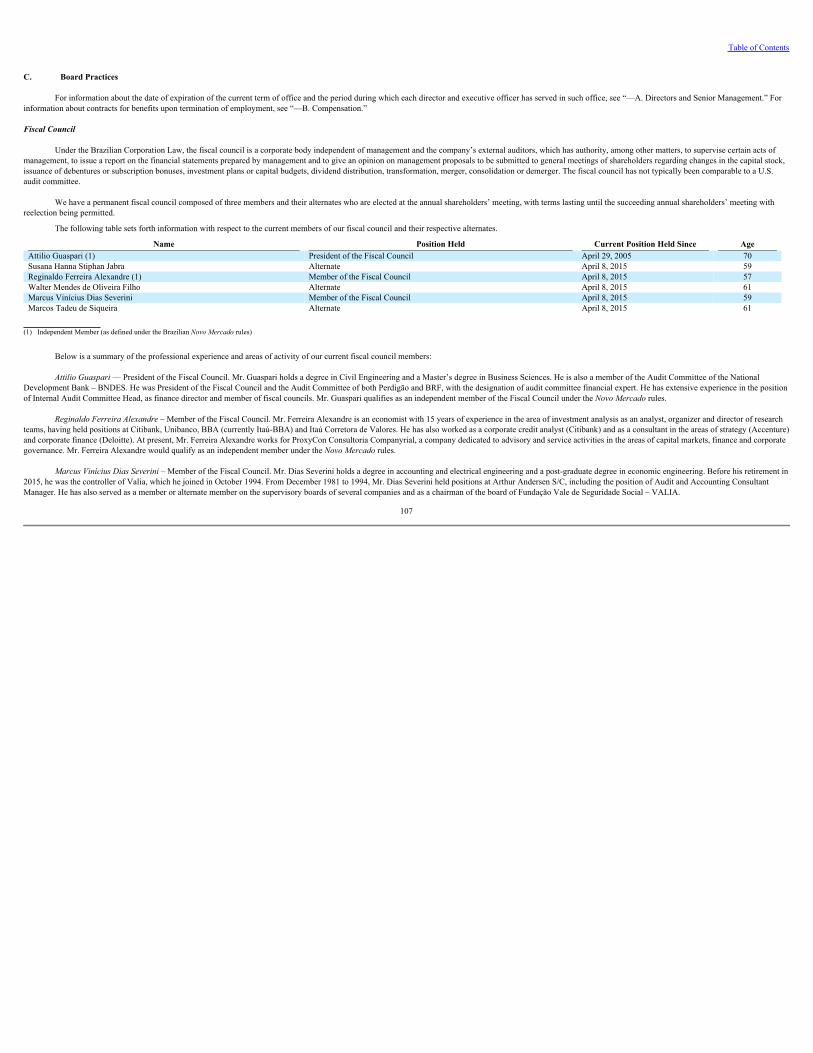
Table of Contents
C. Board Practices
For information about the date of expiration of the current term of office and the period during which each director and executive officer has served in such office, see “—A. Directors and Senior Management.” Forinformation about contracts for benefits upon termination of employment, see “—B. Compensation.”
Fiscal Council
Under the Brazilian Corporation Law, the fiscal council is a corporate body independent of management and the company’s external auditors, which has authority, among other matters, to supervise certain acts ofmanagement, to issue a report on the financial statements prepared by management and to give an opinion on management proposals to be submitted to general meetings of shareholders regarding changes in the capital stock, issuance of debentures or subscription bonuses, investment plans or capital budgets, dividend distribution, transformation, merger, consolidation or demerger. The fiscal council has not typically been comparable to a U.S.audit committee.
We have a permanent fiscal council composed of three members and their alternates who are elected at the annual shareholders’ meeting, with terms lasting until the succeeding annual shareholders’ meeting withreelection being permitted.
The following table sets forth information with respect to the current members of our fiscal council and their respective alternates.
Name Position Held Current Position Held Since AgeAttilio Guaspari (1) President of the Fiscal Council April 29, 2005 70Susana Hanna Stiphan Jabra Alternate April 8, 2015 59Reginaldo Ferreira Alexandre (1) Member of the Fiscal Council April 8, 2015 57Walter Mendes de Oliveira Filho Alternate April 8, 2015 61Marcus Vinícius Dias Severini Member of the Fiscal Council April 8, 2015 59Marcos Tadeu de Siqueira Alternate April 8, 2015 61
(1) Independent Member (as defined under the Brazilian NovoMercadorules)
Below is a summary of the professional experience and areas of activity of our current fiscal council members:
AttilioGuaspari— President of the Fiscal Council. Mr. Guaspari holds a degree in Civil Engineering and a Master’s degree in Business Sciences. He is also a member of the Audit Committee of the NationalDevelopment Bank – BNDES. He was President of the Fiscal Council and the Audit Committee of both Perdigão and BRF, with the designation of audit committee financial expert. He has extensive experience in the positionof Internal Audit Committee Head, as finance director and member of fiscal councils. Mr. Guaspari qualifies as an independent member of the Fiscal Council under the NovoMercadorules.
ReginaldoFerreiraAlexandre–Member of the Fiscal Council. Mr. Ferreira Alexandre is an economist with 15 years of experience in the area of investment analysis as an analyst, organizer and director of researchteams, having held positions at Citibank, Unibanco, BBA (currently Itaú-BBA) and Itaú Corretora de Valores. He has also worked as a corporate credit analyst (Citibank) and as a consultant in the areas of strategy (Accenture)and corporate finance (Deloitte). At present, Mr. Ferreira Alexandre works for ProxyCon Consultoria Companyrial, a company dedicated to advisory and service activities in the areas of capital markets, finance and corporategovernance. Mr. Ferreira Alexandre would qualify as an independent member under the NovoMercadorules.
MarcusViníciusDiasSeverini– Member of the Fiscal Council. Mr. Dias Severini holds a degree in accounting and electrical engineering and a post-graduate degree in economic engineering. Before his retirement in2015, he was the controller of Valia, which he joined in October 1994. From December 1981 to 1994, Mr. Dias Severini held positions at Arthur Andersen S/C, including the position of Audit and Accounting ConsultantManager. He has also served as a member or alternate member on the supervisory boards of several companies and as a chairman of the board of Fundação Vale de Seguridade Social – VALIA.
107
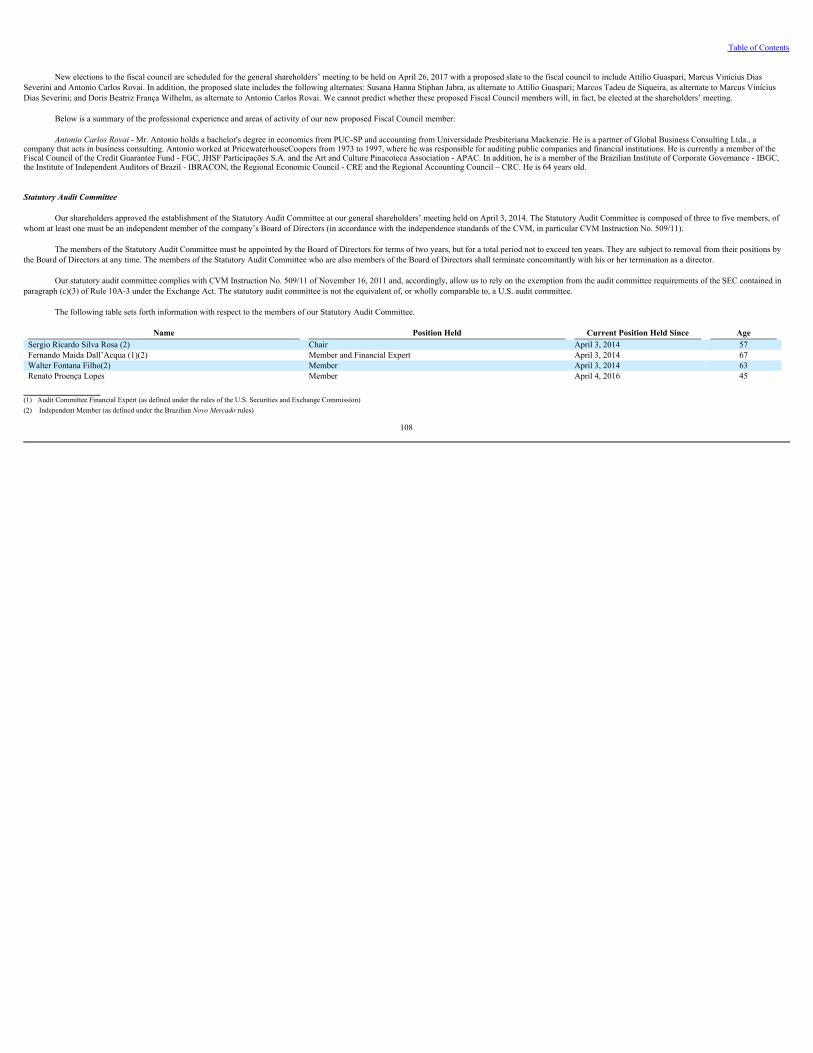
Table of Contents
New elections to the fiscal council are scheduled for the general shareholders’ meeting to be held on April 26, 2017 with a proposed slate to the fiscal council to include Attilio Guaspari, Marcus Vinícius Dias
Severini and Antonio Carlos Rovai. In addition, the proposed slate includes the following alternates: Susana Hanna Stiphan Jabra, as alternate to Attilio Guaspari; Marcos Tadeu de Siqueira, as alternate to Marcus ViníciusDias Severini; and Doris Beatriz França Wilhelm, as alternate to Antonio Carlos Rovai. We cannot predict whether these proposed Fiscal Council members will, in fact, be elected at the shareholders’ meeting.
Below is a summary of the professional experience and areas of activity of our new proposed Fiscal Council member:
AntonioCarlosRovai- Mr. Antonio holds a bachelor's degree in economics from PUC-SP and accounting from Universidade Presbiteriana Mackenzie. He is a partner of Global Business Consulting Ltda., acompany that acts in business consulting. Antonio worked at PricewaterhouseCoopers from 1973 to 1997, where he was responsible for auditing public companies and financial institutions. He is currently a member of theFiscal Council of the Credit Guarantee Fund - FGC, JHSF Participações S.A. and the Art and Culture Pinacoteca Association - APAC. In addition, he is a member of the Brazilian Institute of Corporate Governance - IBGC,the Institute of Independent Auditors of Brazil - IBRACON, the Regional Economic Council - CRE and the Regional Accounting Council – CRC. He is 64 years old.
Statutory Audit Committee
Our shareholders approved the establishment of the Statutory Audit Committee at our general shareholders’ meeting held on April 3, 2014. The Statutory Audit Committee is composed of three to five members, ofwhom at least one must be an independent member of the company’s Board of Directors (in accordance with the independence standards of the CVM, in particular CVM Instruction No. 509/11).
The members of the Statutory Audit Committee must be appointed by the Board of Directors for terms of two years, but for a total period not to exceed ten years. They are subject to removal from their positions bythe Board of Directors at any time. The members of the Statutory Audit Committee who are also members of the Board of Directors shall terminate concomitantly with his or her termination as a director.
Our statutory audit committee complies with CVM Instruction No. 509/11 of November 16, 2011 and, accordingly, allow us to rely on the exemption from the audit committee requirements of the SEC contained inparagraph (c)(3) of Rule 10A-3 under the Exchange Act. The statutory audit committee is not the equivalent of, or wholly comparable to, a U.S. audit committee.
The following table sets forth information with respect to the members of our Statutory Audit Committee.
Name Position Held Current Position Held Since AgeSergio Ricardo Silva Rosa (2) Chair April 3, 2014 57Fernando Maida Dall’Acqua (1)(2) Member and Financial Expert April 3, 2014 67Walter Fontana Filho(2) Member April 3, 2014 63Renato Proença Lopes Member April 4, 2016 45
(1) Audit Committee Financial Expert (as defined under the rules of the U.S. Securities and Exchange Commission)(2) Independent Member (as defined under the Brazilian NovoMercadorules)
108
Table of Contents
Below is a summary of the professional experience and areas of activity of our current members of the Statutory Audit Committee:
SérgioRicardoSilvaRosa–Chair of the Statutory Audit Committee. Mr. Silva Rosa graduated in journalism from the Arts and Communication School of USP. Mr. Silva Rosa was investment director of ABRAPP;a member of the Social and Economic Development Council (CDES) and a founder and member of the PRI (Principles for Responsible Investment) Council, a United Nations-supported program. Mr. Silva Rosa was aDirector of the Bank Workers Labor Union, President of the National Confederation of Bank Workers under the umbrella of the United Workers Central - CUT and the Latin American Bank Workers Federation. He was amember of São Paulo city council between 1994 and 1996. He was also a member of the Board of America Latina Logística S.A. and Brasil Telecom S.A. He was president of the executive directors for the companies:Valepar S.A., Litel S.A., 521 Participações, BrasilPrev and PREVI - Caixa de Previdência dos Funcionários do Banco do Brasil between 2003 and 2010, where he also held the position of Equity Investment Director. Hechaired the Board of Companhia Vale S.A. between 2003 and 2010, and was the Vice Chairman of the Board of Directors of BRF S.A. between 2013 and 2015.
FernandoMaidaDall’Acqua– Member of the Statutory Audit Committee and its Financial Expert. Mr. Dall’Acqua holds a master degree in business administration from the Getulio Vargas Foundation, a PhD inEconomic Development from the University of Wisconsin-Madison, USA, and received the post-doctoral title of “Livre Docente” in Business Administration from the Getulio Vargas Foundation. He is a Professor ofEconomics at the School of Administration of São Paulo (Getulio Vargas Foundation) and provides consulting services to major companies on mergers and acquisitions, economic and financial valuation and macroeconomicand tax advisory services. He was the Chairman of the Fiscal Council of Grupo Pão de Açúcar and Viavarejo. He is currently a Board member and chairman of the Audit Committee of ISA-CTEEP and the chairman of theAudit Committee of OEstadodeSãoPaulonewspaper. He was the Finance Secretary of the São Paulo and has held financial, tax, budget and strategic management positions, besides serving as a member of the São PauloState Privatization Council. He was director of the Project Center for Latin America and the Caribbean of the IICA/OEA. He was also a member of the Board of Directors and the Audit Committee of Sabesp and a member ofthe Boards of CESP, PRODESP, DERSA, Banco Nossa Caixa and Banespa, as well as served on the Advisory Board of Grupo Pão de Açúcar. He was president of the People Bank of the São Paulo Government . He was alsoa Fellow at Michigan State University, U.S.A. and adviser of the World Bank for fiscal policy and credit market and of the Ministry of Finance of the Brazilian government.
Please see “—A. Directors and Senior Management” for the biographical information of Mr. Fontana Filho and Mr. Proença Lopes.
For more information about the Statutory Audit Committee, see “Item 10. Additional Information –– B. Memorandum and Articles of Association –– Statutory Audit Committee.”
Advisory Committees for our Board of Directors
Under our bylaws, our Board of Directors may, for advisory purposes, set up technical or consultative committees, of a non-deliberative nature, to undertake special tasks or general activities of interest to us.
In addition to the Statutory Audit Committee, we have other three advisory committees for our Board of Directors: (i) Strategy, M&A and Markets Committee, (ii) Finance, Governance and Sustainability Committee,and (iii) People, Organization and Culture Committee. They are composed of members of our Board of Directors, as well as other professionals.
The People, Organization and Culture Committee is responsible for advising the board of directors in setting compensation policies and the compensation of executives and employees, provides support to theexecutive officers in the assessment, selection and development of top leadership, advises the board of directors in the formulation and practice of BRF culture to monitor and encourage proper behavior of leaders, andproposes actions to align the expectations of shareholders and executives. Its current members are Vicente Falconi Campos (Chairman), Henri Philippe Reichstul, José Carlos Reis de Magalhães Neto, Luiz Fernando Furlanand Manoel Cordeiro Silva Filho. This committee is not the equivalent of, or wholly comparable to, a U.S. compensation committee.
109
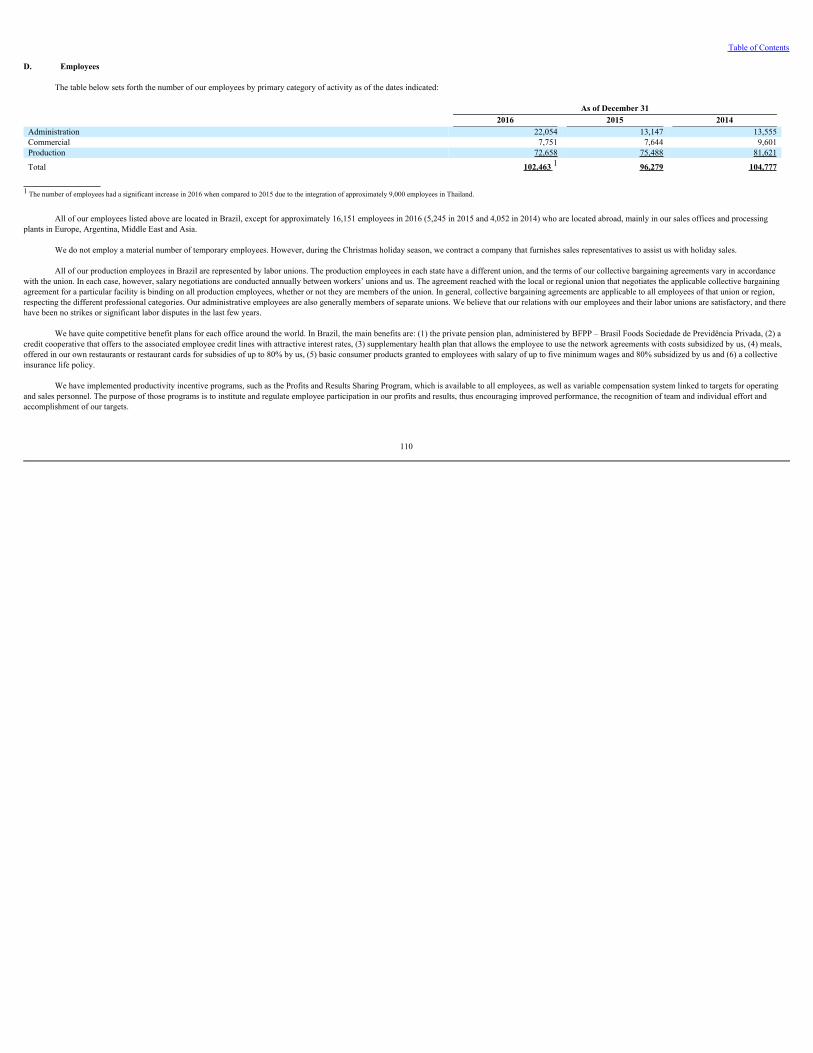
Table of Contents
D. Employees
The table below sets forth the number of our employees by primary category of activity as of the dates indicated:
As of December 31 2016 2015 2014Administration 22,054 13,147 13,555Commercial 7,751 7,644 9,601Production 72,658 75,488 81,621
Total 102,463 1 96,279 104,777 1 The number of employees had a significant increase in 2016 when compared to 2015 due to the integration of approximately 9,000 employees in Thailand.
All of our employees listed above are located in Brazil, except for approximately 16,151 employees in 2016 (5,245 in 2015 and 4,052 in 2014) who are located abroad, mainly in our sales offices and processingplants in Europe, Argentina, Middle East and Asia.
We do not employ a material number of temporary employees. However, during the Christmas holiday season, we contract a company that furnishes sales representatives to assist us with holiday sales.
All of our production employees in Brazil are represented by labor unions. The production employees in each state have a different union, and the terms of our collective bargaining agreements vary in accordancewith the union. In each case, however, salary negotiations are conducted annually between workers’ unions and us. The agreement reached with the local or regional union that negotiates the applicable collective bargainingagreement for a particular facility is binding on all production employees, whether or not they are members of the union. In general, collective bargaining agreements are applicable to all employees of that union or region,respecting the different professional categories. Our administrative employees are also generally members of separate unions. We believe that our relations with our employees and their labor unions are satisfactory, and therehave been no strikes or significant labor disputes in the last few years.
We have quite competitive benefit plans for each office around the world. In Brazil, the main benefits are: (1) the private pension plan, administered by BFPP – Brasil Foods Sociedade de Previdência Privada, (2) acredit cooperative that offers to the associated employee credit lines with attractive interest rates, (3) supplementary health plan that allows the employee to use the network agreements with costs subsidized by us, (4) meals,offered in our own restaurants or restaurant cards for subsidies of up to 80% by us, (5) basic consumer products granted to employees with salary of up to five minimum wages and 80% subsidized by us and (6) a collectiveinsurance life policy.
We have implemented productivity incentive programs, such as the Profits and Results Sharing Program, which is available to all employees, as well as variable compensation system linked to targets for operatingand sales personnel. The purpose of those programs is to institute and regulate employee participation in our profits and results, thus encouraging improved performance, the recognition of team and individual effort andaccomplishment of our targets.
110
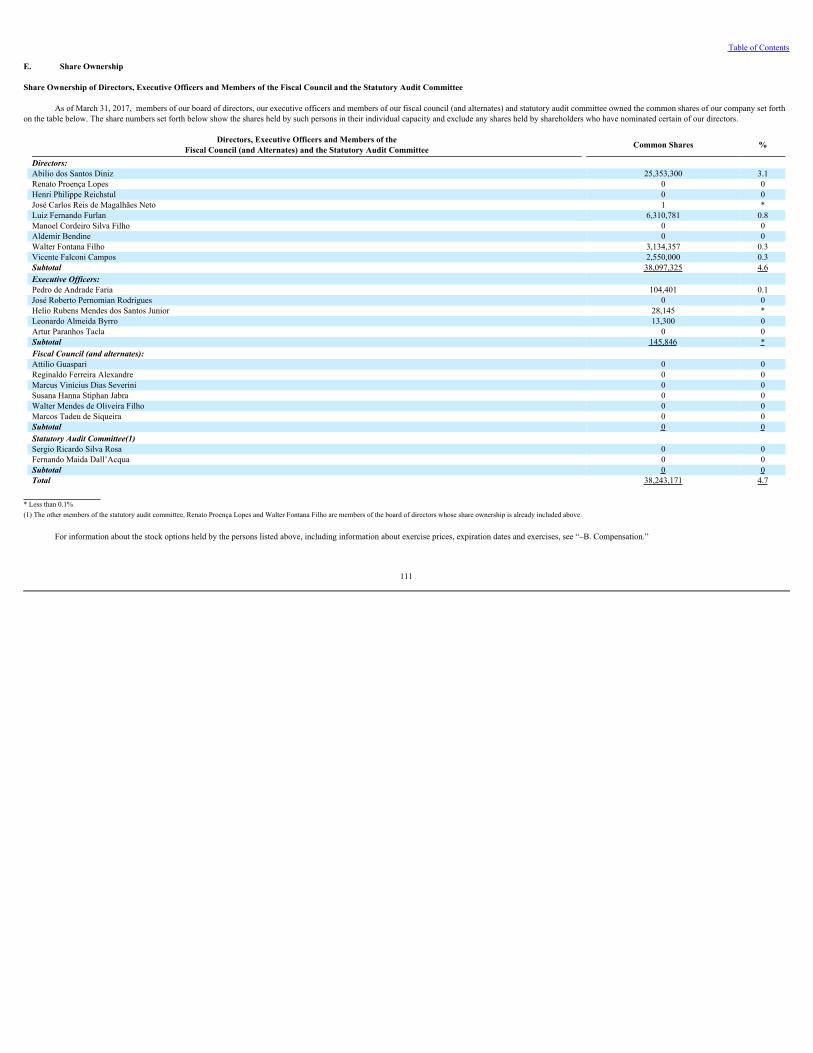
Table of Contents
E. Share Ownership
Share Ownership of Directors, Executive Officers and Members of the Fiscal Council and the Statutory Audit Committee
As of March 31, 2017, members of our board of directors, our executive officers and members of our fiscal council (and alternates) and statutory audit committee owned the common shares of our company set forthon the table below. The share numbers set forth below show the shares held by such persons in their individual capacity and exclude any shares held by shareholders who have nominated certain of our directors.
Directors, Executive Officers and Members of theFiscal Council (and Alternates) and the Statutory Audit Committee Common Shares %
Directors: Abilio dos Santos Diniz 25,353,300 3.1Renato Proença Lopes 0 0Henri Philippe Reichstul 0 0José Carlos Reis de Magalhães Neto 1 *Luiz Fernando Furlan 6,310,781 0.8Manoel Cordeiro Silva Filho 0 0Aldemir Bendine 0 0Walter Fontana Filho 3,134,357 0.3Vicente Falconi Campos 2,550,000 0.3Subtotal 38,097,325 4.6Executive Officers: Pedro de Andrade Faria 104,401 0.1José Roberto Pernomian Rodrigues 0 0Helio Rubens Mendes dos Santos Junior 28,145 *Leonardo Almeida Byrro 13,300 0Artur Paranhos Tacla 0 0Subtotal 145,846 *Fiscal Council (and alternates): Attilio Guaspari 0 0Reginaldo Ferreira Alexandre 0 0Marcus Vinícius Dias Severini 0 0Susana Hanna Stiphan Jabra 0 0Walter Mendes de Oliveira Filho 0 0Marcos Tadeu de Siqueira 0 0Subtotal 0 0Statutory Audit Committee(1) Sergio Ricardo Silva Rosa 0 0Fernando Maida Dall’Acqua 0 0Subtotal 0 0Total 38,243,171 4.7
* Less than 0.1%(1) The other members of the statutory audit committee, Renato Proença Lopes and Walter Fontana Filho are members of the board of directors whose share ownership is already included above.
For information about the stock options held by the persons listed above, including information about exercise prices, expiration dates and exercises, see “–B. Compensation.”
111
Table of Contents
Stock Option Plan and Restricted Stock Plan
We have a long-term stock option plan for the executive officers and other employees of BRF and its subsidiaries for the award of stock options. This plan is part of the eligible executives’ compensation and isintended to attract, retain and motivate our executives in order to generate value for our companies and align their interests with the interests of our shareholders.
The current stock option plan has been approved at the shareholder meeting held on April 8, 2015. This new plan replaces the stock option plan approved on March 31, 2010 and modified on April 24, 2012, March 9,2013 and April 3, 2014.
The Stock Option Plan is managed by our board of directors. Exercise prices of stock options granted under the Stock Option Plan are determined by our board of directors on the grant date based on the averageclosing price of our shares on the 20 trading days preceding the grant date. Exercise prices are adjusted monthly based on the IPCA.
The current plan presents some changes from the previous plan, as described below:
the maximum number of options granted under the Stock Option Plan may not exceed, at any time, the amount equivalent to 2% of the total number of common shares issued by BRF; stock options granted under the Stock Option Plan vest over four years in four equal annual installments; after exercising the stock option and purchasing shares, the participant must hold at least part of those shares for at least one year before selling them and is only permitted to sell up to the number of shareswhose value covers their purchase price prior to the one-year date (lock-up); and in case of retirement or termination of the contract (resignation or dismissal) other than with cause, the participant may exercise the options accrued up to that date, and the remaining options will beimmediately canceled.
As of December 31, 2016, a total of 39,365,781 options had been granted, of which 16,506,807 were outstanding and held by approximately 264 persons. During the year ended December 31, 2016, 140,600 optionswere exercised at an average exercise price of R$45.18 per share for aggregate payments to our company of R$6.4 million. As of December 31, 2016, the weighted average strike price of our outstanding options was R$60.33per share, and the weighted average of the remaining contractual terms was 41 months. No individual has received a number of options for common shares that, together with the common shares owned by that individual,exceed one percent of our common shares.
For more information about the Stock Option Plan, including information about exercise prices, expiration dates and exercises, see Note 25 to our consolidated financial statements.
In addition to changes to our Stock Option Plan, our shareholders approved the Restricted Stock Plan for employees at the shareholder meeting held on April 8, 2015. The purpose of the Restricted Stock Plan is,among others, to stimulate the expansion, success and the achievement of social objectives of the Company; align the interests of shareholders of the Company to the plan participants and allow the Company or othercompanies under its control to attract and retain eligible persons.
The Restricted Stock Plan is managed by our board of directors. As administrator of this plan, our board of directors may invite a limited number of executives to use their bonus to invest in stocks of BRF. Byinvesting at least 25% of their bonus, the company would grant restricted shares that would be given to participants after 3 years as long as certain goals related to TSR (Total Shareholder Return) are achieved by thecompany. If the participant is laid off during those three years, the restricted shares will be immediately canceled.
112
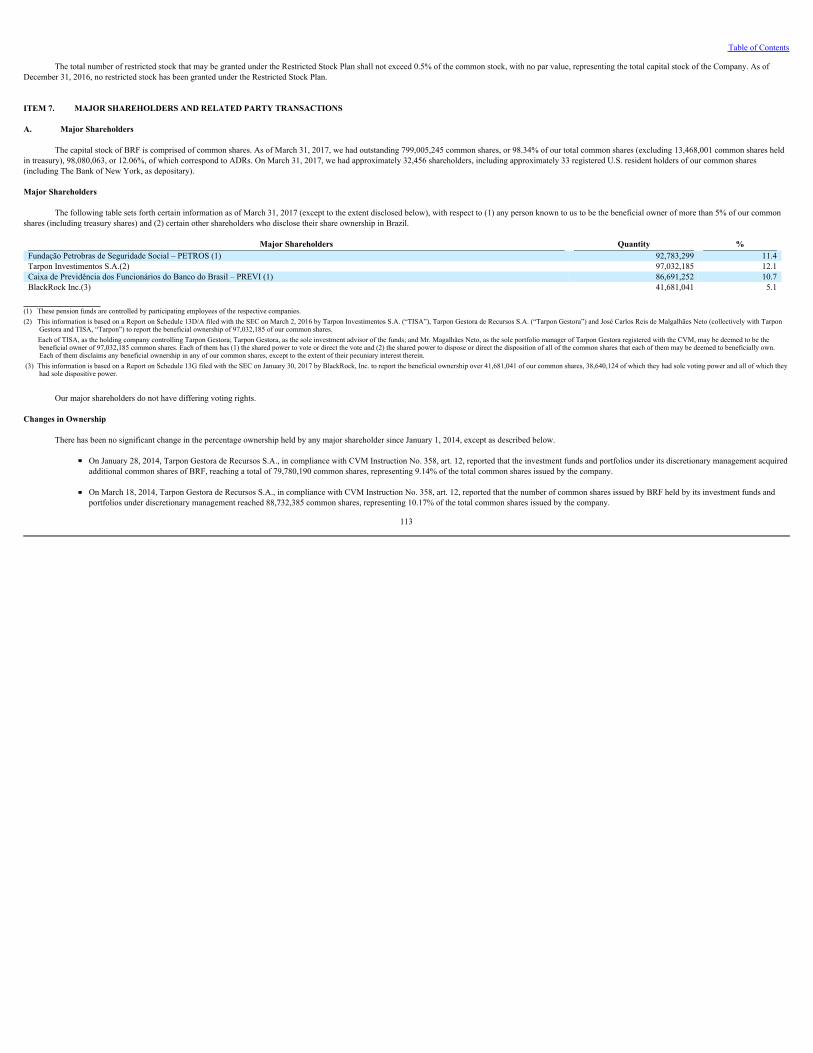
Table of Contents
The total number of restricted stock that may be granted under the Restricted Stock Plan shall not exceed 0.5% of the common stock, with no par value, representing the total capital stock of the Company. As ofDecember 31, 2016, no restricted stock has been granted under the Restricted Stock Plan.
ITEM 7. MAJOR SHAREHOLDERS AND RELATED PARTY TRANSACTIONS
A. Major Shareholders
The capital stock of BRF is comprised of common shares. As of March 31, 2017, we had outstanding 799,005,245 common shares, or 98.34% of our total common shares (excluding 13,468,001 common shares heldin treasury), 98,080,063, or 12.06%, of which correspond to ADRs. On March 31, 2017, we had approximately 32,456 shareholders, including approximately 33 registered U.S. resident holders of our common shares(including The Bank of New York, as depositary).
Major Shareholders
The following table sets forth certain information as of March 31, 2017 (except to the extent disclosed below), with respect to (1) any person known to us to be the beneficial owner of more than 5% of our commonshares (including treasury shares) and (2) certain other shareholders who disclose their share ownership in Brazil.
Major Shareholders Quantity %Fundação Petrobras de Seguridade Social – PETROS (1) 92,783,299 11.4Tarpon Investimentos S.A.(2) 97,032,185 12.1Caixa de Previdência dos Funcionários do Banco do Brasil – PREVI (1) 86,691,252 10.7BlackRock Inc.(3) 41,681,041 5.1
(1) These pension funds are controlled by participating employees of the respective companies.(2) This information is based on a Report on Schedule 13D/A filed with the SEC on March 2, 2016 by Tarpon Investimentos S.A. (“TISA”), Tarpon Gestora de Recursos S.A. (“Tarpon Gestora”) and José Carlos Reis de Malgalhāes Neto (collectively with Tarpon
Gestora and TISA, “Tarpon”) to report the beneficial ownership of 97,032,185 of our common shares. Each of TISA, as the holding company controlling Tarpon Gestora; Tarpon Gestora, as the sole investment advisor of the funds; and Mr. Magalhães Neto, as the sole portfolio manager of Tarpon Gestora registered with the CVM, may be deemed to be the
beneficial owner of 97,032,185 common shares. Each of them has (1) the shared power to vote or direct the vote and (2) the shared power to dispose or direct the disposition of all of the common shares that each of them may be deemed to beneficially own.Each of them disclaims any beneficial ownership in any of our common shares, except to the extent of their pecuniary interest therein.
(3) This information is based on a Report on Schedule 13G filed with the SEC on January 30, 2017 by BlackRock, Inc. to report the beneficial ownership over 41,681,041 of our common shares, 38,640,124 of which they had sole voting power and all of which theyhad sole dispositive power.
Our major shareholders do not have differing voting rights.
Changes in Ownership
There has been no significant change in the percentage ownership held by any major shareholder since January 1, 2014, except as described below.
On January 28, 2014, Tarpon Gestora de Recursos S.A., in compliance with CVM Instruction No. 358, art. 12, reported that the investment funds and portfolios under its discretionary management acquiredadditional common shares of BRF, reaching a total of 79,780,190 common shares, representing 9.14% of the total common shares issued by the company. On March 18, 2014, Tarpon Gestora de Recursos S.A., in compliance with CVM Instruction No. 358, art. 12, reported that the number of common shares issued by BRF held by its investment funds andportfolios under discretionary management reached 88,732,385 common shares, representing 10.17% of the total common shares issued by the company.
113
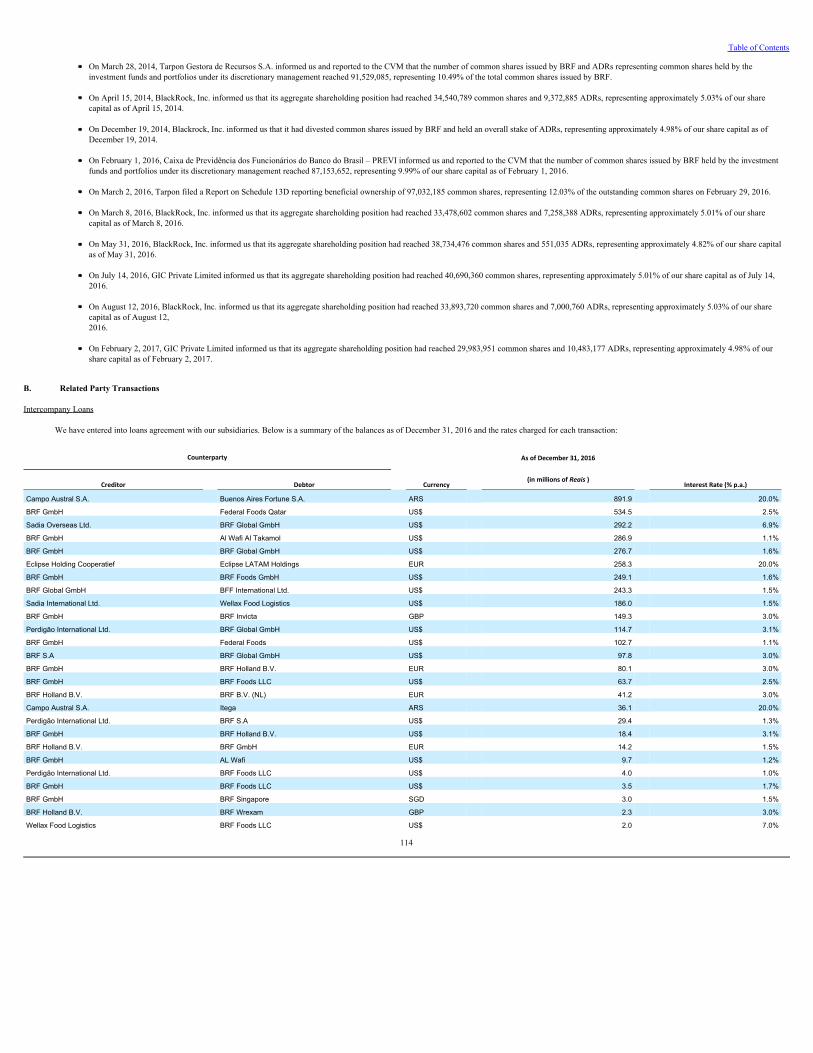
Table of Contents
On March 28, 2014, Tarpon Gestora de Recursos S.A. informed us and reported to the CVM that the number of common shares issued by BRF and ADRs representing common shares held by theinvestment funds and portfolios under its discretionary management reached 91,529,085, representing 10.49% of the total common shares issued by BRF. On April 15, 2014, BlackRock, Inc. informed us that its aggregate shareholding position had reached 34,540,789 common shares and 9,372,885 ADRs, representing approximately 5.03% of our sharecapital as of April 15, 2014. On December 19, 2014, Blackrock, Inc. informed us that it had divested common shares issued by BRF and held an overall stake of ADRs, representing approximately 4.98% of our share capital as ofDecember 19, 2014. On February 1, 2016, Caixa de Previdência dos Funcionários do Banco do Brasil – PREVI informed us and reported to the CVM that the number of common shares issued by BRF held by the investmentfunds and portfolios under its discretionary management reached 87,153,652, representing 9.99% of our share capital as of February 1, 2016. On March 2, 2016, Tarpon filed a Report on Schedule 13D reporting beneficial ownership of 97,032,185 common shares, representing 12.03% of the outstanding common shares on February 29, 2016. On March 8, 2016, BlackRock, Inc. informed us that its aggregate shareholding position had reached 33,478,602 common shares and 7,258,388 ADRs, representing approximately 5.01% of our sharecapital as of March 8, 2016. On May 31, 2016, BlackRock, Inc. informed us that its aggregate shareholding position had reached 38,734,476 common shares and 551,035 ADRs, representing approximately 4.82% of our share capitalas of May 31, 2016. On July 14, 2016, GIC Private Limited informed us that its aggregate shareholding position had reached 40,690,360 common shares, representing approximately 5.01% of our share capital as of July 14,2016. On August 12, 2016, BlackRock, Inc. informed us that its aggregate shareholding position had reached 33,893,720 common shares and 7,000,760 ADRs, representing approximately 5.03% of our sharecapital as of August 12, 2016. On February 2, 2017, GIC Private Limited informed us that its aggregate shareholding position had reached 29,983,951 common shares and 10,483,177 ADRs, representing approximately 4.98% of ourshare capital as of February 2, 2017.
B. Related Party Transactions
Intercompany Loans
We have entered into loans agreement with our subsidiaries. Below is a summary of the balances as of December 31, 2016 and the rates charged for each transaction:
Counterparty
Currency
AsofDecember31,2016
InterestRate(%p.a.)Creditor Debtor (inmillionsofReais )
Campo Austral S.A. Buenos Aires Fortune S.A. ARS 891.9 20.0%
BRF GmbH Federal Foods Qatar US$ 534.5 2.5%
Sadia Overseas Ltd. BRF Global GmbH US$ 292.2 6.9%
BRF GmbH Al Wafi Al Takamol US$ 286.9 1.1%
BRF GmbH BRF Global GmbH US$ 276.7 1.6%
Eclipse Holding Cooperatief Eclipse LATAM Holdings EUR 258.3 20.0%
BRF GmbH BRF Foods GmbH US$ 249.1 1.6%
BRF Global GmbH BFF International Ltd. US$ 243.3 1.5%
Sadia International Ltd. Wellax Food Logistics US$ 186.0 1.5%
BRF GmbH BRF Invicta GBP 149.3 3.0%
Perdigão International Ltd. BRF Global GmbH US$ 114.7 3.1%
BRF GmbH Federal Foods US$ 102.7 1.1%
BRF S.A BRF Global GmbH US$ 97.8 3.0%
BRF GmbH BRF Holland B.V. EUR 80.1 3.0%
BRF GmbH BRF Foods LLC US$ 63.7 2.5%
BRF Holland B.V. BRF B.V. (NL) EUR 41.2 3.0%
Campo Austral S.A. Itega ARS 36.1 20.0%
Perdigão International Ltd. BRF S.A US$ 29.4 1.3%
BRF GmbH BRF Holland B.V. US$ 18.4 3.1%
BRF Holland B.V. BRF GmbH EUR 14.2 1.5%
BRF GmbH AL Wafi US$ 9.7 1.2%
Perdigão International Ltd. BRF Foods LLC US$ 4.0 1.0%
BRF GmbH BRF Foods LLC US$ 3.5 1.7%
BRF GmbH BRF Singapore SGD 3.0 1.5%
BRF Holland B.V. BRF Wrexam GBP 2.3 3.0%
Wellax Food Logistics BRF Foods LLC US$ 2.0 7.0%
114
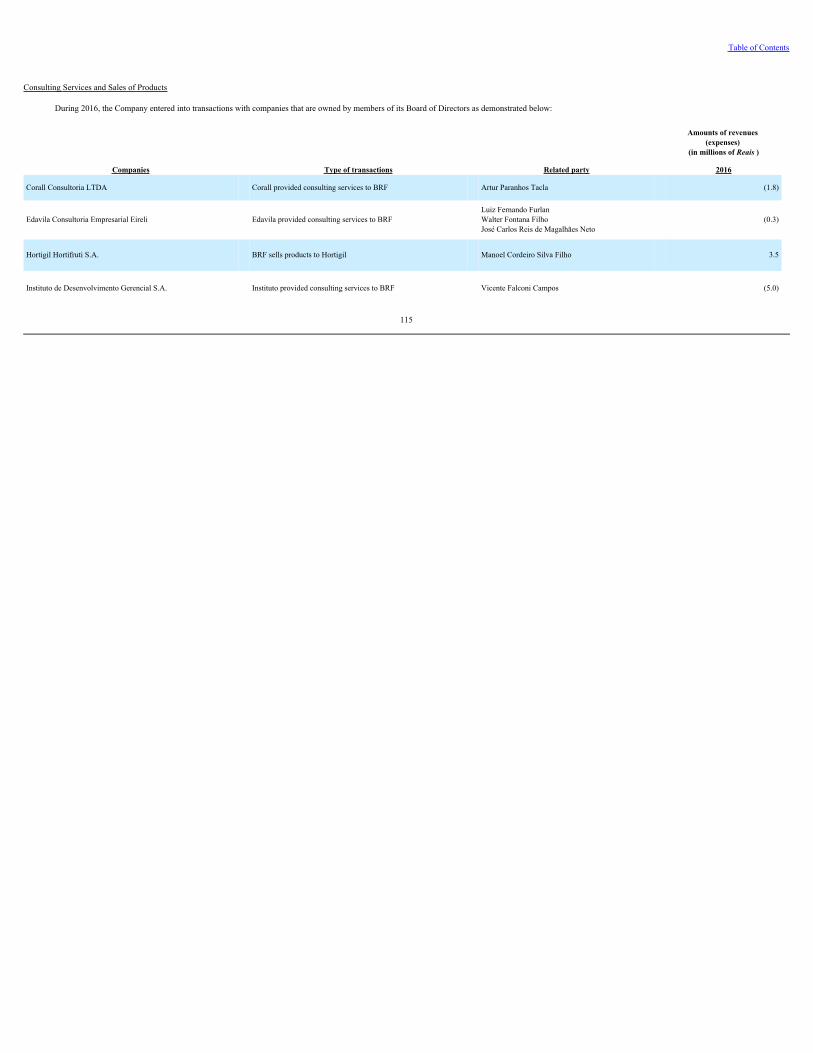
Table of Contents
Consulting Services and Sales of Products
During 2016, the Company entered into transactions with companies that are owned by members of its Board of Directors as demonstrated below:
Amounts of revenues (expenses)
(in millions of Reais )
Companies Type of transactions Related party 2016
Corall Consultoria LTDA Corall provided consulting services to BRF Artur Paranhos Tacla (1.8)
Edavila Consultoria Empresarial Eireli Edavila provided consulting services to BRF Luiz Fernando Furlan Walter Fontana Filho José Carlos Reis de Magalhães Neto
(0.3)
Hortigil Hortifruti S.A. BRF sells products to Hortigil Manoel Cordeiro Silva Filho 3.5
Instituto de Desenvolvimento Gerencial S.A. Instituto provided consulting services to BRF Vicente Falconi Campos (5.0)
115
Table of Contents
Arrangements with FAF
The Company leased properties owned by the Francisco Xavier Fontana Foundation (“FAF”), a foundation established by members of the Furlan and Fontana families, some of which are members of our board ofdirectors. For the year ended December 31, 2016, the total amount of rental payments paid to FAF was R$14.4 million. The rent value was set based on market conditions.
Transactions with Sustainability Institutes
We are the guarantors of a loan obtained by the Sadia Sustainability Institute ( Instituto Sadia de Sustentabilidade) from BNDES. The loan was obtained with the purpose of allowing the implementation ofbiodigesters in the farms of the outgrowers which take part in Sadia’s integration system, targeting the reduction of greenhouse gases emission. The value of these guarantees on December 31, 2016 totaled R$28.4 million.
We had a liability in the amount of R$6.2 million as of December 31, 2016 related to the fair value of these guarantees (for more details, see “Item 5E – Operating and Financial Review and Prospects – Off-balanceSheet Arrangements”).
In addition, we had, as of December 31, 2016, a liability in the amount of R$22.2 million within other obligations with this entity in connection with our acquisition of biodigesters from Instituto Sadia deSustentabilidade.
C. Interests of Experts and Counsel
Not applicable.
ITEM 8. FINANCIAL INFORMATION
A. Consolidated Statements and Other Financial Information
See Exhibits.
Legal Proceedings
We are involved in certain legal proceedings arising from the regular course of business, which include civil, administrative, tax, social insurance and labor lawsuits.
We classify the risk of adverse decisions in the legal suits as “remote,” “possible” or “probable.” We record provisions for probable losses in our financial statements in connection with these proceedings in anamount determined by our management on the basis of legal advice. We disclose the aggregate amounts of these proceedings that we have judged possible or probable, to the extent those amounts can be reasonably estimated,and we record provisions only for losses that we consider probable. However, the amounts involved in certain of the proceedings are substantial, and the losses to us could, therefore, be significantly higher than the amountsfor which we have recorded provisions, if any. Even for the amounts recorded as provisions for probable losses, a judgment against us would have an effect on our cash flow if we are required to pay those amounts. See “Item3. Key Information—D. Risk Factors—Risks Relating to Our Business and Industry— Unfavorable outcomes in legal proceedings may reduce our liquidity and negatively affect us.”
116
Table of Contents
Tax Proceedings
ContingenciesforProbableLosses
We are engaged in several legal proceedings with Brazilian tax authorities for which we have recorded provisions for probable losses. As of December 31, 2016, our provisions for such tax proceedings was R$281.7million, compared to R$240.6 million as of December 31, 2015. We consider our estimate tax provisions relating to our business combination with Sadia, Avex and Danica.
The tax contingencies classified as probable losses involve the following main legal proceedings:
ICMS:We are involved in a number of administrative and judicial tax disputes regarding the recording and/or use of amounts paid in respect of the Tax on the Circulation of Merchandise and Services (ImpostoSobreaCirculaçãodeMercadoriaseServiços), or “ICMS,” as tax credits against other taxes assessed on certain transactions, such as exports, acquisition of consumption materials and monetarycorrection. The provision amount is R$129.1 million as of December 31, 2016 (R$107.7 million as of December 31, 2015). PISandCOFINS:We are involved in administrative proceedings related to the use of federal PIS and COFINS tax credits to offset other federal taxes, in the amount of R$102.0 million as of December 31,2016 (R$77.5 million as of December 31, 2015). Although we intend to vigorously defend against these tax assessment notices and related administrative proceedings, we expect that the number of casesand the aggregate amount of possible losses will continue to increase as the tax authorities address later tax years. Othertaxcontingencies:We recorded other provisions for lawsuits related to the payment of social security contributions under various Brazilian government programs (SAT, INCRA, FUNRURAL,Education Salary) and tax liabilities relating to accessory obligations, the payment of legal fees and other tax matters in a total amount of R$105.4 million as of December, 31, 2016 (R$52.0 million as ofDecember 31, 2015).
ContingenciesforPossibleLosses
The amount of tax contingencies for which the probability of loss was classified as “possible” was R$11,953.1 million as of December 31, 2016 (R$10,569.9 million as of December 31, 2015). Of this amount,R$490.3 million as of December 31, 2016 (R$511.4 million as of December 31, 2015) reflected our fair value estimate of contingent tax liabilities relating to our business combination with Sadia, Avex and Danica.
The most significant of these tax cases for which the risk of loss is classified as possible are described below:
· PISandCOFINS: We are involved in administrative proceedings regarding the use of PIS and COFINS tax credits to offset other federal tax liabilities in the amount of R$3,614.9 million as of December 31, 2016(R$3,097.2 million as of December 31, 2015). The 2016 increase relates to new cases as well as to monetary indexation of existing cases.
o On January 4, 2016 and April 14, 2016, the Brazilian Internal Revenue Service (Secretaria da Receita Federal) filed several tax assessments against us in the total amount of R$209.8 million as of December31, 2016 related to the use of federal PIS and COFINS tax credits to offset other federal taxes carried out in the first and second quarters of 2011 and 2012, respectively. We filed administrative appeals thatare still waiting for decisions by the lower administrative court.
· ICMS:We are involved in a number of disputes related to the ICMS tax: (1) allegedly undue ICMS tax credits generated by tax incentives granted by states of origin (known as the guerrafiscaldispute) in a totalamount of R$2,153.5 million as of December 31, 2016 (R$2,267.7 million as of December 31, 2015); (2) the maintenance of ICMS tax credits on the acquisition of staple foods ( cestabásica) with a reduced taxburden in a total amount of R$716.2 million as of December 31, 2016 (R$547.6 million as of December 31, 2015); (3) the absence of evidence to prove the balances of exports in the amount of R$356.8 million as ofDecember 31, 2016 (R$324.8 million as of December 31, 2015); and (4) R$1,763.2 million as of December 31, 2016 (R$1,416.9 million as of December 31, 2015) related to other tax lawsuits regarding ICMS.
117
Table of Contents
o With respect to the guerrafiscal(item (1) above), on December 14, 2015, BRF received a tax assessment notice from the State of Paraná, demanding a partial rebate of ICMS credits in the total amount ofR$339.6 million for undue credits related to materials used in the production and undue credits over imports.
o With respect to the cestabásica(item (2) above), in a meeting held on October 16, 2014, the Supreme Court of Brazil (“STF”) was favorable to the Tax Authority of the State of Rio Grande do Sul, in thejudgment of the extraordinary appeal No. 635,688 submitted by the company Santa Lúcia, understanding as improper the integral maintenance of ICMS tax credits on the reduced tax basis of food productsthat are classified as staple foods in Brazil. The decision applies to all taxpayers; however, there is still a claim for clarification waiting to be judged, requesting more details related to the timing of suchdecision (previously or only after), which suggests the need to wait for this final decision to recognize the effects on our financial statements.
o On March 30, 2015, the São Paulo State Treasury Office (Secretaria de Fazenda do Estado de São Paulo) filed a tax assessment against us in the amount of R$54.4 million (R$68.2 million on December 31,2016) related to alleged irregularities in the collection of ICMS taxes levied on certain in natura beef transactions carried out in 2012 and 2013. We filed an administrative appeal on April 28, 2015 and awaitthe judicial decision.
· Profitsearnedabroad:We were assessed by the Brazilian Internal Revenue Service for alleged underpayment of income tax and social contribution on profits earned by subsidiaries established abroad in the totalamount of R$688.6 million as of December 31, 2016 (R$636.5 million as of December 31, 2015). We have presented our defense based on the fact that our subsidiaries located abroad are only subject to full taxationin the countries in which they are based as a result of treaties regarding double taxation.
· Incometaxandsocialcontribution: We are involved in administrative disputes regarding the use of income tax and social contribution losses, refunds and credits to offset other federal tax debts, including creditsgenerated by legal disputes related to the PlanoVerão, an economic stabilization plan from 1989. Also, on February 5, 2015, BRF received a tax assessment notice related to the compensation of tax losscarryforwards and negative calculation basis up to a limit of 30% when it incorporated one of the group’s entities during calendar year 2012 in the amount of R$675.9 million as of December 31, 2016. The incometax and social contribution disputes totaled R$1,160.2 million as of December 31, 2016 (R$1,127.7 million as of December 31, 2015).
o On February 5, 2015, we received two tax assessments notices related to the compensation of tax loss carryforwards and negative calculation basis up to a limit of 30% when we incorporated one of thegroup’s entities during calendar year 2012, in the amount of R$574.7 million as of December 31, 2015 (R$605.4 million on December 31, 2016). On April 28, 2016, the lower administrative court renderedunfavorable decisions against us. The judgment of our appeals to the superior administrative court remains pending.
· IPI: We are involved in administrative proceedings relating to the failure to permit the use of credits under the sales tax for industrial products ( ImpostosobreProdutosIndustrializados, or “IPI”) generated frompurchases of goods not taxed, sales to the Manaus Free Zone and purchases of supplies by non-taxpayers to offset PIS and COFINS taxes in the amount of R$459.2 million as of December 31, 2016 (R$453.2 millionas of December 31, 2015).
· IPIpremiumcredits: Our subsidiary Sadia is involved in a judicial dispute related to the alleged undue use of IPI premium credits to offset other federal taxes in the amount of R$440.1 million as of December 31,2016 (R$464.7 million as of December 31, 2015). We have recorded these credits only based on a final judicial decision.
118
Table of Contents
NormativeInstruction86: We were assessed by the Brazilian Internal Revenue Service for a total amount of R$237.4 million as of December 31, 2015 related to a fine for alleged non-compliance in thedelivery of magnetic files for the years 2003–2005 to the tax authorities. In October 2013, the case was judged favorably for BRF by the Tax Administrative Appeals Board. In January 2016, the case wasjudged favorably for BRF by the Superior Chamber of Tax Administrative Appeal Board, which led to the definitive closure of the case. Socialsecuritycharges:We are involved in disputes related to social security charges allegedly due on payments to service providers and social contributions allegedly due to civil construction serviceproviders and others in the aggregate amount of R$237.2 million as of December 31, 2016 (R$194.4 million as of December 31, 2015). Othercontingencies: We are involved in other tax contingencies involving a variety of matters, including rural activities, transfer pricing and the basis for calculating social contribution taxes, totalingR$29.7 million as of December 31, 2016 (R$39.0 million as of December 31, 2015).
Additionally, we were included as co-defendant in a tax lawsuit against Huaine Participações Ltda. (a former holding company of Perdigão), claiming our liability for taxes in the amount of R$642.8 million as ofDecember 31, 2016 (R$625.5 million as of December 31, 2015). On February 16, 2012, we received a favorable decision from the Superior Court, which remanded the matter to the lower court. However, on November 17,2013, the Federal Court judged the lawsuit unfavorably for BRF and has determined that BRF is co-responsible for the tax debt. For this reason, we filed a new appeal to the Superior Court. In 2014, the Federal District Court(TRF-3) sustained BRF’s responsibility for the tax debt. In response, BRF filed a special and extraordinary appeal, which has been awarded suspensive effect, by precautionary measure (case nº. 0000185-28.2014.4.03.0000),which is waiting Superior Court of Justice and Supreme Court decisions. In the tax foreclosure proceeding, BRF had guaranteed the debt, which was accepted by the court, and filed an appeal, which is awaiting first instancejudgment. Despite this, our external legal advisors maintain that the risk of loss in this lawsuit is remote.
SocialSecurityContributionAssessment
On April 1, 2015, the Brazilian Internal Revenue Service ( SecretariadaReceitaFederal) filed a tax assessment against us in the amount of R$75.9 million (R$79.2 million on December 31, 2016, for which we recordeda provision of R$11.5 million for probable losses). The tax assessment is related to alleged irregularities in (i) our Stock Options Plan, (ii) our Profit Sharing Program and (iii) certain variable compensation to executive andmanagerial employees in 2011 and 2012. We filed an administrative appeal on May 4, 2015. We received an unfavorable decision and await the decision in the 2 nd administrative level. Based on advice from outside counsel,we have classified our risk of loss as possible (with a probable part as stated above).
As noted above, we are involved in other lawsuits for which we classify our risk of loss as remote, and the amounts involved in certain of those proceedings are substantial.
Labor Proceedings
On December 31, 2016, we were involved in 20,424 labor claims in the total amount of R$1.2 billion (amount includes risks deemed “remote”, “possible” and “probable”), compared to R$1.4 billion as of December31, 2015. These cases are mainly related to overtime, time spent by employees when changing clothes for uniforms, work-related travel time, rest breaks, article 253 of the Labor Code (Consolidation of Labor Laws), illnessesallegedly contracted at work and work accidents. Labor claims are being processed mainly at the Lower Court level and our provisions for “probable” losses from these labor claims are recorded in the amount of R$479.6million on December 31, 2016, compared to R$377.0 million on December 31, 2015. These provisions were recorded based on our past historical payments and in the opinion of our experts.
Included in these proceedings is a series of lawsuits filed by the Ministry of Federal Work, which related to overtime, mandatory rest breaks and other labor-related issues. Others in the industry have been the subjectof similar cases, and we do not believe that these proceedings will have a material adverse effect on us. Of the 46 cases pending, some have no assigned value and the largest has a value of approximately R$42.0 million,which is included in the total amounts disclosed above. We do not agree with the arguments presented by the Ministry of Federal Labor and the decisions of these proceedings. During 2016, we had meetings and hearings withthe Federal Public Ministry of Labor, seeking negotiations when we believed they were in our interest.
119
Table of Contents
On October 1, 2014, we entered into a judicial agreement with the Ministry of Labor related to one of these cases to settle throughout the country a claim that the Company was not using the minimum number ofyoung apprentices, as required by law. According to the Judicial Agreement, the Company agreed to donate R$50,000 to a charity and still has five years to hire a number of young apprentices equivalent to 5% of the totalnumber of our production employees instead of 5% of the total number of our employees, as required by law. If the Company reaches the goal within five years, the claim on which the lawsuit was based will be remedied. See“Item 6. Directors, Senior Management and Employees—D. Employees” for information on the breakdown of our workforce by type of employee.
Civil, Commercial and Other Proceedings
As of December 31, 2016, we were defendants in 1,791 civil proceedings amounting to total claims of R$2.6 billion. We were defendants in several civil, commercial and others proceedings related to, among otherthings, traffic accidents, alleged breach of contracts and consumer claims. We have recorded provisions for probable losses in the amount of R$117.3 million in connection with our pending civil, commercial and otherproceedings as of December 31, 2016. We recorded these provisions based on history of payments and on the opinion of our legal counsels.
On May 18, 2001, a declaratory action cumulated with condemnatory request was filed by Texaco do Brasil S/A Produtos de Petróleo (currently Ipiranga Produtos de Petróleo S/A), where the plaintiff claims thatPerdigão Alimentos S/A (currently BRF) did not comply with the three contracts set between the parties (the Tax Incentives Implementation Commitment and Promise of Share Purchase and Sales, the Share Purchase andSale Contract and Resale Promise and the Private Instrument of Tax Incentives Implementation Commitment and Promise of Share Purchase and Sales). Such contracts were related to the structuring and acquisition ofcommon and preferred shares of Perdigão Amazônia S.A, whose project would be financed by Texaco via tax incentives. The case ended with an unfavorable decision against BRF, ordering the company to indemnifyIpiranga for the damages related to the project. The said damages are currently subject to an expert evaluation, and thus, have not been calculated yet. Therefore, no provisions have been made for this case yet.
On March 30, 2006, Seara Alimentos S.A. filed a civil liability suit claiming for indemnification for damages and losses, including moral damages, due to a contractual default of BRF regarding the supply agreementcelebrated between them. On June 17, 2015, the Court of Appeal rendered an award condemning BRF to pay material damages. Both parties filed appeal to the Superior Court of Justice. Recently, the Court admitted bothappeals. The amounts of the indemnification are still illiquid, thus there are no provisions related to this proceeding.
On November 1, 2006, FRS S.A. Agro Avícola (“FRS”) filed an inhibitory action at Montenegro/RS in order to obtain a judicial decision compelling BRF to refrain from practicing any and all act that may affect thecommercial exploitation of products “LEBON NUGGETS” and “FRANGOSUL NUGGETS” by FRS. After an unfavorable decision was issued against FRS on September 17, 2015, they filed an appeal, which in turn wasgranted by the Rio Grande do Sul Court of Appeals on May 6, 2016, based on the understanding that the use by third parties (even without authorization) of NUGGETS’ trademark is allowed. BRF has filed an appeal to theSuperior Court of Justice. Since the case regards an inhibitory action, no provision is deemed necessary for this case.
On August 20, 2008, the Federal Public Prosecutor’s Office filed a public civil action against BRF due to alleged damages to consumers related to the excess of water absorbed by the chicken products manufacturedat Francisco Beltrão/PR and Dois Vizinhos/PR. The Public Prosecutor Office requests indemnification for all consumers individually who acquired products with any quality issues related to water in excess, as well aspublicly disclose the problems via newspaper, radio and other means. After an unfavorable judgment was issued ordering the defendants to indemnify the consumers about the irregularity of the products as well as payingR$700.0 thousand as collective damages, BRF and the other defendants filed their respective appeals on 2011. The case is currently waiting judgment at the Superior Court of Justice. The updated amounts of the provisionsfor this case are R$2.3 million. This case is currently under the responsibility of our subsidiary, Sadia SHB Comércio e Indústria de Alimentos S.A.
120
Table of Contents
Since May 20, 2011, the Public Prosecutor’s Office of Minas Gerais has filed six public civil actions requesting BRF to establish a legal reserve area, as well as to present a recovery project for the areas of variousproperties of BRF in the Municipality of Uberlândia/MG under the penalty of a fine. BRF has responded to all six proceedings demonstrating there is no need to establish legal reserve on any of the properties since all of themare situated on urban areas, and the constitution of legal reserve is not applicable. All six public civil actions are still active, in different procedural phases. Three of them had unfavorable decisions at the court of appeals, twoof them had favorable decisions at the court of appeals and one of them is still pending judgment at the lower court. On October 10, 2013, an action for damages was filed by Attilio Fontana’s heiresses in order to condemnBRF to pay material and moral damages for the destruction and/or concealment of SADIA S.A.’s statutory books. Such books were not exhibited in the preliminary proceeding, which prevented the plaintiffs from discoveringeventual illegal donations made by Mr. Fontana to his other heirs/their other siblings. The case is in pre-trial phase, and expert evidence is being produced. Since the amounts involved are still illiquid, no provisions have beenrecorded for this proceeding.
On October 17, 2013, Mr. Marcus Macedo Cazarré filed an indemnification action as a result of the allegedly exploitation of his Patent MU 8300298-7 by BRF in the biodigesters used in farms. The case is currentlyin pre-trial phase, and an expert report favorable to BRF was issued, pointing out there was no violation of Mr. Cazarré’s patent. Although Mr. Cazarré requests damages of over R$300 million, considering the early stage ofthe proceeding and his low chances of success, at this moment, there are no provisions for this action.
On April 27, 2014, we signed a TAC with the Public Prosecutors’ Office of the State of Goiás due to problems with the disposal of solid materials (animal carcasses) of the Rio Verde unit. Because of this, BRF wasrequired to pay a fine of R$1.4 million and to assume other obligations that are still being fulfilled by the Company.
On March 24, 2014, we signed a TAC with the Consumer Protection Agency of the Municipality of Rio de Janeiro ( ProconCarioca) due to problems with the distribution of skimmed UHT milk in Rio de Janeiro.Because of that agreement, the Company had to pay a fine of R$150 thousand and assumed other obligations that have already been fulfilled by the Company. On October, 23, 2014, the Consumer Protection Agency of theState of Rio de Janeiro ( ProconEstadual)filed a civil action against BRF related to the same problem with the distribution of skimmed milk. In May 2016, a judgment was issued recognizing that BRF had diligently taken allnecessary actions to mitigate damages on this case, including signing a TAC on the matter. Nevertheless, the lower court still determined that any consumers that manage to prove they suffered material losses from theproblems related to the milk distributed back then shall be reimbursed. PROCON Estadual has appealed the decision and their appeal was dismissed on January 25, 2017. No provisions are applicable to this case.
On January 16, 2015 and on November 16, 2016, two class actions were filed by ASAPREV, an association of retirees. Both actions report the existence of two different “BRF/Sadia Autogestão” health-plan policies,one directed to employees and another one to former employees, which would mainly violate the provisions of the Brazilian law for private health plans. Based on that allegation, the association pleads: (i) the invalidity ofseveral clauses of the “BRF/Sadia Autogestão” health plan, (ii) the recognition of the right of retirees to remain in “BRF/Sadia Autogestão” health plan under the same conditions applicable to current employees; (iii) doublerefund of all amounts improperly charged by BRF from each associate, with indexation and interests; (iv) the payment of punitive damages to each associate not inferior to R$35 thousand. Since both proceedings are still attheir preliminary stages, no substantial provisions have been recorded on these proceedings as of this moment.
On May 20, 2015, an indemnification action was filed by the municipality of Tijucas against BRF, Nestlé Brazil Ltda, Invista Fibers and Polymers Brazil Ltda and Bardusch Rentals Textiles Ltd. to investigateenvironmental damages related to the improper disposal of clothes and uniforms with the logos of the aforementioned companies. The parties presented their respective defenses in December 2015 and the case is still in thetrial phase, awaiting for a judgment to be issued. Due to the subject matter discussed on these proceedings, R$1.2 million have been provisioned.
121
Table of Contents
On October 23, 2015, Perdue Foods LLC (“Perdue”) filed an enforcement lawsuit against BRF. Perdue seeks to order BRF to comply with the obligations assumed in the Coexistence Agreement, as amended, enteredinto by both parties related to the trademarks Perdue and Perdix. In the event that BRF does not comply with these obligations, Perdue also seeks the imposition of a daily fine, in the amount of R$50.0 thousand for each dayof delay. BRF has presented its defense on the case and the case is currently awaiting for a decision to be issued by the lower court judge. Since the enforcement lawsuit relates to obligations to do and not to do and, therefore,has no measurable economic value, no provisions have been recorded for these proceedings.
On December 7, 2015, a city councilor filed a popular action against BRF in connection with alleged irregularities identified on a competitive bid for the supply of school meal to the Municipality of São Paulo. Wehave already filed our defense and are awaiting trial. This popular action is still at its preliminary stages, and we have classified the risk of loss as possible, with no provisions recorded.
On December 22, 2015, the Public Prosecutors’ Office of the State of Pernambuco filed a public civil action against BRF in connection with alleged irregularities identified on dairy products sold by BRF in the past.The judge granted the preliminary injunction requested by the plaintiff, mainly in order to: (i) order BRF to suspend the sale of its products every time the Ministry of Agriculture identifies new irregularities; (ii) make BRFresponsible for the burden of proof; (iii) order BRF to provide a public notice of the decision so that consumers possibly affected by the alleged irregularities may join the lawsuit; and (iv) order BRF to publish the preliminarydecision in a newspaper of general circulation. We have already prepared an appeal against this preliminary injunction and have also filed our defense to this lawsuit in order to clarify, among other topics, that BRF is notresponsible for the production and sale of these products anymore. This public civil action is still at its preliminary stages, and we have classified the risk of loss as possible, with no provisions recorded.
On March 14, 2016, a public civil action was filed by Abracon-Saúde – Associação Brasileira de Defesa dos Consumidores de Plano de Saúde, an association for health insurance customers, seeking to oblige BRF toinsert the following warning on the package of its products: “CONTAINS GLUTEN – gluten is harmful to celiac patients” or another similar alert to demonstrate how gluten can be harmful to costumer’s health. After BRFpresented its defense, a judgment was issued on September 14, 2016 ordering BRF to include said information on the package of all of its products that contain gluten. BRF appealed the decision in October 2016 and the caseis currently pending trial at the State Court of Appeals of Mato Grosso do Sul. No substantial provisions were deemed necessary for this proceeding. Weak Flesh Operation
On March 17, 2017, we learned of a decision issued by the federal judge of the 14th judicial division of the federal circuit of the state of Parana in the context of the Weak Flesh Operation. For more information, see“Item 8. Financial Information – B. Significant Changes – Weak Flesh Operation.”
Dividends and Dividend Policy
Our dividend policy has historically included the distribution of periodic dividends, based on quarterly balance sheets approved by our board of directors. When we pay dividends on an annual basis, they are declaredat our annual shareholders’ meeting, which we are required by the Brazilian Corporation Law and our bylaws to hold by April 30 of each year. When we declare dividends, we are generally required to pay them within 60days of declaring them unless the shareholders’ resolution establishes another payment date. In any event, if we declare dividends, we must pay them by the end of the fiscal year in which they are declared.
As permitted by the Brazilian Corporation Law, our bylaws specify that 25% of our adjusted net profits for each fiscal year must be distributed to shareholders as dividends or interest on shareholders’ equity. Werefer to this amount as the mandatory distributable amount. Under the Brazilian Corporation Law, the amount by which the mandatory distributable amount exceeds the “realized” portion of net income for any particular yearmay be allocated to the unrealized income reserve, and the mandatory distribution may be limited to the “realized” portion of net income. The “realized” portion of net income is the amount by which our net income exceedsthe sum of (1) our net positive results, if any, from the equity method of accounting for earnings and losses of our subsidiaries and certain associated companies, and (2) the profits, gains or income obtained on transactionsmaturing after the end of the following fiscal year. As amounts allocated to the unrealized income reserve are realized in subsequent years, such amounts must be added to the dividend payment relating to the year ofrealization.
122
Table of Contents
The following table sets forth the dividends and interest on shareholders’ equity paid to holders of our common shares since 2014 on a per share basis in reais.
Year Description Payment Date Amounts per Share in Reais
U.S.$ Equivalent per Share
at Payment Date2014 Interest on shareholders’ equity August 15, 2014 0.41 0.182014 Interest on shareholders’ equity February 13, 2015 0.43 0.152014 Dividends February 13, 2015 0.10 0.042015 Interest on shareholders’ equity August 14, 2015 0.50 0.142015 Interest on shareholders’ equity February 12, 2016 0.58 0.152015 Dividends February 12, 2016 0.11 0.032015 Dividends April 1, 2016 0.12 0.032016 Interest on shareholders’ equity August 15, 2016 0.64 0.20
The following table sets forth total dividends and interest on shareholders’ equity paid in each year presented below:
Year
Total Dividends and Interest on
Shareholders’ Equity
(in millions of reais)2014 824.32015 1,088.92016 513.2
Any decision to declare and pay dividends and/or interest on shareholders’ equity in the future will be made at our discretion and will be subject to our continuing determination that such payments are in the best
interests of our shareholders and are in compliance with all laws and agreements to which we are subject. Amounts Available for Distribution
The section of this form entitled “Item 10. Additional Information –– B. Memorandum and Articles of Association –– Description of Share Capital” contains a description of the calculation and payment of dividendsand interest on shareholders’ equity under the Brazilian Corporation Law. See “—Allocation of Net Income and Distribution of Dividends” and “—Payment of Dividends and Interest on Shareholders’ Equity” under Item 10.
B. Significant Changes
Weak Flesh Operation
The Brazilian authorities are investigating Brazil’s meat processing industry in the so-called “Weak Flesh Operation,” which became public on March 17, 2017. The investigation involves a number of companies inthe industry in Brazil.
On March 17, 2017, we learned of a decision issued by a federal judge of the state of Paraná authorizing the search and seizure of information and documents, and the detention of certain individuals in the context ofthis Weak Flesh Operation. Two BRF employees were detained (one of which has been released) and three were identified for questioning (of which two were questioned, including Mr. Rodrigues, our Vice President –Corporate Integrity).
In addition to the above our Mineiros plant was temporarily suspended by the MAPA on March 17, 2017, so that MAPA could conduct an additional audit on its production process . After conducting an audit, theMAPA authorized the Mineiros plant to resume operations as of April 8, 2017. The Mineiros plant reopened on April 10, 2017 and resumed its operations on April 11, 2017.
On April 15, 2017, the Brazilian Federal Police issued a report on the investigation and recommended charges against three BRF employees. On April 20, 2017, based on the Brazilian Federal Police investigation,Brazilian federal prosecutors filed charges against two BRF employees (one of our regional manufacturing officer and one of our corporate affairs manager).
Based on the charges filed against such two employees, the main allegations at this stage involve alleged misconduct relating to improper offers and/or promises to government inspectors.
BRF has communicated with, and has received requests for information from certain regulators and governmental entities, including the U.S. Securities and Exchange Commission and U.S. Department of Justice inrelation to this matter. BRF is cooperating with these inquiries.
BRF’s Statutory Audit Committee has already initiated an investigation with respect to the allegations involving BRF employees in the Weak Flesh Operation and is in the process of engaging outside counsel inconnection with this investigation.
For information about the risks related to this investigation, see “Item 3. Key Information – D. Risk Factors. We have a governance structure and compliance processes designed to sustain our positive image andreputation in the marketplace, but they may fail to ensure compliance with relevant anti-corruption, anti-bribery, anti-money laundering and other international trade laws and regulations.”
123
Table of Contents
Social Contributions
In accordance with the Provisional Measure No. 774/17, we will be rquired to pay 20% social contribution over our payroll beginning in July 2017, which is higher than the amounts we currently pay of 1% of ourgross operating revenue for in-natura products (excluding exports) and 2.5% of our gross operating revenue for some processed products (excluding exports). This Provisional Measure may be passed into law or not or may bemodified by the Brazilian Congress. For as long as the Provisional Measure No. 774/17 is in effect or if it is passed into law, our overall tax burden will be increased, which could negatively affect our overall financialperformance.
Other Significant Changes
We are not aware of any other significant changes bearing upon our financial condition since the date of the financial statements included in this Annual Report on Form 20-F.
ITEM 9. THE OFFER AND LISTING
A. Offer and Listing Details
Our common shares trade on the São Paulo Stock Exchange. ADRs representing our common shares trade on the NYSE. On March 31, 2017, there were 799,005,245 common shares issued and outstanding(excluding 13,468,001 common shares held in treasury), and there were 98,080,063 ADRs outstanding, representing 12.06% of our outstanding common shares.
Price History of Our Common Shares and ADRs
The tables below set forth the high and low closing sales prices for our common shares on the São Paulo Stock Exchange and the high and low closing sales prices for the ADRs on the NYSE for the periodsindicated.
124
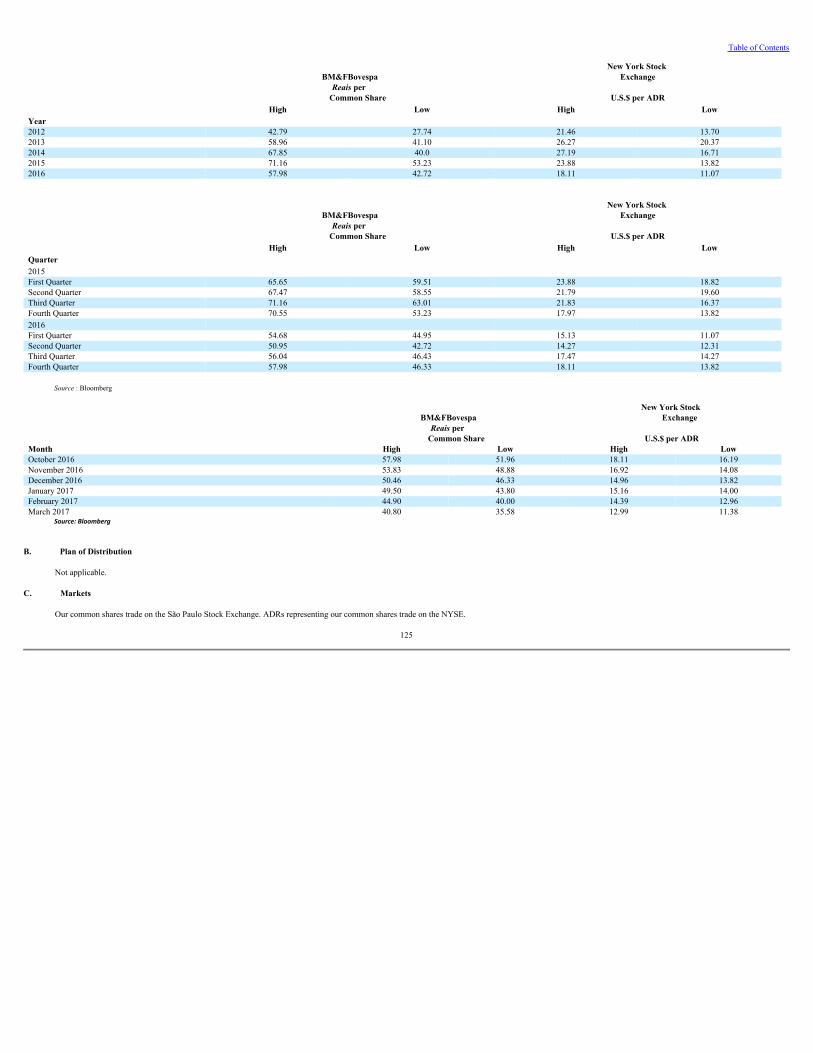
Table of Contents
BM&FBovespaNew York Stock
Exchange
Reais per
Common Share U.S.$ per ADR High Low High LowYear 2012 42.79 27.74 21.46 13.702013 58.96 41.10 26.27 20.372014 67.85 40.0 27.19 16.712015 71.16 53.23 23.88 13.822016 57.98 42.72 18.11 11.07
BM&FBovespaNew York Stock
Exchange
Reais per
Common Share U.S.$ per ADR High Low High LowQuarter 2015 First Quarter 65.65 59.51 23.88 18.82Second Quarter 67.47 58.55 21.79 19.60Third Quarter 71.16 63.01 21.83 16.37Fourth Quarter 70.55 53.23 17.97 13.822016 First Quarter 54.68 44.95 15.13 11.07Second Quarter 50.95 42.72 14.27 12.31Third Quarter 56.04 46.43 17.47 14.27Fourth Quarter 57.98 46.33 18.11 13.82
Source: Bloomberg
BM&FBovespaNew York Stock
Exchange
Reais per
Common Share U.S.$ per ADRMonth High Low High LowOctober 2016 57.98 51.96 18.11 16.19November 2016 53.83 48.88 16.92 14.08December 2016 50.46 46.33 14.96 13.82January 2017 49.50 43.80 15.16 14.00February 2017 44.90 40.00 14.39 12.96March 2017 40.80 35.58 12.99 11.38
Source: Bloomberg B. Plan of Distribution
Not applicable.
C. Markets
Our common shares trade on the São Paulo Stock Exchange. ADRs representing our common shares trade on the NYSE.
125
Table of Contents
TradingontheBM&FBovespa
The BM&FBOVESPA S.A. – Bolsa de Valores Mercadorias e Futuros is a public company which resulted from the merger, in 2008, among BolsadeMercadoriaseFuturos(BM&F, the Brazilian commodities andfutures exchange), BolsadeValoresdeSãoPaulo(“Bovespa,” the São Paulo stock exchange), and CompanhiaBrasileiradeLiquidaçãoeCustódia(“CBLC,” the Bovespa’s securities clearing system).
Trading on the São Paulo Stock Exchange is limited to member brokerage firms and a limited number of authorized non-members. The São Paulo Stock Exchange currently has trading sessions, from 10:00 a.m. to5:00 p.m., during Brazilian summer time. There is also trading in the so-called After-Market, only through the automated quotation system of the São Paulo Stock Exchange, from 5:30 p.m. to 6:00 p.m. Only shares that weretraded during the regular trading session of the day may be traded in the After-Market of the same day. Trades are made by entering orders in the Mega Bolsa electronic trading system, created and operated by Bovespa.
Settlement of transactions conducted on the São Paulo Stock Exchange is effected three business days after the trade date without any adjustment for inflation. Delivery of and payment for shares is made through thefacilities of CBLC, the São Paulo Stock Exchange’s securities clearing system. The seller is ordinarily required to deliver the shares to the exchange on the second business day following the trade date.
In order to maintain better control over the fluctuation of the São Paulo Stock Exchange index, the São Paulo Stock Exchange has a “circuit breaker” system in which the trading session is suspended for a period of30 minutes or one hour in the event the São Paulo Stock Exchange index were to fall below the limit of 10% or 15%, respectively, in relation to the closing rate of the index of the previous trading session.
The São Paulo Stock Exchange is significantly less liquid than the NYSE and the world’s other major stock exchanges. While all of the outstanding shares of a listed company may trade on the São Paulo StockExchange, in most cases fewer than half of the listed shares are actually available for trading by the public. The remaining shares are often held by a single or small group of controlling persons or by governmental entities.
Trading on the São Paulo Stock Exchange by a holder not deemed to be domiciled in Brazil for Brazilian tax and regulatory purposes, or a non-Brazilian holder, is subject to certain limitations under Brazilian foreigninvestment regulations. With limited exceptions, non-Brazilian holders may trade on the São Paulo Stock Exchange only in accordance with the requirements of Resolution No. 4,373 of September 29, 2014 of the CMN.Resolution No. 4,373 requires securities held by non-Brazilian holders to be maintained in the custody of, or in deposit accounts with, financial institutions that are authorized by the Central Bank and the Brazilian SecuritiesCommission. In addition, Resolution No. 4,373 requires non-Brazilian holders to restrict their securities trading to transactions on the São Paulo Stock Exchange or organized over-the-counter markets. With limitedexceptions, non-Brazilian holders may not transfer the ownership of investments made under Resolution No. 4,373 to other non-Brazilian holders through private transactions. For more information, see “Regulation ofForeign Investment” under Item 10.
RegulationofBrazilianSecuritiesMarkets
The Brazilian securities markets are regulated by the CVM, which has authority over stock exchanges and the securities markets generally, by the CMN and by the Central Bank, which has, among other powers,licensing authority over brokerage firms and which regulates foreign investment and foreign exchange transactions. The Brazilian securities market is governed by Brazilian Law No. 6,385/76, as amended, and by theBrazilian Corporation Law and other CVM rulings and regulations.
Under the Brazilian Corporation Law, a company may be either public ( companhiaaberta), as we are, or closely held ( companhiafechada). All public companies are registered with the CVM and are subject toperiodic reporting requirements. A company registered with the CVM may have its securities traded on the Brazilian stock exchanges or in the Brazilian over-the-counter market. The shares of a listed company, like those ofour company, also may be traded privately subject to certain limitations.
126
Table of Contents
The Brazilian over-the-counter market consists of direct trades between persons in which a financial institution registered with the CVM serves as intermediary. No special application, other than registration with theCVM, is necessary for securities of a public company to be traded in this market. The CVM must receive notice of all trades carried out in the Brazilian over-the counter market by the respective intermediaries.
Trading of a company’s securities on the São Paulo Stock Exchange may be suspended in anticipation of a material announcement. A company must also suspend trading of its securities on international stockexchanges on which its securities are traded. Trading may also be suspended by the São Paulo Stock Exchange or the CVM, among other reasons, based on or due to a belief that a company has provided inadequateinformation regarding a material event or has provided inadequate responses to an inquiry by the CVM or the relevant stock exchange.
Brazilian Law No. 6,385/76, as amended, the Brazilian Corporation Law and regulations issued by the CVM provide for, among other things, disclosure obligations, restrictions on insider trading and pricemanipulation and protections for minority shareholders. However, the Brazilian securities markets are not as highly regulated and supervised as securities markets in the United States and some other jurisdictions. In addition,rules and policies against self-dealing or for preserving shareholder interests may be less well-defined and enforced in Brazil than in the United States, which may put holders of our common shares and ADRs at adisadvantage. Corporate disclosures also may be less complete than for public companies in the United States and certain other jurisdictions.
São Paulo Stock Exchange Corporate Governance Standards
The São Paulo Stock Exchange has listing segments:
Corporate Governance Level 1; Corporate Governance Level 2; and The NovoMercado(New Market) of the São Paulo Stock Exchange.
These listing segments have been designed for the trading of shares issued by companies that voluntarily undertake to abide by corporate governance practices and disclosure requirements in addition to those alreadyrequired under the Brazilian Corporation Law. The inclusion of a company in any of the new segments requires adherence to a series of corporate governance rules. These rules are designed to increase shareholders’ rights andenhance the quality of information provided by Brazilian corporations.
In April 2006, we entered into a listing agreement with the São Paulo Stock Exchange, under which we agreed to comply with stricter corporate governance and disclosure requirements established by the São PauloStock Exchange in order to qualify as a company admitted to the NovoMercado.
When we became a company within the NovoMercado, we agreed, among other things, to:
maintain a share capital structure composed exclusively of common shares; ensure that shares representing at least 25% of our total outstanding share capital are held by investors other than our directors, executive officers and any controlling shareholders; adopt offering procedures that favor widespread ownership of shares whenever making a public offering; comply with minimum quarterly disclosure standards; follow stricter disclosure policies with respect to transactions involving our securities made by any controlling shareholders and our directors and executive officers; make a schedule of corporate events available to our shareholders;
127
Table of Contents
offer tag-along rights to minority shareholders (meaning that, upon the acquisition of a controlling interest, the purchaser must also agree to purchase the shares of minority shareholders for the same pricepaid for the shares in the controlling stake); in the event of a delisting of shares, conduct a public tender offer for our common shares at a price at least equal to the economic value determined pursuant to an appraisal; present an annual balance sheet prepared in accordance with, or reconciled to, IFRS; establish a two-year term for all members of the board of directors; require that at least 20% of our board of directors consist of independent directors; and submit to arbitration by the Market Arbitration Chamber ( CâmaradeArbitragemdoMercado) all controversies and disputes involving our company, members of our board of directors, board of executiveofficers, fiscal council and statutory audit committee or shareholders relating to the application, validity, efficacy, interpretation, violation or effect of the NovoMercadolisting agreement and regulations,our bylaws, the Brazilian Corporation Law or the rules of the CMN, the Central Bank, the CVM or the Market Arbitration Chamber or other rules within the jurisdiction of the Market Arbitration Chamber.
All members of our board of directors and board of executive officers signed a management compliance statement ( TermodeAnuênciadosAdministradores) under which they take personal responsibility forcompliance with the NovoMercadolisting agreement, the rules of the Market Arbitration Chamber and the regulations of the NovoMercado.
D. Selling Shareholders
Not applicable.
E. Dilution
Not applicable.
F. Expenses of the Issue
Not applicable.
ITEM 10. ADDITIONAL INFORMATION
A. Share Capital
Not applicable.
B. Memorandum and Articles of Association
Description of Share Capital
Set forth below is a summary of the material terms of provisions of our common shares. This description does not purport to be complete and is qualified in its entirety by reference to our amended and restatedbylaws (filed herewith as Exhibit 1.01), the Brazilian Corporation Law, the rules and regulations of the CVM, the rules of the NovoMercado. We have described some of the amendments below.
128
Table of Contents
Under the NovoMercadolisting agreement we entered into with the São Paulo Stock Exchange (BM&F Bovespa) and our bylaws, we may not issue preferred shares or shares with restricted voting rights.Accordingly, this section does not discuss the Brazilian statutory rights conferred upon holders of preferred shares.
General
We are currently a publicly held corporation ( sociedadeporaçõesdecapitalaberto) incorporated under the laws of Brazil. Our headquarters currently are located in Itajaí, State of Santa Catarina. We are dulyregistered with JuntaComercialdoEstadodeSantaCatarinaunder the number NIRE 42.300.034.240 and with the CVM under No. 01629-2.
On December 31, 2016, our capital subscribed and paid up was R$12,553,417,953.36, which is composed of 812,473,246 book-entry shares of common stock without par value. The Board is authorized to increaseour capital stock to 1 billion common shares.
Corporate Purpose
Article 3 of our bylaws provides that our corporate purpose consists of:
the manufacture, sale, in the retail and wholesale sector, and transaction of business relating to food in general, particularly animal protein by-products and food items that use the cold chain for support anddistribution; the manufacture, sale of animal feed, nutrients and food supplements for animals; the provision of food services in general; the manufacture, refining and sale of vegetable oils, fats and dairy products; the production, conservation, storage, silage and sale of grains, their derivatives and by-products; the sale on the retail and wholesale market of consumer and production goods, including equipment and vehicles for the development of its logistical activity; the export and import of production and consumer goods; the provision of services of transport, logistics and distribution of freight and food in general; holding equity stakes in other companies, with the aim of achieving the corporate purposes to the fullest extent; and the participation in any projects needed for the operation of our business.
We may further engage directly, or indirectly through others, in any support activities for the core business described above, such as:
administrative, technical or operational support activities, aimed at creating conditions to improve our core business; transport services, in general; product storage and stocking services and other related ancillary services; activities to promote and replace our products in the retail market and at points of sale exposed to the final consumer, including the support needed by clients which allows the packaging and visualization ofthe products;
129
Table of Contents
services for receiving and allocating raw materials to be used in production;
the provision of machine and vehicle repair, maintenance and overhaul services;
the promotion of the growth of agribusiness in Brazil through programs, technical assistance and supply;
the manufacture, development and sale of packaging products of any kind;
the processing and raising of livestock in general;
the sale of commodities in general;
research and development of techniques for the production and improvement of our genetic matrixes;
the activities of reforestation, extraction, manufacturing and sale of timber;
the sale of mobile assets, real estate, including machines, equipment and vehicles, fixed assets, to meet the activities within our corporate purpose; and
services to supply fuel for our own fleet or outsourced service providers, particularly freight, transport, logistics and distribution.
Our bylaws forbid us to engage in any business practices inconsistent with our corporate purpose and core business, including the granting of pledges, collateral, endorsement or any guarantees not related to ourcorporate purpose or contrary to our bylaws, except for those practices already engaged in, and any such practices will be null and void.
Rights of Common Shares
At our shareholders’ meetings, each share of our common stock is entitled to one vote. Pursuant to our bylaws and to the NovoMercadolisting agreement, we may not issue shares without voting rights or withrestricted voting rights. In addition, our bylaws and the Brazilian Corporation Law provide that holders of our shares are entitled to dividends or other distributions made in respect of our shares ratably in accordance with theirrespective participation in the total amount of our issued and outstanding shares. See “— Payment of Dividends and Interest on Shareholders’ Equity” for a more complete description of the payment of dividends and otherdistributions on our shares. In addition, upon our liquidation, holders of our shares are entitled to share our remaining assets, after payment of all of our liabilities, ratably in accordance with their respective participation in thetotal amount of our issued and outstanding shares. Common shareholders have, except in certain circumstances listed in the Brazilian Corporation Law and in our bylaws, the right to participate in our company’s future capitalincreases, in proportion to their participation in our capital stock, and also the right to dispose of shares in a public offering in case of acquisition of shares in quantities equal to or in excess of 33.3% of total shares issued inthe offering, in compliance with the terms and conditions provided in Article 43 of our bylaws.
According to the Brazilian Corporation Law, neither our bylaws nor actions taken at a shareholders’ meeting may deprive a shareholder of the following rights:
the right to participate in the distribution of profits;
130
Table of Contents
the right to participate equally and ratably in any remaining residual assets in the event of our liquidation; preemptive rights in the event of issuance of shares, convertible debentures or warrants, except in certain specific circumstances under Brazilian Corporation Law described under “—Preemptive Rights”; the right to monitor our management in accordance with the provisions of the Brazilian Corporation Law; and the right to withdraw from our company in the cases specified in the Brazilian Corporation Law, which are described under “—Withdrawal Rights.”
Meeting of Shareholders
Under the Brazilian Corporation Law, our shareholders are generally empowered at our shareholders’ meetings to take any action relating to our corporate purposes and to pass resolutions that they deem necessary toour interests and development at duly called and convened general meetings. Shareholders at our annual shareholders’ meeting, which is required to be held within four months of the end of our fiscal year, have the exclusiveright to approve our audited financial statements and to determine the allocation of our net profits and the distribution of dividends with respect to the fiscal year ended immediately prior to the relevant shareholders’ meeting.The election of our directors typically takes place at the annual shareholders’ meeting, although under Brazilian Corporation Law it may also occur at an extraordinary shareholders’ meeting. Members of the fiscal council (conselhofiscal) may be elected at any shareholders’ meeting.
An extraordinary shareholders’ meeting may be held concurrently with the annual shareholders’ meeting and at other times during the year.
Under our bylaws and the Brazilian Corporation Law, the following actions, among others, may be taken only at a shareholders’ meeting:
amendment of our bylaws; election and dismissal, at any time, of the members of our board of directors and fiscal council and approval of their aggregate compensation; approval of management accounts and our audited financial statements; granting stock awards and approval of stock splits or reverse stock splits; approval of stock option plans for our management and employees or individuals who provide services to us, as well as those of companies directly or indirectly controlled by us; authorization of the issuance of convertible debentures exceeding the authorized capital stock; suspension of the rights of a shareholder; approval of the distribution of our profits and payment of dividends, as well as the establishment of any reserve other than the legal reserve; acceptance or rejection of the valuation of in-kind contributions offered by a shareholder in consideration for issuance of shares of our share capital; approval of our transformation, merger, consolidation, spin-off;
131
Table of Contents
approval of any dissolution or liquidation, and the appointment and dismissal of a liquidator, as well as the members of our fiscal council, which shall be installed in the event of our liquidation if it does notalready exist at the time; authorization to delist from the Novo Mercado, as well as to retain a specialized firm to prepare a valuation report with respect to the value of our shares in such circumstances; and authorization to petition for bankruptcy or file a request for judicial or extra-judicial restructuring.
Quorum
As a general rule, the Brazilian Corporation Law provides that the quorum for our shareholders’ meetings consists of shareholders representing at least a quarter of our issued and outstanding shares on the first calland, if that quorum is not reached, any percentage on the second call. If the shareholders are convened to amend our bylaws, a quorum at a shareholders’ meeting consists of shareholders representing at least two-thirds of ourissued and outstanding share capital entitled to vote on the first call and any percentage on the second call. In most cases, the affirmative vote of shareholders representing at least the majority of our issued and outstandingshares present in person or represented by proxy at a shareholders’ meeting is required to approve any proposed action, and blank votes are not counted as shares present in person or represented by proxy. However, theaffirmative vote of shareholders representing not less than one-half of our issued and outstanding shares is required to, among other measures:
reduce the percentage of mandatory dividends; change our corporate purpose; consolidate with or merge our company into another company; spin off assets of our company; approve our participation in a centralized group of companies; apply for cancellation of any voluntary liquidation; approve our dissolution; and approve the merger of all of our shares into another Brazilian company.
A quorum smaller than the quorum established by the Brazilian Corporation Law may be authorized by the CVM for a public company with widely traded and held shares that has had at least half of the holders of itsvoting shares in attendance at its last three shareholders’ meetings.
Elimination of or amendment to limit shareholders’ rights under Article 39 of our bylaws, which requires any shareholder who becomes the holder of 33.3% or more of our total capital stock to effect a public offerfor all of our outstanding stock, is permitted only when approved by the majority of shareholders present at the shareholders’ meeting. The shareholders who approve such elimination or amendment must launch a public offerin accordance with the rules established by Article 43 of our bylaws.
Notice of Shareholders’ Meetings
Under the Brazilian Corporation Law, notice of our shareholders’ meetings must be published at least three times in the DiárioOficialdoEstadodeSantaCatarina, the official newspaper of the State of SantaCatarina, and in another widely circulated newspaper in the same state, which is currently the ValorEconômico.
132
Table of Contents
Notices of shareholders’ meetings must contain the agenda for the meeting and, in the case of an amendment to our bylaws, a summary of the proposed amendment. Under the Brazilian Corporation Law and ourbylaws, the first notice must be published at least 15 days before the date of the meeting on the first call, and no later than eight days before the date of the meeting on the second call. However, under CVM Instruction No.559 of March 27, 2015, Brazilian issuers of depositary receipts, such as our company, must call their shareholders’ meetings not less than 30 days prior to the meeting. In addition, upon request of any shareholder, the CVMmay suspend for up to 15 days the required prior notice of an extraordinary shareholders’ meeting so that the CVM can become familiar with, and analyze, the proposals to be submitted at the meeting and, if applicable,inform the company, up to the end of the suspension period, about the reasons why it believes that a proposed resolution violates legal or regulatory provisions.
Location of Shareholders’ Meetings
Our shareholders’ meetings take place at our head offices in the City of Itajaí, State of Santa Catarina. The Brazilian Corporation Law allows our shareholders to hold meetings in another location in the event of forcemajeure, provided that the meetings are held in the City of Itajaí and the relevant notice includes a clear indication of the place where the meeting will occur.
Calling of Shareholders’ Meetings
Our board of directors may call shareholders’ meetings. Shareholders’ meetings also may be called by:
any shareholder, if our board of directors fails to call a shareholders’ meeting within 60 days after the date it is required to do so under applicable law and our bylaws; shareholders holding at least 5% of our shares, if our board of directors fails to call a meeting within eight days after receipt of a request to call the meeting by those shareholders indicating the reasons forcalling such a meeting and the proposed agenda; shareholders holding at least 5% of our shares if our board of directors fails to call a meeting within eight days after receipt of a request to call a meeting to approve the creation of a fiscal council; our fiscal council, if the board of directors fails to call an annual shareholders’ meeting within one month after the date it is required to do so under applicable law and our bylaws. The fiscal council mayalso call an extraordinary general shareholders’ meeting if it believes that there are important or urgent matters to be addressed; and the chairman of our board of directors, within two days of a determination by the São Paulo Stock Exchange that the prices of our common shares must be quoted separately from other Novo Mercadosecurities or following the suspension of trading of our shares on the Novo Mercado, in each case, due to our non-compliance with the Novo Mercado regulations. All members of our board of directorsmust be replaced at such shareholders’ meeting. If any co-chairman of the board of directors fails to call such shareholders’ meeting within the prescribed time limit, any shareholder of our company may doso.
Conditions of Admission
Our shareholders may be represented at a shareholders’ meeting by a proxy appointed less than a year before the meeting, which proxy must be either a shareholder, a corporate officer, a lawyer or, in the case of apublicly traded company, such as our company, a financial institution. An investment fund shareholder must be represented by its investment fund officer or a proxy.
Pursuant to our bylaws, to ensure the efficiency of the works during our shareholder’s meetings shareholders attending a shareholders’ meeting are required to deliver, at least five days prior to the shareholders’meeting, proof of their status as shareholders and proof that they hold the shares they intend to vote by delivery of proper identification and, if necessary, a receipt issued by the custodian agent, a power of attorney (if theshareholder is represented by a third party) and/or an extract evidencing the holding of registered shares. Notwithstanding the above and in accordance with Brazilian Corporation Law and our bylaws, shareholders who areable to make proof of their status as shareholders of the Company may participate and vote at our shareholder meeting.
133
Table of Contents
In inspecting the validity of documents submitted with respect to shareholder representation, we apply the principle of good faith. Unauthenticated copies of documents or those bearing no verified signature, whennot required by law, are permitted and confer entitlement to fully exercise shareholders’ rights, provided that the person concerned undertakes to present the original documents or the equivalent required by us within fiveworking days after the shareholders’ meeting. If the shareholder does not submit the originals or equivalent required by us within the deadline, his or her vote shall be disregarded, and he or she shall be responsible for anyloss or damage that this act has caused us.
In addition, shareholders may vote by sending the relevant ballot paper dully filled and signed directly to the Company at R. Hungria, 1,400, 5°. Floor, Zip Code 01455-000, São Paulo – SP – Brazil to the attention ofthe Corporate Governance team, with copies of the following documents:
certified copies of identity document (which should contain a picture of the shareholder) for individual persons and the bylaws, corporate and proxy documents and the identity document (which shouldcontain a picture of the proxy holder) of the proxy holder for legal entities; and
in the case of investment funds, the rules of the fund, the bylaws of the manager or the administrator, according to the voting policy of the fund, corporate and proxy documents and the identity documentsof the proxy holder (which should contain a picture of the proxy holder).
It is not mandatory to notarize the signature on the ballot papers. Corporate and proxy documents of legal entities and investment funds in foreign languages shall be notarized and officially translated. Board of Directors
Under our bylaws, our board of directors is composed of nine to eleven members. The members of our board of directors are elected at the shareholders’ meeting for a period of two years and may be reelected. Ourbylaws do not contemplate alternates to board members. At least 20% of the directors must be independent (as defined in the NovoMercadoregulations). There is no mandatory retirement age for our directors. In case of anyvacancy, the remaining members will nominate an alternate director who will serve until the next shareholders’ meeting, when shareholders shall elect another director to serve for the remaining term of office. If more than1/3 of the seats on the board of directors are vacant at the same time, then an extraordinary shareholders’ meeting shall be called within 30 days counted from such vacancy event to elect the substitutes for such positions, whowill serve for a term of office coinciding with the term of the other members.
Under the NovoMercadorules, the members of our board of directors must, prior to taking office, sign a compliance statement subscribing to the NovoMercadorules and Arbitration Regulations of the ArbitrationChamber of the São Paulo Stock Exchange.
Pursuant to our bylaws, a shareholder who intends to nominate one or more members of our board of directors, other than the current members of the board of directors, must notify us in writing preferably at leastfive days prior to the shareholders’ meeting at which the members of the board of directors will be elected, providing us with the name and resume of the candidate. In case we receive such a notification, we will beresponsible for immediately disclosing this information through a Shareholders’ Notice to be posted on the CVM website and our website.
The Brazilian Corporation Law sets forth that a cumulative vote system must be made available upon request of shareholders representing at least 10% of our voting share capital. The cumulative vote system entitleseach shareholder to as many votes as there are members of the board of directors for each share it holds. Further, shareholders have the right to allocate their votes to one candidate or several. Whenever the election has beencarried out by the cumulative vote process, the dismissal of any member of the board of directors by the shareholder’s meeting will imply the dismissal of all other members, and a new election shall be held.
134
Table of Contents
Under CVM Instruction 282, the minimum percentage of voting capital required for the adoption of the cumulative vote system by a publicly held company may be reduced based on its share capital, varying from5% to 10%. In our case, considering the amount of our share capital, shareholders representing 5% of the voting capital may request the adoption of the cumulative vote system to elect the members of our board of directors. Ifthere is no request for the adoption of the cumulative vote system, directors are elected by a majority of the shareholders of our issued and outstanding common shares present in person or represented by proxy at ashareholders’ meeting, except that any minority shareholders that, individually or collectively, hold at least 10% of the common shares have the right to select one director.
Pursuant to our bylaws, if a shareholder requests the adoption of the cumulative vote system, as provided by Section 141, paragraph one of the Brazilian Corporation Law, we must disclose our receipt and thecontents of such notification immediately through a Shareholder Notice, available on the CVM website or in accordance with applicable laws or CVM rules.
The shareholders approve the aggregate compensation of the directors, fiscal council members and executive officers for each fiscal year. The board of directors decides the allocation of the compensation among itsmembers, the fiscal council members and the executive officers.
Board of Executive Officers
Our bylaws provide for a board of executive officers composed of at least two and no more than 15 members elected for a period of two years, one of which is the Global Chief Executive Officer, one of which is theChief Financial Officer and one of which is the Investor Relations Officer. The titles and duties of the remaining executive officers are proposed by the Global Chief Executive Officer to the Board of Directors.
The members of our board of executive officers are elected by our board of directors for two-year terms and are eligible for reelection. Our board of directors may remove any executive officer from office at any timewith or without cause. Under the Brazilian Corporation Law, our executive officers must be residents of Brazil but need not be shareholders of our company.
Fiscal Council
Under the Brazilian Corporation Law, the fiscal council is an auditing body independent from the company’s management. Its main responsibility is to inspect the management actions and audit our consolidatedfinancial statements, reporting its conclusions to the shareholders.
We have a permanent fiscal council composed of three members and an equal number of alternates. The Brazilian Corporation Law and our bylaws provide that, if there is a controlling shareholder, then minorityshareholders jointly representing 10% or more of the company shares will have the right to elect, in a separate vote, one member of the fiscal council and one alternate. Under the NovoMercadorules, the members of thefiscal council must, prior to taking office, sign a compliance statement subscribing to the NovoMercadoListing Regulations and Arbitration Regulations of the Arbitration Chamber.
Members of the fiscal council may not be members of the board of directors, officers or employees of the company or of a controlled company or a company from the same group. The Brazilian Corporation Lawalso requires that members of the fiscal council receive remuneration, at a minimum, in the amount of 10% of the average remuneration paid to directors, excluding other benefits.
135
Table of Contents
Statutory Audit Committee
At our shareholders’ meeting held on April 3, 2014, our shareholders approved the establishment of a permanent statutory audit committee, Our bylaws provide that the permanent statutory audit committee shall becomprised of three and a maximum of five members, of whom at least one will be an independent director of the Board of Directors. The statutory audit committee is designed to comply with CVM Instruction No. 509/11 ofNovember 16, 2011 and to allow us to rely on the exemption from the audit committee requirements of the SEC contained in paragraph (c)(3) of Rule 10A-3 under the Exchange Act. See “Item 16D. Exemptions from theListing Standards for Audit Committees.”
The statutory audit committee is an advisory body directly linked to the board of directors. The members of the statutory audit committee are appointed by the board of directors for terms of two years and will servefor no more than 10 years. At least one of the members of the statutory audit committee must be a financial specialist, having knowledge of corporate accounting, auditing and finance.
The statutory audit committee has the following functions:
opine on the engagement and removal of the independent auditors for the preparation of the outside independent audit or for any other service; supervise the activities (a) of the independent auditors to evaluate their independence and the quality and suitability of the services rendered, (b) of our internal controls department, (c) of our internal auditdepartment and (d) of our financial reporting department; monitor the quality and integrity of our internal control mechanisms, our quarterly information, our interim and annual financial statements and additional information and metrics published on the basis ofadjusted account data and non-accounting data which may incorporate information not typically reported in the financial statements; evaluate and monitor our exposure to risk, including requiring detailed information on policies and procedures related to management compensation, the use of our assets and expenses incurred in our name; evaluate and monitor, together with management and the internal audit department, the suitability and reasoning of transactions with related parties; and prepare a summarized annual report to be presented together with the financial statements containing a description of its activities, results and conclusions reached and recommendations offered, and anysituations where there is significant divergence between our management, the independent auditors and the statutory audit committee in relation to our financial statements.
The statutory audit committee must also have funding to receive, retain and respond to whistleblower complaints, including of a confidential nature, on matters related to the scope of the company’s internal orexternal activities, such as those of an accounting, internal controls and auditing nature.
The statutory audit committee has a written charter, which was approved by the board of directors and describes in detail the committee’s functions and operating procedures.
Transactions in Which Members of the Board of Directors and Executive Officers Have a Conflict of Interest
Our bylaws contain a specific provision limiting the right of a member of the board of directors to have access to information, participate in the discussions or vote on a proposal, arrangement or contract in which heor she has an interest that conflicts with our interests. In addition, the Brazilian Corporation Law prohibits a member of the board of directors or board of executive officers from intervening in any transaction that conflictswith the interests of the company.
136
Table of Contents
Allocation of Net Income and Distribution of Dividends
Calculation of Distributable Amount
At each annual shareholders’ meeting, our board of executive officers and our board of directors are required to recommend how to allocate our net profits, if any, from the preceding fiscal year. This allocation issubject to deliberation by our shareholders.
The Brazilian Corporation Law defines “net profits” for any fiscal year as net profits after income and social contribution taxes for that fiscal year, net of any accumulated losses from prior fiscal years and anyamounts allocated to employees’ and management’s participation in our net profits in such fiscal year. Our bylaws provide that the shareholders may allocate the participation of directors, executive officers and employees onour net profits as follows: up to 10% to employees and up to the limit established under applicable laws to our directors and executive officers.
Our bylaws provide that an amount equal to 25% of our net profits, if any, as reduced by amounts allocated to our legal reserves and contingency reserves, and increased by any reversals of our contingency reserves,if any, must be allocated for dividend distributions or payment of interest on shareholders’ equity in any particular year. This dividend is limited to the realized portion of our net profits, which amount is the minimummandatory dividend. Such amount must be calculated after excluding the allocation of profits to employees and directors. The calculation of our net profits, allocations to reserves and distributable amounts are determined onthe basis of our unconsolidated financial statements prepared in accordance with the Brazilian Corporation Law.
Profit Reserve Accounts
The financial statements of corporations constituted under Brazilian law include two principal reserve accounts: profit reserves and capital reserves. Except for the legal reserve, allocations to any reserve are subjectto the approval of our shareholders at our annual shareholders’ meetings.
ProfitReserves
Under the Brazilian Corporation Law, our profit reserves account is comprised of the legal reserve, unrealized profits reserve, contingency reserve, bylaw reserves and retained earnings reserve. Allocations to each ofthese reserves (other than the legal reserve) are subject to approval by company’s shareholders at annual shareholders’ meeting.
LegalReserve
Under the Brazilian Corporation Law and our bylaws, we are required to maintain a legal reserve to which we must allocate 5% of net profits for each fiscal year until the aggregate amount in the reserve equals 20%of share capital. However, we are not required to make any allocations to legal reserve in a fiscal year in which the legal reserve, when added to established capital reserves, exceeds 30% of total capital. The amounts to beallocated to such reserve must be approved by company’s shareholders at a shareholders’ meeting and may only be used to increase share capital or to absorb losses, but are not available for distribution. Under the newproposed bylaws, this amount must be calculated after excluding the allocation of profits to employees, officers and directors. At December 31, 2016, we had a legal reserve of R$540.2 million.
UnrealizedProfitReserve
Under the Brazilian Corporation Law, the amount by which the distributable amount exceeds realized net profits in a given fiscal year may be allocated to unrealized profits reserves. The Brazilian Corporation Lawdefines realized net profits as the amount by which net profits exceed the sum of (1) the portion of net income, if any, attributable to earnings and losses of subsidiaries and affiliates accounted for using the equity method ofaccounting and (2) the profits, gains or returns that will be received by company after the end of the next fiscal year. The profits allocated to the unrealized profits reserves must be added to the next mandatory minimumdividend distribution after those profits have been realized, if they have not been used to absorb losses in subsequent periods. At December 31, 2016, we did not have an unrealized profits reserve.
137
Table of Contents
ContingencyReserve
Under the Brazilian Corporation Law, a percentage of net profits may be allocated to a contingency reserve for estimable losses that are considered probable in future years. Any amount so allocated in a prior yearmust either be reversed in the fiscal year in which the loss had been anticipated if the loss does not occur as projected or be offset in the event that the anticipated loss occurs. At December 31, 2016, we did not have acontingency reserve.
BylawReserves
Under the Brazilian Corporation Law, any corporation may provide in its bylaws for additional reserves, provided that the maximum amount that may be allocated, the purpose and allocation criteria of the reserveare specified. Our bylaws provide for the following additional reserves:
Reservesforincreasesincapital. 20% of adjusted net profits for each fiscal year must be allocated to reserves for increases in capital until the aggregate amount in such reserve equals 20% of share capital.This amount must be calculated after excluding the allocation of profits to employees, officers and directors. At December 31, 2016, we had reserves for increases in capital of R$170.8 million. Expansionreserves. Shareholders may decide at a meeting to retain up to 50% of our net profits to allocate to an expansion reserve, up to a limit of 80% of share capital. This amount must be calculatedafter excluding the allocation of profits to employees, officers and directors. This reserve is intended to minimize the effects of a decrease in our working capital. At December 31, 2016, we did not have anexpansion reserve.
In addition, under the Brazilian Corporate Law, shareholders may decide at a meeting to retain a portion of net profits arising from donations on government grants for investment to allocate to a reserve for taxincentives. This reserve can be excluded from the calculation basis of the mandatory minimum dividends. At December 31, 2016, we had a reserve for tax incentives of R$639.7 million.
RetainedEarningsReserves
Under the Brazilian Corporation Law, our shareholders may decide at a general shareholders’ meeting to retain a portion of our net profits that is provided for in a capital expenditure budget. At December 31, 2016,we did not have a retained earnings reserve.
CapitalReserves
Under the Brazilian Corporation Law, the capital reserve consists of the share premium from the issuance of shares, goodwill reserves from mergers, sales of founders’ shares, sales of subscription warrants, premiumfrom the issuance of debentures, tax and fiscal incentives and donations. Amounts allocated to our capital reserve are not taken into consideration for purposes of determining the mandatory minimum dividends. We are notallowed to issue founders’ shares. In addition, the remaining balance in the capital reserve may only be used to increase share capital, to absorb losses that surpass accumulated profits and the profit reserves or to redeem,reimburse or purchase shares. At December 31, 2016, we had a capital reserve of R$41.0 million.
Payment of Dividends and Interest on Shareholders’ Equity
The bylaws of a Brazilian company must specify a minimum percentage of profit available for distribution, which must be paid to shareholders as mandatory dividends or as interest on shareholders’ equity.Consistent with the Brazilian Corporation Law, our bylaws provide that an amount equal to 25% of our net profits, adjusted as described in “—Allocation of Net Income and Distribution of Dividends” above, must beallocated for dividend distributions or payment of interest on shareholders’ equity in a particular year.
138
Table of Contents
While we are required under the Brazilian Corporation Law to pay a mandatory dividend each year, we may suspend the mandatory dividends if our administrative bodies report to our annual shareholders’ meetingthat the distribution is incompatible with our financial condition. Our fiscal council, if in operation, must review any suspension of mandatory dividends recommended by our management. In such case, our managementwould be required to submit a report to the CVM setting forth the reasons for any suspension of dividends. Profits not distributed by virtue of such a suspension are allocated to a special reserve and, if not absorbed by anysubsequent losses, are required to be distributed as dividends as soon as our financial condition permits their distribution.
We are able to allocate mandatory dividends in the form of interest on shareholders’ equity, which is deductible when calculating our income tax and social contribution. We have done so in the past and expect tocontinue to do so in the foreseeable future.
Dividends
We are required by the Brazilian Corporation Law and our bylaws to hold an annual shareholders’ meeting no later than the fourth month following the end of each fiscal year at which, among other things, theshareholders must vote to declare an annual dividend. The annual dividend is calculated based on our audited financial statements prepared for the immediately preceding fiscal year.
Any holder of shares on the date the dividend is declared is entitled to receive the dividend. Under the Brazilian Corporation Law, dividends are generally required to be paid within 60 days of the declaration date,unless the shareholders’ resolution establishes another date of payment, which, in any case, must occur before the end of the fiscal year in which the dividend is declared.
Our bylaws do not require that we index the amount of any dividend payment to inflation.
Our board of directors may declare interim dividends or interest on shareholders’ equity based on realized profits reflected in semiannual financial statements. The board of directors may also declare dividends basedon financial statements prepared for shorter periods, but they cannot exceed the amount of capital reserves. Any payment of interim dividends may be set off against the amount of mandatory dividends relating to the netprofits earned in the year in which the interim dividends were paid.
Interest on Shareholders’ Equity
Since January 1, 2006, Brazilian companies are permitted to pay interest on shareholders’ equity and treat those payments as a deductible expense for purposes of calculating Brazilian income tax and socialcontribution tax. The amount of the deduction is limited to the greater of: (1) 50% of our net profits (after deduction of social contribution and before payment of any interest or any deduction for income taxes) relating to theperiod to which the payment is made; and (2) 50% of our accumulated profits. The payment of interest on shareholders’ equity is an alternative to the payment of mandatory dividends. The rate applied in calculating intereston shareholders’ equity cannot exceed the TJLP rate for the applicable period. The amount distributed to our shareholders as interest on shareholders’ equity, net of any income tax, may be included as part of the mandatorydividends. In accordance with applicable law, we are required to pay to shareholders an amount sufficient to ensure that the net amount they receive in respect of interest on shareholders’ equity, after payment of anyapplicable withholding tax plus the amount of declared dividends, is at least equivalent to the mandatory dividend amount. For more information, see “E. Taxation—Brazilian Tax Considerations—Income Tax.”
Any payment of interest on shareholders’ equity to holders of common shares or ADRs, whether or not they are Brazilian residents, is subject to Brazilian withholding tax at the rate of 15%, except that a 25%withholding tax rate applies if the recipient is a resident of a tax haven jurisdiction. A tax haven jurisdiction is a country (1) that does not impose income tax or whose income tax rate is lower than 20% or (2) that does notpermit disclosure of the identity of shareholders of entities organized under its jurisdiction. Under our bylaws, we may include the amount distributed as interest on shareholders’ equity, net of any withholding tax, as part ofthe mandatory dividend amount.
139
Table of Contents
There are no restrictions on our ability to distribute dividends that have been lawfully declared under Brazilian law. However, as with other types of remittances from Brazil, the Brazilian government may imposetemporary restrictions on remittances to foreign investors of the proceeds of their investments in Brazil, as it did for approximately nine months in 1989 and early 1990, and on the conversion of Brazilian currency into foreigncurrencies, which could hinder or prevent the depositary from converting dividends into U.S. dollars and remitting these U.S. dollars abroad.
Prescription
Our shareholders have three years to claim dividend distributions made with respect to their shares, from the date that we distribute the dividends to our shareholders, after which any unclaimed or not receiveddividend distributions legally revert to us. We are not required to adjust the amount of any distributions for inflation that occurs during the period from the date of declaration to the payment date.
Withdrawal Rights
Shareholders who dissent from certain actions taken by our shareholders at a shareholders’ meeting have withdrawal rights. Under the Brazilian Corporation Law, a shareholder’s withdrawal rights may be exercisedin the following circumstances, among others:
spin-off (as described below); reduction in our mandatory dividends; change in our corporate purpose; consolidation with or merger into another company; participation in a group of companies (as defined in the Brazilian Corporation Law); or the acquisition by our company of the control of any company if the acquisition price exceeds the limits established in the second paragraph of Article 256 of the Brazilian Corporation Law.
However, under the Brazilian Corporation Law, a spin-off will not trigger withdrawal rights unless, as a result:
there is a change in our corporate purpose, except to the extent that the principal business purpose of the entity to which the spun-off assets and liabilities were transferred is consistent with our businesspurpose; there is a reduction in our mandatory dividend; or we are made part of a centralized group of companies, as defined in the Brazilian Corporation Law.
In cases where we:
merge into or consolidate with another company; participate in a group of companies (as defined in the Brazilian Corporation Law);
140
Table of Contents
participate in a merger of shares; or acquire the control of any company if the acquisition price exceeds the limits established in the second paragraph of Article 256 of the Brazilian Corporation Law, our shareholders will not be given withdrawal rights if our shares (1) are “liquid,” which means that they are part of the São Paulo Stock Exchange Index or another traded stock exchange index, as definedby the CVM, and (2) are widely held, such that our controlling shareholders and their affiliates jointly hold less than 50% of the type or class of shares that are being withdrawn.
The right to withdraw expires 30 days after publication of the minutes of the relevant shareholders’ meeting. We are entitled to reconsider any action giving rise to withdrawal rights for ten days after the expiration ofthis period if we determine that the redemption of shares of dissenting shareholders would jeopardize our financial stability.
Any shareholder who exercises withdrawal rights is entitled to receive book value for its shares, based on our most recent audited balance sheet approved by our shareholders. However, if the resolution giving rise tothe withdrawal rights is made more than 60 days after the date of our most recent balance sheet, a shareholder may request that its shares be valued in accordance with a new balance sheet dated no more than 60 days prior tothe date of the resolution. In such case, we are obligated to pay 80% of the refund value of the shares based on the most recent balance sheet approved by our shareholders, and the remaining balance must be paid within 120days after the date of the resolution at the shareholders’ meeting that gave rise to withdrawal rights based on the new balance sheet.
Redemption
Under the Brazilian Corporation Law, we may redeem our shares by a decision taken in an extraordinary shareholders’ meeting by shareholders representing at least 50% of our share capital.
Preemptive Rights
Except as described below, each of our shareholders has a general preemptive right to participate in any issuance of new shares, convertible debentures and warrants, in proportion to its shareholding at such time, butthe conversion of debentures and warrants into shares, the granting of options to purchase shares and the issuance of shares as a result of the exercise of options are not subject to preemptive rights.
A period of at least 30 days following the publication of notice of the issuance of shares, convertible debentures or warrants is allowed for the exercise of the preemptive right, and the right may be transferred ordisposed of for value. Under the terms of Article 172 of the Brazilian Corporation Law and our bylaws, our board of directors may reduce or exclude preemptive rights or reduce the exercise period with respect to the issuanceof new shares, debentures convertible into our shares and warrants up to the limit of our authorized stock capital if the distribution of those securities is effected through a stock exchange, through a public offering or throughan exchange offer for shares in a public offering the purpose of which is to acquire control of another company.
Anti-Takeover Effects of Provisions in Bylaws
Our bylaws contain provisions that have the effect of avoiding concentration of our shares in the hands of a small group of investors, in order to promote more widespread ownership of our shares. These provisionsrequire each shareholder who becomes the holder of 33.3% or more of our total share capital to immediately issue a press release to disclose that fact and within 30 days from the date of such event or acquisition, commence apublic tender offer to buy all of our outstanding shares in accordance with the CVM and the São Paulo Stock Exchange regulations and our bylaws. These provisions are triggered by the acquisition of beneficial ownership aswell as record ownership of our shares.
141
Table of Contents
These provisions are not applicable to shareholders who become holders of 33.3% or more of our shares as a result of (1) legal succession, provided that the shareholder sells any shares in excess of the 33.3% limitwithin 60 days of the event, (2) the incorporation of another company into us, (3) the incorporation of the shares of another company by us and (4) the subscription of shares of the Company carried out in a single primaryissue.
Involuntary capital increases resulting from cancellation of treasury shares or capital reductions with cancellation of shares will not be considered in the calculation of the 33.3% of total shares issued by us.
The public tender offer must be (1) directed to all our shareholders, (2) made through an auction to take place at the São Paulo Stock Exchange, (3) launched at a fixed price in accordance with the procedure set forthbelow and (4) paid upfront in Brazilian currency. The takeover should be immediately disclosed through a material fact notice, and a public tender offer must be commenced within 30 days from the date of such acquisition orevent and must be done with respect to all of our shares for a price per share that may not be less than the greater of: (i) 140% of the average trading price on the stock exchange trading the greatest volume of shares of thecapital stock of the Company during the last 120 trading sessions prior to the date on which the public tender offer became obligatory; and (ii) 140% of the average trading price on the stock exchange trading the greatestvolume of shares of the capital stock of the Company during the last 30 trading days prior to the date on which the public tender offer became obligatory.
The realization of the public tender offer does not exclude the right of another of our shareholders or of our company to launch a competing public tender offer in accordance with applicable regulations.
All shareholders who vote in favor of an amendment to the provisions of our bylaws that results in the limitation of this public tender offer obligation or the elimination of this mechanism are obligated to launch apublic tender offer based on the existing rules.
Restriction on Certain Transactions by Controlling Shareholders, Directors and Officers
We are subject to the rules of CVM Instruction 358, of January 3, 2002, relating to the trading of our securities. We, the members of our board of directors, executive officers and members of our fiscal council andmembers of any technical or advisory body, any current or future controlling shareholders, or whomever or whatever, by virtue of their or its title, duty or position with us, or with any such controlling shareholder, controlledcompany or affiliates, has knowledge of a material fact, and any other person who has knowledge of material information and knows it has not been disclosed to the market (including auditors, analysts, underwriters andadvisers), are considered insiders and must abstain from trading our securities, including derivatives based on our securities, prior to the disclosure of such material information to the market.
This restriction also applies:
to any of our former officers, directors or members of the fiscal council for a six-month period, if any such officer, director or member of the fiscal council left office prior to disclosure of materialinformation that occurred while in office; if we intend to merge or combine with another company, consolidate, spin off part or all of our assets or reorganize, until such information is disclosed to the market; to us, if an agreement for the transfer of our control has been executed, or if an option or mandate to such effect has been granted, until such information is disclosed to the market; during the 15-day period before the disclosure of our quarterly and annual financial statements required by the CVM; or to the controlling shareholders, our officers, and members of our board of directors, whenever we, or any of our controlling companies, affiliates or companies under common control, are in the process ofpurchasing or selling shares issued by us.
142
Table of Contents
Arbitration
In accordance with our bylaws, we, our shareholders, directors and members of our fiscal council agree to resolve through arbitration any disputes or controversies that may arise between us relating to or derivedfrom, in particular, the application, validity, enforceability, interpretation or breach (and its effects) of the NovoMercadolisting agreement, NovoMercadorules, our bylaws, the shareholders’ agreements filed at ourheadquarters, the Brazilian Corporation Law, the rules published by the CVM, the other rules applicable to the Brazilian capital markets in general or the rules of the Market Arbitration Chamber of the São Paulo StockExchange itself, in each case in accordance with the rules of the Market Arbitration Chamber.
Going-Private Process
Our shareholders may decide to take us private only if we or our controlling shareholders, as the case may be, conduct a public tender offer to acquire all of our outstanding shares in accordance with the rules andregulations of the Brazilian Corporation Law and CVM regulations. The minimum price offered for the shares in the public tender offer must correspond to the economic value of such shares, as determined by an appraisalreport issued by a specialized firm.
The appraisal report must be prepared by a specialized and independent firm of recognized experience chosen by shareholders representing the majority of the outstanding shares of the shareholders present at themeeting (excluding, for such purposes, the shares held by any controlling shareholder, its partner and any dependents included in the income tax statement (should the controlling shareholder be an individual), treasury shares,shares held by our affiliates and by other companies that are a part of our economic group, as well as blank votes) from a list of three institutions presented by our board of directors. All the expenses and costs incurred inconnection with the preparation of the appraisal report must be paid for by the controlling shareholder that wishes to take the company private.
Shareholders holding at least 10% of our outstanding shares (as adjusted in the manner described in the prior paragraph) may require our management to call an extraordinary shareholders’ meeting to determinewhether to perform another valuation using the same or a different valuation method. This request must be made within 15 days following the disclosure of the price to be paid for the shares in the public tender offer and mustbe justified. The shareholders who make such request, as well as those who vote in its favor, must reimburse us for any costs involved in preparing the new valuation if the new valuation price is not higher than the originalvaluation price. If the new valuation price is higher than the original valuation price, the public tender offer must be made at the higher price or cancelled, and this decision must be announced to the market in accordance withBrazilian law.
If our shareholders determine to take us private and at that time we do not have a controlling shareholder, we must conduct a public tender offer. In this case, subject to applicable regulation, we may only purchaseshares from shareholders who have voted in favor of our going private after purchasing all shares from the other shareholders who voted against going private and who have accepted the public tender offer. If, however, wehave a controlling shareholder who decides to take us private, such controlling shareholder is required, pursuant to our bylaws, to conduct a public tender offer.
Delisting from the Novo Mercado
At any time, we may delist our shares from the NovoMercado, provided that shareholders representing the majority of our shares approve the action and that we give at least 30 days’ written notice to the São PauloStock Exchange. The deliberation must specify if the delisting will occur because the securities will no longer be traded on the NovoMercado, or because we are going private. Our delisting from the NovoMercadowill notresult in the loss of our registration as a public company on the São Paulo Stock Exchange.
If we delist from the NovoMercado, by deliberation taken at a shareholders’ meeting, our controlling shareholder or group of controlling shareholders, if we have one, must conduct a public tender offer for theacquisition of our outstanding shares.
143
Table of Contents
The price per share shall be equivalent to the economic value of those shares as determined in a valuation report prepared by a specialized and independent company of recognized experience, which will be chosen ata shareholders’ meeting from a list of three institutions presented by our board of directors by a majority of the outstanding shares of the shareholders present at the meeting (excluding, for such purposes, the shares held byany controlling shareholder, its partner and dependents included in the income tax statement (should the controlling shareholder be an individual), treasury shares, shares held by our affiliates and by other companies that are apart of our economic group, as well as blank votes). All the expenses and costs incurred in connection with the preparation of the valuation report must be paid by the controlling shareholder undertaking the delisting.
If we do not have a controlling shareholder or group of controlling shareholders, in the event of our delisting from the NovoMercado, either for our shares to be traded outside the NovoMercadoor as a result of acorporate reorganization, the shareholders that voted in favor of such resolution must conduct a public offer for the acquisition of our shares in accordance with applicable regulations.
Pursuant to our bylaws, we may also be delisted if the São Paulo Stock Exchange decides to suspend trading of our shares on the NovoMercadodue to our non-compliance with the NovoMercadoregulations. Insuch a case, the chairman of the board of directors must call a shareholders’ meeting within two days of the determination by the São Paulo Stock Exchange in order to replace all members of our board of directors. If thechairman of the board of directors does not call the shareholders’ meeting, any shareholder may do so. The new board of directors will be responsible for fixing the non-compliance with the requirements that resulted in thedelisting.
Additionally, if we delist from the NovoMercado(1) as a result of our non-compliance with the NovoMercadoregulations resulting from a decision taken at our shareholders’ meeting, the public offer must beconducted by the shareholders who voted in favor of the decision, or (2) as a result of our non-compliance with the NovoMercadoregulations resulting from acts of our management, we must call a shareholder meeting todecide whether we will fix the noncompliance or delist from the NovoMercado,in which case the shareholders will have to decide who will be responsible for undertaking a public offering in connection with that.
Under the NovoMercadolisting regulations, in the event of a transfer of control of our company within 12 months following our delisting from the NovoMercado, the selling controlling shareholders and theacquirer must offer to acquire the remaining shares for the same price and terms offered to the selling controlling shareholders, adjusted for inflation.
If our shares are delisted from the NovoMercado, we will not be permitted to have shares listed on the NovoMercadofor a period of two years after the delisting date, unless there is a change in our control after thedelisting from the NovoMercado.
Change of Control
Under the rules of the NovoMercado, the direct or indirect sale of our control, in one transaction or in a series of transactions, creates an obligation by the acquirer to complete, subject to applicable regulations, apublic tender offer for the acquisition of all other outstanding shares on the same terms and conditions granted to the selling controlling shareholder.
A public tender offer is also required:
when there is an assignment of share subscription rights or rights of other securities convertible into our shares that results in the transfer of our control; or in case of change of control of another company that holds control of the company. In this case, the selling controlling shareholder must inform the São Paulo Stock Exchange of the amount of the purchaseprice paid for control and provide the corresponding documents.
In the event we are subject to widespread ownership, the shareholder that acquires control of our company will only be obligated to conduct a public tender offer acquire our remaining shares if there is a sale of anumber of shares of our share capital that entitles the acquiring shareholder, directly or indirectly, legally or in fact, effectively to control our business and orient our management. Such situations must be analyzed on a case-by-case basis. The change of control concept provided for in our bylaws and the situations in which the acquiring shareholder is required to make a public tender offer includes and may be broader than the concepts andsituations provided for in the Brazilian Corporation Law and in the NovoMercadolisting regulations.
144
Table of Contents
The acquirer must take all necessary measures to reconstitute the minimum 25% free float required under the NovoMercadolisting regulations within six months of the acquisition.
The controlling shareholder may not transfer the shares it holds to the purchaser of control, and we may not register the transfer of such shares, if the purchaser fails to execute the Terms of Consent to the NovoMercadoRegulations and the Rules of the Market Arbitration Chamber established by the São Paulo Stock Exchange.
Holders of 33.3% or More of Our Shares
Any person who acquires or becomes a shareholder through an offering for quantities of shares equal to or greater than 33.3% of the total issued shares should undertake or apply for registration of a takeover bid ofall shares of our offering and should comply with CVM rules, the regulations of the São Paulo Stock Exchange, and the provisions of our bylaws.
The takeover should be immediately disclosed through a material fact notice, and a public tender offer must be commenced within 30 days from the date of such acquisition or event and must be done with respect toall of our shares for a price per share that may not be less than the greater of: (i) 140% of the average trading price on the stock exchange trading the greatest volume of shares of the capital stock of the Company during thelast 120 trading sessions prior to the date on which the public tender offer became obligatory; and (ii) 140% of the average trading price on the stock exchange trading the greatest volume of shares of the capital stock of theCompany during the last 30 trading days prior to the date on which the public tender offer became obligatory. For a detailed description of the procedures applicable to takeover bid by increased participation, see our bylawsfiled as exhibit 1.01 to this Annual Report on Form 20-F.
Suspension of Rights of Acquiring Shareholder for Violation of Our Bylaws
In the event an acquiring shareholder violates the provisions of our bylaws regarding the need to conduct a public offer as a result of a change of control or of the purchase of shares representing 33.3% or more of ourshare capital, the rights of such acquiring shareholder may be suspended by a decision taken at our shareholders’ meeting. If such a violation occurs, we must hold a shareholders’ meeting and the acquiring shareholder willnot be entitled to vote at such meeting.
Purchases of Our Shares by Our Company
Our bylaws entitle our board of directors to approve the acquisition of our shares. The acquisition of our shares for cancellation or maintenance in treasury may not, among other actions:
result in a reduction of our share capital; require the use of resources greater than our retained earnings or reserves (other than the legal reserve, unrealized profit reserve, revaluation reserve, and special mandatory dividend reserves) recorded inour most recent balance sheet; create, directly or indirectly, any artificial demand, supply or share price condition, or use any unfair practice as a result of any action or omission; be conducted during the course of a public tender offer of our shares; or be used to purchase shares not fully paid or held by any controlling shareholder.
145
Table of Contents
The decision to purchase our own shares must be taken by the board of directors, which shall specify: (1) the purpose of the transaction; (2) the amount of shares to be purchased; (3) the period in which we willproceed with such purchases, not to exceed 365 days; (4) the amount of the free float of our shares; and (5) the financial institutions that will act as intermediaries for such purchases.
We cannot hold in treasury more than 10% of our total shares, including the shares held by our subsidiaries and affiliates.
Any acquisition of our shares by our company must be made on a stock exchange unless prior approval for the acquisition outside a stock exchange is obtained from the CVM. The purchase price of any such sharesmay not exceed their market price. We also may purchase our own shares for the purpose of going private. Moreover, subject to certain limitations, we may acquire or issue put or call options related to our shares.
Reporting Requirements
We are subject to the reporting requirements established by the Brazilian Corporation Law and the regulations of the CVM. In addition, as a result of our listing on the NovoMercado, we must meet the reportingrequirements of the NovoMercado.
Information Required by the CVM
Brazilian securities regulations require that a publicly held corporation must provide the CVM and the relevant stock exchanges with the following periodic information:
financial statements prepared in accordance with IFRS and related management and auditors’ reports, within three months from the end of its fiscal year or on the date in which they are published or madeavailable to shareholders, whichever occurs first, together with the DemonstraçõesFinanceirasPadronizadas(a report on a standard form containing financial information derived from our financialstatements required to be filled out by us and filed with the CVM); notices of our annual shareholders’ meeting, on the date of its publication; a summary of the decisions taken at the annual general shareholders’ meeting, on the day the meeting is held; a copy of the minutes of the annual shareholders’ meeting, within seven business days of its occurrence; FormuláriodeReferência– a report on a standard form containing annual corporate, business, and selected financial information, within a month from the date of the annual general shareholders’ meeting;and we must update this document in accordance with Instructions 480 and 481 of the CVM; InformaçõesTrimestrais– ITR (a report on a standard form containing quarterly corporate, business and financial information), together with a special review report issued by our independent auditor,within 45 days from the end of each quarter (except for the last quarter of each year) or upon disclosure of such information to the public if it occurs within 45 days from the end of the relevant quarter. In addition to the foregoing, we must also file with the CVM and the São Paulo Stock Exchange the following information: a notice of any extraordinary shareholders’ meeting, on the same date it is published;
146
a summary of the decisions taken at any extraordinary shareholders’ meetings, on the day the meeting is held; minutes of any extraordinary shareholders’ meeting, within seven business days of the date the meeting occurred; a copy of any shareholders’ agreement within seven business days it is filed with us; any press release giving notice of material facts, on the same date it is published in the press; information on any filing for plan of reorganization, the reason for such filing, special financial statements prepared for obtaining a legal benefit and, if applicable, a plan for payment of holders ofdebentures, as well as a copy of any judicial decision granting such request, on the same date it is filed and on the date we take notice of the judicial decision, respectively; request for information or notice of bankruptcy, the same day of notice by the Company, or the filing of a bankruptcy petition in court, as appropriate; and a copy of any judicial decision granting a bankruptcy request and appointing of a bankruptcy trustee, on the date we take notice of it.
Information Required by the São Paulo Stock Exchange from Companies Listed on the Novo Mercado
The shares of the Corporation have been listed to trade on the Brazilian Securities and Derivatives Stock Exchange special listing segment named NovoMercado, of BM&FBOVESPA S.A. – Bolsa de Valores,Mercadorias e Futuros. Accordingly, the Corporation, its shareholders, the Directors and Officers and the Fiscal Council members (if the council is active) are bound by BM&FBOVESPA’s Novo Mercado Listing Rules. Where a public tender offer required under the provisions of these bylaws is materially detrimental to the rights of shareholders, the Novo Mercado Listing Regulations shall prevail over the provisions of these bylaws.
As a NovoMercadocompany, we must observe the following additional disclosure requirements, among others:
no later than six months following our listing on the NovoMercado, we must disclose financial statements and consolidated financial statements at the end of each quarter (except the last quarter of eachyear) and at the end of each fiscal year, including a cash flow statement that must indicate, at a minimum, the changes in our cash and cash equivalents, divided into operating, finance and investment cashflows; as from the date we release our financial statements relating to the second fiscal year following our listing on the NovoMercadowe must, no later than four months after the end of the fiscal year: release our annual financial statements and consolidated financial statements in accordance with IFRS, in reaisand in the English language, including notes to the financial statements and includinginformation on net profits and net worth calculated at the end of such fiscal year in accordance with IFRS, together with a management report and the management proposal for the allocation of net profitsand our independent auditors’ report; or disclose, in the English language, the complete financial statements of BRF (parent company on an unconsolidated basis), management reports and notes to the financial statements prepared in accordancewith Brazilian Corporation Law, as well as the independent auditors’ report; and
147
Table of Contents
as from the date we release our first financial statements prepared as provided above, no more than 15 days following the period established by law for the publication of quarterly financial information, wemust: disclose, in its entirety, our quarterly financial information translated into the English language; or disclose our financial statements and consolidated financial statements in accordance with IFRS, accompanied by the independent auditors’ report.
Due to the listing of our shares on the NovoMercado, we must disclose the following information, pursuant to the NovoMercadoregulations, with our quarterly information ( InformaçõesTrimestrais):
our consolidated balance sheet, consolidated statement of income, and a discussion and analysis of our consolidated performance; any direct or indirect ownership interest exceeding 5% of our share capital, looking through to any ultimate individual beneficial owner; the number and characteristics of our shares held directly or indirectly by any controlling shareholders and members of our board of directors, board of executive officers and fiscal council; changes in the numbers of our shares held by any controlling shareholders and members of our board of directors, board of executive officers and fiscal council in the immediately preceding 12 months; our cash flow statement and consolidated cash flow statement, together with an explanatory note thereto; the number of shares constituting our free float and their percentage in relation to the total number of issued shares; and if we are party to an arbitration agreement for dispute resolution.
Information relating to the ownership interest exceeding five percent of our share capital, the number and characteristics of our shares directly or indirectly held by any controlling shareholders and members of theboard of directors, board of executive officers and fiscal council, changes in the number of securities held by such persons within the immediately preceding 12 months, the number of free float shares and their respectivepercentage in relation to the total number of shares issued and disclosure of whether we are party to an arbitration agreement for dispute resolution must also be included in our Annual Report on Form 20-F.
Information Regarding Any Trading Carried Out by Any Controlling Shareholders, Members of Our Board of Directors, Our Board of Executive Officers or Members of Our Fiscal Council
Pursuant to the rules of the CVM and the NovoMercado, any controlling shareholders, officers, directors, members of the fiscal council, if active, and members of any other technical or advisory committee createdby our bylaws, must disclose to us, the CVM and the São Paulo Stock Exchange information in connection with the total amount and characteristics of our securities owned, directly or indirectly, or any derivatives withreference to such securities, as well as any subsequent trading of such securities and derivatives. In the case of individuals, this information must also include securities held by the spouse, companion or dependents of suchpersons and be included in the annual income tax statement of the controlling shareholder, officer, director or member of the fiscal council. This information must be communicated to the CVM and the São Paulo StockExchange by the Investor Relations Officer within ten days after the end of each month.
148
Table of Contents
In addition, any controlling shareholders, our shareholders who have caused the election of members of our board of directors or fiscal council, as well as any individual, legal entity or group of persons acting jointlythat holds directly or indirectly 5% or more of our shares must provide to us, the CVM and the São Paulo Stock Exchange the following information:
the name and qualifications of the person acquiring the shares or other securities; the amount, price, type, and/or class, in the case of acquired shares, or characteristics, in the case of other securities; the form of acquisition (private placement, purchase through a stock exchange, among others); the reason and purpose of the acquisition; and information on any agreement regarding the exercise of voting rights or the purchase and sale of our securities.
The disclosure requirement referred to above will also apply to any person or group of persons acting jointly holding participations equal to or in excess of five percent each time such person increases or decreases itsparticipation in our shares by an amount equal to five percent of our shares.
Disclosure of Material Developments
According to Law No. 6,385 of December 7, 1976 and subsequent amendments, and the rules published by the CVM, we must disclose any material development related to our business to the CVM and to the SãoPaulo Stock Exchange and must publish a notice of the material development. A development is deemed to be material if it impacts the price of our securities, the decision of investors to trade in our securities or the decisionof investors to exercise any rights as holders of any of our securities. Under special circumstances, we may request confidential treatment of certain material developments from the CVM when our management believes thatpublic disclosure could result in adverse consequences to us.
Public Meeting with Analysts
NovoMercadoregulations require that our company conduct a public meeting with analysts and any other interested parties at least once a year to disclose information regarding the company’s economic andfinancial situation, its projects and its expectations.
Annual Calendar
NovoMercadoregulations require that companies and their management, by December 10 th of each year, disclose an annual calendar, and send a copy to the São Paulo Stock Exchange, containing all scheduledcorporate events, company information, the time and place of such events and the date when the information relating to these events will be disclosed and sent to the São Paulo Stock Exchange. Amendments to the calendarmust be communicated to the São Paulo Stock Exchange.
Trading on Stock Exchanges
Our shares trade on the NovoMercadosegment of the São Paulo Stock Exchange under the symbol “BRFS3.” The CVM and the São Paulo Stock Exchange have discretionary authority to suspend trading in sharesof a particular issuer under certain circumstances.
Settlement of transactions on the São Paulo Stock Exchange occurs three business days after the trade date. Delivery of and payment for shares is made through the facilities of an independent clearinghouse. Theclearinghouse for São Paulo Stock Exchange is the CBLC. The CBLC is the central counterparty for transactions effected on the São Paulo Stock Exchange, carrying out multi-party settlement for financial obligations andsecurities transfers. Under the regulations of the CBLC, financial settlement is carried out through the Reserve Transfer System of the Central Bank ( SistemadeTransferênciadeReservas). The settlement of trades of sharesis carried out in the custodial system of the CBLC. All deliveries against final payment are irrevocable.
149
Table of Contents
Agreements Within Our Group
According to CVM Instruction no. 480, we must disclose and send the São Paulo Stock Exchange information relating to any agreements entered into by our company with our controlled companies and affiliates,officers and any controlling shareholders, and, moreover, any agreements entered into by our company with controlled companies and affiliates of the officers and controlling shareholders as well as other companies that,together with these persons, compose a single group, in fact or in right, provided that such agreements, whether or not they involve one single agreement or successive agreements or the same or different purposes, in theexplanatory notes.
The information disclosed should include a description of the purpose of the relevant agreement, its term, value, termination provisions and any influence that this agreement may have over the management andoperations of our company.
Regulation of Foreign Investment
Investors residing outside Brazil, including institutional investors, are authorized to purchase equity instruments, including our common shares, on the São Paulo Stock Exchange, provided that they comply with theregistration requirements set forth in Resolution No. 4,373 and CVM Instruction No. 560.
With certain limited exceptions, Resolution No. 4,373 investors are permitted to carry out any type of transaction in the Brazilian capital markets involving a security traded on a stock, future or organized over-the-counter market, but may not transfer the ownership of investments made under Resolution No. 4,373 to other non-Brazilian holders through private transactions. Investments and remittances outside Brazil of gains, dividends,profits or other payments under our common shares are made through the foreign exchange market.
In order to become a Resolution No. 4,373 investor, an investor residing outside Brazil must:
appoint at least one representative in Brazil who will be responsible for complying with registration an reporting requirements and procedures with the Central Bank and the CVM. If the representative is anindividual or a non-financial company, the investor must also appoint an institution duly authorized by the Central Bank that will be jointly and severally liable for the representative’s obligations; complete the appropriate foreign investor registration form; register as a foreign investor with the CVM; register the foreign investment with the Central Bank; appoint a tax representative in Brazil; obtain a taxpayer identification number from the Brazilian federal tax authorities; and appoint at least one custodian duly authorized by CVM.
Securities and other financial assets held by foreign investors pursuant to Resolution No. 4,373 must be registered or maintained in deposit accounts or under the custody of an entity duly licensed by the Central Bank or theCVM. In addition, securities trading by foreign investors is generally restricted to transactions on the São Paulo Stock Exchange or in organized over-the-counter markets licensed by the CVM.
150
Table of Contents
C. Material Contracts
BRF has not entered into any material contracts since January 1, 2015.
D. Exchange Controls
Brazilian law provides that, whenever there is a significant imbalance in Brazil’s balance of payments or reasons to foresee such an imbalance, temporary restrictions may be imposed on remittances of foreign capitalabroad. For approximately six months in 1989 and early 1990, for example, aiming at preserving Brazil’s foreign currency reserves, the Brazilian government froze all dividend and capital repatriations that were owed toforeign equity investors and held by the Central Bank. These amounts were subsequently released in accordance with Brazilian Government directives. There can be no assurance, however, that the Brazilian Government maynot take similar measures in the future.
There are no restrictions on ownership of capital share of the Company by individuals or legal entities domiciled outside Brazil. However, the right to convert dividend payments and proceeds from the sale ofCommon Shares into foreign currency and to remit such amounts outside Brazil is subject to exchange control restrictions and foreign investment legislation that generally requires, among other things, obtaining an ElectronicRegistration under the Resolution No. 4,373. Under Resolution No. 4,373, qualified foreign investors registered with the CVM and acting through authorized custody accounts managed by local agents may buy and sell shareson Brazilian share exchanges without obtaining separate Electronic Registration for each transaction. Investors under the Resolution No. 4,373 are also generally entitled to favorable tax treatment.
Electronic Registrations by the Brazilian Central Bank have been issued in the name of the Company with respect to the ADRs. Pursuant to the electronic registration, the Custodian will be able to convert dividendsand other distributions with respect to the shares represented by the ADRs into foreign currency and remit the proceeds outside Brazil.
E. Taxation
The following summary contains a description of certain Brazilian and U.S. federal income tax consequences of the acquisition, ownership and disposition of common shares or ADRs, but it does not purport to be acomprehensive description of all the tax considerations that may be relevant to a decision to purchase common shares or ADRs. The summary is based upon the tax laws of Brazil and regulations thereunder and on the taxlaws of the United States and regulations thereunder as in effect on the date hereof, which are subject to change. Prospective purchasers of common shares or ADRs should consult their own tax advisors as to the taxconsequences of the acquisition, ownership and disposition of common shares or ADRs.
Although there is at present no tax treaty to avoid double taxation between Brazil and the United States, the tax authorities of the two countries have had discussions that may culminate in such a treaty. No assurancecan be given, however, as to whether or when a treaty will enter into force or how it will affect the U.S. Holders (as defined below under “— U.S. Federal Income Tax Considerations”) of common shares or ADRs.Prospective holders of common shares or ADRs should consult their own tax advisors as to the tax consequences of the acquisition, ownership and disposition of common shares or ADRs in their particular circumstances.
Brazilian Tax Considerations
The following discussion summarizes the material Brazilian tax consequences of the acquisition, ownership and disposition of common shares or ADRs by a holder that is not domiciled in Brazil for purposes ofBrazilian taxation (a “Non-Resident Holder”) and does not specifically address all of the Brazilian tax considerations applicable to any particular Non-Resident Holder. Each Non-Resident Holder should consult its own taxadviser concerning the Brazilian tax consequences of an investment in common shares or ADRs. The discussion below is based on Brazilian law as currently in effect. Any change in that law may change the consequencesdescribed below.
Income Tax
151
Table of Contents
Dividends.Dividends paid by a Brazilian corporation, such as our company, including stock dividends and other dividends paid to a Non-Resident Holder of common shares or ADRs, are currently not subject toBrazilian withholding income tax, as far as such amounts are related to profits generated on or after January 1, 1996. Dividends relating to profits generated prior to January 1, 1996 may be subject to Brazilian withholding taxat varying rates, depending on the year the profits were generated.
InterestonShareholders’Equity.Law No. 9,249, dated December 26, 1995, as amended, permits a Brazilian corporation, such as our company, to make distributions to shareholders of interest on shareholders’equity. These distributions may be paid in cash. Such payments represent a deductible expense from the payer’s corporate income tax and social contribution on net profits tax basis. For tax purposes, this interest is limited tothe daily pro rata variation of the TJLP, as determined by the Central Bank from time to time, and may not exceed the greater of:
50% of net income (after the social contribution on net profits tax, and before the provision for corporate income tax and the amounts attributable to shareholders as interest on shareholders’ equity) for theperiod in respect of which the payment is made; and 50% of the sum of retained profits and profit reserves as of the date of the beginning of the period in respect of which the payment is made.
Payment of interest to a Non-Resident Holder is subject to withholding income tax at the rate of 15%, or 25% if the Non-Resident Holder is domiciled in a tax haven (“Tax Haven Residents”). For this purpose, a “taxhaven” is a country or location that does not impose income tax, where the income tax rate is lower than 20% or where the local legislation imposes restrictions on disclosing the shareholding composition or the ownership ofthe investment. These payments of interest on shareholders’ equity may be included, at their net value, as part of any mandatory dividend. To the extent payment of interest on shareholders equity is so included, thecorporation is required to distribute to shareholders an additional amount to ensure that the net amount received by them, after payment of the applicable Brazilian withholding income tax, plus the amount of declareddividends is at least equal to the mandatory dividend.
We believe that the best interpretation of the current tax legislation lead to the conclusion that a Non-Resident Holder domiciled in a privileged tax regime is not subject to the increased tax rate of 25%. In this case,the applicable tax rate would be 15%. For this purpose, under Law No. 11,727, dated June 23, 2008, a “privileged tax regime” is a tax regime that: i) does not impose income tax or where the income tax rate is lower than 20%for income earned inside its territory or abroad; ii) provides tax advantage to non-residents: a) without demanding execution of substantive economic activity; or b) conditioned to the non-execution of substantive economicactivity; or iii) pursuant to the local legislation imposes restrictions on disclosing the shareholding composition, the ownership of the investment or the economic operations executed in its territory.
Nevertheless, we cannot assure you whether subsequent legislation or interpretations by the Brazilian tax authorities regarding the definition of a “privileged tax regime” provided by Law No. 11,727 will also applyto a Non-Resident Holder on payments potentially made by a Brazilian source. In other words, Brazilian tax authorities may determine that the increased tax rate of 25% must apply to payments made by a Brazilian source toa Non-Resident Holder subject to “privileged tax regimes”.
We recommend prospective investors to consult their own tax advisors from time to time to verify any possible tax consequences arising from Normative Instruction No. 1,037/2010 (that provides an exhaustive listof all the countries deemed as a “tax haven” and all tax regimes deemed as a “privileged tax regime”) and Law No. 11,727.
Distributions of interest on shareholders equity to Non-Resident Holders may be converted into U.S. dollars and remitted outside Brazil, subject to applicable exchange controls, to the extent that the investment isregistered with the Central Bank.
The Brazilian President enacted the Provisional Measure No. 694/15 to effect the following changes:
152
Table of Contents
the maximum TJLP will be 5% (currently this rate is approximately 7.5%); and the withholding tax will rise from 15% to 18% (except for Tax Haven Residents who continue to be subject to 25% withholding tax).
Such Provisional Measure had not been converted into law within the required legal deadlines and therefore had not changed the rules about interest on shareholders’ equity as initially intended.
Gains
According to Law No. 10,833/03, the gains recognized on a disposition of assets located in Brazil, such as our common shares, by a Non-Resident Holder, are subject to withholding income tax in Brazil. This rule isapplicable regardless of whether the disposition is conducted in Brazil or abroad and/or if the disposition is or is not made to an individual or entity resident or domiciled in Brazil.
As a general rule, capital gains realized as a result of a disposition transaction are the positive difference between the amount realized on the disposition of the common shares and the respective acquisition cost.
Capital gains realized by Non-Resident Holders on the disposition of common shares sold on the Brazilian stock exchange (which includes the transactions carried out on the organized over-the-counter market):
are subject to the withholding income tax at a zero percent rate, when realized by a Non-Resident Holder that (i) has registered its investment in Brazil before the Central Bank under the rules of theBrazilian Monetary Council (“Registered Holder”) and (ii) is not a Tax Haven Resident; are subject to withholding income tax at a rate of 15% with respect to gains realized by a Non-Resident Holder that is neither a Registered Holder (including a Non-Resident Holder who qualifies under LawNo. 4,131/62) nor a Tax Haven Resident. In this case, a withholding income tax of 0.005% shall be applicable and can be offset against any income tax due on the capital gain; and are subject to withholding income tax at a rate of 15% with respect to gains realized by a Non-Resident Holder that is a Tax Haven Resident regardless of being a Registered Holder or not. In this case, awithholding income tax of 0.005% shall be applicable and can be offset against any income tax due on the capital gain.
Any other gains realized on the disposition of common shares that are not carried out on the Brazilian stock exchange:
are subject to income tax at a rate of 15% when realized by any Non-Resident Holder that is not a Tax Haven Resident, whether or not such holder is a Registered Holder; and are subject to income tax at a rate of 25% when realized by a natural or legal person that is a Tax Haven Resident, whether or not such holder is a Registered Holder.
In the cases described above, if the gains are related to transactions conducted on the Brazilian non-organized over-the-counter market with intermediation, the withholding income tax of 0.005% shall also beapplicable and can be offset against any income tax due on the capital gain.
Any exercise of preemptive rights relating to common shares will not be subject to Brazilian withholding income tax. Gains realized by a Non-Resident Holder on the disposition of preemptive rights will be subjectto Brazilian income tax according to the same rules applicable to disposition of common shares.
In the case of a redemption of common shares or a capital reduction, the positive difference between the amount received by the Non-Resident Holder and the acquisition cost of the common shares redeemed in reaisis treated as capital gain derived from the sale or exchange of shares not carried out on a Brazilian stock exchange market and is therefore subject to income tax at the rate of 15%, or 25%, as the case may be.
153
Table of Contents
There can be no assurance that the current favorable tax treatment of Registered Holders will continue in the future.
SaleofADRsbyU.S.HolderstoOtherNon-ResidentsinBrazil
As discussed above, the sale of property located in Brazil involving Non-Resident Holders is subject to Brazilian withholding income tax as of February 1, 2004. Our understanding is that ADRs do not qualify asproperty located in Brazil and, thus, should not be subject to the Brazilian withholding tax. Insofar as the regulatory norm referred to in Article 26 of Law No. 10,833/03 is generic and has not been tested through theadministrative or judicial courts, we are unable to assure the final outcome of such discussion.
GainsontheExchangeofADRsforCommonShares
Although there is no clear regulatory guidance, the exchange of ADRs for common shares should not be subject to Brazilian withholding tax. Non-Resident Holders may exchange the ADSs evidenced by ADRs forthe underlying common shares, sell the common shares on a Brazilian stock exchange and remit abroad the proceeds of the sale within five business days from the date of exchange (in reliance on the depositary’s electronicregistration) with no tax consequences.
Upon receipt of the underlying common shares in exchange for ADSs evidenced by ADRs, Non-Resident Holders may also elect to register with the Central Bank the U.S. dollar value of such common shares as aforeign portfolio investment under Resolution No. 4,373, which will entitle them to the tax treatment discussed above.
Alternatively, the Non-Resident Holder is also entitled to register with the Central Bank the U.S. dollar value of such common shares as a foreign direct investment under Law No. 4,131/62, in which case therespective sale would be subject to the tax treatment applicable to transactions carried out on the Brazilian stock exchange.
GainsontheExchangeofCommonSharesforADRs
The deposit of common shares in exchange for the ADRs may be subject to Brazilian withholding income tax on capital gains if the amount previously registered with the Central Bank as a foreign investment incommon shares or, in the case of other market investors under Resolution No. 4,373, the acquisition cost of the common shares, as the case may be, is lower than:
the average price per common share on the Brazilian stock exchange on which the greatest number of such common shares were sold on the day of deposit; or if no common shares were sold on that day, the average price on the Brazilian stock exchange on which the greatest number of common shares were sold during the 15 preceding trading sessions.
The difference between the amount previously registered, or the acquisition cost, as the case may be, and the average price of the common shares, calculated as set forth above, is considered a capital gain subject toincome tax at a rate of 15%, or 25% for Tax Haven Residents.
Tax on Foreign Exchange and Financial Transactions
ForeignExchangeTransactions.Brazilian law imposes a Tax on Foreign Exchange Transactions, or “IOF/Exchange Tax,” on the conversion of reaisinto foreign currency and on the conversion of foreign currencyinto reais. Currently, IOF rates for almost all foreign currency exchange transactions are 0.38%. In the case of transactions performed in the stock market or under the regulations issued by the Monetary Council of Brazil, theapplicable rate is zero. In any situation, the Ministry of Finance is permitted to increase the rate at any time up to 25% on the foreign exchange transaction amount. However, any increase in the rate will not applyretroactively.
154
Table of Contents
TaxonTransactionsInvolvingBondsandSecurities.Brazilian law imposes a Tax on Transactions Involving Bonds and Securities, or “IOF/Bonds Tax,” including those carried out on a Brazilian stock exchange.The rate of IOF/Bonds Tax applicable to transactions involving common shares is currently zero, but the Minister of Finance is permitted to increase such rate at any time up to 1.5% of the transaction amount per day, but anyincrease in the rate will not apply retroactively.
Other Brazilian Taxes
There are no Brazilian inheritance, gift or succession taxes applicable to the ownership, transfer or disposition of common shares or ADRs, except for gift and inheritance taxes imposed by some Brazilian states ongifts or bequests by individuals or entities not domiciled or residing in Brazil to individuals or entities domiciled or residing within such states. There are no Brazilian stamp, issue, registration or similar taxes or duties payableby holders of common shares or ADRs.
U.S. Federal Income Tax Considerations
The following summary describes certain U.S. federal income tax consequences of the acquisition, ownership and disposition of our common shares and ADRs as of the date hereof. Except where noted, thissummary deals only with U.S. Holders (as defined below) that hold our common shares or ADRs as capital assets for U.S. federal income tax purposes (generally, property held for investment). As used in this summary, theterm “U.S. Holder” means a holder of our common shares or ADRs that is for U.S. federal income tax purposes:
an individual citizen or resident of the United States; a corporation (or other entity treated as a corporation for U.S. federal income tax purposes) created or organized in or under the laws of the United States, any state thereof or the District of Columbia; an estate the income of which is subject to U.S. federal income taxation regardless of its source; or a trust if it (1) is subject to the primary supervision of a court within the United States and one or more United States persons have the authority to control all substantial decisions of the trust or (2) has avalid election in effect under applicable United States Treasury regulations to be treated as a United States person.
This summary does not represent a detailed description of the U.S. federal income tax consequences applicable to you if you are subject to special treatment under the U.S. federal income tax laws, including if youare:
a dealer in securities or currencies; a financial institution; a regulated investment company; a real estate investment trust; an insurance company; a tax-exempt organization; a person holding our common shares or ADRs as part of a hedging, integrated or conversion transaction or a straddle; a person deemed to sell our common shares or ADRs under the constructive sale provisions of the U.S. Internal Revenue Code of 1986, as amended (the “Code”);
155
Table of Contents
a trader in securities that has elected the mark-to-market method of accounting for your securities; a person liable for alternative minimum tax; a person who owns or is deemed to own 10% or more of our voting stock; a partnership or other pass-through entity for U.S. federal income tax purposes; or a person whose “functional currency” for U.S. federal income tax purposes is not the U.S. dollar.
The discussion below is based upon the provisions of the Code, and regulations, rulings and judicial decisions thereunder as of the date hereof, and such authorities may be replaced, revoked or modified so as toresult in U.S. federal income tax consequences different from those discussed below. In addition, this summary is based, in part, upon representations made by the depositary to us and assumes that the deposit agreementrelating to the ADRs, and all other related agreements, will be performed in accordance with their terms.
If a partnership holds our common shares or ADRs, the tax treatment of a partner will generally depend upon the status of the partner and the activities of the partnership. If you are a partner of a partnership holdingour common shares or ADRs, you should consult your tax advisors.
This summary does not contain a detailed description of all the U.S. federal income tax consequences to you in light of your particular circumstances and does not address the Medicare tax on net investment incomeor the effects of any state, local or non-United States tax laws. If you are considering the purchase, ownership or disposition of our common shares or ADRs, you should consult your own tax advisors concerning the U.S.federal income tax consequences to you in light of your particular situation, as well as any consequences arising under the laws of any other taxing jurisdiction.
ADRs
If you hold ADRs, for U.S. federal income tax purposes, you generally will be treated as the owner of the underlying common shares that are represented by the ADSs evidenced by ADRs. Accordingly, deposits orwithdrawals of common shares for ADRs will not be subject to U.S. federal income tax.
Taxation of Dividends
Subject to the discussion under “—Passive Foreign Investment Company” below, the gross amount of distributions on the ADRs or our common shares (including amounts withheld to reflect Brazilian withholdingtaxes and distributions of interest on shareholders’ equity, as described above under “—Brazilian Tax Considerations”) will be taxable as dividends, to the extent paid out of our current or accumulated earnings and profits, asdetermined under U.S. federal income tax principles. Such income (including withheld taxes) will be includable in your gross income as ordinary income on the day actually or constructively received by you, in the case ofour common shares, or by the depositary, in the case of ADRs. Such dividends will not be eligible for the dividends received deduction allowed to corporations under the Code.
With respect to non-corporate U.S. Holders, certain dividends received from a qualified foreign corporation may be subject to reduced rates of taxation. Subject to certain limitations, a foreign corporation is treated asa qualified foreign corporation with respect to dividends received from that corporation on shares (or ADRs backed by such shares) that are readily tradable on an established securities market in the United States. U.S.Treasury Department guidance indicates that the ADRs (which are listed on the NYSE), but not our common shares, are readily tradable on an established securities market in the United States. Thus, although we believe thatdividends received with respect to ADRs currently meet the conditions required for those reduced tax rates, we do not believe that dividends received with respect to common shares (rather than ADRs) currently meet theconditions required for those reduced tax rates. We cannot assure you that the ADRs will be considered readily tradable on an established securities market in later years. Non-corporate holders that do not meet a minimumholding period requirement during which they are not protected from the risk of loss or that elect to treat the dividend income as “investment income” pursuant to Section 163(d)(4) of the Code will not be eligible for thereduced rates of taxation regardless of our status as a qualified foreign corporation. In addition, the rate reduction will not apply to a dividend if the recipient of the dividend is obligated to make related payments with respectto positions in substantially similar or related property. This disallowance applies even if the minimum holding period has been met. Furthermore, non-corporate U.S. Holders will not be eligible for reduced rates of taxationon any dividends received from us if we are a passive foreign investment company (as discussed below under “— Passive Foreign Investment Company”) in the taxable year in which such dividends are paid or in thepreceding taxable year. You should consult your own tax advisors regarding the application of these rules given your particular circumstances.
156
Table of Contents
The amount of any dividend paid in reaiswill equal the U.S. dollar value of the reaisreceived calculated by reference to the exchange rate in effect on the date the dividend is received by you, in the case of commonshares, or by the depositary, in the case of ADRs, regardless of whether the reaisare converted into U.S. dollars. If the reaisreceived as a dividend are converted into U.S. dollars on the date they are received, you generallywill not be required to recognize foreign currency gain or loss in respect of the dividend income. If the reaisreceived as a dividend are not converted into U.S. dollars on the date of receipt, you will have a basis in the reaisequal to their U.S. dollar value on the date of receipt. Any gain or loss realized on a subsequent conversion or other disposition of the reaiswill be treated as U.S. source ordinary income or loss.
Subject to certain conditions and limitations, Brazilian withholding taxes on distributions (including distribution of interest on shareholders’ equity) will be treated as foreign taxes eligible for credit against your U.S.federal income tax liability. For purposes of calculating the foreign tax credit, dividends paid on the ADRs or our common shares will be treated as income from sources outside the United States and will generally constitutepassive category income. In addition, in certain circumstances, if you have held ADRs or common shares for less than a specified minimum period during which you are not protected from risk of loss, or are obligated to makepayments related to the dividends, you will not be allowed a foreign tax credit for foreign taxes imposed on dividends paid on the ADRs or common shares. The rules governing the foreign tax credit are complex. You areurged to consult your tax advisors regarding the availability of the foreign tax credit under your particular circumstances. Instead of claiming a credit, you may, at your election, deduct such otherwise creditable Brazilianwithholding taxes in computing your taxable income, but only for a taxable year in which you elect to do so with respect to all foreign income taxes paid or accrued in such taxable year and subject to generally applicablelimitations under U.S. law.
To the extent that the amount of any distribution (including amounts withheld to reflect Brazilian withholding taxes and distributions of interest on shareholders’ equity, as described above under “—Brazilian TaxConsiderations”) exceeds our current and accumulated earnings and profits for a taxable year, as determined under U.S. federal income tax principles, the distribution will first be treated as a tax-free return of capital, causinga reduction in the adjusted basis of the ADRs or common shares, and the balance in excess of adjusted basis will be taxed as capital gain recognized on a sale or exchange (as discussed below under “—Taxation of CapitalGains”). However, we do not expect to calculate earnings and profits in accordance with U.S. federal income tax principles. Therefore, you should assume that a distribution will generally be treated as a dividend (asdiscussed above).
Distributions of common shares or ADRs, or rights to subscribe for common shares or ADRs, which are received as part of a pro rata distribution to all of our shareholders generally will not be subject to U.S. federalincome tax.
Passive Foreign Investment Company
Based on our financial statements, relevant market and shareholder data, and the projected composition of our income and valuation of our assets, including goodwill, we do not believe we were a PFIC for U.S.federal income tax purposes for 2016, and we do not expect to be a PFIC for 2017 or in the future, although we can provide no assurances in this regard.
In general, we will be a PFIC for any taxable year in which:
at least 75% of our gross income is passive income, or
157
Table of Contents
at least 50% of the value (determined on a quarterly basis) of our assets is attributable to assets that produce or are held for the production of passive income.
For this purpose, cash is a passive asset and passive income generally includes dividends, interest, royalties and rents (other than royalties and rents derived in the active conduct of a trade or business and not derivedfrom a related person). If we own at least 25% (by value) of the stock of another corporation, we will be treated, for purposes of the PFIC tests, as owning our proportionate share of the other corporation’s assets and receivingour proportionate share of the other corporation’s income.
The determination of whether we are a PFIC must be made annually. Accordingly, it is possible that we may become a PFIC in the current or any future taxable year due to changes in our income or assetcomposition. Because we have valued our goodwill based on the market value of our equity, a decrease in the price of our ADRs or common shares may also result in our becoming a PFIC. If we are a PFIC for any taxableyear during which you hold our ADRs or common shares, you will be subject to special tax rules discussed below and could suffer adverse tax consequences.
If we are a PFIC for any taxable year during which you hold our ADRs or common shares, you will be subject to special tax rules with respect to any “excess distribution” received and any gain realized from a saleor other disposition, including a pledge, of ADRs or common shares. Distributions received in a taxable year that are greater than 125% of the average annual distributions received during the shorter of the three precedingtaxable years or your holding period for the ADRs or common shares will be treated as excess distributions. Under these special tax rules:
the excess distribution or gain will be allocated ratably over your holding period for the ADRs or common shares, the amount allocated to the current taxable year, and any taxable year prior to the first taxable year in which we were a PFIC, will be treated as ordinary income, and the amount allocated to each other year will be subject to tax at the highest tax rate in effect for that year and the interest charge generally applicable to underpayments of tax will be imposed on theresulting tax attributable to each such year.
In addition, non-corporate U.S. Holders will not be eligible for reduced rates of taxation on any dividends received from us if we are a PFIC in the taxable year in which such dividends are paid or in the precedingtaxable year. You will generally be required to file Internal Revenue Service Form 8621 if you hold our ADRs or common shares in any year in which we are classified as a PFIC.
If we are a PFIC for any taxable year and any of our non-United States subsidiaries is also a PFIC, a U.S. Holder would be treated as owning a proportionate amount (by value) of the common shares of the lower-tierPFIC for purposes of the application of these rules. You are urged to consult your tax advisors about the application of the PFIC rules to any of our subsidiaries.
In certain circumstances, in lieu of being subject to the excess distribution rules discussed above, you may make an election to include gain on the stock of a PFIC as ordinary income under a mark-to-market method,provided that such stock is regularly traded on a qualified exchange. Under current law, the mark-to-market election may be available to holders of ADRs because the ADRs are listed on the NYSE, which constitutes aqualified exchange, although there can be no assurance that the ADRs will be “regularly traded” for purposes of the mark-to-market election. It should also be noted that only the ADRs and not the common shares are listed onthe NYSE. Our common shares are listed on the NovoMercado(New Market) of the São Paulo Stock Exchange, which must meet certain trading, listing, financial disclosure and other requirements to be treated as a qualifiedexchange under applicable Treasury regulations for purposes of the mark-to-market election, and no assurance can be given that the common shares will be “regularly traded” for purposes of the mark-to-market election.
158
Table of Contents
If you make an effective mark-to-market election, you will include in each year that we are a PFIC as ordinary income the excess of the fair market value of your ADRs or common shares at the end of the year overyour adjusted tax basis in the ADRs or common shares. You will be entitled to deduct as an ordinary loss in each such year the excess of your adjusted tax basis in the ADRs or common shares over their fair market value atthe end of the year, but only to the extent of the net amount previously included in income as a result of the mark-to-market election. If you make an effective mark-to-market election, in each year that we are a PFIC any gainyou recognize upon the sale or other disposition of your ADRs or common shares will be treated as ordinary income and any loss will be treated as ordinary loss, but only to the extent of the net amount previously included inincome as a result of the mark-to-market election.
Your adjusted tax basis in the ADRs or common shares will be increased by the amount of any income inclusion and decreased by the amount of any deductions under the mark-to-market rules. If you make a mark-to-market election it will be effective for the taxable year for which the election is made and all subsequent taxable years unless the ADRs or common shares are no longer regularly traded on a qualified exchange or theInternal Revenue Service consents to the revocation of the election. You are urged to consult your tax advisor about the availability of the mark-to-market election, and whether making the election would be advisable in yourparticular circumstances.
Alternatively, you can sometimes avoid the rules described above by electing to treat a PFIC as a “qualified electing fund” under Section 1295 of the Code. This option is not available to you because we do notintend to comply with the requirements necessary to permit you to make this election. You are urged to consult your tax advisors concerning the United States federal income tax consequences of holding ADRs or commonshares if we are considered a PFIC in any taxable year.
Taxation of Capital Gains
For U.S. federal income tax purposes, you will recognize taxable gain or loss on any sale, exchange or redemption of common shares or ADRs in an amount equal to the difference between the amount realized forthe common shares or ADRs (including any amounts withheld to reflect Brazilian withholding taxes) and your tax basis in the common shares or ADRs, both determined in U.S. dollars. Subject to the discussion under “—Passive Foreign Investment Company” above, such gain or loss will generally be capital gain or loss. Capital gains of non-corporate holders derived with respect to capital assets held for more than one year are eligible forreduced rates of taxation. The deductibility of capital losses is subject to limitations. Any gain or loss recognized by you will generally be treated as U.S. source gain or loss. Consequently, you may not be able to use theforeign tax credit arising from any Brazilian tax imposed on the disposition of our common shares or ADRs unless such credit can be applied (subject to applicable limitations) against tax due on other income treated asderived from sources outside the United States in the appropriate category for foreign tax credit purposes.
Other Brazilian Taxes
It is important to note that any Brazilian IOF/Exchange Tax or IOF/Bonds Tax (as discussed above under “—Brazilian Tax Considerations”) will not be treated as a creditable foreign tax for U.S. federal income taxpurposes, although you may be entitled to deduct such taxes, subject to applicable limitations under the Code. You should consult your tax advisors regarding the U.S. federal income tax consequences of these other Braziliantaxes.
Information Reporting and Backup Withholding
In general, information reporting will apply to dividends in respect of common shares or ADRs and the proceeds from the sale, exchange or redemption of common shares or ADRs that are paid to you within theUnited States (and in certain cases, outside the United States), unless you are an exempt recipient. Backup withholding may apply to such payments if you fail to provide a taxpayer identification number or certification ofother exempt status or fail to report in full dividend and interest income.
Any amounts withheld under the backup withholding rules will be allowed as a refund or a credit against your U.S. federal income tax liability provided the required information is furnished to the Internal RevenueService.
159
Table of Contents
F. Dividends and Paying Agents
Not applicable.
G. Statement by Experts
Not applicable.
H. Documents on Display
The Company makes its filings in electronic form under the EDGAR filing system of the U.S. Securities and Exchange Commission. Its filings are available through the EDGAR system at www.sec.gov. In addition,the Company’s filings are available to the public over the internet at BRF’s web site at http://www. brf-br.com/ir. Such filings and other information on its website are not incorporated by reference in this Annual Report onForm 20-F. You may request a copy of this filing, and any other report, at no cost, by contacting us at:
Investor Relations DepartmentBRF S.A.Rua Hungria, 1400 - 5th Floor01455-000 – São Paulo – SP – BrazilTel.: +55 11 2322-5377E-mail: [email protected]
I. Subsidiary Information
See Note 1.1 to our consolidated financial statements for a description of the Company’s subsidiaries.
ITEM 11. QUANTITATIVE AND QUALITATIVE DISCLOSURES ABOUT MARKET RISK
We are exposed to a variety of market risks related to potential losses resulting from adverse changes in interest rates, exchange rates and the price of some commodities. We have established policies and proceduresto manage our sensitivity to such risks, the so-called Financial Risk Management Policy. These procedures include the monitoring of our level of exposure to each market risk through an analysis based on our balance-sheetexposure combined with an analysis of expected cash flows. We also use derivative financial instruments to mitigate our exposure to these risks, guided by our risk policy under the management of our Financial RiskManagement Committee, our board of executive officers and our board of directors.
Our risk management department is responsible for monitoring, evaluating and reporting our financial risk. Our board of directors is responsible for approving our risk policy and periodically evaluatingimprovements to it, defining the limits of risk tolerance for different types of risks to which we are exposed and defining action plans to align the risks within these limits. Our Financial Risk Management Committee is incharge of the execution of our risk policy, which includes supervising the risk management process, planning and verifying the impact of the decisions implemented, evaluating and approving hedging alternatives, andmonitoring the exposure levels to risks in order to ensure compliance with our risk policy. Our risk policy defines the risk management strategies to be adopted. Among other things, our risk policy does not authorize us toengage in leveraged transactions in derivative markets and states that the notional amount of individual hedging transactions must be limited to 2.5% of our shareholders’ equity.
Under IFRS, we have accounted for our derivative instruments using the fair value method. For more information on our financial instruments and risk management, see Note 4 to our consolidated financialstatements.
The following section describes the significant market risks associated to our activities and the related financial instruments.
160
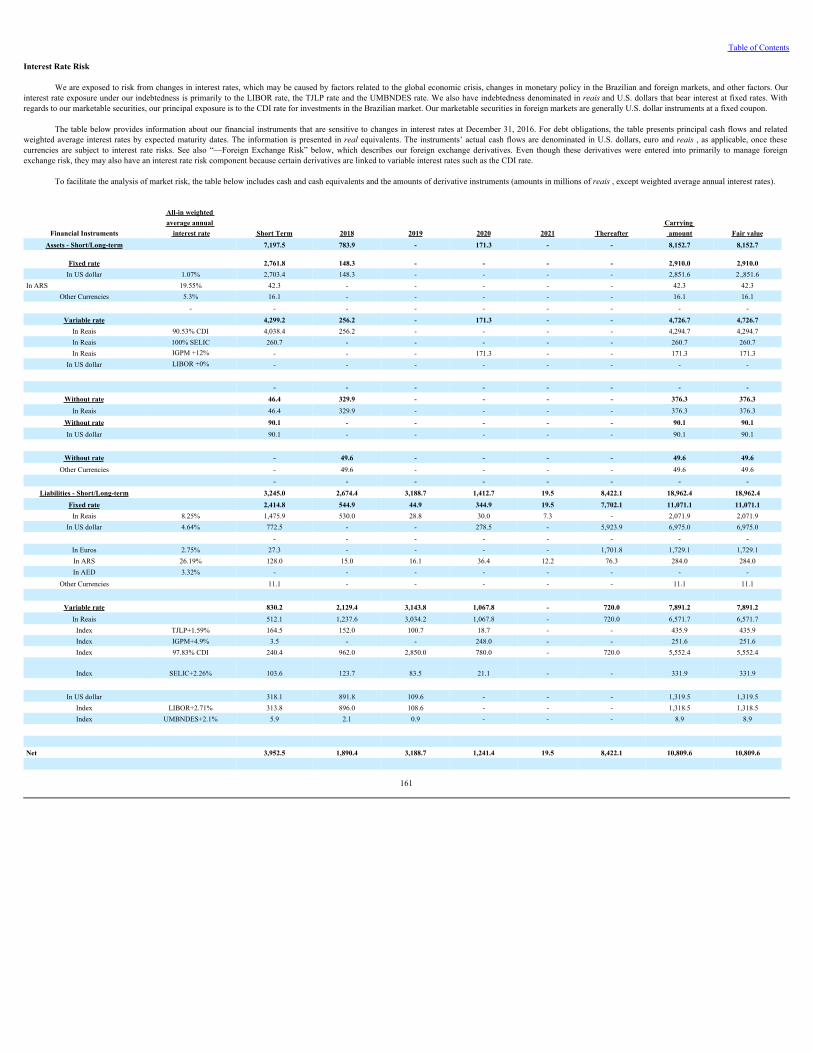
Table of Contents
Interest Rate Risk
We are exposed to risk from changes in interest rates, which may be caused by factors related to the global economic crisis, changes in monetary policy in the Brazilian and foreign markets, and other factors. Ourinterest rate exposure under our indebtedness is primarily to the LIBOR rate, the TJLP rate and the UMBNDES rate. We also have indebtedness denominated in reaisand U.S. dollars that bear interest at fixed rates. Withregards to our marketable securities, our principal exposure is to the CDI rate for investments in the Brazilian market. Our marketable securities in foreign markets are generally U.S. dollar instruments at a fixed coupon.
The table below provides information about our financial instruments that are sensitive to changes in interest rates at December 31, 2016. For debt obligations, the table presents principal cash flows and relatedweighted average interest rates by expected maturity dates. The information is presented in realequivalents. The instruments’ actual cash flows are denominated in U.S. dollars, euro and reais , as applicable, once thesecurrencies are subject to interest rate risks. See also “—Foreign Exchange Risk” below, which describes our foreign exchange derivatives. Even though these derivatives were entered into primarily to manage foreignexchange risk, they may also have an interest rate risk component because certain derivatives are linked to variable interest rates such as the CDI rate.
To facilitate the analysis of market risk, the table below includes cash and cash equivalents and the amounts of derivative instruments (amounts in millions of reais, except weighted average annual interest rates).
Financial Instruments
All-in weighted average annual
interest rate Short Term 2018 2019 2020 2021 ThereafterCarrying amount Fair value
Assets - Short/Long-term 7,197.5 783.9 - 171.3 - - 8,152.7 8,152.7
Fixed rate 2,761.8 148.3 - - - - 2,910.0 2,910.0In US dollar 1.07% 2,703.4 148.3 - - - - 2,851.6 2.,851.6
In ARS 19.55% 42.3 - - - - - 42.3 42.3Other Currencies 5.3% 16.1 - - - - - 16.1 16.1
- - - - - - - - -Variable rate 4,299.2 256.2 - 171.3 - - 4,726.7 4,726.7
In Reais 90.53% CDI 4,038.4 256.2 - - - - 4,294.7 4,294.7In Reais 100% SELIC 260.7 - - - - - 260.7 260.7In Reais IGPM +12% - - - 171.3 - - 171.3 171.3
In US dollar LIBOR +0% - - - - - - - -
- - - - - - - -Without rate 46.4 329.9 - - - - 376.3 376.3
In Reais 46.4 329.9 - - - - 376.3 376.3Without rate 90.1 - - - - - 90.1 90.1In US dollar 90.1 - - - - - 90.1 90.1
Without rate - 49.6 - - - - 49.6 49.6
Other Currencies - 49.6 - - - - 49.6 49.6 - - - - - - - -
Liabilities - Short/Long-term 3,245.0 2,674.4 3,188.7 1,412.7 19.5 8,422.1 18,962.4 18,962.4Fixed rate 2,414.8 544.9 44.9 344.9 19.5 7,702.1 11,071.1 11,071.1
In Reais 8.25% 1,475.9 530.0 28.8 30.0 7.3 - 2,071.9 2,071.9In US dollar 4.64% 772.5 - - 278.5 - 5,923.9 6,975.0 6,975.0
- - - - - - - -In Euros 2.75% 27.3 - - - - 1,701.8 1,729.1 1,729.1In ARS 26.19% 128.0 15.0 16.1 36.4 12.2 76.3 284.0 284.0In AED 3.32% - - - - - - - -
Other Currencies 11.1 - - - - - 11.1 11.1
Variable rate 830.2 2,129.4 3,143.8 1,067.8 - 720.0 7,891.2 7,891.2In Reais 512.1 1,237.6 3,034.2 1,067.8 - 720.0 6,571.7 6,571.7
Index TJLP+1.59% 164.5 152.0 100.7 18.7 - - 435.9 435.9Index IGPM+4.9% 3.5 - - 248.0 - - 251.6 251.6Index 97.83% CDI 240.4 962.0 2,850.0 780.0 - 720.0 5,552.4 5,552.4
Index SELIC+2.26% 103.6 123.7 83.5 21.1 - - 331.9 331.9
In US dollar 318.1 891.8 109.6 - - - 1,319.5 1,319.5
Index LIBOR+2.71% 313.8 896.0 108.6 - - - 1,318.5 1,318.5Index UMBNDES+2.1% 5.9 2.1 0.9 - - - 8.9 8.9
Net 3,952.5 1,890.4 3,188.7 1,241.4 19.5 8,422.1 10,809.6 10,809.6
161

Table of Contents
Foreign Exchange Risk
In managing our foreign exchange risk, we try to balance our assets denominated in foreign currency against our liabilities also denominated in foreign currency. We also consider future cash flows resulting fromtransactions in foreign currency, especially exports denominated in U.S. dollars, euro and pounds sterling. We usually enter into derivative instruments, mainly local short-term swaps, to manage such foreign exchange risk,but these derivatives generally do not cover 100% of the principal amount of our U.S. dollar-denominated obligations.
The table below provides information about our financial instruments and presents such information in realequivalents as of December 31, 2016. The table summarizes information on instruments and transactionsthat are sensitive to foreign currency exchange rates. The table presents principal cash flows and related weighted average interest rates by expected maturity dates (amounts in millions of reais, except average annual interestrates).
162
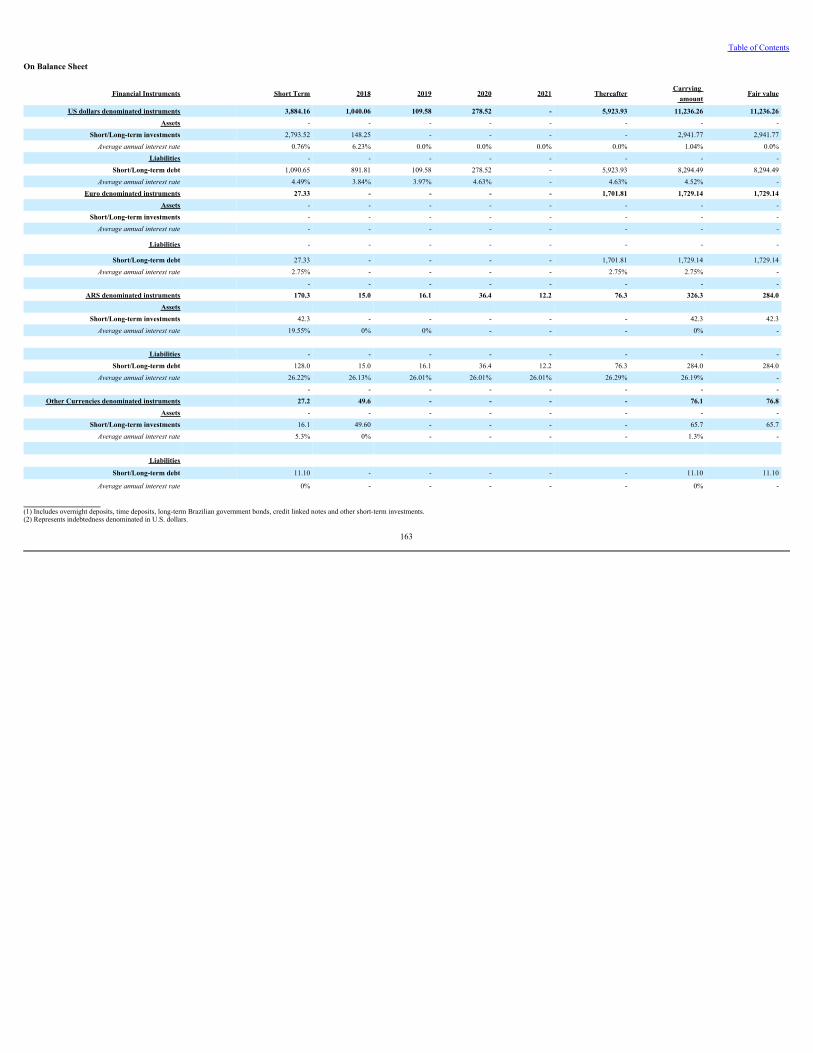
Table of Contents
On Balance Sheet
Financial Instruments Short Term 2018 2019 2020 2021 ThereafterCarrying
amountFair value
US dollars denominated instruments 3,884.16 1,040.06 109.58 278.52 - 5,923.93 11,236.26 11,236.26Assets - - - - - - - -
Short/Long-term investments 2,793.52 148.25 - - - - 2,941.77 2,941.77Averageannualinterestrate 0.76% 6.23% 0.0% 0.0% 0.0% 0.0% 1.04% 0.0%
Liabilities - - - - - - - -Short/Long-term debt 1,090.65 891.81 109.58 278.52 - 5,923.93 8,294.49 8,294.49
Averageannualinterestrate 4.49% 3.84% 3.97% 4.63% - 4.63% 4.52% -Euro denominated instruments 27.33 - - - - 1,701.81 1,729.14 1,729.14
Assets - - - - - - - -Short/Long-term investments - - - - - - - -Averageannualinterestrate - - - - - - - -
Liabilities - - - - - - - -
Short/Long-term debt 27.33 - - - - 1,701.81 1,729.14 1,729.14Averageannualinterestrate 2.75% - - - - 2.75% 2.75% -
- - - - - - - -ARS denominated instruments 170.3 15.0 16.1 36.4 12.2 76.3 326.3 284.0
Assets Short/Long-term investments 42.3 - - - - - 42.3 42.3Averageannualinterestrate 19.55% 0% 0% - - - 0% -
Liabilities - - - - - - - -
Short/Long-term debt 128.0 15.0 16.1 36.4 12.2 76.3 284.0 284.0Averageannualinterestrate 26.22% 26.13% 26.01% 26.01% 26.01% 26.29% 26.19% -
- - - - - - - -Other Currencies denominated instruments 27.2 49.6 - - - - 76.1 76.8
Assets - - - - - - - -Short/Long-term investments 16.1 49.60 - - - - 65.7 65.7Averageannualinterestrate 5.3% 0% - - - - 1.3% -
Liabilities
Short/Long-term debt 11.10 - - - - - 11.10 11.10
Averageannualinterestrate 0% - - - - - 0% -
(1) Includes overnight deposits, time deposits, long-term Brazilian government bonds, credit linked notes and other short-term investments. (2) Represents indebtedness denominated in U.S. dollars.
163
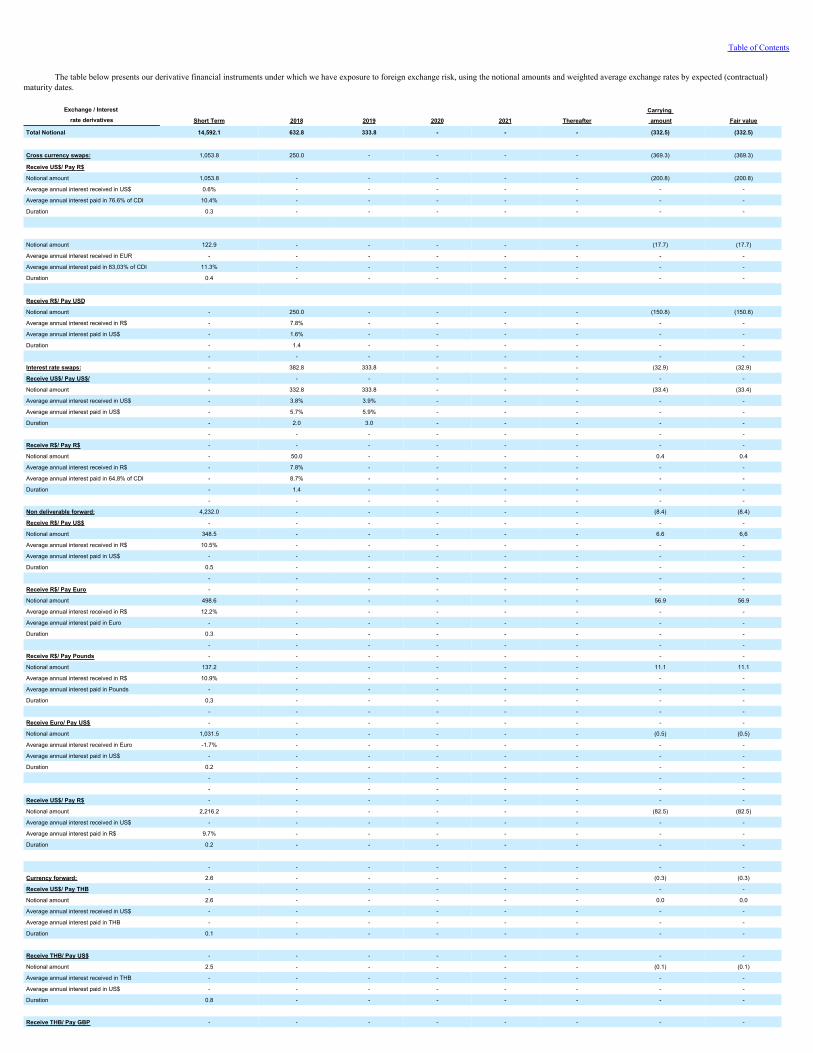
Table of Contents
The table below presents our derivative financial instruments under which we have exposure to foreign exchange risk, using the notional amounts and weighted average exchange rates by expected (contractual)
maturity dates.
Exchange / Interest rate derivatives Short Term 2018 2019 2020 2021 Thereafter
Carrying amount Fair value
Total Notional 14,592.1 632.8 333.8 - - - (332.5) (332.5)
Cross currency swaps: 1,053.8 250.0 - - - - (369.3) (369.3)
Receive US$/ Pay R$ Notional amount 1,053.8 - - - - - (200.8) (200.8)
Average annual interest received in US$ 0.6% - - - - - - -
Average annual interest paid in 76.6% of CDI 10.4% - - - - - - -
Duration 0.3 - - - - - - -
Notional amount 122.9 - - - - - (17.7) (17.7)
Average annual interest received in EUR - - - - - - - -
Average annual interest paid in 83,03% of CDI 11.3% - - - - - - -
Duration 0.4 - - - - - - -
Receive R$/ Pay USD Notional amount - 250.0 - - - - (150.8) (150.8)
Average annual interest received in R$ - 7.8% - - - - - -
Average annual interest paid in US$ - 1.6% - - - - - -
Duration - 1.4 - - - - - -
- - - - - - - -
Interest rate swaps: - 382.8 333.8 - - - (32.9) (32.9)
Receive US$/ Pay US$/ - - - - - - - -
Notional amount - 332.8 333.8 - - - (33.4) (33.4)
Average annual interest received in US$ - 3.8% 3.9% - - - - -
Average annual interest paid in US$ - 5.7% 5.9% - - - - -
Duration - 2.0 3.0 - - - - -
- - - - - - - -
Receive R$/ Pay R$ - - - - - - - -
Notional amount - 50.0 - - - - 0.4 0.4
Average annual interest received in R$ - 7.8% - - - - - -
Average annual interest paid in 64,8% of CDI - 8.7% - - - - - -
Duration - 1.4 - - - - - -
- - - - - - - -
Non deliverable forward: 4,232.0 - - - - - (8.4) (8.4)
Receive R$/ Pay US$ - - - - - - - -
Notional amount 348.5 - - - - - 6.6 6,6
Average annual interest received in R$ 10.5% - - - - - - -
Average annual interest paid in US$ - - - - - - - -
Duration 0.5 - - - - - - -
- - - - - - - -
Receive R$/ Pay Euro - - - - - - - -
Notional amount 498.6 - - - - - 56.9 56.9
Average annual interest received in R$ 12.2% - - - - - - -
Average annual interest paid in Euro - - - - - - - -
Duration 0.3 - - - - - - -
- - - - - - - -
Receive R$/ Pay Pounds - - - - - - - -
Notional amount 137.2 - - - - - 11.1 11.1
Average annual interest received in R$ 10.9% - - - - - - -
Average annual interest paid in Pounds - - - - - - - -
Duration 0,3 - - - - - - -
- - - - - - - -
Receive Euro/ Pay US$ - - - - - - - -
Notional amount 1,031.5 - - - - - (0.5) (0.5)
Average annual interest received in Euro -1.7% - - - - - - -
Average annual interest paid in US$ - - - - - - - -
Duration 0.2 - - - - - - -
- - - - - - - -
- - - - - - - -
Receive US$/ Pay R$ - - - - - - - -
Notional amount 2,216.2 - - - - - (82.5) (82.5)
Average annual interest received in US$ - - - - - - - -
Average annual interest paid in R$ 9.7% - - - - - - -
Duration 0.2 - - - - - - -
- - - - - - - -
Currency forward: 2.6 - - - - - (0.3) (0.3)
Receive US$/ Pay THB - - - - - - - -
Notional amount 2.6 - - - - - 0.0 0.0
Average annual interest received in US$ - - - - - - - -
Average annual interest paid in THB - - - - - - - -
Duration 0.1 - - - - - - -
Receive THB/ Pay US$ - - - - - - - -
Notional amount 2.5 - - - - - (0.1) (0.1)
Average annual interest received in THB - - - - - - - -
Average annual interest paid in US$ - - - - - - - -
Duration 0.8 - - - - - - -
Receive THB/ Pay GBP - - - - - - - -
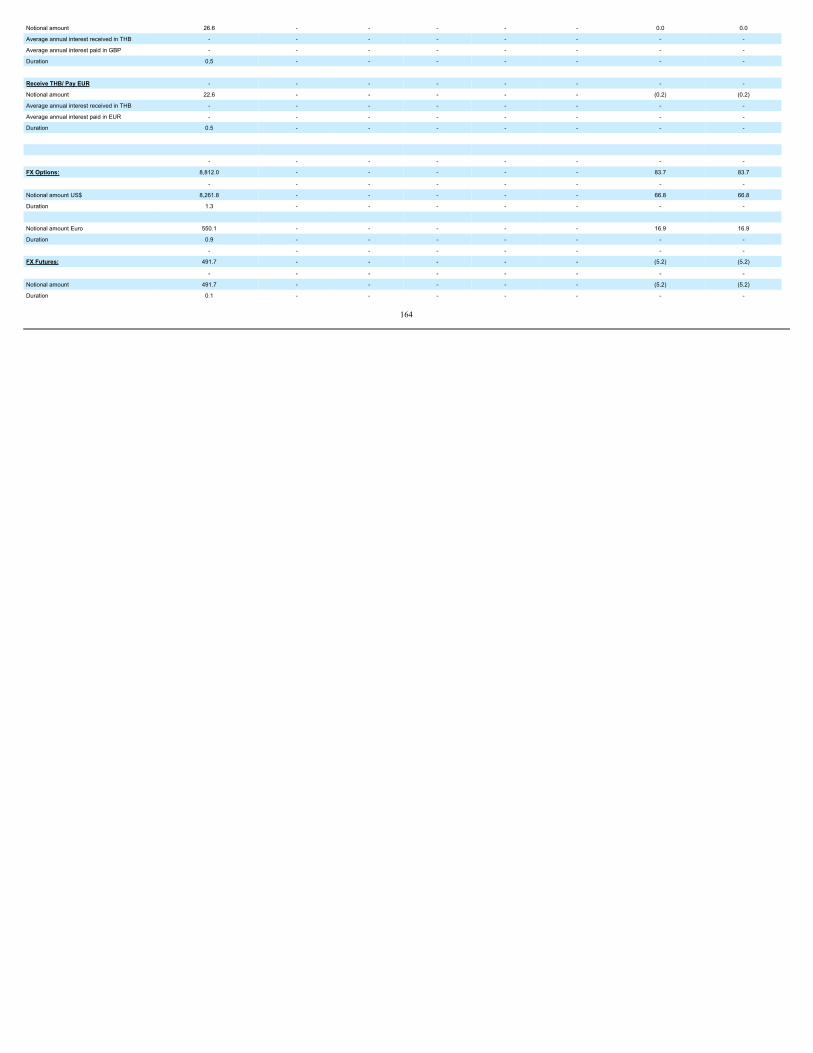
Notional amount 26.6 - - - - - 0.0 0.0
Average annual interest received in THB - - - - - - - -
Average annual interest paid in GBP - - - - - - - -
Duration 0,5 - - - - - - -
Receive THB/ Pay EUR - - - - - - - -
Notional amount 22.6 - - - - - (0.2) (0.2)
Average annual interest received in THB - - - - - - - -
Average annual interest paid in EUR - - - - - - - -
Duration 0.5 - - - - - - -
- - - - - - - -
FX Options: 8,812.0 - - - - - 83.7 83.7
- - - - - - - -
Notional amount US$ 8,261.8 - - - - - 66.8 66.8
Duration 1.3 - - - - - - -
Notional amount Euro 550.1 - - - - - 16.9 16.9
Duration 0.9 - - - - - - -
- - - - - - - -
FX Futures: 491.7 - - - - - (5.2) (5.2)
- - - - - - - -
Notional amount 491.7 - - - - - (5.2) (5.2)
Duration 0.1 - - - - - - -
164
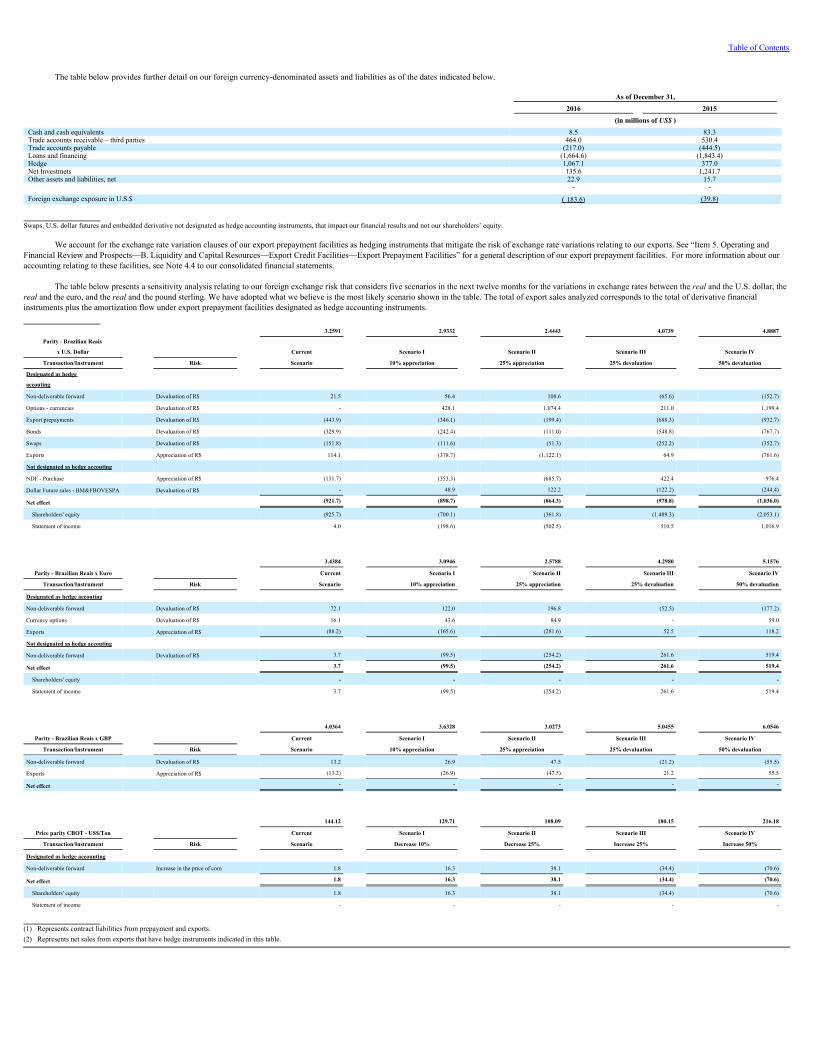
Table of Contents
The table below provides further detail on our foreign currency-denominated assets and liabilities as of the dates indicated below.
As of December 31,
2016 2015
(in millions of US$ )Cash and cash equivalents 8.5 83.3Trade accounts receivable – third parties 464.0 530.4Trade accounts payable (217.0) (444.5)Loans and financing (1,664.6) (1,843.4)Hedge 1,067.1 377.0Net Investmets 135.6 1,241.7Other assets and liabilities, net 22.9 15.7 - -Foreign exchange exposure in U.S.$ ( 183.6) (39.8)
Swaps, U.S. dollar futures and embedded derivative not designated as hedge accounting instruments, that impact our financial results and not our shareholders’ equity.
We account for the exchange rate variation clauses of our export prepayment facilities as hedging instruments that mitigate the risk of exchange rate variations relating to our exports. See “Item 5. Operating andFinancial Review and Prospects—B. Liquidity and Capital Resources—Export Credit Facilities—Export Prepayment Facilities” for a general description of our export prepayment facilities. For more information about ouraccounting relating to these facilities, see Note 4.4 to our consolidated financial statements.
The table below presents a sensitivity analysis relating to our foreign exchange risk that considers five scenarios in the next twelve months for the variations in exchange rates between the realand the U.S. dollar, therealand the euro, and the realand the pound sterling. We have adopted what we believe is the most likely scenario shown in the table. The total of export sales analyzed corresponds to the total of derivative financialinstruments plus the amortization flow under export prepayment facilities designated as hedge accounting instruments.
3.2591 2.9332 2.4443 4.0739 4.8887
Parity - Brazilian Reais
x U.S. Dollar Current Scenario I Scenario II Scenario III Scenario IV
Transaction/Instrument Risk Scenario 10% appreciation 25% appreciation 25% devaluation 50% devaluation
Designated as hedge
accouting Non-deliverable forward Devaluation of R$ 21.5 56.4 108.6 (65.6) (152.7)
Options - currencies Devaluation of R$ - 428.1 1,074.4 211.0 1,199.4
Export prepayments Devaluation of R$ (443.9) (346.1) (199.4) (688.3) (932.7)
Bonds Devaluation of R$ (329.9) (242.4) (111.0) (548.8) (767.7)
Swaps Devaluation of R$ (151.8) (111.6) (51.3) (252.2) (352.7)
Exports Appreciation of R$ 114.1 (378.7) (1,122.1) 64.9 (761.6)
Not designated as hedge accouting NDF - Purchase Appreciation of R$ (131.7) (353.3) (685.7) 422.4 976.4
Dollar Future sales - BM&FBOVESPA Devaluation of R$ - 48.9 122.2 (122.2) (244.4)
Net effect (921.7) (898.7) (864.3) (978.8) (1,036.0)
Shareholders' equity (925.7) (700.1) (361.8) (1.489.3) (2,053.1)
Statement of income 4.0 (198.6) (502.5) 510.5 1,016.9
3.4384 3.0946 2.5788 4.2980 5.1576
Parity - Brazilian Reais x Euro Current Scenario I Scenario II Scenario III Scenario IV
Transaction/Instrument Risk Scenario 10% appreciation 25% appreciation 25% devaluation 50% devaluation
Designated as hedge accouting Non-deliverable forward Devaluation of R$ 72.1 122.0 196.8 (52.5) (177.2)
Currency options Devaluation of R$ 16.1 43.6 84.9 - 59.0
Exports Appreciation of R$ (88.2) (165.6) (281.6) 52.5 118.2
Not designated as hedge accouting Non-deliverable forward Devaluation of R$ 3.7 (99.5) (254.2) 261.6 519.4
Net effect 3.7 (99.5) (254.2) 261.6 519.4
Shareholders' equity - - - - -
Statement of income 3.7 (99.5) (254.2) 261.6 519.4
4.0364 3.6328 3.0273 5.0455 6.0546
Parity - Brazilian Reais x GBP Current Scenario I Scenario II Scenario III Scenario IV
Transaction/Instrument Risk Scenario 10% appreciation 25% appreciation 25% devaluation 50% devaluation
Non-deliverable forward Devaluation of R$ 13.2 26.9 47.5 (21.2) (55.5)
Exports Appreciation of R$ (13.2) (26.9) (47.5) 21.2 55.5
Net effect - - - - -
144.12 129.71 108.09 180.15 216.18
Price parity CBOT - US$/Ton Current Scenario I Scenario II Scenario III Scenario IV
Transaction/Instrument Risk Scenario Decrease 10% Decrease 25% Increase 25% Increase 50%
Designated as hedge accounting Non-deliverable forward Increase in the price of corn 1.8 16.3 38.1 (34.4) (70.6)
Net effect 1.8 16.3 38.1 (34.4) (70.6)
Shareholders' equity 1.8 16.3 38.1 (34.4) (70.6)
Statement of income - - - - -
(1) Represents contract liabilities from prepayment and exports.(2) Represents net sales from exports that have hedge instruments indicated in this table.

165
Table of Contents
Commodity Price Risk
In the normal course of our operations, we purchase commodities, mainly corn, soy meal and live hogs, which make up a significant portion of our raw materials and costs of production.
Corn and soy meal prices are subject to volatility resulting from weather conditions, crop yield, transportation costs, storage costs, agricultural policy of the government, foreign exchange rates and the prices of thesecommodities on the international market, among other factors. The price of hogs acquired from third parties is subject to market conditions and are determined by supply and demand in the international market, among otherfactors.
166
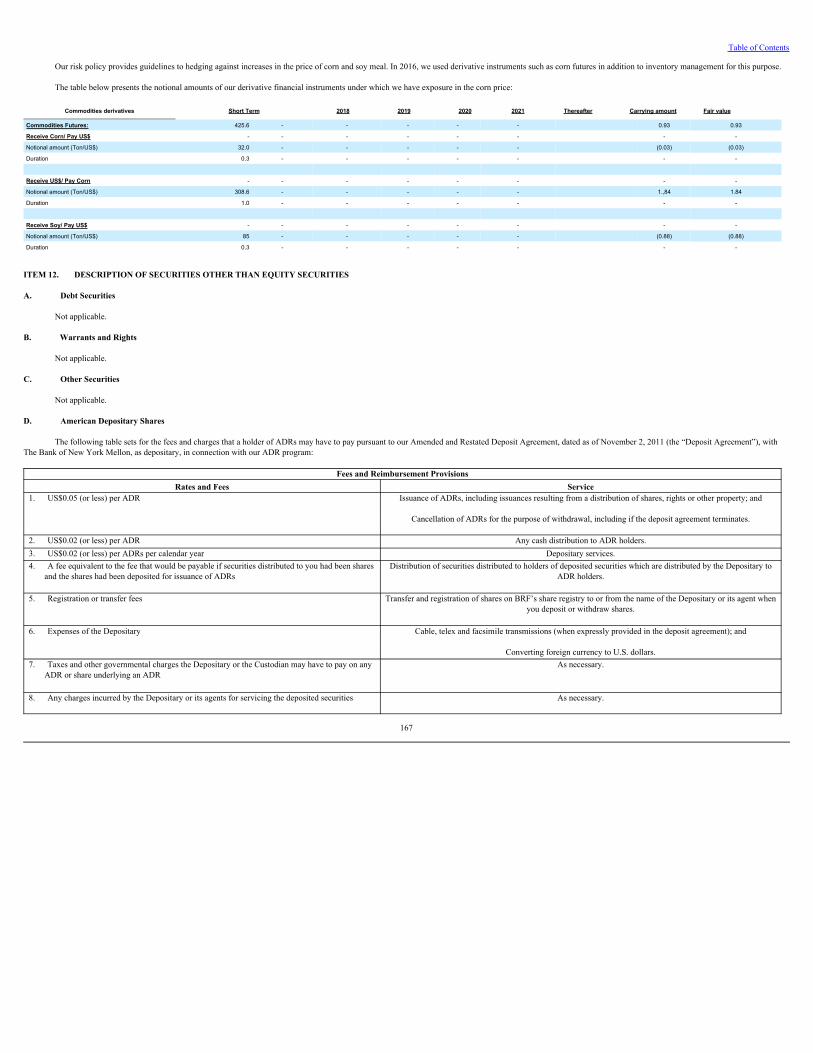
Table of Contents
Our risk policy provides guidelines to hedging against increases in the price of corn and soy meal. In 2016, we used derivative instruments such as corn futures in addition to inventory management for this purpose.
The table below presents the notional amounts of our derivative financial instruments under which we have exposure in the corn price:
Commodities derivatives Short Term 2018 2019 2020 2021 Thereafter Carrying amount Fair value Commodities Futures: 425.6 - - - - - 0.93 0.93
Receive Corn/ Pay US$ - - - - - - - -
Notional amount (Ton/US$) 32.0 - - - - - (0.03) (0.03)
Duration 0.3 - - - - - - -
Receive US$/ Pay Corn - - - - - - - -
Notional amount (Ton/US$) 308.6 - - - - - 1.,84 1.84
Duration 1.0 - - - - - - -
Receive Soy/ Pay US$ - - - - - - - -
Notional amount (Ton/US$) 85 - - - - - (0.88) (0.88)
Duration 0.3 - - - - - - -
ITEM 12. DESCRIPTION OF SECURITIES OTHER THAN EQUITY SECURITIES
A. Debt Securities
Not applicable.
B. Warrants and Rights
Not applicable.
C. Other Securities
Not applicable.
D. American Depositary Shares
The following table sets for the fees and charges that a holder of ADRs may have to pay pursuant to our Amended and Restated Deposit Agreement, dated as of November 2, 2011 (the “Deposit Agreement”), withThe Bank of New York Mellon, as depositary, in connection with our ADR program:
Fees and Reimbursement ProvisionsRates and Fees Service
1. US$0.05 (or less) per ADR Issuance of ADRs, including issuances resulting from a distribution of shares, rights or other property; and
Cancellation of ADRs for the purpose of withdrawal, including if the deposit agreement terminates.
2. US$0.02 (or less) per ADR Any cash distribution to ADR holders.3. US$0.02 (or less) per ADRs per calendar year Depositary services.4. A fee equivalent to the fee that would be payable if securities distributed to you had been shares
and the shares had been deposited for issuance of ADRsDistribution of securities distributed to holders of deposited securities which are distributed by the Depositary to
ADR holders.
5. Registration or transfer fees Transfer and registration of shares on BRF’s share registry to or from the name of the Depositary or its agent whenyou deposit or withdraw shares.
6. Expenses of the Depositary Cable, telex and facsimile transmissions (when expressly provided in the deposit agreement); and
Converting foreign currency to U.S. dollars.7. Taxes and other governmental charges the Depositary or the Custodian may have to pay on any
ADR or share underlying an ADRAs necessary.
8. Any charges incurred by the Depositary or its agents for servicing the deposited securities As necessary.
167
Table of Contents
The fee and reimbursement provisions described in rows 3. and 8. of the table above may, at the depositary’s discretion, be billed to the holders of ADRs or deducted from one or more cash dividends or other cash
distributions.
For the year ended December 31, 2016, pursuant to a letter agreement between BRF and the depositary, the depositary reimbursed us for fees, expenses and related taxes in the amount of US$6.2 million.
A form of the Deposit Agreement is filed as Exhibit 2.01 to this Annual Report on Form 20-F. We encourage you to review this document carefully if you are a holder of ADRs.
PART II
ITEM 13. DEFAULTS, DIVIDEND ARREARAGES AND DELINQUENCIES
None.
ITEM 14. MATERIAL MODIFICATIONS TO THE RIGHTS OF SECURITY HOLDERS AND USE OF PROCEEDS
None.
ITEM 15. CONTROLS AND PROCEDURES
A. Disclosure Controls and Procedures
As of the end of the period covered by this Annual Report on Form 20-F, management, with the participation of the Company’s Chief Executive Officer and Chief Financial Officer, performed an evaluation of theeffectiveness of the design and operation of our disclosure controls and procedures as defined in Rules 13a-15(e) and 15d-15(e) of the Securities Exchange Act of 1934 (“Exchange Act”). Our disclosure controls andprocedures are designed to ensure that information required to be disclosed in the reports we file or submit under the Exchange Act is recorded, processed, summarized and reported within the time periods specified in theSEC’s rules and forms, and that such information is accumulated and communicated to our management, including the Chief Executive Officer and the Chief Financial Officer, to allow timely decisions regarding requireddisclosures. Any controls and procedures, no matter how well designed and operated, can provide only reasonable assurance of achieving the desired control objective. Consistent with the guidance issued by the Securities andExchange Commission that an assessment of recently acquired businesses may be omitted from management's report on internal control over financial reporting in the year of acquisition, management excluded the assessmentof the effectiveness of internal control over financial reporting of the following companies acquired in 2016: Universal Meats (UK) Ltd, Alimentos Calchaquí Productos 7 S.A., Al Khan Foodstuff LLC, FFM FurtherProcessing SDN BHD and Eclipse Holding Cöoperatief U.A. For information about the significance of these entities, see “—B. Management’s Annual Report on Internal Control Over Financial Report.” Based on ourmanagement’s evaluation and subject to the exclusions of the recently acquired companies listed above, our Chief Executive Officer and Chief Financial Officer concluded that, as of December 31, 2016, our disclosurecontrols and procedures were effective at the reasonable assurance level.
168
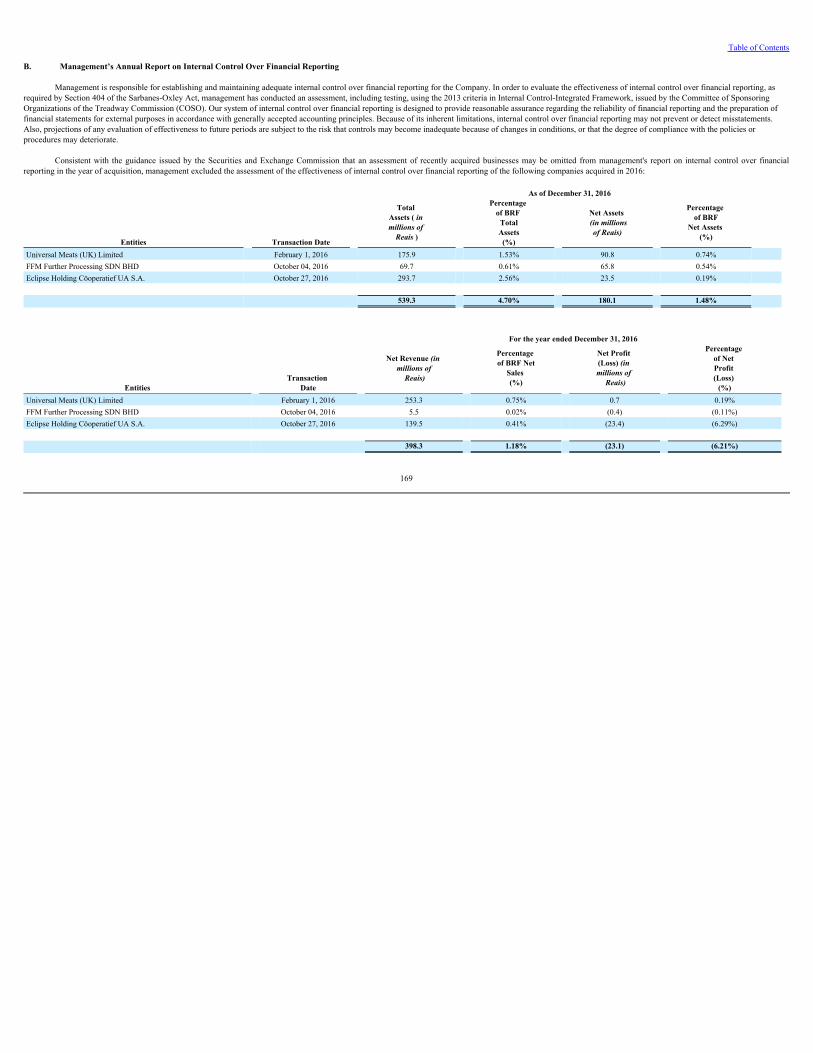
Table of Contents
B. Management’s Annual Report on Internal Control Over Financial Reporting
Management is responsible for establishing and maintaining adequate internal control over financial reporting for the Company. In order to evaluate the effectiveness of internal control over financial reporting, asrequired by Section 404 of the Sarbanes-Oxley Act, management has conducted an assessment, including testing, using the 2013 criteria in Internal Control-Integrated Framework, issued by the Committee of SponsoringOrganizations of the Treadway Commission (COSO). Our system of internal control over financial reporting is designed to provide reasonable assurance regarding the reliability of financial reporting and the preparation offinancial statements for external purposes in accordance with generally accepted accounting principles. Because of its inherent limitations, internal control over financial reporting may not prevent or detect misstatements.Also, projections of any evaluation of effectiveness to future periods are subject to the risk that controls may become inadequate because of changes in conditions, or that the degree of compliance with the policies orprocedures may deteriorate.
Consistent with the guidance issued by the Securities and Exchange Commission that an assessment of recently acquired businesses may be omitted from management's report on internal control over financialreporting in the year of acquisition, management excluded the assessment of the effectiveness of internal control over financial reporting of the following companies acquired in 2016:
As of December 31, 2016
Entities Transaction Date
Total Assets ( in millions of
Reais )
Percentage of BRF Total Assets
(%)
Net Assets (in millions
of Reais)
Percentage of BRF
Net Assets (%)
Universal Meats (UK) Limited February 1, 2016 175.9 1.53% 90.8 0.74% FFM Further Processing SDN BHD October 04, 2016 69.7 0.61% 65.8 0.54% Eclipse Holding Cöoperatief UA S.A. October 27, 2016 293.7 2.56% 23.5 0.19% 539.3 4.70% 180.1 1.48%
For the year ended December 31, 2016
Entities Transaction
Date
Net Revenue (in millions of
Reais)
Percentage of BRF Net
Sales (%)
Net Profit (Loss) (in millions of
Reais)
Percentage of Net Profit (Loss)
(%)Universal Meats (UK) Limited February 1, 2016 253.3 0.75% 0.7 0.19%FFM Further Processing SDN BHD October 04, 2016 5.5 0.02% (0.4) (0.11%)Eclipse Holding Cöoperatief UA S.A. October 27, 2016 139.5 0.41% (23.4) (6.29%) 398.3 1.18% (23.1) (6.21%)
169
Table of Contents
The amounts above were included in our consolidated financial statements for the year ended December 31, 2016.
Based on its assessment and subject to the exclusions listed above, management has concluded that we maintained effective internal control over financial reporting as of December 31, 2016, based on criteria inInternal Control-Integrated Framework, issued by the COSO (2013).
Ernst & Young Auditores Independentes S.S., an independent registered public accounting firm, which has audited and reported on the consolidated financial statements contained in this Annual Report on Form 20-F, has issued an attestation report on management’s assessment of our internal control over financial reporting.
C. Attestation Report of the Registered Public Accounting Firm
See “Item 18—Financial Statements.”
D. Changes in Internal Control Over Financial Reporting
Except with respect to the acquisitions conducted in 2016 and listed in “—B. Management’s Annual Report on Internal Control Over Financial Report,” there were no other changes in our internal control overfinancial reporting (as defined in Rules 13a-15(f) and 15d-15(f) under the Exchange Act) that occurred during the year ended December 31, 2016 that have materially affected, or are reasonably likely to materially affect, ourinternal control over financial reporting.
ITEM 16. [RESERVED]
ITEM 16A. AUDIT COMMITTEE FINANCIAL EXPERT
The Board of Directors has determined that Fernando Maida Dall’Acqua, a member of the Company’s Statutory Audit Committee, is an “audit committee financial expert,” as such term is defined in the SEC rules.Mr. Dall’Acqua is independent, as such term is defined in the NovoMercadolisting rules. The Company has determined that Mr. Dall’Acqua is independent under the standards of the NYSE listing rules and Rule 10A-3under the Exchange Act that would apply if the Company were not relying on the exemption provided in paragraph (c)(3) of Rule 10A-3, as described in “Item 16D. Exemptions from the Listing Standards for AuditCommittees.” See “Item 6. Directors, Senior Management and Employees—C. Board Practices” for information regarding the experience of Mr. Dall’Acqua.
ITEM 16B. CODE OF ETHICS
Under NYSE Rule 303A.10, each U.S. listed company must adopt and disclose a code of business conduct and ethics for directors, officers and employees and promptly disclose any waivers of the code for directorsor executive officers. We are subject to a similar requirement under Brazilian law, and we have adopted a code of ethics that applies to our directors, officers and employees.
170
Table of Contents
Our code of ethics, as well as further information concerning our corporate governance practices and applicable Brazilian law, is available on our website at www.brf-br.com/ir. Information on our website is notincorporated by reference in this Annual Report on Form 20-F. Copies of our “Code of Ethics and Conduct” are also available without charge upon request to our Investor Relations Office.
If we make any substantive amendment to the code of ethics or grant any waivers, including any implicit waiver, from a provision of the code of ethics that apply to our principal executive officer, principal financialofficer, principal accounting officer or controller, or persons performing similar functions, we intend to disclose the nature of such amendment or waiver on our website. During the year ended December 31, 2016, no suchamendment was made or waiver granted.
ITEM 16C. PRINCIPAL ACCOUNTANT FEES AND SERVICES
Audit and Non-Audit Fees
The following table sets forth the fees billed to BRF by its independent auditors responsible for auditing the financial statements included in the Annual Report on Form 20-F, which was Ernst & Young AuditoresIndependentes S.S. for the fiscal years ended December 31, 2016 and 2015. No payments of consultancy fees were made to the independent auditors during 2016 and 2015. The hiring of our auditors for consultancy servicesis subject to Board of Directors’ and Statutory Audit Committee approvals and presupposes that the service in question does not risk the independence and objectivity of our auditors in the performance of the outside audit.The Board’s approval also takes into account restrictions on certain services under the Sarbanes-Oxley Act.Aggregate fees for professional services rendered to us by Ernst & Young Auditores Independentes S.S. for the years ended December 31, 2016 and 2015 were: Year Ended December 31, 2016 2015 (inthousandsofReais)Audit fees 11,596.5 8,616.7Audit-related fees 1,063.9 2,106.5Tax fees 1,031.4 72.8All other fees 288.1 -Total fees 13,952.9 10,795.9
Audit fees in the above table are the fees billed by our independent auditors in connection with the audit of our annual consolidated financial statements, the review of our quarterly financial information, the audit of
our internal control over financial reporting and the statutory audits of our foreign subsidiaries.
Audit-related fees in the above table for 2016 refer to services relating to a bond offering, agreed upon procedures, carve out and core training. Audit-related fees in the above table for 2015 refer to services relatingto a bond offering, issuance of audit reports in connection with the merger/corporate restructuring of our subsidiaries in Argentina, issuance of book value appraisal reports required in connection with the discontinuedoperations of our dairy segment, agreed upon procedures, financial due diligence and SOX core training.
Tax fees in the above table for 2016 are fees billed relating to annual tax review and providing tax assistance of supply chain process. Tax fees in the above table for 2015 tax fees are relating to tax due diligence.
All other fees for 2016 refer to providing assistance to the company in its review of supply chain process. There were no other fees in 2015.
171
Table of Contents
Our Board of Directors has established pre-approval procedures for the engagement of our registered public accounting firm for audit and non-audit services. Such services can only be contracted if they are approvedby the Board of Directors, they comply with the restrictions provided under applicable rules and they do not jeopardize the independence of our auditors. All the services presented in the above table were approved by theAudit Committee. ITEM 16D. EXEMPTIONS FROM THE LISTING STANDARDS FOR AUDIT COMMITTEES
Our statutory audit committee meets the requirements for the exemption available to foreign private issuers under paragraph (c)(3) of Rule 10A-3 under the Exchange Act. The statutory audit committee is not theequivalent of, or wholly comparable to, a U.S. audit committee. Among other differences, it is not required to meet the standards of “independence” established in Rule 10A-3 and is not fully empowered to act on all thematters that are required by Rule 10A-3 to be within the scope of an audit committee’s authority. Nonetheless, with the attributes provided to the statutory audit committee under the Company’s bylaws to the extent permittedby Brazilian law, the Company believes that its corporate governance system, taken as a whole, is materially equivalent to a system having an audit committee functioning as a committee of its board of directors. Accordingly,the Company does not believe that its reliance on the exemption in paragraph (c)(3) of Rule 10A-3 materially adversely affects the ability of the statutory audit committee to act independently and to satisfy the otherrequirements of Rule 10A-3 to the extent permitted by the Brazilian Corporation Law.
The Company also has a permanent Fiscal Council. However, as of April 3, 2014, the Company no longer relies on the Fiscal Council to avail itself of the exemption contained in paragraph (c)(3) of Rule 10A-3under the Exchange Act. ITEM 16E. PURCHASES OF EQUITY SECURITIES BY THE ISSUER AND AFFILIATED PURCHASERS
None.
ITEM 16F. CHANGE IN REGISTRANT’S CERTIFYING ACCOUNTANT
None.
ITEM 16G. CORPORATE GOVERNANCE
We adopt corporate governance practices for a continual process of organizational improvement aimed at greater transparency, liquidity and return for our investors.
We were the first company in the food sector to list on BM&FBOVESPA’s NovoMercado(2006), which requires us to comply with stringent listing regulations, including, among them, diffused control, protectionmechanisms and equality of rights among shareholders. In addition, the Company has adhered to Level A of the Global Reporting Initiative guidelines for the publication of its annual reports under Brazilian law.
Further information concerning our corporate governance practices and applicable Brazilian law is available on the Company’s website (www.brf-br.com/ir). Information on our website is not incorporated byreference in this Annual Report on Form 20-F.
Under Section 303A.11 of the NYSE Corporate Governance Rules, we are required to disclose any significant differences in our corporate governance practices from those required to be followed by U.S. companiesunder the NYSE listing standards. We have summarized these significant differences below.
We are permitted to follow practices in Brazil in lieu of the provisions of the NYSE Listed Company Manual, except that we are required to have a qualifying audit committee under Section 303A.06 of the Rules oravail ourselves of an appropriate exemption. As a foreign private issuer, we have established a statutory audit committee in order to avail ourselves of an exemption from the listing standards for audit committees. See “Item 6.Directors, Senior Management and Employees—C. Board Practices—Statutory Audit Committee.” In addition, our chief executive officer is obligated, under Section 303A.12(b), to promptly notify the NYSE in writing afterany of our executive officers becomes aware of any material non-compliance with any applicable provisions of the NYSE Listed Company Manual. We are also required under Section 303A.12(c) of the NYSE ListedCompany Manual to submit an annual written affirmation of compliance with applicable provisions of the rules and, under certain circumstances, an interim written affirmation.
172
Table of Contents
MajorityofIndependentDirectors
Under NYSE Rule 303A.01, each U.S. listed company must have a majority of independent directors. Under the NovoMercadorules, at least 20% of our directors must be independent, and a majority of our directorscurrently meet that standard. In addition, the independence standards under the NYSE Listed Company Manual are different from the independence standards under the NovoMercadorules.
SeparateMeetingsofNon-ManagementDirectors
Under NYSE Rule 303A.03, the non-management directors of each U.S. listed company must meet at regularly scheduled executive sessions without management. In addition, if a listed company chooses to holdregular meetings of all non-management directors, such listed company should hold an executive session including only independent directors at least once a year. We do not have a similar requirement under Brazilianpractice, but in any event, all members of our board are non-executive directors. However, our independent directors do not meet separately from directors who are not independent.
Nominating/CorporateGovernanceCommittee
Under NYSE Rule 303A.04, each U.S. listed company must have a nominating/corporate governance committee composed entirely of independent directors. We are not required to have such a committee underBrazilian law. However, we have a Finance, Governance and Sustainability Committee composed mostly of independent members according to NovoMercadorules. This committee is not the equivalent of, or whollycomparable to, a U.S. nominating/corporate governance committee.
CompensationCommittee
NYSE Rule 303A.05 requires each U.S. listed company to have a compensation committee composed entirely of independent directors and contains more specific guidance regarding the independence standards forthose directors. Listed companies must grant the compensation committee, in its sole discretion, the authority to retain or obtain a compensation adviser and to be directly responsible for the compensation and oversight of anycompensation adviser so retained with appropriate funding from the listed company. In addition, the compensation committee must assess the independence of any compensation adviser, subject to certain exceptions.
We are not required to have such a committee or to comply with similar requirements under Brazilian rules. However, we have established the People, Organization and Culture Committee, which is responsible foradvising the board of directors in setting compensation policies and the compensation of executives and employees, providing support to the executive officers in the assessment, selection and development of top leadership,advising the board of directors in the formulation and practice of BRF culture to monitor and encouraging proper behavior of leaders, and proposing actions to align the expectations of shareholders and executives. Thiscommittee is not the equivalent of, or wholly comparable to, a U.S. compensation committee.
In accordance with Brazilian Corporation Law, our shareholders approve the aggregate compensation of the members of our board of directors, statutory audit committee and fiscal council for each fiscal year. Ourboard of directors then decides the allocation of the compensation among its members and the members of the statutory audit committee and the fiscal council. In addition, our board of directors is directly responsible foremployee and executive compensation and recruitment, incentive compensation and related matters.
173
Table of Contents
AuditCommittee
Under NYSE Rule 303A.06 and the requirements of Rule 10A-3 under the Exchange Act, each U.S. listed company is required to have an audit committee consisting entirely of independent members that complywith the requirements of Rule 10A-3. In addition, the audit committee must have a written charter compliant with the requirements of NYSE Rule 303A.07(b), the listed company must have an internal audit function and thelisted company must fulfill all other requirements of the NYSE and Rule 10A-3. The SEC has recognized that, for foreign private issuers, local legislation may delegate some of the functions of the audit committee to otherbodies. We have established the Statutory Audit Committee as approved at the Annual and Extraordinary General Meeting of April 3, 2014. Our Statutory Audit Committee meets the requirements for the exemption availableto foreign private issuers under paragraph (c)(3) of Rule 10A-3 under the Exchange Act. The Statutory Audit Committee is not the equivalent of, or wholly comparable to, a U.S. audit committee. Among other differences, itis not required to meet the standards of “independence” established in Rule 10A-3 and is not fully empowered to act on all the matters that are required by Rule 10A-3 to be within the scope of an audit committee’s authority.
CorporateGovernanceGuidelines
Under NYSE Rule 303A.09, each U.S. listed company must adopt and disclose their corporate governance guidelines. We do not have a similar requirement under Brazilian law. However, we have listed ourcommon shares on the NovoMercadoof the São Paulo Stock Exchange, which requires adherence to the corporate governance standards described under “Item 9. The Offer and Listing—C. Markets —São Paulo StockExchange Corporate Governance Standards.” In addition, we have adopted a written policy on trading of securities and relevant disclosure matters.
Further information concerning our corporate governance practices and applicable Brazilian law is available on our website. Information on our website is not incorporated by reference in this Annual Report on Form20-F.
ITEM 16H. MINE SAFETY DISCLOSURE
Not applicable.
PART III
ITEM 17. FINANCIAL STATEMENTS
Not applicable.
ITEM 18. FINANCIAL STATEMENTS
See our consolidated financial statements beginning at page F-1.
ITEM 19. EXHIBITS
The agreements and other documents filed as exhibits to this Annual Report on Form 20-F are not intended to provide factual information or other disclosure other than with respect to the terms of the agreements orother documents themselves, and you should not rely on them for that purpose. In particular, any representations and warranties made by us in these agreements or other documents were made solely within the specific contextof the relevant agreement or document and for the benefit of the other parties to the agreements and they may not describe the actual state of affairs as of the date they were made or at any other time.
The total amount of long-term debt of the Company authorized under each instrument does not exceed 10% of the total assets of the Company and its subsidiaries on a consolidated basis. The Company undertakes tofurnish to the SEC any instruments relating to long-term debt of the Company and its subsidiaries upon request by the SEC.
The exhibit index attached hereto is incorporated herein by reference.
174
Table of Contents
SIGNATURES
The registrant hereby certifies that it meets all of the requirements for filing on Form 20-F and that it has duly caused and authorized the undersigned to sign this Annual Report on Form 20-F on its behalf.
BRF S.A.
By: /s/ Pedro de Andrade Faria Name: Pedro de Andrade FariaTitle: Global Chief Executive, Financial and Investor Relations Officer
By: /s/ Helio Rubens Mendes dos Santos Junior Name: Helio Rubens Mendes dos Santos Junior Title: Vice President – Supply Chain
Date: April 25, 2017
175
Table of Contents
EXHIBIT INDEX
Exhibit Number Description
1.01 Amended and Restated Bylaws of the Registrant, approved at the ordinary and extraordinary meeting of the shareholders of BRF S.A. on April 7, 2016 (incorporated by reference toExhibit 1 to the Report on Form 6-K filed on April 7, 2016, SEC File No. 001-15148).
2.01 Form of Deposit Agreement among BRF S.A. (Perdigão S.A.), The Bank of New York Mellon, as depositary, and the owners and beneficial owners of American Depositary Shares,as amended and restated as of November 2, 2011 (incorporated by reference to Exhibit 1 to the Registration Statement on Form F-6, filed on November 2, 2011, SEC File No. 333-177676).
2.02 Form of American Depositary Receipt (incorporated by reference to Exhibit A to Exhibit 1 to the Registration Statement on Form F-6, filed on November 2, 2011, SEC File 333-177676).
4.01 Stock Options Plan for Employees, approved at the ordinary and extraordinary meeting of the shareholders of BRF S.A. on April 3, 2014 (incorporated by reference to Exhibit 1 tothe Report on Form 6-K filed on April 4, 2014, SEC File No. 001-15148).
4.02 Stock Options Performance Plan, approved at the ordinary and extraordinary meeting of the shareholders of BRF S.A. on April 3, 2014 (incorporated by reference to Exhibit 1 to theReport on Form 6-K filed on April 4, 2014, SEC File No. 001-15148).
4.03 Stock Options Grant Plan of BRF S.A., approved at the ordinary and extraordinary general shareholders meeting held on April 8, 2015 (incorporated by reference to Annex I to theReport on Form 6-K, filed on April 10, 2015, SEC File No. 001-15148).
4.04 Restricted Stocks Plan of BRF S.A., approved at the ordinary and extraordinary general shareholders meeting held on April 8, 2015 (incorporated by reference to Annex II to theReport on Form 6-K, filed on April 10, 2015, SEC File No. 001-15148).
8.01 Subsidiaries of the Registrant.
12.01 Certification of the Chief Executive and Financial Officer pursuant to Section 302 of the Sarbanes-Oxley Act of 2002.
13.01* Certification of the Chief Executive and Financial Officer pursuant to 18 U.S.C. Section 1350, as adopted pursuant to Section 906 of the Sarbanes-Oxley Act of 2002.
* This certification will not be deemed “filed” for purposes of Section 18 of the Exchange Act (15 U.S.C. §78r), or otherwise subject to the liability of that section. Such certification will not be deemed to be incorporated by reference into any filing under the
Securities Act or the Exchange Act, except to the extent that the Registrant specifically incorporates it by reference.
176
Table of Contents
INDEX TO FINANCIAL STATEMENTS
Consolidated Financial Statements: Reports of Independent Registered Public Accounting Firms R-1Consolidated Balance Sheets as of December 31, 2016 and 2015 F-1Consolidated Statements of Income for the Years Ended December 31, 2016, 2015 and 2014 F-3Consolidated Statements of Comprehensive Income for the Years Ended December 31, 2016, 2015 and 2014 F-4Consolidated Statements of Changes in Shareholders’ Equity for the Years Ended December 31, 2016, 2015 and 2014 F-5Consolidated Statements of Cash Flows for the Years Ended December 31, 2016, 2015 and 2014 F-7Notes to the Consolidated Financial Statements F-8
177
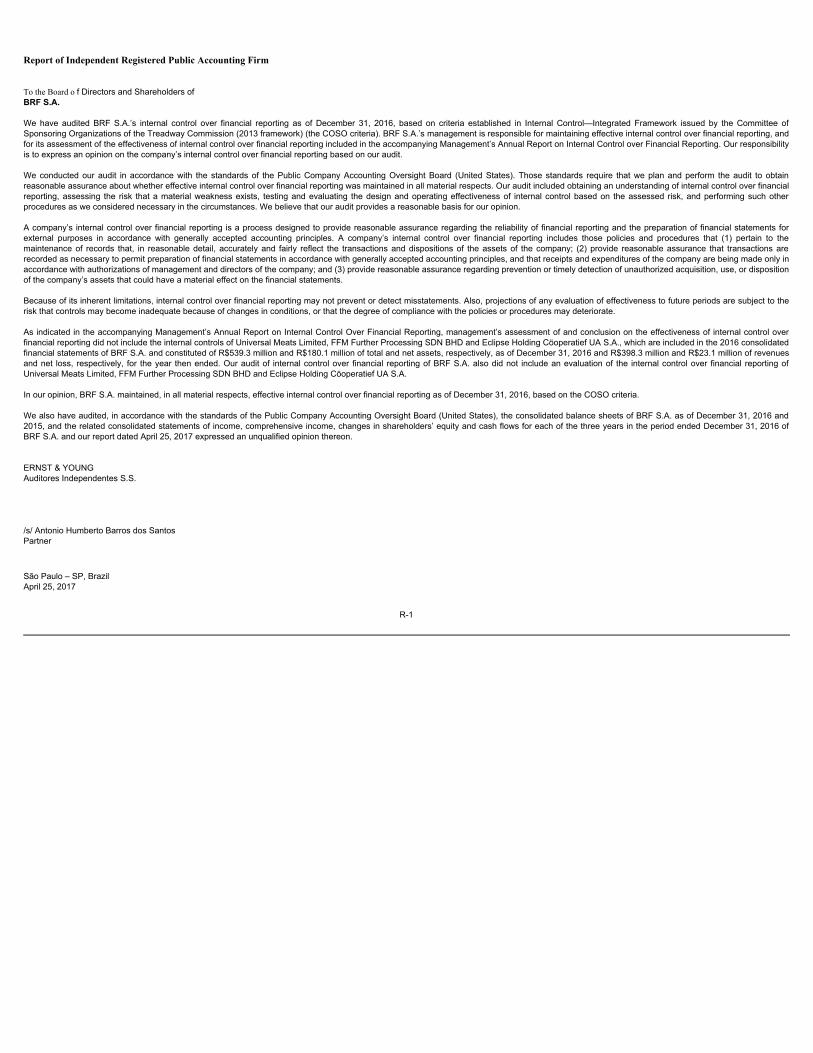
Report of Independent Registered Public Accounting Firm To the Board o f Directors and Shareholders ofBRF S.A. We have audited BRF S.A.’s internal control over financial reporting as of December 31, 2016, based on criteria established in Internal Control—Integrated Framework issued by the Committee ofSponsoring Organizations of the Treadway Commission (2013 framework) (the COSO criteria). BRF S.A.’s management is responsible for maintaining effective internal control over financial reporting, andfor its assessment of the effectiveness of internal control over financial reporting included in the accompanying Management’s Annual Report on Internal Control over Financial Reporting. Our responsibilityis to express an opinion on the company’s internal control over financial reporting based on our audit. We conducted our audit in accordance with the standards of the Public Company Accounting Oversight Board (United States). Those standards require that we plan and perform the audit to obtainreasonable assurance about whether effective internal control over financial reporting was maintained in all material respects. Our audit included obtaining an understanding of internal control over financialreporting, assessing the risk that a material weakness exists, testing and evaluating the design and operating effectiveness of internal control based on the assessed risk, and performing such otherprocedures as we considered necessary in the circumstances. We believe that our audit provides a reasonable basis for our opinion. A company’s internal control over financial reporting is a process designed to provide reasonable assurance regarding the reliability of financial reporting and the preparation of financial statements forexternal purposes in accordance with generally accepted accounting principles. A company’s internal control over financial reporting includes those policies and procedures that (1) pertain to themaintenance of records that, in reasonable detail, accurately and fairly reflect the transactions and dispositions of the assets of the company; (2) provide reasonable assurance that transactions arerecorded as necessary to permit preparation of financial statements in accordance with generally accepted accounting principles, and that receipts and expenditures of the company are being made only inaccordance with authorizations of management and directors of the company; and (3) provide reasonable assurance regarding prevention or timely detection of unauthorized acquisition, use, or dispositionof the company’s assets that could have a material effect on the financial statements. Because of its inherent limitations, internal control over financial reporting may not prevent or detect misstatements. Also, projections of any evaluation of effectiveness to future periods are subject to therisk that controls may become inadequate because of changes in conditions, or that the degree of compliance with the policies or procedures may deteriorate. As indicated in the accompanying Management’s Annual Report on Internal Control Over Financial Reporting, management’s assessment of and conclusion on the effectiveness of internal control overfinancial reporting did not include the internal controls of Universal Meats Limited, FFM Further Processing SDN BHD and Eclipse Holding Cöoperatief UA S.A., which are included in the 2016 consolidatedfinancial statements of BRF S.A. and constituted of R$539.3 million and R$180.1 million of total and net assets, respectively, as of December 31, 2016 and R$398.3 million and R$23.1 million of revenuesand net loss, respectively, for the year then ended. Our audit of internal control over financial reporting of BRF S.A. also did not include an evaluation of the internal control over financial reporting ofUniversal Meats Limited, FFM Further Processing SDN BHD and Eclipse Holding Cöoperatief UA S.A. In our opinion, BRF S.A. maintained, in all material respects, effective internal control over financial reporting as of December 31, 2016, based on the COSO criteria. We also have audited, in accordance with the standards of the Public Company Accounting Oversight Board (United States), the consolidated balance sheets of BRF S.A. as of December 31, 2016 and2015, and the related consolidated statements of income, comprehensive income, changes in shareholders’ equity and cash flows for each of the three years in the period ended December 31, 2016 ofBRF S.A. and our report dated April 25, 2017 expressed an unqualified opinion thereon. ERNST & YOUNGAuditores Independentes S.S. /s/ Antonio Humberto Barros dos SantosPartner
São Paulo – SP, BrazilApril 25, 2017
R-1
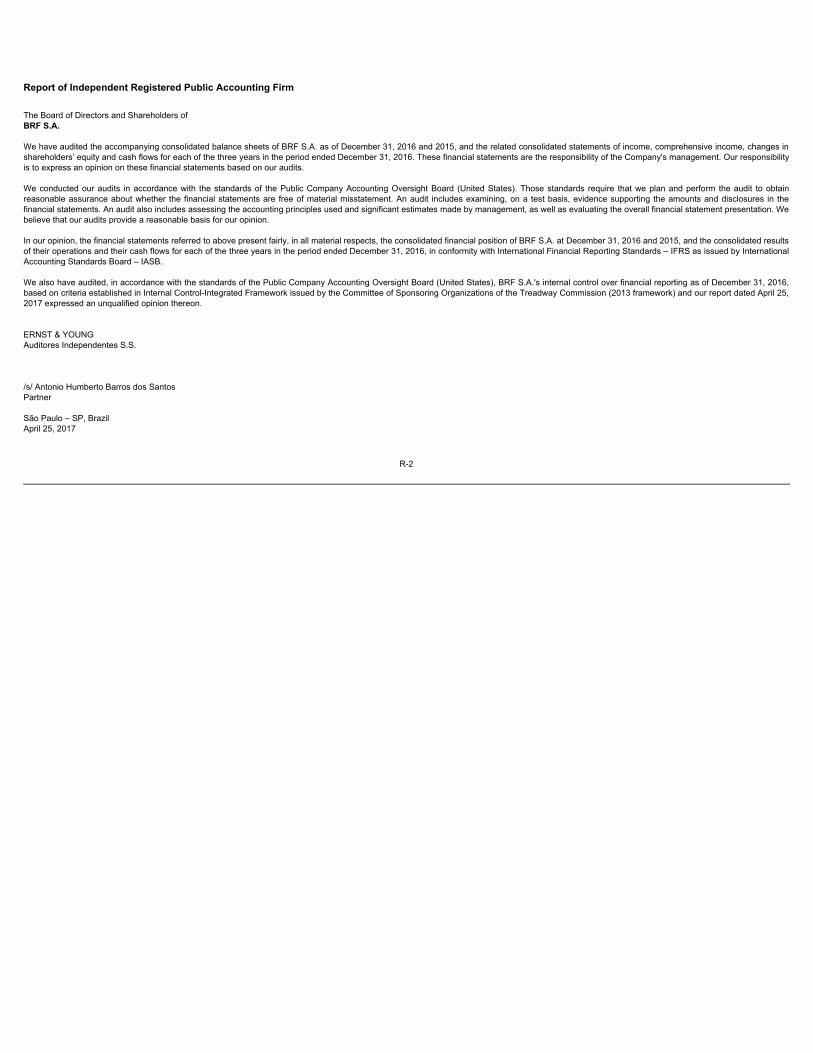
Report of Independent Registered Public Accounting Firm The Board of Directors and Shareholders ofBRF S.A. We have audited the accompanying consolidated balance sheets of BRF S.A. as of December 31, 2016 and 2015, and the related consolidated statements of income, comprehensive income, changes inshareholders’ equity and cash flows for each of the three years in the period ended December 31, 2016. These financial statements are the responsibility of the Company's management. Our responsibilityis to express an opinion on these financial statements based on our audits. We conducted our audits in accordance with the standards of the Public Company Accounting Oversight Board (United States). Those standards require that we plan and perform the audit to obtainreasonable assurance about whether the financial statements are free of material misstatement. An audit includes examining, on a test basis, evidence supporting the amounts and disclosures in thefinancial statements. An audit also includes assessing the accounting principles used and significant estimates made by management, as well as evaluating the overall financial statement presentation. Webelieve that our audits provide a reasonable basis for our opinion. In our opinion, the financial statements referred to above present fairly, in all material respects, the consolidated financial position of BRF S.A. at December 31, 2016 and 2015, and the consolidated resultsof their operations and their cash flows for each of the three years in the period ended December 31, 2016, in conformity with International Financial Reporting Standards – IFRS as issued by InternationalAccounting Standards Board – IASB. We also have audited, in accordance with the standards of the Public Company Accounting Oversight Board (United States), BRF S.A.'s internal control over financial reporting as of December 31, 2016,based on criteria established in Internal Control-Integrated Framework issued by the Committee of Sponsoring Organizations of the Treadway Commission (2013 framework) and our report dated April 25,2017 expressed an unqualified opinion thereon. ERNST & YOUNGAuditores Independentes S.S. /s/ Antonio Humberto Barros dos SantosPartner São Paulo – SP, BrazilApril 25, 2017
R-2
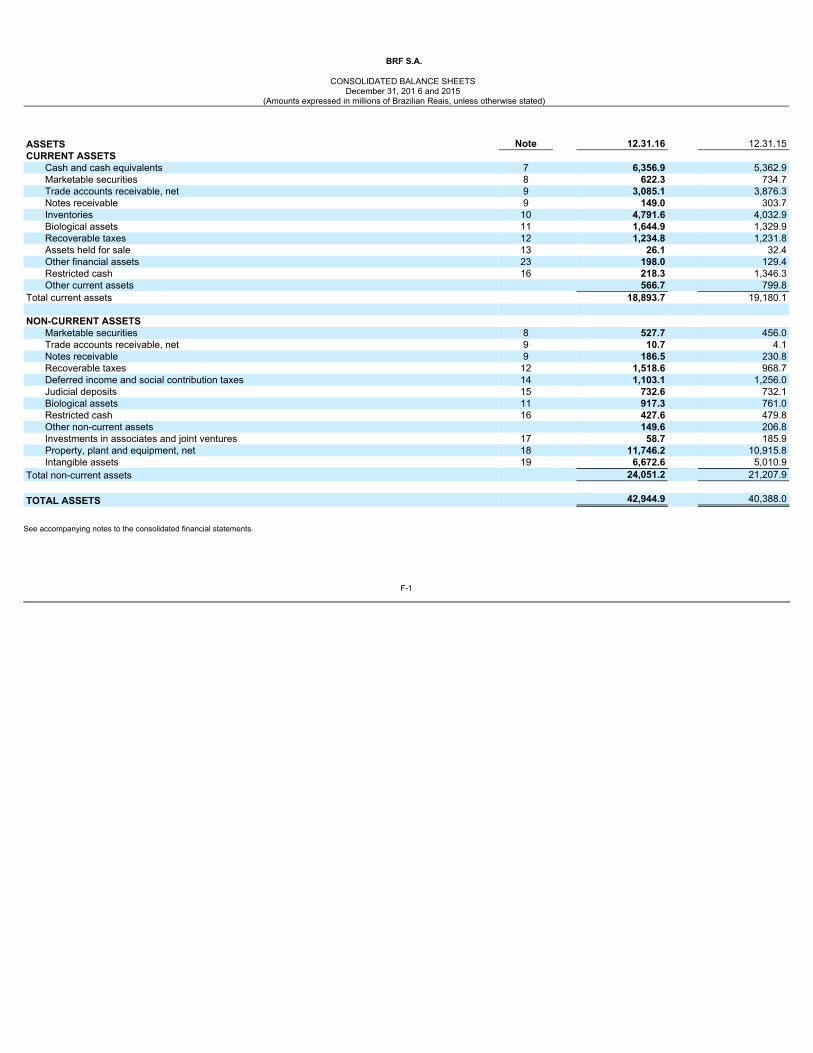
BRF S.A.
CONSOLIDATED BALANCE SHEETS December 31, 201 6 and 2015
(Amounts expressed in millions of Brazilian Reais, unless otherwise stated)
ASSETS Note 12.31.16 12.31.15CURRENT ASSETS
Cash and cash equivalents 7 6,356.9 5,362.9Marketable securities 8 622.3 734.7Trade accounts receivable, net 9 3,085.1 3,876.3Notes receivable 9 149.0 303.7Inventories 10 4,791.6 4,032.9Biological assets 11 1,644.9 1,329.9Recoverable taxes 12 1,234.8 1,231.8Assets held for sale 13 26.1 32.4Other financial assets 23 198.0 129.4Restricted cash 16 218.3 1,346.3Other current assets 566.7 799.8
Total current assets 18,893.7 19,180.1 NON-CURRENT ASSETS
Marketable securities 8 527.7 456.0Trade accounts receivable, net 9 10.7 4.1Notes receivable 9 186.5 230.8Recoverable taxes 12 1,518.6 968.7Deferred income and social contribution taxes 14 1,103.1 1,256.0Judicial deposits 15 732.6 732.1Biological assets 11 917.3 761.0Restricted cash 16 427.6 479.8Other non-current assets 149.6 206.8Investments in associates and joint ventures 17 58.7 185.9Property, plant and equipment, net 18 11,746.2 10,915.8Intangible assets 19 6,672.6 5,010.9
Total non-current assets 24,051.2 21,207.9 TOTAL ASSETS 42,944.9 40,388.0
See accompanying notes to the consolidated financial statements.
F-1
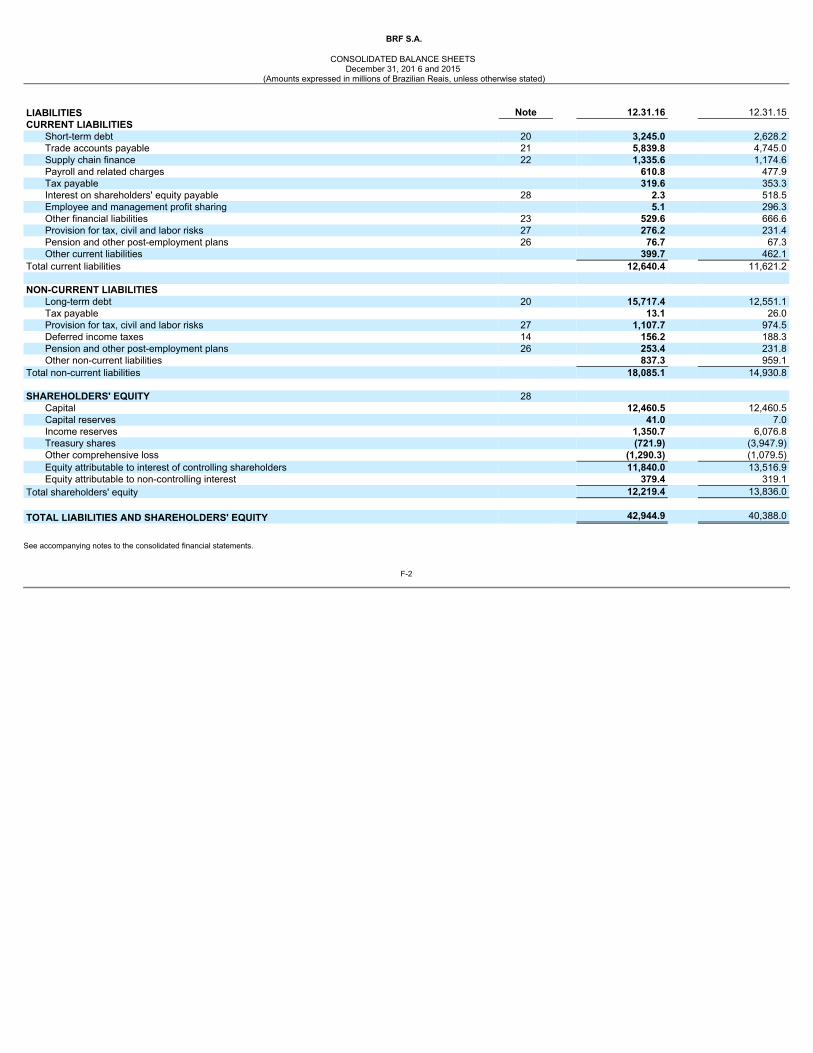
BRF S.A.
CONSOLIDATED BALANCE SHEETS December 31, 201 6 and 2015
(Amounts expressed in millions of Brazilian Reais, unless otherwise stated) LIABILITIES Note 12.31.16 12.31.15CURRENT LIABILITIES
Short-term debt 20 3,245.0 2,628.2Trade accounts payable 21 5,839.8 4,745.0Supply chain finance 22 1,335.6 1,174.6Payroll and related charges 610.8 477.9Tax payable 319.6 353.3Interest on shareholders' equity payable 28 2.3 518.5Employee and management profit sharing 5.1 296.3Other financial liabilities 23 529.6 666.6Provision for tax, civil and labor risks 27 276.2 231.4Pension and other post-employment plans 26 76.7 67.3Other current liabilities 399.7 462.1
Total current liabilities 12,640.4 11,621.2 NON-CURRENT LIABILITIES
Long-term debt 20 15,717.4 12,551.1Tax payable 13.1 26.0Provision for tax, civil and labor risks 27 1,107.7 974.5Deferred income taxes 14 156.2 188.3Pension and other post-employment plans 26 253.4 231.8Other non-current liabilities 837.3 959.1
Total non-current liabilities 18,085.1 14,930.8 SHAREHOLDERS' EQUITY 28
Capital 12,460.5 12,460.5Capital reserves 41.0 7.0Income reserves 1,350.7 6,076.8Treasury shares (721.9) (3,947.9)Other comprehensive loss (1,290.3) (1,079.5)Equity attributable to interest of controlling shareholders 11,840.0 13,516.9Equity attributable to non-controlling interest 379.4 319.1
Total shareholders' equity 12,219.4 13,836.0 TOTAL LIABILITIES AND SHAREHOLDERS' EQUITY 42,944.9 40,388.0
See accompanying notes to the consolidated financial statements.
F-2
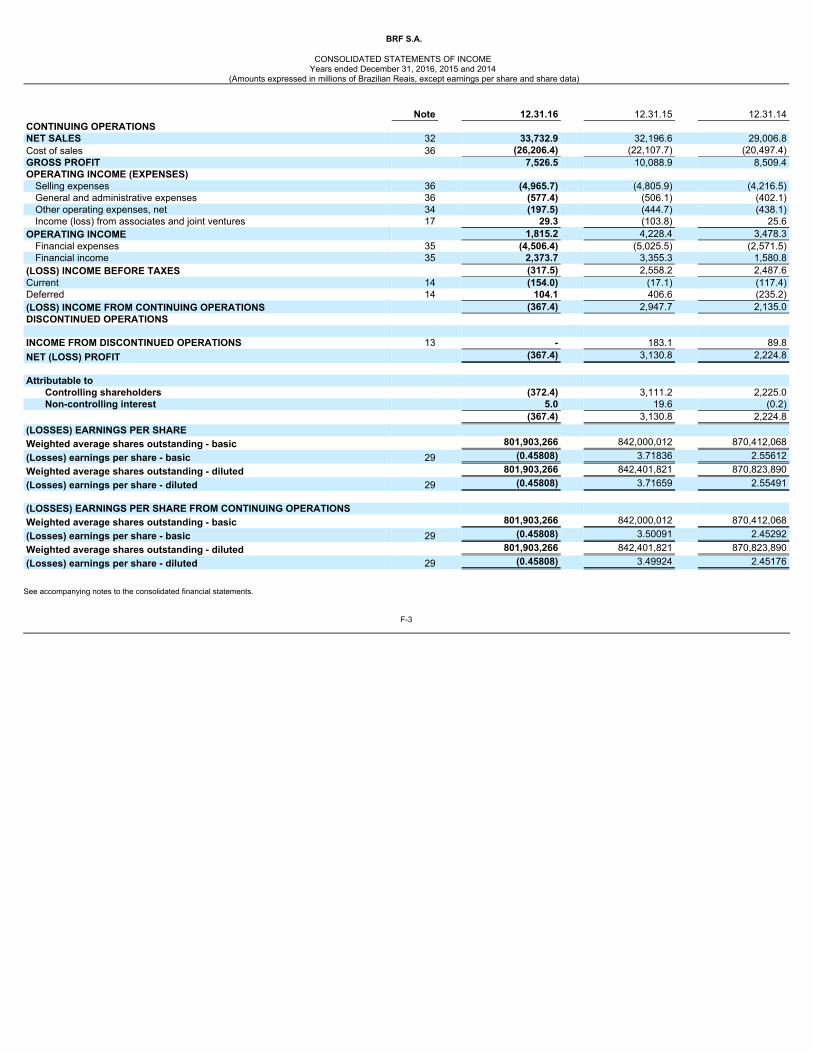
BRF S.A.
CONSOLIDATED STATEMENTS OF INCOME Years ended December 31, 2016, 2015 and 2014
(Amounts expressed in millions of Brazilian Reais, except earnings per share and share data) Note 12.31.16 12.31.15 12.31.14CONTINUING OPERATIONS NET SALES 32 33,732.9 32,196.6 29,006.8Cost of sales 36 (26,206.4) (22,107.7) (20,497.4)GROSS PROFIT 7,526.5 10,088.9 8,509.4OPERATING INCOME (EXPENSES)
Selling expenses 36 (4,965.7) (4,805.9) (4,216.5)General and administrative expenses 36 (577.4) (506.1) (402.1)Other operating expenses, net 34 (197.5) (444.7) (438.1)Income (loss) from associates and joint ventures 17 29.3 (103.8) 25.6
OPERATING INCOME 1,815.2 4,228.4 3,478.3Financial expenses 35 (4,506.4) (5,025.5) (2,571.5)Financial income 35 2,373.7 3,355.3 1,580.8
(LOSS) INCOME BEFORE TAXES (317.5) 2,558.2 2,487.6Current 14 (154.0) (17.1) (117.4)Deferred 14 104.1 406.6 (235.2)(LOSS) INCOME FROM CONTINUING OPERATIONS (367.4) 2,947.7 2,135.0DISCONTINUED OPERATIONS INCOME FROM DISCONTINUED OPERATIONS 13 - 183.1 89.8NET (LOSS) PROFIT (367.4) 3,130.8 2,224.8 Attributable to
Controlling shareholders (372.4) 3,111.2 2,225.0Non-controlling interest 5.0 19.6 (0.2)
(367.4) 3,130.8 2,224.8(LOSSES) EARNINGS PER SHARE Weighted average shares outstanding - basic 801,903,266 842,000,012 870,412,068(Losses) earnings per share - basic 29 (0.45808) 3.71836 2.55612Weighted average shares outstanding - diluted 801,903,266 842,401,821 870,823,890(Losses) earnings per share - diluted 29 (0.45808) 3.71659 2.55491 (LOSSES) EARNINGS PER SHARE FROM CONTINUING OPERATIONS Weighted average shares outstanding - basic 801,903,266 842,000,012 870,412,068(Losses) earnings per share - basic 29 (0.45808) 3.50091 2.45292Weighted average shares outstanding - diluted 801,903,266 842,401,821 870,823,890(Losses) earnings per share - diluted 29 (0.45808) 3.49924 2.45176
See accompanying notes to the consolidated financial statements.
F-3
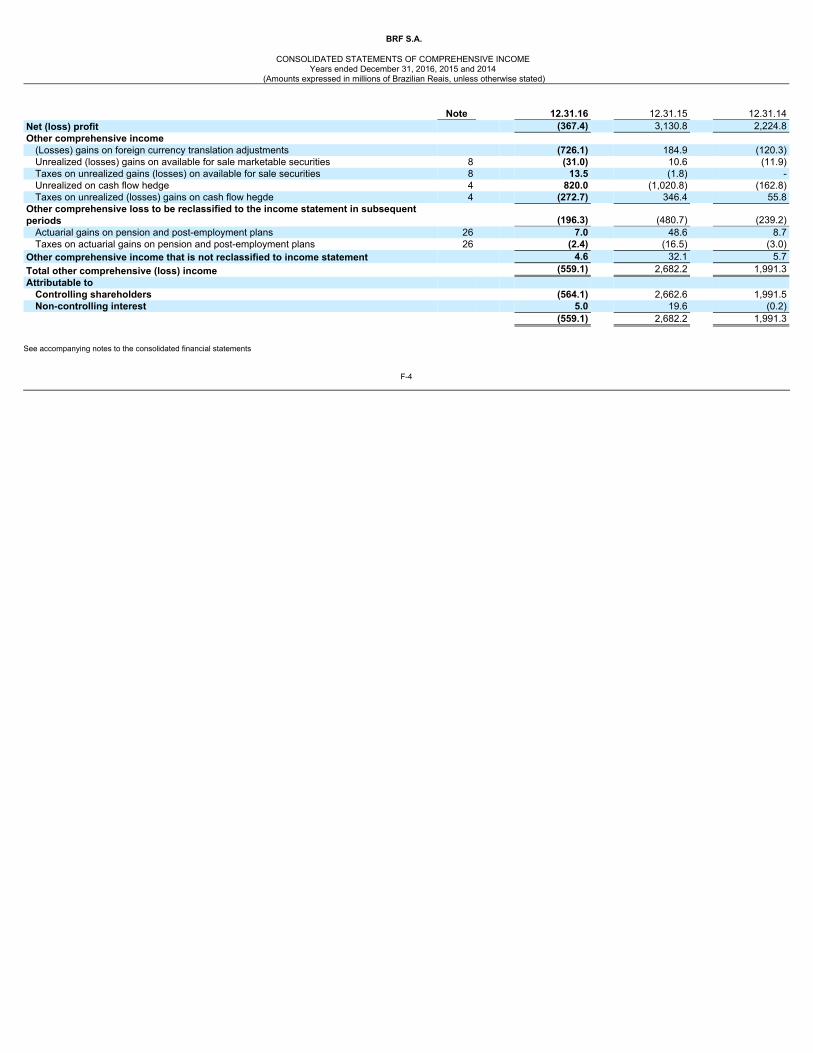
BRF S.A.
CONSOLIDATED STATEMENTS OF COMPREHENSIVE INCOME Years ended December 31, 2016, 2015 and 2014
(Amounts expressed in millions of Brazilian Reais, unless otherwise stated) Note 12.31.16 12.31.15 12.31.14Net (loss) profit (367.4) 3,130.8 2,224.8Other comprehensive income
(Losses) gains on foreign currency translation adjustments (726.1) 184.9 (120.3)Unrealized (losses) gains on available for sale marketable securities 8 (31.0) 10.6 (11.9)Taxes on unrealized gains (losses) on available for sale securities 8 13.5 (1.8) -Unrealized on cash flow hedge 4 820.0 (1,020.8) (162.8)Taxes on unrealized (losses) gains on cash flow hegde 4 (272.7) 346.4 55.8
Other comprehensive loss to be reclassified to the income statement in subsequentperiods (196.3) (480.7) (239.2)
Actuarial gains on pension and post-employment plans 26 7.0 48.6 8.7Taxes on actuarial gains on pension and post-employment plans 26 (2.4) (16.5) (3.0)
Other comprehensive income that is not reclassified to income statement 4.6 32.1 5.7Total other comprehensive (loss) income (559.1) 2,682.2 1,991.3Attributable to
Controlling shareholders (564.1) 2,662.6 1,991.5Non-controlling interest 5.0 19.6 (0.2)
(559.1) 2,682.2 1,991.3
See accompanying notes to the consolidated financial statements
F-4
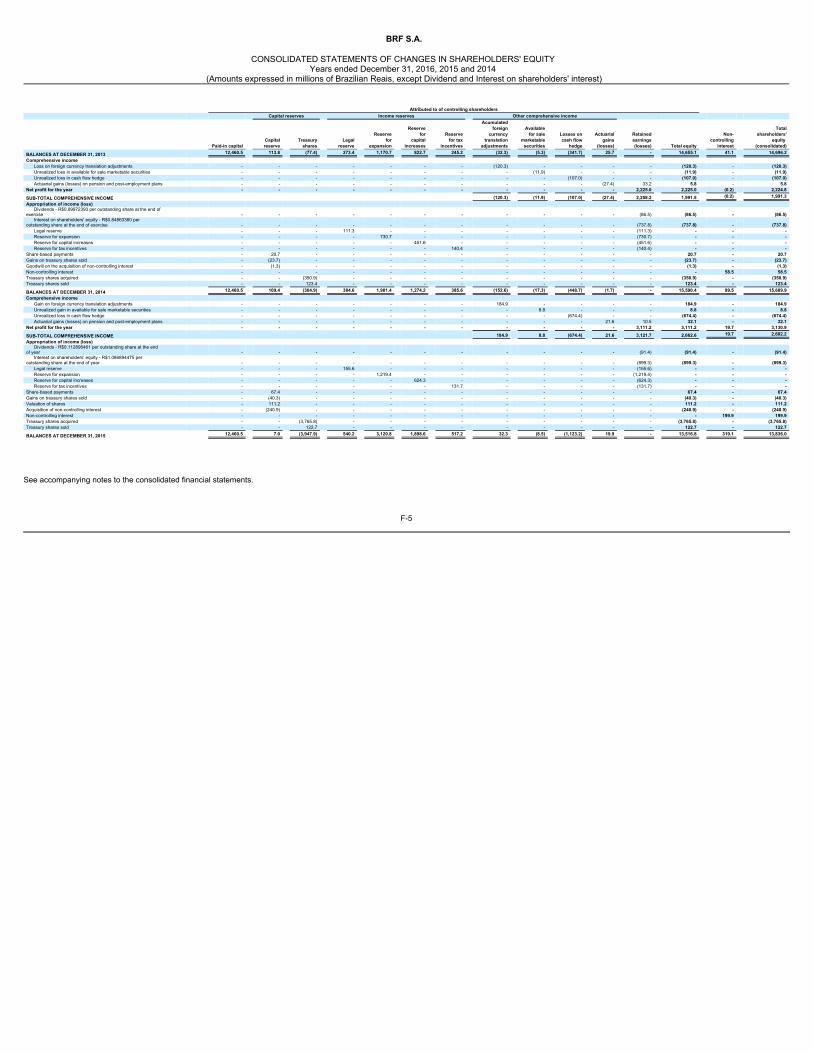
BRF S.A.
CONSOLIDATED STATEMENTS OF CHANGES IN SHAREHOLDERS' EQUITY Years ended December 31, 2016, 2015 and 2014
(Amounts expressed in millions of Brazilian Reais, except Dividend and Interest on shareholders' interest)
Attributed to of controlling shareholders Capital reserves Income reserves Other comprehensive income
Paid-in capital Capitalreserve
Treasuryshares
Legalreserve
Reservefor
expansion
Reservefor
capitalincreases
Reservefor tax
incentives
Acumulatedforeign
currencytranslation
adjustments
Availablefor sale
marketablesecurities
Losses oncash flow
hedge
Actuarialgains
(losses)
Retainedearnings(losses) Total equity
Non-controlling
interest
Totalshareholders'
equity (consolidated)
BALANCES AT DECEMBER 31, 2013 12,460.5 113.8 (77.4) 273.4 1,170.7 822.7 245.2 (32.3) (5.3) (341.7) 25.7 - 14,655.1 41.1 14,696.2Comprehensive income
Loss on foreign currency translation adjustments - - - - - - - (120.3) - - - - (120.3) - (120.3)Unrealized loss in available for sale marketable securities - - - - - - - - (11.9) - - - (11.9) - (11.9)Unrealized loss in cash flow hedge - - - - - - - - - (107.0) - - (107.0) - (107.0)Actuarial gains (losses) on pension and post-employment plans - - - - - - - - - - (27.4) 33.2 5.8 - 5.8
Net profit for the year - - - - - - - - - - - 2,225.0 2,225.0 (0.2) 2,224.8
SUB-TOTAL COMPREHENSIVE INCOME (120.3) (11.9) (107.0) (27.4) 2,258.2 1,991.5 (0.2) 1,991.3Appropriation of income (loss)
Dividends - R$0.09972393 per outstanding share at the end ofexercise - - - - - - - - - - - (86.5) (86.5) - (86.5)
Interest on shareholders' equity - R$0.84863360 peroutstanding share at the end of exercise - - - - - - - - - - - (737.8) (737.8) - (737.8)
Legal reserve - - - 111.3 - - - - - - - (111.3) - - -Reserve for expansion - - - - 730.7 - - - - - - (730.7) - - -Reserve for capital increases - - - - - 451.6 - - - - - (451.6) - - -Reserve for tax incentives - - - - - - 140.4 - - - - (140.4) - - -
Share-based payments - 20.7 - - - - - - - - - - 20.7 - 20.7Gains on treasury shares sold - (23.7) - - - - - - - - - - (23.7) - (23.7)Goodwill on the acquisition of non-controlling interest - (1.3) - - - - - - - - - - (1.3) - (1.3)Non-controlling interest - - - - - - - - - - - - - 58.5 58.5Treasury shares acquired - - (350.9) - - - - - - - - - (350.9) - (350.9)Treasury shares sold - - 123.4 - - - - - - - - - 123.4 - 123.4
BALANCES AT DECEMBER 31, 2014 12,460.5 109.4 (304.9) 384.6 1,901.4 1,274.2 385.6 (152.6) (17.3) (448.7) (1.7) - 15,590.4 99.5 15,689.9Comprehensive income
Gain on foreign currency translation adjustments - - - - - - - 184.9 - - - - 184.9 - 184.9Unrealized gain in available for sale marketable securities - - - - - - - - 8.8 - - - 8.8 - 8.8Unrealized loss in cash flow hedge - - - - - - - - - (674.4) - - (674.4) - (674.4)Actuarial gains (losses) on pension and post-employment plans - - - - - - - - - - 21.6 10.5 32.1 - 32.1
Net profit for the year - - - - - - - - - - - 3,111.2 3,111.2 19.7 3,130.9
SUB-TOTAL COMPREHENSIVE INCOME 184.9 8.8 (674.4) 21.6 3,121.7 2,662.6 19.7 2,682.2Appropriation of income (loss)
Dividends - R$0.112896461 per outstanding share at the endof year - - - - - - - - - - - (91.4) (91.4) - (91.4)
Interest on shareholders' equity - R$1.086894475 peroutstanding share at the end of year - - - - - - - - - - - (899.3) (899.3) - (899.3)
Legal reserve - - - 155.6 - - - - - - - (155.6) - - -Reserve for expansion - - - - 1,219.4 - - - - - - (1,219.4) - - -Reserve for capital increases - - - - - 624.3 - - - - - (624.3) - - -Reserve for tax incentives - - - - - - 131.7 - - - - (131.7) - - -
Share-based payments - 67.4 - - - - - - - - - - 67.4 - 67.4Gains on treasury shares sold - (40.3) - - - - - - - - - - (40.3) - (40.3)Valuation of shares - 111.2 - - - - - - - - - - 111.2 - 111.2Acquisition of non-controlling interest - (240.9) - - - - - - - - - - (240.9) - (240.9)Non-controlling interest - - - - - - - - - - - - - 199.9 199.9Treasury shares acquired - - (3,765.8) - - - - - - - - - (3,765.8) - (3,765.8)Treasury shares sold - - 122.7 - - - - - - - - - 122.7 - 122.7
BALANCES AT DECEMBER 31, 2015 12,460.5 7.0 (3,947.9) 540.2 3,120.8 1,898.6 517.2 32.3 (8.5) (1,123.2) 19.9 - 13,516.8 319.1 13,836.0
See accompanying notes to the consolidated financial statements.
F-5
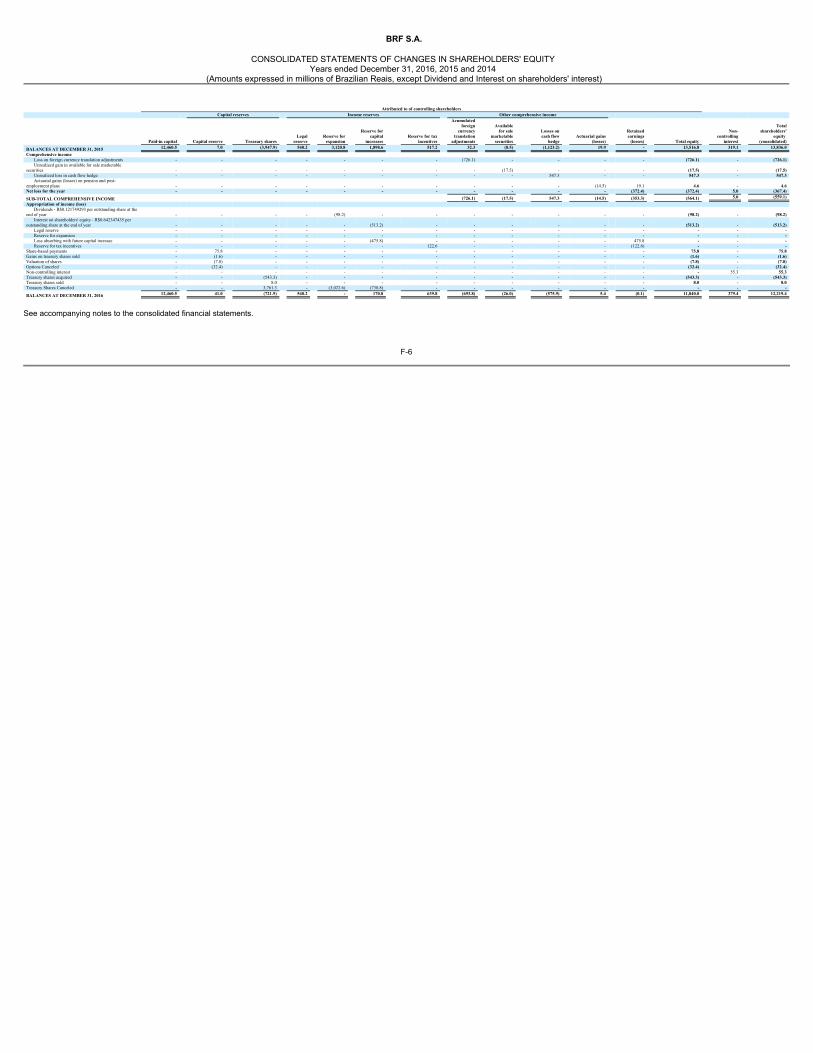
BRF S.A.
CONSOLIDATED STATEMENTS OF CHANGES IN SHAREHOLDERS' EQUITY Years ended December 31, 2016, 2015 and 2014
(Amounts expressed in millions of Brazilian Reais, except Dividend and Interest on shareholders' interest)
Attributed to of controlling shareholders Capital reserves Income reserves Other comprehensive income
Paid-in capital Capital reserve Treasury shares Legal
reserve Reserve for
expansion
Reserve forcapital
increases Reserve for tax
incentives
Acumulatedforeign
currencytranslation
adjustments
Availablefor sale
marketablesecurities
Losses oncash flow
hedge Actuarial gains
(losses)
Retainedearnings
(losses) Total equity
Non-controlling
interest
Totalshareholders'
equity (consolidated)
BALANCES AT DECEMBER 31, 2015 12,460.5 7.0 (3,947.9) 540.2 3,120.8 1,898.6 517.2 32.3 (8.5) (1,123.2) 19.9 - 13,516.8 319.1 13,836.0Comprehensive income
Loss on foreign currency translation adjustments - - - - - - - (726.1) - - - - (726.1) - (726.1)Unrealized gain in available for sale marketable
securities - - - - - - - - (17.5) - - - (17.5) - (17.5)Unrealized loss in cash flow hedge - - - - - - - - - 547.3 - - 547.3 - 547.3Actuarial gains (losses) on pension and post-
employment plans - - - - - - - - - - (14.5) 19.1 4.6 - 4.6Net loss for the year - - - - - - - - - - - (372.4) (372.4) 5.0 (367.4)
SUB-TOTAL COMPREHENSIVE INCOME (726.1) (17.5) 547.3 (14.5) (353.3) (564.1) 5.0 (559.1)Appropriation of income (loss)
Dividends - R$0.121749293 per outstanding share at theend of year - - - - (98.2) - - - - - - - (98.2) - (98.2)
Interest on shareholders' equity - R$0.642347435 peroutstanding share at the end of year - - - - - (513.2) - - - - - - (513.2) - (513.2)
Legal reserve - - - - - - - - - - - - - - -Reserve for expansion - - - - - - - - - - - - - - -Loss absorbing with future capital increase - - - - - (475.8) - - - - - 475.8 - - -Reserve for tax incentives - - - - - - 122.6 - - - - (122.6) - - -
Share-based payments - 75.8 - - - - - - - - - - 75.8 - 75.8Gains on treasury shares sold - (1.6) - - - - - - - - - - (1.6) - (1.6)Valuation of shares - (7.8) - - - - - - - - - - (7.8) - (7.8)Options Canceled - (32.4) - - - - - - - - - - (32.4) - (32.4)Non-controlling interest - - - - - - - - - - - - - 55.3 55.3Treasury shares acquired - - (543.3) - - - - - - - - - (543.3) - (543.3)Treasury shares sold - - 8.0 - - - - - - - - - 8.0 - 8.0Treasury Shares Canceled - - 3,761.3 - (3,022.6) (738.8) - - - - - - - - -
BALANCES AT DECEMBER 31, 2016 12,460.5 41.0 (721.9) 540.2 - 170.8 639.8 (693.8) (26.0) (575.9) 5.4 (0.1) 11,840.0 379.4 12,219.4
See accompanying notes to the consolidated financial statements.
F-6
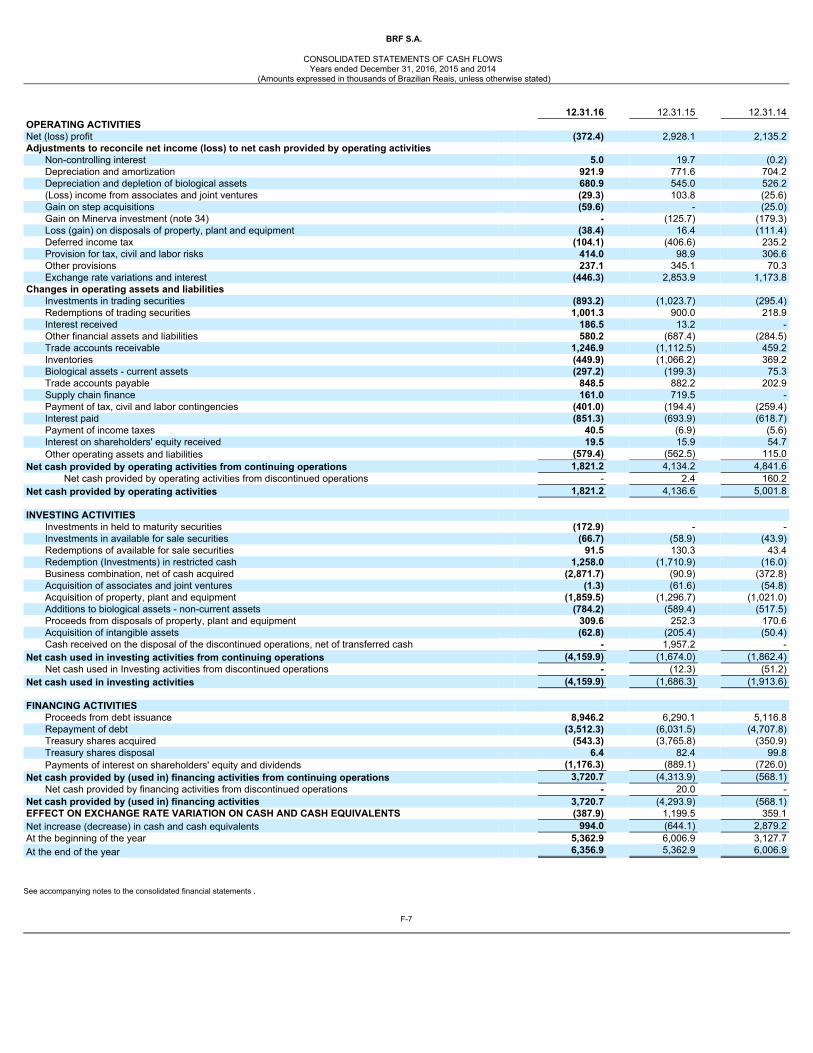
BRF S.A.
CONSOLIDATED STATEMENTS OF CASH FLOWS Years ended December 31, 2016, 2015 and 2014
(Amounts expressed in thousands of Brazilian Reais, unless otherwise stated)
12.31.16 12.31.15 12.31.14OPERATING ACTIVITIES Net (loss) profit (372.4) 2,928.1 2,135.2Adjustments to reconcile net income (loss) to net cash provided by operating activities
Non-controlling interest 5.0 19.7 (0.2)Depreciation and amortization 921.9 771.6 704.2Depreciation and depletion of biological assets 680.9 545.0 526.2(Loss) income from associates and joint ventures (29.3) 103.8 (25.6)Gain on step acquisitions (59.6) - (25.0)Gain on Minerva investment (note 34) - (125.7) (179.3)Loss (gain) on disposals of property, plant and equipment (38.4) 16.4 (111.4)Deferred income tax (104.1) (406.6) 235.2Provision for tax, civil and labor risks 414.0 98.9 306.6Other provisions 237.1 345.1 70.3Exchange rate variations and interest (446.3) 2,853.9 1,173.8
Changes in operating assets and liabilities Investments in trading securities (893.2) (1,023.7) (295.4)Redemptions of trading securities 1,001.3 900.0 218.9Interest received 186.5 13.2 -Other financial assets and liabilities 580.2 (687.4) (284.5)Trade accounts receivable 1,246.9 (1,112.5) 459.2Inventories (449.9) (1,066.2) 369.2Biological assets - current assets (297.2) (199.3) 75.3Trade accounts payable 848.5 882.2 202.9Supply chain finance 161.0 719.5 -Payment of tax, civil and labor contingencies (401.0) (194.4) (259.4)Interest paid (851.3) (693.9) (618.7)Payment of income taxes 40.5 (6.9) (5.6)Interest on shareholders' equity received 19.5 15.9 54.7Other operating assets and liabilities (579.4) (562.5) 115.0
Net cash provided by operating activities from continuing operations 1,821.2 4,134.2 4,841.6Net cash provided by operating activities from discontinued operations - 2.4 160.2
Net cash provided by operating activities 1,821.2 4,136.6 5,001.8 INVESTING ACTIVITIES
Investments in held to maturity securities (172.9) - -Investments in available for sale securities (66.7) (58.9) (43.9)Redemptions of available for sale securities 91.5 130.3 43.4Redemption (Investments) in restricted cash 1,258.0 (1,710.9) (16.0)Business combination, net of cash acquired (2,871.7) (90.9) (372.8)Acquisition of associates and joint ventures (1.3) (61.6) (54.8)Acquisition of property, plant and equipment (1,859.5) (1,296.7) (1,021.0)Additions to biological assets - non-current assets (784.2) (589.4) (517.5)Proceeds from disposals of property, plant and equipment 309.6 252.3 170.6Acquisition of intangible assets (62.8) (205.4) (50.4)Cash received on the disposal of the discontinued operations, net of transferred cash - 1,957.2 -
Net cash used in investing activities from continuing operations (4,159.9) (1,674.0) (1,862.4)Net cash used in Investing activities from discontinued operations - (12.3) (51.2)
Net cash used in investing activities (4,159.9) (1,686.3) (1,913.6) FINANCING ACTIVITIES
Proceeds from debt issuance 8,946.2 6,290.1 5,116.8Repayment of debt (3,512.3) (6,031.5) (4,707.8)Treasury shares acquired (543.3) (3,765.8) (350.9)Treasury shares disposal 6.4 82.4 99.8Payments of interest on shareholders' equity and dividends (1,176.3) (889.1) (726.0)
Net cash provided by (used in) financing activities from continuing operations 3,720.7 (4,313.9) (568.1)Net cash provided by financing activities from discontinued operations - 20.0 -
Net cash provided by (used in) financing activities 3,720.7 (4,293.9) (568.1)EFFECT ON EXCHANGE RATE VARIATION ON CASH AND CASH EQUIVALENTS (387.9) 1,199.5 359.1Net increase (decrease) in cash and cash equivalents 994.0 (644.1) 2,879.2At the beginning of the year 5,362.9 6,006.9 3,127.7At the end of the year 6,356.9 5,362.9 6,006.9
See accompanying notes to the consolidated financial statements .
F-7
BRF S.A.
Notes to Consolidated Financial Statements
Years ended December 31, 2016, 2015 and 2014(Amounts expressed in millions of Brazilian Reais, unless otherwise stated)
1. COMPANY’S OPERATIONS BRF S.A. (“BRF”) and its subsidiaries (collectively the “Company”) is a multinational Brazilian Company, which owns a comprehensive and diverse portfolio ofproducts and is one of the world’s largest companies in the food industry. With a focus on raising, producing and slaughtering of poultry and pork for processing,production and sale of fresh meat, processed products, pasta, sauce, mayonnaise, frozen vegetables and soybean by-products, among which the following arehighlighted:
· Whole chickens and frozen cuts of chicken, turkey and pork;· Ham products, bologna, sausages, frankfurters and other smoked products;· Hamburgers, breaded meat products and meatballs;· Lasagnas, pizzas, cheese breads, pies and frozen vegetables;· Margarine, sauces and mayonnaise; and· Soy meal and refined soy flour, as well as animal feed.
BRF is a public company, listed on the New Market of Brazilian Securities, Commodities and Future Exchange (“BM&FBOVESPA”), under the ticker BRFS3, andlisted on the New York Stock Exchange (“NYSE”), under the ticker BRFS. Its headquarters are located at 475, Rua Jorge Tzachel in the City of Itajaí, State of SantaCatarina. The Company's business model is by means of a vertical and integrated production system, which are distributed through an extensive distribution network, reachingthe 5 continents, to meet the demand of supermarkets, retail stores, wholesalers, restaurants and other institutional customers. In addition, our facilities arestrategically located near to their raw material suppliers or its main consumption centers. The Company has as main brands Sadia, Perdigão, Qualy, Chester®, Perdix and Paty that are highly recognized, especially in Brazil, Argentina and the Middle East. In 2016, the Company´s activities are organized in 7 operating segments, due to the importance and growth potential of Africa region, which now has the sameautonomy and organizational structure of other regions. Thus, the operating segments are as follows: Brazil, Latin America (“LATAM”), Europe, Middle East andNorth of Africa (“MENA”), Asia, Africa and Other Segments (note 5).
F-8
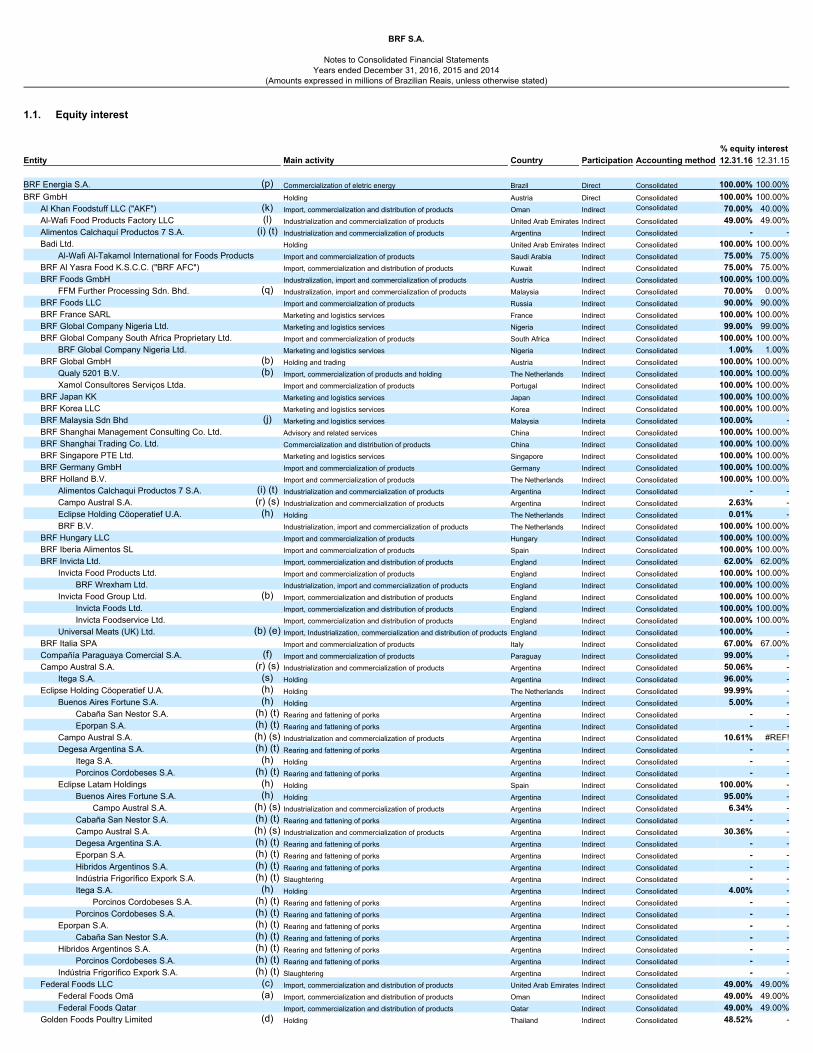
BRF S.A.
Notes to Consolidated Financial Statements
Years ended December 31, 2016, 2015 and 2014(Amounts expressed in millions of Brazilian Reais, unless otherwise stated)
1.1. Equity interest % equity interestEntity Main activity Country Participation Accounting method 12.31.16 12.31.15 BRF Energia S.A. (p) Commercialization of eletric energy Brazil Direct Consolidated 100.00% 100.00%BRF GmbH Holding Austria Direct Consolidated 100.00% 100.00%
Al Khan Foodstuff LLC ("AKF") (k) Import, commercialization and distribution of products Oman Indirect Consolidated 70.00% 40.00%Al-Wafi Food Products Factory LLC (l) Industrialization and commercialization of products United Arab Emirates Indirect Consolidated 49.00% 49.00%Alimentos Calchaquí Productos 7 S.A. (i) (t) Industrialization and commercialization of products Argentina Indirect Consolidated - -Badi Ltd. Holding United Arab Emirates Indirect Consolidated 100.00% 100.00%
Al-Wafi Al-Takamol International for Foods Products Import and commercialization of products Saudi Arabia Indirect Consolidated 75.00% 75.00%BRF Al Yasra Food K.S.C.C. ("BRF AFC") Import, commercialization and distribution of products Kuwait Indirect Consolidated 75.00% 75.00%BRF Foods GmbH Industralization, import and commercialization of products Austria Indirect Consolidated 100.00% 100.00%
FFM Further Processing Sdn. Bhd. (q) Industralization, import and commercialization of products Malaysia Indirect Consolidated 70.00% 0.00%BRF Foods LLC Import and commercialization of products Russia Indirect Consolidated 90.00% 90.00%BRF France SARL Marketing and logistics services France Indirect Consolidated 100.00% 100.00%BRF Global Company Nigeria Ltd. Marketing and logistics services Nigeria Indirect Consolidated 99.00% 99.00%BRF Global Company South Africa Proprietary Ltd. Import and commercialization of products South Africa Indirect Consolidated 100.00% 100.00%
BRF Global Company Nigeria Ltd. Marketing and logistics services Nigeria Indirect Consolidated 1.00% 1.00%BRF Global GmbH (b) Holding and trading Austria Indirect Consolidated 100.00% 100.00%
Qualy 5201 B.V. (b) Import, commercialization of products and holding The Netherlands Indirect Consolidated 100.00% 100.00%Xamol Consultores Serviços Ltda. Import and commercialization of products Portugal Indirect Consolidated 100.00% 100.00%
BRF Japan KK Marketing and logistics services Japan Indirect Consolidated 100.00% 100.00%BRF Korea LLC Marketing and logistics services Korea Indirect Consolidated 100.00% 100.00%BRF Malaysia Sdn Bhd (j) Marketing and logistics services Malaysia Indireta Consolidated 100.00% -BRF Shanghai Management Consulting Co. Ltd. Advisory and related services China Indirect Consolidated 100.00% 100.00%BRF Shanghai Trading Co. Ltd. Commercialization and distribution of products China Indirect Consolidated 100.00% 100.00%BRF Singapore PTE Ltd. Marketing and logistics services Singapore Indirect Consolidated 100.00% 100.00%BRF Germany GmbH Import and commercialization of products Germany Indirect Consolidated 100.00% 100.00%BRF Holland B.V. Import and commercialization of products The Netherlands Indirect Consolidated 100.00% 100.00%
Alimentos Calchaqui Productos 7 S.A. (i) (t) Industrialization and commercialization of products Argentina Indirect Consolidated - -Campo Austral S.A. (r) (s) Industrialization and commercialization of products Argentina Indirect Consolidated 2.63% -Eclipse Holding Cöoperatief U.A. (h) Holding The Netherlands Indirect Consolidated 0.01% -BRF B.V. Industrialization, import and commercialization of products The Netherlands Indirect Consolidated 100.00% 100.00%
BRF Hungary LLC Import and commercialization of products Hungary Indirect Consolidated 100.00% 100.00%BRF Iberia Alimentos SL Import and commercialization of products Spain Indirect Consolidated 100.00% 100.00%BRF Invicta Ltd. Import, commercialization and distribution of products England Indirect Consolidated 62.00% 62.00%
Invicta Food Products Ltd. Import and commercialization of products England Indirect Consolidated 100.00% 100.00%BRF Wrexham Ltd. Industrialization, import and commercialization of products England Indirect Consolidated 100.00% 100.00%
Invicta Food Group Ltd. (b) Import, commercialization and distribution of products England Indirect Consolidated 100.00% 100.00%Invicta Foods Ltd. Import, commercialization and distribution of products England Indirect Consolidated 100.00% 100.00%Invicta Foodservice Ltd. Import, commercialization and distribution of products England Indirect Consolidated 100.00% 100.00%
Universal Meats (UK) Ltd. (b) (e) Import, Industrialization, commercialization and distribution of products England Indirect Consolidated 100.00% -BRF Italia SPA Import and commercialization of products Italy Indirect Consolidated 67.00% 67.00%Compañía Paraguaya Comercial S.A. (f) Import and commercialization of products Paraguay Indirect Consolidated 99.00% -Campo Austral S.A. (r) (s) Industrialization and commercialization of products Argentina Indirect Consolidated 50.06% -
Itega S.A. (s) Holding Argentina Indirect Consolidated 96.00% -Eclipse Holding Cöoperatief U.A. (h) Holding The Netherlands Indirect Consolidated 99.99% -
Buenos Aires Fortune S.A. (h) Holding Argentina Indirect Consolidated 5.00% -Cabaña San Nestor S.A. (h) (t) Rearing and fattening of porks Argentina Indirect Consolidated - -Eporpan S.A. (h) (t) Rearing and fattening of porks Argentina Indirect Consolidated - -
Campo Austral S.A. (h) (s) Industrialization and commercialization of products Argentina Indirect Consolidated 10.61% #REF!Degesa Argentina S.A. (h) (t) Rearing and fattening of porks Argentina Indirect Consolidated - -
Itega S.A. (h) Holding Argentina Indirect Consolidated - -Porcinos Cordobeses S.A. (h) (t) Rearing and fattening of porks Argentina Indirect Consolidated - -
Eclipse Latam Holdings (h) Holding Spain Indirect Consolidated 100.00% -Buenos Aires Fortune S.A. (h) Holding Argentina Indirect Consolidated 95.00% -
Campo Austral S.A. (h) (s) Industrialization and commercialization of products Argentina Indirect Consolidated 6.34% -Cabaña San Nestor S.A. (h) (t) Rearing and fattening of porks Argentina Indirect Consolidated - -Campo Austral S.A. (h) (s) Industrialization and commercialization of products Argentina Indirect Consolidated 30.36% -Degesa Argentina S.A. (h) (t) Rearing and fattening of porks Argentina Indirect Consolidated - -Eporpan S.A. (h) (t) Rearing and fattening of porks Argentina Indirect Consolidated - -Hibridos Argentinos S.A. (h) (t) Rearing and fattening of porks Argentina Indirect Consolidated - -Indústria Frigorífico Expork S.A. (h) (t) Slaughtering Argentina Indirect Consolidated - -Itega S.A. (h) Holding Argentina Indirect Consolidated 4.00% -
Porcinos Cordobeses S.A. (h) (t) Rearing and fattening of porks Argentina Indirect Consolidated - -Porcinos Cordobeses S.A. (h) (t) Rearing and fattening of porks Argentina Indirect Consolidated - -
Eporpan S.A. (h) (t) Rearing and fattening of porks Argentina Indirect Consolidated - -Cabaña San Nestor S.A. (h) (t) Rearing and fattening of porks Argentina Indirect Consolidated - -
Hibridos Argentinos S.A. (h) (t) Rearing and fattening of porks Argentina Indirect Consolidated - -Porcinos Cordobeses S.A. (h) (t) Rearing and fattening of porks Argentina Indirect Consolidated - -
Indústria Frigorífico Expork S.A. (h) (t) Slaughtering Argentina Indirect Consolidated - -Federal Foods LLC (c) Import, commercialization and distribution of products United Arab Emirates Indirect Consolidated 49.00% 49.00%
Federal Foods Omã (a) Import, commercialization and distribution of products Oman Indirect Consolidated 49.00% 49.00%Federal Foods Qatar Import, commercialization and distribution of products Qatar Indirect Consolidated 49.00% 49.00%
Golden Foods Poultry Limited (d) Holding Thailand Indirect Consolidated 48.52% -
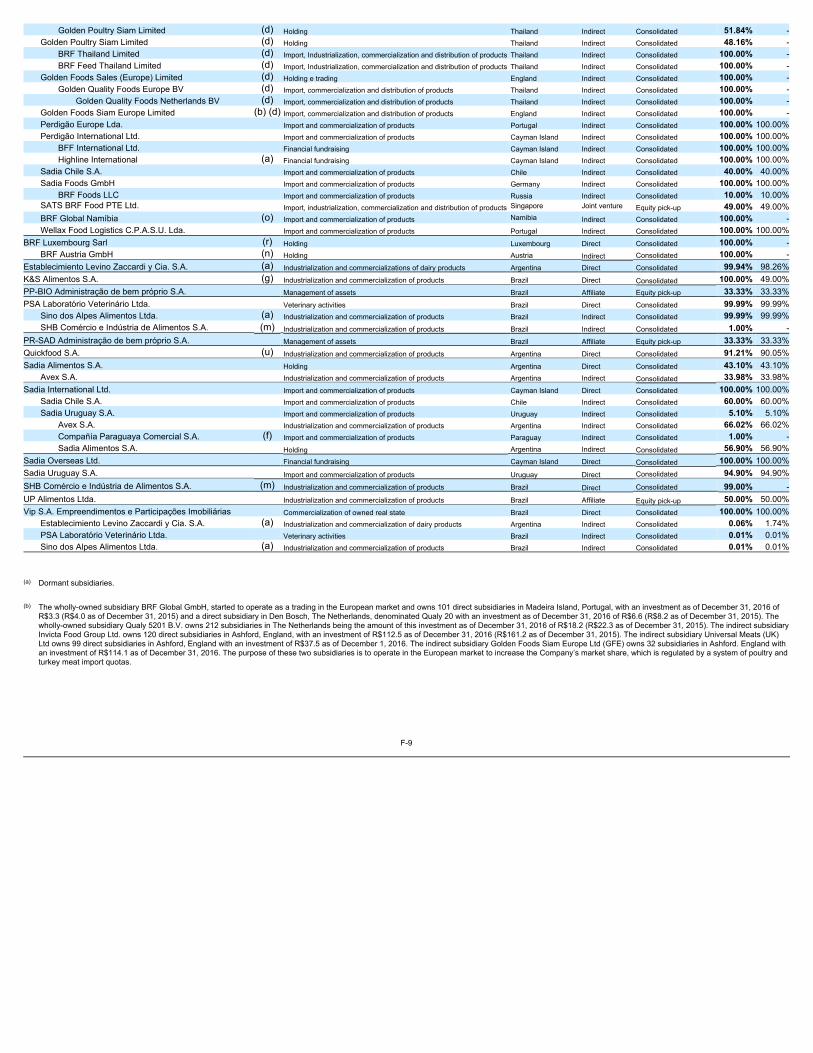
Golden Poultry Siam Limited (d) Holding Thailand Indirect Consolidated 51.84% -Golden Poultry Siam Limited (d) Holding Thailand Indirect Consolidated 48.16% -
BRF Thailand Limited (d) Import, Industrialization, commercialization and distribution of products Thailand Indirect Consolidated 100.00% -BRF Feed Thailand Limited (d) Import, Industrialization, commercialization and distribution of products Thailand Indirect Consolidated 100.00% -
Golden Foods Sales (Europe) Limited (d) Holding e trading England Indirect Consolidated 100.00% -Golden Quality Foods Europe BV (d) Import, commercialization and distribution of products Thailand Indirect Consolidated 100.00% -
Golden Quality Foods Netherlands BV (d) Import, commercialization and distribution of products Thailand Indirect Consolidated 100.00% -Golden Foods Siam Europe Limited (b) (d) Import, commercialization and distribution of products England Indirect Consolidated 100.00% -Perdigão Europe Lda. Import and commercialization of products Portugal Indirect Consolidated 100.00% 100.00%Perdigão International Ltd. Import and commercialization of products Cayman Island Indirect Consolidated 100.00% 100.00%
BFF International Ltd. Financial fundraising Cayman Island Indirect Consolidated 100.00% 100.00%Highline International (a) Financial fundraising Cayman Island Indirect Consolidated 100.00% 100.00%
Sadia Chile S.A. Import and commercialization of products Chile Indirect Consolidated 40.00% 40.00%Sadia Foods GmbH Import and commercialization of products Germany Indirect Consolidated 100.00% 100.00%
BRF Foods LLC Import and commercialization of products Russia Indirect Consolidated 10.00% 10.00%SATS BRF Food PTE Ltd. Import, industrialization, commercialization and distribution of products Singapore Joint venture Equity pick-up 49.00% 49.00%BRF Global Namíbia (o) Import and commercialization of products Namibia Indirect Consolidated 100.00% -Wellax Food Logistics C.P.A.S.U. Lda. Import and commercialization of products Portugal Indirect Consolidated 100.00% 100.00%
BRF Luxembourg Sarl (r) Holding Luxembourg Direct Consolidated 100.00% -BRF Austria GmbH (n) Holding Austria Indirect Consolidated 100.00% -
Establecimiento Levino Zaccardi y Cia. S.A. (a) Industrialization and commercializations of dairy products Argentina Direct Consolidated 99.94% 98.26%K&S Alimentos S.A. (g) Industrialization and commercialization of products Brazil Direct Consolidated 100.00% 49.00%PP-BIO Administração de bem próprio S.A. Management of assets Brazil Affiliate Equity pick-up 33.33% 33.33%PSA Laboratório Veterinário Ltda. Veterinary activities Brazil Direct Consolidated 99.99% 99.99%
Sino dos Alpes Alimentos Ltda. (a) Industrialization and commercialization of products Brazil Indirect Consolidated 99.99% 99.99%SHB Comércio e Indústria de Alimentos S.A. (m) Industrialization and commercialization of products Brazil Indirect Consolidated 1.00% -
PR-SAD Administração de bem próprio S.A. Management of assets Brazil Affiliate Equity pick-up 33.33% 33.33%Quickfood S.A. (u) Industrialization and commercialization of products Argentina Direct Consolidated 91.21% 90.05%Sadia Alimentos S.A. Holding Argentina Direct Consolidated 43.10% 43.10%
Avex S.A. Industrialization and commercialization of products Argentina Indirect Consolidated 33.98% 33.98%Sadia International Ltd. Import and commercialization of products Cayman Island Direct Consolidated 100.00% 100.00%
Sadia Chile S.A. Import and commercialization of products Chile Indirect Consolidated 60.00% 60.00%Sadia Uruguay S.A. Import and commercialization of products Uruguay Indirect Consolidated 5.10% 5.10%
Avex S.A. Industrialization and commercialization of products Argentina Indirect Consolidated 66.02% 66.02%Compañía Paraguaya Comercial S.A. (f) Import and commercialization of products Paraguay Indirect Consolidated 1.00% -Sadia Alimentos S.A. Holding Argentina Indirect Consolidated 56.90% 56.90%
Sadia Overseas Ltd. Financial fundraising Cayman Island Direct Consolidated 100.00% 100.00%Sadia Uruguay S.A. Import and commercialization of products Uruguay Direct Consolidated 94.90% 94.90%SHB Comércio e Indústria de Alimentos S.A. (m) Industrialization and commercialization of products Brazil Direct Consolidated 99.00% -UP Alimentos Ltda. Industrialization and commercialization of products Brazil Affiliate Equity pick-up 50.00% 50.00%Vip S.A. Empreendimentos e Participações Imobiliárias Commercialization of owned real state Brazil Direct Consolidated 100.00% 100.00%
Establecimiento Levino Zaccardi y Cia. S.A. (a) Industrialization and commercialization of dairy products Argentina Indirect Consolidated 0.06% 1.74%PSA Laboratório Veterinário Ltda. Veterinary activities Brazil Indirect Consolidated 0.01% 0.01%Sino dos Alpes Alimentos Ltda. (a) Industrialization and commercialization of products Brazil Indirect Consolidated 0.01% 0.01%
(a) Dormant subsidiaries.
(b) The wholly-owned subsidiary BRF Global GmbH, started to operate as a trading in the European market and owns 101 direct subsidiaries in Madeira Island, Portugal, with an investment as of December 31, 2016 ofR$3.3 (R$4.0 as of December 31, 2015) and a direct subsidiary in Den Bosch, The Netherlands, denominated Qualy 20 with an investment as of December 31, 2016 of R$6.6 (R$8.2 as of December 31, 2015). Thewholly-owned subsidiary Qualy 5201 B.V. owns 212 subsidiaries in The Netherlands being the amount of this investment as of December 31, 2016 of R$18.2 (R$22.3 as of December 31, 2015). The indirect subsidiaryInvicta Food Group Ltd. owns 120 direct subsidiaries in Ashford, England, with an investment of R$112.5 as of December 31, 2016 (R$161.2 as of December 31, 2015). The indirect subsidiary Universal Meats (UK)Ltd owns 99 direct subsidiaries in Ashford, England with an investment of R$37.5 as of December 1, 2016. The indirect subsidiary Golden Foods Siam Europe Ltd (GFE) owns 32 subsidiaries in Ashford. England withan investment of R$114.1 as of December 31, 2016. The purpose of these two subsidiaries is to operate in the European market to increase the Company’s market share, which is regulated by a system of poultry andturkey meat import quotas.
F-9
BRF S.A.
Notes to Consolidated Financial Statements
Years ended December 31, 2016, 2015 and 2014(Amounts expressed in millions of Brazilian Reais, unless otherwise stated)
(c) The Company owns 49% of the equity interest, permitted by the Federal Law 8/1984, which is effective in the United Arab Emirates. According to the shareholder’s agreement, the Company holds 100% of the
economic interest.
(d) On January 26, 2016 acquisition of 48.52% of equity interest in Golden Foods Poultry Limited and 48.16% of equity interest in Golden Poultry Siam Limited. According to the shareholder’s agreement, the companyowns substantial part of the economic rights of such entities. In addition, on January 26, 2016, acquisition of 100% of equity interest in Golden Foods Sales (Europe) Limited and Golden Foods Siam Europe Limited.
(e) On February 01, 2016, acquisition of 100% of equity interest in Universal Meats (UK) Ltd.
(f) On February 25, 2016, acquisition of 100% of equity interest in Compañía Paraguaya Comercial S.A.
(g) On March 18, 2016, the Company acquired the remaining equity interest and thus holds 100% of equity interest in K&S Alimentos S.A.
(h) On April 13, 2016, acquisition of 50% of equity interest in Eclipse Holding Cöoperatief UA and its subsidiaries. On October 27, 2016, acquisition of 50% of equity interest and thus holds 100% of equity interest.
(i) On May 10, 2016, acquisition of 100% of equity interest in Alimentos Calchaquí Productos 7 S.A..
(j) On June 10, 2016, establishment of BRF Malaysia Snd Bhd with 100% of equity interest.
(k) On June 20, 2016, acquisition of 30% of equity interest, becoming the holder of 70% of equity interest, permitted by the Federal Law, which is effective in the Sultanate of Oman. According to the shareholder’sagreement, the Company holds 99% of the economic interest.
F-10
BRF S.A.
Notes to Consolidated Financial Statements
Years ended December 31, 2016, 2015 and 2014(Amounts expressed in millions of Brazilian Reais, unless otherwise stated)
(l) The Company owns 49% of equity interest, permitted by the Federal Law 8/1984, which is effective in the United Arab Emirates. According to the shareholder’s agreement, the Company holds 100% of the economic
interest.
(m) On September 01, 2016, incorporation of SHB Comércio e Indústria de Alimentos S.A.
(n) On September 02, 2016, acquisition of 100% of equity interest in SALEM Beteiligungsverwaltung Siebenundsiebzigste. On November 09, 2016, change the corporate name to BRF Austria GmbH.
(o) On September 22, 2016, acquisition of 100% of equity interest in Gazania Investments Three Hundred and Thirty Three (Pty) Ltd. On October 13, 2016, change the corporate name to BRF Global Namibia.
(p) On October 03, 2016, change the corporate name to BRF Energia S.A. and modification of its business purpose, to trading of enegy.
(q) On October 04, 2016, acquisition of 70% of equity interest in FFM Further Processing Sdn Bhdl.
(r) On October 28, 2016, establishment of BRF Luxemburgo Sarl.
(s) On November 01, 2016, change in equity interest in Campo Austral.
(t) On November 01, 2016, spin-off of the following companies: Alimentos Calchaquí Productos 7 S.A., Cabaña San Néstor S.A., Eporpam S.A., Industria Frigorifico Expork S.A., Híbridos Argentinos S.A., PorcinosCordobeces S.A. and Degesa Argentina S.A., in Campo Austral S.A., and change in equity interest.
(u) On December 29, 2016, change in equity interest in Quickfood S.A.
1.2. Acquisition of the frozen distribution business of Qatar National Import and Export Co. (“QNIE”) On January 01, 2016, BRF signed an agreement with QNIE for the acquisition of frozen distribution business in the State of Qatar. QNIE was one of distributor ofBRF products in Qatar for more than 40 years. The transaction amounted to US$146.2 paid in cash (equivalent to R$589.1) (note 6.1.1). 1.3. Business combination with Golden Foods Siam (“GFS”) On January 26, 2016, BRF through its wholly-owned subsidiary BRF Gmbh, it concluded the acquisition of a controlling interest in GFS (“transaction”). Thetransaction comprised the acquisition of 100% of the equity interest in Golden Foods Sales Ltd. and Golden Foods Siam Europe, both located in the United Kingdom,48.52% of the equity interest in Golden Foods Poultry Ltd. and 73.31% of on indirect equity interest in Golden Poultry Siam Ltd., both located in Thailand. The transaction amounted to US$359.5 (equivalent to R$1,466.8) (note 6.1.2.). 1.4. Business combination with Universal Meats (UK) Limited (“Universal”) On February 01, 2016, BRF through its wholly-owned subsidiary BRF Invicta Limited (“BRF Invicta”), it concluded the acquisition of 100% interest of Universal(“transaction”), in the amount of GBP32.4 (equivalent to R$185.7) (note 6.1.3).
F-11
BRF S.A.
Notes to Consolidated Financial Statements
Years ended December 31, 2016, 2015 and 2014(Amounts expressed in millions of Brazilian Reais, unless otherwise stated)
1.5. Acquisition of interest in the joint venture with Mondelez Lacta and Mondelez Brasil (together “Mondelez”) On March 18, 2016, BRF amended the terms of its agreement with Mondelez, and became holder of 100% of the equity interest in K&S Alimentos S.A. through thepayment of R$10.7 (note 6.2.1). 1.6. Business combination with Alimentos Calchaquí Productos 7 S.A. (“Calchaquí”)
On March 22, 2016, BRF through its wholly-owned subsidiaries BRF GmbH and BRF Holland B.V., signed an agreement for the acquisition of the total shares issuedby Calchaquí (“transaction”), a traditional Argentine entity, in the cold cuts market, and owner of leading brands such as Calchaquí and Bocatti. The transaction amounted to US$104.7 (equivalent of R$364.1) (note 6.1.5). 1.7. Step acquisition – Al Khan Foodstuff LLC. (“AKF”). On July 03, 14, BRF acquired 40% of the equity interest of AKF and booked the investment as a joint venture. On June 20, 2016, the Company concluded the acquisition of the control of AKF, becoming the owner of 99% of its economic interest. The transaction totaledUS$32.6 (equivalent to R$110.3) (note 6.1.6). 1.8. Shares purchase agreement with Globosuínos Agropecuária S.A. (“Globosuínos”) On April 08, 2016, BRF signed an agreement for the acquisition of the total shares of a newco, that would hold certain assets that were owned by Globosuínos. The Company decided to terminate the agreement and cancelled the deal. 1.9. Business combination with Eclipse Holding Cöoperatief UA S.A. (“Eclipse”) On April 14, 2016 BRF concluded the first step of the transaction and acquired 50% of equity by US$36.5 (equivalent to R$128.9), paid in cash. On October 27, 2016, after complying with the conditions established in the agreement, BRF acquired the remaining equity interest (50%) by US$31.7 (equivalent ofR$99.6), paid in cash (note 6.1.4). 1.10. Business combination – FFM Further Processing SDN BHD (“FFP”)
F-12
BRF S.A.
Notes to Consolidated Financial Statements
Years ended December 31, 2016, 2015 and 2014(Amounts expressed in millions of Brazilian Reais, unless otherwise stated)
On October 04, 2016, BRF through its wholly-owned subsidiary BRF Foods GmbH, entered into an agreement with FFM Berhad for the acquisition of 70% equityinterest in FFP. BRF Foods GmbH controls FFP by means of the conditions established by the shareholder’s agreement. The transaction amounted to MYR62.8 (equivalent to R$49.0), paid in cash. This amount should be further adjusted according to certain term set out in theagreement (note 6.1.7). 1.11. Seasonality In Brazil and LATAM operating segments, in months of November and December of each year, the Company is impacted by seasonality due to Christmas and NewYear Eve Celebrations, being the best-selling products in this period: turkey, Chester®, ham and pork loins. In MENA operating segment, seasonality is due to Ramadan, which is the holy month of the Muslim Calendar. The start of Ramadan depends on the beginning of themoon cycle and therefore can vary each year. 2. MANAGEMENT’S STATEMENT AND BASIS OF PREPARATION AND PRESENTATION OF FINANCIAL STATEMENTS The Company’s consolidated financial statements are prepared in accordance with the International Financial Reporting Standards (“IFRS”) issued by theInternational Accounting Standards Board (“IASB”) and interpretations issued by the International Financial Reporting Interpretations Committee (“IFRIC”). The Company’s consolidated financial statements are expressed in millions of Brazilian Reais (“R$”), as well as the amounts of other currencies disclosed in thefinancial statements. The preparation of the Company’s financial statements requires Management to make judgments, use estimates and adopt assumptions that affect the reportedamounts of revenues, expenses, assets and liabilities, including contingent liabilities, as of the reporting date. However, the uncertainty inherent to these judgments,assumptions and estimates could result in material adjustments to the carrying amounts of the affected assets and liabilities in future periods. The consolidated financial statements were prepared on the historical cost basis except for the following items which are measured at fair value: i. derivative and non-derivative financial instruments;
ii. available for sale financial assets;
F-13
BRF S.A.
Notes to Consolidated Financial Statements
Years ended December 31, 2016, 2015 and 2014(Amounts expressed in millions of Brazilian Reais, unless otherwise stated)
iii. highly liquid investments classified as cash and cash equivalents; iv. share-based payments and employee benefits, and v. biological assets. 3. SUMMARY OF SIGNIFICANT ACCOUNTING POLICIES 3.1. Consolidation : the consolidated financial statements comprise the financial statements of the Company and its subsidiaries in which the Company controls.
Intercompany accounts and transactions have been eliminated in consolidation. Non-controlling interest is presented separately. 3.2. Functional currency : the financial statements of each subsidiary included in consolidation are prepared using the currency of the main economic environment
where it operates.
The financial statements of foreign subsidiaries with a functional currency different from the Brazilian Reais are translated into Brazilian Reais using thefollowing criteria: Foreign subsidiaries with functional currency – Argentine Peso, Bath, Chilean Peso, Dirham, Euro, Forint Hungary, Kwait Dinar, Oman Riyal, Pound Sterling,Rande Africa, Renminbi Yuan China, Ringgit Malaysia, Riyal Saudi Arabia, Riyal Qatar, Ruble Russia, Singapore Dollar, Uruguayan Peso, Won South Koreaand Yen.
· Assets and liabilities are translated at the exchange rate in effect at year-end;
· Income statement accounts are translated based on the monthly average rate; and
· The cumulative effects of gains or losses on translation are recognized as Accumulated Foreign Currency Translation Adjustments as a component
of other comprehensive income.
Transactions of foreign subsidiaries with functional currency – Brazilian Reais
· Non-monetary assets and liabilities are translated at the historical rate of the transaction;
· Monetary assets and liabilities are translated at the exchange rate at year-end;
F-14
BRF S.A.
Notes to Consolidated Financial Statements
Years ended December 31, 2016, 2015 and 2014(Amounts expressed in millions of Brazilian Reais, unless otherwise stated)
· Income statement accounts are translated based on the monthly average rate; and· The cumulative effects of gains or losses on translation are recognized in the income statement.
Goodwill arising from a foreign business combination is denominated in the functional currency of the acquiring entity and translated at year-end exchange ratefor the presentation currency of the Company. The accounting policies have been consistently applied by all subsidiaries included in consolidation.
3.3. Investments in associates and joint ventures : the Company’s investments in its associates and joint ventures are accounted for using the equity method. Anassociate is an entity over which the Company has significant influence, which is the power to participate in the financial and operating policy decisions of theinvestee but it is not control or joint control over those policies. Joint venture is a type of joint arrangement, whereby the parties that have joint control of theagreement have rights to the net assets of the joint venture. Joint control is the contractually agreed sharing of control of an arrangement, which exists onlywhen decisions about the relevant activities requires the unanimous consent of the parties sharing control.
3.4. Business combinations : are accounted for using the purchase method. The cost of an acquisition is the sum of the consideration paid, measured at fair value
at acquisition date, and the amount of any non-controlling interests in the acquiree. For each business combination, the Company recognizes any non-controlling interest in the acquiree either at fair value or at the non-controlling interest’s proportionate share of the acquiree’s net assets. Costs directlyattributable to the acquisition are expensed as incurred.
When acquiring a business, assets acquired and the liabilities assumed are measured at fair value and are classified according to terms of the agreement,economic circumstances and conditions at the acquisition date.
Goodwill is initially measured as the excess of the consideration paid over the fair value of the net assets acquired.
After initial recognition, goodwill is measured at cost, net of any accumulated impairment losses. For purposes of impairment testing, the goodwill recognized ina business combination, as from the acquisition date, is allocated to each of the Company’s cash generating units expected to benefit from the businesscombination, regardless of whether other assets and liabilities of the acquiree are assigned to those units.
3.5. Segment information : an operating segment is a component of the Company that carries out business activities from which it can obtain revenues and incurexpenses. The operating segments reflect how the Company’s management reviews financial information to make decisions. The Company’s managementhas identified reportable segments, which meet the quantitative and qualitative disclosure requirements. The segments identified for disclosure representmainly sales channels. The information according to the characteristics of the products is also disclosed, based on their nature, as follows: poultry, pork andother, processed foods and other sales.
F-15
BRF S.A.
Notes to Consolidated Financial Statements
Years ended December 31, 2016, 2015 and 2014(Amounts expressed in millions of Brazilian Reais, unless otherwise stated)
3.6. Cash and cash equivalents: include cash on hand, bank deposits and highly liquid investments in fixed-income funds and/or securities with maturities, of 90
days or less, which are readily convertible into known amounts of cash and subject to insignificant risk of change in value. Highly liquid investments classifiedas cash equivalents, due to their nature, are measured at fair value through the profit and loss and will be used in a short period time.
3.7. Financial instruments: financial assets and liabilities are recorded when the Company becomes a party to the contractual provisions of the instruments and are
classified into the following categories:
3.7.1. Marketable securities : are financial assets that comprise public and private fixed-income securities, classified and recorded based on the purpose for whichthey were acquired, in accordance with the following categories:
· Trading securities: acquired for sale or repurchase in the short term, recorded at fair value with changes to fair value recorded as financial income or
expense;
· Held to maturity: when the Company has the intention and ability to hold them until maturity, investments are recorded at amortized cost, plus interest,monetary and exchange rate changes, when applicable, and recognized as financial income or expense; and
· Available for sale: comprises the remaining securities that are not classified in any of the categories above, which are measured at fair value, with
changes to fair value recorded in other comprehensive income while the asset is not realized, net of taxes. Interest, monetary correction and exchangedifferences, when applicable, are recognized as financial income or expense.
3.7.2. Derivatives financial instruments measured at fair value : are those actively traded on organized markets and fair value is determined based on the
amounts quoted on an active market at the balance sheet date. These financial instruments are designated at initial recognition, classified as other financialassets and/or liabilities, with a corresponding entry in the statement of income within financial income or expenses or cash flow hedge, a component of othercomprehensive income, net of taxes.
F-16
BRF S.A.
Notes to Consolidated Financial Statements
Years ended December 31, 2016, 2015 and 2014(Amounts expressed in millions of Brazilian Reais, unless otherwise stated)
3.7.3. Hedge transactions : the Company utilizes derivative and non-derivative financial instruments, to hedge the exposure to exchange rate and interestvariations or to modify the characteristics of financial assets and liabilities and highly probable transactions, which are: (i) highly correlated to changes in themarket value of the item being hedged, both at inception and throughout the term of the contract (effectiveness between 80% and 125%); (ii) supported bydocuments that identify the transaction, the hedged risk, the risk management process and the methodology used to assess effectiveness; and (iii)considered effective in the mitigation of the risk associated with the hedged exposure. These transactions are accounted for in accordance with IAS 39. Hedges that meet the criteria for hedge accounting are recorded as cash flow hedge or fair value hedge.
In a cash flow hedge, the effective portion of the gain or loss on the hedging instrument is recognized as other comprehensive income, while the ineffectiveportion of the hedge is recognized immediately as financial income or expense. In a fair value hedge, the effective portion of the gain or loss on the hedging instrument is recognized as financial income or expense at the same time asthe changes of fair value of the hedge object. When the hedge object is a firm commitment, the amount initially recorded of the asset or liability is adjustedby these gains or losses. The amounts recorded as other comprehensive income are immediately transferred to the statement of income when the hedged transaction affects thestatement of income.
If the occurrence of the forecasted transaction or firm commitment is no longer expected, the amounts previously recognized in other comprehensive incomeare transferred to the statement of income. If the hedging instrument expires or is sold, terminated or exercised without replacement or rollover, or if itsclassification as a hedge is revoked, the gains or losses previously recognized remain recorded in other comprehensive income until the forecastedtransaction or firm commitment affect the statement of income.
3.7.4. Loans and receivables : these are financial assets and liabilities with fixed or determinable payments which are not quoted on an active market. Such
assets and liabilities are initially recognized at fair value plus any attributable transaction costs. After initial recognition, loans and receivables are measuredat amortized cost using the effective interest rate method, less any impairment losses.
F-17
BRF S.A.
Notes to Consolidated Financial Statements
Years ended December 31, 2016, 2015 and 2014(Amounts expressed in millions of Brazilian Reais, unless otherwise stated)
3.7.5. Non-derivative financial liabilities : are initially recognized at fair value less from any directly attributable to such liability. After initial recognition, financial
liabilities are measured at amortized cost using the effective interest method.3.8. Adjustment to present value : the Company measures the adjustment to present value of outstanding balances of current and non-current trade accounts
receivable, trade payables and other non-current liabilities, being recorded in accounts reducing their lines on the other hand financial result. The Companyadopts the weighted average cost of capital (“WACC”) to determine the adjustment to present value to those assets and liabilities, which corresponds to annualrate of 14.30% p.a. on December 31, 2016 (12.80% p.a. on December 31, 2015).
3.9. Trade accounts receivables : are recorded at the invoiced amount and adjusted to present value, when applicable, net of allowance for doubtful accounts.
An allowance for doubtful accounts is determined through analysis of the aging of trade accounts receivable and assessment of collectability based on historictrends, the financial condition of the Company’s customers and evaluation of economic conditions. The Company writes off uncollectible trade receivables once collection efforts have been exhausted.
3.10. Inventories : are measured at the weighted average cost method, not exceeding market value or net realizable value. Provisions for obsolescence,adjustments to net realizable value and deteriorated products are recorded when necessary. Usual production losses are included in monthly cost, whereasunusual losses, if any, are charged to other operating expenses.
3.11. Biological assets : Consumables and production biological assets (live animals) and forests are measured at their fair value less cost to sell, using the cost
approach technique for live animals and income approach for forests.
3.12. Assets held for sale: Such assets are measured at carrying amount or fair value, whichever is lower, net of selling costs and are not depreciated or amortized. The income statement and cash flows from discontinued operations are presented separately from those of continuing operations of the Company.
3.13. Property, plant and equipment : stated at the cost of acquisition or construction, less accumulated depreciation and impairment losses, when applicable.
Borrowing costs are capitalized as a component of construction in progress, pursuant to with IAS 23, considering the weighted average interest rate of theCompany’s debt at the capitalization date.
F-18
BRF S.A.
Notes to Consolidated Financial Statements
Years ended December 31, 2016, 2015 and 2014(Amounts expressed in millions of Brazilian Reais, unless otherwise stated)
Depreciation is recognized based on the estimated economic useful life of each asset on a straight-line basis. The estimated useful life, residual values anddepreciation methods are annually reviewed and the effects of any changes in estimates are accounted for prospectively. Land is not depreciated. The Company annually performs an analysis of impairment indicators of property, plant and equipment along with goodwill impairment test. If an impairmentindicator is identified, the corresponding assets are tested for impairment using the discounted cash flow methodology. Hence, when an impairment isidentified, a provision is recorded. The recoverability of these assets was tested for impairment in 2016, and no adjustments were identified. The realization ofthe test involved the adoption of assumptions and judgments, as disclosed in note 19. Gains and losses on disposals of property, plant and equipment items are calculated by comparing the proceeds of the disposals with their net book valuesand recognized in the statement of income at the disposal date.
3.14. Intangible assets : Intangible assets acquired are measured at cost at the time they are initially recognized. The cost of intangible assets acquired in a
business combination corresponds to the fair value at the acquisition date. After initial recognition, intangible assets are presented at cost less accumulatedamortization and impairment losses, when applicable. Internally-generated intangible assets, excluding development costs, are not capitalized but recognizedin the statement of income as incurred.
The useful life of intangible assets is assessed as finite or indefinite. Intangible assets with a finite life are amortized over the economic useful life and reviewed for impairment whenever there is an indication that their carryingvalues may be impaired. The amortization period and method for an intangible asset with a finite useful life are reviewed at least at the end of each fiscal year.The amortization of intangible assets with a finite useful life is recognized in the statement of income as an expense consistently with the use of the intangibleasset. Intangible assets with an indefinite useful life are not amortized, but are tested annually for impairment on an individual basis or at the cash generating unitlevel. The Company records goodwill and trademarks as intangibles assets with in indefinite useful life. Goodwill recoverability was tested for fiscal year 2016 and no impairment loss was identified. Such test involved the adoption of assumptions and judgments,disclosed in note 19.
F-19
BRF S.A.
Notes to Consolidated Financial Statements
Years ended December 31, 2016, 2015 and 2014(Amounts expressed in millions of Brazilian Reais, unless otherwise stated)
3.15. Income taxes : in Brazil, are comprised of corporate income tax (“IRPJ”) and social contribution tax (“CSLL”), which are calculated monthly on taxable income,
at the rate of 15% plus 10% surtax for IRPJ, and of 9% for CSLL, considering the offset of tax loss carryforwards, up to the limit of 30% of annual taxableincome. The income from foreign subsidiaries is subject to taxation pursuant to the local tax rates and legislation. In Brazil, these incomes suffer the effects of taxationon universal basis instituted by Law 12.973/14, being individualized analysis by subsidiary to add the profits of the same to taxation in Brazil, respecting the taxtreaty signed by each country with Brazil in order to avoid double taxation.
Deferred taxes are recorded on IRPJ and CSLL tax losses, assets and liabilities and temporary differences between the tax basis the carrying amount andclassified as non-current assets, as required by IAS 01. When the Company’s analysis indicates that the realization of these credits, is not probable, avaluation allowance is recorded.
Deferred tax assets and liabilities are offset if a legally enforceable right exists to set off current tax assets against current tax liabilities and they relate toincome taxes levied by the same tax authority on the same taxable entity. Deferred tax assets and liabilities must be measured by rates that are expected to be applicable for the period when the assets are realized and liabilitiessettled.
3.16. Accounts payable and trade accounts payable : are initially recognized at fair value plus any accrued charges, monetary and exchange variations incurredthrough the balance sheet date.
3.17. Provision for tax, civil and labor risks and contingent liabilities : are recognized when the Company has a present obligation, formalized or not, as a result of apast event, it is probable that an outflow of resources will be required to settle the obligation and its amount can be reliably estimated.
The Company is part of various lawsuits, including, tax, labor and civil claims. The assessment of the likelihood of an unfavorable outcome in these lawsuitsincludes the analysis of the available evidence, the hierarchy of the laws, available former court decisions, as well as the most recent court decisions and theirimportance to the Brazilian legal system, as well as the opinion of external legal counsel. The provisions are reviewed and adjusted to reflect changes in thecircumstances, such as the applicable statute of limitation, conclusions of tax inspections or additional exposures identified based on new claims or courtdecisions.
A contingent liability recognized in a business combination is initially measured at fair value and subsequently measured at the higher of:
F-20
BRF S.A.
Notes to Consolidated Financial Statements
Years ended December 31, 2016, 2015 and 2014(Amounts expressed in millions of Brazilian Reais, unless otherwise stated)
· the amount that would be recognized in accordance with the accounting policy for the provisions above that comply with IAS 37; or
· the amount initially recognized less, if appropriate, cumulative amortization recognized in accordance with IAS 18.
As a result of the business combinations with Sadia, Avex and Dánica group the Company recognized contingent liabilities related to tax, civil and labor claims.
3.18. Leases : lease transactions in which the risks and rewards of ownership are substantially transferred to the Company are classified as finance leases. Whenthere is no significant transfer of the risks and rewards of ownership, lease transactions are classified as operating leases.
Finance lease agreements are recognized in property, plant and equipment and in liabilities at the lower of the present value of the minimum future paymentsof the agreement and the fair value of the asset, including, when applicable, the initial direct costs incurred in the transaction. The amounts recorded inproperty, plant and equipment are depreciated and the underlying interest is recorded in the statement of income in accordance with the terms of the leaseagreement. Operating lease agreements are recognized as expenses throughout the lease terms.
3.19. Share based payments : the Company provides share based payments for its executives, which are settled with Company shares. The Company adopts theprovisions of IFRS 2, recognizing as an expense, on a straight-line basis, the fair value of the options granted, over the length of service required by the stockoptions plan, with a corresponding entry to equity. The accumulated expense recognized reflects the acquired vesting period and the Company's best estimateof the number of shares to be acquired. The expense or income arising from the movement during the year is recognized in the statement of income under other operating expense or income. Noexpense is recognized for options that have not completed their vesting period. The dilution effect of outstanding options is reflected as additional dilution in the calculation of diluted earnings per share.
3.20. Pension and other post-employment plans : the Company sponsors four supplementary defined benefit and defined contribution plans, as well as other post-
employment benefits, for those, an actuarial appraisal is annually prepared by an independent actuary. The costing of defined benefits is establishedseparately for each plan using the projected unit credit method. The measurements comprise the actuarial gains and losses, the effect of a limit on contributions and yields on plan contributions and are recognized in thebalance sheet with a contra entry in other comprehensive income when incurred. These measurements are not reclassified to statement of income insubsequent periods.
F-21
BRF S.A.
Notes to Consolidated Financial Statements
Years ended December 31, 2016, 2015 and 2014(Amounts expressed in millions of Brazilian Reais, unless otherwise stated)
The Company recognizes the net defined benefit asset, when:
· controls a resource and has the ability to use the surplus to generate future benefits;
· the control is a result of past events; and
· the future economic benefits are available to the Company in the form of a reduction in future contributions or a cash refund, either directly to theCompany or indirectly to another deficitary plan. The asset ceiling is the present value of those future benefits.
The past service cost is recognized in the statement of income at the earliest of the following dates:
· when the plan amendment or curtailment occurs, or
· when the Company recognizes related restructuring costs. The past service cost and net interest on net defined benefit liability or asset are recognized in the statement of income within other operating expense orincome.
3.21. Earnings per share : basic earnings per share are calculated by dividing the net profit attributable to the holders of ordinary shares of the Company by theweighted average number of ordinary shares during the year. Diluted earnings per share are calculated by dividing the net profit attributable to the holders ofordinary shares of the Company by the weighted average number of ordinary shares during the year, plus the weighted average number of ordinary sharesthat would be issued when converting all dilutive potential ordinary shares into ordinary shares.
3.22. Determination of income : results from operations are recorded on an accrual basis. 3.23. Revenue recognition : revenues comprise of the fair value of consideration received or receivable by the sale of products, net of taxes, returns, rebates and
discounts.
Revenues are recognized when the significant risks and rewards of ownership of the goods have passed to the buyer.
F-22
BRF S.A.
Notes to Consolidated Financial Statements
Years ended December 31, 2016, 2015 and 2014(Amounts expressed in millions of Brazilian Reais, unless otherwise stated)
The Company has incentive programs and sales discounts, which are accounted for as deductions from sales or selling expenses. These programs mayinclude discounts to customers for a good sales performance based on volumes and marketing actions carried out at the sales points.
3.24. Employee and management profit sharing : employees are entitled to profit sharing based on certain targets agreed upon on an annual basis, whereasmanagers are entitled to profit sharing based on the provisions of the bylaws, proposed by the Board of Directors and approved by the shareholders. The profitsharing amount is recognized in the statement of income for the period in which the targets are attained.
3.25. Financial income : include interest earnings on amounts invested (including available for sale financial assets), dividend income (except for dividends receivedfrom equity investees), gains on disposal of available for sale financial assets, changes in fair value of financial assets measured at fair value through incomeand gains on hedging instruments that are recognized in income. Interest income is recognized through the effective interest method.
3.26. Grants and government assistance : government subsidies are recognized at fair value when there is reasonable assurance that the conditions established
are met and related benefits will be received. The tax incentives used to reduce sales taxes are transferred from retained earnings to reserve of tax incentivescomponent of shareholders’ equity.
3.27. Dividends and interest on shareholders’ equity : the proposal for payment of dividends and interest on shareholders’ equity made by the Company’s
Management, which is within the portion equivalent to the mandatory minimum dividend, is recorded in current liabilities, as a legal obligation provided for inthe bylaws; on the other hand, the dividends that exceed the mandatory minimum dividend, declared by management before the end of the accounting periodcovered by the consolidated financial statements, not yet approved by the shareholders, is recorded as additional dividend proposed in shareholders’ equity.
For financial statement presentation purposes, interest on shareholders’ equity is stated as an allocation of income directly in shareholders’ equity.
3.28. Transactions and balances in foreign currency : transactions in foreign currency are translated into Brazilian Reais (the Company's functional currency) using
the exchange rates at the transaction dates. Balance sheet accounts in foreign currency are translated using the exchange rates at the date of the financialstatements and the gains or losses on foreign exchange variation are recognized as financial income or expense.
F-23
BRF S.A.
Notes to Consolidated Financial Statements
Years ended December 31, 2016, 2015 and 2014(Amounts expressed in millions of Brazilian Reais, unless otherwise stated)
The exchange rates in Brazilian Reais effective at the balance sheet dates were as follows:
Exchange rate at the balance sheet date 12.31.16 12.31.15
Bath (THB) 0.0911 0.1083Kwait Dinar (KWD) 10.6751 12.8701Dirham (AED) 0.8875 1.0631Singapore Dollar (SGD) 2.2572 2.7574U.S. Dollar (US$ or USD) 3.2591 3.9048Euro (€ or EUR) 3.4384 4.2504Forint Hungary (HUF) 0.0111 0.0135Yen (JPY) 0.0279 0.0324Pound Sterling (£ or GBP) 4.0364 5.7881Argentine Peso ($ or ARS) 0.2056 0.3017Chilean Peso (CLP) 0.0049 0.0055Uruguayan Peso (UYU) 0.1122 0.1306Rande Africa (ZAR) 0.2379 0.2510Renminbi Yuan China (CNY) 0.4695 0.6015Saudi Riyal (SAR) 0.8689 1.0406Qatar Riyal (QAR) 0.8951 1.0725Omani Riyal (OMR) 8.4718 10.1529Ringgit Malaysia (MYR) 0.7267 0.9102Ruble Russia (RUB) 0.0534 0.0529Won South Korea (KRW) 0.0027 0.0033
Average rates 12.31.16 12.31.15Bath (THB) 0.0989 0.0970Kwait Dinar (KWD) 11.5548 11.0694Dirham (AED) 0.9503 0.9071Singapore Dollar (SGD) 2.5261 2.4187U.S. Dollar (US$ or USD) 3.4901 3.3315Euro (€ or EUR) 3.8615 3.6929Forint Hungary (HUF) 0.0124 0.0119Yen (JPY) 0.0321 0.0275Pound Sterling (£ or GBP) 4.7464 5.0931Argentine Peso ($ or ARS) 0.2373 0.3601Chilean Peso (CLP) 0.0052 0.0051Uruguayan Peso (UYU) 0.1158 0.1217Rande Africa (ZAR) 0.2372 0.2604Renminbi Yuan China (CNY) 0.5261 0.5295Saudi Riyal (SAR) 0.9307 0.8883Qatar Riyal (QAR) 0.9586 0.9151Omani Riyal (OMR) 9.0721 8.6563Ringgit Malaysia (MYR) 0.8433 0.8504Ruble Russia (RUB) 0.0521 0.0546Won South Korea (KRW) 0.0030 0.0029
3.29. Accounting judgments, estimates and assumptions : as mentioned in note 2, in the process of applying the Company’s accounting policies, managementmade the following judgments which have a material impact on the amounts recognized in the consolidated financial statements:
F-24
BRF S.A.
Notes to Consolidated Financial Statements
Years ended December 31, 2016, 2015 and 2014(Amounts expressed in millions of Brazilian Reais, unless otherwise stated)
· fair value of financial instruments (see note 4);· annual analysis of recoverable amounts of non-financial assets (see note 5 and 19);· measurement of fair value of items related to business combinations (see note 6);· allowance for doubtful accounts (see note 9);· net realizable value provision for inventories (see note 10);· fair value of biological assets (see note 11);· annual analysis of recoverable amounts of taxes (see note 12 and 14);· useful lives of property, plant and equipment and intangible assets (see note 18 and 19);· share-based payment transactions (see note 25);· pension and post-employment plans (see note 26);· provision for tax, civil and labor risks (see note 27); e· definition of the moment when significant risks and rewards of ownership are transferred in recognizing revenues.
The Company reviews the estimates and underlying assumptions used in its accounting estimates on a quarterly basis. Revisions to accounting estimates arerecognized in the period in each the estimates are revised.
4. FINANCIAL INSTRUMENTS AND RISK MANAGEMENT 4.1. Overview In the normal course of its business, the Company is exposed to credit, liquidity and market risks, which are actively managed in conformity to the Financial RiskManagement Policy and Strategy Papers (this set called hereafter as “Risk Policy”) and internal guidelines subject to such policy. The Risk Policy is under the management of the Board of Directors, Risk Management Committee and Financial Risk Management, with clear and defined roles andresponsibilities, as follows:
· The Board of Directors is responsible for approving the Risk Policy and defining the limits of tolerance of the different risks identified as acceptable forthe Company on behalf of its shareholders. The current risk policy was reviewed and approved on November 26, 2015, with maturity of two years, andis automatically renewed once for the same period;
F-25
BRF S.A.
Notes to Consolidated Financial Statements
Years ended December 31, 2016, 2015 and 2014(Amounts expressed in millions of Brazilian Reais, unless otherwise stated)
· The Financial Risk Management Committee is in charge of the execution of the Risk Policy, which comprises the supervision of the risk management
process, planning and verification of the impacts of the decisions implemented, as well as the evaluation and approval of hedging strategies andmonitoring the risk exposure levels to ensure compliance with Risk Policy; and
· The Risk Management area has as a crucial role in monitoring, evaluating and reporting of the financial risks taken by the Company.
The Risk Policy does not authorize the Company’s management to contract leveraged derivative transactions and determines that any individual hedge operations(notional amount) must not exceed 2.5% of the Company’s shareholders’ equity. a. Credit risk management The Company is subject to the credit risk related to trade accounts receivable, financial investments and derivative contracts, as follows: Credit risk associated with trade accounts receivable is actively managed through the use of specific systems. Furthermore, it should be noted the diversification ofthe customer portfolio and the concession of credit to customers with good financial and operational conditions. The Company does not usually require collateral forsales to customer, and has a contracted credit insurance policy for specific markets; and
Credit risk associated with financial investments and derivative contracts is mitigated by the Company’s policy of working with prime institutions. On December 31, 2016, the Company had financial investments over R$100.0 at the following financial institutions: Banco Bradesco, Banco do Brasil, Banco HSBC,Banco Itaú, Banco Safra, Banco Santander, Caixa Econômica Federal, Deutsche Bank and JP Morgan. The Company also held derivative contracts with the following financial institutions: Banco BNP, Banco Bradesco, Banco do Brasil, Banco HSBC, Banco Itaú, BancoSantander, Banco Votorantim, Citibank, Deutsche Bank, Ing Bank, Merrill Lynch and Rabobank. b. Liquidity risk management Liquidity risk management aims to reduce the impacts caused by events which may affect the Company’s cash flow. Thus, the Company utilizes the following metrics:
· Cash Flow at Risk (“CFaR”), which aims to statistically estimates the cash flows for the next twelve months and the Company’s liquidity exposure. TheCompany determined that the minimum cash available should be equivalent mainly to the average monthly billing and EBITDA for the last twelve-monthperiod; and
F-26
BRF S.A.
Notes to Consolidated Financial Statements
Years ended December 31, 2016, 2015 and 2014(Amounts expressed in millions of Brazilian Reais, unless otherwise stated)
· Value at Risk ("VaR") is used for derivative transactions that require payments of periodic adjustments. Currently, the Company holds onlyBM&FBOVESPA operations with daily adjustments and in order to monitor them, such methodology is utilized, which statistically measures potentialmaximum adjustments to be paid at intervals of 1 to 21-days.
The Company maintains its leverage levels in order to avoid any impact to its ability to settle commitments and obligations. As a guideline, the majority of the debtshould be in long term. On December 31, 2016, the long term debt portion accounted for 82.9% (82.7% as of December 31, 2015) of the total outstanding debt withan average term greater than 5 years. The table below summarizes the commitments and contractual obligations that may impact the Company’s liquidity: 12.31.16
Book value
Cash flowcontracted 2017 2018 2019 2020 2021
After 5 years
Non derivative financial liabilities Loans and financing 9,965.8 12,475.1 3,378.2 2,946.6 3,588.9 1,519.0 10.2 1,032.2BRF bonds 6,588.3 8,435.8 289.2 769.8 250.5 250.5 250.5 6,625.3BFF bonds 287.2 351.7 20.3 20.3 20.3 290.8 - -Sadia bonds 370.0 380.1 380.1 - - - - -BRF GMBH bonds 1,606.6 2,338.5 70.9 70.9 70.9 70.9 70.9 1,984.0Quickfood bonds 144.5 131.9 39.8 2.5 16.1 36.4 12.2 24.9Trade accounts payable 5,839.8 5,839.8 5,839.8 - - - - -Supply chain finance 1,335.6 1,335.6 1,335.6 - - - - -Financial lease 216.8 330.0 75.5 56.0 47.9 33.1 24.5 92.9Operational lease - 586.2 345.3 103.7 46.7 23.2 17.8 49.5
Derivative financial liabilities Financial instruments designated as cashflow hedge
Interest rate and exchange rate derivatives 184.2 178.9 13.4 165.1 0.4 - - -Currency derivatives (NDF) 1.8 (7.0) (7.0) - - - - -Deliverable forwards contracts 0.3 0.3 0.3 - - - - -Currency derivatives (options) 35.1 - - - - - - -Commodities derivatives (NDF) 1.4 1.4 1.4 - - - - -Commodities derivatives (Future) - - - - - - - -
Financial instruments not designated ascash flow hedge
Currency derivatives (NDF) 83.0 129.4 129.4 - - - - -Currency derivatives (Future) 5.2 5.2 5.2 - - - - -Interest rate and exchange rate derivatives 218.5 242.8 242.8 - - - - -
c. Interest rate risk management Interest rates risk is the one the Company incurs in economic losses resulting from changes in these rates, which could affect its assets and liabilities. The Company’s Risk Policy does not restrict exposure to different interest rates, neither establishes limits for fixed or floating rates. However, the Companycontinually monitors the market interest rates, in order to evaluate any need to enter into hedging transaction to protect from the exposure to fluctuation of such ratesand manage the mismatch between its financial investments and debts. In these transactions the Company enters into contracts that exchange floating rate for fixedrate or vice-versa. Such transactions were designated by the Company as cash flow hedge.
F-27
BRF S.A.
Notes to Consolidated Financial Statements
Years ended December 31, 2016, 2015 and 2014(Amounts expressed in millions of Brazilian Reais, unless otherwise stated)
The Company’s indebtedness is essentially tied to the London Interbank Offered rate ("LIBOR"), fixed coupon (“R$ and USD”), Long Term Interest Rate ("TJLP") andMonetary Unit of the Bank National Economic and Social Development ("UMBNDES") rates. In case of adverse changes in the market that result in LIBOR, TJLP andUMBNDES hikes, the cost of the floating indebtedness rises and on the other hand, the cost of the fixed indebtedness decreases in relative terms. With regards to the Company's marketable securities, the main index is the Interbank Deposit Certificate ("CDI") for investments in Brazil and fixed coupon (“USD”)for investments in the International market. d. Foreign exchange risk management Foreign exchange risk is the one related to variations of foreign exchange rates that may cause the Company to incur unexpected losses, leading to a reduction ofassets or an increase in liabilities. The Risk Policy is intended to protect the Company's results from these variations, in order to:
· Protect operating revenues and costs that are related to transactions arising from commercial activities, such as estimated exports and purchases ofraw materials, utilizing hedging instruments, that is, to protect its future cash flow denominated in foreign currency; and
· Manage assets and liabilities denominated in foreign currencies in order to protect the balance sheet of the Company, through the use of over-the-counter and futures transactions.
The Company’s consolidated financial statements are mainly impacted by the following currencies: Argentine Peso, Baht, Yen, Dirham, Euro, Kwait Dinar, PoundSterling, Riyal Saudi Arabia, Riyal Qatar and U.S. Dollar. Assets and liabilities denominated in foreign currency are as follows:
F-28
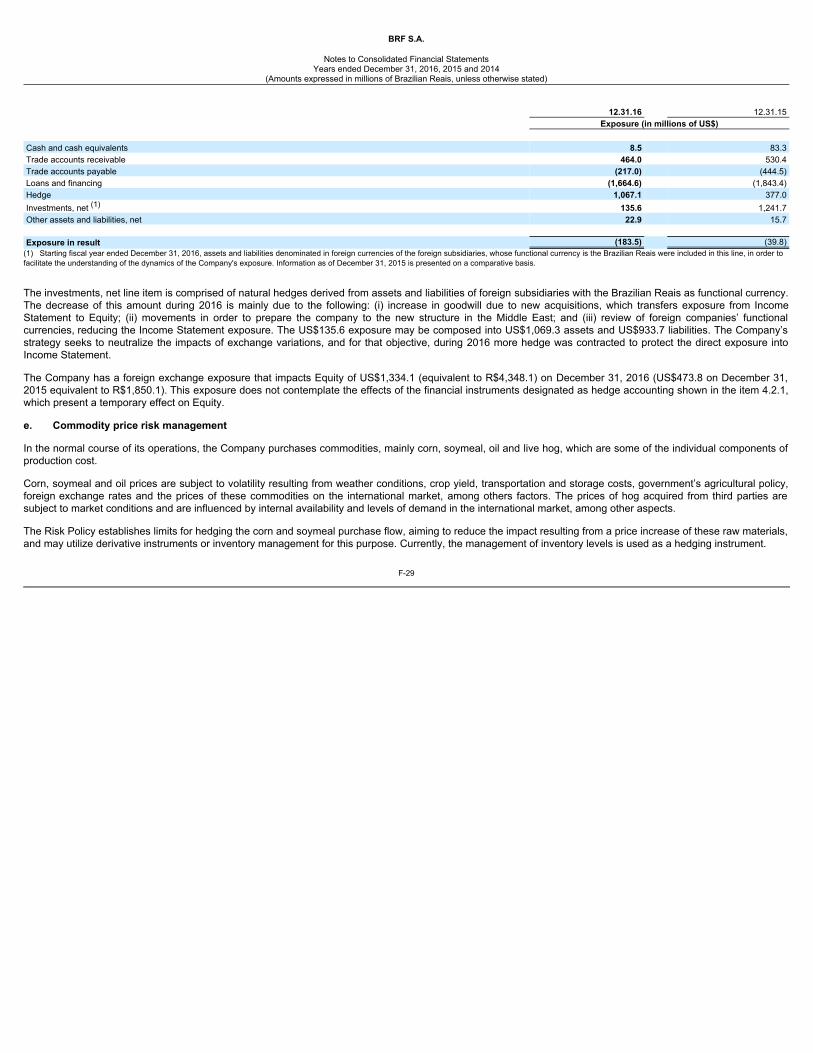
BRF S.A.
Notes to Consolidated Financial Statements
Years ended December 31, 2016, 2015 and 2014(Amounts expressed in millions of Brazilian Reais, unless otherwise stated)
12.31.16 12.31.15 Exposure (in millions of US$) Cash and cash equivalents 8.5 83.3Trade accounts receivable 464.0 530.4Trade accounts payable (217.0) (444.5)Loans and financing (1,664.6) (1,843.4)Hedge 1,067.1 377.0Investments, net (1) 135.6 1,241.7Other assets and liabilities, net 22.9 15.7 Exposure in result (183.5) (39.8)
(1) Starting fiscal year ended December 31, 2016, assets and liabilities denominated in foreign currencies of the foreign subsidiaries, whose functional currency is the Brazilian Reais were included in this line, in order tofacilitate the understanding of the dynamics of the Company's exposure. Information as of December 31, 2015 is presented on a comparative basis.
The investments, net line item is comprised of natural hedges derived from assets and liabilities of foreign subsidiaries with the Brazilian Reais as functional currency.The decrease of this amount during 2016 is mainly due to the following: (i) increase in goodwill due to new acquisitions, which transfers exposure from IncomeStatement to Equity; (ii) movements in order to prepare the company to the new structure in the Middle East; and (iii) review of foreign companies’ functionalcurrencies, reducing the Income Statement exposure. The US$135.6 exposure may be composed into US$1,069.3 assets and US$933.7 liabilities. The Company’sstrategy seeks to neutralize the impacts of exchange variations, and for that objective, during 2016 more hedge was contracted to protect the direct exposure intoIncome Statement. The Company has a foreign exchange exposure that impacts Equity of US$1,334.1 (equivalent to R$4,348.1) on December 31, 2016 (US$473.8 on December 31,2015 equivalent to R$1,850.1). This exposure does not contemplate the effects of the financial instruments designated as hedge accounting shown in the item 4.2.1,which present a temporary effect on Equity. e. Commodity price risk management In the normal course of its operations, the Company purchases commodities, mainly corn, soymeal, oil and live hog, which are some of the individual components ofproduction cost. Corn, soymeal and oil prices are subject to volatility resulting from weather conditions, crop yield, transportation and storage costs, government’s agricultural policy,foreign exchange rates and the prices of these commodities on the international market, among others factors. The prices of hog acquired from third parties aresubject to market conditions and are influenced by internal availability and levels of demand in the international market, among other aspects. The Risk Policy establishes limits for hedging the corn and soymeal purchase flow, aiming to reduce the impact resulting from a price increase of these raw materials,and may utilize derivative instruments or inventory management for this purpose. Currently, the management of inventory levels is used as a hedging instrument.
F-29
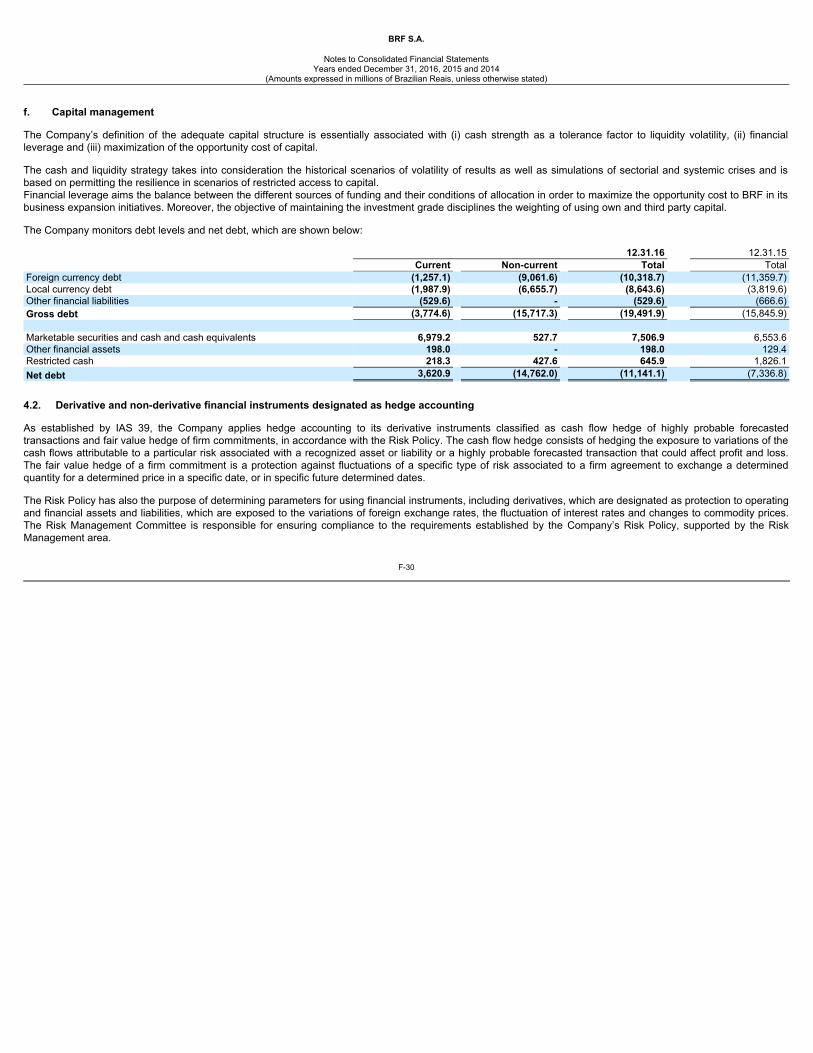
BRF S.A.
Notes to Consolidated Financial Statements
Years ended December 31, 2016, 2015 and 2014(Amounts expressed in millions of Brazilian Reais, unless otherwise stated)
f. Capital management The Company’s definition of the adequate capital structure is essentially associated with (i) cash strength as a tolerance factor to liquidity volatility, (ii) financialleverage and (iii) maximization of the opportunity cost of capital. The cash and liquidity strategy takes into consideration the historical scenarios of volatility of results as well as simulations of sectorial and systemic crises and isbased on permitting the resilience in scenarios of restricted access to capital.Financial leverage aims the balance between the different sources of funding and their conditions of allocation in order to maximize the opportunity cost to BRF in itsbusiness expansion initiatives. Moreover, the objective of maintaining the investment grade disciplines the weighting of using own and third party capital. The Company monitors debt levels and net debt, which are shown below: 12.31.16 12.31.15 Current Non-current Total TotalForeign currency debt (1,257.1) (9,061.6) (10,318.7) (11,359.7)Local currency debt (1,987.9) (6,655.7) (8,643.6) (3,819.6)Other financial liabilities (529.6) - (529.6) (666.6)Gross debt (3,774.6) (15,717.3) (19,491.9) (15,845.9) Marketable securities and cash and cash equivalents 6,979.2 527.7 7,506.9 6,553.6Other financial assets 198.0 - 198.0 129.4Restricted cash 218.3 427.6 645.9 1,826.1Net debt 3,620.9 (14,762.0) (11,141.1) (7,336.8)
4.2. Derivative and non-derivative financial instruments designated as hedge accounting As established by IAS 39, the Company applies hedge accounting to its derivative instruments classified as cash flow hedge of highly probable forecastedtransactions and fair value hedge of firm commitments, in accordance with the Risk Policy. The cash flow hedge consists of hedging the exposure to variations of thecash flows attributable to a particular risk associated with a recognized asset or liability or a highly probable forecasted transaction that could affect profit and loss.The fair value hedge of a firm commitment is a protection against fluctuations of a specific type of risk associated to a firm agreement to exchange a determinedquantity for a determined price in a specific date, or in specific future determined dates. The Risk Policy has also the purpose of determining parameters for using financial instruments, including derivatives, which are designated as protection to operatingand financial assets and liabilities, which are exposed to the variations of foreign exchange rates, the fluctuation of interest rates and changes to commodity prices.The Risk Management Committee is responsible for ensuring compliance to the requirements established by the Company’s Risk Policy, supported by the RiskManagement area.
F-30
BRF S.A.
Notes to Consolidated Financial Statements
Years ended December 31, 2016, 2015 and 2014(Amounts expressed in millions of Brazilian Reais, unless otherwise stated)
The Company has formally designated its operations for hedge accounting treatment for the derivative financial instruments to protect cash flows and exportrevenues by documenting:
· The relationship of the hedge;· The objective and risk management strategy of the Company to enter into a hedge transaction;· The identification of the financial instrument;· The hedge object or transaction;· The nature of the risk to be hedged;· The description of the hedge relationship;· The demonstration of the correlation between the hedge transaction and the hedge object, when applicable; and· The prospective demonstration of the effectiveness of the hedge.
The transactions for which the Company has designated cash flow hedge accounting are highly probable and present an exposure to variations in cash flow thatcould affect profit and loss. The transactions for which the Company has designated fair value hedge accounting are firm commitments that present an exposure tovariations in the fair value that could affect profit and loss. The prospective and retrospective effectiveness tests are prepared at each period end, following the criteria demonstrated below: The prospective test is based on the comparison between the critical terms of the hedging instruments and of the hedged items. The hedged items (future monthlyexport sales or firm commitments) and the hedge instruments have the same critical terms, as follows:
· Both fair values change due to the exchange rate or commodities prices variation (spot or forward rate method);· Their notional amounts are similar; and· Their maturities are identical, both the hedged item and the settlement of the financial instrument will occur at the same period.
The retrospective test is based on the analysis of the coverage ratio. This ratio compares the fair value variation accumulated since the inception of the hedged item(date of hedge designation) with the accumulated variation of the derivative and non-derivative financial instrument since its inception.
F-31
BRF S.A.
Notes to Consolidated Financial Statements
Years ended December 31, 2016, 2015 and 2014(Amounts expressed in millions of Brazilian Reais, unless otherwise stated)
The Company, within its hedge accounting strategy, utilizes the following financial instruments: a. Non-deliverable forwards – NDF Non-deliverable forward contract is the future commitment to purchase or sell certain currencies on a certain date in the future for a predetermined price. Thiscontract does not require physical settlement of contracted positions, but the financial settlement of the difference between the settlement price and thepredetermined price of the contract. b. Interest rate and currency swap Similar to a non-deliverable forward contract, the swap is the future commitment to buy or sell certain interest rates or currency at a specified date in the future for apredetermined price. The particularity in this type of transaction is the possibility to exchange cash flows on various dates. The Company contracts swaps that do notrequire the physical settlement of contracted positions, but the financial settlement of the difference between the settlement price and the price established in thecontract. c. Options A put option gives the holder (option holder) the right to buy an asset at a certain price (strike) at certain future date (the exercise date). A call option gives the holderthe right to sell an asset at a certain price at a certain future date. In addition, there is a possibility of buying (premium disbursement, with rights) or selling (premiumreceiving, with obligations). d. Fixed exchange rate Fixed exchange rate is a non-derivative financial instrument contracted from financial institutions that allows the definition of a future rate to internalization ofresources arising from foreign activities. Contractually, there is the requirement of submission of export invoices to prove the nature of resources which will beinternalized trough closing of exchange rate. Such contract has similar characteristics of a non-deliverable forward derivative contract because it determines, at itsinception, a future exchange rate. Nevertheless, the contract requires a physical settlement of the contracted positions. e. Export prepayments – PPEs The Company utilizes the exchange rates variation of export prepayments contracts (“PPEs”) as a hedge instrument for the highly probable future sales in foreigncurrency.
F-32
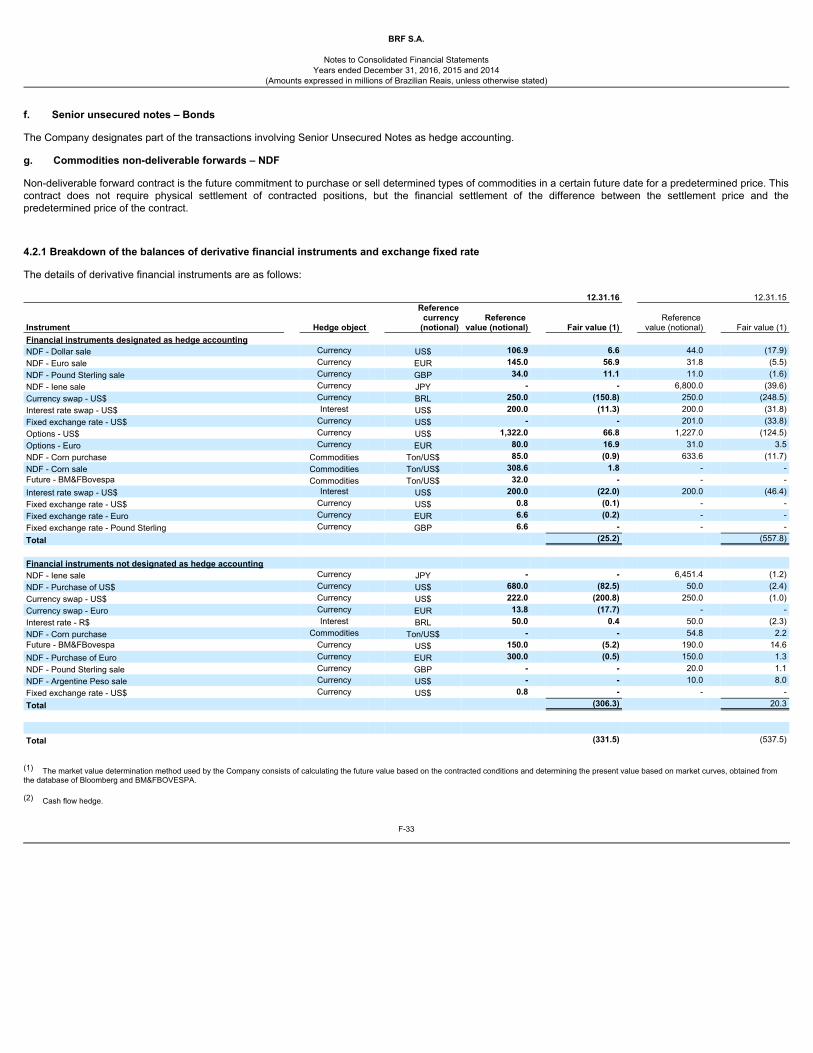
BRF S.A.
Notes to Consolidated Financial Statements
Years ended December 31, 2016, 2015 and 2014(Amounts expressed in millions of Brazilian Reais, unless otherwise stated)
f. Senior unsecured notes – Bonds The Company designates part of the transactions involving Senior Unsecured Notes as hedge accounting. g. Commodities non-deliverable forwards – NDF Non-deliverable forward contract is the future commitment to purchase or sell determined types of commodities in a certain future date for a predetermined price. Thiscontract does not require physical settlement of contracted positions, but the financial settlement of the difference between the settlement price and thepredetermined price of the contract. 4.2.1 Breakdown of the balances of derivative financial instruments and exchange fixed rate The details of derivative financial instruments are as follows:
12.31.16 12.31.15
Instrument Hedge object
Referencecurrency
(notional)Reference
value (notional) Fair value (1) Reference
value (notional) Fair value (1)Financial instruments designated as hedge accounting NDF - Dollar sale Currency US$ 106.9 6.6 44.0 (17.9)NDF - Euro sale Currency EUR 145.0 56.9 31.8 (5.5)NDF - Pound Sterling sale Currency GBP 34.0 11.1 11.0 (1.6)NDF - Iene sale Currency JPY - - 6,800.0 (39.6)Currency swap - US$ Currency BRL 250.0 (150.8) 250.0 (248.5)Interest rate swap - US$ Interest US$ 200.0 (11.3) 200.0 (31.8)Fixed exchange rate - US$ Currency US$ - - 201.0 (33.8)Options - US$ Currency US$ 1,322.0 66.8 1,227.0 (124.5)Options - Euro Currency EUR 80.0 16.9 31.0 3.5NDF - Corn purchase Commodities Ton/US$ 85.0 (0.9) 633.6 (11.7)NDF - Corn sale Commodities Ton/US$ 308.6 1.8 - -Future - BM&FBovespa Commodities Ton/US$ 32.0 - - -Interest rate swap - US$ Interest US$ 200.0 (22.0) 200.0 (46.4)Fixed exchange rate - US$ Currency US$ 0.8 (0.1) - -Fixed exchange rate - Euro Currency EUR 6.6 (0.2) - -Fixed exchange rate - Pound Sterling Currency GBP 6.6 - - -Total (25.2) (557.8) Financial instruments not designated as hedge accounting NDF - Iene sale Currency JPY - - 6,451.4 (1.2)NDF - Purchase of US$ Currency US$ 680.0 (82.5) 50.0 (2.4)Currency swap - US$ Currency US$ 222.0 (200.8) 250.0 (1.0)Currency swap - Euro Currency EUR 13.8 (17.7) - -Interest rate - R$ Interest BRL 50.0 0.4 50.0 (2.3)NDF - Corn purchase Commodities Ton/US$ - - 54.8 2.2Future - BM&FBovespa Currency US$ 150.0 (5.2) 190.0 14.6NDF - Purchase of Euro Currency EUR 300.0 (0.5) 150.0 1.3NDF - Pound Sterling sale Currency GBP - - 20.0 1.1NDF - Argentine Peso sale Currency US$ - - 10.0 8.0Fixed exchange rate - US$ Currency US$ 0.8 - - -Total (306.3) 20.3 Total (331.5) (537.5)
(1) The market value determination method used by the Company consists of calculating the future value based on the contracted conditions and determining the present value based on market curves, obtained fromthe database of Bloomberg and BM&FBOVESPA.
(2) Cash flow hedge.
F-33
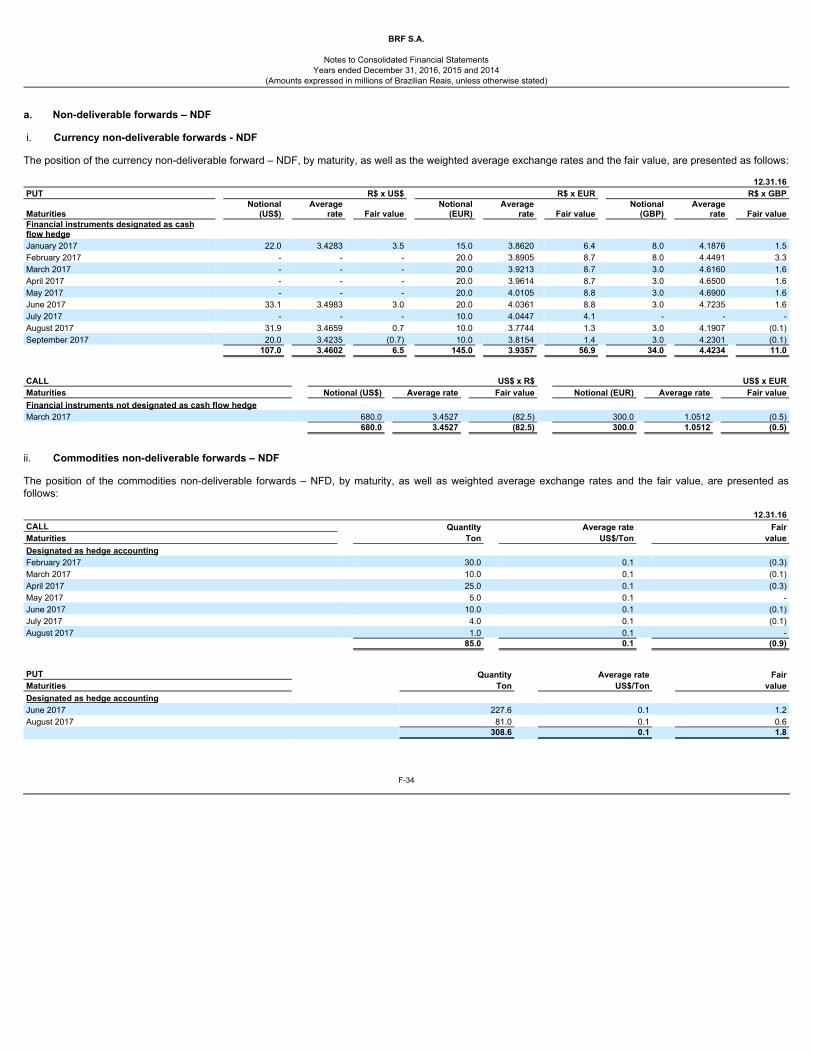
BRF S.A.
Notes to Consolidated Financial Statements
Years ended December 31, 2016, 2015 and 2014(Amounts expressed in millions of Brazilian Reais, unless otherwise stated)
a. Non-deliverable forwards – NDF
i. Currency non-deliverable forwards - NDF The position of the currency non-deliverable forward – NDF, by maturity, as well as the weighted average exchange rates and the fair value, are presented as follows:
12.31.16PUT R$ x US$ R$ x EUR R$ x GBP
Maturities Notional
(US$) Average
rate Fair value Notional
(EUR) Average
rate Fair value Notional
(GBP) Average
rate Fair valueFinancial instruments designated as cashflow hedge January 2017 22.0 3.4283 3.5 15.0 3.8620 6.4 8.0 4.1876 1.5February 2017 - - - 20.0 3.8905 8.7 8.0 4.4491 3.3March 2017 - - - 20.0 3.9213 8.7 3.0 4.6160 1.6April 2017 - - - 20.0 3.9614 8.7 3.0 4.6500 1.6May 2017 - - - 20.0 4.0105 8.8 3.0 4.6900 1.6June 2017 33.1 3.4983 3.0 20.0 4.0361 8.8 3.0 4.7235 1.6July 2017 - - - 10.0 4.0447 4.1 - - -August 2017 31.9 3.4659 0.7 10.0 3.7744 1.3 3.0 4.1907 (0.1)September 2017 20.0 3.4235 (0.7) 10.0 3.8154 1.4 3.0 4.2301 (0.1) 107.0 3.4602 6.5 145.0 3.9357 56.9 34.0 4.4234 11.0
CALL US$ x R$ US$ x EURMaturities Notional (US$) Average rate Fair value Notional (EUR) Average rate Fair valueFinancial instruments not designated as cash flow hedge March 2017 680.0 3.4527 (82.5) 300.0 1.0512 (0.5) 680.0 3.4527 (82.5) 300.0 1.0512 (0.5)
ii. Commodities non-deliverable forwards – NDF The position of the commodities non-deliverable forwards – NFD, by maturity, as well as weighted average exchange rates and the fair value, are presented asfollows:
12.31.16CALL Quantity Average rate FairMaturities Ton US$/Ton valueDesignated as hedge accounting February 2017 30.0 0.1 (0.3)March 2017 10.0 0.1 (0.1)April 2017 25.0 0.1 (0.3)May 2017 5.0 0.1 -June 2017 10.0 0.1 (0.1)July 2017 4.0 0.1 (0.1)August 2017 1.0 0.1 - 85.0 0.1 (0.9)
PUT Quantity Average rate FairMaturities Ton US$/Ton valueDesignated as hedge accounting June 2017 227.6 0.1 1.2August 2017 81.0 0.1 0.6 308.6 0.1 1.8
F-34
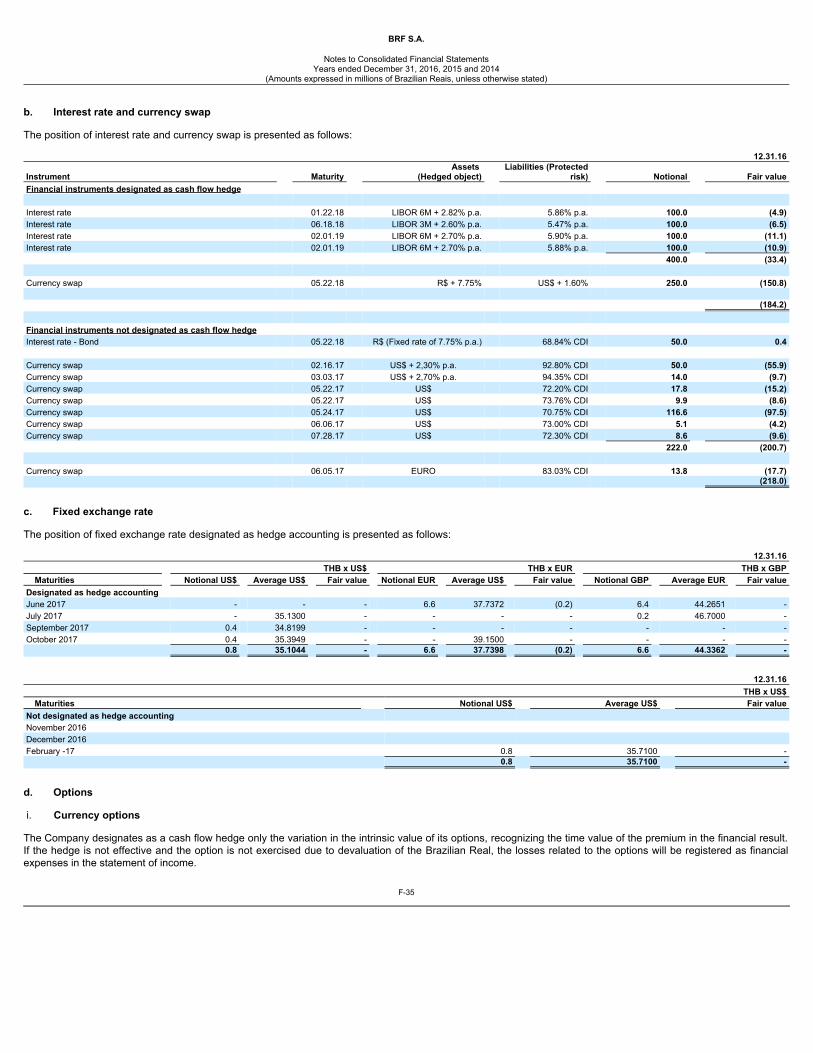
BRF S.A.
Notes to Consolidated Financial Statements
Years ended December 31, 2016, 2015 and 2014(Amounts expressed in millions of Brazilian Reais, unless otherwise stated)
b. Interest rate and currency swap The position of interest rate and currency swap is presented as follows:
12.31.16
Instrument Maturity Assets
(Hedged object) Liabilities (Protected
risk) Notional Fair valueFinancial instruments designated as cash flow hedge Interest rate 01.22.18 LIBOR 6M + 2.82% p.a. 5.86% p.a. 100.0 (4.9)Interest rate 06.18.18 LIBOR 3M + 2.60% p.a. 5.47% p.a. 100.0 (6.5)Interest rate 02.01.19 LIBOR 6M + 2.70% p.a. 5.90% p.a. 100.0 (11.1)Interest rate 02.01.19 LIBOR 6M + 2.70% p.a. 5.88% p.a. 100.0 (10.9) 400.0 (33.4) Currency swap 05.22.18 R$ + 7.75% US$ + 1.60% 250.0 (150.8) (184.2) Financial instruments not designated as cash flow hedge Interest rate - Bond 05.22.18 R$ (Fixed rate of 7.75% p.a.) 68.84% CDI 50.0 0.4 Currency swap 02.16.17 US$ + 2,30% p.a. 92.80% CDI 50.0 (55.9)Currency swap 03.03.17 US$ + 2,70% p.a. 94.35% CDI 14.0 (9.7)Currency swap 05.22.17 US$ 72.20% CDI 17.8 (15.2)Currency swap 05.22.17 US$ 73.76% CDI 9.9 (8.6)Currency swap 05.24.17 US$ 70.75% CDI 116.6 (97.5)Currency swap 06.06.17 US$ 73.00% CDI 5.1 (4.2)Currency swap 07.28.17 US$ 72.30% CDI 8.6 (9.6) 222.0 (200.7) Currency swap 06.05.17 EURO 83.03% CDI 13.8 (17.7) (218.0)
c. Fixed exchange rate The position of fixed exchange rate designated as hedge accounting is presented as follows:
12.31.16 THB x US$ THB x EUR THB x GBP
Maturities Notional US$ Average US$ Fair value Notional EUR Average US$ Fair value Notional GBP Average EUR Fair valueDesignated as hedge accounting June 2017 - - - 6.6 37.7372 (0.2) 6.4 44.2651 -July 2017 - 35.1300 - - - - 0.2 46.7000 -September 2017 0.4 34.8199 - - - - - - -October 2017 0.4 35.3949 - - 39.1500 - - - - 0.8 35.1044 - 6.6 37.7398 (0.2) 6.6 44.3362 -
12.31.16 THB x US$
Maturities Notional US$ Average US$ Fair valueNot designated as hedge accounting November 2016 December 2016 February -17 0.8 35.7100 - 0.8 35.7100 -
d. Options i. Currency options The Company designates as a cash flow hedge only the variation in the intrinsic value of its options, recognizing the time value of the premium in the financial result.If the hedge is not effective and the option is not exercised due to devaluation of the Brazilian Real, the losses related to the options will be registered as financialexpenses in the statement of income.
F-35
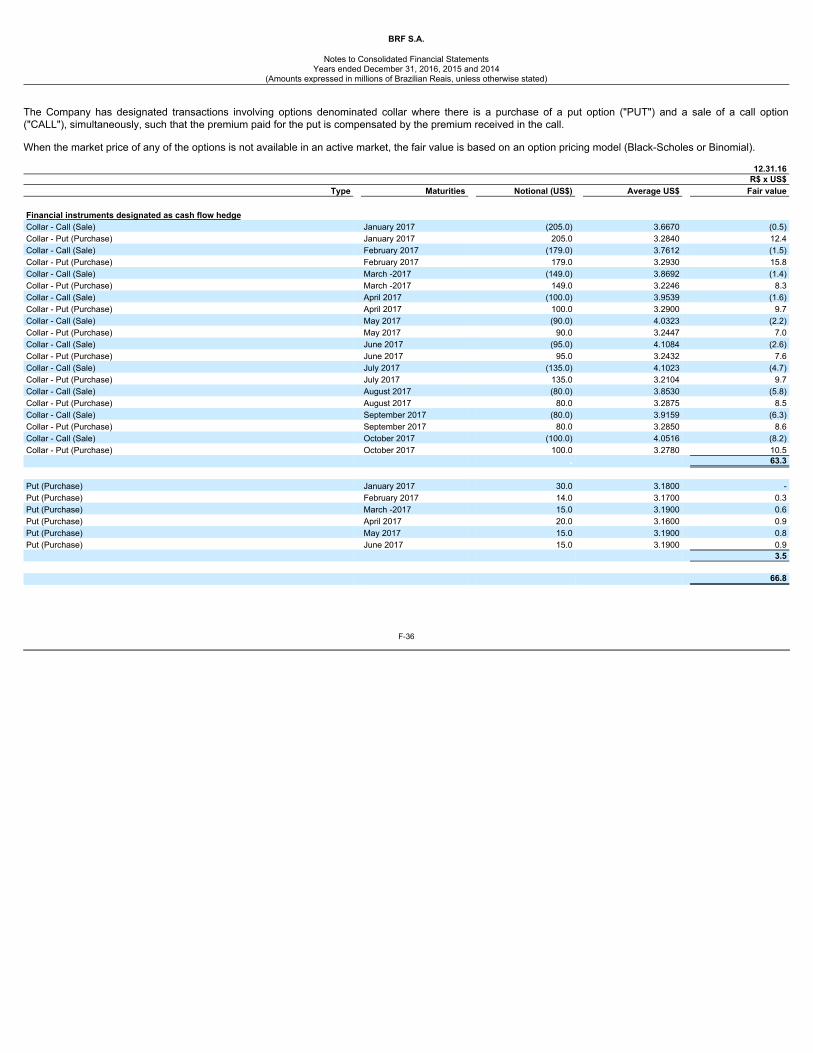
BRF S.A.
Notes to Consolidated Financial Statements
Years ended December 31, 2016, 2015 and 2014(Amounts expressed in millions of Brazilian Reais, unless otherwise stated)
The Company has designated transactions involving options denominated collar where there is a purchase of a put option ("PUT") and a sale of a call option("CALL"), simultaneously, such that the premium paid for the put is compensated by the premium received in the call. When the market price of any of the options is not available in an active market, the fair value is based on an option pricing model (Black-Scholes or Binomial).
12.31.16R$ x US$
Type Maturities Notional (US$) Average US$ Fair value Financial instruments designated as cash flow hedge Collar - Call (Sale) January 2017 (205.0) 3.6670 (0.5)Collar - Put (Purchase) January 2017 205.0 3.2840 12.4Collar - Call (Sale) February 2017 (179.0) 3.7612 (1.5)Collar - Put (Purchase) February 2017 179.0 3.2930 15.8Collar - Call (Sale) March -2017 (149.0) 3.8692 (1.4)Collar - Put (Purchase) March -2017 149.0 3.2246 8.3Collar - Call (Sale) April 2017 (100.0) 3.9539 (1.6)Collar - Put (Purchase) April 2017 100.0 3.2900 9.7Collar - Call (Sale) May 2017 (90.0) 4.0323 (2.2)Collar - Put (Purchase) May 2017 90.0 3.2447 7.0Collar - Call (Sale) June 2017 (95.0) 4.1084 (2.6)Collar - Put (Purchase) June 2017 95.0 3.2432 7.6Collar - Call (Sale) July 2017 (135.0) 4.1023 (4.7)Collar - Put (Purchase) July 2017 135.0 3.2104 9.7Collar - Call (Sale) August 2017 (80.0) 3.8530 (5.8)Collar - Put (Purchase) August 2017 80.0 3.2875 8.5Collar - Call (Sale) September 2017 (80.0) 3.9159 (6.3)Collar - Put (Purchase) September 2017 80.0 3.2850 8.6Collar - Call (Sale) October 2017 (100.0) 4.0516 (8.2)Collar - Put (Purchase) October 2017 100.0 3.2780 10.5 - 63.3 Put (Purchase) January 2017 30.0 3.1800 -Put (Purchase) February 2017 14.0 3.1700 0.3Put (Purchase) March -2017 15.0 3.1900 0.6Put (Purchase) April 2017 20.0 3.1600 0.9Put (Purchase) May 2017 15.0 3.1900 0.8Put (Purchase) June 2017 15.0 3.1900 0.9 3.5 66.8
F-36
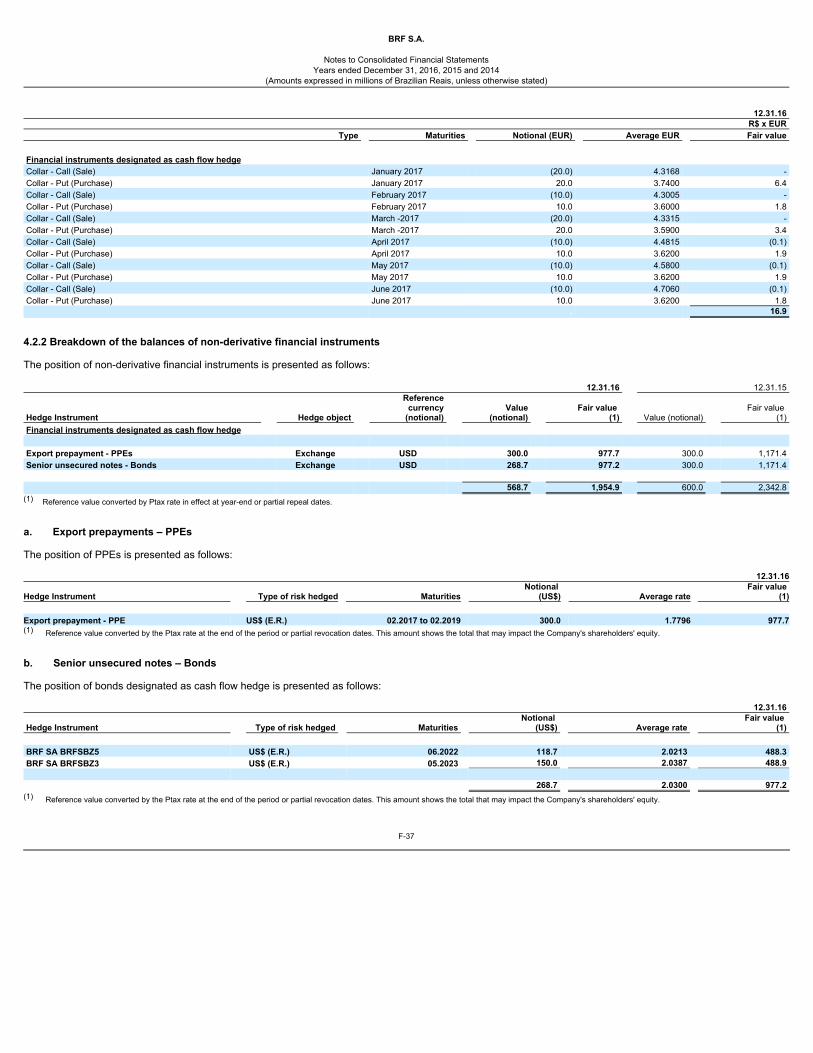
BRF S.A.
Notes to Consolidated Financial Statements
Years ended December 31, 2016, 2015 and 2014(Amounts expressed in millions of Brazilian Reais, unless otherwise stated)
12.31.16R$ x EUR
Type Maturities Notional (EUR) Average EUR Fair value Financial instruments designated as cash flow hedge Collar - Call (Sale) January 2017 (20.0) 4.3168 -Collar - Put (Purchase) January 2017 20.0 3.7400 6.4Collar - Call (Sale) February 2017 (10.0) 4.3005 -Collar - Put (Purchase) February 2017 10.0 3.6000 1.8Collar - Call (Sale) March -2017 (20.0) 4.3315 -Collar - Put (Purchase) March -2017 20.0 3.5900 3.4Collar - Call (Sale) April 2017 (10.0) 4.4815 (0.1)Collar - Put (Purchase) April 2017 10.0 3.6200 1.9Collar - Call (Sale) May 2017 (10.0) 4.5800 (0.1)Collar - Put (Purchase) May 2017 10.0 3.6200 1.9Collar - Call (Sale) June 2017 (10.0) 4.7060 (0.1)Collar - Put (Purchase) June 2017 10.0 3.6200 1.8 - 16.9
4.2.2 Breakdown of the balances of non-derivative financial instruments The position of non-derivative financial instruments is presented as follows:
12.31.16 12.31.15
Hedge Instrument Hedge object
Referencecurrency
(notional) Value
(notional) Fair value
(1) Value (notional) Fair value
(1)Financial instruments designated as cash flow hedge Export prepayment - PPEs Exchange USD 300.0 977.7 300.0 1,171.4Senior unsecured notes - Bonds Exchange USD 268.7 977.2 300.0 1,171.4 568.7 1,954.9 600.0 2,342.8
(1) Reference value converted by Ptax rate in effect at year-end or partial repeal dates.
a. Export prepayments – PPEs The position of PPEs is presented as follows:
12.31.16
Hedge Instrument Type of risk hedged Maturities Notional
(US$) Average rate Fair value
(1) Export prepayment - PPE US$ (E.R.) 02.2017 to 02.2019 300.0 1.7796 977.7(1) Reference value converted by the Ptax rate at the end of the period or partial revocation dates. This amount shows the total that may impact the Company's shareholders' equity.
b. Senior unsecured notes – Bonds The position of bonds designated as cash flow hedge is presented as follows:
12.31.16
Hedge Instrument Type of risk hedged Maturities Notional
(US$) Average rate Fair value
(1) BRF SA BRFSBZ5 US$ (E.R.) 06.2022 118.7 2.0213 488.3BRF SA BRFSBZ3 US$ (E.R.) 05.2023 150.0 2.0387 488.9 268.7 2.0300 977.2
(1) Reference value converted by the Ptax rate at the end of the period or partial revocation dates. This amount shows the total that may impact the Company's shareholders' equity.
F-37
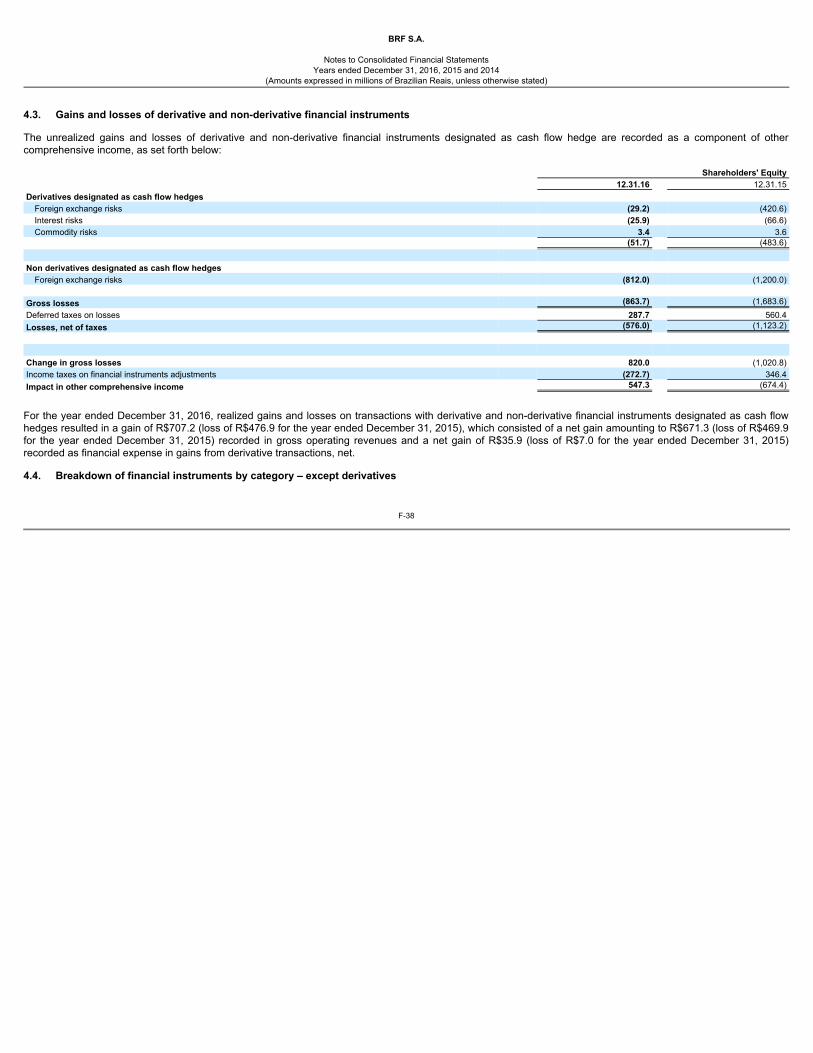
BRF S.A.
Notes to Consolidated Financial Statements
Years ended December 31, 2016, 2015 and 2014(Amounts expressed in millions of Brazilian Reais, unless otherwise stated)
4.3. Gains and losses of derivative and non-derivative financial instruments The unrealized gains and losses of derivative and non-derivative financial instruments designated as cash flow hedge are recorded as a component of othercomprehensive income, as set forth below: Shareholders' Equity 12.31.16 12.31.15Derivatives designated as cash flow hedges
Foreign exchange risks (29.2) (420.6)Interest risks (25.9) (66.6)Commodity risks 3.4 3.6
(51.7) (483.6) Non derivatives designated as cash flow hedges
Foreign exchange risks (812.0) (1,200.0) Gross losses (863.7) (1,683.6)Deferred taxes on losses 287.7 560.4Losses, net of taxes (576.0) (1,123.2) Change in gross losses 820.0 (1,020.8)Income taxes on financial instruments adjustments (272.7) 346.4Impact in other comprehensive income 547.3 (674.4)
For the year ended December 31, 2016, realized gains and losses on transactions with derivative and non-derivative financial instruments designated as cash flowhedges resulted in a gain of R$707.2 (loss of R$476.9 for the year ended December 31, 2015), which consisted of a net gain amounting to R$671.3 (loss of R$469.9for the year ended December 31, 2015) recorded in gross operating revenues and a net gain of R$35.9 (loss of R$7.0 for the year ended December 31, 2015)recorded as financial expense in gains from derivative transactions, net. 4.4. Breakdown of financial instruments by category – except derivatives
F-38
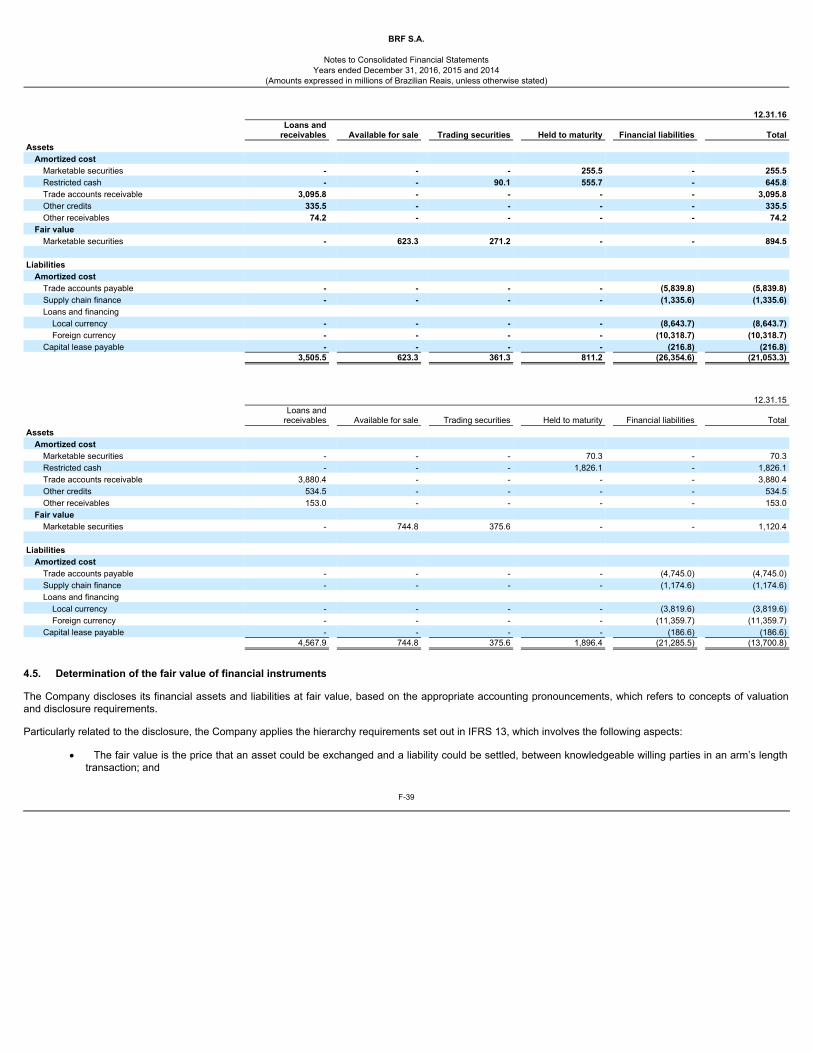
BRF S.A.
Notes to Consolidated Financial Statements
Years ended December 31, 2016, 2015 and 2014(Amounts expressed in millions of Brazilian Reais, unless otherwise stated)
12.31.16
Loans and
receivables Available for sale Trading securities Held to maturity Financial liabilities TotalAssets
Amortized cost Marketable securities - - - 255.5 - 255.5Restricted cash - - 90.1 555.7 - 645.8Trade accounts receivable 3,095.8 - - - - 3,095.8Other credits 335.5 - - - - 335.5Other receivables 74.2 - - - - 74.2
Fair value Marketable securities - 623.3 271.2 - - 894.5
Liabilities
Amortized cost Trade accounts payable - - - - (5,839.8) (5,839.8)Supply chain finance - - - - (1,335.6) (1,335.6)Loans and financing
Local currency - - - - (8,643.7) (8,643.7)Foreign currency - - - - (10,318.7) (10,318.7)
Capital lease payable - - - - (216.8) (216.8) 3,505.5 623.3 361.3 811.2 (26,354.6) (21,053.3)
12.31.15
Loans and
receivables Available for sale Trading securities Held to maturity Financial liabilities TotalAssets
Amortized cost Marketable securities - - - 70.3 - 70.3Restricted cash - - - 1,826.1 - 1,826.1Trade accounts receivable 3,880.4 - - - - 3,880.4Other credits 534.5 - - - - 534.5Other receivables 153.0 - - - - 153.0
Fair value Marketable securities - 744.8 375.6 - - 1,120.4
Liabilities
Amortized cost Trade accounts payable - - - - (4,745.0) (4,745.0)Supply chain finance - - - - (1,174.6) (1,174.6)Loans and financing
Local currency - - - - (3,819.6) (3,819.6)Foreign currency - - - - (11,359.7) (11,359.7)
Capital lease payable - - - - (186.6) (186.6) 4,567.9 744.8 375.6 1,896.4 (21,285.5) (13,700.8)
4.5. Determination of the fair value of financial instruments The Company discloses its financial assets and liabilities at fair value, based on the appropriate accounting pronouncements, which refers to concepts of valuationand disclosure requirements. Particularly related to the disclosure, the Company applies the hierarchy requirements set out in IFRS 13, which involves the following aspects:
· The fair value is the price that an asset could be exchanged and a liability could be settled, between knowledgeable willing parties in an arm’s lengthtransaction; and
F-39
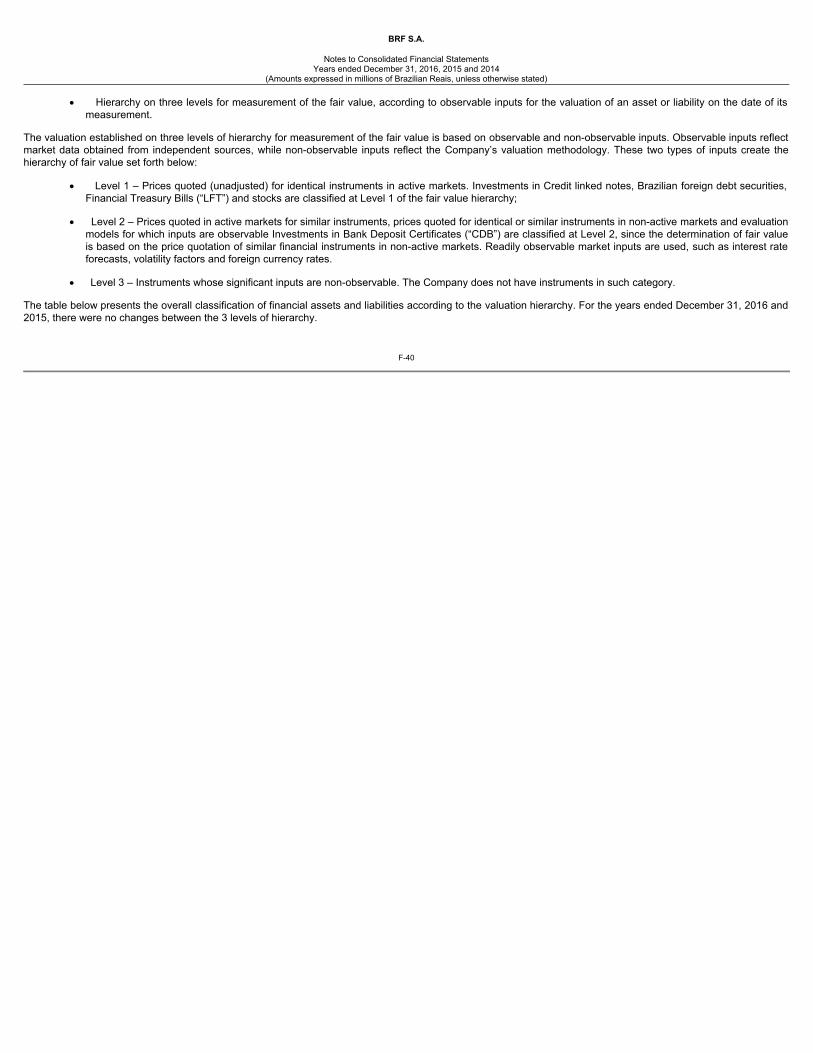
BRF S.A.
Notes to Consolidated Financial Statements
Years ended December 31, 2016, 2015 and 2014(Amounts expressed in millions of Brazilian Reais, unless otherwise stated)
· Hierarchy on three levels for measurement of the fair value, according to observable inputs for the valuation of an asset or liability on the date of its
measurement. The valuation established on three levels of hierarchy for measurement of the fair value is based on observable and non-observable inputs. Observable inputs reflectmarket data obtained from independent sources, while non-observable inputs reflect the Company’s valuation methodology. These two types of inputs create thehierarchy of fair value set forth below:
· Level 1 – Prices quoted (unadjusted) for identical instruments in active markets. Investments in Credit linked notes, Brazilian foreign debt securities,Financial Treasury Bills (“LFT”) and stocks are classified at Level 1 of the fair value hierarchy;
· Level 2 – Prices quoted in active markets for similar instruments, prices quoted for identical or similar instruments in non-active markets and evaluationmodels for which inputs are observable Investments in Bank Deposit Certificates (“CDB”) are classified at Level 2, since the determination of fair valueis based on the price quotation of similar financial instruments in non-active markets. Readily observable market inputs are used, such as interest rateforecasts, volatility factors and foreign currency rates.
· Level 3 – Instruments whose significant inputs are non-observable. The Company does not have instruments in such category.
The table below presents the overall classification of financial assets and liabilities according to the valuation hierarchy. For the years ended December 31, 2016 and2015, there were no changes between the 3 levels of hierarchy.
F-40
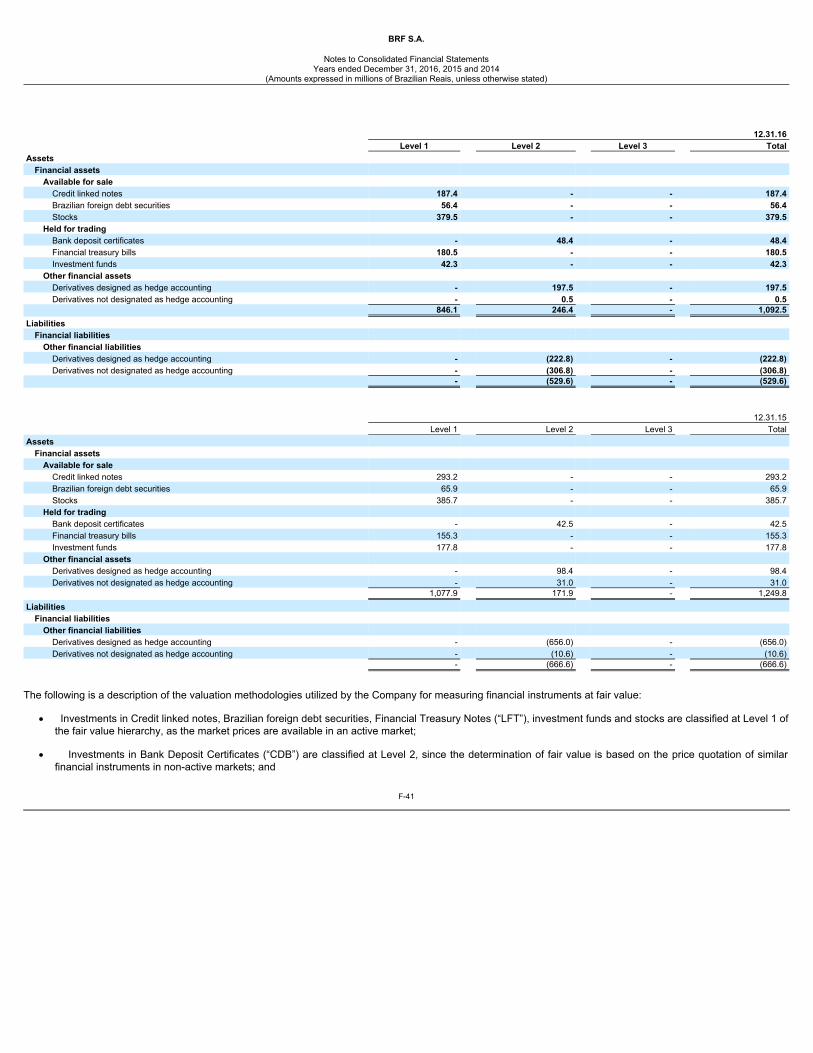
BRF S.A.
Notes to Consolidated Financial Statements
Years ended December 31, 2016, 2015 and 2014(Amounts expressed in millions of Brazilian Reais, unless otherwise stated)
12.31.16 Level 1 Level 2 Level 3 TotalAssets
Financial assets Available for sale
Credit linked notes 187.4 - - 187.4Brazilian foreign debt securities 56.4 - - 56.4Stocks 379.5 - - 379.5
Held for trading Bank deposit certificates - 48.4 - 48.4Financial treasury bills 180.5 - - 180.5Investment funds 42.3 - - 42.3
Other financial assets Derivatives designed as hedge accounting - 197.5 - 197.5Derivatives not designated as hedge accounting - 0.5 - 0.5
846.1 246.4 - 1,092.5Liabilities
Financial liabilities Other financial liabilities
Derivatives designed as hedge accounting - (222.8) - (222.8)Derivatives not designated as hedge accounting - (306.8) - (306.8)
- (529.6) - (529.6) 12.31.15 Level 1 Level 2 Level 3 TotalAssets
Financial assets Available for sale
Credit linked notes 293.2 - - 293.2Brazilian foreign debt securities 65.9 - - 65.9Stocks 385.7 - - 385.7
Held for trading Bank deposit certificates - 42.5 - 42.5Financial treasury bills 155.3 - - 155.3Investment funds 177.8 - - 177.8
Other financial assets Derivatives designed as hedge accounting - 98.4 - 98.4Derivatives not designated as hedge accounting - 31.0 - 31.0
1,077.9 171.9 - 1,249.8Liabilities
Financial liabilities Other financial liabilities
Derivatives designed as hedge accounting - (656.0) - (656.0)Derivatives not designated as hedge accounting - (10.6) - (10.6)
- (666.6) - (666.6)
The following is a description of the valuation methodologies utilized by the Company for measuring financial instruments at fair value:
· Investments in Credit linked notes, Brazilian foreign debt securities, Financial Treasury Notes (“LFT”), investment funds and stocks are classified at Level 1 ofthe fair value hierarchy, as the market prices are available in an active market;
· Investments in Bank Deposit Certificates (“CDB”) are classified at Level 2, since the determination of fair value is based on the price quotation of similarfinancial instruments in non-active markets; and
F-41
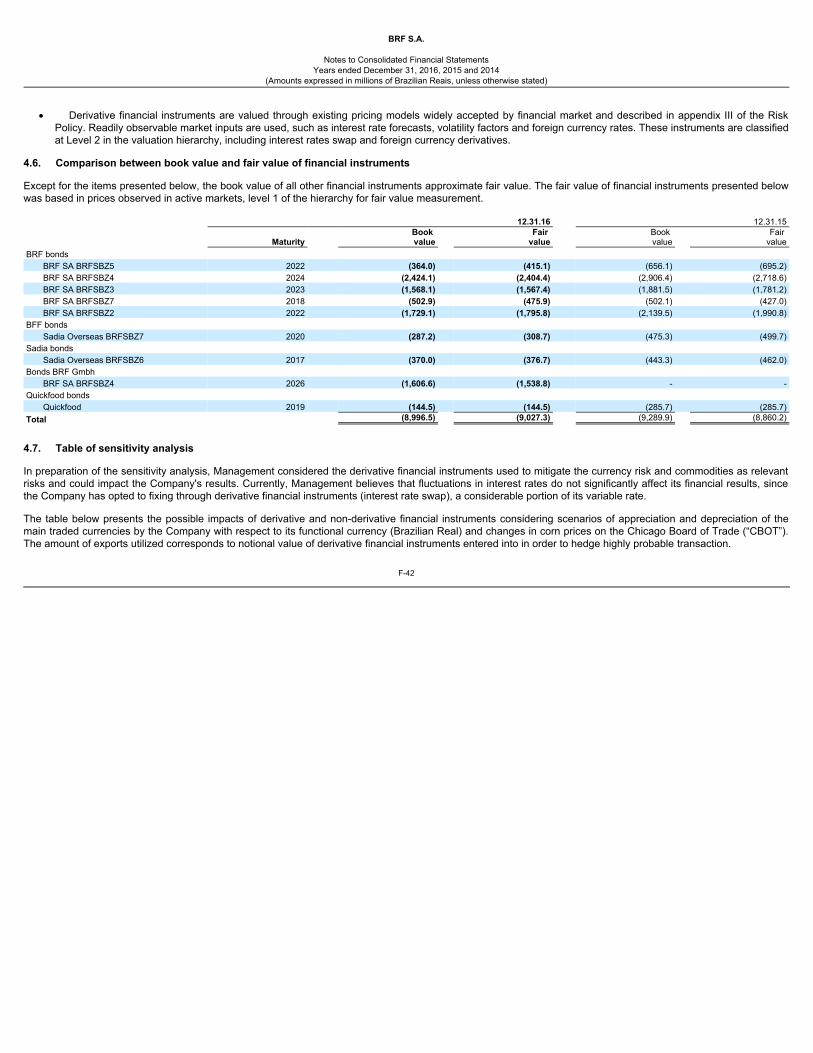
BRF S.A.
Notes to Consolidated Financial Statements
Years ended December 31, 2016, 2015 and 2014(Amounts expressed in millions of Brazilian Reais, unless otherwise stated)
· Derivative financial instruments are valued through existing pricing models widely accepted by financial market and described in appendix III of the RiskPolicy. Readily observable market inputs are used, such as interest rate forecasts, volatility factors and foreign currency rates. These instruments are classifiedat Level 2 in the valuation hierarchy, including interest rates swap and foreign currency derivatives.
4.6. Comparison between book value and fair value of financial instruments
Except for the items presented below, the book value of all other financial instruments approximate fair value. The fair value of financial instruments presented belowwas based in prices observed in active markets, level 1 of the hierarchy for fair value measurement. 12.31.16 12.31.15
Maturity Book value
Fair value
Book value
Fair value
BRF bonds BRF SA BRFSBZ5 2022 (364.0) (415.1) (656.1) (695.2)BRF SA BRFSBZ4 2024 (2,424.1) (2,404.4) (2,906.4) (2,718.6)BRF SA BRFSBZ3 2023 (1,568.1) (1,567.4) (1,881.5) (1,781.2)BRF SA BRFSBZ7 2018 (502.9) (475.9) (502.1) (427.0)BRF SA BRFSBZ2 2022 (1,729.1) (1,795.8) (2,139.5) (1,990.8)
BFF bonds Sadia Overseas BRFSBZ7 2020 (287.2) (308.7) (475.3) (499.7)
Sadia bonds Sadia Overseas BRFSBZ6 2017 (370.0) (376.7) (443.3) (462.0)
Bonds BRF Gmbh BRF SA BRFSBZ4 2026 (1,606.6) (1,538.8) - -
Quickfood bonds Quickfood 2019 (144.5) (144.5) (285.7) (285.7)
Total (8,996.5) (9,027.3) (9,289.9) (8,860.2)
4.7. Table of sensitivity analysis In preparation of the sensitivity analysis, Management considered the derivative financial instruments used to mitigate the currency risk and commodities as relevantrisks and could impact the Company's results. Currently, Management believes that fluctuations in interest rates do not significantly affect its financial results, sincethe Company has opted to fixing through derivative financial instruments (interest rate swap), a considerable portion of its variable rate. The table below presents the possible impacts of derivative and non-derivative financial instruments considering scenarios of appreciation and depreciation of themain traded currencies by the Company with respect to its functional currency (Brazilian Real) and changes in corn prices on the Chicago Board of Trade (“CBOT”).The amount of exports utilized corresponds to notional value of derivative financial instruments entered into in order to hedge highly probable transaction.
F-42
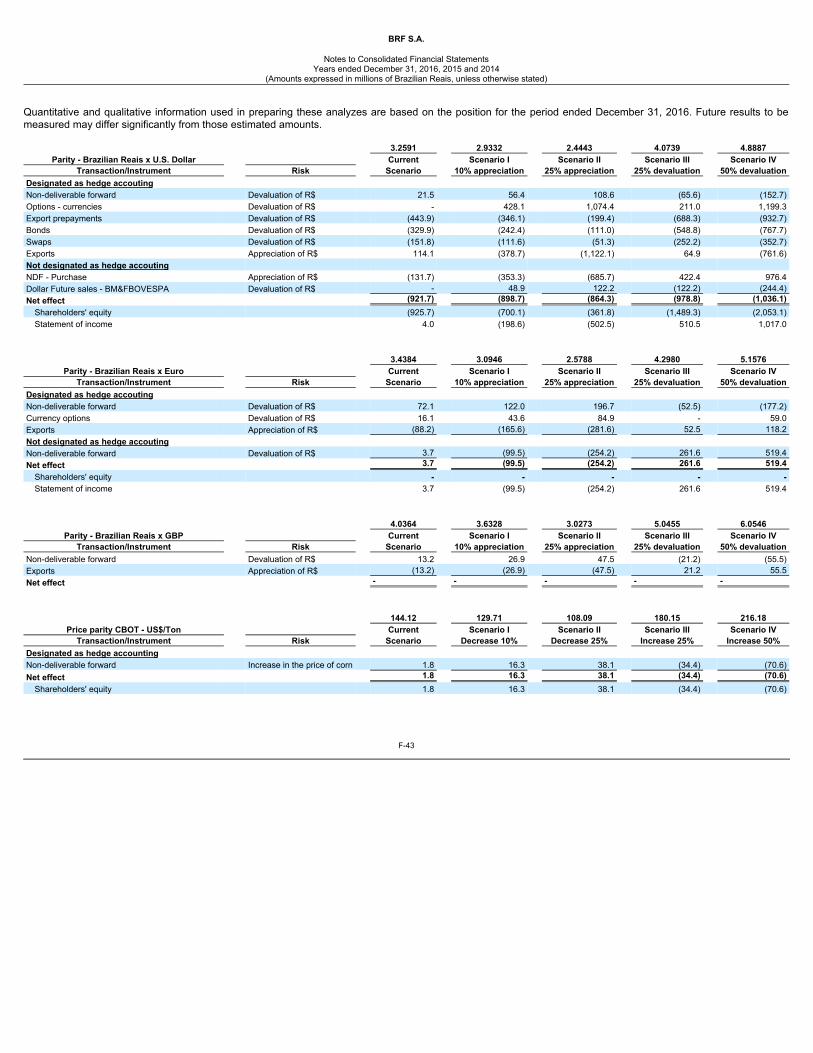
BRF S.A.
Notes to Consolidated Financial Statements
Years ended December 31, 2016, 2015 and 2014(Amounts expressed in millions of Brazilian Reais, unless otherwise stated)
Quantitative and qualitative information used in preparing these analyzes are based on the position for the period ended December 31, 2016. Future results to bemeasured may differ significantly from those estimated amounts. 3.2591 2.9332 2.4443 4.0739 4.8887
Parity - Brazilian Reais x U.S. Dollar Current Scenario I Scenario II Scenario III Scenario IVTransaction/Instrument Risk Scenario 10% appreciation 25% appreciation 25% devaluation 50% devaluation
Designated as hedge accouting Non-deliverable forward Devaluation of R$ 21.5 56.4 108.6 (65.6) (152.7)Options - currencies Devaluation of R$ - 428.1 1,074.4 211.0 1,199.3Export prepayments Devaluation of R$ (443.9) (346.1) (199.4) (688.3) (932.7)Bonds Devaluation of R$ (329.9) (242.4) (111.0) (548.8) (767.7)Swaps Devaluation of R$ (151.8) (111.6) (51.3) (252.2) (352.7)Exports Appreciation of R$ 114.1 (378.7) (1,122.1) 64.9 (761.6)Not designated as hedge accouting NDF - Purchase Appreciation of R$ (131.7) (353.3) (685.7) 422.4 976.4Dollar Future sales - BM&FBOVESPA Devaluation of R$ - 48.9 122.2 (122.2) (244.4)Net effect (921.7) (898.7) (864.3) (978.8) (1,036.1)
Shareholders' equity (925.7) (700.1) (361.8) (1,489.3) (2,053.1)Statement of income 4.0 (198.6) (502.5) 510.5 1,017.0
3.4384 3.0946 2.5788 4.2980 5.1576
Parity - Brazilian Reais x Euro Current Scenario I Scenario II Scenario III Scenario IVTransaction/Instrument Risk Scenario 10% appreciation 25% appreciation 25% devaluation 50% devaluation
Designated as hedge accouting Non-deliverable forward Devaluation of R$ 72.1 122.0 196.7 (52.5) (177.2)Currency options Devaluation of R$ 16.1 43.6 84.9 - 59.0Exports Appreciation of R$ (88.2) (165.6) (281.6) 52.5 118.2Not designated as hedge accouting Non-deliverable forward Devaluation of R$ 3.7 (99.5) (254.2) 261.6 519.4Net effect 3.7 (99.5) (254.2) 261.6 519.4
Shareholders' equity - - - - -Statement of income 3.7 (99.5) (254.2) 261.6 519.4
4.0364 3.6328 3.0273 5.0455 6.0546
Parity - Brazilian Reais x GBP Current Scenario I Scenario II Scenario III Scenario IVTransaction/Instrument Risk Scenario 10% appreciation 25% appreciation 25% devaluation 50% devaluation
Non-deliverable forward Devaluation of R$ 13.2 26.9 47.5 (21.2) (55.5)Exports Appreciation of R$ (13.2) (26.9) (47.5) 21.2 55.5Net effect - - - - - 144.12 129.71 108.09 180.15 216.18
Price parity CBOT - US$/Ton Current Scenario I Scenario II Scenario III Scenario IVTransaction/Instrument Risk Scenario Decrease 10% Decrease 25% Increase 25% Increase 50%
Designated as hedge accounting Non-deliverable forward Increase in the price of corn 1.8 16.3 38.1 (34.4) (70.6)Net effect 1.8 16.3 38.1 (34.4) (70.6)
Shareholders' equity 1.8 16.3 38.1 (34.4) (70.6)
F-43
BRF S.A.
Notes to Consolidated Financial Statements
Years ended December 31, 2016, 2015 and 2014(Amounts expressed in millions of Brazilian Reais, unless otherwise stated)
5. SEGMENT INFORMATION The operating segments are reported consistently with the management reports provided to the Chief Operating Decision Maker (“CODM”) for assessing theperformance of each segment and allocating resources. As disclosed in note 1, in order to reflect the Company’s organizational changes the segment information for fiscal years 2016, 2015 and 2014 has been preparedconsidering the seven operating segments, as follows: Brazil, Latin America (“LATAM”), Europe, Middle East and North Africa (“MENA”), Africa, Asia and OtherSegments, which primarily reflect the geographical structure of the Company. The segment information as of December 31, 2015 and 2014 was prepared in order tobe comparable to the information disclosed as of December 31, 2016. These segments are disclosed according to the nature of the products as described below:
· Poultry : involves the production and sale of whole poultry and in-natura cuts. · Pork and other : involves the production and sale of in-natura cuts. · Processed foods : involves the production and sale of frozen and processed products derived from poultry, pork and beef and other processed foods
such as margarine, vegetable and soybean-based products. · Other sales : involves the production and sale of soy meal, refined soy flour.
Other segments include sale of in-natura beef cuts, agricultural products and animal feed. The net sales for each operating segment are presented below:
F-44
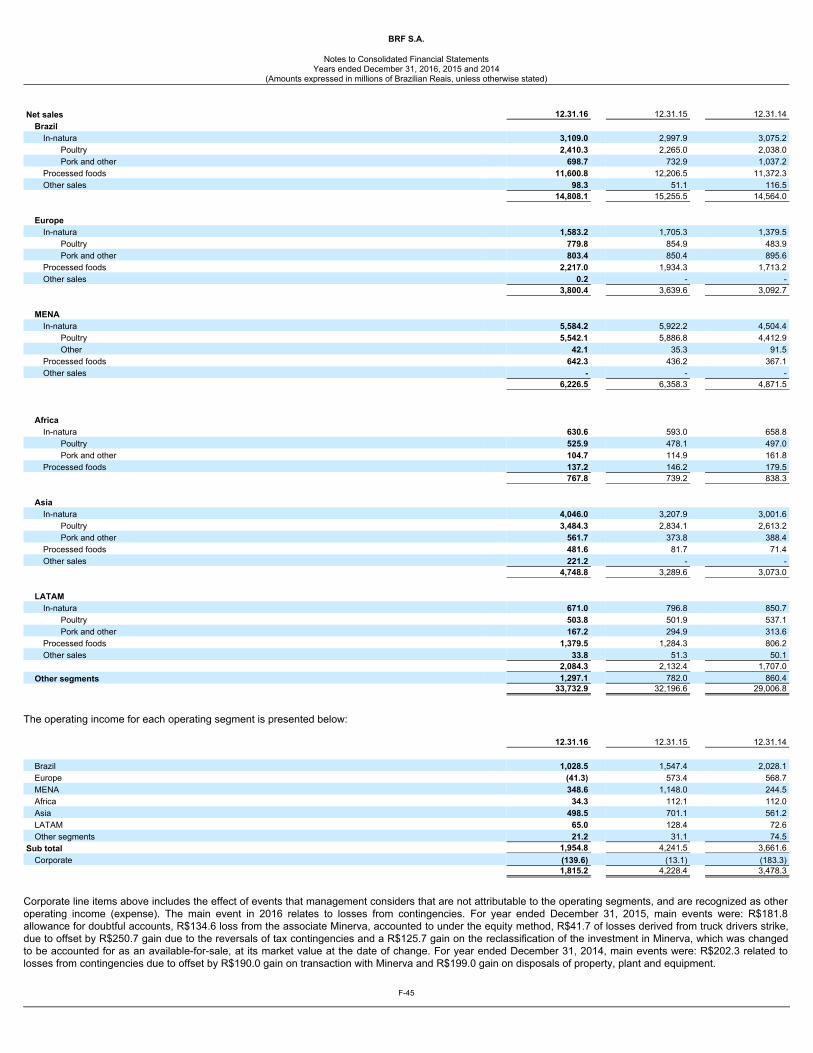
BRF S.A.
Notes to Consolidated Financial Statements
Years ended December 31, 2016, 2015 and 2014(Amounts expressed in millions of Brazilian Reais, unless otherwise stated)
Net sales 12.31.16 12.31.15 12.31.14
Brazil In-natura 3,109.0 2,997.9 3,075.2
Poultry 2,410.3 2,265.0 2,038.0Pork and other 698.7 732.9 1,037.2
Processed foods 11,600.8 12,206.5 11,372.3Other sales 98.3 51.1 116.5
14,808.1 15,255.5 14,564.0
Europe In-natura 1,583.2 1,705.3 1,379.5
Poultry 779.8 854.9 483.9Pork and other 803.4 850.4 895.6
Processed foods 2,217.0 1,934.3 1,713.2Other sales 0.2 - -
3,800.4 3,639.6 3,092.7
MENA In-natura 5,584.2 5,922.2 4,504.4
Poultry 5,542.1 5,886.8 4,412.9Other 42.1 35.3 91.5
Processed foods 642.3 436.2 367.1Other sales - - -
6,226.5 6,358.3 4,871.5
Africa In-natura 630.6 593.0 658.8
Poultry 525.9 478.1 497.0Pork and other 104.7 114.9 161.8
Processed foods 137.2 146.2 179.5 767.8 739.2 838.3
Asia In-natura 4,046.0 3,207.9 3,001.6
Poultry 3,484.3 2,834.1 2,613.2Pork and other 561.7 373.8 388.4
Processed foods 481.6 81.7 71.4Other sales 221.2 - -
4,748.8 3,289.6 3,073.0
LATAM In-natura 671.0 796.8 850.7
Poultry 503.8 501.9 537.1Pork and other 167.2 294.9 313.6
Processed foods 1,379.5 1,284.3 806.2Other sales 33.8 51.3 50.1
2,084.3 2,132.4 1,707.0Other segments 1,297.1 782.0 860.4
33,732.9 32,196.6 29,006.8
The operating income for each operating segment is presented below: 12.31.16 12.31.15 12.31.14
Brazil 1,028.5 1,547.4 2,028.1Europe (41.3) 573.4 568.7MENA 348.6 1,148.0 244.5Africa 34.3 112.1 112.0Asia 498.5 701.1 561.2LATAM 65.0 128.4 72.6Other segments 21.2 31.1 74.5
Sub total 1,954.8 4,241.5 3,661.6Corporate (139.6) (13.1) (183.3)
1,815.2 4,228.4 3,478.3
Corporate line items above includes the effect of events that management considers that are not attributable to the operating segments, and are recognized as otheroperating income (expense). The main event in 2016 relates to losses from contingencies. For year ended December 31, 2015, main events were: R$181.8allowance for doubtful accounts, R$134.6 loss from the associate Minerva, accounted to under the equity method, R$41.7 of losses derived from truck drivers strike,due to offset by R$250.7 gain due to the reversals of tax contingencies and a R$125.7 gain on the reclassification of the investment in Minerva, which was changedto be accounted for as an available-for-sale, at its market value at the date of change. For year ended December 31, 2014, main events were: R$202.3 related tolosses from contingencies due to offset by R$190.0 gain on transaction with Minerva and R$199.0 gain on disposals of property, plant and equipment.
F-45
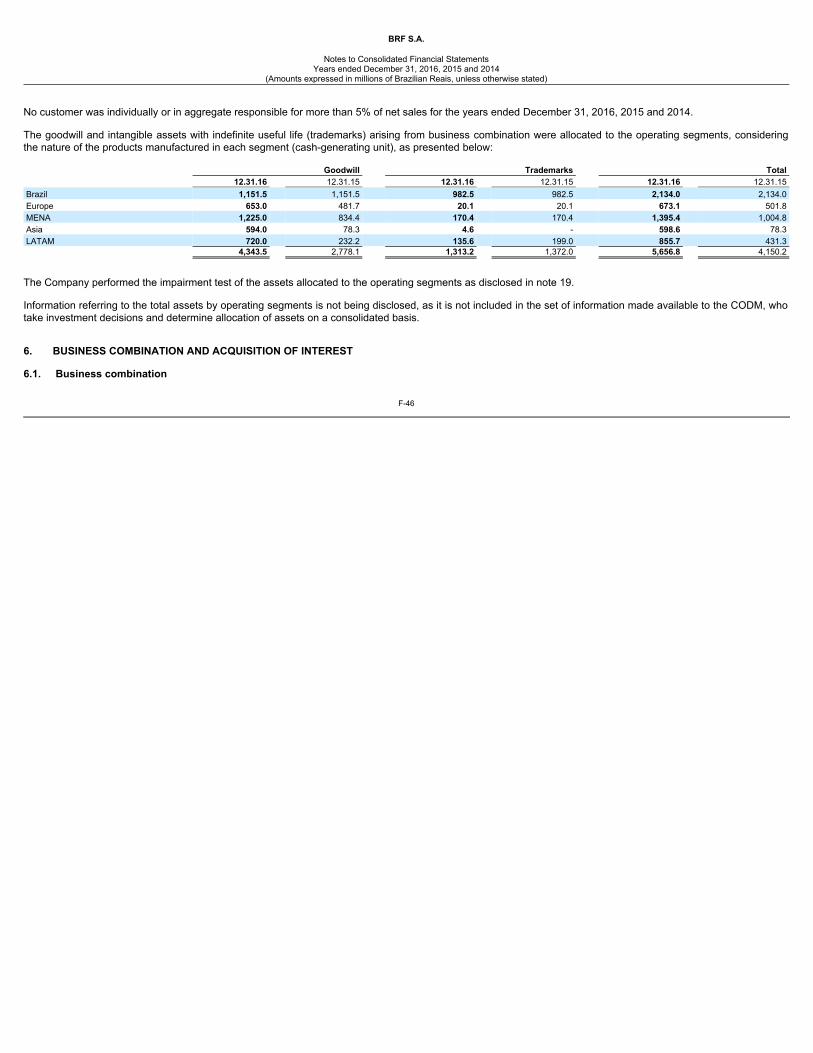
BRF S.A.
Notes to Consolidated Financial Statements
Years ended December 31, 2016, 2015 and 2014(Amounts expressed in millions of Brazilian Reais, unless otherwise stated)
No customer was individually or in aggregate responsible for more than 5% of net sales for the years ended December 31, 2016, 2015 and 2014. The goodwill and intangible assets with indefinite useful life (trademarks) arising from business combination were allocated to the operating segments, consideringthe nature of the products manufactured in each segment (cash-generating unit), as presented below: Goodwill Trademarks Total 12.31.16 12.31.15 12.31.16 12.31.15 12.31.16 12.31.15Brazil 1,151.5 1,151.5 982.5 982.5 2,134.0 2,134.0Europe 653.0 481.7 20.1 20.1 673.1 501.8MENA 1,225.0 834.4 170.4 170.4 1,395.4 1,004.8Asia 594.0 78.3 4.6 - 598.6 78.3LATAM 720.0 232.2 135.6 199.0 855.7 431.3 4,343.5 2,778.1 1,313.2 1,372.0 5,656.8 4,150.2
The Company performed the impairment test of the assets allocated to the operating segments as disclosed in note 19. Information referring to the total assets by operating segments is not being disclosed, as it is not included in the set of information made available to the CODM, whotake investment decisions and determine allocation of assets on a consolidated basis. 6. BUSINESS COMBINATION AND ACQUISITION OF INTEREST 6.1. Business combination
F-46
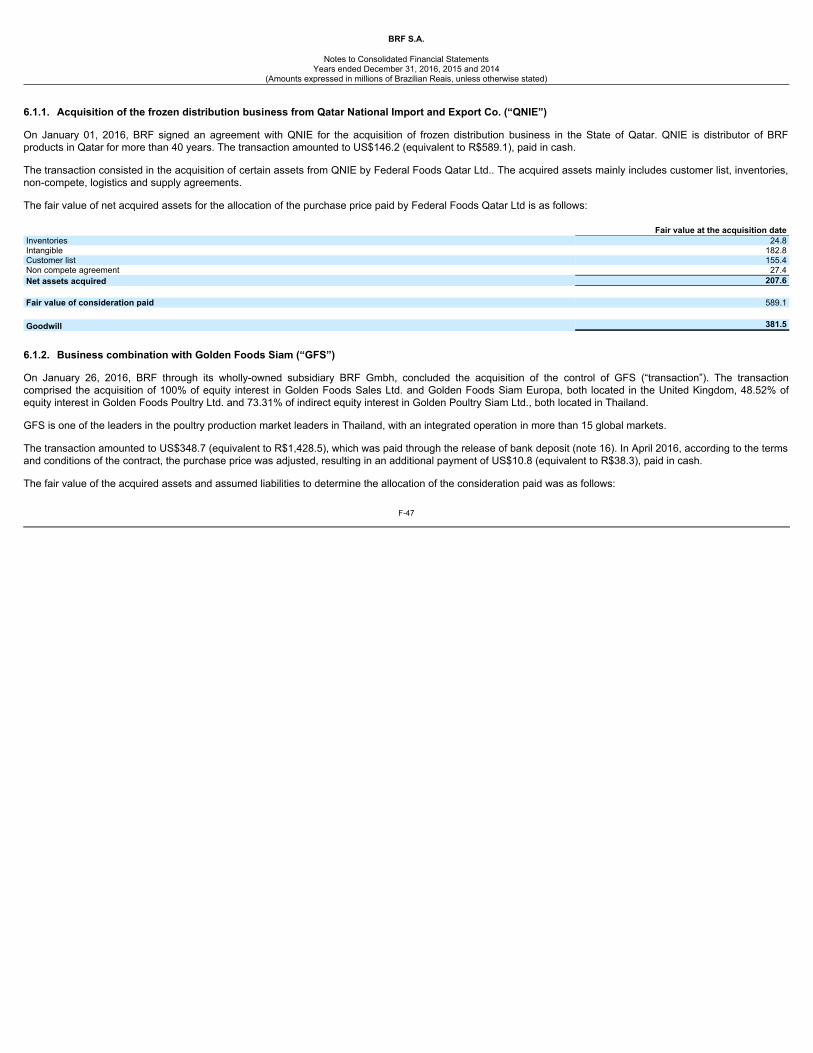
BRF S.A.
Notes to Consolidated Financial Statements
Years ended December 31, 2016, 2015 and 2014(Amounts expressed in millions of Brazilian Reais, unless otherwise stated)
6.1.1. Acquisition of the frozen distribution business from Qatar National Import and Export Co. (“QNIE”) On January 01, 2016, BRF signed an agreement with QNIE for the acquisition of frozen distribution business in the State of Qatar. QNIE is distributor of BRFproducts in Qatar for more than 40 years. The transaction amounted to US$146.2 (equivalent to R$589.1), paid in cash. The transaction consisted in the acquisition of certain assets from QNIE by Federal Foods Qatar Ltd.. The acquired assets mainly includes customer list, inventories,non-compete, logistics and supply agreements. The fair value of net acquired assets for the allocation of the purchase price paid by Federal Foods Qatar Ltd is as follows: Fair value at the acquisition dateInventories 24.8Intangible 182.8Customer list 155.4Non compete agreement 27.4Net assets acquired 207.6 Fair value of consideration paid 589.1 Goodwill 381.5
6.1.2. Business combination with Golden Foods Siam (“GFS”) On January 26, 2016, BRF through its wholly-owned subsidiary BRF Gmbh, concluded the acquisition of the control of GFS (“transaction”). The transactioncomprised the acquisition of 100% of equity interest in Golden Foods Sales Ltd. and Golden Foods Siam Europa, both located in the United Kingdom, 48.52% ofequity interest in Golden Foods Poultry Ltd. and 73.31% of indirect equity interest in Golden Poultry Siam Ltd., both located in Thailand. GFS is one of the leaders in the poultry production market leaders in Thailand, with an integrated operation in more than 15 global markets. The transaction amounted to US$348.7 (equivalent to R$1,428.5), which was paid through the release of bank deposit (note 16). In April 2016, according to the termsand conditions of the contract, the purchase price was adjusted, resulting in an additional payment of US$10.8 (equivalent to R$38.3), paid in cash. The fair value of the acquired assets and assumed liabilities to determine the allocation of the consideration paid was as follows:
F-47
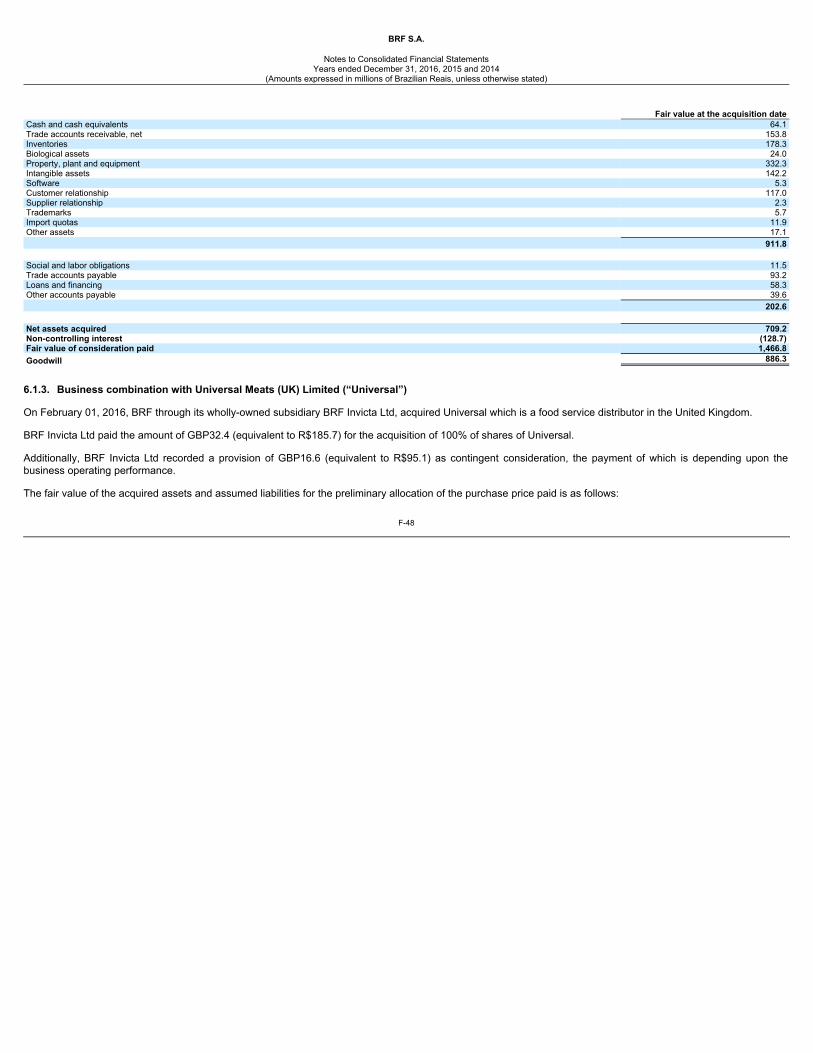
BRF S.A.
Notes to Consolidated Financial Statements
Years ended December 31, 2016, 2015 and 2014(Amounts expressed in millions of Brazilian Reais, unless otherwise stated)
Fair value at the acquisition dateCash and cash equivalents 64.1Trade accounts receivable, net 153.8Inventories 178.3Biological assets 24.0Property, plant and equipment 332.3Intangible assets 142.2Software 5.3Customer relationship 117.0Supplier relationship 2.3Trademarks 5.7Import quotas 11.9Other assets 17.1 911.8 Social and labor obligations 11.5Trade accounts payable 93.2Loans and financing 58.3Other accounts payable 39.6 202.6 Net assets acquired 709.2Non-controlling interest (128.7)Fair value of consideration paid 1,466.8Goodwill 886.3
6.1.3. Business combination with Universal Meats (UK) Limited (“Universal”) On February 01, 2016, BRF through its wholly-owned subsidiary BRF Invicta Ltd, acquired Universal which is a food service distributor in the United Kingdom. BRF Invicta Ltd paid the amount of GBP32.4 (equivalent to R$185.7) for the acquisition of 100% of shares of Universal. Additionally, BRF Invicta Ltd recorded a provision of GBP16.6 (equivalent to R$95.1) as contingent consideration, the payment of which is depending upon thebusiness operating performance. The fair value of the acquired assets and assumed liabilities for the preliminary allocation of the purchase price paid is as follows:
F-48
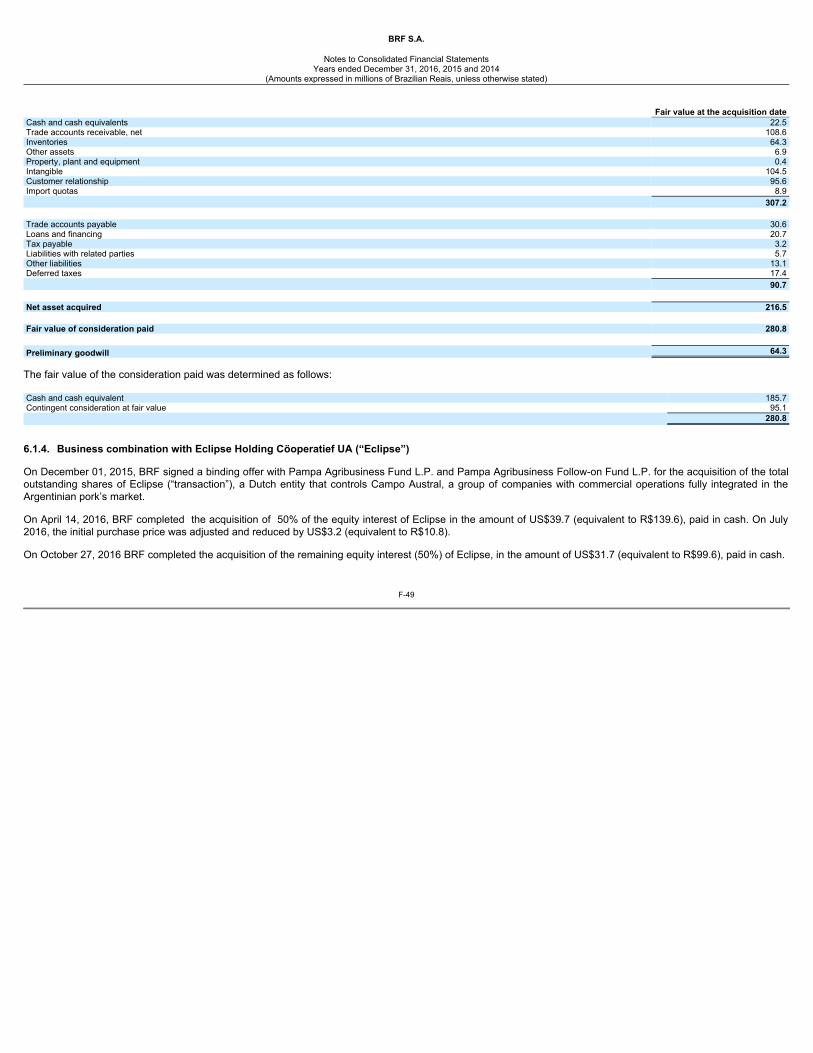
BRF S.A.
Notes to Consolidated Financial Statements
Years ended December 31, 2016, 2015 and 2014(Amounts expressed in millions of Brazilian Reais, unless otherwise stated)
Fair value at the acquisition dateCash and cash equivalents 22.5Trade accounts receivable, net 108.6Inventories 64.3Other assets 6.9Property, plant and equipment 0.4Intangible 104.5Customer relationship 95.6Import quotas 8.9 307.2 Trade accounts payable 30.6Loans and financing 20.7Tax payable 3.2Liabilities with related parties 5.7Other liabilities 13.1Deferred taxes 17.4 90.7 Net asset acquired 216.5 Fair value of consideration paid 280.8 Preliminary goodwill 64.3
The fair value of the consideration paid was determined as follows: Cash and cash equivalent 185.7Contingent consideration at fair value 95.1 280.8
6.1.4. Business combination with Eclipse Holding Cöoperatief UA (“Eclipse”) On December 01, 2015, BRF signed a binding offer with Pampa Agribusiness Fund L.P. and Pampa Agribusiness Follow-on Fund L.P. for the acquisition of the totaloutstanding shares of Eclipse (“transaction”), a Dutch entity that controls Campo Austral, a group of companies with commercial operations fully integrated in theArgentinian pork’s market. On April 14, 2016, BRF completed the acquisition of 50% of the equity interest of Eclipse in the amount of US$39.7 (equivalent to R$139.6), paid in cash. On July2016, the initial purchase price was adjusted and reduced by US$3.2 (equivalent to R$10.8). On October 27, 2016 BRF completed the acquisition of the remaining equity interest (50%) of Eclipse, in the amount of US$31.7 (equivalent to R$99.6), paid in cash.
F-49
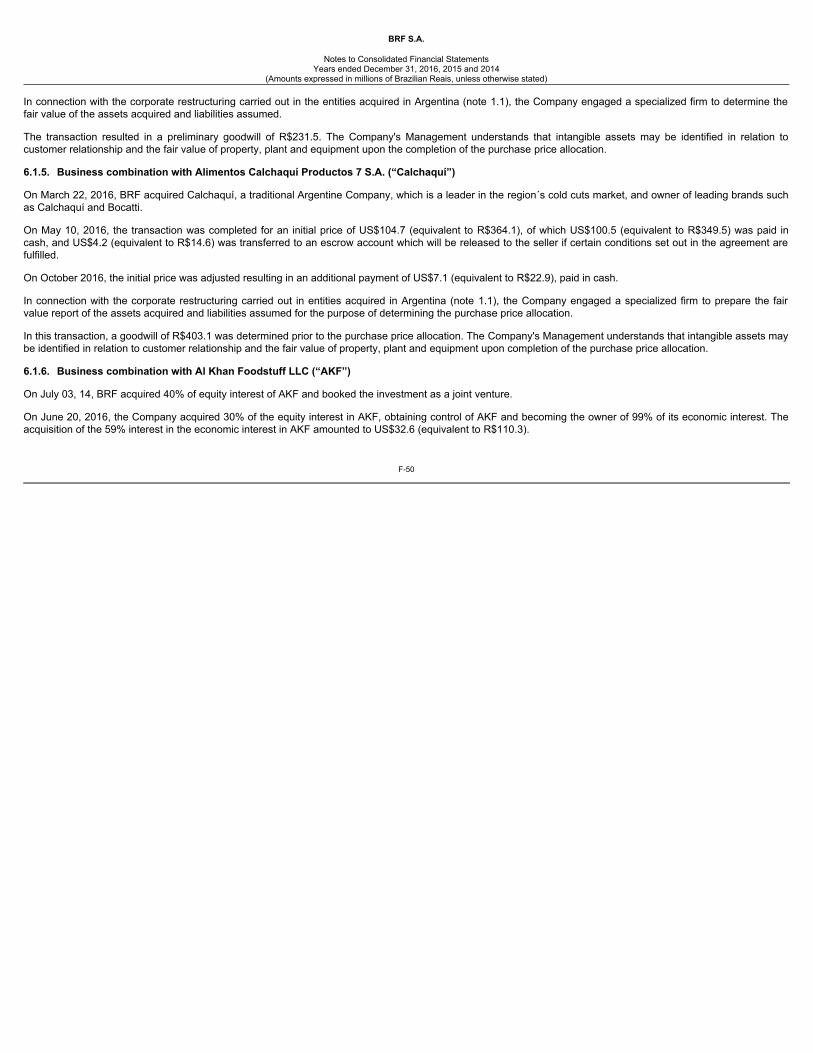
BRF S.A.
Notes to Consolidated Financial Statements
Years ended December 31, 2016, 2015 and 2014(Amounts expressed in millions of Brazilian Reais, unless otherwise stated)
In connection with the corporate restructuring carried out in the entities acquired in Argentina (note 1.1), the Company engaged a specialized firm to determine thefair value of the assets acquired and liabilities assumed. The transaction resulted in a preliminary goodwill of R$231.5. The Company's Management understands that intangible assets may be identified in relation tocustomer relationship and the fair value of property, plant and equipment upon the completion of the purchase price allocation. 6.1.5. Business combination with Alimentos Calchaquí Productos 7 S.A. (“Calchaquí”) On March 22, 2016, BRF acquired Calchaquí, a traditional Argentine Company, which is a leader in the region´s cold cuts market, and owner of leading brands suchas Calchaquí and Bocatti. On May 10, 2016, the transaction was completed for an initial price of US$104.7 (equivalent to R$364.1), of which US$100.5 (equivalent to R$349.5) was paid incash, and US$4.2 (equivalent to R$14.6) was transferred to an escrow account which will be released to the seller if certain conditions set out in the agreement arefulfilled. On October 2016, the initial price was adjusted resulting in an additional payment of US$7.1 (equivalent to R$22.9), paid in cash. In connection with the corporate restructuring carried out in entities acquired in Argentina (note 1.1), the Company engaged a specialized firm to prepare the fairvalue report of the assets acquired and liabilities assumed for the purpose of determining the purchase price allocation. In this transaction, a goodwill of R$403.1 was determined prior to the purchase price allocation. The Company's Management understands that intangible assets maybe identified in relation to customer relationship and the fair value of property, plant and equipment upon completion of the purchase price allocation. 6.1.6. Business combination with Al Khan Foodstuff LLC (“AKF”) On July 03, 14, BRF acquired 40% of equity interest of AKF and booked the investment as a joint venture. On June 20, 2016, the Company acquired 30% of the equity interest in AKF, obtaining control of AKF and becoming the owner of 99% of its economic interest. Theacquisition of the 59% interest in the economic interest in AKF amounted to US$32.6 (equivalent to R$110.3).
F-50
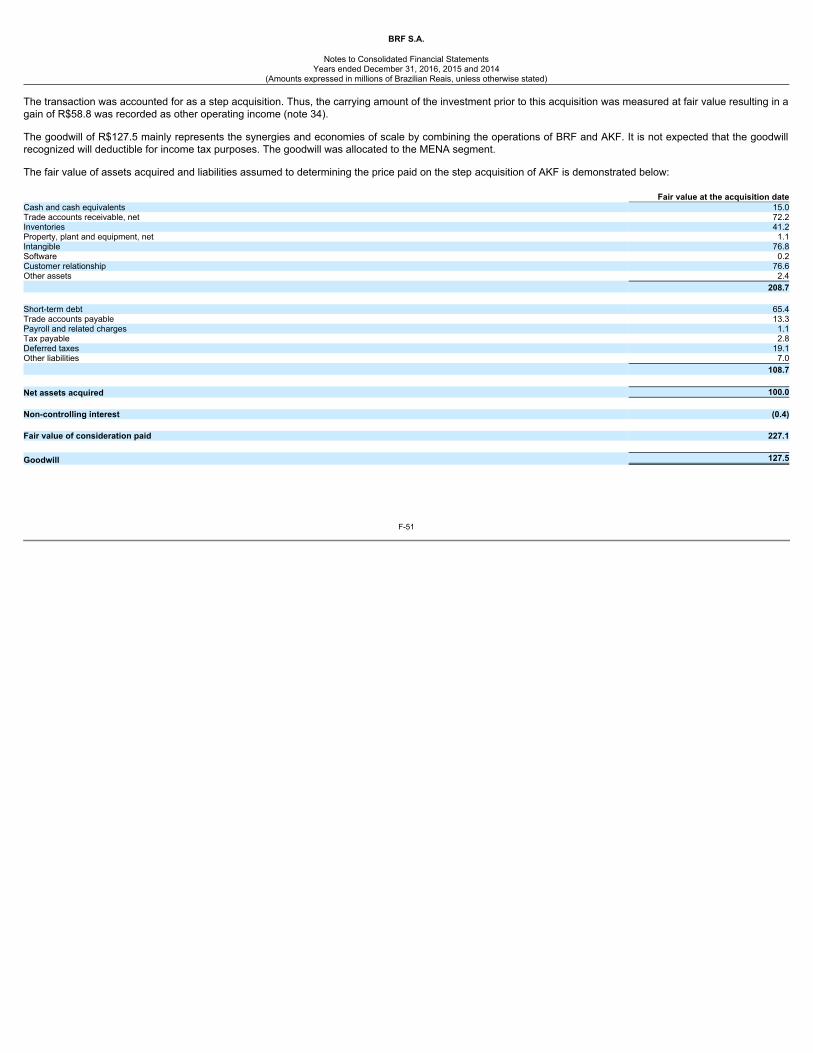
BRF S.A.
Notes to Consolidated Financial Statements
Years ended December 31, 2016, 2015 and 2014(Amounts expressed in millions of Brazilian Reais, unless otherwise stated)
The transaction was accounted for as a step acquisition. Thus, the carrying amount of the investment prior to this acquisition was measured at fair value resulting in again of R$58.8 was recorded as other operating income (note 34). The goodwill of R$127.5 mainly represents the synergies and economies of scale by combining the operations of BRF and AKF. It is not expected that the goodwillrecognized will deductible for income tax purposes. The goodwill was allocated to the MENA segment. The fair value of assets acquired and liabilities assumed to determining the price paid on the step acquisition of AKF is demonstrated below: Fair value at the acquisition dateCash and cash equivalents 15.0Trade accounts receivable, net 72.2Inventories 41.2Property, plant and equipment, net 1.1Intangible 76.8Software 0.2Customer relationship 76.6Other assets 2.4 208.7 Short-term debt 65.4Trade accounts payable 13.3Payroll and related charges 1.1Tax payable 2.8Deferred taxes 19.1Other liabilities 7.0 108.7 Net assets acquired 100.0 Non-controlling interest (0.4) Fair value of consideration paid 227.1 Goodwill 127.5
F-51
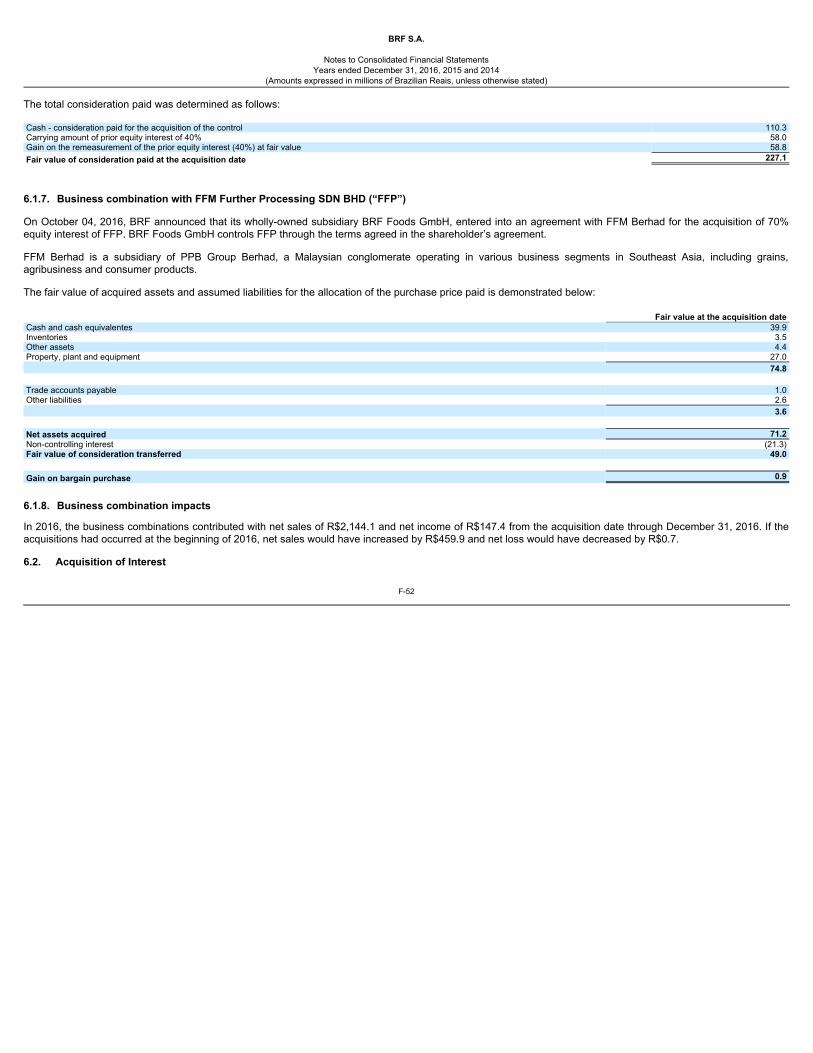
BRF S.A.
Notes to Consolidated Financial Statements
Years ended December 31, 2016, 2015 and 2014(Amounts expressed in millions of Brazilian Reais, unless otherwise stated)
The total consideration paid was determined as follows: Cash - consideration paid for the acquisition of the control 110.3Carrying amount of prior equity interest of 40% 58.0Gain on the remeasurement of the prior equity interest (40%) at fair value 58.8Fair value of consideration paid at the acquisition date 227.1
6.1.7. Business combination with FFM Further Processing SDN BHD (“FFP”) On October 04, 2016, BRF announced that its wholly-owned subsidiary BRF Foods GmbH, entered into an agreement with FFM Berhad for the acquisition of 70%equity interest of FFP. BRF Foods GmbH controls FFP through the terms agreed in the shareholder’s agreement. FFM Berhad is a subsidiary of PPB Group Berhad, a Malaysian conglomerate operating in various business segments in Southeast Asia, including grains,agribusiness and consumer products. The fair value of acquired assets and assumed liabilities for the allocation of the purchase price paid is demonstrated below: Fair value at the acquisition dateCash and cash equivalentes 39.9Inventories 3.5Other assets 4.4Property, plant and equipment 27.0 74.8 Trade accounts payable 1.0Other liabilities 2.6 3.6 Net assets acquired 71.2Non-controlling interest (21.3)Fair value of consideration transferred 49.0 Gain on bargain purchase 0.9
6.1.8. Business combination impacts
In 2016, the business combinations contributed with net sales of R$2,144.1 and net income of R$147.4 from the acquisition date through December 31, 2016. If theacquisitions had occurred at the beginning of 2016, net sales would have increased by R$459.9 and net loss would have decreased by R$0.7. 6.2. Acquisition of Interest
F-52
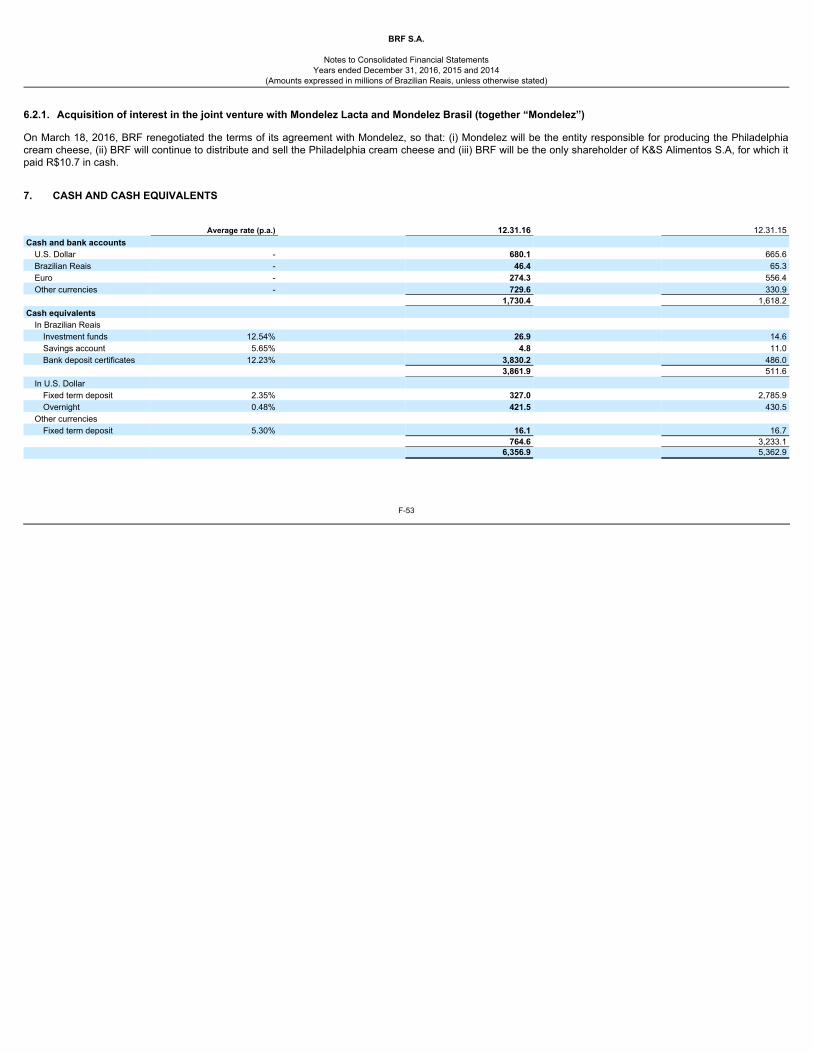
BRF S.A.
Notes to Consolidated Financial Statements
Years ended December 31, 2016, 2015 and 2014(Amounts expressed in millions of Brazilian Reais, unless otherwise stated)
6.2.1. Acquisition of interest in the joint venture with Mondelez Lacta and Mondelez Brasil (together “Mondelez”) On March 18, 2016, BRF renegotiated the terms of its agreement with Mondelez, so that: (i) Mondelez will be the entity responsible for producing the Philadelphiacream cheese, (ii) BRF will continue to distribute and sell the Philadelphia cream cheese and (iii) BRF will be the only shareholder of K&S Alimentos S.A, for which itpaid R$10.7 in cash. 7. CASH AND CASH EQUIVALENTS
Average rate (p.a.)
12.31.16 12.31.15Cash and bank accounts
U.S. Dollar - 680.1 665.6Brazilian Reais - 46.4 65.3Euro - 274.3 556.4Other currencies - 729.6 330.9
1,730.4 1,618.2Cash equivalents
In Brazilian Reais Investment funds 12.54% 26.9 14.6Savings account 5.65% 4.8 11.0Bank deposit certificates 12.23% 3,830.2 486.0
3,861.9 511.6In U.S. Dollar
Fixed term deposit 2.35% 327.0 2,785.9Overnight 0.48% 421.5 430.5
Other currencies Fixed term deposit 5.30% 16.1 16.7
764.6 3,233.1 6,356.9 5,362.9
F-53
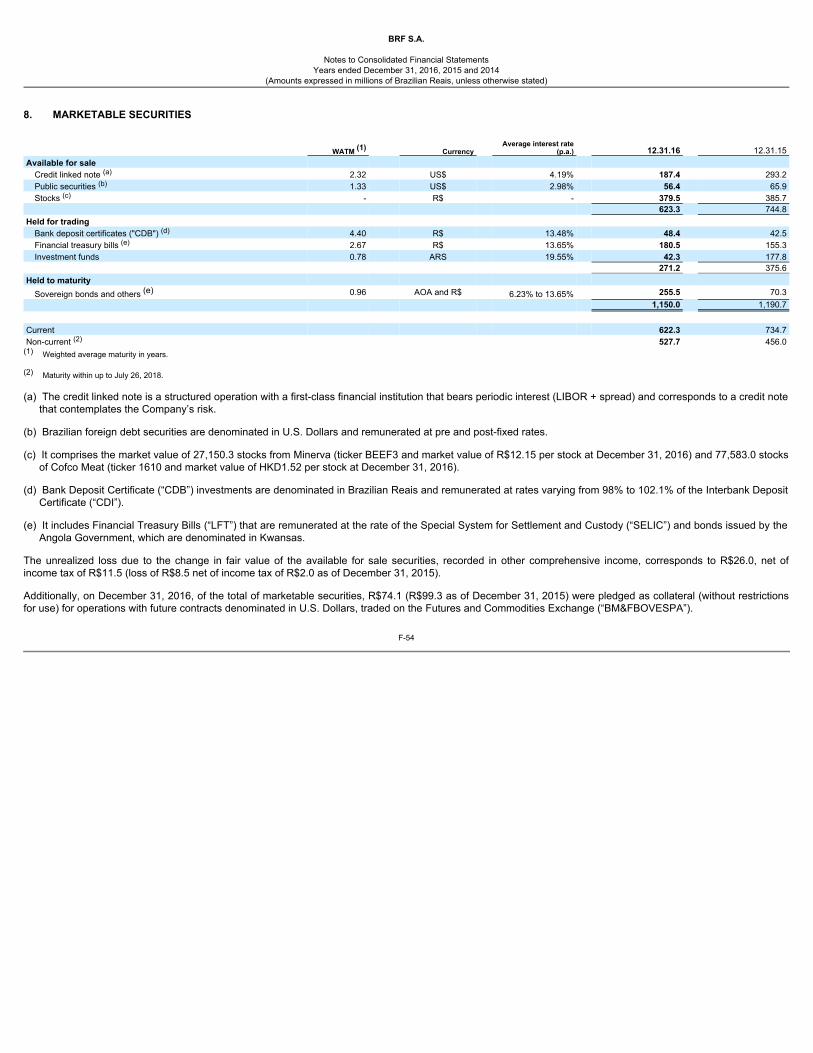
BRF S.A.
Notes to Consolidated Financial Statements
Years ended December 31, 2016, 2015 and 2014(Amounts expressed in millions of Brazilian Reais, unless otherwise stated)
8. MARKETABLE SECURITIES
Average interest rate(p.a.)
WATM (1) Currency 12.31.16 12.31.15Available for sale
Credit linked note (a) 2.32 US$ 4.19% 187.4 293.2Public securities (b) 1.33 US$ 2.98% 56.4 65.9Stocks (c) - R$ - 379.5 385.7
623.3 744.8Held for trading
Bank deposit certificates ("CDB") (d) 4.40 R$ 13.48% 48.4 42.5Financial treasury bills (e) 2.67 R$ 13.65% 180.5 155.3Investment funds 0.78 ARS 19.55% 42.3 177.8
271.2 375.6Held to maturity
Sovereign bonds and others (e) 0.96 AOA and R$ 6.23% to 13.65% 255.5 70.3 1,150.0 1,190.7 Current 622.3 734.7Non-current (2) 527.7 456.0
(1) Weighted average maturity in years.
(2) Maturity within up to July 26, 2018. (a) The credit linked note is a structured operation with a first-class financial institution that bears periodic interest (LIBOR + spread) and corresponds to a credit note
that contemplates the Company’s risk.
(b) Brazilian foreign debt securities are denominated in U.S. Dollars and remunerated at pre and post-fixed rates.
(c) It comprises the market value of 27,150.3 stocks from Minerva (ticker BEEF3 and market value of R$12.15 per stock at December 31, 2016) and 77,583.0 stocksof Cofco Meat (ticker 1610 and market value of HKD1.52 per stock at December 31, 2016).
(d) Bank Deposit Certificate (“CDB”) investments are denominated in Brazilian Reais and remunerated at rates varying from 98% to 102.1% of the Interbank Deposit
Certificate (“CDI”). (e) It includes Financial Treasury Bills (“LFT”) that are remunerated at the rate of the Special System for Settlement and Custody (“SELIC”) and bonds issued by the
Angola Government, which are denominated in Kwansas. The unrealized loss due to the change in fair value of the available for sale securities, recorded in other comprehensive income, corresponds to R$26.0, net ofincome tax of R$11.5 (loss of R$8.5 net of income tax of R$2.0 as of December 31, 2015). Additionally, on December 31, 2016, of the total of marketable securities, R$74.1 (R$99.3 as of December 31, 2015) were pledged as collateral (without restrictionsfor use) for operations with future contracts denominated in U.S. Dollars, traded on the Futures and Commodities Exchange (“BM&FBOVESPA”).
F-54
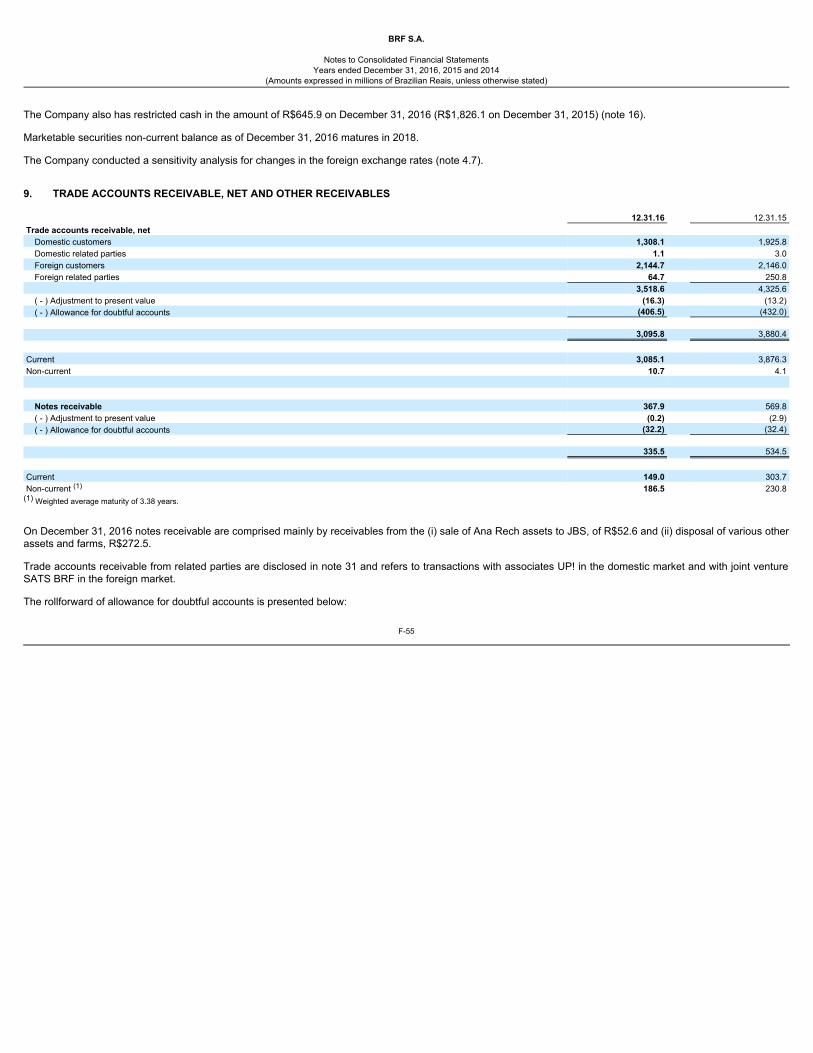
BRF S.A.
Notes to Consolidated Financial Statements
Years ended December 31, 2016, 2015 and 2014(Amounts expressed in millions of Brazilian Reais, unless otherwise stated)
The Company also has restricted cash in the amount of R$645.9 on December 31, 2016 (R$1,826.1 on December 31, 2015) (note 16). Marketable securities non-current balance as of December 31, 2016 matures in 2018. The Company conducted a sensitivity analysis for changes in the foreign exchange rates (note 4.7). 9. TRADE ACCOUNTS RECEIVABLE, NET AND OTHER RECEIVABLES 12.31.16 12.31.15Trade accounts receivable, net
Domestic customers 1,308.1 1,925.8Domestic related parties 1.1 3.0Foreign customers 2,144.7 2,146.0Foreign related parties 64.7 250.8
3,518.6 4,325.6( - ) Adjustment to present value (16.3) (13.2)( - ) Allowance for doubtful accounts (406.5) (432.0)
3,095.8 3,880.4 Current 3,085.1 3,876.3Non-current 10.7 4.1
Notes receivable 367.9 569.8( - ) Adjustment to present value (0.2) (2.9)( - ) Allowance for doubtful accounts (32.2) (32.4)
335.5 534.5 Current 149.0 303.7Non-current (1) 186.5 230.8
(1) Weighted average maturity of 3.38 years.
On December 31, 2016 notes receivable are comprised mainly by receivables from the (i) sale of Ana Rech assets to JBS, of R$52.6 and (ii) disposal of various otherassets and farms, R$272.5. Trade accounts receivable from related parties are disclosed in note 31 and refers to transactions with associates UP! in the domestic market and with joint ventureSATS BRF in the foreign market. The rollforward of allowance for doubtful accounts is presented below:
F-55
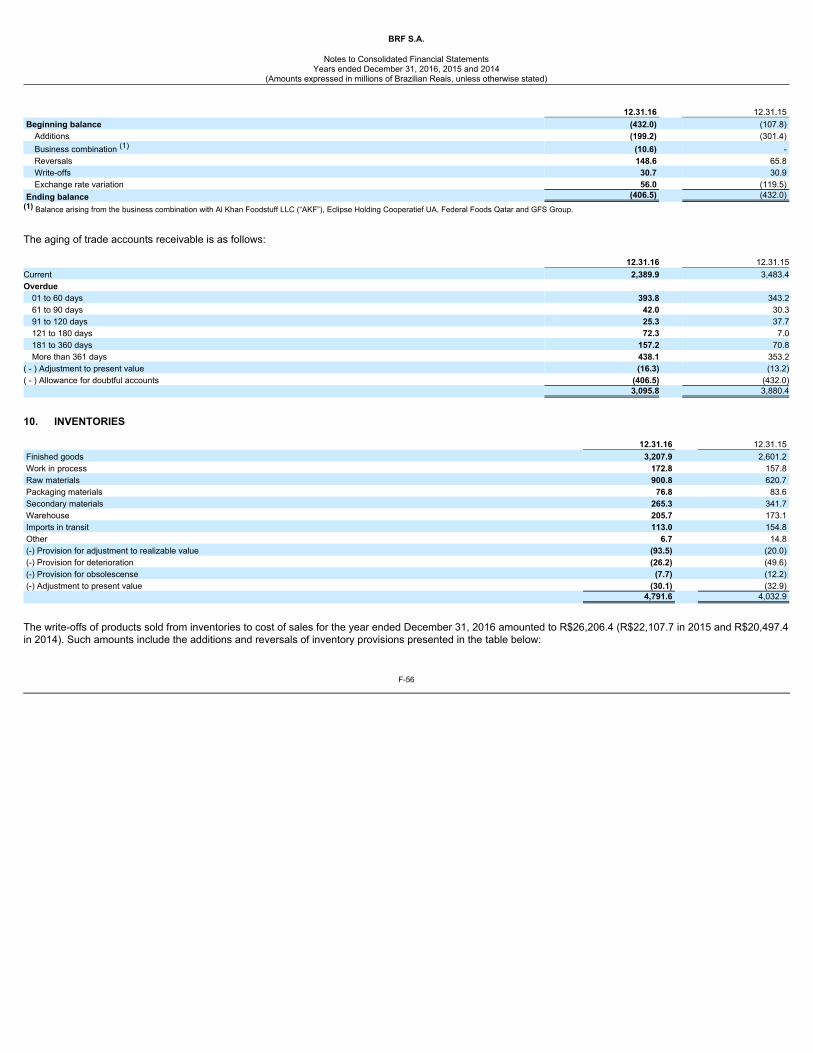
BRF S.A.
Notes to Consolidated Financial Statements
Years ended December 31, 2016, 2015 and 2014(Amounts expressed in millions of Brazilian Reais, unless otherwise stated)
12.31.16 12.31.15Beginning balance (432.0) (107.8)
Additions (199.2) (301.4)Business combination (1) (10.6) -Reversals 148.6 65.8Write-offs 30.7 30.9Exchange rate variation 56.0 (119.5)
Ending balance (406.5) (432.0)(1) Balance arising from the business combination with Al Khan Foodstuff LLC (“AKF”), Eclipse Holding Cooperatief UA, Federal Foods Qatar and GFS Group.
The aging of trade accounts receivable is as follows: 12.31.16 12.31.15Current 2,389.9 3,483.4Overdue
01 to 60 days 393.8 343.261 to 90 days 42.0 30.391 to 120 days 25.3 37.7121 to 180 days 72.3 7.0181 to 360 days 157.2 70.8More than 361 days 438.1 353.2
( - ) Adjustment to present value (16.3) (13.2)( - ) Allowance for doubtful accounts (406.5) (432.0) 3,095.8 3,880.4
10. INVENTORIES 12.31.16 12.31.15Finished goods 3,207.9 2,601.2Work in process 172.8 157.8Raw materials 900.8 620.7Packaging materials 76.8 83.6Secondary materials 265.3 341.7Warehouse 205.7 173.1Imports in transit 113.0 154.8Other 6.7 14.8(-) Provision for adjustment to realizable value (93.5) (20.0)(-) Provision for deterioration (26.2) (49.6)(-) Provision for obsolescense (7.7) (12.2)(-) Adjustment to present value (30.1) (32.9) 4,791.6 4,032.9
The write-offs of products sold from inventories to cost of sales for the year ended December 31, 2016 amounted to R$26,206.4 (R$22,107.7 in 2015 and R$20,497.4in 2014). Such amounts include the additions and reversals of inventory provisions presented in the table below:
F-56
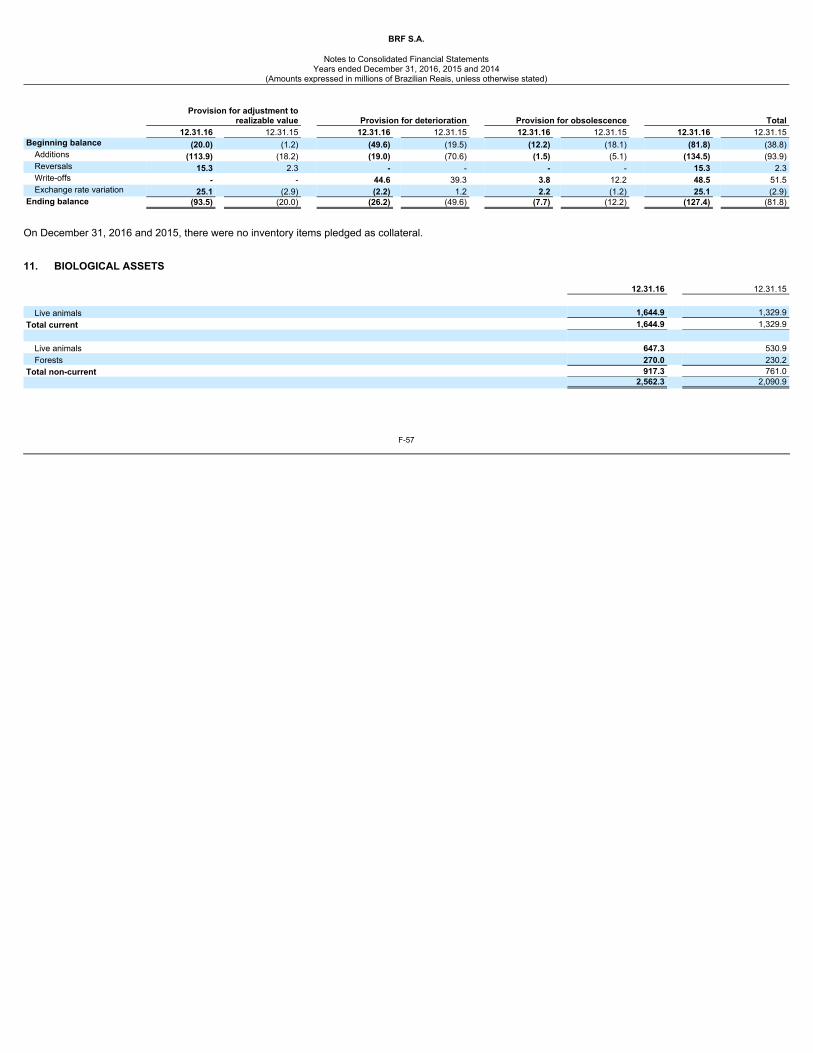
BRF S.A.
Notes to Consolidated Financial Statements
Years ended December 31, 2016, 2015 and 2014(Amounts expressed in millions of Brazilian Reais, unless otherwise stated)
Provision for adjustment to
realizable value Provision for deterioration Provision for obsolescence Total 12.31.16 12.31.15 12.31.16 12.31.15 12.31.16 12.31.15 12.31.16 12.31.15Beginning balance (20.0) (1.2) (49.6) (19.5) (12.2) (18.1) (81.8) (38.8)
Additions (113.9) (18.2) (19.0) (70.6) (1.5) (5.1) (134.5) (93.9)Reversals 15.3 2.3 - - - - 15.3 2.3Write-offs - - 44.6 39.3 3.8 12.2 48.5 51.5Exchange rate variation 25.1 (2.9) (2.2) 1.2 2.2 (1.2) 25.1 (2.9)
Ending balance (93.5) (20.0) (26.2) (49.6) (7.7) (12.2) (127.4) (81.8)
On December 31, 2016 and 2015, there were no inventory items pledged as collateral. 11. BIOLOGICAL ASSETS 12.31.16 12.31.15
Live animals 1,644.9 1,329.9Total current 1,644.9 1,329.9
Live animals 647.3 530.9Forests 270.0 230.2
Total non-current 917.3 761.0 2,562.3 2,090.9
F-57
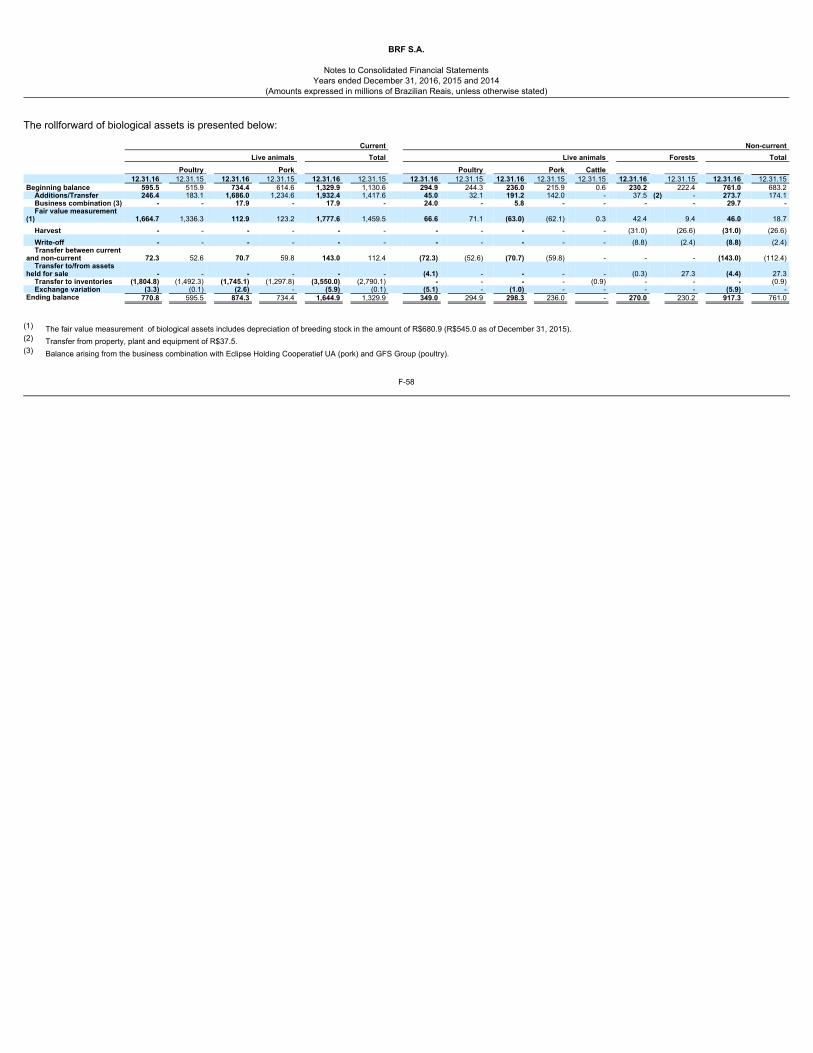
BRF S.A.
Notes to Consolidated Financial StatementsYears ended December 31, 2016, 2015 and 2014
(Amounts expressed in millions of Brazilian Reais, unless otherwise stated)
The rollforward of biological assets is presented below: Current Non-current Live animals Total Live animals Forests Total
Poultry Pork Poultry Pork Cattle 12.31.16 12.31.15 12.31.16 12.31.15 12.31.16 12.31.15 12.31.16 12.31.15 12.31.16 12.31.15 12.31.15 12.31.16 12.31.15 12.31.16 12.31.15Beginning balance 595.5 515.9 734.4 614.6 1,329.9 1,130.6 294.9 244.3 236.0 215.9 0.6 230.2 222.4 761.0 683.2
Additions/Transfer 246.4 183.1 1,686.0 1,234.6 1,932.4 1,417.6 45.0 32.1 191.2 142.0 - 37.5 (2) - 273.7 174.1Business combination (3) - - 17.9 - 17.9 - 24.0 - 5.8 - - - - 29.7 -Fair value measurement
(1) 1,664.7 1,336.3 112.9 123.2 1,777.6 1,459.5 66.6 71.1 (63.0) (62.1) 0.3 42.4 9.4 46.0 18.7Harvest - - - - - - - - - - - (31.0) (26.6) (31.0) (26.6)Write-off - - - - - - - - - - - (8.8) (2.4) (8.8) (2.4)Transfer between current
and non-current 72.3 52.6 70.7 59.8 143.0 112.4 (72.3) (52.6) (70.7) (59.8) - - - (143.0) (112.4)Transfer to/from assets
held for sale - - - - - - (4.1) - - - - (0.3) 27.3 (4.4) 27.3Transfer to inventories (1,804.8) (1,492.3) (1,745.1) (1,297.8) (3,550.0) (2,790.1) - - - - (0.9) - - - (0.9)Exchange variation (3.3) (0.1) (2.6) - (5.9) (0.1) (5.1) - (1.0) - - - - (5.9) -
Ending balance 770.8 595.5 874.3 734.4 1,644.9 1,329.9 349.0 294.9 298.3 236.0 - 270.0 230.2 917.3 761.0
(1) The fair value measurement of biological assets includes depreciation of breeding stock in the amount of R$680.9 (R$545.0 as of December 31, 2015).(2) Transfer from property, plant and equipment of R$37.5.(3) Balance arising from the business combination with Eclipse Holding Cooperatief UA (pork) and GFS Group (poultry).
F-58
BRF S.A.
Notes to Consolidated Financial Statements
Years ended December 31, 2016, 2015 and 2014(Amounts expressed in millions of Brazilian Reais, unless otherwise stated)
The acquisitions of biological assets for production (non-current) occur when the Company expects that the production plan cannot be met with its ownanimals. These acquisitions refer to immature animals in the beginning of the life cycle. The living animals comprises poultry and pork and are segregated into consumable and for production. The animals classified as consumables are those intended for slaughtering to produce in-natura meat or processed products. Until they reach the adequate weightfor slaughtering, they are classified as immature. The slaughtering and production process occurs sequentially and in a very short period of time, so that only liveanimals ready for slaughtering are classified as mature. The animals classified as for production (breeding stock) are those that produce other biological assets. Until they reach the age of reproduction they are classified asimmature and when they are able to initiate the reproductive cycle, they are classified as mature. The Company has determined that the cost approach is the most appropriate methodology valuation technique allowed under IFRS 13 for calculating the fair valuemeasurement of its live animals, as particularly given the short life of the biological assets, the price that would be received from a market participant for the assetswould be based on the cost to such a participant to raise an animal to the same point in its lifecycle. In the case of animals held for breeding, this cost is reducedover time to take account of its decline in value over its useful life. The Company has determined that the income approach is the most appropriate valuationtechnique allowed under IFRS 13 for calculating the fair value measurement of its forests due to the longer lives of such assets. The fair value of live animals and forests is determined using inputs that are unobservable, using the best information available in the circumstances for using theassets and therefore are classified in the level 3 category of fair value measurement under IFRS 13.
F-59
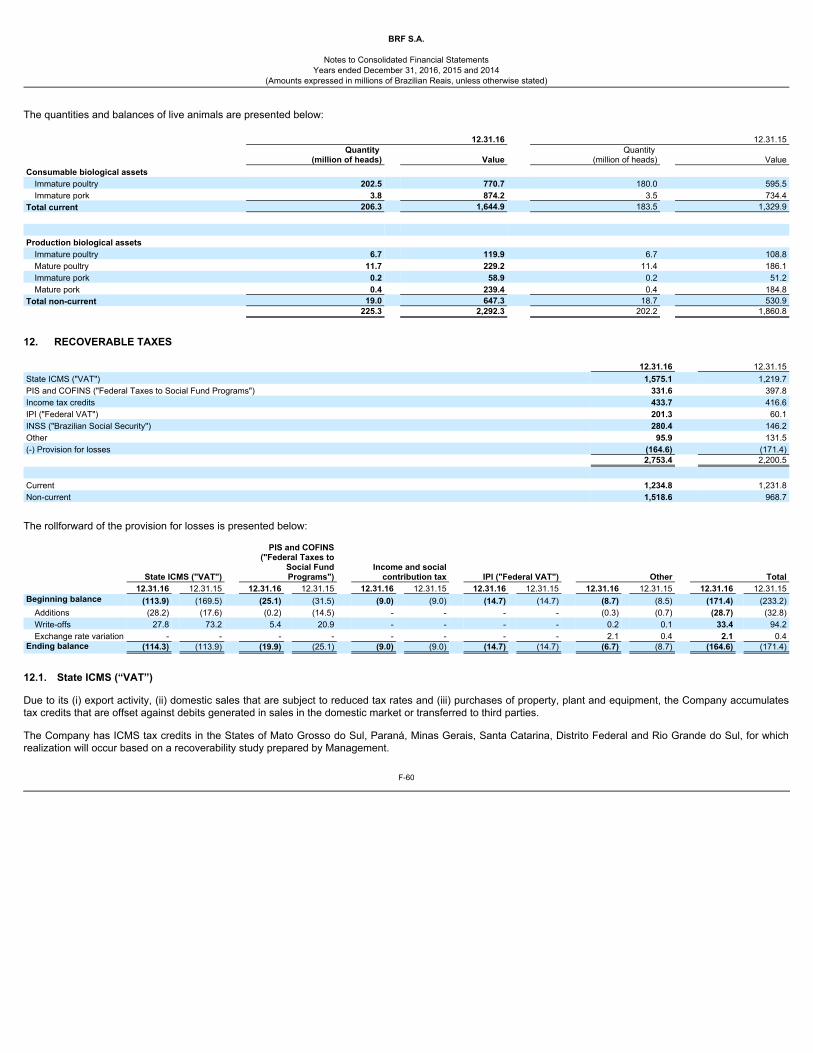
BRF S.A.
Notes to Consolidated Financial Statements
Years ended December 31, 2016, 2015 and 2014(Amounts expressed in millions of Brazilian Reais, unless otherwise stated)
The quantities and balances of live animals are presented below: 12.31.16 12.31.15
Quantity
(million of heads) Value Quantity
(million of heads) ValueConsumable biological assets
Immature poultry 202.5 770.7 180.0 595.5Immature pork 3.8 874.2 3.5 734.4
Total current 206.3 1,644.9 183.5 1,329.9 Production biological assets
Immature poultry 6.7 119.9 6.7 108.8Mature poultry 11.7 229.2 11.4 186.1Immature pork 0.2 58.9 0.2 51.2Mature pork 0.4 239.4 0.4 184.8
Total non-current 19.0 647.3 18.7 530.9 225.3 2,292.3 202.2 1,860.8
12. RECOVERABLE TAXES 12.31.16 12.31.15State ICMS ("VAT") 1,575.1 1,219.7PIS and COFINS ("Federal Taxes to Social Fund Programs") 331.6 397.8Income tax credits 433.7 416.6IPI ("Federal VAT") 201.3 60.1INSS ("Brazilian Social Security") 280.4 146.2Other 95.9 131.5(-) Provision for losses (164.6) (171.4) 2,753.4 2,200.5 Current 1,234.8 1,231.8Non-current 1,518.6 968.7
The rollforward of the provision for losses is presented below:
State ICMS ("VAT")
PIS and COFINS("Federal Taxes to
Social FundPrograms")
Income and socialcontribution tax IPI ("Federal VAT") Other Total
12.31.16 12.31.15 12.31.16 12.31.15 12.31.16 12.31.15 12.31.16 12.31.15 12.31.16 12.31.15 12.31.16 12.31.15Beginning balance (113.9) (169.5) (25.1) (31.5) (9.0) (9.0) (14.7) (14.7) (8.7) (8.5) (171.4) (233.2)
Additions (28.2) (17.6) (0.2) (14.5) - - - - (0.3) (0.7) (28.7) (32.8)Write-offs 27.8 73.2 5.4 20.9 - - - - 0.2 0.1 33.4 94.2Exchange rate variation - - - - - - - - 2.1 0.4 2.1 0.4
Ending balance (114.3) (113.9) (19.9) (25.1) (9.0) (9.0) (14.7) (14.7) (6.7) (8.7) (164.6) (171.4)
12.1. State ICMS (“VAT”) Due to its (i) export activity, (ii) domestic sales that are subject to reduced tax rates and (iii) purchases of property, plant and equipment, the Company accumulatestax credits that are offset against debits generated in sales in the domestic market or transferred to third parties. The Company has ICMS tax credits in the States of Mato Grosso do Sul, Paraná, Minas Gerais, Santa Catarina, Distrito Federal and Rio Grande do Sul, for whichrealization will occur based on a recoverability study prepared by Management.
F-60
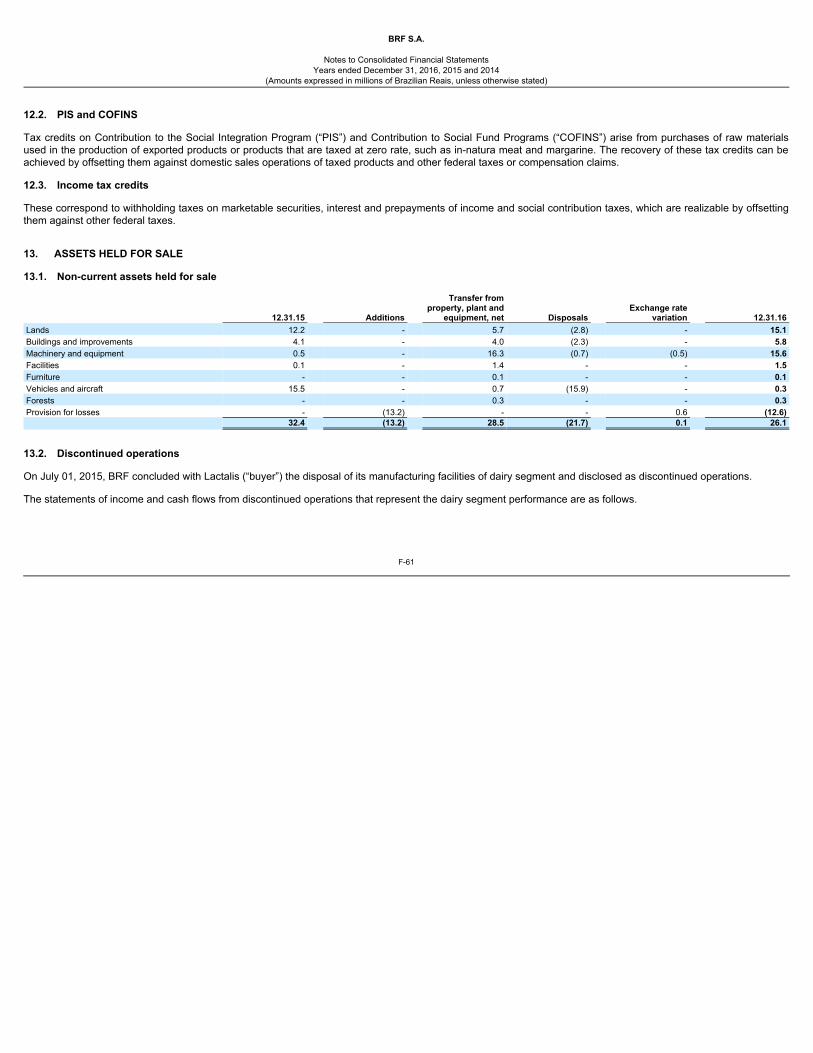
BRF S.A.
Notes to Consolidated Financial Statements
Years ended December 31, 2016, 2015 and 2014(Amounts expressed in millions of Brazilian Reais, unless otherwise stated)
12.2. PIS and COFINS
Tax credits on Contribution to the Social Integration Program (“PIS”) and Contribution to Social Fund Programs (“COFINS”) arise from purchases of raw materialsused in the production of exported products or products that are taxed at zero rate, such as in-natura meat and margarine. The recovery of these tax credits can beachieved by offsetting them against domestic sales operations of taxed products and other federal taxes or compensation claims. 12.3. Income tax credits
These correspond to withholding taxes on marketable securities, interest and prepayments of income and social contribution taxes, which are realizable by offsettingthem against other federal taxes. 13. ASSETS HELD FOR SALE 13.1. Non-current assets held for sale
12.31.15 Additions
Transfer fromproperty, plant and
equipment, net Disposals Exchange rate
variation 12.31.16Lands 12.2 - 5.7 (2.8) - 15.1Buildings and improvements 4.1 - 4.0 (2.3) - 5.8Machinery and equipment 0.5 - 16.3 (0.7) (0.5) 15.6Facilities 0.1 - 1.4 - - 1.5Furniture - - 0.1 - - 0.1Vehicles and aircraft 15.5 - 0.7 (15.9) - 0.3Forests - - 0.3 - - 0.3Provision for losses - (13.2) - - 0.6 (12.6) 32.4 (13.2) 28.5 (21.7) 0.1 26.1
13.2. Discontinued operations On July 01, 2015, BRF concluded with Lactalis (“buyer”) the disposal of its manufacturing facilities of dairy segment and disclosed as discontinued operations. The statements of income and cash flows from discontinued operations that represent the dairy segment performance are as follows.
F-61
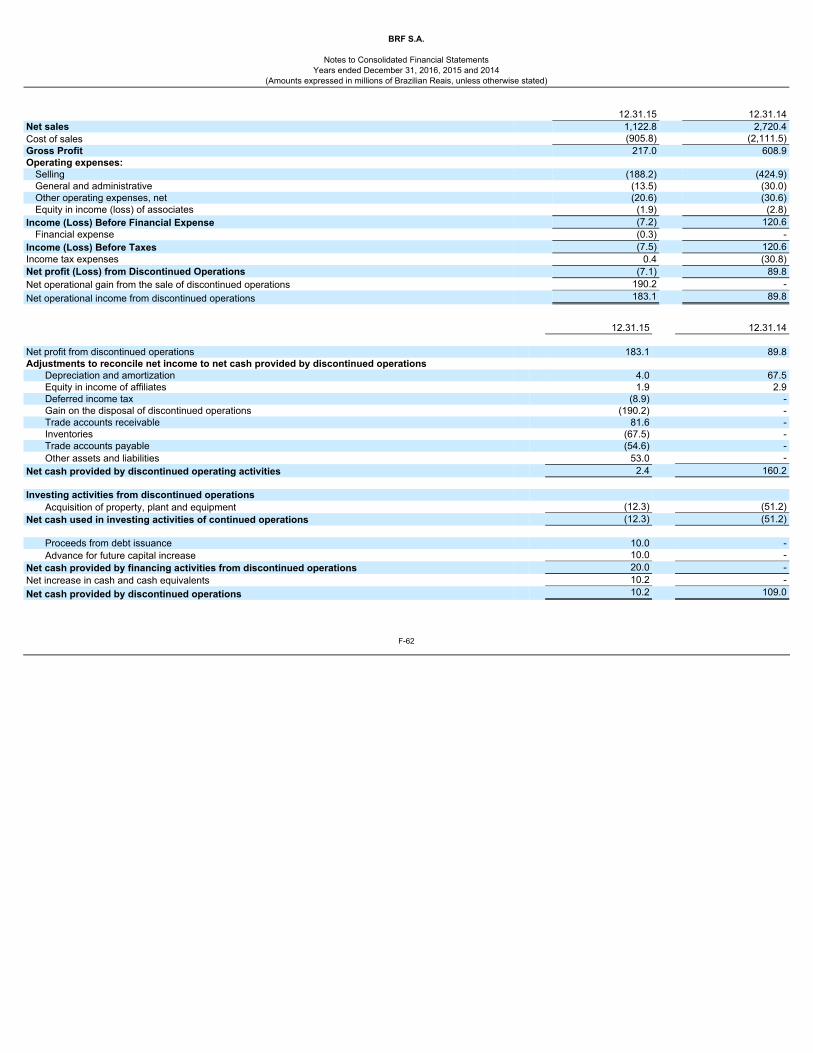
BRF S.A.
Notes to Consolidated Financial Statements
Years ended December 31, 2016, 2015 and 2014(Amounts expressed in millions of Brazilian Reais, unless otherwise stated)
12.31.15 12.31.14Net sales 1,122.8 2,720.4Cost of sales (905.8) (2,111.5)Gross Profit 217.0 608.9Operating expenses:
Selling (188.2) (424.9)General and administrative (13.5) (30.0)Other operating expenses, net (20.6) (30.6)Equity in income (loss) of associates (1.9) (2.8)
Income (Loss) Before Financial Expense (7.2) 120.6Financial expense (0.3) -
Income (Loss) Before Taxes (7.5) 120.6Income tax expenses 0.4 (30.8)Net profit (Loss) from Discontinued Operations (7.1) 89.8Net operational gain from the sale of discontinued operations 190.2 -Net operational income from discontinued operations 183.1 89.8
12.31.15 12.31.14 Net profit from discontinued operations 183.1 89.8Adjustments to reconcile net income to net cash provided by discontinued operations
Depreciation and amortization 4.0 67.5Equity in income of affiliates 1.9 2.9Deferred income tax (8.9) -Gain on the disposal of discontinued operations (190.2) -Trade accounts receivable 81.6 -Inventories (67.5) -Trade accounts payable (54.6) -Other assets and liabilities 53.0 -
Net cash provided by discontinued operating activities 2.4 160.2 Investing activities from discontinued operations
Acquisition of property, plant and equipment (12.3) (51.2)Net cash used in investing activities of continued operations (12.3) (51.2)
Proceeds from debt issuance 10.0 -Advance for future capital increase 10.0 -
Net cash provided by financing activities from discontinued operations 20.0 -Net increase in cash and cash equivalents 10.2 -Net cash provided by discontinued operations 10.2 109.0
F-62
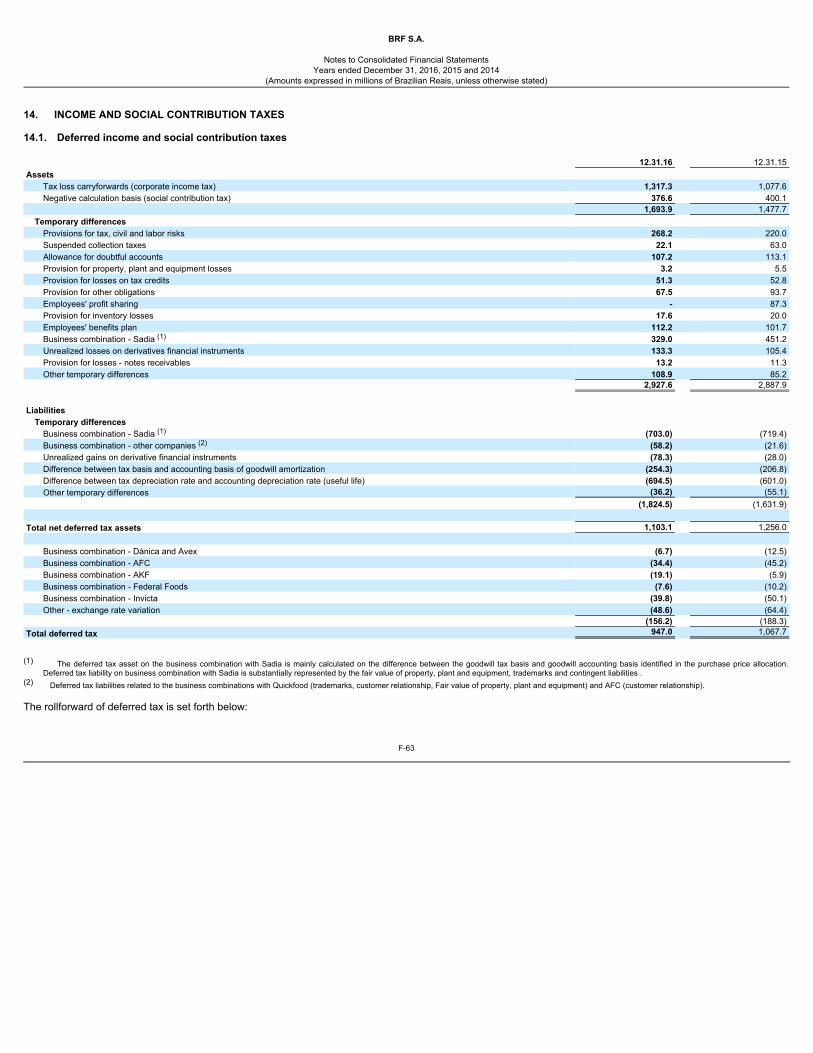
BRF S.A.
Notes to Consolidated Financial Statements
Years ended December 31, 2016, 2015 and 2014(Amounts expressed in millions of Brazilian Reais, unless otherwise stated)
14. INCOME AND SOCIAL CONTRIBUTION TAXES 14.1. Deferred income and social contribution taxes 12.31.16 12.31.15Assets
Tax loss carryforwards (corporate income tax) 1,317.3 1,077.6Negative calculation basis (social contribution tax) 376.6 400.1
1,693.9 1,477.7Temporary differences
Provisions for tax, civil and labor risks 268.2 220.0Suspended collection taxes 22.1 63.0Allowance for doubtful accounts 107.2 113.1Provision for property, plant and equipment losses 3.2 5.5Provision for losses on tax credits 51.3 52.8Provision for other obligations 67.5 93.7Employees' profit sharing - 87.3Provision for inventory losses 17.6 20.0Employees' benefits plan 112.2 101.7Business combination - Sadia (1) 329.0 451.2Unrealized losses on derivatives financial instruments 133.3 105.4Provision for losses - notes receivables 13.2 11.3Other temporary differences 108.9 85.2
2,927.6 2,887.9 Liabilities
Temporary differences Business combination - Sadia (1) (703.0) (719.4)Business combination - other companies (2) (58.2) (21.6)Unrealized gains on derivative financial instruments (78.3) (28.0)Difference between tax basis and accounting basis of goodwill amortization (254.3) (206.8)Difference between tax depreciation rate and accounting depreciation rate (useful life) (694.5) (601.0)Other temporary differences (36.2) (55.1)
(1,824.5) (1,631.9) Total net deferred tax assets 1,103.1 1,256.0
Business combination - Dánica and Avex (6.7) (12.5)Business combination - AFC (34.4) (45.2)Business combination - AKF (19.1) (5.9)Business combination - Federal Foods (7.6) (10.2)Business combination - Invicta (39.8) (50.1)Other - exchange rate variation (48.6) (64.4)
(156.2) (188.3)Total deferred tax 947.0 1,067.7
(1) The deferred tax asset on the business combination with Sadia is mainly calculated on the difference between the goodwill tax basis and goodwill accounting basis identified in the purchase price allocation.Deferred tax liability on business combination with Sadia is substantially represented by the fair value of property, plant and equipment, trademarks and contingent liabilities .
(2) Deferred tax liabilities related to the business combinations with Quickfood (trademarks, customer relationship, Fair value of property, plant and equipment) and AFC (customer relationship). The rollforward of deferred tax is set forth below:
F-63
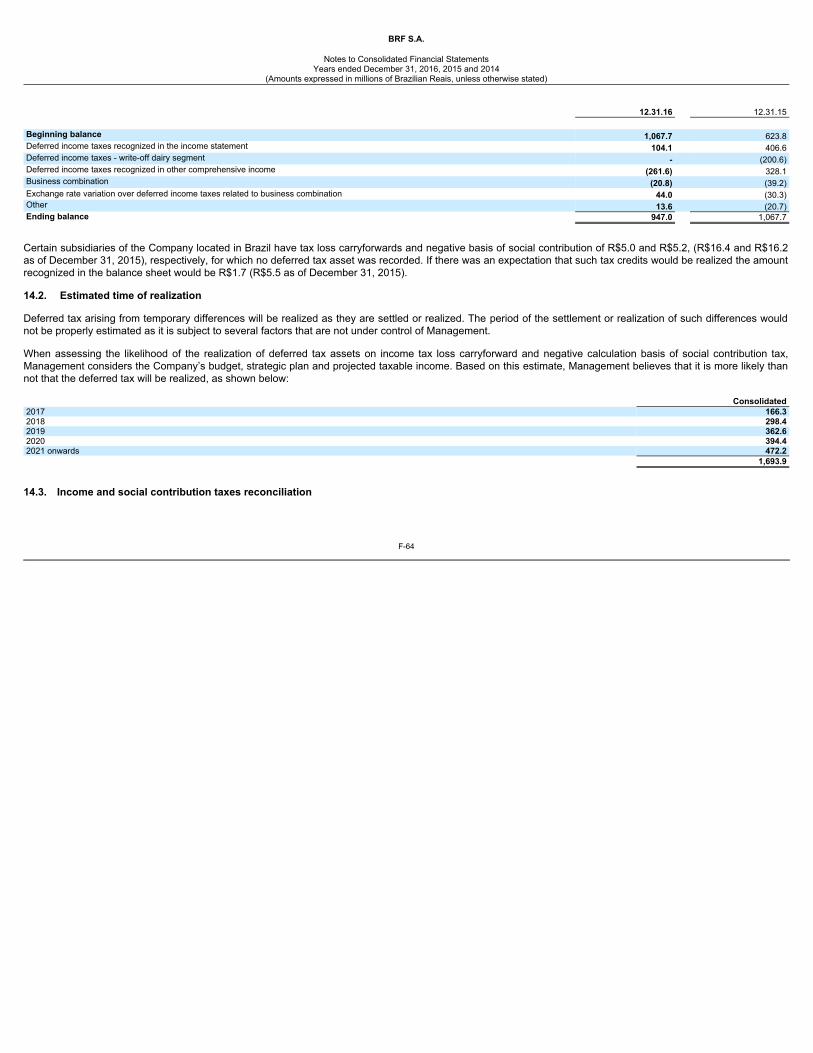
BRF S.A.
Notes to Consolidated Financial Statements
Years ended December 31, 2016, 2015 and 2014(Amounts expressed in millions of Brazilian Reais, unless otherwise stated)
12.31.16 12.31.15 Beginning balance 1,067.7 623.8Deferred income taxes recognized in the income statement 104.1 406.6Deferred income taxes - write-off dairy segment - (200.6)Deferred income taxes recognized in other comprehensive income (261.6) 328.1Business combination (20.8) (39.2)Exchange rate variation over deferred income taxes related to business combination 44.0 (30.3)Other 13.6 (20.7)Ending balance 947.0 1,067.7
Certain subsidiaries of the Company located in Brazil have tax loss carryforwards and negative basis of social contribution of R$5.0 and R$5.2, (R$16.4 and R$16.2as of December 31, 2015), respectively, for which no deferred tax asset was recorded. If there was an expectation that such tax credits would be realized the amountrecognized in the balance sheet would be R$1.7 (R$5.5 as of December 31, 2015). 14.2. Estimated time of realization Deferred tax arising from temporary differences will be realized as they are settled or realized. The period of the settlement or realization of such differences wouldnot be properly estimated as it is subject to several factors that are not under control of Management. When assessing the likelihood of the realization of deferred tax assets on income tax loss carryforward and negative calculation basis of social contribution tax,Management considers the Company’s budget, strategic plan and projected taxable income. Based on this estimate, Management believes that it is more likely thannot that the deferred tax will be realized, as shown below: Consolidated2017 166.32018 298.42019 362.62020 394.42021 onwards 472.2 1,693.9
14.3. Income and social contribution taxes reconciliation
F-64
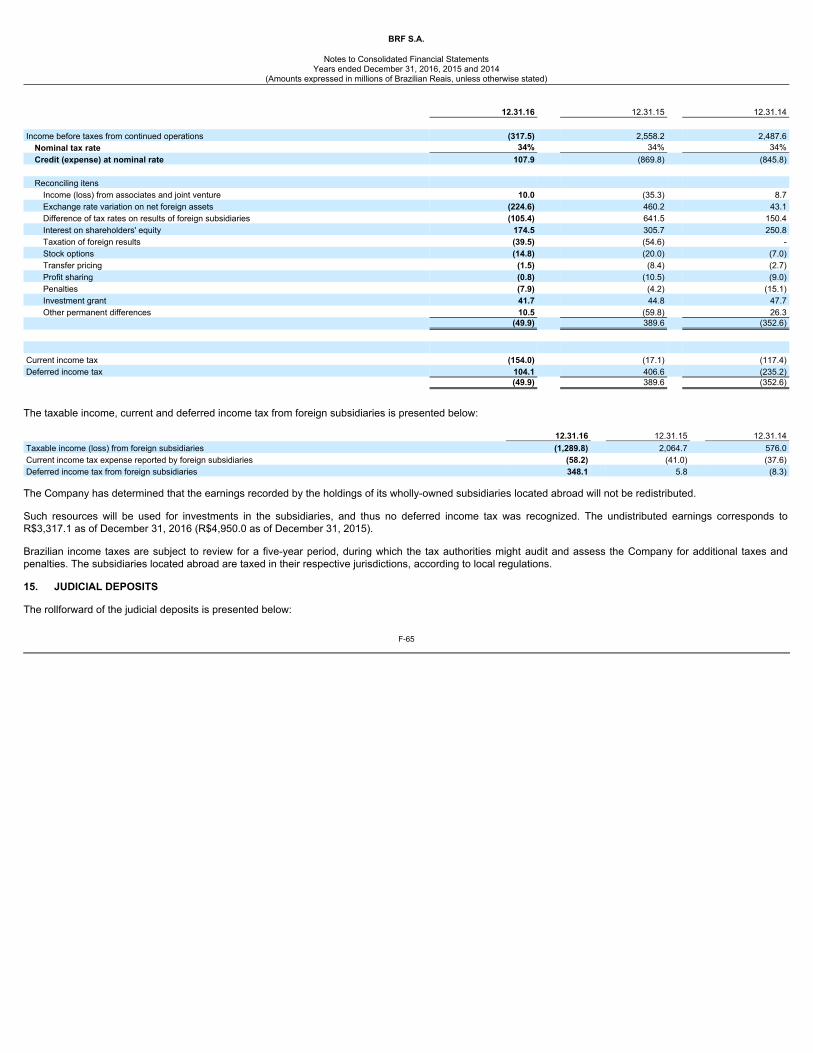
BRF S.A.
Notes to Consolidated Financial Statements
Years ended December 31, 2016, 2015 and 2014(Amounts expressed in millions of Brazilian Reais, unless otherwise stated)
12.31.16 12.31.15 12.31.14 Income before taxes from continued operations (317.5) 2,558.2 2,487.6
Nominal tax rate 34% 34% 34%Credit (expense) at nominal rate 107.9 (869.8) (845.8)
Reconciling itens
Income (loss) from associates and joint venture 10.0 (35.3) 8.7Exchange rate variation on net foreign assets (224.6) 460.2 43.1Difference of tax rates on results of foreign subsidiaries (105.4) 641.5 150.4Interest on shareholders' equity 174.5 305.7 250.8Taxation of foreign results (39.5) (54.6) -Stock options (14.8) (20.0) (7.0)Transfer pricing (1.5) (8.4) (2.7)Profit sharing (0.8) (10.5) (9.0)Penalties (7.9) (4.2) (15.1)Investment grant 41.7 44.8 47.7Other permanent differences 10.5 (59.8) 26.3
(49.9) 389.6 (352.6) Current income tax (154.0) (17.1) (117.4)Deferred income tax 104.1 406.6 (235.2) (49.9) 389.6 (352.6)
The taxable income, current and deferred income tax from foreign subsidiaries is presented below: 12.31.16 12.31.15 12.31.14Taxable income (loss) from foreign subsidiaries (1,289.8) 2,064.7 576.0Current income tax expense reported by foreign subsidiaries (58.2) (41.0) (37.6)Deferred income tax from foreign subsidiaries 348.1 5.8 (8.3)
The Company has determined that the earnings recorded by the holdings of its wholly-owned subsidiaries located abroad will not be redistributed. Such resources will be used for investments in the subsidiaries, and thus no deferred income tax was recognized. The undistributed earnings corresponds toR$3,317.1 as of December 31, 2016 (R$4,950.0 as of December 31, 2015). Brazilian income taxes are subject to review for a five-year period, during which the tax authorities might audit and assess the Company for additional taxes andpenalties. The subsidiaries located abroad are taxed in their respective jurisdictions, according to local regulations. 15. JUDICIAL DEPOSITS The rollforward of the judicial deposits is presented below:
F-65
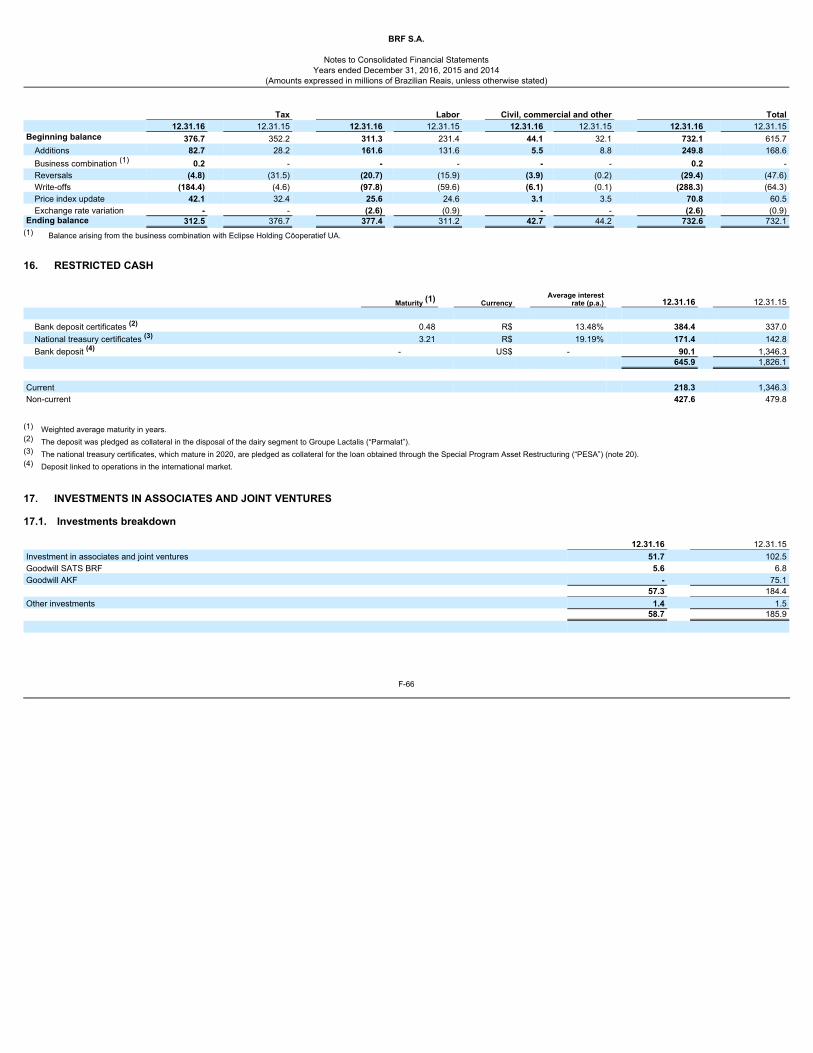
BRF S.A.
Notes to Consolidated Financial Statements
Years ended December 31, 2016, 2015 and 2014(Amounts expressed in millions of Brazilian Reais, unless otherwise stated)
Tax Labor Civil, commercial and other Total 12.31.16 12.31.15 12.31.16 12.31.15 12.31.16 12.31.15 12.31.16 12.31.15Beginning balance 376.7 352.2 311.3 231.4 44.1 32.1 732.1 615.7
Additions 82.7 28.2 161.6 131.6 5.5 8.8 249.8 168.6Business combination (1) 0.2 - - - - - 0.2 -Reversals (4.8) (31.5) (20.7) (15.9) (3.9) (0.2) (29.4) (47.6)Write-offs (184.4) (4.6) (97.8) (59.6) (6.1) (0.1) (288.3) (64.3)Price index update 42.1 32.4 25.6 24.6 3.1 3.5 70.8 60.5Exchange rate variation - - (2.6) (0.9) - - (2.6) (0.9)
Ending balance 312.5 376.7 377.4 311.2 42.7 44.2 732.6 732.1(1) Balance arising from the business combination with Eclipse Holding Cöoperatief UA.
16. RESTRICTED CASH
Average interestrate (p.a.)
Maturity (1) Currency 12.31.16 12.31.15
Bank deposit certificates (2) 0.48 R$ 13.48% 384.4 337.0National treasury certificates (3) 3.21 R$ 19.19% 171.4 142.8Bank deposit (4) - US$ - 90.1 1,346.3
645.9 1,826.1 Current 218.3 1,346.3Non-current 427.6 479.8
(1) Weighted average maturity in years.(2) The deposit was pledged as collateral in the disposal of the dairy segment to Groupe Lactalis (“Parmalat”).(3) The national treasury certificates, which mature in 2020, are pledged as collateral for the loan obtained through the Special Program Asset Restructuring (“PESA”) (note 20).(4) Deposit linked to operations in the international market. 17. INVESTMENTS IN ASSOCIATES AND JOINT VENTURES 17.1. Investments breakdown 12.31.16 12.31.15Investment in associates and joint ventures 51.7 102.5Goodwill SATS BRF 5.6 6.8Goodwill AKF - 75.1 57.3 184.4Other investments 1.4 1.5 58.7 185.9
F-66
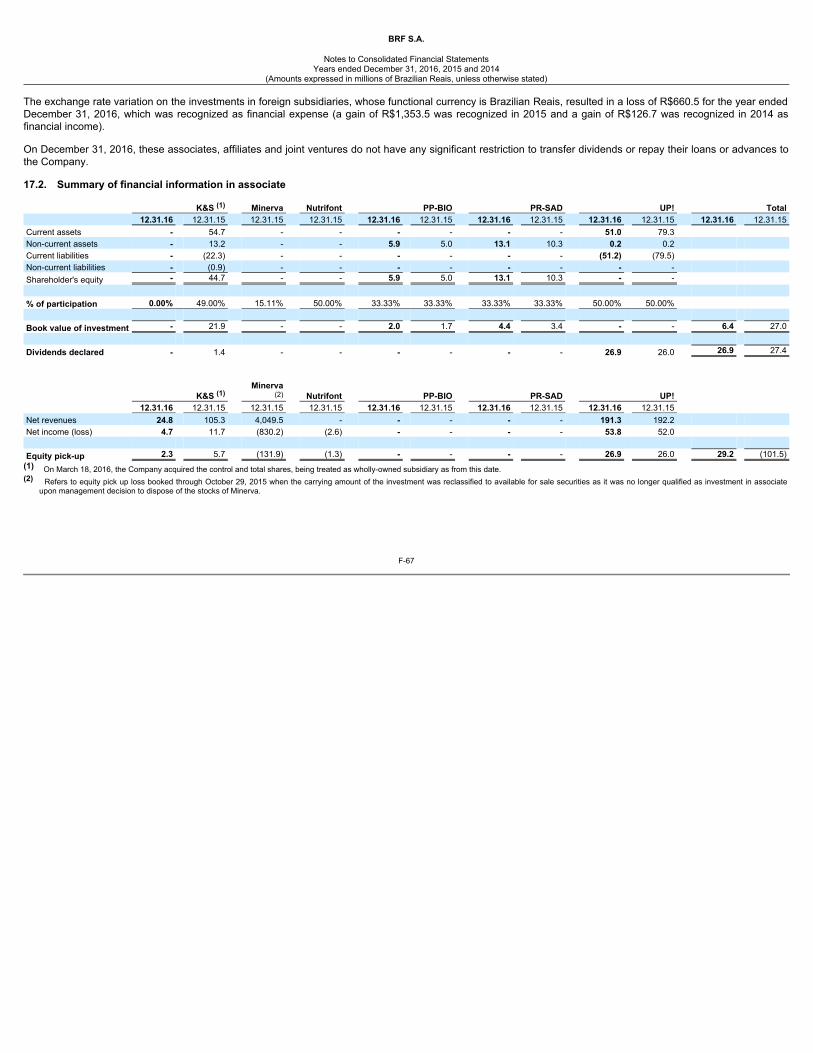
BRF S.A.
Notes to Consolidated Financial Statements
Years ended December 31, 2016, 2015 and 2014(Amounts expressed in millions of Brazilian Reais, unless otherwise stated)
The exchange rate variation on the investments in foreign subsidiaries, whose functional currency is Brazilian Reais, resulted in a loss of R$660.5 for the year endedDecember 31, 2016, which was recognized as financial expense (a gain of R$1,353.5 was recognized in 2015 and a gain of R$126.7 was recognized in 2014 asfinancial income). On December 31, 2016, these associates, affiliates and joint ventures do not have any significant restriction to transfer dividends or repay their loans or advances tothe Company. 17.2. Summary of financial information in associate
K&S (1) Minerva Nutrifont PP-BIO PR-SAD UP! Total 12.31.16 12.31.15 12.31.15 12.31.15 12.31.16 12.31.15 12.31.16 12.31.15 12.31.16 12.31.15 12.31.16 12.31.15Current assets - 54.7 - - - - - - 51.0 79.3 Non-current assets - 13.2 - - 5.9 5.0 13.1 10.3 0.2 0.2 Current liabilities - (22.3) - - - - - - (51.2) (79.5) Non-current liabilities - (0.9) - - - - - - - - Shareholder's equity - 44.7 - - 5.9 5.0 13.1 10.3 - - % of participation 0.00% 49.00% 15.11% 50.00% 33.33% 33.33% 33.33% 33.33% 50.00% 50.00% Book value of investment - 21.9 - - 2.0 1.7 4.4 3.4 - - 6.4 27.0 Dividends declared - 1.4 - - - - - - 26.9 26.0 26.9 27.4
K&S (1) Minerva
(2) Nutrifont PP-BIO PR-SAD UP! 12.31.16 12.31.15 12.31.15 12.31.15 12.31.16 12.31.15 12.31.16 12.31.15 12.31.16 12.31.15 Net revenues 24.8 105.3 4,049.5 - - - - - 191.3 192.2 Net income (loss) 4.7 11.7 (830.2) (2.6) - - - - 53.8 52.0 Equity pick-up 2.3 5.7 (131.9) (1.3) - - - - 26.9 26.0 29.2 (101.5)
(1) On March 18, 2016, the Company acquired the control and total shares, being treated as wholly-owned subsidiary as from this date.(2) Refers to equity pick up loss booked through October 29, 2015 when the carrying amount of the investment was reclassified to available for sale securities as it was no longer qualified as investment in associate
upon management decision to dispose of the stocks of Minerva.
F-67
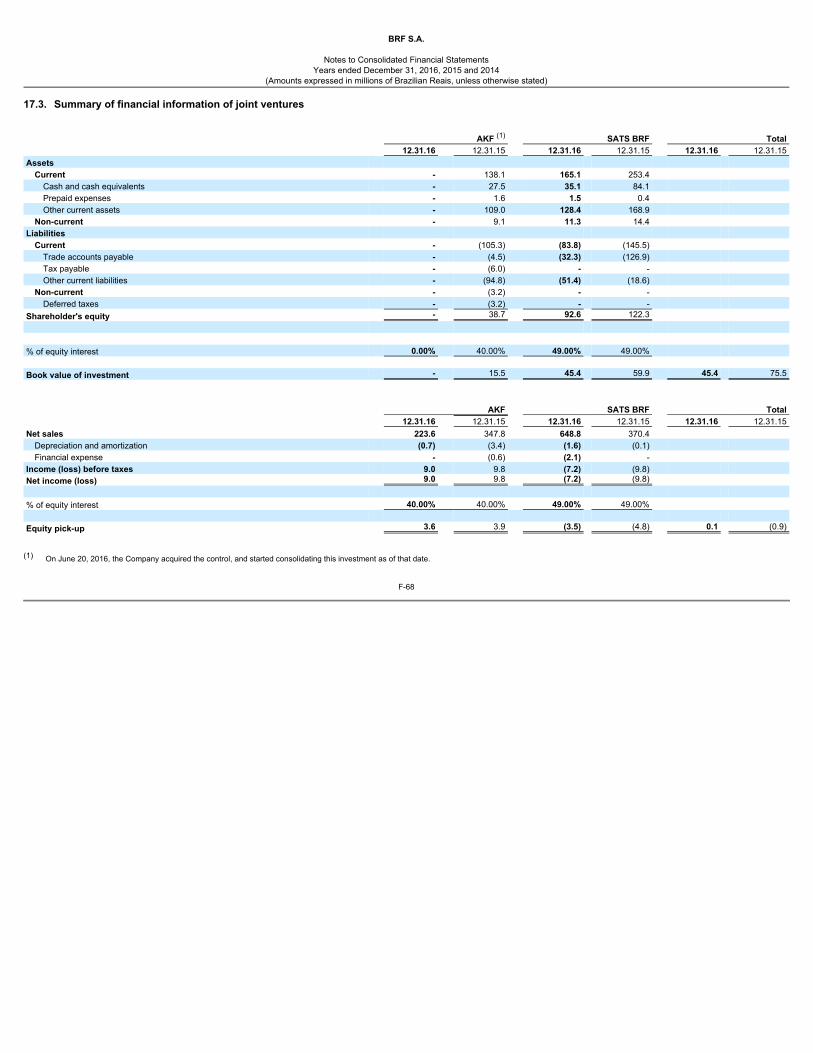
BRF S.A.
Notes to Consolidated Financial Statements
Years ended December 31, 2016, 2015 and 2014(Amounts expressed in millions of Brazilian Reais, unless otherwise stated)
17.3. Summary of financial information of joint ventures AKF (1) SATS BRF Total 12.31.16 12.31.15 12.31.16 12.31.15 12.31.16 12.31.15Assets
Current - 138.1 165.1 253.4 Cash and cash equivalents - 27.5 35.1 84.1 Prepaid expenses - 1.6 1.5 0.4 Other current assets - 109.0 128.4 168.9
Non-current - 9.1 11.3 14.4 Liabilities
Current - (105.3) (83.8) (145.5) Trade accounts payable - (4.5) (32.3) (126.9) Tax payable - (6.0) - - Other current liabilities - (94.8) (51.4) (18.6)
Non-current - (3.2) - - Deferred taxes - (3.2) - -
Shareholder's equity - 38.7 92.6 122.3 % of equity interest 0.00% 40.00% 49.00% 49.00% Book value of investment - 15.5 45.4 59.9 45.4 75.5 AKF SATS BRF Total 12.31.16 12.31.15 12.31.16 12.31.15 12.31.16 12.31.15Net sales 223.6 347.8 648.8 370.4
Depreciation and amortization (0.7) (3.4) (1.6) (0.1) Financial expense - (0.6) (2.1) -
Income (loss) before taxes 9.0 9.8 (7.2) (9.8) Net income (loss) 9.0 9.8 (7.2) (9.8) % of equity interest 40.00% 40.00% 49.00% 49.00% Equity pick-up 3.6 3.9 (3.5) (4.8) 0.1 (0.9)
(1) On June 20, 2016, the Company acquired the control, and started consolidating this investment as of that date.
F-68
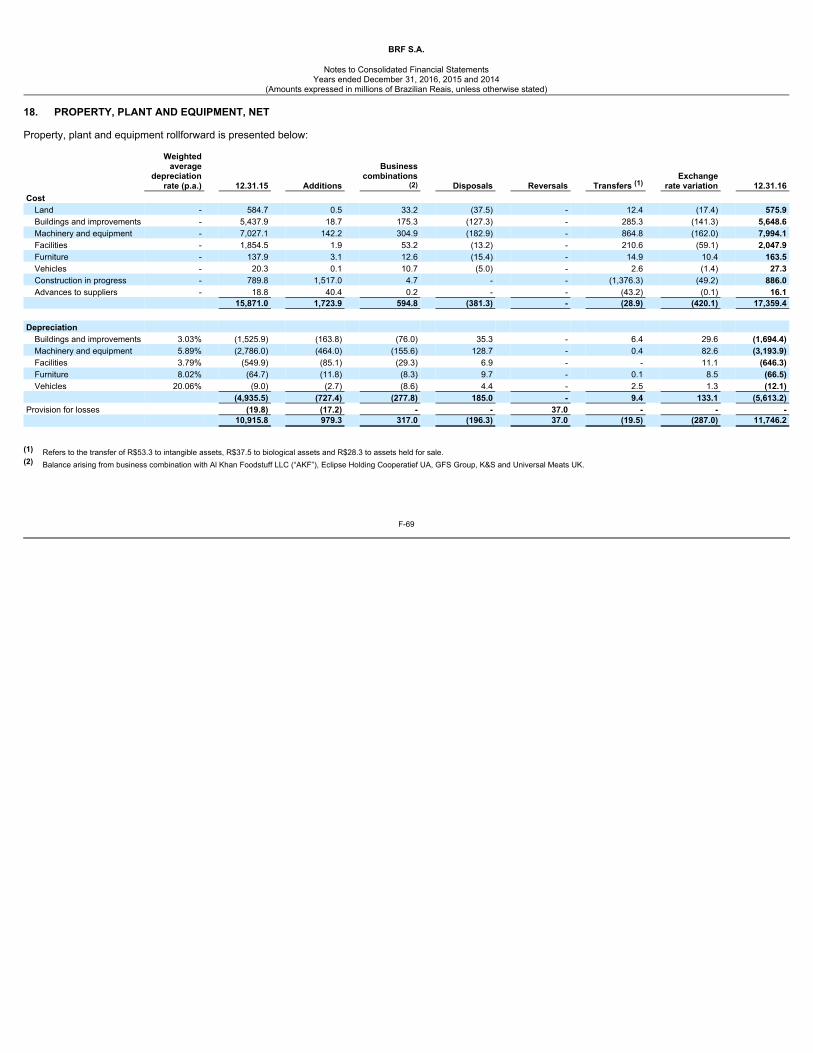
BRF S.A.
Notes to Consolidated Financial StatementsYears ended December 31, 2016, 2015 and 2014
(Amounts expressed in millions of Brazilian Reais, unless otherwise stated)
18. PROPERTY, PLANT AND EQUIPMENT, NET Property, plant and equipment rollforward is presented below:
Weightedaverage
depreciationrate (p.a.) 12.31.15 Additions
Businesscombinations
(2) Disposals Reversals Transfers (1) Exchange
rate variation 12.31.16Cost
Land - 584.7 0.5 33.2 (37.5) - 12.4 (17.4) 575.9Buildings and improvements - 5,437.9 18.7 175.3 (127.3) - 285.3 (141.3) 5,648.6Machinery and equipment - 7,027.1 142.2 304.9 (182.9) - 864.8 (162.0) 7,994.1Facilities - 1,854.5 1.9 53.2 (13.2) - 210.6 (59.1) 2,047.9Furniture - 137.9 3.1 12.6 (15.4) - 14.9 10.4 163.5Vehicles - 20.3 0.1 10.7 (5.0) - 2.6 (1.4) 27.3Construction in progress - 789.8 1,517.0 4.7 - - (1,376.3) (49.2) 886.0Advances to suppliers - 18.8 40.4 0.2 - - (43.2) (0.1) 16.1
15,871.0 1,723.9 594.8 (381.3) - (28.9) (420.1) 17,359.4 Depreciation
Buildings and improvements 3.03% (1,525.9) (163.8) (76.0) 35.3 - 6.4 29.6 (1,694.4)Machinery and equipment 5.89% (2,786.0) (464.0) (155.6) 128.7 - 0.4 82.6 (3,193.9)Facilities 3.79% (549.9) (85.1) (29.3) 6.9 - - 11.1 (646.3)Furniture 8.02% (64.7) (11.8) (8.3) 9.7 - 0.1 8.5 (66.5)Vehicles 20.06% (9.0) (2.7) (8.6) 4.4 - 2.5 1.3 (12.1)
(4,935.5) (727.4) (277.8) 185.0 - 9.4 133.1 (5,613.2)Provision for losses (19.8) (17.2) - - 37.0 - - - 10,915.8 979.3 317.0 (196.3) 37.0 (19.5) (287.0) 11,746.2
(1) Refers to the transfer of R$53.3 to intangible assets, R$37.5 to biological assets and R$28.3 to assets held for sale.(2) Balance arising from business combination with Al Khan Foodstuff LLC (“AKF”), Eclipse Holding Cooperatief UA, GFS Group, K&S and Universal Meats UK.
F-69
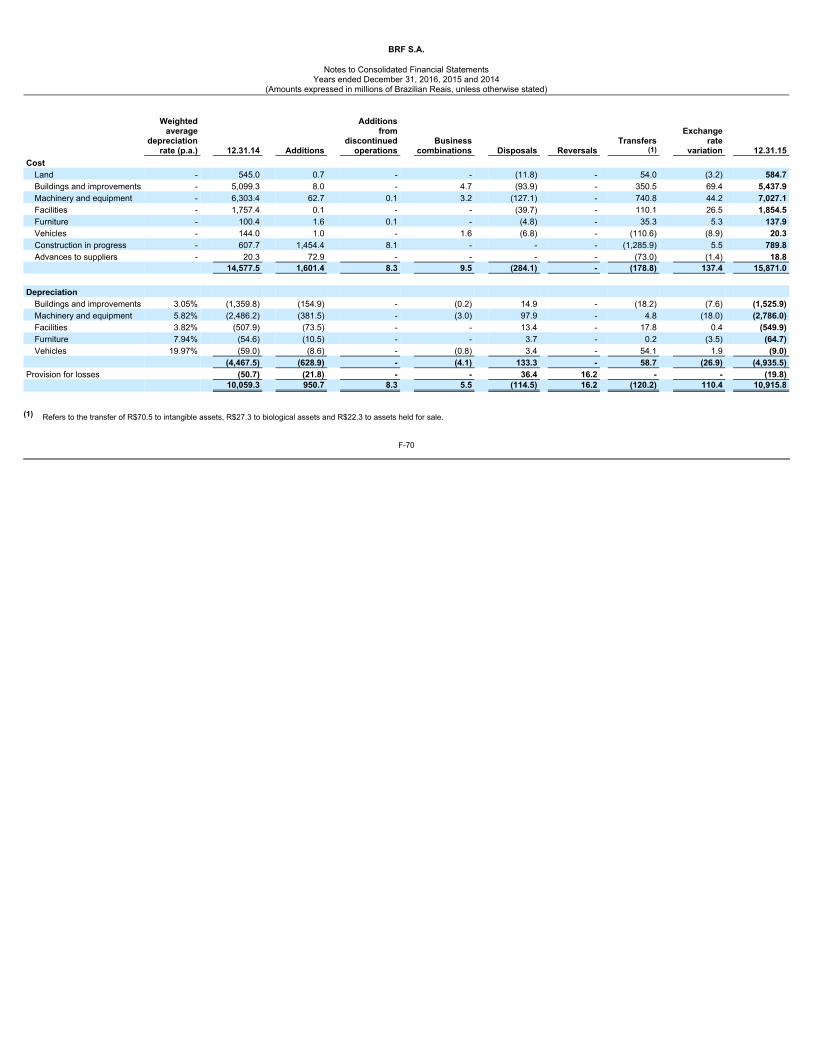
BRF S.A.
Notes to Consolidated Financial StatementsYears ended December 31, 2016, 2015 and 2014
(Amounts expressed in millions of Brazilian Reais, unless otherwise stated)
Weightedaverage
depreciationrate (p.a.) 12.31.14 Additions
Additionsfrom
discontinuedoperations
Businesscombinations Disposals Reversals
Transfers(1)
Exchangerate
variation 12.31.15Cost
Land - 545.0 0.7 - - (11.8) - 54.0 (3.2) 584.7Buildings and improvements - 5,099.3 8.0 - 4.7 (93.9) - 350.5 69.4 5,437.9Machinery and equipment - 6,303.4 62.7 0.1 3.2 (127.1) - 740.8 44.2 7,027.1Facilities - 1,757.4 0.1 - - (39.7) - 110.1 26.5 1,854.5Furniture - 100.4 1.6 0.1 - (4.8) - 35.3 5.3 137.9Vehicles - 144.0 1.0 - 1.6 (6.8) - (110.6) (8.9) 20.3Construction in progress - 607.7 1,454.4 8.1 - - - (1,285.9) 5.5 789.8Advances to suppliers - 20.3 72.9 - - - - (73.0) (1.4) 18.8
14,577.5 1,601.4 8.3 9.5 (284.1) - (178.8) 137.4 15,871.0 Depreciation
Buildings and improvements 3.05% (1,359.8) (154.9) - (0.2) 14.9 - (18.2) (7.6) (1,525.9)Machinery and equipment 5.82% (2,486.2) (381.5) - (3.0) 97.9 - 4.8 (18.0) (2,786.0)Facilities 3.82% (507.9) (73.5) - - 13.4 - 17.8 0.4 (549.9)Furniture 7.94% (54.6) (10.5) - - 3.7 - 0.2 (3.5) (64.7)Vehicles 19.97% (59.0) (8.6) - (0.8) 3.4 - 54.1 1.9 (9.0)
(4,467.5) (628.9) - (4.1) 133.3 - 58.7 (26.9) (4,935.5)Provision for losses (50.7) (21.8) - - 36.4 16.2 - - (19.8) 10,059.3 950.7 8.3 5.5 (114.5) 16.2 (120.2) 110.4 10,915.8
(1) Refers to the transfer of R$70.5 to intangible assets, R$27.3 to biological assets and R$22.3 to assets held for sale.
F-70
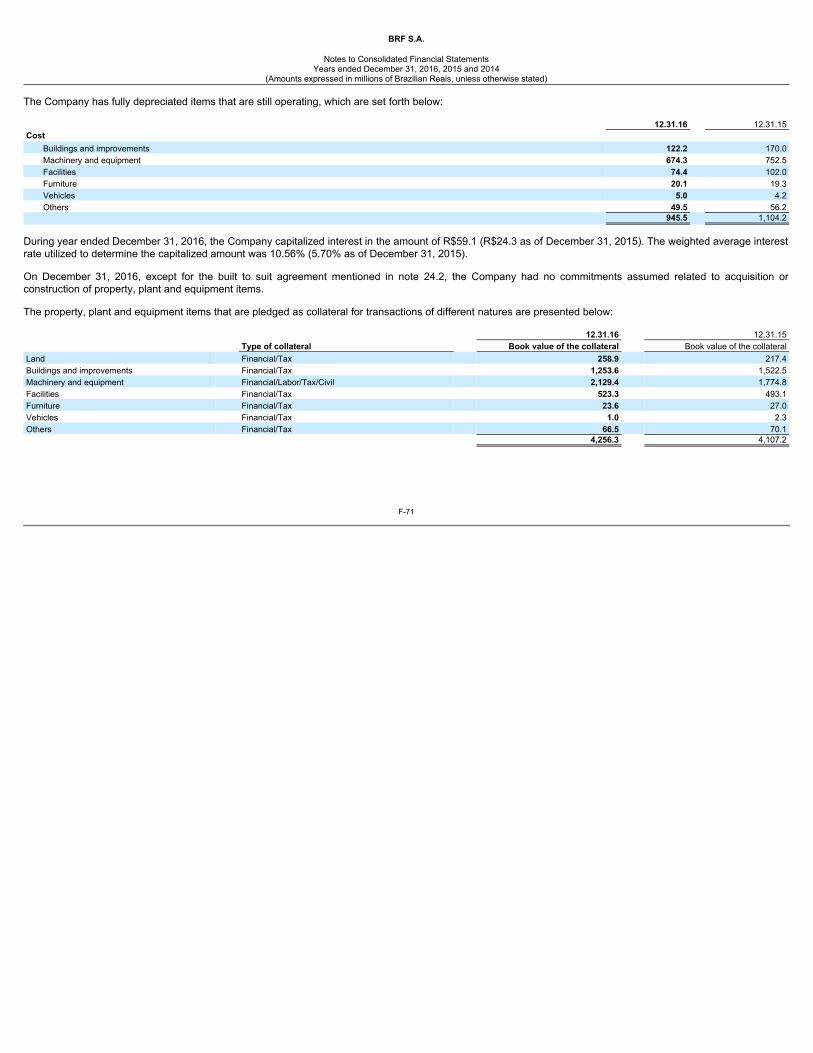
BRF S.A.
Notes to Consolidated Financial Statements
Years ended December 31, 2016, 2015 and 2014(Amounts expressed in millions of Brazilian Reais, unless otherwise stated)
The Company has fully depreciated items that are still operating, which are set forth below: 12.31.16 12.31.15Cost
Buildings and improvements 122.2 170.0Machinery and equipment 674.3 752.5Facilities 74.4 102.0Furniture 20.1 19.3Vehicles 5.0 4.2Others 49.5 56.2
945.5 1,104.2 During year ended December 31, 2016, the Company capitalized interest in the amount of R$59.1 (R$24.3 as of December 31, 2015). The weighted average interestrate utilized to determine the capitalized amount was 10.56% (5.70% as of December 31, 2015). On December 31, 2016, except for the built to suit agreement mentioned in note 24.2, the Company had no commitments assumed related to acquisition orconstruction of property, plant and equipment items. The property, plant and equipment items that are pledged as collateral for transactions of different natures are presented below: 12.31.16 12.31.15 Type of collateral Book value of the collateral Book value of the collateralLand Financial/Tax 258.9 217.4Buildings and improvements Financial/Tax 1,253.6 1,522.5Machinery and equipment Financial/Labor/Tax/Civil 2,129.4 1,774.8Facilities Financial/Tax 523.3 493.1Furniture Financial/Tax 23.6 27.0Vehicles Financial/Tax 1.0 2.3Others Financial/Tax 66.5 70.1 4,256.3 4,107.2
F-71
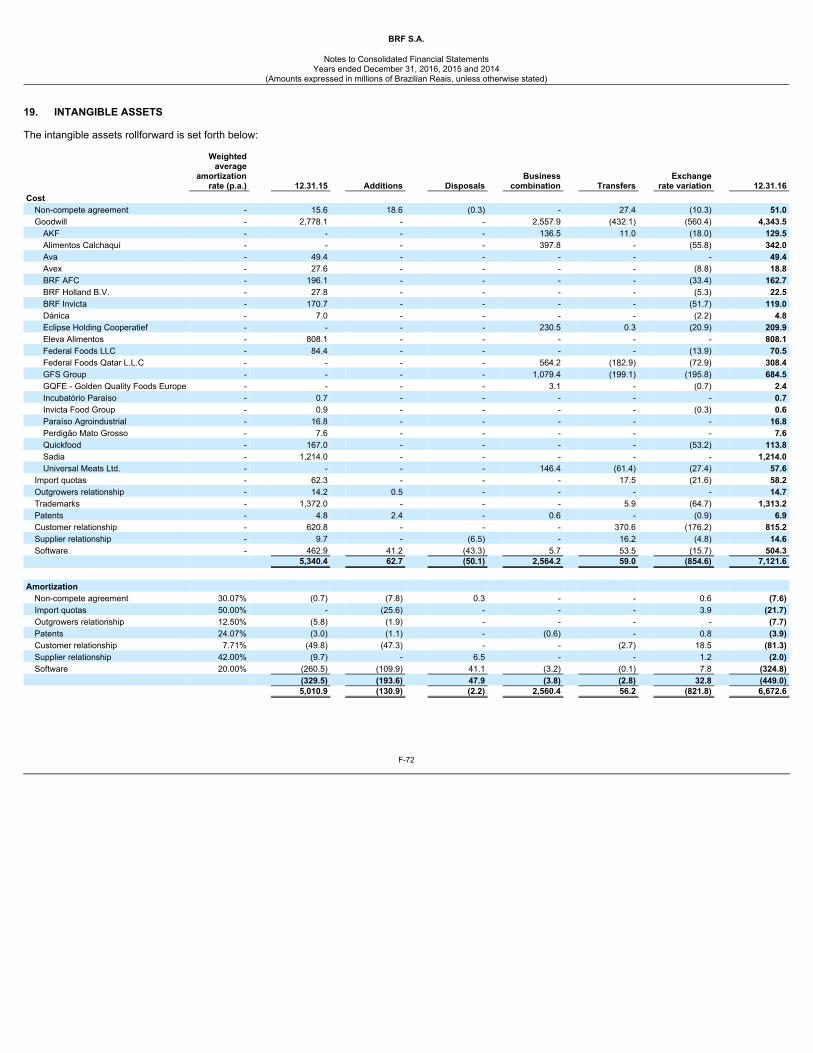
BRF S.A.
Notes to Consolidated Financial Statements
Years ended December 31, 2016, 2015 and 2014(Amounts expressed in millions of Brazilian Reais, unless otherwise stated)
19. INTANGIBLE ASSETS The intangible assets rollforward is set forth below:
Weightedaverage
amortizationrate (p.a.) 12.31.15 Additions Disposals
Businesscombination Transfers
Exchangerate variation 12.31.16
Cost Non-compete agreement - 15.6 18.6 (0.3) - 27.4 (10.3) 51.0Goodwill - 2,778.1 - - 2,557.9 (432.1) (560.4) 4,343.5
AKF - - - - 136.5 11.0 (18.0) 129.5Alimentos Calchaquí - - - - 397.8 - (55.8) 342.0Ava - 49.4 - - - - - 49.4Avex - 27.6 - - - - (8.8) 18.8BRF AFC - 196.1 - - - - (33.4) 162.7BRF Holland B.V. - 27.8 - - - - (5.3) 22.5BRF Invicta - 170.7 - - - - (51.7) 119.0Dánica - 7.0 - - - - (2.2) 4.8Eclipse Holding Cooperatief - - - - 230.5 0.3 (20.9) 209.9Eleva Alimentos - 808.1 - - - - - 808.1Federal Foods LLC - 84.4 - - - - (13.9) 70.5Federal Foods Qatar L.L.C - - - - 564.2 (182.9) (72.9) 308.4GFS Group - - - - 1,079.4 (199.1) (195.8) 684.5GQFE - Golden Quality Foods Europe - - - - 3.1 - (0.7) 2.4Incubatório Paraíso - 0.7 - - - - - 0.7Invicta Food Group - 0.9 - - - - (0.3) 0.6Paraíso Agroindustrial - 16.8 - - - - - 16.8Perdigão Mato Grosso - 7.6 - - - - - 7.6Quickfood - 167.0 - - - - (53.2) 113.8Sadia - 1,214.0 - - - - - 1,214.0Universal Meats Ltd. - - - - 146.4 (61.4) (27.4) 57.6
Import quotas - 62.3 - - - 17.5 (21.6) 58.2Outgrowers relationship - 14.2 0.5 - - - - 14.7Trademarks - 1,372.0 - - - 5.9 (64.7) 1,313.2Patents - 4.8 2.4 - 0.6 - (0.9) 6.9Customer relationship - 620.8 - - - 370.6 (176.2) 815.2Supplier relationship - 9.7 - (6.5) - 16.2 (4.8) 14.6Software - 462.9 41.2 (43.3) 5.7 53.5 (15.7) 504.3
5,340.4 62.7 (50.1) 2,564.2 59.0 (854.6) 7,121.6 Amortization
Non-compete agreement 30.07% (0.7) (7.8) 0.3 - - 0.6 (7.6)Import quotas 50.00% - (25.6) - - - 3.9 (21.7)Outgrowers relationship 12.50% (5.8) (1.9) - - - - (7.7)Patents 24.07% (3.0) (1.1) - (0.6) - 0.8 (3.9)Customer relationship 7.71% (49.8) (47.3) - - (2.7) 18.5 (81.3)Supplier relationship 42.00% (9.7) - 6.5 - - 1.2 (2.0)Software 20.00% (260.5) (109.9) 41.1 (3.2) (0.1) 7.8 (324.8)
(329.5) (193.6) 47.9 (3.8) (2.8) 32.8 (449.0) 5,010.9 (130.9) (2.2) 2,560.4 56.2 (821.8) 6,672.6
F-72
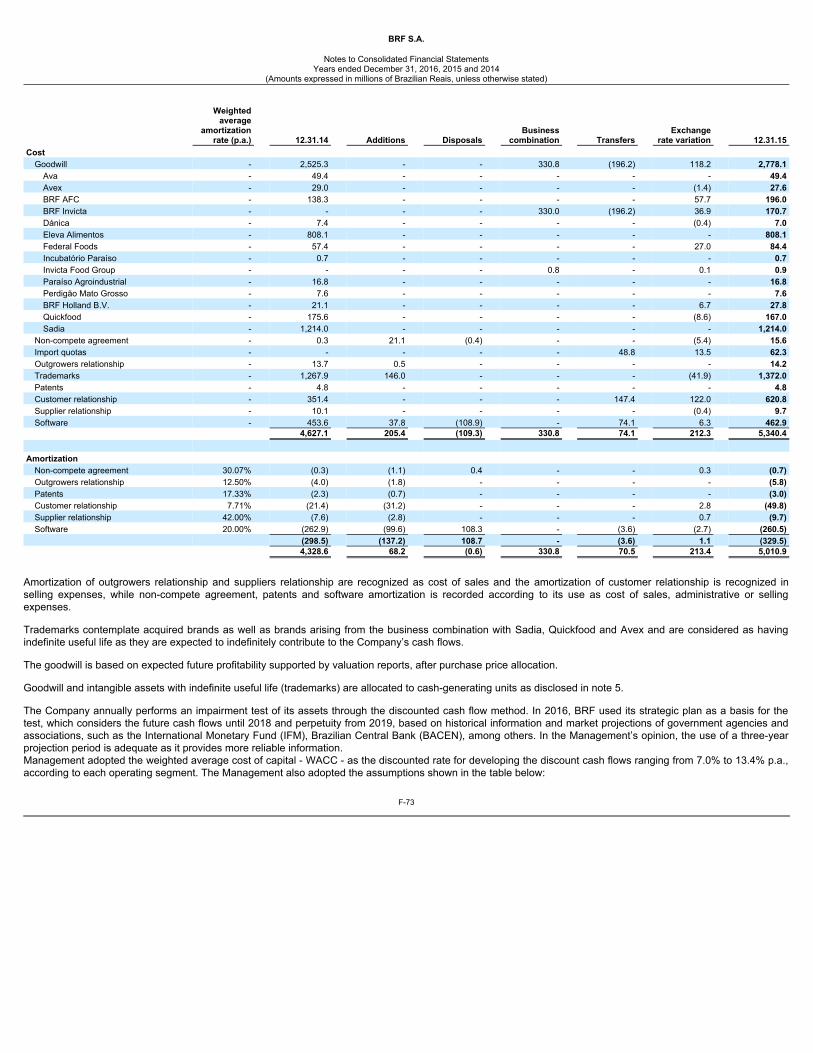
BRF S.A.
Notes to Consolidated Financial Statements
Years ended December 31, 2016, 2015 and 2014(Amounts expressed in millions of Brazilian Reais, unless otherwise stated)
Weightedaverage
amortizationrate (p.a.) 12.31.14 Additions Disposals
Businesscombination Transfers
Exchangerate variation 12.31.15
Cost Goodwill - 2,525.3 - - 330.8 (196.2) 118.2 2,778.1
Ava - 49.4 - - - - - 49.4Avex - 29.0 - - - - (1.4) 27.6BRF AFC - 138.3 - - - - 57.7 196.0BRF Invicta - - - - 330.0 (196.2) 36.9 170.7Dánica - 7.4 - - - - (0.4) 7.0Eleva Alimentos - 808.1 - - - - - 808.1Federal Foods - 57.4 - - - - 27.0 84.4Incubatório Paraíso - 0.7 - - - - - 0.7Invicta Food Group - - - - 0.8 - 0.1 0.9Paraíso Agroindustrial - 16.8 - - - - - 16.8Perdigão Mato Grosso - 7.6 - - - - - 7.6BRF Holland B.V. - 21.1 - - - - 6.7 27.8Quickfood - 175.6 - - - - (8.6) 167.0Sadia - 1,214.0 - - - - - 1,214.0
Non-compete agreement - 0.3 21.1 (0.4) - - (5.4) 15.6Import quotas - - - - - 48.8 13.5 62.3Outgrowers relationship - 13.7 0.5 - - - - 14.2Trademarks - 1,267.9 146.0 - - - (41.9) 1,372.0Patents - 4.8 - - - - - 4.8Customer relationship - 351.4 - - - 147.4 122.0 620.8Supplier relationship - 10.1 - - - - (0.4) 9.7Software - 453.6 37.8 (108.9) - 74.1 6.3 462.9
4,627.1 205.4 (109.3) 330.8 74.1 212.3 5,340.4 Amortization
Non-compete agreement 30.07% (0.3) (1.1) 0.4 - - 0.3 (0.7)Outgrowers relationship 12.50% (4.0) (1.8) - - - - (5.8)Patents 17.33% (2.3) (0.7) - - - - (3.0)Customer relationship 7.71% (21.4) (31.2) - - - 2.8 (49.8)Supplier relationship 42.00% (7.6) (2.8) - - - 0.7 (9.7)Software 20.00% (262.9) (99.6) 108.3 - (3.6) (2.7) (260.5)
(298.5) (137.2) 108.7 - (3.6) 1.1 (329.5) 4,328.6 68.2 (0.6) 330.8 70.5 213.4 5,010.9
Amortization of outgrowers relationship and suppliers relationship are recognized as cost of sales and the amortization of customer relationship is recognized inselling expenses, while non-compete agreement, patents and software amortization is recorded according to its use as cost of sales, administrative or sellingexpenses. Trademarks contemplate acquired brands as well as brands arising from the business combination with Sadia, Quickfood and Avex and are considered as havingindefinite useful life as they are expected to indefinitely contribute to the Company’s cash flows. The goodwill is based on expected future profitability supported by valuation reports, after purchase price allocation. Goodwill and intangible assets with indefinite useful life (trademarks) are allocated to cash-generating units as disclosed in note 5. The Company annually performs an impairment test of its assets through the discounted cash flow method. In 2016, BRF used its strategic plan as a basis for thetest, which considers the future cash flows until 2018 and perpetuity from 2019, based on historical information and market projections of government agencies andassociations, such as the International Monetary Fund (IFM), Brazilian Central Bank (BACEN), among others. In the Management’s opinion, the use of a three-yearprojection period is adequate as it provides more reliable information.Management adopted the weighted average cost of capital - WACC - as the discounted rate for developing the discount cash flows ranging from 7.0% to 13.4% p.a.,according to each operating segment. The Management also adopted the assumptions shown in the table below:
F-73
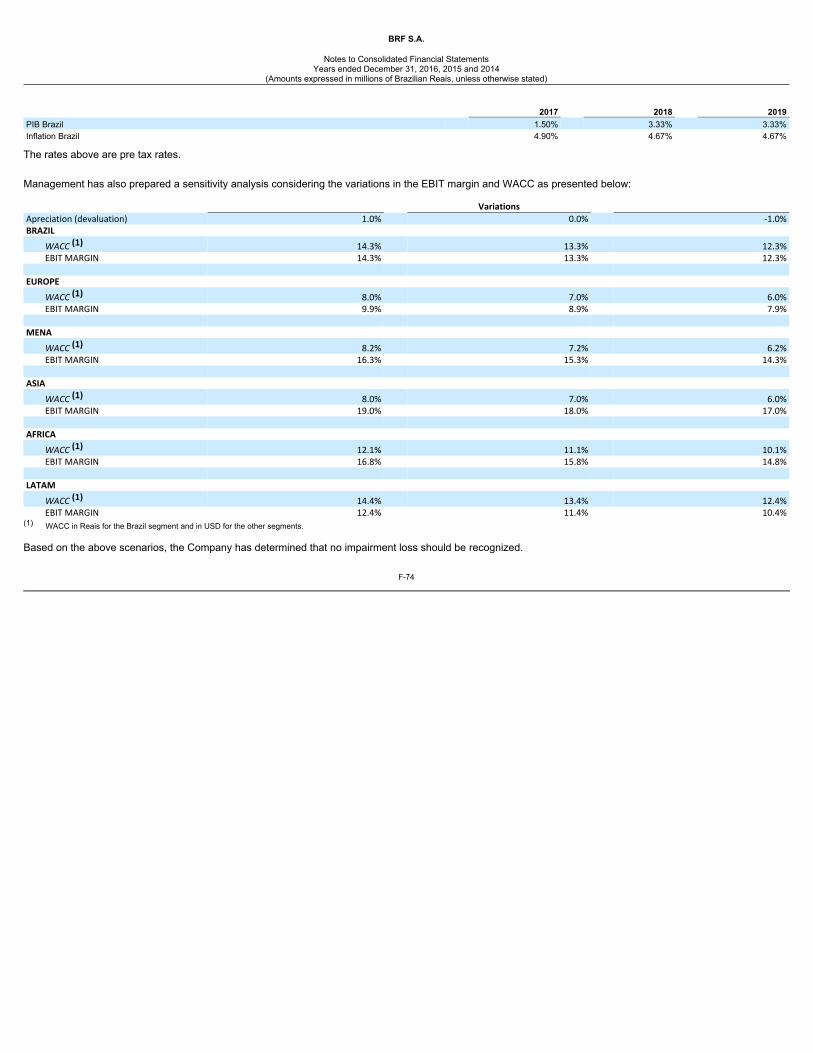
BRF S.A.
Notes to Consolidated Financial Statements
Years ended December 31, 2016, 2015 and 2014(Amounts expressed in millions of Brazilian Reais, unless otherwise stated)
2017 2018 2019PIB Brazil 1.50% 3.33% 3.33%Inflation Brazil 4.90% 4.67% 4.67%
The rates above are pre tax rates. Management has also prepared a sensitivity analysis considering the variations in the EBIT margin and WACC as presented below: Variations Apreciation (devaluation) 1.0% 0.0% -1.0%BRAZIL
WACC(1) 14.3% 13.3% 12.3%EBIT MARGIN 14.3% 13.3% 12.3%
EUROPE
WACC(1) 8.0% 7.0% 6.0%EBIT MARGIN 9.9% 8.9% 7.9%
MENA
WACC(1) 8.2% 7.2% 6.2%EBIT MARGIN 16.3% 15.3% 14.3%
ASIA
WACC(1) 8.0% 7.0% 6.0%EBIT MARGIN 19.0% 18.0% 17.0%
AFRICA
WACC(1) 12.1% 11.1% 10.1%EBIT MARGIN 16.8% 15.8% 14.8%
LATAM
WACC(1) 14.4% 13.4% 12.4%EBIT MARGIN 12.4% 11.4% 10.4%
(1) WACC in Reais for the Brazil segment and in USD for the other segments. Based on the above scenarios, the Company has determined that no impairment loss should be recognized.
F-74
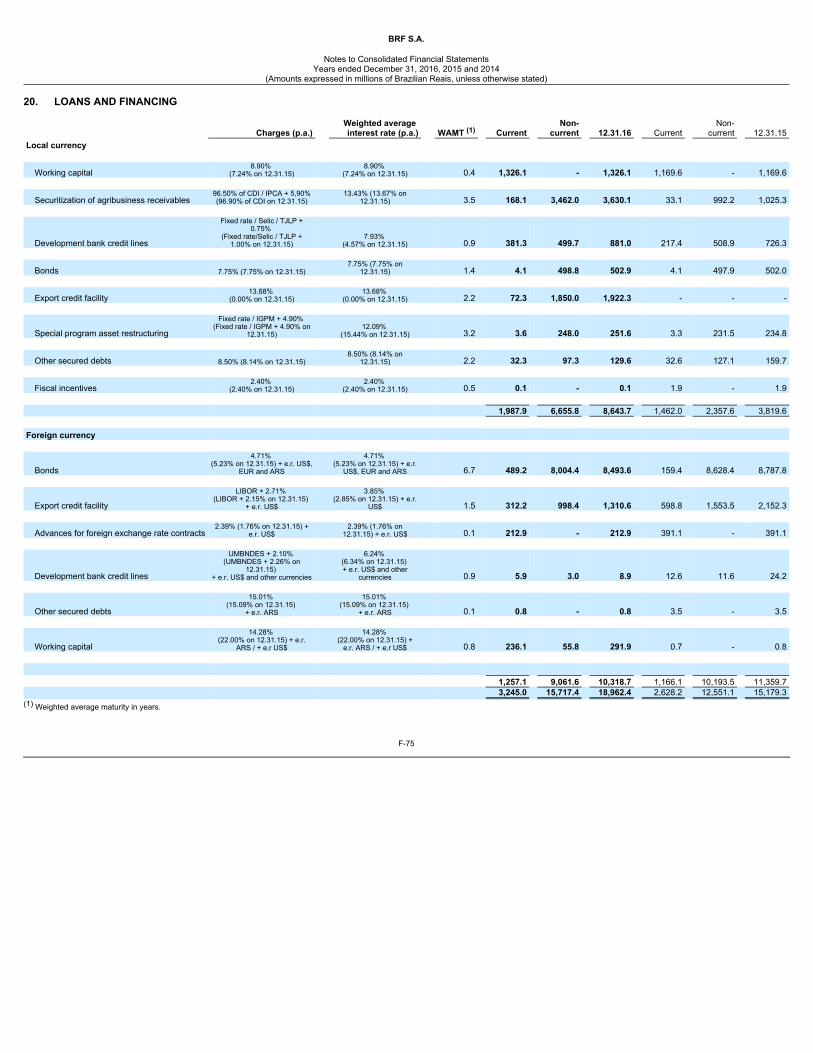
BRF S.A.
Notes to Consolidated Financial Statements
Years ended December 31, 2016, 2015 and 2014(Amounts expressed in millions of Brazilian Reais, unless otherwise stated)
20. LOANS AND FINANCING
Charges (p.a.) Weighted average interest rate (p.a.) WAMT (1) Current
Non-current 12.31.16 Current
Non-current 12.31.15
Local currency
Working capital8.90%
(7.24% on 12.31.15) 8.90% (7.24% on 12.31.15) 0.4 1,326.1 - 1,326.1 1,169.6 - 1,169.6
Securitization of agribusiness receivables
96.50% of CDI / IPCA + 5,90%(96.90% of CDI on 12.31.15) 13.43% (13.67% on
12.31.15) 3.5 168.1 3,462.0 3,630.1 33.1 992.2 1,025.3
Development bank credit lines
Fixed rate / Selic / TJLP +0.75%
(Fixed rate/Selic / TJLP +1.00% on 12.31.15) 7.93%
(4.57% on 12.31.15) 0.9 381.3 499.7 881.0 217.4 508.9 726.3
Bonds 7.75% (7.75% on 12.31.15) 7.75% (7.75% on12.31.15) 1.4 4.1 498.8 502.9 4.1 497.9 502.0
Export credit facility
13.68% (0.00% on 12.31.15) 13.68%
(0.00% on 12.31.15) 2.2 72.3 1,850.0 1,922.3 - - -
Special program asset restructuring
Fixed rate / IGPM + 4.90% (Fixed rate / IGPM + 4.90% on
12.31.15) 12.09% (15.44% on 12.31.15) 3.2 3.6 248.0 251.6 3.3 231.5 234.8
Other secured debts 8.50% (8.14% on 12.31.15) 8.50% (8.14% on
12.31.15) 2.2 32.3 97.3 129.6 32.6 127.1 159.7
Fiscal incentives2.40%
(2.40% on 12.31.15) 2.40% (2.40% on 12.31.15) 0.5 0.1 - 0.1 1.9 - 1.9
1,987.9 6,655.8 8,643.7 1,462.0 2,357.6 3,819.6 Foreign currency
Bonds
4.71% (5.23% on 12.31.15) + e.r. US$,
EUR and ARS 4.71%
(5.23% on 12.31.15) + e.r.US$, EUR and ARS 6.7 489.2 8,004.4 8,493.6 159.4 8,628.4 8,787.8
Export credit facility
LIBOR + 2.71% (LIBOR + 2.15% on 12.31.15)
+ e.r. US$ 3.85%
(2.85% on 12.31.15) + e.r.US$ 1.5 312.2 998.4 1,310.6 598.8 1,553.5 2,152.3
Advances for foreign exchange rate contracts
2.39% (1.76% on 12.31.15) +e.r. US$ 2.39% (1.76% on
12.31.15) + e.r. US$ 0.1 212.9 - 212.9 391.1 - 391.1
Development bank credit lines
UMBNDES + 2.10% (UMBNDES + 2.26% on
12.31.15) + e.r. US$ and other currencies
6.24% (6.34% on 12.31.15) + e.r. US$ and other
currencies 0.9 5.9 3.0 8.9 12.6 11.6 24.2
Other secured debts
15.01% (15.09% on 12.31.15)
+ e.r. ARS 15.01%
(15.09% on 12.31.15) + e.r. ARS 0.1 0.8 - 0.8 3.5 - 3.5
Working capital
14.28% (22.00% on 12.31.15) + e.r.
ARS / + e.r US$ 14.28%
(22.00% on 12.31.15) +e.r. ARS / + e.r US$ 0.8 236.1 55.8 291.9 0.7 - 0.8
1,257.1 9,061.6 10,318.7 1,166.1 10,193.5 11,359.7 3,245.0 15,717.4 18,962.4 2,628.2 12,551.1 15,179.3
(1) Weighted average maturity in years.
F-75
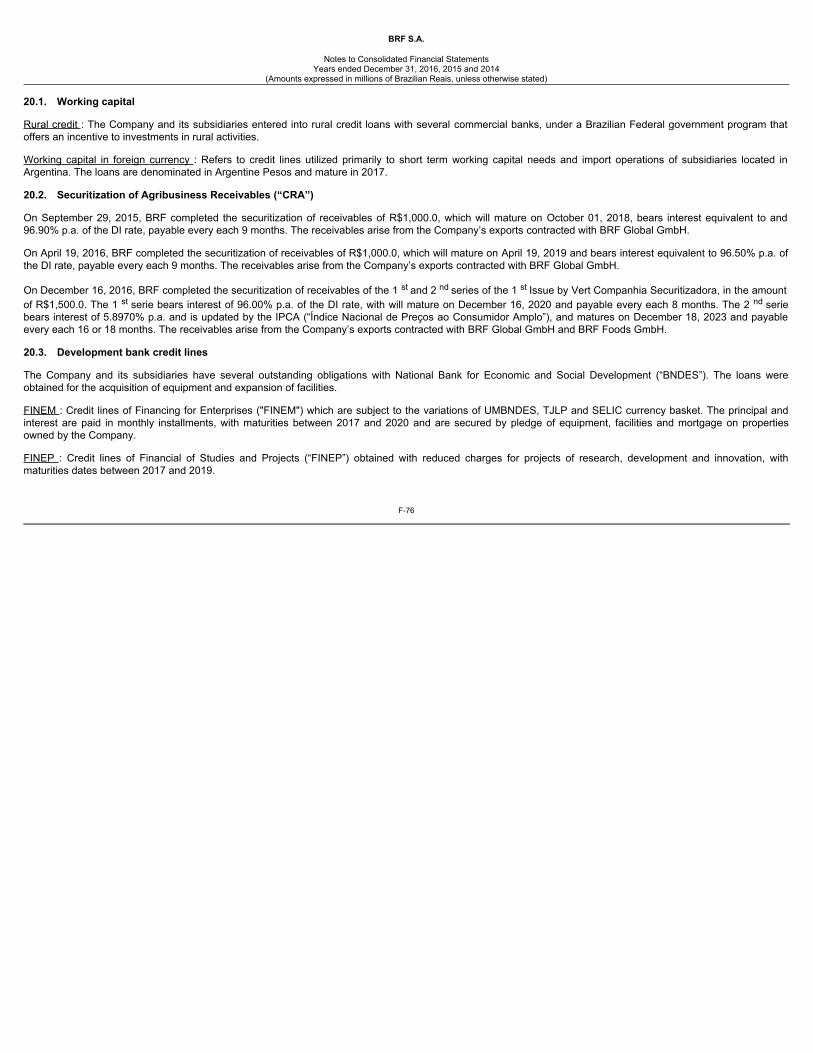
BRF S.A.
Notes to Consolidated Financial Statements
Years ended December 31, 2016, 2015 and 2014(Amounts expressed in millions of Brazilian Reais, unless otherwise stated)
20.1. Working capital
Rural credit : The Company and its subsidiaries entered into rural credit loans with several commercial banks, under a Brazilian Federal government program thatoffers an incentive to investments in rural activities. Working capital in foreign currency : Refers to credit lines utilized primarily to short term working capital needs and import operations of subsidiaries located inArgentina. The loans are denominated in Argentine Pesos and mature in 2017. 20.2. Securitization of Agribusiness Receivables (“CRA”) On September 29, 2015, BRF completed the securitization of receivables of R$1,000.0, which will mature on October 01, 2018, bears interest equivalent to and96.90% p.a. of the DI rate, payable every each 9 months. The receivables arise from the Company’s exports contracted with BRF Global GmbH. On April 19, 2016, BRF completed the securitization of receivables of R$1,000.0, which will mature on April 19, 2019 and bears interest equivalent to 96.50% p.a. ofthe DI rate, payable every each 9 months. The receivables arise from the Company’s exports contracted with BRF Global GmbH.
On December 16, 2016, BRF completed the securitization of receivables of the 1 st and 2 nd series of the 1 st Issue by Vert Companhia Securitizadora, in the amountof R$1,500.0. The 1 st serie bears interest of 96.00% p.a. of the DI rate, with will mature on December 16, 2020 and payable every each 8 months. The 2 nd seriebears interest of 5.8970% p.a. and is updated by the IPCA (“Índice Nacional de Preços ao Consumidor Amplo”), and matures on December 18, 2023 and payableevery each 16 or 18 months. The receivables arise from the Company’s exports contracted with BRF Global GmbH and BRF Foods GmbH. 20.3. Development bank credit lines The Company and its subsidiaries have several outstanding obligations with National Bank for Economic and Social Development (“BNDES”). The loans wereobtained for the acquisition of equipment and expansion of facilities. FINEM : Credit lines of Financing for Enterprises ("FINEM") which are subject to the variations of UMBNDES, TJLP and SELIC currency basket. The principal andinterest are paid in monthly installments, with maturities between 2017 and 2020 and are secured by pledge of equipment, facilities and mortgage on propertiesowned by the Company. FINEP : Credit lines of Financial of Studies and Projects (“FINEP”) obtained with reduced charges for projects of research, development and innovation, withmaturities dates between 2017 and 2019.
F-76
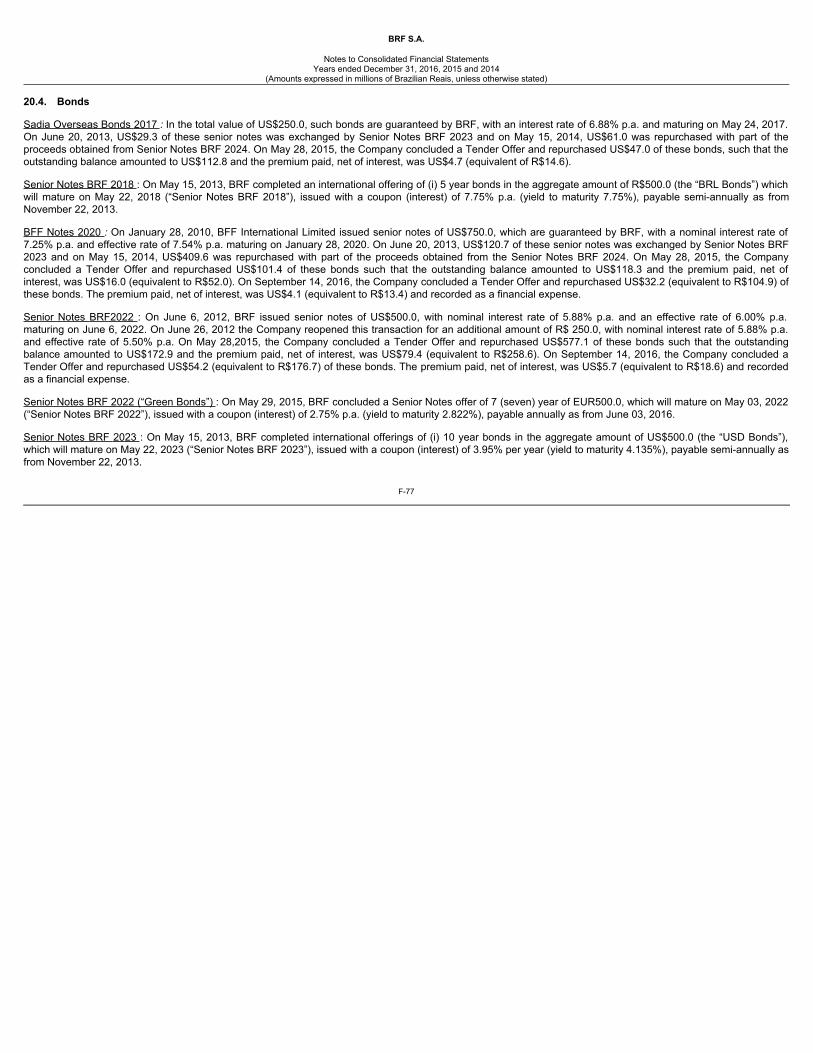
BRF S.A.
Notes to Consolidated Financial Statements
Years ended December 31, 2016, 2015 and 2014(Amounts expressed in millions of Brazilian Reais, unless otherwise stated)
20.4. Bonds Sadia Overseas Bonds 2017 :In the total value of US$250.0, such bonds are guaranteed by BRF, with an interest rate of 6.88% p.a. and maturing on May 24, 2017.On June 20, 2013, US$29.3 of these senior notes was exchanged by Senior Notes BRF 2023 and on May 15, 2014, US$61.0 was repurchased with part of theproceeds obtained from Senior Notes BRF 2024. On May 28, 2015, the Company concluded a Tender Offer and repurchased US$47.0 of these bonds, such that theoutstanding balance amounted to US$112.8 and the premium paid, net of interest, was US$4.7 (equivalent of R$14.6). Senior Notes BRF 2018 : On May 15, 2013, BRF completed an international offering of (i) 5 year bonds in the aggregate amount of R$500.0 (the “BRL Bonds”) whichwill mature on May 22, 2018 (“Senior Notes BRF 2018”), issued with a coupon (interest) of 7.75% p.a. (yield to maturity 7.75%), payable semi-annually as fromNovember 22, 2013. BFF Notes 2020 :On January 28, 2010, BFF International Limited issued senior notes of US$750.0, which are guaranteed by BRF, with a nominal interest rate of7.25% p.a. and effective rate of 7.54% p.a. maturing on January 28, 2020. On June 20, 2013, US$120.7 of these senior notes was exchanged by Senior Notes BRF2023 and on May 15, 2014, US$409.6 was repurchased with part of the proceeds obtained from the Senior Notes BRF 2024. On May 28, 2015, the Companyconcluded a Tender Offer and repurchased US$101.4 of these bonds such that the outstanding balance amounted to US$118.3 and the premium paid, net ofinterest, was US$16.0 (equivalent to R$52.0). On September 14, 2016, the Company concluded a Tender Offer and repurchased US$32.2 (equivalent to R$104.9) ofthese bonds. The premium paid, net of interest, was US$4.1 (equivalent to R$13.4) and recorded as a financial expense. Senior Notes BRF2022 : On June 6, 2012, BRF issued senior notes of US$500.0, with nominal interest rate of 5.88% p.a. and an effective rate of 6.00% p.a.maturing on June 6, 2022. On June 26, 2012 the Company reopened this transaction for an additional amount of R$ 250.0, with nominal interest rate of 5.88% p.a.and effective rate of 5.50% p.a. On May 28,2015, the Company concluded a Tender Offer and repurchased US$577.1 of these bonds such that the outstandingbalance amounted to US$172.9 and the premium paid, net of interest, was US$79.4 (equivalent to R$258.6). On September 14, 2016, the Company concluded aTender Offer and repurchased US$54.2 (equivalent to R$176.7) of these bonds. The premium paid, net of interest, was US$5.7 (equivalent to R$18.6) and recordedas a financial expense. Senior Notes BRF 2022 (“Green Bonds”) : On May 29, 2015, BRF concluded a Senior Notes offer of 7 (seven) year of EUR500.0, which will mature on May 03, 2022(“Senior Notes BRF 2022”), issued with a coupon (interest) of 2.75% p.a. (yield to maturity 2.822%), payable annually as from June 03, 2016. Senior Notes BRF 2023 : On May 15, 2013, BRF completed international offerings of (i) 10 year bonds in the aggregate amount of US$500.0 (the “USD Bonds”),which will mature on May 22, 2023 (“Senior Notes BRF 2023”), issued with a coupon (interest) of 3.95% per year (yield to maturity 4.135%), payable semi-annually asfrom November 22, 2013.
F-77
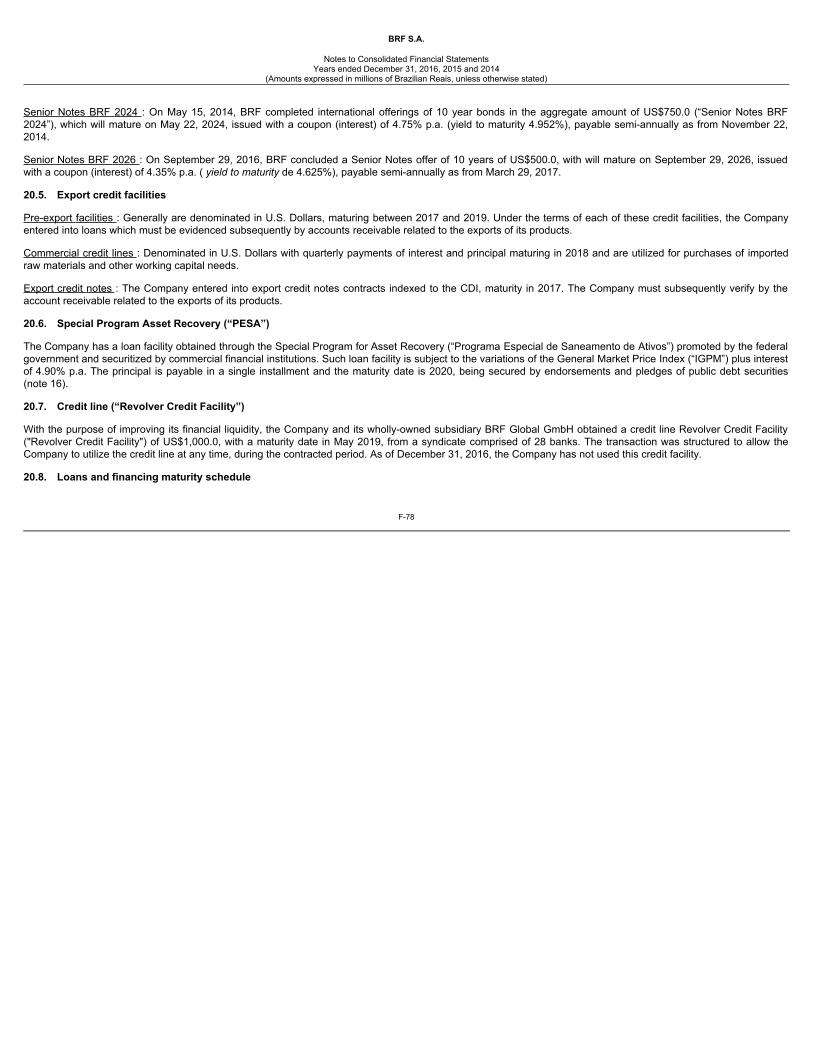
BRF S.A.
Notes to Consolidated Financial Statements
Years ended December 31, 2016, 2015 and 2014(Amounts expressed in millions of Brazilian Reais, unless otherwise stated)
Senior Notes BRF 2024 : On May 15, 2014, BRF completed international offerings of 10 year bonds in the aggregate amount of US$750.0 (“Senior Notes BRF2024”), which will mature on May 22, 2024, issued with a coupon (interest) of 4.75% p.a. (yield to maturity 4.952%), payable semi-annually as from November 22,2014. Senior Notes BRF 2026 : On September 29, 2016, BRF concluded a Senior Notes offer of 10 years of US$500.0, with will mature on September 29, 2026, issuedwith a coupon (interest) of 4.35% p.a. ( yieldtomaturityde 4.625%), payable semi-annually as from March 29, 2017. 20.5. Export credit facilities Pre-export facilities : Generally are denominated in U.S. Dollars, maturing between 2017 and 2019. Under the terms of each of these credit facilities, the Companyentered into loans which must be evidenced subsequently by accounts receivable related to the exports of its products. Commercial credit lines : Denominated in U.S. Dollars with quarterly payments of interest and principal maturing in 2018 and are utilized for purchases of importedraw materials and other working capital needs. Export credit notes : The Company entered into export credit notes contracts indexed to the CDI, maturity in 2017. The Company must subsequently verify by theaccount receivable related to the exports of its products. 20.6. Special Program Asset Recovery (“PESA”) The Company has a loan facility obtained through the Special Program for Asset Recovery (“Programa Especial de Saneamento de Ativos”) promoted by the federalgovernment and securitized by commercial financial institutions. Such loan facility is subject to the variations of the General Market Price Index (“IGPM”) plus interestof 4.90% p.a. The principal is payable in a single installment and the maturity date is 2020, being secured by endorsements and pledges of public debt securities(note 16). 20.7. Credit line (“Revolver Credit Facility”) With the purpose of improving its financial liquidity, the Company and its wholly-owned subsidiary BRF Global GmbH obtained a credit line Revolver Credit Facility("Revolver Credit Facility") of US$1,000.0, with a maturity date in May 2019, from a syndicate comprised of 28 banks. The transaction was structured to allow theCompany to utilize the credit line at any time, during the contracted period. As of December 31, 2016, the Company has not used this credit facility. 20.8. Loans and financing maturity schedule
F-78
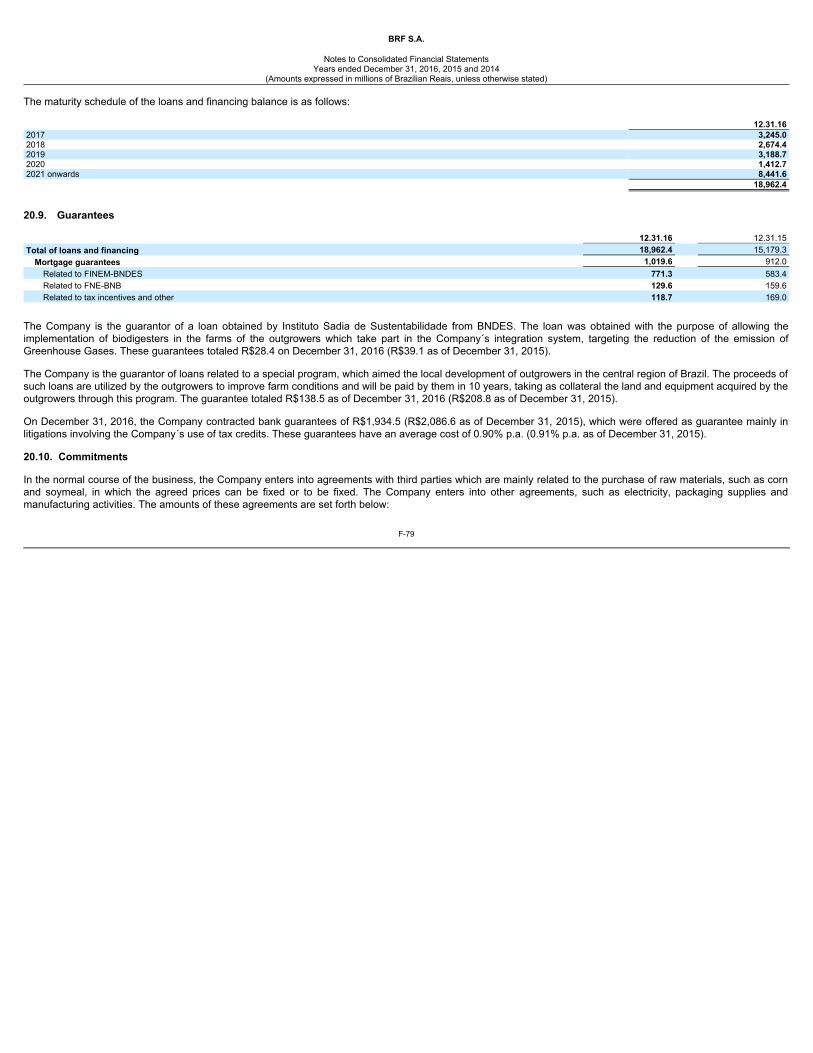
BRF S.A.
Notes to Consolidated Financial Statements
Years ended December 31, 2016, 2015 and 2014(Amounts expressed in millions of Brazilian Reais, unless otherwise stated)
The maturity schedule of the loans and financing balance is as follows: 12.31.162017 3,245.02018 2,674.42019 3,188.72020 1,412.72021 onwards 8,441.6 18,962.4
20.9. Guarantees 12.31.16 12.31.15Total of loans and financing 18,962.4 15,179.3
Mortgage guarantees 1,019.6 912.0Related to FINEM-BNDES 771.3 583.4Related to FNE-BNB 129.6 159.6Related to tax incentives and other 118.7 169.0
The Company is the guarantor of a loan obtained by Instituto Sadia de Sustentabilidade from BNDES. The loan was obtained with the purpose of allowing theimplementation of biodigesters in the farms of the outgrowers which take part in the Company´s integration system, targeting the reduction of the emission ofGreenhouse Gases. These guarantees totaled R$28.4 on December 31, 2016 (R$39.1 as of December 31, 2015). The Company is the guarantor of loans related to a special program, which aimed the local development of outgrowers in the central region of Brazil. The proceeds ofsuch loans are utilized by the outgrowers to improve farm conditions and will be paid by them in 10 years, taking as collateral the land and equipment acquired by theoutgrowers through this program. The guarantee totaled R$138.5 as of December 31, 2016 (R$208.8 as of December 31, 2015). On December 31, 2016, the Company contracted bank guarantees of R$1,934.5 (R$2,086.6 as of December 31, 2015), which were offered as guarantee mainly inlitigations involving the Company´s use of tax credits. These guarantees have an average cost of 0.90% p.a. (0.91% p.a. as of December 31, 2015). 20.10. Commitments In the normal course of the business, the Company enters into agreements with third parties which are mainly related to the purchase of raw materials, such as cornand soymeal, in which the agreed prices can be fixed or to be fixed. The Company enters into other agreements, such as electricity, packaging supplies andmanufacturing activities. The amounts of these agreements are set forth below:
F-79
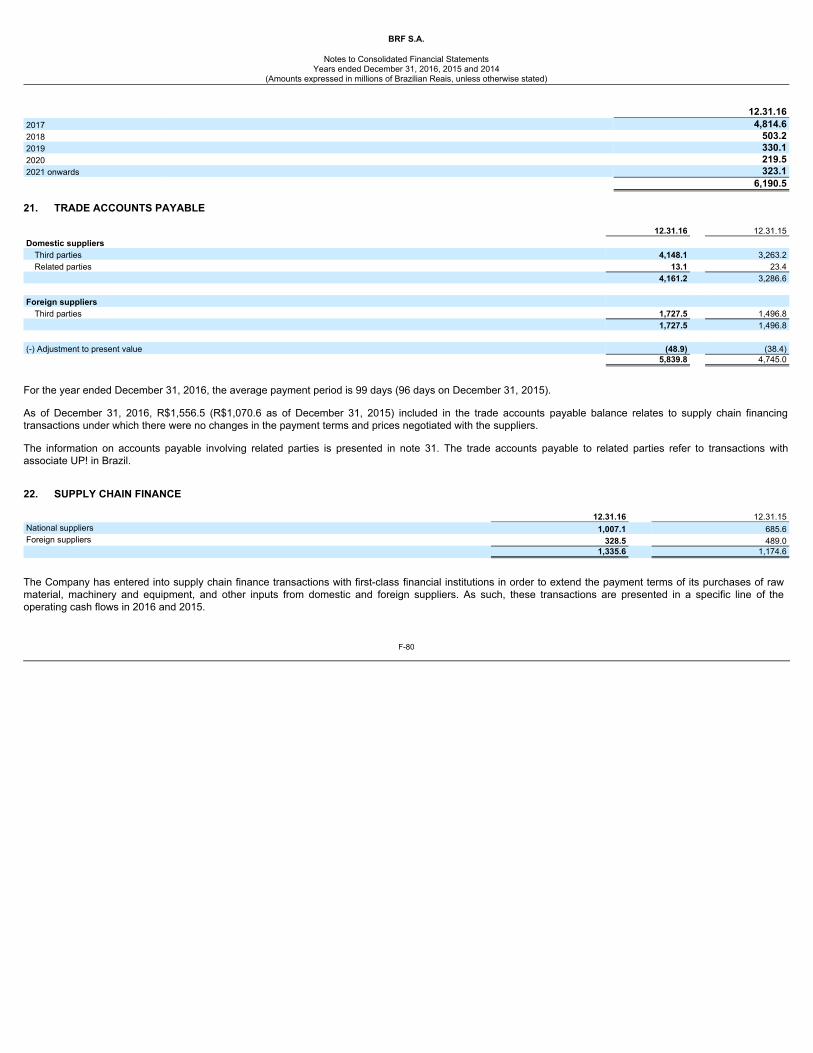
BRF S.A.
Notes to Consolidated Financial Statements
Years ended December 31, 2016, 2015 and 2014(Amounts expressed in millions of Brazilian Reais, unless otherwise stated)
12.31.162017 4,814.62018 503.22019 330.12020 219.52021 onwards 323.1 6,190.5
21. TRADE ACCOUNTS PAYABLE 12.31.16 12.31.15Domestic suppliers
Third parties 4,148.1 3,263.2Related parties 13.1 23.4
4,161.2 3,286.6 Foreign suppliers
Third parties 1,727.5 1,496.8 1,727.5 1,496.8 (-) Adjustment to present value (48.9) (38.4) 5,839.8 4,745.0
For the year ended December 31, 2016, the average payment period is 99 days (96 days on December 31, 2015). As of December 31, 2016, R$1,556.5 (R$1,070.6 as of December 31, 2015) included in the trade accounts payable balance relates to supply chain financingtransactions under which there were no changes in the payment terms and prices negotiated with the suppliers. The information on accounts payable involving related parties is presented in note 31. The trade accounts payable to related parties refer to transactions withassociate UP! in Brazil. 22. SUPPLY CHAIN FINANCE 12.31.16 12.31.15National suppliers 1,007.1 685.6Foreign suppliers 328.5 489.0 1,335.6 1,174.6
The Company has entered into supply chain finance transactions with first-class financial institutions in order to extend the payment terms of its purchases of rawmaterial, machinery and equipment, and other inputs from domestic and foreign suppliers. As such, these transactions are presented in a specific line of theoperating cash flows in 2016 and 2015.
F-80
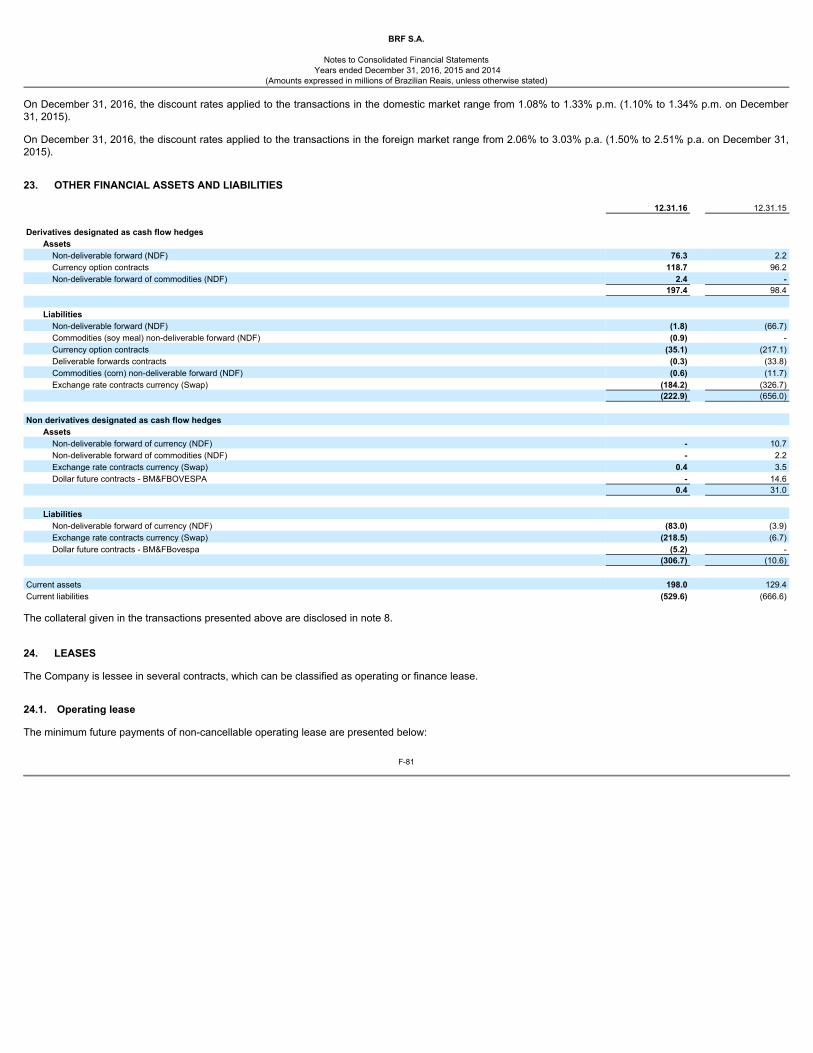
BRF S.A.
Notes to Consolidated Financial Statements
Years ended December 31, 2016, 2015 and 2014(Amounts expressed in millions of Brazilian Reais, unless otherwise stated)
On December 31, 2016, the discount rates applied to the transactions in the domestic market range from 1.08% to 1.33% p.m. (1.10% to 1.34% p.m. on December31, 2015). On December 31, 2016, the discount rates applied to the transactions in the foreign market range from 2.06% to 3.03% p.a. (1.50% to 2.51% p.a. on December 31,2015). 23. OTHER FINANCIAL ASSETS AND LIABILITIES 12.31.16 12.31.15 Derivatives designated as cash flow hedges
Assets Non-deliverable forward (NDF) 76.3 2.2Currency option contracts 118.7 96.2Non-deliverable forward of commodities (NDF) 2.4 -
197.4 98.4
Liabilities Non-deliverable forward (NDF) (1.8) (66.7)Commodities (soy meal) non-deliverable forward (NDF) (0.9) -Currency option contracts (35.1) (217.1)Deliverable forwards contracts (0.3) (33.8)Commodities (corn) non-deliverable forward (NDF) (0.6) (11.7)Exchange rate contracts currency (Swap) (184.2) (326.7)
(222.9) (656.0) Non derivatives designated as cash flow hedges
Assets Non-deliverable forward of currency (NDF) - 10.7Non-deliverable forward of commodities (NDF) - 2.2Exchange rate contracts currency (Swap) 0.4 3.5Dollar future contracts - BM&FBOVESPA - 14.6
0.4 31.0
Liabilities Non-deliverable forward of currency (NDF) (83.0) (3.9)Exchange rate contracts currency (Swap) (218.5) (6.7)Dollar future contracts - BM&FBovespa (5.2) -
(306.7) (10.6) Current assets 198.0 129.4Current liabilities (529.6) (666.6)
The collateral given in the transactions presented above are disclosed in note 8. 24. LEASES The Company is lessee in several contracts, which can be classified as operating or finance lease. 24.1. Operating lease The minimum future payments of non-cancellable operating lease are presented below:
F-81
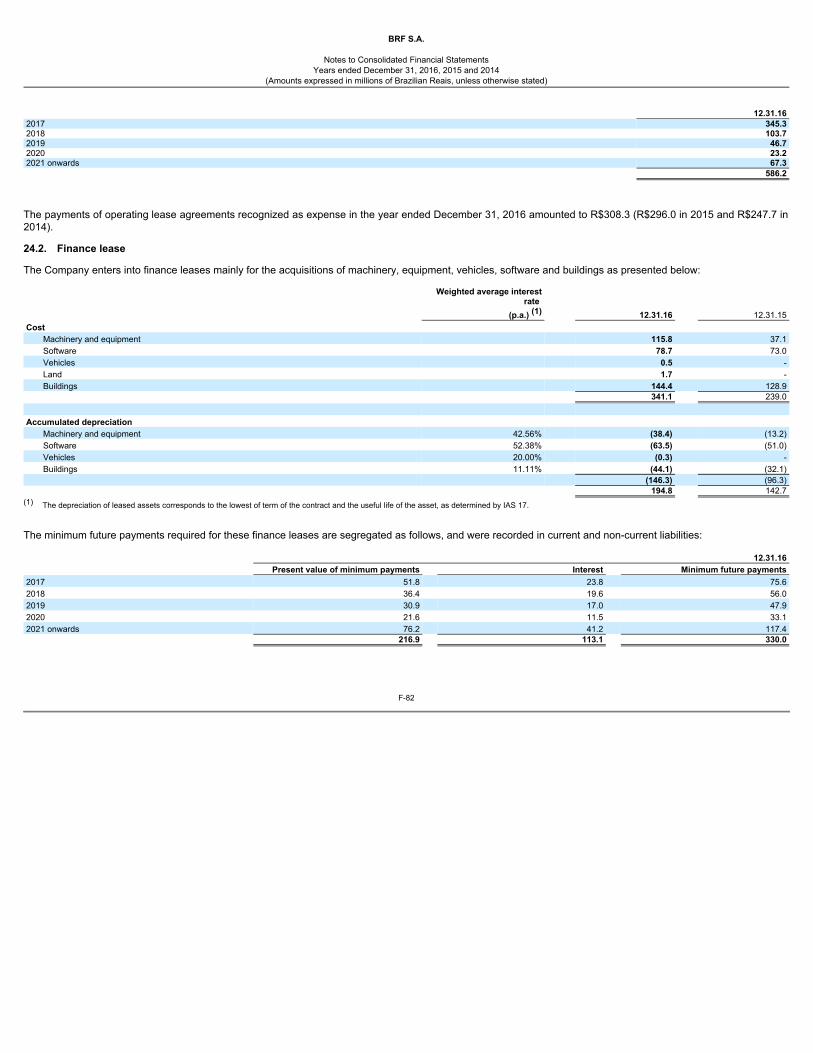
BRF S.A.
Notes to Consolidated Financial Statements
Years ended December 31, 2016, 2015 and 2014(Amounts expressed in millions of Brazilian Reais, unless otherwise stated)
12.31.162017 345.32018 103.72019 46.72020 23.22021 onwards 67.3 586.2
The payments of operating lease agreements recognized as expense in the year ended December 31, 2016 amounted to R$308.3 (R$296.0 in 2015 and R$247.7 in2014). 24.2. Finance lease The Company enters into finance leases mainly for the acquisitions of machinery, equipment, vehicles, software and buildings as presented below:
Weighted average interestrate
(p.a.) (1) 12.31.16 12.31.15Cost
Machinery and equipment 115.8 37.1Software 78.7 73.0Vehicles 0.5 -Land 1.7 -Buildings 144.4 128.9
341.1 239.0 Accumulated depreciation
Machinery and equipment 42.56% (38.4) (13.2)Software 52.38% (63.5) (51.0)Vehicles 20.00% (0.3) -Buildings 11.11% (44.1) (32.1)
(146.3) (96.3) 194.8 142.7
(1) The depreciation of leased assets corresponds to the lowest of term of the contract and the useful life of the asset, as determined by IAS 17.
The minimum future payments required for these finance leases are segregated as follows, and were recorded in current and non-current liabilities: 12.31.16 Present value of minimum payments Interest Minimum future payments2017 51.8 23.8 75.62018 36.4 19.6 56.02019 30.9 17.0 47.92020 21.6 11.5 33.12021 onwards 76.2 41.2 117.4 216.9 113.1 330.0
F-82
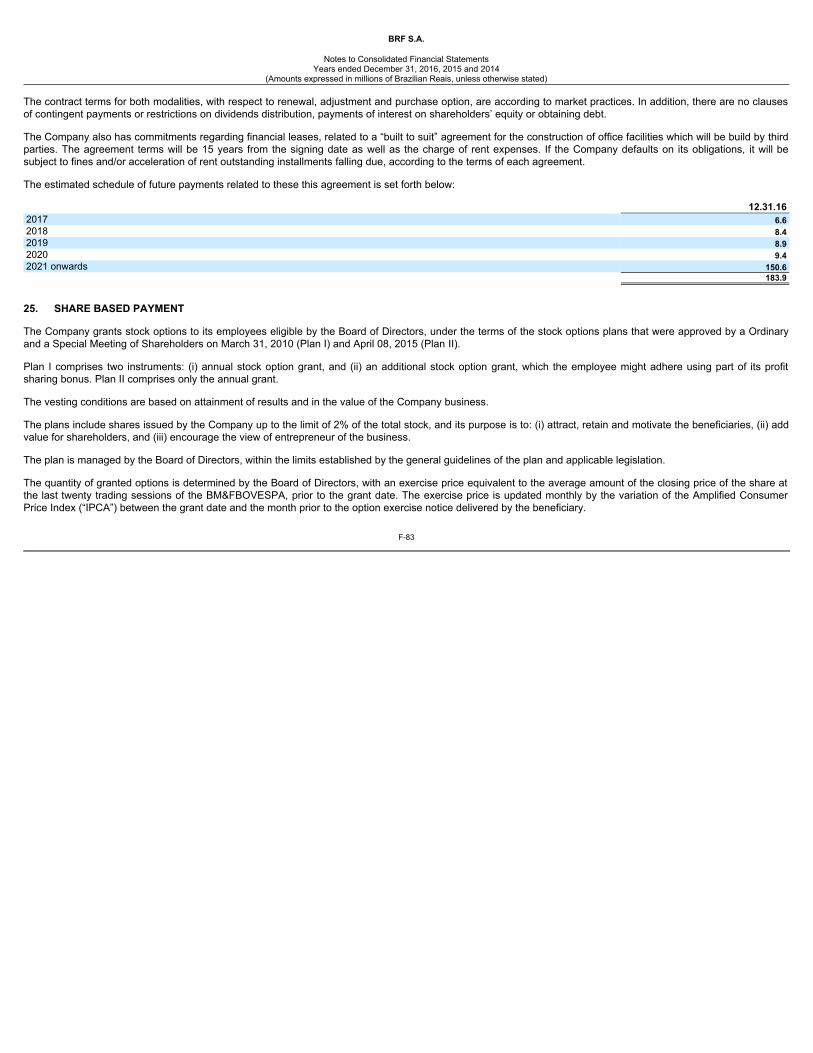
BRF S.A.
Notes to Consolidated Financial Statements
Years ended December 31, 2016, 2015 and 2014(Amounts expressed in millions of Brazilian Reais, unless otherwise stated)
The contract terms for both modalities, with respect to renewal, adjustment and purchase option, are according to market practices. In addition, there are no clausesof contingent payments or restrictions on dividends distribution, payments of interest on shareholders’ equity or obtaining debt. The Company also has commitments regarding financial leases, related to a “built to suit” agreement for the construction of office facilities which will be build by thirdparties. The agreement terms will be 15 years from the signing date as well as the charge of rent expenses. If the Company defaults on its obligations, it will besubject to fines and/or acceleration of rent outstanding installments falling due, according to the terms of each agreement. The estimated schedule of future payments related to these this agreement is set forth below: 12.31.162017 6.62018 8.42019 8.92020 9.42021 onwards 150.6 183.9
25. SHARE BASED PAYMENT The Company grants stock options to its employees eligible by the Board of Directors, under the terms of the stock options plans that were approved by a Ordinaryand a Special Meeting of Shareholders on March 31, 2010 (Plan I) and April 08, 2015 (Plan II). Plan I comprises two instruments: (i) annual stock option grant, and (ii) an additional stock option grant, which the employee might adhere using part of its profitsharing bonus. Plan II comprises only the annual grant. The vesting conditions are based on attainment of results and in the value of the Company business. The plans include shares issued by the Company up to the limit of 2% of the total stock, and its purpose is to: (i) attract, retain and motivate the beneficiaries, (ii) addvalue for shareholders, and (iii) encourage the view of entrepreneur of the business. The plan is managed by the Board of Directors, within the limits established by the general guidelines of the plan and applicable legislation. The quantity of granted options is determined by the Board of Directors, with an exercise price equivalent to the average amount of the closing price of the share atthe last twenty trading sessions of the BM&FBOVESPA, prior to the grant date. The exercise price is updated monthly by the variation of the Amplified ConsumerPrice Index (“IPCA”) between the grant date and the month prior to the option exercise notice delivered by the beneficiary.
F-83
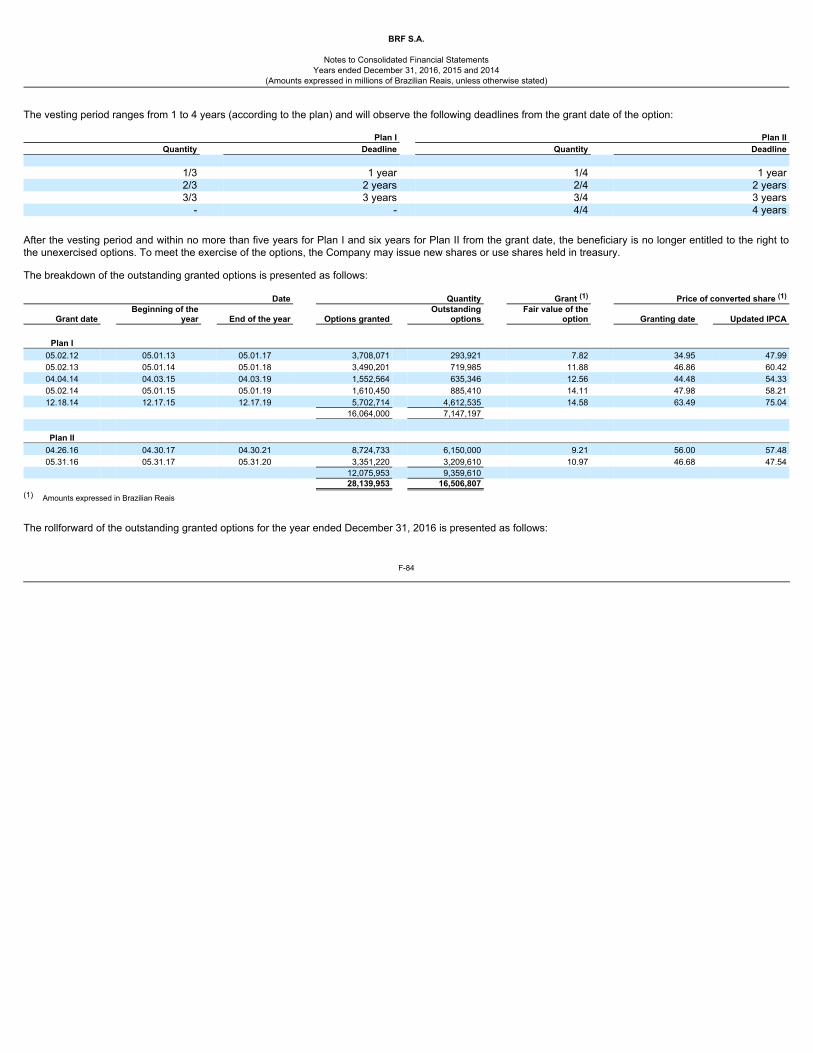
BRF S.A.
Notes to Consolidated Financial Statements
Years ended December 31, 2016, 2015 and 2014(Amounts expressed in millions of Brazilian Reais, unless otherwise stated)
The vesting period ranges from 1 to 4 years (according to the plan) and will observe the following deadlines from the grant date of the option:
Plan I Plan IIQuantity Deadline Quantity Deadline
1/3 1 year 1/4 1 year2/3 2 years 2/4 2 years3/3 3 years 3/4 3 years
- - 4/4 4 years
After the vesting period and within no more than five years for Plan I and six years for Plan II from the grant date, the beneficiary is no longer entitled to the right tothe unexercised options. To meet the exercise of the options, the Company may issue new shares or use shares held in treasury. The breakdown of the outstanding granted options is presented as follows:
Date Quantity Grant (1) Price of converted share (1)
Grant date Beginning of the
year End of the year Options granted Outstanding
options Fair value of the
option Granting date Updated IPCA
Plan I 05.02.12 05.01.13 05.01.17 3,708,071 293,921 7.82 34.95 47.9905.02.13 05.01.14 05.01.18 3,490,201 719,985 11.88 46.86 60.4204.04.14 04.03.15 04.03.19 1,552,564 635,346 12.56 44.48 54.3305.02.14 05.01.15 05.01.19 1,610,450 885,410 14.11 47.98 58.2112.18.14 12.17.15 12.17.19 5,702,714 4,612,535 14.58 63.49 75.04
16,064,000 7,147,197
Plan II 04.26.16 04.30.17 04.30.21 8,724,733 6,150,000 9.21 56.00 57.4805.31.16 05.31.17 05.31.20 3,351,220 3,209,610 10.97 46.68 47.54
12,075,953 9,359,610 28,139,953 16,506,807
(1) Amounts expressed in Brazilian Reais
The rollforward of the outstanding granted options for the year ended December 31, 2016 is presented as follows:
F-84
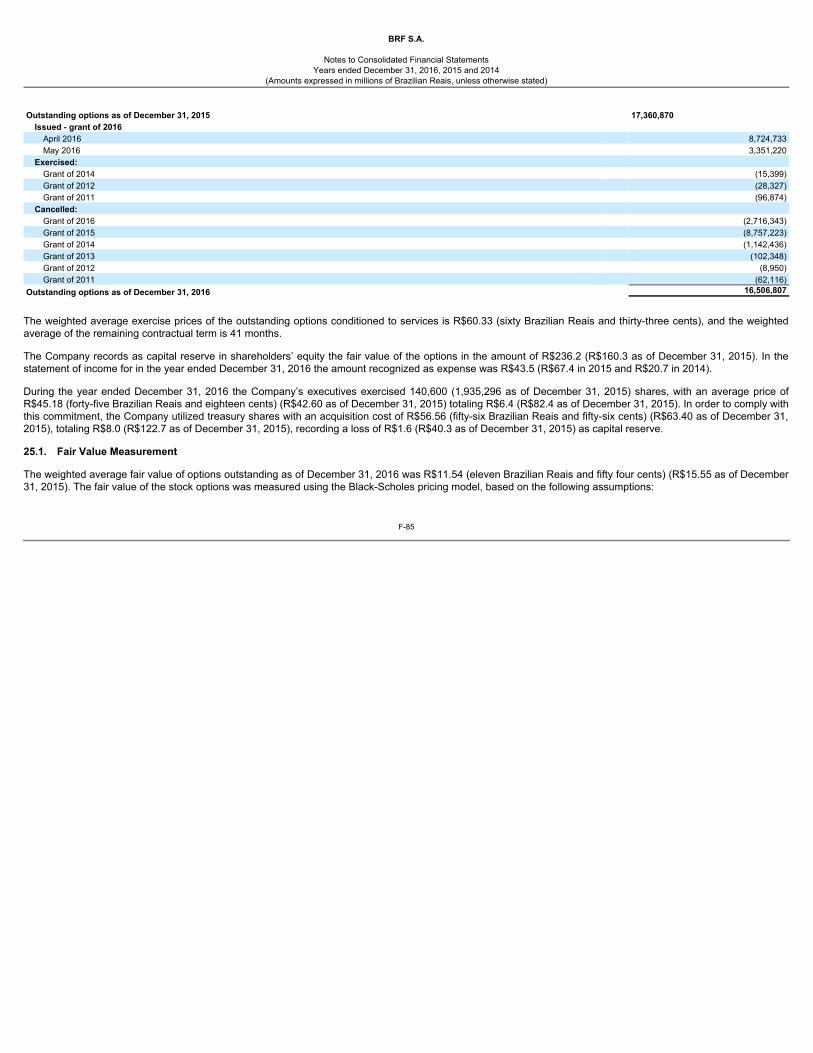
BRF S.A.
Notes to Consolidated Financial Statements
Years ended December 31, 2016, 2015 and 2014(Amounts expressed in millions of Brazilian Reais, unless otherwise stated)
Outstanding options as of December 31, 2015 17,360,870
Issued - grant of 2016 April 2016 8,724,733May 2016 3,351,220
Exercised: Grant of 2014 (15,399)Grant of 2012 (28,327)Grant of 2011 (96,874)
Cancelled: Grant of 2016 (2,716,343)Grant of 2015 (8,757,223)Grant of 2014 (1,142,436)Grant of 2013 (102,348)Grant of 2012 (8,950)Grant of 2011 (62,116)
Outstanding options as of December 31, 2016 16,506,807
The weighted average exercise prices of the outstanding options conditioned to services is R$60.33 (sixty Brazilian Reais and thirty-three cents), and the weightedaverage of the remaining contractual term is 41 months. The Company records as capital reserve in shareholders’ equity the fair value of the options in the amount of R$236.2 (R$160.3 as of December 31, 2015). In thestatement of income for in the year ended December 31, 2016 the amount recognized as expense was R$43.5 (R$67.4 in 2015 and R$20.7 in 2014). During the year ended December 31, 2016 the Company’s executives exercised 140,600 (1,935,296 as of December 31, 2015) shares, with an average price ofR$45.18 (forty-five Brazilian Reais and eighteen cents) (R$42.60 as of December 31, 2015) totaling R$6.4 (R$82.4 as of December 31, 2015). In order to comply withthis commitment, the Company utilized treasury shares with an acquisition cost of R$56.56 (fifty-six Brazilian Reais and fifty-six cents) (R$63.40 as of December 31,2015), totaling R$8.0 (R$122.7 as of December 31, 2015), recording a loss of R$1.6 (R$40.3 as of December 31, 2015) as capital reserve. 25.1. Fair Value Measurement The weighted average fair value of options outstanding as of December 31, 2016 was R$11.54 (eleven Brazilian Reais and fifty four cents) (R$15.55 as of December31, 2015). The fair value of the stock options was measured using the Black-Scholes pricing model, based on the following assumptions:
F-85
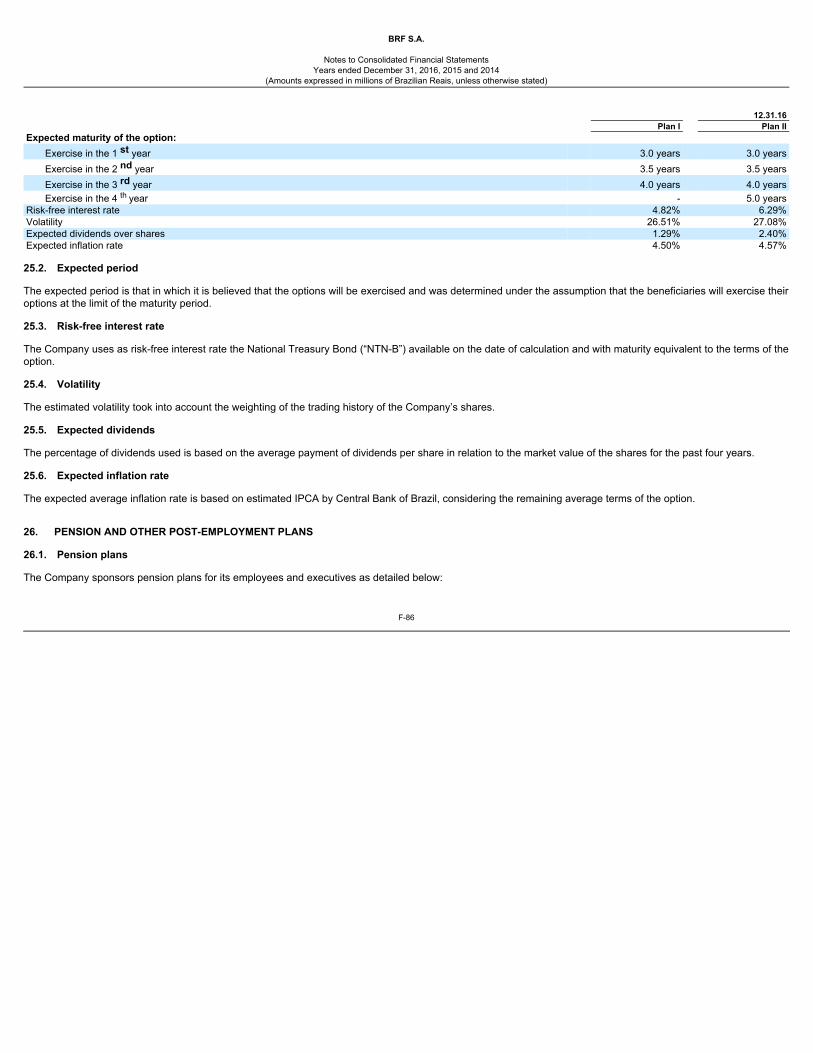
BRF S.A.
Notes to Consolidated Financial Statements
Years ended December 31, 2016, 2015 and 2014(Amounts expressed in millions of Brazilian Reais, unless otherwise stated)
12.31.16 Plan I Plan IIExpected maturity of the option:
Exercise in the 1 st year 3.0 years 3.0 yearsExercise in the 2 nd year 3.5 years 3.5 yearsExercise in the 3 rd year 4.0 years 4.0 yearsExercise in the 4 th year - 5.0 years
Risk-free interest rate 4.82% 6.29%Volatility 26.51% 27.08%Expected dividends over shares 1.29% 2.40%Expected inflation rate 4.50% 4.57%
25.2. Expected period The expected period is that in which it is believed that the options will be exercised and was determined under the assumption that the beneficiaries will exercise theiroptions at the limit of the maturity period. 25.3. Risk-free interest rate The Company uses as risk-free interest rate the National Treasury Bond (“NTN-B”) available on the date of calculation and with maturity equivalent to the terms of theoption. 25.4. Volatility The estimated volatility took into account the weighting of the trading history of the Company’s shares. 25.5. Expected dividends The percentage of dividends used is based on the average payment of dividends per share in relation to the market value of the shares for the past four years. 25.6. Expected inflation rate The expected average inflation rate is based on estimated IPCA by Central Bank of Brazil, considering the remaining average terms of the option. 26. PENSION AND OTHER POST-EMPLOYMENT PLANS 26.1. Pension plans The Company sponsors pension plans for its employees and executives as detailed below:
F-86
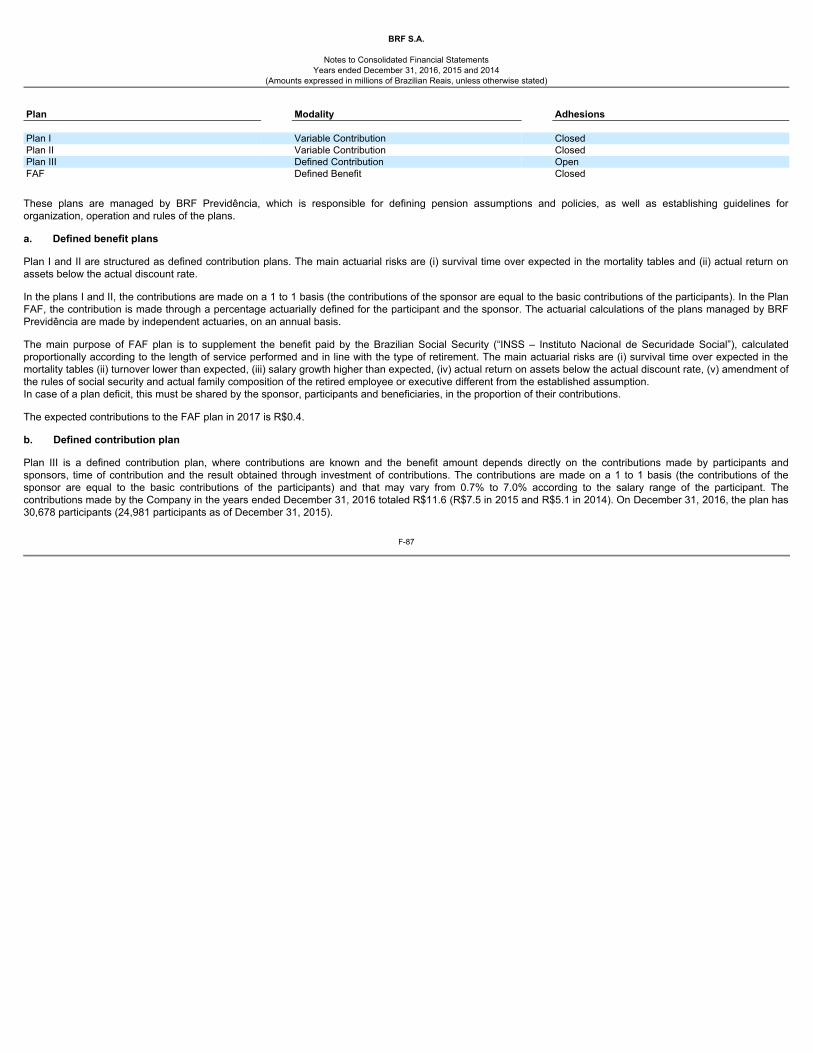
BRF S.A.
Notes to Consolidated Financial Statements
Years ended December 31, 2016, 2015 and 2014(Amounts expressed in millions of Brazilian Reais, unless otherwise stated)
Plan Modality Adhesions Plan I Variable Contribution ClosedPlan II Variable Contribution ClosedPlan III Defined Contribution OpenFAF Defined Benefit Closed
These plans are managed by BRF Previdência, which is responsible for defining pension assumptions and policies, as well as establishing guidelines fororganization, operation and rules of the plans. a. Defined benefit plans Plan I and II are structured as defined contribution plans. The main actuarial risks are (i) survival time over expected in the mortality tables and (ii) actual return onassets below the actual discount rate. In the plans I and II, the contributions are made on a 1 to 1 basis (the contributions of the sponsor are equal to the basic contributions of the participants). In the PlanFAF, the contribution is made through a percentage actuarially defined for the participant and the sponsor. The actuarial calculations of the plans managed by BRFPrevidência are made by independent actuaries, on an annual basis. The main purpose of FAF plan is to supplement the benefit paid by the Brazilian Social Security (“INSS – Instituto Nacional de Securidade Social”), calculatedproportionally according to the length of service performed and in line with the type of retirement. The main actuarial risks are (i) survival time over expected in themortality tables (ii) turnover lower than expected, (iii) salary growth higher than expected, (iv) actual return on assets below the actual discount rate, (v) amendment ofthe rules of social security and actual family composition of the retired employee or executive different from the established assumption.In case of a plan deficit, this must be shared by the sponsor, participants and beneficiaries, in the proportion of their contributions. The expected contributions to the FAF plan in 2017 is R$0.4. b. Defined contribution plan Plan III is a defined contribution plan, where contributions are known and the benefit amount depends directly on the contributions made by participants andsponsors, time of contribution and the result obtained through investment of contributions. The contributions are made on a 1 to 1 basis (the contributions of thesponsor are equal to the basic contributions of the participants) and that may vary from 0.7% to 7.0% according to the salary range of the participant. Thecontributions made by the Company in the years ended December 31, 2016 totaled R$11.6 (R$7.5 in 2015 and R$5.1 in 2014). On December 31, 2016, the plan has30,678 participants (24,981 participants as of December 31, 2015).
F-87

BRF S.A.
Notes to Consolidated Financial Statements
Years ended December 31, 2016, 2015 and 2014(Amounts expressed in millions of Brazilian Reais, unless otherwise stated)
If participants of the plans I, II and III end the employment relationship with the sponsor, the balance of the contributions made by the sponsor not used for thepayment of benefits, will form a fund of surplus of contributions that may be used to compensate the future contributions of the sponsor. c. Rollforward of defined benefit plans The assets and actuarial liabilities are presented below:
F-88
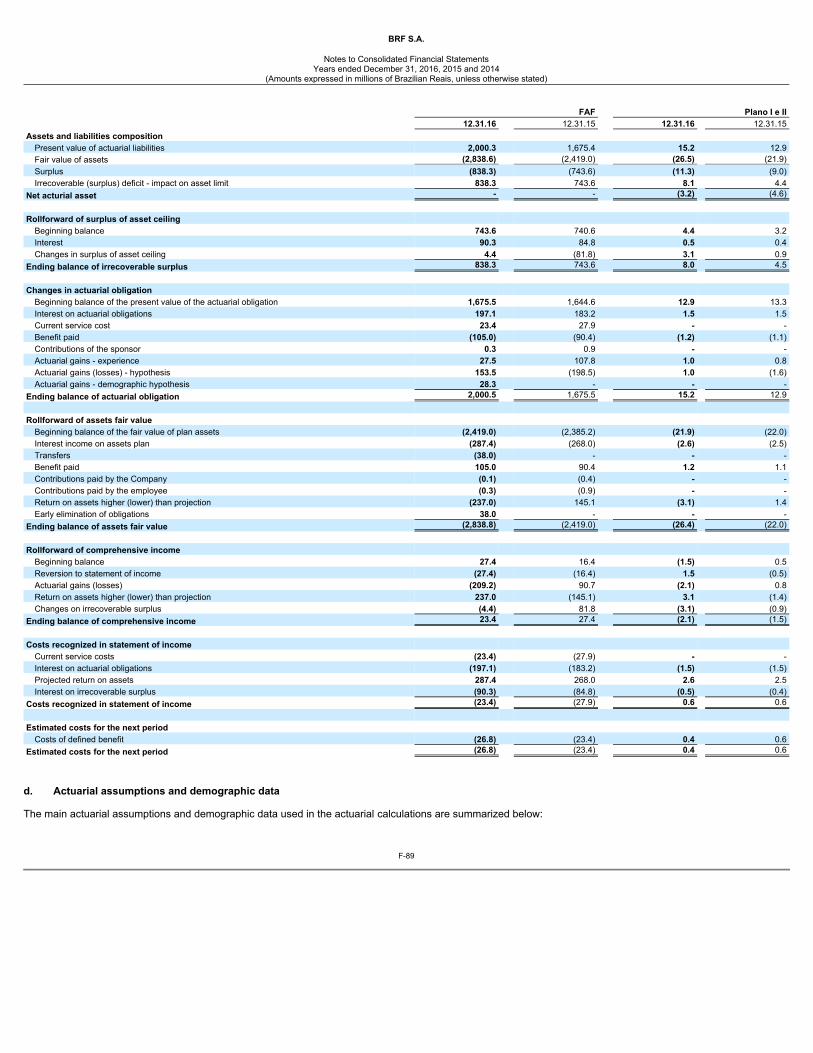
BRF S.A.
Notes to Consolidated Financial Statements
Years ended December 31, 2016, 2015 and 2014(Amounts expressed in millions of Brazilian Reais, unless otherwise stated)
FAF Plano I e II 12.31.16 12.31.15 12.31.16 12.31.15Assets and liabilities composition
Present value of actuarial liabilities 2,000.3 1,675.4 15.2 12.9Fair value of assets (2,838.6) (2,419.0) (26.5) (21.9)Surplus (838.3) (743.6) (11.3) (9.0)Irrecoverable (surplus) deficit - impact on asset limit 838.3 743.6 8.1 4.4
Net acturial asset - - (3.2) (4.6) Rollforward of surplus of asset ceiling
Beginning balance 743.6 740.6 4.4 3.2Interest 90.3 84.8 0.5 0.4Changes in surplus of asset ceiling 4.4 (81.8) 3.1 0.9
Ending balance of irrecoverable surplus 838.3 743.6 8.0 4.5 Changes in actuarial obligation
Beginning balance of the present value of the actuarial obligation 1,675.5 1,644.6 12.9 13.3Interest on actuarial obligations 197.1 183.2 1.5 1.5Current service cost 23.4 27.9 - -Benefit paid (105.0) (90.4) (1.2) (1.1)Contributions of the sponsor 0.3 0.9 - -Actuarial gains - experience 27.5 107.8 1.0 0.8Actuarial gains (losses) - hypothesis 153.5 (198.5) 1.0 (1.6)Actuarial gains - demographic hypothesis 28.3 - - -
Ending balance of actuarial obligation 2,000.5 1,675.5 15.2 12.9 Rollforward of assets fair value
Beginning balance of the fair value of plan assets (2,419.0) (2,385.2) (21.9) (22.0)Interest income on assets plan (287.4) (268.0) (2.6) (2.5)Transfers (38.0) - - -Benefit paid 105.0 90.4 1.2 1.1Contributions paid by the Company (0.1) (0.4) - -Contributions paid by the employee (0.3) (0.9) - -Return on assets higher (lower) than projection (237.0) 145.1 (3.1) 1.4Early elimination of obligations 38.0 - - -
Ending balance of assets fair value (2,838.8) (2,419.0) (26.4) (22.0) Rollforward of comprehensive income
Beginning balance 27.4 16.4 (1.5) 0.5Reversion to statement of income (27.4) (16.4) 1.5 (0.5)Actuarial gains (losses) (209.2) 90.7 (2.1) 0.8Return on assets higher (lower) than projection 237.0 (145.1) 3.1 (1.4)Changes on irrecoverable surplus (4.4) 81.8 (3.1) (0.9)
Ending balance of comprehensive income 23.4 27.4 (2.1) (1.5) Costs recognized in statement of income
Current service costs (23.4) (27.9) - -Interest on actuarial obligations (197.1) (183.2) (1.5) (1.5)Projected return on assets 287.4 268.0 2.6 2.5Interest on irrecoverable surplus (90.3) (84.8) (0.5) (0.4)
Costs recognized in statement of income (23.4) (27.9) 0.6 0.6 Estimated costs for the next period
Costs of defined benefit (26.8) (23.4) 0.4 0.6Estimated costs for the next period (26.8) (23.4) 0.4 0.6
d. Actuarial assumptions and demographic data
The main actuarial assumptions and demographic data used in the actuarial calculations are summarized below:
F-89
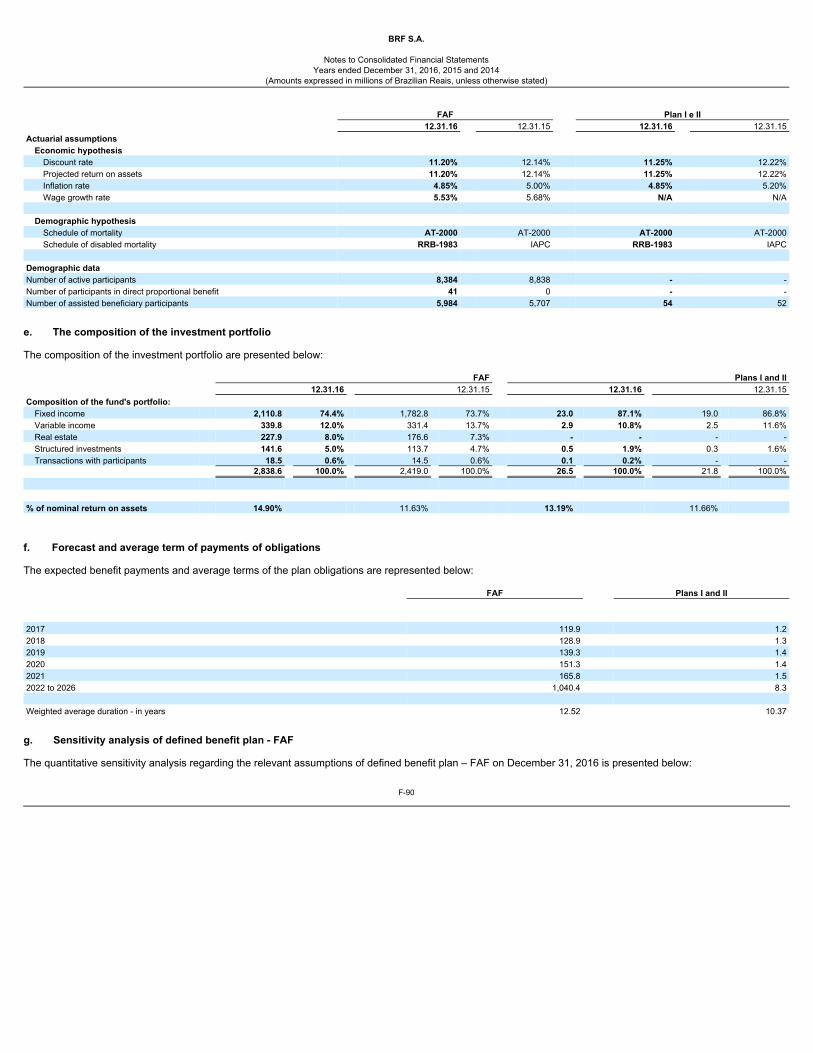
BRF S.A.
Notes to Consolidated Financial Statements
Years ended December 31, 2016, 2015 and 2014(Amounts expressed in millions of Brazilian Reais, unless otherwise stated)
FAF Plan I e II 12.31.16 12.31.15 12.31.16 12.31.15Actuarial assumptions
Economic hypothesis Discount rate 11.20% 12.14% 11.25% 12.22%Projected return on assets 11.20% 12.14% 11.25% 12.22%Inflation rate 4.85% 5.00% 4.85% 5.20%Wage growth rate 5.53% 5.68% N/A N/A
Demographic hypothesis
Schedule of mortality AT-2000 AT-2000 AT-2000 AT-2000Schedule of disabled mortality RRB-1983 IAPC RRB-1983 IAPC
Demographic data Number of active participants 8,384 8,838 - -Number of participants in direct proportional benefit 41 0 - -Number of assisted beneficiary participants 5,984 5,707 54 52
e. The composition of the investment portfolio The composition of the investment portfolio are presented below: FAF Plans I and II 12.31.16 12.31.15 12.31.16 12.31.15Composition of the fund's portfolio:
Fixed income 2,110.8 74.4% 1,782.8 73.7% 23.0 87.1% 19.0 86.8%Variable income 339.8 12.0% 331.4 13.7% 2.9 10.8% 2.5 11.6%Real estate 227.9 8.0% 176.6 7.3% - - - -Structured investments 141.6 5.0% 113.7 4.7% 0.5 1.9% 0.3 1.6%Transactions with participants 18.5 0.6% 14.5 0.6% 0.1 0.2% - -
2,838.6 100.0% 2,419.0 100.0% 26.5 100.0% 21.8 100.0% % of nominal return on assets 14.90% 11.63% 13.19% 11.66%
f. Forecast and average term of payments of obligations The expected benefit payments and average terms of the plan obligations are represented below: FAF Plans I and II 2017 119.9 1.22018 128.9 1.32019 139.3 1.42020 151.3 1.42021 165.8 1.52022 to 2026 1,040.4 8.3 Weighted average duration - in years 12.52 10.37
g. Sensitivity analysis of defined benefit plan - FAF The quantitative sensitivity analysis regarding the relevant assumptions of defined benefit plan – FAF on December 31, 2016 is presented below:
F-90
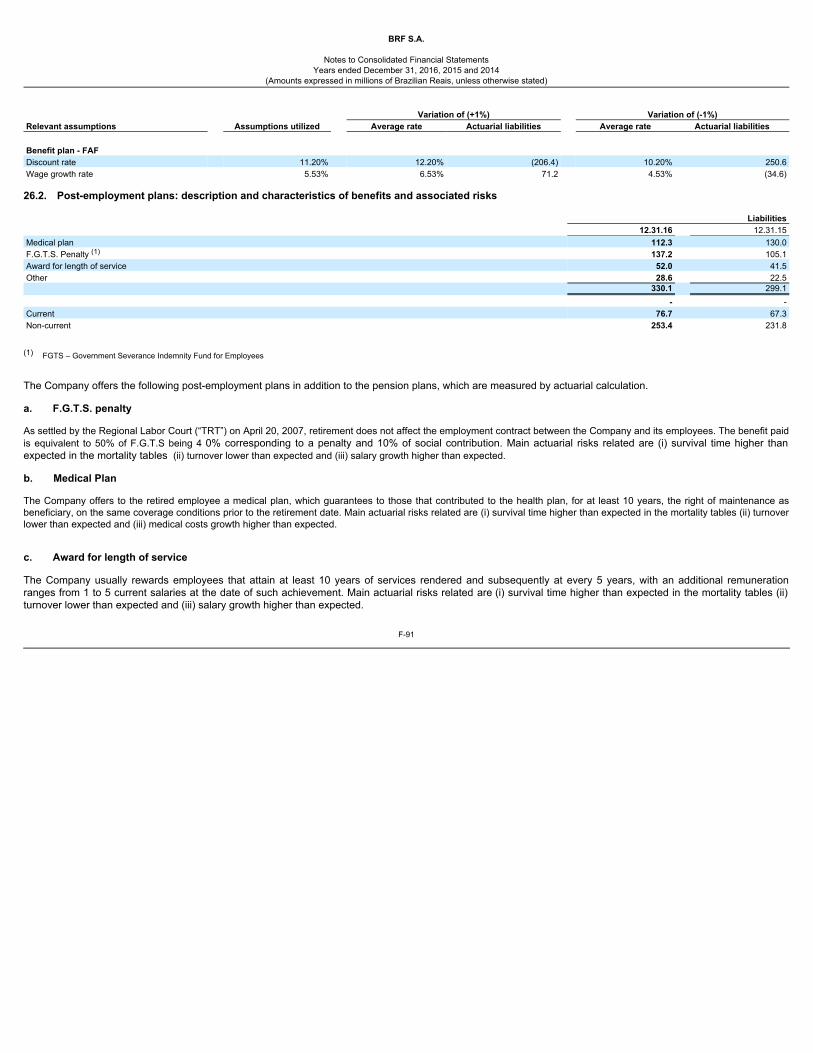
BRF S.A.
Notes to Consolidated Financial Statements
Years ended December 31, 2016, 2015 and 2014(Amounts expressed in millions of Brazilian Reais, unless otherwise stated)
Variation of (+1%) Variation of (-1%)Relevant assumptions Assumptions utilized Average rate Actuarial liabilities Average rate Actuarial liabilities Benefit plan - FAF Discount rate 11.20% 12.20% (206.4) 10.20% 250.6Wage growth rate 5.53% 6.53% 71.2 4.53% (34.6)
26.2. Post-employment plans: description and characteristics of benefits and associated risks Liabilities 12.31.16 12.31.15Medical plan 112.3 130.0F.G.T.S. Penalty (1) 137.2 105.1Award for length of service 52.0 41.5Other 28.6 22.5 330.1 299.1 - -Current 76.7 67.3Non-current 253.4 231.8
(1) FGTS – Government Severance Indemnity Fund for Employees
The Company offers the following post-employment plans in addition to the pension plans, which are measured by actuarial calculation. a. F.G.T.S. penalty As settled by the Regional Labor Court (“TRT”) on April 20, 2007, retirement does not affect the employment contract between the Company and its employees. The benefit paidis equivalent to 50% of F.G.T.S being 4 0% corresponding to a penalty and 10% of social contribution. Main actuarial risks related are (i) survival time higher thanexpected in the mortality tables (ii) turnover lower than expected and (iii) salary growth higher than expected. b. Medical Plan The Company offers to the retired employee a medical plan, which guarantees to those that contributed to the health plan, for at least 10 years, the right of maintenance asbeneficiary, on the same coverage conditions prior to the retirement date. Main actuarial risks related are (i) survival time higher than expected in the mortality tables (ii) turnoverlower than expected and (iii) medical costs growth higher than expected. c. Award for length of service The Company usually rewards employees that attain at least 10 years of services rendered and subsequently at every 5 years, with an additional remunerationranges from 1 to 5 current salaries at the date of such achievement. Main actuarial risks related are (i) survival time higher than expected in the mortality tables (ii)turnover lower than expected and (iii) salary growth higher than expected.
F-91
BRF S.A.
Notes to Consolidated Financial Statements
Years ended December 31, 2016, 2015 and 2014(Amounts expressed in millions of Brazilian Reais, unless otherwise stated)
d. Retirement compensation On retirement, employees with over 10 years of service to the Company are eligible for additional compensation of 1 to 2 current wages in force at the time ofretirement. Main actuarial risks related are (i) survival time higher than expected in the mortality tables (ii) turnover lower than expected and (iii) salary growth higherthan expected. e. Life insurance The Company offers life insurance benefit to the employees who, at the time of their termination, are retired and during the employment contract opted for theinsurance. For the employees with 10-20 years of service, the maintenance period of insurance is 2 years, from 21 years of service, the period is 3 years. Mainactuarial risks related are (i) survival time higher than expected in the mortality tables (ii) turnover lower than expected and (iii) insurance costs higher than expected.
F-92
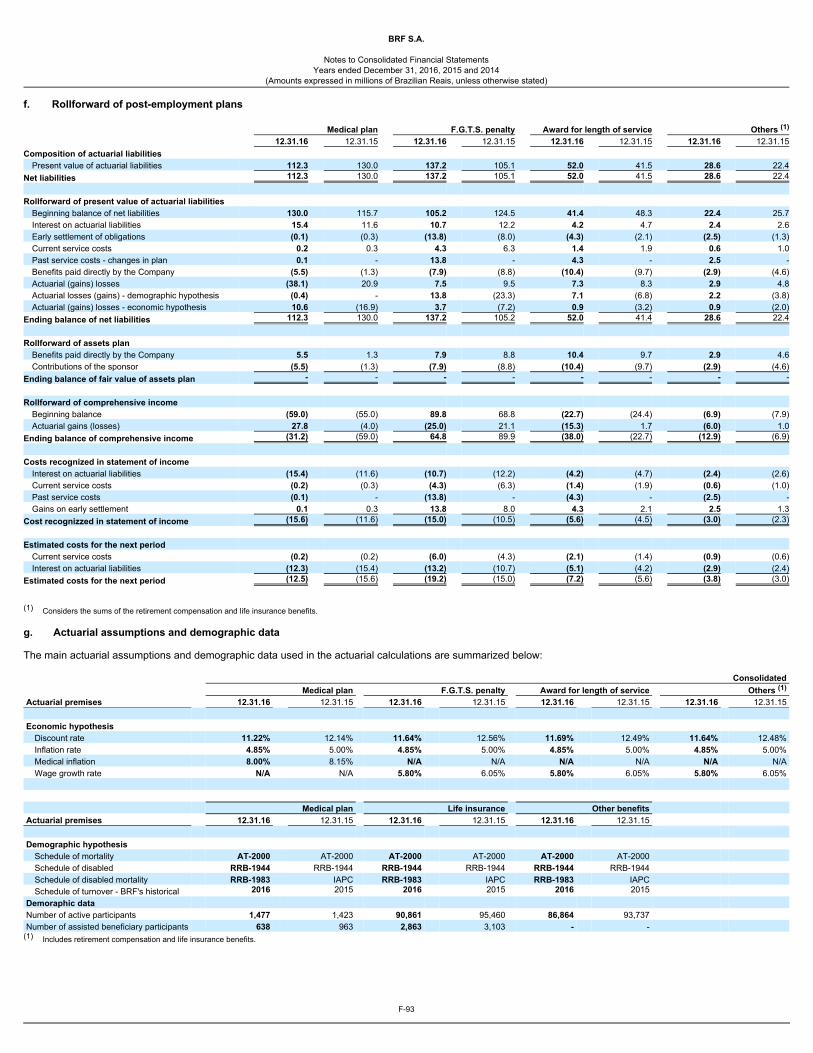
BRF S.A.
Notes to Consolidated Financial Statements
Years ended December 31, 2016, 2015 and 2014(Amounts expressed in millions of Brazilian Reais, unless otherwise stated)
f. Rollforward of post-employment plans Medical plan F.G.T.S. penalty Award for length of service Others (1)
12.31.16 12.31.15 12.31.16 12.31.15 12.31.16 12.31.15 12.31.16 12.31.15Composition of actuarial liabilities
Present value of actuarial liabilities 112.3 130.0 137.2 105.1 52.0 41.5 28.6 22.4Net liabilities 112.3 130.0 137.2 105.1 52.0 41.5 28.6 22.4 Rollforward of present value of actuarial liabilities
Beginning balance of net liabilities 130.0 115.7 105.2 124.5 41.4 48.3 22.4 25.7Interest on actuarial liabilities 15.4 11.6 10.7 12.2 4.2 4.7 2.4 2.6Early settlement of obligations (0.1) (0.3) (13.8) (8.0) (4.3) (2.1) (2.5) (1.3)Current service costs 0.2 0.3 4.3 6.3 1.4 1.9 0.6 1.0Past service costs - changes in plan 0.1 - 13.8 - 4.3 - 2.5 -Benefits paid directly by the Company (5.5) (1.3) (7.9) (8.8) (10.4) (9.7) (2.9) (4.6)Actuarial (gains) losses (38.1) 20.9 7.5 9.5 7.3 8.3 2.9 4.8Actuarial losses (gains) - demographic hypothesis (0.4) - 13.8 (23.3) 7.1 (6.8) 2.2 (3.8)Actuarial (gains) losses - economic hypothesis 10.6 (16.9) 3.7 (7.2) 0.9 (3.2) 0.9 (2.0)
Ending balance of net liabilities 112.3 130.0 137.2 105.2 52.0 41.4 28.6 22.4 Rollforward of assets plan
Benefits paid directly by the Company 5.5 1.3 7.9 8.8 10.4 9.7 2.9 4.6Contributions of the sponsor (5.5) (1.3) (7.9) (8.8) (10.4) (9.7) (2.9) (4.6)
Ending balance of fair value of assets plan - - - - - - - - Rollforward of comprehensive income
Beginning balance (59.0) (55.0) 89.8 68.8 (22.7) (24.4) (6.9) (7.9)Actuarial gains (losses) 27.8 (4.0) (25.0) 21.1 (15.3) 1.7 (6.0) 1.0
Ending balance of comprehensive income (31.2) (59.0) 64.8 89.9 (38.0) (22.7) (12.9) (6.9) Costs recognized in statement of income
Interest on actuarial liabilities (15.4) (11.6) (10.7) (12.2) (4.2) (4.7) (2.4) (2.6)Current service costs (0.2) (0.3) (4.3) (6.3) (1.4) (1.9) (0.6) (1.0)Past service costs (0.1) - (13.8) - (4.3) - (2.5) -Gains on early settlement 0.1 0.3 13.8 8.0 4.3 2.1 2.5 1.3
Cost recognizzed in statement of income (15.6) (11.6) (15.0) (10.5) (5.6) (4.5) (3.0) (2.3) Estimated costs for the next period
Current service costs (0.2) (0.2) (6.0) (4.3) (2.1) (1.4) (0.9) (0.6)Interest on actuarial liabilities (12.3) (15.4) (13.2) (10.7) (5.1) (4.2) (2.9) (2.4)
Estimated costs for the next period (12.5) (15.6) (19.2) (15.0) (7.2) (5.6) (3.8) (3.0)
(1) Considers the sums of the retirement compensation and life insurance benefits. g. Actuarial assumptions and demographic data The main actuarial assumptions and demographic data used in the actuarial calculations are summarized below: Consolidated Medical plan F.G.T.S. penalty Award for length of service Others (1)
Actuarial premises 12.31.16 12.31.15 12.31.16 12.31.15 12.31.16 12.31.15 12.31.16 12.31.15 Economic hypothesis
Discount rate 11.22% 12.14% 11.64% 12.56% 11.69% 12.49% 11.64% 12.48%Inflation rate 4.85% 5.00% 4.85% 5.00% 4.85% 5.00% 4.85% 5.00%Medical inflation 8.00% 8.15% N/A N/A N/A N/A N/A N/AWage growth rate N/A N/A 5.80% 6.05% 5.80% 6.05% 5.80% 6.05%
Medical plan Life insurance Other benefits Actuarial premises 12.31.16 12.31.15 12.31.16 12.31.15 12.31.16 12.31.15 Demographic hypothesis
Schedule of mortality AT-2000 AT-2000 AT-2000 AT-2000 AT-2000 AT-2000 Schedule of disabled RRB-1944 RRB-1944 RRB-1944 RRB-1944 RRB-1944 RRB-1944 Schedule of disabled mortality RRB-1983 IAPC RRB-1983 IAPC RRB-1983 IAPC Schedule of turnover - BRF's historical 2016 2015 2016 2015 2016 2015
Demoraphic data Number of active participants 1,477 1,423 90,861 95,460 86,864 93,737 Number of assisted beneficiary participants 638 963 2,863 3,103 - -
(1) Includes retirement compensation and life insurance benefits.
F-93
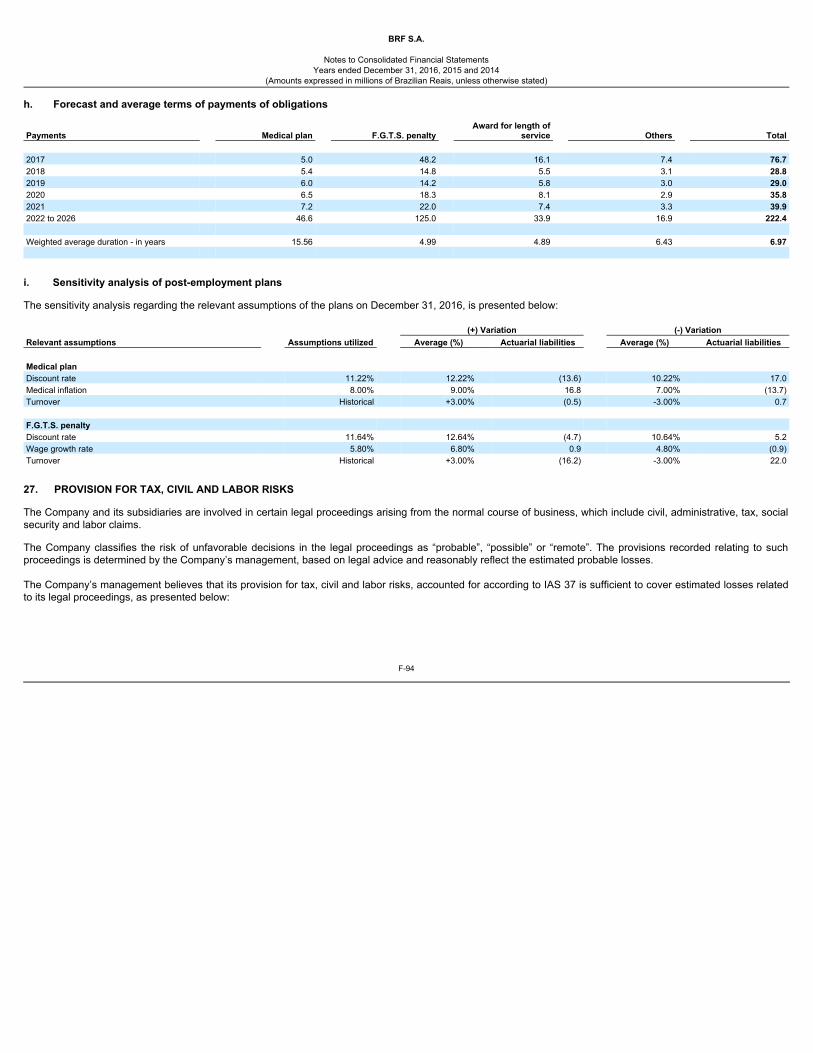
BRF S.A.
Notes to Consolidated Financial Statements
Years ended December 31, 2016, 2015 and 2014(Amounts expressed in millions of Brazilian Reais, unless otherwise stated)
h. Forecast and average terms of payments of obligations
Payments Medical plan F.G.T.S. penalty Award for length of
service Others Total 2017 5.0 48.2 16.1 7.4 76.72018 5.4 14.8 5.5 3.1 28.82019 6.0 14.2 5.8 3.0 29.02020 6.5 18.3 8.1 2.9 35.82021 7.2 22.0 7.4 3.3 39.92022 to 2026 46.6 125.0 33.9 16.9 222.4 Weighted average duration - in years 15.56 4.99 4.89 6.43 6.97
i. Sensitivity analysis of post-employment plans The sensitivity analysis regarding the relevant assumptions of the plans on December 31, 2016, is presented below: (+) Variation (-) VariationRelevant assumptions Assumptions utilized Average (%) Actuarial liabilities Average (%) Actuarial liabilities Medical plan Discount rate 11.22% 12.22% (13.6) 10.22% 17.0Medical inflation 8.00% 9.00% 16.8 7.00% (13.7)Turnover Historical +3.00% (0.5) -3.00% 0.7 F.G.T.S. penalty Discount rate 11.64% 12.64% (4.7) 10.64% 5.2Wage growth rate 5.80% 6.80% 0.9 4.80% (0.9)Turnover Historical +3.00% (16.2) -3.00% 22.0
27. PROVISION FOR TAX, CIVIL AND LABOR RISKS The Company and its subsidiaries are involved in certain legal proceedings arising from the normal course of business, which include civil, administrative, tax, socialsecurity and labor claims. The Company classifies the risk of unfavorable decisions in the legal proceedings as “probable”, “possible” or “remote”. The provisions recorded relating to suchproceedings is determined by the Company’s management, based on legal advice and reasonably reflect the estimated probable losses. The Company’s management believes that its provision for tax, civil and labor risks, accounted for according to IAS 37 is sufficient to cover estimated losses relatedto its legal proceedings, as presented below:
F-94
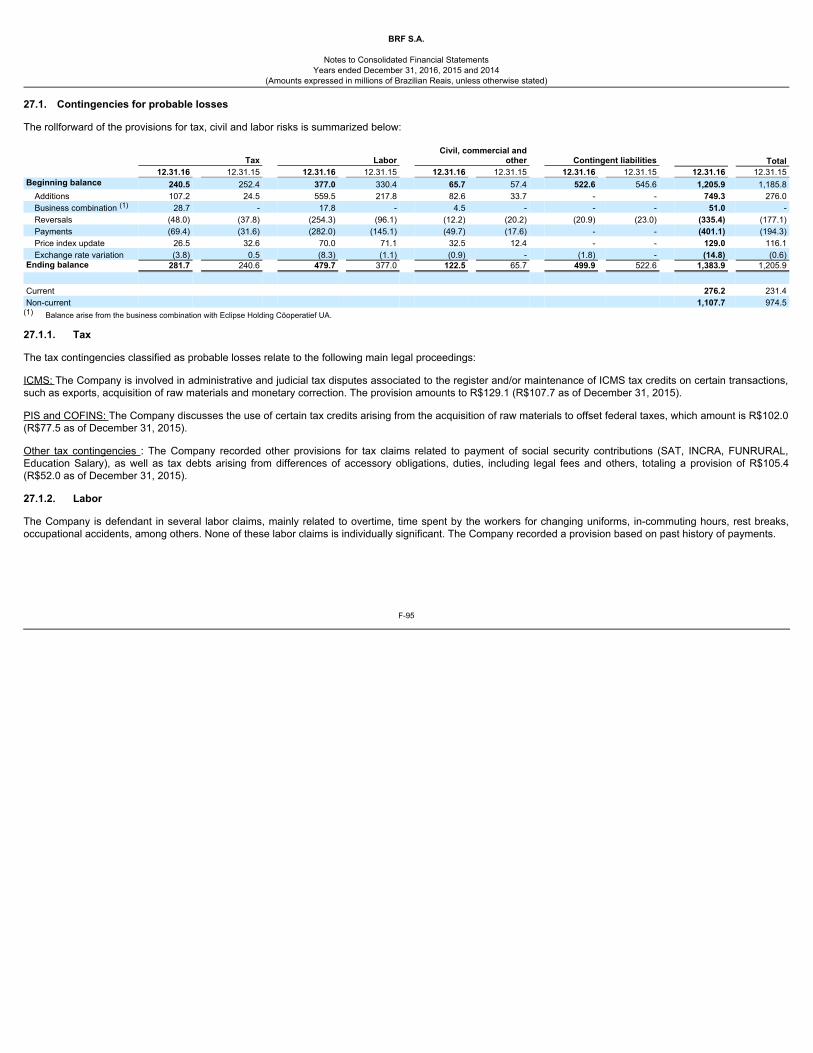
BRF S.A.
Notes to Consolidated Financial Statements
Years ended December 31, 2016, 2015 and 2014(Amounts expressed in millions of Brazilian Reais, unless otherwise stated)
27.1. Contingencies for probable losses The rollforward of the provisions for tax, civil and labor risks is summarized below:
Tax Labor Civil, commercial and
other Contingent liabilities Total 12.31.16 12.31.15 12.31.16 12.31.15 12.31.16 12.31.15 12.31.16 12.31.15 12.31.16 12.31.15Beginning balance 240.5 252.4 377.0 330.4 65.7 57.4 522.6 545.6 1,205.9 1,185.8
Additions 107.2 24.5 559.5 217.8 82.6 33.7 - - 749.3 276.0Business combination (1) 28.7 - 17.8 - 4.5 - - - 51.0 -Reversals (48.0) (37.8) (254.3) (96.1) (12.2) (20.2) (20.9) (23.0) (335.4) (177.1)Payments (69.4) (31.6) (282.0) (145.1) (49.7) (17.6) - - (401.1) (194.3)Price index update 26.5 32.6 70.0 71.1 32.5 12.4 - - 129.0 116.1Exchange rate variation (3.8) 0.5 (8.3) (1.1) (0.9) - (1.8) - (14.8) (0.6)
Ending balance 281.7 240.6 479.7 377.0 122.5 65.7 499.9 522.6 1,383.9 1,205.9 Current 276.2 231.4Non-current 1,107.7 974.5
(1) Balance arise from the business combination with Eclipse Holding Cöoperatief UA.
27.1.1. Tax The tax contingencies classified as probable losses relate to the following main legal proceedings:
ICMS: The Company is involved in administrative and judicial tax disputes associated to the register and/or maintenance of ICMS tax credits on certain transactions,such as exports, acquisition of raw materials and monetary correction. The provision amounts to R$129.1 (R$107.7 as of December 31, 2015). PIS and COFINS: The Company discusses the use of certain tax credits arising from the acquisition of raw materials to offset federal taxes, which amount is R$102.0(R$77.5 as of December 31, 2015). Other tax contingencies : The Company recorded other provisions for tax claims related to payment of social security contributions (SAT, INCRA, FUNRURAL,Education Salary), as well as tax debts arising from differences of accessory obligations, duties, including legal fees and others, totaling a provision of R$105.4(R$52.0 as of December 31, 2015). 27.1.2. Labor
The Company is defendant in several labor claims, mainly related to overtime, time spent by the workers for changing uniforms, in-commuting hours, rest breaks,occupational accidents, among others. None of these labor claims is individually significant. The Company recorded a provision based on past history of payments.
F-95
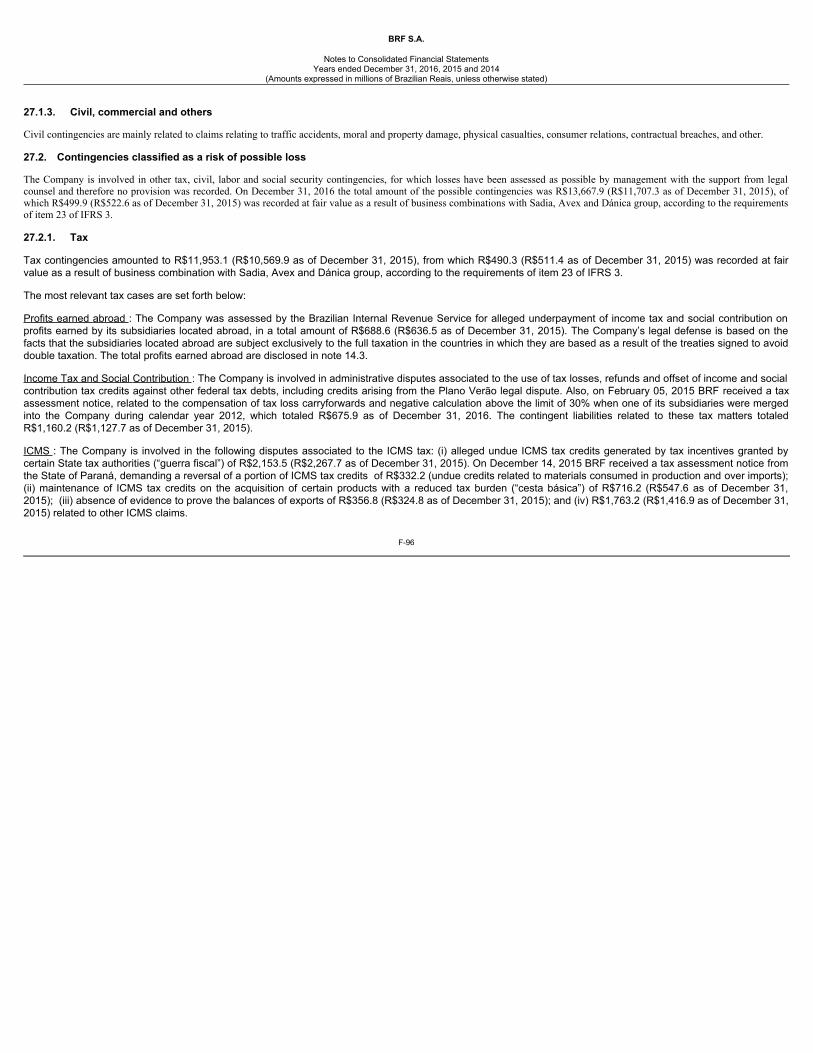
BRF S.A.
Notes to Consolidated Financial Statements
Years ended December 31, 2016, 2015 and 2014(Amounts expressed in millions of Brazilian Reais, unless otherwise stated)
27.1.3. Civil, commercial and others Civil contingencies are mainly related to claims relating to traffic accidents, moral and property damage, physical casualties, consumer relations, contractual breaches, and other. 27.2. Contingencies classified as a risk of possible loss The Company is involved in other tax, civil, labor and social security contingencies, for which losses have been assessed as possible by management with the support from legalcounsel and therefore no provision was recorded. On December 31, 2016 the total amount of the possible contingencies was R$13,667.9 (R$11,707.3 as of December 31, 2015), ofwhich R$499.9 (R$522.6 as of December 31, 2015) was recorded at fair value as a result of business combinations with Sadia, Avex and Dánica group, according to the requirementsof item 23 of IFRS 3. 27.2.1. Tax Tax contingencies amounted to R$11,953.1 (R$10,569.9 as of December 31, 2015), from which R$490.3 (R$511.4 as of December 31, 2015) was recorded at fairvalue as a result of business combination with Sadia, Avex and Dánica group, according to the requirements of item 23 of IFRS 3. The most relevant tax cases are set forth below: Profits earned abroad : The Company was assessed by the Brazilian Internal Revenue Service for alleged underpayment of income tax and social contribution onprofits earned by its subsidiaries located abroad, in a total amount of R$688.6 (R$636.5 as of December 31, 2015). The Company’s legal defense is based on thefacts that the subsidiaries located abroad are subject exclusively to the full taxation in the countries in which they are based as a result of the treaties signed to avoiddouble taxation. The total profits earned abroad are disclosed in note 14.3. Income Tax and Social Contribution : The Company is involved in administrative disputes associated to the use of tax losses, refunds and offset of income and socialcontribution tax credits against other federal tax debts, including credits arising from the Plano Verão legal dispute. Also, on February 05, 2015 BRF received a taxassessment notice, related to the compensation of tax loss carryforwards and negative calculation above the limit of 30% when one of its subsidiaries were mergedinto the Company during calendar year 2012, which totaled R$675.9 as of December 31, 2016. The contingent liabilities related to these tax matters totaledR$1,160.2 (R$1,127.7 as of December 31, 2015). ICMS : The Company is involved in the following disputes associated to the ICMS tax: (i) alleged undue ICMS tax credits generated by tax incentives granted bycertain State tax authorities (“guerra fiscal”) of R$2,153.5 (R$2,267.7 as of December 31, 2015). On December 14, 2015 BRF received a tax assessment notice fromthe State of Paraná, demanding a reversal of a portion of ICMS tax credits of R$332.2 (undue credits related to materials consumed in production and over imports);(ii) maintenance of ICMS tax credits on the acquisition of certain products with a reduced tax burden (“cesta básica”) of R$716.2 (R$547.6 as of December 31,2015); (iii) absence of evidence to prove the balances of exports of R$356.8 (R$324.8 as of December 31, 2015); and (iv) R$1,763.2 (R$1,416.9 as of December 31,2015) related to other ICMS claims.
F-96
BRF S.A.
Notes to Consolidated Financial Statements
Years ended December 31, 2016, 2015 and 2014(Amounts expressed in millions of Brazilian Reais, unless otherwise stated)
In a meeting held on October 16, 2014 with the decision disclosed on February 13, 2015, the Brazilian Federal Supreme Court ("STF") found in favor to the TaxAuthority of State of Rio Grande do Sul, in a judgment relating to the extraordinary appeal No.635.688 submitted by company Santa Lúcia. The STF ruled thatcompanies could not recognize full VAT credits relating to products included in the basic food basket which have reduced rate of VAT. As disclosed above, theCompany has a possible loss contingency of R$716.2 related to this matter as of December 31, 2016. Although this decision has wide general repercussions and forms a precedent for other taxpayers and courts, there will still be, in accordance with applicable law, amotion for clarification, which will include a determination of the date at which the effects of the decision are applicable to the Company. Due to this uncertainty, theCompany is unable to reliably measure the effect of the decision or to record the impact in its consolidated financial statements. IPI: The Company discusses administratively the non-ratification of compensation of IPI credits resulting from purchases of exempted goods, sales to Manaus FreeZone and purchases of supplies of non-taxpayers with PIS and COFINS in the amount of R$459.2 (R$453.2 as of December, 2015). IPI Premium Credits : The Company is involved in a judicial dispute related to the alleged undue offsetting of IPI Premium Credits against other federal taxes ofR$440.1 (R$464.7 as of December 31, 2015). The Company recorded and used these credits based on a final judicial decision. PIS and COFINS : The Company is mainly involved in administrative proceedings regarding the offsetting of credits against other federal tax debts of R$3,614.9(R$3,097.2 as of December 31, 2015). Social Security Taxes : The Company is involved in disputes related to social security charges allegedly due on payments to service providers as well as jointresponsibility with civil construction service providers and others of R$237.2 (R$194.4 as of December 31, 2015). Other Contingencies : The Company is involved in other tax contingencies including rural activity, transfer price, social contribution tax and others, totaling R$29.7(R$39.0 as of December 31, 2015).
F-97
BRF S.A.
Notes to Consolidated Financial Statements
Years ended December 31, 2016, 2015 and 2014(Amounts expressed in millions of Brazilian Reais, unless otherwise stated)
Additionally, the Company’s management has determined the disclosure of the information about the legal proceeding below: HUAINE : the Company was included as co-responsible in a debt from Huaine Participações Ltda (former holding of Perdigão). In this lawsuit it is being discussed theinclusion of the Company in the liability from the tax execution of R$642.8 (R$625.5 as of December 31, 2015). BRF presented a guarantee to the debt, which wasaccepted by the judge and filed a motion, which is still waiting judgment. The Company’s legal advisors classified the risk of losses as remote. 27.2.2. Labor On December 31, 2016 the contingencies assessed as possible loss totaled R$34.9 (R$39.2 as of December 31, 2015). 27.2.3. Civil The civil contingencies for which losses were assessed as possible totaled R$1,679.8 (R$1,098.2 as of December 31, 2015) and were mainly related toindemnification for material and moral damages. 28. SHAREHOLDERS’ EQUITY 28.1. Capital stock On December 31, 2016, the capital subscribed and paid by the Company is R$12,553.4, which is composed of 812,473,246 book-entry shares of common stockwithout par value. The capital stock is presented net of the public offering expenses of R$92.9. On February 25, 2016, the Board of Directors approved the cancellation of 60,000,000 (sixty million) common shares held in treasury by the Company, without anyreduction in the capital stock. On April 07, 2016, the cancellation was ratified in the Shareholders Ordinary Meeting. The Company is authorized to increase the capital stock, irrespective of amendment to the bylaws, up to the limit of 1,000,000,000 common shares, in book-entryform without par value. 28.2. Interest on shareholders’ equity and dividends On February 12, 2016, the Company paid R$473.4 in relation to the interest on shareholders’ equity and R$91.4 related to dividends approved by Management onDecember 17, 2015 and ratified by the Shareholders Ordinary Meeting on April 7, 2016.
F-98
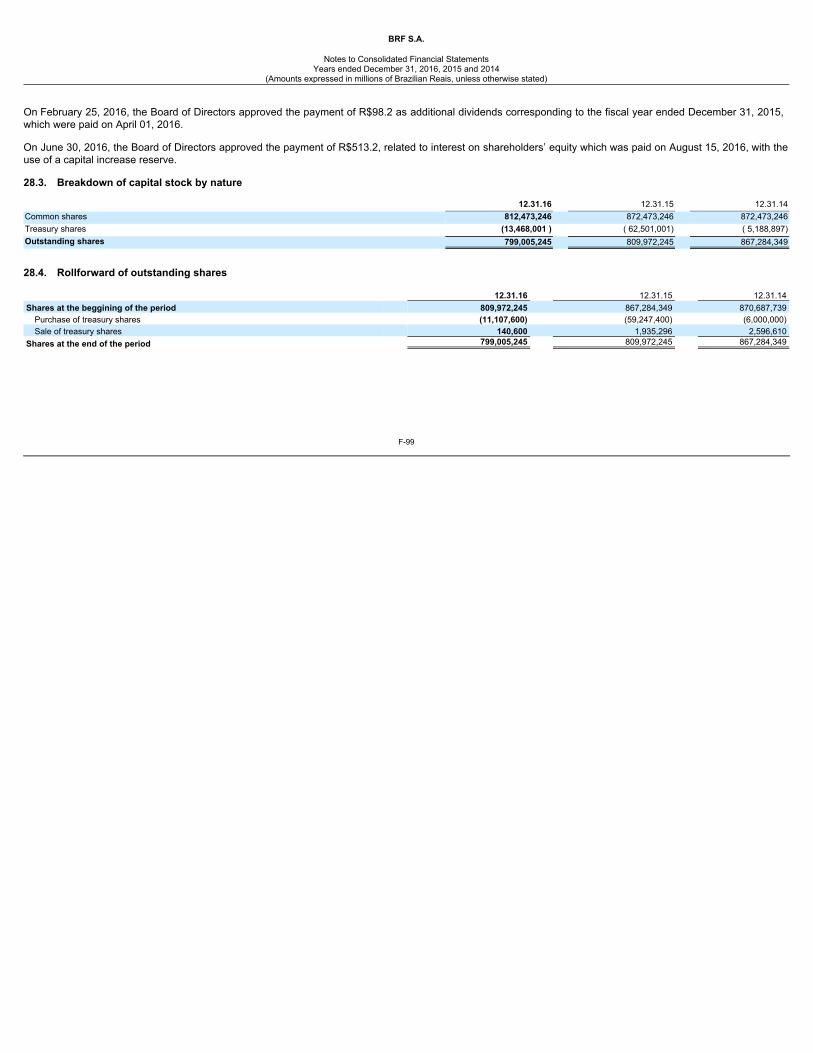
BRF S.A.
Notes to Consolidated Financial Statements
Years ended December 31, 2016, 2015 and 2014(Amounts expressed in millions of Brazilian Reais, unless otherwise stated)
On February 25, 2016, the Board of Directors approved the payment of R$98.2 as additional dividends corresponding to the fiscal year ended December 31, 2015,which were paid on April 01, 2016. On June 30, 2016, the Board of Directors approved the payment of R$513.2, related to interest on shareholders’ equity which was paid on August 15, 2016, with theuse of a capital increase reserve. 28.3. Breakdown of capital stock by nature
12.31.16 12.31.15 12.31.14Common shares 812,473,246 872,473,246 872,473,246Treasury shares (13,468,001 ) ( 62,501,001) ( 5,188,897)Outstanding shares 799,005,245 809,972,245 867,284,349
28.4. Rollforward of outstanding shares 12.31.16 12.31.15 12.31.14Shares at the beggining of the period 809,972,245 867,284,349 870,687,739
Purchase of treasury shares (11,107,600) (59,247,400) (6,000,000)Sale of treasury shares 140,600 1,935,296 2,596,610
Shares at the end of the period 799,005,245 809,972,245 867,284,349
F-99
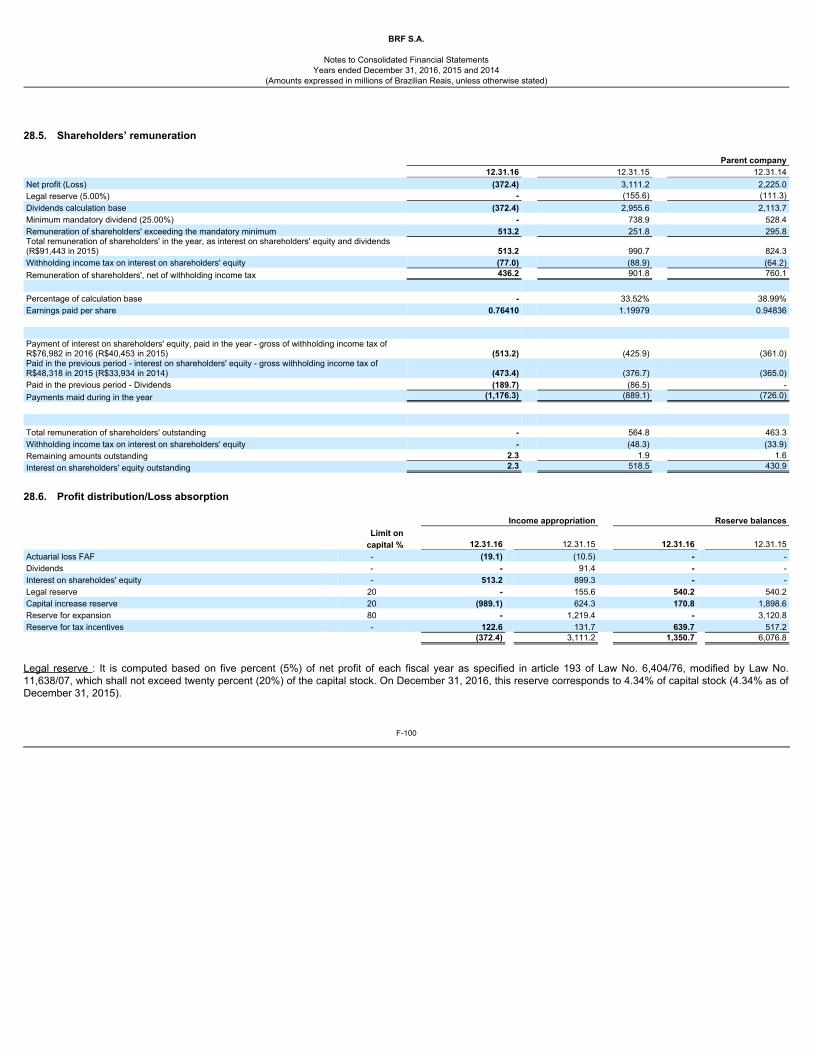
BRF S.A.
Notes to Consolidated Financial Statements
Years ended December 31, 2016, 2015 and 2014(Amounts expressed in millions of Brazilian Reais, unless otherwise stated)
28.5. Shareholders’ remuneration Parent company 12.31.16 12.31.15 12.31.14Net profit (Loss) (372.4) 3,111.2 2,225.0Legal reserve (5.00%) - (155.6) (111.3)Dividends calculation base (372.4) 2,955.6 2,113.7Minimum mandatory dividend (25.00%) - 738.9 528.4Remuneration of shareholders' exceeding the mandatory minimum 513.2 251.8 295.8Total remuneration of shareholders' in the year, as interest on shareholders' equity and dividends(R$91,443 in 2015) 513.2 990.7 824.3Withholding income tax on interest on shareholders' equity (77.0) (88.9) (64.2)Remuneration of shareholders', net of withholding income tax 436.2 901.8 760.1 Percentage of calculation base - 33.52% 38.99%Earnings paid per share 0.76410 1.19979 0.94836 Payment of interest on shareholders' equity, paid in the year - gross of withholding income tax ofR$76,982 in 2016 (R$40,453 in 2015) (513.2) (425.9) (361.0)Paid in the previous period - interest on shareholders' equity - gross withholding income tax ofR$48,318 in 2015 (R$33,934 in 2014) (473.4) (376.7) (365.0)Paid in the previous period - Dividends (189.7) (86.5) -Payments maid during in the year (1,176.3) (889.1) (726.0) Total remuneration of shareholders' outstanding - 564.8 463.3Withholding income tax on interest on shareholders' equity - (48.3) (33.9)Remaining amounts outstanding 2.3 1.9 1.6Interest on shareholders' equity outstanding 2.3 518.5 430.9
28.6. Profit distribution/Loss absorption Income appropriation Reserve balances Limit on capital % 12.31.16 12.31.15 12.31.16 12.31.15Actuarial loss FAF - (19.1) (10.5) - -Dividends - - 91.4 - -Interest on shareholdes' equity - 513.2 899.3 - -Legal reserve 20 - 155.6 540.2 540.2Capital increase reserve 20 (989.1) 624.3 170.8 1,898.6Reserve for expansion 80 - 1,219.4 - 3,120.8Reserve for tax incentives - 122.6 131.7 639.7 517.2 (372.4) 3,111.2 1,350.7 6,076.8
Legal reserve : It is computed based on five percent (5%) of net profit of each fiscal year as specified in article 193 of Law No. 6,404/76, modified by Law No.11,638/07, which shall not exceed twenty percent (20%) of the capital stock. On December 31, 2016, this reserve corresponds to 4.34% of capital stock (4.34% as ofDecember 31, 2015).
F-100
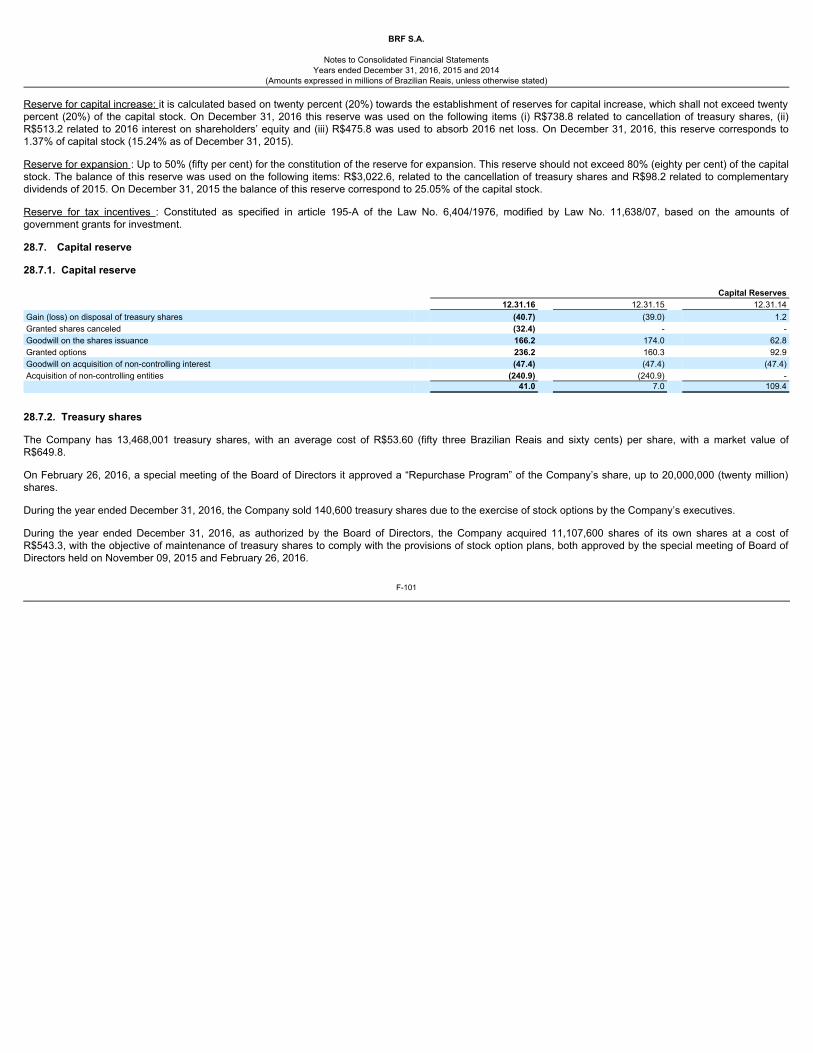
BRF S.A.
Notes to Consolidated Financial Statements
Years ended December 31, 2016, 2015 and 2014(Amounts expressed in millions of Brazilian Reais, unless otherwise stated)
Reserve for capital increase: it is calculated based on twenty percent (20%) towards the establishment of reserves for capital increase, which shall not exceed twentypercent (20%) of the capital stock. On December 31, 2016 this reserve was used on the following items (i) R$738.8 related to cancellation of treasury shares, (ii)R$513.2 related to 2016 interest on shareholders’ equity and (iii) R$475.8 was used to absorb 2016 net loss. On December 31, 2016, this reserve corresponds to1.37% of capital stock (15.24% as of December 31, 2015). Reserve for expansion : Up to 50% (fifty per cent) for the constitution of the reserve for expansion. This reserve should not exceed 80% (eighty per cent) of the capitalstock. The balance of this reserve was used on the following items: R$3,022.6, related to the cancellation of treasury shares and R$98.2 related to complementarydividends of 2015. On December 31, 2015 the balance of this reserve correspond to 25.05% of the capital stock. Reserve for tax incentives : Constituted as specified in article 195-A of the Law No. 6,404/1976, modified by Law No. 11,638/07, based on the amounts ofgovernment grants for investment. 28.7. Capital reserve 28.7.1. Capital reserve Capital Reserves 12.31.16 12.31.15 12.31.14Gain (loss) on disposal of treasury shares (40.7) (39.0) 1.2Granted shares canceled (32.4) - -Goodwill on the shares issuance 166.2 174.0 62.8Granted options 236.2 160.3 92.9Goodwill on acquisition of non-controlling interest (47.4) (47.4) (47.4)Acquisition of non-controlling entities (240.9) (240.9) - 41.0 7.0 109.4
28.7.2. Treasury shares The Company has 13,468,001 treasury shares, with an average cost of R$53.60 (fifty three Brazilian Reais and sixty cents) per share, with a market value ofR$649.8. On February 26, 2016, a special meeting of the Board of Directors it approved a “Repurchase Program” of the Company’s share, up to 20,000,000 (twenty million)shares. During the year ended December 31, 2016, the Company sold 140,600 treasury shares due to the exercise of stock options by the Company’s executives. During the year ended December 31, 2016, as authorized by the Board of Directors, the Company acquired 11,107,600 shares of its own shares at a cost ofR$543.3, with the objective of maintenance of treasury shares to comply with the provisions of stock option plans, both approved by the special meeting of Board ofDirectors held on November 09, 2015 and February 26, 2016.
F-101
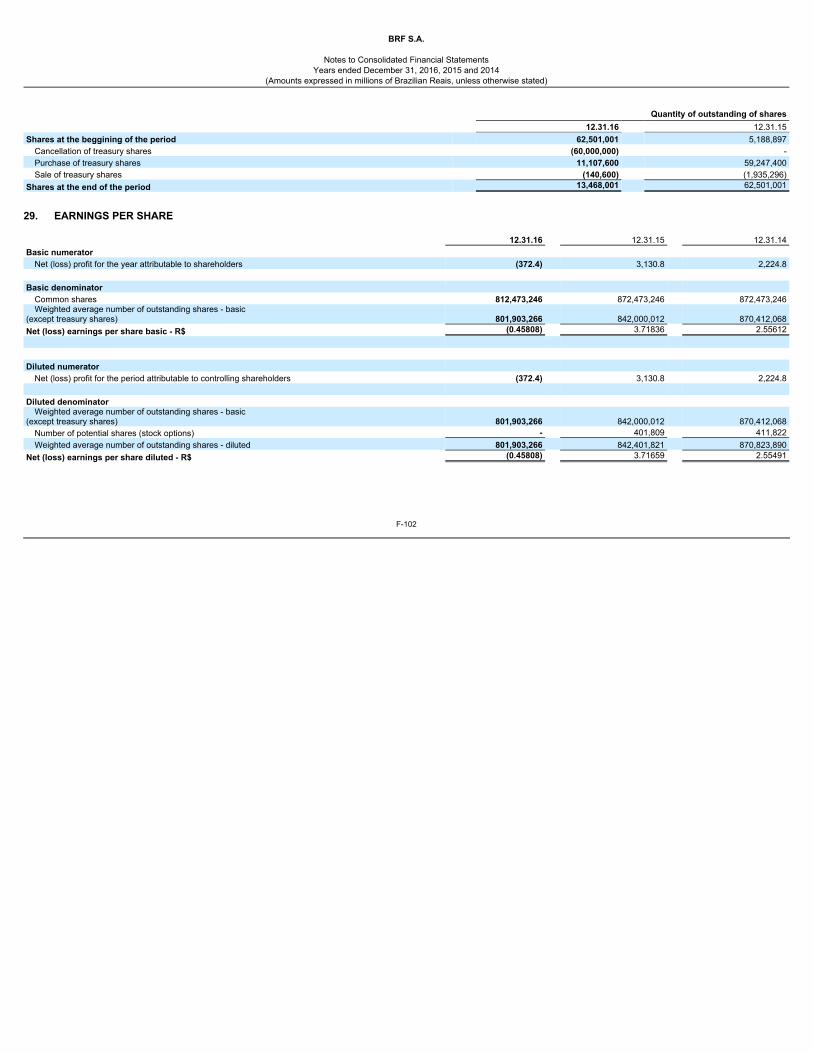
BRF S.A.
Notes to Consolidated Financial Statements
Years ended December 31, 2016, 2015 and 2014(Amounts expressed in millions of Brazilian Reais, unless otherwise stated)
Quantity of outstanding of shares 12.31.16 12.31.15Shares at the beggining of the period 62,501,001 5,188,897
Cancellation of treasury shares (60,000,000) -Purchase of treasury shares 11,107,600 59,247,400Sale of treasury shares (140,600) (1,935,296)
Shares at the end of the period 13,468,001 62,501,001
29. EARNINGS PER SHARE 12.31.16 12.31.15 12.31.14Basic numerator
Net (loss) profit for the year attributable to shareholders (372.4) 3,130.8 2,224.8 Basic denominator
Common shares 812,473,246 872,473,246 872,473,246Weighted average number of outstanding shares - basic
(except treasury shares) 801,903,266 842,000,012 870,412,068Net (loss) earnings per share basic - R$ (0.45808) 3.71836 2.55612 Diluted numerator
Net (loss) profit for the period attributable to controlling shareholders (372.4) 3,130.8 2,224.8 Diluted denominator
Weighted average number of outstanding shares - basic (except treasury shares) 801,903,266 842,000,012 870,412,068
Number of potential shares (stock options) - 401,809 411,822Weighted average number of outstanding shares - diluted 801,903,266 842,401,821 870,823,890
Net (loss) earnings per share diluted - R$ (0.45808) 3.71659 2.55491
F-102
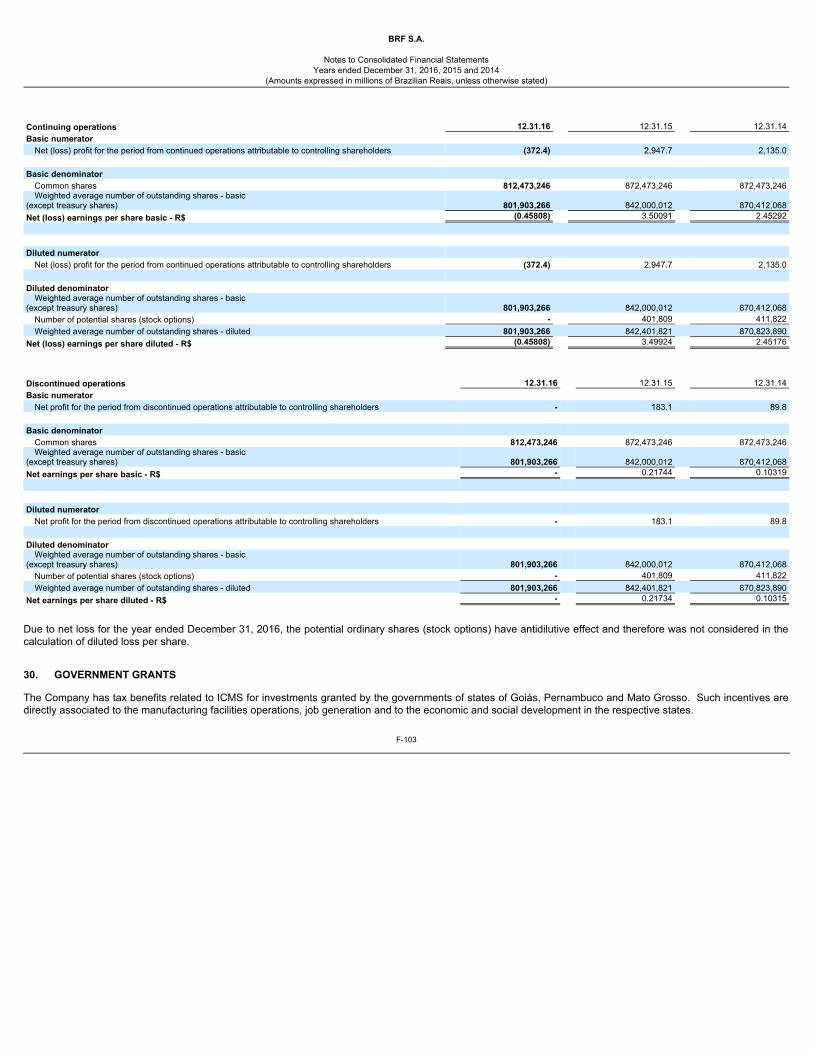
BRF S.A.
Notes to Consolidated Financial Statements
Years ended December 31, 2016, 2015 and 2014(Amounts expressed in millions of Brazilian Reais, unless otherwise stated)
Continuing operations 12.31.16 12.31.15 12.31.14Basic numerator
Net (loss) profit for the period from continued operations attributable to controlling shareholders (372.4) 2,947.7 2,135.0 Basic denominator
Common shares 812,473,246 872,473,246 872,473,246Weighted average number of outstanding shares - basic
(except treasury shares) 801,903,266 842,000,012 870,412,068Net (loss) earnings per share basic - R$ (0.45808) 3.50091 2.45292 Diluted numerator
Net (loss) profit for the period from continued operations attributable to controlling shareholders (372.4) 2,947.7 2,135.0 Diluted denominator
Weighted average number of outstanding shares - basic (except treasury shares) 801,903,266 842,000,012 870,412,068
Number of potential shares (stock options) - 401,809 411,822Weighted average number of outstanding shares - diluted 801,903,266 842,401,821 870,823,890
Net (loss) earnings per share diluted - R$ (0.45808) 3.49924 2.45176
Discontinued operations 12.31.16 12.31.15 12.31.14Basic numerator
Net profit for the period from discontinued operations attributable to controlling shareholders - 183.1 89.8 Basic denominator
Common shares 812,473,246 872,473,246 872,473,246Weighted average number of outstanding shares - basic
(except treasury shares) 801,903,266 842,000,012 870,412,068Net earnings per share basic - R$ - 0.21744 0.10319 Diluted numerator
Net profit for the period from discontinued operations attributable to controlling shareholders - 183.1 89.8 Diluted denominator
Weighted average number of outstanding shares - basic (except treasury shares) 801,903,266 842,000,012 870,412,068
Number of potential shares (stock options) - 401,809 411,822Weighted average number of outstanding shares - diluted 801,903,266 842,401,821 870,823,890
Net earnings per share diluted - R$ - 0.21734 0.10315
Due to net loss for the year ended December 31, 2016, the potential ordinary shares (stock options) have antidilutive effect and therefore was not considered in thecalculation of diluted loss per share. 30. GOVERNMENT GRANTS The Company has tax benefits related to ICMS for investments granted by the governments of states of Goiás, Pernambuco and Mato Grosso. Such incentives aredirectly associated to the manufacturing facilities operations, job generation and to the economic and social development in the respective states.
F-103
BRF S.A.
Notes to Consolidated Financial Statements
Years ended December 31, 2016, 2015 and 2014(Amounts expressed in millions of Brazilian Reais, unless otherwise stated)
On December 31, 2016, this incentive totaled R$122.6 (R$131.7 as of December 31, 2015) and was booked as a reduction of sales taxes. 31. RELATED PARTIES As part of the Company’s operations, rights and obligations arise between related parties, resulting from transactions of purchase and sale of products and loansbased on prices under the conditions agreed by the parties. All relationships between the Company and its subsidiaries were disclosed irrespective of the existence or these transactions. 31.1. Transactions and balances
All companies presented in note 1.1 are controlled by BRF, except for UP! Alimentos, K&S, PP-BIO, PR-SAD and SATS BRF which are associates or joint ventures.
The Company also recorded a liability R$6.2 (R$8.5 as of December 31, 2015) related to the fair value of the guarantees offered to BNDES concerning a loan madeby Instituto Sadia de Sustentabilidade.
Due to the acquisition of biodigesters from Instituto Sadia de Sustentabilidade, as of December 31, 2016 the Company recorded a payable of R$22.2, which isincluded in other liabilities (R$30.6 as of December 31, 2015). The Company has entered into loans agreement with its subsidiaries. Below is a summary of the balances and rates charged for the transactions at the balancesheet date:
F-104
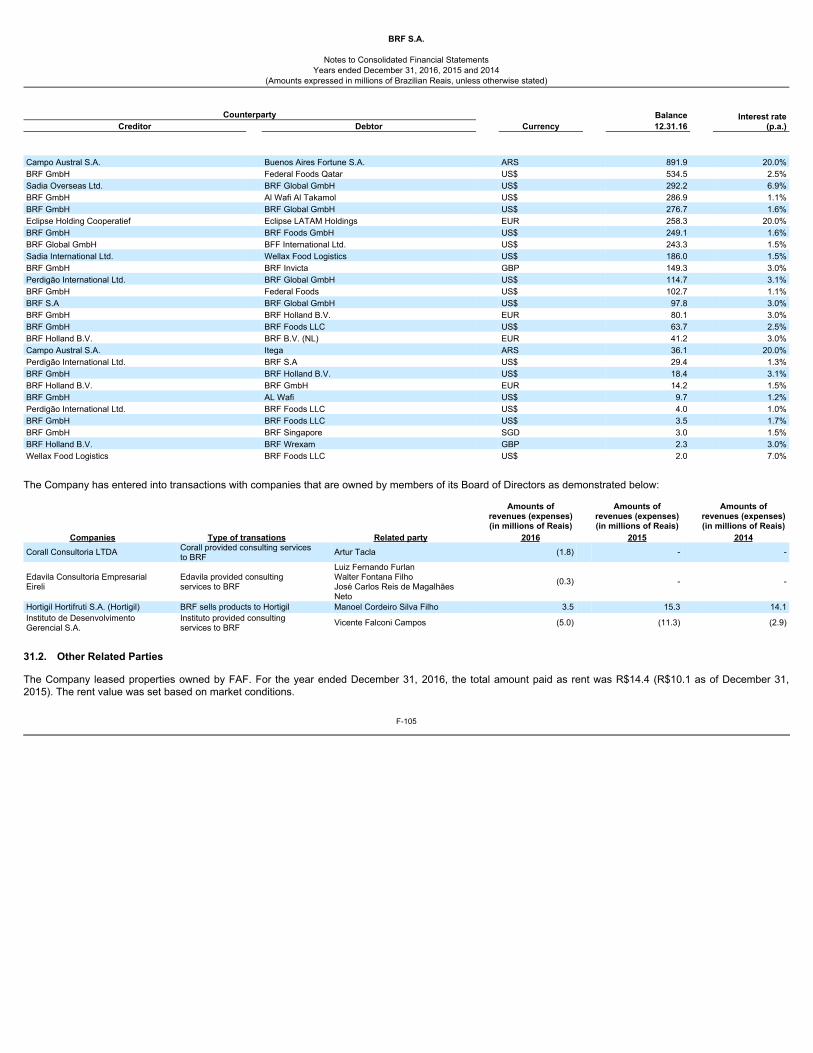
BRF S.A.
Notes to Consolidated Financial Statements
Years ended December 31, 2016, 2015 and 2014(Amounts expressed in millions of Brazilian Reais, unless otherwise stated)
Counterparty Balance Interest rate(p.a.)Creditor Debtor Currency 12.31.16
Campo Austral S.A. Buenos Aires Fortune S.A. ARS 891.9 20.0%BRF GmbH Federal Foods Qatar US$ 534.5 2.5%Sadia Overseas Ltd. BRF Global GmbH US$ 292.2 6.9%BRF GmbH Al Wafi Al Takamol US$ 286.9 1.1%BRF GmbH BRF Global GmbH US$ 276.7 1.6%Eclipse Holding Cooperatief Eclipse LATAM Holdings EUR 258.3 20.0%BRF GmbH BRF Foods GmbH US$ 249.1 1.6%BRF Global GmbH BFF International Ltd. US$ 243.3 1.5%Sadia International Ltd. Wellax Food Logistics US$ 186.0 1.5%BRF GmbH BRF Invicta GBP 149.3 3.0%Perdigão International Ltd. BRF Global GmbH US$ 114.7 3.1%BRF GmbH Federal Foods US$ 102.7 1.1%BRF S.A BRF Global GmbH US$ 97.8 3.0%BRF GmbH BRF Holland B.V. EUR 80.1 3.0%BRF GmbH BRF Foods LLC US$ 63.7 2.5%BRF Holland B.V. BRF B.V. (NL) EUR 41.2 3.0%Campo Austral S.A. Itega ARS 36.1 20.0%Perdigão International Ltd. BRF S.A US$ 29.4 1.3%BRF GmbH BRF Holland B.V. US$ 18.4 3.1%BRF Holland B.V. BRF GmbH EUR 14.2 1.5%BRF GmbH AL Wafi US$ 9.7 1.2%Perdigão International Ltd. BRF Foods LLC US$ 4.0 1.0%BRF GmbH BRF Foods LLC US$ 3.5 1.7%BRF GmbH BRF Singapore SGD 3.0 1.5%BRF Holland B.V. BRF Wrexam GBP 2.3 3.0%Wellax Food Logistics BRF Foods LLC US$ 2.0 7.0%
The Company has entered into transactions with companies that are owned by members of its Board of Directors as demonstrated below:
Amounts ofrevenues (expenses)(in millions of Reais)
Amounts ofrevenues (expenses)(in millions of Reais)
Amounts ofrevenues (expenses)(in millions of Reais)
Companies Type of transations Related party 2016 2015 2014Corall Consultoria LTDA Corall provided consulting services
to BRF Artur Tacla (1.8) - -
Edavila Consultoria EmpresarialEireli Edavila provided consulting
services to BRF Luiz Fernando Furlan Walter Fontana Filho José Carlos Reis de MagalhãesNeto
(0.3) - -
Hortigil Hortifruti S.A. (Hortigil) BRF sells products to Hortigil Manoel Cordeiro Silva Filho 3.5 15.3 14.1Instituto de DesenvolvimentoGerencial S.A. Instituto provided consulting
services to BRF Vicente Falconi Campos (5.0) (11.3) (2.9)
31.2. Other Related Parties The Company leased properties owned by FAF. For the year ended December 31, 2016, the total amount paid as rent was R$14.4 (R$10.1 as of December 31,2015). The rent value was set based on market conditions.
F-105
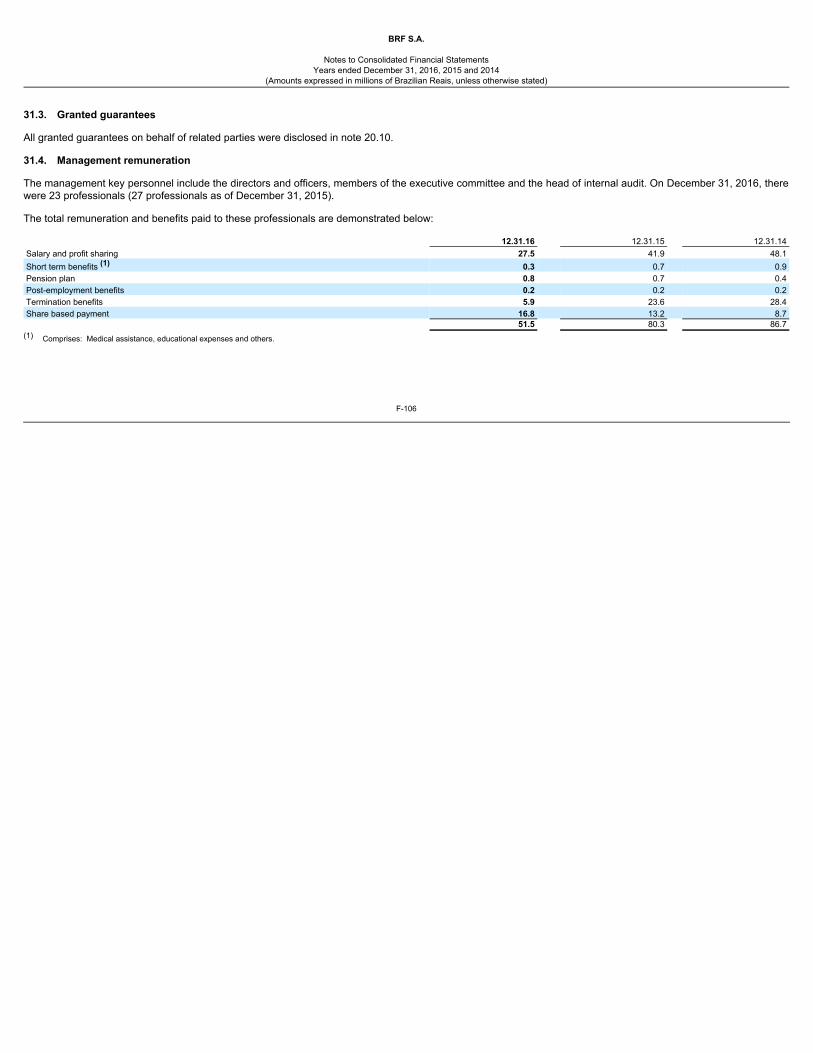
BRF S.A.
Notes to Consolidated Financial Statements
Years ended December 31, 2016, 2015 and 2014(Amounts expressed in millions of Brazilian Reais, unless otherwise stated)
31.3. Granted guarantees All granted guarantees on behalf of related parties were disclosed in note 20.10. 31.4. Management remuneration The management key personnel include the directors and officers, members of the executive committee and the head of internal audit. On December 31, 2016, therewere 23 professionals (27 professionals as of December 31, 2015). The total remuneration and benefits paid to these professionals are demonstrated below: 12.31.16 12.31.15 12.31.14Salary and profit sharing 27.5 41.9 48.1Short term benefits (1) 0.3 0.7 0.9Pension plan 0.8 0.7 0.4Post-employment benefits 0.2 0.2 0.2Termination benefits 5.9 23.6 28.4Share based payment 16.8 13.2 8.7 51.5 80.3 86.7
(1) Comprises: Medical assistance, educational expenses and others.
F-106
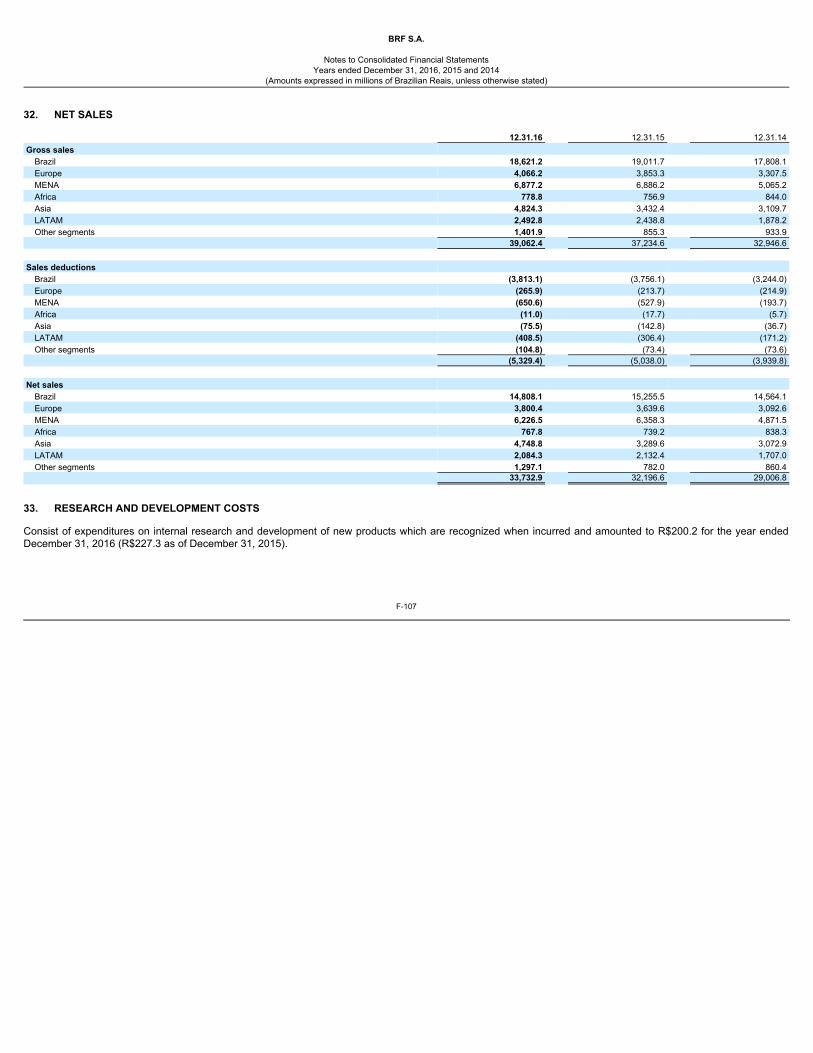
BRF S.A.
Notes to Consolidated Financial Statements
Years ended December 31, 2016, 2015 and 2014(Amounts expressed in millions of Brazilian Reais, unless otherwise stated)
32. NET SALES 12.31.16 12.31.15 12.31.14Gross sales
Brazil 18,621.2 19,011.7 17,808.1Europe 4,066.2 3,853.3 3,307.5MENA 6,877.2 6,886.2 5,065.2Africa 778.8 756.9 844.0Asia 4,824.3 3,432.4 3,109.7LATAM 2,492.8 2,438.8 1,878.2Other segments 1,401.9 855.3 933.9
39,062.4 37,234.6 32,946.6 Sales deductions
Brazil (3,813.1) (3,756.1) (3,244.0)Europe (265.9) (213.7) (214.9)MENA (650.6) (527.9) (193.7)Africa (11.0) (17.7) (5.7)Asia (75.5) (142.8) (36.7)LATAM (408.5) (306.4) (171.2)Other segments (104.8) (73.4) (73.6)
(5,329.4) (5,038.0) (3,939.8) Net sales
Brazil 14,808.1 15,255.5 14,564.1Europe 3,800.4 3,639.6 3,092.6MENA 6,226.5 6,358.3 4,871.5Africa 767.8 739.2 838.3Asia 4,748.8 3,289.6 3,072.9LATAM 2,084.3 2,132.4 1,707.0Other segments 1,297.1 782.0 860.4
33,732.9 32,196.6 29,006.8
33. RESEARCH AND DEVELOPMENT COSTS Consist of expenditures on internal research and development of new products which are recognized when incurred and amounted to R$200.2 for the year endedDecember 31, 2016 (R$227.3 as of December 31, 2015).
F-107
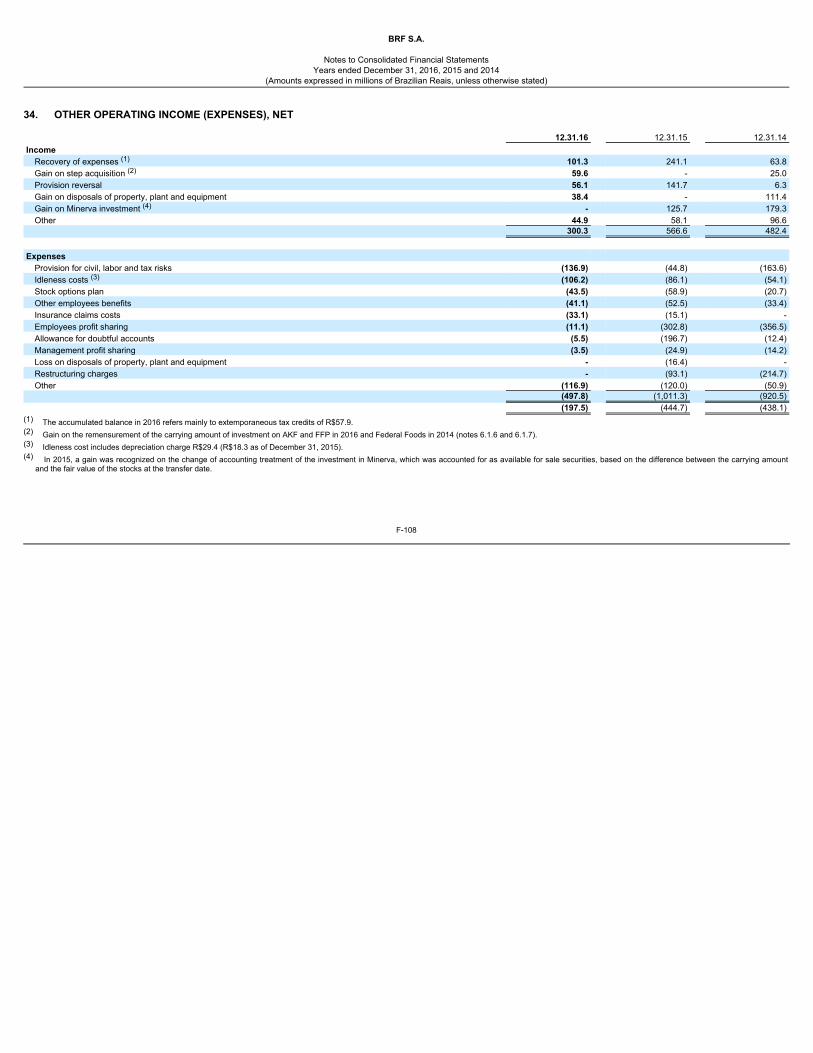
BRF S.A.
Notes to Consolidated Financial Statements
Years ended December 31, 2016, 2015 and 2014(Amounts expressed in millions of Brazilian Reais, unless otherwise stated)
34. OTHER OPERATING INCOME (EXPENSES), NET 12.31.16 12.31.15 12.31.14Income
Recovery of expenses (1) 101.3 241.1 63.8Gain on step acquisition (2) 59.6 - 25.0Provision reversal 56.1 141.7 6.3Gain on disposals of property, plant and equipment 38.4 - 111.4Gain on Minerva investment (4) - 125.7 179.3Other 44.9 58.1 96.6
300.3 566.6 482.4 Expenses
Provision for civil, labor and tax risks (136.9) (44.8) (163.6)Idleness costs (3) (106.2) (86.1) (54.1)Stock options plan (43.5) (58.9) (20.7)Other employees benefits (41.1) (52.5) (33.4)Insurance claims costs (33.1) (15.1) -Employees profit sharing (11.1) (302.8) (356.5)Allowance for doubtful accounts (5.5) (196.7) (12.4)Management profit sharing (3.5) (24.9) (14.2)Loss on disposals of property, plant and equipment - (16.4) -Restructuring charges - (93.1) (214.7)Other (116.9) (120.0) (50.9)
(497.8) (1,011.3) (920.5) (197.5) (444.7) (438.1)
(1) The accumulated balance in 2016 refers mainly to extemporaneous tax credits of R$57.9.(2) Gain on the remensurement of the carrying amount of investment on AKF and FFP in 2016 and Federal Foods in 2014 (notes 6.1.6 and 6.1.7).(3) Idleness cost includes depreciation charge R$29.4 (R$18.3 as of December 31, 2015).(4) In 2015, a gain was recognized on the change of accounting treatment of the investment in Minerva, which was accounted for as available for sale securities, based on the difference between the carrying amount
and the fair value of the stocks at the transfer date.
F-108
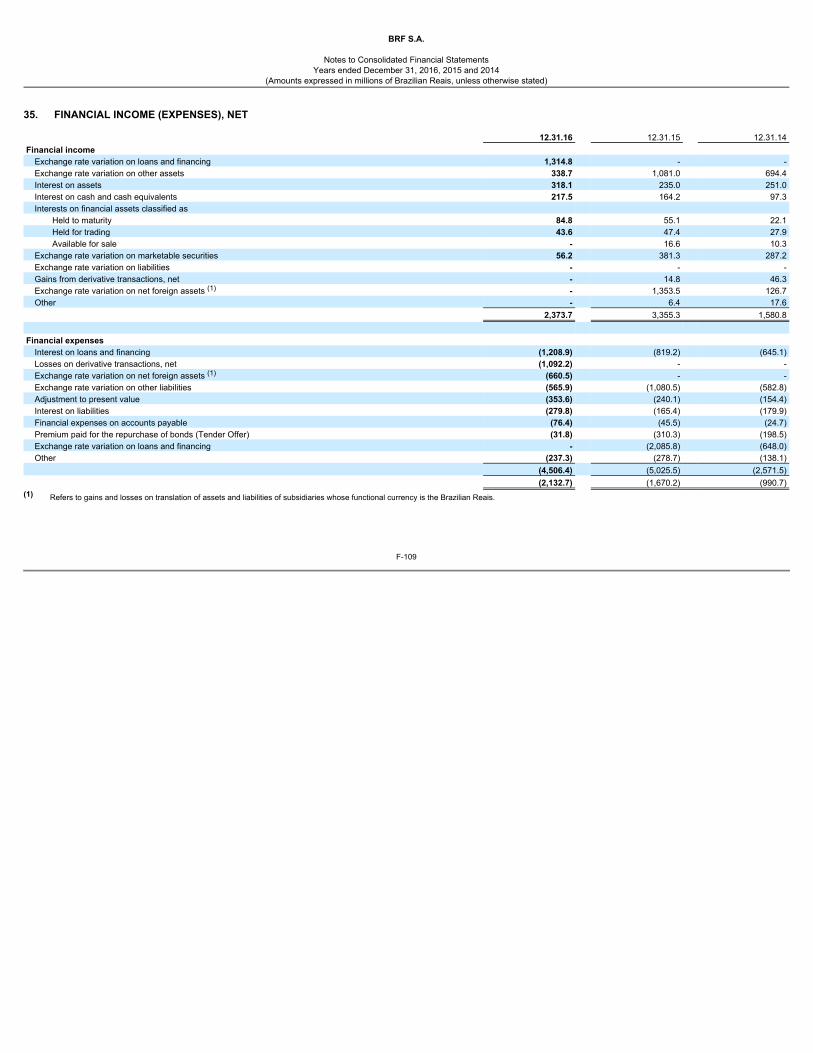
BRF S.A.
Notes to Consolidated Financial Statements
Years ended December 31, 2016, 2015 and 2014(Amounts expressed in millions of Brazilian Reais, unless otherwise stated)
35. FINANCIAL INCOME (EXPENSES), NET 12.31.16 12.31.15 12.31.14Financial income
Exchange rate variation on loans and financing 1,314.8 - -Exchange rate variation on other assets 338.7 1,081.0 694.4Interest on assets 318.1 235.0 251.0Interest on cash and cash equivalents 217.5 164.2 97.3Interests on financial assets classified as
Held to maturity 84.8 55.1 22.1Held for trading 43.6 47.4 27.9Available for sale - 16.6 10.3
Exchange rate variation on marketable securities 56.2 381.3 287.2Exchange rate variation on liabilities - - -Gains from derivative transactions, net - 14.8 46.3Exchange rate variation on net foreign assets (1) - 1,353.5 126.7Other - 6.4 17.6
2,373.7 3,355.3 1,580.8 Financial expenses
Interest on loans and financing (1,208.9) (819.2) (645.1)Losses on derivative transactions, net (1,092.2) - -Exchange rate variation on net foreign assets (1) (660.5) - -Exchange rate variation on other liabilities (565.9) (1,080.5) (582.8)Adjustment to present value (353.6) (240.1) (154.4)Interest on liabilities (279.8) (165.4) (179.9)Financial expenses on accounts payable (76.4) (45.5) (24.7)Premium paid for the repurchase of bonds (Tender Offer) (31.8) (310.3) (198.5)Exchange rate variation on loans and financing - (2,085.8) (648.0)Other (237.3) (278.7) (138.1)
(4,506.4) (5,025.5) (2,571.5) (2,132.7) (1,670.2) (990.7)
(1) Refers to gains and losses on translation of assets and liabilities of subsidiaries whose functional currency is the Brazilian Reais.
F-109
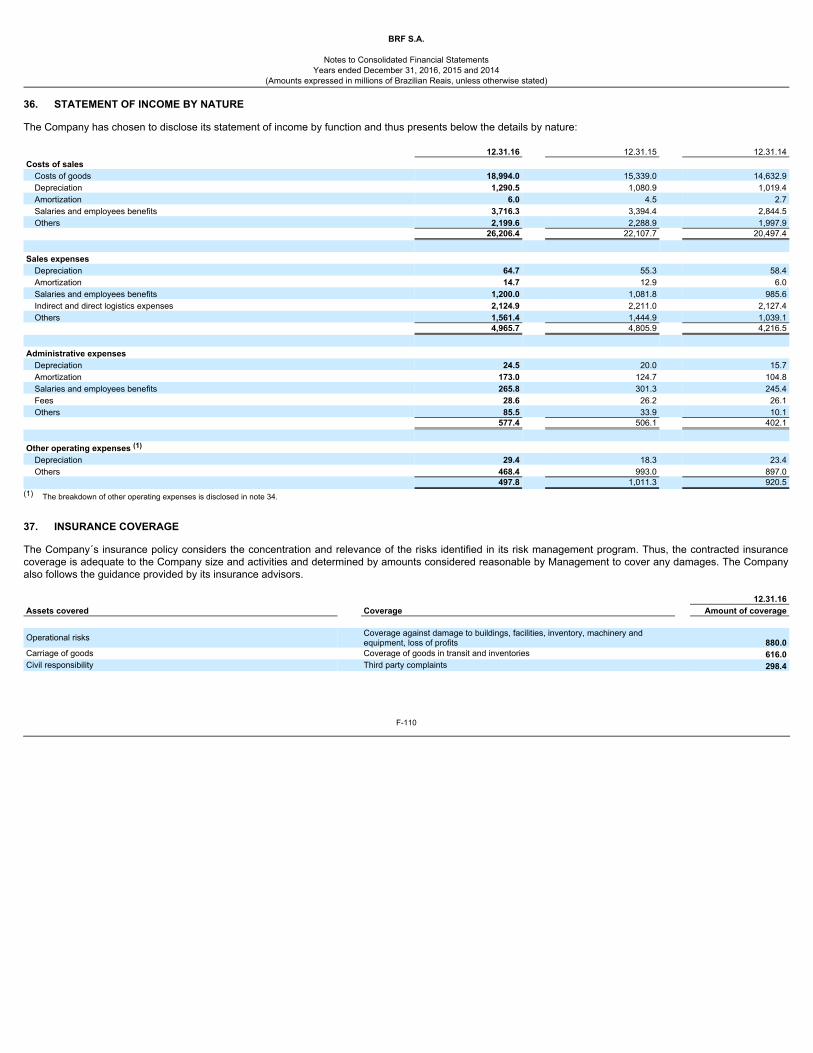
BRF S.A.
Notes to Consolidated Financial Statements
Years ended December 31, 2016, 2015 and 2014(Amounts expressed in millions of Brazilian Reais, unless otherwise stated)
36. STATEMENT OF INCOME BY NATURE The Company has chosen to disclose its statement of income by function and thus presents below the details by nature: 12.31.16 12.31.15 12.31.14Costs of sales
Costs of goods 18,994.0 15,339.0 14,632.9Depreciation 1,290.5 1,080.9 1,019.4Amortization 6.0 4.5 2.7Salaries and employees benefits 3,716.3 3,394.4 2,844.5Others 2,199.6 2,288.9 1,997.9
26,206.4 22,107.7 20,497.4 Sales expenses
Depreciation 64.7 55.3 58.4Amortization 14.7 12.9 6.0Salaries and employees benefits 1,200.0 1,081.8 985.6Indirect and direct logistics expenses 2,124.9 2,211.0 2,127.4Others 1,561.4 1,444.9 1,039.1
4,965.7 4,805.9 4,216.5 Administrative expenses
Depreciation 24.5 20.0 15.7Amortization 173.0 124.7 104.8Salaries and employees benefits 265.8 301.3 245.4Fees 28.6 26.2 26.1Others 85.5 33.9 10.1
577.4 506.1 402.1 Other operating expenses (1)
Depreciation 29.4 18.3 23.4Others 468.4 993.0 897.0
497.8 1,011.3 920.5(1) The breakdown of other operating expenses is disclosed in note 34.
37. INSURANCE COVERAGE The Company´s insurance policy considers the concentration and relevance of the risks identified in its risk management program. Thus, the contracted insurancecoverage is adequate to the Company size and activities and determined by amounts considered reasonable by Management to cover any damages. The Companyalso follows the guidance provided by its insurance advisors. 12.31.16Assets covered Coverage Amount of coverage Operational risks Coverage against damage to buildings, facilities, inventory, machinery and
equipment, loss of profits 880.0Carriage of goods Coverage of goods in transit and inventories 616.0Civil responsibility Third party complaints 298.4
F-110
BRF S.A.
Notes to Consolidated Financial Statements
Years ended December 31, 2016, 2015 and 2014(Amounts expressed in millions of Brazilian Reais, unless otherwise stated)
38. NEW ACCOUNTING PRONOUNCEMENTS RECENTLY ADOPTED IAS 16 and IAS 38 – Clarification of Accountable Methods of Depreciation and Amortization – Amendment On May 2014, IASB issued amendments to clarify guidelines of IAS 16 and IAS 38, that revenue reflects a model of economic benefits generated from operation ofbusiness (of which the asset is a part), instead of economic benefits generated from the use of the asset. As a result, a method based on revenue cannot be usedfor property, plant and equipment depreciation purposes and may be used only under very limited circumstances to amortize intangible assets. The amendments willbe in force prospectively to amortize intangible assets fiscal years beginning on January 01, 2016 or after. There was no impact on the consolidated financialstatements as the Company does not use a method based on revenue to depreciate its non-current assets. IFRS 11 – Accounting for Acquisition of Interests in Joint Operations – Amendment On May 2014, IASB issued amendments to IFRS 11, which demands that a joint operator that is accounting an acquisition of equity interest in which the jointoperation activity constitutes a business, applied the guidelines according to IFRS 3 for business combination accounting. The amendments also clarify that anequity interest previously held in a joint operation is not remeasured on an additional acquisition of interest in the same joint operation while the joint control is held.Additionally, the amendments are not applied when the parties sharing the control, including the reporting entity, are under common control of the parent company. The amendments are applicable to both the acquisition of the final equity interest in a joint operation and on the acquisition of any additional equity interest in thesame joint operation. The Company analyzed the content of this standard and there was no impact on its consolidated financial statements, since it does notparticipate in joint operations with third parties. IAS 16 and IAS 41 – Biological assets: Bearer Plants On June 2014, IASB issued amendments to IAS 16 and IAS 41, including bearer plants concept, that it is a living plant and (i) it is used in the production or supply ofagricultural products, (ii) it is grown to produce fruit and (iii) it is remotely likely to be sold as an agricultural product. IAS 41 currently requires all biological assetsrelated to agricultural activity to be measured at fair value less costs to sell. The IASB has decided that the carrier plant should be recorded in the same way as fixedassets in accordance with IAS 16, since its operation is similar to the manufacturing process. The amendments are applicable in force prospectively to periodsbeginning on January 1, 2016 or after. The Company analyzed the content of this standard and concluded that there was no impact on its consolidated financialstatements, since its forests are either (i) harvested as agricultural product to be used in the productive process as fuel or (ii) maintained as a sanitary barrier.
F-111
BRF S.A.
Notes to Consolidated Financial Statements
Years ended December 31, 2016, 2015 and 2014(Amounts expressed in millions of Brazilian Reais, unless otherwise stated)
IAS 1 – Presentation of Financial Statements On December 2014, IASB issued amendments to IAS 1, as part of its initiatives to disclosure, primarily related to materiality of the information. The entity shallevaluate the disclosure of material information without affecting the comprehensibility of its financial statements. The Company analyzed the content of this standardand concluded that the disclosure in the consolidated finance statements follows the principles of this amendment. 39. NEW ACCOUNTING PRONOUNCEMENTS NOT ADOPTED IFRS 15 – Revenue from Contracts with Customer On May 2014, IASB issued IFRS 15 that establishes a 5 step model to determine the revenue to be recognized in contracts with customers. In accordance with thispronouncement, revenues are recognized based on an amount that reflects the consideration that an entity expects to be entitled for delivering goods or providingservices to a customer. The guidelines of IFRS 15 consider a more structured approach to measure and recognize revenue. This standard is applicable to all entities and will replace all current requirements related to revenue recognition. The adoption of IFRS 15 is mandatory to periodsbeginning on January 1, 2018. The Company is in the process of engaging an advisor for the qualitative assessment of the impacts of adopting IFRS 15 in its consolidated financial statements,which will involve (i) gaining an understanding of current policies and processes for recognizing revenues (ii) identifying the necessary changes to be implemented inthe information technology system, processes and internal controls arising from the adoption of this pronouncement and (iii) detailed review of relevant contracts. It isexpected that such assessment to be completed by the end of the 2 nd quarter of 2017. In a preliminary assessment, the Company has determined that the adoption of IFRS 15 would affect amounts and the manner on that rebates, discounts and returnsare recognized as well as, it will require further disclosures and remodeling of certain internal controls on revenues. Due to high volume and complexity of certaintransactions, it is not possible to measure with reasonable assurance the quantitative impacts resulting from the adoption of such pronouncement. IFRS 9 – Financial Instruments On July 2014, IASB issued the final version of IFRS 9 – Financial Instruments, which reflects all phases of financial instruments project and replaces IAS 39 –Financial Instruments: Recognizing and Measurement and all previous versions of IFRS 9. The standard introduces new guidance about classification andmeasurement, impairment loss and hedge accounting. Early adoption is not permitted and is effective from periods beginning on January 1, 2018. Retrospectiveadoption is mandatory, however, is not required the presentation of comparative information. Early adoption of previous versions of IFRS 9, issued in 2009, 2010 and2013, is permitted if the initial adoption date is prior to February 1, 2015. The Company is evaluating the impacts of adopting this standard in its consolidated financialstatements.
F-112
BRF S.A.
Notes to Consolidated Financial Statements
Years ended December 31, 2016, 2015 and 2014(Amounts expressed in millions of Brazilian Reais, unless otherwise stated)
IFRS 16 - Leases On January 2016, the IASB issued the final version of IFRS 16 – Leases, which supersedes IAS 17 – Leases, which will be applicable to periods beginning onJanuary 01, 2019. Early adoption will be permitted for entities which also apply IFRS 15 – Revenue from Contracts with Customers. The adoption of this standard willaffect mainly property, plant and equipment and financial liabilities, as the treatment between financial and operational lease will no longer exists, being the leasestreated in a similar way of the financial lease as per IAS 17. The Company is analyzing the impact of adopting this standard in its consolidated financial statements. IAS 12 – Income Taxes On January 2016, the IASB issued a review of the IAS 12 – Income Taxes, aiming to clarify how to account for deferred tax assets related to debt instrumentsmeasured at fair value. IAS 12 also provides requirements related to the recognition and measurement of current and deferred tax assets and liabilities. The newversion of IAS 12 should be applied to fiscal years beginning on January 01, 2017, and early adoption is permitted. The Company is analyzing the content and theimpacts of adopting of this standard in its consolidated financial statements. 40. SUBSEQUENT EVENTS 40.1. Corporate reorganization One Foods Holdings Ltd. (“One Foods”) On January 04, 2017, BRF announced the constitution of the subsidiary One Foods Holdings Ltd. (“One Foods”), based in Dubai, United Arab Emirates. One Foods,until now referred to as “Sadia Halal”, will hold assets related to the production and distribution of food products for Muslim markets. Such restructuring process involves the transfer of certain assets related to the production and distribution of halal products, including: (i) grain storage facilities, feedmills, outgrowers (outsourced farmers) agreements, hatcheries and 8 slaughtering and processing plans in Brazil; (ii) one processing plant in United Arab Emirates;(iii) the equity participation in FFM Further Processing SDN BHD; and (iv) the equity participation held by the Company in certain distribution companies based inSaudi Arabia, Qatar, United Arab Emirates, Sultanate of Oma and Kwait. The assets were transferred to SHB Comércio e Indústria de Alimentos S.A. (“SHB”) ordirectly to One Foods.
F-113
BRF S.A.
Notes to Consolidated Financial Statements
Years ended December 31, 2016, 2015 and 2014(Amounts expressed in millions of Brazilian Reais, unless otherwise stated)
In addition, BRF will transfer or license to One Foods certain brands in halal markets. The purpose is to grant more independence and focus to BRF businessesrelating to Muslim markets. As such, BRF will analyze strategic alternatives for One Foods, enabling the development of its expansion, in current markets as well asin those not currently served by BRF. Finally, BRF will enter into agreements with One Foods under which the costs of certain operational and corporate activities will be shared and BRF and One Foodswill supply certain raw materials and finished goods to each other. The completion of the Transaction is subject to certain administrative approvals, including anti-trust approvals. BRF has clarified that: (i) the Transaction does nottrigger withdrawal rights to its shareholders, as per article 256, §2º, and article 137, II, of Brazilian Corporate Law and (ii) the Transaction is not subject toShareholders’ approval, since it involves a wholly-owned subsidiary of the Company and is based on economic grounds.
40.2. Business combination with Banvit On January 9th 2017, BRF announced that its wholly owned subsidiary BRF GmbH, has entered into a share purchase agreement with the controlling shareholdersof Banvit Bandirma Vitaminli Yem Sanayii A.Ş. (“Banvit” and “Shareholders”), for the acquisition of 79.5% of the shares outstanding of Banvit (“Shares”). Banvit is thelargest poultry producer in Turkey, with fully integrated operations and the well known brand in the business sector. BRF GmbH and Qatar Investment Authority (“QIA”), the sovereign wealth fund of the State of Qatar, have entered into definitive agreements under which it wasagreed to: (i) incorporate a new company (“TBQ Foods GmbH”), which will acquire Banvit Shares; and (ii) to regulate the governance of the agreements betweenTBQ Foods and Banvit. The rights arising from the agreements will be assigned to BRF Foods GmbH, a wholly owned subsidiary of One Foods Holdings Ltd. (“OneFoods”) upon its incorporation, so that One Foods will hold 60% of TBQ Foods GmbH and QIA the remaining 40%. TBQ Foods GmbH has been incorporated inMarch 2017 as a wholly owned subsidiary of BRF Foods GmbH. As per the agreement, before the closing QIA shall acquire 40% of TBQ Foods. Pursuant to the terms of the Transaction and subject to the financial performance of Banvit for the year of 2016, the enterprise value for 100% of Banvit isapproximately US$ 470 million (equivalent to R$1,531.2). Based on the net debt position of Banvit as of September 30, 2016, the equity value of Banvit wouldtherefore be approximately US$ 340 million (R$1,108.1). Following the consummation of the Transaction, NewCo will launch a mandatory tender offer to acquire theremaining 20.5% of the Shares from the minority shareholders, on the same terms and conditions offered to the Shareholders.
F-114
BRF S.A.
Notes to Consolidated Financial Statements
Years ended December 31, 2016, 2015 and 2014(Amounts expressed in millions of Brazilian Reais, unless otherwise stated)
Upon completion, the Transaction will allow One Foods to enter into the Turkish market, which has the largest poultry halal consumption in the world, which is alignedwith the Company’s continuous commitment to the Muslim markets. The completion of the Transaction is subject to fulfillment of certain conditions, including anti-trust approvals. BRF has clarified that: (i) the Transaction does nottrigger withdrawal rights to its shareholders, as per article 256, §2º, and article 137, II, of Brazilian Corporate Law and (ii) the Transaction is not subject toShareholders’ approval, since it involves a wholly-owned subsidiary of the Company and is based on BRF’s business strategy. 40.3. Weak Flesh Operation (“Operation”) The Brazilian authorities are investigating Brazil’s meat processing industry in the so-called “Weak Flesh Operation,” which became public on March 17, 2017. Theinvestigation involves a number of companies in the industry in Brazil. On March 17, 2017, BRF learned of a decision issued by a federal judge of the state of Paraná authorizing the search and seizure of information and documents, andthe detention of certain individuals in the context of this Weak Flesh Operation. Two BRF employees were detained (one of which has been released) and three wereidentified for questioning (of which two were questioned, including Mr. Rodrigues, Vice President – Corporate Integrity of BRF). In addition to the above the Mineiros plant was temporarily suspended by the MAPA on March 17, 2017, so that MAPA could conduct an additional audit on itsproduction process. After conducting an audit, the MAPA authorized the Mineiros plant to resume operations as of April 8, 2017. The Mineiros plant reopened on April10, 2017 and resumed its operations on April 11, 2017. On April 15, 2017, the Brazilian Federal Police issued a report on the investigation and recommended charges against three BRF employees. On April 20, 2017,based on the Brazilian Federal Police investigation, Brazilian federal prosecutors filed charges against two BRF employees (one BRF regional manufacturing officerand one BRF corporate affairs manager). Based on the charges filed against such two employees, the main allegations at this stage involve alleged misconduct relating to improper offers and/or promises togovernment inspectors. BRF has communicated with, and has received requests for information from certain regulators and governmental entities, including the U.S. Securities andExchange Commission and U.S. Department of Justice in relation to this matter. BRF is cooperating with these inquiries. BRF's Statutory Audit Committee has already initiated an investigation with respect to the allegations involving BRF employees in the Weak Flesh Operation and is inthe process of engaging outside counsel in connection with this investigation.
F-115

BRF S.A.
Notes to Consolidated Financial Statements
Years ended December 31, 2016, 2015 and 2014(Amounts expressed in millions of Brazilian Reais, unless otherwise stated)
41. APPROVAL OF THE CONSOLIDATED FINANCIAL STATEMENTS The consolidated financial statements were approved by the Board of Directors on April 25 , 2017.
F-116
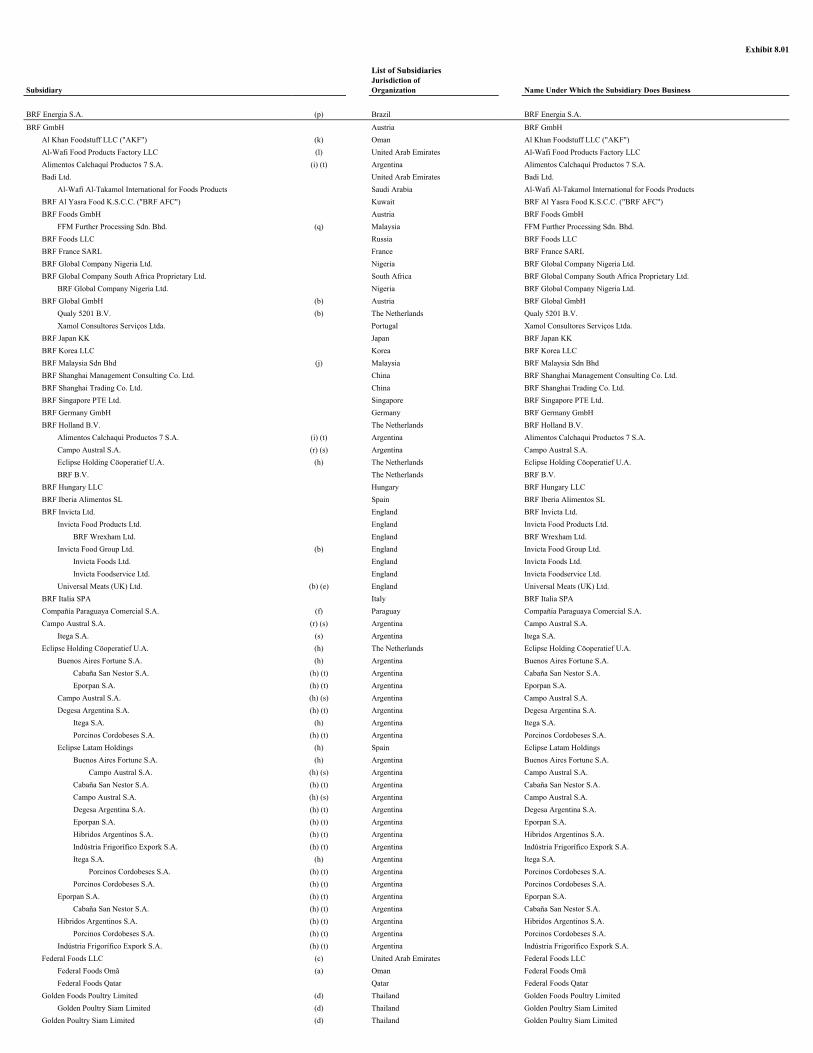
Exhibit 8.01
List of Subsidiaries
Subsidiary Jurisdiction ofOrganization Name Under Which the Subsidiary Does Business
BRF Energia S.A. (p) Brazil BRF Energia S.A.
BRF GmbH Austria BRF GmbHAl Khan Foodstuff LLC ("AKF") (k) Oman Al Khan Foodstuff LLC ("AKF")Al-Wafi Food Products Factory LLC (l) United Arab Emirates Al-Wafi Food Products Factory LLCAlimentos Calchaquí Productos 7 S.A. (i) (t) Argentina Alimentos Calchaquí Productos 7 S.A.Badi Ltd. United Arab Emirates Badi Ltd.
Al-Wafi Al-Takamol International for Foods Products Saudi Arabia Al-Wafi Al-Takamol International for Foods ProductsBRF Al Yasra Food K.S.C.C. ("BRF AFC") Kuwait BRF Al Yasra Food K.S.C.C. ("BRF AFC")BRF Foods GmbH Austria BRF Foods GmbH
FFM Further Processing Sdn. Bhd. (q) Malaysia FFM Further Processing Sdn. Bhd.BRF Foods LLC Russia BRF Foods LLCBRF France SARL France BRF France SARLBRF Global Company Nigeria Ltd. Nigeria BRF Global Company Nigeria Ltd.BRF Global Company South Africa Proprietary Ltd. South Africa BRF Global Company South Africa Proprietary Ltd.
BRF Global Company Nigeria Ltd. Nigeria BRF Global Company Nigeria Ltd.BRF Global GmbH (b) Austria BRF Global GmbH
Qualy 5201 B.V. (b) The Netherlands Qualy 5201 B.V.Xamol Consultores Serviços Ltda. Portugal Xamol Consultores Serviços Ltda.
BRF Japan KK Japan BRF Japan KKBRF Korea LLC Korea BRF Korea LLCBRF Malaysia Sdn Bhd (j) Malaysia BRF Malaysia Sdn BhdBRF Shanghai Management Consulting Co. Ltd. China BRF Shanghai Management Consulting Co. Ltd.BRF Shanghai Trading Co. Ltd. China BRF Shanghai Trading Co. Ltd.BRF Singapore PTE Ltd. Singapore BRF Singapore PTE Ltd.BRF Germany GmbH Germany BRF Germany GmbHBRF Holland B.V. The Netherlands BRF Holland B.V.
Alimentos Calchaqui Productos 7 S.A. (i) (t) Argentina Alimentos Calchaqui Productos 7 S.A.Campo Austral S.A. (r) (s) Argentina Campo Austral S.A.Eclipse Holding Cöoperatief U.A. (h) The Netherlands Eclipse Holding Cöoperatief U.A.BRF B.V. The Netherlands BRF B.V.
BRF Hungary LLC Hungary BRF Hungary LLCBRF Iberia Alimentos SL Spain BRF Iberia Alimentos SLBRF Invicta Ltd. England BRF Invicta Ltd.
Invicta Food Products Ltd. England Invicta Food Products Ltd.BRF Wrexham Ltd. England BRF Wrexham Ltd.
Invicta Food Group Ltd. (b) England Invicta Food Group Ltd.Invicta Foods Ltd. England Invicta Foods Ltd.Invicta Foodservice Ltd. England Invicta Foodservice Ltd.
Universal Meats (UK) Ltd. (b) (e) England Universal Meats (UK) Ltd.BRF Italia SPA Italy BRF Italia SPACompañía Paraguaya Comercial S.A. (f) Paraguay Compañía Paraguaya Comercial S.A.Campo Austral S.A. (r) (s) Argentina Campo Austral S.A.
Itega S.A. (s) Argentina Itega S.A.Eclipse Holding Cöoperatief U.A. (h) The Netherlands Eclipse Holding Cöoperatief U.A.
Buenos Aires Fortune S.A. (h) Argentina Buenos Aires Fortune S.A.Cabaña San Nestor S.A. (h) (t) Argentina Cabaña San Nestor S.A.Eporpan S.A. (h) (t) Argentina Eporpan S.A.
Campo Austral S.A. (h) (s) Argentina Campo Austral S.A.Degesa Argentina S.A. (h) (t) Argentina Degesa Argentina S.A.
Itega S.A. (h) Argentina Itega S.A.Porcinos Cordobeses S.A. (h) (t) Argentina Porcinos Cordobeses S.A.
Eclipse Latam Holdings (h) Spain Eclipse Latam HoldingsBuenos Aires Fortune S.A. (h) Argentina Buenos Aires Fortune S.A.
Campo Austral S.A. (h) (s) Argentina Campo Austral S.A.Cabaña San Nestor S.A. (h) (t) Argentina Cabaña San Nestor S.A.Campo Austral S.A. (h) (s) Argentina Campo Austral S.A.Degesa Argentina S.A. (h) (t) Argentina Degesa Argentina S.A.Eporpan S.A. (h) (t) Argentina Eporpan S.A.Hibridos Argentinos S.A. (h) (t) Argentina Hibridos Argentinos S.A.Indústria Frigorífico Expork S.A. (h) (t) Argentina Indústria Frigorífico Expork S.A.Itega S.A. (h) Argentina Itega S.A.
Porcinos Cordobeses S.A. (h) (t) Argentina Porcinos Cordobeses S.A.Porcinos Cordobeses S.A. (h) (t) Argentina Porcinos Cordobeses S.A.
Eporpan S.A. (h) (t) Argentina Eporpan S.A.Cabaña San Nestor S.A. (h) (t) Argentina Cabaña San Nestor S.A.
Hibridos Argentinos S.A. (h) (t) Argentina Hibridos Argentinos S.A.Porcinos Cordobeses S.A. (h) (t) Argentina Porcinos Cordobeses S.A.
Indústria Frigorífico Expork S.A. (h) (t) Argentina Indústria Frigorífico Expork S.A.Federal Foods LLC (c) United Arab Emirates Federal Foods LLC
Federal Foods Omã (a) Oman Federal Foods OmãFederal Foods Qatar Qatar Federal Foods Qatar
Golden Foods Poultry Limited (d) Thailand Golden Foods Poultry LimitedGolden Poultry Siam Limited (d) Thailand Golden Poultry Siam Limited
Golden Poultry Siam Limited (d) Thailand Golden Poultry Siam Limited
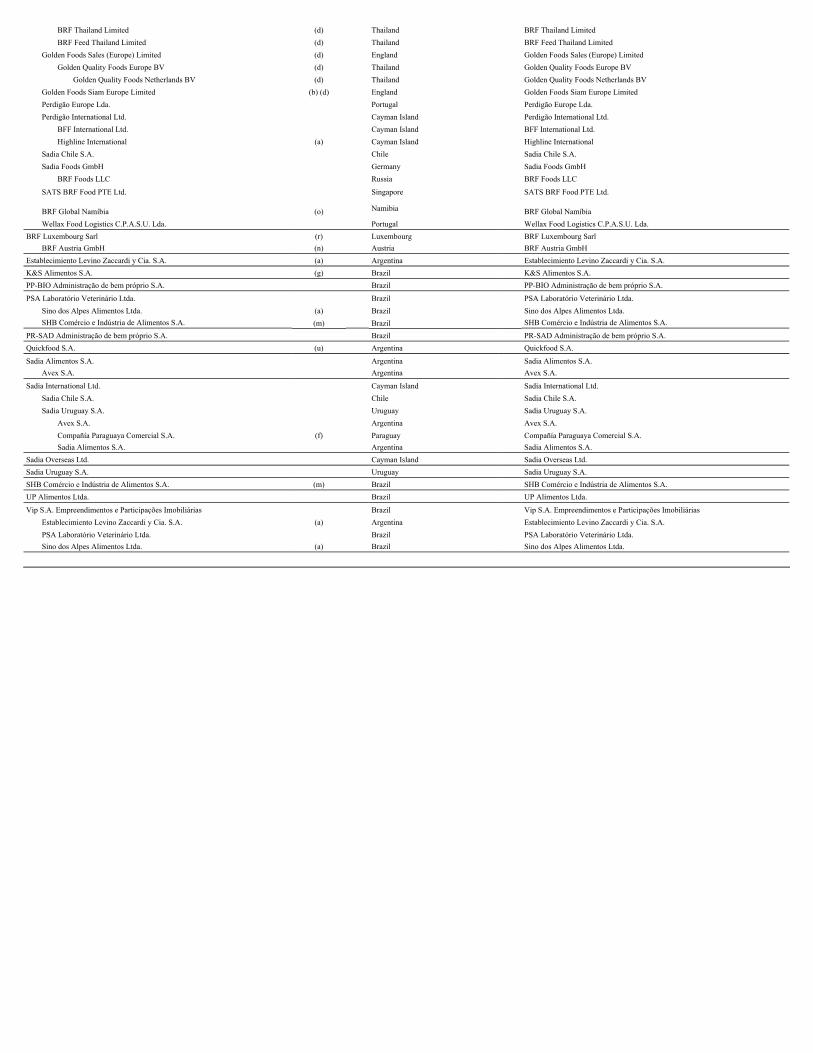
BRF Thailand Limited (d) Thailand BRF Thailand LimitedBRF Feed Thailand Limited (d) Thailand BRF Feed Thailand Limited
Golden Foods Sales (Europe) Limited (d) England Golden Foods Sales (Europe) LimitedGolden Quality Foods Europe BV (d) Thailand Golden Quality Foods Europe BV
Golden Quality Foods Netherlands BV (d) Thailand Golden Quality Foods Netherlands BVGolden Foods Siam Europe Limited (b) (d) England Golden Foods Siam Europe LimitedPerdigão Europe Lda. Portugal Perdigão Europe Lda.Perdigão International Ltd. Cayman Island Perdigão International Ltd.
BFF International Ltd. Cayman Island BFF International Ltd.Highline International (a) Cayman Island Highline International
Sadia Chile S.A. Chile Sadia Chile S.A.Sadia Foods GmbH Germany Sadia Foods GmbH
BRF Foods LLC Russia BRF Foods LLC
SATS BRF Food PTE Ltd. Singapore SATS BRF Food PTE Ltd.
BRF Global Namíbia (o) Namibia BRF Global NamíbiaWellax Food Logistics C.P.A.S.U. Lda. Portugal Wellax Food Logistics C.P.A.S.U. Lda.
BRF Luxembourg Sarl (r) Luxembourg BRF Luxembourg SarlBRF Austria GmbH (n) Austria BRF Austria GmbH
Establecimiento Levino Zaccardi y Cia. S.A. (a) Argentina Establecimiento Levino Zaccardi y Cia. S.A.K&S Alimentos S.A. (g) Brazil K&S Alimentos S.A.PP-BIO Administração de bem próprio S.A. Brazil PP-BIO Administração de bem próprio S.A.
PSA Laboratório Veterinário Ltda. Brazil PSA Laboratório Veterinário Ltda.Sino dos Alpes Alimentos Ltda. (a) Brazil Sino dos Alpes Alimentos Ltda.SHB Comércio e Indústria de Alimentos S.A. (m) Brazil SHB Comércio e Indústria de Alimentos S.A.
PR-SAD Administração de bem próprio S.A. Brazil PR-SAD Administração de bem próprio S.A.Quickfood S.A. (u) Argentina Quickfood S.A.
Sadia Alimentos S.A. Argentina Sadia Alimentos S.A.Avex S.A. Argentina Avex S.A.
Sadia International Ltd. Cayman Island Sadia International Ltd.Sadia Chile S.A. Chile Sadia Chile S.A.Sadia Uruguay S.A. Uruguay Sadia Uruguay S.A.
Avex S.A. Argentina Avex S.A.Compañía Paraguaya Comercial S.A. (f) Paraguay Compañía Paraguaya Comercial S.A.Sadia Alimentos S.A. Argentina Sadia Alimentos S.A.
Sadia Overseas Ltd. Cayman Island Sadia Overseas Ltd.Sadia Uruguay S.A. Uruguay Sadia Uruguay S.A.SHB Comércio e Indústria de Alimentos S.A. (m) Brazil SHB Comércio e Indústria de Alimentos S.A.UP Alimentos Ltda. Brazil UP Alimentos Ltda.
Vip S.A. Empreendimentos e Participações Imobiliárias Brazil Vip S.A. Empreendimentos e Participações ImobiliáriasEstablecimiento Levino Zaccardi y Cia. S.A. (a) Argentina Establecimiento Levino Zaccardi y Cia. S.A.PSA Laboratório Veterinário Ltda. Brazil PSA Laboratório Veterinário Ltda.Sino dos Alpes Alimentos Ltda. (a) Brazil Sino dos Alpes Alimentos Ltda.
(a) Dormant subsidiaries.(b) The wholly-owned subsidiary BRF Global GmbH, started to operate as a trading in the European market and owns 101 direct subsidiaries in Madeira Island, Portugal, with an investment as of December 31, 2016 of
R$3,301 (R$4,406 as of December 31, 2015) and a direct subsidiary in Den Bosch, The Netherlands, denominated Qualy 20 with an investment as of December 31, 2016 of R$6,638 (R$8,162 as of December 31,2015). The whollyowned subsidiary Qualy 5201 B.V. owns 212 subsidiaries in The Netherlands being the amount of this investment as of December 31, 2016 of R$18,234 (R$22,258 as of December 31, 2015). Theindirect subsidiary Invicta Food Group Ltd. owns 120 direct subsidiaries in Ashford, England, with an investment of R$112,471 as of December 31, 2016 (R$161,197 as of December 31, 2015). The indirect subsidiaryUniversal Meats (UK) Ltd owns 99 direct subsidiaries in Ashford, England with an investment of R$37,486 as of December 1, 2016. The indirect subsidiary Golden Foods Siam Europe Ltd (GFE) owns 32 subsidiariesin Ashford. England with an investment of R$114,068 as of December 31, 2016. The purpose of these two subsidiaries is to operate in the European market to increase the Company’s market share, which is regulatedby a system of poultry and turkey meat import quotas.
(c) The Company owns 49% of the equity interest, permitted by the Federal Law 8/1984, which is effective in the United Arab Emirates. According to the shareholder’s agreement, the Company holds 100% of theeconomic interest.
(d) On January 26, 2016 acquisition of 48.52% of equity interest in Golden Foods Poultry Limited and 48.16% of equity interest in Golden Poultry Siam Limited. The company, according to the shareholder’s agreement,owns substantial part of the economic rights of such entities. In addition, on January 26, 2016, acquisition of 100% of equity interest in Golden Foods Sales (Europe) Limited and Golden Foods Siam Europe Limited.
(e) On February 01, 2016, acquisition of 100% of equity interest in Universal Meats (UK) Ltd.(f) On February 25, 2016, acquisition of 100% of equity interest in Compañía Paraguaya Comercial S.A.(g) On March 18, 2016, the Company acquired the remaining equity interest and thus holds 100% of equity interest in K&S Alimentos S.A.
(h) On April 13, 2016, acquisition of 50% of equity interest in Eclipse Holding Cöoperatief UA and its subsidiaries. On October 27, 2016, acquisition of 50% of equity interest and thus holds 100% of equity interest.(i) On May 10, 2016, acquisition of 100% of equity interest in Alimentos Calchaquí Productos 7 S.A..(j) On June 10, 2016, establishment of BRF Malaysia Snd Bhd with 100% of equity interest.(k) On June 20, 2016, acquisition of 30% of equity interest, becoming the holder of 70% of equity interest, permitted by the Federal Law, which is effective in the Sultanate of Oman. According to the shareholder’s
agreement, the Company holds 99% of the economic interest.(l) The Company owns 49% of equity interest, permitted by the Federal Law 8/1984, which is effective in the United Arab Emirates. According to the shareholder’s agreement, the Company holds 100% of the economic
interest.(m) On September 01, 2016, establishment of SHB Comércio e Indústria de Alimentos S.A.(n) On September 02, 2016, acquisition of 100% of equity interest in SALEM Beteiligungsverwaltung Siebenundsiebzigste. On November 09, 2016, change the corporate name to BRF Austria GmbH.(o) On September 22, 2016, acquisition of 100% of equity interest in Gazania Investments Three Hundred and Thirty-Three (Pty) Ltd. On October 13, 2016, change the corporate name to BRF Global Namibia.(p) On October 03 ,2016, change the corporate name to BRF Energia S.A. and modification of its corporate purpose, so that it carries out activities of commercialization of electric enegy.(q) On October 04, 2016, acquisition of 70% of equity interest in FFM Further Processing Sdn Bhdl.(r) On October 28, 2016, establishment of BRF Luxemburgo Sarl.(s) On November 01, 2016, change in equity interest in campo Austral.(t) On November 01, 2016, spin-off of the following companies: Alimentos Calchaqui Productos 7 S.A., Cabaña San Néstor S.A., Eporpam S.A., Industria Frigorica Expork S.A., Híbridos Argentinos S.A., Porcinos
Cordobeces S.A. and Degesa Argentina S.A., at Campo Austral S.A., and change in equity interest.(u) On December 29, 2016, change in equity interest in Quickfood S.A.
Exhibit 12.01
CERTIFICATION PURSUANT TO SECTION 302 OF THE SARBANES-OXLEY ACT OF 2002
I, Pedro de Andrade Faria, certify that:
1. I have reviewed this annual report on Form 20-F of BRF S.A.;
2. Based on my knowledge, this report does not contain any untrue statement of a material fact or omit to state a material fact necessary to make the statements made, in light of the circumstances under which suchstatements were made, not misleading with respect to the period covered by this report;
3. Based on my knowledge, the financial statements, and other financial information included in this report, fairly present in all material respects the financial condition, results of operations and cash flows of thecompany as of, and for, the periods presented in this report;
4. The company’s other certifying officer(s) and I are responsible for establishing and maintaining disclosure controls and procedures (as defined in Exchange Act Rules 13a-15(e) and 15d-15(e)) and internal controlover financial reporting (as defined in Exchange Act Rules 13a-15(f) and 15d-15(f)) for the company and have:
(a) Designed such disclosure controls and procedures, or caused such disclosure controls and procedures to be designed under our supervision, to ensure that material information relating to the company, including itsconsolidated subsidiaries, is made known to us by others within those entities, particularly during the period in which this report is being prepared;
(b) Designed such internal control over financial reporting, or caused such internal control over financial reporting to be designed under our supervision, to provide reasonable assurance regarding the reliability offinancial reporting and the preparation of financial statements for external purposes in accordance with generally accepted accounting principles;
(c) Evaluated the effectiveness of the company’s disclosure controls and procedures and presented in this report our conclusions about the effectiveness of the disclosure controls and procedures, as of the end of theperiod covered by this report based on such evaluation; and
(d) Disclosed in this report any change in the company’s internal control over financial reporting that occurred during the period covered by the annual report that has materially affected, or is reasonably likely tomaterially affect the company’s internal control over financial reporting; and
5. The company’s other certifying officer(s) and I have disclosed, based on our most recent evaluation of internal control over financial reporting, to the company’s auditors and the audit committee of the company’sboard of directors (or persons performing the equivalent functions):
(a) All significant deficiencies and material weaknesses in the design or operation of internal control over financial reporting which are reasonably likely to adversely affect the company’s ability to record, process,summarize and report financial information; and
(b) Any fraud, whether or not material, that involves management or other employees who have a significant role in the company’s internal control over financial reporting.
Date: April 25, 2017
By: /s/ Pedro de Andrade Faria Name: Pedro de Andrade Faria Title: Global Chief Executive, Financial and Investor Relations Officer

Exhibit 13.01
CERTIFICATION PURSUANT TO 18 U.S.C. SECTION 1350, AS ADOPTED PURSUANT TO
SECTION 906 OF THE U.S. SARBANES-OXLEY ACT OF 2002
In connection with the Annual Report of BRF S.A. (the “Company”) on Form 20-F for the fiscal year ended December 31, 2016, as filed with the U.S. Securities and Exchange Commission on the date hereof (the“Report”), I, Pedro de Andrade Faria, Global Chief Executive, Financial and Investor Relations Officer, certify, pursuant to 18 U.S.C. section 1350, as adopted pursuant to section 906 of the U.S. Sarbanes-Oxley Act of 2002,that to the best of my knowledge:
(i) the Report fully complies with the requirements of Section 13(a) or 15(d) of the U.S. Securities Exchange Act of 1934; and
(ii) the information contained in the Report fairly presents, in all material respects, the financial condition and results of operations of the Company.
By: /s/ Pedro de Andrade Faria Name: Pedro de Andrade FariaTitle: Global Chief Executive, Financial and Investor Relations Officer April 25, 2017