breast cancer mortality in appalachia: reversing patterns of disparity over time
TRANSCRIPT

Br t n r rt l t n pp l h : R v r n P tt rnf D p r t v r T
N n l n , n J. L n r h, r nn . H ll r
Journal of Health Care for the Poor and Underserved, Volume 23, Number2, May 2012, pp. 715-725 (Article)
P bl h d b J hn H p n n v r t PrDOI: 10.1353/hpu.2012.0043
For additional information about this article
Access provided by SUNY @ Buffalo (5 Oct 2015 02:28 GMT)
http://muse.jhu.edu/journals/hpu/summary/v023/23.2.yao.html
Part 3: brief communication
© Meharry Medical College Journal of Health Care for the Poor and Underserved 23 (2012): 715–725.
breast cancer mortality in appalachia: reversing Patterns of Disparity over time
Nengliang Yao, MSEugene J. Lengerich, VMD, MS
Marianne M. Hillemeier, PhD, MPH
Abstract: Breast cancer death rates in the U.S. have decreased in recent decades, however areas such as Appalachia with fewer cancer care resources may not have experienced comparable mortality declines. This study examines trends in breast cancer mortality rate disparities in Appalachian states and the continental U.S. using data from SEER mortality files 1969–2007 and the Area Resource File. Overall breast cancer mortality rates decreased significantly, with a smaller decline in Appalachian counties (17.5%) compared with non-Appalachian counties in Appalachian states (30.5%), and compared with non-Appalachia U.S. counties (28.3%). After accounting for poverty, rural/urban status, education, health care resources, and proportion White in the population, residence in Appalachian counties except for those in the Northern subregion was significantly associated with smaller reduction in breast cancer mortality rates. Lower levels of education, physician density, and percent White in the population were also associated with smaller reductions in breast cancer mortality.
Key Words: Breast cancer, mortality, Appalachia, disparity.
Breast cancer is the most commonly diagnosed non-skin cancer and the second leading cause of cancer deaths among U.S. women.1 Breast cancer death rates have
decreased since 1990, declining from 33 per 100,000 in 1990 to 23 per 100,000 in 2006.1 This decline has been attributed to increased early detection through mammography, as well as to improvements in breast cancer treatment.1–3 Geographic areas that are medically underserved with fewer mammography facilities and more limited options for cancer treatment,4,5 however, may not have experienced comparable declines in breast cancer mortality.
Appalachia is a geographic region that has long been characterized by poverty and reduced health care access.6–9 Based upon disparities in cancer incidence and outcomes, residents of the Appalachian region have been designated as a special population of interest by the National Cancer Institute.10 Women in Appalachia report fewer mam-mograms and being less likely than others to receive recommended treatment for breast cancer.6,11 Despite these barriers, researchers reported that during 1976–1996
The auThors are affiliated with The Pennsylvania State University, Department of Health Policy and Administration (NY, EJL, MMH), The Pennsylvania State University, Department of Public Health Sciences (EJL, MMH), and the Penn State Hershey Cancer Institute (EJL). Please address correspondence to Nengliang Yao, 604 Ford Building, University Park, PA 16802; (814) 380-1251; [email protected].

716 Breast cancer mortality in Appalachia
breast cancer mortality rate was lower among Appalachian White women than among White women in other geographic regions.12 It was the case, however, that this differ-ence decreased over time.12
This study examines trends in breast cancer mortality rate disparities and rate reduc-tions in Appalachian states and the continental U.S. The objectives of this research were: (I) to examine disparities and trends associated with breast cancer mortality rate in Appalachian states and the continental U.S., using updated data through 2007; (II) to examine the spatial distribution of reductions in breast cancer mortality; and (III) to examine the relationship between reduction of breast cancer mortality and Appalachian location, taking contextual factors including poverty and educational level into account.
methods
Annual, population-based data from 1969 to 2007 regarding breast cancer deaths among White women in the continental U.S. and the District of Columbia were ana-lyzed. These data, originally collected by the National Center for Health Statistics, were accessed through the Surveillance, Epidemiology and End Results (SEER) program of the National Cancer Institute.13 To account for changes in the International Clas-sification of Disease (ICD) system over time, we used recoded cause of death data in SEER which allow comparison of breast cancer deaths originally coded according to ICD versions 8, 9, and 10. Breast cancer mortality data have been found to be reliable and valid across time and location in previous studies.14–17 We restricted the analysis to White women because the Appalachian population contains few non-White women, especially at the earlier time points of interest. This study also uses county-level data on poverty, rural/urban status, education, healthcare resources, and percent White in the population extracted from the Area Resource File in regression analyses.
We used SEER*Stat statistical software from the SEER Program18 to calculate breast cancer mortality rates (expressed as deaths per 100,000 individuals per year) and trends. We used SEER’s multiple-year aggregate rates which improved the stability of the estimates; for 1969–1998, we calculated three-year aggregate rates, with four-year aggregate rates for 1999–2002 and five-year aggregate rates for 2003–2007 (http://seer .cancer.gov/mortality/index.html). The rates were age-adjusted by the direct method using 5-year age groups, with the 2000 U.S. standard population as the reference.
We calculated breast cancer mortality rates for Appalachian counties (n420), non-Appalachian counties in the 13 Appalachian states (n640) (note that all West Virginia counties are Appalachian), and non-Appalachian counties in the continental U.S. as a whole (n2,756). We also calculated rates by age (younger than 65 years of age and 65 years and older) and for rural and urban counties, with those with Rural Urban Con-tinuum Codes (RUCC) of 6–9 and 0–5 classified as rural and urban, respectively.19 We used the 2003 urban-rural continuum scheme to designate county rural status during the period 1999–2007, the 1993 scheme for the period 1990–1998, the 1983 scheme for the period 1981–1989, and the 1974 scheme for the period 1969–1980. Consequently, the number of counties designated as rural or urban changed over time; for example, in 1974, 670 counties were designated rural while in 2003, 494 were designated rural.
We tested the significance (p.05) of linear trends of Appalachia/non-Appalachia
717Yao, Lengerich, and Hillemeier
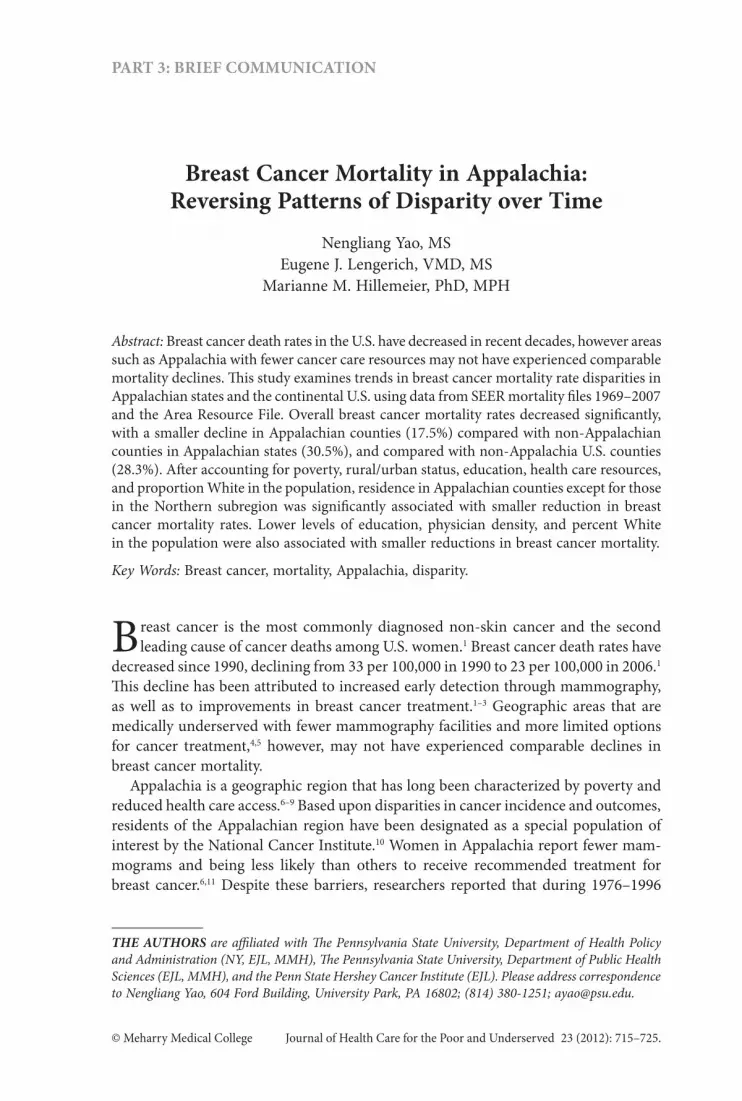
rate ratios and calculated the annual percentage change by fitting a least squares regres-sion line to the natural logarithm of the rates. We also conducted exploratory spatial data analysis to examine the spatial distribution of the reduction in county-specific mortality rates. The reduction was calculated as the absolute difference between nine-year aggregate rates for 1969–1977 and 1999–2007. The reduction in rates is presented as a choropleth map constructed with shapefiles from the Geography Division of U.S. Census Bureau.20 Rates for counties with fewer than four deaths are not displayed.
The final stage of analysis included weighted multivariate regression to examine fac-tors associated with reduction in breast cancer mortality rates, using SEER mortality data merged with county data from the Area Resource File. Two different regression models were estimated. The independent variables in the first model included Appa-lachian location, rural/urban status, White poverty rate, percent of Whites with a high school diploma, percent White in the population, and physicians per 1,000 residents during 1995–2000. These covariates were inspected and found to be relatively stable across years. The second model included the variables in the first model, substituting regional dummy variables to represent the five Appalachian sub-regions defined by the Appalachian Regional Commission in place of the overall Appalachian variable. The dependent variable in both models is the difference in aggregate county-level breast cancer mortality rates between 1969–1977 and 1999–2007.
results
From 1969 to 2007, 1,197,281 breast cancer deaths occurred among U.S. White women, with 125,006 (10.4%) occurring in Appalachia. Over this period, the overall breast can-cer mortality rate among White women decreased significantly, with a smaller decline in Appalachian counties (17.5%) than in non-Appalachian counties in Appalachian states (30.5%) and non-Appalachia counties in the U.S. as a whole (28.3%). The annual percentage change values are 0.42, 0.88, and 0.83 respectively in Appalachian counties, non-Appalachian counties in Appalachian states, and non-Appalachian coun-ties in the U.S. The mortality rate in Appalachia during 2003–2007 (24.1 per 100,000 people, 95% CI: 23.8~24.5) is significantly higher than non-Appalachian counties in the U.S. (23.3 per 100,000 people, 95% CI: 23.2~23.4, p-value .001). Figure 1 depicts changes in breast cancer mortality rates over time for U.S. counties, with the smallest declines indicated in black. Counties in central Appalachia, especially those in West Virginia, Kentucky, and Virginia, had among the smallest rate decreases.
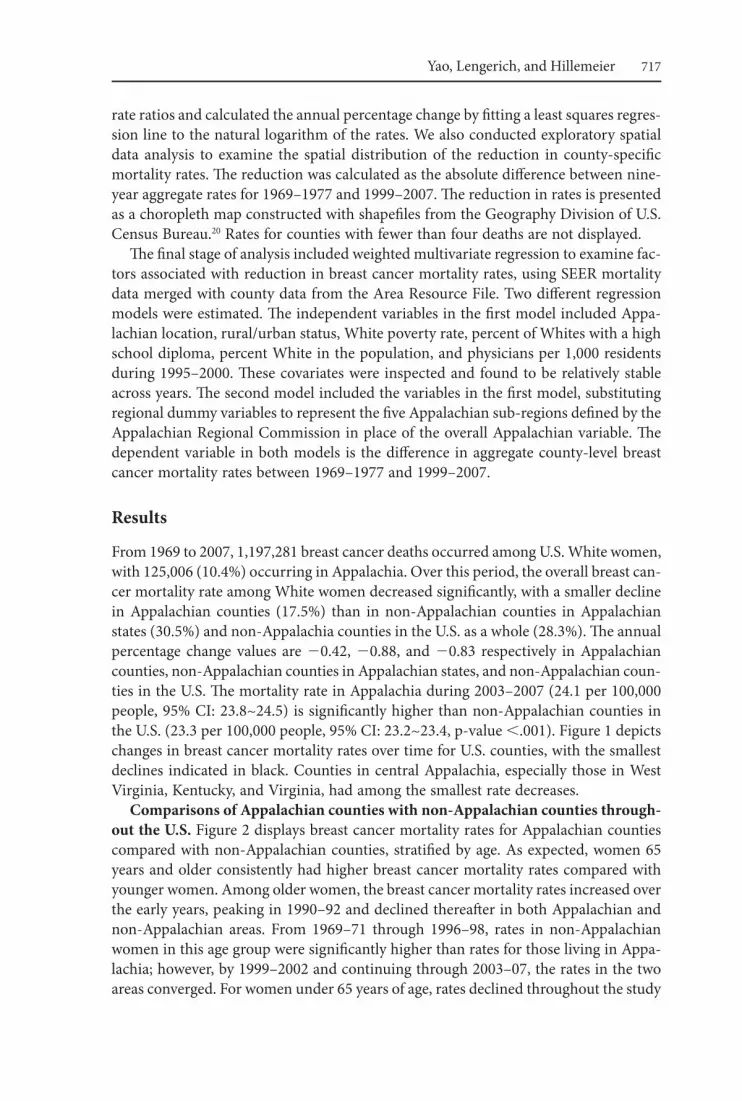
comparisons of appalachian counties with non-appalachian counties through-out the u.S. Figure 2 displays breast cancer mortality rates for Appalachian counties compared with non-Appalachian counties, stratified by age. As expected, women 65 years and older consistently had higher breast cancer mortality rates compared with younger women. Among older women, the breast cancer mortality rates increased over the early years, peaking in 1990–92 and declined thereafter in both Appalachian and non-Appalachian areas. From 1969–71 through 1996–98, rates in non-Appalachian women in this age group were significantly higher than rates for those living in Appa-lachia; however, by 1999–2002 and continuing through 2003–07, the rates in the two areas converged. For women under 65 years of age, rates declined throughout the study

718 Breast cancer mortality in Appalachia
period in both Appalachia and non-Appalachia. Rates were significantly higher in non-Appalachia areas until the rates converged in 1981–83. By 2003–07, the disparity had reversed direction and the breast cancer mortality rate in Appalachia was significantly higher than the rate in non-Appalachian counties (p.001).
comparisons in appalachian and non-appalachian counties within appalachian states. In addition to overall comparisons, Appalachian counties were compared to neighboring non-Appalachian counties within the same states. Table 1 displays Appala-chian county/non-Appalachian county breast cancer mortality ratios for the 12 Appala-chian states that include both county types. In 2003–07, the Appalachia/non-Appalachia mortality rate ratio was significantly greater than 1.0 in South Carolina (1.1031; p.05) and Virginia (1.1508; p.01). The trend in the Appalachia/non-Appalachia mortality rate ratio increased over time in Kentucky (p.001), Ohio (p.019), South Carolina (p.025), Tennessee (p.045) and Virginia (p.001).
Figure 1. Reduction in age-adjusted White female breast cancer death rates by county, 48 continental states.aThe rate reduction is the absolute difference between age-adjusted death rates during 1969–1977 and rates during 1999–2007.bThe rates reduction could not be calculated for some counties due to fewer than 4 deaths in one or two 9-year time periods. cThe projected coordinate system of this map is USA Contiguous Lambert Conformal Conic.dData Sources: U.S. Mortality Data, 1969 to 2007. Surveillance, Epidemiology, and End Results (SEER) Program (www.seer.cancer.gov). SEER*Stat Database: Mortality—All COD, Aggregated With County, Total U.S. (1969–2007) <Katrina/Rita Population Adjustment>—Linked To County Attributes—Total U.S., 1969–2007 Counties, National Cancer Institute, DCCPS, Surveillance Research Program, Cancer Statistics Branch, released June 2010. Underlying mortality data provided by NCHS (www.cdc.gov /nchs).
Boundaries of The Appalachian Region
Reduction in Breast Cancer Death Rates
#2.702.69–2.202.21–6.506.51–11.20.11.20Statistic could not be calculated

719Yao, Lengerich, and Hillemeier
Figure 2. Comparison of Appalachian counties to non-Appalachian counties throughout the U.S., stratified by age group: three-year age-adjusted White female breast cancer death rates, 1969 to 2007. aSignificant difference (p-value .001) between “women 65 in App counties” and “women 65 in non-App U.S.”bSignificant difference (p-value .001) between “women 65 in App counties” and “women 65 in non-App U.S.”cThe last study period 2003–2007 is 5-years, and the period 1999–2002 is 4-years.dRates are age adjusted to the 2000 U.S. standard population (Census P25-1130).eSources: U.S. Mortality Data, 1969 to 2007. Surveillance, Epidemiology, and End Results (SEER) Program (www.seer.cancer.gov). SEER*Stat Database: Mortality—All COD, Aggregated With County, Total U.S. (1969–2007) <Katrina/Rita Population Adjustment>—Linked To County Attributes—Total U.S., 1969–2007 Counties, National Cancer Institute, DCCPS, Surveillance Research Program, Cancer Statistics Branch, released June 2010. Underlying mortality data provided by NCHS (www.cdc.gov /nchs).COD Classification of diseaseDCCPS Division of Cancer Control and Population Sciences
140
130
120
110
100
30
20
10
0
Rat
es P
er 1
00,0
00 P
opul
atio
n
Year of Death
Women 65 in non-App US
Women 65 in App counties
Women 65 in non-App US
Women 65 in App counties
a,b1969– a,b1972– a,b1975– a,b1978– a1981– a1984– a1987– a1990– a1993– a1996– 1999– b2003– 1971 1974 1977 1980 1983 1986 1989 1992 1995 1998 2002 2007

tabl
e 1.
a
PPa
Lac
Hia
n/n
on
-aPP
aLa
cH
ian
ra
tio
of
3-Y
ear
aG
e-a
DJu
SteD
fem
aLe
br
eaSt
ca
nc
er
Dea
tH
ra
teS
bY
Sta
te:
WH
iteS
on
LY, 1
2 a
PPa
Lac
Hia
n S
tat
eS, 1
969–
2007
a
app
alac
hian
/non
-app
alac
hian
rat
io o
f 3-y
ear
age
-adj
uste
d fe
mal
e br
east
can
cer
Dea
th r
ates
a
la-
bam
aG
eorg
iaK
en-
tuck
ym
ary-
la
ndm
issi
s-
sipp
in
ew
York
nor
th
car
olin
ao
hio
Penn
syl-
vani
aSo
uth
car
olin
ate
n-
ness
eeV
irgi
nia
1969
–197
1
.973
3.9
414
.794
7**
.834
8.8
634
.818
0***
.963
4.8
721*
*.9
702
1.16
44.9
375
.665
3***
1972
–197
41.
1887
*.9
729
.746
3***
.963
2.9
578
.865
4**
.909
.887
6**
.962
11.
1556
.922
2.7
166*
**19
75–1
977
1.04
36.9
692
.700
3***
.964
7.9
878
.887
8**
.932
.928
1.9
302*
*1.
0194
.902
2.8
625*
1978
–198
01.
0026
.962
5.7
616*
**.8
808
.889
6.9
302
.934
1.9
695
.907
5***
1.14
22.9
923
.833
5*19
81–1
983
1.20
10**
.928
3.8
806*
.989
8.8
946
.910
0*.9
735
.966
7.9
143*
**1.
1252
.913
.758
3***
1984
–198
61.
0188
1.01
93.8
317*
*.8
496
.931
4.9
271
.895
2*.9
484
.977
11.
1313
.972
9.9
066
1987
–198
91.
0543
.926
2.9
017
.835
71.
0569
.840
8**
.92
.902
2*.9
228*
*1.
1088
.932
5.8
818*
1990
–199
2.9
923
.978
3.9
013
.943
8.9
895
.889
6**
.958
3.8
917*
*.9
688
.994
4.9
662
.943
519
93–1
995
.885
1*1.
0521
1.01
41.7
960*
1.14
07.9
401
.973
5.9
854
.958
.924
7.9
745
1.01
5719
96–1
998
.906
11.
0213
.980
1.8
365
.872
6.8
584*
*.9
293
1.01
84.9
547
1.08
66.9
628
1.04
4719
99–2
002
.972
4.9
594
1.03
831.
0592
.864
2.9
508
.923
4*1.
0075
.960
5.9
719
1.00
25.9
101
2003
–200
71.
0142
1.00
591.
0839
1.10
141.
0312
.975
11.
0069
.948
41.
0159
1.10
31*
.990
71.
1508
**p-
valu
e of
the
linea
r tr
end
.088
.197
.0
001
.932
.629
.168
.998
.019
.622
.025
.045
.001
*p-v
alue
.0
5**
p-va
lue
.0
1**
*p-v
alue
.0
01
a The
last
stud
y pe
riod
200
3–20
07 is
5-y
ears
, and
the
peri
od 1
999–
2002
is 4
-yea
rs. R
ates
are
age
adj
uste
d to
the
2000
U.S
. sta
ndar
d po
pula
tion
(Cen
sus P
25-1
130)
. Val
ues
are r
ate r
atio
s; U
.S. M
orta
lity
Dat
a, 1
969
to 2
007.
Sur
veill
ance
, Epi
dem
iolo
gy, a
nd E
nd R
esul
ts (S
EER)
Pro
gram
(ww
w.se
er.c
ance
r.gov
). SE
ER S
tat D
atab
ase:
Mor
talit
y—A
ll C
OD
, Agg
rega
ted
With
Cou
nty,
Tota
l U.S
. (19
69–2
007)
<K
atri
na/R
ita P
opul
atio
n A
djus
tmen
t>—
Link
ed T
o C
ount
y A
ttrib
utes
—To
tal U
.S.,
1969
–200
7 C
ount
ies,
Nat
iona
l C
ance
r Ins
titut
e, D
CC
PS, S
urve
illan
ce R
esea
rch
Prog
ram
, Can
cer S
tatis
tics B
ranc
h, re
leas
ed Ju
ne 2
01. U
nder
lyin
g m
orta
lity
data
pro
vide
d by
NC
HS
(ww
w.cd
c.go
v/nc
hs).
CO
D
Cla
ssifi
catio
n of
dis
ease
DC
CPS
D
ivisi
on o
f Can
cer
Con
trol
and
Pop
ulat
ion
Scie
nces

721Yao, Lengerich, and Hillemeier
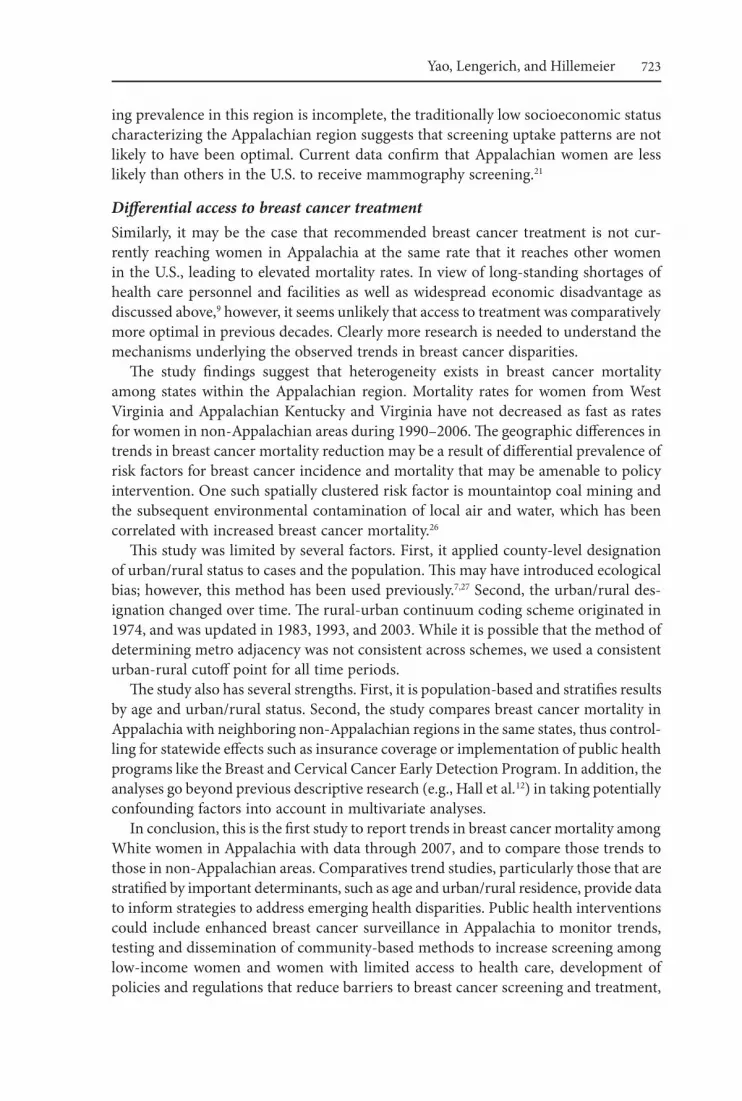
In addition to descriptive comparisons, we conducted analytic regression analyses to examine whether residence in Appalachian counties as opposed to neighboring non-Appalachian counties was associated with reduced breast cancer mortality after taking potentially confounding factors into account. As shown in Table 2, we ran sepa-rate models depending on the specification of the Appalachian variable. Looking first at Model 1, a negative and significant association was found between the Appalachia dummy variable and reduction in breast cancer mortality rate when controlling for other covariates in the model. In Model 2, residence in the North Central, Central, South Central, and Southern Appalachia regions was associated with smaller reduc-tions in breast cancer mortality rates compared with non-Appalachian areas, while the North region was not significantly different. Education, per capita physician supply, and percent White in the population were positively associated with reduction of breast cancer mortality. Rural/urban status and poverty rate were not significantly associated with mortality rate reduction. The adjusted R2 for the regression models ranged from 0.28 to 0.29.
Discussion
Although the overall breast cancer mortality rate has decreased since the early 1990s, the mortality advantage that was present for White women in Appalachia from 1969 until the early 1990s has disappeared. Women under 65 years of age in Appalachia now have a higher breast cancer mortality rate than women in the non-Appalachian coun-ties of Appalachian states (5.2% greater) and for women in non-Appalachian counties in the U.S. (7.1% greater).
In interpreting the transformation in breast cancer mortality risk among White Appalachian women from comparatively low to significantly elevated, it is helpful to consider factors that have been previously suggested as being potentially protective, and changes in status that may have taken place in recent years. Hall and colleagues discussed several influences that may have contributed to lower risk breast cancer mortality risk in earlier decades:12
Lower underlying incidence of breast cancer secondary to lower risk factor prevalence among appalachian womenThe risk of developing breast cancer is increased by modifiable factors such as not breastfeeding, older age at first birth, oral contraceptive use, post-menopausal hormone therapy, overweight/obesity, physical inactivity, and drinking more than one alco-holic beverage daily.21 If the female Appalachian population had comparatively lower exposure to risk factors in the past and in recent decades has progressively become more exposed, underlying breast cancer incidence rates could be trending upward. For example, the prevalence of obesity is much higher in Appalachia than in the rest of the U.S. Eighty-one percent of counties in the Appalachian region have among the highest rates of obesity,22 and obesity rates in the region have risen substantially in recent years.23 However, while data on long-term trends in breast cancer incidence in Appalachia as a whole are not available,12 comparison of incidence rates in Appalachian

722 Breast cancer mortality in Appalachia
areas of Kentucky, Pennsylvania, and West Virginia from 1994–1998 to 2002–2006 show no increase and in fact rates in these areas have declined in recent years.21,24
Recent compositional changes in the Appalachian population through migration could also conceivably have led to a greater prevalence of women with genetic markers that predispose them to breast cancer. Because nearly half of recent population growth in Appalachia is attributable to an influx of non-White people,25 however, the fact that the present study is limited to White women makes this possibility somewhat less salient.
Differences in the prevalence of breast cancer screeningResearchers noted that the lower breast cancer mortality rate observed previously in Appalachia could be due to more frequent detection of the disease at earlier stages through mammography screening.12 Although information about past trends in screen-
table 2. reSuLtS from muLtiVariate reGreSSion anaLYSeS moDeLinG reDuction in aGe-aDJuSteD WHite femaLe breaSt cancer DeatH rateS,a 1969–2007
model 1 model 2
Number of counties includedb 1008 1008Intercept 23.67* 18.99**Appalachian .65**Sub-regions Northern Appalachia North Central Appalachia Central Appalachia South Central Appalachia Southern Appalachia
.302.55*3.63*3.88***1.56*
Rural status .60 .56% White Poverty .12 .12% White 25 HS graduate or more .28*** .23***% Percent White in the Population .06*** .06***Number of physicians per 1,000 residents .94*** .99***R2 .2859 .3016Adjusted R2 .2816 .2946F statistics 66.79*** 43.05***
*p.05**p.01***p.001aMortality rates are expressed as deaths per 100,000 individuals per year, and the dependent vari-able is the difference in aggregate county-level mortality rates between 1969–1977 and 1999–2007.bThe N of 1008 represents the number of counties in the 13 Appalachian states with complete data for all variables in the model.
723Yao, Lengerich, and Hillemeier
ing prevalence in this region is incomplete, the traditionally low socioeconomic status characterizing the Appalachian region suggests that screening uptake patterns are not likely to have been optimal. Current data confirm that Appalachian women are less likely than others in the U.S. to receive mammography screening.21
Differential access to breast cancer treatmentSimilarly, it may be the case that recommended breast cancer treatment is not cur-rently reaching women in Appalachia at the same rate that it reaches other women in the U.S., leading to elevated mortality rates. In view of long-standing shortages of health care personnel and facilities as well as widespread economic disadvantage as discussed above,9 however, it seems unlikely that access to treatment was comparatively more optimal in previous decades. Clearly more research is needed to understand the mechanisms underlying the observed trends in breast cancer disparities.
The study findings suggest that heterogeneity exists in breast cancer mortality among states within the Appalachian region. Mortality rates for women from West Virginia and Appalachian Kentucky and Virginia have not decreased as fast as rates for women in non-Appalachian areas during 1990–2006. The geographic differences in trends in breast cancer mortality reduction may be a result of differential prevalence of risk factors for breast cancer incidence and mortality that may be amenable to policy intervention. One such spatially clustered risk factor is mountaintop coal mining and the subsequent environmental contamination of local air and water, which has been correlated with increased breast cancer mortality.26
This study was limited by several factors. First, it applied county-level designation of urban/rural status to cases and the population. This may have introduced ecological bias; however, this method has been used previously.7,27 Second, the urban/rural des-ignation changed over time. The rural-urban continuum coding scheme originated in 1974, and was updated in 1983, 1993, and 2003. While it is possible that the method of determining metro adjacency was not consistent across schemes, we used a consistent urban-rural cutoff point for all time periods.
The study also has several strengths. First, it is population-based and stratifies results by age and urban/rural status. Second, the study compares breast cancer mortality in Appalachia with neighboring non-Appalachian regions in the same states, thus control-ling for statewide effects such as insurance coverage or implementation of public health programs like the Breast and Cervical Cancer Early Detection Program. In addition, the analyses go beyond previous descriptive research (e.g., Hall et al.12) in taking potentially confounding factors into account in multivariate analyses.
In conclusion, this is the first study to report trends in breast cancer mortality among White women in Appalachia with data through 2007, and to compare those trends to those in non-Appalachian areas. Comparatives trend studies, particularly those that are stratified by important determinants, such as age and urban/rural residence, provide data to inform strategies to address emerging health disparities. Public health interventions could include enhanced breast cancer surveillance in Appalachia to monitor trends, testing and dissemination of community-based methods to increase screening among low-income women and women with limited access to health care, development of policies and regulations that reduce barriers to breast cancer screening and treatment,

724 Breast cancer mortality in Appalachia
and provision of services, such as patient navigation, that support guideline-concordant treatment of breast cancer.28 More broadly, interventions are needed that address key mechanisms underlying breast cancer incidence and mortality, such as structural and behavioral programs focused on obesity prevention, and social policies that improve education and increase access to high-quality health care in Appalachia.
notes 1. Jemal A, Siegel R, Xu J, et al. Cancer statistics, 2010. CA Cancer J Clin. 2010 Sep–Oct;
60(5):277–300. 2. Berry DA, Cronin KA, Plevritis SK, et al. Effect of screening and adjuvant therapy
on mortality from breast cancer. N Engl J Med. 2005 Oct 27;353(17):1784–92. 3. Zapka JG, Taplin SH, Solberg LI, et al. A framework for improving the quality of cancer
care: the case of breast and cervical cancer screening. Cancer Epidemiol Biomarkers Prev. 2003 Jan;12(1):4–13.
4. Peek ME, Han JH. Disparities in screening mammography. Current status, interven-tions and implications. J Gen Intern Med. 2004 Feb;19(2):184–94.
5. Stages C. ASCO announces new program designed to increase workforce diversity and reduce cancer care disparities. Journal of Oncology Practice. 2009 Nov;5(6):315–17.
6. Hall HI, Uhler RJ, Coughlin SS, et al. Breast and cervical cancer screening among Appalachian women. Cancer Epidemiol Biomarkers Prev. 2002 Jan;11(1):137–42.
7. Lengerich EJ, Wyatt SW, Rubio A, et al. The Appalachia Cancer Network: cancer control research among a rural, medically underserved population. J Rural Health. 2004 Spring;20(2):181–7.
8. Huang B, Dignan M, Han D, et al. Does distance matter? Distance to mammography facilities and stage at diagnosis of breast cancer in Kentucky. J Rural Health. 2009 Fall;25(4):366–31.
9. Halverson J, Lin M, Harner E. An analysis of disparities in health status and access to health care in the Appalachian region. Washington, DC: Appalachian Regional Commission, 2004.
10. National Cancer Institute. Center to reduce cancer health disparities. Washington, DC: Appalachia Community Cancer Network, 2010.
11. Behringer B, Friedell GH. Appalachia: where place matters in health. Prev Chronic Dis. 2006 Oct;3(4):A113. Epub 2006 Sep 15.
12. Hall HI, Rogers JD, Weir HK, et al. Breast and cervical carcinoma mortality among women in the Appalachian region of the U.S., 1976–1996. Cancer. 2000 Oct 1;89(7): 1593–602.
13. National Cancer Institute. Mortality—all COD, aggregated with county, total U.S. (1969–2007). Bethesda, MD: National Cancer Institute, 2007.
14. Sorlie PD, Rogot E, Johnson NJ. Validity of demographic characteristics on the death certificate. Epidemiology. 1992 Mar;3(2):181–4.
15. Kircher T, Nelson J, Burdo H. The autopsy as a measure of accuracy of the death certificate. N Engl J Med. 1985 Nov 14;313(20):1263–9.
16. Percy C, Stanek E 3rd, Gloeckler L. Accuracy of cancer death certificates and its effect on cancer mortality statistics. Am J Public Health. 1981 Mar;71(3):242–50.
17. Israel RA. Automation of mortality data coding and processing in the United States of America. World Health Stat Q. 1990;43(4):259–62.

725Yao, Lengerich, and Hillemeier
18. Ries L, Eisner M, Kosary C, et al. SEER cancer statistics review, 1975–2000. Bethesda, MD: National Cancer Institute, 2003.
19. U.S. Department of Agriculture. Rural-urban continuum codes. Washington, DC: U.S. Department of Agriculture, 2010.
20. U.S. Census Bureau. TIGER/Line® Shapefiles county and equivalent (Census 2000). Washington, DC: U.S. Census Bureau, 2009.
21. Appalachian Cancer Network. Addressing the cancer burden in Appalachian com-munities. Washington, DC: Appalachian Cancer Network, 2010.
22. Centers for Disease Control and Prevention. Estimated county-level prevalence of diabetes and obesity—United States, 2007. MNWR Morb Mortal Wkly Rep. 2009 Nov 20;58(45):1259–63.
23. Centers for Disease Control and Prevention. Vital signs: state-specific obesity preva-lence among adults—United States, 2009. MNWR Morb Mortal Wkly Rep. 2010 Aug 6;59(30):951–5.
24. Lengerich EJ, Tucker TC, Powell RK, et al. Cancer incidence in Kentucky, Pennsylvania, and West Virginia: disparities in Appalachia. J Rural Health. 2005 Winter;21(1):39–47.
25. Pollard K, Bureau PR. A “new diversity”: race and ethnicity in the Appalachian region. Washington, DC: Population Reference Bureau, 2004.
26. Hendryx M, Fedorko E, Anesetti-Rothermel A. A geographical information system-based analysis of cancer mortality and population exposure to coal mining activities in West Virginia, United States of America. Geospat Health. 2010 May;4(2):243–56.
27. Centers for Disease Control and Prevention. Cancer death rates—Appalachia 1994–1998. MNWR Morb Mortal Wkly Rep. 2002 Jun 21;51(24):527–9.
28. Fiscella K, Humiston S, Hendren S, et al. Eliminating disparities in cancer screening and follow-up of abnormal results: what will it take? J Health Care Poor Underserved. 2011 Feb;22(1):83–100.