breast cancer in ontario 1971-1996
TRANSCRIPT

Breast Cancer in Ontario1971-1996
October 2000
Anna M Chiarelli
Beth Theis
Eric Holowaty
Veronika Moravan
E Diane Nishri
Surveillance Unitand
The Ontario Breast Screening ProgramDivision of Preventive Oncology
Cancer Care Ontario
Preface/Highlights/Background

Cancer Care Ontario i
Breast Cancer in Ontario
Table of ContentsPreface ............................................................................................................................................. ii
Report Highlights .............................................................................................................................. iii
Background .......................................................................................................................................1
Introduction ..........................................................................................................................2
Anatomy...............................................................................................................................3
Pathology of invasive carcinoma of the breast .......................................................................3
Risk factors ..........................................................................................................................4
Prevention and early detection ..............................................................................................5
Signs and symptoms ..............................................................................................................7
Diagnosis and staging ............................................................................................................7
Treatment .............................................................................................................................8
Prognosis ..............................................................................................................................9
List of TablesTable 1. Probability of developing breast cancer by age, and lifetime ............................................2
probability of dying from breast cancer, in Canada (NCIC 2000)
Table 2. Proportion of Ontario women aged 50-69 having a screening ..........................................6mammogram within the last two years, reported by the NPHSand within the OBSP, by region, 1996-1997
Table 3. Comparison of stage distribution in OCR versus SEER ...................................................8
List of FiguresFigure 1. Anatomy of the female breast .........................................................................................3
Figure 2. Proportion of Canadian women aged 50-69 reporting a screening ....................................7mammogram within the last two years, National Population Health Survey(NPHS), 1996-1997
Figure 3. Five-year relative survival, by stage, for US SEER breast cancer cases, .........................91990-1991

Cancer Care Ontario ii
Breast Cancer in Ontario
PrefaceThis monograph presents information on incidence, mortality and survival for invasive breast cancerin Ontario females from 1971 to 1996. It was developed to provide comprehensive backgroundinformation for the Ontario Breast Screening Program (OBSP) and as a resource document forplanning.
The basis for the information in this monograph is the Ontario Cancer Registry (OCR). Both theOBSP and the OCR are operated by Cancer Care Ontario (CCO), through funding by the OntarioMinistry of Health and Long-Term Care. The OBSP and the OCR are situated within the ScreeningUnit and the Surveillance Unit, respectively, of the Division of Preventive Oncology, which is locatedat the Provincial Office of CCO in Toronto.
The authors would like to thank Drs. Frances O’Malley and Carol Sawka for contributing to theclinical sections in the background and to Mr. Gordon Fehringer for providing projected numbers forbreast cancer cases and deaths. We are also grateful to Dr. Richard Schabas, Head of the Division ofPreventive Oncology and Dr. Verna Mai, Director of the Screening Unit, for reviewing a draft of thisdocument.
This monograph could not have been produced without the valuable assistance of Mrs. Virginia Hunter(desktop publishing), and Ms. Vicky Majpruz-Moat and Ms. Sandrene Chin Cheong (technical supportand graphics). Finally, the authors would like to acknowledge the contribution of all the operationsstaff within the Surveillance Unit, and the Registry Support Group (within the Information SystemsDepartment), for their ongoing efforts in ensuring the generation of timely and high-quality cancerincidence data for Ontario.
Cancer Care Ontario iii
Breast Cancer in Ontario
Report Highlights• In the year 2000, breast cancer will be diagnosed in an estimated 7,200 Ontario women and
an estimated 2,000 women will die from the disease.
• In 1992-1996, breast cancer was the most common cancer site among women, representing29% of the total cancers, and ranked first for every age group. Breast cancer was also themost common cause of death during this time period, accounting for 19% of all cancer deaths.
• Breast cancer incidence varies dramatically around the world. Ontario’s incidence rate isamong the highest in the world.
• The incidence of breast cancer in Ontario has increased by 17% from 1971 to 1996. Thisincrease was highest for women over 50 years of age, particularly after 1986.
• Mortality rates increased slightly (4%) from 1971 to 1986. Between 1986 and 1996, breastcancer mortality decreased by 9%. This decline was greatest for women aged 40-49 and 50-69.The decline is most likely due both to screening and improved treatments.
• The five-year relative survival rate after diagnosis of breast cancer is 81%. The greatestimprovements in survival occurred during the 1980s. Relative survival was highest for womendiagnosed at ages 40-69 and lowest for women diagnosed at ages 20-39.

Cancer Care Ontario 1
Breast Cancer in Ontario
Background
Cancer Care Ontario 2
Breast Cancer in Ontario
Introduction
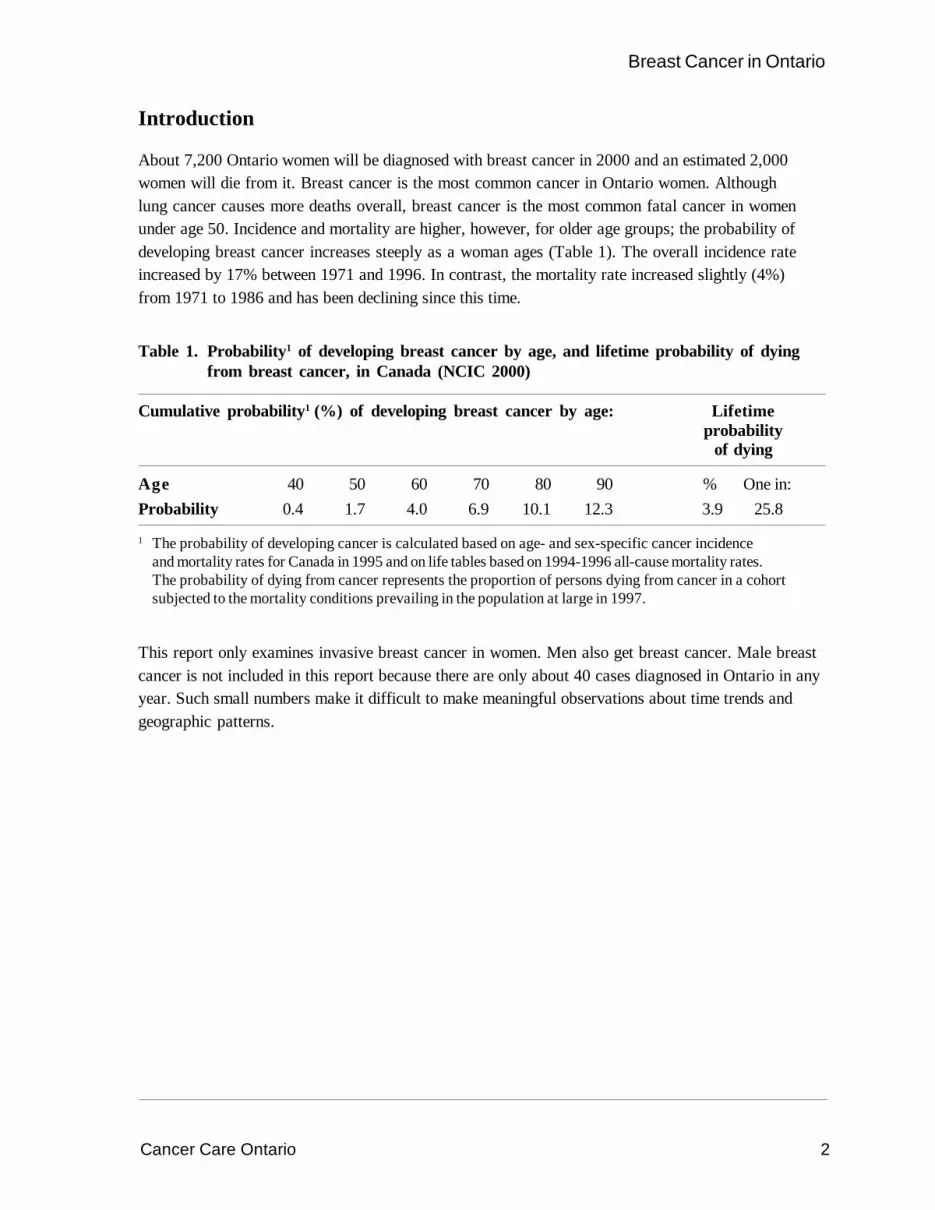
About 7,200 Ontario women will be diagnosed with breast cancer in 2000 and an estimated 2,000women will die from it. Breast cancer is the most common cancer in Ontario women. Althoughlung cancer causes more deaths overall, breast cancer is the most common fatal cancer in womenunder age 50. Incidence and mortality are higher, however, for older age groups; the probability ofdeveloping breast cancer increases steeply as a woman ages (Table 1). The overall incidence rateincreased by 17% between 1971 and 1996. In contrast, the mortality rate increased slightly (4%)from 1971 to 1986 and has been declining since this time.
Table 1. Probability1 of developing breast cancer by age, and lifetime probability of dyingfrom breast cancer, in Canada (NCIC 2000)
Cumulative probability1 (%) of developing breast cancer by age: Lifetimeprobability
of dying
Age 40 50 60 70 80 90 % One in:Probability 0.4 1.7 4.0 6.9 10.1 12.3 3.9 25.8
1 The probability of developing cancer is calculated based on age- and sex-specific cancer incidenceand mortality rates for Canada in 1995 and on life tables based on 1994-1996 all-cause mortality rates.The probability of dying from cancer represents the proportion of persons dying from cancer in a cohortsubjected to the mortality conditions prevailing in the population at large in 1997.
This report only examines invasive breast cancer in women. Men also get breast cancer. Male breastcancer is not included in this report because there are only about 40 cases diagnosed in Ontario in anyyear. Such small numbers make it difficult to make meaningful observations about time trends andgeographic patterns.

Cancer Care Ontario 3
Breast Cancer in Ontario
Anatomy
The female breast consists of three major components: glandular tissue, subcutaneous tissue and skin.The glandular tissue consists of breast parenchyma and stroma. The tip of the nipple contains openingsof collecting ducts through which the infant obtains milk. The ducts extend from the nipple to form abranching duct system that divides the breast into approximately 20 lobes (Figure 1). Each duct drainsa lobe and each lobe comprises 20-40 lobules. Lobules are formed by multiple blind ending branches ofthe terminal ducts.
Figure 1. Anatomy of the female breast
Pathology of invasive carcinoma of the breast
Invasive carcinoma of the breast is usually divided into tumours of no special morphologic type(infiltrating duct) and those of a special type. Infiltrating duct carcinoma comprises approximately 70%of breast cancers (Berg and Hutter 1995). These tumours can be stratified into prognostic groupsbased on histologic grading.
Other types of carcinoma comprise approximately 30% of all invasive breast cancers (Page et al.1987). These include lobular, mucinous, tubular, cribriform and medullary cancers. Tubular andcribriform cancers are generally associated with a more favourable prognosis than the other types.
Rib
DuctsNipple
Areola
Fat
Muscle
Lobes
Source: National Cancer Institute
Cancer Care Ontario 4
Breast Cancer in Ontario
Risk factors
Age is the most significant risk factor for breast cancer. The risk of a woman developing breastcancer increases rapidly with age (Bryant and Brasher 1994). Being born in North America orNorthern Europe is also an important risk factor for breast cancer. Risk is slightly higher for womenliving in urban areas and belonging to a higher socioeconomic class (Kelsey and Bernstein 1996).
Some reproductive characteristics influence the risk of breast cancer. Early age at menarche, late ageat menopause, late age at first full-term pregnancy and never having had children are all associatedwith modest elevations in risk (Kelsey et al. 1993). Removal of ovaries before age 40 reduces the riskby about one-half. Women currently using oral contraceptives (OC) are at a slightly increased risk ofdeveloping breast cancer, but there is no increased risk 10 years after stopping OC use (CollaborativeGroup on Hormonal Factors in Breast Cancer 1996). Hormone replacement therapy slightly increasesrisk and this risk increases with length of use (Collaborative Group on Hormonal Factors in BreastCancer 1997). This excess risk decreases after hormone replacement therapy is stopped and haslargely disappeared after five years. Recent data show that replacement therapy with both estrogenand progestin increases breast cancer risk beyond that associated with replacement with estrogenalone (Schairer et al. 2000).
A family history of breast cancer is an important risk factor (Pharoah et al. 1997). This risk isparticularly high if both the mother and a sister have been affected at a younger age (less than 50).Mutations in several identified genes account for some of this familial clustering. Mutations in theBRCA1 and BCRA2 genes are associated with an inherited susceptibility to breast cancer at an earlyage and are estimated to account for between 3% and 8% of all breast cancers (Brody and Biesecker1998).
Many studies have suggested causal roles for diet and alcohol consumption in breast cancer; theseremain unverified (Clavel-Chapelon et al. 1997; Longnecker 1994).
Postmenopausal obesity increases the risk of breast cancer. Obesity before the menopause, however,is protective (Hunter and Willett 1993; Ursin et al. 1995). Regular physical exercise probably reducesthe risk of breast cancer, in particular for premenopausal women who are lean and have beenpregnant (Friedenreich et al. 1998).
Moderate to high doses of ionizing radiation to the chest before age 40 increases breast cancer risk.Results from studies of other exogenous exposures are inconclusive. The most recent large studieshave found no evidence of an increased breast cancer risk associated with exposure to environmentalpollutants such as the pesticide DDE (chemically related to DDT) and PCBs (polychlorinatedbiphenyls) (Laden and Hunter 1998).
A number of breast conditions are considered predisposing or predictive factors. Benign proliferativebreast disease with atypical hyperplasia increases the risk of breast cancer three- to five-fold andrelative risks of around 2 have been found for proliferative disease without atypia (Kelsey andBernstein 1996). Women with ductal carcinoma in situ, lobular carcinoma in situ, or a history of cancerin one breast are at high risk. Women with high (>75%) mammographic density (the proportion ofconnective tissue and epithelial tissue as opposed to fat) have a risk three to four times that of womenwhose parenchyma is mostly fat (Oza and Boyd 1993).
Cancer Care Ontario 5
Breast Cancer in Ontario
Prevention and early detection
Most of the established risk factors for breast cancer are associated with only moderate elevations inrisk. Only a few are readily modifiable by either environmental or behavioural changes. Despite this,some primary prevention trials are underway or planned. Two randomized trials being conducted inNorth America will assess whether a low-fat diet reduces the incidence of breast cancer (Self et al.1988; Boyd et al. 1997). A small randomized trial in Los Angeles, California, is testing whether ahormonal contraceptive regimen designed to suppress ovarian function lowers breast cancer risk(Spicer et al. 1993).
Tamoxifen is being considered for the prevention of breast cancer because of its demonstrated effectin decreasing the risk of breast cancer recurrence. Results of three randomized controlled trials haverecently been published. Preliminary results of the National Surgical Adjuvant Breast and BowelProject (P-1) in the United States and Canada showed that tamoxifen use lowers the risk of breastcancer by 45% among users compared to women with the same risk factors who did not taketamoxifen (Fisher et al. 1998). Neither the British nor Italian trials have found any benefit fromtamoxifen (Powles et al. 1998; Veronesi et al. 1998).
Screening with regular mammograms can reduce breast cancer mortality in women aged 50-74.Randomized controlled trials show a mortality reduction of 26% (95% confidence interval 17% to34%) (Kerlikowske et al. 1995).
An organized breast cancer screening program was introduced in Ontario in 1990. The Ontario BreastScreening Program (OBSP) offers biennial screening to all women in the province 50 years of ageand older. The OBSP offers eligible women two-view mammography, clinical breast examination by aspecially trained nurse examiner, instruction in breast self-examination and client recall.
In 1996-97, 61.5% of women aged 50-69 reported having had a screening mammogram in the lasttwo years (Table 2). Only 11.6% of all Ontario women in that age group were screened withinthe OBSP. OBSP coverage was higher for some regions in the north such as Manitoulin Islandand Sudbury and Thunder Bay, Kenora and Rainy River. Expansion of the OBSP since 1998 hasincreased the proportion of women 50-69 having their screening mammograms within the OBSP to15.8% during 1998-1999. In 2000, OBSP will reach an estimated 21% of eligible women.

Cancer Care Ontario 6
Breast Cancer in Ontario
Table 2. Proportion of Ontario women aged 50-69 having a screening mammogramwithin the last two years, reported by the NPHS and within the OBSP,by region, 1996-1997
National Population Health Survey (NPHS) Region1 NPHS OBSP2
(%) (%)
Algoma, Cochrane 63.7 24.5Brant, Haldimand-Norfolk 50.3 3.4Bruce, Grey, Perth, Huron 58.2 12.1Durham 63.8 2.9Elgin, Middlesex, Oxford 57.4 20.4Essex 65.2 17.6Halton 57.4 3.6Hamilton-Wentworth 61.1 27.4Lambton, Kent 73.3 6.2Lanark, Leeds & Grenville, Hastings, 58.2 24.3 Prince Edward, Frontenac, Lennox & AddingtonManitoulin Island, Sudbury District, Sudbury Regional Municipality 66.3 43.1Niagara 61.4 1.6Northumberland, Victoria, Haliburton, Peterborough 67.3 6.7Ottawa-Carleton 62.3 22.7Peel 58.6 0.8Prescott & Russell, Stormont-Dundas & Glengarry, Renfrew 59.3 10.8Simcoe 58.3 1.5Thunder Bay, Kenora, Rainy River 65.1 30.0Timiskaming, Muskoka, Parry Sound, Nipissing 48.9 8.0Toronto 63.7 7.8Waterloo 56.1 6.6Wellington, Dufferin 64.2 7.3York 67.0 6.7All Ontario 61.5 11.6
1 Regions are agglomerations of census divisions2 Number of women aged 50-69 at screening who participated in OBSP as a proportion of all women
aged 50-69 in that region, using 1996 Ontario census data

Cancer Care Ontario 7
Breast Cancer in Ontario
The percentage of women reporting having had a screening mammogram in the last two years variesamong provinces (Figure 2). Ontario has the highest reported coverage.
Figure 2. Proportion of Canadian women aged 50-69 reporting a screening mammogramwithin the last two years, National Population Health Survey (NPHS), 1996-1997
British Columbia
Alberta
Saskatchewan
Manitoba
Ontario
Quebec
New Brunswick
Nova Scotia
Prince Edward Island
Newfoundland
0 10 20 30 40 50 60 70
Percent
Signs and symptoms
More and more breast cancers are now being detected by screening, before the development ofsymptoms. Symptomatic breast cancer is usually first noticed by the patient as a painless mass.A small proportion of patients report breast pain as the first symptom. Other less common symptomsinclude thickening, swelling, skin irritation or distortion in shape. Nipple symptoms, includingspontaneous discharge, erosion, inversion or tenderness, may also occur. Many of these symptomsare more commonly associated with non-malignant processes, including fibrocystic disease andintraductal papillomas (Ahearne et al. 1998). Malaise, bony pain and weight loss are unusual, butmay indicate metastatic disease.
Mammographic findings most predictive of malignancy include spiculated masses with associatedarchitectural distortion, clustered micro-calcifications in a linear or branching array, and/ormicro-calcifications within a mass (Ahearne et al. 1998). While breast cancer may also appearas a round “coin-like” lesion, this is much less common (Henderson 1995).
Diagnosis and staging
The diagnosis of breast cancer typically begins with physical examination, mammography and,sometimes, ultrasound. If appropriate, this is followed by fine-needle aspiration or needle-core biopsy.If the cytologic or histologic findings are not diagnostic, open surgical biopsy is usually undertaken fora definitive diagnosis.

Cancer Care Ontario 8
Breast Cancer in Ontario
Both breasts are assessed for other lesions, both palpable and non-palpable. Bilateral synchronouscancers may occur in up to 3% of all cases (Ahearne et al. 1998).
Treatment of breast cancer requires additional evaluation for the possibility of metastatic disease.A history and physical examination, chest x-ray and evaluation of serum liver enzymes are usuallyindicated. Additional scans and imaging are not usually warranted unless signs and symptoms aresuggestive of metastatic disease. Removal and pathologic examination of the axillary lymph nodes isstandard, as it provides accurate staging and prognostic information.
Typically, breast cancer is staged using guidelines from the International Union Against Cancer(UICC) and the American Joint Committee on Cancer (AJCC). Based on clinical and pathologicassessment of tumour size and extension, involvement of regional lymph nodes and the presence orabsence of distant metastases, this information is very important for subsequent treatment decisionsand for estimating prognosis.
While the OCR does not routinely collect stage information, past comparisons suggest that the stagedistribution reported by the Surveillance, Epidemiology and End Results (SEER) system in the US is areasonable approximation for Ontario, as shown in Table 3 (National Cancer Institute 1999; AmericanJoint Committee on Cancer 1988).
Table 3. Comparison of stage distribution1 in OCR2 versus SEER3
AJCC4 summary OCR cases (1988-1991) SEER cases (1988-1991) SEER (1996)stage n=150 n=52,324 n=14,337
(%) (%) (%)
Stage I 39.1 40.9 46.6Stage II 38.5 38.7 35.0Stage III 8.6 6.1 6.8Stage IV 10.1 5.1 4.5
Unknown 3.6 9.3 7.1
1 Cases are restricted to malignant breast cancer, as the first or only primary. OCR cases were derived from arecent Ontario-wide validation study
2 Ontario Cancer Registry3 Surveillance, Epidemiology and End Results (US)4 American Joint Committee on Cancer
Treatment
Breast cancer can be treated with surgery, radiation, chemotherapy or hormonal therapy. Treatmentusually incorporates a combination of modalities, depending on the stage and type of cancer and thepatient’s age and preferences. Canadian guidelines for the treatment of breast cancer are published inappropriate formats for women and for the professionals caring for them (The Steering Committee onClinical Practice Guidelines for the Care and Treatment of Breast Cancer 1998). Breast cancermanagement guidelines developed by Cancer Care Ontario are available to professionals and thepublic through CCO’s website at www.cancercare.on.ca.

Cancer Care Ontario 9
Breast Cancer in Ontario
Surgery is the primary treatment for breast cancer. This can be either a partial mastectomy (removingthe tumour and a small margin of surrounding normal tissue) or a modified radical mastectomy(removing the entire breast). Long-term survival is similar after both types of surgery and there is someevidence of superior quality of life with partial mastectomy. In 1995-1996, approximately 62% of allOntario women having surgery for breast cancer had partial mastectomies (sometimes calledsegmental mastectomy, lumpectomy, wide excision, tylectomy, quadrantectomy or breast conservingsurgery). There is considerable geographic variation in breast conserving surgery rates, not only inOntario, but also in the US and Europe (Iscoe et al. 1994).
Systemic treatment with chemotherapy or tamoxifen has similar effects on recurrence and survivalrates for both axillary node-negative and node-positive breast cancer. Tamoxifen is most effective inpostmenopausal women, and chemotherapy in premenopausal women. Systemic treatment is usuallyrecommended for women with node-positive disease because they have a high risk of recurrence,75-80% over a 10-year period.
Radiation therapy markedly reduces the risk of local recurrence when it is used as an adjuvant afterbreast conserving surgery. This radiation therapy requires daily outpatient treatments over five to sixweeks. Radiation therapy is also useful for palliation in advanced cases of breast cancer, controllingsymptoms associated with metastases.
Prognosis
Prognosis is closely related to stage of breast cancer at diagnosis. The US SEER system providesreasonable approximations of survival estimates following breast cancer in Ontario. Figure 3 shows thefive-year relative survival rate by stage for cases diagnosed 1990-1991 (National Cancer Institute 1999).
Figure 3. Five-year relative survival, by stage, for US SEER1 breast cancer cases, 1990-1991
I II III IV0
10
20
30
40
50
60
70
80
90
100
Stage1 Surveillance, Epidemiology and End Results (US)
Rel
ativ
e su
rviv
al (%
)

Breast Cancer in Ontario1971-1996
October 2000
Anna M Chiarelli
Beth Theis
Eric Holowaty
Veronika Moravan
E Diane Nishri
Surveillance Unitand
The Ontario Breast Screening ProgramDivision of Preventive Oncology
Cancer Care Ontario
Incidence and Mortality

Cancer Care Ontario i
Breast Cancer in Ontario
Table of ContentsMost common cancers and cancer causes of death ...........................................................................1
Numbers of new cases and deaths ....................................................................................................2
Trends in incidence and mortality .......................................................................................................3
Numbers of new cases and deaths, by age ........................................................................................4
Age-specific incidence and mortality .................................................................................................5
Trends in incidence, by age group ......................................................................................................6
Trends in mortality, by age group .......................................................................................................7
List of TablesTable 4. Most common cancers diagnosed and cancer causes of death ........................................1
in Ontario females, 1992-1996
Table 5. Ranking of breast cancer cases and deaths relative to other cancers ...............................1in Ontario women, by age group, 1992-1996
Table 6. Annual percentage change (APC) for breast cancer incidence in Ontario, ......................6by age group, 1971 -1996
Table 7. Annual percentage change (APC) for breast cancer mortality in Ontario, .......................7by age group, 1971-1996
List of FiguresFigure 4. Numbers of new cases of and deaths from breast cancer in Ontario, by year, .................2
1971-1996, and projected to 2000
Figure 5. Age-standardized incidence and mortality rates (3-year moving averages) for .................3breast cancer in Ontario, by year, 1971-1996
Figure 6. Numbers of new cases of and deaths from breast cancer in Ontario, by age group, .........41992-1996
Figure 7. Age-specific incidence and mortality rates for breast cancer in Ontario, ..........................51992-1996
Figure 8. Age-standardized incidence rates (3-year moving averages) for breast cancer ................6in Ontario, by age group, 1971-1996
Figure 9. Age-standardized mortality rates (3-year moving averages) for breast cancer .................7in Ontario, by age group, 1971-1996
Cancer Care Ontario 1
Breast Cancer in Ontario
Most common cancers and cancer causes of death
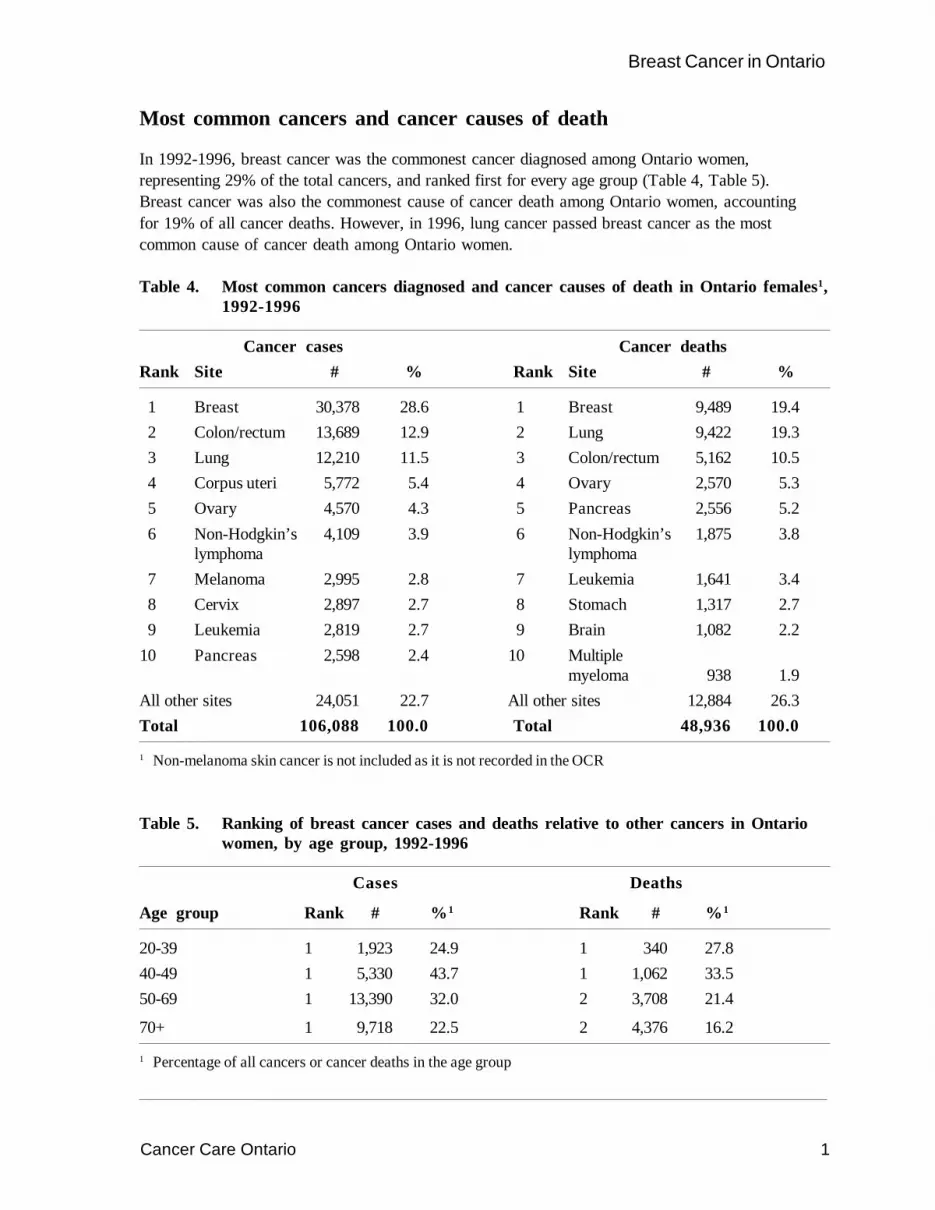
In 1992-1996, breast cancer was the commonest cancer diagnosed among Ontario women,representing 29% of the total cancers, and ranked first for every age group (Table 4, Table 5).Breast cancer was also the commonest cause of cancer death among Ontario women, accountingfor 19% of all cancer deaths. However, in 1996, lung cancer passed breast cancer as the mostcommon cause of cancer death among Ontario women.
Table 4. Most common cancers diagnosed and cancer causes of death in Ontario females1,1992-1996
Cancer cases Cancer deathsRank Site # % Rank Site # %
1 Breast 30,378 28.6 1 Breast 9,489 19.42 Colon/rectum 13,689 12.9 2 Lung 9,422 19.33 Lung 12,210 11.5 3 Colon/rectum 5,162 10.54 Corpus uteri 5,772 5.4 4 Ovary 2,570 5.35 Ovary 4,570 4.3 5 Pancreas 2,556 5.26 Non-Hodgkin’s 4,109 3.9 6 Non-Hodgkin’s 1,875 3.8
lymphoma lymphoma7 Melanoma 2,995 2.8 7 Leukemia 1,641 3.48 Cervix 2,897 2.7 8 Stomach 1,317 2.79 Leukemia 2,819 2.7 9 Brain 1,082 2.2
10 Pancreas 2,598 2.4 10 Multiplemyeloma 938 1.9
All other sites 24,051 22.7 All other sites 12,884 26.3Total 106,088 100.0 Total 48,936 100.0
1 Non-melanoma skin cancer is not included as it is not recorded in the OCR
Table 5. Ranking of breast cancer cases and deaths relative to other cancers in Ontariowomen, by age group, 1992-1996
Cases Deaths
Age group Rank # %1 Rank # %1
20-39 1 1,923 24.9 1 340 27.840-49 1 5,330 43.7 1 1,062 33.550-69 1 13,390 32.0 2 3,708 21.4
70+ 1 9,718 22.5 2 4,376 16.2
1 Percentage of all cancers or cancer deaths in the age group

Cancer Care Ontario 2
Breast Cancer in Ontario
Numbers of new cases and deaths
In the year 2000, approximately 7,200 women in Ontario will be diagnosed with breast cancer.The number of new cases of breast cancer diagnosed annually in Ontario increased by about 3,000or 113% between 1971 and 1996 (Figure 4). This increase is mainly due to population growth andpopulation aging, rather than an increase in the underlying risk.
In the year 2000 approximately 2,000 Ontario women will die from breast cancer. The number ofbreast cancer deaths per year also increased over this time period (1971 to 1996) by about 900 casesor about 88%. The number of deaths per year has increased more slowly than the number of newcases. This reflects the steady improvements in survival seen over this time period.
Figure 4. Numbers of new cases of and deaths from breast cancer in Ontario, by year,1971-1996, and projected to 2000
1971 1976 1981 1986 1991 19960
1000
2000
3000
4000
5000
6000
7000
8000
Year of diagnosis/death
Cases
Deaths
- - - - - Projected number
Num
ber o
f new
cas
es/d
eath
s

Cancer Care Ontario 3
Breast Cancer in Ontario
Trends in incidence and mortality
Age-standardized incidence rates for breast cancer increased slowly but steadily from 1971 to 1996by about 15 per 100,000 or 17% (Figure 5). (Rates are age standardized to the 1991 Canadianpopulation, Appendix A.) This increase may be due, in part, to the rising number of screeningmammograms since the mid-1980s and may also be affected by reproductive histories (NationalCancer Institute of Canada 2000).
In contrast, age-standardized mortality rates have increased only slightly from 1971 to 1986(4% increase). Since 1986, mortality has been declining. Between 1986 and 1996 breast cancermortality in Ontario decreased by about 3 per 100,000 or 9%. This decrease may be due both toimprovements in treatment and to the early detection of breast cancers by screening.
Figure 5. Age-standardized incidence and mortality rates (3-year moving averages) for breast cancer in Ontario, by year, 1971-1996
1971 1976 1981 1986 1991 19960
20
40
60
80
100
120
Year of diagnosis/death
Incidence
Mortality
Age
-sta
ndar
dize
d ra
te p
er 1
00,0
00
Cancer Care Ontario 4
Breast Cancer in Ontario
Numbers of new cases and deaths, by age
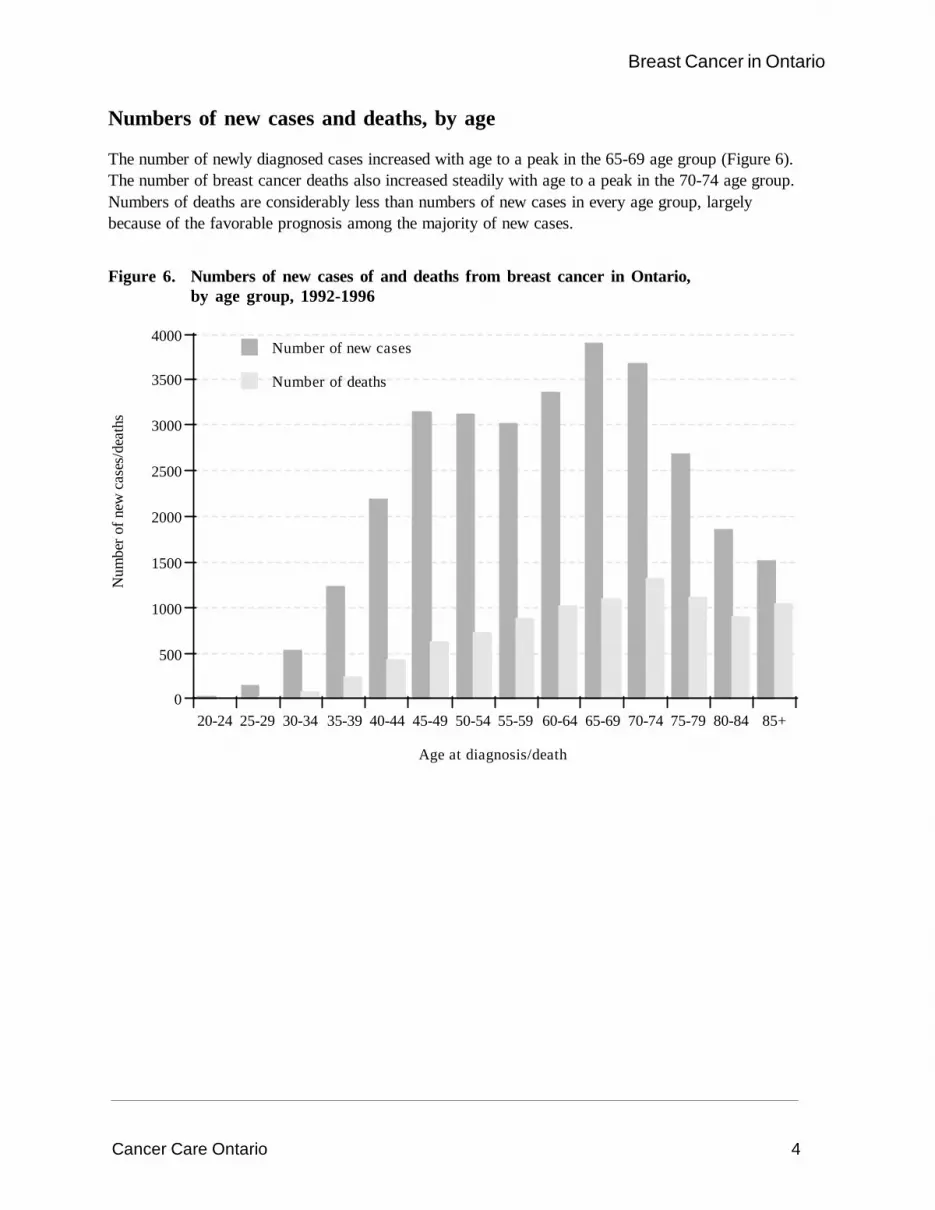
The number of newly diagnosed cases increased with age to a peak in the 65-69 age group (Figure 6).The number of breast cancer deaths also increased steadily with age to a peak in the 70-74 age group.Numbers of deaths are considerably less than numbers of new cases in every age group, largelybecause of the favorable prognosis among the majority of new cases.
Figure 6. Numbers of new cases of and deaths from breast cancer in Ontario,by age group, 1992-1996
20-24 25-29 30-34 35-39 40-44 45-49 50-54 55-59 60-64 65-69 70-74 75-79 80-84 85+0
500
1000
1500
2000
2500
3000
3500
4000
Age at diagnosis/death
Number of new cases
Number of deaths
Num
ber o
f new
cas
es/d
eath
s

Cancer Care Ontario 5
Breast Cancer in Ontario
Age-specific incidence and mortality
Breast cancer is very uncommon in women aged less than 30 years and then increases steadily to apeak in the 75-79 age group (Figure 7). Deaths from breast cancer are very uncommon in womenaged less than 35 years, but then increase steadily from that age.
Figure 7. Age-specific incidence and mortality rates for breast cancer in Ontario,1992-1996
20-24 25-29 30-34 35-39 40-44 45-49 50-54 55-59 60-64 65-69 70-74 75-79 80-84 85+0
50
100
150
200
250
300
350
400
Age at diagnosis/death
Incidence
Mortality
Age
-spe
cific
rate
per
100
,000

Cancer Care Ontario 6
Breast Cancer in Ontario
Trends in incidence, by age group
For younger women (20-49) incidence rates decreased during the earlier part of the time period(1971-1981) and increased slightly for the later part of the time period (Figure 8, Table 6). Thisincrease may be explained by changes in reproductive histories. For women over 50 years of ageincidence rates have increased over the time period, particularly after 1986. This pattern is consistentwith the increased use of mammography as a screening test in Canada around this time (NationalCancer Institute of Canada 2000).
Figure 8. Age-standardized incidence rates (3-year moving averages) for breast cancerin Ontario, by age group, 1971-1996
1971 1976 1981 1986 1991 19960
50
100
150
200
250
300
350
400
Year of diagnosis
20-39
70+
40-49
50-69
Table 6. Annual percentage change (APC) for breast cancer incidence in Ontario,by age group, 1971-1996
Age group Period APC (%)
20-39 1971-1977 -2.21978-1996 0.7
40-49 1971-1981 -1.21982-1996 0.6
50-69 1971-1996 1.470+ 1971-1996 0.9
Age
-sta
ndar
dize
d ra
te p
er 1
00,0
00

Cancer Care Ontario 7
Breast Cancer in Ontario
Trends in mortality, by age group
Breast cancer mortality rates have been declining for women aged 40-49 since 1971 (Figure 9,Table 7). Mortality rates have been decreasing for women 50-69 since 1989. It is likely that bothscreening and improved treatments have contributed to this decline. Mortality rates are stable inwomen under age 40 and are increasing steadily in women age 70 and older.
Figure 9. Age-standardized mortality rates (3-year moving averages) for breast cancerin Ontario, by age group, 1971-1996
1971 1976 1981 1986 1991 19960
20
40
60
80
100
120
140
160
180
Year of death
20-39
40-49
50-69
70+
Table 7. Annual percentage change (APC) for breast cancer mortality in Ontario,by age group, 1971-1996
Age group Period APC (%)
20-39 1971-1996 0.040-49 1971-1996 -1.550-69 1971-1988 0.4
1989-1996 -2.770+ 1971-1996 0.9
Age
-sta
ndar
dize
d ra
te p
er 1
00,0
00

Breast Cancer in Ontario1971-1996
October 2000
Anna M Chiarelli
Beth Theis
Eric Holowaty
Veronika Moravan
E Diane Nishri
Surveillance Unitand
The Ontario Breast Screening ProgramDivision of Preventive Oncology
Cancer Care Ontario
Geographic Patterns

Cancer Care Ontario i
Breast Cancer in Ontario
Table of ContentsInternational comparisons ..................................................................................................................1
Interprovincial comparisons ...............................................................................................................2
Ontario comparisons ..........................................................................................................................3
List of TablesTable 8. Age-standardized incidence and mortality rates (per 100,000), rate ratios (RR) ...............3
and 95% confidence intervals (CI) for breast cancer, by CCOR, 1992-1996
Table 9. Age-standardized incidence rates (per 100,000), rate ratios (RR) and 95% ......................4confidence intervals (CI) for breast cancer, by Public Health Unit, 1992-1996
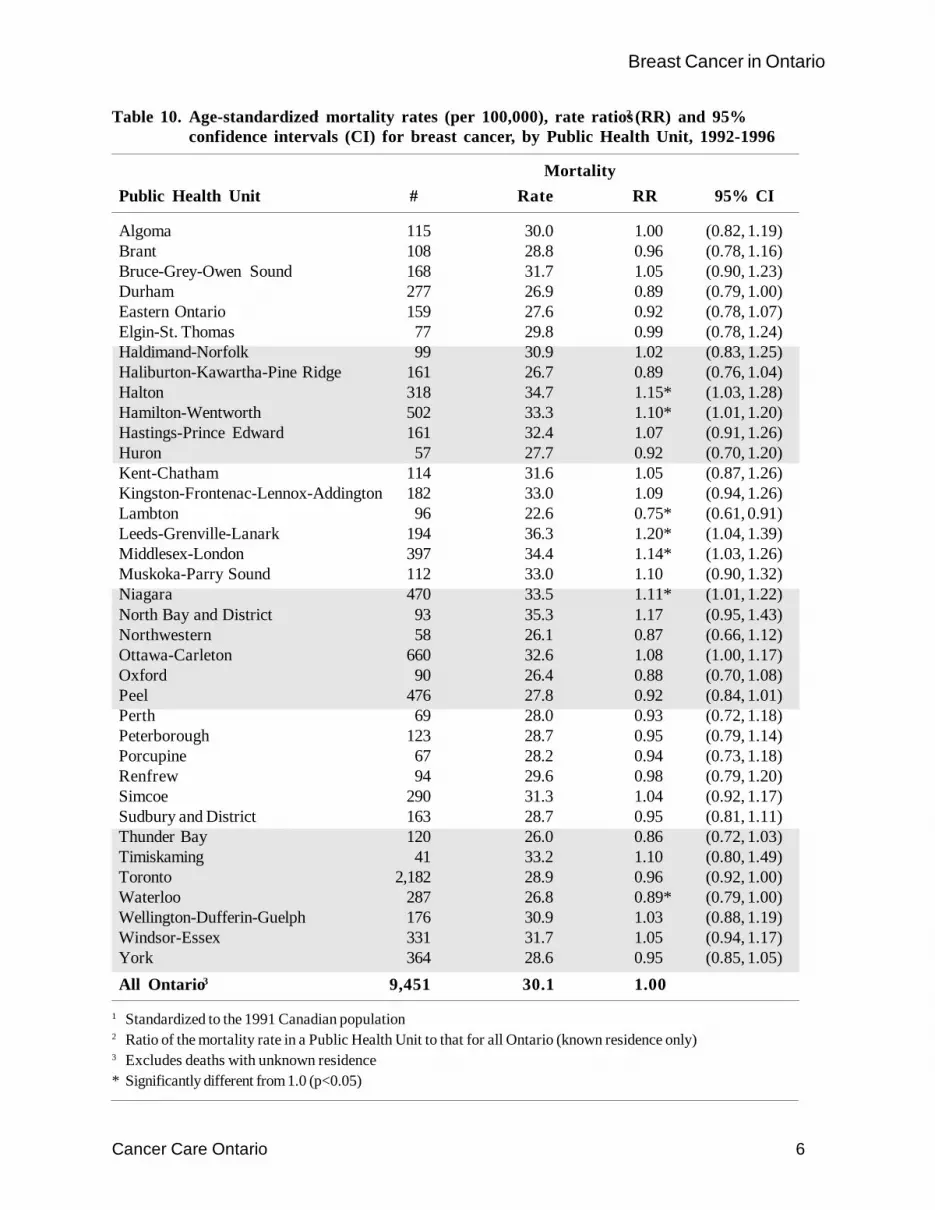
Table 10. Age-standardized mortality rates (per 100,000), rate ratios (RR) and 95% .......................6confidence intervals (CI) for breast cancer, by Public Health Unit, 1992-1996
List of FiguresFigure 10. Age-standardized incidence rates for breast cancer, by country/region, 1988-1992 ..........1
Figure 11. Age-standardized incidence and mortality rates for breast cancer ...................................2in Canada, 1991-1995
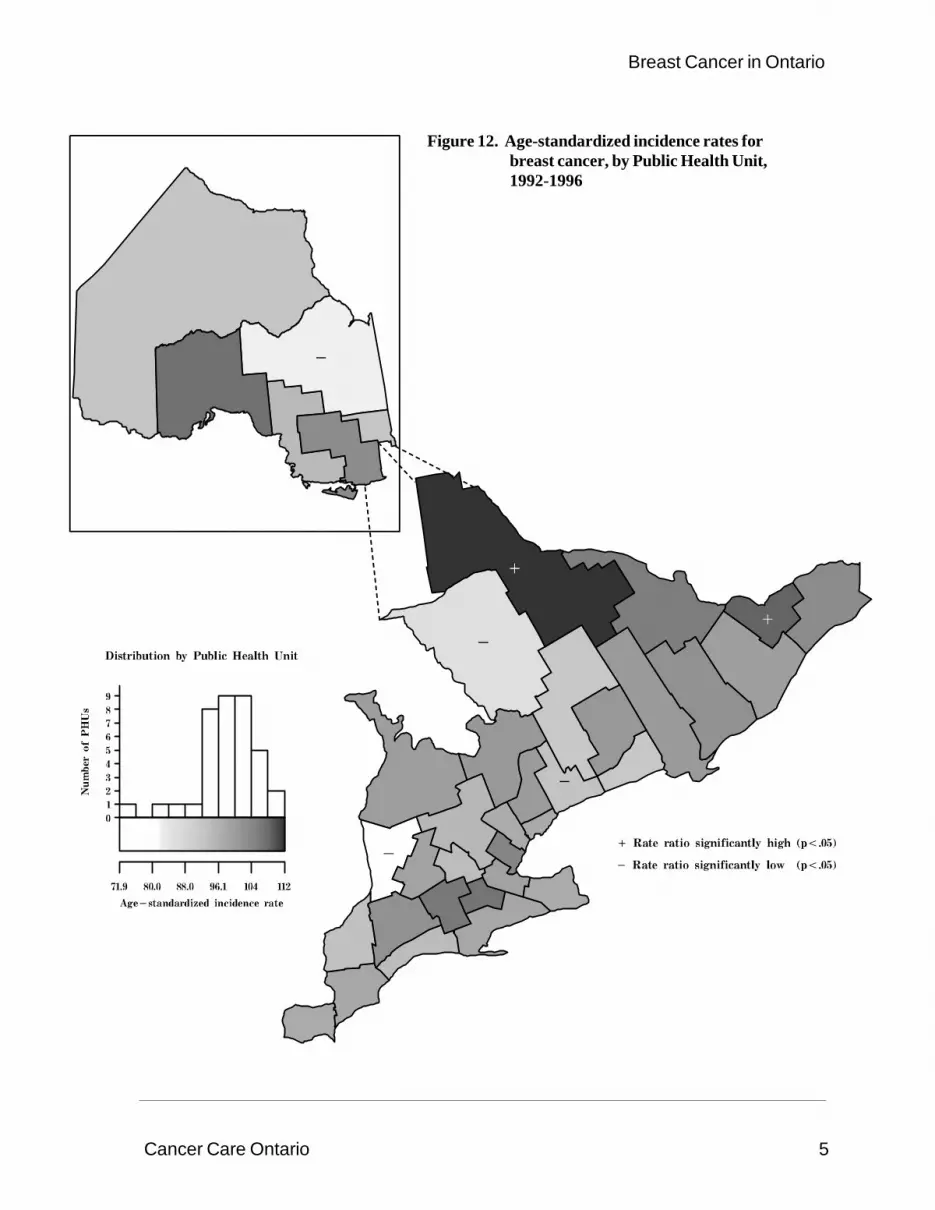
Figure 12. Age-standardized incidence rates for breast cancer, by Public Health Unit, .....................51992-1996
Figure 13. Age-standardized mortality rates for breast cancer, by Public Health Unit, ......................71992-1996
Cancer Care Ontario 1
Breast Cancer in Ontario
International comparisons
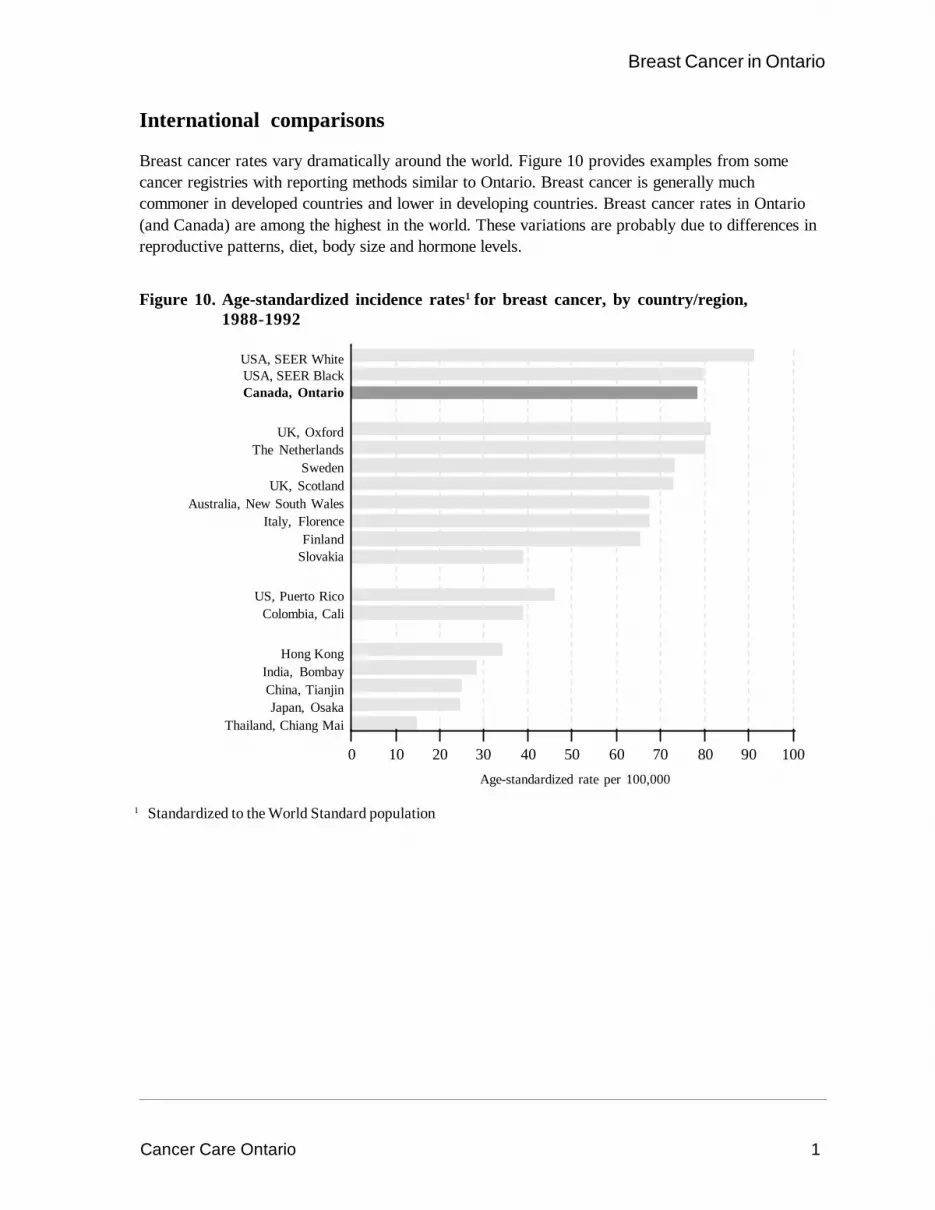
Breast cancer rates vary dramatically around the world. Figure 10 provides examples from somecancer registries with reporting methods similar to Ontario. Breast cancer is generally muchcommoner in developed countries and lower in developing countries. Breast cancer rates in Ontario(and Canada) are among the highest in the world. These variations are probably due to differences inreproductive patterns, diet, body size and hormone levels.
Figure 10. Age-standardized incidence rates1 for breast cancer, by country/region,1988-1992
1 Standardized to the World Standard population
Age-standardized rate per 100,000
0 10 20 30 40 50 60 70 80 90 100
USA, SEER WhiteUSA, SEER BlackCanada, Ontario
UK, OxfordThe Netherlands
SwedenUK, Scotland
Australia, New South WalesItaly, Florence
FinlandSlovakia
US, Puerto RicoColombia, Cali
Hong KongIndia, BombayChina, TianjinJapan, Osaka
Thailand, Chiang Mai
Cancer Care Ontario 2
Breast Cancer in Ontario
Interprovincial comparisons
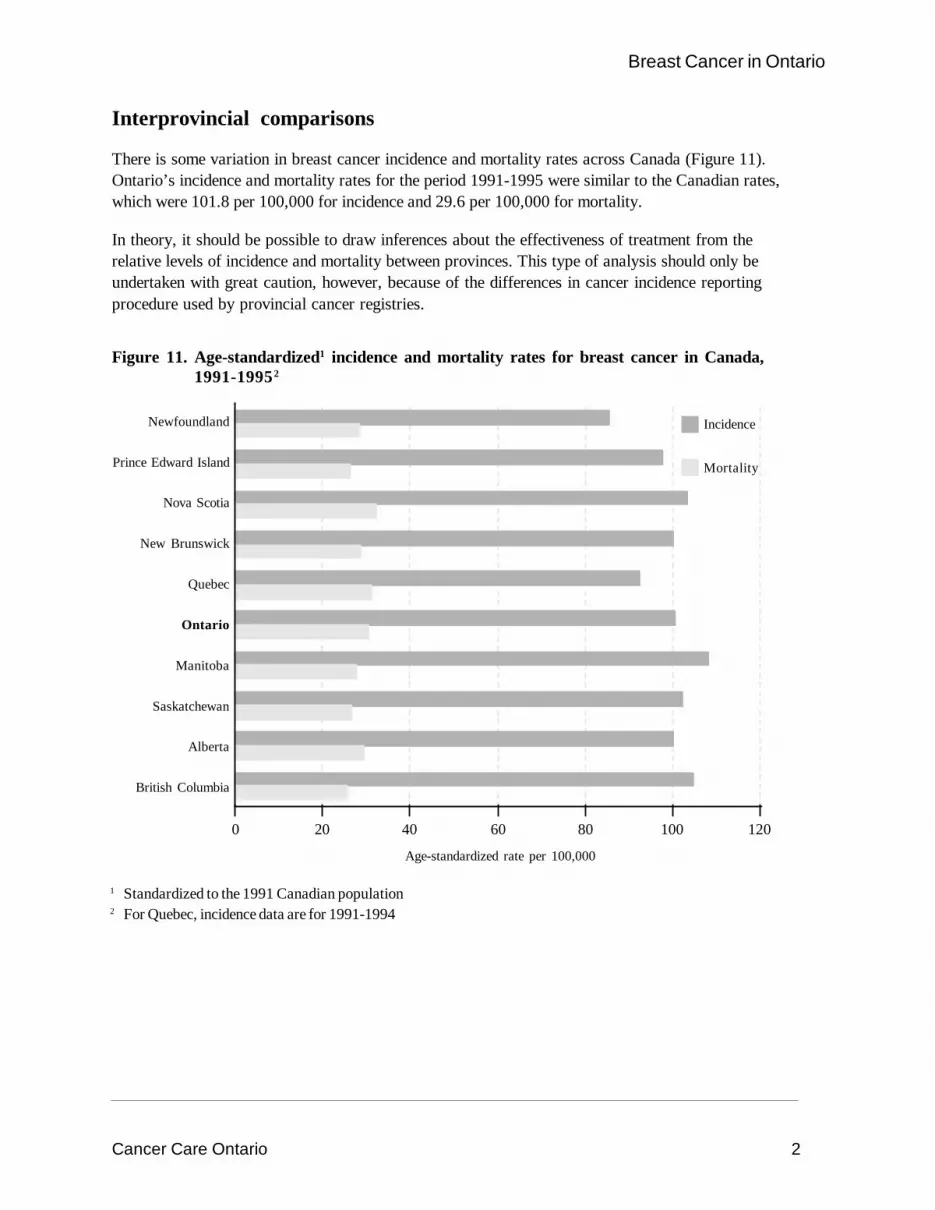
There is some variation in breast cancer incidence and mortality rates across Canada (Figure 11).Ontario’s incidence and mortality rates for the period 1991-1995 were similar to the Canadian rates,which were 101.8 per 100,000 for incidence and 29.6 per 100,000 for mortality.
In theory, it should be possible to draw inferences about the effectiveness of treatment from therelative levels of incidence and mortality between provinces. This type of analysis should only beundertaken with great caution, however, because of the differences in cancer incidence reportingprocedure used by provincial cancer registries.
Figure 11. Age-standardized1 incidence and mortality rates for breast cancer in Canada,1991-19952
1 Standardized to the 1991 Canadian population2 For Quebec, incidence data are for 1991-1994
Newfoundland
Prince Edward Island
Nova Scotia
New Brunswick
Quebec
Ontario
Manitoba
Saskatchewan
Alberta
British Columbia
Age-standardized rate per 100,000
0 20 40 60 80 100 120
Incidence
Mortality

Cancer Care Ontario 3
Breast Cancer in Ontario
Ontario comparisons
Age-standardized incidence rates for 1992-1996 ranged from 97.6 and 97.7 per 100,000 in theSouthwest and South Cancer Care Ontario Regions (CCORs), respectively, to 106.7 in the EasternCCOR, only a 9% difference (Table 8). (Definitions of the CCORs are found in Appendix B.)Mortality showed a broader range, with the highest rate in the Central West CCOR, at 32.3 per100,000 and the lowest mortality rate in the Northwest CCOR, at 26.0 per 100,000.
Table 9 and Figure 12 present the age-standardized incidence rates for Ontario’s 37 Public HealthUnits (PHUs) for the time period 1992-1996. (Definitions of the PHUs are found in Appendix C.)Incidence rates ranged from a high of 112.2 per 100,000 in North Bay and District to a low of 71.9 inHuron, a 56% difference.
Table 10 and Figure 13 present age-standardized mortality rates by PHU for 1992-1996. Rates rangedfrom a high of 36.3 per 100,000 in Leeds-Granville-Lanark to a low of 22.6 per 100,000 in Lambton.
Drawing conclusions about differences in incidence and mortality patterns must be done with caution.Survival rates for breast cancer are high compared with other cancers; this increases the possibilitythat women may reside in a different area at their time of death than when they are diagnosed.
Table 8. Age-standardized1 incidence and mortality rates (per 100,000), rate ratios2 (RR)and 95% confidence intervals (CI) for breast cancer, by CCOR, 1992-1996
Incidence Mortality
CCOR # Rate RR 95% CI # Rate RR 95% CI
Eastern 3,196 106.7 1.07* (1.04, 1.11) 983 31.4 1.04 (0.98, 1.11)Southeast 2,015 101.2 1.02 (0.98, 1.07) 665 31.7 1.05 (0.97, 1.14)Central East 13,409 97.9 0.99 (0.97, 1.00) 4,053 29.2 0.97* (0.94, 1.00)Central West 3,921 98.9 1.00 (0.97, 1.03) 1,355 32.3 1.07* (1.02, 1.13)Southwest 4,226 97.6 0.98 (0.95, 1.01) 1,355 29.5 0.98 (0.93, 1.03)South 984 97.7 0.98 (0.92, 1.05) 331 31.7 1.05 (0.94, 1.17)Northeast 1,663 97.9 0.99 (0.94, 1.03) 531 30.7 1.02 (0.93, 1.11)Northwest 683 102.5 1.03 (0.96, 1.11) 178 26.0 0.86* (0.74, 1.00)All Ontario3 30,097 99.3 1.00 9,451 30.1 1.00
1 Standardized to the 1991 Canadian population2 Ratio of the incidence or mortality rate in a CCOR to that for all Ontario (known residence only)3 Excludes cases and deaths with unknown residence* Significantly different from 1.0 (p<0.05)

Cancer Care Ontario 4
Breast Cancer in Ontario
Table 9. Age-standardized1 incidence rates (per 100,000), rate ratios2 (RR) and 95%confidence intervals (CI) for breast cancer, by Public Health Unit, 1992-1996
IncidencePublic Health Unit # Rate RR 95% CI
Algoma 358 94.5 0.95 (0.86, 1.05)Brant 374 107.5 1.08 (0.98, 1.20)Bruce-Grey-Owen Sound 506 100.2 1.01 (0.92, 1.10)Durham 983 93.0 0.94* (0.88, 1.00)Eastern Ontario 556 103.7 1.04 (0.96, 1.13)Elgin-St. Thomas 223 94.1 0.95 (0.83, 1.08)Haldimand-Norfolk 300 98.5 0.99 (0.88, 1.11)Haliburton-Kawartha-Pine Ridge 509 91.5 0.92 (0.84, 1.01)Halton 970 104.7 1.05 (0.99, 1.12)Hamilton-Wentworth 1,402 99.2 1.00 (0.95, 1.05)Hastings-Prince Edward 474 100.1 1.01 (0.92, 1.10)Huron 144 71.9 0.72* (0.61, 0.85)Kent-Chatham 330 98.3 0.99 (0.89, 1.10)Kingston-Frontenac-Lennox-Addington 536 102.7 1.03 (0.95, 1.13)Lambton 368 93.4 0.94 (0.85, 1.04)Leeds-Grenville-Lanark 496 100.0 1.01 (0.92, 1.10)Middlesex-London 1,141 102.6 1.03 (0.97, 1.10)Muskoka-Parry Sound 266 85.5 0.86* (0.76, 0.97)Niagara 1,305 97.7 0.98 (0.93, 1.04)North Bay and District 286 112.2 1.13* (1.00, 1.27)Northwestern 201 92.2 0.93 (0.81, 1.07)Ottawa-Carleton 2,160 109.0 1.10* (1.05, 1.15)Oxford 311 106.7 1.07 (0.96, 1.20)Peel 1,775 97.3 0.98 (0.93, 1.03)Perth 225 99.1 1.00 (0.87, 1.14)Peterborough 427 101.4 1.02 (0.92, 1.12)Porcupine 194 81.8 0.82* (0.71, 0.95)Renfrew 311 106.0 1.07 (0.95, 1.19)Simcoe 917 101.2 1.02 (0.95, 1.09)Sudbury and District 586 103.8 1.04 (0.96, 1.13)Thunder Bay 482 107.7 1.08 (0.99, 1.19)Timiskaming 112 92.1 0.93 (0.76, 1.12)Toronto 7,002 97.5 0.98 (0.96, 1.01)Waterloo 978 94.2 0.95 (0.89, 1.01)Wellington-Dufferin-Guelph 540 95.2 0.96 (0.88, 1.04)Windsor-Essex 984 97.7 0.98 (0.92, 1.05)York 1,365 100.6 1.01 (0.96, 1.07)All Ontario3 30,097 99.3 1.00
1 Standardized to the 1991 Canadian population2 Ratio of the incidence rate in a Public Health Unit to that for all Ontario (known residence only)3 Excludes cases with unknown residence* Significantly different from 1.0 (p<0.05)
Cancer Care Ontario 5
Breast Cancer in Ontario
Figure 12. Age-standardized incidence rates forbreast cancer, by Public Health Unit,1992-1996
Cancer Care Ontario 6
Breast Cancer in Ontario
Table 10. Age-standardized1 mortality rates (per 100,000), rate ratios2 (RR) and 95%confidence intervals (CI) for breast cancer, by Public Health Unit, 1992-1996
MortalityPublic Health Unit # Rate RR 95% CI
Algoma 115 30.0 1.00 (0.82, 1.19)Brant 108 28.8 0.96 (0.78, 1.16)Bruce-Grey-Owen Sound 168 31.7 1.05 (0.90, 1.23)Durham 277 26.9 0.89 (0.79, 1.00)Eastern Ontario 159 27.6 0.92 (0.78, 1.07)Elgin-St. Thomas 77 29.8 0.99 (0.78, 1.24)Haldimand-Norfolk 99 30.9 1.02 (0.83, 1.25)Haliburton-Kawartha-Pine Ridge 161 26.7 0.89 (0.76, 1.04)Halton 318 34.7 1.15* (1.03, 1.28)Hamilton-Wentworth 502 33.3 1.10* (1.01, 1.20)Hastings-Prince Edward 161 32.4 1.07 (0.91, 1.26)Huron 57 27.7 0.92 (0.70, 1.20)Kent-Chatham 114 31.6 1.05 (0.87, 1.26)Kingston-Frontenac-Lennox-Addington 182 33.0 1.09 (0.94, 1.26)Lambton 96 22.6 0.75* (0.61, 0.91)Leeds-Grenville-Lanark 194 36.3 1.20* (1.04, 1.39)Middlesex-London 397 34.4 1.14* (1.03, 1.26)Muskoka-Parry Sound 112 33.0 1.10 (0.90, 1.32)Niagara 470 33.5 1.11* (1.01, 1.22)North Bay and District 93 35.3 1.17 (0.95, 1.43)Northwestern 58 26.1 0.87 (0.66, 1.12)Ottawa-Carleton 660 32.6 1.08 (1.00, 1.17)Oxford 90 26.4 0.88 (0.70, 1.08)Peel 476 27.8 0.92 (0.84, 1.01)Perth 69 28.0 0.93 (0.72, 1.18)Peterborough 123 28.7 0.95 (0.79, 1.14)Porcupine 67 28.2 0.94 (0.73, 1.18)Renfrew 94 29.6 0.98 (0.79, 1.20)Simcoe 290 31.3 1.04 (0.92, 1.17)Sudbury and District 163 28.7 0.95 (0.81, 1.11)Thunder Bay 120 26.0 0.86 (0.72, 1.03)Timiskaming 41 33.2 1.10 (0.80, 1.49)Toronto 2,182 28.9 0.96 (0.92, 1.00)Waterloo 287 26.8 0.89* (0.79, 1.00)Wellington-Dufferin-Guelph 176 30.9 1.03 (0.88, 1.19)Windsor-Essex 331 31.7 1.05 (0.94, 1.17)York 364 28.6 0.95 (0.85, 1.05)
All Ontario3 9,451 30.1 1.00
1 Standardized to the 1991 Canadian population2 Ratio of the mortality rate in a Public Health Unit to that for all Ontario (known residence only)3 Excludes deaths with unknown residence* Significantly different from 1.0 (p<0.05)

Cancer Care Ontario 7
Breast Cancer in Ontario
Figure 13. Age-standardized mortality rates forbreast cancer, by Public Health Unit,1992-1996
Breast Cancer in Ontario1971-1996
October 2000
Anna M Chiarelli
Beth Theis
Eric Holowaty
Veronika Moravan
E Diane Nishri
Surveillance Unitand
The Ontario Breast Screening ProgramDivision of Preventive Oncology
Cancer Care Ontario
Morphology

Cancer Care Ontario i
Breast Cancer in Ontario
Table of ContentsMorphologic patterns, by age group ...................................................................................................1
Trends in incidence for infiltrating duct carcinoma, by age ..................................................................2
Trends in incidence, by morphologic subgroup ....................................................................................3
List of TablesTable 11. Percentage distribution of morphologic subgroup for breast cancer in Ontario, .................1
by age group, 1992-1996
List of FiguresFigure 14. Age-standardized incidence rates (3-year moving averages) for infiltrating ......................2
duct carcinoma of the breast in Ontario, by age group, 1979-1996
Figure 15. Age-standardized incidence rates (3-year moving averages) for breast cancer ................3in Ontario, by morphologic subgroup, 1979-1996
Cancer Care Ontario 1
Breast Cancer in Ontario
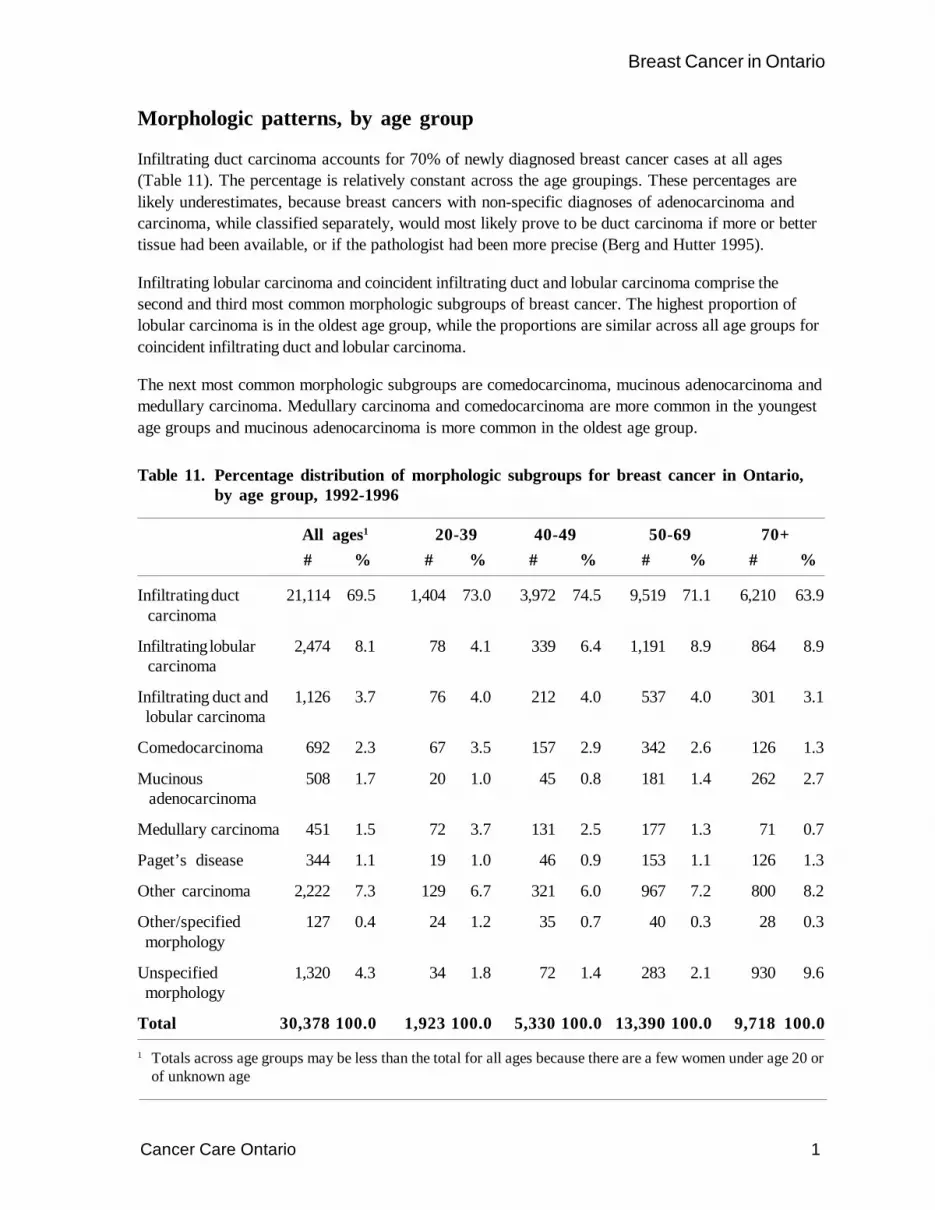
Morphologic patterns, by age group
Infiltrating duct carcinoma accounts for 70% of newly diagnosed breast cancer cases at all ages(Table 11). The percentage is relatively constant across the age groupings. These percentages arelikely underestimates, because breast cancers with non-specific diagnoses of adenocarcinoma andcarcinoma, while classified separately, would most likely prove to be duct carcinoma if more or bettertissue had been available, or if the pathologist had been more precise (Berg and Hutter 1995).
Infiltrating lobular carcinoma and coincident infiltrating duct and lobular carcinoma comprise thesecond and third most common morphologic subgroups of breast cancer. The highest proportion oflobular carcinoma is in the oldest age group, while the proportions are similar across all age groups forcoincident infiltrating duct and lobular carcinoma.
The next most common morphologic subgroups are comedocarcinoma, mucinous adenocarcinoma andmedullary carcinoma. Medullary carcinoma and comedocarcinoma are more common in the youngestage groups and mucinous adenocarcinoma is more common in the oldest age group.
Table 11. Percentage distribution of morphologic subgroups for breast cancer in Ontario,by age group, 1992-1996
All ages1 20-39 40-49 50-69 70+# % # % # % # % # %
Infiltrating duct 21,114 69.5 1,404 73.0 3,972 74.5 9,519 71.1 6,210 63.9 carcinoma
Infiltrating lobular 2,474 8.1 78 4.1 339 6.4 1,191 8.9 864 8.9 carcinoma
Infiltrating duct and 1,126 3.7 76 4.0 212 4.0 537 4.0 301 3.1 lobular carcinoma
Comedocarcinoma 692 2.3 67 3.5 157 2.9 342 2.6 126 1.3
Mucinous 508 1.7 20 1.0 45 0.8 181 1.4 262 2.7 adenocarcinoma
Medullary carcinoma 451 1.5 72 3.7 131 2.5 177 1.3 71 0.7
Paget’s disease 344 1.1 19 1.0 46 0.9 153 1.1 126 1.3
Other carcinoma 2,222 7.3 129 6.7 321 6.0 967 7.2 800 8.2
Other/specified 127 0.4 24 1.2 35 0.7 40 0.3 28 0.3 morphology
Unspecified 1,320 4.3 34 1.8 72 1.4 283 2.1 930 9.6 morphology
Total 30,378 100.0 1,923 100.0 5,330 100.0 13,390 100.0 9,718 100.0
1 Totals across age groups may be less than the total for all ages because there are a few women under age 20 orof unknown age
Cancer Care Ontario 2
Breast Cancer in Ontario
Age
-sta
ndar
dize
d ra
te p
er 1
00,0
00Trends in incidence for infiltrating duct carcinoma, by age
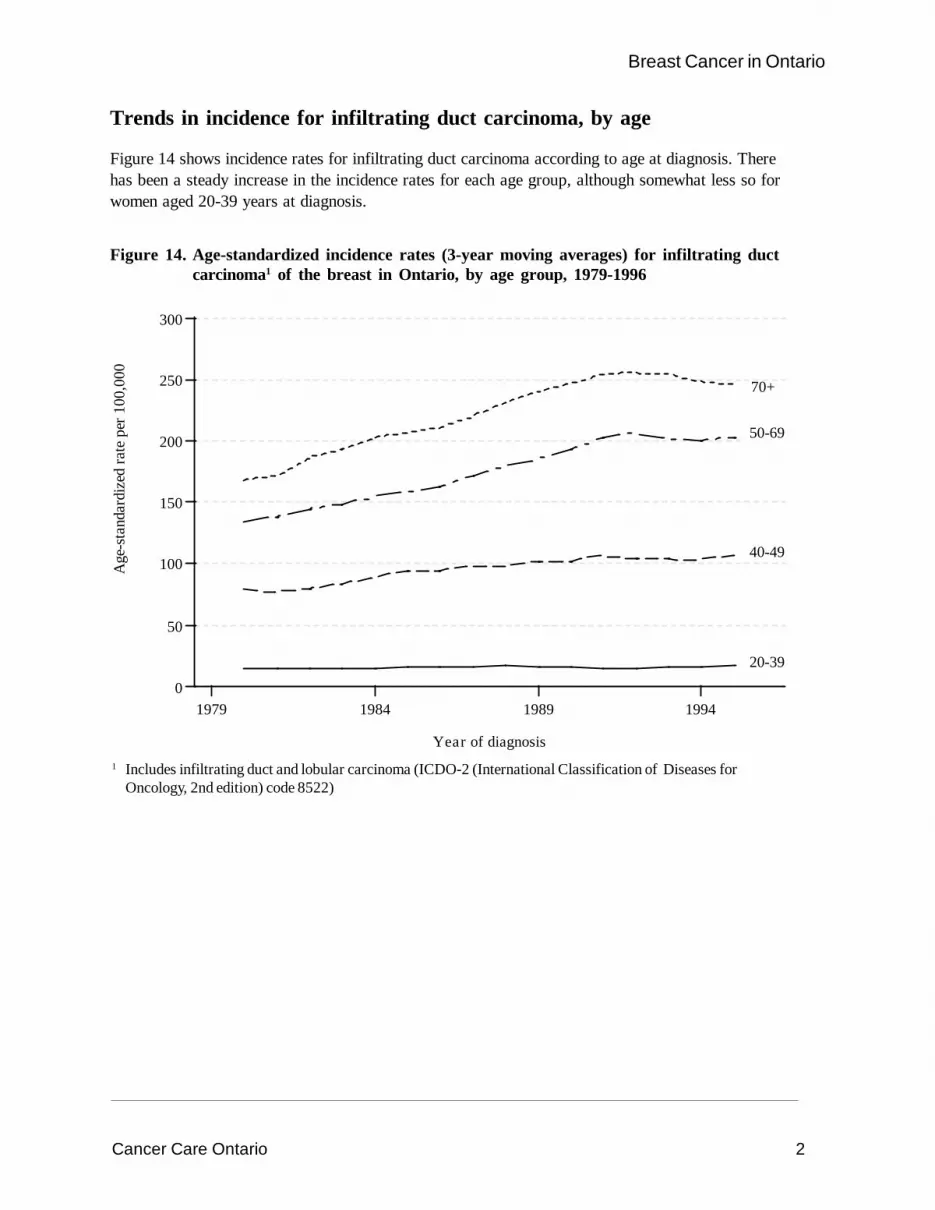
Figure 14 shows incidence rates for infiltrating duct carcinoma according to age at diagnosis. Therehas been a steady increase in the incidence rates for each age group, although somewhat less so forwomen aged 20-39 years at diagnosis.
Figure 14. Age-standardized incidence rates (3-year moving averages) for infiltrating ductcarcinoma1 of the breast in Ontario, by age group, 1979-1996
1979 1984 1989 19940
50
100
150
200
250
300
Year of diagnosis
20-39
40-49
50-69
70+
1 Includes infiltrating duct and lobular carcinoma (ICDO-2 (International Classification of Diseases forOncology, 2nd edition) code 8522)
Cancer Care Ontario 3
Breast Cancer in Ontario
Age
-sta
ndar
dize
d ra
te p
er 1
00,0
00
Trends in incidence, by morphologic subgroup
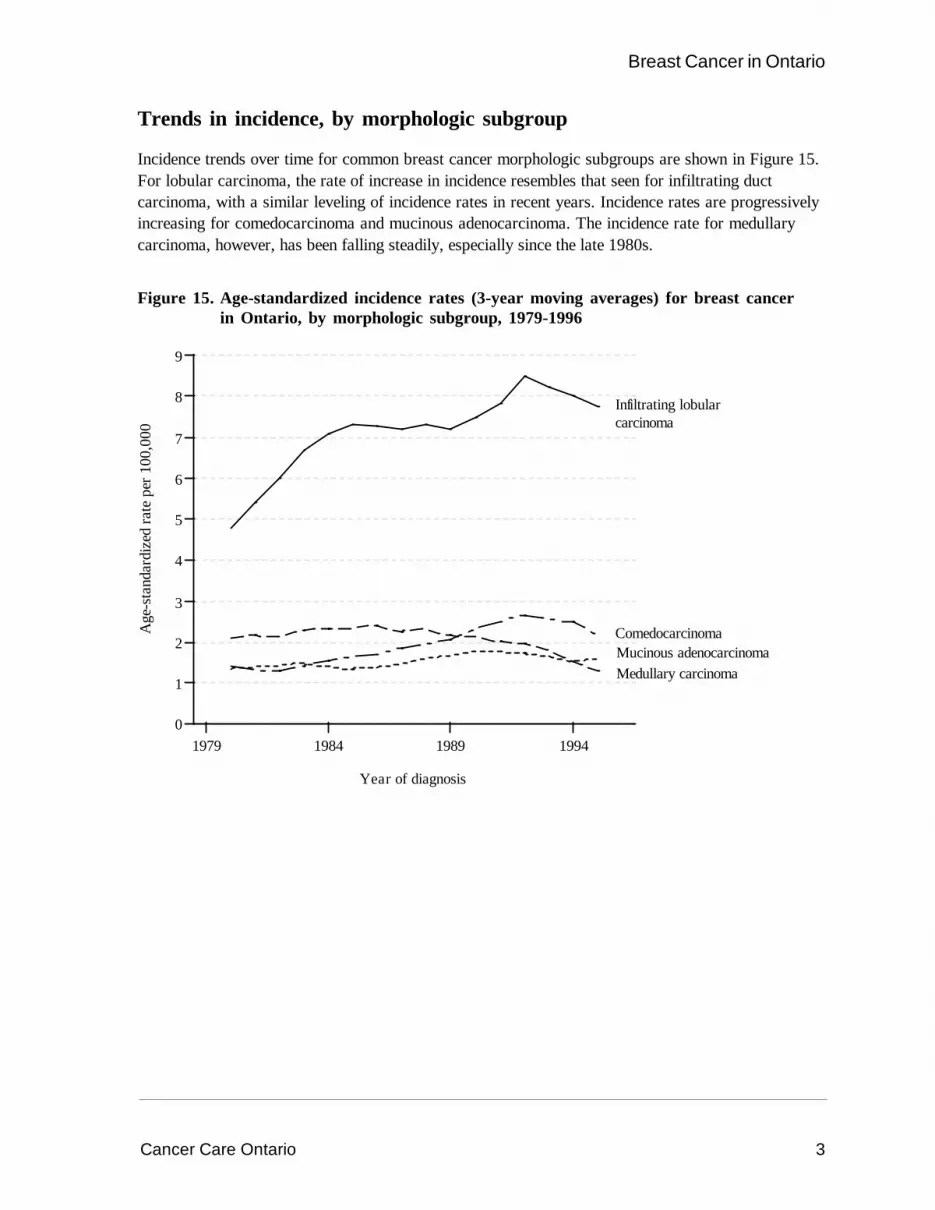
Incidence trends over time for common breast cancer morphologic subgroups are shown in Figure 15.For lobular carcinoma, the rate of increase in incidence resembles that seen for infiltrating ductcarcinoma, with a similar leveling of incidence rates in recent years. Incidence rates are progressivelyincreasing for comedocarcinoma and mucinous adenocarcinoma. The incidence rate for medullarycarcinoma, however, has been falling steadily, especially since the late 1980s.
Figure 15. Age-standardized incidence rates (3-year moving averages) for breast cancerin Ontario, by morphologic subgroup, 1979-1996
1979 1984 1989 19940
1
2
3
4
5
6
7
8
9
Year of diagnosis
Infiltrating lobularcarcinoma
ComedocarcinomaMucinous adenocarcinomaMedullary carcinoma

Breast Cancer in Ontario1971-1996
October 2000
Anna M Chiarelli
Beth Theis
Eric Holowaty
Veronika Moravan
E Diane Nishri
Surveillance Unitand
The Ontario Breast Screening ProgramDivision of Preventive Oncology
Cancer Care Ontario
Survival

Cancer Care Ontario i
Breast Cancer in Ontario
Table of ContentsCrude and relative survival ................................................................................................................1
Relative survival, by period of diagnosis .............................................................................................2
Relative survival, by age group ..........................................................................................................3
Relative survival, by morphologic subgroup ........................................................................................4
List of TablesTable 12. Relative survival (%) and 95% confidence intervals (CI) for breast cancer .....................4
in Ontario, by morphologic subgroup, 1979-1996
List of FiguresFigure 16. Crude and relative survival for breast cancer in Ontario, 1987-1996 ................................1
Figure 17. Relative survival for breast cancer in Ontario, by period of diagnosis, 1971-1995 .............2
Figure 18. Relative survival for breast cancer in Ontario, by age group, 1987-1996 ..........................3

Cancer Care Ontario 1
Breast Cancer in Ontario
Crude and relative survival
Survival rates for breast cancer are higher than those for most other cancers (McLaughlin et al.1995). The one-year relative survival rate after diagnosis of breast cancer is 96% and the five-yearrelative survival is 81% (Figure 16). Relative survival declined a further 10% to 71% at 10 years.
Figure 16. Crude and relative survival for breast cancer in Ontario, 1987-1996
Surv
ival
(%)
0 2 4 6 8 100
20
40
60
80
100
Years after diagnosis
Crude
Relative
Cancer Care Ontario 2
Breast Cancer in Ontario
Relative survival, by period of diagnosis
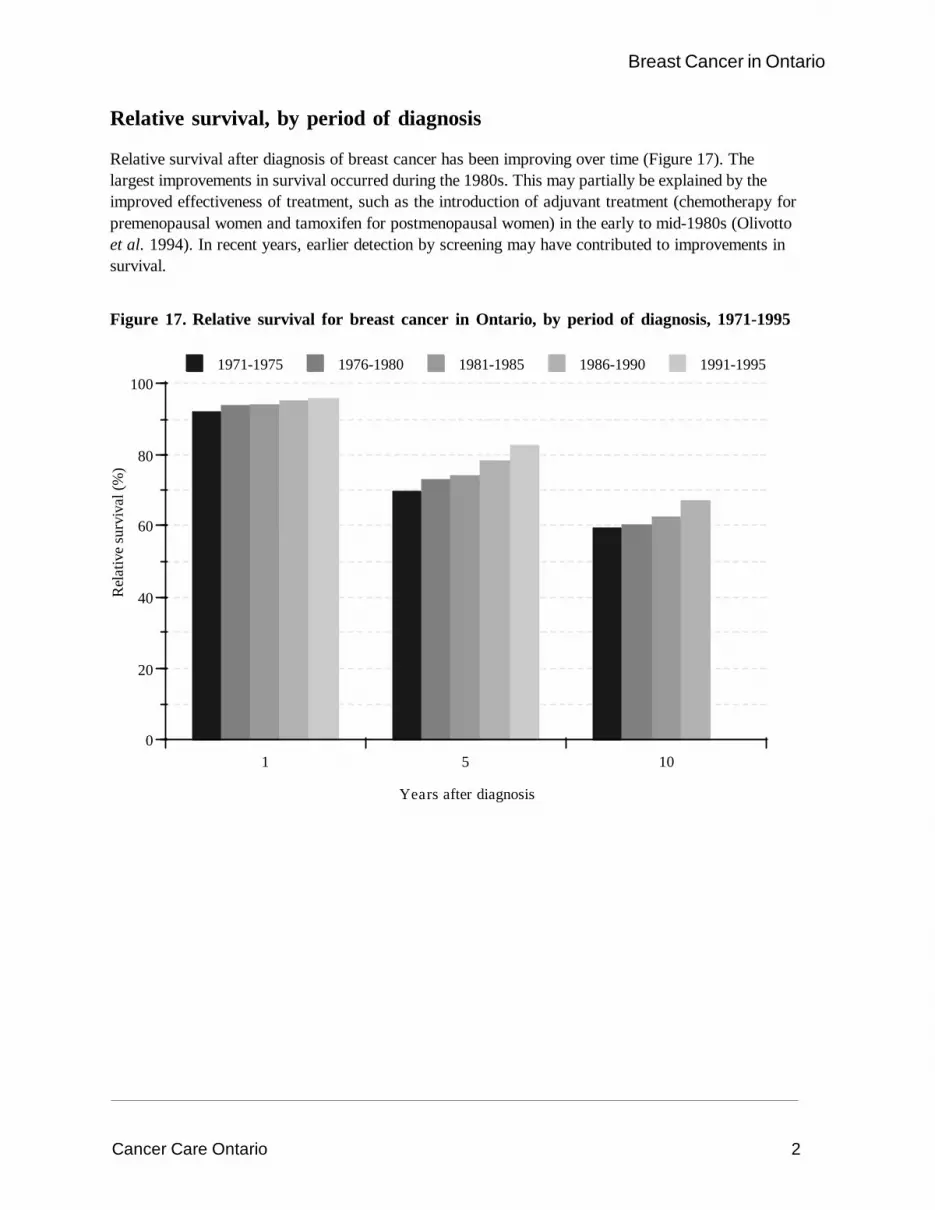
Relative survival after diagnosis of breast cancer has been improving over time (Figure 17). Thelargest improvements in survival occurred during the 1980s. This may partially be explained by theimproved effectiveness of treatment, such as the introduction of adjuvant treatment (chemotherapy forpremenopausal women and tamoxifen for postmenopausal women) in the early to mid-1980s (Olivottoet al. 1994). In recent years, earlier detection by screening may have contributed to improvements insurvival.
Figure 17. Relative survival for breast cancer in Ontario, by period of diagnosis, 1971-1995
Rel
ativ
e su
rviv
al (%
)
1 5 100
20
40
60
80
100
Years after diagnosis
1971-1975 1976-1980 1981-1985 1986-1990 1991-1995
Cancer Care Ontario 3
Breast Cancer in Ontario
Relative survival, by age group
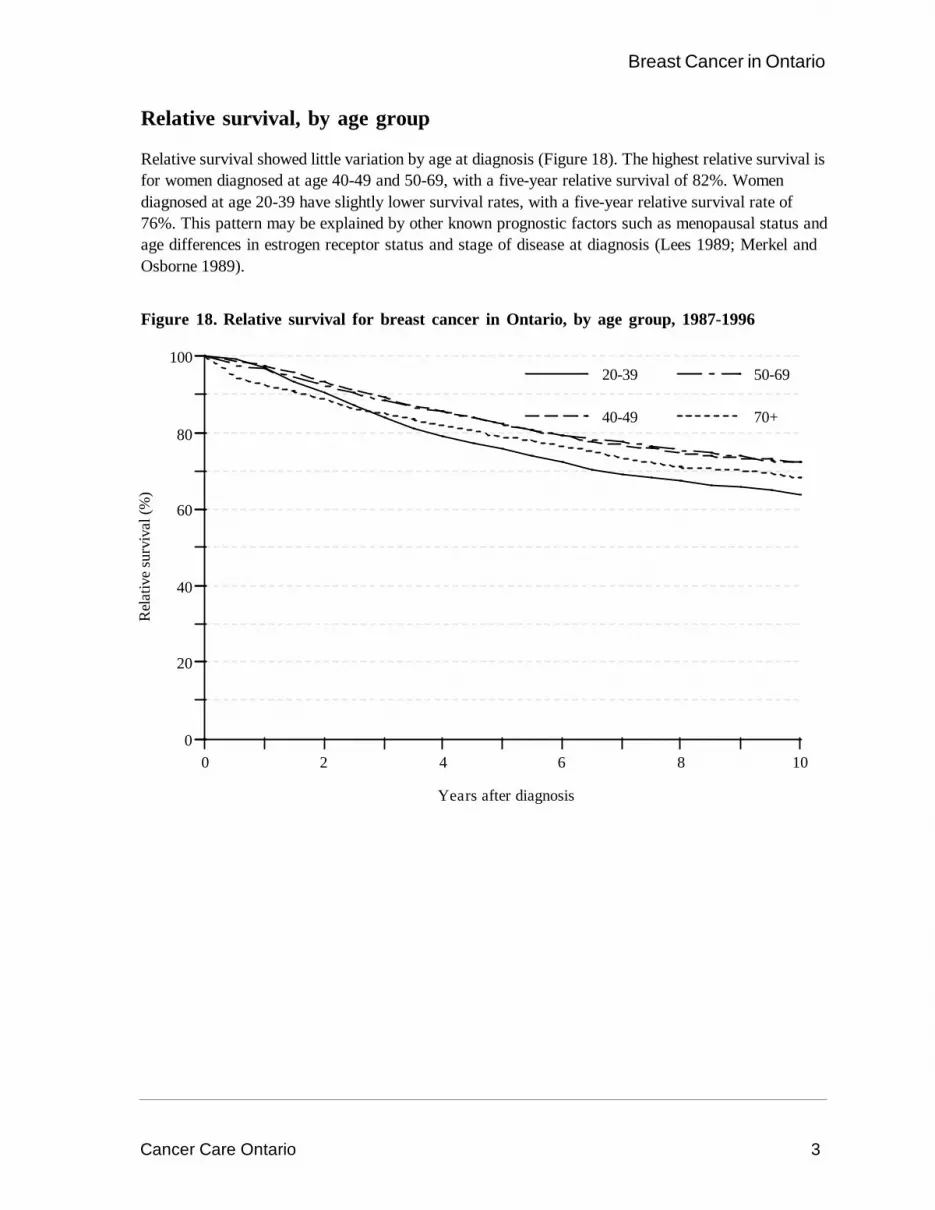
Relative survival showed little variation by age at diagnosis (Figure 18). The highest relative survival isfor women diagnosed at age 40-49 and 50-69, with a five-year relative survival of 82%. Womendiagnosed at age 20-39 have slightly lower survival rates, with a five-year relative survival rate of76%. This pattern may be explained by other known prognostic factors such as menopausal status andage differences in estrogen receptor status and stage of disease at diagnosis (Lees 1989; Merkel andOsborne 1989).
Figure 18. Relative survival for breast cancer in Ontario, by age group, 1987-1996
0 2 4 6 8 100
20
40
60
80
100
Years after diagnosis
20-39
40-49
50-69
70+
Rel
ativ
e su
rviv
al (%
)

Cancer Care Ontario 4
Breast Cancer in Ontario
Relative survival, by morphologic subgroup
Women with infiltrating duct carcinoma have a lower five- and 10-year relative survival thanwomen with special types of carcinomas, a pattern that is consistent with previous reports (Bergand Hutter 1995) (Table 12). Special-type carcinomas such as lobular and mucinous have the bestfive-year relative survival rates and medullary and mucinous have the best 10-year survival rates.The differences in survival rate may reflect the stage at which the cancer was diagnosed in thedifferent types of carcinomas (Berg and Hutter 1995).
Table 12. Relative survival (%) and 95% confidence intervals (CI) for breast cancer inOntario, by morphologic subgroup, 1979-1996
5-year 10-year# % 95% CI % 95% CI
Infiltrating duct carcinoma1 57,536 80.0 (79.6, 80.5) 67.0 (66.4, 67.6)Infiltrating lobular carcinoma 6,320 85.5 (84.2, 86.7) 71.2 (69.3, 73.1)Medullary carcinoma 1,721 82.5 (80.4, 84.7) 77.5 (74.7, 80.3)Comedocarcinoma 1,683 82.7 (80.5, 85.0) 73.0 (69.8, 76.3)Mucinous adenocarcinoma 1,374 91.2 (88.4, 94.1) 83.5 (78.8, 88.3)
1 Includes infiltrating duct and lobular carcinoma (ICDO-2 (International Classification of Diseases forOncology, 2nd edition) code 8522)
Breast Cancer in Ontario1971-1996
October 2000
Anna M Chiarelli
Beth Theis
Eric Holowaty
Veronika Moravan
E Diane Nishri
Surveillance Unitand
The Ontario Breast Screening ProgramDivision of Preventive Oncology
Cancer Care Ontario
Materials and Methods/References/Appendices

Cancer Care Ontario i
Breast Cancer in Ontario
Table of ContentsMaterials and Methods ......................................................................................................................1
Data sources ........................................................................................................................2
New cases of cancer ...............................................................................................2
Quality of data for new cases of cancer ...................................................................2
Deaths from cancer .................................................................................................2
Population data .........................................................................................................3
National and international data ..................................................................................3
Incidence and mortality data .................................................................................................3
Cancer site ...............................................................................................................3
Morphology ..............................................................................................................3
Time periods .............................................................................................................4
Residence at diagnosis and death ..............................................................................5
Statistical methods ................................................................................................................5
Age-specific rates ....................................................................................................5
Age-standardized rates .............................................................................................5
Time trends ..............................................................................................................5
Rate ratios ...............................................................................................................6
Confidence intervals .................................................................................................6
Projections ...............................................................................................................6
Survival ....................................................................................................................7
References .......................................................................................................................................8
Appendices ..................................................................................................................................... 12
Appendix A. World and Canadian standard populations and Ontario 1996 population........... 13
Appendix B. Cancer Care Ontario Regions (CCORs) showing census divisions ................. 14
Appendix C. Ontario Public Health Units (PHUs) .............................................................. 16
Appendix D. Description of morphologic subgroups for breast cancer ................................ 18
List of FiguresFigure 19. Temporal trends in data quality indicators ........................................................................4

Cancer Care Ontario 1
Breast Cancer in Ontario
Materials and Methods

Cancer Care Ontario 2
Breast Cancer in Ontario
Data sources
New cases of cancer
The Ontario Cancer Registry (OCR), operated by Cancer Care Ontario (CCO), registers all newlydiagnosed cases of cancer (invasive neoplasms) except non-melanoma skin cancers. While cancerreporting is not a legal requirement in Ontario, the Cancer Act provides a legal mandate for thisundertaking and offers legal protection for physicians, dentists and health care agencies which reportinformation on cancer cases.
The process of cancer registration in Ontario is passive, relying almost completely on recordscollected for other purposes. Since 1977, the OCR has relied on the same four major data sources:hospital discharge summaries which include a diagnosis of cancer; pathology reports with any mentionof cancer; records of patients referred to CCO’s eight Regional Cancer Centres (RCCs) or thePrincess Margaret Hospital (PMH) (now part of the University Health Network), the specializedinstitutions treating cancer patients in Ontario; and death certificates with cancer as the underlyingcause of death.
All records except pathology reports are coded at the source and provided to the OCR inmachine-readable form. Paper copies of pathology reports are sent to the OCR by all hospital andprivate pathology laboratories and are coded and key-entered by OCR staff. Since 1991, the OCR hasalso received day surgery summaries which include a diagnosis of cancer. The OCR receives about400,000 records from these multiple sources each year. The OCR is highly automated, relying heavilyon automated edit-checking, computerized probabilistic record linkage and automated rule-basedsystems for summarizing patient and tumour information. Further details about the operation areavailable in recent monographs (Holowaty et al. 1995; Marrett et al. 1995; McLaughlin et al. 1995).
Quality of data for new cases of cancer
Microscopic examination of tissue or cells is the definitive diagnostic test for cancer. During the period1971-1996, 7% of breast cancers were not microscopically verified in the OCR. This proportiondecreased to under 5% for the more recent interval 1979-1996, largely because of more completereporting from pathology laboratories. This rate of non-microscopic confirmation is still somewhatabove that reported by established active registries; for instance, the American SEER (Surveillance,Epidemiology and End Results Program) registries report a rate of 3%.
Another parameter of data quality is the percentage of cases for which a death certificate is the onlysource of information supporting a diagnosis of breast cancer. Only 1% of breast cancers registeredfrom 1971-1996 was registered from death certificates only. Figure 19 shows the temporal trends indata quality indicators for breast cancer.
Because the management of breast cancer almost always requires contact with institutions thatcomprise two or more of the OCR’s major reporting sources, it is likely that reporting is almostcomplete. During the 1971-1996 time period, only 11% of breast cancer cases registered in the OCRwere identified by a single source, with 6%, 2%, 2% and 1% of cases, respectively, being identified byhospitalization records, pathology records, clinic records and death certificates only.
Deaths from cancer
Mortality data in the OCR are largely derived from the Office of the Registrar General of Ontario,where death certificate information is collected and coded. Mortality rates are estimated from the

Cancer Care Ontario 3
Breast Cancer in Ontario
reported underlying cause of death, coded according to the International Classification of Diseases -Ninth Revision (ICD-9), among persons residing in Ontario at the time of death (World HealthOrganization 1977).
Population data
Rates were calculated using annual mid-year estimated resident populations of females by five-yearage group. These estimates are based on the National Population Census, conducted every five years,and are corrected for census undercounts. Populations for both Ontario and its census divisions wereprovided by Statistics Canada (Statistics Canada 1999). Populations for CCO Regions (CCORs) andPublic Health Units (PHUs) were determined by adding the populations for all census divisions thatcomprise each Region or Unit (see Appendices B and C).
The age distribution of the 1991 Canadian population, adjusted for census undercount, was used tocalculate most of the age-standardized rates appearing in this monograph (Statistics Canada 1994)(see Appendix A). For international comparisons, the World Standard Population was used to calculatethe age-standardized rates (Parkin et al. 1997) (see Appendix A).
National and international data
Incidence and mortality rates for the provinces in Canada were obtained from the North AmericanAssociation of Central Registries (NAACCR) 1999 Cancer in North America (CINA) monographs(Chen et al. 1999; Chen and Wu 1999). The monographs cover the period 1991-1995 for mostparticipating registries. Incidence rates of breast cancer around the world were recently published bythe International Agency for Research on Cancer (IARC) (Parkin et al. 1997). This monographcovers the period 1988-1992 for most reporting registries. For comparison with Ontario incidence data,countries or regions were selected to represent different continents, but also had to meet all of thedata quality requirements of the IARC publication. No areas of Africa qualified for this comparison.
Incidence and mortality data
Cancer site
A cancer is generally coded according to the body site in which it occurs. In the OCR, the primary siteof cancer or cancer cause of death has been coded according to ICD-9 (World Health Organization1977). The ICD-9 code for invasive cancer of the breast is 174. Although this code has a fourth digitwhich indicates the more specific site of the cancer within the breast (174.0 for the nipple and areola,174.1 for the central portion, 174.2-174.5 for the quadrants, 174.6 for the axillary tail and 174.8 foroverlapping subsites or ectopic sites), this digit was often recorded in the OCR as a ‘9’, which meansthat no subsite was specified. Therefore, data have been presented only for site 174 as a whole.
Morphology
The microscopic morphology or histopathology of tumours concerns the appearance of cancerouscells, tissues and organs under the light microscope. The morphologic type of a cancer may be aprognostic factor; additionally, it may be important for treatment decisions. It may also be important inepidemiologic studies of cancer etiology. Cancers of different morphologic types that occur in thesame anatomic site often have different etiologies, incidences and prognoses.
The morphologic data presented in this monograph have been coded according to the InternationalClassification of Diseases for Oncology (ICD-O) (World Health Organization 1976; Percy et al.1990). The morphology code in ICD-O consists of five digits. The first four digits describe the

Cancer Care Ontario 4
Breast Cancer in Ontario
morphologic type, and the fifth digit describes the behaviour. The OCR registers only malignantneoplasms; that is, those with a behaviour code of 3.
As the total number of morphologic types recognized in ICD-O approaches 500, grouping of thevarious types is necessary. Appendix D shows the grouping scheme employed for this monograph, avariant of the histology groups defined by Berg for use in epidemiologic studies (Percy et al. 1995;Berg and Hutter 1995). For the most recent five-year time period, we included coincident infiltratingduct and lobular carcinoma as a separate category, but combined it with infiltrating duct carcinoma foranalysis of time trends for the period 1979-1996. This reflects coding history in the OCR; prior to1988, coincident infiltrating duct and lobular carcinoma was coded as infiltrating duct carcinoma.
Time periods
Incidence, mortality and survival trends are presented in this monograph for the period 1971-1996.While the OCR actually begins in 1964, population estimates adjusted for census undercount are onlyavailable since 1971. The most recent years for which reporting is complete are 1996 for incidenceand 1997 for mortality.
The most recent five-year time period, 1992-1996, was used to estimate the burden of cancer and todescribe selected characteristics of tumours or cases. This five-year aggregate stabilizes estimatesof infrequent events (diagnoses at younger ages, for example) while providing the most currentinformation.
More detailed analyses by morphologic subgroup were focused on the period 1979-1996, because ofthe appreciable improvement in the rates of microscopic confirmation between 1971 and 1979(Figure 19). Other periods were used occasionally because of availability; for example, data fromother provinces of Canada are for 1991-1995. The most recently published international data are for1988-1992.
Figure 19. Temporal trends in data quality indicators
Perc
ent
1971 1976 1981 1986 1991 19960
2
4
6
8
10
12
14
16
18
20
Not microscopicallyconfirmed
Death certificate only
Year of diagnosis

Cancer Care Ontario 5
Breast Cancer in Ontario
Residence at diagnosis and death
The geographic variation in incidence and mortality in breast cancer in Ontario over the period1992-1996 is described in terms of Cancer Care Ontario Regions (CCORs) and Public Health Units(PHUs), which are aggregations of census divisions (see Appendices B and C). Census division ofresidence at the time of diagnosis comes primarily from hospital records in the OCR. All but 1% ofcases of breast cancer in 1992-1996 have a census division of residence recorded. Cases with missingresidence were excluded from all incidence rates calculated for the purpose of comparing the CCORsor PHUs to the province. Census division of residence at time of death comes from death certificatesin the OCR. Mortality rates for CCOR and PHU comparisons were also calculated with missingresidence excluded; fewer than 1% of breast cancer deaths for the 1992-1996 time period did notreport a valid census division of residence.
The eight CCORs cover the entire province, with populations ranging from 5,484,173 in the largest(Central East CCOR) to 373,008 in the smallest (South CCOR) (Statistics Canada 1999). Within eachCCOR is situated one of CCO’s Regional Cancer Centres. In addition, Princess Margaret Hospital islocated within the Central East CCOR. Maps describing CCOR boundaries and census divisioncomponents are shown in Appendix B.
Appendix C contains a map showing Ontario PHUs and a table showing corresponding censusdivisions as used for PHU analysis. It should be noted that actual PHU boundaries are not alwaysequivalent to those for the grouped census divisions as used herein. The discrepancy is greatest innorthern Ontario. The following PHUs do not correspond exactly to groups of census divisions:Algoma, Muskoka-Parry Sound, North Bay and District, Northwestern, Porcupine, Renfrew, Sudburyand District, Thunder Bay, and Timiskaming.
Statistical methods
Age-specific rates
Age-specific rates were calculated in five-year age groups by dividing the number of cases or deathsby the Ontario female population in the same age group for the same calendar period. Age-specificrates are expressed per 100,000 women-years.
Age-standardized rates
To compare incidence and mortality rates between populations which have different age structures,age-standardized rates were calculated. The age-standardized rate is a weighted average of theage-specific rates, using a standard population age distribution. The standardized rates reflect theincidence and mortality that would be expected if the population of interest had an age structureidentical to the standard population. The 1991 Canadian population, adjusted for census undercount(Appendix A), was used as the standard throughout most of this monograph. However, in comparisonsbetween Ontario’s rate and those of other parts of the world, the World Standard Population was used(see Appendix A). Age-standardized rates are expressed per 100,000 women-years.
Time trends
The annual numbers of incident cases and deaths were plotted to describe the total burden of breastcancer for the period 1971-1996. To illustrate time trends, three-year moving averages of

Cancer Care Ontario 6
Breast Cancer in Ontario
age-standardized incidence and mortality rates were plotted, for all ages and by age group. Theseaverages smooth out annual fluctuations that can occur when there are small numbers of cases.Trends by morphologic subgroup were plotted from 1979 to 1996, again using three-year movingaverages.
In order to estimate the annual percentage change (APC), the logarithm of the annual rate wasmodelled as a function of year of diagnosis or death using weighted linear regression and SAS®
PROCs REG and GLM (Esteve et al. 1994; SAS Institute Inc. 1997). First, the entire time period wasmodeled, allowing the inclusion of a quadratic year term if necessary. If the quadratic term was foundto be significant or if the model fit was poor, a change-point analysis was undertaken to determine theyear at which the rate of annual increase or decrease changed markedly (Shaban 1980). In thissecond step, two lines were fit to the data (one prior to the change point and one after) to try toimprove the model; the increase in the percentage of variation explained by the model (R2) was usedto select the best two-line model.
The APC estimates are reported either for the entire time period or for two time periods, depending onthe results of the change-point analysis.
Rate ratios
The comparison of incidence or mortality rates in two populations (or subgroups), as a ratio of theserates, is termed a rate ratio (RR) or relative rate. In this monograph, this technique was employedfor comparison of the rates of breast cancer for each CCOR or PHU to that of the province as awhole. The rates for each population were age-standardized using the 1991 Canadian population,adjusted for census undercount (Appendix A), as the standard. A rate ratio in excess of 1.0 forregional comparisons, for example, means that the region has a higher rate than Ontarioas a whole.
Confidence intervals
A confidence interval (CI) indicates the range of values for a parameter of interest (for example, arate ratio) which has a specified probability of including the true value. Thus, the 95% CI for a RRrepresents the interval which has a 95% chance of covering the true value of the RR. The 95% CI foreach incidence and mortality RR comparing a regional rate to the provincial rate was calculated usingthe approximate bootstrap confidence interval method (Swift 1995).
When the 95% CI includes 1.0, the RR is considered not to differ significantly from 1.0 (that is, therate for the region does not differ significantly from that for the province), and the difference betweenthe RR and 1.0 is ascribed to chance variation. If the interval does not include 1.0, the RR is deemedto be statistically significantly different from 1.0. A RR is declared to be significantly low if the upperlimit of the CI is less than 1.0 and significantly high if the lower limit of the CI is greater than 1.0. Dueto rounding, a RR may occasionally be declared to differ significantly from 1.0 when one of the endpoints of the CI is 1.0.
Projections
The expected number of incident cases and deaths from breast cancer are presented up to the year2000. These estimates were calculated by extrapolating age-specific incidence and mortality rate

Cancer Care Ontario 7
Breast Cancer in Ontario
trends using data from 1986 to 1996 and applying these extrapolated rates to projected Ontariopopulation estimates made available by the Ontario Ministry of Health and Long Term Care.
Survival
Cases with a first primary diagnosis of breast cancer between 1971 and 1996 were used in thesurvival analyses for all cases and by age group; the time period 1979-1996 was used for theanalyses by morphologic subgroup. Cases were followed for deaths occurring through December 31,1998 (as recorded in the OCR). The outcome of interest was all-cause mortality. If no deathinformation was available, cases were assumed to be alive through December 31, 1998.
Life table methods using six-month intervals were used to calculate crude survival rates for up to10 years (Namboodiri and Suchindran 1987). SAS® PROC LIFETEST was used for these analyses(SAS Institute Inc. 1997). Although the crude survival rate is actually a proportion, in standardterminology it is referred to as a “rate”. The relative survival rate is a measure of the influence ofbreast cancer on normal life expectancy, because it is obtained by adjusting the crude survival for theaverage life expectancy of the general population of the same age as women diagnosed with breastcancer. (A more detailed description can be found in the monograph on cancer survival in Ontario(McLaughlin et al. 1995).) Since it is generally acknowledged that cause of death information ondeath certificates is often not accurate enough to determine whether an individual died from his or heroriginal cancer, the relative survival rate is the preferred method for reporting survival from cancerregistry data. A FORTRAN program developed by Hakulinen et al. was used for the relative survivalanalyses (Hakulinen and Abewickrama 1985).

Cancer Care Ontario 8
Breast Cancer in Ontario
References
Cancer Care Ontario 9
Breast Cancer in Ontario
ReferencesAhearne PM, Leach SD and Feig BW (1998), Invasive breast cancer. In: The MD AndersonSurgical Oncology Handbook, Second Edition, Feig BW, Berger DH, et al., eds.New York, NY: Lippincott, Williams and Wilkins, 13-37.
American Joint Committee on Cancer (1988), Manual for Staging of Cancer, Third Edition.Philadelphia, PA: JB Lippincott Co.
Berg JW and Hutter RV (1995), Breast Cancer. Cancer 751(1 Suppl):257-269.
Boyd NF, Greenberg C and Lockwood G (1997), Effects at two years of a low-fat high-carbohydratediet on radiologic features of the breast: results from a randomized trial. JNCI 89:488-496.
Brody LC and Biesecker BB (1998), Breast cancer susceptibility genes. BRCA1 and BRCA2.Medicine 77:208-226.
Bryant HE and Brasher PMA (1994), Risks and probabilities of breast cancer: short-term versuslifetime probabilities. CMAJ 150:211-216.
Chen VW, Wu XC, and Andrews PA (1999), Cancer in North America, 1991-1995.Volume One: Incidence. Sacramento, CA: North American Association of Central CancerRegistries.
Chen VW and Wu XC (1999), Cancer in North America, 1991-1995. Volume Two: Mortality.Sacramento, CA: North American Association of Central Cancer Registries.
Clavel-Chapelon F, Niravong M and Joseph RR (1997), Diet and breast cancer: review of theepidemiologic literature. Cancer Detect Prev 21:426-440.
Collaborative Group on Hormonal Factors in Breast Cancer (1996), Breast cancer and hormonalcontraceptives: collaborative reanalysis of individual data on 53,297 women with breast cancer and100,239 women without breast cancer from 54 epidemiological studies. Lancet 347:1713-1727.
Collaborative Group on Hormonal Factors in Breast Cancer (1997), Breast cancer and hormonereplacement therapy: collaborative reanalysis of data from 51 epidemiological studies of 52,705women with breast cancer and 108,411 women without breast cancer. Lancet 350:1047-1059.
Esteve J, Benhamou B and Raymond L (1994), Statistical methods in cancer research. Volume IV:Descriptive Epidemiology. Lyon, France: International Agency for Research on Cancer.
Fisher B, Constantino JP, Wickerham DL, et al. (1998), Tamoxifen for prevention of breast cancer:report of the National Surgical Adjuvant Breast and Bowel Project P-I study. JNCI 90:1371-1388.
Friedenreich CM, Thune I, Brinton LA, et al. (1998), Epidemiologic issues related to the associationbetween physical activity and breast cancer. Cancer 83(3 Suppl):600-610.
Hakulinen T and Abewickrama K (1985), A computer program package for relative survival analysis.Comput Biomed Res 19:197-207.
Henderson IC (1995), Breast Cancer. In: ACS Textbook of Clinical Oncology, Second Edition,Murphy GP, Lawrence W, Jr., et al., eds. Atlanta, GA: American Cancer Society, 198-219.
Holowaty EJ, Marrett LD and Fehringer G (1995), Cancer incidence in Ontario: Trends andregional variations in the 1980s. Toronto: Ontario Cancer Treatment and Research Foundation.

Cancer Care Ontario 10
Breast Cancer in Ontario
Hunter DJ and Willett WC (1993), Diet, body size, and breast cancer. Epidemiol Rev 15:110-132.
Iscoe NA, Goel V, Wu K, et al. (1994), Variation in breast cancer surgery in Ontario. CMAJ150(3):345-352.
Kelsey JL and Bernstein L (1996), Epidemiology and prevention of breast cancer.Ann Rev Public Health 17:47-67.
Kelsey JL, Gammon MD and John EM (1993), Reproductive factors and breast cancer.Epidemiol Rev 15:36-47.
Kerlikowske K, Grady D, Rubin S, et al. (1995), Efficacy of screening mammography.A meta-analysis. JAMA 273:149-154.
Laden F and Hunter DJ (1998), Environmental risk factors and female breast cancer.Ann Rev Public Health 19:101-123.
Lees AW (1989), Risk factors and 10 year breast cancer survival in northern Alberta.Breast Cancer Res Treat 13:143-151.
Longnecker MP (1994), Alcoholic beverage consumption in relation to risk of breast cancer:meta-analysis and review. Cancer Causes Control 5:73-82.
Marrett LD, Nishri ED, Swift MB, et al. (1995), Geographic distribution of cancer in Ontario,Volume II: Atlas of cancer incidence, 1980-1991. Toronto: Ontario Cancer Treatment andResearch Foundation.
McLaughlin JR, Sloan MR and Janovjak DP (1995), Cancer Survival in Ontario.Toronto: Ontario Cancer Treatment and Research Foundation.
Merkel DE and Osborne CK (1989), Prognostic factors in breast cancer.Hematol Oncol Clin North Am 3:641-652.
Namboodiri D and Suchindran CM (1987), Life table techniques and their applications. Orlando,FL: Academic Press.
National Cancer Institute (1999), SEER 1973-96 Public Use CD-ROM. Bethesda, MD: U.S.Department of Health and Human Services.
National Cancer Institute of Canada (2000), Canadian Cancer Statistics 2000.Toronto: National Cancer Institute of Canada.
Olivotto IA, Bajdik CD, Plenderleith IH, et al. (1994), Adjuvant systemic therapy and survival afterbreast cancer. N Engl J Med 330(12):805-810.
Oza AM and Boyd NF (1993), Mammographic parenchymal patterns: a marker of breast cancer risk.Epidemiol Rev 15(1):196-208.
Page DL, Anderson TJ and Sakamota G (1987), Infiltrating carcinoma: major histologic types. In:Diagnostic histopathology of the breast, Page DL and Anderson TJ, eds. London: WB Saunders,193-235.
Parkin DM, Whelan SL, Ferlay J, et al. (1997), Cancer Incidence in Five Continents Vol. VII.Lyon, France: International Agency for Research on Cancer.

Cancer Care Ontario 11
Breast Cancer in Ontario
Percy C, Van Holton V and Muir C (1990), International Classification of Diseases forOncology, Second Edition. Geneva, Switzerland: World Health Organization.
Percy C, Young JL, Muir C, et al. (1995), Cancer. Introduction. Cancer 75(1 Suppl):140-146.
Pharoah PDP, Day NE, Duffy S, et al. (1997), Family history and the risk of breast cancer:systematic review and meta-analysis. Int J Cancer 71:800-809.
Powles T, Eeles R and Ashley S (1998), Interim analysis of the incidence of breast cancer in theRoyal Marsden Hospital tamoxifen randomised chemoprevention trial. Lancet 352:98-101.
SAS Institute Inc. (1997), SAS/STAT® Software: Changes and Enhancements through Release6.12. Cary, NC: SAS Institute Inc.
Schairer C, Lubin J, Troisi R, et al. (2000), Menopausal estrogen and estrogen-progestin replacementtherapy and breast cancer risk. JAMA 283:485-491.
Self S, Prentice R, Iverson D, et al. (1988), Statistical design of the Women’s Health Trial.Control Clin Trials 9:119-136.
Shaban AS (1980), Change point problem and two-phase regression: an annotated bibliography.Internat Statist Rev 48:83-93.
Spicer DV, Pike MC, Pike A, et al. (1993), Pilot trial of a gonadotropin hormone agonist withreplacement hormones as a prototype contraceptive to prevent breast cancer.Contraception 47:427-444.
Statistics Canada (1994), Revised intercensal population and family estimates,July 1, 1971-1991. Ottawa: Statistics Canada.
Statistics Canada (1999), Annual Demographic Statistics 1998. Ottawa: Ministry of Industry.
Swift MB (1995), Approximate bootstrap confidence intervals for direct and indirect standardizedrates. Stat Med 14:1875-1888.
The Steering Committee on Clinical Practice Guidelines for the Care and Treatment of BreastCancer (1998), Questions and answers on breast cancer. A guide for women andtheir physicians. Based on Clinical Practice Guidelines for the Care and Treatment of BreastCancer: a Canadian consensus document. Ottawa: Canadian Medical Association.
Ursin G, Longnecker MP, Haile RW, et al. (1995), A meta-analysis of body mass index and risk ofpremenopausal breast cancer. Epidemiol 6:137-141.
Veronesi U, Maisonneuve P, Costa A, et al. (1998), Prevention of breast cancer with tamoxifen:preliminary findings from the Italian randomised trial among hysterectomised women.Lancet 352:93-97.
World Health Organization (1976), Manual of the International Classification of Diseases forOncology, First Edition. Geneva, Switzerland: World Health Organization.
World Health Organization (1977), International Classification of Diseases - Ninth Revision.Geneva, Switzerland: World Health Organization.

Cancer Care Ontario 12
Breast Cancer in Ontario
Appendices

Cancer Care Ontario 13
Breast Cancer in Ontario
Appendix A. World and Canadian standard populations and Ontario 1996 population
Age World Standard Canadian 1991 Ontario 1996Population1 Population2 Population3
0-4 12,000 6946.4 756,0535-9 10,000 6945.4 760,338
10-14 9,000 6803.4 740,08015-19 9,000 6849.5 721,39620-24 8,000 7501.6 747,17425-29 8,000 8994.4 826,42630-34 6,000 9240.0 994,83635-39 6,000 8338.8 973,24140-44 6,000 7606.3 865,31945-49 6,000 5953.6 790,26850-54 5,000 4764.9 608,63655-59 4,000 4404.1 501,21760-64 4,000 4232.6 459,36465-69 3,000 3857.0 431,22370-74 2,000 2965.9 374,24775-79 1,000 2212.7 255,75480-84 500 1359.5 167,495
85+ 500 1023.7 127,809Total 100,000 100,000 11,100,876
1 Parkin et al. 19972 Statistics Canada 1994. Represented for convenience as the proportional distribution across age groups, rather
than as actual population counts3 Statistics Canada 1999

Cancer Care Ontario 14
Breast Cancer in Ontario
Eastern
Northwest
Northeast
Southeast
Central East
Central West
South
Southwest
Appendix B. Cancer Care Ontario Regions (CCORs) showing census divisions

Cancer Care Ontario 15
Breast Cancer in Ontario
Appendix B (continued). Cancer Care Ontario Regions (CCORs) showing census divisions
48. Nipissing49. Parry Sound51. Manitoulin Island52. Sudbury District53. Sudbury R.M.54. Timiskaming56. Cochrane57. Algoma58. Thunder Bay59. Rainy River60. Kenora
Census Divisions
Northwest CCOR
Northeast CCOR
56
5754
4849
59
53
51
52
58
60
Northern Ontario
Southwest CCOR
South CCOR
Southern Ontario
Central West CCOR
Central East CCOR
Southeast CCOR
Eastern CCOR
2024
2119
18
25
22
7
1
26
1113
14
10151643
12
28
29
2330
2632
31
42
9
47
4644
37
36
3938
34
40
41
1. Stormont, Dundas and Glengarry2. Prescott & Russell6. Ottawa-Carleton7. Leeds & Grenville9. Lanark
10. Frontenac11. Lennox & Addington12. Hastings13. Prince Edward14. Northumberland15. Peterborough16. Victoria18. Durham19. York20. Toronto21. Peel22. Dufferin23. Wellington24. Halton
Census Divisions
25. Hamilton-Wentworth26. Niagara28. Haldimand-Norfolk29. Brant30. Waterloo31. Perth32. Oxford34. Elgin36. Kent37. Essex38. Lambton39. Middlesex40. Huron41. Bruce42. Grey43. Simcoe44. Muskoka46. Haliburton47. Renfrew

Figure 12:
Key map ofpublic health units
01
23
29
32
33
34
02
0304
05
06
07
08
09
10
10
11
12
13
14
15
16
17
18
19
20
21
22
24
25
26
27
28
30
31
35
36
37
01. Algoma02. Brant03. Bruce-Grey-Owen Sound04. Durham05. Eastern Ontario06. Elgin-St. Thomas07. Windsor-Essex08. Toronto09. Haldimand-Norfolk10. Haliburton-Kawartha-Pine Ridge11. Halton12. Hamilton-Wentworth13. Hastings-Prince Edward14. Huron15. Kent-Chatham16. Kingston-Frontenac-Lennox-Addington17. Lambton18. Leeds-Grenville-Lanark19. Middlesex-London20. Muskoka-Parry Sound21. Niagara22. North Bay and District23. Northwestern24. Ottawa-Carleton25. Oxford26. Peel27. Perth28. Peterborough29. Porcupine30. Renfrew31. Simcoe32. Sudbury and District33. Thunder Bay34. Timiskaming35. Waterloo36. Wellington-Dufferin-Guelph37. York
Appendix C.Ontario Public Health Units (PHUs)
Cancer Care Ontario 16
Breast Cancer in Ontario

Cancer Care Ontario 17
Breast Cancer in Ontario
Appendix C (continued). Ontario Public Health Units (PHUs) showing correspondingcensus divisions
Public Health Unit Census divisions
Algoma AlgomaBrant BrantBruce-Grey-Owen Sound Bruce
GreyDurham DurhamEastern Ontario Prescott and Russell
Stormont, Dundas and GlengarryElgin-St. Thomas ElginHaldimand-Norfolk Haldimand-NorfolkHaliburton-Kawartha-Pine Ridge Haliburton
NorthumberlandVictoria
Halton HaltonHamilton-Wentworth Hamilton-WentworthHastings-Prince Edward Hastings
Prince EdwardHuron HuronKent-Chatham KentKingston-Frontenac-Lennox-Addington Frontenac
Lennox and AddingtonLambton LambtonLeeds-Grenville-Lanark Lanark
Leeds and GrenvilleMiddlesex-London MiddlesexMuskoka-Parry Sound Muskoka
Parry SoundNiagara NiagaraNorth Bay and District NipissingNorthwestern Kenora
Rainy RiverOttawa-Carleton Ottawa-CarletonOxford OxfordPeel PeelPerth PerthPeterborough PeterboroughPorcupine CochraneRenfrew RenfrewSimcoe SimcoeSudbury Manitoulin Island
Sudbury DistrictSudbury R.M.
Thunder Bay Thunder BayTimiskaming TimiskamingToronto TorontoWaterloo WaterlooWellington-Dufferin-Guelph Dufferin
WellingtonWindsor-Essex EssexYork York
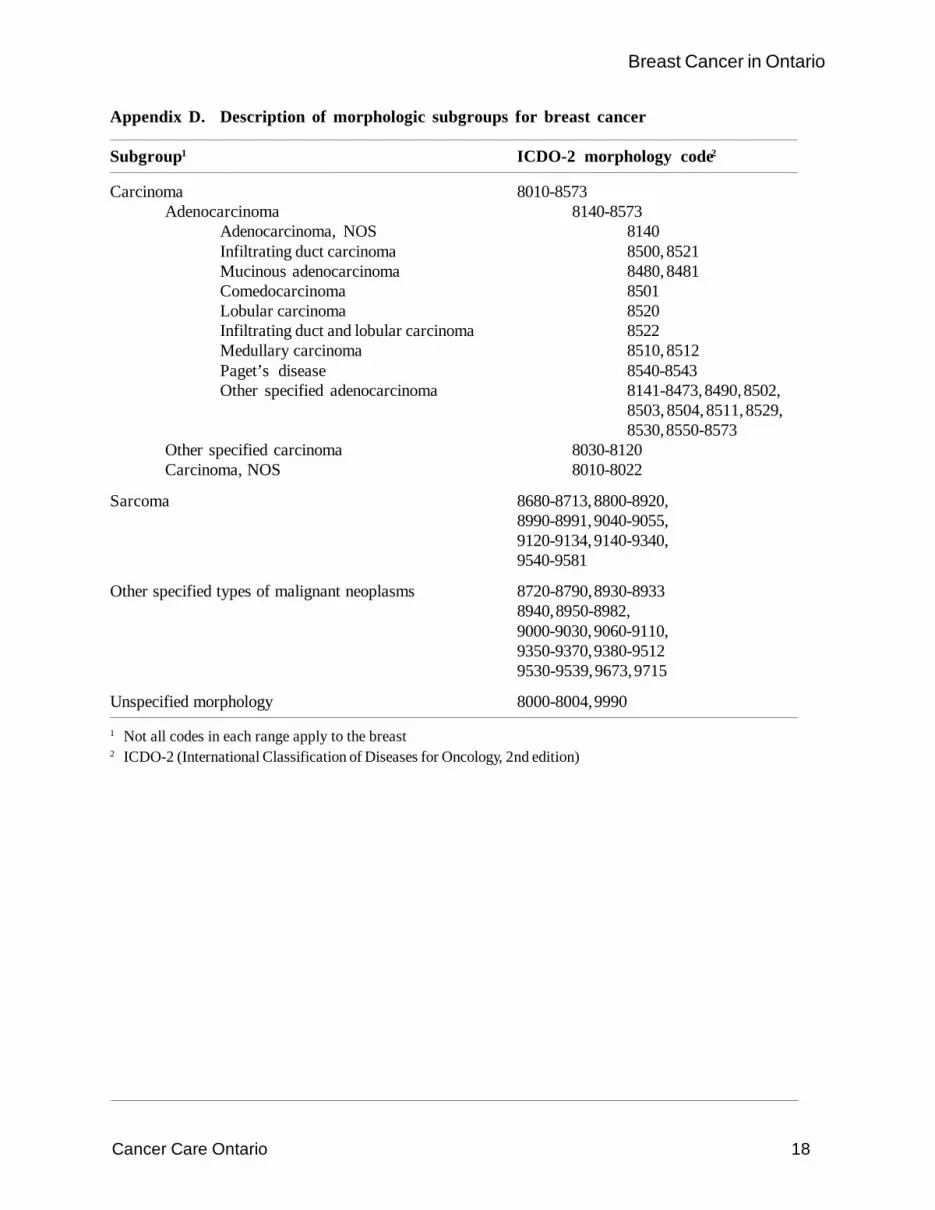
Cancer Care Ontario 18
Breast Cancer in Ontario
Appendix D. Description of morphologic subgroups for breast cancer
Subgroup1 ICDO-2 morphology code2
Carcinoma 8010-8573Adenocarcinoma 8140-8573
Adenocarcinoma, NOS 8140Infiltrating duct carcinoma 8500, 8521Mucinous adenocarcinoma 8480, 8481Comedocarcinoma 8501Lobular carcinoma 8520Infiltrating duct and lobular carcinoma 8522Medullary carcinoma 8510, 8512Paget’s disease 8540-8543Other specified adenocarcinoma 8141-8473, 8490, 8502,
8503, 8504, 8511, 8529,8530, 8550-8573
Other specified carcinoma 8030-8120Carcinoma, NOS 8010-8022
Sarcoma 8680-8713, 8800-8920,8990-8991, 9040-9055,9120-9134, 9140-9340,9540-9581
Other specified types of malignant neoplasms 8720-8790, 8930-89338940, 8950-8982,9000-9030, 9060-9110,9350-9370, 9380-95129530-9539, 9673, 9715
Unspecified morphology 8000-8004, 9990
1 Not all codes in each range apply to the breast2 ICDO-2 (International Classification of Diseases for Oncology, 2nd edition)