brandenburgische technische universität cottbus
TRANSCRIPT

We would like to thank our sponsors for supporting us to make thisconference possible:
Brandenburgische Technische Universitat Cottbus
Brandenburgische Technische Universitat Cottbus –Lehrstuhl fur Marketing und Innovationsmanagement
Holiday Inn Cottbus
Klaus-Steilmann-Institut fur Innovation und Umweltan der BTU Cottbus
MLP AG - Geschaftsstelle Cottbus
MTU Maintenance Berlin-Brandenburg GmbH,Ludwigsfelde
Scicon Wissenschaftliche UnternehmensberatungGmbH, Karlsruhe - Bielefeld - Bern
Sparkasse Spree-Neiße, Cottbus
Synergy Microwave Corporation, New Jersey
Volkswagen AG, Wolfsburg
and various producers of Scottish single malt whisky, e.g: Aberfeldy,Ardbeg, Isle of Arran, Balblair, Ben Nevis, Benromach, Bruichladdich,Glenfarclas, Glengoyne, Glenlivet, Glenmorangie, Glenmorangie MadeiraFinish, Glen Moray, Glenrothes, Glenturret, Loch Lomond, Macallan, OldPulteney, Speyburn, Springbank, Talisker and Tomatin. Grateful thanks tothe producers and their German distributors, including Bacardi-Martini.

Contents
1 General Information . . . . . . . . . . . . . . . . . . . . . . . . . . . . . . . . . . . . . . . . . . . 3
2 Tutorials and Meetings of the Librarians . . . . . . . . . . . . . . . . . . . . . . . 14
3 Conference Program . . . . . . . . . . . . . . . . . . . . . . . . . . . . . . . . . . . . . . . . . . . 16
4 Abstracts (alphabetically sorted) . . . . . . . . . . . . . . . . . . . . . . . . . . . . . . . 35
2

General Information

Ladies and Gentleman,
the following pages provide you with some useful information about the27th Annual Conference of the German Classification Society (GfKl) at theBrandenburg University of Technology Cottbus (BTU Cottbus). It is orga-nized with strong support of the Polish classification society, SKAD (SekcjaKlasyfikacji i Analizy Danych). Apart from challenging and likewise excit-ing scientific contributions we hope to offer you an attractive conference sitecomprising a rich social program.
We would be pleased to welcome you as a participant of our conferencebetween March 12 and 14, 2003.
Furthermore, let us point out the interesting tutorials and meetings of thelibrarians between March 11 and 12, 2003 which is closely connected to theconference.
With best regards
Daniel Baier (Local Organizer, BTU Cottbus),Klaus-Dieter Wernecke (Program Committee Chair, HU Berlin),Krzysztof Jajuga, Andrzej Sokolowski (Polish Co-Organizers),Hans Joachim Hermes (Co-Organizer for the Librarians)
Local Organizers
Prof. Dr. Daniel Baier, Dipl.-Ing. Michael Brusch,Lehrstuhl fur Marketing und Innovationsmanagement,BTU Cottbus, Post Box 10 13 44, D-03013 Cottbus,Phone: ++49 355 69-2922, Fax: -2921, Mail: [email protected],URL: www.marketing.tu-cottbus.de
Program Committee
Prof. Dr. K.-D. Wernecke (Chair, HU Berlin)Prof. Dr. D. Baier (BTU Cottbus)Prof. Dr. H.-H. Bock (RWTH Aachen)Prof. Dr. K. Fellbaum (BTU Cottbus)Prof. Dr. O. Gascuel (Universite Montpellier)Prof. Dr. H. Goebl (Universitat Salzburg)Prof. Dr. K. Jajuga (Wroclaw University of Economics)Prof. Dr. P. Martus (FU Berlin)Prof. Dr. A. Okada (Rikkyo Univerity Tokyo)Prof. Dr. O. Opitz (Universitat Augsburg)Prof. Dr. M. Schader (Universitat Mannheim)Prof. Dr. A. Sokolowski (Cracow University of Economics)Prof. Dr. M. Uhrig-Homburg (Universitat Karlsruhe)Prof. Dr. C. Weihs (Universitat Dortmund)
4

Conference location
BTU CottbusAudimax BuildingKarl- Marx- Straße 17D-03044 Cottbus
Conference Office
Audimax Building - SR 1 (Seminar Room 1)Tel.: ++49 355 692922, Fax: ++49 355 692921Mail: [email protected], URL: www.gfkl2003.deOpening hours: 08.00-18.00 (March 12th-14th,2003)
Conference languages are English and German.
Registration
In advance: http://www.marketing.tu-cottbus.de/gfkl/onlinereg.html
On the spot: March 12-14, 2003 in the conference office
Each participant will receive an abstract volume containing the final pro-gram, a name tag and further information. Materials will be handed out inthe conference office.
Registration Fees (after 2003/2/17)
Members of GfKl and associated Societies (incl. proceedings) 100 EURNon-Members (incl. proceedings) 130 EURDaily visitors, Polish PhD students (without proceedings) 40 EURLibrarians (without proceedings) 40 EUR
Bank account
Account name GfKl 2003Account no. 3204 107 719Bank Sparkasse Spree-Neiße, CottbusBank identifier code (BLZ) 180 500 00for international payment:BIC WELA DE D1CBNBank Westdeutsche Landesbank DusseldorfSwift-address WELA DE DD
5

Information for speakers
Please contact the conference office at least two hours before your sched-uled lecture. The lecture time, as scheduled in the conference program, in-cludes five minutes for discussion. The standard equipment of the lecturerooms consists of a blackboard, an overhead-projector and a beamer. Addi-tional equipment is available on request.
Deadline for paper submission for the proceedings volume isMarch 31th,2003. Please eMail an archive with your paper and all figures (postscriptformat) to: [email protected].
For detailed formatting instructions please refer to www.gfkl2003.de
Information for chairpersons
Please contact the conference at least 20 minutes before the session forpossible changes in the program.
General assembly of the GfKl
The general assembly is hold on Thursday, March 13, 17.00-18.00, HS A(Horsaal A), Audimax Building.
Accommodations
For further information please refer to our web-site:
http://www.marketing.tu-cottbus.de/gfkl/accomodation.htm
Local Traffic
The Audimax Building of the BTU Cottbus is not far from the centre ofCottbus. It takes approximately 10 minutes by foot (see the map).
6

City Plan - Accommodation in Cottbus
7
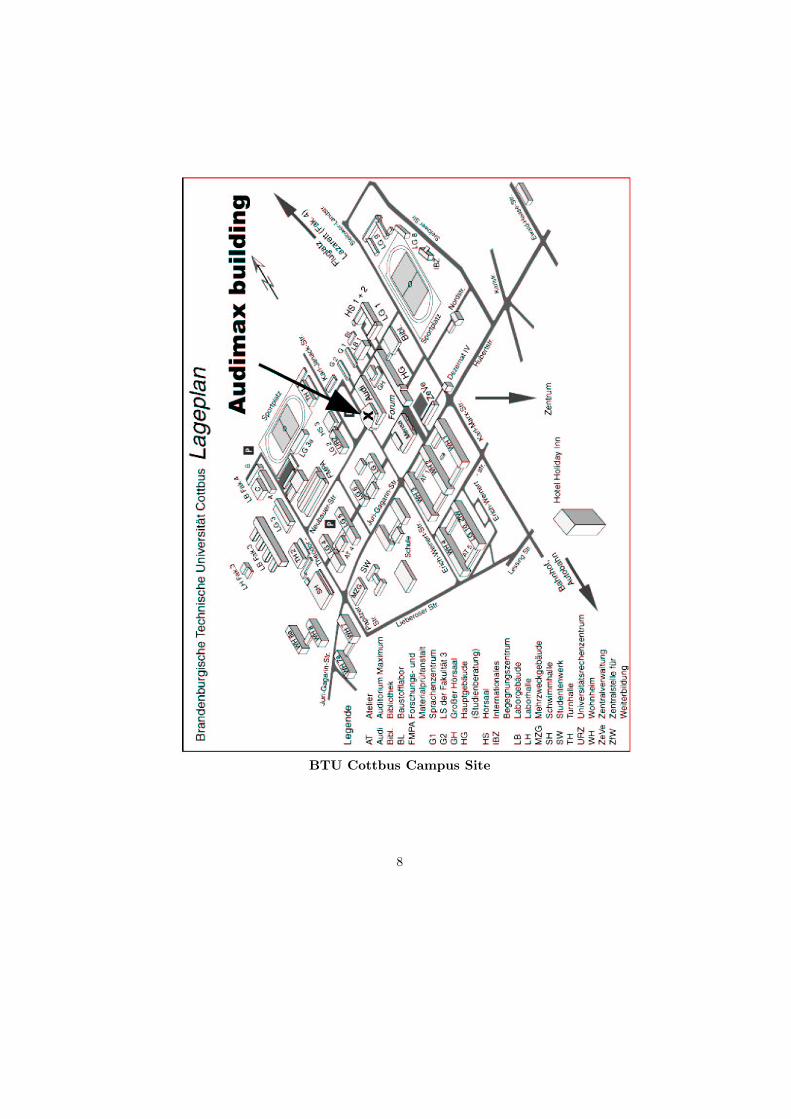
BTU Cottbus Campus Site
8

The conference takes place at the BTU campus, in the Audimax Building.
Audimax Building Ground Floor
The seminar rooms are situated on the first floor of the Audimax Building.
Audimax Building First Floor
9

Social Program
Day Time Program
Tuesday, March 11 19.00-21.00 GET-TOGETHER
Wednesday, March 12 14.00-16.30 SIGHT-SEEING IN COTTBUS19.00-21.00 CITY’S GREETING
Thursday, March 13 08.00-13.00 CLOISTRAL BREWERY13.00-17.00 ACTION ON KARTS14.00-16.30 HISTORY AND LANDSCAPE17.00-18.00 GENERAL ASSEMBLY18.00-19.00 WHISKY TASTING19.00-22.00 CONFERENCE DINNER
Friday, March 14 12.50-13.30 INFORMAL FAREWELL
We try to arrange a Cargolifter visit on Thursday (insecure due to firm’seconomic problems, information at the conference office).
GET-TOGETHER (Tuesday, March 11, 19.00-21.00)
Place: ”Paulaner Brau”, Sandower Straße 57, 03046 Cottbus, in a restau-rant, situated in the picturesque Old Town of Cottbus, near Altmarkt andOberkirche
SIGHT-SEEING IN COTTBUS (Wednesday, March 12, 14.00-16.00)
The sight-seeing-tour will take approximately two hours. You see Cottbus’most important historical and modern buildings. The tour is guided by theCottbuser Postkutscher.Price: 5 EUR, Starting point: Audimax building
CITY’S GREETING (Wednesday, March 12, 19.00-21.00)
Place: Großer Festsaal im Stadthaus (Altmarkt 21), please be on time.
CLOISTRIAL BREWERY (Thursday, March 13, 08.00-13.00)
The history of Neuzeller Kloster Brau begins in the year 1416, when theyearly register of the monks records the first delivery of grains and hops tobe used to brewery beer. Unofficially, beer was brewed here as early as 1268,but only on a small scale. The Neuzeller beer was in the former times and isstill today again one of the best beers in the world because of its high qualityand the maintenance of the monastery prescriptions. We will travel by bus.Price: 20 EUR, Starting point: Audimax Building
10

ACTION ON KARTS (Thursday, March 13, 13.00-17.00)
We will offer you the possibility to have action and fun at the KarttrackLoschen. The trip by bus to Loschen takes about 45 minutes. You will havethe chance to test your ”Art of driving” for two hours.Price: The fee transport amount 10 EUR. On the karttrack you have to payas much as you ”ride”. Starting point: Audimax Building
HISTORY AND LANDSCAPE (Thursday, March 13, 14.00-16.30)
The second seight-seeing-tour brings us to the beautiful Park Branitz,situated in the south of Cottbus’ city. It is where Furst Puckler (1785-1871)created from 1811 the beautiful landscape of Park Branitz. The tour contin-ues to the Branitz castle.Starting point will be the Audimax Building.Price: 10 EUR (incl. fee for public transport, entrance and guided tour, Start-ing point: Audimax building
CARGOLIFTER (Thursday, March 13, insecure)
The Cargolifter dockyard is one of the most forward-looking projects inBrandenburg and even in Germany. But the huge amount of costs matteredthe financial disaster of Cargolifter. Because of the insolvency it is impossibleto guarantee the trip to Cargolifter.
WHISKY TASTING (Thursday, March 13, 18.00-19.00)
Place: Audimax Building, HS A
CONFERENCE DINNER (Thursday, March 13, 19:00-22:00)
Place: Spreewald/Burg Waldhotel ”Zur Eiche”Price: 25 EUR (incl. the transfer to Burg by bus, a welcome-drink, the pro-gram and the Spreewald-buffet)The busses depart at the Audimax building. Please be on time.
INFORMAL FAREWELL (Friday, March 14, 12.50-13.30)
Place: Foyer of the Audimax Building
11

Lunch break: Mensa
For lunch use the Mensa Building near-by the Audimax Building. Thereyou will find a Cafeteria, a Brasserie and the Mensa. The Mensa is situatedon the first floor.
Opening hours: Mensa: 10.45-14.30Cafeteria: 07.00-21.00Brasserie: 18.00-24.00
Mensa Building Ground Floor
Mensa Building First Floor
12

Lunch break: Cafes und Restaurants
Other possibilities for lunch or dinner are nice cafes and restaurants inCottbus. Here are some examples.
Cafes and Restaurants in Cottbus
13

Tutorials and Meetings of the Librarians

Tuesday, March 11, 2003
Bibliothekarische Fortbildung: Sacherschließung, Audimax 2
10.00-10.15 Hermes (Chemnitz): Begrußung, Einfuhrung10.15-11.15 Ceynowa (Gottingen): Leitreferat: Sacherschließung - Konnen
wir uns die noch leisten? Suche nach Antworten mit den Mit-teln des Controlling
11.15-12.15 Peters (Hamburg): Intellektuelle Indexierung und automatis-che Verfahren in der Gruner + Jahr-Dokumentation
12.15-13.15 Flachmann (Munster): Effiziente Sacherschließung als Kern-aufgabe von Bibliotheken: Perspektiven und Probleme leis-tungsgerechter bibliothekarischer Produkte
Lunch Break14:00-14.45 Zimmermann (Saarbrucken): Moglichkeiten einer computerge-
stutzten Sacherschließung
14.45-15.30 Wolf (Konstanz): Ubernahme von Sacherschließungselementenaus dem Bibliotheks-Verbund Bayern (BVB)
15.30-16.45 Pika (Zurich): Sacherschließung an der ETH Zurich16.45- Hermes (Chemnitz): Abschlussdiskussionanschließend Warnatz (Cottbus): Rundgang durch die Universitatsbiblio-
thek einschließlich Neubau
Wednesday, March 12, 2003
Bibliothekarische Sektion, Audimax 2
10.15-11.15 Lorenz (Munchen), Pika (Zurich)): Arbeitsgruppe De-zimalklassifikationen: Anwenderberichte, DACH [Deutsch-land/Osterreich/Schweiz], Neues zu Dezimalklassifikationen
11.15-12.15 Preuss (Koln): Die DDC ubersetzen: ein Werkstattbericht12.00-12.45 Braune-Egloff (Berlin): Sacherschließung im KOBV: Erfahrun-
gen mit einem dezentral-kooperativen KonzeptLunch Break14:00-14.30 Zimmermann (Wien): Meta-Klassifikation und Kategorien fur
interdisziplinare Forschung14.30-15.00 Lindner (Cottbus): Surfen in Internetquellen. Fortgeschrittene
Suchtechniken. Das Informationsportal Cottbusanschließend Warnatz (Cottbus): Rundgang durch die UUniversitatsbiblio-
thek einschließlich Neubau
15

Conference Program


Announcement for Dr. David Wishart’s guided Whiskey tasting
20

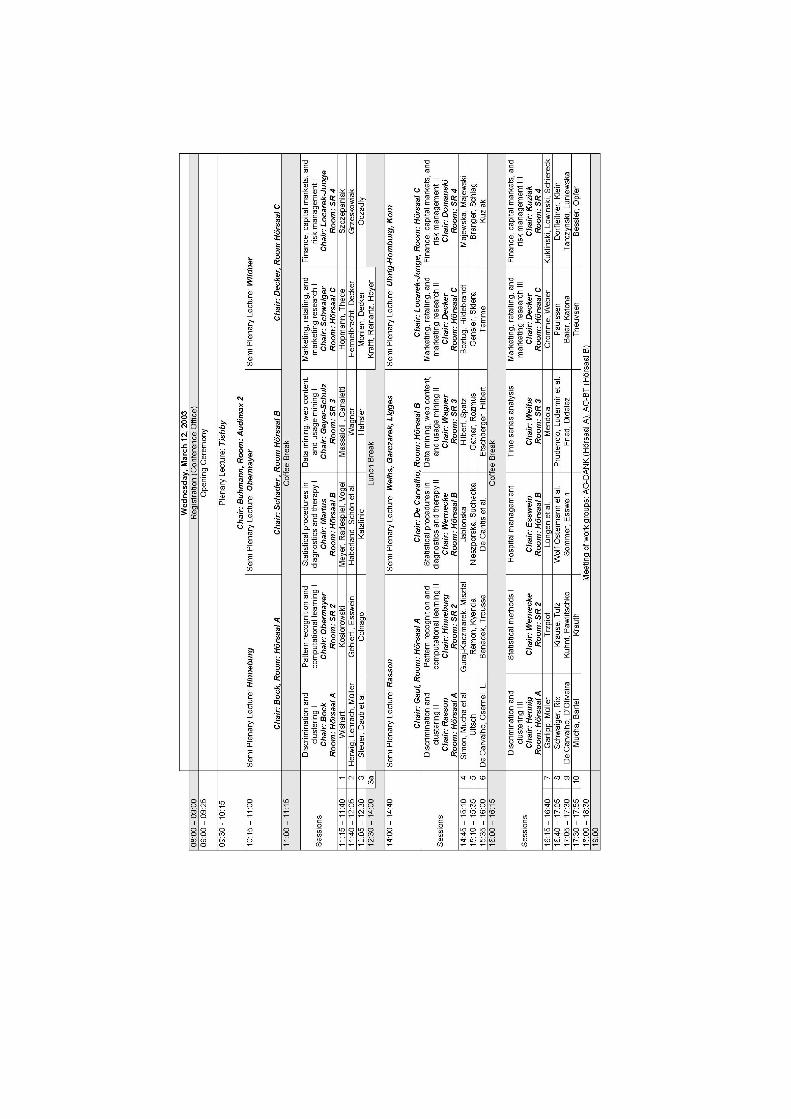
Wednesday, March 12, 2003
08.00-09.00 REGISTRATION (SR 1)
09.00-09.25 OPENING CEREMONY (Audimax 2)
PLENARY LECTURE (Audimax 2, Chair: Buhmann)09.30-10.15 Tishby: Principles of Biological Information Processing
THREE PARALLEL SEMI PLENARY LECTURES:
Semi Plenary Lecture (HS A, Chair: Bock)10.15-11.00 Hinneburg: Finding Clusters in Projections of High-
dimensional Data
Semi Plenary Lecture (HS B, Chair: Schader)10.15-11.00 Obermayer: New Methods for Supervised and Unsupervised
Learning
Semi Plenary Lecture (HS C, Chair: Decker)10.15-11.00 Wildner: From Figures to Information: Data Analysis in Mar-
keting Research
SIX PARALLEL SESSIONS:
Discrimination and Clustering I (HS A, Chair: Bock)11.15-11.40 Wishart: Bootstrap Validation for Hierarchical Cluster Analy-
sis11.40-12.05 Herwig, Lehrbach, Muller: An Information Theoretic Measure
for Validating Clustering Results12.05-12.30 Steuer, Daub, Selbig, Kurths: The Mutual Information as a
Measure of Distance between Variables
Pattern Recognition and Computational Learning I (SR 2, Chair:Obermayer)11.15-11.40 Kosiorowski: Individual Rationality Versus Group Rationality
in Statistical Modeling Issues11.40-12.05 Gehlert, Esswein: The Importance of the Eigenvalue to Define
a Configuration of the Categories of a Group of QualitativeVariable
12.05-12.30 Colnago: The Importance of the Eigenvalue to Define a Con-figuration of the Categories of a Group of Qualitative Variable
21

Wednesday, March 12, 2003
Statistical procedures in diagnostics and therapy I (SR 2, Chair:Martus)11.15-11.40 Meyer, Radespiel, Vogel: Probabilistisches Record-Linkage mit
anonymisierten Krebsregistermeldungen11.40-12.05 Haberland, Schon, Bertz, Gorsch: Vollzahligkeitsschatzungen
von Krebsregisterdaten mittels log-linearer Modelle undneueste Ergebnisse
12.05-12.30 Katalinic: Wie konnen Daten aus deutschen Krebsregistern furForschungsprojekte genutzt werden?
Data mining, web content, and usage mining I (SR 3, Chair: Geyer-Schulz)11.15-11.40 Massaioli, Canaletti: Document Mining: Semantics from Semi-
otics11.40-12.05 Wagner: Mining Promising Qualification Patterns12.05-12.30 Hahsler: Generating Synthetic Transaction Data for Tuning
Usage Mining Algorithms
Marketing, Retailing, and Market Research I (HS C, Chair:Schwaiger)11.15-11.40 Hopmann, Thede: Applicability of Customer Churn Forecasts
in a Non-contractual Setting11.40-12.05 Hermelbracht, Decker: Wettbewerbsanalyse mittels rang-
kodierter Daten12.05-12.30 Monien, Decker: Vertriebsdatenanalyse mittels Support-
Vektor-Maschinen12.30-12.55 Krafft, Reinartz, Hoyer: Measuring the Customer Relationship
Management Construct and Relating it to Performance Out-comes
Finance, Capital Markets, and Risk Management I (SR 4, Chair:Locarek-Junge)11.15-11.40 Szczepaniak: Approximation of Distributions of Treasury
Yields and Interbank Rates by Means of α-stable and Hyper-bolic Distributions
11.40-12.05 Grzeskowiak: Detection of Heteroscedasticity: Application toSecurity Characteristic Line
12.05-12.30 Oczadly: Comparing Neural Networks to some classical modelsapplied in financial data analysis
22

Wednesday, March 12, 2003
THREE PARALLEL SEMI PLENARY LECTURES:
Semi Plenary Lecture (HS A, Chair: Gaul)14.00-14.45 Rasson: Stratification Before Discriminant Analysis: a Must?
Semi Plenary Lecture (HS B, Chair: De Carvalho)14.00-14.45 Weihs, Garczarek, Ligges: Prediction of Notes from Vocal Time
Series: An Overview
Semi Plenary Lecture (HS C, Chair: Locarek-Junge)14.00-14.45 Uhrig-Homburg, Korn: Do Lead-Lag Effects Affect Derivative
Pricing?
SIX PARALLEL SESSIONS:
Discrimination and clustering II (HS A, Chair: Rasson)14.45-15.10 Simon, Mucha, Bruggemann: Model-based Cluster Analysis
Applied to Flow Cytometry Data15.10-15.35 Ultsch: UP Clustering: a Density Based Cluster Algorithm for
Data Mining15.35-16.00 De Carvalho, Csernel, Lechevallier: Partitioning of Con-
strained Symbolic Data based on Dissimilarity Functions
Pattern Recognition and Computational Learning II (SR 2, Chair:Hinneburg)14.45-15.10 Guraj-Kaczmarek, Misztal: Nonparametric Pattern Recogni-
tion Methods and Their Applications15.10-15.35 Remon, Kyenda: Dynamic Recognition of Objects: the Study
Case of Mathematical Formulae15.35-16.00 Benedek, Trousse: Adaptation of Self-Organizing Maps for
Case Indexing
23

Wednesday, March 12, 2003
Statistical procedures in Diagnostics and Therapy II (HS B, Chair:Wernecke)14.45-15.10 Jablonska: Correlation Between some Disease Features and
Prognosis in the Adult Non-Hodgkin‘s Lymphoma Patients15.10-15.35 Nieszporska, Suchecka: Measurement of the Quality of Health
from Polish Patients Point of View - EQ-5D as a Measure ofHealth State of a Population of any Hospital.
15.35-16.00 De Cantis, Mendola, Iannitto: Adaptive ABVD Chemotherapyfor Treatment of Early Stage Hodgkin’s Disease.
Data Mining, Web Content, and Usage Mining II (SR 3, Chair:Gatnar)14.45-15.10 Hilbert, Spatz: Ein alternativer PRE-Pruning-Ansatz fur
Entscheidungsbaume15.10-15.35 Gatnar, Rozmus: Data Mining-Polish Experience15.35-16.00 Etschberger, Hilbert: Auswahl exogener Variablen in der Re-
gression mit Hilfe Genetischer Algorithmen
Marketing, Retailing, and Market Research II (HS C, Chair: Skiera)14.45-15.10 Boztug, Hildebrandt: Empirical Test of the Consumer Behavior
Theory of Price Valuation Using a Semiparametric Approachand Reference Prices
15.10-15.35 Gensler, Skiera: Discrete Versus Continuous Representation ofHeterogeneity in Conjoint and Choice-Based Conjoint Models
15.35-16.00 Temme: Assessing Measurement Invariance Using Confirma-tory Factor Models for Finite Normal Mixtures
Finance, Capital Markets, and Risk Management II (SR 4, Chair:Domanski)14.45-15.10 Majewska, Majewski: Testing of Warrants Market Efficiency
on the Warsaw Stock Exchange15.10-15.35 Branger, Schlag: Why is the Index Smile so Steep?15.35-16.00 Kuziak: Model Risk in Market Risk Management
24

Wednesday, March 12, 2003
SIX PARALLEL SESSIONS:
Discrimination and Clustering III (HS A, Chair: Hennig)16.15-16.40 Garlipp, Muller: Simple Consistent Cluster Methods Based on
Redescending M-Estimators with an Application to Edge Iden-tification in Images
16.40-17.05 Schwaiger, Rix: An Exchange Algorithm for Two-Mode Clus-ter Analysis
17.05-17.30 De Carvalho, D’Oliveira: Symbolic Classifier with Convex HullBased Dissimilarity Function
17.30-17.55 Mucha, Bartel: ClusCorr98 - Adaptive Clustering, Classifica-tion, Multivariate Visualisation, and Validation of Results
Statistical Methods I (SR 2, Chair: Hinneburg )16.15-16.40 Trzpiot: Partial Moments and Negative Moments in Ordering
Asymmetric Distribution16.40-17.05 Krause, Tutz: Simultaneous Selection of Predictors and
Smoothing Parameters in Additive Models17.05-17.30 Kuhnt, Pawlitschko: Outlier Identification Rules for General-
ized Linear Models17.30-17.55 Krauth: Multiple Change-Points and Alternating Segments in
Binary Trials with Dependence
Hospital Management (HS B, Chair: Esswein)16.15-16.40 Lungen, Wolf-Ostermann, Lauterbach: Differences in the Costs
of Teaching and Non-Teaching Hospitals in Germany16.40-17.05 Wolf-Ostermann, Lungen, Mieth, Lauterbach: An Empirical
Study Evaluating the Organization and Costs of Hospital Man-agement
17.05-17.30 Sommer, Esswein: Klassifikation von Anforderungen anKrankenhauser im Rahmen der DRG-Einfuhrung
Time Series Analysis (SR 3, Chair: Weihs)16.15-16.40 Mendola: Dynamical Missing Data in Environmental Series.
An Unlucky Situation16.40-17.05 Prudencio, Ludemir, De Carvalho: Using the Meta-Prototype
Approach to Select Time Series Models17.05-17.30 Fried, Didelez: Partial Correlation Graphs and Latent Variable
Analysis for Multivariate Time Series
25

Wednesday, March 12, 2003
Marketing, Retailing, and Market Research III (HS C, Chair:Decker)16.15-16.40 Cromme, Weber: Fuzzy Optimization Applications in Market-
ing16.40-17.05 Paulssen: Ein verhaltenswissenschaftliches Modell zur
Erklarung von Kundenbindung in Business-to-BusinessGeschaftsbeziehungen
17.05-17.30 Baier, Katona: Customer Relationship Management in theTelecommunications and Utilities Markets
17.30-17.55 Theuvsen: The Prospects of Electronic Commerce: The Caseof the Food Industry
Finance, Capital Markets, and Risk Management III (SR 4, Chair:Kuziak)16.15-16.40 Kuklinski, Lowinski, Schiereck: Zur Renditeentwicklung von
borsennotierten deutschen Familienunternehmen16.40-17.05 Dorfleitner, Klein: Technische Analyse als Mittel des Risiko-
managements: Selbsttauschung oder rationale Strategie?17.05-17.30 Tarczynski, Luniewska: Generalised Distance Measure as a
Method of Classification of the Companies Listed on the War-saw Stock Exchange
17.30-17.55 Bessler, Opfer: Eine empirische Untersuchung zur Bedeutungmakrookonomischer Einflussfaktoren auf Aktienrenditen amdeutschen Kapitalmarkt
18.00-18.30 Meeting of work groups:AG-DANK (HS A)AG-BT (HS B)
26

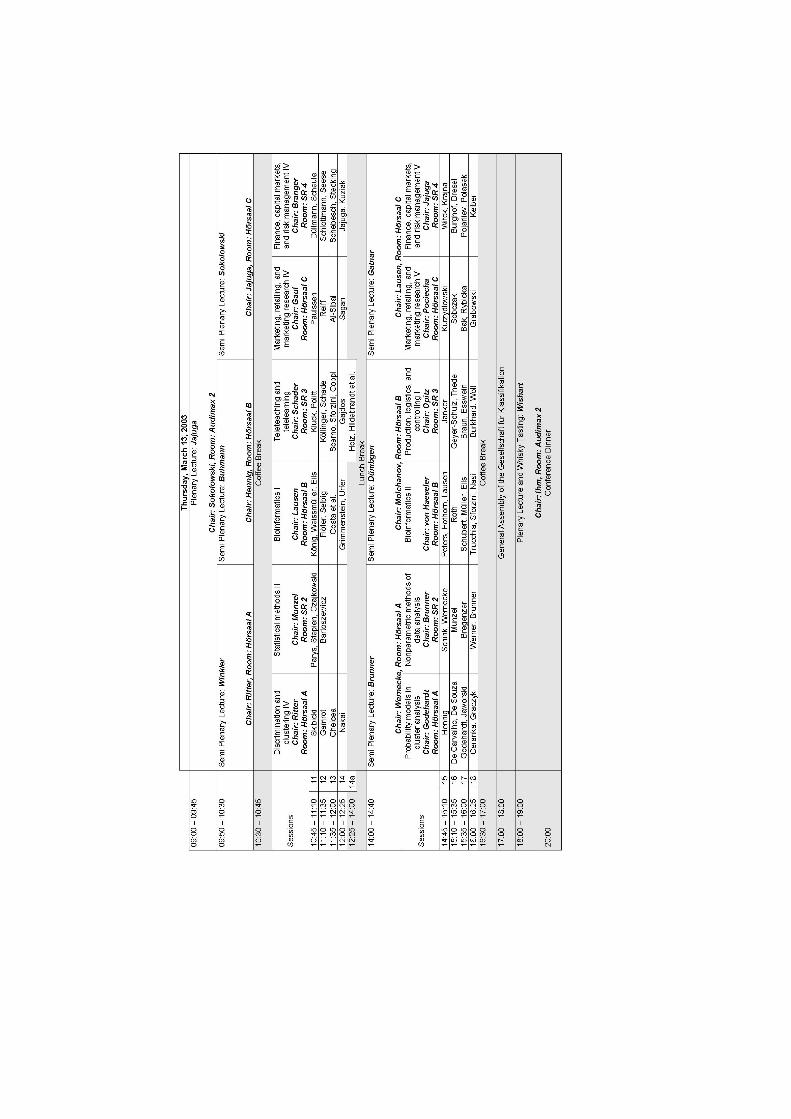
Thursday, March 13, 2003
PLENARY LECTURE (Audimax 2, Chair: Sokolowski)09.00-09.45 Jajuga: Tail Dependence in Multivariate Data
THREE PARALLEL SEMI PLENARY LECTURES:
Semi Plenary Lecture (HS A, Chair: Ritter)09.50-10.30 Winkler: Variational Approaches to the Segmentation of Time
Series
Semi Plenary Lecture (HS B, Chair: Hennig)09.50-10.30 Buhmann: Statistical Learning for Data Clustering: Modelling,
Optimization and Validation
Semi Plenary Lecture (HS C, Chair: Jajuga)09.50-10.30 Sokolowski: Mode Estimation
SIX PARALLEL SESSIONS:
Discrimination and clustering IV (HS A, Chair: Ritter)10.45-11.10 Skibicki: On Stratification Using Auxiliary Variables and Dis-
criminant Method11.10-11.35 Gamrot: On Application of a Certain Clustering Procedure
to Mean Value Estimation under Double Sampling for Nonre-sponse
11.35-12.00 Chelcea: Agglomerative 2-3 Hierachical Clustering: TheoreticalImprovements and Tests
12.00-12.25 Nakai: Classification of Career-lifestyle Patterns of Women
Statistical methods II (SR 2, Chair: Munzel)10.45-11.10 Parys, Stepien, Czajkowski: Some Remarks on Closed Multiple
Tests Procedures11.10-11.35 Bartoszewicz: Modelling the Claim Count with Poisson Re-
gression and Negative Binomial Regression
27

Thursday, March 13, 2003
Bioinformatics I (HS B, Chair: Lausen)10.45-11.10 Konig, Weissmuller, Eils: Applying Nearest Neighbour Based
Clustering Algorithms on Metabolic Networks and Gene Ex-pression Data
11.10-11.35 Floter, Selbig: Finding pathways in Decision Forests11.35-12.00 Costa, De Carvalho, De Souto: Validation of Clustering Meth-
ods for Gene Expression Analysis12.00-12.25 Grimmenstein, Urfer: Analyzing Protein Data with the Gen-
erative Topographic Mapping Approach
Teleteaching and Telelearning (SR 3, Chair: Schader)10.45-11.10 Kluck, Politt: Preconditions for an User-Friendly Internet Por-
tal on Education: Conclusions from an Qualitative Study ofTypical Search Strategies
11.10-11.35 Kollinger, Schade: Typical Characteristics of E-LearningAdopters-A Multivariate Analysis
11.35-12.00 Scarno, Sforzinz, Coppi: Does the Web Dominate Web Users?A Relation Between Game Theory and Web Mining
12.00-12.25 Gajdos: Utilization of Information Technics in Teleworking andTelelearning. Perspectives Expansion in Poland.
12.25-12.40 Holz, Hildebrandt, Merting, Schonefeldt: Hydro-Europe: Webbased Collaborative Learning and Water-Engineering
Marketing, Retailing, and Market Research IV (HS C, Chair: Gaul)10.45-11.10 Paulssen: Moderatoreffekte sozio- und unternehmensde-
mographischer Variablen auf den Zusammenhang zwischenKundenzufriedenheit und Kundenbindung
11.10-11.35 Reiff: Developing New Marketing Strategies in the ProductSegment of Industrial Gas Turbines
11.35-12.00 Al-Sibai: Evaluation of the Forecast Validity of Product Clinicsfor New Product Launches - Example Automotive Industry
12.00-12.25 Sagan: Structural Model of Product Meaning Using Means-endApproach
28

Thursday, March 13, 2003
Finance, Capital Markets, and Risk Management IV (SR 4, Chair:Branger)10.45-11.10 Dullmann, Scheule: Asset Correlation of German Corporate
Obligors: Its Estimation, Its Drivers and Implications for Reg-ulatory Capital
11.10-11.35 Schlottmann, Seese: Discovery of Risk-Return Efficient Struc-tures in Middle-Market Credit Portfolios
11.35-12.00 Schebesch, Stecking: SVM for Credit Scoring: Extension to NonStandard Cases
12.00-12.25 Jajuga, Kuziak: Copula Analysis for Bivariate Distributions -Some Empirical Studies in Finance
THREE PARALLEL SEMI PLENARY LECTURES:
Semi Plenary Lecture (HS A, Chair: Wernecke)14.00-14.40 Brunner: Nonparametric Methods in Factorial Designs
Semi Plenary Lecture (HS B, Chair: Molchanov)14.00-14.40 Dumbgen: P-Values for Classification
Semi Plenary Lecture (HS C, Chair: Lausen)14.00-14.40 Gatnar: Randomization in Aggregated Classification Trees
SIX PARALLEL SESSIONS:
Probability Models in Cluster Analysis (HS A, Chair: Godehardt)14.45-15.10 Hennig: Breakdown Points for ML-Estimators in Mixture
Models15.10-15.35 De Carvalho, Souza: Dynamical Clustering with Non-
Quadratic Adaptive Distance for Interval Data15.35-16.00 Godehardt, Jaworski: Random Graph and Hypergraph Models
for Classification16.00-16.25 Ceranka, Graczyk: Estimation of Parameters With Different
Variances of Errors in Model of Chemical Balance WeightingDesign
29

Thursday, March 13, 2003
Nonparametric Methods of Data Analysis (SR 2, Chair: Brunner)14.45-15.10 Schink, Wernecke: Comparison of Semi- and Nonparamet-
ric Methods for the Analysis of Longitudinal Data15.10-15.35 Munzel: Paired Rank Tests15.35-16.00 Bregenzer: Nonparametric Analysis of Multiple Endpoints -
Overview of Methods and Availability of Software Solutions16.00-16.25 Werner, Brunner: Confidence Intervals for Nonparametric
Treatment Effects in Designs with Repeated Measures
Bioinformatics II (HS B, Chair: von Haeseler)14.45-15.10 Peters, Hothorn, Lausen: Genomic Data Analysis - Evalu-
ation of Classification by the R Package ipred15.10-15.35 Roth: Gene Selection in Microarray Experiments by
Bayesian Inference15.35-16.00 Schubert, Muller, Eils: Understanding the Classification of
Tumors with a Support Vector Machine16.00-16.25 Trucchia, Sforzini, Nasi: From Database to the Analysis of
Genome profile: the case of Myc
Production, Logistics, and Controlling I (SR 3, Chair: Opitz)14.45-15.10 Janker: Klassifikation und Reprasentation von Lieferanten
mit der Hauptkomponentenmethode15.10-15.35 Geyer-Schulz, Thede: A Two-Phase Grammar-Based Ge-
netic Algorithm for a Workshop Scheduling Problem15.35-16.00 Braun, Esswein: Zustandsmodellierung im Rahmen der
Konzeption von Produktdatenmanagementsystemen16.00-16.25 Burkhard, Woll: Full Factorial Design, Taguchi Design,
Parameter Search or Genetic Algorithms - different ap-proaches of Design of Experiments in education
30

Thursday, March 13, 2003
Marketing, Retailing, and Market Research V (HS C, Chair:Pociecha)14.45-15.10 Kurzydlowski: The Application of CHAID Algorithm in
Preference Analysis of Chocolates Buyers15.10-15.35 Sobczak: The Concept of Chains as a Tool for MSA Con-
tributing to the International Market Segmentation15.35-16.00 Bak, Rybicka: Discrete Choice Method Application in the
Research of Consumer Preferences16.00-16.25 Grabowski: Handling Missing Values in Marketing Research
Using SOM
Finance, Capital Markets, and Risk Management V (SR 4, Chair:Schierek)14.45-15.10 Witek, Krajna: Strategic Analysis of Bankruptcy Threat on
the Example of the Polish Building Company15.10-15.35 Burghof, Dresel: Value at Risk with Informed Decision
Makers-the Regulators Perspective15.35-16.00 Pojarlev, Polasek: Volatility Forecasts and Value at Risk
Evaluation for the MSCI North America Index16.00-16.25 Keiber: Overconfidence in the Continuous-Time Principal-
Agent Problem
17.00-18.00 GENERAL ASSEMBLY of the Gesellschaft furKlassifikation (HS A)
18.00-19.00 PLENARY LECTURE and WHISKY TASTING(Audimax 2)Wishart: Classification of Single Malt Whiskies by Flavour
31

Friday, March 14, 2003
THREE PARALLEL SEMI PLENARY LECTURES
Semi Plenary Lecture (HS A, Chair: Bock)09.00-09.45 Molchanov: Application of stochastic geometry to clustering
and search
Semi Plenary Lecture (HS B, Chair: Baier)09.00-09.45 Hartmann, W.: Evonetics - a New Scientific Approach to Evo-
lutionary Design and Networking
Semi Plenary Lecture (HS C, Chair: Polasek)09.00-09.45 Leskow: Bootstrap Resampling in Analysis of Time Series
SIX PARALLEL SESSIONS:
Dissimilarities, Scaling, and Clustering structures (HS A, Chair:Blasius)10.00-10.25 Imaizumi: A Modified Gravity-based Multidimensional Un-
folding Model for Preference Data10.25-10.50 Okada, Imaizumi: Joint Space Model for Multidimensional
Scaling of Asymmetric Proximities10.50-11.15 Bove, Rocci: Generalized EG model with Subjective or Exter-
nal Information11.15-11.40 Siarka: Graphical Presentation of Multidimensional Data
Statistical Methods III (SR 2, Chair: Krauth)10.00-10.25 Dahms: Combination of Classification Trees and Logistic Re-
gression to Analyse Animal Management and Disease Data10.25-10.50 Konczak: On the Modification of David-Hellwigs Test10.50-11.15 Queiroz, De Carvalho: An Item-Based Symbolic Approach for
Making Group Recommendations
32

Friday, March 14, 2003
Wearable electronics, smart clothes / Information systems (HSB, Chair: Hartmann)10.00-10.25 Ullsperger: Intelligent Fashion Interfaces. New challenges of
Classifying and Standardizing Context Awareness Systems forSmart Homes, Clothes and Fibres
10.25-10.50 Hartmann, D.: Challenges for Measuring, Assessing and UsingData for Individual ”Smart Fashion”
10.50-11.15 Meinberg, Jakobza:Wissensbasierte Ansatze zur ganzheitlichenEntscheidungsunterstutzung
11.15-11.40 Holz, Hildebrandt, Merting: Hydro-Europe: Web Based Collab-orative Learning and Water-Engineering
Production, Logistics, and Controlling II (SR 3, Chair: Lasch)10.00-10.25 Hantke: Die Klassifikation der lokalen Arbeitsmarkte in der
Schlesischen Wojewodschaft nach der Arbeitslosigkeitsstruktur10.25-10.50 Kwiatkowska-Ciotucha, Zaluska, Hanczar: Computer Aided
Database for Small and Medium Size Firms in Poland10.50-11.15 Szeja: Comparing Socio-Economic Structures of Euroregions
Located on Polish Boarders11.15-11.40 Michalak: Quality Control Methods and Applications11.40-12.05 Swacha, Mikolajczyk: Information Retrieval as a Tool for Non-
Substantial Paper Evaluation
Marketing, Retailing, and Market Research VI (HS C, Chair:Walesiak)10.00-10.25 Obrcebalski: The European ,,Urban Audit” Indicators Results
of Implementation and Informational Recommendations forPolish Public Statistics
10.25-10.50 Stanimir: Analyse der Beweggrunde fr die Hochschulbildung10.50-11.15 Wielki: Has the New Marketing Era Already Come?11.15-11.40 Szajt: Statistical Analysis of Innovative Activity
33

Friday, March 14, 2003
Finance, Capital Markets, and Risk Management VI (SR 4, Chair:Tarczynski)10.00-10.25 Ronka-Chmielowiec, Poprawska: Selected Methods of Credibil-
ity Theory and its Application to Calculating Insurance Pre-mium in Heterogeneous Insurance Portfolios
10.25-10.50 Borda: Application of Classification Methods to the Evaluationof Polish Insurance Companies
10.50-11.15 Gieraltowska, Putek: Immobilienmarkt und Finanzmarkt alsalternative, langfristige Investitionsmoglichkeiten
11.15-11.40 Domanski, Kondrasiuk: Analytic Hierarchy Process - Applica-tions in Banking
11.40-12.05 Owsinski: Group Opinion Structure: Assessing Agreement andStability
PLENARY LECTURE (Audimax 2, Chair: Gaul)12.05-12.50 DeSarbo, Fong, Liechty, Saxton: A Hierarchical Bayesian Pro-
cedure for Two-Mode Cluster Analysis
34

Abstracts (alphabetically sorted)
Evaluation of the Forecast Validity of ProductClinics for New Product Launches - Example
Automotive Industry
Jumana Al-Sibai
Director, Simon-Kucher and Partners, Haydnstr. 36, Bonn, Germany
Abstract. As the market for new products becomes increasingly competitive anddemanding, most companies in business-to-consumer markets employ market re-search to evaluate customer requirements, the position of the new product in thecompetitive environment and the purchase probability of potential customers.The more complex and innovative the product to be introduced is, the more impor-tant the presentation and explanation towards the customer is. A very widely usedway to inform the customer in the course of market research is a product clinic.While it has been used for decades for the evaluation of product concepts in earlystages of product development its application at a time close to market launch toforecast volumes to be expected and the optimal price setting is more recent.Although the organisation and conduct of a product clinic is more time consumingand expensive the value of product clinics compared to classical market researchsupported by photos, explanations or videos has not been quantified.This speech explains the general context of product clinics, using the automotive in-dustry as an example, and describes the survey concept, sample layout and methodswhich have been used to evaluate the forecast validity of car clinics close to marketlaunch. The results of the study quantify the difference between forecasts with andwithout the employment of car clinics and validate the forecasts in comparing themto the market situation after market launch.
References
CONRAD,T. (1997): Preisbildung mittels der Conjoint-Analyse und eines Sim-ulationsmodells am Beispiel eines Premiumanbieters der Automobilindus-trie,Dissertation: Universitat Tubingen.
ERDMANN, A. (1999): Verminderung des Produkteinfuhrungsrisikos durch VirtualReality-unterstutzte Konzepttests: eine experimentelle Studie zur Durchfuhrungvon VR-Car Clinics, Lohmar/Koln: Eul
SCHUH, CH. (1991): Die Car Clinic als Marktforschungsinstrument einer kon-sumentenorientierten Produktentwicklung, Diplomarbeit: Universitat Koln
SIMON, H. (1992): Preismanagement: Analyse - Strategie - Umsetzung, Wiesbaden:Gabler
Keywords
MARKET RESEARCH, DECISION MAKING, PRICING, SIMULATION36
Customer Relationship Management in theTelecommunications and Utilities Markets
Daniel Baier1 and Robert Katona2
1 Chair of Marketing and Innovation Management, BTU Cottbus, D-03046Cottbus, Germany
2 Strategy and Business Architecture (Accenture Service Line),Accenture, Campus Kronberg 1, D-61476 Kronberg, Germany
Abstract. Over the last two decades, relationship marketing gained an increasingpopularity in theory and practice, some authors consider it even as a paradigmchange in Marketing. The respective literature offers numerous definitions of theterm Relationship Marketing, with distinctions made between the scope of the com-panys relations The focus of relationships has been widened over time to includenot only relationships with external customers but also with the internal organisa-tion and other business parties.In this context, customer relationship management (CRM) can be seen as a centralcomponent of relationship marketing targeting at the end-customer. Our under-standing of CRM is ”to establish, maintain, enhance and commercialize customerrelationships ... so that the objectives of the parties are met. ... ” considering thelong-term value of each customer. CRM is a philosophy, a holistic approach, whichintegrates a set of capabilities (Berry 2002).In Germany, CRM has entered the telecommunications and the utilities marketsmost recently. Fixed calls as well as electricity markets were liberalized in 1998.Nevertheless, today the companies in the telecommunications markets are facinga far more intense competition than the companies in the utilities markets. Thisobservation brought us to examine, to which extend the companies in the telecom-munications markets are ahead with their CRM capabilities compared to companiesin the utilities markets, and what are possibly the lessons that could be learned.For this purpose, a survey was performed in both markets based on a comprehen-sive questionnaire. It refers to the following integrated CRM capabilities: Generat-ing and Applying Customer Insight, Developing Customer Offers, Interacting withCustomers, Integration of the Organization , and Integration of the Enterprise.The main target of our paper is to present key results of this study and to reveal acomparison of the current CRM activities in the telecommunications and utilitiesmarkets in Germany.
Keywords
CUSTOMER RELATIONSHIPMANAGEMENT, TELECOMMUNICATIONS,UTILITIES
37
Discrete Choice Method Applicationin the Research of Consumer Preferences
Andrzej Bak and Aneta Rybicka
WrocÃlaw University of Economics,Komandorska 118/120, 53-345 WrocÃlaw, Poland
Abstract. Stated preferences refer to hypothetical behaviors of consumers in themarket. In this case research methods based on data collected a priori by e.g.questionnaires. In researches of stated preferences are used among others discretechoice methods, that based on random utility theory. It means that choice processamong given profiles of product or services is probabilistic. Consumer choices canbe different even if the same circumstances and the identical choice set of profiles.
In the paper are used conditional logit model to analyses of consumer prefer-ences measured on the nominal scale. As example are presented results of researchof preferences light beer consumers passed in group of 235 respondents. The fol-lowing variables were used: country (Poland, Germany, Czech Republic, Holland,Denmark), price (to 2 PLN, 2-4 PLN, above 4 PLN), alcohol (to 1.0%, from 1.8-5.0%, above 5.0%), packing (bottle, can, keg), capacity (0.33l, 0.5l, above 0.5l).That results in standard LMP factor design (L – number of levels of attribute,M – number of attributes, P – number of profiles in each choice set) with 34·5
runs. There was carried out the reduction of complete factor design using the it-erative Fedorov algorithm to find optimal nonortogonal fractional factorial design.Part-worth utilities were estimated using Cox’s proportional hazard model. In thecomputations were used procedures from SAS/STAT 8.2 statistical package.
References
HAAIJER, R. and WEDEL, M. (2000): Conjoint Choice Experiments: GeneralCharacteristics and Alternative Model Specifications. In: A. Gustafsson, A.Herrmann and F. Huber (Eds.): Conjoint Measurement: Methods and Appli-cations. Springer, Berlin 319–360.
KUHFELD, W. F. (2001): Multinomial Logit, Discrete Choice Modeling. URL:http://ftp.sas.com/techsup/download/technote/ts643.pdf, SAS Institute.
LOUVIERE, J. J. and WOODWORTH, G. (1983): Design and Analysis of Sim-ulated Consumer Choice or Allocation Experiments: An Approach Based onAggregate Data. Journal of Marketing Research, November, 20, 350–367.
MCFADDEN, D. (1974): Conditional Logit Analysis of Qualitative Choice Behav-ior. In: P. Zarembka (Ed.): Frontiers in Econometrics. Academic Press, NewYork-San Francisco-London, 105–142.
Keywords
MEASUREMENT OF PREFERENCES, DISCRETE CHOICE METHODS,FACTOR DESIGN, CONDITIONAL LOGIT MODEL
38
Modelling the Claim Count with PoissonRegression and Negative Binomial Regression
BartÃlomiej Bartoszewicz
Department of Econometrics, WrocÃlaw University of EconomicsKomandorska 118/120, 53-345 WrocÃlaw, Poland
Abstract. It is often of interest for an insurance company to fit a distribution tothe claim count in a group of policies. If a claim is to occur once only for a givenpolicy and the total number of policies is known, it is justified to use the binomialmodel and estimate the probability of a single claim by the ratio of number ofclaims to number of policies. For sufficiently large samples it is possible to testthe hypothesis that these ratios are equal in two or more groups. If a claim occursmore than once, given the total number of policies, it is possible to use Poissonor negative binomial distribution and estimate its parameters using the samplemean (and variance). The procedure of testing hypotheses about the mean (or thevariance) in groups of policies is also well known. If the only available informationis the number of claims (the total number of policies is unknown, but assumedconstant), credible data on at least several periods (e.g. years) is necessary to choosean appropriate model and estimate its parameters.In this paper the Poisson regression model is fitted to car insurance claims data.The data contain the number of claims only (which occurred in one period) andseveral factors thought to be likely to affect the number of claims. Symptoms ofoverdispersion are also sought. Negative binomial regression is a proposal to dealwith the fact that the true variance exceeds the variance imposed by the Poissonregression. Finally, tests on the significance of covariate factors are performed todraw conclusions about the equality of parameters in groups of policies.
References
McCullagh, P. and Nelder, J.A. (1989):Generalized Linear Models. 2nd Edition,Chapman and Hall, London.
Mildenhall, S. (1999): A Systematic Relationship Between Minimum Bias and Gen-eralized Linear Models.PCAS LXXXVI, 393-487.
Nelder, J.A. and Verrall, R.J. (1997): Credibility Theory and Generalized LinearModels. ASTIN Bulletin, 27, 71-82.
Renshaw, A.E. (1994): Modelling the Claims Process in the Presence of Covariates.ASTIN Bulletin, 24, 265-286.
Keywords
GENERALIZED LINEARMODELS, CLAIM COUNT, RATING FACTORS
39
Adaptation of Self-Organizing Maps for CaseIndexing
Attila Benedek and Brigitte Trousse
AxIS Research Group, INRIA Sophia-Antipolis BP 93, 06902 Sophia-AntipolisCedex, France
Abstract. We present, as in Benedek et al. (2002), two pattern indexing mod-els used in the context of Case Based Reasoning (Aamodt et al. 1994) that arebased on neural networks and derived from the following models: Probis (Malek1992), SOFM (Kohonen 1989) and GCS (Fritzke 1992). The models perform un-supervised/supervised learning, can be used for data clustering, classifying, andknowledge discovery. They can be considered as a set of dynamic, meta-data gener-ation rules based on the physical data, and have the capabilities of clustering dataalong multiple dimensions, of balancing the generated index information to modelinput data density, of generalizing their response. The advantage of this approachvs. other similar attempts (discrimination tree, memory), is the proper balance ofefficient and precise search, low cost of maintenance/extension, and simple storage.Discrimination trees provide efficient search, however they score poorly when itcomes about search precision, incrementing cost and storage simplicity. Flat mem-ory structures have poor search efficiency, and score well from other perspectives.
References
AAMODT, A. and PLAZA, E. (1994) : Case-based reasoning: foundational issues,methodological variations, and system approaches. AI Communications, IOSPress, Vol. 7:1, 39-59.
BENEDEK, A. and TROUSSE, B. (2002) : Adaptation of Self-organizing Maps forCBR Case Indexing. Symbolic and Numeric Algorithms for Scientific Comput-ing. 9-12 October, Timisoara, Romania.
FRITZKE, B. (1994) : Growing Cell Structures, a self-organizing network for un-supervised and supervised learning. In Neural Networks, Vol. 7, No. 9, p. 1441-1460, Elseviers Science Ltd., USA
KOHONEN, T. (1989) : Self-Organization and Associative Memory. Third Edition,Springer-Verlag, Berlin Heidelberg.
MALEK, M. (1992) : A hybrid memory model for Case Base Reasoning. These dedoctorat, Joseph Fourier University - Grenoble, France.
Keywords
AUTOMATED REASONING, CASE BASED REASONING (CBR), KNOWL-EDGE DATA DISCOVERY (KDD), ARTIFICIAL NEURAL NETWORKS(ANN or NN), PATTERN SEARCH AND INDEXING.
40

Eine empirische Untersuchung zur Bedeutungmakrookonomischer Einflussfaktoren auf
Aktienrenditen am deutschen Kapitalmarkt
Wolfgang Bessler
Professur fur Finanzierung und Banken, Universitat Giessen
Abstract. In dieser Studie werden die Renditen von verschiedenen Branchenin-dizes mit makrookonomischen Faktormodellen untersucht. Dazu wird ein rollieren-der Ansatz verwendet, der geeignet ist, die zeitliche Entwicklung der Koeffizientendes Modells zu erfassen. Dieser Ansatz bildet die Grundlage fur eine Varianzzer-legung der Renditen sowie eine Schatzung der Risikopramien von verschiedenenmakrookonomische Faktoren. Den Untersuchungsgegenstand bilden die monatlichenRenditen von sechs kapitalgewichteten Branchenindizes auf dem deutschen Kapi-talmarkt fur den Zeitraum von 1974 bis 2000. Als Einflussfaktoren werden viermakrookonomische Großen und ein Marktindex zugrundegelegt. Insbesondere furden Index der Finanzintermediare stellt die Entwicklung der langfristigen Kap-italmarktrenditen den bedeutendsten makrookonomischen Faktor dar. Danebenkann fur alle Branchenindizes im Zeitablauf eine deutliche Zunahme der Sensi-tivitat gegenuber dem USD/DM- Wechselkurs konstatiert werden. Im Rahmen derSchatzung der Risikopramien werden verschiedene Spezifikationsansatze der Er-wartungsbildung am Kapitalmarkt zugrundegelegt. Dabei erweist sich der ARIMA-Ansatz als besonders geeignet. Insbesondere die makrookonomischen Faktoren Ren-ditedifferenz und USD/DM-Wechselkurs werden am Kapitalmarkt vergleichsweiseoft mit Risikopramien bewertet. Insgesamt finden sich im Rahmen der Unter-suchung deutliche Hinweise auf eine Zeitvariabilitat sowohl in den Betakoeffizientenals auch den Risikopramien des Faktormodells.
41
Application of Classification Methods for theEvaluation of Polish Insurance Companies
Marta Borda and Patrycja Kowalczyk-Lizak
Department of Financial Investments and Insurance, WrocÃlaw University ofEconomicsKomandorska 118/120, 53-345 WrocÃlaw, Poland
Abstract. In view of the specific characteristics of the insurance activity the in-surance companies are more exposed to insolvency risk than other enterprises. Theevaluation of the financial standing helps the insurer to identify and manage riskand it is also a significant part of insurance rating. The paper discusses the problemof the selection of variables characterizing the financial condition of the insuranceenterprises on the Polish market. The studies have been conducted separately forlife insurers and for property and casualty insurers. The authors have applied thek-means method and the Ward‘s method to cluster the insurance companies ac-cording to their financial condition. The obtained results show the variation in thefinancial standing of the analyzed insurers and changes in this field over last fewyears.
References
Cummins J. D., Santomero A. M. (ed.) (1999), Changes in the Life Insurance In-dustry : Efficiency, Technology and Risk Management, Kluwer Academic Pub-lishers, Boston-Dordrecht-London.
Jajuga K., Kuziak K., Walesiak M. (2001), Proba zastosowania metod klasy-fikacji w zagadnieniu ratingu ubezpieczeniowego, ”Taksonomia”, z. 8, Wyd. AEWrocÃlaw.
Jaworski W. (2002), Rating ubezpieczeniowy, Wyd. AE, Poznan.Jaworski W., Lisowski J. (2002), Ocena sytuacji ekonomiczno-finansowej zakÃladu
ubezpieczen, w: Ubezpieczenia w gospodarce rynkowej,cz. 4, pod red. T. San-gowskiego, Oficyna Wydawnicza ”Branta”, Bydgoszcz-Poznan.
PUNU (2000), Metodologia analizy finansowej zakÃladow ubezpieczen - wersja II,Departament Analiz Systemu Ubezpieczeniowego PUNU, Warszawa.
Nowak E. (1990), Metody taksonomiczne w klasyfikacji obiektow spoÃleczno-gospodarczych,PWE, Warszawa
Zelias A. (red.) (1989), Metody taksonomii numerycznej w modelowaniu zjawiskspoÃleczno- gospodarczych,PWN, Warszawa.
Keywords
EVALUATION OF FINANCIAL STANDING, FINANCIAL RATIOS, IN-SURANCE ENTERPRISES, INSURANCE RATING
42
Generalized EG Modelwith Subjective or External Information
Giuseppe Bove1 and Roberto Rocci2
1 Dipartimento di Scienze dell’EducazioneUniversita di Roma Tre, Roma, Italy
2 Dipartimento SEFeMEQUniversita di Tor Vergata, Roma, Italy
Abstract. Multidimensional scaling is a set of techniques, used especially in be-havioral and social sciences, able to visualize proximity data in a multidimensionalspace.This work focuses on a particular model, called Generalized Escoufier & Grorudmodel (Rocci and Bove, 2002; Escoufier and Grorud, 1980), proposed to deal withproximities which describe asymmetric relationships (i.e., trade indices for a setof countries, brand switching data, occupational mobility tables, etc.). It is basedon the decomposition of the relationships into a symmetric and a skew-symmetricpart. The objects are represented as points in a multidimensional space and the in-tensity of their relationships as scalar products (symmetry) or triangle areas (skew-symmetry).In this paper a new methodology is presented to incorporate subjective or externalinformation into the model. Advantages of the proposal are illustrated by analysesof real data.
References
ESCOUFIER, Y. and GRORUD, A. (1980): Analyse Factorielle des matrices carreesnon symetriques, in E.Diday et al. (Eds.): Data Analysis and Informatics, 1.North Holland, Amsterdam, 263–276.
ROCCI, R. and BOVE, G. (2002): Rotations techniques in asymmetric multidi-mensional scaling. Journal of Computational & Graphical Statistics, vol.11,n.2, 405–419.
Keywords
MULTIDIMENSIONAL SCALING, ASYMMETRY, EXTERNAL INFOR-MATION
43
Empirical Test of the Consumer BehaviorTheory of Price Valuation Using a
Semiparametric Approach and ReferencePrices
Yasemin Boztug and Lutz Hildebrandt
Institute of Marketing, Humboldt University of Berlin, D-10178 Berlin
Abstract. To describe price response at the individual level most existing stud-ies are based on the prospect theory framework modeled in a parametric manner.In general prospect theory is used without any empirical validation although al-ternative response functions exist. One alternative approach to describe consumerbehavior is the assimilation contrast theory. In an empirical study Kalyanaram andLittle (1994) considered situations where this model might be more valid. Again,the validation of the theory was not tested and the model was estimated in a fullparametric manner.
In our approach to discover the underlying structure of the brand choice process,we use a semiparametric methodology based on a Generalized Partial Linear Model(GPLM). Feature, display, loyalty (as in Guadagni and Little, 1983), and branddummy parameters are estimated in a parametric manner following the standardMultinomial Logit Model. The price gap (reference price minus actual price) ismodeled with a nonparametric estimator. Due to this special modeling form, weare able to discover empirically the underlying process of the consumer behaviorregarding the influence of reference prices. Several reference price types are used forinternal and external reference price modeling. Heterogeneity is captured by an apriori segmentation of the consumers based on the concept of loyals and switchers,which is a common approach. In a simulation study we examine data that follow amodel based on the assimilation contrast theory but the estimation is based on anapproach regarding to the prospect theory. The results lead to parameters, whichare highly significant, but far away from the true values. In an application to a realdata set, we find that the behavior of loyal consumers is in line with the assimilationcontrast theory, while the switchers behave according to prospect theory.
References
GUADAGNI, P.M. and LITTLE, J.D.C. (1983): A Logit Model of Brand Choicecalibrated on Scanner Data. Marketing Science, 2(3), 203–238.
KALYANARAM, G. and LITTLE, J.D.C. (1994): An empirical Analysis of Lati-tude of Price Acceptance in Consumer Package Goods. Journal of ConsumerResearch, 35, 16–29.
Keywords
REFERENCE PRICE, PROSPECT THEORY, ASSIMILATION CONTRASTTHEORY, SEMIPARAMETRIC ESTIMATION, CONSUMER BEHAVIOR
44

Why is the Index Smile so Steep?
Nicole Branger and Christian Schlag
School of Business and Economics, Goethe University,Mertonstr. 17/Uni-Pf 77, D-60054 Frankfurt am Main, Germany
Abstract. There is empirical evidence that the implied volatility smile for indexoptions is significantly steeper than the smile for individual options. We proposea simple model setup that is able to explain this difference. When modelling theindex, an aggregation restriction has to be taken into account. The index level isa weighted sum of individual stock prices, so that the distribution of the indexis completely determined by the joint distribution of the component stocks. Thedifference between the index smile and the smiles for individual stocks is thendetermined entirely by the dependence structure among the stocks. Changing thisdependence structure changes the implied volatility curve for the index, whereasindividual smiles would remain unchanged.
We illustrate our basic idea in the context of a jump-diffusion model. The de-pendence among stocks is captured by decomposing both the jump and the diffusionterms into common and idiosyncratic parts. Special attention is paid to the depen-dence in a crash. In this situation stocks are supposed to move together more thanduring normal market periods, which causes the difference between the impliedvolatilities of at-the-money and out-of-the-money puts to be much larger for theindex than for individual stocks.
Although the smile is explained exclusively by the risk-neutral distribution therelation between this distribution and the data-generating process is also of interest.It is an important feature of our model that large downward movements are causedby jumps, which behave quite differently from diffusions under a change of measure.While for purely diffusion-based models second moments are preserved under thenew measure this is not necessarily true for models with jump components. Here achange of measure may also alter the dependence structure of the stocks.
Keywords
OPTION PRICING, JUMP-DIFFUSION, SMILE, IMPLIED VOLATILITY
45
Zustandsmodellierung im Rahmen derKonzeption von
Produktdatenmanagementsystemen
Robert Braun and Werner Esswein
Lehrstuhl fur Wirtschaftsinformatik, insb. Systementwicklung,Technische Universitat Dresden, D-01062 Dresden
Abstract. Modellierungsmethoden zur Gestaltung von Informationssystemen kapselnverschiedene Techniken, um die strukturalen und verhaltensorientierten Aspektedieser komplexen Systeme separat, fr den menschlichen Intellekt begreifbar, zuerfassen. Whrend der Analyse und des Entwurfs von Informationssystemen wer-den dabei zur Darstellung des Systemverhaltens Techniken benutzt, die die zurbetrieblichen Leistungserstellung fhrenden Prozesse und die durch sie kondition-ierten, betriebswirtschaftlich relevanten Objekte visualisieren. Die aus den Ob-jekten gebildeten Klassen, die sog. Informationsobjekttypen, und deren Beziehun-gen dienen i. d. R. wiederum zur Darstellung der Systemstruktur. Fr den Fall derKonzeption von Produktdatenmanagementsystemen weisen aufgrund der System-spezifika die prozessprgenden Objekte allerdings eine andere Charakteristik auf, alsdies gewohnlich bei der Modellierung (hufig implizit) unterstellt wird. Der Artikellegt diese Differenzen zunchst dar und schlagt daraus resultierend die Einfhrungdes Konzeptes Versionstyp eines Informationsobjekttypen als Hilfsmittel zur Mod-ellierung von Produktdatenmanagementsystemen vor. Dem folgend wird eine mod-ifizierte Statechart-Technik prasentiert, um die Versionstypen von Information-sobjekttypen auch separat darstellen zu konnen. Abschlieend wird die Integra-tion dieser Technik in eine Modellierungsmethode exemplarisch demonstriert. DerBeitrag des Artikels zur Klassifikation ist daher in der Entwicklung einer Produkt-spezifikationsmoglichkeit zu sehen, die die notwendigen Etappen einer Produkten-twicklung determiniert.
References
BRINKKEMPER, S. (1996): Method Engineering: Engineering of information sys-tems development methods and tools. Information and Software Technology,38, 275–280.
EIGNER, M.; STELZER, R. (2001): Produktdatenmanagement-Systeme: Ein Leit-faden fr Product Development und Life-Cycle-Management. Springer, Berlin etal.
KeywordsPRODUKTDATENMANAGEMENTSYSTEME, METHODEN-ENGINEERING,STATECHARTS
46
Nonparametric Analysis of Multiple Endpoints- Overview of Methods and Availability of
Software Solutions
Thomas Bregenzer
PAREXEL, [email protected]
Abstract. The evaluation of efficacy in clinical trials and in other application ar-eas often leads to a situation in which several variables are of equal importance,for example if repeated measures are obtained to assess longitudinal differences be-tween two groups of subjects. The separate statistical analysis of such ”multipleendpoints” results in a multitude of p-values, whereas in many situations a singlep-value would be preferable.
Classical parametric approaches exist for a long time (Hotellings T-square Test,e.g.), and during the last decades special emphasis was placed on the so-called”directional” test procedures which are more powerful for detecting restricted al-ternatives, especially those which reflect a uniform superiority of one group withrespect to all endpoints (O’Brien, 1984; Wei-Lachin, 1984; Lachin, 1992; Lauter,1996). Despite most of these procedures were developed in a specific environment(and mostly were parametric in nature), they can be embedded in a nonparamet-ric setup, using the ”relative (treatment) effect” (Akritas, Arnold, Brunner; 1997),which can be regarded as a generalized mean.
The practical interpretation of these multivariate ”relative effects” will be discussedas well as some basic test procedures. Furthermore, the availability in commercialsoftware products will be sketched.
References
P.C. O’Brien (1984). Procedures for comparing samples with multiple endpoints.Biometrics, 40,1079–1087.
L.J. Wei and J.M. Lachin (1984). Two–sample asymptotically distribution free testsfor incomplete multivariate observations. JASA 79, 653–661.
J.M. Lachin (1992). Some large–sample distribution–free estimators and tests formultivariate partially incomplete data from two populations. Stat.Med. 11,1151- 1170.
J. Lauter (1996). Exact t and F tests for analyzing studies with multiple endpoints.Biometrics 52, 964–970.
Akritas, M., Arnold, S., and Brunner, E. (1997). Nonparametric hypothesis andrank statistics for unbalanced factorial designs. JASA 92, 258–265.
Bregenzer, T., Lehmacher, W. (1998). Directional tests for the analysis of clinicaltrials with multiple endpoints allowing for incomplete data. Biom. J. 40, 911-928.
47
Nonparametric Methods in Factorial Designs
Edgar Brunner
Abt. Med. Statistik, University of Gottingen, [email protected]
Abstract. This talk summarizes some recent developments in the analysis of non-parametric models where the classical models of ANOVA are generalized in sucha way that not only the assumption of normality is relaxed but also the struc-ture of the designs is introduced in a broader framework. Moreover, the conceptof treatment effects is redefined. The continuity of the distribution functions is notassumed so that not only data from continuous distributions but also data withties are included in this general set-up.
In designs with independent observations as well as in repeated measures designs,the hypotheses are formulated by means of the distribution functions where in par-ticular factorial designs involving longitudinal data are discussed. The main resultsare given in a unified form. Some applications to special designs are considered,where in simple designs, some well known statistics such as the Kruskal-Wallis
statistic and the X2-statistic for dichotomous data come out as special cases.
The general framework presented here enables a nonparametric analysis of data withcontinuous distribution functions as well as arbitrary discrete data such as countdata, ordered categorical and dichotomous data. In particular, not only asymptoticresults are discussed, also quite accurate approximations for small sample sizes arepresented.
To graphically describe the outcome of an experiment, relative treatment effectsare defined and asymptotically unbiased and consistent estimators as well as con-fidence intervals for these treatment effects are given.
References
Brunner, E. and Puri, M.L. (2001). Nonparametric Methods in Factorial Designs.Statist. Papers 42, 1-52.
Brunner, E. und Langer, F. (1999). Nichtparametrische Analyse longitudinalerDaten. Oldenbourg, Munchen.
Brunner, E., Domhof S. and Langer, F. (2002). Nonparametric Analysis of Longi-tudinal Data in Factorial Designs. Wiley, New York.
Brunner, E. und Munzel, U. (2002). Nichtparametrische Datenanalyse. Springer,Heidelberg.
48
Statistical Learning for Data Clustering:Modelling, Optimization and Validation
Joachim Maximilian Buhmann
University of Bonn, Department of Computerscience III, Rmerstr. 164, 53117Bonn, [email protected]
Abstract. Data Clustering is one of the fundamental techniques in pattern recog-nition to extract structure from data with growing importance in data mining, bioin-formatics, computer vision and other application areas. I will introduce metaprinci-ples for data clustering which favor either pairwise closeness or local connectednessof data. Cost functions are developed for the different data types of vector, his-togram or proximity data. Topological or hierarchical constraints on the clustersyield a variety of related clustering principles. The consistency requirement thattwo clustering solutions on two sample sets of the same data source should be qual-itatively similar motivates a resampling based stability measure which determinesan optimized number of clusters. Practical clustering solutions in bioinformaticsand image segmentation clearly match or even outperform alternative approaches.
49

Value at Risk with Informed Decision Makers-the Regulators Perspective
Hans-Peter Burghof1 and Tanja Dresel2
1 Banking Department, Faculty of Law and Economics, University of Mainz,55099 Mainz, Tel.: +49 (0)89 2180 3110, Fax.: +49 (0)89 2180 99 3110,[email protected].
2 Institute of Capital Market Research and Finance, Faculty of BusinessAdministration, University of Munich, Schackstrae 4, 80539 Munchen, Tel.: +49(0)89 2180 2193, Fax: +49 (0)89 2180 2016, [email protected].
Abstract. Banks and regulators use value at risk as a device to restrict the proba-bility of severe losses from the banks portfolios. To achieve objective results for valueat risk, it is implicitly assumed that markets are perfect and portfolios are chosenarbitrarily. We develop a model of value at risk for a bank consisting of a tradingdepartment with informed traders and with observability of sequential trading de-cisions. Although the additional information decreases the risk of the individualsdecisions, it might increase value at risk of portfolios. Compared with ”neoclassical”value at risk, in particular well diversified portfolios in highly correlated marketsmight contain a significantly higher risk. This is because in such markets diversifi-cation is a signal for a high uncertainty about the true market trend and for a highproportion of wrong trading decisions. Thus, the use of objective market prices inthe calculation of value at risk is bought at the price of an over- or underevaluationof the banks true riskiness. We discuss potential regulatory consequences.
50
Full Factorial Design, Taguchi Design,Parameter Search or Genetic Algorithms -
different approaches of Design of Experimentsin education
Carina Burkhard and Ralf Woll
Lehrstuhl Qualitatsmanagement, Institut fur Produktionsforschung, BTU Cottbus
Abstract. Design of Experiments is of high interest in engineering to get robustand reproducible results with a minimum of experiments. Based on a simple ex-periment we will show different approaches for DoE and our experiences from oureducational programs.
To train experiences in DoE students had to search for the optimised settingof a catapult. The finding of the longest distance was demanded. The catapult wasprepared in a way it would not show the answer immediately. In result a shortenedversion of the Shainin method did not sufficiently lead to optimised adjustments. Afull factorial design resulted in too many different adjustments and the employmentof the Taguchi method was difficult to apply but lead to good results with very fewexperiments. Further, the use of genetic algorithms was possible with good resultsas well.
The simple example demonstrates how DoE can be applied for student educa-tion in an effective way. It shows as well how to teach some of the stepping stonesof DoE. We developed a proposal for a complex training module in DoE.
51
Document Mining: Semantics from Semiotics
Angelo Canaletti1 and Federico Massaioli2
1 Think Different s.r.l., V. Reggio Calabria 6, 00161 Roma, Italy2 CASPUR, V. dei Tizi 6/b, 00185 Roma, Italy
Abstract. 90% of all the data bases in the world are collections of unstructureddata, mostly textual documents, the whole Internet being the most striking ex-ample. Usual cataloguing and indexing techniques are useful but not adequate tosearch for documents. Cataloguing approaches rely on a human expliciting rela-tions between documents, by decorating documents with keywords or hyperlinks,or structuring them in a directory tree. Those techniques are fundamentally lim-ited, as they arise from the limited, subjective perspective (ontology) of the personperforming the classification, restricted to his knowledge and views at a given time.Full text indexing is impaired by the diffculty of choosing the right search keywords,and unable to grasp similarity between documents discussing the same subject usingdifferent terms. These problems are not surprising, as the only complete identifica-tion of a document is formed by the date of its creation and the whole meaning itexpresses [C]. Moreover, meaning and knowledge emerge not from the document initself, but from its relations to all the other existing documents. From an informa-tion theory point of view, this is a direct consequence of Shannon’s theories. From acybernetics point of view, ontological processes arise from interactions of the subjectwith other subjects and his environment [M]. We propose a different methodologyto sift the document base you are interested in, a knowledge technology based on aquantitative analysis of relations between documents. A concept of ”distance” be-tween documents can be built with a purely semiotic approach, looking at statisticsof words in single documents and in the whole document base. A self-organizingmap (Kohonen map [K]) is used to identify how documents cluster together. Weshow how this process, while based on purely semiotic information, results in a mapwhere documents aggregate according to their meanings. This emerging semanticsis not the rigid frame imposed by a predefined knowledge ontology. It is, in fact,dynamically recovered by the user interpreting the map signs. This is in agreementwith the well known fact that the meaning of a document arise in the very act ofreading it.
References
[C]ARRIERO, N., GELERNTER, D. (2001): A Computational Model of Every-thing Communications of the ACM, 44, 11, 77-81.
[K]OHONEN, T. (2000): Self Organizing Maps, Springer.[M]ATURANA, H. R., VARELA, J. F. (1980): Autopoiesis and Cognition: The
Realization of Living, Kluwer Academic Publishers.
Keywords
DOCUMENT BASE, SEARCH ENGINES, SELF-ORGANIZING MAPS52

Estimation of Parameters with DdifferentVariances of Errors in Model of Chemical
Balance Weighting Design
BronisÃlaw Ceranka1 and MaÃlgorzata Graczyk2
1 Department of Mathematical and Statistical Methods Agricultural UniversityWojska Polskiego 28, 60-637 Poznan, Polande-mail: [email protected]
2 e-mail: [email protected]
Abstract. The paper deals with the problem of estimating individual weights ofobjects, using a chemical balance weighing design with diagonal variance - covari-ance matrix of errors under the restriction on the number times in which each objectis weighed. A lower bound for the variance of each of the estimated weights fromthis chemical balance weighing design is obtained and a necessary and sufficientcondition for this lower bound to be attained is given. The incidence matrices ofbalanced incomplete block designs and ternary balanced block designs are used toconstruct optimum chemical balance weighing designs.
References
Ceranka B., Graczyk M.(2001): Optimum chemical balance weighting designs underthe restriction on weightings. Discussiones Mathematicae - Probability andStatistics 19, 111-120.
Ceranka B., Katulska K. (1999): Chemical balance weighting designs under therestriction on the number of objects placed on the pans. Tatra Mt. Math.Publ., 17, 141-148.
Keywords
BALANCED INCOMPLETE BLOCK DESIGN, CHEMICAL BALANCEWEIGHTING DESIGN, TERNARY BALANCED BLOCK DESIGN
53
Agglomerative 2-3 Hierarchical Clustering:Theoretical Improvements and Tests
Sergiu Chelcea1, Patrice Bertrand2, and Brigitte Trousse3
1 AxIS Research Group, INRIA Sophia-Antipolis BP 93, 06902 Sophia-AntipolisCedex, France
2 ENST-Bretagne, Departement IASC Technopole BREST-IROISE, BP 832 ,29285 BREST Cedex, France
3 AxIS Research Group, INRIA Rocquencourt BP 105, 78 153 Le Chesnay Cedex,France
Abstract. Motivated by clustering Web user sessions, we have studied a new gen-eral clustering procedure, that we call here Agglomerative 2-3 Hierarchical Clus-tering (2-3 AHC), and which was proposed by Bertrand (2002a, 2002b). The threemain contributions of this paper are: first, the theoretical study has led to reducethe complexity from O(\2) to O(\2log\), where \ is the number of objects to beclustered. Secondly, in order to obtain a strict indexing of the cluster structure, wehave proposed to integrate the refinement phase of the algorithm into the mergingphase, with a new formulation of the algorithm. Finally, we have specified and im-plemented this procedure as a new case indexing method in CBR*Tools, our CaseBased Reasoning framework: for further details see Jaczynski (1998). Preliminarytests were made on a CBR application for car assurance risk factor determination.Current and future work concerns the application of our 2-3 AHC method for clus-tering Web user sessions and to compare it with other existing methods such asneural networks (Benedek 2002) and classical AHC, mainly on quality aspects.
References
BENEDEK, A. and TROUSSE, B. (2002) : Adaptation of Self-organizing Maps forCBR Case Indexing. Symbolic and Numeric Algorithms for Scientific Comput-ing. 9-12 October, Timisoara, Romania.
BERTRAND, P. (2002a) : Set systems for which each set properly intersects atmost one other set - Application to pyramidal clustering. Cahier du Ceremadenumero 0202, Ceremade, Universite Paris-9, France.
BERTRAND, P. (2002b) : Les 2-3 hierarchies : une structure de classification pyra-midale parcimonieuse. Actes du IX eme Congres de la Societe Francophone deClassification. 16-18 September, Toulouse, France.
JACZYNSKI, M. (1998) : Modle et plate-forme a objets pour l’indexation des caspar situations comportementales : application a l’assistance a la navigation surle Web, These de doctorat, UNSA, December 1998, France. Keywords
Keywords
CLUSTERING, WEB USAGE DATA, DATA MINING, 2-3 HIERARCHIES54
The Importance Of The Eigenvalues To DefineA Configuration Of The Categories Of A
Group Of Qualitative Variables
Efrem Colnago
Institute of Statistics, Probability, Applied Statistics, University La Sapienza,Piazzale Aldo Moro 5, Roma 00185, Italy, Mail: [email protected]
Abstract. There exist several methodologies for analizing multivariate qualitativedata (Scaling, Correspondence Analysis, Dual Scaling, Categorical Data, Multidi-mensional Scaling, and at last procedures of Data Mining). Our aim consist infinding suitable constraints for discriminating and ordering the categories of themultidimensional set of qualitative variables according to a unidimensional scale(categorical multidimensional data). Hence the problem: exist an acceptable unidi-mensional scaling for this type of data and which constraints are needed to arrive atan optimal quantification of the categories? Nishisato (1993) defined in a bidimen-sional analysis, the minimum reliable level of the first eigenvalue to discriminate thecategories. We will demonstrate, in our application in the multivariate analysis ifthis approach is reliable. He defines also two types of data matrix in quantifications.One is an ”incidence data” matrix, where that exists a second component that influ-ences the results data of the first component and another one is ”dominance data”matrix, where this influences doesn’t exist. Since we start from a Burt’s matrix thatusually is of the type ”incidence data”, then we want verify with an example the influence of the second eigenvalue on the configuration of the first one. We introducethe PCA, as a model with linear and bilinear components(Gabriel 1971) and de-compose the initial matrix into a sum of matrices related to the first eigenvalue andof residual traditional matrices. If we eliminate the contribution of the second andother successive eigenvalues we build special residual matrices, that holds alwaysthe first factor. If we can show the independence of the configurations of the firstcomponent from the others in special residual matrices, we can prove the not influ-ence of the second factor. So two methodological problem exist: the first eigenvaluecan optimally order the categories (at what level?). Which is the acceptance intervalof λ?, based on the test χ2(F ). In this connection we introduce nonnegative ma-trix F formed by the configurations of the first eigenvalues in initial and successivespecial residual matrices. Besides we proceed, demonstrating the not influences ofthe second component in traditional matrices with a Greenacre test,and afterwardsalso in special residual matrices with a χ(F )2 on previous special multiway tablesof configurations.
Keywords
CATEGORICAL DATA, BURT’S MATRIX, QUANTIFICATION, RESID-UAL MATRIX
55
Validation of Clustering Methods for GeneExpression Analysis
Ivan G. Costa1, Francisco A. T. de Carvalho1, and Marcilio C. P. de Souto2
1 Centro de Informatica / Universidade Federal de Pernambuco, Av. Prof. LuizFreire, s/n - Cidade Universitaria, CEP: 50740-540 Recife - PE, Brazil,{igcf,fatc}@cin.ufpe.br
2 Instituto de Ciencias Matematicas e da Computacao / Universidade de SaoPaulo, Av. Trabalhador Sao Carlense, 400 - Centro - Postal 668 - Sao Carlos -SP, Brazil, {marcilio}@icmc.usp.br
Abstract. Different clustering techniques such as, hierarchical clustering , Self-Organizing Maps, graph theory approaches, dynamical clustering among others,have been used on the analysis of gene expression data. The majority of these workfocus on the biological results, and there is no critical analysis concerning the ade-quacy of the clustering methods used. In the few works in which cluster validationwas applied in gene expression analysis studies, the focus was on the evaluation ofthe validation methodology proposed (Yeung, 2001 and Zhu, 2000).In this work, an evaluation of the accuracy of five clustering methods in recover-ing true cluster structure from gene expression data is presented. A k-fold cross-validation procedure for unsupervised methods, inspired in Replication Analysis(Breckeridge, 1989), is applied. Then, the results accuracy are assessed with theuse of external indices. Such indices measure the agreement between the clusteringresults with a priori classification data, such as functional classification (Jain andDubes, 1988). Finally, in order to detect statistically significant differences obtainedby the distinct clustering method, a hypothesis test for equal means is applied tothe agreement values achieved in each cross-validation.
References
BRECKENRIDGE J. N. (1989) : Replication cluster analysis: Method, consistency,and validity. Multivariate Behavior Research, 24, 2,147-161.
JAIN A.K., DUBES, R.C. (1988) : Algorithms for clustering data. Prentice Hall,New York.
YEUNG K.Y. HAYNOR, D. R., RUZZO, W. L. (2001) Validating Clustering forGene Expression Data. Bioinformatics, 17, 309-318.
ZHU J, ZHANG M. Q. (2000) Cluster, function and promoter: analysis of yeastexpression array. Proc. Of Pacific Symp of Biocomputing, 479-90.
Keywords
CLUSTER ANALYSIS, CLUSTER VALIDATION, BIOINFORMATICS, GENEEXPRESSION
56
Fuzzy Optimization Applications in Marketing
L. Cromme1 and K. Weber23
1 BTU Cottbus, Institut fur Mathematik, Postfach 10 13 44, D-03013 Cottbus,Germany
2 Lufthansa Systems Berlin GmbH, Bereich Revenue Management,Fritschestrasse 27-28, D-10585 Berlin, Germany, [email protected].
Abstract. Whereas in ”the old days” of Arthur Miller’s ”Death of a Salesman”sales was the business for those men who had ”a nose”, nowadays a variety of soft-ware tools support planning and management of acquisition activities. Among themany decisions which have to be made in prearrangement and while running of theacquisition process the choice of effective marketing actions, and appropriate appli-cation and sensible compliance of the limited resources are crucial. In a competitiveenvironment these decisions are so much the better as they meet the peculiaritiesand specific demands of each customer as good as possible. Fuzzy logic methodsare suitable for these problems because some quantities involved are rather fuzzythan crisp, for instance, capacity restrictions, customer attributes, trade of betweenacquisition goal and restrictions, and balancing between different simultanous re-strictions. Our work was motivated by a commercial software tool for planningand managing acquisition processes by means of so called ’acquisition plans’. Theseare specific directed graphs where nodes are marketing actions and edges corre-spond to customer reactions. From this base we develop a mathematical modelwhich allows estimation of economic quantities and simulation of their evolutionin time. Furthermore, we define some optimisation problems in order to maximisecustomer throughput in the acquisition process in accordance with capacity re-strictions. These fuzzy stochastic integer optimization problems are solved usingmean-risk and chance constrained programming approaches. Moreover, in order toincrease flexibility with respect to provision of the necessary probability figures, sce-nario trees are introduced for modelling, and scenario reduction is applied to reduceoptimisation complexity. In order to include customer attributes into the decisionprocess, acquisition plans are extended to dynamic acquisition plans. They modelthe acquisition process as stochastic dynamic process where states are defined bycustomer segments. The model is the base for a fuzzy stochastic optimisation prob-lem of the Bellman/Zadeh type. It is shown how the underlying functional equationscan be solved by a fixed-point theorem. The solution is a decision rule for optimalchoice of marketing actions in each state of the process. Solution of the above op-timisation problems actually constitutes the core component of according decisionsupport systems. Due to their dependency on provision of sufficient data they areparticularly suitable for application in branches where much customer data is pro-cessed and stored, e.g. in e-commerce. Owing to the customer-dependency of thesecond, dynamic programming optimisation approach, the article also contributesto the field of customer relationship marketing.
KeywordsFUZZY LOGIC, OPTIMISATION, SCENARIO TREES, MARKETING,MODELING
57
Combination of Classification Trees andLogistic Regression to Analyse Animal
Management and Disease Data
Susanne Dahms
Institut fur Biometrie und Informationsverarbeitung,FB Veterinarmedizin, FU Berlin, Oertzenweg 19b, D-14163 Berlin, Germany
Abstract. For some years now integrated quality control measures have been dis-cussed in farm animal husbandry and veterinary medicine in search of concepts tolink information on management factors and incidents during the fattening periodwith disease data gained by veterinary meat inspection at slaughter. Better un-derstanding of relationships between these variables hopefully will help to improvemanagement practices as well as meat quality and safety.
With regard to statistical data analysis and modeling the situation can becharacterized as follows.
• Dependent variables are either dichotomous characteristics (disease yes or no)or percentages of diseased animals in specified groups.
• There is a large number of independent variables that are possibly interactingand that are heterogenous with regard to their measurement scales.
• Analysis is exploratory as information from routine farm and slaughter pro-cesses must be interpreted as observational data.
Based on these considerations a modeling strategy has been developed thatcombines two statistical methods: generation of classification trees to explore theassociation structure in available animal management and disease data and logisticregression used to quantify systematic effects of management factors.
Beforehand, however, the variance structure of the data is explored, as apartfrom management factors with systematic effects there are random farm or fatteninggroup effects to be recognized.
The developed concept and open problems will be outlined and discussed inthis presentation.
References
DAHMS, S. (2000): Bestandsgesundheit und Lebensmittelsicherheit — Beitrageder Biometrie und Epidemiologie. Habilitationsschrift, Fachbereich Veterinar-medizin, Freie Universitat Berlin.
Keywords
CLASSIFICATION TREES, LOGISTIC REGRESSION, MEAT INSPEC-TION RESULTS, INTEGRATED QUALITY CONTROL IN MEAT PRO-DUCTION
58
Adaptive ABVD Chemotherapy for Treatmentof Early Stage Hodgkin’s Disease.
A Multicentric Italian Study
Stefano De Cantis1, Daria Mendola2, and Emilio Iannitto3
1 Dipartimento di Metodi Quantitativi per le Scienze Umane2 Dipartimento di Scienze Statistiche e Matematiche “Silvio Vianelli”3 Cattedra di Ematologia, Policlinico Universitario “Paolo Giaccone”Universita degli studi di Palermo, 90128 Palermo, Italia
Abstract. About 80% early stage Hodgkin’s disease (HD) patients can be suc-cessfully treated with extend field radiotherapy, chemotherapy or an associationof both. However, the long-term side effects of the therapy are a major concernand, in particular, secondary tumors and lung-heart dysfunctions are the mosttreatment related late effects. Currently, the tendency is to explore strategies toimprove the efficacy and decrease the toxicity of treatment. The odds of side effectsdepends mostly on the extent and dose of radiotherapy and is correlated to thetype and amount of chemotherapy administrated. ABVD chemotherapy produces,in advanced stages, a better tumor control than MOPP chemotherapy with a risk ofsecondary leukaemia less than 1%. Moreover the issue of the optimal chemotherapycycles number is critical being the risk of late adverse effects correlated to the totaldose of drugs delivered. Thus, being the lymphoma burden one of the most signifi-cant variables influencing the success, it is plausible that early stage disease patientsmight require a shorter course of chemotherapy to obtain a good disease control.Our aim was to verify if HD patients who achieve a complete remission within thefirst three courses of chemotherapy are a dynamically sorted good prognosis groupthat can behave fairly good without additional therapy. In this paper we reportthe results of a prospective controlled multicentric phase II trial, on behalf of GISL(Gruppo Italiano Studio Linfomi), exploring in unfavorable early stage HD patientsthe feasibility and the efficacy of a therapeutic strategy based on flexible, responsetailored, courses of ABVD and, if that is the case, accomplished with radiotherapy.
References
AISENBERG, A. (1999): Problems in Hodgkin’s disease management. Blood, 93,761–779.
CONNORS, J.M., NOORDIJK, E.M. and HORNING, S.J. (2001): Hodgkin’s lym-phoma: basing treatment on evidence. Hematology, 178–193.
Keywords
HODGKIN’S DISEASE, SURVIVAL ANALYSIS, ADAPTIVE THERAPY,TAILORED RESPONSE THERAPY
59
Symbolic Classifier with Convex Hull basedDissimilarity Function
Francisco de A. T. de Carvalho and Simith T. D’Oliveira Junior
Centro de Informatica - CIn / UFPE, Av. Prof. Luiz Freire, s/n - CidadeUniversitaria, CEP: 50740-540 Recife - PE, Brazil, {fatc,stdj}@cin.ufpe.br
Abstract. The objective of this paper is to present a classifier based on a symbolicapproach. The symbolic classifier has as input data samples of predefined groups(the learning set) represented in a usual table of values. The learning step organizesa complete and discriminant description of each group, using either a symbolic de-scription or disjunctions of symbolic descriptions. A symbolic description of a groupis defined by the convex hulls of all its elements and the disjunctions of symbolicdescriptions are obtained by using a Mutual Neighbourhood Graph. The classifi-cation rule is based on a new dissimilarity matching function which compares anexample with a class by measuring their difference in content and volume. Basically,given a new example to classify, for each constructed convex hull in the learningstep, the basic parameters of this matching function are the volume of the convexhull including the example to be classified and the volume of the convex hull dis-respecting this example. The new example is affected to its closest class accordingto the dissimilarity matching function. To show his usefulness, this approach is ap-plied to the recognition of simulated Synthetic Aperture Radar (SAR) images inthe framework of a Monte Carlo experience accomplished on the stages of the im-plemented system. This simulation encompass situations ranging from ”moderateease” to ”great difficulty” of classification. The average error rate of classificationobtained was satisfactory.
References
BOCK, H.H. and DIDAY, E. (2000): Analysis of Symbolic Data. Springer, Heidel-berg.
FRERY, A.C., MUELLER, H. J., YANASSE, C.C.F. and SANT’ANNA, S. J. S.(1997): Amodel for extremely heterogeneous clutter. IEEE Transactions onGeoscience and Remote Sensing, 1, 648–659.
ICHINO, M., YAGUCHI, H. and DIDAY, E. (1996): A fuzzy simbolic patternclassifier. In: E. Diday, Y. Lechevallier, O. Opitz (Eds.): Ordinal and SymbolicData Analysis . Springer, Heidelberg, 92–102.
SOUZA, R.M.C.R., DE CARVALHO, F.A.T. and FRERY, A.C. (1999): Simbolicapproach to SAR image classification. In: Proceedings of the IEEE 1999 Inter-national Geoscience and Remote Sensing Symposium , Hamburg, 1318–1320.
Keywords
SYMBOLIC DATA ANALYSIS, SYMBOLIC CLASSIFIER, DISSIMILAR-ITY, CONVEX HULL
60
Partitioning of Constrained Symbolic DataBased on Dissimilarity Functions
Francisco de A. T. de Carvalho1 Marc Csernel2 and Yves Lechevallier2
1 Centro de Informatica - CIn / UFPE, Av. Prof. Luiz Freire, s/n - CidadeUniversitaria, CEP: 50740-540 Recife - PE, Brazil
2 INRIA-Rocquencourt, Domaine de Voluceau - Rocquencourt B.P. 105,78153 Le Chesnay Cedex, France
Abstract. Symbolic data are organized on a symbolic table which may containin each cell not only a single value, as usual, but a set of values (Bock and Diday(2000)). The columns of this symbolic table are called symbolic variables becausethey are set-valued, i.e., for an object they take a subset of values of its domain. Therows of this data table are the symbolic descriptions of the objects. These symbolicdescriptions can be constrained by dependency rules between variables.
The method described in this paper aims to obtain a partition of a set ofsymbolic objects into a reduced (fixed) number of homogeneous classes, on the basisof a dissimilarity table. The partitioning algorithm minimizes a criterion which isbased on the sum of dissimilarities between the individuals belonging to the samecluster (Diday et al (1978)).
The dissimilarity table is provided by a new family of dissimilarity functionswhich are able to compare couples of symbolic descriptions. As comparison of cou-ples of constrained symbolic descriptions induces usually an exponential growingof computation times, a pre-processing step, where all symbolic descriptions areput on the Normal Symbolic Form, is necessary in order to keep computation timepolynomial. The Normal Symbolic Form (NSF) is a decomposition of symbolic de-scription in such a way that only coherent descriptions (i.e., which do not contradictthe rules) are represented (Csernel and De Carvalho (1999)).
References
BOCK, H.H. and DIDAY, E. (2000): Analysis of Symbolic Data. Springer, Heidel-berg.
CSERNEL, M. and DE CARVALHO, F.A.T. (1999): Usual operations with sym-bolic data under noraml symbolic form. Applied Stochastic Model in Businessand Industry, 15, 241–257.
DIDAY, E., GOVAERT, G., LECHEVALLIER, Y. and SIDI, J. (1978): Cluster-ing in Pattern Recognition, in 4th International Joint Conference on PatternRecognition, Kyoto, Japan.
Keywords
SYMBOLIC DATA ANALYSIS, DYNAMICAL CLUSTERING, NORMALSYMBOLIC FORM, DISSIMILARITY FUNCTIONS
61
Dynamical Clustering with Non-QuadraticAdaptive Distance for Interval Data
Francisco de A. T. de Carvalho and Renata M. C. R de Souza
Centro de Informatica - CIn / UFPE, Av. Prof. Luiz Freire, s/n - CidadeUniversitaria, CEP: 50740-540 Recife - PE, Brazil, {fatc,rmcrs}@cin.ufpe.br
Abstract. This work presents an extension of the dynamical clustering with adap-tive non-quadratic distance method (Diday and Govaert (1977)) to partitioning aset of symbolic objects described by interval variables. The adaptive version of thedynamical clustering method also optimizes a criterion based on a measure of fit-ting between the clusters and their representation (prototype), but at each iterationthere is a different measure to the comparison of each cluster with its own repre-sentation. The clustering algorithm is performed in two steps: an allocation stepin order to assign the individuals to the classes according to their proximity to theprototype, and a representation step where the prototypes are updated accordingto the assignment of the individuals in the allocation step.
The allocation step needs the definition of an allocation function. In our methodthe allocation function is a suitable extension of a dissimilarity function (De Car-valho and Souza (1998)) for Boolean symbolic data. This function is a Minkowski-like distance which allows to represent an interval [a,b] as a point (a,b) ∈ R2, wherethe lower bounds of the intervals are represented in the x-axis, and the upper boundsin the y-axis. The prototype associated to this method is a vector of intervals wherethe bounds for each variable are, respectively, the median of the lower bounds andthe median of the upper bounds. We considered several symbolic data sets rangingfrom different degree of difficulty to be clustered in order to show the usefulness ofthis method. The evaluation of the clustering results is based on external validityindices in the framework of a Monte Carlo experience.
References
BOCK, H.H. and DIDAY, E. (2000): Analysis of Symbolic Data. Springer, Heidel-berg.
DE CARVALHO, F.A.T. and SOUZA, R.M.C.R. (1999): New Metrics for Con-strained Boolean Symbolic Objects. In: Studies and Research: Proceedingsof the Conference on Knowledge Extraction and Symbolic Data Analysis(KESDA’98). Office for Official Publications of the European Communities,Luxembourg, 175–187.
DIDAY, E. and GOVAERT, G. (1977): Classification Automatique avec DistancesAdaptatives. R.A.I.R.O. Informatique /Computer Science, 11 (4), 329–349
Keywords
SYMBOLIC DATAANALYSIS, DYNAMICAL CLUSTERING, ADAPTIVEDISTANCES, INTERVAL DATA
62
A Hierarchical Bayesian Procedure forTwo-Mode Cluster Analysis
Wayne S. DeSarbo1, Duncan K. H. Fong1, John Liechty1, and M. KimSaxton2
1 Smeal College of Business, Pennsylvania State University, University Park,Pennsylvania, USA
2 Eli Lilly & Co., Indianapolis, USA
Abstract. This manuscript introduces a new Bayesian finite mixture methodologyfor the joint clustering of row and column stimuli/objects associated with two-modeasymmetric proximity, dominance, or profile data. That is, common clusters are de-rived which partition both the row and column stimuli/objects simultaneously intothe same derived set of clusters. In this manner, interrelationships between bothsets of entities (rows and columns) are easily ascertained. We describe the technicaldetails of the proposed two-mode clustering methodology including its Bayesianmixture formulation and a Bayes factor heuristic for model selection. We presenta modest Monte Carlo analysis to investigate the performance of the proposedBayesian two-mode clustering procedure with respect to synthetically created datawhose structure and parameters are known. Next, a consumer psychology appli-cation is provided examining physician pharmaceutical prescription behavior forvarious brands of prescription/ethical drugs in the mental health market. We con-clude by discussing several fertile areas for future research.
Keywords
CLUSTER ANALYSIS, HIERARCHICAL BAYESIAN ANALYSIS, FINITEMIXTURE MODELS, CONSUMER PSYCHOLOGY
63
Analytic Hierarchy Process - Applications inBanking
CzesÃlaw Domanski1 and JarosÃlaw Kondrasiuk2
1 University of ÃLodz, Chair of Statistical [email protected]
2 LG Petro Bank S.A., Dep.of Economic Planning and [email protected]
Abstract. In our article we want to present Analytic Hierarchy Process (AHP)as support methodology for optimising decision making. Due to our research wefocus on making strategy decisions in a bank with applying both a basic and anadjusted AHP application model. We will try to focus on main possible models tobe applied.We also describe guidelines of Thomas L.Saaty’s AHP methodology. His multi-criteria decision support method AHP provides an objective way for reaching anoptimal decision for both individual and group decision makers with a limited levelof inconsistency. The AHP makes possible to select the best alternative (underseveral criteria) from a number of alternatives through carrying out pairwise com-parison judgements. Basing on pairwise comparison judgements, overall prioritiesfor ranking the alternatives are being calculated.
Keywords
AHP, ANALYTIC HIERARCHY PROCESS, BANKING, DECISION MAK-ING
64

Technische Analyse als Mittel desRisikomanagements: Selbsttauschung oder
rationale Strategie?
Gregor Dorfleitner and Christian Klein
Institut fur Statistik und mathematische Wirtschaftstheorie,Universitat Augsburg D-86153 Augsburg, Germany
Abstract. Die wissenschaftliche Auseinandersetzung mit der Technischen Analysebesitzt eine lange Tradition sowohl in der deutschsprachigen als auch der anglo-amerikanischen Literatur. Seit den kritischen Beitragen uber die Technische Analyseseitens der Vertreter der Effizienzmarkthypothese (vgl. etwa Schmidt (1976) oderMalkiel (1996)) schien das Thema erledigt zu sein: In effizienten Markten kann dieTechnische Analyse keine Uberrenditen erzielen. Bewegung kommt in die Diskussiondurch eine Reihe neuer Arbeiten von anerkannten Wissenschaftlern, welche sich mitder Technischen Analyse beschaftigen (vgl. etwa Lo/Mamaysky/Wang (2000)). Diesist in sofern uberraschend, da es immer noch keine wissenschaftlich befriedigendeErklarung gibt, weshalb die Technische Analyse funktionieren soll (vgl. hierzu auchJegadeesh (2000)).
Der Vortrag geht auf die Anwendungsmoglichkeiten der technischen Analyse imRisikomanagement des Wertpapierhandels ein. Befurworter in der Praxis weisen aufdie risikoreduzierende Funktion der technischen Analyse hin. Dies soll im Vortragwissenschaftlich hinterfragt werden.
References
JEGADEESH, N. (2000): Foundations of Technical Analysis - Discussion. Journalof Finance 55, No. 4, S. 1765-1770.
LO, A.W., MAMAYSKY, H. und WANG, J. (2000): Foundations of Technical Anal-ysis: Computational Algorithms, Statistical Inference, and Empirical Imple-mentation. Journal of Finance 55, S. 1705-1765
MALKIEL, B. (1996): A Random Walk Down Wallstreet: Including a Life-CycleGuide to Personal Investing. New York
SCHMIDT, R.H. (1976): Aktienkursprognose. Wiesbaden.
Keywords
TECHNISCHE ANALYSE, MARKTEFFIZIENZ, RISIKOMANAGEMENT
65
Asset Correlation of German CorporateObligors: Its Estimation, Its Drivers and
Implications for Regulatory Capital
Klaus Dullmann1 and Harald Scheuley2
1 Deutsche Bundesbank, Wilhelm-Epstein-Str. 14, D-60431 Frankfurt, Email:[email protected]
2 Department of Statistics, Faculty of Business and Economics, University ofRegensburg, D-93040 Regensburg
Abstract. The objective of this paper is to estimate the asset correlation of Ger-man corporate obligors. In the theoretical part the small sample properties of twoestimators of the asset correlation are analysed by Monte Carlo simulations. Inthe empirical part the asset correlation is estimated and their dependency on twofactors - firm size and probability of default (PD) - is explored. The analysis ofthese factors is inspired by a recent proposal of the Basel Committee by which therisk weight function of the internal rating based (IRB) approach of the new Ac-cord is modified. (See press release ”Basel Committee reaches agreement on NewCapital Accord issues” from July 10th, 2002.) This modification introduces a two-dimensional dependency of the parameter asset correlation on the PD and the sizeof the obligor.
Our analysis is based on the asymptotic single risk factor model (ASRF) thathas been used to derive the IRB capital charge of the new Accord. (See Gordy(2001).)We refer to this model because it facilitates the comparison with the IRBrisk weights. In this model there exists a one-to-one mapping between default cor-relation and asset correlation for a given probability of default. Hence, the analysisprovides new results on the level of default correlation which is a key driver of creditrisk. Therefore, the results are relevant as well for credit risk modeling in general.
References
M. Gordy. A risk-factor model foundation for ratings-based bank capital rules.Working Paper, Board of Governors of the Federal Reserve System, 2001.
M. Gordy and E. Heitfield. Estimating factor loadings when ratings performancedata are scarce. Memorandum, Board of Governors of the Federal ReserveSystem, 2000.
J. A. Lopez. The empirical relationship between average asset correlation, firmprobability of default and asset size. Working Paper, BIS Workshop: ”Basel II:An Economic Assessment”, 2002.
66
P-Values for Classification
Lutz Dumbgen
Department of Mathematical Statistics and Actuarial ScienceUniversity of BerneSidlerstrasse 5, CH-3012 Berne, Switzerland
Abstract. In this talk we discuss the classical paradigm of optimal classification(in a Bayesian sense) and an alternative approach using P-values. Suppose that(X,C) is a random pair consisting of a feature vector X and a class C ∈ {1, . . . , L}.Classification means to predict C based on X. Our approach replaces such a clas-sifier with a vector (πc(X))Lc=1 of P-values for class memberships. That means,
P (πc(X) ≤ α |C = c) ≤ α
for any c ∈ {1, . . . , L} and α ∈ [0, 1]. Given such P-values, we may claim withconfidence 1− α that the unknown class C belongs to the set
Cα(X) = {c : πc(X) > α}.
We argue that such a prediction region is preferable to Bayesian posterior credibilityset for various reasons.
The classical theory of optimal classifiers may be modified in order to deriveoptimal P-values. But things get more involved if the conditional distributionsof the feature vector X, given C, are unknown and have to be estimated fromtraining data. In particular we describe some nonparametric methods and commenton algorithmic aspects.
Finally these methods are illustrated with simulated and real data.
References
DUEMBGEN, L. and HOEMKE, L. (2003). P-Values for Classification. PreprintKENT, J.T. and TYLER, D.E. (1991). Redescending M-estimates of multivariate
location and scatter. Annals of Statistics, 19, 2102-2119MCLACHLAN, G.J. (1992). Discriminant Analysis and Statistical Pattern Recog-
nition. Wiley, New York
Keywords
BAYES-OPTIMAL, NEAREST NEIGHBORS, M-ESTIMATION, PERMU-TATION TEST, TYPICALITY INDEX
67

Auswahl exogener Variablen in der Regressionmit Hilfe Genetischer Algorithmen
Stefan Etschberger and Andreas Hilbert
Institut fur Statistik und Mathematische Wirtschaftstheorie, UniversitatAugsburg, D-86159 Augsburg, Germany
Abstract. In vielen Anwendungssituationen, wie z.B. dem Data Mining, entstehtoft das Problem, aus einer MengeX(mit |X| = m) von exogenen Variablen diejenigeTeilmenge Xi ⊂ X(i = 0, ..., 2m − 1) von Regressoren auszuwahlen, die unterBerucksichtigung ausgewahlter Gutemaße die endogene Variable Y hinreichend gutbeschreiben.
Dieses global schwierig zu losende kombinatorische Optimierungsproblem wirdderzeit vor allem mit Hilfe verschiedener Heuristiken, wie z.B. den schrittweisenAuswahlverfahren, oder mit Hilfe von Monte-Carlo-Simulationsstudien bearbeitet(Miller, 2002).
Fasst man nun ein konkretes Regressionsmodell M gemaß Y = f(Xi) als einIndividuum und eine uber Mutations- und Rekombinationsregeln verknupfte Mengedieser Individuen als eine Population P = {M1,M2, ...} auf, kann das Problem mitHilfe evolutionarer Strategien (Nissen, 1997) modelliert und gelost werden.
Der Vortrag beschaftigt sich mit einer moglichen Implementierung der adaquatenAlgorithmen auf dieses als Subset Selection bekannte Problem und deren Anwen-dung im Rahmen einer Simulationsstudie.
References
MILLER, A. (2002): Subset Selection in Regression. Chapman and Hall, Boca Ra-ton, Florida.
NISSEN, V. (1997): Einfuhrung in evolutionare Algorithmen. Vieweg, Braun-schweig, Wiesbaden.
Keywords
MULTIPLE REGRESSION, SUBSET SELECTION, GENETIC ALGORITHM
68

Effiziente Sacherschließung als Kernaufgabevon Bibliotheken: Perspektiven und Problemeleistungsgerechter bibliothekarischer Produkte
Holger Flachmann
Universitats- und Landesbibliothek, Westfalische Wilhelms-Universitat Munster,Krummer Timpen 3-5, 48143 Munster
Abstract. Bibliotheken stehen im Zeitalter elektronischer Kommunikation in ver-starkter Konkurrenz zu anderen Informationsanbietern. Mit den Wahlmoglichkeitender Nutzer stellt sich unmittelbar die Frage nach der Effizienz der eigenen Produkteund Dienstleistungen. Dies gilt auch fur die bibliothekarische Sacherschließung,allerdings in spezifischer, sich von den Rechtfertigungsgrunden anderer bibliotheka-rischer Angebote unterscheidender Weise, wie darzulegen sein wird. Anschließendwird weiterfuhrend nach einzelnen Leistungsmerkmalen zu fragen sein, die geeignetsind, das generelle Erfordernis einer effizienten Inhaltserschließung zu konkretisieren.Es sollen Kriterien erhoben und systematisiert werden, mit deren Hilfe sich dieWirksamkeit bibliothekarischer Sacherschließungsinstrumente und -verfahren bes-timmen laßt. Ziel ist es, qualitative Maßstabe zu entwickeln, die vermittelt mitdem externen und abstrakten Kriterium der Wirtschaftlichkeit fur eine Gesamtef-fizienzbewertung in Anschlag gebracht werden konnen.
Die Uberlegungen stutzen sich durchgangig auch auf Erfahrungen und exem-plarische Beispiele aus der Praxis der Sachkatalogisierung. Zusatzlich zu Effizienz-mangeln und ihren Ursachen sollen Optimierungsmoglichkeiten und -hindernisseerortert werden. Die anschließende Diskussion uber die Kriteriologie konnte Per-spektiven und Strategien einer effizienteren bibliothekarischen Sacherschließungaufzeigen.
69

Finding Pathways in Decision Forests
Andre Floter1 and Joachim Selbig2
1 Institut fur Informatik,Universitat Potsdam, August-Bebel-Str. 89/Hs.4, D-14482 Potsdam, Germany
2 Max-Planck-Institut fr molekulare Pflanzenphysiologie,Am Mhlenberg 1, D-14476 Golm, Germany
Abstract. Transcript profiling is a powerful source of information about gene reg-ulation.
Several methods have been reported that allow inferences to be made aboutgenetic regulatory networks using profiling data. While somewhat accurate in pre-dicting properties such as Markov relations between the nodes of the output graph,these methods encounter problems when dealing with graphs containing a highnumber of vertices (>50). To circumvent these difficulties, data sets (sometime>20,000 genes) must be reduced priori with pre-processing techniques.
We have found a way to make network inferences using ensembles of decisiontrees that can handle almost any amount of vertices, and thus to avoid time con-suming pre-processing steps. The technique works on a bootstrap principle andheuristically searches for partially correlated relations between all objects.
We tested this approach on synthetically generated data as well as on datataken from real microarray experiments.
References
DANA PE’ER, AVIV REGEV, GAL ELIDAN and NIR FRIEDMAN (2001): In-ferring subnetworks from perturbed expression profiles. Bioinformatics, Vol.17Suppl. 1 2001, p365–392.
HIROYUKI TOH and KATSUHISA HORIMOTO (2002): Inference of a geneticnetwork by a combined approach of cluster analysis and graphical Gaussianmodeling. Bioinformatics, Vol.18 no.2 2002, p287–297
IRENE M. ONG, JEREMY D. GLASNER and DAVID PAGE: Modelling regula-tory pathways in E. coli from time series expression profiles. Bioinformatics,Vol.18 Suppl. 1 2002, p241–248
BILL SHIPLEY, “Cause and Correlation in Biology: A User’s guide to Path Anal-ysis, Structural Equations and Causal Inference”, Cambridge University Press,ISBN 0521529212, 2002
Keywords
MICROARRAY EXPRESSION PROFILING, NETWORK INFERENCE,REGULATORY PATHS, DECISION TREES
70
Partial Correlation Graphsand Latent Variable Analysisfor Multivariate Time Series
Roland Fried1 and Vanessa Didelez2
1 Fachbereich Statistik,Universitat Dortmund, D-44137 Dortmund, Germany
2 Department of Statistical Science,University College London, London WC1E 6BT, U.K.
Abstract. We derive conditions for decomposition and collapsibility of partial cor-relation graphs for multivariate time series (Dahlhaus, 2000). These properties en-able us to perform stepwise model selection under certain restrictions. Reliablestrategies for selection of partial correlation graphs are valuable for instance forclassifying distinct clinical states of patients in intensive care (Gather et al., 2002).We also show how the collapsibility and separation properties of a partial corre-lation graph can help to understand the relation between a dynamic factor modeland the structure among the observable time series. With these results, a partialcorrelation graph constructed from empirical data can be exploited for identifyinginterpretable latent variables underlying a multivariate time series. The findings areillustrated by an application to measurements of the human hemodynamic system.
References
DAHLHAUS, R. (2000): Graphical Interaction Models for Multivariate Time Series.Metrika, 51, 157–172.
FRIED, R. and DIDELEZ, V. (2002): Decomposability and Selection of Graphi-cal Models for Multivariate Time Series. Technical Report 17/2002, SFB 475,University of Dortmund, Germany.
GATHER, U., IMHOFF, M. and FRIED, R. (2002): Graphical Models for Multi-variate Time Series from Intensive Care Monitoring. Statistics in Medicine, 21,2685–2701.
Keywords
DIMENSION REDUCTION, GRAPHICAL MODELS, MODEL SELEC-TION, DYNAMIC ASSOCIATIONS
71

Utilization of Information Technicses inTeleworking and Telelearning. Perspectives
Expansion in Poland.
Marcin Gajdos
Katedra Ekonometrii i Statystyki, Politechnika Czestochowska, Poland,[email protected]
Abstract. Time - limit teleworking as a rule qualifies work, which can be leaden farfrom places of employment with utilization of accessible information and telecom-munication technicses. Teleworking is also qualified as form of work using technologyinquiry in aim of carriage of work to worker, not worker to work. Workers executeone’s own work far from traditional desks and effects send to main offices. Use oftechnology of information different oneself degree utilizations of useful tools of re-mittance, such as: telephone, fax, computer whether Internet.In the ending I want to show situation of teleworking in Poland.
Keywords
TELELEARNING, TELETEACHING, TELEWORKING
72
On Application of a Certain ClusteringProcedure to Mean Value Estimation under
Double Sampling for Nonresponse
Wojciech Gamrot
Department of Statistics, The Karol Adamiecki University o Economy, ulBogucicka 14, 40-226 Katowice Poland
Abstract. The phenomenon of nonresponse in sample surveys reduces the preci-sion of population mean estimates and in addition it introduces the bias. Severalmethods have been proposed to compensate for these effects. An important tech-nique used to deal with deterministic nonresponse is the double sampling scheme.According to this procedure, the survey is executed in two phases. In the firstphase a sample is drawn from the population and some units respond, whereasothers do not. During the second phase a subsample of first-phase nonrespondentsis re-examined in an additional effort to collect missing data. Population meanestimates obtained in both phases of the survey are then weighted by estimatesof population respondent and nonrespondent proportions. Usually, the fractions ofrespondents and nonrespondents in the initial sample are used as weights. In thispaper an alternative method of assessing these fractions on the basis of availableauxiliary information is considered. The application of a certain clustering pro-cedure to improve the accuracy of population mean estimates is discussed. Someresults of Monte Carlo simulation comparing the mean square error of both sam-pling strategies are presented.
References
JAJUGA, K. (1990): Statystyczna Teoria RozpoznawaniaObrazow. PWN, Warsaw.
SARNDAL, C.E. SWENSSON, B. and WRETMAN, J. (1992): ModelAssisted Survey Sampling. Springer, New York.
WYWIAÃL, J. (1998): Estimation of Population Average on theBasis of Strata Formed by Means of Discrimination FunctionStatistics in Transition. 3, 5, 903–912.
WYWIAÃL, J. (2001): On Estimation of Population Mean in theCase When Nonrespondents Are Present. Taksonomia, 8, 13–21.
Keywords
NONRESPONSE, CLUSTERING, MEAN VALUE ESTIMATION, ACCU-RACY
73
Simple Consistent Cluster Methods Based onRedescending M-Estimators with an
Application to Edge Identification in Images
by Tim Garlipp and Christine H. Muller
Universitat Oldenburg, Fachbereich 6 MathematikPostfach 2503, D - 26111 Oldenburg
Abstract. We use the local maxima of a redescending M-estimator to identifycluster, a method proposed already by Morgenthaler (1990) for finding regressionclusters. We work out the method not only for classical regression but also fororthogonal regression and multivariate location and show that all three approachesare special cases of a general approach which includes also other cluster problems.For the general case we show consistency for an asymptotic objective functionwhich generalizes the density in the multivariate case. The approach of orthogonalregression is applied to the identification of edges in noisy images.
References
ARSLAN, O. (2002): A simple test to identify good solutions of redescending Mestimating equations for regression. In: Dutter, R., Gather, U., Rousseeuw,P.J. and Filzmoser, P. (Eds.): Developments in Robust Statistics, Proceedingsof ICORS 2001, 50-61.
HENNIG, C. (2002): Clusters, outliers, and regression: Fixed point clusters. Toappear in: Journal of Multivariate Analysis.
MORGENTHALER, S. (1990): Fitting redescending M-estimators in regression.In: Lawrence, H. D. and Arthur, S. (Eds.): Robust Regression. Dekker, NewYork, 105-128.
Keywords
KERNEL DENSITY ESTIMATORS, M-ESTIMATION, CONSISTENCY,MULTIVARIATE CLUSTER, REGRESSION CLUSTER, ORTHOGONALREGRESSION, EDGE IDENTIFICATION IN NOISY IMAGES
74
Randomizationin Aggregated Classification Trees
Eugeniusz Gatnar
Institute of Statistics,Katowice University of Economics, ul. Bogucicka 14, 40-226 Katowice, Poland
Abstract. Tree-based models are popular and widely used because they are sim-ple, flexible and powerful tools for classification. Unfortunately they are not stableclassifiers. The model depends on the contents of the training set, i.e. small changesin the data lead to major changes in the response y.
Significant improvement of the model stability can be obtained by aggregation ofmultiple classification trees. Proposed methods, i.e. bagging and boosting are basedon bootstrap sampling from the training set. The methods reduce the classifcationerror but this resampling causes major modification of the training set.
Even more accurate classifiers can be obtained by combining models built ontraining samples with randomly chosen subsets of variables. Moreover, this methoddoes not modify the distribution of predictors in the training set.
In this paper we show and compare methods for building random decisionforests.
References
AMIT, Y. and GEMAN, D. (1997): Shape quantization and recognition with ran-domized trees. Neural Computattion, 9, 1545–1588.
GATNAR, E. (2002): Tree-based models in statistics: three decades of research. In:K. Jajuga, A. SokoÃlowski and H.H. Bock (Eds.): Classification, Clustering, andAnalysis. Springer, Berlin, 399–408.
HO, T.K. (1998): The random subspace method for constructing decision forests.IEEE Transactions on Pattern Analysis and Machine Intelligence, 20, 832–844.
Keywords
TREE-BASED MODELS, DECISION FORESTS, RANDOMIZED CLAS-SIFIERS
75

Data Mining - Polish experience
Eugeniusz Gatnar and Dorota Rozmus
Institute of Statistics,Katowice University of Economics, ul. Bogucicka 14, 40-226 Katowice, Poland
Abstract. Data Mining is used to turn data into information and it links sev-eral fields including statistics, artificial intelligence, database management, machinelearning, pattern recognition and data visualization. It became a field of interest inearly 90s.
In this paper we present the development of Data Mining in Poland.We start with a short description of research projects that have been done
recently in this field in Poland. There are also courses related to Data Miningavailable for students at several Polish Universities. We tell a few words aboutthem.
Then we mention recent publications (books, etc.) in Polish on some DataMining techniques.
Several software developers and vendors in Poland are specialized in Data Min-ing tools. They sell computer programs both of foreing and Polish origin.
At last we show some examples of successful use of the Data Mining methodsin practice.
References
BERRY, M.J. and LINOFF, G. (1997): Data Mining techniques. John Wiley &Sons, New York.
GATNAR, E. (1997): Data Mining and statistical data analysis. Statistical Revue,2, 309–316 (in Polish).
GROTH, R. (1998): Data Mining. Prentice Hall, Upper Saddle River, NJ.
Keywords
DATA MINING, STATISTICAL METHODS, DATA ANALYSIS
76
Ein Refenzmetamodell zur Klassifikation vonMethodenfragmenten
Andreas Gehlert and Werner Esswein
Lehrstuhl fur Wirtschaftsinformatik, insb. Systementwicklung, TechnischeUniversitat Dresden, D-01062 Dresden
Abstract. Mit der Entwicklung von Referenz(objekt)modellen als Wiederverwen-dungsansatz innerhalb der Modellierung wurde die Grundlage dafur gelegt, denModellierungsprozess schneller, kostengunstiger, qualitativ hochwertiger und risi-koarmer zu gestalten. Referenzmodelle fur die Metaebene wurden bisher jedochnur von Winter betrachtet.
Die relativ neue Forschungsrichtung der Methodenentwicklung, deren Zielset-zung es ist, fur konkrete Projekte maßgeschneiderte Methoden aus bestehendenMethodenfragmenten systematisch zu konstruieren, benotigt nach Harmsen eineMethodenbasis, in der die Methodenfragmente klar strukturiert abgelegt werden,sodass sie zur Konstruktion der neuen Methode einfach aufgefunden werden konnen.
In dieser Arbeit wird gezeigt, wie bestehende Techniken der Referenzmodel-lierung auf die Metaebene ubertragen werden konnen. Es wird ein sprachbasiertesReferenzmetamodell vorgestellt, welches sich aus insgesamt drei Teilen, dem Ref-erenzmetamodellrahmen, dem Referenzmetaschema und dem Referenzmetaaktivitats-modell zusammensetzt. Der Referenzmetamodellrahmen klassifiziert existierendesprachbasierte Methodenfragmente der Systementwicklung nach einem polyhier-archichen Klassifikationssystem. Dabei werden vier Sichten (Aufbau-, Aufgaben-,Objekt-, Prozesssicht), unterschieden die weiter durch Paradigmen unterteilt wer-den. Das Referenzmetaschema enthalt das Modell dieser Methodenfragmente, welchesdurch ein Klassendiagramm der UML visualisiert wird. Das Referenzmetaaktivi-tatsmodell zeigt, wie die Methodenfragmente und ihre vorgedachten Beziehungenuntereinander identifiziert, aus dem Referenzmetaschema extrahiert und zu spezi-fischen Metamodellen kombiniert werden konnen.
Das hier vorgestellte Referenzmetamodell kann als Methodenbasis fur die Meth-odenentwicklung fungieren. Damit werden die Vorteile des Einsatzes von Referenz-modellen auf die Metaebene ubertragen und damit fur die Methodenentwicklungnutzbar.
References
HARMSEN, A. F.: Situational Method Engineering. University of Twente, Disser-tation, 1997
WINTER, A.: Ein Referenz-Metaschema der Beschreibungsmittel fur Organisatio-nen und Softwaresysteme. Universitat Koblenz-Landau, Dissertation, 2000
Keywords
METAMODELL, REFERENZMODELL, METHODENFRAGMENT77
Discrete versus Continuous Representationof Heterogeneity in Conjoint
and Choice-Based Conjoint Models
Sonja Gensler and Bernd Skiera
Department of Electronic Commerce,Johann Wolfgang Goethe-University, D-60054 Frankfurt am Main, Germany
Abstract. To know consumers’ preferences is of great importance for many mar-keting decisions like pricing or new product development. Therefore, the questionof how to elicit consumers’ preferences is crucial. Conjoint methods are popularmethods to find out consumers’ preferences and numerous variants of traditionalConjoint Analysis like Choice-Based Conjoint (CBC) Analysis exist to overcomethe shortcomings of traditional Conjoint Analysis. The discussion if CBC Analysisor traditional Conjoint Analysis is more likely to elicit consumers’ preferences isone about the trade-off between bias and variance, whereas the bias of parameterestimates is caused by heterogeneity. Hence the representation of heterogeneity isa great challenge in marketing. An adequate representation of heterogeneity al-lows target-marketing or one-to-one marketing activities. Finite Mixture modelsand hierarchical Bayes models are discussed for a discrete respectively a continu-ous representation of heterogeneity. A simulation study is conducted to comparethe different models at different levels of aggregation. The extent of heterogeneityis manipulated as well as the information available for estimation. The results ofthe extensive simulation study give insights in model performance of Finite Mix-ture models and hierarchical Bayes models as well as Conjoint Analysis and CBCAnalysis regarding fit, recovery of utility structure and predictive accuracy. Theseresults have implications for model application.
References
ANDREWS, R.L., AINSLIE, A. and CURRIM, I.S. (2002a): An Empirical Com-parison of Logit Models with Discrete vs. Continuous Representations of Het-erogeneity. Working Paper (accepted in JMR), University of Delaware.
ANDREWS, R.L., ANSARI, A. and CURRIM, I.S. (2002b): Hierarchical Bayes ver-sus Finite Mixture Conjoint Analysis Models: A Comparison of Fit, Prediction,and Partworth Recovery. Journal of Marketing Research, 39, 87-98.
MOORE, W.L., GRAY-LEE, J. and LOUVIERE, J.J. (1998): A Cross-ValidityComparison of Conjoint-Analysis and Choice Models at Different Levels ofAggregation. Marketing Letters, 9, 195-208.
Keywords
HETEROGENEITY, HIERACHICAL BAYESMODEL, FINITEMIXTUREMODEL, CONJOINT ANALYSIS
78

A Two-Phase Grammar-Based GeneticAlgorithm for a Workshop Scheduling Problem
Andreas Geyer-Schulz1 and Anke Thede1
Institut fur Informationswirtschaft und -Management,Universitat Karlsruhe (TH), D-76128 Karlsruhe, Germany
Abstract. In this contribution we present a two-phase grammar-based geneticalgorithm that we use to solve the problem of workshop scheduling in an educa-tional environment which respects partial preferences of participants. The solutionrespects constraints on workshop capacities and allows for different schedule types.
We approach this problem by defining a grammar which defines a languagefor expressing the restrictions on workshops and participants. A word of this for-mal language represents a feasible solution and has the property that only feasibleschedules can be represented.
For each feasible schedule the fitness is the result of optimizing the group’ssocial welfare function which is defined as the sum of the individual utility functionas expressed by the partial preferences. This optimization is achieved with an orderbased genetic algorithm which assigns to each participant his personal schedule.
79
Immobilienmarkt und Finanzmarktals Alternative, LangfristigeInvestitionsmoglichkeiten
Urszula GieraÃltowska and Ewa Putek
Universitat in Szczecin,Al. Jednosci Narodowej 22a, 70-453 Szczecin, Poland
Abstract. Kapital kann auf dem Geld- und Kapitalmarkt umfassenden Finanz-markt oder auf dem Sachmarkt, der aus dem Immobilien- und Auktionsmarktbesteht, angelegt werden. Die Investitionsbereitschaft hangt von der Risikoein-schatzung ab, weil ein zukunftiger Gewinn nicht garantiert ist. Aus diesem Grundstrebt ein Anleger nach Minimierung des Risikos oder nach Maximierung des kunf-tigen Gewinns. Zum diesem Ziel werden neue Investitionsmarkte gesucht, die keineoder geringe Korrelation aufweisen. Das Ziel dieses Artikels ist die Bildung einesPortefeuille, das aus Aktien der Wertpapierborse in Warschau (GPW), Schatzan-weisungen, Obligationen und Immobilien besteht. Im Hinblick auf den spezifischenCharakter der Immobilien, der durch niedrige Liquiditat gegenzeichnet sind, kom-men ausschliesslich Langzeitinvestitionen in Betracht. Im Artikel wird eine Anal-yse des Immobilienmarktes, unter Berucksichtigung der Aufteilung in Wohn undGewerbeimmobilien (die Analyse wurde fur Szczecin, Koszalin, Gryfino und Gry-fice durchgefuhrt), vorgenommen. Den Berechnungen liegen Immobilientransaktio-nen aus den Jahren 1995–2000 zugrunde, die sich auf die gegenwartig zuganglicheDatenbanke der Finanzamter stutzen. Im Bereich des Kapitalmarktes wurde eineKlassifikation mit Hilfe der gewahlten Methoden (TMAI, Methoden k-Mittel) deran der GPW notierten Aktiengesellschaften vorgenommen. Diese Klassifikation op-timiert die Wahl der Aktien. Das auf die Weise erstelltes Portefeuille minimalisiertdas Risiko und maximalisiert den Gewinn des Anlegers.
References
NOWAK, E. (1990): Metody taksonomiczne w klasyfikacji obiektow spoÃleczno-gospodarczych. PWE, Warszawa.
BROWN, G.R. (1991): Property Investment and the Capital Markets. EFN SPO,London.
STASIAK-KUCHARSKA, E. (1999): Inwestowanie w nieruchomosci. Valor.
Keywords
INVESTITION, AKTIENMARKT, IMMOBILIENMARKT, PORTEFEUILLE,MARKOWITZ-MODEL, KLASSIFIKATION
80
Random Graph and Hypergraph Models forClassification
Erhard Godehardt1 and Jerzy Jaworski2
1 Clinic of Thoracic and Cardiovascular Surgery, Heinrich Heine University,D-40225 Dusseldorf, Germany
2 Faculty of Mathematics and Computer Science, Adam Mickiewicz University,PL-61614 Poznan, Poland
Abstract. Graph concepts generally are useful for defining and detecting clusters.Consider a set V of objects and a set W of their possible properties and let BG bea bipartite graph with the 2-partition (V,W) of the vertex set V ∪W and with theedge set E of choices; edges go only from elements of V to elements of W. Eachgraph BG generates two intersection graphs. The first one with the vertex set Vhas two vertices joined by an edge if and only if the sets of neighbors of thesevertices in BG have a non-empty intersection (or, more generally, an intersectionconsisting of at least s elements). The second intersection graph generated by BG isdefined on the vertex set W of properties analogously. Intersection graphs derivedfrom a random bipartite graph, in which properties are assigned to elements of theset V according to a given probability distribution were studied by Godehardt andJaworski (2002). The main purpose of the paper is to study the connectedness ofthe two models of random intersection graphs generated by this random bipartitegraph: the “active” one, i.e., the one with the set V of active vertices (the verticeswhich choose their neighbors in the original bipartite graph) and the “passive” one(with the vertices which were chosen). First some relations between hypergraphsand these two models (active and passive) are established. Then applying knownresults for the connectivity of random hypergraphs, we obtain the correspondingresults for the intersection models. The application of this result to find clustersand to test their randomness for non-metric data is discussed.
References
GODEHARDT, E. and JAWORSKI, J. (2002): Two models of random intersectiongraphs for classification. In: M. Schwaiger, O. Opitz (Eds.): Exploratory dataanalysis in empirical research. Springer, Berlin – Heidelberg – New York, 68–81.
DUCHET, P.(1995): Hypergraphs. In: R. Graham, M. Grotschel, and L. Lovasz(Eds.): Handbook of Combinatorics. Elsevier Science, 381–431.
KARONSKI, M. and ÃLUCZAK, T. (1996): Random hypergraphs. In: D. Miklos,V.T. Sos and T. Szonyi (Eds.): Combinatorics, Paul Erdos is Eighty, BolyaiMath. Society, Budapest, Hungary, volume 2, 283–293.
KeywordsGRAPH THEORY, RANDOM GRAPHS, HYPERGRAPHS, CLUSTERS.
81
Handling Missing Valuesin Marketing Research Using SOM
Mariusz Grabowski1
Department of Computer Science,Cracow University of Economics, 31-510 Krakow, 27, Rakowicka St., Poland
Abstract. Incomplete data constitute a serious difficulty in many fields of re-search. This problem is particularly vital in marketing research, where gaps occurin gathered statistical material quite frequently. In practice, researchers deal withthis problem in many less or more satisfactory ways. The trivial techniques suchas record or variable deletion, implemented in various statistical software pack-ages, discard the information contained in rejected portions of data. Other simpletechniques such as mean substitution are in many cases not acceptable because ofdistribution assumptions. Although the loss of information connected with even apartial lack of data is inevitable, it seems important to develop methods estimatingthe missing values that would aim at preserving as much of the information fromthe data space as possible. The attempt of using Kohonen’s SOM (Self-OrganizingMap) neural network as a method dealing with incomplete information was pre-sented in Grabowski (1998), where its superiority over mean substitution algorithmwas proven on IRIS data set. This paper will address the use of SOM in estimatingmissing data in a marketing field. The comparison of SOM with other non-trivialmissing values handling methods as expectation maximization and others also willbe presented.
References
GRABOWSKI, M. (1998): Application of Self-Organizing Maps to Outlier Identi-fication and Estimation of Missing Data. In: A. Rizzi, M. Vichi and H.H. Bock(Eds.): Advances in Data Science and Classification. Springer, Berlin, 279–286.
KOHONEN, T. (2001): Self-Organizing Maps. Springer, Berlin.KORDOS, J. (1988): Jakosc danych statystycznych. PWE, Warszawa.POCIECHA, J. (1996): Metody statystyczne w badaniach marketingowych. PWN,
Warsawa.SARLE, W.S. (1994): Neural Networks and Statistical Models. In: SAS Institute
Inc.: Proceedings of the Nineteenth Annual SAS Users Group InternationalConference, Cary, NC, 1538–1550.
Keywords
MISSING DATA, MARKETING, NEURAL NETWORKS, SOM
82
Analyzing Protein Data With theGenerative Topographic Mapping Approach
Isabelle Grimmenstein and Wolfgang Urfer
Fachbereich Statistik,Universitat Dortmund, D-44221 Dortmund, Germany
Abstract. Protein sequence data contain a wealth of information. Especially theanalysis of protein families can give an insight into evolutionary mechanisms andhelps to elucidate biochemical processes in the cell. In this connection it is importantto know the internal organization of a given protein family and to determine keyregions in the proteins where interactions with other molecules take place or whichare important for the special three-dimensional structure.
One way to obtain this information is to use a latent variable approach for dataanalysis where a statistical model is searched for representing the distribution of thehigh-dimensional sequence space by a lower dimensional hidden smooth manifold.In a recent work (Grimmenstein et al., 2002) we analyzed protein family databy the Self-Organizing Map (SOM) approach of Kohonen (1982) which gives aclassification and topographic mapping of the sequence data. However, because ofthe heuristic nature of the SOM methodology we found several drawbacks in thecontext of protein sequence data analysis. These were above all that different runsof the SOM algorithm can produce different results and that there is no globaloptimization criterion for the assessment of the outcomes.
To overcome the shortcomings of the SOM approach we use instead the Genera-tive Topographic Mapping (GTM) approach by Bishop et al. (1998) which is inspirit corresponding to the SOM, but is based on a probabilistic background. Weapply the GTM algorithm to sequences from the protein family of septins andcompare the results with our former results obtained with SOMs. We discuss theapplicability of the GTM approach for the appraisal of protein sequence data andpoint out ways for further enhancements in the given context.
References
BISHOP C.M.; SVENSEN, M. and WILLIAMS, C.K.I. (1998), GTM: The Genera-tive Topographic Mapping. Neural Computation, 10, 215–234.
GRIMMENSTEIN, I.M.; ANDRADE, M.A. and URFER, W. (2002): Identificationof Conserved Regions in Protein Families by Self-Organizing Maps. TechnicalReport 36/2002, SFB 475, Department of Statistics, University of Dortmund.
KOHONEN, T. (1982): Self-organized formation of topologically correct featuremaps. Biological Cybernetics, 43, 59–69.
Keywords
GENERATIVE TOPOGRAPHICMAPPING, SELF-ORGANIZINGMAPS,SEPTINS, FAMILY RELATIONSHIPS , KEY RESIDUES
83
Detection of Heteroscedasticity: Application toSecurity Characteristic Line
Alicja Grzeskowiak
Department of EconometricsWrocÃlaw University of Economics, WrocÃlaw, Poland
Abstract. The characteristic lines as the classical linear regression models are usu-ally estimated by the ordinary least squares method. Under certain assumptions theOLS estimators have desirable optimal properties. In the linear model it is assumedthat the random terms (disturbances) have identical variance. To detect the oppo-site situation known as heteroscedasticity a lot of statistical tests based on theresiduals of the model were proposed. In this paper the application of a classifica-tion rule to detection of heteroscedasticity is discussed. Two distributions of randomterms are regarded: the first with scalar matrix of covariance (homoscedasticity)and the second with non-scalar matrix of covariance (heteroscedasticity). The dis-criminant function obtained from the likelihood ratio should give the opportunityto distinguish models with or without heteroscedasticity. This classification rule isapplied to detect heteroscedasticity of error terms in models of characteristic linesestimated for shares quoted on the Warsaw Stock Exchange.
References
ELTON, E. J. and GRUBERM. J. (1995): Modern Portfolio Theory and InvestmentAnalysis. John Wiley & Sons, New York.
JUDGE, G. G., HILL, C., GRIFFITHS W. E., LUTKEPOHL H. and LEE, T.- C.(1982): Introduction to the Theory and Practice of Econometrics. John Wiley& Sons, New York
MORRISON, D. F. (1990): Multivariate Statistical Methods. McGraw-Hill Inc, Lon-don.
THEIL, H. (1971): Principles of Econometrics. John Wiley & Sons, New York.
Keywords
SECURITY CHARACTERISTIC LINE, CLASSIFICATION, HETEROSCE-DASTICITY, REGRESSION MODELS
84

Nonparametric Recognition Methods andTheir Applications
Kazimiera Guraj-Kaczmarek and MaÃlgorzata Misztal
Chair of Statistical Methods, University of Lodz
Abstract. The primary goal of pattern recognition is to assign an object, repre-sented by a vector of numbers, to one class from the finite set of classes.The aim of the article is to present the results of using selected nonparametric pat-tern recognition algorithms to solve decision - making problems.The following methods were applied: the nearest neighbour (NN) algorithm, thea-nearest neighbours (α-NN) algorithm, the distance - based (DB) algorithm andclassification and trees, constructed by recursively partitioning the learning set. Inorder to compare nonparametric and parametric methods linear classifying func-tions were also calculated.We also present some applications of the described methods in medical diagnosisand socio - economic research.
85
Vollzahligkeitsschatzungen vonKrebsregisterdaten mittels log-linearer
Modelle und neueste Ergebnisse
Jorg Haberland, Dieter Schon, Joachim Bertz, and Bernd Gorsch
Dachdokumentation Krebs, Abt. Epidemiologie undGesundheitsberichterstattung, Robert Koch-Institut, Seestrae 10, D-13353 Berlin
Abstract. Das 1995 in Deutschland in Kraft getretene Bundeskrebsregistergesetzverpflichtete alle Bundeslander, epidemiologische Krebsregister einzurichten. Damitein bevolkerungsbezogenes Krebsregister aussagekraftige Krebsinzidenzen liefernkann, muss es einen ausreichend hohen Erfassungsgrad aufweisen. Insbesondere furdie sich im Aufbau befindlichen Krebsregister ist es daher wichtig, Vollzahligkeitsab-schatzungen durchzufuhren.
Neben direkten Methoden zur Vollzahligkeitsschatzung besteht die Moglichkeit,den erreichten Erfassungsgrad eines Registers indirekt abzuschatzen, indem manInzidenzen fr das betreffende Einzugsgebiet auf der Basis der Daten eines an-deren Krebsregisters schatzt und mit den dort tatsachlich erhobenen Daten ver-gleicht. In der hier vorgestellten Untersuchung werden an die Quotienten von Inzi-denz und Mortalitat eines Referenzregisters log-lineare Modelle angepasst, die sichschon in einer franzosischen Studie (Colonna et al., 1999) bewahrt haben und auchzur Schatzung bundesweiter Inzidenzen in Deutschland erfolgreich eingesetzt wur-den (Haberland et al., 2001). Die geschatzten Modelle werden dann unter Ein-beziehung der Mortalitat der zu untersuchenden Region zur Schatzung der Inzi-denz der betreffenden Region verwendet. Fur ein Geschlecht und eine Krebslokali-sation werden polynomiale Trends an die logarithmierten Quotienten aus Inzi-denz und Mortalitat fur alle Altersklassen angepasst. Die Datenbasis beruht imWesentlichen auf saarlandischen Krebsregisterdaten, die als lange Zeitreihe vor-liegen und, belegt durch zahlreiche Studien, hinsichtlich der Vollzahligkeit undQualitat internationalen Standards genugen.
Die ”Arbeitsgemeinschaft Bevolkerungsbezogener Krebsregister in Deutschland”hat sich auf dieses Verfahren zur Vollzahligkeitsabschatzung geeinigt und gegenwar-tig werden entsprechende Analysen fur die epidemiologischen Krebsregister Deutsch-lands durchgefuhrt, so dass die neuesten Ergebnisse auf der Tagung prasentiertwerden konnen.
Keywords
VOLLZAHLIGKEITSSCHATZUNGEN, EPIDEMOLOGISCHE KREBSREG-ISTER, LOG-LINEARE MODELLE
86
Generating Synthetic Transaction Data forTuning Usage Mining Algorithms
Michael Hahsler
Institut fur Informationsverarbeitung und -wirtschaft,Wirtschaftsuniversitat Wien, Augasse 2–6, A-1090 Wien, Austria
Abstract. The Internet was rapidly adopted as a channel for advertising and sell-ing products. Especially the Internet is useful for selling information based goods(documents, software, music, ...) which can be delivered instantly via the net. Com-petition is fierce and the sellers have to provide additional services to keep theircustomers and attract new customers. A common approach is to improve the userinterface by adding recommender services as known from the book recommenderused by the successful Internet retailer Amazon.com. Market basket analysis andassociation rule algorithms for transaction data are frequently used to generate rec-ommendations. However, tuning the performance and testing different parametersof algorithms is crucial for the success of such approaches. Unfortunately, the greatamount of high-quality historical data needed is often not available. To generatesynthetic data, that has similar characteristics like the real world data, is often theonly solution to this problem.
In this talk we analyze the Quest synthetic data generation code for associations(see: http://www.almaden.ibm.com/cs/quest). The transaction data generated bythis program is used in several papers to evaluate performance increases of associ-ation rule algorithms. However, the characteristics of the generated data seem tobe not in line with real world data, especially data concerning the Web and infor-mation goods. As an alternative, we present the first version of a generator basedon Ehrenberg’s repeat buying theory to generate synthetic transaction data. Therepeat buying theory has a solid empirical basis and models the micro-structure ofthe purchase processes. We conclude with a comparison of data generated by thetwo generators with real world data. We belief, that for an objective evaluationand the tuning of algorithms always real data as well as a combination of differentsynthetic data sets from generators using different models should be used.
References
EHRENBERG, A.S.C. (1988): Repeat-Buying: Facts, Theory and Application.Charles Griffin & Company Ltd., London.
ZHENG, Z., KOHAVI, R., and MASON, L. (2001): Real world performance ofassociation rule algorithms. In: F. Provost and R. Srikant (Eds.): Proceedingsof the 7th International Conference on Knowledge Discovery and Data Mining(ACM-SIGKDD). ACM Press, New York, 401–406.
Keywords
SYNTHETIC DATA GENERATION, INFORMATION GOODS, USAGEDATA MINING
87

Die Klassifikation der lokalen Arbeitsmarktein der Schlesischen Wojewodschaft nach der
Arbeitslosigkeitsstruktur
Witold Hantke
Hochschule des Managements, Sozial- und Verwaltungswissenschaften, Tychy,Poland
Abstract. Im Jahre 1997 wurde die Senkungstendenz der Arbeitslosigkeitsrate(die damals ungefahr 10% betrug) abgewandt. Die in den Jahren 1998-2000 ein-gefuhrten Reformen verursachten die schnelle Erhohung der Zahl der Leute, dieohne den Arbeitsplatz geblieben sind. Im Ergebnis daraus naherte sich die Arbeit-slosigkeitsrate zum Niveau 20% gefahrlich und die Arbeitslosigkeit wurde wiederdas wichtige Sozialproblem.Außerdem, auf dem Oberschlesiengebiet ubte die Beschleunigung der Schwerindus-triereform (besonders der Bergbaureform) großes Einfluß auf die Steigerung der Ar-beitslosigkeit aus. Ihre negativen Ergebnisse wurden durch verschiedene Sozialleis-tungen zum Teil neutralisiert, aber der Zulauf der arbeitslosen Bergmanner, Hut-tenwerker und anderen Schwerindustriearbeiter wurde nur verspatet.In vielen Publikationen diskutiert man nur uber das Problem der Arbeitslosigkeits-große. Aber der zweite, auch sehr wichtige Faktor, der die Lage einer Person aufdem Arbeitsmarkt beeinflußt, ist die Struktur der Arbeitslosigkeit. Und gerade dieArbeitslosigkeitsstruktur wird in diesem Referat zum Hauptthema der Forschun-gen und wird uber die Klassifikation der lokalen Arbeitsmarkten (der Kreisen derWojewodschaft 1) entscheiden.Die Veranderlichen, die die Arbeitslosigkeitsstruktur beschreiben, werden die prozen-tuale Anteile der Arbeitslosen in besonderen Berufsgruppen. Man hat die Beruf-sklassifikation angenommen, die durch das Schlesische Wojewodschaftliche Arbeit-samt angewandt wird.Im ersten Teil der Bearbeitung werden die lokale Arbeitsmarkte durch solche Meth-oden wie Cluster- und Diskriminanzanalyse klassifiziert. Das bedeutet, daß die ho-mogenen der Struktur nach Markteansammlungen abgesondert werden. Dann, beiBenutz der Mehrdimensional Skalierung werden die Verbindungen zwischen beson-deren Berufsgruppen geforscht.Die Aussichte des schlesischen Arbeitsmarktes sind fur die nachsten Jahre nichtoptimistisch. Man soll erwarten, da die Schwerindustriereform weiter durchgefuhrtwird und das bedeutet, da viele verlustbringende Werke liquidiert werden. Außer-dem, die Erhohung des Jugendlichenausbildungsniveau verursacht, daß die Ausbil-dung an den Hochschulen wird zur Vorbedingung um die befriedigende Arbeitsstellezu bekommen. Das alles ist der Anlaß, dass in nachster Zukunft der Eintritt aufden schlesischen Arbeitsmarkt immer schwieriger wird.
881 Die Wojewodschaft in Polen entspricht dem Bundesland in Deutschland. Polenbesteht aus 15 Wojewodschaften.

Challenges for Measuring, Assessing and UsingData for Individual ”Smart Fashion”
Doerte Hartmann
Chair of Marketing and Innovation Management, BTU Cottbus, D-03046Cottbus, Germany
Abstract. The most important characteristic for smart products lies in the newfunctions that are added to traditional products. To gain the most use out of thesefunctions they should meet individual needs. That’s why personalization plays a cru-cial role for smart products, especially for smart fashion. Individual smart fashionthough connects the challenges from mass customization as well as from intelligenttechnology integration with measuring issues difficult to put into numbers. Theseare:
• Gaining, extracting and using individual body measurements• Measuring, assessing and classifying customer preferences• Measuring and using network effects, especially in terms of knots and numbers
of interlinks the customer has to deal with during consumption process
The conference contribution is referring to these information problems and showingup solutions how to cope with them.
Body measurements are needed to create an individual, perfect fitting garment,but also have some functional aspects, like in the case of ”weight-watching” clothes.These technologies are complex and difficult to handle, but very important.Measuring customer preferences is an issue for all marketing sciences. However inmass customization for smart products it is prerequisite for the success, as customerpreferences have to be modularized and integrated into each single product.Finally, measuring network effects traditionally is an economic and marketing tool.In the case of smart products however it gains a new role already in the develop-ment of product, content and service. The more interfaces a new product integratesthe more complex the decision process for the consumer becomes. By internalisingnetwork externalities the marketing of the product can be supported.
The contribution gives an overview about some new information problems forsmart fashions and also a prospective of product development and marketing issuesof the future.
89
Evonetics - a New Scientific Approach toEvolutionary Design and Networking
Wolf-D. Hartmann
Guest chair of Evonetics at BTU Cottbus, Klaus Steilmann Institut furInnovation und Umwelt, Bochum/Cottbus
Abstract. The word evolution is quite fashionable at present, being used to presenta variety of different ideas, e.g. ”evolutionary cars, evolutionary politics” or ”evo-lutionary theories”. In relation to trends like biomorph design, neuronal networks,evolutionary electronics it becomes a key solution nowadays and for the near future.Often in popular belief, evolution means better, improvement, adapt or manipulate.But that describe only aspects. With the use of evolutionary algorithm and evolu-tionary computation transitions between genes to bits and reverse will be possible.Evolution has been used to improve or generate new designs for several years. Theuse of evolution for electronic circuit design has become so popular that it has nowdeveloped into a research field with its own name: evolvable hardware. Evolutiongenerates novel and very efficient new circuit-designs that we may learn from.When we use evolution to help create other forms of digital biology, we increase thecapabilities of computers too. Even fashion affects technology trends more than inrelation to simple every day life questions. Fashion has to be reflected in a senseof scientific influence too. The combination between fashion and technology, bio-and techno-cultural evolution need a new starting point. Never before biology andcomputers have become so closely entwined.These will form the next generation of our technology, enabling remarkable newadvances in all fields. By understanding the solutions of nature and using them tosolve daily life problems, e.g. a whole new class of computation, a whole new way ofusing computers but also a new understanding of human characteristics will haveto be found. In near future digital biology will allow the mankind to survive in themodern world. Evolution is now enabling us to transform our technology and evenus.In the speech there will be given some practical examples for the strong connec-tion between first and second skin, biological and computational evolution throughintelligent new products. Research results in the field of protection against the in-creasing influences of environmental radiation, e.g. of electromagnetic in general,show the increasing networking between natural and virtual world. The new projectwellness-fashion will initiate research and development for textiles and clothes withinvisible improvements for body and soul. Creating by doing could help to step for-ward via digital evolution with the use of interactions, feedback and perturbationsto produce its own results.
90
Breakdown Points for ML-Estimators inMixture Models
Christian Hennig1
Seminar fur Statistik,ETH-Zentrum, CH-8092 Zurich, Switzerland
Abstract. ML-estimation based on mixtures of Normal distributions is a widelyused tool for cluster analysis. However, a single outlier can break down the pa-rameter estimation of at least one of the mixture components. Among others, theestimation of mixtures of t-distributions (McLachlan and Peel, 2000) and the ad-dition of a further mixture component accounting for ”noise” (Fraley and Raftery1998) were suggested as more robust alternatives. In this talk, a breakdown point(i.e., the minimum number of observations that can spoil the estimator completely)is defined and bounds on the breakdown points of the mentioned methods are given.It turns out that the two alternatives, while adding stability in the presence of out-liers of moderate size, do not possess a substantially better breakdown behaviorthan estimation based on Normal mixtures. If the number of clusters s is treatedas fixed, r additional points suffice for all three methods to let the parameters of rclusters explode, unless r = s, where this is not possible for t-mixtures. The abilityto estimate the number of mixture components, e.g., by use of the Bayesian Infor-mation Criterion, and to isolate gross outliers as clusters of one point, is crucial fora better breakdown behavior of all three techniques. A mixture of Normals withan improper uniform distribution is proposed in order to attain more robustness inthe case of a fixed number of components.
References
FRALEY, C. and RAFTERY, A. E. (1998): How many clusters? Which clusteringmethod? Answers via model based cluster analysis. Computer Journal, 41,578–588.
MCLACHLAN, G. and PEEL, D. (2000): Finite Mixture Models. Wiley, New York.
Keywords
MODEL-BASED CLUSTER ANALYSIS, MIXTURES OF t-DISTRIBUTIONS,NORMAL MIXTURES, NOISE COMPONENT, ROBUST STATISTICS
91
Wettbewerbsanalyse mittels rangkodierterDaten
Antonia Hermelbracht und Reinhold Decker
Lehrstuhl fur BWL und MarketingUniversitat Bielefeld, D-33613 Bielefeld, Germany
Abstract. Im Rahmen dieses Vortrags wird ein auf rangkodierte Daten (vgl. Tutz(2000)) zugeschnittenes Modell zur Bewertung der zwischen verschiedenen Vertre-tern einer Produktgruppe bestehenden Konkurrenzbeziehungen vorgestellt. Ziel derModellierung ist die Ruckfuhrung des Erfolgs der einzelnen Produkte auf die Wahr-nehmung unterschiedlicher, als relevant erachteter Produktaspekte. Um dies zu er-reichen, muss zunachst eine individuelle Beurteilung der Produkte bezuglich dereinzelnen Aspekte vorgenommen werden. Das Modell zur Auswertung der aus denresultierenden Rangordnungen generierten Daten basiert von seinem methodischenAnsatz her auf dem Konzept der ordinalen Regression (vgl. Hilbert (1996)). Diemodellgestutzte Auswertung der Rangurteile bildet sodann die Grundlage fur dieErklarung des Zustandekommens von Marktanteilen. Anhand eines entsprechendenDatenbeispiels wird die grundsatzliche Funktionsweise des Modells demonstriert.
References
HILBERT, A. (1996): Regressionsansatze zur Analyse ordinaler Daten. Arbeitspa-pier Nr. 143/1996, Institut fur Statistik und Mathematische Wirtschaftstheo-rie, Universitat Augsburg.
TUTZ, G. (2000): Die Analyse kategorialer Daten. Oldenbourg, Munchen.
Keywords
ORDINALE REGRESSION, RANGKODIERTE DATEN,WETTBEWERBS-ANALYSE
92
An Information Theoretic Measure forValidating Clustering Results
Ralf Herwig1, Hans Lehrach1, and Christine Muller2
1 Department of vertebrate genomics,Max-Planck Institute for Molecular Genetics, D-14195 Berlin, Germany
2 Department 6 Mathematics,Carl von Ossietzky Universitat Oldenburg, D-26111 Oldenburg, Germany
Abstract. Cluster validation is a main concern of practical data analysis. Com-paring partitions involves the validation according to a measure on the respectivebinary partition matrices (Hubert and Arabie 1985, Jain and Dubes 1988). Here,we present the relative mutual information coefficient (rmi) - a new clustering vali-dation measure, i.e. a measure that allows judging the quality of a calculated clus-tering given a known true clustering. In contrast to standard measures that have ageometric interpretation, the rmi is based on the information theoretic concept ofmutual information (Cover and Thomas 1991). We highlight some useful proper-ties of this measure. Furthermore, a new criterion is defined that allows comparingdifferent validation measures according to their sensitivity in detecting error in thecalculated clustering with respect to the true clustering. We show that widely usedmeasures show a bad sensitivity in the sense that even if clustering error is high(40-50%) the values achieved by these indices still indicate that the clustering isgood. We show that the rmi is more sensitive than standard measures. Furthermore,we define a null hypothesis in order to derive corrections for chance for the variousindices. It turns out that rmi is asymptotically unbiased under this null hypothesis.We apply the discussed indices to the validation of clustering data occurring in thecontext of genetic fingerprinting experiments (Herwig et al. 1999).
References
COVER, T.M. and THOMAS, J.A. (1991): Elements of Information Theory. J.Wiley and Sons, New York.
HERWIG, R., POUSTKA, A., MULLER, C., BULL, C., LEHRACH, H., andO’BRIEN, J. (1999): Large-scale clustering of cDNA fingerprinting data.Genome Research 9: 1093-1105.
HUBERT, L. and ARABIE, A. (1985): Comparing partitions. Journal of Classifi-cation, 2, 193–218.
JAIN, A.K. and DUBES, R.C. (1988): Algorithms for Clustering Data. Prentice-Hall, Englewood Cliffs.
Keywords
CLUSTER VALIDATION, MUTUAL INFORMATION, SENSITIVITY ANAL-YSIS, GENETIC FINGERPRINTING
93
Ein alternativer PRE-Pruning-Ansatzfur Entscheidungsbaume
Andreas Hilbert and Alexander Spatz
Institut fur Statistik und Mathematische Wirtschaftstheorie,Universitat Augsburg, D-86159 Augsburg, Germany
Abstract. Ein wesentliches Problem bei der Induktion von Entscheidungsbaumenist das sog. Pruning, durch das das Over-Fitting eines Entscheidungsbaumes ver-hindert werden soll. Dabei stehen sowohl PRE-Pruning- als auch POST-Pruning-Techniken zur Verfugung. Das PRE-Pruning verhindert bereits beim Aufbau desBaumes eine weitere Aufsplittung, wahrend das POST-Pruning einen komplett in-duzierten Baum nachtraglich zuruckschneidet. Die bekanntesten POST-Pruning-Verfahren sind das Error-Complexity-Pruning von Breiman et al. (1984), das Pessi-mistic-Error-Pruning von Quinlan (1986) und schließlich das Error-Based-Pruningvon Quinlan (1993).
Die gangigen PRE-Pruning-Techniken kontrollieren bei jedem Split eines Kno-tens, ob die daraus resultierenden Subknoten bzgl. verschiedener Kriterien, wiez.B. der Objektanzahl in einem Knoten oder der Verbesserung der Reinheit einesKnotens, a-priori vorgegebene Werte erfullen. Die daraus resultierenden Entschei-dungsbaume sind damit stark von diesen subjektiven Schwellenwerten abhangig.
Die vorliegende Arbeit stellt nun eine PRE-Pruning-Technik vor, die auf dieVorgabe solcher subjektiven Schwellenwerte verzichten kann. Sie basiert auf der Um-setzung von Erkenntnissen, die unmittelbar aus den – den Entscheidungsbaumenzugeordneten – Gains-Charts abgeleitet werden konnen. Daruber hinaus bietetdiese Technik auch noch die Moglichkeit, die Ergebnisse der Trainingsdaten an-hand einer Testdatenmenge zu uberprufen; eine Vorgehensweise, die die bekanntenPRE-Pruning-Techniken im Allgemeinen nicht erlauben.
References
BREIMAN, L.; FRIEDMAN, J.H.; Olshen, R.A., and STONE, C.J. (1984):Classification and Regression Tree. Statistics/Probability Series. Wadsworth,Belmont.
QUINLAN, J.R. (1986): Induction of Decision Trees. Machine Learning, 1, 81–106.
QUINLAN, J.R. (1993): C4.5 Programs for Machine Learning. Morgan Kaufmann,San Mateo, California.
Keywords
DECISION TREE, PRE-PRUNING, POST-PRUNING, GAINS-CHART94
Finding Clusters in Projections ofHigh-Dimensional Data
Alexander Hinneburg
Institut fur Informatik, von Seckendorff-Platz 1Martin-Luther-University of Halle-Wittenberg06099 Halle/Saale, Germany
Abstract. Projected clustering received attention in the data mining researchcommunity during the last years [1,3]. In the first part recent algorithms prosedin the literature will be presented, which find different types of projected clustersin high-dimensional numerical data. One of the main problems is how to find theprojections where clusters are defined. One approach is to construct the projectionsbottom up starting from one-dimensional projections and combine interesting onesto projections with higher dimensionality. The other type of algorithms iterativelyapplies dimensionality reduction to certain subsets of data points. In both casesthe description of the clusters are convex geometrical objects, like hyper-boxes orcylinders.
In the second part a new algorithm is presented, which uses a frequent set miningalgorithm like apriori [2] to find useful combination of low dimensional projections.In the algorithms second step similar results are merged to form a projected cluster.These geometric objects have in general a concave shape, which – as we show – isbetter suited to describe projected clusters. In the reminder some applications forprojected clustering are presented.
References
1. Charu C. Aggarwal and Philip S. Yu. Finding generalized projected clusters inhigh dimensional spaces. In Proceedings of the 2000 ACM SIGMOD Interna-tional Conference on Management of Data, May 16-18, 2000, Dallas, Texas,USA, pages 7081. ACM, 2000.
2. Rakesh Agrawal and Ramakrishnan Srikant. Fast algorithms for mining associ-ation rules in large databases. In VLDB94, Proceedings of 20th InternationalConference on Very Large Data Bases, 1994, Santiago de Chile, Chile, pages487499. Morgan Kaufmann, 1994.
3. Cecilia M. Procopiuc, Michael Jones, Pankaj K. Agarwal, and T. M. Murali.A monte carlo algorithm for fast projective clustering. In Proceedings of theACM SIGMOD international conference on Management of data, pages 418427. ACM Press, 2002.
Keywords
CLUSTERING, HIGH-DIMENSIONAL DATA, PROJECTED CLUSTER-ING
95
Hydro-Europe: Web based CollaborativeLearning and Water-Engineering
K. P. Holz, G. Hildebrand, F. Merting, and K. Schonefeldt
Institute for Bauinformatik, BTU Cottbus, Germany
Abstract. The paper will report about Hydro-Europe, an Intensive DistributedTeaching/Learning Programme within the Socrates/Erasmus framework. The ac-tivity is run in the sense of the Bologna declaration aiming at gradual harmonizationof curricula ”just by doing”. In its present version it addresses students matricu-lated at five universities across Europe (Brussels, Cottbus, Delft, Lausanne, Nice)involved in different master degrees specialized on water management and numericalsimulations in the environment water.
The key element of the course is the ”active collaboration” of all partners ac-cording to the ”any place - any time” paradigm. Besides course material exchangeand local teaching activities, project work is in the centre of the activities. Like inconsultant business groups are formed which act like small companies on a project.The groups consist of students mixed from all different places communicating andinteracting on the Web and competing in solutions against each other. It is be-lieved that in this manner future engineering environment in water consultancy isbeing mapped: collaboration of small expertise units and freelancers distributed allover the world. This new dimension of working without perhaps even knowing eachother before demands for new skills and a new ’technological culture’ which will beacquired ’just by doing”.
Collaboration processes within the Internet may be supported by freeware In-ternet tools such as Web browsers, Email-, or FTP-clients etc. as well tools likeNetMeeting and instant messengers for communication and conferencing. Such en-vironment, however, is too restricted as soon as numerical simulation and collabora-tive reporting gets involved. Data-files have to be transmitted, access to numericalprocessors have to be provided residing somewhere worldwide and technical draw-ings have to be generated and transferred. Moreover, for evaluation of simulationresults pictures and videos from the sites have to be exchanged and satellite in-formation processed. Finally reports have to be written and findings presented tothe public. All these services have been integrated into ONE working platform tosupport project work.
The working platform has been designed in a manner to integrate electronicdocuments, simulation tools and communication processes into just one Web basedenvironment. Main idea of the design was the feature of document and numericalengine ”sharing”. Insofar the platforms is quite different from standard tools. Thepaper will present the philosophy of the Web based collaboration platform and givetechnical details.
Keywords
VIRTUAL UNIVERSITY, CSCL, CSCW, WEB BASED COLLABORA-TIVE ENGINEERING
96
Applicability of Customer Churn Forecasts ina Non-Contractual Setting
Jorg Hopmann and Anke Thede
Institut fur Informationswirtschaft und -Management,Universitat Karlsruhe (TH), D-76128 Karlsruhe, Germany
Abstract. “Selling a product to a new customer is six times as expensive as sellingit to an existing customer”1 is a well known factoid in marketing and customer re-lationship management that recommends customer oriented enterprises to focus onretaining and selling more products to existing customers rather than concentratingall marketing actions on the strive for new customers.
For retaining customers it is very important to be able to predict when a cus-tomer is likely to churn. In this case marketing actions can be taken to keep thecustomer with the company. Several methods exist that can be used to predictcustomer churn. In this paper we give an overview over several possible methodsand apply the most promising ones to real-life B2B purchase histories to evaluatethe quality of churn prediction of each of the methods. We show up to which de-gree churn prediction seems to yield usable and reliable results in a non-contractualenvironment.
Keywords
CUSTOMER RELATIONSHIP MANAGEMENT, CUSTOMER CHURN,CUSTOMER ATTRITION, MARKETING, NBD, LOGISTIC REGRES-SION, SURVIVAL ANALYSIS, NEURAL NETWORK
97
1 Dyche, Jill. The CRM Handbook. Addison Wesley Publishing Company (2002)
A Modified Gravity-based MultidimensionalUnfolding Model for Preference Data
Tadashi Imaizumi
School of Management and Information Sciences, Tama University,4-4-1 Hijirigaoka, Tama city, Tokyo, 206-0022 Japan
Abstract. Many Multidimensional Unfolding(MDU) models and methods havebeen used for analyzing marketing data on the brand positioning. In these models,the observed preference values are related to the distances between object pointand the ideal point only. The market share of each brand are ignored or assumedto be be same for all brands. DeSarbo, Kim, Choi and Spaulding(2002) discussedon the gravity model in the marketing areas and proposed a gravity based MDU,
Rij =Monoi(Mαi S
λj /d
2ij)
where Monoi(·) is monotonically non-increaseing function, Rij is observed prefer-ence data for object j by individual i, dij is the euclidean distance between idealpoint yi and object point xj in K-dimensional space, Mα
i is consumer mass of in-dividual i,Sj is brand mass of object j. In this model, the preference value Rij israpidly increased as the object point xj approaches to the ideal point yi. However,some analysis of the real data set such as that of Rushton(1969)’s study indicatethe preference value tends to vary milder with distance dij .
An modified gravity based MDU is presented in which we assume that thepreference value will relate to the term 1/(1 + d2
ij) instead of 1/d2ij .
Rij =Monoi(Mαi S
λj /(1 + d2
ij))
An associated nonmetric MDU algorithm and an application to an real data set arepresented.
References
DeSarbo, W. S., Kim, J., Choi, S. C. & Spaulding , M.(2002): A Gravity-BasedMultidimensional Scaling Model for Deriving Spatial Structures UnderlyingConsumer Preference Judgements. journal of consumer research, 29,91–100.
Rushton, G. (1969): The Scaling of Locational Preferences. Cox, K. R. and Gooedge,R. G. eds : Behavioral Problems in Geography: A Symposium. Studies in Ge-ography, 17, 192–227, Department of Geography, NorthWestern University..
Keywords
GRAVITY MODEL, MULTIDIMENSIONAL UNFOLDING MODEL98
Correlation Between Some Disease Featuresand Prognosis in the Adult Non-Hodgkin‘s
Lymphoma Patients
Edyta JabÃlonska
Jagiellonian University, Collegium Medicum, Oncology Clinic, Krakow
Abstract. Purpose: Over the past 30 years the incidence of the Non-Hodgkin‘slymphoma (NHL) in Europe and in the United States has increased dramatically.The Polish NHL patients have yet significantly poorer survival as compared withthe NHL patients in the E.U. countries. The aim of this study was to define prog-nostic factors determining the prognosis of NHL patients. This could help to selecta group of patients who require more intensive treatment.Patients and Methods: I reviewed and reclassified 174 cases of NHL patients treatedin the Oncology Clinic of the Jagiellonian University in Krakow in 1971-1999. I es-timated some social-economic features of the patients as well as the diagnostic andclinical features of the disease.Results: Univariate analysis showed that there were two groups of factors influenc-ing survival: lack of the abdominal computer tomography examination and certainclinical features of the disease. Therefore I decided to search for prognostic factorsamong the patients who were properly diagnosed, e.g. who underwent the abdom-inal computer tomography examination. Multivariate analysis (Cox model) in thegroup of patients with indolent NHL showed that there were two factors decreasingthe overall survival (OS): diffused localisation of the disease and the elevated level ofLDH. For disease-free survival (DFS) there was one independent prognostic factor,e.g. the value of International Prognostic Index (IPI). In patients with aggressiveNHL the value of IPI significantly influenced the OS and the DFS. In this group Idiscovered also that anemia decreases the OS. In patients with high-aggressive NHLthe independent prognostic for the OS was clinical stage IV and for the DFS theelevated level of LDH. Retrospective analysis revealed that the achievement of theCR substantially improves the OS. Common features that make difficult to achievethe CR in all lymphoma group were: bulky disease with the tumour size over 10cm, low performance status (>1 according the WHO) and anemia.Conclusion: In summary, my analysis indicates that the improvement of the out-come among the Polish NHL patients is associated with the improvement of thediagnosis. In addition, the high-risk NHL patients according the IPI risk groupshould be considered as candidates for more intensive treatment. In the high-riskgroup of indolent NHL patients, chemotherapy combined with immunotherapy isrecommended. In the high-risk group of aggressive NHL patients earlier qualifica-tion for myeloablative chemotherapy with subsequent PBSCT should be suggested.
99

Tail Dependence in Multivariate Data- Review of Problems
Krzysztof Jajuga
Department of Financial Investments and Insurance,Wroclaw University of Economics,ul. Komandorska 118/120 53-345 WrocÃlaw, Poland
Abstract. Tail dependence is understood as a dependence in the tails of the dis-tribution. It has become very important practical issue, particularly in such areasas finance and insurance. The paper contains the review of the most importantproblems related to tail dependence. The following problems are discussed:
• the explanation of the tail dependence (including the extension to multivariatecase);
• tail dependence in time series;• the approaches to determine tail dependence;• the review of tail dependence coefficients;• some applications.
100
Copula Analysis for Bivariate Distributions– Some Empirical Studies in Finance
Krzysztof Jajuga and Katarzyna Kuziak
Department of Financial Investments and Insurance,Wroclaw University of Economics,ul. Komandorska 118/120 53-345 WrocÃlaw, Poland
Abstract. Copula analysis as a tool to analyze multivariate data has gained re-cently some attention of researchers and practitioners, the latter working in thearea of finance and insurance. The paper presents some empirical studies of thecopula analysis, namely the fitting of copula to bivariate data and calculation oftail dependence coefficients. In the studies two types of data are used: data fromPolish financial market and data simulated from different distributions.
References
EMBRECHTS, P., LINDSKOG, F. and MCNEIL, A. (2001): Modeling dependencewith copulas and applications to risk management. Report, ETHZ Zurich.
Keywords
COPULA, MULTIVARIATE DATA
101
Klassifikation und Reprasentation vonLieferanten mit der
Hauptkomponentenmethode
Christian G. Janker
Lehrstuhl fur Betriebswirtschaftslehre, insbesondere LogistikTechnische Universitat Dresden, D-01062 Dresden, Germany
Abstract. Die Lieferantenbewertung als kritische Komponente fur ein erfolgre-iches SCM ist in den letzten Jahren verstarkt ins Zentrum des Interesses geruckt.Verantwortlich dafur sind die Zunahme der Just-in-Time Produktion, umfangreicheInvestitionen in Produktions- und Informationstechnologien sowie die vermehrteBildung von strategischen Wertschopfungspartnerschaften.Eine auf die Lieferantenbewertung fokussierte, internationale empirische Unter-suchung des Lieferantenmanagements von 193 Industrieunternehmen zeigt, dassdie neuen Anforderungen an den Lieferanten auch neue Verfahren der Lieferanten-bewertung bedingen.Ein auf der Hauptkomponentenmethode basierendes Modell der Lieferantenbewer-tung zeigt, wie die Bewertung und Auswahl des bzw. der optimalen Lieferantenerfolgen kann und welche weiteren Aufgaben des Lieferantenmanagements durchKlassifikation und Reprasentation der Lieferanten unterstutzt werden konnen. EinFallbeispiel aus der Praxis illustriert das Verfahren.
References
HARTING, D. (1994): Lieferanten-Wertanalyse. Schaffer-Poeschel, Stuttgart.LASCH, R., JANKER, C. G. und FRIEDRICH, C. (2001): Identifikation, Be-
wertung und Auswahl von Lieferanten - Empirische Bestandsaufnahme beideutschen Industrieunternehmen. Dresdner Beitrage zur Betriebswirtschaft-slehre, Nr. 56/01.
Keywords
LOGISTIK, BESCHAFFUNG, LIEFERANTENBEWERTUNG, HAUPTKOM-PONENTENANALYSE
102

Wie konnen Daten aus deutschenKrebsregistern fur Forschungsprojekte genutzt
werden?
Alexander Katalinic
Institut fur Krebsepidemiologie, Universitat Lubeck, Beckergrube 43-47, 23552Lubeck, Email: [email protected]
Abstract. Die deutschen Krebsregister haben die gesetzliche Aufgabe, das Auftretenund die Trendentwicklung aller Formen von Krebserkrankungen zu beobachtenund insbesondere statistisch-epidemiologisch aus- zuwerten. Zusatzlich sollen sievornehmlich anonymisierte, aber auch personenbezogene Daten fur die Grundlagender Gesundheitsplanung sowie der epidemiologischen Forschung einschließlich derUrsachenforschung bereitstellen. In der Vergangenheit wurde bei Forschungsprojek-ten eher selten auf Krebsregister zuruckgegriffen. Dies begrundete sich in der fehlen-den Flachendeckung und der teilweise unzureichenden Vollzahligkeit der Krebsreg-istrierung. Inzwischen wurden in allen Bundeslandern Krebsregister eingerichtet, diebis auf wenige Ausnahmen flachendeckend Krebserkrankungen registrieren, sodassin der Zukunft fur Deutschland von einer aussagekraftigen Krebserfassung auszuge-hen ist. Wie konnen aber die Daten der Krebsregister praktisch fur Forschungspro-jekte genutzt werden? Wo liegen die Vorteile, wo die Nachteile?
Auf Basis der verschiedenen Landeskrebsregistergesetze wurde untersucht, welcheMoglichkeiten zur Verwendung der Krebsregisterdaten bestehen. Am Beispiel vonForschungsaktivitaten des Krebsregisters Schleswig-Holstein (SH) werden Anwen-dungen mit Krebsregisterdaten aufgezeigt.
Ergebnis: konnten drei Zugange zur Nutzung der Krebsregisterdaten unter-schieden werden:
1. Anonymisierte Daten: Diese durfen entweder auf Personenebene oder in ag-gregierter Form bereitgestellt werden.
2. Personenbezogene Daten konnen unter bestimmten Voraussetzungen (Studien-antrag, Ethikkommission etc.) wissenschaftlichen Forschungsgruppen zur Ver-fugung gestellt werden.
3. Kohortenabgleich: Fur Kohortenstudien, die als Zielgroße Tumorerkrankungbzw. -sterblichkeit haben, besteht prinzipiell die Moglichkeit des Abgleichs mitdem Krebsregister.
Keywords
KREBSREGISTER, KREBSREGISTRIERUNG, EPIDEMIOLOGIE
103
Overconfidence in the Continuous-TimePrincipal-Agent Problem
Karl Ludwig Keiber
WHU Otto Beisheim Graduate School of Management, Dresdner Bank Chair ofFinance, Burgplatz 2, D-56179 Vallendar, Germany, e-mail: [email protected]
Abstract. In this paper we analyze the impact of overconfidence on the continuous-time principal-agent problem when both the risk neutral principal and the riskaverse agent are assumed to be subject to this psychological bias. The first-bestand second-best sharing rules as well as the agency costs are derived when theoutcome process which is controlled privately by the agent is not observable di-rectly ba two parties to the contract but a common signal on the outcome processis available. Both the first-best contract and the first-best control are reported tobe independent of the parties’ overconfidence. In contrast the second-best contractand the second-best control, which is always less than the first-best control, as wellas agency costs depend on the degree of overconfidence. The comparative staticresults document that the second-best control decreases but the agency costs in-crease with the parties’ overconfidence. The various components of the second-bestsharing rule exhibit mixed comparative static results with respect to the degree ofoverconfidence.
104
Preconditions for an User-friendly InternetPortal on Education: Conclusions from an
Qualitative Study of Typical Search Strategies
Michael Kluck1 and Susanne Politt2
1 Humboldt-Universitat zu Berlin, Abteilung Padagogik und Informatik /Informationszentrum Sozialwissenschaften (IZ), Bonn
2 Fachhochschule fur Technik und Wirtschaft Berlin
Abstract. Deploying the rich data of the German Education Server (DeutscherBildungsserver) from the time period October 2001 till April 2002 this study showssome consequences for the design of a user-friendly interface for an education webportal. It is the task of domain-specific portals to facilitate the access to the desiredinformation for ”normal users”. Until now the empirical studies on the real searchbehaviour of Internet users refer essentially to general search engines. The aimof the study on hand is, to analyse the search behaviour and extract and groupthe typical search queries of ”normal users” of education portals in a qualitativeway. This is based on the log files of the German Education Server. These fileshave on the one hand been transformed and analysed for typical search queries,on the other hand individual search strategies were extracted, grouped in classesand qualitatively analysed. These results are compared with the results of otherempirical examinations on user behaviour and especially search behaviour. Thearticle closes with some conclusions for the further development of education portalswhich are derived as well from the empirical results as from general considerationson the design of search interfaces.
References
DICKSTEIN, R. and MILLS, V. (2000): Usability Testing at the University of Ari-zona Library: How to Let the Users in on the Design. Information Technologyand Libraries, Sept. 2000, 144-151
FIDEL, R., DAVIES, R.K., DOUGLASS, M.H., HOLDER, J.K., HOPKINS, C.J.,KUSHNER, E.J., MIYAGISHIMA, B.K. and TONEY, C.D. (1999): A Visitto the Information Mall: Web Searching Behavior of High School Students.Journal of the American Society for Information Science, 50 (1) 24-37
HOLSCHER, C. and STRUBE, G. (2000): Web search Behavior of Internet Ex-
perts and Newbies. 9th International World Wide Web Conference, The Web:The Next Generation, Amsterdam, May 15-19 2000, Conference Proceedings,available at: http://www9.org/w9cdrom/81/81.html
Keywords
EDUCATION, INTERNET, PORTAL, USER-INTERFACE, SEARCH, BE-HAVIOUR, DESIGN
105
Typical Characteristics of E-LearningAdopters - A Multivariate Analysis
Philipp Kollinger1 and Christian Schade2
1 Deutsches Institut fur Wirtschaftsforschung (DIW Berlin), Konigin-Luise-Str. 5,14195 Berlin, Germany
2 Humboldt-Universitat zu Berlin, Institut fur Entrepreneurship /Innovationsmanagement, Ziegelstr. 13a, 10117 Berlin, Germany
Abstract. E-Learning is supposed to boost the efficiency of corporate training.Our analysis explores typical characteristics of firms that recently adopted e-learning,based on 10.000 firm interviews in 15 industry sectors throughout Europe in June2002. We find that firm size, industry sector and overall Internet-affinity have asignificant influence on the adoption of e-learning. The findings are put into per-spective to some very optimistic growth scenarios for the e-learning market thatwere propagated by market research firms lately.
References
BACKHAUS et. al. (2000): Multivariate Analysemethoden. Springer.E-BUSINESS MARKET WATCH (2002): http://www.ebusiness-watch.org.KOLLINGER, P. (2000): E-Learning - Eine Marktanalyse fur Deutschland. Sym-
posion Publishing.LITFIN, T. (2000): Adoptionsfaktoren - Empirische Analyse am Beispiel eines in-
novativen Telekommunikationsdienstes. DUV.
Keywords
E-LEARNING, ADOPTION, MULTIVARIATE ANALYSIS, MARKET RE-SEARCH
106
Applying Nearest Neighbour Based ClusteringAlgorithms on Metabolic Networks and Gene
Expression Data
Rainer Konig, Marco Weismuller and Roland Eils
Intelligent Bioinformatics Systems,Deutsches Krebsforschungszentrum, 69120 Heidelberg, Germany
Abstract. Microarray technology has evolved to a central technology in modernbiochemical laboratories within a few years time. It allows to profile gene expression(blueprint of an enzyme or protein) of a large subset or the whole cells’ genome.Besides this, biochemical research of the past 30 years has enabled to elucidate anow more and more complete image of the cells’ metabolic architecture. Especiallyfor smaller model organisms, such as Escherichia coli, the biochemical networkcould be rather clarified. We investigate the topology of such networks by super-paramagnetic spin clustering. This unsupervised learning technique, coming fromstatistical physics, essentially operates on nearest neighbour interactions and there-fore suits for discovering graph properties. Within our approach, experimental datafrom large scale gene expression profiling can be used to analyse changes in thetopology of the net under different treatments of the cell sample. This may discoverbreaks and degradations in the metabolism.
References
BLATT, M., WISEMAN, S. AND DOMANY, E. (1996): Super-paramagnetic clus-tering of data. Phys. Rev. Lett., 76, 3251-3255.
KARP, P.D., RILEY, M., PALEY, S.M. AND PELLEGRINI-TOOLE, A. (2002):The MetaCyc Database. Nucleic Acids Res., 30, 59-61.
WEISMULLER, M., KONIG, R. AND EILS, R. (2002): Modelling of informationflow in cells. Proceedings of the 16th European Simulation Multiconference,Darmstadt, Germany, 413-417.
Keywords
GENE EXPRESSION, CLUSTERING, METABOLIC NETWORKS
107
On the Modification of David-Hellwig’s Test
Grzegorz Konczak
Department of StatisticsThe Karol Adamiecki University of Economics in Katowice, Bogucicka 14, 40-226Katowice, Poland.
Abstract. This paper presents a proposal of a nonparametric test for determiningunknown distribution. The proposal is a modification of David-Hellwig’s ”free cells”test. The area of variability of attribute is divided into m cells. Then we take asample from a population. Following we calculate a number of elements for eachcell. In David-Hellwig’s test, we calculate statistics Kn = card{j:mj=0}, which
counts empty cells. In the proposed modification we calculate the value of statistic,which is based on count of cells, whose consider 0, 1,..., k (k is the parameter ofthis test) elements.It is very difficult to find the exactly critical values for this test. Thus, there weremade some computer simulations and there were presented the tables of estimatedcritical values.There were compared the results for David-Hellwig’s test and proposed modificationin the last part of this paper.
References
DAVID H.A. (1950): Two Combinational Tests Whether a Sample has ConformGiven Population. Biometrika, vol. 37.
DOMANSKI, Cz. and PRUSKA, K. (2000): Nieklasyczne metody statystyczne.PWE, Warszawa.
HELLWIG, Z. (1965): Test zgodnosci dla maÃlej proby. Przeglad Statystyczny, vol.12.
Keywords
NON-PARAMETRIC METHODS, TEST, COMPUTER SIMULATIONS
108
Individual Rationality Versus GroupRationality
in Statistical Modeling Issues
Daniel Kosiorowski
Department of Statistics,Cracow University of Economics, ul. Rakowicka 27, 51-510 Krakow, Poland
Abstract. In the paper an apparatus of stochastic matrix spaces and discreteMarkov‘s chains is presented so that it could cope with approximation of individualchoice mechanism similar to network of associations. The proposed apparatus makeit possible to investigate dynamical properties of aggregated choice of group whenexist interactions between individual choice mechanisms within the group. Themain point of paper is to investigate the dynamic aspects of aggregated choiceof group with interactions between individual choices in terms group rationalitycriteria. This investigation leads to analysis of stability aggregated group choiceand to analysis of stationary processes of group choice. In the paper a suggestionon possibility of intervention in process of group choice is presented. A way ofthe empirical verification and perspective of further researches and applications isproposed.
Keywords
MARKOVCHAIN, TRANSITIONMATRIX, STOCHASTICMATRIX, AL-GEBRAIC STRUCTURE, CONGRUENCE MODULO N, N-ARY OPERA-TIONS, TCHEBYSHEV‘S INEQUALITY, PROBABILISTIC ALGORITHM,COMPOSITION OF RANDOM VARIABLES
109
Measuring the Customer RelationshipManagement Construct and Linking it to
Performance Outcomes
Manfred Krafft1, Werner Reinartz2, and Wayne D. Hoyer3
1 Professor and Chair of Marketing, and Director of the Institute of Marketing atWestfalische Wilhelms-Universitat, [email protected]
2 Assistant Professor of Marketing at INSEAD, [email protected] James L. Bayless/William S. Farish Fund Chair for Free Enterprise andChairman, Department of Marketing, McCombs School of Business, Universityof Texas at Austin, [email protected]
Abstract. Understanding how to effectively manage relationships with customershas become a very important topic to both academicians and practitioners in recentyears. As a result, deploying strategic customer relationship management (CRM)initiatives has become very common. Yet, the existing academic literature andthe practical applications of CRM strategies do not provide a clear indication ofspecifically what constitutes CRM implementation. In this study, we attempt to(a) conceptualize a construct of CRM implementation, (b) operationalize and vali-date this construct, and (c) empirically investigate the organizational performanceconsequences of implementing CRM. Our research questions are addressed in twocross-sectional studies across four different industries and three countries. Our firstkey outcome is a theoretically sound CRM Implementation measure. Our secondkey result is the finding that CRM Implementation has a moderate positive impacton a firm’s market performance which in turn is associated with better economicperformance. The link between CRM Implementation and market-based perfor-mance is subject to moderating factors such as a company’s ability to create CRMcompatible incentivization schemes.
110
Simultaneous Selection of Predictorsand Smoothing Parameters
in Additive Models
Rudiger Krause and Gerhard Tutz
Institut fur Statistik,Ludwig-Maximilians Universitat Munchen, Akademiestr.1, D-80799 Munchen,Germany
Abstract. In classical linear regression with many predictors the problem of vari-able seletion has been extensively investigated. For additive models of the typey = f1(x1)+ . . .+fp(xp)+ε where fj , j = 1, . . . , p, have unspecified functional form(e.g. Hastie & Tibshirani & Friedman, 2001) the problem is strongly connected tothe choice of the amount of smoothing used for components fj . For many predictorsa grid search for smoothing parameters is impossible. We propose to consider theproblem of variable selection and choice of smoothing parameters together and usegenetic algorithms. Common genetic algorithms (e.g. Michalewicz, 1996; Mitchell,1996) have to be modified since inclusion of variables and smoothing have to becoded separately but are linked in the search for optimal solutions. The basic toolfor fitting the additive model is the expansion in B-splines (Marx & Eilers, 1998).This approach allows for direct estimates which is essential for the method to work.
References
HASTIE, T. and TIBSHIRANI, R. and FRIEDMAN, J. (2001): The Elements ofStatistical Learning. Springer, New York.
MARX, B.D. and EILERS, P.H.C. (1998): Direct Generalized Additive Modelingwith Penalized Likelihood. Computational Statstics & Data Analysis, 28, 193–209.
MICHALEWICZ, Z. (1996): Genetic Algorithms + Data Structures = EvolutionPrograms. Springer, Berlin.
MITCHELL, M. (1996): An Introduction to Genetic Algorithms. MIT Press, Cam-bridge, MA.
Keywords
GENETIC ALGORITHMS, ADDITIVEMODELS, VARIABLE SELECTION,B-SPLINES
111
Multiple Change-Points andAlternating Segments
in Binary Trials with Dependence
J. Krauth
Department of PsychologyUniversity of Dusseldorf, D-40225 Dusseldorf, Germany
Abstract. In Krauth (2003) we derived modified maximum likelihood estimates toidentify change-points and changed segments in Bernoulli trials with dependence.Here, we extend these results to the situation of multiple change-points in an alter-nating segments model (Halpern, 2000) and to a more general multiple change-pointmodel (Hawkins, 2001). Both situations are of interest, e.g., in molecular biologywhen analyzing DNA sequences.
References
HALPERN, A.L. (2000): Multiple-Changepoint Testing for an Alternating Seg-ments Model of a Binary Sequence. Biometrics, 56, 903–908.
HAWKINS, D.M. (2001): Fitting Multiple Change-Point Models to Data. Compu-tational Statistics & Data Analysis, 37, 323–341.
KRAUTH, J. (2003): Change-Points in Bernoulli Trials with Dependence. In: W.Gaul, M. Schader and M. Vichi (Eds.): Between Data Science and EverydayWeb Practice. Springer, Heidelberg.
Keywords
MULTIPLE CHANGE-POINTS, ALTERNATING SEGMENTS, BINARYTRIALS WITH DEPENDENCE, DNA SEQUENCES
112
Outlier Identification Rulesfor Generalized Linear Models
Sonja Kuhnt and Jorg Pawlitschko
Fachbereich StatistikUniversitat Dortmund, D-44221 Dortmund, Germany
Abstract. Observations which seem to deviate strongly from the main part of thedata can occur in every statistical analysis. These observations, usually called out-liers, may cause completely misleading results when using standard methods. Theymay also contain information about special events or dependencies. It is thereforeof interest to identify them.
We discuss outliers in situations, where a generalized linear model is assumedas null-model. An exact definition of outliers is derived from the α-outlier conceptof Davies and Gather (Davies and Gather, 1993; Gather et al., 2002).
Identification rules for such outliers in a data set are introduced. For the specialcase of a loglinear poisson model some one-step identifiers based on robust andnon-robust estimators are proposed and compared (Kuhnt, 2000).
References
DAVIES, L. and Gather, U. (1993): The Identification of Multiple Outliers. Journalof the American Statistical Association, 88, 782-792.
Kuhnt, S. (2000): Ausreißeridentifikation im Loglinearen Poissonmodell fur Kontin-genztafeln unter Einbeziehung robuster Schatzer. Dissertation, Department ofStatistics, University of Dortmund, Germany.
Gather, U., Kuhnt, S. and Pawlitschko, J. (2002): Concepts of Outlyingness forVarious Data Structures. Technical Report 6/2002, Department of Statistics,University of Dortmund.
Keywords
GENERALIZED LINEAR MODELS, OUTLIER, OUTLIER IDENTIFICA-TION
113

Renditeentwicklung in borsennotiertendeutschen Familienunternehmen
Jan Kuklinski, Felix Lowinski, and Dirk Schiereck
Institute for Mergers & Acquisitions, Universitat Witten/Herdecke,Alfred-Herrhausen-Straße 50, 58448 Witten
Abstract. Da fur Familienunternehmen in besonderem Maße eine weitgehendeIdentitat zwischen Management und Eigentum gegeben zu sein scheint, werden dielangfristigen Kapitalmarktreaktionen auf die durch einen Borsengang induziertenfundamentalen Veranderungen in der Eigentumerstruktur und damit in der Corpo-rate Governance der Familienunternehmen untersucht.Wahrend fruhere Studien uber langere Zeitraume schon Hinweise uber eine Un-derperformance von Familienunternehmen geliefert haben, hat sich unseren Ergeb-nissen zufolge die Situation in den neunziger Jahren noch erheblich verschlechtert.Gegenuber der Entwicklung des Gesamtmarktes mussten Aktionare von Familienun-ternehmen im Durchschnitt eine negative Uberrendite von 43,4 % hinnehmen. Inabsoluten Zahlen bedeutet dies, dass Aktionare von neu eingefuhrten Familienun-ternehmen lediglich eine Rendite von 32,1% nach 5 Jahren erzielen konnten imVergleich zu 75,5%, die der gesamte Aktienmarkt erreicht hat. Es gibt Anzeichendafur, die dieses Resultat darauf zuruckfuhren, dass Familienunternehmer wahrendboomender Aktienmarkte einen Teil ihrer Unternehmensanteile an die Borse brin-gen, ohne jedoch eine Einbuße hinsichtlich der Verfugungsgewalt uber ihre Firmenhinzunehmen, die ihnen die Moglichkeit zum Abschopfen von Private Benefits er-schweren wurde.Die Erwartungen bezuglich langfristig niedrigerer Kapitalkosten, die mittelstandischeFamilienunternehmen an den Borsengang knupfen, werden demnach im Schnittnicht erfullt. Dies deutet darauf hin, dass deutsche Familienunternehmen nur bed-ingt fur den Kapitalmarkt geeignet sind.
114
The Application of CHAID Algorithmin Preference Analysis of Chocolates Buyers
Adam KurzydÃlowski
WrocÃlaw University of Economics,Komandorska 118/120, 53-345 WrocÃlaw, Poland
Abstract. In the paper the application of CHAID algorithm in preference analy-sis of chocolates buyers is presented. This algorithm can be used for data given inratio, interval, ordinal and nominal scale. It is based on the recursive partitioningof the multidimensional attribute space into disjoint classes. The quality of par-tition of data is measured in CHAID algorithm by the Pearson chi-squared test,the likelihood-ratio test or test F . It depends on the scale of measurement of thecriterion variable. In the paper the following problems are discussed:
• the classification of respondents on the basis of their average monthly expenseson purchase of chocolate (metric dependent variable),
• the construction of discriminant tree for separate classes of consumers basedon their chocolate brands preferences (categorical dependent variable).
References
AnswerTree 3.0 (2001): User’s Guide. Chicago, SPSS Inc.HASTIE, T., TIBSHIRANI, R. and FRIEDMAN, J. (2001): The Elements of Sta-
tistical Learning: Data Mining, Inference and Prediction. New York, Berlin,Heidelberg, Springer-Verlag.
KURZYDÃLOWSKI, A. (2002): The Application of Algorithms CHAID and C&RTin Classification of Buyers of Chocolates. In: Jajuga K., Walesiak M. (Eds.):Klasyfikacja i analiza danych – teoria i zastosowania. Taksonomia 9. PraceNaukowe AE we WrocÃlawiu, 942, 258–271.
WIND, Y. (1978): Issues and Advances in Segmentation Research. Journal of Mar-keting Research”, August, 15, 317–337.
Keywords
REGRESSION TREE, DISCRIMINANT TREE MODEL, CHAID, CLAS-SIFICATION
115

Model Risk in Market Risk Management
Katarzyna Kuziak
Department of Financial Investments and Insurance,Wroclaw University of Economics, ul. Komandorska 118/120 53-345 WrocÃlaw,Poland
Abstract. Model risk arises when we use mathematical models to value or hedgeposition in securities. For classical instruments, such as stocks and straight bonds,this risk is relatively insignificant. For derivatives and complex strategies (eg. com-plex arbitrage strategies) or VaR it becomes considerable. In the paper sources andtypes of model risk be given. Some examples of types of model risk from marketrisk management area be presented.
References
CROUHY, M., GALAI, D. and MARK, R. (2001): Risk Management. McGraw-Hill,New York.
JORION, P. (1995): Value at Risk: The New Benchmark for Controlling MarketRisk. McGraw-Hill, New York.
Keywords
MODEL RISK, MARKET RISK, RISK MANAGEMENT
116
Computer Aided Database for Small andMedium Size Firms in Poland
Dorota Kwiatkowska-Ciotucha1, Urszula ZaÃluska1, and PaweÃl Hanczar2
1 Department of Forecasting and Economic Analyses, WrocÃlaw University ofEconomics, 53-345 WrocÃlaw, Poland, e-mail: [email protected],[email protected]
2 Department of Logistics, WrocÃlaw University of Economics, 53-345 WrocÃlaw,Poland, e-mail: [email protected]
Abstract. The paper presents an idea of the construction of database providingbusiness and economic information needed by Small and Medium Size Enterprisesmanagers in Poland. For analyses the multivariate statistical analysis frameworkwill be used. The database will be free of charge and accessible via-Internet. The goalof the database construction is providing the information base for the determinationof the manufacturing branches attractiveness from the point of view four potentialusers (firms managers, investors, credit managers in banks and local politicians).Depending on the end user of the research results, for the evaluation of the Polishmanufacturing sector performance (section D in NACE Classification) - appropriateset of indicators (variables describing firms performance) will be given. Additionallysome branch indicators showing current and future situation, position (ranking,rating and clustering) are planned. The analysis covers period from January 1995to December 2002. In the database there are two sources of the raw data. First typeof the data comes from quarterly reports from the enterprises. The second sourceof the data is the monthly and the quarterly business tendency surveys. Since theraw data may not be published (because of confidentiality), the aggregated andmodified information have to be produced.
References
KWIATKOWSKA-CIOTUCHA, D. and DZIECHCIARZ, J.: Assessment of thePolish Manufacturing Sector Attractiveness. An End-User Approach. XXVIGfKl Conference, Mannheim, 22-24.07.2002.
RENCHER, A.C. (1997), Methods of Multivariate Analysis, Vol. 2, MultivariateStatistical Inference and Applications. Wiley, New York.
PAPAKONSTANTINOU, Y. at al (1995), A Query Translation Scheme for RapidImplementation of Wrappers. In Proceedings of the 4th International Confer-ence on Deductive and Object-Oriented Databases, Singapore.
WIDOM, J. and CERI, S. (1995), Active Database Systems: Triggers and Rules forAdvanced Database Processing. Morgan Kaufmann, San Francisco.
Keywords
MANUFACTURING BRANCHES, COMPARATIVE ANALYSIS, COMPOS-ITE INDICATOR, DATABASE CONSTRUCTION
117
Bootstrap Resampling in Analysis of TimeSeries
Jacek Leskow
Department of Econometrics, The Graduate School of Business WSB-NLUNOWY SACZ, POLAND.
Abstract. The aim of this presentation is to review basic bootstrap resamplingtechniques available for time series. We will start with the elementary method ofARMA models residuals resampling, presented already in the pioneering paper ofEfron (1979). Then we will focus on moving block bootstrap and its potential appli-cations and limitation of use. In the second part of the talk we will give some insightinto modern bootstrap resampling techniques such as: sieve bootstrap and subsam-pling for nonstationary data. The potential of bootstrap will be demonstrated inrestoring spectral densities of quantized time series as well as in identification ofnonstationarity for time series.
References
EFRON, B. (1979), Bootstrap Methods: Another Look at the Jackknife, Ann. Stat.7, 1-26.
LESKOW, J. (2001), The impact of stationarity assesment on studies of volatilityand Value-at-Risk, Mathematical and Computer Modelling,34, 2001,pp 1213 -1222.
Keywords
BOOTSTRAP, TIME SERIES, IDENTIFICATION
118
Differences in the Costs of Teaching andNon-Teaching Hospitals in Germany
Markus Lungen1, Karin Wolf-Ostermann2, and Karl W. Lauterbach1
1 Institute for Health Economics and Clinical Epidemiology of the University ofCologne, D-50935 Koln, Germany
2 Department of Child and Adolescent Psychiatry, Philipps-University Marburg,D-35033 Marburg, Germany
Abstract. As from 1.1.2004 all inpatient care in Germany will be charged forvia a prospective payment system based on DRGs (Diagnosis-Related Groups). Itis not clear, if additional payments for teaching hospitals in Germany are to bemade to compensate for higher costs. Case reimbursements and length of stay datawere collated for 206 hospitals (135 non-teaching; 71 teaching). The difference incase reimbursement between hospitals with and those without teaching activities isabout 15%, the absolute difference is 357 Euro. Teaching hospitals have 2% longerlength of stay. The additional payment over and above the flat rate reimbursementvia DRGs ought to be introduced also in Germany. Further research is recommendedto determine the reasons for the higher costs and the detailed level of additionalteaching payments.
References
FRICK A.P., MARTIN S.G., SHWARTZ M. (1985): Case-Mix and cost differencesbetween teaching and non-teaching hospitals. Med Care, 23(4), 283-9
IEZZONI L.I., SHWARTZ M., MOSKOWITZ M.A., ASH A.S., SAWITZ E.,BURNSIDE S. (1990): Illness severity and costs of admissions at teaching andnon-teaching hospitals. JAMA. 19;264(11), 1426-31
Keywords
DIAGNOSIS RELATED GROUPS, FINANCING, HOSPITAL, TEACHINGACTIVITY
119
Testing of Warrants Market Efficiency on theWarsaw Stock Exchange
Agnieszka Majewska and Sebastian Majewski
Insurance and Capital Market DepartmentFaculty of Economic Sciences and ManagementUniversity of Szczecin
Abstract. The efficiency of the different markets was a subject of researches bymany analysts. The most of market researches on the derivatives market was con-centrated on the valuation, but only a little part of them was concentrated on themarket efficiency. The goal of this article is providing an empirical test of efficiencyof warrants quoted on the Warsaw Stock Exchange. The one of the approaches of thederivatives’ market efficiency testing is researching a relationships between impliedand historical volatility. The efficient market hypothesis assumes that volatilityprediction, which is build on the signs from the market, its named implied volatil-ity, could be the estimator of empirical volatility in the future, named historicalvolatility. Using standard procedures for estimating regression line by the OLS andmeasures of goodness of fit we can draw a conclusion about rejection of lack ofbases of rejection of hypothesis that the market is effective.Researching includes testing week efficiency and strong efficiency. Empirical testingcould be done in the following stages:
1. The calculation of underlying assets’ historical volatility.2. The estimation of implied volatility from warrants prices.3. Verification of hypothesis.
Keywords
WARRANTS, MARKET EFFICIENCY, IMPLIED ANDHISTORICAL VOLATIL-ITY
120
Wissensbasierte Ansatzezur ganzheitlichen
Entscheidungsunterstutzungin der Produktion
Uwe Meinberg1 and Jens Jakobza2
1 Fraunhofer-Anwendungszentrum fur Logistiksystemplanung undInformationssysteme (ALI) und Lehrstuhl Industrielle Informationstechnik ander Brandenburgischen Technischen Universitat Cottbus, 3-4, 03044 Cottbus,Deutschland
2 Fraunhofer-Anwendungszentrum fur Logistiksystemplanung undInformationssysteme (ALI), Universitatsplatz 3-4, 03044 Cottbus, Deutschland
Abstract. Innerhalb der Produktionsplanung und -steuerung (PPS) werden Auf-trage meist nach dem produktionswirtschaftlichen Zielsystem und den daraus ab-geleiteten Prioritatsregeln durch die Produktion gesteuert. Die Effizienz dieser Re-geln zur zielorientierten Steuerung wird dabei oft in Frage gestellt. Zudem kanndiese Vorgehensweise sich konfliktar zu den Zielen anderer Unternehmensbereicheauswirken und den Zielerreichungsgrad des Gesamtergebnises des Unternehmens,meist zeitverzogert, auch negativ beeinflussen.Einige vorherrschende Ziele der einzelnen Unternehmensbereiche, die sich zu einemgroßen Teil aus dem Zielsystem der Unternehmung ableiten lassen, sind zudemnicht oder nur unter hohem Aufwand meßbar. Dies erschwert es, die auf solchenEinflussgroßen basierenden Entscheidungen gesamtunternehmerisch im Sinne einerganzheitlichen Steuerung der Prozesse zu kommunizieren. Die Akzeptanz solcherEntscheidungen leidet darunter, kann zu deren Nichtberucksichtigung in anderenUnternehmensbereichen fuhren.In diesem Beitrag sollen Moglichekiten erortert werden, wie mit Hilfe wissens-basierter Systeme diese Probleme uberwunden werden konnen, um dem Ziel einerganzheitlichen Planung und Steuerung der Produktion naher zu kommen.
Keywords
WISSENSBASIERTE SYSTREME, PPS; GANZHEITLICHE PLANUNGUND STEUERUNG.
121
Dynamical Missing Data in EnvironmentalSeries. An Unlucky Situation
Daria Mendola
Dipartimento di Scienze Statistiche e Matematiche “Silvio Vianelli”,Universita degli Studi di Palermo, 90128 Palermo, Italia
Abstract. Missing data are a common problem of time series data and almostendemic in high frequency series. So far, despite an extensive literature (see Ru-bin(1996), Hopke et al. (2001)), often the approach to missing data is simply throw-ing cases away and pretend that they never existed. This common practice is usuallyrisky; furthermore, if we are dealing with a regular time series, it makes also nec-essary to reconsider it as an unequally spaced time series, with increased analyticdifficulties. Most common procedures (easily supported by most of data managingsoftware) for imputation of missing data can be classified as: a) univariate meth-ods, which substantially use information from the distribution of the variable itself;and b) multivariate methods, generally based on regression analyses involving oneor more variables potentially related to the incomplete ones. All these methodsimplicitly assume that missing and observed data are generated from the samemechanism; therefore to be implemented they need the availability of observationsfrom “similar” subseries. In this paper we deal with the unlucky situation in which,in hourly series, missing data immediately follow an absolutely anomalous period,for which we do not have any similar period to use for any tentative imputation.We put forward some proposals based on the possibility, typical of environmentaltime series, to resort to specific imputation methods exploiting temporal-spatialcorrelations or physical laws that characterize relationships between variables.
References
HOPKE, P.K., LIU, C. and RUBIN, D.B. (2001): Multiple Imputation for Mul-tivariate Data with Missing and Below-Threshold Measurements: Time-SeriesConcentrations of Pollutants in the Artic. Biometrics, 57, 22–33.
RUBIN, D.B. (1996): Multiple Imputation After 18+ Years. Journal of the Amer-ican Statistical Association, 91, 434, 473–489.
Keywords
MISSING DATA, LACK OF REPLICATIONS, ENVIRONMENTAL TIMESERIES
122
Probabilistisches Record-Linkage mitanonymisierten Krebsregistermeldungen
Martin Meyer, Martin Radespiel-Troger and Christine Vogel
Bevolkerungsbezogenes Krebsregister Bayern - RegisterstelleFriedrich-Alexander-Universitat Erlangen-Nurnberg, D-91052 Erlangen, Germany
Abstract. In einem Krebsregister treffen in der Regel zu einem Patienten imLauf der Zeit mehrere Meldungen ein. So konnen fur eine Neuerkrankungsmeldungpathologische Befunde, Daten zu einem Zweittumor oder im Todesfall Sterbedatennachgemeldet werden. Alle Meldungen zu einer Person mussen im Krebsregisterzusammengefuhrt werden, damit Tumoren korrekt gezahlt und Inzidenzen richtigberechnet werden konnen. Eine direkte Zusammenfuhrung von Meldungen mit Hilfevon Name und Anschrift eines Patienten ist im bayerischen Register nicht moglich,da aus Datenschutzgrunden lediglich anonymisierte Identifikationsmerkmale zurVerfugung stehen, mit denen zwar keine Person mehr namentlich identifiziert wer-den kann, aber immerhin unterschieden werden kann, ob sich zwei Meldungenauf dieselbe oder auf verschiedene Personen beziehen. Eine Dechiffrierung dieseranonymisierten Daten ist nicht moglich, fur die Zusammenfuhrung aber auch nichterforderlich. Als Folge von Eingabe- oder Ubermittlungsfehlern konnen manchmalfur eine Person unterschiedliche Angaben vorliegen. Auch solche Datensatze sollennoch als zusammengehorig erkannt werden. Daher wurde in der Registerstelle einhalbautomatisches stochastisches Record-Linkage-Verfahren implementiert. DiesesProgramm-Modul fordert nur bei Zweifelsfallen vom Benutzer eine Entscheidunguber die Zusammengehorigkeit von Meldungen. Meistens kann die Zuordnung au-tomatisch durchgefuhrt werden oder zumindest ein passender Vorschlag erzeugtwerden. Das stochastische Verfahren bewertet den Grad der Zusammengehorigkeitjedes in Frage kommenden Meldungspaars mit einem Ubereinstimmungsgewicht.In dessen Berechnung geht die Werteverteilung der verwendeten Merkmale undderen Anderungswahrscheinlichkeit ein. Werden fur eine neue Meldung nur niedrigeUbereinstimmungsgewichte zu den schon vorhandenen Datensatzen gefunden, giltsie als Einzelmeldung und kann automatisch weiterverarbeitet werden. Werdenbestehende Datensatze mit hohem Ubereinstimmungsgewicht gefunden, gelten sieals zusammengehorig und werden dem Benutzer zur Wahl der bestmoglichen In-formationen aus den Tumordaten angeboten. In einer verbleibenden Grauzone immittleren Gewichtsbereich muss der Benutzer uber die Zusammenfuhrung urteilen.
References
Fellegi, I.P. and Sunter, A.B. (1969): A theory for record linkage. American Statis-tical Association Journal, 40, 1183–220
Keywords
RECORD LINKAGE, CANCER REGISTRY123

Quality Control Methods and Applications
JarosÃlaw Michalak
Chair of Statistical MethodsUniversity of Lodz
Abstract. Reliable and accurate quality control is an important element in indus-trial manufacturing. The pattern of the process-run can be defined as nonrandomconfiguration of the empirical point series. Many statistical quality control methodscan be apllied to indicate an out-of-control states of the process. The aim of thearticle is to present some statistical quality control methods and their applicationsin statistical process control.
124

Application of stochastic geometry toclustering and search
Ilya Molchanov
Institut fur mathematische Statistik und Versicherungslehre, Universitat Bern
Abstract. We formulate clustering as a minimisation problem in the space of mea-sures by modelling the cluster centres as a Poisson process with unknown intensityfunction. Thus, we derive a Ward-type clustering criterion which, under the Poissonassumption, can easily be evaluated explicitly in terms of the intensity function.We show that asymptotically, i.e. for increasing total intensity, the optimal inten-sity function is proportional to a dimension-dependent power of the density of theobservations. Similar methods are also applicable to such problems as mixtures ofdistributions and optimal search.
125
Vertriebsdatenanalyse mittelsSupport-Vektor-Maschinen
Katharina Monien und Reinhold Decker
Fakultat fur Wirtschaftswissenschaften,Universitat Bielefeld, D-33613 Bielefeld
Abstract. Support-Vektor-Maschinen (SVM) bezeichnen eine aus dem Bereich desmaschinellen bzw. statistischen Lernens stammende Methodik zur Mustererken-nung (vgl. Vapnik (1998)), die bereits heute auf zahlreichen Gebieten, etwa derKrebsdiagnostik oder der Bilderkennung (vgl. Bredensteiner, Bennett (1999)), zumEinsatz kommt. Die hierbei erzielten Erfolge lassen dieses Instrumentarium auchfur Klassifikationsfragestellungen im Marketing interessant erscheinen. Insbeson-dere bei der Verarbeitung hochdimensionaler Marketingdaten konnen zuverlassigeKlassifikationsergebnisse erwartet werden.
Der vorliegende Beitrag setzt sich anhand eines ausgewahlten Beispieldaten-satzes mit Starken und Schwachen dieser Methodik im Kontext der Vertriebs-datenanalyse auseinander. Besondere Aufmerksamkeit findet hierbei das fur prak-tische Anwendungen im Marketing zentrale Problem der Wahl geeigneter Kernfunk-tionen und deren Parameter. Die Ausfuhrungen schließen mit einigen Bemerkungenzu weiteren Einsatzmoglichkeiten von SVM im Rahmen der Analyse von Market-ingdaten und damit einhergehenden Problemen.
References
BREDENSTEINER, E. J. and BENNETT, K. (1999): Multicategory Classificationby Support Vector Machines. Computational Optimizations and Applications,12, 53 – 79.
VAPNIK, V. N. (1998): Statistical Learning Theory. New York, Wiley.
Keywords
KLASSIFIKATION, SUPPORT-VEKTOR-MASCHINEN, VERTRIEB
126
ClusCorr98 - Adaptive Clustering,Classification, Multivariate Visualisation,
and Validation of Results
Hans–Joachim Mucha1 and Hans–Georg Bartel2
1 Weierstraß-Institut fur Angewandte Analysis und Stochastik (WIAS),D-10117 Berlin, Germany
2 Institut fur Chemie,Humboldt-Universitat zu Berlin, D-12489 Berlin
Abstract. A new release of the statistical software ClusCorr98 will be presented.Here the emphasis lies on an extended collection of exploratory and model-basedclustering techniques. The advantages and disadvantages of different clustering tech-niques optimizing the same criterion are investigated. Furthermore, it is recom-mended to use adaptive distances in clustering as well as for multivariate visuali-sation.ClusCorr98 is based on the statistical computing environment of Excel.
References
BANFIELD, J. D. and RAFTERY, A. E. (1993): Model-Based Gaussian and Non-Gaussian Clustering. Biometrics, 49, 803–821.
MUCHA, H.–J. (1992): Clusteranalyse mit Mikrocomputern. Akademie Verlag,Berlin.
Keywords
MODEL-BASED CLUSTERING, ADAPTIVE DISTANCES, STATISTICALSOFTWARE
127
Paired Rank Tests
Ullrich Munzel
Viatris GmbH und Co. KG, [email protected]
Abstract. The nonparametric standard tests for paired data are the sign test (ST)and the Wilcoxon signed rank test (WSR). Although these tests frequently are usedin practice both have major disadvantages. The ST reduces the information of anintra-individual change to its direction and this loss of information leads to the wellknown inefficiency of the test. The WSR on the other hand is very based on theassumptions that the observations are metric and the intra-individual differencesare distributed symmetrically. Note that the WSR not even is consistent for skewdistributions. Hence, the application of both tests is inefficient or questionable, es-pecially for ordinal or skew data.
Alternative tests are proposed that are based on intra-individual differences ofranks. The ranks contain more information than the direction and, therefore, leadto more efficient tests than the ST. Moreover, the ranks are robust against skewnessand can be applied to ordinal data, such that the resulting methods can be used insituations where the WSR should be omitted.
In detail the so called paired rank test will be discussed, the asymptotic version ofwhich simply can be derived by applying the paired t-test to the ranks. The exactconditional distribution will also be given. Finally a modification of the varianceestimator will be proposed that is consistent under hypothesis as well as underalternatives.
References
Munzel, U. (1999). Nonparametric methods for paired samples. Statist. Neerl. 53,277-286.
Munzel, U. and Brunner, E. (2002). An exact paired rank test. Biom. J. 44, 584-593.
128
Classification of Career-lifestylePatterns of Women
Miki Nakai
Department of Social Sciences, College of Social Sciences,Ritsumeikan University, 56-1 Toji-in Kitamachi, Kyoto 603-8577 Japan
Abstract. In most sociological research that focus on women’s life-course or ca-reer, typology which treats only the experience of events such as entry into or exitfrom labor market is utilized. However, each of the categories of this sort of ty-pology is comprised of various socioeconomic groups of women (Nakai and Akachi2000). This paper proposes the typology of female career-lifestyle patterns that dis-tinguish women not a uniform state in terms of the social background based mainlyon occupational history data. Using the data of 1995 Social Stratification and Mo-bility survey in Japan, complete history of occupational career and family career aswell as 2 other life domains - cultural participation and material affluence - of 644women aged between 30 and 49 were analyzed by cluster analysis. Eight categorieswere derived: Four categories were characterized as the women who devote a largepart of their life for paid-work in the labor market and make up 54%, and otherfour categories were characterized as not engaged in employment and make up 46%.In addition, by analyzing the relationships between these clusters and variables ofsocial stratification, e.g. fathers occupational status and education, the result showsthat among those who are classified into one of the clusters which are work-centeredlifestyle patterns, there are both women who are from disadvantaged social back-ground (’continuous working and child rearing’ cluster) and women from the highestsocial background (’continuous working with cultural participation’ cluster).The re-sult also shows that among those who are classified into one of the clusters whichare relatively outside of labor market, there are women who are actively involvedin cultural domain from privileged social background (’housewife consuming bothculture and household goods’), whereas there are women who are deprived of bothadvantageous social background and opportunity for cultural participation.
References
Nakai, M. and Akachi, M. (2000): Labor Market and Social Participation. In K.Seiyama (Ed.): Gender, Market, and Family. University of Tokyo Press, Tokyo,111-131. (in Japanese)
Keywords
CLUSTER ANALYSIS, CAREER-LIFESTYLE PATTERN, OCCUPATIONAL-HISTORY DATA, SOCIAL STRATIFICATION
129
Measurement of the Quality of Health fromPolish Patients Point of View - EQ-5D as aMeasure of Health State of a Population of
any Hospital.
Sylwia Nieszporska1 and Jadwiga Suchecka2
1 Technical University of Czestochowa, Department of Management, ul. ArmiiKrajowej 19b, 42-200 Czestochowa, Poland; e-mail: [email protected]
2 University of Lodz, Department of Economics and Sociology, ul. P.O.W. 3/5,90-255 ÃLodz, Poland
Abstract. The measurements that are based on the health assessment from thepatient’s perspective are more often used in the nowadays study on the qualityof life. Such measurements serve the assessment of equality and effectiveness inapplications of different therapies, but they also become a base for economical as-sessment of the healthcare system. The main aim of this paper is the evaluation ofthe patients’ health in one of the Czestochowa’s hospitals using EQ-5D descriptivesystem. This system is interesting because it not only describes the health care ofthe respondents in a complex way, but also delivers a weighted index for health’sstate, which can be used in economical and clinical assessment of the health care.In the conducted sample on the population of patients chosen in order to obtainaforementioned index, a questionnaire that was developed and delivered by Euro-QoL Group will be used. This 2 pages long questionnaire includes questions con-cerning 5 dimensions of health: mobility, self-care, usual activities, pain/discomfort,anxiety/depression. Respondents will choose its level of problem (small, medium,or big) in each dimension. Moreover they will asses their heath on their own usingEQ VAS (Visual Analogue Scale) that starts from 000 (the worse health state) to100 (the best health state).The assessment of the actual health level of the chosen group of patients will beconducted using questionnaire EQ-5D and the responses it contains. It will alsofacilitate analysis of the quality of their life, which can help hospital’s managers inundertaking decisions that influence effectiveness of the implemented methods oftherapy from both medical and economical point of view.
Keywords
QUALITY OF LIFE, HEALTH STATE, EQ-5D.
130
New Methods for Supervised andUnsupervised Learning
Klaus Obermayer
Fakultat fur Elektrotechnik und Informatik, Technische Universitat Berlin, FR2-1,Franklinstrasse 28/28, 10587 Berlin, Germany
Abstract. In the first part of the talk I will investigate a sample-based criterion formodel selection in unsupervised learning which allows for selection if maximum like-lihood approaches are intractable. Given a set of training data and a set of data gen-erated by the model two kernel density estimators are constructed. Model selectionis then based on the integrated squared difference between the density estimatorsfor model and training data. After this cost function has been reparametrized forcomputational convenience, the optimal model is selected by gradient descent w.r.t.the model parameters. I prove that convergence is optimal under weak assumptionson the kernel, if, and only if, the kernel in the reparametrized cost function is ageneralized Coulomb kernel. In this case, optimal convergence assures that the costfunction has only one global minimum w.r.t. the location of the model samples.Numerical simulations using the reparametrized cost function show that the newmethod is highly successfully when applied to complex generative models, nonlineardensity estimation, and nonlinear independent component analysis.
In the second part of the talk I will address the problem of how to constructclassifiers for datasets which are described by matrices. Rows and columns of thesematrices correspond to objects, where row and column objects may belong to dif-ferent sets, and the entries in the matrix express the relationships between them. Iinterpret the matrix elements as being produced by an unknown kernel which op-erates on object pairs. Minimizing a bound for the generalization error of a linearclassifier, which has been obtained using covering numbers, we derive an objectivefunction for model selection according to the principle of structural risk minimiza-tion. The new objective function has the advantage that it allows the analysis ofmatrices which are neither positive definite, nor symmetric or square. I then con-sider the case that row objects are interpreted as features. Using a constraint, whichimposes sparseness on the row objects we show, that the method can be used forfeature selection. The method is applied to data from DNA microarrays, where“column” objects correspond to samples, “row” objects correspond to genes andmatrix elements correspond to expression levels. The new method extracts a sparseset of genes and provides superior classification results.
The work was done in collaboration with Jospeh Hochreiter.
131
The European ,,Urban Audit” Indicators– Results of Implementation and InformationalRecommendations for Polish Public Statistics
Marek Obrebalski
WrocÃlaw University of Economics,Komandorska 118/120, 53-345 WrocÃlaw, Poland
Abstract. The European Commission launched in June 1998 a project called Ur-ban Audit. The project involved 58 large towns through-out the EU and the resultswere available in spring 2000. Each town was assessed through 21 indicators cov-ering five areas: socio-economic aspects, civic involvement, education and training,environment, and culture and leisure activities. The indicators were selected on thebasis of availability and comparability criteria. The results have not always livedup to expectations, either because of a poor definition of the indicator or becauseof the inadequacy of the data, since data about towns are not always available.
The conducted comparative analysis leads towards the conclusion that there canbe observed a high degree of compatibility between the information needs resultingfrom the range of indicators used in the ,,Urban Audit” project and the informativepotential of Polish public statistics.
References
FELDMANN, B. (2000): European Urban Statistics. Eurostat – February 2000.OBREBALSKI, M. and STRAHL, D. (1999): Informational range of Local
Database in Poland vs. European Infraregional Information System – SIRE.Argumenta Oeconomica” nr 2 (8), AE, WrocÃlaw, 81–94.
ROMA, M. (2000): New ideas for Europe‘s towns. ,,Sigma” 2000 No 1.The 2001 Census (2001): Proposal on special tables for urban statistics. Working
Party on Urban Statistics – Eurostat 2001.
Keywords
URBAN STATISTICS, URBAN AREA, URBAN AUDIT INDICATORS,NEEDS FOR URBAN STATISTICS, COMPARATIVE URBAN STATIS-TICS
132
Comparing Neural Networks to some ClassicalModels Applied in Financial Data Analysis
Tomasz OczadÃly
Department of Financial Investments and Insurance,Wroclaw University of Economics,ul. Komandorska 118/120 53-345 WrocÃlaw, Poland
Abstract. Artificial Intelligence could be a useful tool for analyzing financial data,and building self developing models. The main idea is to put the process of develop-ing models into automatic way. Other advantage is possibility to create much morecomplicated way of data analysis that haven’t ever been used by the analyst. Thebasic idea of this article is to compare some main models of Neural Networks tosome some other models including stochastic modelling. Some research shows thatNeural Networks could produce more complicated models, especially in comparingwith ARCH, and GARCH modeling. The last part of this article, shows futureprospect of using Neural Networks as basic blocks in advanced systems, that couldbe the future of financial data modeling.
References
GOLDBERG David E. (1989): Genetic Algoritms in Search, Optimization and Ma-chine Learning. Addison - Wesley Publishing Company, Inc.
DUNIS L. Christian (1997): Forecasting Financial Marktes. John Wiley & SonsLtd.
KOZA J.R. (1993): Genetic Programming: On the Programinng of Computers byMeans of Natural Selection. MIT Press, Cambridge.
Keywords
NEURAL NETWORKS, GENETIC ALGORITHMS, GENETIC PROGRAM-MING, CELLULAR AUTOMATS, GARCH, ARCH
133
Joint Space Model for MultidimensionalScaling of Asymmetric Proximities
Akinori Okada1 and Tadashi Imaizumi2
1 Department of Industrial Relations, School of Social Relations,Rikkyo (St. Paul’s) University, 3-34-1 Nishi Ikebukuro,Toshima-ku Tokyo, 171-8501 Japan
2 School of Management and Information Sciences, Tama University,4-4-1 Hijirigaoka, Tama city, Tokyo, 206-0022 Japan
Abstract. A model and an associated algorithm to analyze two-mode three-wayasymmetric proximities (object×object×source) are presented. Each object is rep-resented as a point and a circle (sphere, hyper sphere) in an object configurationwhich is inherited from Okada and Imaizumi (1997). Each source is also repre-sented as a point, called the dominance point, in the object configuration. Let sjkibe the observed proximity from objects j to k for source i. It is assumed that sjkiis monotonically decreasingly (when sjki depicts similarity) or increasingly (whensjki depicts dissimilarity) related to mjki defined as
mjki = widjk − βi(1− exp(−d2ij))rj + βi(1− exp(−d2
ik))rk,
where djk is the distance between the points representing objects j and k, dij is thedistance between the dominance point of source i and the point representing objectj, wi(≥ 0) is the symmetry weight, βi(≥ 0) is the weight for the asymmetry, and rjis the radius of object j. Thus each source has its own radius: the radius of an objectfor a source is expanded according to the distance between the point representingthe object and the dominance point of the source (cf. Krumhansl 1978). When anobject is at the dominance point of a source, the radius of the object for the sourceis minimized. An associated nonmetric algorithm to derive the object configuration,the dominance points, αi and βi from observed two-mode three-way proximities,and the application to intergenerational occupational mobility are presented.
References
KRUMHANSL, C.L. (1978): Concerning the Applicability of Geometric Model toSimilarity Data: the Interrelationship between Similarity and Spatial Density.Psychological Review, 85, 445–463.
OKADA, A. and IMAIZUMI, T. (1997): Asymmetric Multidimensional Scaling ofTwo-Mode Three-Way Proximities. Journal of Classification, 14, 195–224.
Keywords
ASYMMETRY, INDIVIDUAL DIFFERENCES, JOINT SPACE MODEL,MDS, THREE-WAY DATA
134
Felix Auerbach – A German Pioneer inStatistical Graphics and Data Analysis
Rudiger Ostermann
FB Pflege, FH MunsterD - 48149 Munster
Abstract. Felix Auerbach (1856-1933) was a multi-talent. He made his doctor’sdegree in physics under the guidance of Helmholtz. In his dissertation he dealt withthe subject of vocal sounds. In 1889 he got a professorship for Theoretical Physicsas the successor of Ernst Abbe who was one of the founders of Carl Zeiss Jena.Among many papers in physics he wrote several papers in data analysis, statistics,military techniques and geography. (http://www.uni-jena.de)
After a brief overview about Auerbach’s life we will demonstrate several exam-ples concerning his innovative graphical proposals in data analysis and geography.We finish our talk using some quotes about Auerbach’s attempt for popularizingmathematics, statistics and physics. The talk will be given in German because weuse many German quotes.
References
Auerbach, F. (1912) Physik in graphischen Darstellungen, Teubner, Lepizig BerlinAuerbach, F. (1913) Das Gesetz der Bevolkerungskonzentration, Petermanns Mit-
teilungen, 59, 74-76 und Tafel 14Auerbach, F. (1914) Die graphische Darstellung, Teubner, Leipzig BerlinAuerbach, F. (1924) Die Furcht vor der Mathematik und ihre Uberwindung, Fischer,
Jena
135

Group Opinion Structure:Assessing Agreement and Stability
Jan W. Owsinski
Systems Research Institute, Polish Academy of SciencesNewelska 6, 01-447 Warszawa, Poland, [email protected]
Abstract. One is often interested in the ,,behind-the-scenes” of a group deci-sion outcome, whether voting or more complex, in which various notions intervene,including the barycentres and the Kemeny’s median. This interest may itself bedifferentiated: to know whether the ,,vote” distribution’s mode anyhow coincideswith the outcome, to determine the structure of the set of opinions (are there anydistinct ,,blocks of votes”?), or to find the biggest subgroup of consistent opinions.
The paper analyses the ,,common opinion (decision)”, especially regarding ,,con-sensus”. Two aspects are paid attention to: (i) natural character of the definitions(avoiding the add-on ,,external” notions), (ii) insight into the ,,group-” or ,,opinionstructure” (e.g. whether the majority are right and what it means?). The latter isa (natural) subject of cluster analysis or unsupervised classification.
The paper focuses on relation between the ,,regularity” conditions that can beset (or attempted) on group opinion structure (say, seen through the cluster struc-ture) and the degree of agreement or ,,consensus”. These conditions and relationshave a broader application than just to group decision-making: broader populations(and models) can thereby also be assessed.
The paper refers to the experiences of the author from application of the clusteranalytic methods, in particular – of the author’s method, to group decision situa-tions, and especially voting. Formulation of the ,,minimum conditions” of consensusand sub-group-consensus, which can be observed within the framework of the au-thor’s method, is attempted, bearing on a broad spectrum of practical situations.
References
OWSINSKI, J.W. (1990): On a new naturally indexed quick clustering method witha global objective function. Applied Stochastic Models and Data Analysis, 6,1, 157-171.
OWSINSKI, J.W. (2002): Group choice: opinion structure, consensus, and clusteranalysis. Paper presented to the 11th conference of SKAD (Polish ClassificationSociety), Miedzyzdroje, 10-12 September 2002.
OWSINSKI, J.W. and SÃl. ZADROZNY (2000): Structuring the set of MPs in PolishParliament: a simple clustering exercise. Annals of Operations Research, 97,15-29.
Keywords
CONSENSUS, GROUP OPINION STRUCTURE, CLUSTER ANALYSIS,IDEAL STRUCTURE.
136

Some Remarks on Closed Multiple TestsProcedures
Dariusz Parys, LechosÃlaw Stepien, and Andrzej Czajkowski
University of ÃLodz, Chair of Statistical Methods
Abstract. In multiple comparisons we comparing the K expected values µi, 1, ...,Kfrom K distributions or K correlation coefficients βi, i = 1, ...,K from the generallinear regression model. A test procedure used in multiple comparison is called mul-tiple test.Such procedure has many applications in multiple inference. In this paper we presenthow to apply this closed procedure to multiple regression analysis.For the linear regression model Y = Xβ + ε is presented the generalized, modifiedclosed procedure for the set of null hypotheses concerning the correlation coeffi-cients. The closed methods for solving the problem of detecting which variablesXican be shown to have such an influence on Y is also suggested. In this paper wepresented how to apply the closed procedure to a bootstrap multiple tests.All the procedures, as closed procedures, keep the multiple level of significance atthe predetermined value.
137
Moderatoreffekte sozio- undunternehmensdemographischer Variablen auf
den Zusammenhang zwischenKundenzufriedenheit und Kundenbindung
Marcel Paulssen
Wirtschaftswissenschaftliche Fakultat, Industrielles Marketing, HumboldtUniversitat zu Berlin,
Abstract. Kundenzufriedenheit ist in den letzten 20 Jahren fur viele Unternehmenzu einem strategischen Imperativ geworden. Kundenzufriedenheit per se kann aberkein strategischen Ziel sein, sondern hochstens ein Mittel zur Erreichung von strate-gischen Zielen wie Kundenloyalitat. Trotz dieser strategischen Relevanz gibt es nurwenige Studien insbesondere im Gebrauchsguter- oder im Industrieguterbereich, dieden Zusammenhang zwischen Zufriedenheit und tatsachlichem Kaufverhalten (inAbgrenzung zum intendiertem Kaufverhalten) untersuchen (Mittal & Kamakura2001). Zusammenhange zwischen Kundenzufriedenheit und Kaufintentionen, diein derselben Erhebung gemessen worden sind, sind problematisch, da sie durchCommon-Method-Variance erhoht werden (Mazursky und Geza 1989) und sichdaruber hinaus Kausalzusammenhange zwischen Kundenzufriedenheit und Hand-lungsintentionen sowie Kundenzufriedenheit und tatsachlichem Verhalten stark un-terscheiden konnen (Arnold et al. 1985). Homburg und Giering (2001) zeigen dieModeratoreffekte von personlichen Charakteristika des Kunden auf den Zusam-menhang von Kundenzufriedenheit und intendiertem Kaufverhalten. Grundsatzlichkonnen Antworttendenzen (bei der Messung von Zufriedenheiten) und Zufrieden-heitsschwellen (bei gleicher Zufriedenheit kann sich Wiederkaufverhalten stark un-terscheiden), die in Abhangigkeit von den Kundencharakteristika variieren, denZusammenhang zwischen gemessener Kundenzufriedenheit und Kaufverhalten bee-influssen. Das von Mittal & Kamakura (2001) entwickelte Probit-Modell zur Ab-bildung von Antworttendenzen und Kundenzufriedenheitsschwellen wird auf in-dustrielle Kaufentscheidungen (Nutzfahrzeuge) ubertragen und um Unternehmen-scharakteristika des Nutzfahrzeugkunden erweitert. Die Ergebnisse zeigen, dassZufriedenheitsschwellenwerte und der Zusammenhang zwischen Zufriedenheit undWiederkauf (Antworttendenzen) in Abhangigkeit von personlichen Charakteristikades Fuhrparkentscheiders und von Unternehmenscharakteristika variieren. Im Ver-wendungszusammenhang ist die Identifikation inharent loyaler oder volatiler Kun-dengruppen fur Kundenwertbetrachtungen und die gezielte Bearbeitung von Wet-tbewerbskunden relevant.
Keywords
ZUFRIEDENHEIT, MODERATOREFFEKTE, KUNDENBINDUNG138
Ein verhaltenswissenschaftliches Modell zurErklarung von Kundenbindung in
Business-to-Business Geschaftsbeziehungen.
Marcel Paulssen
Wirtschaftswissenschaftliche Fakultat, Industrielles Marketing, HumboldtUniversitat zu Berlin
Abstract. Auf der Basis der sozial-psychologischen Literatur zu interpersonalenBeziehungen und insbesondere den Determinanten von Beziehungsqualitat undBeziehungsstabilitat in interpersonalen Beziehungen wird ein Erklarungsmodell furKundenbindung in Geschaftsbeziehungen entwickelt. Implizit wird dabei von derBasishypothese ausgegangen, dass in Geschaftsbeziehungen ahnliche Prozesse stat-tfinden wie in interpersonalen Beziehungen. Konstrukte aus der Beziehungspsy-chologie wie Vertrauen (Moorman et al. 1993), emotionale Nahe (z. B. Berscheid etal. 1989) sowie Fairness werden auf Geschaftsbeziehungen ubertragen und entspre-chend operationalisiert. Determinanten der intervenierenden BeziehungsvariablenVertrauen, emotionale Nahe und Fairness sind Zufriedenheiten mit den Hauptin-teraktionspunkten zwischen Kunde und Hersteller. Im Untersuchungsbeispiel wer-den das Produkt, der Verkauf, die Betreung durch Hersteller sowie der Servicebetrachtet. Das Modell wird in einer Langsschnittanalyse fur Nutzfahrzeugkundengetestet. In der ersten Welle werden Zufriedenheiten, Beziehungsvariablen und in-tendiertes Kaufverhalten gemessen. In der zweitenWelle wird tatsachliches Kaufver-halten gemessen. Berucksichtigt man den relativ langen Zeitraum zwischen den bei-den Wellen (9 Monate) und Ergebnisse zur Einstellungs-Verhaltens-Relation ausder Fishbein und Ajzen Tradition, so ist die Erklarungskraft des gewahlten verhal-tenswissenschaftlichen Modellansatzes sehr hoch. 30% der Varianz der tatsachlichenKundenloyalitat werden durch das Modell erklart.
References
BERSCHEID, E., SNYDER, M., OMOTO, A. M. (1989), Issues in studyingclose relationships: Conceptualizing and measuring closeness. In: Hendrick, C.(Hrsg.): Review of personality and social psychology (10), 63-91, Sage Publi-cations.
MOORMAN, C., ZALTMAN, G., DESPANDE, R. (1993), Factors Affecting Trustin Marketing Relationships, Journal of Marketing, 57, S. 81-101.
Keywords
KUNDENBINDUNG, VERTRAUEN, EMOTIONALE NAHE, FAIRNESS
139
Verschlagwortung und automatische Verfahrenin der Gruner + Jahr Dokumentation
Gunter Peters
Gruner + Jahr AG & Co.
Abstract. Die Dokumentation des Hamburger Verlages Gruner + Jahr AG & Co.,der zu knapp 75% zur Bertelsmann AG gehort, fuhrt seit 1972 eine Pressedatenbankzur Versorgung der verlagseigenen Redaktionen und der ZEIT mit Presseinforma-tionen. Da es bis Anfang der 90er Jahre kaum Moglichkeiten gab, die Volltextevon Presseartikeln zu speichern, bestand die G+J Pressedatenbank aus den Ver-schlagwortungen der gespeicherten Artikel inklusive einer Adressenangabe, wo derbetreffende Artikel physisch lagerte. Dies war das Papier- und Mikrofichearchiv, ab1984 Artikelfaksimiles auf Bildplatten.
Die Leistungsfahigkeit der G+J Pressedatenbank hing also jahrzehntelang vonder Qualitat der intellektuellen Verschlagwortung der gespeicherten Artikel ab.Fur diese Verschlagwortung benutzte Gruner + Jahr einen proprietaren, alphanu-merischen Thesaurus, aus dem eine Systematik zur formalen und inhaltlichen Er-schließung von Artikeln entwickelt wurde. Ab 1993 speicherte Gruner + Jahr Ar-tikelvolltexte, so dass sich die Funktion der Verschlagwortung anderte. Um End-nutzern den Zugriff auf die G+J Pressedatenbank zu ermoglichen, wurde 1997der alphanumerische Thesaurus durch einen naturlichsprachigen und reduziertenabgelost. Die Systematik wurde auf die formale und inhaltliche Erschließung vonVolltexten umgestellt.
Seit 1998 testet die Gruner + Jahr Dokumentation automatische Verfahren zurKlassifikation beziehungsweise Verschlagwortung von Volltexten. Seit 2001 setztdie G+J Dokumentation die Software DocCat (Document Categorizer) der FirmaTEMIS SA produktiv im Input der Pressedatenbank ein, mit der Verschlagwor-tungsvorschlage erzeugt werden. Die G+J-Dokumentare uberprufen in dieser hal-bautomatischen Arbeitsweise die Ergebnisse der Software.
140
Genomic Data Analysis - Evaluation ofClassification by the RPackage ipred
Andrea Peters, Torsten Hothorn, and Berthold Lausen
Institut fur Medizininformatik, Biometrie und Epidemiologie,Friedrich-Alexander Universitat Erlangen-Nurnberg,D-91054 Erlangen, Germany
Abstract. The analysis of genomic data requires a software for rapid developmentand implementation of most recent methods (Lausen, 2002). The open source andopen development software project Bioconductor (www.bioconductor.org) pro-vides access to a wide range of powerful statistical and graphical methods for theanalysis of genomic data. It facilitates the integration of biological metadata inthe analysis of experimental data and promotes high-quality documentation andreproducible research. The R package system is the main vehicle for designing andreleasing software of Bioconductor. R (www.r-project.org) is a programming en-vironment for statistical computing and graphics.
We present the package ipred (Peters et al., 2002b), implemented in R, asan appropriate tool to analyze genomic data with new supervised classificationtechniques. ipred implements a new approach of machine learning: double-bagging
(Hothorn and Lausen, 2003b,a) combines linear discriminant analysis and bootstrapaggregated classification trees. The implemented feature of indirect classification(Hand et al., 2001; Peters et al., 2002a) is a framework that combines medical apriori knowledge with statistical modeling techniques. Variables of a given data setare subdivided into three groups, those to be used predicting the class, those tobe used defining the class and the class membership variable itself. We discuss thepossibility to evaluate genomic path way models by the use of indirect classifiers.
Keywords
BIOINFORMATICS, SOFTWARE, MACHINE LEARNING, GENOMIC DA-TA ANALYSIS
141

Die Sacherschliessung an der ETH-BibliothekZurich
Jiri Pika
ETH-Bibliothek Zurich, Ramistr. 101, CH-8092, Schweiz
Abstract. Die ETH-Bibliothek erschliesst ihre Bestande klassifikatorisch nach derUDK. Sie ist mit ihrem verschlossenen Magazinbestand eine typische Hochschul-bibliothek, die nicht gut auf die Sacherschliessung verzichten kann. Den Einblickin das Dokument haben die Benutzer der ETH-Bibliothek nicht. Stattdessen dientdie Klassifikation der Dokumente mit ihren Deskriptoren als eine Entscheidung-shilfe beim Bestellen. Im vernetzten Katalog-Angebot ist die angemessene Sacher-schliessung der Dokumente von grossem Vorteil, da die Mehrzahl der Benutzer eherTendenz zu virtuellem als echtem Besuch der Bibliothek zeigt.
Gegenwartig sind vielen Hochschulbibliotheken folgende Veranderungen gemein-sam:
1. Mengen und Arten der Dokumente - nehmen zu2. Die Zahl der interdisziplinaren Arbeiten nimmt konstant zu3. Benutzerstrukturen verandern sich4. Kosten der Bibliotheken erreichen ihre Grenzen5. Informationstechniken grenzen an ihre Limiten
Welche Parameter von 1-5 konnen zugunsten der Benutzer verandert werden?Aus einer Diskussion zur Verbesserung dieser Parameter lassen sich folgende Opti-mierungsansatze fur die Systemoberflache und Katalogpflege auflisten:
Um die Benutzerschaft in der Zukunft wenigstens so gut wie heute informierenzu konnen, ist wichtig insbesondere bei der bestehenden Informationsflut und di-versifizierender Form der Infotrager:
• eine einzige Suchmaske fur alle Medien anzubieten sowie die entsprechendePflege von
• Katalogverbesserungen und Anpassungen an die gegenwartige Terminologie -und nicht zuletzt sie auf den neuesten Wissensstand zu bringen.
Die hohe Akzeptanz der Internetdienste mit ihrer strukturierten, baumartigenNavigationshilfe in Form der Verzeichnisse oder der Buchverkauf via Amazon sindvon allen nachvollziehbar. Den gleichen Zulauf konnen/sollen/mussen sich die Bib-liotheken mit ihrem sonst attraktiven Angebot sichern.
142
Volatility Forecasts and Value at RiskEvaluation
for the MSCI North America Index
Momtchil Pojarliev1 and Wolfgang Polasek2
1 INVESCO Asset ManagementBleichstrasse 60-62,D-60313 Frankfurt, Germany
2 University of Bolzen and University of BaselEconomics Department,Via Sernesi 1, 39100 Bolzano, Italy
Abstract. This paper compares different models for volatility forecasts with re-spect to the value at risk performance (VaR). The VaR measures the potential lossof a portfolio for the next period at a given significance level. We focus on the ques-tion if the choice of the appropriate volatility forecasting model is important forthe VaR estimation. We compare the forecasting performance of several volatilitymodels for the returns of the MSCI North America index. The resulting VaR esti-mators are evaluated by comparing the empirical failure rate with the forecastingperformance.
References
ENGLE, R. and KRONER, K. (1995): Multivariate Simultaneous GARCH. Econo-metric Theory, 11, 122–150.
DOCKNER E. and SCHEICHER M. (1999): Evaluating Volatility Forecasts andEmpirical Distributions in Value at Risk Models. Finanzmarkt und PortfolioManagement, 1, 39–55.
PAGAN A. and SCHWERT W. (1990): Alternative Models for Conditional StockVolatility. Journal of Econometrics, 50, 267–290.
CHRISTOFFERSEN P. (1998): Evaluating Interval Forecast. International Eco-nomic Review, 39, 841–862.
Keywords
VOLATILITY FORECASTS, EVALUATION OF VAR, CHRISTOFFERSENTESTS
143
Die DDC ubersetzen: ein Werkstattbericht
Michael Preuss
Institut fur Informationswissenschaft, Fachhochschule Koln, Fakultat furInformations- und Kommunikationswissenschaften, D-50678 Koln, Germany
Abstract. Nach mehrjahriger Vorlaufzeit ist die deutsche Ubersetzung der DDC22 in ihre produktive Phase eingetreten. Seit November 2002 arbeitet nun einvierkopfiges Team an Ubersetzung und Adaption der Dewey fur den deutschenSprachraum. Gleichermaßen als Werkstattbericht will der Vortrag uber bisherigeErfahrungen und den Fortgang der Ubersetzung (besonders bezuglich Entscheidun-gen die Begrifflichkeit der DDC betreffend) informieren. Dabei steht vor allem dieProjektorganisation im Vordergrund, die sich von der anderer Ubersetzungsvorhaben,namentlich dem franzosischen, deutlich unterscheidet. Des Weiteren, da die Ar-beit weitgehend datenbankgestutzt erfolgt, ist eine kurze Vorstellung des eigensfur dieses Projekt entwickelten Editionssystems geplant. Die verwendete XML-Datenbasis eroffnet der deutschen DDC dabei Moglichkeiten, die uber eine reinePrintverwertung weit hinausgehen (mussen). Naturlich soll der Vortrag auch einForum fur grundsatzlichere Fragen im Zusammenhang mit einer deutschen DDCbieten und zur Diskussion uber Eignung fur bzw. Widerspenstigkeit gegen eine Ver-wendung dieser oft als amerikazentriert stigmatisierten Klassifikation in deutschsprachi-gen Bibliotheken anregen.
Keywords
DEWEY DECIMAL CLASSIFICATION, TRANSLATION
144
Using the Meta-Prototype Approachto Select Time Series Models
Ricardo Prudencio, Teresa Ludermir, and Francisco de Carvalho
Center of Informatics, Federal University of PernambucoP.O.Box 7851, Cidade Universitaria, Recife-PE, Brazil, 50.732-970
Abstract. Time series prediction has been widely used to support planning anddecision making (Montgomery et al. 1990). The selection of a good model for pre-dicting a time series is a task that involves experience and knowledge. A promisingapproach to acquire knowledge for selecting time series models is using machinelearning algorithms (Prudencio and Ludermir 2002). In this approach, the modelselection is viewed as a classification problem in which the predictor attributes arefeatures of the time series, and the classes are the candidate models to predict theseries. In this work, we proposed the use of a novel machine learning algorithm, theMeta-Prototype (MP) approach (Bezerra et al. 2002) in the model selection task.This algorithm is related to Symbolic Data Analysis (Bock and Diday 2000), whichis a new domain in the area of knowledge discovery. In our work, the MP algorithmwas used in the task of selecting among two models, Simple Exponential Smooth-ing (Montgomery et al. 1990) and Time Delay Neural Networks (Lang and Hinton1988). The results of the MP algorithm were compared to the results obtained by(Prudencio and Ludermir 2002) in the same task using decision trees. Furthermore,we performed comparisions with other traditional learning algorithms. So far, theMP algorithm obtained the lowest classification error among all the tested algo-rithms, leading to a significant improvement in the selection task (around 10%).
References
BEZERRA B., DE CARVALHO, F., RAMALHO G. and ZUCKER, J-D. (2002):Speeding up Recommender Systems with Meta-Prototypes. Proceedings of theBrazilian Symposium on Artificial Intelligence, Springer-Verlag, Recife, Brazil.
BOCK, H. and DIDAY, E. (2000): Analysis of Symbolic Data. Springer, Heidelberg.LANG, K and HINTON, G. (1988): Time-Delay Neural Network Architecture for
Speech Recognition. Technical Report CMU-CS-88-152, Carnegie-Mellon Uni-versity, Pittsburgh, PA.
MONTGOMERY, D., JOHNSON, L. and GARDINER, J. (1990): Forecasting &Time Series Analysis. Mc-Graw-Hill, New York.
PRUDENCIO, R. and LUDERMIR, T. (2002): Selection of Models for Time SeriesPrediction via Meta-Learning. Proceedings of the Second International Confer-ence on Hybrid Systems, IOS Press, Santiago, Chile.
Keywords
TIME SERIES, MODEL SELECTION, SYMBOLIC DATA ANALYSIS145
An Item-Based Symbolic Approachfor Making Group Recommendations
Sergio R. de M. Queiroz1 and Francisco de A. T. de Carvalho1
Centro de Informatica - CIn / UFPE, Av. Prof. Luiz Freire, s/n - CidadeUniversitaria, CEP: 50740-540 Recife - PE, Brazil, {srmq,fatc}@cin.ufpe.br
Abstract. Group recommenders would be useful to domains where activities arecarried out in groups, like going to the movies. Existing collaborative filtering algo-rithms cannot be directly used to this end, because in a group we can potentiallyhave users with different tastes, therefore different neighbours. Two different ap-proaches can be taken to adapt collaborative filtering algorithms to tackle thisproblem: generate individual recommendations for the members of the group andcombine the results using some kind of social function; or generate an aggregateobject to represent the group and make recommendations based on this object.We present a novel technique that takes the second approach. In this technique,a symbolic object with modal attributes is generated to represent the group ofusers. Candidate items for recommendation (target items) are also represented bya symbolic object of the same kind. The similarity between the symbolic objectof the target item and the group of users is compared, and the target items aresorted by this similarity, giving the final recommendation. This is a ongoing work,we have made preliminary experimental evaluations using groups of different sizesand homogeneity degrees (like-mindness of the members). Our initial evaluationsshow satisfactory results (considering total group approval of the recommendation)for groups with medium and high homogeneity degrees. We are working to improvethe recommendation quality, especially for groups with low homogeneity degrees,where the technique has not achieved good results.
References
BOCK, H.H. and DIDAY, E. (2000): Analysis of Symbolic Data. Springer, Heidel-berg.
QUEIROZ, S.R.M., DE CARVALHO, F.A.T., RAMALHO, G.L. and CORRUBLE,V. (2002): Making Recommendations for Groups Using Collaborative Filteringand Fuzzy Majority. In: G. Bittencourt, G. L. Ramalho (Eds.): Advances inArtificial Intelligence (LNAI 2507). Springer, heidelberg, 248–258.
SARWAR, B.M., KARYPIS, G., KONSTAN, J.A. and RIEDL, J. (2001): Item-Based Collaborative Filtering Recommendation Algorithms. In: Proc. of the10th International World Wide Web Conference. Hong Kong, 285–295.
Keywords
RECOMMENDER SYSTEMS, GROUP RECOMMENDATIONS, SYMBOLICDATA ANALYSIS
146
Stratification before Discriminant Analysis:a Must?
J.-P. Rasson
Department of Mathematics, University of Namur,8, Rempart de la Vierge, B-5000 Namur, Belgium.
Abstract. It could be said as a tautology that, if we want to make a discriminantanalysis between two or more populations and if we are able to divide these pop-ulations and training sets into some homogeneous subsets, it will be more efficientto make it on each of these subsets and then to combine the results.
This can be done using one or two variables highly correlated with the one wewant to predict. Our point of view will be a bit different: we will use a classificationtree on all the available variables. We will first recall the first attempt (presented atIFCS2002 in Krakow). This one allowed us to obtain on an example of predictionof failure of the enterprises a gain of 5% of well classified data, using, after andbefore stratification, the classical Fisher’s linear discriminant rule or the logisticregression.
We intend to present (and to compare with) a new method, still a classificationtree, but with a multivariate criterion and in an agglomerative way. In the sameconditions and with the same data set, the gain is as high as 20%!
Results will obviously also be presented when the methods are applied to testsets.
Finally, we will speak about perspectives of future developments of this method-ology.
References
BREIMAN, L., FRIEDMAN, J. H., OLSHEN, R. A. and STONE, C.J. (1984):Classification and Regression Trees. Belmont, Wadsworth.
CHAVENT, M. (1997): Analyse des donnes symboliques. Une mthode divisive declassification. PhD thesis. Universit de Paris IX, Dauphine.
CELEUX, G. and LECHEVALLIER, Y. (1982): Methodes de segmentation nonparamtriques. Revue de Statistique Applique, 30(4), 39–53.
WILLIAMS, W.T. and LAMBERT, J.M. (1959): Multivariate Method in PlantEcology. Journal of Ecology, 47, 83–101.
Keywords
POISSON PROCESS, MONOTHETIC CLASSIFICATION, HIERARCHY,KERNEL DENSITY, HISTOGRAM, LINEAR DISCRIMINATION RULE,LOGISTIC REGRESSION
147
Developing New Marketing Strategies in theProduct Segment of Industrial Gas Turbines
Gerhard Willi Reiff
MTU Maintenance Berlin-Brandenburg GmbH
Abstract. MTU Maintenance Berlin-Brandenburg GmbH, based in Ludwigsfelde,Germany, offers maintenance, repair and overhaul (MRO) services for industrialgas turbines in the 3 - 40 Megawatt class. The main objective of a study whichwas conducted together withthe BTU Cottbus was to determine whether and towhat extent new and innovative marketing approaches have an influence on thecustomer’s decision process. For that purpose an extensive research process wasstarted by interviewing potential customers.
The following data analysis showed very clearly that Price and Quality are stillthe dominant key buying factors, followed by reliability in terms of compliance withcosts and time. New customer-orientated approaches such as e-maintenance (e.g.Trend Monitoring/ Remote Diagnostics via internet, on-line spare parts sale, etc.)or full plant support are of interest, but not decisive. Of most interest were thetopics outsourcing and remote diagnostics. Risk orientated / modularized overhaulservices and e-business are already used, 39% respectively 25% of all respondentsare working with these innovative tools. It remains to be seen whether these factorswill continue to gain importance in the future. We therefore recommend to furtherobserve the market with regard to new trends, especially in the above mentionedareas.
148

Dynamic Recognition of Objects : the StudyCase of Mathematical Formulae
Marcel Remon and D. Sulika Kyenda
Department of Mathematics,Namur University, B-5000 Namur, Belgiumemail : [email protected]
Abstract. Objects recognition algorithms are all based on an estimation of theunknown object. This estimation is often done by comparing the unknown objectto a list of predefined objects, the training set.Of course, this training set can only contain a finite number of objects. In someapplications, however, the number of possible objects to be recognised is very huge.The talk will present a dynamic algorithm of recognition where the training set canbe infinite. The idea is to generate elements of the training set dynamically (on thespot), when the recognition algorithm asks some comparison to be done.In the study case of mathematical formulae, the algorithm first finds in the globalformula simple entities (letters, numbers, operators), and estimates the relation be-tween these entities. Then, the algorithm searches in the infinite set of mathematicalformulae the one which is the closest, in some sense, to the unknown formula. Here,the training set is generated by LaTex.Different types of comparisons, together with different kinds of distances, are usedduring the execution of the algorithm. Examples and results will be shown.
References
LAVIROTTE, S. (2000): Reconnaissance structurelle de formules mathematiquestypographiees et manuscrites. Ph.D Thesis, Sophia-Antipolis University, Nice.
TOUMIT, J.-Y., GARCIA-SALICETTI, S. and EMPTOZ, H. (1999): A Hierarchi-cal and Recursive Model of Mathematical Expressions for Automatic Readingof Mathematical Documents. In: Proceedings of the Fifth International Confer-ence on Document Analysis and Recognition, ICDAR’99. Bengalore, INDIA,119–122.
Keywords
CHARACTER RECOGNITION, DISCRIMINANT ANALYSIS, CLASSIFI-CATION
149
Selected Methods of Credibility Theory and itsApplication to Calculating Insurance Premium
in Heterogeneous Insurance Portfolios
Wanda Ronka-Chmielowiec and Ewa Poprawska
Department of Financial Investments and InsuranceUniversity of EconomicsKomandorska 118/12053-345 WrocÃlawPoland
Abstract. In the first part of the paper the Buhlmann and Bhlmann-Straub mod-els will be reviewed. Both are useful to model portfolios of insurance polices in whichsome individual contracts or groups of contracts are characterised by non-standardclaim experience. The insurance premium for such heterogeneous portfolios (thecredibility premium) is calculated by maximum likely estimation. In the second -empirical part of the paper several examples of heterogeneous policy portfolios willbe presented and appropriate credibility premium calculated.
References
Daykin C.D., Pentikainen T., Pesonen M. (1996): Practical Risk Theory for Actu-aries, Chapman & Hall, London.
Kaas R., Goovaerts M., Dhaene J., Denuit M. (2001): Modern actuarial risk theory,Kluwer Academic Publishers, Boston.
Klugman S., Panjer H.H., Willmot G.E. (1998): Loss models: From Data to Deci-sions, John Wiley & Sons, New York.
Keywords
CREDIBILITY PREMIUM, HETEROGENEOUS POLICY PORTFOLIOS,RISK MODEL
150
Gene Selection in Microarray Experiments byBayesian Inference
Volker Roth
Institut fur Informatik III, Universitat Bonn, Romerstr. 164, D-53117 Bonn,Germany
Abstract. A central goal of the analysis of microarray data is the identification ofsmall subsets of informative genes with disease-specific expression profiles. Whenrestricting our attention to sample- (or tissue-) classification problems, we can for-malize this goal as the problem of feature selection in supervised learning. Formicroarray experiments with several thousands of genes, however, the combina-torial explosion of the space of all possible subsets of features precludes the useof greedy search strategies. This paper reports on the successful application of aBayesian inference method to the problem of selecting discriminative subsets offeatures. The method proposed implements a wrapper strategy for gene selectionby optimizing the discriminative power of a logistic classification model. The selection process can be interpreted as a special instance of the Bayesian automaticrelevance determination (ARD) principle. The most outstanding properties of thiscombined classification and selection method are: (i) excellent generalization abil-ity; (ii) probabilistic outputs, rather than only binary class labels; (iii) genericdefinition of a doubt class collecting samples with uncertain predicted label; (iv)simultaneous assessment of prediction strength and stability of gene selection un-der resampling; (v) availability of a highly efficient optimization algorithm which iscapable of dealing with large-scale real-world applications. Experiments for severalmicroarray datasets demonstrate both the outstanding classification performanceand the biological relevance of the selected genes.
Keywords
GENE EXPRESSION, MICROARRAYS, FEATURE SELECTION, AUTO-MATIC RELEVANCE DETERMINATION, LOGISTIC REGRESSION
151

Structural Model of Product Meaningusing Means-end Approach
Adam Sagan
Department of Market Analysis and Marketing Research,Cracow University of Economics, ul. Rakowicka 27, 51-510 Krakow, Poland
Abstract. The aim of paper is to model motivational and cognitive structuresbased on means-end chain framework. Applying SEM to means-end provides newanalysis to help validate of ’hard laddering’ measurement scales, model relation-ships among multiple latent predictors (bundles of product attributes) and crite-rions (consequences and values), as well as error of measurement and test a priorisubstantive assumptions against the data. This methodology introduces scales tomeans-end framework and confirmatory instead classical exploratory approach toMEC analysis like HVM, HVCM, APT, LVQ, CDA, social networks and correspon-dence and factor analysis.
152
Does the Web Dominate Web Users?A Relation Between Game Theory and Web
Mining
Marco Scarno1, Donatella Sforzini1, and Renato Coppi2
1 CASPUR, Consorzio interuniversitario Applicazioni di SuperCalcolo,Universita di Roma La Sapienza, P.le A. Moro 5, 00185 Roma, Italy
2 Dipartimento di Statistica, Probabilita e Statistiche applicateUniversita di Roma La Sapienza, P.le A. Moro 5, 00185 Roma, Italy
Abstract. Any interaction with multiple decision making agents (players) thathave different interest is called a game. Game theory studies the criteria for allthe players rational behaviour and the equilibrium conditions for them. We couldconsider that in a web relation the two players are: Users and Search Engine; we mayintroduce the hypothesis that the interest for the first one is to save time to searcha document, the interest for the engine is, instead, to provide more useful links aspossible. In this work we will synthesize (according to web mining techniques) theinformation contained in a data set coming from a web server, and we will verifywhich player wins more frequently, where the win conditions is based on the payoffsdefinitions calculated using several statistics derived from the behaviour of the usersand on the answers of the search engine. We will study the equilibrium conditionsand we will verify if our system respects them. Furthermore we will replicate theanalysis by considering several time intervals, in order to verify if players learn howto interact.
References
Nash, J.F. (1950): Equilibrium Points in n-Person Games. Proceedings of the Na-tional Academy of Sciences, 36, 48-49.
Von Neumann & J. Morgensten, (1944): Theory of Games and Economic BehaviourPrinceton: Princeton University Press, USA
Scarno M., Sforzini D., (2002): La di.usione della Conoscenza via Internet: Ac-quisizione ed elaborazione dei comportamenti degli utenti. In: F. Camillo, G.Tassinari (Eds.) Data Mining, Web Mining e CRM. FrancoAngeli, Milano,116-131.
Keywords
WEB MINING, GAME THEORY, SEARCH ENGINE
153
SVM for Credit Scoring:Extension to Non Standard Cases
Klaus B. Schebesch and Ralf Stecking
Institut fur Konjunktur- und Strukturforschung,Universitat Bremen, D-28359 Bremen, Germany
Abstract. Credit scoring is being used in order to assign credit applicants togood and bad risk classes. This paper investigates the credit scoring performanceof support vector machines (SVM). We consider the adjustment of support vec-tor machines for credit scoring to a set of non standard situations important topractitioners. Such more sophisticated credit scoring systems will adapt to vastlydifferent and changing proportions of credit worthiness in the population. Differentcosts for different types of misclassification will also be handled. Furthermore, thederivation of default probabilities will enable the determination of differentiatedcredit prices. These extensions lead to still better generalization but also to morecomplicated evaluation procedures.
References
BURGESS, C. (1998): A Tutorial on Support Vector Machines for Pattern Recog-nition. Data Mining and Knowledge Discovery, 2, 121–167.
CRISTIANINI, N. and SHAWE-TAYLOR, J. (2000): Support Vector Machines.Cambridge University Press, Cambridge.
KWOK, J.T. (1999): Moderating the Outputs of Support Vector Machine Classi-fiers. IEEE Transactions on Neural Networks, 10, 5, 1018–1031.
LIN, Y., WAHBA, G., ZHANG, H. and LEE, Y. (2002): Statistical Properties andAdaptive Tuning of Support Vector Machines. Machine Learning, 48, 115–136.
THOMAS, L.C. (2000): A survey of credit and behavioural scoring: forecastingfinancial risk of lending to consumers. International Journal of Forecasting,16, 149–172.
Keywords
CREDIT SCORING, SUPPORT VECTORMACHINES, NON STANDARDCASE, DEFAULT PROBABILITIES
154
Comparison of Semi- and NonparametricMethods for the Analysis of Longitudinal Data
Tania Schink and Klaus-Dieter Wernecke
Institut fur Medizinische Biometrie,Universitats-Klinikum Charite, Campus Virchow-Klinikum, D-13344 Berlin,Germany
Abstract. There are often longitudinal data in clinical research, where paramet-ric methods cannot be used because of categorical response and/or small samplesizes. Koch [1979] generalized the nonparametric tests of Friedman, Wilcoxon andKruskal-Wallis for split-plot-designs. A semiparametric method, based on weightedleast squares estimations, for the analysis of categorical data was described in Koch[1977].
Recently, marginal models, basing on only trivial assumptions, have been devel-oped. They are valid for arbitrary, possibly non-continuous distribution functionsand can handle ties, missing values and singular covariance matrices. [Brunner etal. 2002].
These different semi- and nonparametric methods are compared in distinct situ-ations. Simulated type-I errors and rejection probabilities are calculated for differentcovariance patterns (independence, compound symmetry, first order autoregressiveprocess). Moreover the behaviour of the methods in critical situations (e.g. manytime points, missing values and cells, ties) and in presence of very small samplesizes is investigated by simulations.
References
BRUNNER E., DOMHOF S. and LANGER F. (2002): Nonparametric Analysis ofLongitudinal Data in Factorial Experiments. Wiley, New York.
KOCH G.G. (1970): The use of non-parametric methods in the statistical analysisof a complex split plot experiment. Biometrics, 26, 105-128.
KOCH G.G., LANDIS J.R., FREEMAN J.L. FREEMAN D.H., LEHNEN R.G.(1977): A general Methodology for the Analysis of Experiments with RepeatedMeasurement of Categorical Data. Biometrics, 33, 577-584.
Keywords
LONGITUDINAL DATA, NONPARAMETRIC, SEMIPARAMETRIC, SIM-ULATION
155
Discovery of Risk-Return Efficient Structuresin Middle-Market Credit Portfolios
Frank Schlottmann and Detlef Seese
Institut AIFB, Fakultat fur Wirtschaftswissenschaften, Universitat Karlsruhe(TH), D-76128 Karlsruhe, Germany
Abstract. The management of portfolio credit risk has recently attracted manyresearch activities both in academic and financial institutions. This is caused bythe fact that there has been a steadily increasing number of bankruptcies in manycountries due to economic downturn. Moreover, there has been an intensive de-velopment of new methods for portfolio credit risk management, and the bankingsupervision authorities have recently announced new supervisory rules which leadto new constraints for investors that hold credit exposures in their portfolios.
In this setting, the discovery of risk-return efficient credit portfolio structureswith respect to constraints is essential for many financial institutions, particularlyfor investors holding middle-market portfolios. We propose a hybrid approach thatcombines Multi-Objective Evolutionary Algorithms and quantitative methods ofportfolio credit risk management to support this task. It includes the search forPareto-optimal credit portfolio structures concerning the net expected return anda nonlinear, nonconvex downside risk measure in a discrete, constrained searchspace. The output from the hybrid algorithm can e.g. be used to decide abouthedging of single exposures using credit derivatives or about a securitisation ofselected exposures in an asset-backed transaction.
We present results from an empirical evaluation of the hybrid algorithm usingreal-world middle-market portfolios that were supplied by a German bank. Theseempirical results indicate that the hybrid method computes feasible, efficient creditportfolio structures within reasonable time on a PC. For the smallest credit portfolioin the study, we verify the quality of the discovered solutions by a complete enu-meration of the search space. Moreover, by comparing the empirical results of thehybrid method to the results of a pure Multi-Objective Evolutionary Algorithm itturns out that the hybrid approach has a higher convergence speed towards feasiblerisk-return efficient solutions.
References
OSYCZKA, A. (2002): Evolutionary Algorithms for single and multicriteria designoptimization. Physica-Verlag, Heidelberg.
Keywords
CREDIT RISK, RISK-RETURN EFFICIENT PORTFOLIOS, MIDDLEMAR-KET PORTFOLIOS, HYBRIDMULTI-OBJECTIVE EVOLUTIONARY AL-GORITHM
156
Understanding the Classification of Tumorswith a Support Vector Machine
Falk Schubert, Jasmin Muller, and Roland Eils
Intelligent Bioinformatics Systems,German Cancer Research Center, INF 280, D-69120 Heidelberg, Germany
Abstract. State-of-the-art machine learning techniques for the classification ofmolecular genetic data are support-vector-machines and artifical neural networks.However, little has been done to provide a plausible explanation scheme for theuser of an established classifier. Such an explanation scheme is indispensible formost clinical applications. So we considered the question ‘How can the outcome ofa classification algorithm be explained to physicians and other clinical users?’
Subsequently, we developed a new explanation scheme which is based on a few,reliable features for each classified case. These features were identified by local linearapproximation of the classifier’s complex decision function, local feature rankingand local feature selection.
Our approach was successfully tested on a support vector machine classifier forgenomic profiles of dedifferentiated and pleomorphic liposarcoma. The explanationsare clearly consistent with the importance of aberrations on chromosome 12q forthe classified tumor probes (Fritz et al. (2002)).
We are confident that our explanation component will have significant impact onthe decision-making ability of health-care providers and enhance the reliability andactionability of clinical classification outcomes in decision support systems basedon molecular biological data.
References
FRITZ, B., SCHUBERT, F., WROBEL, G., SCHWAENEN, C., WESSENDORF,S., NESSLING, M., KORZ, C., RIEKER, RJ., MONTGOMERY, K.,KUCHERLAPATI, R., MECHTERSHEIMER, G., EILS, R., JOOS, S.,LICHTER, P. (2002): Microarray based Copy Number and Expression Profilingin Dedifferentiated and Pleomorphic Liposarcoma. Cancer Res., 62, 2993–2998
Keywords
SUPPORT VECTOR MACHINES, EXPLANATION COMPONENT, DI-AGNOSTICS, DECISION SUPPORT
157
An Exchange Algorithm forTwo-mode Cluster Analysis
Manfred Schwaiger1 and Raimund Rix2
1 Institut of Corporate Development and Organization,Munich School of ManagementLudwig-Maximilians-University, D-80539 Munich, Germany
2 Accenture GmbH,Strategy and Business Architekture, D-80539 Munich, Germany
Abstract. A comprehensive simulation study recently has shown that, in orderto identify best two-mode classifications, the user may apply different algorithmsand select the result yielding the lowest squared centroid distance measurement(SCD). Knowing the outperformer among several goodness-of-fit measures createsthe premises to develop an exchange algorithm for two-mode classifications.
This paper will present the algorithm and discuss, how significant gain in pre-cision turned out to be in a large Monte-Carlo-Simulation study.
References
HUBERT, L. and ARABIE, P. (1985): Comparing Partitions. Journal of Classifi-cation, 2, 193–218.
RAND, W.M. (1971): Objective Criteria for the Evaluation of Clustering Methods.Journal of the American Statistical Association, 66, 846–850.
RIX, R. (2002): Zweimodale hierarchische Clusteranalyse. Bewertung der Verfahrenund Gutemasse. Diss., Universitat Munchen.
UNTERREITMEIER, A. and SCHWAIGER, M. (2002): Goodness of Fit Measuresfor Two-Mode Cluster Analyses, in: W. Gaul and G. Ritter (Eds.): Classifica-tion, Automation, and New Media, Proceedings of the 24th Annual Conferenceof the ’Gesellschaft fur Klassifikation e.V’, Springer, Berlin, 401–408
Keywords
TWO-MODE CLASSIFICATION, EXCHANGE ALGORITHM, SIMULA-TION
158
Graphical Presentation of MultidimensionalData
PaweÃl Siarka
Wroclaw University of Economics
Abstract. Researchers, who analyse multivariate data, often ponder about thepossibility of its visualization. Due to limited human perception, the graphicalvisualization is achieved by reduction of dimensionality from m to 2. Then it ispossible to present the data in two dimensional space. Unfortunately some infor-mation is lost from the original data due to this action, even the very important tothe researcher. Depending on a particular method, different pieces of informationare lost, therefore the method should be chosen according to the character of theproblem the researcher is working on.The method I’ve proposed is particularly useful when the researcher wants to an-swer the question whether the set of the multivariate objects is homogeneous ornot, that means whether it forms one dense cloud of points or not. This is a veryimportant issue, because with the lack of homogeneousity, estimating the param-eters, such as average, loses sense, and what’s more, the further conclusions areincorrect.The above mentioned method allows presented multivariate data graphically, in thecontext of the researching the homogeneousity of data. Its most important featureis that it doesn’t require data’s standarisation which is usually followed by somechanges in data. Considered method is presented using the well-known methodcalled ”principal components” as a backdrop. Comparison of the results of thesetwo methods, and its application in banking, is described in detail in the article.
References
[1] Hair J. F., Anderson R. E.,Multivariate data analysis, Prentice-Hall, New Jersey1998,
[2] Jajuga K., Statystyczna teoria rozpoznawania obrazow, PWN, Warszawa 1990,[3] Johnson R. A. , Wichern D.W., Applied Multivariate Statistical Analysis,
Prentice-Hall, New Jersey 1998.
Keywords
MULTIVARIATE DATA, HOMOGENEOUSITY, REDUCTION OF DIMEN-SIONALITY
159
Model-based Cluster AnalysisApplied to Flow Cytometry Data
Ute Simon1, Hans–Joachim Mucha2, and Rainer Bruggemann2
1 Institut fur Gewasserokologie und Binnenfischerei,D-12587 Berlin, Germany
2 Weierstraß-Institut fur Angewandte Analysis und Stochastik (WIAS),D-10117 Berlin, Germany
Abstract. Monitoring of phytoplankton by microscope is very time- and work-consuming. Flow cytometry provides the opportunity to investigate algae commu-nities in a semiautomatic way. Two different kinds of information are obtained:the number of cells (here algae) per unit of sample-volume and characteristics ofeach cell according to its composition of photosynthetic pigments. To identify thedifferent pigment-groups and to count the number of organisms belonging to eachgroup usually gates are put manually. Anyway in a multidimensional space thisprocedure might be difficult and is time-consuming too. Thus, to use the techniqueoff low cytometry as a routine in phytoplankton monitoring, the evaluation of thedata has to be done automatically by suitable mathematic tools like cluster anal-ysis. For comparable analysis between samples of different freshwater systems andof different seasons of the year it is also convenient to describe each pigment-groupas a gaussian-function. Some cluster analysis results will be discussed.
References
FRALEY, C. (1996): Algorithms for model-based Gaussian Hierarchical Clustering.Technical Report, 311. Department of Statistics, University of Washington,Seattle.
MUCHA, H.–J. (1992): Clusteranalyse mit Mikrocomputern. Akademie Verlag,Berlin.
Keywords
MODEL-BASED CLUSTERING, DATA ANALYSIS; APPLICATION INECOLOGY
160
On Stratification Using Auxiliary Variablesand Discriminant Method
Marcin Skibicki
Department of Statistics,University of Economics, ul. Bogucicka 14, 40-226 Katowice, Poland
Abstract. The paper concerns the problem of mean estimation from a stratifiedsample and population stratification. Let us assume that we have a preliminarysample and auxiliary variables observed in the whole population. Then we candivide this sample into starta using some clastering method e.g. k-means. Next wecan apply a discriminant method to obtain stratification of the other part of thepopulation on the basis of auxiliary variables.
References
Hartigan, J.A. (1975): Clustering Algorithms. John Wiley, New York.Huberty, C. J. (1994): Applied discriminant analysis. Wiley and Sons, New York.Sarndal, C.A., Swensson, B. and Wretman J. (1992): Model Assisted Survey Sam-
pling. Springer-Verlag, New York.Wywial, J. (2002): On Stratification of Population on the Basis of Auxiliary Variable
and the Selected Sample. Acta Universitatis Lodziensis, Folia Oeconomica 156,83–90.
Keywords
STRATIFIED SAMPLE, STRATIFICATION, CLUSTERING ALGORITHM,DISCRIMINANT METHOD
161
The Concept Of Chains as a Toolfor MSA Contributing
to the International Market Segmentation
Elzbieta Sobczak
WrocÃlaw University of Economics,Komandorska 118/120, 53-345 WrocÃlaw, Poland
Abstract. New tendencies in international market segmentation methodology leadtowards joining similar market segments, functioning in different countries, into oneinternational segment, defined as an inter-market one. The paper presents sugges-tions of applying multivariate statistical analysis methods for identifying interna-tional segments. The basis of this segmentation is made up of the concept of means-end chains, which assumes that products’ attributes become for the consumer themeans, which enable obtaining set objectives: i.e. consequences and personal values.Configurations of bonds between the attributes, consequences and values called thehierarchical cognitive structure of the product, diversify consumers and due to this,can become the criteria of their segmentation.
References
CLAEYS, C., SWINNEN, A. and ABEELE, P. V. (1995): Consumer’s Means-EndChains for ,,Think” and ,,Feel” Products. International Journal of Research inMarketing, 12, 193–208.
GUTMAN, J. (1982): A Means-End Chain Model Based on Consumer Categoriza-tion Processes, Journal of Marketing, 46 (Spring), 60–72.
JAJUGA, K. (1993): Statystyczna analiza wielowymiarowa [Multivariate StatisticalAnalysis], PWN, Warszawa.
NEWELL, A. and SIMON, H.A. (1972): Human Problem Solving. Englewood Cliffs,Prentice Hall.
REYNOLDS, T.J., GENGLER, CH.E. and HOWARD, D.J. (1995): A Means-EndAnalysis of Brand Persuasion Through Advertising, International Journal ofResearch in Marketing”, 12, 257–266.
SOKAL, R.R. and SNEATH, P.H.A. (1963): Principles of Numerical Taxonomy.Freeman, San Francisco.
HOFSTEDE, F., AUDENAERT, A., STEENKAMP, J.-B.E.M. and WEDEL, M.(1998): An Investigation into the Association Pattern Technique as a Quan-titative Approach to Measuring Means-End Chains, International Journal ofResearch in Marketing, 115, 37–50.
Keywords
INTERNATIONALMARKET SEGMENTATION, THE CONCEPT OFMEANS-END CHAINS, MULTIVARIATE STATISTICAL
162

Mode Estimation
Andrzej Sokolowski
Cracow University of Economics Rakowicka 27, Krakow, [email protected]
Abstract. Mode value seems to be a very natural measure of central tendencybecause it says what is the most probable value of a given variable. The word”mode” was first used by K. Pearson in 1895, though the measure itself had beenused long before that date. The estimation of the mode, even for the simplestunidimensional case, is presented in many textbooks with just one formula and onegraph. However, it is not widely known that the mode can be estimated withoutthe formation of structural series from detailed data. In the paper the definition ofthe mode, the concept of unimodality and estimation methods are being discussed.For the cluster analysis problems the multidimensional mode and multidimensionalunimodality is one of the possible models for homogeneity. There are two generalstrategies for the mode estimation. With the indirect approach, a probability densityfunction is estimated first, and its maximum defines the mode. The direct approachseeks the most ”popular” value using various ideas - fixed intervals, fixed orderedsub-sumples or iterative procedures. These methods are discussed and compared inthis paper.
163

Klassifikation von Anforderungen anKrankenhauser im Rahmen der
DRG-Einfuhrung
Torsten Sommer1 und Werner Esswein2
1 Lehrstuhl fur Wirtschaftsinformatik, insb. Systementwicklung,Technische Universitat Dresden, D-01062 Dresden
2 Lehrstuhl fur Wirtschaftsinformatik, insb. Systementwicklung,Technische Universitat Dresden, D-01062 Dresden
Abstract. In zunehmend deregulierten Markten befinden sich die Unternehmen imSpannungsfeld zwischen erforderlicher Agilitat, um adaquat auf Umweltveranderungenreagieren zu knnen und einem strikten Kostenmanagement. Dies gilt insbesonderefur die deutschen Krankenhauser, die auf ihre Einnahmen nur mittelbaren Ein-flußhaben und bei denen ab 2004 die Vergutung auf der Basis von Fallpauschalen(Diagnosis Related Groups, DRG) erfolgt. Zudem besteht ein steter Druck seit-ens der Kostentrager, da auf den Krankenhaussektor etwa 35% der Gesamtaus-gaben des deutschen Gesundheitswesens entfallen. Die Krankenhauser stehen somitvor der Aufgabe, ihre internen Strukturen und Ablaufe zu reorganisieren. Furdie Beurteilung der Reorganisationsprojekte auf theoretischer Ebene ist jedochzunachst ein Kriterienkatalog erforderlich, der sich an den Anforderungen orien-tiert, vor denen die Krankenhauser stehen. Gegenstand des Artikels soll es sein, dieAnforderungen an Krankenhauser im Rahmen der DRG-Einfuhrung systematischzu erheben und zu klassifizieren. Damit stellt er eine Moglichkeit dar zu beurteilen,inwieweit Reorganisationsmaßnahmen Auswirkungen auf bestimmte Anforderungs-bereiche haben (etwa interne Organisation oder Personal), oder Anforderungen wiez. B. an die Faktoren Mitarbeiterzufriedenheit oder Verweildauerverkurzung zuerfullen in der Lage sind.
References
BRAUN VON REINERSDORF, A. (2002): Strategische Krankenhausfuhrung: vomLean Management zum Balanced Hospital. Hans Huber, Bern et al.
DIEFFENBACH, S.; LANDENBERGER, M.; WEIDEN, Guido von der (Hrsg.)(2002): Kooperation in der Gesundheitsversorgung: das Projekt “VerKet” -praxisorientierte regionale Versorgungsketten. Luchterhand, Neuwied et al.
Schlusselworter
KRANKENHAUS, ANFOREDERUNGEN, DIAGNOSIS RELATEDGROUPS(DRG)
164
Analyse der Beweggrunde fur dieHochschulbildung
Agnieszka Stanimir
Lehrstuhl fur OkonometrieOskar Lange Wirtschaftsuniversitat, WrocÃlaw, Polen
Abstract. Das Referat enthalt die Ergebnisse der Analyse der Studentenmotiva-tionen bei der Auswahl des weiteren Bildungsweges. In den letzten paar Jahrenist in Polen die Anzahl der Wirtschaftshochschulen stark gestiegen. Man muss je-doch darauf hinweisen, dass die Anzahl der staatlichen Hochschulen im Vergleichzu den privaten sich kaum geandert hat. Die Daten fur diese Analyse wurden mitHilfe eines Fragebogens gesammelt, der von Studenten ausgefullt worden ist. Bei derUmfrage haben 177 Studenten der privaten und 804 Studenten der staatlichen Fern-studien teilgenommen. Dank dieser Analyse konnte man die Motive ermitteln, diezur Auswahl bestimmter Hochschulen gefuhrt hatten. Auch die Informationsquellenuber die Bildungsgebiete sowie die beruflichen Karrierenchancen der Studenten derprivaten und staatlichen Hochschulen konnte man auf Grund dieser Analyse vergle-ichen. Die durchgefuhrte Analyse unterstutzt die Erstellung der Studienangebote,die an die zukunftigen Studenten gerichtet sind. Diese Forschung zeigt die Brauch-barkeit der Korrespondenzanalyse in der Marketingforschung. Die Darstellung vonZusammenhangen zwischen den variablen Varianten wurde mit Hilfe von Multivari-aten Korrespondenzanalysen ermoglicht.
References
BACKHAUS K., ERICHSON B., PLINKE W., SCHUCHARD-FICHER Chr.,WEIBER R. (1989): Multivariate Analysenmethoden. Springer-Verlag, Berlin.
GREENACRE, M. (1993): Correspondence Analysis in Practice. Academic Press,London.
Keywords
MARKETINGFORSCHUNG, KORRESPONDENZANALYSE
165
The Mutual Information as a Measure ofDistance between Variables
R. Steuer1, C. O. Daub2, J. Selbig2 and J. Kurths1
1 University Potsdam, Nonlinear Dynamics Group, Am Neuen Palais 10,D-14469 Potsdam, Germany
2 Max-Planck Institute for Molecular Plant Physiology, Am Muhlenberg 1,D-14476 Golm, Germany
Abstract. The clustering of co-expressed genes requires the definition of ’distance’or ’similarity’ between measured datasets. Among the most common choices arePearson correlation and Euclidean distance. However, it is widely recognized thatthe choice of the distance measure may be as crucial as the choice of the clusteringalgorithm itself. One alternative, based on information theory, is mutual informa-tion, which provides a general measure of dependencies between variables.In this work, we describe and review several aspects of mutual information as ameasure of distance between variables. Starting with a brief review of informationtheory, we provide two approaches leading to the definition of mutual information.The next part is devoted to an overview over various algorithms to estimate themutual information from finite datasets, ranging from simple partition-based esti-mation to more complex iterative schemes. Subsequently, we discuss some generalaspects, such as recent improvements of algorithms, higher-order dependencies andthe relation of mutual information to other measures.In the last part, we focus on the application of these concepts in the analysis oflarge-scale gene expression data. Our findings show that the algorithms used so farmay be quite substantially improved upon. In particular when dealing with smalldatasets, finite sample effects and other potential pitfalls have to be taken intoaccount.
References
STEUER, R., KURTHS, J., DAUB, C. O., and SELBIG J. (2002): The mutualinformation: Detecting and evaluating dependencies between variables.Bioinformatics, 18 (Suppl. 2), S231–S240
EBELING, W., STEUER, R., and TITCHENER, M. R. (2001): Partition-basedentropies of deterministic and stochastic maps. Stochastics and Dynamics, 1(1), 45–61.
D’HAESELEER, P., LIANG S., and SOMOGYI, R. (2000): Genetic network infer-ence: from co-expression clustering to reverse engineering. Bioinformatics, 16,707–726.
Keywords
MUTUAL INFORMATION, DISTANCEMEASURES, EXPRESSION DATA166
Information Retrieval As A Tool ForNon-Substantial Paper Evaluation
Jakub Swacha and Marek Mikolajczyk
Jakub.Swacha @uoo.univ.szczecin.pl, [email protected],University of Szczecin, Ul. Mickiewicza 64, 71-101 Szczecin, Poland
Abstract. The quality of scientific papers, as perceived by a reader, may decreasefrom serious short-comings such as obsolete data, incomprehensible language, orlack of reliable references. Knowledge of the most frequent mistakes is an essentialfactor in order to find ways for quality improvement. We believe that these short-comings may be discovered using methods of information retrieval. In our paper wepropose a set of criteria to construct an aggregated measure for paper quality. Itis important for us to choose criteria which are not only irrelevant but can also beverified against easily extractable information.As an application of our concept, we have conducted research on quality of mas-ter’s theses produced by graduates of University of Szczecin in years 2000-2001.We present interesting results obtained using statistical analysis of retrieved data.These results compose a valuable source of information for both professors andstudents, which purpose is to stimulate improvement of the quality of the master’stheses in the near future.Conclusion is that by employing methods of information retrieval for paper eval-uation it is possible to learn something about paper quality both in general andregarding specific issues. Proved in case of the master’s theses, it can also be ap-plied into a wider area of scientific papers, and even other publications, of courseprovided the set of used criteria is reconstructed.
References
VAN RIJSBERGEN, C. J. (1979) : Information Retrieval. Butterworths, London.GAIZAUSKAS, R., AND WILKS, Y. (1998): Information Extraction: Beyond Doc-
ument Retrieval. Computational Linguistics and Chinese Language Processingvol. 3, no. 2, pp. 17-60.
MONTES-Y-GOMES, M., GELBUKH, A., LOPEZ-LOPEZ, A. (1999): DocumentTitle Patterns in Information Retrieval. Proc. of the Workshop on Text, Speechand Dialogue TDS’99.
BROWN, E. (1995): Execution Performance Issues in Full-Text Information Re-trieval. Technical Report 95-81. Computer Science Department, University ofMassachusetts at Amherst.
MOFFAT, A., ZOBEL, J., SACKS-DAVIS, R.(2002): Memory Efficient Ranking.Information Processing and Management.
Keywords
PAPER QUALITY, INFORMATION RETRIEVAL, COMPUTER PAPEREVALUATION
167

Statistical Analysis of Innovative Activity
Marek Szajt
Katedra Ekonometrii i StatystykiWydziaÃl ZarzadzaniaPolitechnika [email protected]
Abstract. Composition refers, more and more often moved of theme - of innova-tive activity. Statistical analysis relating formations of innovation effected acrossresearch of number of patents and of factors formative activity searchingly - ofdevelopment delivers of very important information. In researches became used oflineal discrimination function and one executed of prognosiss with utilisation ofspatial analogy. Received informations can become used in innovative policies ofstate. They can also to help in estimation of activity given states in creation ofinnovative society.
Keywords
INNOVATION, PATENTS, SPATIAL ANALYSIS
168
Approximation of Distributions of TreasuryYields and Interbank Rates by Means ofα-stable and Hyperbolic Distributions
Witold Szczepaniak
Department of Financial Investments and Insurance,Wroclaw University of Economics,Komandorska 118/120,53-342 Wroclaw,Poland
Abstract. The preliminary analysis of distributions of treasury yields and inter-bank rates such as LIBOR or EURIBOR shows, that they have heavier tails than,the normal distribution—this fact is believed to be important in term structuremodeling, because it implicates that Brownian motion used in the term structuremodels should be replaced with Levy processes, which generate values, whose dis-tribution has heavy tails.
The aim of this paper is to give detailed analysis of distributions of treasuryyields and interbank rates and to propose the use of α-stable and hyperbolic dis-tributions to describe those phenomena.
References
ADLER, R., FELDMAN, R. and TAQQU, M.S. (1998): A practical guide to heavytails. Birkhauser, Boston.
BARNDORFF-NIELSEN, O. E. (1977): Exponentially decreasing distributions forthe logarithm of practicle size. Proceedings of the Royal Society, A 353, 401–419
EBERLEIN, E. and KELLER, U. (1995): Hyperbolic distributions in finance.Bernoulli, 1, 281–299.
NOLAN, J. P. (2002): Stable distributions, models for heavy-tailed data.http://academic2.american.edu/ jpnolan.
ZOLOTAREV, V. M. (1986): One-dimensional stable distributions. Translations ofMathematical Monographs of American Mathematical Society, vol. 65, Provi-dence.
Keywords
TREASURY YIELDS DISTRIBUTIONS, INTERBANK RATES DISTRI-BUTIONS, STABLE DISTRIBUTIONS, HYPERBOLIC DISTRIBUTIONS
169
Comparing Socio-Economic Structures ofEuroregions Located on Polish Boarders
Jan J. Szeja
Cracow University of EconomicsDepartment of StatisticsUl. Rakowicka 2731-510 KrakowPoland
Abstract. Since 1989 Poland have been actively involved in international economiccooperation on regional level. During the first pioneer years of the 90’s partnershave been looking for the new forms of cooperation, established official contacts onregional and governmental level and build legal base ofr future development. ”Eu-roregion” is the special kind of transboarder regions. It involves free cooperationof adminitrative units from both sides of the borader (cities, counties, provinces).The cooperation is based on European Chart for Regional Selfgovernment. Thereare 15 euroregions located along Polish boarders.Clustering methods are used in the paper to investigate the homogeneity of regions,theirs history and ways of development Statistical variables taken into account de-scribe population structure, demographic changes, industrial production and char-acteristics of agriculture sector. Special attention in analyses has been paid to ho-mogeneity of structures. Statistical data covers two periods: 1995 and 2000, whatmakes possible to evaluate changes in levels and homogeneity of euroregions.
Keywords
CLUSTERING, ECONOMICS, REGIONAL SCIENCES
170
Generalised Distance Measureas a Method of Classification of the Companies
Listed on the Warsaw Stock Exchangefor Portfolio Analysis –Attempt of Evaluation
Waldemar Tarczynski and MaÃlgorzata ÃLuniewska
Szczecin University,Al. Jednosci Narodowej 22a, 70-453 Szczecin, Poland
Abstract. There are three big groups of methods within the analysis methodsapplied to the capital market: technical analysis, fundamental analysis and portfolioanalysis. Among those methods it is solely the portfolio analysis that allows acombine analysis of all the stock leading thus to the diversification of the investmentrisk. The problem that arises during those analyses is related to the companiesconstituting the construction base of the portfolio of securities. In the paper anattempt has been made to evaluate the usefulness of the Generalised DistanceMeasure, proposed by M.Walesiak, in the construction of the base of companies forportfolio analysis in comparison to the synthetic development measure TMAI andNo-Pattern Method. The results of linear ranging of the companies according toGDM have been evaluated in relation to the synthetic development measure TMAIand No-Pattern Method. The research was carried out for the companies listed onthe Warsaw Stock Exchange in the period 2001-2002.
References
WALESIAK, M. (2002): Uogolniona miara odlegÃlosci w statystycznej anal-izie wielowymiarowej. Wydawnictwo Akademii Ekonomicznej we WrocÃlawiu,WrocÃlaw.
171
Assessing Measurement Invariance UsingConfirmatory Factor Models for Finite Normal
Mixtures
Dirk Temme
Institut fur Marketing,Humboldt-Universitat zu Berlin, D-10178 Berlin, Germany
Abstract. Meaningful comparisons between different groups (e.g., cultures, cus-tomer segments) based on multiple measures of theoretical constructs (e.g., at-titudes, values) require that the measures are invariant across groups. The mostwidely used approach to assess measurement invariance is multi-group confirmatoryfactor analysis (e.g., Steenkamp & Baumgartner 1998). Given an a priori group-ing of the data (observed heterogeneity) a sequence of increasingly more restrictivemodels allows to test for invariant factor structures (configural invariance), factorloadings (metric invariance), and item intercepts (scalar invariance) across groups.Although it seems obvious to apply the same testing procedure in situations wherethe samples are supposed to consist of several latent groups (unobserved hetero-geneity), specific problems arise which require a modification of this approach.
In the context of finite mixture confirmatory factor analysis (CFA), basicallytwo different types of factor models exist. Since in the Shifting Means Model (SMM)the means remain unstructured, scalar invariance can only be tested by estimatingthe Common Regression model (CRM). Unlike the SMM, the CRM, however, isonly weakly identified. Simulation results reveal serious problems in estimating thetrue number of groups and in parameter recovery but show otherwise that a fewinvariant items greatly alleviate these problems (Lubke, Muthen & Larsen 2002).
This paper describes (1) findings of an extended simulation study, (2) proposes aprocedure to test for measurement invariance in finite mixture CFA and (3) presentsresults of an empirical application to large-scale consumer survey data.
References
STEENKAMP, J.B. and BAUMGARTNER, H. (1998): Assessing MeasurementInvariance in Cross-National Consumer Research. Journal of Consumer Re-search, 25, 78–90.
LUBKE, G., MUTHEN, B. and LARSEN, K. (2002): Global and Local Identifia-bility of Factor Mixture Models. Working Paper No. 94, UCLA, Los Angeles.
Keywords
MEASUREMENT INVARIANCE, CONFIRMATORY FACTOR MODELS,FINITE NORMAL MIXTURES
172

The Prospects of Electronic Commerce: TheCase of the Food Industry
Ludwig Theuvsen
Institute of Agricultural Economics, Georg-August-University Gottingen, Platzder Gottinger Sieben 5, 37073 Gottingen
Abstract. Is it possible to sell food to consumers via the Internet? Can foodmanufacturers establish successful, i.e. profitable, business-to-consumer electroniccommerce activities? The paper analyzes these questions by combining ideas takenfrom the marketing and the strategic management literature. In particular, theresource-based view, the stimulus-organism-response model, and Porter’s genericstrategies framework are combined to argue that sustainable competitive advantagein electronic commerce in the food industry depends on three conditions:
1. Rareness: Only manufacturers whose products are not available in a super-market just around the corner have the chance of successfully establishing abusiness-to-consumer electronic commerce business. This condition is often ful-filled by manufacturers of regional products or specialities.
2. Activation: Buying food via the Internet is comparatively expensive and compli-cated. Consumers have to find suitable manufacturers, pay high transportationcosts, wait several days for delivery, organize the arrival of goods, and so on.Thus, consumers will only buy food via the Internet if they become mentally ac-tivated by something special about the products offered on the web. The paperanalyzes in detail which product features might be able to activate consumers.It is argued that products that signal the belonging to a certain social group,represent attractive lifestyles, have become a hobby for consumers, or remindconsumers of outstanding situations in their life have the chance to motivateconsumers to overcome the obstacles of electronic commerce.
3. Differentiation: The Internet is characterized by the economics of attention.Furthermore, traditional hard and soft discounters have the cost leadershipposition in food retailing. Thus, selling food via the Internet demands a dif-ferentiation strategy that distinguishes the products on sale from competingproducts.
The paper analyzes these aspects in detail and comes up with a model that deter-mines the success factors of food manufacturers on the Internet. The paper closeswith a discussion in how far the ideas developed for the food industry might alsobe applicable to other industries.
173
Principles of Biological Information Processing
Naftali Tishby
Institute of Computer Science and Center for Neural Computing, The HebrewUniversity, Jerusalem, Israel
Abstract. One of the most fundamental theoretical achievements of the twenti-eth century is Shannon’s Information Theory. Shannon’s theory established thequantitative framework for digital representation of information and provided sur-prisingly general bounds on possible point-to-point communication with essentiallyno assumptions on its physical realization. Yet, despite fifty years of efforts, infor-mation theory has failed to yield such a useful framework for analyzing informationprocessing in more general contexts than its original ”source-channel-receiver” en-gineering setup. There are interesting and deep reasons for this failure, such as thealmost complete absence of the notions of ”time” and ”computation” in the the-ory which is essentially asymptotic and stationary. One of those difficulties is thefundamental separation between source coding (compression) and channel coding(error correction) in Shannon’s theory, a separation that does not seem to gener-alize beyond the very simple setup. Shannon himself was well aware of the dualnature of the optimization problems of source and channel coding and hinted thatthis duality may reflect the notion of time and that the two problems should havea deeper unified formulation.
In this talk I will discuss one possible unification of source coding (Rate Distor-tion Theory) and channel coding (Capacity-Cost tradeoff) in a way which eliminatesthe arbitrary nature of both the distortion and cost functions. This formulation isbased on the tradeoff between simple description (compression) and accuracy (pre-diction), using Shannon’s measures of mutual information. This tradeoff is at theheart of computational learning theory and in fact is the essence of science. Inthis formulation it relies solely on the joint statistics of two (or more) variablesand purely reflects the deeper structure that links these variables. Our theoreticalframework, called the ”Information Bottleneck”, can also be stated as a coding the-orem that combines source and channel coding back-to-back in perfect matching.Such matching of source and channel, obtained via mutual adaptation of the repre-sentation, eliminates the need for sophisticated coding schemes in many cases andthus fits the constraints that exist in biological information processing. This frame-work can be naturally generalized to a network of multiple sources and receiversand it can quantify general information processing in networks. It also suggests newalgorithms for data representation that generalize different learning theoretic prob-lems. I will demonstrate the application of this principle for dimension reductionand data quantization in biological contexts.
174
From Database to the Analysis of Genomeprofile: the Case of Myc
Alessia Trucchia1, Donatella Sforzini1, and Sergio Nasi2
1 CASPUR, Consorzio interuniversitario Applicazioni di SuperCalcolo, Universitadi Roma La Sapienza, P.le A. Moro 5, 00185 Roma, Italy
2 Istituto di Biologia e Patologia Molecolari CNR, Universita di Roma LaSapienza, P.le A. Moro 5, 00185 Roma, Italy
Abstract. The rapid technological development in microarray and proteomic anal-ysis allows the monitoring of expression levels for thousand of genes and of the globalpro.le of the proteins in exam. A lot of statistical methods have been proposed toanalyze the large volume of information available about this .eld. In particular wefocus our analysis on Myc gene, because alterations in its activity are common ina wide range of human tumours. Myc induces diverse biological activities such ascell proliferation, cell growth, apoptosis, inhibition of di.erentiation and tumorige-nesis. E.ects of Myc may be manifested not only at the transcriptional level, butalso through alterations in the types and levels of speci.c proteins. We plane tointegrate several sources of data and di.erent statistical methods in order to obtaina more complete information about the biological role of Myc. In particular dataused regard an experiment done by Department of Genetics and Molecular Biologyof Rome University La Sapienza and results of similar experiments published onweb resource. By cross comparison of di.erent experimental sources and several sta-tistical methods we purpose to verify which are the most relevant biological resultsand to evaluate the robustness of the various algorithm used.
References
DOPAZO, J., ZANDERS, E., DRAGONI, I., AMPHLETT, G. and FALCIANI,F. (2001): Methods and approaches in the analysis of gene expression data.Journal of Immunological Methods, 250, 93112.
SCARNO, M., SFORZINI, D., NASI, S., ULIVIERI, A. (in press): A Method toClassify Microarrays Data.
SHIIO, Y., DONOHOE, S., C.YI, E., R.GOODLETT, D., AEBERSOLD, R. andN.EISENMAN, R. (2002): Quantitative proteomic analysis of Myc oncoproteinfunction. The EMBO Journal, Vol.21, No. 19, 50885096.
SOUCEK, L., JUCKER, R., PANACCHIA, L., RICORDY, R., TATO, F. andNASI, S. (2002): Omomyc, a Potential Myc Dominant Negative, EnhancesMyc-indiced Apoptosis. Cancer Research, 62, June 15, 35073510.
Keywords
MICROARRAYS, PROTEOMICS, GENETIC DATA BASE175
Partial Moments and Negative Moments inOrdering Asymmetric Distribution
Grazyna Trzpiot
Department of Statistics, The Karol Adamiecki University of Economics,Katowice, Poland
Abstract. Moment ordering condition is shown to be necessary for stochastic dom-inance. Related results of the partial moments and negative moments are presented.The condition for any degree of stochastic dominance by ordering fractional andnegative moments of the distribution will be shown. We present sufficient conditionfor restricted families of distribution functions - class of asymmetric distribution.Additionally we present a related general measure based on fractional momentswhich can be used for complete ordering the set of distribution. The condition ap-plies generally, subject only to the requirement that the moments exist. The resultsrests on the fact that the negative and the fractional moments of the distributioncan be interpreted as constant relative risk aversion utility function.
References
BRADLEY M. G., LEHMAN D.E. (1988). Instrument Effects and Stochastic Dom-inance, Insurance Mathematic and Economics, 7, 185 - 191.
HODGES C. W., WALTON R. L. T., Yoder J. A. (1997). Stock, Bonds, the SharpeRatio and the Investment Horizon, Financial Analysis Journal, 74 - 80.
LEVY H. (1996). Investment Diversification and Investment Specialization and theAssumed Holding Period, Applied Mathematical Finance, 3, 117 - 134.
OGRYCZAK W., RUSZCZYNSKI A (1999). From Stochastic Dominance to MeanRisk Models: Semideviation as Risk Measure. European Journal of OperationResearch, 116, 33 - 50.
TRZPIOT G. (2002). Multicriterion Analysis based on Marginal ConditionalStochastic Dominance in financial analysis, in: Multiple Objective and GoalProgramming, ed. T. Trzaskalik, J. Michnik, series Advances in Soft Comput-ing, 401-412, Springer - Verlag Company
Keywords
PARTIAL MOMENTS, NEGATIVE MOMENTS, ASYMMETRIC INFOR-MATION, STOCHASTIC DOMINANCE
176

Do Lead-Lag Effects Affect Derivative Pricing?
Marliese Uhrig-Homburg1 and Olaf Korn2
1 Chair of Financial Engineering and Derivatives, Universitat Karlsruhe (TH),76128 Karlsruhe, Phone +49 721 608 8183, Fax +49 721 608 8190, [email protected].
2 Chair of Finance, University of Mannheim, 68131 Mannheim, Phone +49 621181 1487, Fax +49 621 181 1519, Email [email protected]
Abstract. In this paper we extend an analysis by Lo andWang (1995), who showedthat predictability of asset returns affects derivatives prices through its impacton instantaneous volatility. We investigate how the whole instantaneous variance-covariance matrix of two assets returns is affected by typical lead-lag patterns. Aclose link between the cross-autocorrelations of finite holding-period returns andthe instantaneous correlation is derived, which implies a strong impact of lead-lagpatterns on correlation dependent derivatives. We provide simple adjustments forlead-lag effects and apply our results to the valuation of stock option plans.
References
Lo, Andrew W., and Jiang Wang, 1995, Implementing option pricing models whenasset returns are predictable, Journal of Finance, 50, 87–129.
Keywords
DERIVATIVE PRICING, PREDICTABILITY, LEAD-LAG
177
Intelligent Fashion Interfaces: New challengesof classifying and standardizing context
awareness systems for smart homes, clothesand fibres
Astrid Ullsperger
Klaus Steilmann Institut fur Innovation und Umwelt GmbH, Cottbus/Bochum
Abstract. The beginning of a new era of computing will change our lives dramat-ically. After the acceptance of internet and virtual reality the next wave of disap-pearing computer applications will create much greater changes in every part ofour live. Technologies of miniaturized and nearly invisible technologies like biotech-nology, nanotechnology and microelectronics as base of computer science will befound in daily life surroundings. Tiny, spontaneously communicating processors ofvery small size and low price will be integrated into everyday items. Also inventionsin materials like ”computational fibers” or ”smart paper” might give computers atotally new appearance. Small sensors are capable of detecting a multitude of dif-ferent environmental parameters. Advances in short-distance wireless networks, likeWLINK or the current Bluetooth standard improve possibilities of communicationand information interchanges. Thinking in the near future especially ”smarter” fash-ion items, like clothes, accessories, shoes, artefacts, interior decorations in homeswill be able to serve us by tackling additional tasks through integrated processors,memory, sensors and communication capabilities. Every advanced item from thee-shoe to the bathroom or kitchen appliance will be connected to the internet andsubscribed to special information services. Especially in wearable computing appli-cations sensor data continuously changing and clothing provides an ideal supportingstructure for sensors. The new field, defined as pervasive or ubiquitous computing,needs new methods, classifications and standards to create useful user interfacesand surfaces to make the new technology accessible for every body. Scalability,mobility, interactivity, flexibility, security, heterogeneity are new challenges in therealization of e.g. context awareness systems. For the creation of completely newapplications around smart devices, the maintenance and the infrastructure servesthe theoretical 7 skin model, which subdivided our physical world into seven skinsin relation to computational embedded systems. Apart from individual functionsthe mobility and flexibility are the most important distinctive marks. Disappearingcomputing applications expects a number of new integrating, standardizing andjudging solutions
178
UP Clustering: a Density Based ClusterAlgorithm for Data Mining
Alfred Ultsch
Fachbereich Mathematik und InformatikPhilipps-Universitt MarburgD-35032 Marburg, Germany
Abstract. Pareto Density as defined in this work is a method for the estimationof probability density functions using hyperspheres. The Pareto-radius of the hy-perspheres is derived from the maximation of information for minimal set size. It isshown, that Pareto Density is the best estimate for clusters of Gaussian structure.The method is shown to be robust when cluster overlap and when the variancesdiffer across clusters. For high dimensional data Pareto Density is still appropriatefor the purpose of cluster analysis. The method is tested successfully on a difficultreal world problem: stock picking in falling markets.
References
Luc Devroye and Gabor Lugosi: Variable Kernel Estimates: on the Impossibility ofTuning the Parameters.
M. C. Jones (1990): Variable kernel density estimates and variable kernel densityestimates. Australian Journal of Statistics, vol. 32, PP: 361-371, 1990
Selena Maranjian (2002): The Best Number of Stocks. The Motley Fool, August 26,2002
D. W. Scott (1992): Mulivariate Density Estimation. Wiley-Interscience, 1992A. Hinneburg, D.A. Keim (1998): An Efficient Approach to Clustering in Large
Multimedia Databases with Noise. Proc. 4th Int. Conf. on Knowledge Discov-ery and Data Mining, 1998
E. Parzen (1962): On the estimation of a probability density function and the mode.Annals of Mathematical Statistics, vol. 33, pp. 1065-1076, 1962.
Keywords
CLUSTERING, DATA MINING, DENSITY, PARETO
179
Mining Promising Qualification Patterns
Ralf Wagner
Business Administration & MarketingUniversity of Bielefeld, D-33615 Bielefeld, Germany
Abstract. The skills to impart in academic management education are subject ofcontroversial debates (c.f. Achenreiner (2001) and Marshall, Michaels (2001) fora review of criticism and a compilation of potential qualifications in marketingrelated education). Both, students as well as business schools and universities arehighly interested in “market orientated” combinations of qualifications to increasethe career opportunities of graduates.In this study the generalized K-means clustering by self organizing maps is usedto extract promising qualification patterns from job openings for graduates in aninternet job portal. Similar to the word category maps of the WEBSOM project(Lagus et al. (1999)) a qualification combination map is obtained. In contrast tothe majority of text mining applications (c.f. Kosala, Blockeel (2000) and Hand etal. (2001) for a review of techniques) this study is based on tri-gram coding.
References
ACHENREINER, G. (2001): Market Research in the “Real” World: Are We Teach-ing Students What They Need To Know? Marketing Education Review, 11,15–25.
HAND, D.J., MANNILA, H., and SMYTH, P. (2001): Principles of Data Mining.Bradford & MIT Press, Cambridge & London.
KOSALA, R. and BLOCKEEL, H. (2000): Web Mining Research: A Survey.SIGKDD Explorations, 2, 1–15.
LAGUS, K., HONKELA, T., KASKI, S., and KOHONEN, T. (1999): WEBSOMfor Textual Data Mining. Artificial Intelligence Review, 13, 345–364.
MARSHALL, G.W. and MICHAELS, R.E. (2001): Teaching Selling and Sales Man-agement in the Next Millennium: An Agenda from the AMA Faculty Consor-tium. Marketing Education Review, 11, 1–2.
Keywords
PATTERNS, TEXT MINING, n-GRAM CODING, WEB MINING
180
Prediction of Notes from Vocal Time Series:An Overview
Claus Weihs, Ursula Garczarek, and Uwe Ligges
Fachbereich Statistik, Universitat Dortmund, 44221 Dortmund, Germany
Abstract. Analogous to speech recognition systems on computers, our aim is theoptimal prediction of the correct notes corresponding to a vocal time series. We baseour results on experiments with singing presentations of the classical song “TochterZion” by Handel sung by amateurs as well as professionals (cp. Weihs et al., 2001).We compare different kinds of classification algorithms from the literature with ourown results using different amounts of background information for the generationof classification rules producing note predictions. We present segmentation algo-rithms based on periodograms and smoothing of predicted notes. Here we comparedifferent distance measures between periodograms of neighboring segments (Liggeset al., 2002) Also we experiment with different amounts of background informa-tion corresponding to voice type and expected notes. As an alternative, we presentan algorithm trained on parts of the song and tested on the remaining parts. Asthe classification algorithm we use a radial basis function support vector machine(RBFSVM) together with a “Hidden Markov” method as a dynamisation mecha-nism. The parameters of the RBFSVM are selected by optimizing the validationset error using experimental design with a quadratic loss function (Garczarek etal., 2003). This method gives the best results. We were able to obtain a minimumof 5% average classification error and a maximum of 26% on data from an exper-iment with 16 singers. The results of the methods are presented by an automatedtranscription algorithm into musical notes (Weihs and Ligges, 2003).
References
GARCZAREK, U., WEIHS, C., LIGGES, U. (2003): Prediction of Notes fromVocal Time Series. Technical Report 1/2003, SFB475, Department of Statistics,University of Dortmund.
LIGGES, U., WEIHS, C., HASSE-BECKER, P. (2002): Detection of Locally Sta-tionary Segments in Time Series. In: W. HARDLE and B. RONZ (Eds.): Comp-Stat2002 – Proceedings in Computational Statistics – 15th Symposium held inBerlin, Germany. Physika Verlag, Heidelberg, 285–290.
WEIHS, C., BERGHOFF, S., HASSE-BECKER, P., LIGGES, U. (2001): Assess-ment of Purity of Intonation in Singing Presentations by Discriminant Analy-sis. In: J. KUNERT and G. TRENKLER (Eds.): Mathematical Statistics andBiometrical Applications. Josef Eul, Bergisch-Gladbach, Koln, 395–410.
WEIHS, C., LIGGES, U. (2003): Automatic Transcription of Singing Performances.Research Report 03/1, Department of Statistics, University of Dortmund.
Keywords: CLASSIFICATION, TIME SERIES, PREDICTION, SINGINGVOICE
181
Confidence Intervals for NonparametricTreatment Effects in Designs with Repeated
Measures
Carola Werner and Edgar Brunner
University of Gottingene-mail:[email protected]
Abstract. We consider a design where n subjects are repeatedly observed at ttime points. It is not assumed that the observations are coming from distributionfunctions belonging to a certain parametric family. Moreover, the continuity of thedistribution functions is not assumed. To describe the outcome of the trial, the so-called relative treatment effects are used. Asymptotically unbiased and consistentpoint- and interval estimators for these relative treatment effects are given and theasymptotic distributions of the estimators are derived. With these estimators theresults of the trial can be described and the variation of the data can be graphicallyvisualized.
References
Brunner, E., Domhof S. and Langer, F. (2001). Nonparametric Analysis of Longi-tudinal Data in Factorial Designs. Wiley, New York.
Brunner, E. and Puri, M.L. (2001). Point and Interval Estimators for Nonparamet-ric Treatment Effects in Design with Repeated Measures. In: Data Analysis fromStatistical Foundations: Festschrift in Honor of Donald A.S. Fraser, A.K.Md.Saleh ed.), Nova Science Publishers, New York, 167–178 .
Domhof, S. (2001). Nichtparametrische relative Effekte. Dissertation, UniversitatGottingen
182
Has the New Marketing Era Already Come?
Janusz Wielki
WrocÃlaw University of Economics, Faculty of Management and Computer Science/Technical University of Opole, Faculty of Management and ProductionEngineering,Address: 45-401 Opole, ul. Bielska 32/7, Polande-mail: [email protected]
Abstract. The 1990’s was a period of time when more and more noticeable becamelowering efficacy of mass marketing approach. Customers got far more demanding,their level of loyalty had significantly dropped, while offering modern, high qual-ity products became not sufficient to stay competitive and succeed in the rapidlyglobalizing marketplace. Almost at the same time the rapid development of theInternet became a reality. Marketers were among the first who noticed the oppor-tunities arising from this fact and many of them put their strong faith in this newmedium. So, at the end of the ’ 90s more and more common became opinions thatnew marketing era became a fact. The question is if access of marketers to newtools (mainly Internet ones), caused that new marketing era really became a factor rather it is still to come.The paper is composed of five parts. In the first part of the paper business environ-ment of contemporary companies, has been characterized and the most importanttrends, which can be observed there have been presented. Second part is devoted toutilization of the electronic environment for marketing purpose. The most importanttrends related to exploitation of various on-line marketing tools and techniques arediscussed there. The following part of the paper is focused on challenges emergingin the new e-reality. It concentrates mostly on two most important issues:
• the way how the new marketing tools and techniques are used,• consumer information protection.
Next part briefly discusses opportunities arising for marketers with electronic envi-ronment development. Finally conclusions are provided.
Keywords
NEW MARKETING RA, INTERNET, ELECTRONIC ENVIRONMENT
183
From Figures to Information: Data analysis inMarket Research
Raimund Wildner
GfK - Gesellschaft fur Konsumforschung, Nurnberg
Abstract. Market Research collects huge amounts of data in order to help man-ufacturers and service companies to make better business decisions. So GfK alonein Germany performs about 600000 interviews per year, collects weekly purchasedata from 13000 households and 27000 individuals as well as TV-viewing data forevery second of all individuals older than 3 years in 5500 households.
In order to get most out of these data there are different options:
• Multivariate analysis / modelling• Data fusion
At first a short outline of data analysis and the organisational background at GfKis given. Then two concrete examples will be shown:
1. Use of data fusion in order to evaluate the effect of TV advertising: GfK hasa 13000 household panel by which it can easily be analysed who buys whereand how often any item of fast moving consumer goods. In addition GfK has a5500 households TV measurement panel by which it can be seen, who watchesat what time TV, especially TV advertising. Moreover: If you know the exacttimes and TV stations where a commercial was shown you know for each panelmember how often he or she has seen advertising for any given brand. But it isnot possible to analyse the difference in buying behaviour between those whohave seen the advertising in contrast to those who have not seen it. Even ifthis is known it would not help much since households who saw advertising aredifferent from those who did not see it. It is shown how by means of data fusionand logistic regression these problems are addressed and how this can be usedto analyse the effectiveness of TV advertising. The possibilities as well as thelimitations of the model will be discussed.
2. Use of interview data for building a price model: The correct pricing of aproduct or a service is essential for the profitability of a company. The exampleshows how interviews where the respondents are shown products with pricescan be used to build a price model. Moreover it is shown how the interviewingprocess causes a bias in the interview results and how the bias can be addressed.A PC-programme will be demonstrated that allows the customer to analyse thedata, to simulate different scenarios and to optimise the prices of his products.The possibilties and the limitations of this model are discussed.
At the end a short outlook will be given about the trends in data analysis in marketresearch.
184

Variational Approaches to the Segmentation ofTime Series
Gerhard Winkler
GSF -National Research Centre for Environment and Health, IBB, Neuherberg -Munchen
Abstract. Typical problems in the analysis of data sets like time-series or imagescrucially rely on the extraction of primitive features based on segmentation. Varia-tional approaches are a popular and convenient framework in which such problemscan be studied. We focus on Potts models as the simplest nontrivial instances ofsuch methods. The discussion proceeds along two data sets from brain mappingand functional genomics.
185
Classification of Single Malt Whiskiesby Flavour
David Wishart
Department of Management, University of St. Andrews,St. Katharine’s West, The Scores, St. Andrews KY16 9AL, ScotlandEmail: [email protected] Website: www.whiskyclassified.com
Abstract. The talk describes the cardinal flavours that can be found in singlemalt whiskies, and explains how the production and maturation processes developthese flavours. To simplify the comparison of malt whiskies, a standardized profileof 12 flavour features was developed from around 1000 tasting notes and over 500whisky terms. The principal malt whiskies from all the Scottish distilleries werethen profiled and clustered by flavour.
This helps answer questions like - (1) My store offers a bewildering selection ofmalt whiskies, so what should I buy? (2) Dad drinks Macallan but I want to givehim another malt that’s similar in flavour which he will also enjoy? (3) Can yousuggest six malts for my cabinet that illustrate the full range of single malt whiskies?
Whisky Classified: Choosing Single Malts by Flavour is the first book to classifysingle malt whiskies by flavour. It does not rate whiskies by marks-out-of-ten forquality, or describe them by regional styles. It is a consumer-friendly guide thattakes the confusion and guesswork out of whisky-buying, and aims to help thenovice or present-buyer make the right purchase of Scotland’s national drink. Itis also an interesting application of classification methodology for a non-technicalreadership.
The talk concludes with a taste of Aberfeldy, Ardbeg, Isle of Arran, Balblair,Ben Nevis, Benromach, Bruichladdich, Glenfarclas, Glengoyne, Glenlivet, Glen-morangie, Glenmorangie Madeira Finish, Glen Moray, Glenrothes, Glenturret, LochLomond, Macallan, Old Pulteney, Speyburn, Springbank, Talisker and Tomatin.
Keywords
CLUSTERING WHISKIES, FLAVOUR PROFILING, MARKETING, SEG-MENTATION, WHISKY CLASSIFIED
186
Bootstrap Validation for HierarchicalCluster Analysis
David Wishart
Department of Management, University of St. Andrews,St. Katharine’s West, The Scores, St. Andrews KY16 9AL, ScotlandEmail: [email protected] Website: www.clustan.com
Abstract. The paper describes a bootstrap validation procedure to determine thebest number of clusters in a hierarchical classification. It compares a tree obtainedfor a given dataset with the family of trees generated by random permutation ofthe same data or the associated proximity matrix. A distribution is obtained forthe set of trees from the permuted data and a confidence interval is constructedabout the mean. The tree for the given data is then compared with this confidenceinterval and significant departures from random are identified.
Our approach to validating a classification is to expect structure rather thanrandomness in the given data and to search for tree sections that correspond to thegreatest departure from randomness. In statistical terms, we seek to reject the nullhypothesis that the structure displayed by a section of a given tree is random. Theprocedure reassuringly reports no significant clusters when random data containingno structure are evaluated.
The paper discusses alternative methods of constructing the confidence inter-val, and the choice of the null hypothesis and associated significance test. Issuesinclude whether the data should be sampled with or without replacement, how toavoid impossible combinations of responses when permuting survey data, and howto test very large data sets for which full permutation and replication would beprohibitively expensive.
This bootstrap validation procedure is available in ClustanGraphics6 (Wishart,2003) and has been evaluated with real lifestyle survey data (Weidenbeck and Zuell,2002).
References
GORDON, A. D. (1999): Classification. Chapman & Hall/CRC Statistics andMathematics.
WIEDENBECK, M. and ZUELL, C. (2002): Classification of media data by meansof cluster analysis, Proc. GfKl 2002, Mannheim (in press).
WISHART, D. (2003): ClustanGraphics Primer, Second Edition, Clustan Ltd., Ed-inburgh: www.clustan.com/bootstrap.html
Keywords
BOOTSTRAP VALIDATION, HIERARCHICAL CLUSTERING, NUMBEROF CLUSTERS, RANDOMPERMUTATIONS, SIGNIFICANT PARTITIONS
187
Strategic Analysis of Bankruptcy Threat OnThe Example Of The Polish Buliding
Company
Mirella Witek and Agnieszka Krajna
Academy of Economics, WrocÃlaw, Poland
Abstract. For many years economists have been trying to determine future op-portunities of a company or to predict its bankruptcy on the basis of financialstatements (balance sheet and statement of consolidated income). It is then im-portant for management to have at disposal early information about financial andeconomic condition of the firm. Thus, in order to find out how the corporation willmanage in future, early warning systems are used.
For predicting bankruptcy and financial problems of the company, an indicatingmethod - a simplified discriminant analysis and Z-score model have been presentedin the paper.
Discriminant analysis methods have been elaborated on the basis of a researchdone in thousands of companies from different branches and having a differentlevel of effectivity. As a result, a set of indicators has been chosen. These indicatorsdetermine the condition and future chances of development. For companies with thefinancial condition varying from very good to those in threat of bankruptcy, a typicallevel of indicators was specified. Next, an appropriate coefficient was attributed toeach indicator, using methods of statistic discriminant analysis. These coefficientsexpress the relation between the level of each indicator and the overall financialand economic condition of a company.
Quick Test is an easier method of assessment of the future chances and threatsof the company. Here, the attribution of the coefficients to the indicators is basedon the expertise of the consultants.
The paper presents above methods of estimating a financial and economic con-dition of the corporation on the example of the Polish building company ExbudWroclaw.
Keywords
EARLY WARNING SYSTEMS, DISCRIMINANT ANALYSIS, PREDICT-ING BANKRUPTCY, INDICATING METHODS
188

An Empirical Study Evaluating theOrganization and Costs of Hospital
Management
Karin Wolf-Ostermann1, Markus Lungen2, Helmut Mieth2, and Karl W.Lauterbach2
1 Department of Child and Adolescent Psychiatry, Philipps-University Marburg,D-35033 Marburg, Germany
2 Institute for Health Economics and Clinical Epidemiology of the University ofCologne, D-50935 Koln, Germany
Abstract. In Germany so far, there exists no evaluation of the relationship be-tween the organization and costs of hospital administrations and hospital character-istics. In a survey of hospital administration costs, structure, and salary level 126hospital participated for the years 1998 and 1999. Hospitals of medium size andnon-profit ownership show the smallest expenditures for personnel in the adminis-tration per treated case. However, salary level was not uniformly linked to hospitalsize in all cases. In these cases, hospital ownership appeared to be a strong indica-tor for the level of personnel salaries. For the planned introduction of prospectivepayment starting 2003 in Germany our study has substantial implications. Publiclyowned hospitals, in particular, are likely to have their administrations most severelyaffected by the change.
References
RIVERS P.A., BAE S. (2000): The relationship between hospital characteristics andthe costs of hospital care. Health Services Management Research; 13, 256-63.
WOLF-OSTERMANN, K., LUNGEN, M.,MIETH, H., LAUTERBACH, K. W.(2002): Eine empirische Studie zu Organisation und Kosten der Verwaltungim Krankenhaus. Zeitschrift fur Betriebswirtschaft, 72(10), 1065-1084.
Keywords
ADMINISTRATION, COSTS, HOSPITAL, PROSPECTIVE PAYMENT
189
Meta-Klassifikation und Kategorienfur interdisziplinare Forschung
Kerstin Zimmermann
ftw (Forschungszentrum Telekommunikation Wien), Austria, [email protected]
Abstract. In unserer zunehmend komplexeren Welt wird Forschung zunehmendinterdisziplinar angelegt. Werden einerseits Fragestellungen gemeinsam aus unter-schiedlichen Wissenschaftsbereichen bearbeitet und Synergie-Effekte erzielt, gestal-tet sich andererseits das Retrieval nach gerade diesen Fachinformationen zunehmendschwieriger. Dies hat folgende Ursachen:
• Jede Teildisziplin verwendet ihre eigene Fachsprache / Nomenklatur• Publikationen bilden Untergruppen in verschiedenen Hierachien bzw. auf ver-
schiedenen (e-print) Servern / in online Archiven
Eine einheitliche Verschlagwortung der Publikationen ist demnach nicht (mehr)zu erwarten. Kommen neben den gangigen Bibliotheks- und Fachschemata noch dieKategorien aus dem Patent- und Normierungswesen wie z.B. in der Telekommu-nikation hinzu, potenziert sich der Aufwand. Hinzu kommt in diesen schnelllebigenForschungsgebieten die Notwendigkeit nach moglichst tagesaktuellen Informatio-nen. Lehr- und Lernmaterialien spielen eine immer großere Rolle, da es (noch)keinen etablierten Studiengang ’Telekommunikation’ gibt.
Als integrativer online Ansatz bietet sich ein Fachinformations-Portal an, dasauch auf die Webseiten von Arbeitsgruppen und Instituten verweist. Ebenso sindLinks zu Konferenzen und Gremien hilfreich. Es soll also auf unterschiedliche Artenvon Datenquellen zugegriffen werden konnen (bottom-up-Ansatz), welche auch Ange-bote der ’Grunddisziplinen’ miteinschließen.
Im Vortag sollen Losungsstrategien der oben erwahnten Probleme aufgezeigt,sowie ein aktueller Einblick in interdisziplinare Portale gegeben werden.
References
ZIMMERMANN, K. (2002): A Research Information Portal for Telecommunica-tions. IN: IEEE Proc. ISTAS’02, Raleigh, NC, 143-149
Keywords
KLASSIFIKATION, INTERDISZIPLINARITAT, TELEKOMMUNIKATION,PORTAL
190