brain transcriptomic response of threespine sticklebacks to cues of a predator
TRANSCRIPT
Fax +41 61 306 12 34E-Mail [email protected]
Original Paper
Brain Behav Evol DOI: 10.1159/000328221
Brain Transcriptomic Response of Threespine Sticklebacks to Cues of a Predator Yibayiri!O.!Sanogo ! a Shala!Hankison ! c Mark!Band ! b Alexandra!Obregon ! d Alison!M.!Bell ! a ! a
! Integrative Biology, b ! W.M. Keck Center for Comparative and Functional Genomics, University of Illinois
at Urbana Champaign, Urbana, Ill. , c ! Department of Zoology, Ohio Wesleyan University, Delaware, Ohio , and
d ! Departments of Pediatrics and Anthropology, University of Oklahoma, Norman, Okla. , USA
exposed to cues of a predator and the control group were related to antigen processing and presentation involving the major histocompatibility complex, transmission of synaptic signals, brain metabolic processes, gene regulation and vi-sual perception. The top four identified pathways were syn-aptic long-term depression, RAN signaling, relaxin signaling and phototransduction. Our study demonstrates that expo-sure of sticklebacks to cues of a predator results in the activa-tion of a wide range of biological and molecular processes and lays the foundation for future investigations on the mo-lecular factors that modulate the function and evolution of the brain in response to stressors.
Copyright © 2011 S. Karger AG, Basel
Introduction
Physiological and behavioral reactions to predators are conserved across organisms, and predation pressure has played an important role in the evolution of brain structures that mediate responses to environmental cues [Cantor, 2009]. Thus, studying how the brain responds to the threat of predation could provide insights into the
Key Words Neurogenomics ! Stress ! Predation ! Microarray ! Gene expression ! Gasterosteus aculeatus
Abstract Predation pressure represents a strong selective force that influences the development and evolution of living organ-isms. An increasing number of studies have shown that both environmental and social factors, including exposure to predators, substantially shape the structure and function of the brain. However, our knowledge about the molecular mechanisms underlying the response of the brain to envi-ronmental stimuli is limited. In this study, we used whole-genome comparative oligonucleotide microarrays to inves-tigate the brain transcriptomic response to cues of a preda-tor in the threespine stickleback, Gasterosteus aculeatus . We found that repeated exposure to olfactory, visual and tactile cues of a predator (rainbow trout, Oncorrhynchus mykiss ) for 6 days resulted in subtle but significant transcriptomic changes in the brain of sticklebacks. Gene functional analy-sis and gene ontology enrichment revealed that the majority of the transcripts differentially expressed between the fish
Received: November 22, 2010 Returned for revision: December 23, 2010 Accepted after revision: March 21, 2011 Published online: June 16, 2011
Alison Bell Integrative Biology, University of Illinois at Urbana-Champaign 505 S. Goodwin Ave., 433 Morrill Hall Urbana, IL 61801 (USA) Tel. +1 217 265 5469, E-Mail alisonmb ! @ ! life.illinois.edu
© 2011 S. Karger AG, Basel
Accessible online at: www.karger.com/bbe
Sanogo ! /Hankison ! /Band ! /Obregon ! /Bell !
Brain Behav Evol 2
mechanisms underlying neural plasticity and how they have evolved. However, our understanding of the molec-ular and biological processes underlying the response to predators is in its infancy. Important recent studies have shown that exposure to a predator results in the activa-tion of particular neural circuitry in the brain [e.g. Nan-da et al., 2008] and that specific genes, including immedi-ate early genes [e.g. Comoli et al., 2003; Blanchard et al., 2005; Motta et al., 2009], are upregulated in the brain in response to the threat of predation. For example, cortico-tropin-releasing factor genes were upregulated in the amygdala of rats 3 h after a 10-min exposure to a ferret predator [Roseboom et al., 2007].
We know less about changes in the brain that might occur in response to repeated exposure to predation risk over longer periods of time. Most studies have measured gene expression within minutes after a single exposure to predation risk [Wang et al., 2003; Nanda et al., 2008; Le-der et al., 2009; Mori et al., 2009]. However, animals are often recurrently exposed to cues of predators, and other studies suggest that the response of the hypothalamic-pituitary-adrenal axis to acute versus chronic stress is dif-ferent [McEwen, 2007]. Recent gene expression studies have supported this hypothesis by showing that an acute stressor activates different genes, and a different number of genes, compared to a chronic stressor. For example, different sets of genes are involved in the transcriptomic response to acute versus chronic stress in the brain [Kras-nov et al., 2005; Cairns et al., 2008]. Other studies have shown that the number of differentially expressed genes in response to a stressor depends on the duration of the stressor. For example, there were more differentially ex-pressed genes in proximal tubule cells after 1 day of ex-posure to cadmium compared to 13 days of exposure [Garrett et al., 2011]. On the other hand, another study found that there were more differentially expressed genes in the liver in response to confinement stress in sea bream that had been confined for 20 h compared to fish that had been confined for 120 h [Calduch-Giner et al., 2010]. We also know that exposure to predation risk can have long-term effects on antipredator behavior [Tulley and Hun-tingford, 1987; Magurran, 1990; Kelley and Magurran, 2003], which suggests that there might be changes in brain gene expression in response to predation risk that are relatively enduring.
The power of genomics has only recently been applied to understand the coordinated action of the entire tran-scriptome in response to predation [but see Wang et al., 2003; Roseboom et al., 2007]. Whole-genome surveys are an attractive strategy because it is likely that the response
to threat of predation involves multiple interacting genes and pathways. In addition, transcriptomic profiling can reveal which genes display similar expression patterns and opens the possibility of more integrated analyses of whole-genome dynamics via techniques such as pathway, network and gene ontology (GO) analyses. Indeed, new insights have emerged from studies measuring the whole transcriptomic response to other stressors, e.g. pollution [Craig et al., 2009], disease [Ching et al., 2010] and con-finement [Kennerly et al., 2008].
Threepined sticklebacks (Gasterosteus aculeatus) are small teleost fish whose evolution has been strongly in-fluenced by predation pressure. Sticklebacks are subject to a wide range of predators including piscivorous fishes, birds, odonate larvae and snakes [Reimchen, 1994]. Much of the extensive phenotypic variation among freshwater stickleback populations, including morphology [Reim-chen, 1980], behavior [Huntingford et al., 1994], physiol-ogy [Bell et al., 2010] and life history traits [Moodie, 1972; Baker et al., 1998] can be attributed to variation in preda-tor pressure. For example, sticklebacks from populations that are subject to high levels of predation pressure have more exterior armor (lateral plates) [Reimchen, 1994], show stronger antipredator behavioral responses to the immediate risk of predation [Huntingford et al., 1994] and are more physiologically responsive to the threat of predation as assessed by respiration rate [Bell et al., 2010]. A recent study of the time course of the acute response to predation risk [Bell et al., 2007] showed that acute expo-sure to predation risk stimulated a glucocorticoid stress response within minutes, with levels of cortisol increas-ing up to 1 h after exposure to predation risk. While re-cent studies have successfully pinpointed the genes un-derlying the evolution of morphological defenses against predators in sticklebacks [Peichel et al., 2001; Cresko et al., 2004; Shapiro et al., 2004; Colosimo et al., 2005; Chan et al., 2010], we know less about the molecular basis of plastic behavioral and physiological reactions to preda-tors within an individual’s lifetime. Growing genomic re-sources for sticklebacks [Kingsley and Peichel, 2007], in-cluding a full genome sequence, make this organism a suitable model for investigating the molecular mecha-nisms that have evolved in response to predation pres-sure.
Therefore, we investigated the brain’s response to cues of a predator using whole-genome microarrays in stick-lebacks. We hypothesized that sticklebacks exposed to predation risk would exhibit differential transcriptomic responses compared to a control group.
Transcriptomic Response to a Predator in Sticklebacks
Brain Behav Evol 3
Materials and Methods
Sticklebacks We studied laboratory-reared F1 female sticklebacks derived
from a wild population in Putah Creek, Calif., USA. We elected to study females in this experiment because males undergo dra-matic changes in behavior over the reproductive period, some of which could influence an individual’s response to predation risk [Wootton, 1976]. The fish were maintained in our laboratory in 104-liter tanks under 8: 16-hour light/dark photoperiod. An aver-age of 10% of the water in the tanks was exchanged each day. The adult fish were fed ad libitum with a mixture of bloodworms, brine shrimp and mysis shrimp.
Adult fish used in the study were sampled from a tank contain-ing representatives of 33 different families. Fish were acclimated together in one tank for 2 weeks prior to the experiment. Fish were placed in six different 26-liter tanks with three fish per tank in a partially recirculating flow-through system. The water was fil-tered through particulate, UV, biological and charcoal filters, which remove olfactory cues. Half of the tanks were assigned to the control group and the other half to the experimental group. The position of the control and experimental tanks was random-ized in the room and the tanks were isolated from external dis-turbances during the entire duration of the experiment by opaque covers on the back and front of the tanks. The fish were allowed to acclimate for 3 days during which the sides of the tanks were left open to allow the fish to visually interact with fish in neigh-boring tanks. Dividers were then inserted between tanks for the remainder of the experiment.
Applying Predator Cues We designed a procedure to mimic the situation of stickle-
backs that are repeatedly exposed to a high level of predation pres-sure in the field. Specifically, over 6 days, sticklebacks wereexposed to olfactory, visual and tactile cues of rainbow trout, a natural predator, in order to simulate real predation risk. This procedure elicited enduring changes in stickleback growth and behavior [Dingemanse et al., 2009; Bell et al., 2011], and other studies using this population have shown that they exhibit strong antipredator responses to rainbow trout [Bell and Sih, 2007]. Nan-da et al. [2008] used a similar procedure to measure the immedi-ate brain transcriptomic response of rats to olfactory, visual and acoustic cues of predators. Sticklebacks were exposed to two types of olfactory cues. First, olfactory cues of rainbow trout were ap-plied to simulate the presence of trout in the environment. Olfac-tory cues of trout were prepared by soaking 1 cm 2 trout skin in 1 liter of distilled water for 2 h. Second, cues of dead stickleback were applied to simulate predation on nearby conspecifics. The dead-stickleback cues were prepared by soaking one sacrificed fish in 1 liter of distilled water for 2 h. Incisions were made in the skin on the sides of the fish with a clean razor to release cues. This procedure releases alarm pheromones in the skin of sticklebacks [Brown and Godin, 1997].
The infusions were frozen in trays and the ice cubes were thawed in a beaker for 1 h prior to use. Once a day for 6 days, at a random time of day, we turned the water off in the tank and add-ed 50 ml of trout infusion and 50 ml of dead stickleback infusion. The olfactory cues were placed within 30 cm of the majority of sticklebacks in the tank. On days 2 and 5 of the treatment period, a trout model was added to the tank at the site of application of
the olfactory cues, held still for 30 s, and then quickly moved to-ward the corner of the tank that contained the majority of the sticklebacks, then to the side and back again. We used a model of a rainbow trout constructed of clay and painted realistically (20.5 cm standard length). The model was thoroughly rinsed in dis-tilled water before being reused. On day 6, the sticklebacks were chased by the model trout for an entire minute. Fish in the control tanks were treated exactly the same except that 100 ml clean water was added instead of olfactory cues, and they were not exposed to the model predator. To control for disruption caused by adding the predator, we splashed the surface of the water in the control tanks once within 30 cm of the majority of the sticklebacks on days 2 and 5 and on day 6, the water was splashed several times for 1 min. The water in the tank was turned on 3 h after the treat-ment was applied. On the 7th day, all the fish (n = 18) were quick-ly netted and sacrificed by decapitation using sharp scissors. All methods were approved by IACUC protocol (No. 06178) of the University of Illinois at Urbana-Champaign.
RNA Extraction and cDNA Synthesis Whole fish brains were individually dissected and placed im-
mediately on ice in 500 ! l of Trizol ! reagent (Invitrogen, Carls-bad, Calif., USA). Total RNA was isolated immediately from in-dividual brains (n = 18) using Trizol reagent according to the manufacturer’s recommendation and subsequently purified on columns with RNeasy kit (Qiagen GmbH, Hilden, Germany). RNA was eluted in a total volume of 60 ! l in RNase-free water. In addition, to remove contaminating genomic DNA, all RNA sam-ples were treated with DNase using the Turbo DNA free kit (Am-bion, Austin, Tex., USA) following the manufacturer’s instruc-tions. The quantity of RNA was estimated using a NanoDrop 1000 (Thermo Fisher Scientific, Inc., Waltham, Mass., USA) and the quality was assessed using the Agilent Bioanalyzer 2100 (Agilent, Santa Clara, Calif., USA). RNA was immediately stored at –80 ! ° ! C for 1 week. To generate enough double-stranded cDNA for hy-bridization, we first amplified RNA (aRNA) from 1 ! g of total RNA of 10 fish used in microarray using the MessageAmp II aRNA amplification kit (Applied Biosystems/Ambion, Austin, Tex., USA) following the manufacturer’s instructions. Other studies have suggested that aRNA does not introduce significant bias in gene expression data [Feldman et al., 2002; Polacek et al., 2003]. Nonamplified RNA was preserved for microarray valida-tion experiments. The aRNA was subsequently converted to dou-ble-stranded cDNA using the SuperScript ! Double-Stranded cDNA Synthesis Kit (Invitrogen). cDNA was purified using the Qiaquick PCR Purification Kit (Qiagen). All samples for microar-ray were successfully amplified. The cDNA yields ranged from 3 to 6 ! g. In accordance with NimbleGen (Madison, Wisc., USA) requirements, 2.5 ! g of double-stranded cDNA were sent to the NimbleGen Microarray Service Department for hybridization.
Chip Design The arrays were printed using the NimbleGen proprietary
Maskless Array Synthesis technology on a 385 K high-density chip using both the 44,884 in silico Genscan predictions from the stickleback genome and the 27,633 gene transcripts obtained from ENSEMBL v.45.1c. Genscan predictions are based on transcrip-tional, translational and splicing signals as well as the length and compositional distributions of exons, introns and intergenic re-gions. They differ from the transcripts, which have been backed

Sanogo ! /Hankison ! /Band ! /Obregon ! /Bell !
Brain Behav Evol 4
by some experimental evidence. 60-bp probes were designed from a total of 72,517 sequences. Of these genes, all except 12 sequenc-es had 5 probes per gene. No probes were found for 44 sequences because all of them were shorter than the minimum 60-bp probe size. Probes were designed taking into account various criteria such as nonrepetitive elements, frequency, uniqueness and melt-ing temperature according to the NimbleGen probe design pro-cedure.
Microarray Design and Hybridization Ten samples were used for microarray analysis. The samples
comprised 5 biological replicates in the experimental group (fish exposed to cues of predator) and 5 biological replicates in the con-trol group (fish not exposed to cues of predator). Samples were selected to ensure even distribution among the tanks and high RNA quality. Three tanks contributed 1 individual, 2 tanks con-tributed 2 individuals and 1 tank contributed 3 individuals to the experiment. The cDNA-labeling (single color), hybridization, washing and scanning steps were performed in the NimbleGen Microarray Gene Expression Service Department. In addition, NimbleGen also conducted the data feature extraction and gener-ated the XYS file format that was used in data analysis. The mi-croarray data have been deposited in NCBI’s Gene Expression Omnibus (GEO, http://www.ncbi.nlm.gov/geo) under accession No. GSE21599, GPL10368.
Data Analysis The microarray data were analyzed using various packages in
R Bioconductor [R Development Core Team, 2009]. Although both the in silico Genescan predictions and transcripts were in-cluded in the microarray chips, we focused the analysis only on the transcripts of confirmed function because some of the Gene-scan predictions do not have biological function. Genescan pre-dictions were not further considered in the analysis. Differential expression of genes between the control group and the experi-mental group was assessed using the package Oligo in R Biocon-ductor [Carvalho et al., 2007]. As required for the package Oligo , we first built a package ‘pd.2007.07.05.g.aculeatus.expr’, which contains the annotation information of the arrays using pdInfo-Builder package [Carvalho et al., 2007]. This package was then installed in R and used for analysis. Background subtraction, quantile normalization and summarization were performed us-ing the Robust Multichip Average Algorithm. This algorithm per-forms three steps in the following sequence: background correc-tion, quantile normalization and log2-transformed perfect-match value summarization, a method that averages the probe’s expres-sion intensities for each transcript [Irizarry et al., 2003]. Before exploring the differences in gene expression between the two groups, we first applied a nonspecific filtering method to the data to remove the probe sets (transcripts) with no or very low expres-sion. This approach is commonly used to improve the detection power in microarray data analysis, particularly when testing mul-tiple hypotheses [Calza et al., 2007; Bourgon et al., 2010]. We ap-plied the function rowSds in the package genefilter, which calcu-lates the standard deviation of expression intensities for each row (probe set). We then estimated the ‘peak’ of the distribution using the function shorth (the shortest interval containing half of the data). Probes with standard deviation below the shorth value were filtered out of the data. The quality of the arrays was assessed by examining the boxplots and the density plots of the log2-trans-
formed intensity values of the probes. Hierarchical clustering was done using the function hclust in the package stats in R Biocon-ductor by employing the complete linkage method as the agglom-eration procedure.
We used principal components analysis as a dimension reduc-tion method to visualize the data using the plotPCA function in R. The experimental treatment (predator-exposed fish and con-trol group) were the variables and the gene expression measure-ments served as the observations.
The log2-fold changes (logFCs) and moderated t statistics were computed to infer the differential expression of genes between the control and experimental groups using the Bayesian moderated t test in the package LIMMA (Linear Models for Microarray Data) in R Bioconductor. We used a false discovery rate (FDR) to correct for multiple testing [Benjamini and Hochberg, 1995]. The func-tion topTable was used to rank the p values.
Because some fish used in the experiment were from the same tank, we conducted a post-hoc analysis of the top differential - ly expressed genes to detect any possible tank effect; these results are shown graphically in online supplementary figure 1 (www.karger.com/doi/10.1159/000328221).
Gene Function, GO and Pathway Analysis Gene functional studies and GO enrichment analysis were
conducted in R Bioconductor using the ENSEMBL dataset Gas-terosteus_aculeatus.BROADS1.58. The annotation of the differ-entially expressed genes was determined using the package BiomaRt as implemented in R. Genes with no known function in the stickleback genome annotation were manually annotated us-ing the BLASTX algorithm against the nonredundant protein da-tabase. The output of the file was parsed using a custom Perl script.
GO enrichment was carried out using the package GOstat. As a gene universe (background), we used the transcripts that were maintained after nonspecific filtering and we tested for overrep-resentation of transcripts with raw p values ̂ 0.01 as determined by the Bayesian statistics. Both the gene universe and the target genes were first converted into ENTREZIDs using human homo-logues by the function getBML in BiomaRt because the stickle-back genes have not been assigned ENTREZIDs, which are used in GOstat . The overrepresented biological processes (BPs), mo-lecular functions (MFs) and cellular components (CCs) were de-termined by using the function hyperGtest with conditional test-ing, which removes the effect of child GO terms before testing parents. We also performed pathway and network analyses using the Ingenuity Pathways Analysis (IPA) software version 8.7 (In-genuity Systems, Redwood City, Calif., USA). IPA is a proprietary application that uses data from its own repository of biological interactions and functional annotations from all species known as Ingenuity Knowledge Base, a manually curated database that is updated weekly and quarterly using annotations and findings from public and commercial databases and from information ex-tracted from published biomedical literature. Third-party sourc-es of database used by IPA include, for example, the NCBI Entrez Gene, Refseq and OMIM, the GWAS Database, GO annotation, Hazardous Substances Database, Human Metabolome Database, GNF Tissue Expression Body Atlas and KEGG metabolic pathway information. Since IPA does not accept stickleback transcriptIDs, the differentially expressed genes were converted into EN-TREZIDs using human homologues.
Transcriptomic Response to a Predator in Sticklebacks
Brain Behav Evol 5
Microarray Validation Microarray validation was conducted on samples used in mi-
croarray experiment and also on 4 samples that were part of the experiment but were not included in the microarray gene expres-sion analysis. Total RNA from each sample was reverse tran-scribed using the SuperScript ! III First-Strand Synthesis System (Invitrogen). Quantitative real-time PCR (qPCR) reactions were performed on the Applied Biosystems 7900HT (Applied Biosys-tems) using the FastStart Universal SYBR Green Master (Rox) (Roche Diagnostics GmbH, Mannheim, Germany) following the manufacturer’s recommendations. The housekeeping gene glyc-eraldehyde 3-phosphate dehydrogenase (GAPDH) was used asinternal reference because the average expression values of this gene did not vary significantly across samples in the microarray experiment. Genes with highest fold change and lowest p values, as determined in R Bioconductor, are more likely to be differen-tially expressed between conditions, and were therefore selected for validation. Primers for validation were designed from each gene transcript using the Primer Express ! Software v1.0 (Applied Biosystems). Primers were redesigned each time amplification across samples was not consistent. This was the case for the rho-dopsin (RHO) genes, which are represented by two differentially expressed splice variants (ENSGACT00000003757, ENSG-ACT00000003760). The genes selected for validation and their respective primers are listed in table!1 . Each reaction was run in triplicate and a dissociation curve was used to assess a single am-plicon. No-template controls were included in the reaction to en-sure the specificity of amplification. Primers were redesigned whenever primer dimers were observed in the dissociation curve. A standard curve was computed using a 10 ! serial dilution of samples made by pooling equal quantities of all samples, includ-ing both the control and experimental samples. A standard curve was run for each gene separately. The qPCR data were analyzed using the Relative Expression Software tool (REST © ) [Pfaffl et al.,
2002]. To test for consistence between the samples used in micro-array and the independent biological replicates, we compared the expression values of three most differentially expressed genes in these samples using a one-way ANOVA using StatPlusMac (Ana-lystSoft, Vancouver, B.C., Canada).
Results
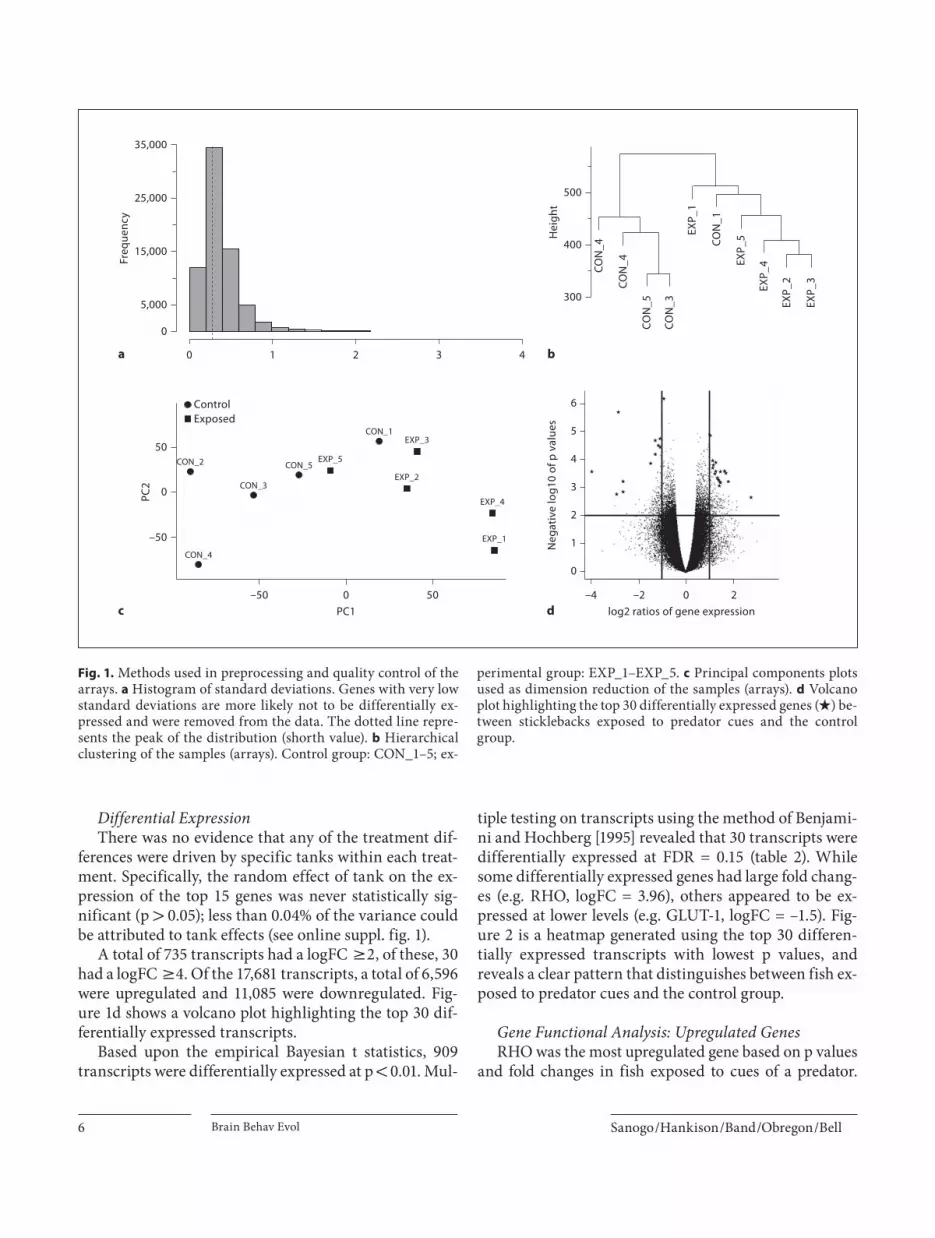
As a result of nonspecific filtering, 36% of probe sets (transcripts) with standard deviations below the shorth value (0.268) were removed because they had low expres-sion levels ( fig.!1 a). The target genes of these probe sets were either not expressed in the samples or their expres-sion was not significantly higher than above background level. In total, 17,681 transcripts were maintained for fur-ther analysis.
The hierarchical clustering based upon row expression values showed that all the samples clustered according to treatment, except 1 sample (CON_1), which grouped with the experimental samples ( fig.! 1 b). However, this sample clustered with the control group based upon dif-ferential expression ( fig.! 2 ). The principal-component analysis shown in figure 1 c revealed that 74% of the vari-ation was explained by the first principal component (PC1), suggesting that the majority of observed changes in gene expression were caused by exposure to predator cues. PC2 and PC3 explained 8.6 and 6.0% of the varia-tion, respectively.
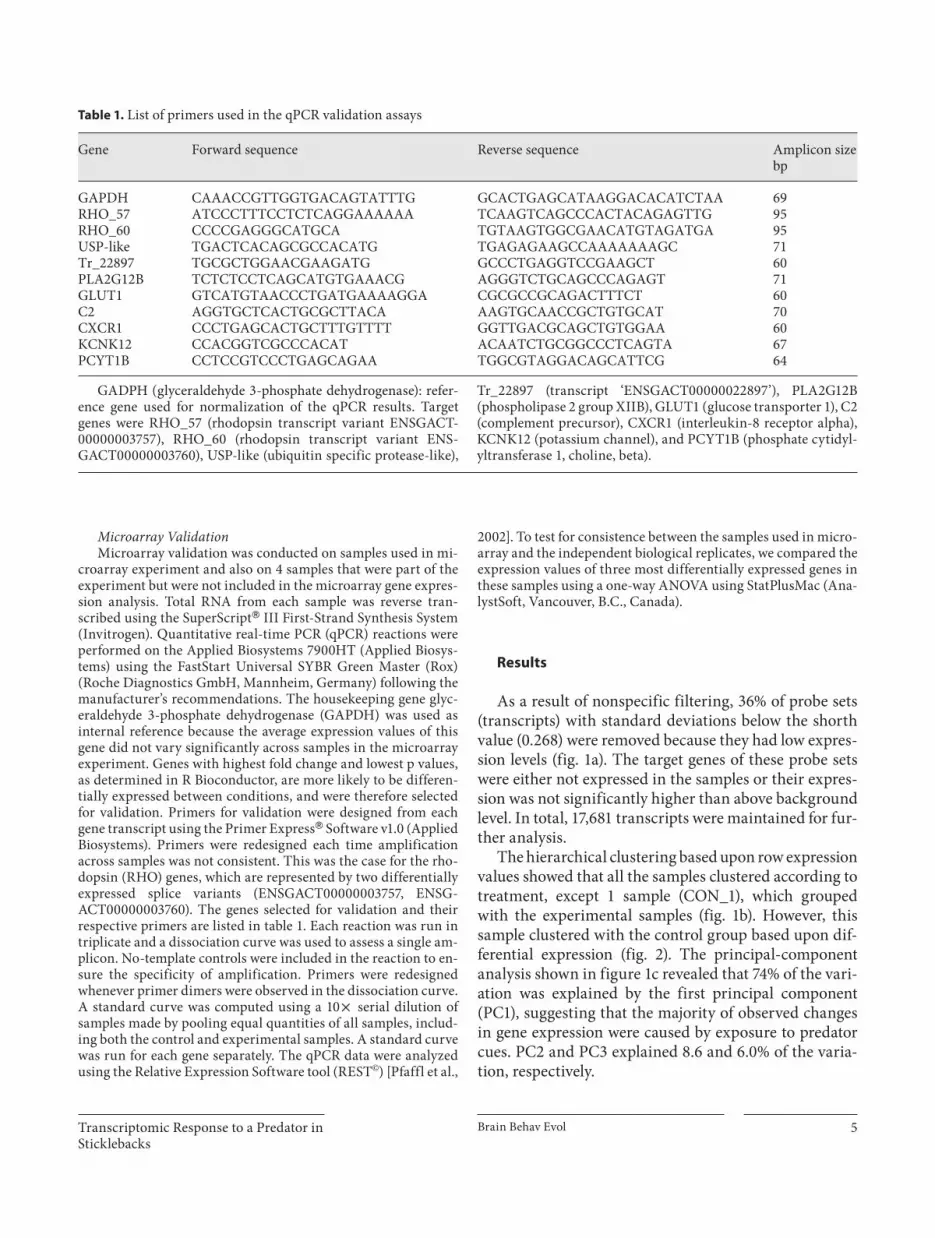
Table 1. L ist of primers used in the qPCR validation assays
Gene Forward sequence Reverse sequence Amplicon size bp
GAPDH CAAACCGTTGGTGACAGTATTTG GCACTGAGCATAAGGACACATCTAA 69 RHO_57 ATCCCTTTCCTCTCAGGAAAAAA TCAAGTCAGCCCACTACAGAGTTG 95 RHO_60 CCCCGAGGGCATGCA TGTAAGTGGCGAACATGTAGATGA 95 USP-like TGACTCACAGCGCCACATG TGAGAGAAGCCAAAAAAAGC 71 Tr_22897 TGCGCTGGAACGAAGATG GCCCTGAGGTCCGAAGCT 60 PLA2G12B TCTCTCCTCAGCATGTGAAACG AGGGTCTGCAGCCCAGAGT 71 GLUT1 GTCATGTAACCCTGATGAAAAGGA CGCGCCGCAGACTTTCT 60 C2 AGGTGCTCACTGCGCTTACA AAGTGCAACCGCTGTGCAT 70 CXCR1 CCCTGAGCACTGCTTTGTTTT GGTTGACGCAGCTGTGGAA 60 KCNK12 CCACGGTCGCCCACAT ACAATCTGCGGCCCTCAGTA 67 PCYT1B CCTCCGTCCCTGAGCAGAA TGGCGTAGGACAGCATTCG 64
GADPH (glyceraldehyde 3-phosphate dehydrogenase): refer-ence gene used for normalization of the qPCR results. Target genes were RHO_57 (rhodopsin transcript variant ENSGACT - 00000003757), RHO_60 (rhodopsin transcript variant ENS-GACT00000003760), USP-like (ubiquitin specific protease-like),
Tr_22897 (transcript ‘ENSGACT00000022897’), PLA2G12B (phospholipase 2 group XIIB), GLUT1 (glucose transporter 1), C2 (complement precursor), CXCR1 (interleukin-8 receptor alpha), KCNK12 (potassium channel), and PCYT1B (phosphate cytidyl-yltransferase 1, choline, beta).
Sanogo ! /Hankison ! /Band ! /Obregon ! /Bell !
Brain Behav Evol 6
Differential Expression There was no evidence that any of the treatment dif-
ferences were driven by specific tanks within each treat-ment. Specifically, the random effect of tank on the ex-pression of the top 15 genes was never statistically sig-nificant (p 1 0.05); less than 0.04% of the variance could be attributed to tank effects (see online suppl. fig.!1).
A total of 735 transcripts had a logFC 6 2, of these, 30 had a logFC 6 4. Of the 17,681 transcripts, a total of 6,596 were upregulated and 11,085 were downregulated. Fig-ure!1 d shows a volcano plot highlighting the top 30 dif-ferentially expressed transcripts.
Based upon the empirical Bayesian t statistics, 909 transcripts were differentially expressed at p ! 0.01. Mul-
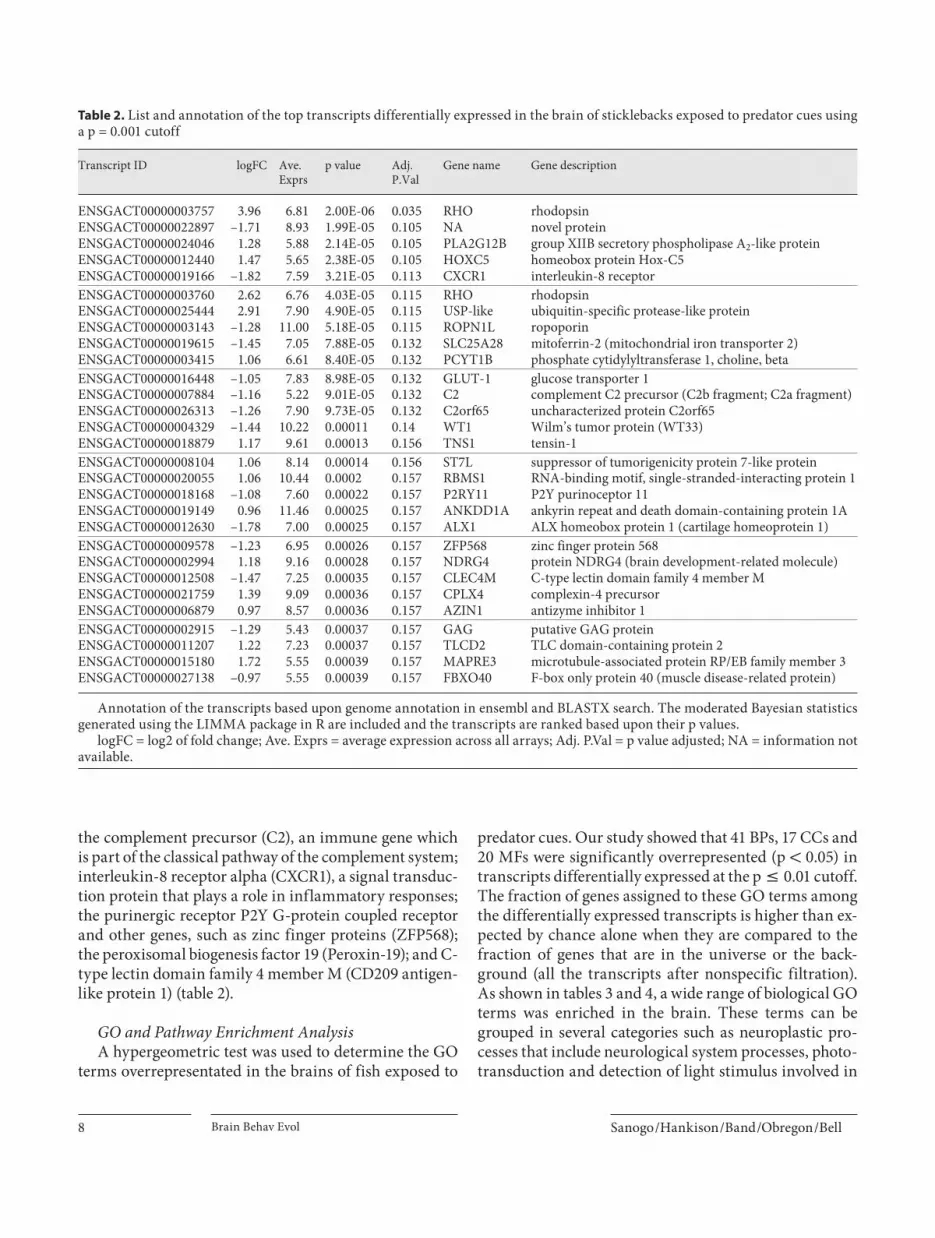
tiple testing on transcripts using the method of Benjami-ni and Hochberg [1995] revealed that 30 transcripts were differentially expressed at FDR = 0.15 ( table! 2 ). While some differentially expressed genes had large fold chang-es (e.g. RHO, logFC = 3.96), others appeared to be ex-pressed at lower levels (e.g. GLUT-1, logFC = –1.5). Fig-ure!2 is a heatmap generated using the top 30 differen-tially expressed transcripts with lowest p values, and reveals a clear pattern that distinguishes between fish ex-posed to predator cues and the control group.
Gene Functional Analysis: Upregulated Genes RHO was the most upregulated gene based on p values
and fold changes in fish exposed to cues of a predator.
0
0a 1 2 3 4
5,000
15,000
25,000
35,000
Freq
uenc
y
b
300
CON
_4400
500
Hei
ght
CON
_4
CON
_5
CON
_1
EXP_
1
EXP_
5
EXP_
4
EXP_
2
EXP_
3
CON
_3
c–50
ControlExposed
CON_2
0PC1
PC2
50
–50
0
50
CON_4
CON_3
CON_5EXP_5
CON_1EXP_3
EXP_2
EXP_4
EXP_1
d
0
–4 –2 0 2
1
2
3
4
5
6
Neg
ativ
e lo
g10
of p
val
ues
log2 ratios of gene expression
C
C
C
CCCCCCCCCCCCCC
C
C
CCCC
CC
CC
CC
Fig. 1. Methods used in preprocessing and quality control of the arrays. a Histogram of standard deviations. Genes with very low standard deviations are more likely not to be differentially ex-pressed and were removed from the data. The dotted line repre-sents the peak of the distribution (shorth value). b Hierarchical clustering of the samples (arrays). Control group: CON_1–5; ex-
perimental group: EXP_1–EXP_5. c Principal components plots used as dimension reduction of the samples (arrays). d Volcano plot highlighting the top 30 differentially expressed genes ( V ) be-tween sticklebacks exposed to predator cues and the control group.

Transcriptomic Response to a Predator in Sticklebacks
Brain Behav Evol 7
RHO is a complex of vision protein opsin and the chromo-fore 11- cis -retinal that mediates vision at low illumination. Phospholipase A2, group XIIB (PLA2G12B) was also sig-nificantly upregulated. This gene is a secreted phospholi-pase (sPLA2) from a family of small secreted proteins with the ability to catalyze the hydrolysis of glycolipids and re-lease free fatty acids and lysophospholipids. The upregu-lated gene homeobox C5 (HOXC5) is a member of the ho-meobox family of genes which encodes a highly conserved family of transcription factors that provide cells with spe-cific positional identities on the anterior-posterior ax - is during morphogenesis in all multicellular organisms. The ubiquitin-specific protease-like protein (USP-like), a group of serine proteases that plays a pivotal role in protein homeostasis by tagging the ubiquitin complex for degra-dation was also upregulated. The upregulated gene phos-phate cyti dylyltransferase 1, choline, beta gene (PCYT1B) is an enzyme that controls the phosphatidylcholine syn-thesis and is a major component of cell membranes with an important role in membrane signaling and cell growth.
Other upregulated genes included the suppressor of tumori genicity protein 7-like protein (STL7), the RNA-in-ding motif (RBSMS1), the ankyrin repeat (ANKDD1A), tensin (TNS1) and the potassium channel subfamily K (KCNK12) gene ( table!2 ).
Downregulated Genes The most downregulated gene in fish exposed to pred-
ator cues was the transcript ENSGACT00000022897, a novel unnamed gene of undetermined function. Also downregulated was ropoporin (ROPN1), a gene most likely involved in reg ulating the growth, development and/or maintenance of motile cilia. The downregulation of mitoferrin-2 (MFRN2), a solute ion carrier essential for red-blood iron uptake, is also noteworthy. Of particular interest is the downregulation of the glucose transporter (GLUT1). GLUT1 is the first member of the solute carrier family (SLC2) that facilitates the transport of glucose from the bloodstream across the blood-brain barrier to the nervous system. Other downregulated genes included
Color key
Row Z-score–1 1
-
Fig. 2. Heat map of top 30 differentially ex-pressed genes between control (CON_1–5) and experimental (EXP_1–5) group with gene names. The Z-score represents the number of standard deviation units a spe-cific gene expression value is from the mean (defined as 0). Red color in the heat map indicates upregulated genes, in blue are downregulated genes and in white are genes that do not change between condi-tions. Color-coded bars represent the clus-tering of samples per treatment (horizon-tal bar) and clusters of differentially ex-pressed genes (vertical bar).
Sanogo ! /Hankison ! /Band ! /Obregon ! /Bell !
Brain Behav Evol 8
the complement precursor (C2), an immune gene which is part of the classical pathway of the complement system; interleukin-8 receptor alpha (CXCR1), a signal transduc-tion protein that plays a role in inflammatory responses; the purinergic receptor P2Y G-protein coupled receptor and other genes, such as zinc finger proteins (ZFP568); the peroxisomal biogenesis factor 19 (Peroxin-19); and C-type lectin domain family 4 member M (CD209 antigen-like protein 1) ( table!2 ).
GO and Pathway Enrichment Analysis A hypergeometric test was used to determine the GO
terms overrepresentated in the brains of fish exposed to
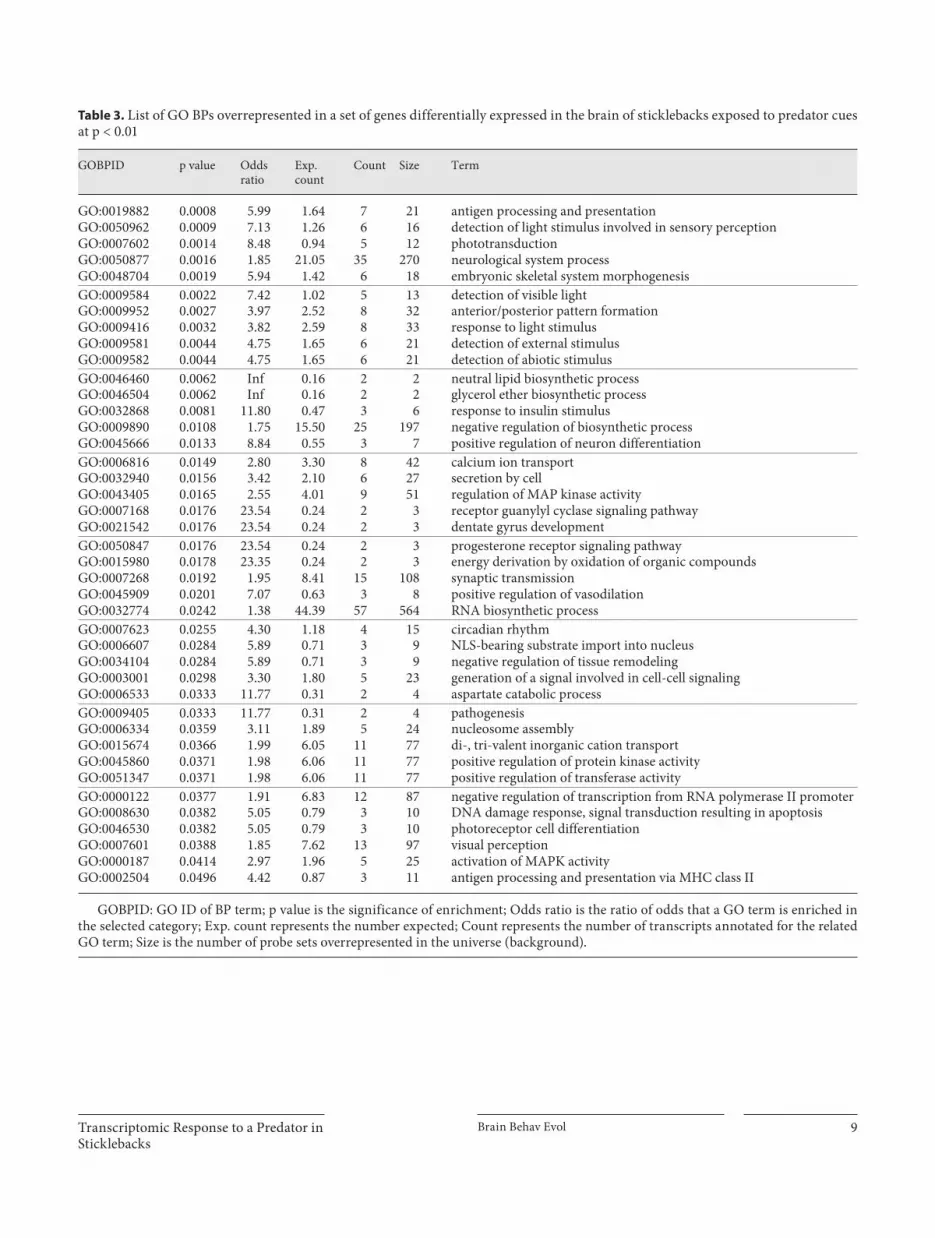
predator cues. Our study showed that 41 BPs, 17 CCs and 20 MFs were significantly overrepresented (p ! 0.05) in transcripts differentially expressed at the p ̂ 0.01 cutoff. The fraction of genes assigned to these GO terms among the differentially expressed transcripts is higher than ex-pected by chance alone when they are compared to the fraction of genes that are in the universe or the back-ground (all the transcripts after nonspecific filtration). As shown in tables 3 and 4 , a wide range of biological GO terms was enriched in the brain. These terms can be grouped in several categories such as neuroplastic pro-cesses that include neurological system processes, photo-transduction and detection of light stimulus involved in
Table 2. L ist and annotation of the top transcripts differentially expressed in the brain of sticklebacks exposed to predator cues using a p = 0.001 cutoff
Transcript ID logFC Ave.Exprs
p value Adj.P.Val
Gene name Gene description
ENSGACT00000003757 3.96 6.81 2.00E-06 0.035 RHO rhodopsin ENSGACT00000022897 –1.71 8.93 1.99E-05 0.105 NA novel protein ENSGACT00000024046 1.28 5.88 2.14E-05 0.105 PLA2G12B group XIIB secretory phospholipase A 2 -like protein ENSGACT00000012440 1.47 5.65 2.38E-05 0.105 HOXC5 homeobox protein Hox-C5 ENSGACT00000019166 –1.82 7.59 3.21E-05 0.113 CXCR1 interleukin-8 receptor ENSGACT00000003760 2.62 6.76 4.03E-05 0.115 RHO rhodopsin ENSGACT00000025444 2.91 7.90 4.90E-05 0.115 USP-like ubiquitin-specific protease-like protein ENSGACT00000003143 –1.28 11.00 5.18E-05 0.115 ROPN1L ropoporin ENSGACT00000019615 –1.45 7.05 7.88E-05 0.132 SLC25A28 mitoferrin-2 (mitochondrial iron transporter 2) ENSGACT00000003415 1.06 6.61 8.40E-05 0.132 PCYT1B phosphate cytidylyltransferase 1, choline, beta ENSGACT00000016448 –1.05 7.83 8.98E-05 0.132 GLUT-1 glucose transporter 1 ENSGACT00000007884 –1.16 5.22 9.01E-05 0.132 C2 complement C2 precursor (C2b fragment; C2a fragment) ENSGACT00000026313 –1.26 7.90 9.73E-05 0.132 C2orf65 uncharacterized protein C2orf65 ENSGACT00000004329 –1.44 10.22 0.00011 0.14 WT1 Wilm’s tumor protein (WT33) ENSGACT00000018879 1.17 9.61 0.00013 0.156 TNS1 tensin-1 ENSGACT00000008104 1.06 8.14 0.00014 0.156 ST7L suppressor of tumorigenicity protein 7-like protein ENSGACT00000020055 1.06 10.44 0.0002 0.157 RBMS1 RNA-binding motif, single-stranded-interacting protein 1 ENSGACT00000018168 –1.08 7.60 0.00022 0.157 P2RY11 P2Y purinoceptor 11 ENSGACT00000019149 0.96 11.46 0.00025 0.157 ANKDD1A ankyrin repeat and death domain-containing protein 1A ENSGACT00000012630 –1.78 7.00 0.00025 0.157 ALX1 ALX homeobox protein 1 (cartilage homeoprotein 1) ENSGACT00000009578 –1.23 6.95 0.00026 0.157 ZFP568 zinc finger protein 568 ENSGACT00000002994 1.18 9.16 0.00028 0.157 NDRG4 protein NDRG4 (brain development-related molecule) ENSGACT00000012508 –1.47 7.25 0.00035 0.157 CLEC4M C-type lectin domain family 4 member M ENSGACT00000021759 1.39 9.09 0.00036 0.157 CPLX4 complexin-4 precursor ENSGACT00000006879 0.97 8.57 0.00036 0.157 AZIN1 antizyme inhibitor 1 ENSGACT00000002915 –1.29 5.43 0.00037 0.157 GAG putative GAG protein ENSGACT00000011207 1.22 7.23 0.00037 0.157 TLCD2 TLC domain-containing protein 2 ENSGACT00000015180 1.72 5.55 0.00039 0.157 MAPRE3 microtubule-associated protein RP/EB family member 3 ENSGACT00000027138 –0.97 5.55 0.00039 0.157 FBXO40 F-box only protein 40 (muscle disease-related protein)
Annotation of the transcripts based upon genome annotation in ensembl and BLASTX search. The moderated Bayesian statistics generated using the LIMMA package in R are included and the transcripts are ranked based upon their p values.
logFC = log2 of fold change; Ave. Exprs = average expression across all arrays; Adj. P.Val = p value adjusted; NA = information not available.
Transcriptomic Response to a Predator in Sticklebacks
Brain Behav Evol 9
Table 3. List of GO BPs overrepresented in a set of genes differentially expressed in the brain of sticklebacks exposed to predator cues at p < 0.01
GOBPID p value Odds ratio
Exp. count
Count Size Term
GO:0019882 0.0008 5.99 1.64 7 21 antigen processing and presentation GO:0050962 0.0009 7.13 1.26 6 16 detection of light stimulus involved in sensory perception GO:0007602 0.0014 8.48 0.94 5 12 phototransduction GO:0050877 0.0016 1.85 21.05 35 270 neurological system process GO:0048704 0.0019 5.94 1.42 6 18 embryonic skeletal system morphogenesis GO:0009584 0.0022 7.42 1.02 5 13 detection of visible light GO:0009952 0.0027 3.97 2.52 8 32 anterior/posterior pattern formation GO:0009416 0.0032 3.82 2.59 8 33 response to light stimulus GO:0009581 0.0044 4.75 1.65 6 21 detection of external stimulus GO:0009582 0.0044 4.75 1.65 6 21 detection of abiotic stimulus GO:0046460 0.0062 Inf 0.16 2 2 neutral lipid biosynthetic process GO:0046504 0.0062 Inf 0.16 2 2 glycerol ether biosynthetic process GO:0032868 0.0081 11.80 0.47 3 6 response to insulin stimulus GO:0009890 0.0108 1.75 15.50 25 197 negative regulation of biosynthetic process GO:0045666 0.0133 8.84 0.55 3 7 positive regulation of neuron differentiation GO:0006816 0.0149 2.80 3.30 8 42 calcium ion transport GO:0032940 0.0156 3.42 2.10 6 27 secretion by cell GO:0043405 0.0165 2.55 4.01 9 51 regulation of MAP kinase activity GO:0007168 0.0176 23.54 0.24 2 3 receptor guanylyl cyclase signaling pathway GO:0021542 0.0176 23.54 0.24 2 3 dentate gyrus development GO:0050847 0.0176 23.54 0.24 2 3 progesterone receptor signaling pathway GO:0015980 0.0178 23.35 0.24 2 3 energy derivation by oxidation of organic compounds GO:0007268 0.0192 1.95 8.41 15 108 synaptic transmission GO:0045909 0.0201 7.07 0.63 3 8 positive regulation of vasodilation GO:0032774 0.0242 1.38 44.39 57 564 RNA biosynthetic process GO:0007623 0.0255 4.30 1.18 4 15 circadian rhythm GO:0006607 0.0284 5.89 0.71 3 9 NLS-bearing substrate import into nucleus GO:0034104 0.0284 5.89 0.71 3 9 negative regulation of tissue remodeling GO:0003001 0.0298 3.30 1.80 5 23 generation of a signal involved in cell-cell signaling GO:0006533 0.0333 11.77 0.31 2 4 aspartate catabolic process GO:0009405 0.0333 11.77 0.31 2 4 pathogenesis GO:0006334 0.0359 3.11 1.89 5 24 nucleosome assembly GO:0015674 0.0366 1.99 6.05 11 77 di-, tri-valent inorganic cation transport GO:0045860 0.0371 1.98 6.06 11 77 positive regulation of protein kinase activity GO:0051347 0.0371 1.98 6.06 11 77 positive regulation of transferase activity GO:0000122 0.0377 1.91 6.83 12 87 negative regulation of transcription from RNA polymerase II promoter GO:0008630 0.0382 5.05 0.79 3 10 DNA damage response, signal transduction resulting in apoptosis GO:0046530 0.0382 5.05 0.79 3 10 photoreceptor cell differentiation GO:0007601 0.0388 1.85 7.62 13 97 visual perception GO:0000187 0.0414 2.97 1.96 5 25 activation of MAPK activity GO:0002504 0.0496 4.42 0.87 3 11 antigen processing and presentation via MHC class II
GOBPID: GO ID of BP term; p value is the significance of enrichment; Odds ratio is the ratio of odds that a GO term is enriched in the selected category; Exp. count represents the number expected; Count represents the number of transcripts annotated for the related GO term; Size is the number of probe sets overrepresented in the universe (background).

Sanogo ! /Hankison ! /Band ! /Obregon ! /Bell !
Brain Behav Evol 10
sensory perception. GO terms in immune response cat-egories involved antigen processing and presentation, de-tection of external stimulus while biosynthetic processes overrepresented included neutral lipid biosynthetic pro-cess, glycerol ether biosynthetic process and negative reg-ulation of biosynthetic process. Terms associated with gene regulation were negative regulation of tissue remod-
eling and positive regulation of protein kinase activity. GO terms associated with development were embryonic skeletal system morphogenesis, anterior/posterior pat-tern formation and dentate gyrus development. Other GO terms were, for example, signal transduction result-ing in induction of apoptosis. MHC class I protein com-plex was the most overrepresented cellular GO term with
Table 4. List of GO terms overrepresented in a set of genes differentially expressed in the brain of sticklebacks exposed to predator cues at p < 0.01
GOCCID p value Odds ratio Exp. count Count Size Term
Cellular component GO:0042612 0.0009 9.93 0.86 5 11 MHC class I protein complex GO:0045211 0.0045 2.67 5.17 12 66 postsynaptic membrane GO:0005751 0.0061 Infinity 0.16 2 2 mitochondrial respiratory chain complex IV GO:0042622 0.0061 Infinity 0.16 2 2 photoreceptor outer segment membrane GO:0005625 0.0077 2.14 8.30 16 106 soluble fraction GO:0019717 0.0086 3.48 2.43 7 31 synaptosome GO:0001917 0.0174 23.67 0.23 2 3 photoreceptor inner segment GO:0000159 0.0198 7.11 0.63 3 8 protein phosphatase type 2A complex GO:0042613 0.0198 7.11 0.63 3 8 MHC class II protein complex GO:0005834 0.0252 4.32 1.17 4 15 heterotrimeric G-protein complex GO:0005640 0.0280 5.93 0.70 3 9 nuclear outer membrane GO:0005891 0.0316 3.96 1.25 4 16 voltage-gated calcium channel complex GO:0042825 0.0330 11.83 0.31 2 4 TAP complex GO:0045202 0.0351 1.72 10.64 17 136 synapse GO:0019898 0.0377 2.45 3.21 7 41 extrinsic to membrane GO:0034707 0.0480 2.83 2.04 5 26 chloride channel complex
Molecular functions GO:0004918 0.0063 Infinity 0.16 2 2 interleukin-8 receptor activity GO:0005546 0.0063 Infinity 0.16 2 2 phosphatidylinositol-4,5-bisphosphate binding GO:0048038 0.0063 Infinity 0.16 2 2 quinone binding GO:0004691 0.0082 11.72 0.48 3 6 cAMP-dependent protein kinase activity GO:0004871 0.0139 1.94 9.60 17 122 signal transducer activity GO:0015226 0.0178 23.38 0.24 2 3 carnitine transporter activity GO:0005388 0.0204 7.03 0.63 3 8 calcium-transporting ATPase activity GO:0008601 0.0204 7.03 0.63 3 8 protein phosphatase type 2A regulator activity GO:0008565 0.0271 2.66 3.00 7 38 protein transporter activity GO:0022890 0.0306 3.27 1.82 5 23 inorganic cation transmembrane transporter activity GO:0003713 0.0327 1.90 7.44 13 94 transcription coactivator activity GO:0019905 0.0335 11.72 0.32 2 4 syntaxin binding GO:0003711 0.0336 11.71 0.32 2 4 transcription elongation regulator activity GO:0004571 0.0337 11.69 0.32 2 4 mannosyl-oligosaccharide 1,2-alpha-mannosidase activity GO:0008131 0.0337 11.69 0.32 2 4 amine oxidase activity GO:0004674 0.0372 1.61 13.97 21 177 protein serine/threonine kinase activity GO:0005245 0.0387 5.02 0.79 3 10 voltage-gated calcium channel activity GO:0004112 0.0403 3.61 1.35 4 17 cyclic-nucleotide phosphodiesterase activity GO:0005216 0.0485 2.51 2.70 6 34 ion channel activity
GOCCID: GO ID of the CC term, GOMFID: GO ID of MF term; p value is the significance of enrichment; Odds ratio is the ratio of odds that a GO term is enriched in the selected category; Exp. count represents the number expected; Count represents the number of transcripts annotated for the related GO term; GO term size is the number of probe sets overrepresented in the universe (background).
Transcriptomic Response to a Predator in Sticklebacks
Brain Behav Evol 11
46% genes enriched for this term followed by the postsyn-aptic membrane mitochondrial respiratory chain com-plex IV, the synaptosome and the voltage-gated calcium channel complex.
Network analysis showed that out of the 5,016 network eligible genes (genes mapped to a pathway by IPA), 348 transcripts were mapped to a network using the IPA sys-tem (p = 0.01). For example, 35 genes in a network involv-ing cell signaling, nucleic acid metabolism, cellular as-sembly and organization were differentially expressed in our experiment (IPA score = 35). Similarly, 33 genes in a network involving neurological disease, developmental disorder and psychological disorders were also differen-tially expressed (IPA score = 30). Pathway analysis re-vealed that the synaptic long-term depression pathways was the most overrepresented [–log(p) = 2.84E-04], fol-lowed by the RAN signaling pathway [–log(p) = 2.62E-04], the relaxin-signaling pathway [–log(p) = 1.98E-04] and the phototransduction pathways [-log(p) = 1.98E-04].
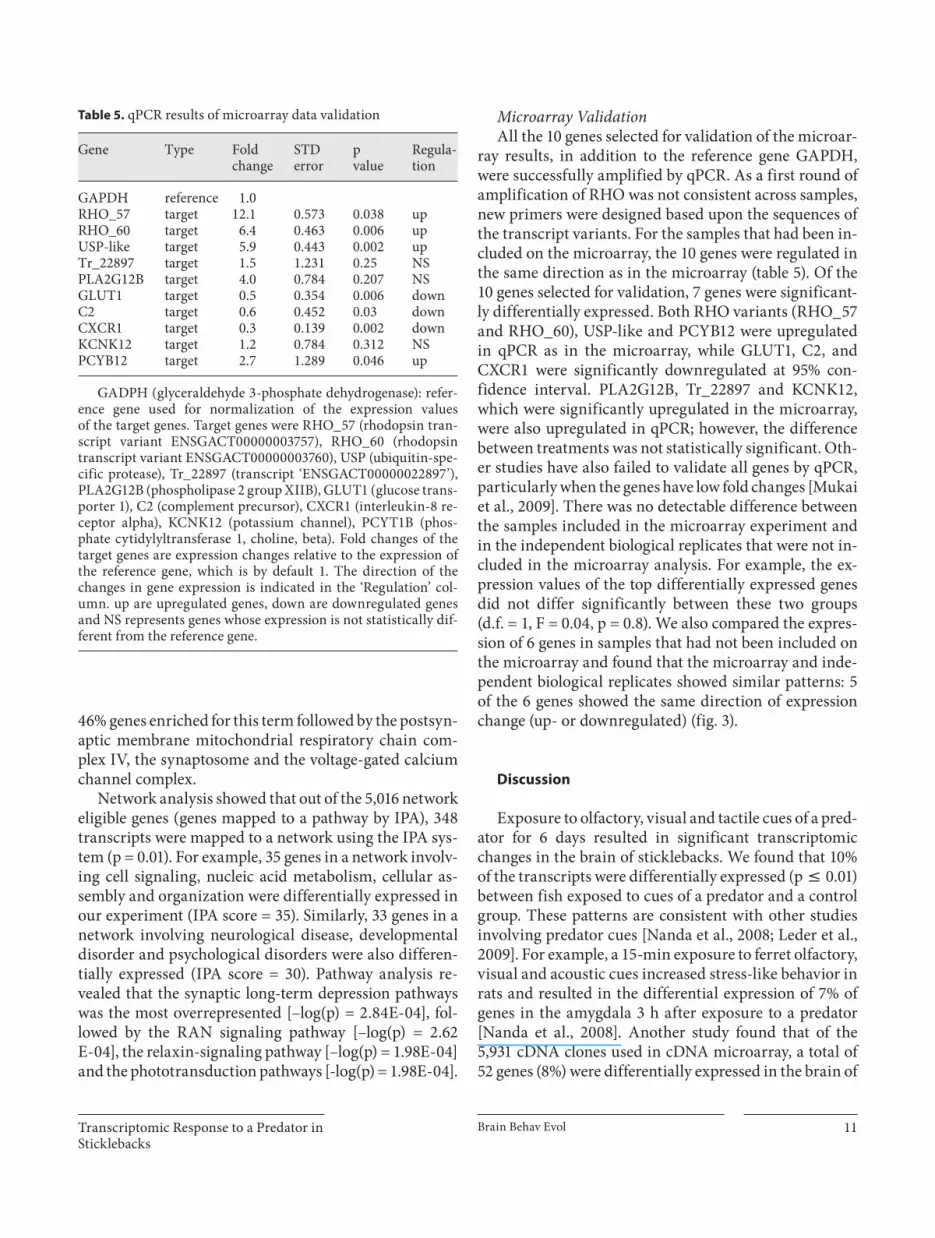
Microarray Validation All the 10 genes selected for validation of the microar-
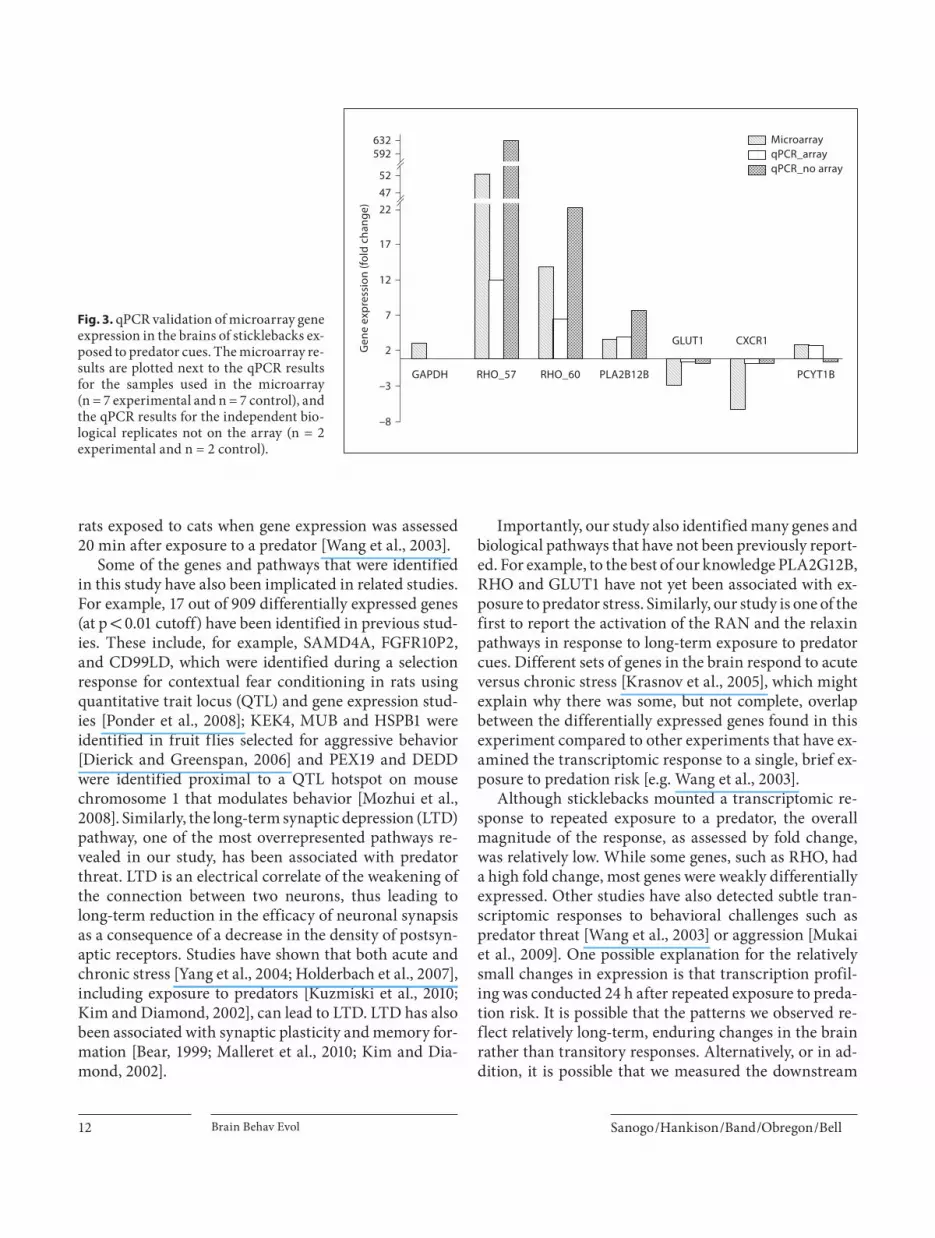
ray results, in addition to the reference gene GAPDH, were successfully amplified by qPCR. As a first round of amplification of RHO was not consistent across samples, new primers were designed based upon the sequences of the transcript variants. For the samples that had been in-cluded on the microarray, the 10 genes were regulated in the same direction as in the microarray ( table!5 ). Of the 10 genes selected for validation, 7 genes were significant-ly differentially expressed. Both RHO variants (RHO_57 and RHO_60), USP-like and PCYB12 were upregulated in qPCR as in the microarray, while GLUT1, C2, and CXCR1 were significantly downregulated at 95% con-fidence interval. PLA2G12B, Tr_22897 and KCNK12, which were significantly upregulated in the microarray, were also upregulated in qPCR; however, the difference between treatments was not statistically significant. Oth-er studies have also failed to validate all genes by qPCR, particularly when the genes have low fold changes [Mukai et al., 2009]. There was no detectable difference between the samples included in the microarray experiment and in the independent biological replicates that were not in-cluded in the microarray analysis. For example, the ex-pression values of the top differentially expressed genes did not differ significantly between these two groups(d.f. = 1, F = 0.04, p = 0.8). We also compared the expres-sion of 6 genes in samples that had not been included on the microarray and found that the microarray and inde-pendent biological replicates showed similar patterns: 5 of the 6 genes showed the same direction of expression change (up- or downregulated) ( fig.!3 ).
Discussion
Exposure to olfactory, visual and tactile cues of a pred-ator for 6 days resulted in significant transcriptomic changes in the brain of sticklebacks. We found that 10% of the transcripts were differentially expressed (p ̂ 0.01) between fish exposed to cues of a predator and a control group. These patterns are consistent with other studies involving predator cues [Nanda et al., 2008; Leder et al., 2009]. For example, a 15-min exposure to ferret olfactory, visual and acoustic cues increased stress-like behavior in rats and resulted in the differential expression of 7% of genes in the amygdala 3 h after exposure to a predator [Nanda et al., 2008]. Another study found that of the 5,931 cDNA clones used in cDNA microarray, a total of 52 genes (8%) were differentially expressed in the brain of
Table 5. qPCR results of microarray data validation
Gene Type Fold change
STD error
p value
Regula-tion
GAPDH reference 1.0 RHO_57 target 12.1 0.573 0.038 up RHO_60 target 6.4 0.463 0.006 up USP-like target 5.9 0.443 0.002 up Tr_22897 target 1.5 1.231 0.25 NS PLA2G12B target 4.0 0.784 0.207 NS GLUT1 target 0.5 0.354 0.006 down C2 target 0.6 0.452 0.03 down CXCR1 target 0.3 0.139 0.002 down KCNK12 target 1.2 0.784 0.312 NS PCYB12 target 2.7 1.289 0.046 up
G ADPH (glyceraldehyde 3-phosphate dehydrogenase): refer-ence gene used for normalization of the expression values of the target genes. Target genes were RHO_57 (rhodopsin tran-script variant ENSGACT00000003757), RHO_60 (rhodopsin transcript variant ENSGACT00000003760), USP (ubiquitin-spe-cific protease), Tr_22897 (transcript ‘ENSGACT00000022897’), PLA2G12B (phospholipase 2 group XIIB), GLUT1 (glucose trans-porter 1), C2 (complement precursor), CXCR1 (interleukin-8 re-ceptor alpha), KCNK12 (potassium channel), PCYT1B (phos-phate cytidylyltransferase 1, choline, beta). Fold changes of the target genes are expression changes relative to the expression of the reference gene, which is by default 1. The direction of the changes in gene expression is indicated in the ‘Regulation’ col-umn. up are upregulated genes, down are downregulated genes and NS represents genes whose expression is not statistically dif-ferent from the reference gene.
Sanogo ! /Hankison ! /Band ! /Obregon ! /Bell !
Brain Behav Evol 12
rats exposed to cats when gene expression was assessed 20 min after exposure to a predator [Wang et al., 2003].
Some of the genes and pathways that were identified in this study have also been implicated in related studies. For example, 17 out of 909 differentially expressed genes (at p ! 0.01 cutoff) have been identified in previous stud-ies. These include, for example, SAMD4A, FGFR10P2, and CD99LD, which were identified during a selection response for contextual fear conditioning in rats using quantitative trait locus (QTL) and gene expression stud-ies [Ponder et al., 2008]; KEK4, MUB and HSPB1 were identified in fruit flies selected for aggressive behavior [Dierick and Greenspan, 2006] and PEX19 and DEDD were identified proximal to a QTL hotspot on mouse chromosome 1 that modulates behavior [Mozhui et al., 2008]. Similarly, the long-term synaptic depression (LTD) pathway, one of the most overrepresented pathways re-vealed in our study, has been associated with predator threat. LTD is an electrical correlate of the weakening of the connection between two neurons, thus leading to long-term reduction in the efficacy of neuronal synapsis as a consequence of a decrease in the density of postsyn-aptic receptors. Studies have shown that both acute and chronic stress [Yang et al., 2004; Holderbach et al., 2007], including exposure to predators [Kuzmiski et al., 2010; Kim and Diamond, 2002], can lead to LTD. LTD has also been associated with synaptic plasticity and memory for-mation [Bear, 1999; Malleret et al., 2010; Kim and Dia-mond, 2002].
Importantly, our study also identified many genes and biological pathways that have not been previously report-ed. For example, to the best of our knowledge PLA2G12B, RHO and GLUT1 have not yet been associated with ex-posure to predator stress. Similarly, our study is one of the first to report the activation of the RAN and the relaxin pathways in response to long-term exposure to predator cues. Different sets of genes in the brain respond to acute versus chronic stress [Krasnov et al., 2005], which might explain why there was some, but not complete, overlap between the differentially expressed genes found in this experiment compared to other experiments that have ex-amined the transcriptomic response to a single, brief ex-posure to predation risk [e.g. Wang et al., 2003].
Although sticklebacks mounted a transcriptomic re-sponse to repeated exposure to a predator, the overall magnitude of the response, as assessed by fold change, was relatively low. While some genes, such as RHO, had a high fold change, most genes were weakly differentially expressed. Other studies have also detected subtle tran-scriptomic responses to behavioral challenges such as predator threat [Wang et al., 2003] or aggression [Mukai et al., 2009]. One possible explanation for the relatively small changes in expression is that transcription profil-ing was conducted 24 h after repeated exposure to preda-tion risk. It is possible that the patterns we observed re-flect relatively long-term, enduring changes in the brain rather than transitory responses. Alternatively, or in ad-dition, it is possible that we measured the downstream
–8
GAPDH–3
2
7
12
17
524722
592632
Gen
e ex
pres
sion
(fol
d ch
ange
)RHO_57 RHO_60 PLA2B12B
GLUT1
MicroarrayqPCR_arrayqPCR_no array
CXCR1
PCYT1B
Fig. 3. qPCR validation of microarray gene expression in the brains of sticklebacks ex-posed to predator cues. The microarray re-sults are plotted next to the qPCR results for the samples used in the microarray(n = 7 experimental and n = 7 control), and the qPCR results for the independent bio-logical replicates not on the array (n = 2 experimental and n = 2 control).
Transcriptomic Response to a Predator in Sticklebacks
Brain Behav Evol 13
consequences of exposure to predation risk 24 h earlier. Detailed time-course experiments are needed to distin-guish the response to single (acute) versus repeated (chronic) exposures to predation risk across short (over the course of minutes) versus long (over the course of days to months) timescales. The stickleback system offers the opportunity to frame this question from an evolutionary perspective by comparing the genes that are involved in the plastic response to predation risk within an individ-ual’s lifetime with the genes that are involved in evolu-tionary divergence between different stickleback popula-tions in response to variation in predation pressure [Giles and Huntingford, 1984; Bell, 2005].
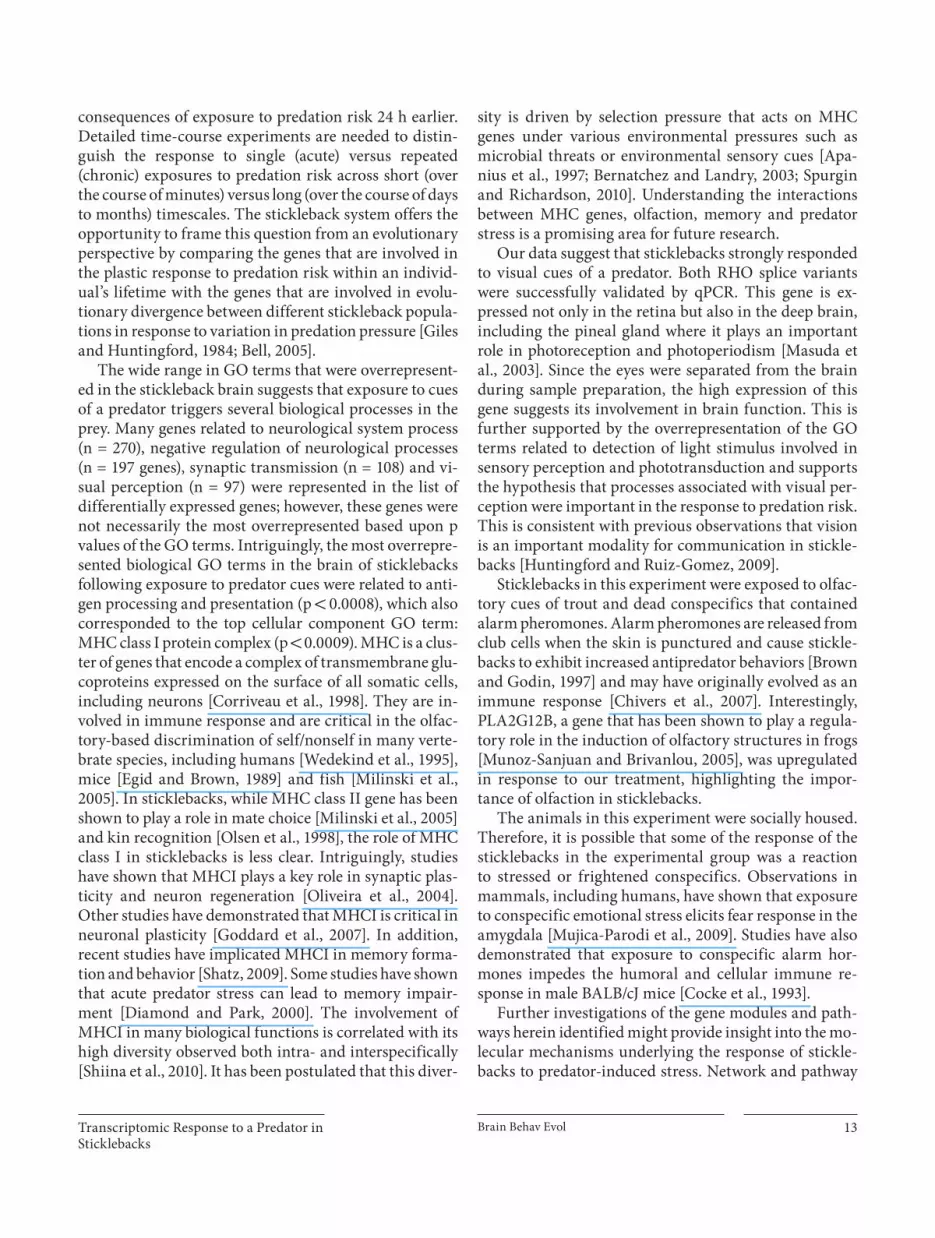
The wide range in GO terms that were overrepresent-ed in the stickleback brain suggests that exposure to cues of a predator triggers several biological processes in the prey. Many genes related to neurological system process (n = 270), negative regulation of neurological processes(n = 197 genes), synaptic transmission (n = 108) and vi-sual perception (n = 97) were represented in the list of differentially expressed genes; however, these genes were not necessarily the most overrepresented based upon p values of the GO terms. Intriguingly, the most overrepre-sented biological GO terms in the brain of sticklebacks following exposure to predator cues were related to anti-gen processing and presentation (p ! 0.0008), which also corresponded to the top cellular component GO term: MHC class I protein complex (p ! 0.0009). MHC is a clus-ter of genes that encode a complex of transmembrane glu-coproteins expressed on the surface of all somatic cells, including neurons [Corriveau et al., 1998]. They are in-volved in immune response and are critical in the olfac-tory-based discrimination of self/nonself in many verte-brate species, including humans [Wedekind et al., 1995], mice [Egid and Brown, 1989] and fish [Milinski et al., 2005]. In sticklebacks, while MHC class II gene has been shown to play a role in mate choice [Milinski et al., 2005] and kin recognition [Olsen et al., 1998], the role of MHC class I in sticklebacks is less clear. Intriguingly, studies have shown that MHCI plays a key role in synaptic plas-ticity and neuron regeneration [Oliveira et al., 2004]. Other studies have demonstrated that MHCI is critical in neuronal plasticity [Goddard et al., 2007]. In addition, recent studies have implicated MHCI in memory forma-tion and behavior [Shatz, 2009]. Some studies have shown that acute predator stress can lead to memory impair-ment [Diamond and Park, 2000]. The involvement of MHCI in many biological functions is correlated with its high diversity observed both intra- and interspecifically [Shiina et al., 2010]. It has been postulated that this diver-
sity is driven by selection pressure that acts on MHC genes under various environmental pressures such asmicrobial threats or environmental sensory cues [Apa - nius et al., 1997; Bernatchez and Landry, 2003; Spurgin and Richardson, 2010]. Understanding the interactions between MHC genes, olfaction, memory and predator stress is a promising area for future research.
Our data suggest that sticklebacks strongly responded to visual cues of a predator. Both RHO splice variants were successfully validated by qPCR. This gene is ex-pressed not only in the retina but also in the deep brain, including the pineal gland where it plays an important role in photoreception and photoperiodism [Masuda et al., 2003]. Since the eyes were separated from the brain during sample preparation, the high expression of this gene suggests its involvement in brain function. This is further supported by the overrepresentation of the GO terms related to detection of light stimulus involved in sensory perception and phototransduction and supports the hypothesis that processes associated with visual per-ception were important in the response to predation risk. This is consistent with previous observations that vision is an important modality for communication in stickle-backs [Huntingford and Ruiz-Gomez, 2009].
Sticklebacks in this experiment were exposed to olfac-tory cues of trout and dead conspecifics that contained alarm pheromones. Alarm pheromones are released from club cells when the skin is punctured and cause stickle-backs to exhibit increased antipredator behaviors [Brown and Godin, 1997] and may have originally evolved as an immune response [Chivers et al., 2007]. Interestingly, PLA2G12B, a gene that has been shown to play a regula-tory role in the induction of olfactory structures in frogs [Munoz-Sanjuan and Brivanlou, 2005], was upregulated in response to our treatment, highlighting the impor-tance of olfaction in sticklebacks.
The animals in this experiment were socially housed. Therefore, it is possible that some of the response of the sticklebacks in the experimental group was a reactionto stressed or frightened conspecifics. Observations in mammals, including humans, have shown that exposure to conspecific emotional stress elicits fear response in the amygdala [Mujica-Parodi et al., 2009]. Studies have also demonstrated that exposure to conspecific alarm hor-mones impedes the humoral and cellular immune re-sponse in male BALB/cJ mice [Cocke et al., 1993].
Further investigations of the gene modules and path-ways herein identified might provide insight into the mo-lecular mechanisms underlying the response of stickle-backs to predator-induced stress. Network and pathway
Sanogo ! /Hankison ! /Band ! /Obregon ! /Bell !
Brain Behav Evol 14
References
Apanius V, Penn D, Slev PR, Ruff LR, Potts WK (1997): The nature of selection on the major histocompatibility complex. Crit Rev Immu-nol 17: 179–224.
Baker JA, Foster SA, Heins DC, Bell MA, King RW (1998): Variation in female life-history traits among Alaskan populations of the threespine stickleback, Gasterosteus aculea-tus L. (Pisces: Gasterosteidae). Biol J Linn Soc Lond 63: 141–159.
Bear MF (1999): Homosynaptic long-term de-pression: a mechanism for memory? Proc Natl Acad Sci USA 96: 9457–9458.
Bell AM (2005): Behavioural differences be-tween individuals and two populations of stickleback (Gasterosteus aculeatus) . J Evol Biol 18: 464–473.
Bell AM, Backstrom T, Huntingford FA, Pot-tinger TG, Winberg S (2007): Variable neu-roendocrine responses to ecologically-rele-vant challenges in sticklebacks. Physiol Be-hav 91: 15–25.
Bell AM, Dingemanse NJ, Hankison S, Langen-hof M, Rollins, K (2011): Early exposure to nonlethal predation risk by size-selective predators increases somatic growth and de-creases size at adulthood in threespined sticklebacks. J Evol Biol 24: 943–945.
Bell AM, Henderson L, Huntingford FA (2010): Behavioral and respiratory responses to stressors in multiple populations of three-spined sticklebacks that differ in predation pressure. J Comp Physiol B 180: 211–220.
Bell AM, Sih A (2007): Exposure to predation generates personality in threespined stickle-backs. Ecol Lett10: 828–834.
Bell MA, Foster SA (1994): Introduction to the evolutionary biology of the threespine stick-leback; in Bell MA, Foster SA (eds): The Evo-lutionary Biology of the Threespine Stickle-back. Oxford, Oxford University Press, pp 1–27.
Benjamini Y, Hochberg Y (1995): Controlling the false discovery rate: a practical and pow-erful approach to multiple testing. J R Stat Soc Ser B (Methodological) 57: 289–300.
Bernatchez L, Landry C (2003): MHC studies in nonmodel vertebrates: what have we learned about natural selection in 15 years? J Evol Biol 16: 363–377.
Blanchard DC, Canteras NS, Markham CM, Pentkowski NS, Blanchard RJ (2005): Le-sions of structures showing FOS expression to cat presentation: effects on responsivity to a cat, cat odor, and nonpredator threat. Neu-rosci Biobehav Rev 29: 1243–1253.
Bourgon R, Gentleman R, Huber W (2010): In-dependent filtering increases detection pow-er for high-throughput experiments. Proc Natl Acad Sci USA 107: 9546–9551.
Brown GE, Godin JJ (1997): Anti-predator re-sponses to conspecific and heterospecific skin extracts by threespine sticklebacks: alarm pheromones revisited. Behaviour 134: 1123–1134.
Brown MM, Williams TD, Chipman JK, Katsia-daki I, Sanders M, Craft JA (2008): Con-struction of subtracted EST and normalised cDNA libraries from liver of chemical-ex-posed three-spined stickleback (Gasteros-teus aculeatus) containing pollutant-respon-sive genes as a resource for transcriptome analysis. Mar Env Res 66: 127–130.
Cairns MT, Johnson MC, Talbot AT, Pernma-sani JK, McNeill RE, Houeix B, Sangrador-Vegas A, Pottinger, TG (2008): A cDNA mi-croarray assessment of gene expression in the liver of rainbow trout (Oncorhynchus mykiss) in response to a handling and con-finement stressor. Comp Biochem Physiol D Genomics Proteomics 3: 51–66.
Calduch-Giner JA, Davey G, Saera-Vila A, Houeix B, Talbot A, Prunet P, Cairns MT, Perez-Sanchez J (2010): Use of microarray technology to assess the time course of liver stress response after confinement exposure in gilthead sea bream ( Sparus aurata L.). BMC Genomics 11:No. 193.
Calza S. Raffelsberger W, Ploner A, Sahel J, Le-veillard T, Pawitan J (2007): Filtering genes to improve sensitivity in oligonucleotide mi-croarray data analysis. Nucleic Acids Res 35:e102.
Cantor C (2009): Post-traumatic stress disorder: evolutionary perspectives. Aust NZJ Psychi-atry 43: 1038–1048.
analyses revealed that genes differentially expressed as a result of exposure of sticklebacks to predator cues are clustered in gene modules. This was also supported by the clusters observed in the hierarchical clustering in the heat map ( fig.!2 ). For example, gene regulatory networks that involve neurological diseases, developmental disorders and psychological disorders as well as cell signaling, nu-cleic acid metabolism, cellular assembly and organization were revealed using network analysis. Future studies will compare the expression of these genes across different populations of sticklebacks that vary in predation pres-sure, and will pharmacologically manipulate the path-ways in order to infer a causal relationship between expo-sure to predators and behavior.
In conclusion, this study examined the gene expres-sion pattern in the brain of sticklebacks under conditions that mimic naturally high predation pressure in the wild. We showed that repeated exposure to cues of a predator results in significant differential expression of genes in-volved in immune response, synaptic processes, brain
metabolic processes and visual perception. Gene func-tional annotation and gene ontology and pathway analy-ses identified several biological and molecular processes that might be activated as a response to predation risk. The radiation of sticklebacks along with growing genom-ic resources [Kingsley and Peichel, 2007; Brown et al., 2008; Geoghegan et al., 2008; Williams et al., 2008; Leder et al., 2009] and its well-characterized biology, make this organism a suitable model system for investigating the molecular and physiological responses of the brain to ecologically relevant selection pressures that have influ-enced their evolution.
Acknowledgments
We would like to thank Jenny Drnevich for help with statis-tical analysis in R Bioconductor, and Tom Newman and Gene Robinson for access to their qPCR machine. This study wassupported by a grant from the National Institutes of Health, R01 GM082937, to A.M.B. and M.B.
Transcriptomic Response to a Predator in Sticklebacks
Brain Behav Evol 15
Carvalho B, Bengtsson H, Speed TP, IrizarryRA (2007): Exploration, normalization, and genotype calls of high-density oligonucle-otide SNP array data. Biostatistics 8: 485–499.
Chan YF, Marks ME, Jones FC, Villarreal G Jr, Shapiro MD, Brady SD, Southwick AM, Ab-sher DM, Grimwood J, Schmutz J, Myers RM, Petrov D, Jonsson B, Schluter D, Bell A, Kingsley DM (2010): Adaptive evolution of pelvic reduction in sticklebacks by recurrent deletion of a Pitx1 enhancer. Science 327: 302–305.
Ching B, Jamieson S, Heath JW, Heath DD, Hub-berstey A (2010): Transcriptional differences between triploid and diploid Chinook salm-on (Oncorhynchus tshawytscha) during live Vibrio anguillarum challenge. Heredity 104: 224–234.
Chivers DP, Wisenden BD, Hindman CJ, Micha-lak TA, Kusch RC, Kaminskyj SG, Jack KL, Ferrari MC, Pollock RJ, Halbgewachs CF, Pollock MS, Alemadi S, James CT, Savaloja RK, Goater CP, Corwin A, Mirza RS, Kies-ecker JM, Brown GE, Adrian JC Jr, Krone PH, Blaustein AR, Mathis A (2007): Epider-mal ‘alarm substance’ cells of fishes main-tained by non-alarm functions: possible de-fence against pathogens, parasites and UVB radiation. Proc Biol Sci 274: 2611–2619.
Cocke R, Moynihan JA, Cohen N, Grota LJ, Ader R (1993): Exposure to conspecific alarmchemosignals alters immune responses in BALB/c mice. Brain Behav Immun 7: 36–46.
Colosimo PF, Hosemann KE, Balabhadra S, Vil-larreal G Jr, Dickson M, Grimwood J,Schmutz J, Myers RM, Schluter D, Kingsley DM (2005): Widespread parallel evolution in sticklebacks by repeated fixation of ectodys-plasin alleles. Science 307: 1928–1933.
Comoli E, Ribeiro-Barbosa ER, Canteras NS (2003): Predatory hunting and exposure to a live predator induce opposite patterns of Fos immunoreactivity in the PAG. Behav Brain Res 138: 17–28.
Corriveau RA, Huh GS, Shatz CJ (1998): Regula-tion of class I MHC gene expression in the developing and mature CNS by neural activ-ity. Neuron 21: 505–520.
Craig P M, Hogstrand C, Wood CM, McClelland GB (2009): Gene expression endpoints fol-lowing chronic waterborne copper exposure in a genomic model organism, the zebrafish, Danio rerio . Physiol Genomics 40: 23–33.
Cresko WA, Amores A, Wilson C, Murphy J, Currey M, Phillips P, Bell MA, Kimmel CB, Postlethwait JH (2004): Parallel genetic basis for repeated evolution of armor loss in Alas-kan threespine stickleback population. Proc Nat Acad Sci 101: 6050–6055.
Diamond DM, Park CR (2000): Predator ex-posure produces retrograde amnesia and blocks synaptic plasticity. Progress toward understanding how the hippocampus is af-fected by stress. Ann NY Acad Sci 911: 453–455.
Dierick HA, Greenspan J (2006): Molecular analysis of f lies selected for aggressive be-havior. Nat Genet 38: 1023–1031.
Dingemanse NJ, Van der Plas F, Wright J, Reale D, Schrama M, Roff DA, Van der Zee E, Bar-ber I (2009): Individual experience and evo-lutionary history of predation affect expres-sion of heritable variation in fish personality and morphology. Proc Biol Sci 276: 1285–1293.
Egid K, Brown JL (1989): The major histocom-patibility complex and female mating prefer-ence in mice. Anim Behav 38: 548–549.
Feldman AJ, Costouros NG, Wang E, Qian M, Marincola FM, Alexander HR, Libutti SK (2002): Advantages of mRNA amplification for microarray analysis. Biotechniques 33: 906–914.
Garrett SH, Somji S, Sens MA, Zhang K, Sens DA (2011): Microarray analysis of gene expres-sion patterns in human proximal tubule cells over a short and long time course of cadmi-um exposure. J Toxicol Environ Health 74: 24–42.
Geoghegan F, Katsiadaki I, Williams, TD, Chip-man JK (2008): A cDNA microarray for the three-spined stickleback, Gasterosteus acu-leatus L., and analysis of the interactive ef-fects of oestradiol and dibenzanthracene ex-posures. J Fish Biol 72: 2133–2153.
Giles N, Huntingford FA (1984): Predation risk and inter-population variation in antipreda-tor behaviour in the threespined stickleback. Anim Behav 32: 264–275.
Goddard CA, Butts DA, Shatz CJ (2007): Regula-tion of CNS synapses by neuronal MHC class I. Proc Natl Acad Sci 104: 6828–6833.
Holderbach R, Clark K, Moreau JL, Bischofber-ger J, Normann C (2007): Enhanced long-term synaptic depression in an animal mod-el of depression. Biol Psychiatry 62: 92–100.
Huntingford FA, Ruiz-Gomez ML (2009): Three-spined sticklebacks Gasterosteus acu-leatus as a model for exploring behavioural biology. J Fish Biol 75: 1943–1976.
Huntingford FA, Wright PJ, Tierney JF (1994): Adaptive variation and antipredator behav-iour in threespine stickleback; in Bell MA, Foster SA (eds): The Evolutionary Biology of the Threespine Stickleback. Oxford, Oxford University Press, pp 277–295.
Irizarry RA, Bolstad BM, Collin F, Cope LM, Hobbs B, Speed TP (2003): Summaries of af-fymetrix GeneChip probe level data. Nucleic Acids Res 31:e15.
Kelley JL, Magurran AE (2003): Learned preda-tor recognition and antipredator responses in fishes. Fish Fish 4: 216–226.
Kennerly E, Ballmann A, Martin S, Wolfinger R, Gregory S, Stoskopf M, Gibson G (2008): A gene expression signature of confinement in peripheral blood of red wolves (Canis rufus). Mol Ecol 17: 2782–2791.
Kim JJ, Diamond D (2002): The stressed hippo-campus, synaptic plasticity and lost memo-ries. Nat Rev Neurosci 3: 453–462.
Kingsley DM, Peichel CL (2007): The molecular genetics of evolutionary change in stickle-backs; in Östlund-Nilsson O, Mayer I, Hun-tingford FA (eds): Biology of the Three-Spined Stickleback. Boca Raton, CRC Press.
Krasnov A, Koskinen H, Pehkonen P, Rexroad CE, Afanasyev S, Molsa H (2005): Gene ex-pression in the brain and kidney of rainbow trout in response to handling stress. BMC Genomics 6: 3.
Kuzmiski JB, Marty V, Baimoukhametova DV, Bains JS (2010). Stress-induced priming of glutamate synapses unmasks associative short-term plasticity. Nat Neurosci 13: 1257–1264.
Leder EH, Merila J, Primmer CR (2009): A flex-ible whole-genome microarray for transcrip-tomics in three-spine stickleback (Gasteros-teus aculeatus). BMC Genomics 10: 426.
Magurran AE (1990): The inheritance and devel-opment of minnow antipredator behavior. Anim Behav 39: 834–842.
Malleret G, Alarcon JM, Martel G, Takizawa, S, Vronskaya S, Yin D, Chen IZ, Kandel ER, Shumyatsky GP (2010): Bidirectional regula-tion of hippocampal long-term synaptic plasticity and its influence on opposing forms of memory. J Neurosci 30: 3813–3825.
Marchinko KB (2009): Predation’s role in repeat-ed phenotypic and genetic divergence of ar-mor in threespine stickleback. Evolution 63: 127–138.
Masuda T, Iigo M, Mizusawa K, Aida K (2003): Retina-type rhodopsin gene expressed in the brain of a teleost, ayu (Plecoglossus altivelis) . Zoolog Sci 20: 989–997.
McEwen BS (2007): Physiology and neurobiolo-gy of stress and adaptation: central role of the brain. Physiol Rev 87: 873–904.
Milinski M, Griffiths S, Wegner KM, Reusch TB, Haas-Assenbaum A, Boehm T (2005): Mate choice decisions of stickleback females pre-dictably modified by MHC peptide ligands. Proc Natl Acad Sci 102: 4414–4418.
Moodie GEE (1972): Predation, natural selection and adaptation in an unusual threespine stickleback. Evolution 28: 167.
Mori T, Kawachi H, Imai C, Sugiyama M, Ku-rata Y, Kishida O, Nishimura K (2009): Iden-tification of a novel uromodulin-like gene related to predator-induced bulgy morph in anuran tadpoles by functional microarray analysis. PLoS One 4:e5936.
Motta SC, Goto M, Gouveia FV, Baldo MV, Can-teras NS, Swanson LW (2009): Dissecting the brain’s fear system reveals the hypothalamus is critical for responding in subordinate con-specific intruders. Proc Natl Acad Sci 106: 4870–4875.
Mozhui K, Ciobanu DC, Schikorski T, Wang X, Lu L, Williams RW (2008): Dissection of a QTL hotspot on mouse distal chromosome 1 that modulates neurobehavioral phenotypes and gene expression. PLoS Genet 4:e1000260.
Sanogo ! /Hankison ! /Band ! /Obregon ! /Bell !
Brain Behav Evol 16
Mujica-Parodi LR, Strey HH, Frederick B, Savoy R, Cox D, Botanov Y, Tolkunov D, Rubin D, Weber J (2009): Chemosensory cues to con-specific emotional stress activate amygdala in humans. PLoS One 4:e6415.
Mukai M, Replogle K, Drnevich J, Wang G, Wacker D, Band M, Clayton DF, Wingfield JC (2009): Seasonal differences of gene ex-pression profiles in song sparrow (Melospiza melodia) hypothalamus in relation to terri-torial aggression. PLoS One 4:e8182.
Munoz-Sanjuan I, Brivanlou AH (2005): Induc-tion of ectopic olfactory structures and bone morphogenetic protein inhibition by Rossy, a group XII secreted phospholipase A 2 . Mol Cell Biol 25: 3608–3619.
Nanda SA, Qi C, Roseboom PH, Kalin NH (2008): Predator stress induces behavioral inhibition and amygdala somatostatin re-ceptor 2 gene expression. Genes Brain Behav 7: 639–648.
Oliveira AL, Thams S, Lidman O, Piehl F, Hok-felt T, Karre K, Linda H, Cullheim, S (2004): A role for MHC class I molecules in synaptic plasticity and regeneration of neurons after axotomy. Proc Natl Acad Sci 101: 17843–17848.
Olsen KH, Grahn M, Lohm J, Langefors A (1998): MHC and kin discrimination in juve-nile arctic charr, Salvelinus alpinus (L.). Anim Behav 56: 319–327.
Peichel CL, Nereng KS, Ohgi KA, Cole BL, Co-losimo PF, Buerkle CA, Schluter D, Kingsley, DM (2001): The genetic architecture ofdivergence between threespine stickleback species. Nature 414: 901–905.
Pfaffl MW, Horgan GW, Dempfle L (2002): Rel-ative expression software tool (REST) for group-wise comparison and statistical anal-ysis of relative expression results in real-time PCR. Nucleic Acids Res 30:e36.
Polacek DC, Passerini AG, Shi C, Francesco NM, Manduchi E, Grant GR, Powell S, Bischof H, Winkler H, Stoeckert CJ Jr, Davies PF (2003): Fidelity of enhanced sensitivity of differen-tial transcription profiles following linear amplification of nanogram amounts of en-dothelial mRNA. Physiol Genomics 13: 147–156.
Ponder CA, Huded CP, Munoz MB, Gulden FO, Gilliam TC, Palmer AA (2008): Rapid selec-tion response for contextual fear condition-ing in a cross between C57BL/6J and A/J: be-havioral, QTL and gene expression analysis. Behav Genet 38: 277–291.
R Development Core Team (2009): R : A Lan-guage and Environment for Statistical Com-puting. R Foundation for Statistical Com-puting, Vienna. ISBN 3-900051-07-0 , URL http://www.R-Project.Org.
Reimchen TE (1980): Spine deficiency and poly-morphism in a population of Gasterosteus aculeatus – an adaptation to predators. Can J Zool 58: 1232–124.
Reimchen TE (1994): Predators and morpho-logical evolution in threespine stickleback; in Bell MA, Foster SA (eds): The Evolution-ary Biology of the Threespine Stickleback. Oxford, Oxford University Press, pp 240–273.
Roseboom PH, Nanda, SA, Bakshi VP, Trentani A, Newman SM, Kalin NH (2007): Predator threat induces behavioral inhibition, pitu-itary-adrenal activation and changes in amygdala CRF-binding protein gene expres-sion. Psychoneuroendocrinology 32: 44–55.
Shapiro MD, Marks ME, Peichel CL, Blackman BK, Nereng KS, Jonsson B, Schluter D,Kingsley, DM (2004): Genetic and develop-mental basis of evolutionary pelvic reduc - tion in threespine sticklebacks. Nature 428: 717–723.
Shatz CJ (2009): MHC class I: an unexpected role in neuronal plasticity. Neuron 64: 40–45.
Shiina T, Ota M, Shimizu S, Katsuyama Y, et al (2006): Rapid evolution of major histocom-patibility complex class I genes in primates generates new disease alleles in humans via hitchhiking diversity. Genetics 173: 1555–1570.
Spurgin LG, Richardson DS (2010): How patho-gens drive genetic diversity: MHC, mecha-nisms and misunderstandings. Proc Biol Sci 277: 979–988.
Tulley TJ, Huntingford FA (1987): Paternal care and the development of adaptive variation in anti-predator responses in sticklebacks. Anim Behav 35: 1570–1572.
Wang H, Zhu YZ, Wong PT, Farook JM, Teo AL, Lee LK, Moochhala S (2003): cDNA microar-ray analysis of gene expression in anxious PVG and SD rats after cat-freezing test. Exp Brain Res 149: 413–421.
Wedekind C, Seebeck T, Bettens F, Paepke AJ (1995): MHC-dependent mate preferences in humans. Proc Biol Sci 260: 245–249.
Williams TD, Brown M, Chipman JK, et al (2008): Development of a stickleback (Gas-terosteus aculeatus) cDNA microarray and gene expression responses to dibenzanthra-cene, ethinyl-estradiol and copper. Marine Environ Res 66:140–140.
Wootton RJ (1976): The Biology of the Stickle-back. London, Academic Pre ss .
Yang Y, Zheng X, Wang Y, Cao J, Dong Z, Cai J, Sui N, Xu L (2004): Stress enables synaptic depression in CA1 synapses by acoustic and chronic morphine: Possible mechanisms for corticosterone on opiate addiction. J Neuro-sci 24: 2412–2420.