boys and girls' changing educational opportunities in thailand: the effects of siblings,...
TRANSCRIPT
O f f i c e o f P o p u l a t i o n R e s e a r c h P r i n c e t o n U n i v e r s i t y W O R K I N G P A P E R S E R I E S
Boys and Girls’ Changing Educational Opportunities in Thailand: The Effects of Siblings, Migration and Village Location
Sara Curran Department of Sociology
Princeton University Wallace Hall
Princeton, NJ 08544 [email protected]
Wendy Cadge
Department of Sociology Princeton University
Wallace Hall Princeton, NJ 08544
Anchalee Varangrat
Institute for Population and Social Research Mahidol University
Salaya, Nakhom Prathom, Thailand
Chang Chung Office of Population Research
Wallace Hall Princeton University
Acknowledgements: Special thanks to the Institute for Population and Social Research and CEP-CPC Project at the University of North Carolina for access to the data.
Papers published in the OPR Working Paper Series reflect the views of individual authors. They may be cited in other publications, but are intended to be work-in-progress. Comments are welcome. Additional copies are available by writing to the Office of Population Research Working Paper Series, Princeton University, Wallace Hall, Second Floor, Princeton, NJ 08544. Fax: (609) 258-1039. Or on the web,http://opr.princeton.edu/.
* p<=.05; **p<=.01; Curran - 1
Boys and Girls’ Changing Educational Opportunities in Thailand: The Effects of Siblings, Migration and Village Location
Abstract
This paper uses unique data to explore, at multiple levels, the correlates and causes of increasing educational opportunity and declining gender inequality in education in rural Thailand. We examine three correlates of educational opportunity that are of theoretical and empirical interest: sibling number, gender, migration and the relative location of primary and secondary schools. The relationship among these correlates and children’s educational opportunities is considered through the lens of the household economy literature in the context of social change and economic development in Thailand. The longitudinal data capture one period of rapid economic development in Thailand between 1984 and 1994 and include information about more than 5,000 households, their members, and the 51 communities in which they live.
Curran - 2
Changing Educational Opportunities in Thailand:
The Effects of Gender, Siblings, Migration, and Village Location Introduction As developing societies are integrated into the global economy, the perceived
value of education tends to increase in national governments, communities, families, and
among individuals. Individuals’ levels of educational attainment tend to rise as a result,
though the paths towards increasing educational attainment are not always linear and not
all members of a population are equally affected. Differences between boys’ and girls’
educational attainments are one of the most common expressions of this inequality in
which boys are more often favored for continued schooling (United Nations
Development Program 1995; King 1991; King and Hill 1991). Until recently this was
also the case in Thailand.
Periods of rapid economic development began in Thailand during the 1980s, and
early evidence showed girls’ total levels of education continuing to lag behind the
educational attainments of boys’(Suvannathat 1989). Recent data analysis from the 1990
census, however, indicates a narrowing or closing of the gender gap across all levels of
schooling, except at the tertiary level where there has been a crossover and a growing gap
in favor of girls (Knodel 1997). The mechanisms through which economic development
leads to changing levels of educational attainment have not yet been completely
explained. Knodel (1997) suggests that these trends result partially from changing
attitudes about family size and son preference and changes in the socioeconomic context
that favor both men’s and women’s labor force participation. His conclusions are drawn
from a series of focus groups held throughout Thailand at the end of the 1980s and the
Curran - 3
beginning of the 1990’s, conclusions, which have not been rigorously tested with
quantitative data. This study is uniquely situated to follow-up on Knodel’s qualitative
insights with a quantitative, longitudinal study that investigates the question; how have
Thais’ educational levels changed over time by gender and what factors help to explain
those changes?
We draw on three different literatures to derive hypotheses about the importance
of sibling characteristics, household economics, and community resources for predicting
educational attainment and changes in educational attainment in Thailand during the ten-
year period (1984-1994) in which there was the most dramatic shift. We examine
hypotheses about whether changes in the number of siblings influenced changing
educational opportunities. We also examine the role of migration among other household
members for either inhibiting or promoting educational attainment. Finally, we examine
community level resources for their possible influence upon educational attainment,
including relative location of primary and secondary schools (including changes in
relative location over time). This limited set of variables is derived from an examination
of the broader literatures about the character of economic and social change in Thailand,
the literature about fertility declines and the value of children, and the literature about
intra-household resource allocation. By examining the case of Thailand we hope to draw
some lessons that might hold true for other settings or be suggestive of policy
prescriptions in other developing country settings.
We apply our hypotheses to a data set, which has not been fully exploited,
especially with regards to changes in educational attainment. The data are linked panel
data from 1984 and 1994 of individuals (N=30,000+), households (N=5000+), and
Curran - 4
communities (N=51) from one rural district in Northeastern Thailand. Information was
collected at both time periods about all individuals and households in all of the
communities. Although the data come from just one district in Northeastern Thailand, it
is one of the largest districts, representative of one of the poorest regions of the country
that has experienced the greatest change in social and economic development. Thus, we
would expect to witness the most variability in both our dependent and independent
variables over time. The timing of the data collection also offers a unique opportunity to
test hypotheses, since there is no other data set, similarly situated with prospective
capabilities in Thailand.
In the next section of the paper a brief description of the Thai context is provided,
as well as an overview of the relevant literature on education in developing countries. A
set of hypotheses is then generated which proposes explanations for the closing
secondary education gap between boys and girls. This will be followed by a description
of the data, definitions of variables, and the methodologies employed. The results of the
analysis are discussed in light of the proposed hypotheses and related to previous
research. A brief conclusion will summarize findings, suggest avenues for future
research, and discuss implications for education and development policy.
Brief Background Thailand is on the Indo-Chinese peninsula of Southeast Asia neighboring
Malaysia, Burma, Cambodia, and Laos. Theravada Buddhism is the prominent religion
though Islam is practiced in parts of the south (bordering Malaysia). It is also the only
country of the region never to have been colonized. Its geographic location, cultural
underpinnings, and historic past have been offered as explanations for a variety of social
Curran - 5
and economic differences, especially concerning the relative status of women and the
rapid rate of economic development which set it apart from its neighbors. Thailand
experienced the fastest economic growth rate in the region during the 1980s with an
average increase in Gross Domestic Product of 10% annually, though this rapid economic
growth was not uniform (Warr 1993; Slagter and Kerbo 2000). Thailand remains a
predominantly rural country with more than 65% of the populace living in the
countryside. More than 30% of the rural population lives in absolute poverty and income
inequality appears to be growing ((United Nations Development Program 1994; Warr
1993). Poor conditions are particularly evident in Northeast Thailand in which people are
disadvantaged economically and educationally relative to the rest of the country, even
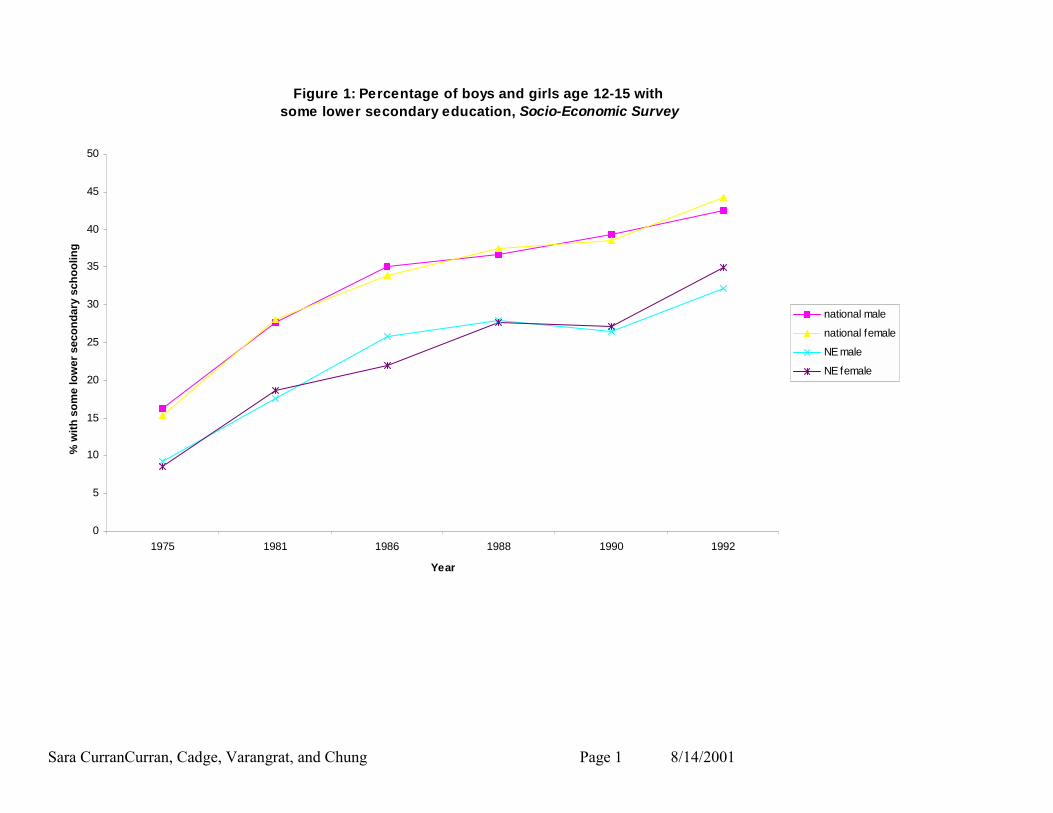
into the late 1980s (Fry and Kempner 1996). No other study has compared gender across
educational outcomes in the region, but the data for this analysis show that both boys and
girls in the Northeast lag behind their counterparts in other parts of the country. The
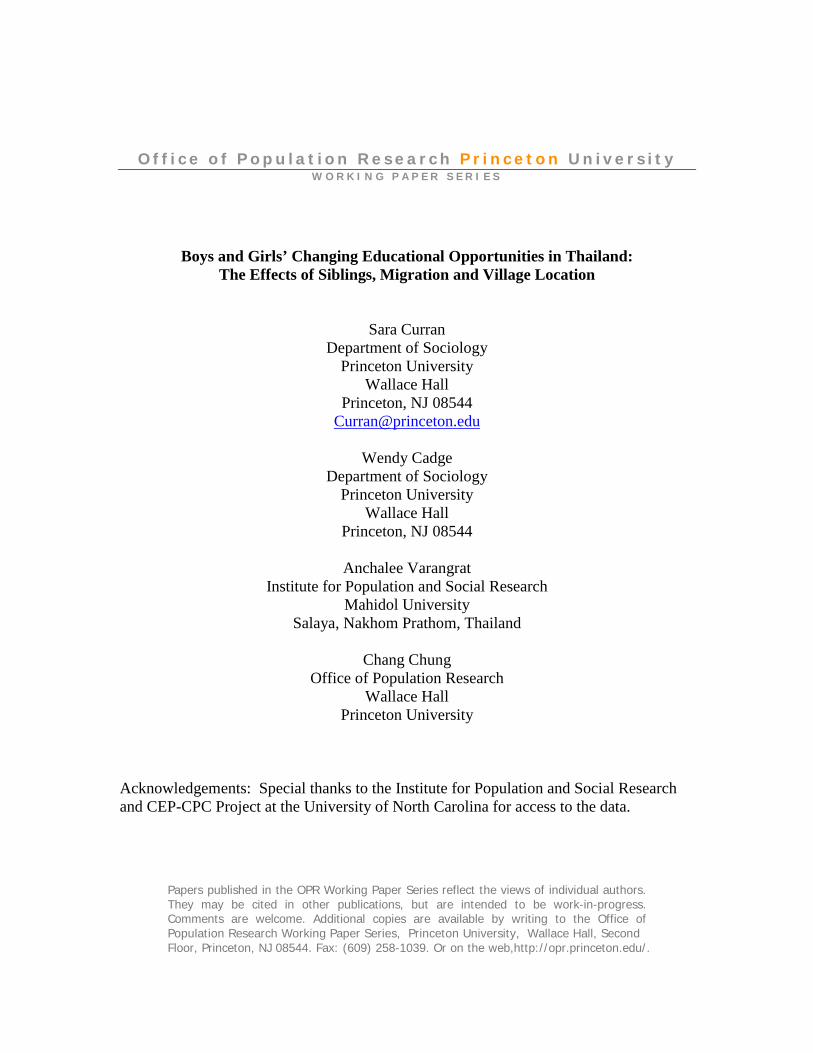
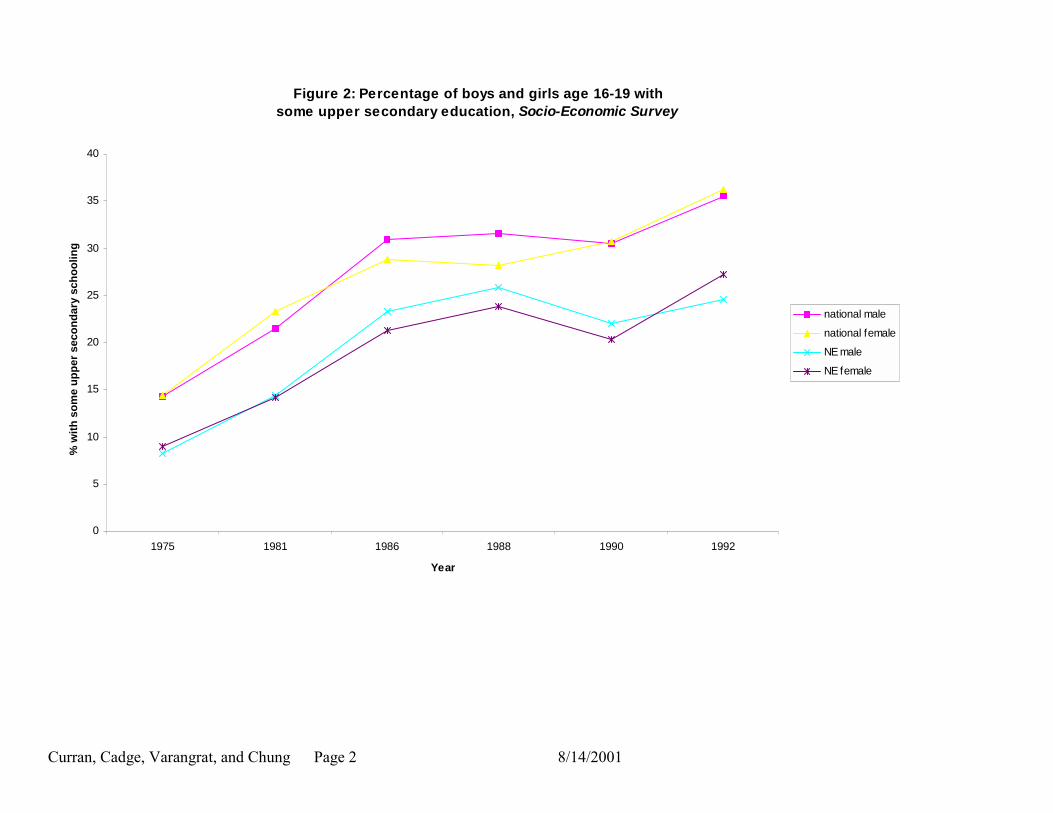
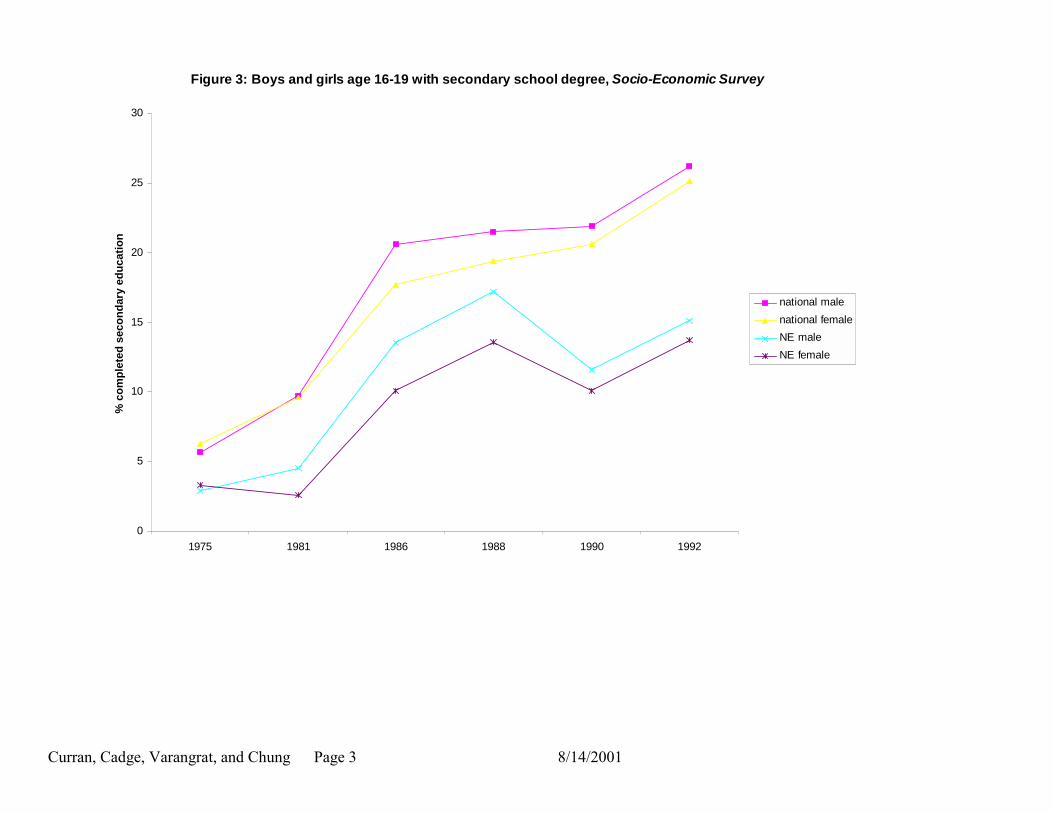
gender gap in education, however, is closing as it is in the country as a whole. Figures 1
through 3 show the narrowing of the education gender gap during the 1980’s for the
country as a whole and for the Northeast region, using data from the Thai National
Statistical Office (the Socio-Economic Survey). Access to lower secondary school shows
little difference for boys and girls at the national level, but in the Northeast the gap
expands and narrows precisely during the time period covered by the survey we will be
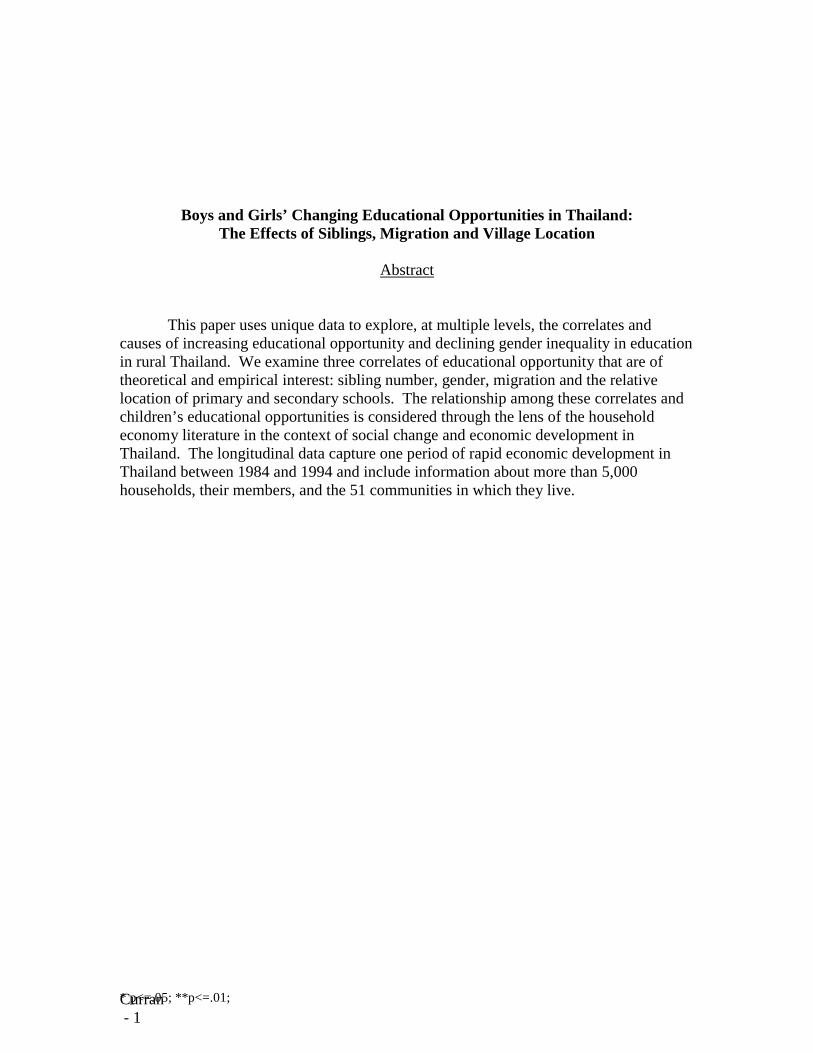
analyzing (Figure 1). Access to upper secondary school shows a longer period for which
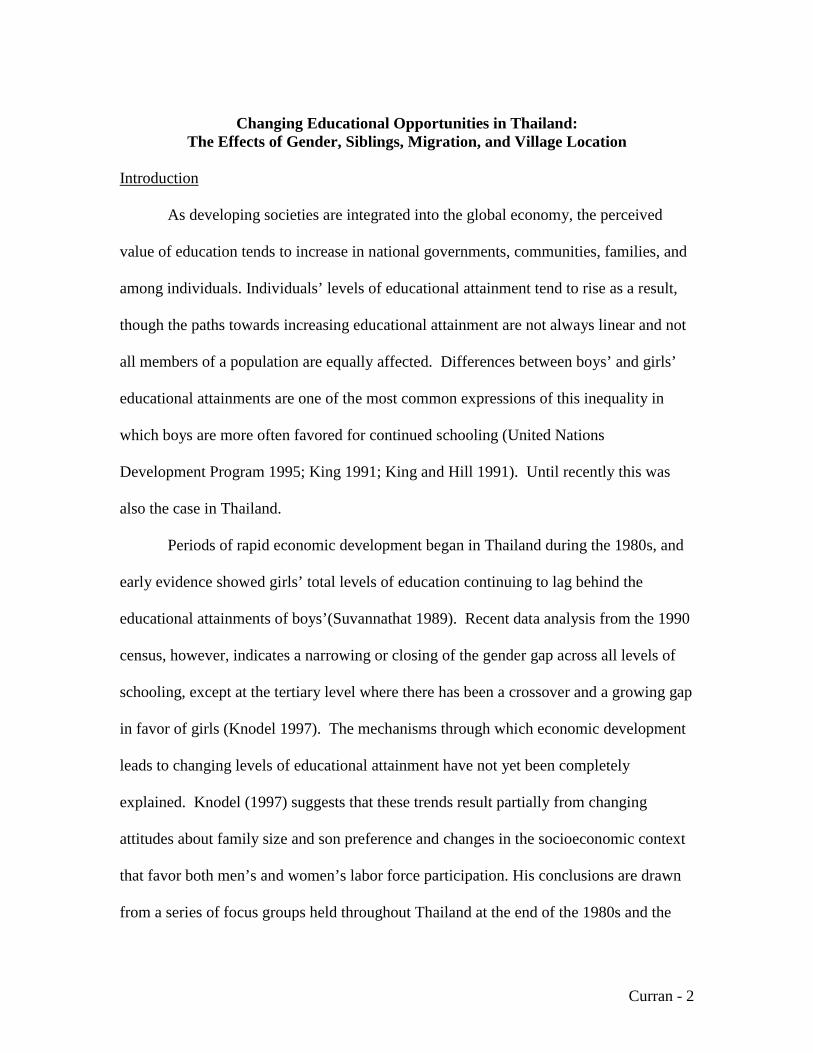
a gender gap exists at both the national and regional levels (Figure 2), and secondary
school completion rates are significantly different for men and women at both the
national and regional level throughout the 1980s but narrow in the early 1990s (Figure 3).
Curran - 6
We seek to explain this change in access to schooling by looking prospectively at young
people’s education opportunities.
Before continuing further we should note something about the characteristics of
the Thai schooling system. Between 1960 and 1978 primary education was mandatory
through four grades, whereupon mandatory education became mandated through six
years of schooling. Secondary education is divided into two levels, lower level and upper
level, each for three years. In 1997, these mandatory levels were again changed and
mandated through nine years of schooling. However, the building rate of the necessary
school infrastructure has lagged significantly behind these mandated levels. It should be
noted that dropout rates are low within any level and that the critical periods of decision-
making are between primary and lower secondary and between lower and upper
secondary.
Prior to the establishment of a uniform national education system at the beginning
of the 20th century, literacy was gained through study in Buddhist temples and this
opportunity was only available to males as part of preparation for entry into
monkhood(Keyes 1991). Since the 1930’s primary schooling was mandated for both
boys and girls as a way to unite a disparate country and supersede local political power
structures and local patronage systems (Keyes 1991). At this time, schooling became an
entry point for access to a new source of patronage through the national government.
Since the 1980s as Thailand’s export oriented market driven economic policies became
more important, education became crucially important for both men and women to
achieve upward mobility. More recently, growing demands for higher skilled labor have
increased the returns to secondary education investments, a previously under invested

Curran - 7
sector in the Thai economy(Sussangkarn 1993). Returns to secondary education in the
urban labor market are twice those of primary education (Sussangkarn 1993). However,
gendered labor markets and not surprisingly, gender differences in education remain,
especially in the Northeastern region of the country. Villagers in the study site are well
aware of the gender differential in the labor market and its relationship to education. In
1992 an explanation offered by one 19 year-old woman, was an oft heard refrain:
One 19 year-old woman said in an in-depth interview: "If girls and boys finish 4th or 6th grade, usually girls will find work more easily because they can sew and usually industrial factories have sewing. A boy who finishes at this level will have trouble finding work." And, another 24 year-old woman in a different in-depth interview said: "Most industrial factories want women. They only want men who have a high education, like artisans or professionals. They can then find work. Even if they finish 9th grade men have a hard time finding work."
Further, parents viewed education as a double-edged sword, as both an investment in
non-agricultural futures and a challenge to traditional familial hierarchies associated with
filial obligation and respect. As one young woman explained to me in 1992:
"My parents are conservative. They would not send their children. Back then even for 6th grade they would not send us. They said only go to 4th grade. We had already made my school uniform and they said there would not be anyone to work the fields. They said 'you study and then are naughty, you may have a husband too soon. Why should you study?' So, I did not go." And in a focus group interview with women 40-55 years old, the following was said: I asked:”Your child who finished grade 6 and your child who finished high school, are they different from each other? Do they have different jobs?” One woman replied: “They are different. Those who study are unable to farm. They have enjoyed a comfortable life for a long time. However, those who finish grade 6, they can farm. They are work harder. Those who study at a higher level do not work hard in the fields.” Another woman added: “They do not like to farm, they like to other things. They like light work. They do not like strenuous jobs.”
Despite these biases, which might work against girls’ education opportunities, as Knodel
has also noted(Knodel 1997), daughters are perceived as more diligent and harder
Curran - 8
working at their studies. Thus, although they may have slightly lower risks of access to
making the education transition from primary to lower secondary, once they have made it
to lower secondary then they may be more likely to continue to upper secondary than
boys.
Several things have changed within the Thai context and specifically in the
Northeastern region that may suggest a possible diminishment in gender differences in
education over the decades. First, fertility has declined dramatically. Although for a
majority of the sample in this analysis, family sizes are still quite large, among the
younger ages (6 to 8 year olds) sibling set size had fallen to two or three children per
family rather than 4 or 5 children per family among the 10 to 12 year olds. Second,
migration and particularly remittances, became a way to diversify risks in some cases,
relieve an over supply of labor in others, and create an income stream used for savings or
investment in non-farm assets, including education. Finally, the Thai government has
shown concern for the low levels of educational attainment among children and links
future educational attainment to brighter national economic prospects. The need to
increase secondary education was mentioned in the Sixth Five Year Plan (1986-1991)
and in the Seventh Five Year Plan (for 1992-1996) (Knodel 1997). In both cases, this
meant greater school building. In the data for this analysis 20% of the boys and girls
lived in villages where a new secondary school was built nearby, over the decade of study
(1984-1994).
Hypotheses
In the broader literature on the gender gap in education explanations range across
several different, but likely correlated, explanations. The first set of general explanations
Curran - 9
is found at the family level including a value shift away from “tradition” towards
“modernity”1, a reduction in the opportunity costs associated with daughters’ household
or farm labor, greater income returns to education, and a greater level of income that
affords access to education for more children. A second set of general explanations is
found at the community or national level where government investments in educational
infrastructure and public transportation decrease the costs associated with schooling.
These general explanations can be grouped into three perspectives. The first is
that with greater prosperity and more old age security a parents will invest more
resources in children and value greater equality in those flows (Parish and Willis 1994;
Becker 1981). We would expect, therefore, that greater household wealth would reduce
gender inequality in educational access or increase girls’ access to secondary education.
We add to this notion that it is also a reduction in the uncertainty of income flows and
investments in non-agricultural wage labor that increases the likelihood of greater access
to education. The idea derives from the household economics of migration literature
whereby as incomes streams are diversified through migration, income uncertainties are
reduced, wealth flows also increase and education becomes more available (Stark 1991;
Massey 1990). Migration became an increasingly important social phenomenon in the
region during the decade of the 1980s. Much of the migration from the Northeastern part
of the country provided the factory and construction labor that contributed to Bangkok’s
population and economic growth (Chamratrithirong et al. 1995). Fieldwork experiences
over the last ten years suggest that siblings and other household members claim to remit
wages home in order to support their siblings’ education opportunities. However, one
might also expect that migration experiences, especially positive ones may increase the
1 This is also what Parish and Willis have called the “lingering patriarchy” effect (Parish and Willis 1994)
Curran - 10
opportunity costs of schooling from the perspective of origin household members,
especially if the labor market returns to low-skill migrant labor are relatively high. There
are few studies that examine how migration impacts educational attainment from this
perspective (one exception is an analysis of international migration upon Bangladeshi
women’s status, where remittances increase education and the status of women(Hadi
2001).
A second perspective is the resource dilution hypothesis(Blake 1989), which
suggests that greater family size will reduce education opportunities for all, but especially
for older siblings. Thus, we would expect that smaller family sizes reduce gender
inequality, especially for daughters. One difficulty with this perspective is that family
size and educational outcomes are endogenously related. That is smaller families may be
a function of a higher valuation of education and a shift in the “quantity-quality” tradeoff.
Although we cannot address this endogeneity problem through a modeling technique, we
do include as a control, measures of educational attainment among adult members of the
household. In previous research, Knodel and colleagues have found significant negative
effects of family size upon educational attainment, because the costs of childrearing are
primarily those of the couple (Knodel and Wongsith 1991). Further, through qualitative
field work and analysis of cross-sectional survey data they find that the explanation lies
with the quantity-quality value shift.
Finally, the context within which these decisions are made may also be important.
The proximity of secondary school opportunities may decrease opportunity costs and
expose parents and children to new ideas and opportunities. We know of no other study
that has evaluated the impact of school establishment upon the educational opportunities
Curran - 11
of youth in developing countries, particularly its impact upon girls’ educational
attainment.
Data and Methodology Overview To explain the shifts in both primary school completion and increases in
secondary school enrollment, this study will analyze two waves of the Nang Rong
Survey, 1984 and 19942. As described earlier, the data are a matched file of individuals,
households, and villages. The data about individuals comes from a complete household
census in 51 villages in the Nang Rong district, Buriram Province. The household census
includes those people who were present in the village during the 1984 survey and those
who moved into the village in 1994. Some data were also collected about individuals
who were no longer living in the village in 1994 but were living in the village in 1984.
Our analysis begins by examining educational attainment for each panel and then
longitudinally from 1984 to 1994. We then examine a set of correlates that might predict
educational attainment by 1994 for those at risk of gaining more education but who had
only achieved primary schooling or less in 1984 (6-12 year olds). Our analysis will then
compare the relative effect of our independent variables (gender, sibling size, the addition
of siblings between 1984 and 1994, household migration experience, presence of migrant
remittance income, and relative location of primary and secondary schools and the
building of new schools between 1984 and 1994) upon educational attainment. Thus, we
expect to gain insights on the relative importance of a variety of factors that help explain
the closing of the gender gap in education in rural Thailand.
Curran - 12
The data for this analysis draws initially on a sample of 16-19 year olds in 1984
and a similar sample of 16-19 year olds in 1994. We then examine 1994 educational
attainment levels among 6-12 year olds in 1984 limited to those who had not completed
more than a primary school level in 1984. Among this second group several caveats must
be mentioned. The matching of cases across the two panels is of relatively high quality.
Of an initial sample of 6,652 6-12 year olds in 1984 with primary schooling or less, we
lost 12% of the cases to sample attrition because entire households moved away and were
not followed. The resulting reduction of the sample size to 5,837 was further limited by
2.6% because of a lack of information about siblings3.
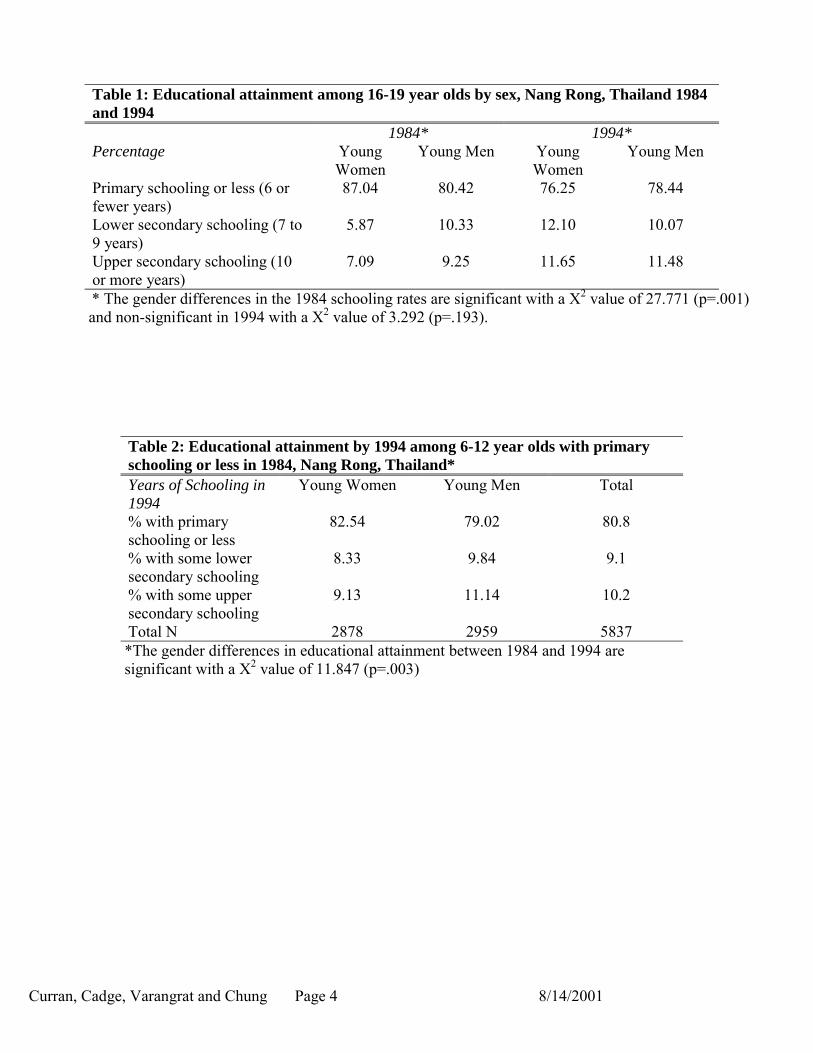
Educational Attainment In Table 1 we first compare educational attainment for 16-19 year old young men
and women between 1984 and 1994. This age group is most likely to have gained some
secondary education (7-12th grade). Looking at the 1984 differences in educational
attainment, the gender differences are significant. Among boys 10.33% completed some
lower secondary schooling, whereas only 5.87% of girls have done so. The differences
are less dramatic for upper secondary schooling. Among boys 9.25% completed upper
secondary schooling and 7.09% of girls have done so. These differences diminish by
1994. In fact, by 1994 girls appear to have a slight advantage. When we compare boys
and girls’ educational attainment between 1984 and 1994, however, boys make greater
2 Information about this survey and data are available from the following: http://www.cpc.unc.edu/projects/nangrong/ 3 Most of the information about siblings came from a separate data collection instrument used in 1994, which asked about sibling age, sex, and location (line number in the household or current district or province or country). This instrument was applied to current household members in 1994 who were 18-35 years old – but to only one member of the sibling set. Among the sample used in this analysis 56.23% of the cases used sibling information from this source. Another 33% of the cases were migrants in 1994 and so were their siblings. Using information from the migrant portion of the data collection we were able to recover 70% of the sibling information for these respondents. Finally, for 8.4% of the cases we were able
Curran - 13
gains than girls, especially in terms of access to upper secondary education (see Table 2).
Among 6 to 12 year-olds with primary schooling or less in 1984, 8.33% of the girls have
completed some lower secondary schooling by 1994 and a slightly higher proportion of
boys have done so (9.84%). The gender differences are slightly greater for upper
secondary schooling, where 9.13% of girls have some upper secondary schooling and
11.14% of boys have the same. The continued gap in girls’ educational attainment in
Table 2, which is not apparent in Table 1, is driven by the older cohort of youth (20-22
years old in 1994) included in Table 2, but not Table 1.
(Table 1 and 2 About Here)
Explanations for Closing the Gender Gap As mentioned earlier there are several explanations for possible changes in the
gender gap in educational attainment. We attempt to test these explanations with
variables available on the Nang Rong data set. To test the resource dilution hypothesis or
changing family size effect, we employ several different variables and test them
separately. The first variable measures the total number of siblings as of 1984. The
second measure categorizes sibling size. Others have suggested that the relationship
between sibling set size and intra-household resource allocation is curvilinear (Morduch
2000). That is at small sibling set sizes there are greater resources, which are equally
distributed. As sibling sizes grow so does inequality as the resource base may not
change, but not everyone has access to the same resources. Finally, as sibling set size
grows larger, it is likely that the resource base per capita is so diminished that no one will
have access to any extra resources. Although these conclusions have been drawn from
data about nutrition and health, it is probably just as likely a scenario for an even scarcer
to reconstruct sibling structures using information collected on the household roster asking for mother and
Curran - 14
and more costly resource such as education. A third measure testing the resource dilution
hypothesis examines whether any more siblings were born between 1984 and 1994.
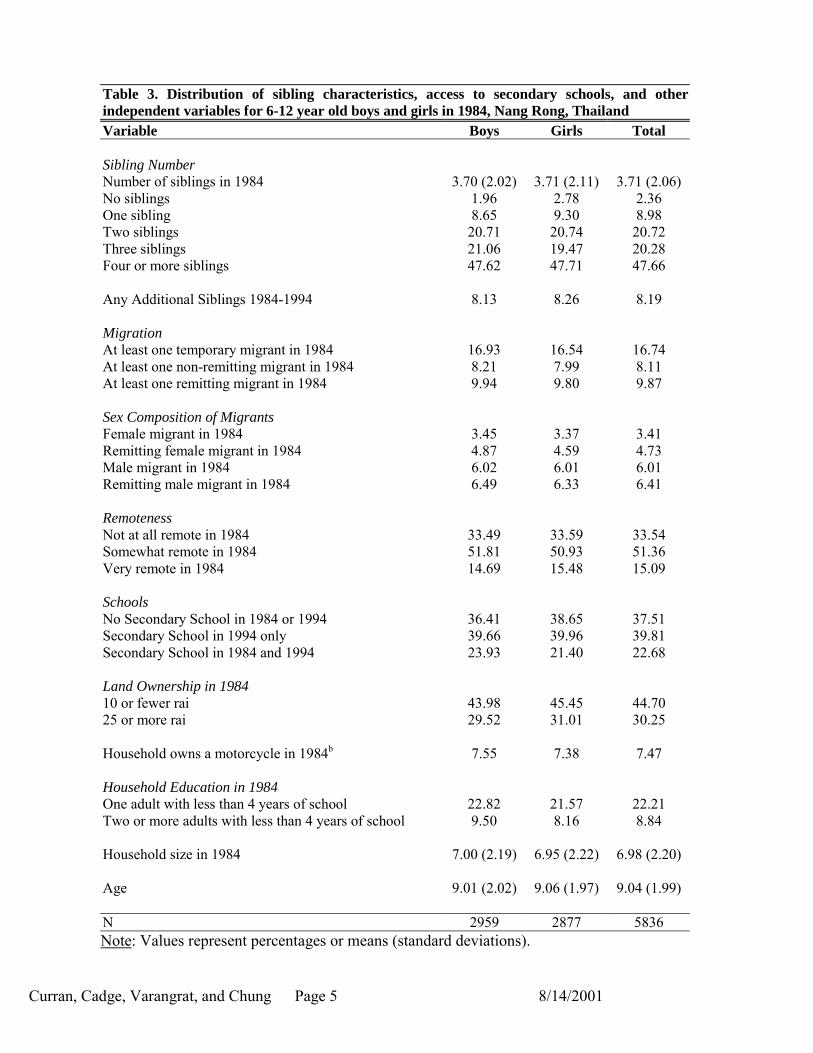
Table 3 displays the distributions of the independent variables used in the analysis for the
whole sample and across boys and girls. On average everyone has almost four siblings
and the modal category is four or more siblings. Only 8% of the sample gained siblings
over the 10-year period.
(Table 3 About Here)
The measures of migration are meant to capture the effect of risk diversification
or income smoothing, which may be important for increasing educational opportunities.
We test three different forms of this measure in our model. Unfortunately, the survey
instrument did not connect educational investments with remittances, and our measure
only captures migration at one point in time at the beginning of the period. Further, the
measure of migration is only for temporary migration, where a person continues to be a
member of an origin household but has not lived there for 2-12 months. These moves are
representative of a vast majority of moves in the region and the country
(Chamratrithirong et al. 1995). We do know whether or not the migrant has sent or
brought money back to the household and we know the sex of the migrants. Thus, we
can test several different forms of migration, a general measure of household migration,
one which disaggregates remitting migrants from non-remitting migrants, and one which
further disaggregates migrants by sex. Fieldwork experience suggests that daughters tend
to remit more than sons, although there is some evidence that this pattern has also
changed in recent years (personal communication with Knodel, March 1998). Almost
father’s line number.
Curran - 15
17% of respondents in our sample live in a household where there is a temporary migrant.
A slight majority of these are remitting migrants and most of them are male (see Table 3).
Our final set of measures examines the respondent’s village location relative to
the district town (the location of the first secondary school and the main market) and
relative to the nearest secondary school in 1984 and in 1994. Our measure of remoteness
incorporates aspects of the difficulty of travel to the district town. The village is
considered to be remotely located the more obstacles to travel. The obstacles we include
in our measure are the presence of a portion of the route to the district town that is a cart
path (upaved, rutted, and narrow), the lack of public transportation to the district town,
travel to the district town takes an hour or more (as reported by a village headman or key
informant), that during the year there are four or months of difficult travel to leave the
village (this is also a measure of road conditions and susceptibility to flooding), and it is
20 or more kilometers to the district town. We recoded this variable into three dummy
measures, not at all remote (0 obstacles), somewhat remote (1-2 obstacles), and very
remote 3-4 obstacles).
School location is also measured categorically. We compared respondents who
lived in villages with no secondary school nearby at both time periods to respondents in
villages that had a secondary school built nearby in 1994 and to respondents in villages
where there was a nearby secondary school in both 1984 and 1994. Nearby is defined as
a school being built within the sub-district, a relatively small, administratively and
geographically bounded area.
Controlling for Age, Household Members’ Education, Landholding, and Household Size Our models control for the age of our respondent, other household members’
educational attainment, landholding, and household size. These variables represent the
Curran - 16
kinds of measures that have been included in previous analyses explaining the gender
gap. They are substantive interest, but the purpose of our paper is to re-test the resource
dilution hypothesis, examine whether migration impacts educational attainment, and
examine whether new schools narrow the gap. The latter two hypotheses have not been
tested in the literature about Thailand or the general literature on the gender gap in
education.
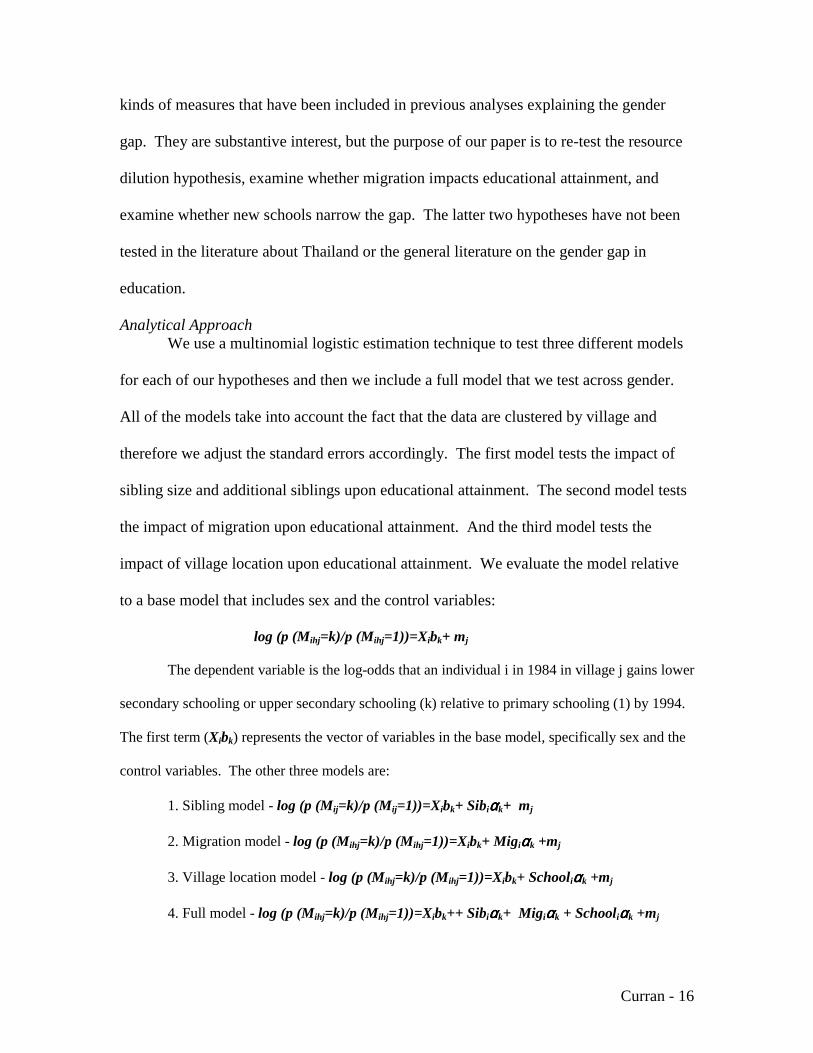
Analytical Approach We use a multinomial logistic estimation technique to test three different models
for each of our hypotheses and then we include a full model that we test across gender.
All of the models take into account the fact that the data are clustered by village and
therefore we adjust the standard errors accordingly. The first model tests the impact of
sibling size and additional siblings upon educational attainment. The second model tests
the impact of migration upon educational attainment. And the third model tests the
impact of village location upon educational attainment. We evaluate the model relative
to a base model that includes sex and the control variables:
log (p (Mihj=k)/p (Mihj=1))=Xibk+ mj
The dependent variable is the log-odds that an individual i in 1984 in village j gains lower
secondary schooling or upper secondary schooling (k) relative to primary schooling (1) by 1994.
The first term (Xibk) represents the vector of variables in the base model, specifically sex and the
control variables. The other three models are:
1. Sibling model - log (p (Mij=k)/p (Mij=1))=Xibk+ Sibiααααk+ mj
2. Migration model - log (p (Mihj=k)/p (Mihj=1))=Xibk+ Migiααααk +mj
3. Village location model - log (p (Mihj=k)/p (Mihj=1))=Xibk+ Schooliααααk +mj
4. Full model - log (p (Mihj=k)/p (Mihj=1))=Xibk++ Sibiααααk+ Migiααααk + Schooliααααk +mj
Curran - 17
We then test a full model with all variables for the pooled sample and for boys
and girls separately. Our analysis of the results will include an evaluation of the
coefficients for the variables of interest as well as to see how inclusion of the variables of
interest impacts the relationship of gender with educational attainment. Finally we will
compare whether the full model is significantly different in its impact for boys and girls.
Discussion of Results
We first discuss our baseline model, which includes a measure of gender and the
control variables. The base model in Table 1, model 1, shows that being a girl
significantly lowers the odds of lower secondary schooling relative to primary schooling
and lowers the odds of upper secondary schooling relative to primary schooling.
However, there are no significant differences between boys and girls regarding the
likelihood of upper secondary versus lower secondary.
The control variables show effects in expected directions. Age significantly
lowers the odds of secondary schooling. Landless or near landless also reduces
educational opportunities. Living in a household with a motorcycle significantly
improves the odds of educational attainment, quite substantially. Lower educational
attainment among other adults in the household lowers the odds of secondary educational
attainment and, not surprisingly, so does household size.
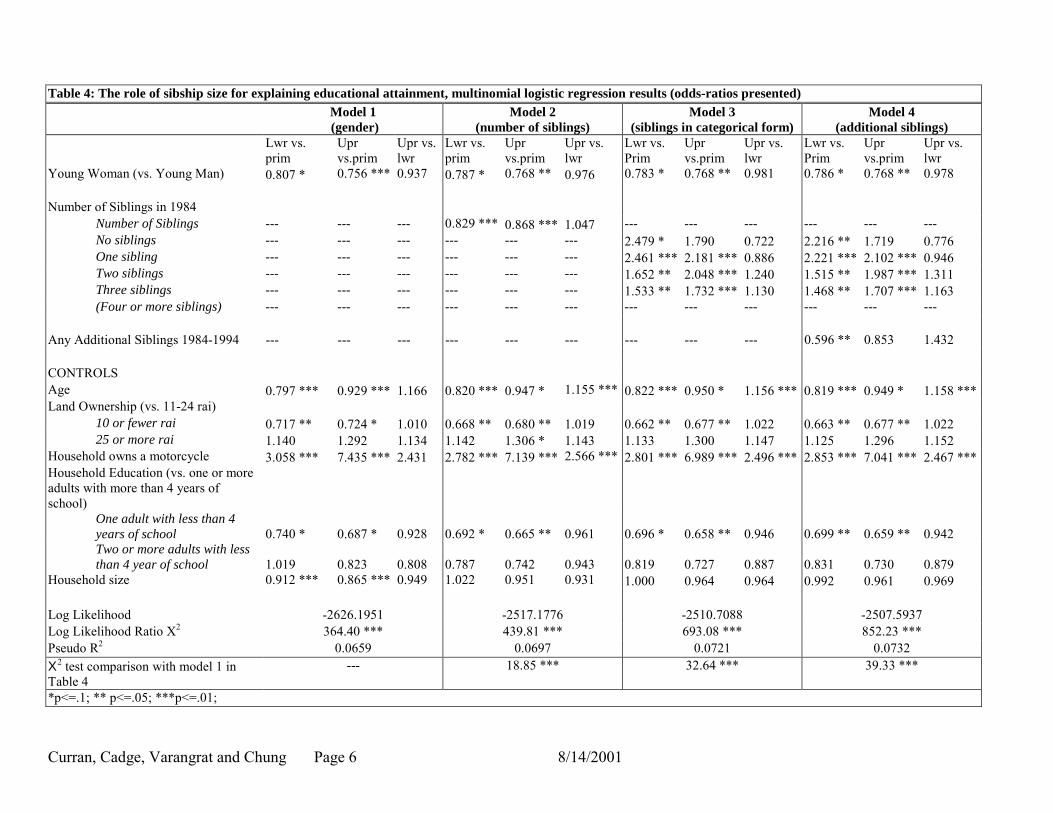
Gender, Sibset Size and Educational Attainment Table 4 displays the results for the full model and the models for sibset size.
Results presented are odds-ratios for ease of interpretation. Model 2 incorporates a
measure of total sibset size, which not surprisingly, lowers the odds of secondary
Curran - 18
schooling. Model 3 tests a somewhat different functional form of sibset size by
categorizing the values. There is still a relatively linear and negative association with
continued schooling and sibset size. Finally, model 4 tests the impact of an additional
sibling between 1984 and 1994. The impact is only observed for comparison between
lower secondary and primary, suggesting that once a decision is made to continue
schooling it's unlikely another sibling will disrupt or change those opportunities.
There is little to no impact of including the various measures of sibship size upon
the relationship of gender and educational attainment. The gender differences remain for
the first two comparisons and the gender similarities remain for the third comparison.
The addition of the sibset size measures, however, significantly improves model fit.
(Table 4 About Here)
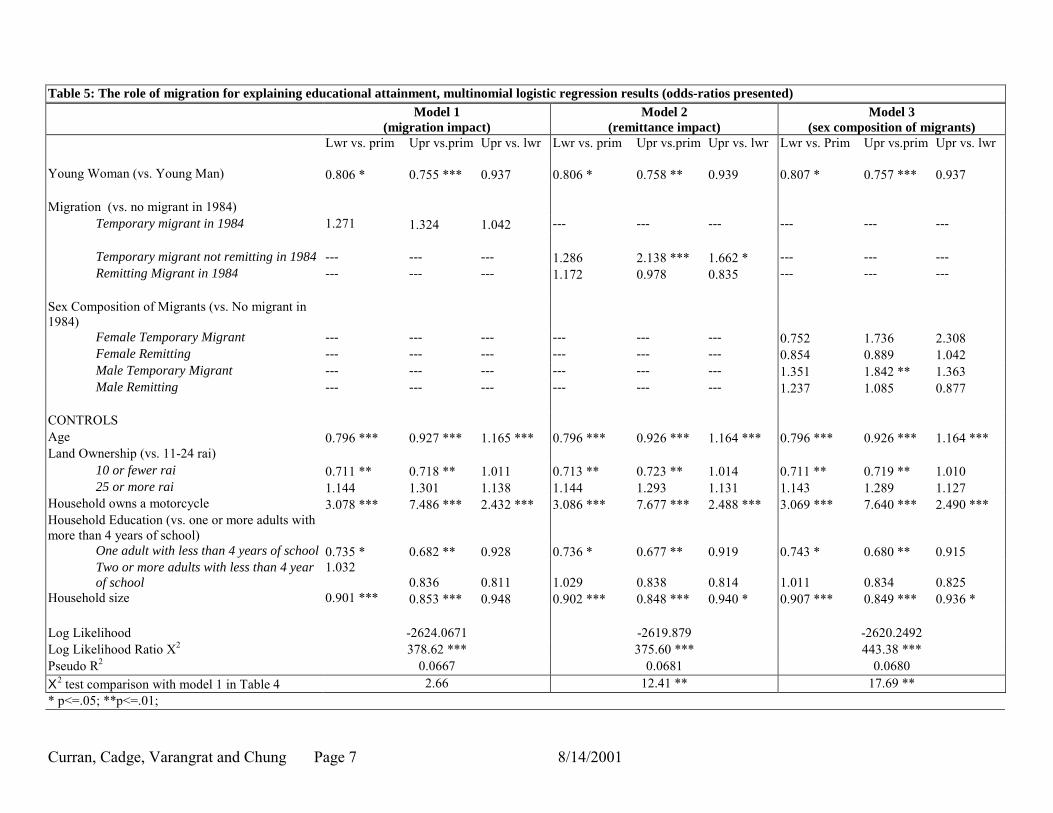
Gender, Migration and Educational Attainment Three different models are evaluated regarding the impact of migration upon
educational attainment (see Table 5). The first model tests whether having any temporary
migrant improves educational attainment. There is no significant effect, in this case of a
migrant upon educational attainment. However, when the effect of migration is parsed
between those households where there is a non-remitting migrant and those households
with a remitting migrant, we observe that there is a positive impact of a non-remitting
migrant upon educational attainment. Finally, in model 3 we observe whether the effect
of migration varies depending on the sex of the migrant. In this case, the effects are
weaker, but still significantly improve model fit relative to the baseline model (Table 4,
model 1). Interestingly, it is not having a female migrant that improves educational
opportunities, but a male non-remitting migrant. Both models 2 and 3 significantly
Curran - 19
improve the fit of the baseline model, however, the addition of these variables does not
change the relationship between gender and educational attainment.
(Table 5 About Here)
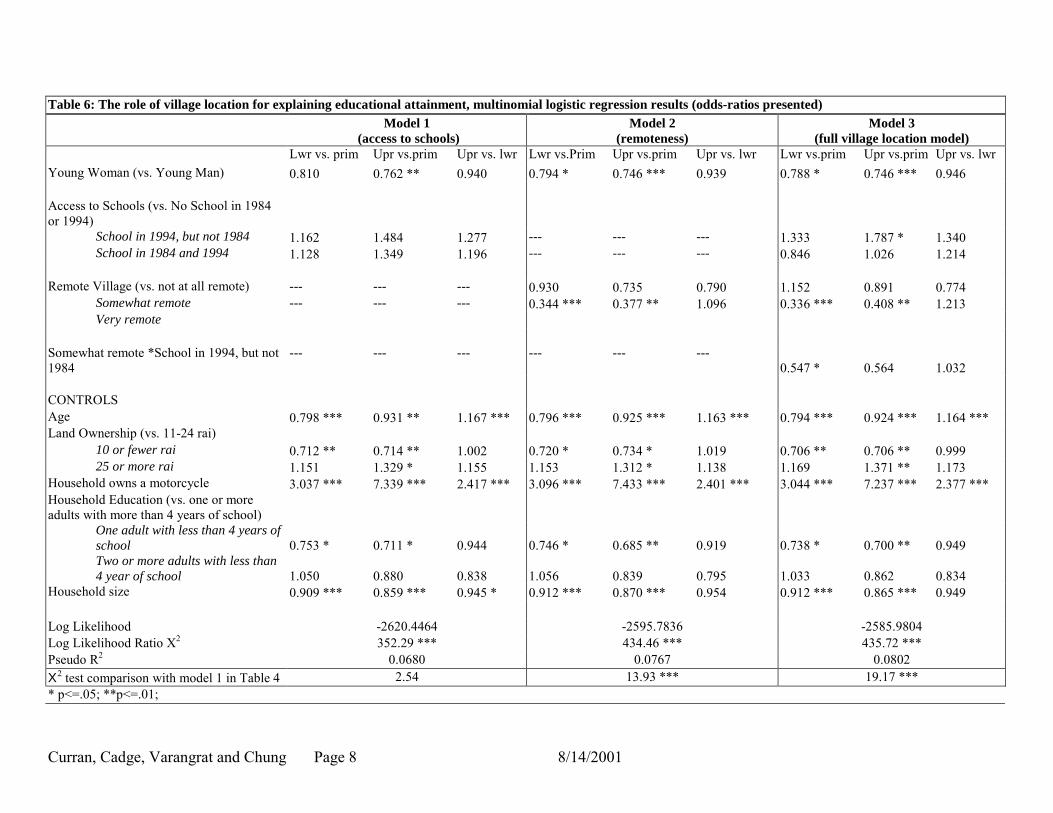
Gender, Schools, Village Location and Educational Attainment Table 6 displays the results of the village level variables upon educational
attainment. Interestingly, the school variables have little effect upon educational
attainment. Although both are positive they do not significantly increase educational
attainment. However, if a village is remotely located relative to the main district town,
the odds of secondary schooling are significantly reduced, by more than 60% for lower
secondary relative to primary and upper secondary relative to primary schooling (Model
2 in Table 6). Adding location characteristics to the model also appears to have no
differential effect upon the relationship between gender and educational attainment.
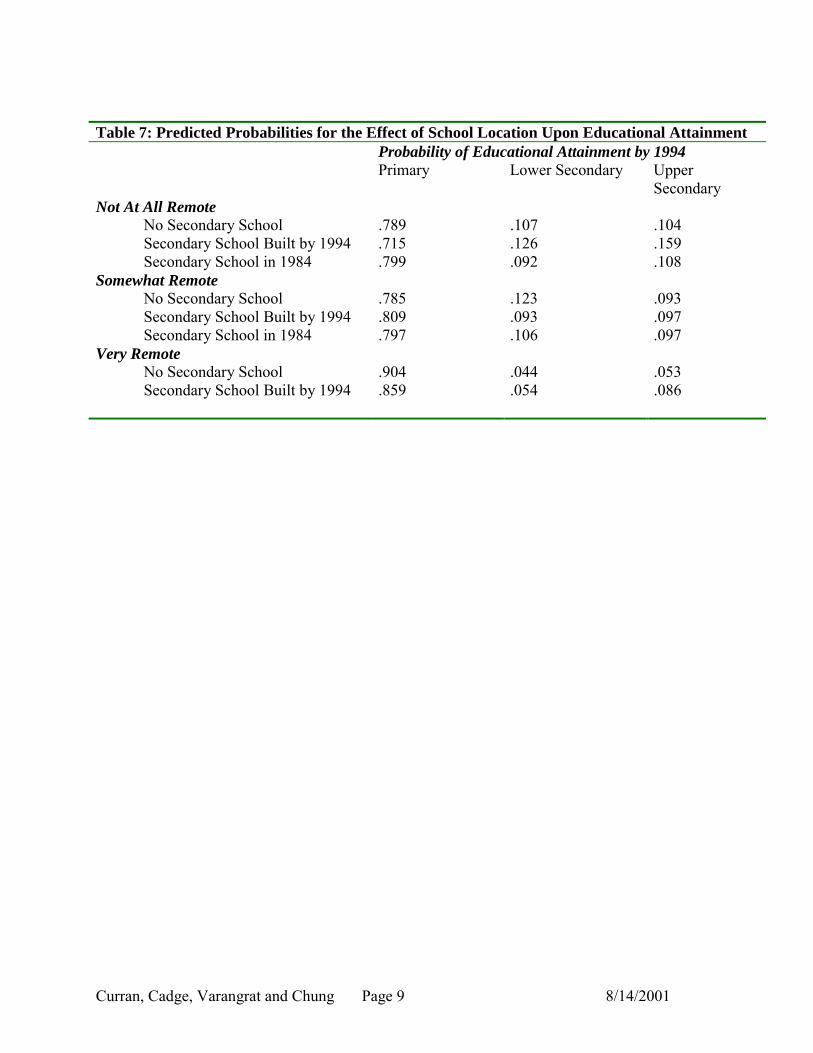
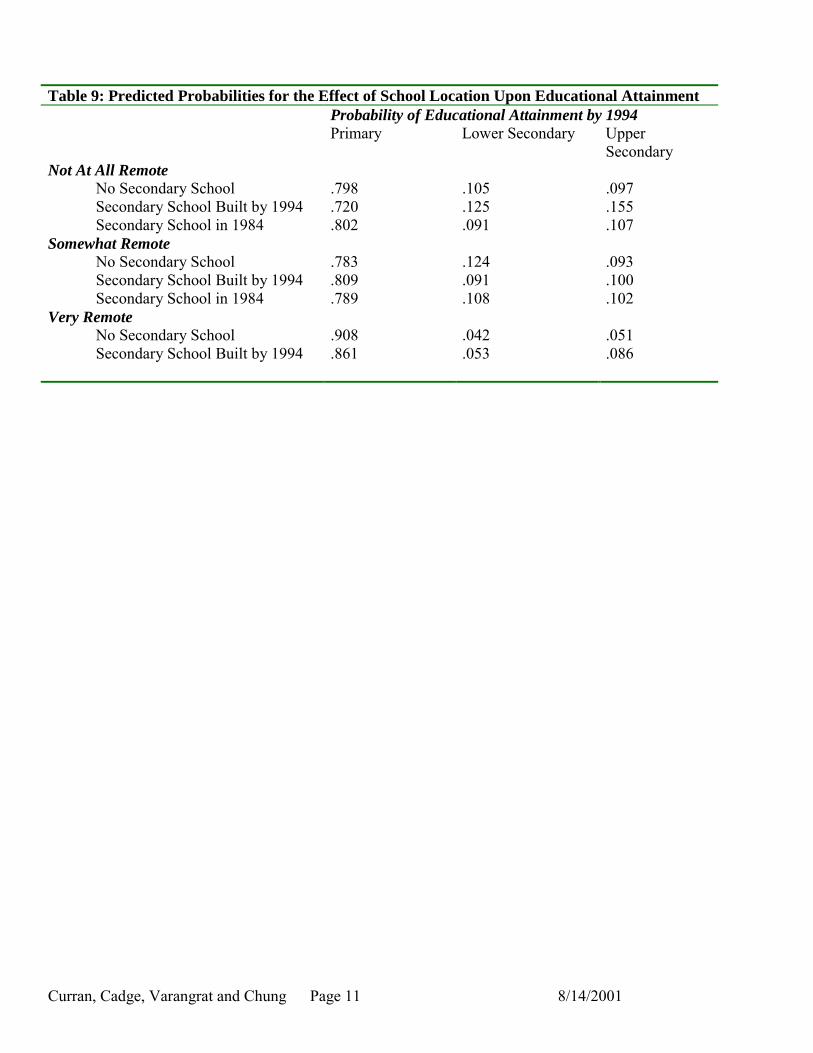
Our last model of the impact of village location tests whether it is the combination
of school construction and remoteness that might make a difference. In fact this appears
to be the case, although the results are not entirely consistent. Table 7 displays the
predicted probabilities for the equation estimated in Model 3 of Table 6. What we can
observe is that the positive effect of school construction is most important for those in
villages that are not at all remote.
(Table 6 and Table 7 About Here)
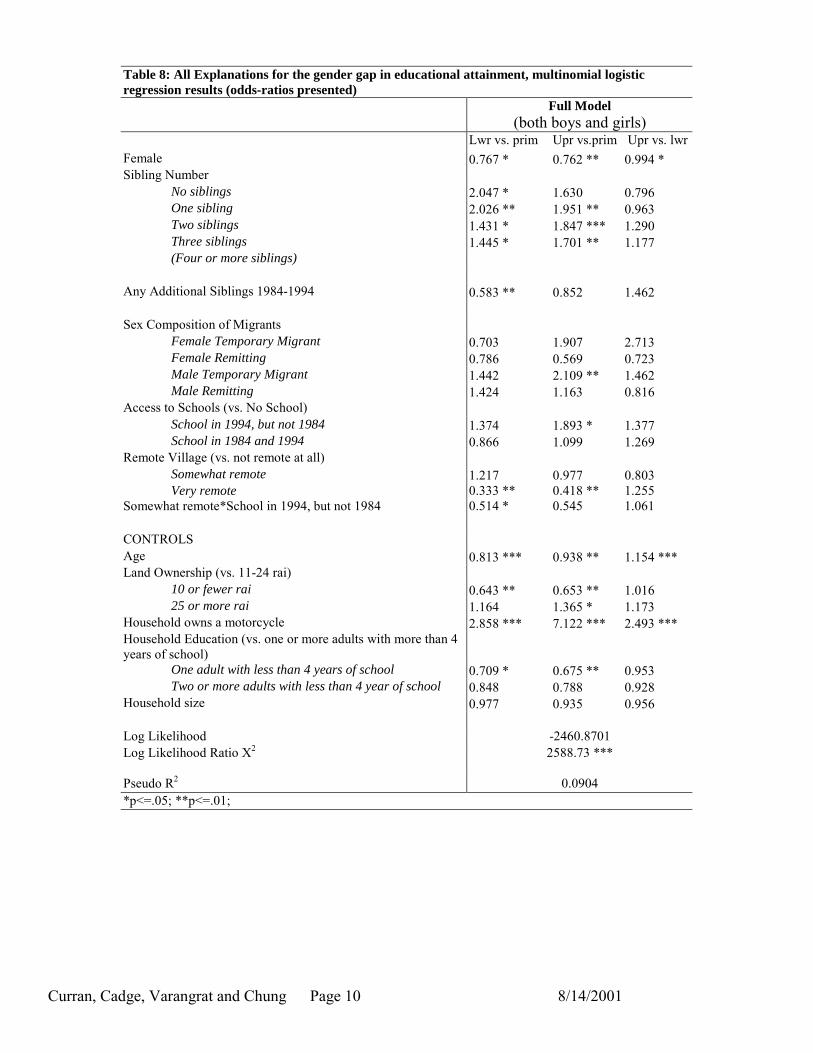
Finally, we test a full model of explanations for changes in access to educational
attainment. In this model we include all the variables that specify sibling composition,
migration, and village location, as well as gender and the control variables. The
specifications for each of the variables of interest take the best fitting form in the
preceding estimations. The effects of the variables of interest upon educational
Curran - 20
attainment remain unchanged. Further, even after including all of the variables that
might explain gender differences in education, the gender gap remains and, in fact,
becomes significant for the latter comparison between upper and lower secondary
schooling.
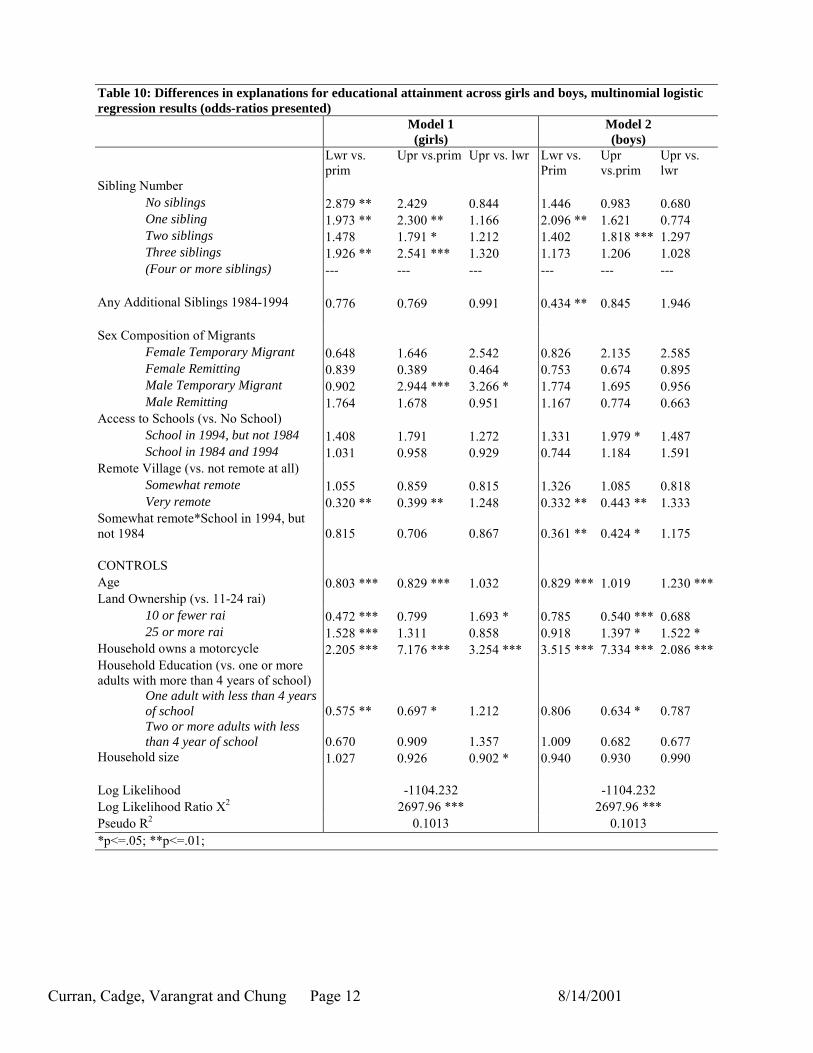
Differences in Explanations For Boys and Girls Despite the fact that the negative relationship between being a girl and
educational attainment is not explained away by the addition of the sibset size, migration,
or village location and school construction, it is still possible that some explanations are
more important for boys than girls. To test this notion, we estimated our full model upon
separate samples of boys and girls. We indeed find differences in effects between the
two estimations. The importance of sibset size is significantly greater for girls than boys.
Reducing their educational opportunities. The effect of migration is also more important
for girls than boys. Having a male, non-remitting migrant in the household significantly
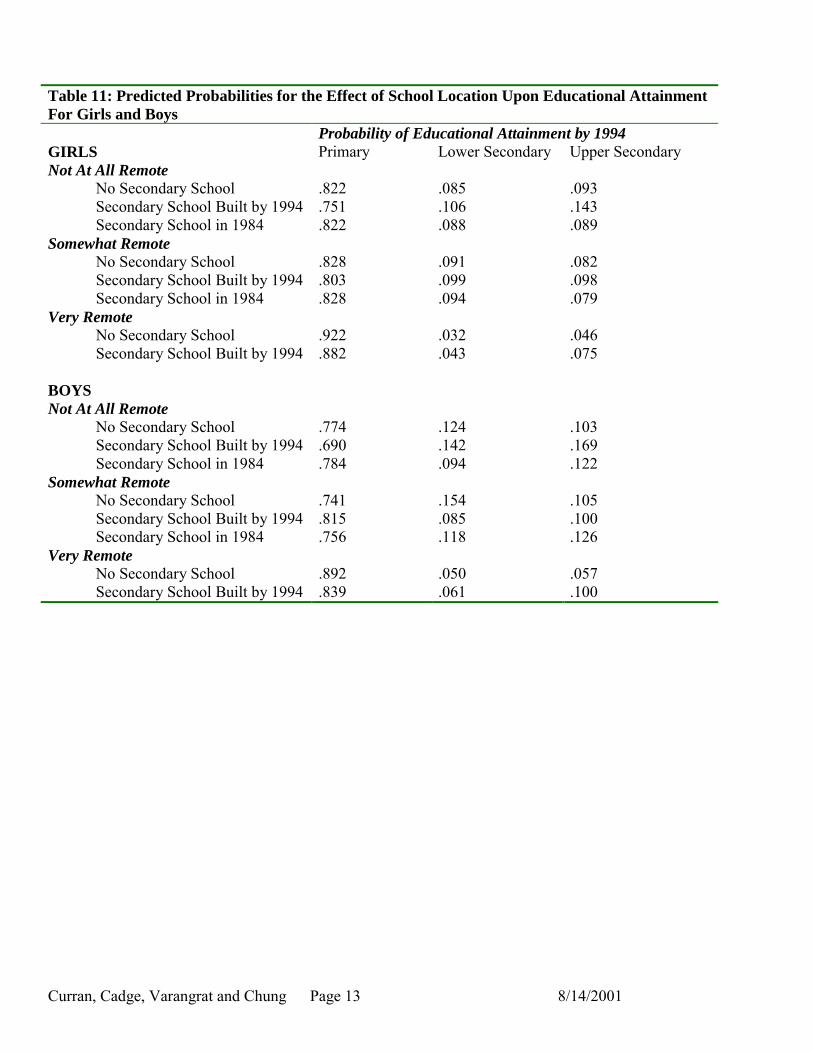
improves a girl's educational opportunities, but not a boy's. On the other hand, the impact
of school construction that we observed for the pooled sample is more important for boys
than for girls. That is boys in villages that are not at all remote have significantly greater
probabilities of having some upper secondary schooling.
(Table 8 and Table 9 About Here)
Conclusion: Interpretations and Implications
This analysis set forth to explain why the gender gap may have closed with regard
to educational attainment in Thailand. We tested three possibilities for the closing of the
gender gap. Decreasing family size, migration and its consequent impact upon income
and resource demands, and school construction. The addition of these explanations to a
Curran - 21
baseline model that indicates significant gender differences in educational attainment
does not explain away the gender differences. These remain. However, a fully
interactive estimation does suggest that some explanations are more important for girls'
educational gains and others for boys'. Firstly, it appears that family size significantly
diminishes a girl's educational attainment. This is nothing new in the literature.
Migration, on the other hand does not predict educational attainment in the way we had
expected. It appears having a male migrant who does not maintain ties to the household
through remittances actually increases the educational opportunities of girls. One
explanation may be that such a temporary migrant relieves resource constraints by simply
not being around to consume them and therefore increases opportunities for all siblings.
However, the effect is only significant for girls and only when the migrant is male.
Again, since males are more likely to consume resources for education, on average, the
out migration of a male may increase the educational resources available to a girl to a
greater degree than the out migration of a sister who would not have laid claim to those
educational resources anyway. The effects are somewhat small and one must be
cautionary about this interpretation. Further, the measure of migration is relatively weak
and doesn't take into account the cumulative impact of migration - which is likely to be
greater than the somewhat more episodic measure included here.
The most surprising result from this analysis is the lack of effect of school
construction upon educational attainment. This is puzzling. Over the time period no new
schools were built nearby the very remote villages and most of the new schools were
built near by somewhat remote villages. However, the greatest impact is felt for the boys
living in villages that are not at all remote. The effect suggests a possible endogenous

Curran - 22
relationship. Schools will be built where demand for schooling is greatest. This suggests
that the potential for rapid school enrollment increases for girls at the secondary level is
relatively low, at least initially. The endogeneity of the relationship is also suggested by
the perception of schooling to be more important for boys than girls in terms of
opportunities in the rapidly growing export manufacturing sector.
Curran - 23
References
1. Becker, Gary. 1981. Treatise on the Family. Cambridge, Mass.: Harvard University.
2. Blake, Judith. 1989. Family Size and Achievement. Berkeley, Calif.: University of California.
3. Chamratrithirong, Aphichat, Kritaya Archavanitkul, Kerry Richter, Philip Guest, Thongthai Varachai, Wathinee Boonchalaksi, Nittaya Piriyathamwong, and Panee Vong-ek. 1995. National Migration Survey of Thailand. Bangkok, Thailand: Institute for Population and Social Research, Mahidol University.
4. Fry, Gerald and Ken Kempner. 1996. "A Subnational Perspective for Comparative Research: Education and Development in Northeast Brazil and Northeast Thailand." Comparative Education 32(3):333-60.
5. Hadi, Abdullah. 2001. "International Migration and the Change of Women's Position Among the Left-Behind in Rural Bangladesh." International Journal of Population Geography 7:53-61.
6. Keyes, Charles F. 1991. "The Proposed World of the School: Thai Villagers' Entry into a Bureacratic State System." Pp. 89-130 in Reshaping Local Worlds: Formal Education and Cultural Change, editor Charles F. Keyes. New Haven, Connecticut: Yale University Press.
7. King, E. 1991. Educating Girls and Women: Investing in Development. Washington, D.C.: The World Bank.
8. King, E. and M. Hill. 1991. Women's Education in Developing Countries. Washington: The World Bank.
9. Knodel, John. 1997. "The Closing of the Gender Gap in Schooling: The Case of Thailand." Comparative Education 33(1):61-86.
10. Knodel, John and Malinee Wongsith. 1991. "Family Size and Children's Education in Thailand: Evidence From a National Sample." Demography 28(1):119-31.
11. Massey, Douglas. 1990. ""Social Structure, Household Strategies, and the Cumulative Causation of Migration"." Population Index 56(1):3-26.
12. Morduch, Jonathon. 2000. "Sibling Rivalry in Africa." American Economic Review 90(2):405-9.
13. Parish, William L. and Robert J. Willis. 1994. "Daughters, Education, and Family Budgets: Taiwan Experiences." Journal of Human Resources 29(4):863-98.
14. Slagter, Robert and Harold Kerbo. 2000. Modern Thailand: A Volume in the Comparative Societies Series. New York: McGraw Hill.
15. Stark, Oded. 1991. The Migration of Labor. Cambridge, MA: Basil Blackwell.
16. Sussangkarn, Chalongphob. 1993. "Labour Markets." Pp. 355-400 in The Thai Economy in Transition, editor Peter G. Warr. Cambridge, UK: Cambridge University Press.
17. Suvannathat, Chancha. 1989. "Thailand." Women in Asia: Beyond the Domestic Domain, editor UNESCO. Bangkok, Thailand: UNESCO.

Curran - 24
18. United Nations Development Program. 1994. Human Development Report 1994. New York: United Nations Development Program.
19. ———. 1995. Human Development Report 1995. New York: Oxford University Press.
20. Warr, Peter. 1993. The Thai Economy in Transition. New York: Cambridge.
Sara CurranCurran, Cadge, Varangrat, and Chung Page 1 8/14/2001
Figure 1: Percentage of boys and girls age 12-15 with some lower secondary education, Socio-Economic Survey
0
5
10
15
20
25
30
35
40
45
50
1975 1981 1986 1988 1990 1992
Year
% w
ith s
ome
low
er s
econ
dary
sch
oolin
g
national male
national female
NE male
NE female
Curran, Cadge, Varangrat, and Chung Page 2 8/14/2001
Figure 2: Percentage of boys and girls age 16-19 withsome upper secondary education, Socio-Economic Survey
0
5
10
15
20
25
30
35
40
1975 1981 1986 1988 1990 1992
Year
% w
ith s
ome
uppe
r sec
onda
ry s
choo
ling
national male
national female
NE male
NE female
Curran, Cadge, Varangrat, and Chung Page 3 8/14/2001
Figure 3: Boys and girls age 16-19 with secondary school degree, Socio-Economic Survey
0
5
10
15
20
25
30
1975 1981 1986 1988 1990 1992
% c
ompl
eted
sec
onda
ry e
duca
tion
national malenational femaleNE maleNE female
Curran, Cadge, Varangrat and Chung Page 4 8/14/2001
Table 1: Educational attainment among 16-19 year olds by sex, Nang Rong, Thailand 1984 and 1994 1984* 1994* Percentage Young
Women Young Men Young
Women Young Men
Primary schooling or less (6 or fewer years)
87.04 80.42 76.25 78.44
Lower secondary schooling (7 to 9 years)
5.87 10.33 12.10 10.07
Upper secondary schooling (10 or more years)
7.09 9.25 11.65 11.48
* The gender differences in the 1984 schooling rates are significant with a Χ2 value of 27.771 (p=.001) and non-significant in 1994 with a Χ2 value of 3.292 (p=.193).
Table 2: Educational attainment by 1994 among 6-12 year olds with primary schooling or less in 1984, Nang Rong, Thailand* Years of Schooling in 1994
Young Women Young Men Total
% with primary schooling or less
82.54 79.02 80.8
% with some lower secondary schooling
8.33 9.84 9.1
% with some upper secondary schooling
9.13 11.14 10.2
Total N 2878 2959 5837 *The gender differences in educational attainment between 1984 and 1994 are significant with a Χ2 value of 11.847 (p=.003)
Curran, Cadge, Varangrat, and Chung Page 5 8/14/2001
Table 3. Distribution of sibling characteristics, access to secondary schools, and other independent variables for 6-12 year old boys and girls in 1984, Nang Rong, Thailand Variable Boys Girls Total Sibling Number Number of siblings in 1984 3.70 (2.02) 3.71 (2.11) 3.71 (2.06) No siblings 1.96 2.78 2.36 One sibling 8.65 9.30 8.98 Two siblings 20.71 20.74 20.72 Three siblings 21.06 19.47 20.28 Four or more siblings 47.62 47.71 47.66 Any Additional Siblings 1984-1994 8.13 8.26 8.19 Migration At least one temporary migrant in 1984 16.93 16.54 16.74 At least one non-remitting migrant in 1984 8.21 7.99 8.11 At least one remitting migrant in 1984 9.94 9.80 9.87 Sex Composition of Migrants Female migrant in 1984 3.45 3.37 3.41 Remitting female migrant in 1984 4.87 4.59 4.73 Male migrant in 1984 6.02 6.01 6.01 Remitting male migrant in 1984 6.49 6.33 6.41 Remoteness Not at all remote in 1984 33.49 33.59 33.54 Somewhat remote in 1984 51.81 50.93 51.36 Very remote in 1984 14.69 15.48 15.09 Schools No Secondary School in 1984 or 1994 36.41 38.65 37.51 Secondary School in 1994 only 39.66 39.96 39.81 Secondary School in 1984 and 1994 23.93 21.40 22.68 Land Ownership in 1984 10 or fewer rai 43.98 45.45 44.70 25 or more rai 29.52 31.01 30.25 Household owns a motorcycle in 1984b 7.55 7.38 7.47 Household Education in 1984 One adult with less than 4 years of school 22.82 21.57 22.21 Two or more adults with less than 4 years of school 9.50 8.16 8.84 Household size in 1984 7.00 (2.19) 6.95 (2.22) 6.98 (2.20) Age 9.01 (2.02) 9.06 (1.97) 9.04 (1.99) N 2959 2877 5836 Note: Values represent percentages or means (standard deviations).
Curran, Cadge, Varangrat and Chung Page 6 8/14/2001
Table 4: The role of sibship size for explaining educational attainment, multinomial logistic regression results (odds-ratios presented) Model 1
(gender) Model 2
(number of siblings) Model 3
(siblings in categorical form) Model 4
(additional siblings) Lwr vs.
prim Upr vs.prim
Upr vs. lwr
Lwr vs. prim
Upr vs.prim
Upr vs. lwr
Lwr vs. Prim
Upr vs.prim
Upr vs. lwr
Lwr vs. Prim
Upr vs.prim
Upr vs. lwr
Young Woman (vs. Young Man) 0.807 * 0.756 *** 0.937 0.787 * 0.768 ** 0.976 0.783 * 0.768 ** 0.981 0.786 * 0.768 ** 0.978 Number of Siblings in 1984
Number of Siblings --- --- --- 0.829 *** 0.868 *** 1.047 --- --- --- --- --- --- No siblings --- --- --- --- --- --- 2.479 * 1.790 0.722 2.216 ** 1.719 0.776 One sibling --- --- --- --- --- --- 2.461 *** 2.181 *** 0.886 2.221 *** 2.102 *** 0.946 Two siblings --- --- --- --- --- --- 1.652 ** 2.048 *** 1.240 1.515 ** 1.987 *** 1.311 Three siblings --- --- --- --- --- --- 1.533 ** 1.732 *** 1.130 1.468 ** 1.707 *** 1.163 (Four or more siblings) --- --- --- --- --- --- --- --- --- --- --- ---
Any Additional Siblings 1984-1994 --- --- --- --- --- --- --- --- --- 0.596 ** 0.853 1.432 CONTROLS Age 0.797 *** 0.929 *** 1.166 0.820 *** 0.947 * 1.155 *** 0.822 *** 0.950 * 1.156 *** 0.819 *** 0.949 * 1.158 *** Land Ownership (vs. 11-24 rai)
10 or fewer rai 0.717 ** 0.724 * 1.010 0.668 ** 0.680 ** 1.019 0.662 ** 0.677 ** 1.022 0.663 ** 0.677 ** 1.022 25 or more rai 1.140 1.292 1.134 1.142 1.306 * 1.143 1.133 1.300 1.147 1.125 1.296 1.152
Household owns a motorcycle 3.058 *** 7.435 *** 2.431 2.782 *** 7.139 *** 2.566 *** 2.801 *** 6.989 *** 2.496 *** 2.853 *** 7.041 *** 2.467 *** Household Education (vs. one or more adults with more than 4 years of school)
One adult with less than 4 years of school 0.740 * 0.687 * 0.928 0.692 * 0.665 ** 0.961 0.696 * 0.658 ** 0.946 0.699 ** 0.659 ** 0.942 Two or more adults with less than 4 year of school 1.019
0.823
0.808 0.787
0.742 0.943 0.819 0.727 0.887 0.831 0.730 0.879
Household size 0.912 *** 0.865 *** 0.949 1.022 0.951 0.931 1.000 0.964 0.964 0.992 0.961 0.969 Log Likelihood -2626.1951 -2517.1776 -2510.7088 -2507.5937 Log Likelihood Ratio Χ2 364.40 *** 439.81 *** 693.08 *** 852.23 *** Pseudo R2 0.0659 0.0697 0.0721 0.0732 Χ2 test comparison with model 1 in Table 4
--- 18.85 *** 32.64 *** 39.33 ***
*p<=.1; ** p<=.05; ***p<=.01;
Curran, Cadge, Varangrat and Chung Page 7 8/14/2001
Table 5: The role of migration for explaining educational attainment, multinomial logistic regression results (odds-ratios presented) Model 1
(migration impact) Model 2
(remittance impact) Model 3
(sex composition of migrants) Lwr vs. prim
Upr vs.prim Upr vs. lwr
Lwr vs. prim
Upr vs.prim Upr vs. lwr
Lwr vs. Prim Upr vs.prim Upr vs. lwr
Young Woman (vs. Young Man) 0.806 * 0.755 *** 0.937 0.806 * 0.758 ** 0.939 0.807 * 0.757 *** 0.937 Migration (vs. no migrant in 1984)
Temporary migrant in 1984 1.271 1.324 1.042 --- --- --- --- --- --- Temporary migrant not remitting in 1984 --- --- --- 1.286 2.138 *** 1.662 * --- --- --- Remitting Migrant in 1984 --- --- --- 1.172 0.978 0.835 --- --- ---
Sex Composition of Migrants (vs. No migrant in 1984)
Female Temporary Migrant --- --- --- --- --- --- 0.752 1.736 2.308 Female Remitting --- --- --- --- --- --- 0.854 0.889 1.042 Male Temporary Migrant --- --- --- --- --- --- 1.351 1.842 ** 1.363 Male Remitting --- --- --- --- --- --- 1.237 1.085 0.877
CONTROLS Age 0.796 *** 0.927 *** 1.165 *** 0.796 *** 0.926 *** 1.164 *** 0.796 *** 0.926 *** 1.164 *** Land Ownership (vs. 11-24 rai)
10 or fewer rai 0.711 ** 0.718 ** 1.011 0.713 ** 0.723 ** 1.014 0.711 ** 0.719 ** 1.010 25 or more rai 1.144 1.301 1.138 1.144 1.293 1.131 1.143 1.289 1.127
Household owns a motorcycle 3.078 *** 7.486 *** 2.432 *** 3.086 *** 7.677 *** 2.488 *** 3.069 *** 7.640 *** 2.490 *** Household Education (vs. one or more adults with more than 4 years of school)
One adult with less than 4 years of school 0.735 * 0.682 ** 0.928 0.736 * 0.677 ** 0.919 0.743 * 0.680 ** 0.915 Two or more adults with less than 4 year of school
1.032 0.836 0.811 1.029 0.838 0.814 1.011 0.834 0.825
Household size 0.901 *** 0.853 *** 0.948 0.902 *** 0.848 *** 0.940 * 0.907 *** 0.849 *** 0.936 * Log Likelihood -2624.0671 -2619.879 -2620.2492 Log Likelihood Ratio Χ2 378.62 *** 375.60 *** 443.38 *** Pseudo R2 0.0667 0.0681 0.0680 Χ2 test comparison with model 1 in Table 4 2.66 12.41 ** 17.69 ** * p<=.05; **p<=.01;
Curran, Cadge, Varangrat and Chung Page 8 8/14/2001
Table 6: The role of village location for explaining educational attainment, multinomial logistic regression results (odds-ratios presented) Model 1
(access to schools) Model 2
(remoteness) Model 3
(full village location model) Lwr vs. prim Upr vs.prim Upr vs. lwr Lwr vs.Prim Upr vs.prim Upr vs. lwr Lwr vs.prim Upr vs.prim Upr vs. lwr Young Woman (vs. Young Man) 0.810 0.762 ** 0.940 0.794 * 0.746 *** 0.939 0.788 * 0.746 *** 0.946 Access to Schools (vs. No School in 1984 or 1994)
School in 1994, but not 1984 1.162 1.484 1.277 --- --- --- 1.333 1.787 * 1.340 School in 1984 and 1994 1.128 1.349 1.196 --- --- --- 0.846 1.026 1.214
Remote Village (vs. not at all remote) --- --- --- 0.930 0.735 0.790 1.152 0.891 0.774 Somewhat remote --- --- --- 0.344 *** 0.377 ** 1.096 0.336 *** 0.408 ** 1.213 Very remote
Somewhat remote *School in 1994, but not 1984
--- --- --- --- --- --- 0.547 * 0.564 1.032
CONTROLS Age 0.798 *** 0.931 ** 1.167 *** 0.796 *** 0.925 *** 1.163 *** 0.794 *** 0.924 *** 1.164 *** Land Ownership (vs. 11-24 rai)
10 or fewer rai 0.712 ** 0.714 ** 1.002 0.720 * 0.734 * 1.019 0.706 ** 0.706 ** 0.999 25 or more rai 1.151 1.329 * 1.155 1.153 1.312 * 1.138 1.169 1.371 ** 1.173
Household owns a motorcycle 3.037 *** 7.339 *** 2.417 *** 3.096 *** 7.433 *** 2.401 *** 3.044 *** 7.237 *** 2.377 *** Household Education (vs. one or more adults with more than 4 years of school)
One adult with less than 4 years of school 0.753 * 0.711 * 0.944 0.746 * 0.685 ** 0.919 0.738 * 0.700 ** 0.949 Two or more adults with less than 4 year of school 1.050 0.880 0.838 1.056 0.839 0.795 1.033 0.862 0.834
Household size 0.909 *** 0.859 *** 0.945 * 0.912 *** 0.870 *** 0.954 0.912 *** 0.865 *** 0.949 Log Likelihood -2620.4464 -2595.7836 -2585.9804 Log Likelihood Ratio Χ2 352.29 *** 434.46 *** 435.72 *** Pseudo R2 0.0680 0.0767 0.0802 Χ2 test comparison with model 1 in Table 4 2.54 13.93 *** 19.17 *** * p<=.05; **p<=.01;
Curran, Cadge, Varangrat and Chung Page 9 8/14/2001
Table 7: Predicted Probabilities for the Effect of School Location Upon Educational Attainment Probability of Educational Attainment by 1994 Primary Lower Secondary Upper
Secondary Not At All Remote
No Secondary School .789 .107 .104 Secondary School Built by 1994 .715 .126 .159 Secondary School in 1984 .799 .092 .108
Somewhat Remote No Secondary School .785 .123 .093 Secondary School Built by 1994 .809 .093 .097 Secondary School in 1984 .797 .106 .097
Very Remote No Secondary School .904 .044 .053 Secondary School Built by 1994 .859 .054 .086
Curran, Cadge, Varangrat and Chung Page 10 8/14/2001
Table 8: All Explanations for the gender gap in educational attainment, multinomial logistic regression results (odds-ratios presented) Full Model
(both boys and girls) Lwr vs. prim Upr vs.prim Upr vs. lwrFemale 0.767 * 0.762 ** 0.994 * Sibling Number
No siblings 2.047 * 1.630 0.796 One sibling 2.026 ** 1.951 ** 0.963 Two siblings 1.431 * 1.847 *** 1.290 Three siblings 1.445 * 1.701 ** 1.177 (Four or more siblings)
Any Additional Siblings 1984-1994 0.583 ** 0.852 1.462
Sex Composition of Migrants
Female Temporary Migrant 0.703 1.907 2.713 Female Remitting 0.786 0.569 0.723 Male Temporary Migrant 1.442 2.109 ** 1.462 Male Remitting 1.424 1.163 0.816
Access to Schools (vs. No School) School in 1994, but not 1984 1.374 1.893 * 1.377 School in 1984 and 1994 0.866 1.099 1.269
Remote Village (vs. not remote at all) Somewhat remote 1.217 0.977 0.803 Very remote 0.333 ** 0.418 ** 1.255
Somewhat remote*School in 1994, but not 1984 0.514 * 0.545 1.061
CONTROLS Age 0.813 *** 0.938 ** 1.154 *** Land Ownership (vs. 11-24 rai)
10 or fewer rai 0.643 ** 0.653 ** 1.016 25 or more rai 1.164 1.365 * 1.173
Household owns a motorcycle 2.858 *** 7.122 *** 2.493 *** Household Education (vs. one or more adults with more than 4 years of school)
One adult with less than 4 years of school 0.709 * 0.675 ** 0.953 Two or more adults with less than 4 year of school 0.848 0.788 0.928
Household size 0.977 0.935 0.956 Log Likelihood -2460.8701 Log Likelihood Ratio Χ2 2588.73 ***
Pseudo R2 0.0904 *p<=.05; **p<=.01;
Curran, Cadge, Varangrat and Chung Page 11 8/14/2001
Table 9: Predicted Probabilities for the Effect of School Location Upon Educational Attainment Probability of Educational Attainment by 1994 Primary Lower Secondary Upper
Secondary Not At All Remote
No Secondary School .798 .105 .097 Secondary School Built by 1994 .720 .125 .155 Secondary School in 1984 .802 .091 .107
Somewhat Remote No Secondary School .783 .124 .093 Secondary School Built by 1994 .809 .091 .100 Secondary School in 1984 .789 .108 .102
Very Remote No Secondary School .908 .042 .051 Secondary School Built by 1994 .861 .053 .086
Curran, Cadge, Varangrat and Chung Page 12 8/14/2001
Table 10: Differences in explanations for educational attainment across girls and boys, multinomial logistic regression results (odds-ratios presented) Model 1
(girls) Model 2 (boys)
Lwr vs. prim
Upr vs.prim Upr vs. lwr Lwr vs. Prim
Upr vs.prim
Upr vs. lwr
Sibling Number No siblings 2.879 ** 2.429 0.844 1.446 0.983 0.680 One sibling 1.973 ** 2.300 ** 1.166 2.096 ** 1.621 0.774 Two siblings 1.478 1.791 * 1.212 1.402 1.818 *** 1.297 Three siblings 1.926 ** 2.541 *** 1.320 1.173 1.206 1.028 (Four or more siblings) --- --- --- --- --- ---
Any Additional Siblings 1984-1994 0.776 0.769 0.991 0.434 ** 0.845 1.946
Sex Composition of Migrants
Female Temporary Migrant 0.648 1.646 2.542 0.826 2.135 2.585 Female Remitting 0.839 0.389 0.464 0.753 0.674 0.895 Male Temporary Migrant 0.902 2.944 *** 3.266 * 1.774 1.695 0.956 Male Remitting 1.764 1.678 0.951 1.167 0.774 0.663
Access to Schools (vs. No School) School in 1994, but not 1984 1.408 1.791 1.272 1.331 1.979 * 1.487 School in 1984 and 1994 1.031 0.958 0.929 0.744 1.184 1.591
Remote Village (vs. not remote at all) Somewhat remote 1.055 0.859 0.815 1.326 1.085 0.818 Very remote 0.320 ** 0.399 ** 1.248 0.332 ** 0.443 ** 1.333
Somewhat remote*School in 1994, but not 1984 0.815 0.706 0.867 0.361 ** 0.424 * 1.175
CONTROLS Age 0.803 *** 0.829 *** 1.032 0.829 *** 1.019 1.230 *** Land Ownership (vs. 11-24 rai)
10 or fewer rai 0.472 *** 0.799 1.693 * 0.785 0.540 *** 0.688 25 or more rai 1.528 *** 1.311 0.858 0.918 1.397 * 1.522 *
Household owns a motorcycle 2.205 *** 7.176 *** 3.254 *** 3.515 *** 7.334 *** 2.086 *** Household Education (vs. one or more adults with more than 4 years of school)
One adult with less than 4 years of school 0.575 ** 0.697 * 1.212 0.806 0.634 * 0.787 Two or more adults with less than 4 year of school 0.670 0.909 1.357 1.009 0.682 0.677
Household size 1.027 0.926 0.902 * 0.940 0.930 0.990 Log Likelihood -1104.232 -1104.232 Log Likelihood Ratio Χ2 2697.96 *** 2697.96 *** Pseudo R2 0.1013 0.1013 *p<=.05; **p<=.01;
Curran, Cadge, Varangrat and Chung Page 13 8/14/2001
Table 11: Predicted Probabilities for the Effect of School Location Upon Educational Attainment For Girls and Boys Probability of Educational Attainment by 1994 GIRLS Primary Lower Secondary Upper Secondary Not At All Remote
No Secondary School .822 .085 .093 Secondary School Built by 1994 .751 .106 .143 Secondary School in 1984 .822 .088 .089
Somewhat Remote No Secondary School .828 .091 .082 Secondary School Built by 1994 .803 .099 .098 Secondary School in 1984 .828 .094 .079
Very Remote No Secondary School .922 .032 .046 Secondary School Built by 1994 .882 .043 .075
BOYS Not At All Remote
No Secondary School .774 .124 .103 Secondary School Built by 1994 .690 .142 .169 Secondary School in 1984 .784 .094 .122
Somewhat Remote No Secondary School .741 .154 .105 Secondary School Built by 1994 .815 .085 .100 Secondary School in 1984 .756 .118 .126
Very Remote No Secondary School .892 .050 .057 Secondary School Built by 1994 .839 .061 .100