blank proforma limited - partial text - read only
TRANSCRIPT
�
�
�
�����������
����������� ��� � ����� �� � ����������
��������������������������
�!����"������#�
��"������#����
���������������������� ������������������������ �������
�
�
�
Valtech SE
P a g e 2 | 12
Consolidated statements of income (loss) 3
Consolidated statements of financial position 4
Principal activities 5
Review and development of the Company’s business and financial position 5
Major events of the year 6
Likely future developments 8
By back of own shares 8
Environment 8
Employees 9
Research and development activities 9
Branches 9
Principal risk and uncertainties 9
Major events after the closing date 11
Valtech SE
P a g e 3 | 12
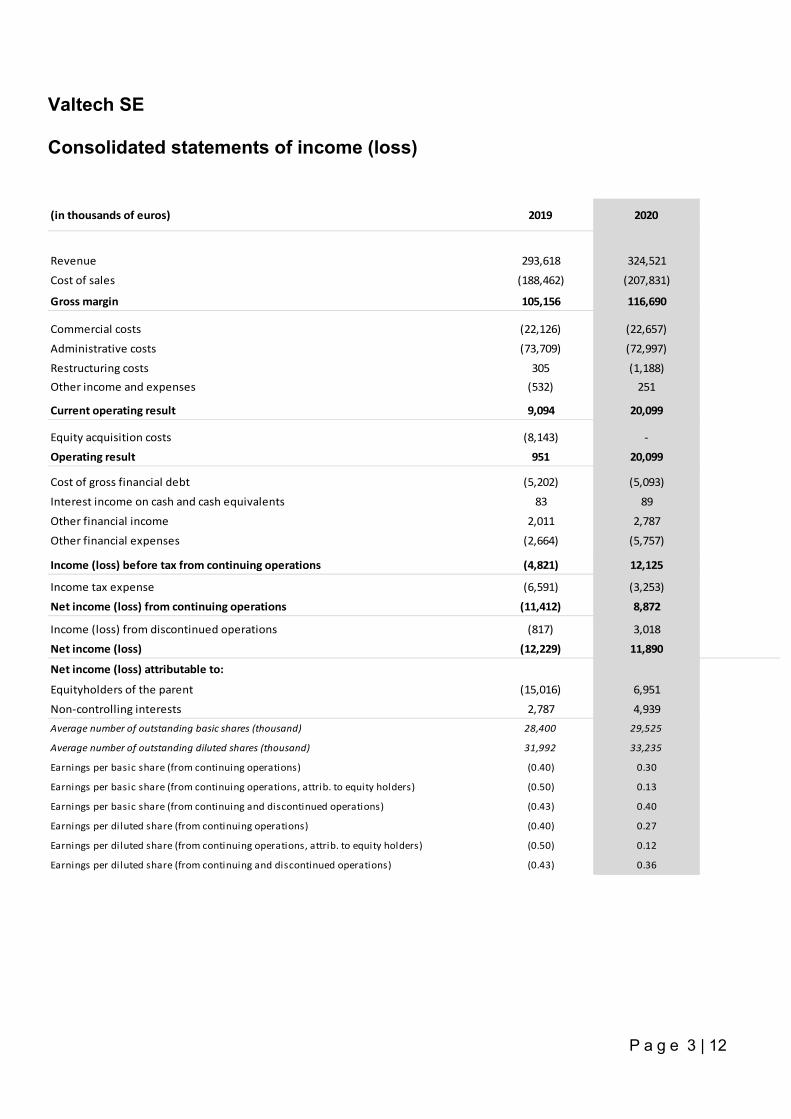
Consolidated statements of income (loss)
(in thousands of euros) 2019 2020
Revenue 293,618 324,521
Cost of sales (188,462) (207,831)
Gross margin 105,156 116,690
Commercial costs (22,126) (22,657)
Administrative costs (73,709) (72,997)
Restructuring costs 305 (1,188)Other income and expenses (532) 251
Current operating result 9,094 20,099
Equity acquisition costs (8,143) -
Operating result 951 20,099
Cost of gross financial debt (5,202) (5,093)
Interest income on cash and cash equivalents 83 89
Other financial income 2,011 2,787
Other financial expenses (2,664) (5,757)
Income (loss) before tax from continuing operations (4,821) 12,125
Income tax expense (6,591) (3,253)
Net income (loss) from continuing operations (11,412) 8,872
Income (loss) from discontinued operations (817) 3,018
Net income (loss) (12,229) 11,890
Net income (loss) attributable to:
Equityholders of the parent (15,016) 6,951
Non-controlling interests 2,787 4,939Average number of outstanding basic shares (thousand) 28,400 29,525
Average number of outstanding diluted shares (thousand) 31,992 33,235
Earnings per basic share (from continuing operations) (0.40) 0.30
Earnings per basic share (from continuing operations, attrib. to equity holders) (0.50) 0.13
Earnings per basic share (from continuing and discontinued operations) (0.43) 0.40
Earnings per diluted share (from continuing operations) (0.40) 0.27
Earnings per diluted share (from continuing operations, attrib. to equity holders) (0.50) 0.12
Earnings per diluted share (from continuing and discontinued operations) (0.43) 0.36
Valtech SE
P a g e 4 | 12
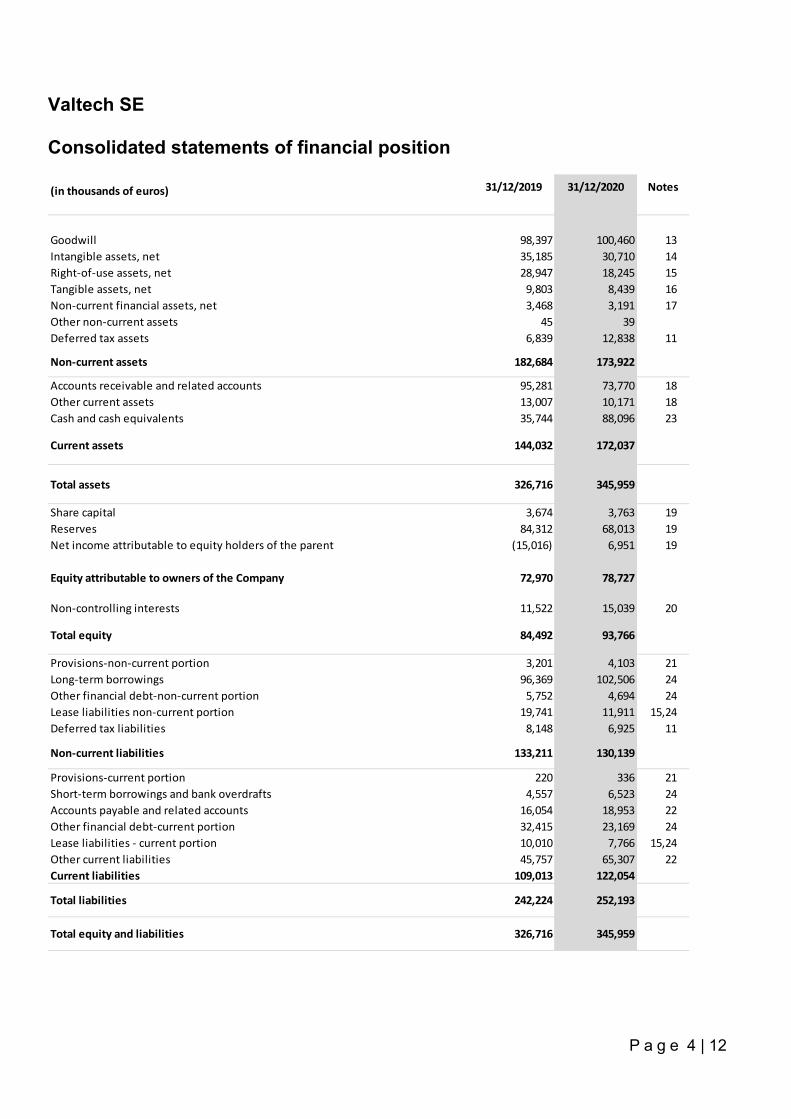
Consolidated statements of financial position
(in thousands of euros) 31/12/2019 31/12/2020 Notes
Goodwill 98,397 100,460 13Intangible assets, net 35,185 30,710 14Right-of-use assets, net 28,947 18,245 15Tangible assets, net 9,803 8,439 16Non-current financial assets, net 3,468 3,191 17Other non-current assets 45 39Deferred tax assets 6,839 12,838 11
Non-current assets 182,684 173,922
Accounts receivable and related accounts 95,281 73,770 18Other current assets 13,007 10,171 18Cash and cash equivalents 35,744 88,096 23
Current assets 144,032 172,037
Total assets 326,716 345,959
Share capital 3,674 3,763 19Reserves 84,312 68,013 19Net income attributable to equity holders of the parent (15,016) 6,951 19
Equity attributable to owners of the Company 72,970 78,727
Non-controlling interests 11,522 15,039 20
Total equity 84,492 93,766
Provisions-non-current portion 3,201 4,103 21Long-term borrowings 96,369 102,506 24Other financial debt-non-current portion 5,752 4,694 24Lease liabilities non-current portion 19,741 11,911 15,24Deferred tax liabilities 8,148 6,925 11
Non-current liabilities 133,211 130,139
Provisions-current portion 220 336 21Short-term borrowings and bank overdrafts 4,557 6,523 24Accounts payable and related accounts 16,054 18,953 22Other financial debt-current portion 32,415 23,169 24Lease liabilities - current portion 10,010 7,766 15,24Other current liabilities 45,757 65,307 22Current liabilities 109,013 122,054
Total liabilities 242,224 252,193
Total equity and liabilities 326,716 345,959
Valtech SE
P a g e 5 | 12
Principal activities
Valtech is a next-generation digital transformation services provider focused on helping medium and large organizations as they embrace the digital age. Valtech provides a streamlined portfolio of integrated offerings, encompassing strategy, design, technology integration and data analytics through which it builds and operates its clients’ critical customer engagement and e-commerce platforms, while maintaining brand consistency. Valtech defines “digital transformation” as a new approach for envisioning, creating, selling, delivering, servicing, and consuming products and services with increased agility, time-to-market, reliability and scalability. This new approach impacts many aspects of clients’ operating models, from the way investment decisions are made, measured and managed to the sales experience and engagement offered to the customers.
Valtech’s clients primarily consist of medium and large corporations located across Europe, North America, South America, and Asia. 72% of 2020 revenues were generated from our operations in Europe, 18% from operations located in North America and 10% from operations located in the rest of the world.
Valtech has become one of the leading independent digital transformation services providers in the world, with 3,167 employees as of December 31, 2020, and with broad geographic and industry diversification. Revenues have grown from €293.6 million in 2019 to €324.5 million in 2020, representing a growth rate of 10%.
Review and development of the Group’s business and financial position
Profit and loss
Revenue grew from €293.6 million in 2019 to €324.5 million in 2020, representing an increase of €30.9 million, or 10.5%. The net increase was primarily attributable to increase of revenues in Switzerland (+€34.8 million), Germany (+€5.9 million) and decrease of revenues in United Kingdom (-€11.1 million). Increase of revenues in Switzerland is mainly attributable to the acquisition of Infocentric Research AG in December 2019, with full impact on revenues in year 2020.
Cost of sales increased from €188.5 million in 2019 to €207.8 million in 2020, representing an increase of €19.4 million, or 10.3%. The increase was primarily attributable to an increase in staff costs, which grew €8.9 million, or 6.0%, from €148.3 million in 2019 to €157.2 million (net of received government grants €3.2 million) in 2020, mainly due to an increase in our average headcount of IT professionals from 2,312 for the year 2019 to 2,533 for the year 2020, and an increase in subcontractor costs, which increased by €9.9 million, or 28.2%, from 2019 to 2020. Gross margin grew from €105.1 million in 2019 to €116.7 million in 2020, representing an increase of €11.5 million, or 11.0%. Gross margin % increased with 0.2%, from 35.8% in 2019 to 36.0% in 2020.
Commercial costs increased from €22.2 million in 2019 to €22.7 million in 2020, representing an increase of €0.5 million, or 2.0%. The increase mainly refers to increase in sales- and marketing salary costs (+€0.6 million compared to 2019), increase in cost for amortization of intangible assets identified in purchase price allocations (+€1.3 million compared to 2019) and decreased cost for marketing (-€1.1 million compared to 2019).
Administrative costs decreased from €73.7 million in 2019 to €73.0 million in 2020, representing a decrease of €0.7 million, or 1.0%. The decrease mainly refers to cost related to share based payments (-€3.6 million compared to 2019), off-set by increase in management- and administration salary costs (+€1.8 million compared to 2019) and increase in costs related to bad debts and provision for risks (+€1.4 million compared to 2019).
Restructuring costs increased from +€0.3 million in 2019 (income) to a loss of €1.2 million in 2020, representing an increase of €1.5 million, which is primarily attributable to severance costs in the United States and the United Kingdom.
Other income and expenses increased from a loss of €0.5 million in 2019 to an income of €0.3 million in 2020, mainly referring to adjustment of earn-out related to the acquisitions of MJD and Infocentric.
Equity acquisition costs decreased from €8.1 million in 2019 to €0.0 million in 2020. Equity acquisition cost in 2019 was attributable to reversal of deferred offering costs as a consequence of the postponement of the initial public offering.
Valtech SE
P a g e 6 | 12
Financial income and expenses increased from €5.8 million in 2019 to €8.0 million in 2020, an increase with €2.2 million. The increase was primarily attributable to the increase in net currency loss for an amount of €2.3 million.
Income tax expense decreased from €6.6 million in 2019 to €3.3 million in 2020, a decrease of €3.3 million. In 2020, a deferred tax asset for an amount of €6.1 million for a portion of the available unused tax losses in France and for the full amount of unused tax losses in USA was recognized. In 2019, an increase of the deferred tax asset for an amount of €0.6 million regarding unused tax losses in USA was recognized.
Income (loss) from discontinued operations refers to disposed businesses in USA and Australia and have changed from a loss of €0.8 million in 2019 to an income of €3.0 million in 2020, an increase with €3.8 million. In 2020, a judgment was rendered in a dispute with the buyer or the business in US, which awarded $3.1 million to Valtech.
Non-controlling interests were €2.8 million in 2019 and €4.9 million in 2020. Non-controlling interest represent the portion of the net income of our joint-venture with Audi that is attributable to our venture partner.
As a result of the foregoing, we had a net loss of €12.2 million in 2019 and a net income of €11.9 million in 2020, representing an increase of €24.1 million.
Balance sheet
Total assets increased by 5.9% compared with previous year to €346.0 million as of 31 December 2020 (2019: €326.7 million). The net increase of €19.3 million mainly refers to increase in cash (+€52.4 million), mainly attributable to operating activities, decrease in right-of-use assets (-€10.7 million), mainly attributable to depreciations, and decrease in accounts receivables and related accounts (-€21.5 million).
Total liabilities increased by 4.1% compared with previous year to €252.2 million as of 31 December 2020 (2019: €242.2 million). The increase of €10.0 million mainly refers to increase in other current liabilities (+€19.6 million), which mainly refers to deferred tax and social security payments, offered by governments in some countries due to Covid-19, and net decrease in financial liability (-€12.3 million), mainly attributable to decrease in debt related to acquisitions (-€14.8 million), decrease of lease liability (-€10.0 million), attributable to payments and increase of long term borrowings (+€6.1 million), attributable to rent-free loans in France guaranteed by the French Government, to support the business in the light of the Covid-19 pandemic.
As of December 31, 2020, our primary sources of liquidity were €87.7 million of cash and cash equivalents net of bank overdrafts and factoring with recourse (€0.4 million).
Major events of the year
Increase in capital On March 6, 2020, the Board of Valtech, on behalf of the shareholders, decided to issue 264,209 new shares at €17.5 per share as payment for the acquisition of MJD Interactive, leading to a capital increase of €4,624 thousand (out of which €33 thousand in share capital). On March 6, 2020, the Board of Valtech, on behalf of the shareholders, decided to issue 453,348 new shares at €17.5 per share as payment for the acquisition of Infocentric Research AG, leading to a capital increase of €7,934 thousand (out of which €57 thousand in share capital). Total capital increase regarding issue of new shares amounts to €12,557 thousand, of which €89 thousand has increased the capital and €12,468 thousand increased additional paid in capital. Net increase in capital amounts to €0 thousand and corresponds to €12,557 thousand minus the put options given in 2020 to the sellers of MJD Interactive and Infocentric at €12,557 thousand.
Valtech SE
P a g e 7 | 12
Hyperinflation in Argentina
Entities with a functional currency of the Argentine peso are required to apply IAS 29 in accounting periods ending on or after 1 July 2018. Valtech’s Argentinian business represented 1.2% of the total revenue for the year 2020. Adoption of IAS 29 requires the non-monetary assets and liabilities and the income statement to be restated to reflect the changes in the general pricing power of its functional currency, leading to a gain or loss on the net monetary position included in the net income. Gain in net monetary position due to restatement amounts to less than €100 thousand as per December 31, 2020 and is deemed as immaterial.
Waiver of financial covenants
As a result of the impact of the Covid-19 outbreak on our financial performance and financial position, we assessed the situation in March 2020 and anticipated then that the Group would not comply with the financial covenants of its bonds, as of June 30 and December 31, 2020. We entered into discussions with the holders of the bonds, who in May 2020 agreed in writing to waive those covenants for June 30 and December 31, 2020, subject to a minimum amount of cash of €25 million to be available in the Group by June 30 and December 31, 2020. The written agreement to waive those covenants was reaffirmed in the resolutions passed by the general assembly of the bond holders on July 10, 2020, which included amendments of a technical nature to the terms and conditions of the bonds. The waiver of the covenants was conditioned by Valtech receiving a loan from the shareholders, for a maximum amount of €30 million. The loan agreement was approved by the General Meeting of Valtech’s shareholders on July 7, 2020 and was signed on September 22, 2020. Loan from shareholders
To secure the Group’s financial position and to cover possible shortfall of cash caused by the Covid-19 pandemic, we have agreed with the shareholders on a loan of maximum €30 million on September 22, 2020. The loan can be drawn in one, two or three drawing(s), for an amount of €10 million each, between the effective date and at the latest on December 10, 2020. No drawing of the loan has been made in year 2020, and the opportunity to borrow has expired without being used.
Dispute with buyer of business in USA
Valtech Services (USA) sold its business assets on January 1, 2016. In August 2018, Valtech Services introduced claims against the buyer to recover payments due under the sale contract, plus legal expenses. In October 2020 the Appeal Court rendered a judgment, which awarded $3.1 million to Valtech Services in payment for the assets sold, plus interest, sanctions and legal fee and costs. In December 2020, the full amount was paid by the buyer to an escrow account, and in January 2021, Valtech received the full amount in cash. The total compensation, including release of withhold cash payments from the buyer’s clients, amount to $3.7 million. Received compensation and legal fees related to the litigation is recorded under discontinued operations. Acquisition of the companies Headways Digital Strategy S.A. de C.V. and Branteza S. de R.L de C.V. (Mexico)
On December 1, 2020, Valtech acquired Headways Digital Strategy and Branteza, a Mexican Digital Agency with offices in Mexico City. Headways and Branteza are consolidated in the Valtech accounts as of December 1, 2020. Pursuant to the purchase agreement, Valtech paid the sellers €2.9 million upon closing with an additional €0.4 million to be paid before end of April 2021, and a €0.1 million holdback payment. In April 2021, an additional €0.5 million will be paid in shares, with an additional €0.9 million holdback amount in shares, to be released for payment between July 2023 and July 2026. Subject to certain exceptions and the achievement of certain targets in 2021 and 2022, the sellers are also entitled to receive €1.3 million in cash in 2022 and 2023. The total consideration is estimated at €6.1million. The determination of the fair value of assets acquired and liabilities assumed is ongoing. The preliminary fair value of net assets acquired before exchange rate fluctuation amounts to €796 thousand, out of which €2,457 thousand relate to financial assets, €40 thousand relate to tangible assets and €1,701 thousand relate to financial liabilities. The preliminary goodwill resulting from this transaction is €5.3 million before exchange rate fluctuation.
Valtech SE
P a g e 8 | 12
Headways and Branteza contributed €771 thousand revenues and €17 thousand to the Group’s result for the period between the date of acquisition and December 31, 2020. If the acquisition of Headways and Branteza had been completed on the first day of the financial year, Group revenues for the year 2020 would have been €330,452 thousand (instead of €324,521 as reported) and Group profit would have been €11,951 thousand (instead of €11,890 thousand as reported).
Likely future developments Valtech will continue to develop its client and activity portfolio in the countries where the group has a presence. Valtech will also explore opportunities to acquire new businesses if and when opportunities arise to expand its activities in geographies, technologies and know-how that can contribute to its growth.
Buy-back of own shares During the year 2020, the Company purchased 566,595 own shares, amounting to €8,777 thousand (purchased from the sellers of People Interactive, El Chalten, Non Linear and Codehouse). 53,000 of the shares bought back was used for exercise of warrants, leading to an outstanding number of 513,595 treasury shares at a value of €7,982 thousand as per December 31, 2020.
Environment Valtech is a s professional service company and has no production of its own. This means that we have relatively small material flows and waste disposal. We strive to reduce our negative environmental impact and increase our positive social imprint.
We work continuously with environmental and sustainability issues, social responsibility, gender equality and diversity. We are committed to these issues because we believe that it contributes to a positive, attractive and evolving working climate and we believe in the power of individuals and businesses to positively influence the development of society.
Here’s some examples of our environment work:
• We have a careful attitude to how we use the earth's resources. We consider environmental aspects, sustainability and social responsibility in decisions made, both large and small
• Environmental issues should be taken into account when choosing new premises, whether it concerns (i) their energy consumption and (ii) their location and thus their ease of access by public transportation.
• We work to minimize our environmental impact and choose the alternatives that are most environmentally friendly. We make relevant environmental requirements when purchasing goods and services.
• We strive to reduce our waste and to have a responsible and efficient waste disposal • We recycle consumed materials and products to the highest extent possible • Through innovation, design and technology, we strive to help our customers choose more sustainable
solutions and approaches that promote sustainable societal development. • We take advantage of employees' interest and commitment in environmental and sustainability issues
Given the very light environmental impact of its business, Valtech does not yet have a definitive responsibility for the responsibility for the coordination of environmental management. A reflection is under way which could lead to a connection with the Group's General Secretariat.
Valtech SE
P a g e 9 | 12
Employees
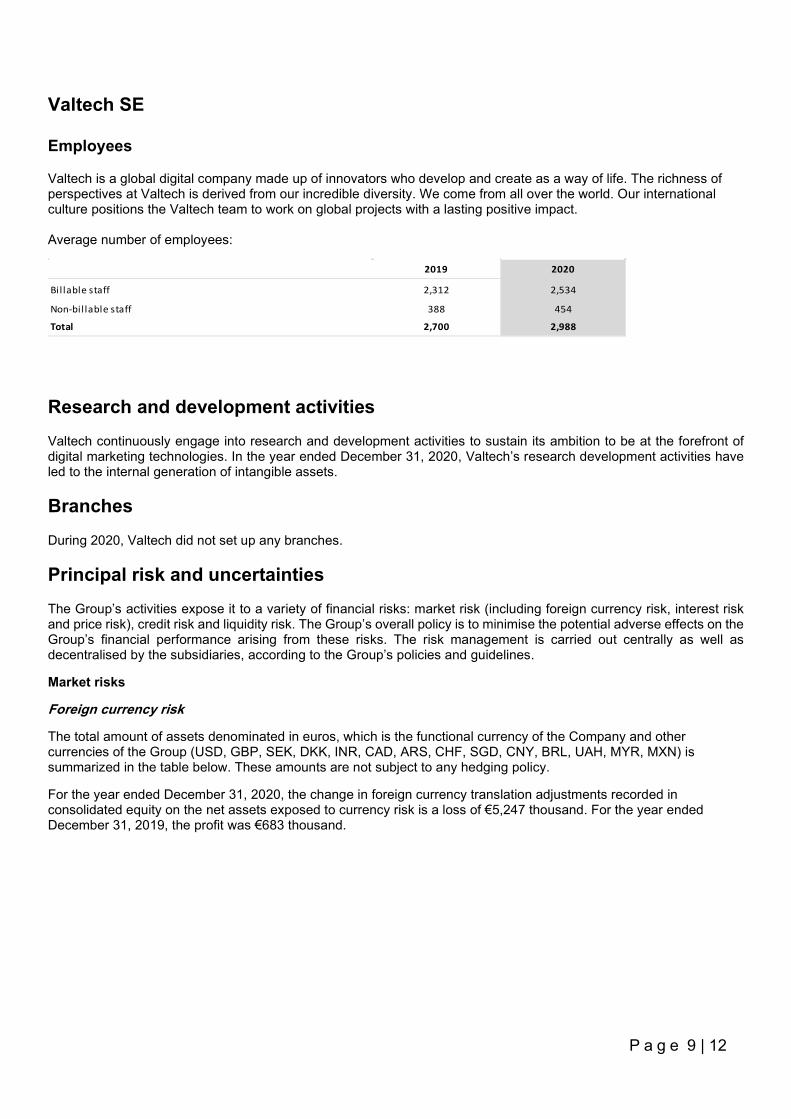
Valtech is a global digital company made up of innovators who develop and create as a way of life. The richness of perspectives at Valtech is derived from our incredible diversity. We come from all over the world. Our international culture positions the Valtech team to work on global projects with a lasting positive impact. Average number of employees:
2019 2020
Billable staff 2,312 2,534
Non-bil lable staff 388 454
Total 2,700 2,988
Research and development activities Valtech continuously engage into research and development activities to sustain its ambition to be at the forefront of digital marketing technologies. In the year ended December 31, 2020, Valtech’s research development activities have led to the internal generation of intangible assets.
Branches During 2020, Valtech did not set up any branches.
Principal risk and uncertainties The Group’s activities expose it to a variety of financial risks: market risk (including foreign currency risk, interest risk and price risk), credit risk and liquidity risk. The Group’s overall policy is to minimise the potential adverse effects on the Group’s financial performance arising from these risks. The risk management is carried out centrally as well as decentralised by the subsidiaries, according to the Group’s policies and guidelines.
Market risks
Foreign currency risk
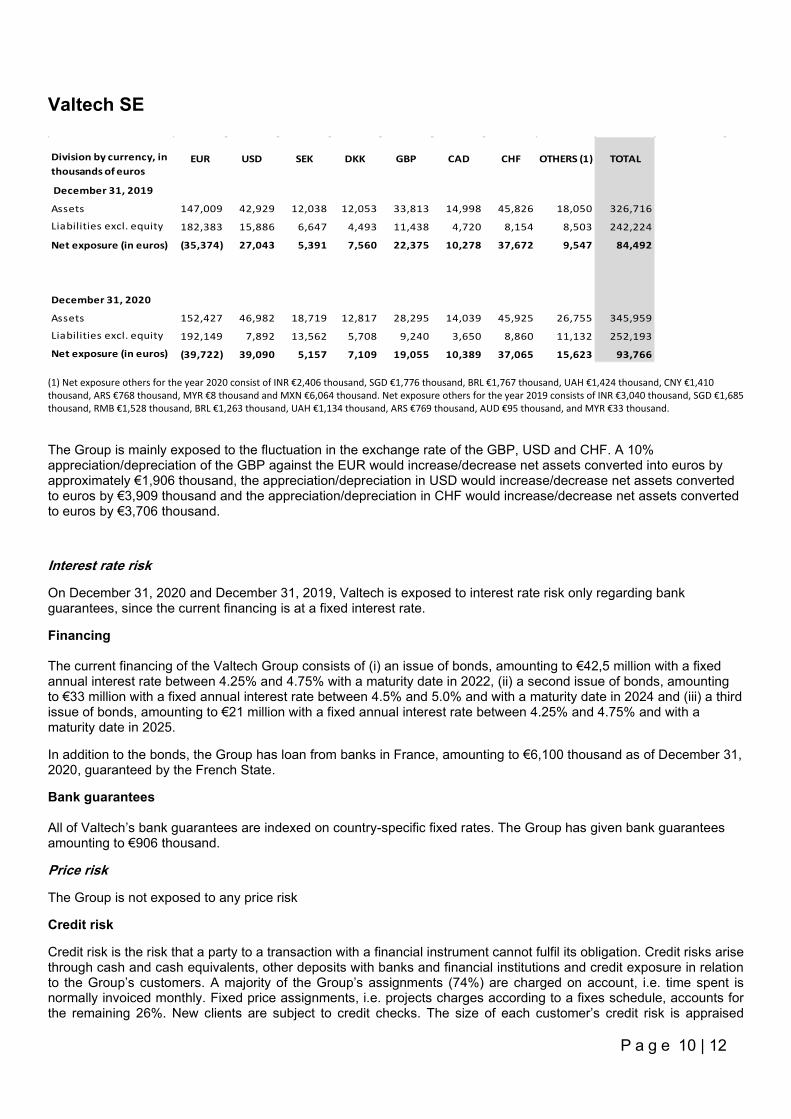
The total amount of assets denominated in euros, which is the functional currency of the Company and other currencies of the Group (USD, GBP, SEK, DKK, INR, CAD, ARS, CHF, SGD, CNY, BRL, UAH, MYR, MXN) is summarized in the table below. These amounts are not subject to any hedging policy.
For the year ended December 31, 2020, the change in foreign currency translation adjustments recorded in consolidated equity on the net assets exposed to currency risk is a loss of €5,247 thousand. For the year ended December 31, 2019, the profit was €683 thousand.
Valtech SE
P a g e 10 | 12
Division by currency, in thousands of euros
EUR USD SEK DKK GBP CAD CHF OTHERS (1) TOTAL
December 31, 2019
Assets 147,009 42,929 12,038 12,053 33,813 14,998 45,826 18,050 326,716
Liabilities excl. equity 182,383 15,886 6,647 4,493 11,438 4,720 8,154 8,503 242,224
Net exposure (in euros) (35,374) 27,043 5,391 7,560 22,375 10,278 37,672 9,547 84,492
December 31, 2020
Assets 152,427 46,982 18,719 12,817 28,295 14,039 45,925 26,755 345,959
Liabilities excl. equity 192,149 7,892 13,562 5,708 9,240 3,650 8,860 11,132 252,193
Net exposure (in euros) (39,722) 39,090 5,157 7,109 19,055 10,389 37,065 15,623 93,766 (1) Net exposure others for the year 2020 consist of INR €2,406 thousand, SGD €1,776 thousand, BRL €1,767 thousand, UAH €1,424 thousand, CNY €1,410 thousand, ARS €768 thousand, MYR €8 thousand and MXN €6,064 thousand. Net exposure others for the year 2019 consists of INR €3,040 thousand, SGD €1,685 thousand, RMB €1,528 thousand, BRL €1,263 thousand, UAH €1,134 thousand, ARS €769 thousand, AUD €95 thousand, and MYR €33 thousand.
The Group is mainly exposed to the fluctuation in the exchange rate of the GBP, USD and CHF. A 10% appreciation/depreciation of the GBP against the EUR would increase/decrease net assets converted into euros by approximately €1,906 thousand, the appreciation/depreciation in USD would increase/decrease net assets converted to euros by €3,909 thousand and the appreciation/depreciation in CHF would increase/decrease net assets converted to euros by €3,706 thousand.
Interest rate risk
On December 31, 2020 and December 31, 2019, Valtech is exposed to interest rate risk only regarding bank guarantees, since the current financing is at a fixed interest rate.
Financing The current financing of the Valtech Group consists of (i) an issue of bonds, amounting to €42,5 million with a fixed annual interest rate between 4.25% and 4.75% with a maturity date in 2022, (ii) a second issue of bonds, amounting to €33 million with a fixed annual interest rate between 4.5% and 5.0% and with a maturity date in 2024 and (iii) a third issue of bonds, amounting to €21 million with a fixed annual interest rate between 4.25% and 4.75% and with a maturity date in 2025.
In addition to the bonds, the Group has loan from banks in France, amounting to €6,100 thousand as of December 31, 2020, guaranteed by the French State.
Bank guarantees All of Valtech’s bank guarantees are indexed on country-specific fixed rates. The Group has given bank guarantees amounting to €906 thousand.
Price risk
The Group is not exposed to any price risk
Credit risk
Credit risk is the risk that a party to a transaction with a financial instrument cannot fulfil its obligation. Credit risks arise through cash and cash equivalents, other deposits with banks and financial institutions and credit exposure in relation to the Group’s customers. A majority of the Group’s assignments (74%) are charged on account, i.e. time spent is normally invoiced monthly. Fixed price assignments, i.e. projects charges according to a fixes schedule, accounts for the remaining 26%. New clients are subject to credit checks. The size of each customer’s credit risk is appraised
Valtech SE
P a g e 11 | 12
individually. A monthly review of the aging of balances is conducted, and each customer and its associated credit limit is closely monitored.
Liquidity risk
Liquidity risk is the risk that the Group will encounter difficulty in meeting the obligations associated with its financial liabilities that are settled by delivering cash or another financial asset. The Group’s approach to managing liquidity is to ensure, as far as possible, that it will have sufficient liquidity to meet its liabilities when they are due, under both normal and stressed conditions, without incurring unacceptable losses or risk damage to the Group’s reputation.
In addition to the cash of €88,096 thousand, the Group’s financing as of December 31, 2020 is based mainly on one line related to factoring of receivables totalling €390 thousand (of maximum amount €7,209 thousand), concluded by the French entity.
As of December 31, 2020, the cash and cash equivalents has increased by €53.9 million compared to December 31, 2019. Increase in cash related to Covid-19 government supports amounts to €22.2 million, and refer to delayed payments of taxes €9.2 million, received loans granted by governments €8.2 million and received government grants related to salary costs €4.8 million.
Risk on shares and other financial investments
Valtech does not hold any marketable securities, and the Group is not exposed to the risk of share price fluctuation.
Major events after the closing date Acquisition of eCapacity A/S (Denmark) On February 8, 2021, Valtech acquired eCapacity A/S, a leading advisory agency for data-driven digital strategies in the Nordic region, with offices in Copenhagen and Aarhus and with a turnover or €6.4 million in 2020. eCapacity will be consolidated in the Valtech accounts as of February 1, 2021. Pursuant to the purchase agreement, Valtech paid the sellers €13.7 million in cash upon closing and €3.0 million in shares, with an additional €1.0 million holdback payment. Subject to certain exceptions and the achievement of certain targets in 2021, the sellers are also entitled to receive €1.7 million in cash in 2022. The total consideration is estimated to €19.4 million.
Acquisition of Radon Creative AB (Sweden)
On February 10, 2021, Valtech acquired Radon Creative AB, a full-service agency, with office in Stockholm and with a turnover of €9.9 million in 2020. Radon Creative will be consolidated in the Valtech accounts as of February 1, 2021. Pursuant to the purchase agreement, Valtech paid the sellers €9.6 million in cash upon closing, with an additional €3.9 million holdback payment. Subject to certain exceptions and the achievement of certain targets in 2021, the sellers are also entitled to receive €3.5 million in shares in 2022. The total consideration is estimated to €17.0 million.
Acquisition of Codeflair Group (Switzerland and North Macedonia)
On March 30, 2021, Valtech acquired Codeflair Group, a Swiss company with a subsidiary in North Macedonia and with a turnover of €1.9 million in 2020. Codeflair will be consolidated in the Valtech accounts as of April 1, 2021. Pursuant to the purchase agreement, Valtech paid the sellers €2.2 million in cash upon closing, with an additional €0.8 million payment in shares to be paid in April 2021.
Valtech SE
P a g e 12 | 12
Approval of restricted share unit plan
On March 25, 2021, the Board of Valtech, on behalf on the shareholders, approved a restricted share unit (RSU) plan, issued to key employees. Total number of issued RSUs amount to 268.334, divided between 7 beneficiaries. The restricted share units give the employees the right to receive shares on the vesting dates. The plan vests between June 30, 2021 and June 30, 2022.
Société à responsabilité limitée au capital de 360.000 € RCS Luxembourg B 67.895 Autorisation d’établissement 10022179 © Deloitte Audit, SARL 13
Deloitte Audit Société à responsabilité limitée 20 Boulevard de Kockelscheuer L-1821 Luxembourg Tel: +352 451 451 www.deloitte.lu
To the Shareholders of
Valtech S.E.
European Public Limited Liability Company
28/30 Boulevard Joseph II
1840 Luxembourg
Luxembourg
REPORT OF THE REVISEUR D’ENTREPRISES AGREE
Report on the Audit of the Consolidated Financial Statements
Opinion
We have audited the consolidated financial statements of Valtech S.E and its subsidiaries (the “Group”), which
comprise the consolidated statement of financial position as at December 31, 2020, and the consolidated statement
of comprehensive income, consolidated statement of changes in equity and consolidated statement of cash flows for
the year then ended, and notes to the consolidated financial statements, including a summary of significant
accounting policies.
In our opinion, the accompanying consolidated financial statements present fairly, in all material respects, the
consolidated financial position of the Group as at December 31, 2020, and of its consolidated financial performance
and of its consolidated cash flows for the year then ended in accordance with International Financial Reporting
Standards (IFRSs) as adopted by the European Union.
Basis for Opinion
We conducted our audit in accordance with the Law of July 23, 2016 on the audit profession (Law of July 23, 2016) and
with International Standards on Auditing (ISAs) as adopted for Luxembourg by the “Commission de Surveillance du
Secteur Financier” (CSSF). Our responsibilities under the Law of July 23, 2016 and ISAs as adopted for Luxembourg by
the CSSF are further described in the “Responsibilities of the “réviseur d’entreprises agréé” for the Audit of the
Consolidated Financial Statements” section of our report. We are also independent of the Group in accordance with
the International Code of Ethics for Professional Accountants, including International Independence Standards, issued
by the International Ethics Standards Board for Accountants (IESBA Code) as adopted for Luxembourg by the CSSF
together with the ethical requirements that are relevant to our audit of the consolidated financial statements, and
have fulfilled our other ethical responsibilities under those ethical requirements. We believe that the audit evidence
we have obtained is sufficient and appropriate to provide a basis for our opinion.
14
Other information
The Board of Directors is responsible for the other information. The other information comprises the information
stated in the consolidated management report but does not include the consolidated financial statements and our
report of the “réviseur d’entreprises agréé” thereon.
Our opinion on the consolidated financial statements does not cover the other information and we do not express any
form of assurance conclusion thereon.
In connection with our audit of the consolidated financial statements, our responsibility is to read the other
information and, in doing so, consider whether the other information is materially inconsistent with the consolidated
financial statements or our knowledge obtained in the audit or otherwise appears to be materially misstated. If, based
on the work we have performed, we conclude that there is a material misstatement of this other information, we are
required to report this fact. We have nothing to report in this regard.
Responsibilities of the Board of Directors and Those Charged with Governance for the Consolidated Financial
Statements
The Board of Directors is responsible for the preparation and fair presentation of these consolidated financial
statements in accordance with IFRSs as adopted by the European Union, and for such internal control as the Board of
Directors determines is necessary to enable the preparation of consolidated financial statements that are free from
material misstatement, whether due to fraud or error.
In preparing the consolidated financial statements, the Board of Directors is responsible for assessing the Group’s
ability to continue as a going concern, disclosing, as applicable, matters related to going concern and using the going
concern basis of accounting unless the Board of Directors either intends to liquidate the Group or to cease operations,
or has no realistic alternative but to do so.
Responsibilities of the “réviseur d’entreprises agréé” for the Audit of the Consolidated Financial Statements
Our objectives are to obtain reasonable assurance about whether the consolidated financial statements as a whole
are free from material misstatement, whether due to fraud or error, and to issue a report of the “réviseur
d’entreprises agréé” that includes our opinion. Reasonable assurance is a high level of assurance, but is not a
guarantee that an audit conducted in accordance with the Law of July 23, 2016 and with ISAs as adopted for
Luxembourg by the CSSF will always detect a material misstatement when it exists. Misstatements can arise from
fraud or error and are considered material if, individually or in the aggregate, they could reasonably be expected to
influence the economic decisions of users taken on the basis of these consolidated financial statements.
15
As part of an audit in accordance with the Law of July 23, 2016 and with ISAs as adopted for Luxembourg by the CSSF,
we exercise professional judgment and maintain professional skepticism throughout the audit. We also:
• Identify and assess the risks of material misstatement of the consolidated financial statements, whether due to
fraud or error, design and perform audit procedures responsive to those risks, and obtain audit evidence that is
sufficient and appropriate to provide a basis for our opinion. The risk of not detecting a material misstatement
resulting from fraud is higher than for one resulting from error, as fraud may involve collusion, forgery,
intentional omissions, misrepresentations, or the override of internal control.
• Obtain an understanding of internal control relevant to the audit in order to design audit procedures that are
appropriate in the circumstances, but not for the purpose of expressing an opinion on the effectiveness of the
Group’s internal control.
• Evaluate the appropriateness of accounting policies used and the reasonableness of accounting estimates and
related disclosures made by the Board of Directors.
• Conclude on the appropriateness of Board of Directors’ use of the going concern basis of accounting and, based
on the audit evidence obtained, whether a material uncertainty exists related to events or conditions that may
cast significant doubt on the Group’s ability to continue as a going concern. If we conclude that a material
uncertainty exists, we are required to draw attention in our report of the “réviseur d’entreprises agréé” to the
related disclosures in the consolidated financial statements or, if such disclosures are inadequate, to modify
our opinion. Our conclusions are based on the audit evidence obtained up to the date of our report of the
“réviseur d’entreprises agréé”. However, future events or conditions may cause the Group to cease to continue
as a going concern.
• Evaluate the overall presentation, structure and content of the consolidated financial statements, including the
disclosures, and whether the consolidated financial statements represent the underlying transactions and
events in a manner that achieves fair presentation.
• Obtain sufficient appropriate audit evidence regarding the financial information of the entities and business
activities within the Group to express an opinion on the consolidated financial statements. We are responsible
for the direction, supervision and performance of the Group audit. We remain solely responsible for our audit
opinion.
We communicate with those charged with governance regarding, among other matters, the planned scope and timing
of the audit and significant audit findings, including any significant deficiencies in internal control that we identify
during our audit.
16
Report on Other Legal and Regulatory Requirements
The consolidated management report is consistent with the consolidated financial statements and has been prepared
in accordance with applicable legal requirements.
For Deloitte Audit, Cabinet de révision agréé
Marco Crosetto, Réviseur d’entreprises agréé Partner
May 6, 2021
VALTECH
P a g e 1 | 59
VALTECH Consolidated financial statements
Years ended December 31 2020, December 31 2019 and December 31 2018
VALTECH
P a g e 2 | 59
Consolidated statements of income (loss) 4
Consolidated statements of comprehensive income (loss) 5
Consolidated statements of financial position 6
Consolidated statements of cash flows 7
Consolidated statements of changes in shareholders’ equity 8
Notes to the financial statements 9
NOTE 1 – Accounting policies 9
NOTE 2 – Major events of the period 21
NOTE 3 – Segment information 24
NOTE 4 – Types of revenue 27
NOTE 5 – Expenses by nature 29
NOTE 6 – Employees 30
NOTE 7 – Auditor’s fees 30
NOTE 8 – Restructuring costs and other income and expenses 30
NOTE 9 – Equity acquisition costs 31
NOTE 10 – Financial result 31
NOTE 11 – Income taxes 31
NOTE 12 – Discontinued operations 34
VALTECH
P a g e 3 | 59
NOTE 13 – Goodwill 35
NOTE 14 – Intangible assets 37
NOTE 15 – Right-of-use assets 38
NOTE 16 – Tangible assets 40
NOTE 17 – Non-current financial assets 41
NOTE 18 – Receivables and other current assets 41
NOTE 19 – Equity 44
NOTE 20 – Non-controlling interests 45
NOTE 21 – Provisions 46
NOTE 22 – Accounts payable and other current liabilities 48
NOTE 23 – Cash and cash equivalents 48
NOTE 24 – Financial debt 49
NOTE 25 – Management of financial risks and financial instruments 51
NOTE 26 – Share-based payments 53
NOTE 27 – Off-balance sheet commitments 57
NOTE 28 – Related parties 57
NOTE 29 – Major events after the closing date 58
VALTECH
P a g e 4 | 59
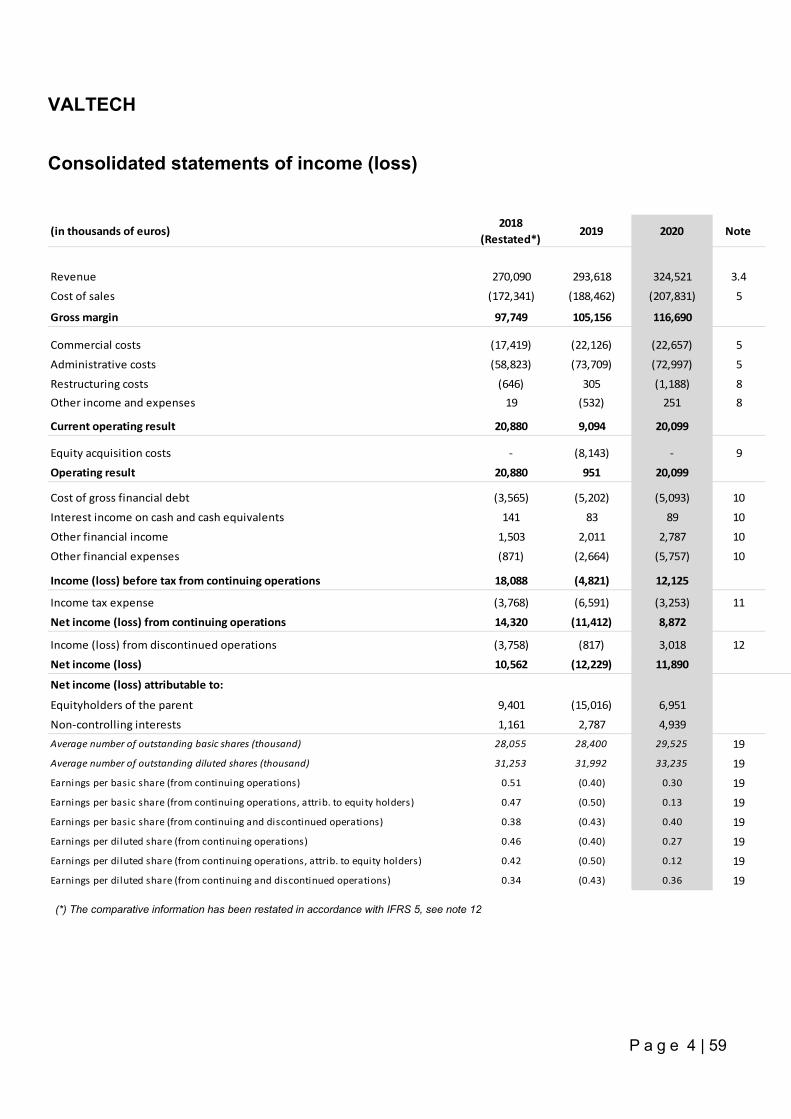
Consolidated statements of income (loss)
(in thousands of euros)2018
(Restated*)2019 2020 Note
Revenue 270,090 293,618 324,521 3.4
Cost of sales (172,341) (188,462) (207,831) 5
Gross margin 97,749 105,156 116,690
Commercial costs (17,419) (22,126) (22,657) 5
Administrative costs (58,823) (73,709) (72,997) 5
Restructuring costs (646) 305 (1,188) 8Other income and expenses 19 (532) 251 8
Current operating result 20,880 9,094 20,099
Equity acquisition costs - (8,143) - 9
Operating result 20,880 951 20,099
Cost of gross financial debt (3,565) (5,202) (5,093) 10
Interest income on cash and cash equivalents 141 83 89 10
Other financial income 1,503 2,011 2,787 10
Other financial expenses (871) (2,664) (5,757) 10
Income (loss) before tax from continuing operations 18,088 (4,821) 12,125
Income tax expense (3,768) (6,591) (3,253) 11
Net income (loss) from continuing operations 14,320 (11,412) 8,872
Income (loss) from discontinued operations (3,758) (817) 3,018 12
Net income (loss) 10,562 (12,229) 11,890
Net income (loss) attributable to:
Equityholders of the parent 9,401 (15,016) 6,951
Non-controlling interests 1,161 2,787 4,939Average number of outstanding basic shares (thousand) 28,055 28,400 29,525 19Average number of outstanding diluted shares (thousand) 31,253 31,992 33,235 19Earnings per basic share (from continuing operations) 0.51 (0.40) 0.30 19Earnings per basic share (from continuing operations, attrib. to equity holders) 0.47 (0.50) 0.13 19Earnings per basic share (from continuing and discontinued operations) 0.38 (0.43) 0.40 19Earnings per diluted share (from continuing operations) 0.46 (0.40) 0.27 19Earnings per diluted share (from continuing operations, attrib. to equity holders) 0.42 (0.50) 0.12 19Earnings per diluted share (from continuing and discontinued operations) 0.34 (0.43) 0.36 19
(*) The comparative information has been restated in accordance with IFRS 5, see note 12
VALTECH
P a g e 5 | 59
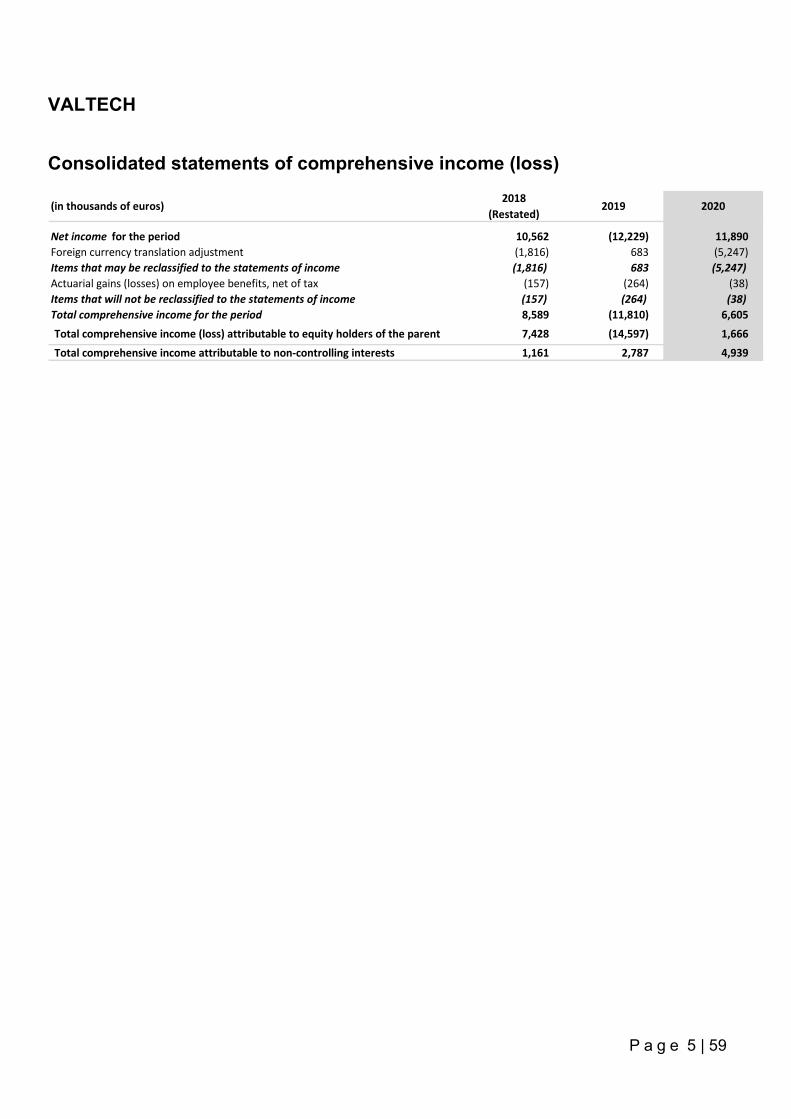
Consolidated statements of comprehensive income (loss)
(in thousands of euros)2018
(Restated)2019 2020
Net income for the period 10,562 (12,229) 11,890 Foreign currency translation adjustment (1,816) 683 (5,247) Items that may be reclassified to the statements of income (1,816) 683 (5,247) Actuarial gains (losses) on employee benefits, net of tax (157) (264) (38) Items that will not be reclassified to the statements of income (157) (264) (38) Total comprehensive income for the period 8,589 (11,810) 6,605 Total comprehensive income (loss) attributable to equity holders of the parent 7,428 (14,597) 1,666 Total comprehensive income attributable to non-controlling interests 1,161 2,787 4,939
VALTECH
P a g e 6 | 59
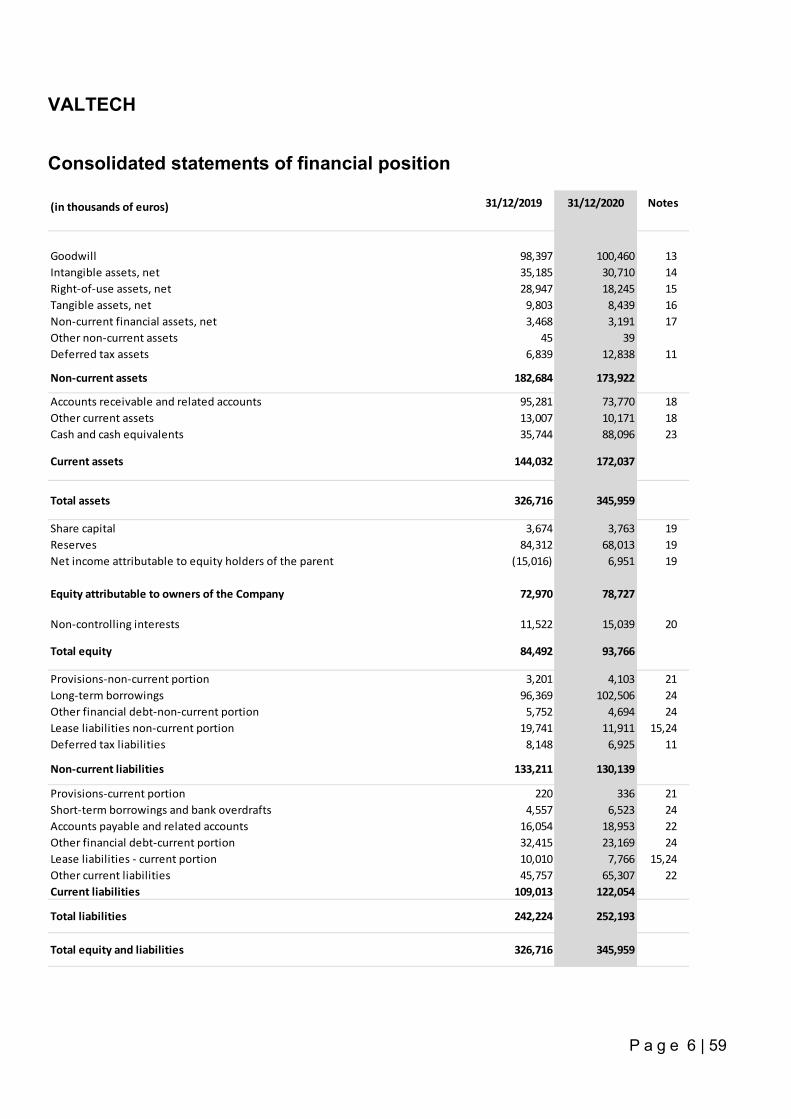
Consolidated statements of financial position
(in thousands of euros) 31/12/2019 31/12/2020 Notes
Goodwill 98,397 100,460 13Intangible assets, net 35,185 30,710 14Right-of-use assets, net 28,947 18,245 15Tangible assets, net 9,803 8,439 16Non-current financial assets, net 3,468 3,191 17Other non-current assets 45 39Deferred tax assets 6,839 12,838 11
Non-current assets 182,684 173,922
Accounts receivable and related accounts 95,281 73,770 18Other current assets 13,007 10,171 18Cash and cash equivalents 35,744 88,096 23
Current assets 144,032 172,037
Total assets 326,716 345,959
Share capital 3,674 3,763 19Reserves 84,312 68,013 19Net income attributable to equity holders of the parent (15,016) 6,951 19
Equity attributable to owners of the Company 72,970 78,727
Non-controlling interests 11,522 15,039 20
Total equity 84,492 93,766
Provisions-non-current portion 3,201 4,103 21Long-term borrowings 96,369 102,506 24Other financial debt-non-current portion 5,752 4,694 24Lease liabilities non-current portion 19,741 11,911 15,24Deferred tax liabilities 8,148 6,925 11
Non-current liabilities 133,211 130,139
Provisions-current portion 220 336 21Short-term borrowings and bank overdrafts 4,557 6,523 24Accounts payable and related accounts 16,054 18,953 22Other financial debt-current portion 32,415 23,169 24Lease liabilities - current portion 10,010 7,766 15,24Other current liabilities 45,757 65,307 22Current liabilities 109,013 122,054
Total liabilities 242,224 252,193
Total equity and liabilities 326,716 345,959
VALTECH
P a g e 7 | 59
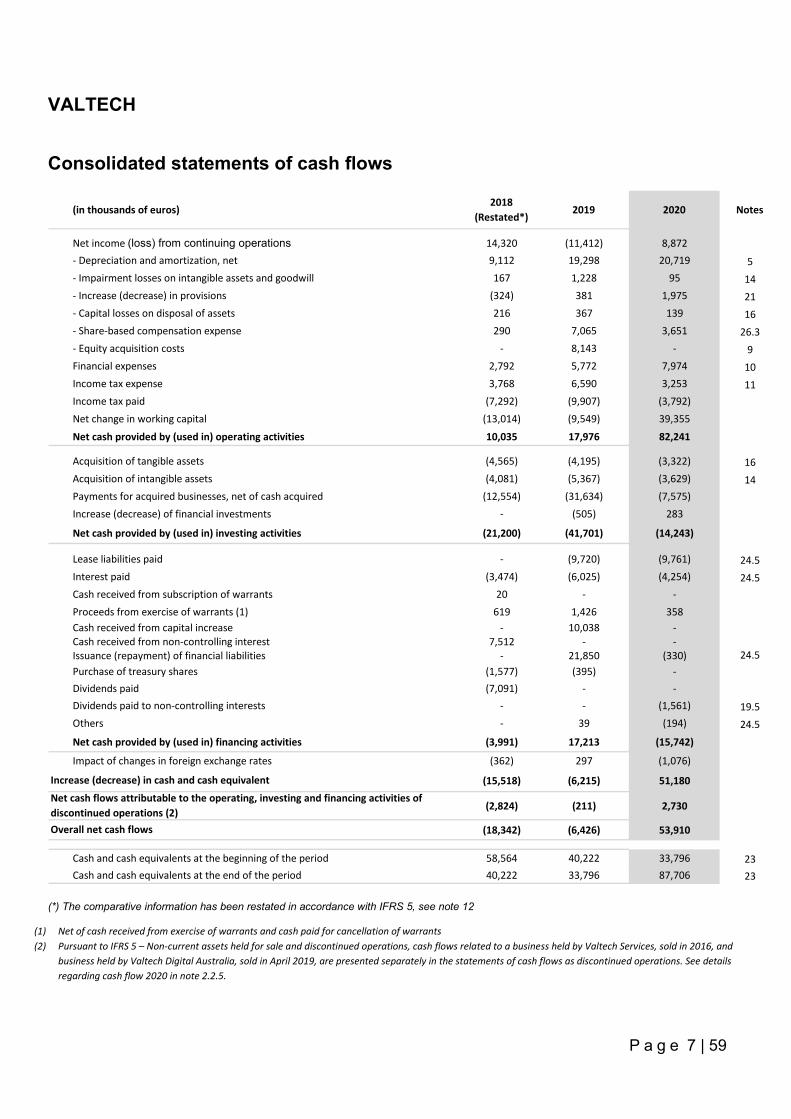
Consolidated statements of cash flows
(in thousands of euros)2018
(Restated*)2019 2020 Notes
Net income (loss) from continuing operations 14,320 (11,412) 8,872- Depreciation and amortization, net 9,112 19,298 20,719 5- Impairment losses on intangible assets and goodwill 167 1,228 95 14- Increase (decrease) in provisions (324) 381 1,975 21- Capital losses on disposal of assets 216 367 139 16- Share-based compensation expense 290 7,065 3,651 26.3- Equity acquisition costs - 8,143 - 9Financial expenses 2,792 5,772 7,974 10Income tax expense 3,768 6,590 3,253 11Income tax paid (7,292) (9,907) (3,792)Net change in working capital (13,014) (9,549) 39,355
Net cash provided by (used in) operating activities 10,035 17,976 82,241
Acquisition of tangible assets (4,565) (4,195) (3,322) 16Acquisition of intangible assets (4,081) (5,367) (3,629) 14Payments for acquired businesses, net of cash acquired (12,554) (31,634) (7,575)Increase (decrease) of financial investments - (505) 283
Net cash provided by (used in) investing activities (21,200) (41,701) (14,243)
Lease liabilities paid - (9,720) (9,761) 24.5Interest paid (3,474) (6,025) (4,254) 24.5Cash received from subscription of warrants 20 - -Proceeds from exercise of warrants (1) 619 1,426 358Cash received from capital increase - 10,038 -Cash received from non-controlling interest 7,512 - -Issuance (repayment) of financial liabilities - 21,850 (330) 24.5Purchase of treasury shares (1,577) (395) -Dividends paid (7,091) - -Dividends paid to non-controlling interests - - (1,561) 19.5Others - 39 (194) 24.5Net cash provided by (used in) financing activities (3,991) 17,213 (15,742)
Impact of changes in foreign exchange rates (362) 297 (1,076)
(15,518) (6,215) 51,180
(2,824) (211) 2,730
(18,342) (6,426) 53,910
Cash and cash equivalents at the beginning of the period 58,564 40,222 33,796 23Cash and cash equivalents at the end of the period 40,222 33,796 87,706 23
Net cash flows attributable to the operating, investing and financing activities of discontinued operations (2)Overall net cash flows
Increase (decrease) in cash and cash equivalent
(*) The comparative information has been restated in accordance with IFRS 5, see note 12
(1) Net of cash received from exercise of warrants and cash paid for cancellation of warrants (2) Pursuant to IFRS 5 – Non-current assets held for sale and discontinued operations, cash flows related to a business held by Valtech Services, sold in 2016, and
business held by Valtech Digital Australia, sold in April 2019, are presented separately in the statements of cash flows as discontinued operations. See details regarding cash flow 2020 in note 2.2.5.
VALTECH
P a g e 8 | 59
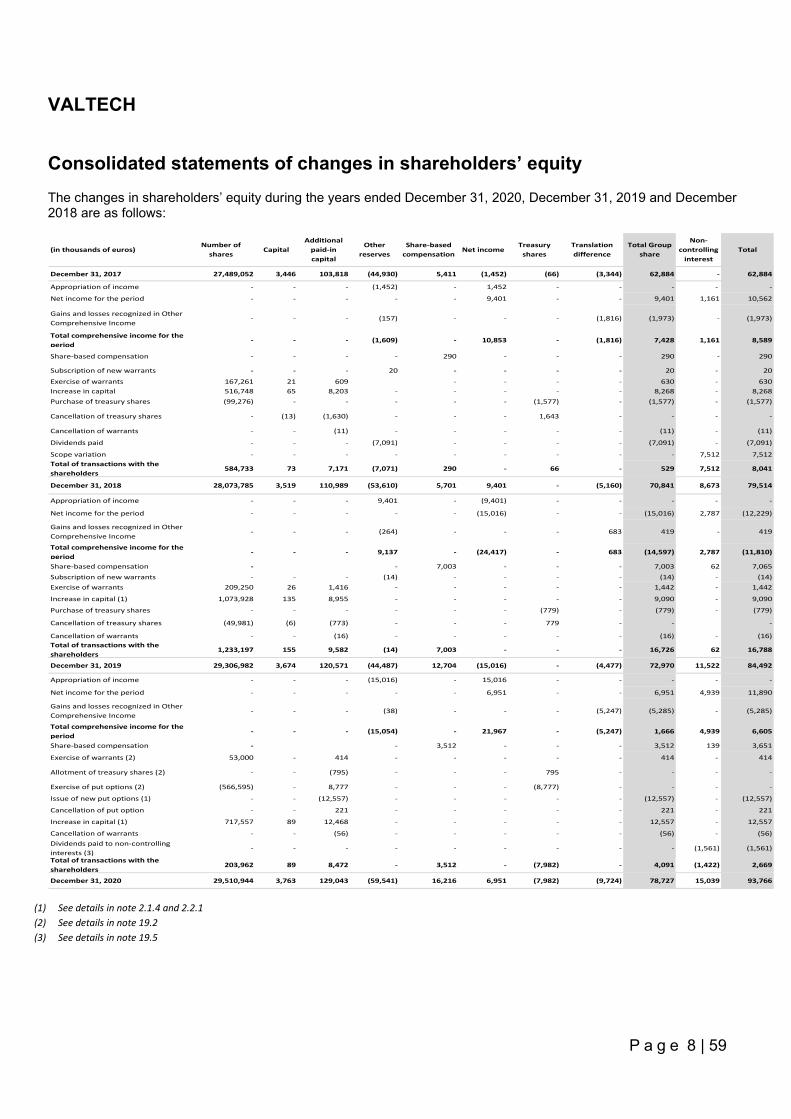
Consolidated statements of changes in shareholders’ equity The changes in shareholders’ equity during the years ended December 31, 2020, December 31, 2019 and December 2018 are as follows:
(in thousands of euros)Number of
sharesCapital
Additional paid-in capital
Other reserves
Share-based compensation
Net incomeTreasury
sharesTranslation difference
Total Group share
Non-controlling
interestTotal
Total of transactions with the 723 1 129 - (6 167) - (4 315) - (4 315)December 31, 2017 27,489,052 3,446 103,818 (44,930) 5,411 (1,452) (66) (3,344) 62,884 - 62,884
Appropriation of income - - - (1,452) - 1,452 - - - - -
Net income for the period - - - - - 9,401 - - 9,401 1,161 10,562
Gains and losses recognized in Other Comprehensive Income
- - - (157) - - - (1,816) (1,973) - (1,973)
Total comprehensive income for the period
- - - (1,609) - 10,853 - (1,816) 7,428 1,161 8,589
Share-based compensation - - - - 290 - - - 290 - 290
Subscription of new warrants - - - 20 - - - - 20 - 20
Exercise of warrants 167,261 21 609 - - - - 630 - 630Increase in capital 516,748 65 8,203 - - - - - 8,268 - 8,268Purchase of treasury shares (99,276) - - - - - (1,577) - (1,577) - (1,577)
Cancellation of treasury shares - (13) (1,630) - - - 1,643 - - - -
Cancellation of warrants - - (11) - - - - - (11) - (11)
Dividends paid - - - (7,091) - - - - (7,091) - (7,091)
Scope variation - - - - - - - - - 7,512 7,512Total of transactions with the shareholders
584,733 73 7,171 (7,071) 290 - 66 - 529 7,512 8,041
December 31, 2018 28,073,785 3,519 110,989 (53,610) 5,701 9,401 - (5,160) 70,841 8,673 79,514
Appropriation of income - - - 9,401 - (9,401) - - - - -
Net income for the period - - - - - (15,016) - - (15,016) 2,787 (12,229)
Gains and losses recognized in Other Comprehensive Income
- - - (264) - - - 683 419 - 419
Total comprehensive income for the period
- - - 9,137 - (24,417) - 683 (14,597) 2,787 (11,810)
Share-based compensation - - 7,003 - - - 7,003 62 7,065Subscription of new warrants - - - (14) - - - - (14) - (14)Exercise of warrants 209,250 26 1,416 - - - - - 1,442 - 1,442
Increase in capital (1) 1,073,928 135 8,955 - - - - - 9,090 - 9,090
Purchase of treasury shares - - - - - - (779) - (779) - (779)
Cancellation of treasury shares (49,981) (6) (773) - - - 779 - - -
Cancellation of warrants - - (16) - - - - - (16) - (16)Total of transactions with the shareholders
1,233,197 155 9,582 (14) 7,003 - - - 16,726 62 16,788
December 31, 2019 29,306,982 3,674 120,571 (44,487) 12,704 (15,016) - (4,477) 72,970 11,522 84,492
Appropriation of income - - - (15,016) - 15,016 - - - - -
Net income for the period - - - - - 6,951 - - 6,951 4,939 11,890
Gains and losses recognized in Other Comprehensive Income
- - - (38) - - - (5,247) (5,285) - (5,285)
Total comprehensive income for the period
- - - (15,054) - 21,967 - (5,247) 1,666 4,939 6,605
Share-based compensation - - 3,512 - - - 3,512 139 3,651
Exercise of warrants (2) 53,000 - 414 - - - - - 414 - 414
Allotment of treasury shares (2) - - (795) - - - 795 - - - -
Exercise of put options (2) (566,595) - 8,777 - - - (8,777) - - - -
Issue of new put options (1) - - (12,557) - - - - - (12,557) - (12,557)
Cancellation of put option - - 221 - - - - - 221 - 221
Increase in capital (1) 717,557 89 12,468 - - - - - 12,557 - 12,557
Cancellation of warrants - - (56) - - - - - (56) - (56)Dividends paid to non-controlling interests (3)
- - - - - - - - - (1,561) (1,561)
Total of transactions with the shareholders
203,962 89 8,472 - 3,512 - (7,982) - 4,091 (1,422) 2,669
December 31, 2020 29,510,944 3,763 129,043 (59,541) 16,216 6,951 (7,982) (9,724) 78,727 15,039 93,766 (1) See details in note 2.1.4 and 2.2.1 (2) See details in note 19.2 (3) See details in note 19.5
VALTECH
P a g e 9 | 59
Notes to the financial statements
The accompanying notes to the consolidated financial statements form an integral part of such consolidated financial statements (notes 3 to 12 primarily relate to the statements of income and notes 13 to 29 primarily relate to the consolidated statements of financial position).
NOTE 1 – Accounting policies
1.1. Basis of preparation
Incorporated in November 2016, VALTECH (hereinafter referred to as “Valtech”, or the “Company” as the parent company or, together with its consolidated subsidiaries, the “Group”) is a Societas Europea (“SE”) incorporated and registered in Luxembourg. The registered office of the company is located at 28/30 Boulevard Joseph II, 1840 Luxembourg, Luxembourg.
Valtech is a global business transformation agency, who enable clients to anticipate tomorrow’s trends and connect more directly with consumers across their digital and physical touch points while optimizing time-to-market and ROI. The company consists of a network of more than 3,000 innovators, design thinkers, marketers, creatives and developers spanning 4 continents with offices in 17 countries. The expertise is experience design, technology and marketing, and delivered services includes strategy consulting, service design, technology services, and optimization of business-critical digital platforms for multichannel commerce and marketing.
The Company prepared its consolidated financial statements for the year ended December 31, 2020 in accordance with International Financial Reporting Standards (“IFRS”) as adopted by the European Union, and IFRS as issued by the International Accounting Standards Board (“IASB”). The term “IFRS” refers collectively to international accounting and financial reporting standards (IASs and IFRSs) and to interpretations of the interpretations committees (IFRIC and SIC), whose application is mandatory for the period ended December 31, 2020. Comparative figures are presented for the year ended December 31, 2019 and December 31, 2018 for consolidated statements of income (loss), consolidated statements of comprehensive income (loss), consolidated statements of cash flows, and consolidated statement of changes in shareholders´ equity and for December 31, 2019 for consolidated statements of financial position.
The Consolidated Financial Statements are presented in thousands of euros unless stated otherwise (functional currency of the parent company and of most of the geographies the Group is operating in). Some amounts may be rounded for the calculation of financial information contained in the Consolidated Financial Statements. Accordingly, the totals in some tables may not be the exact sum of the preceding figures.
The Consolidated Financial Statements have been prepared on a historical cost basis, except for certain items such as financial assets and liabilities measured at fair value.
The Societas Europea is a form of European company with a board of directors, subject to the provisions of Luxembourg law. The consolidated financial statements have been approved and authorized for issuance by the board of directors of Valtech (the “Board of Directors” or the “Board”) on May 6, 2021.
1.2. New standards, amendments and interpretations
1.2.1 New standards, amendments and interpretation implemented in the financial statements of the Group for the year ended December 31, 2020
A number of new standards, amendments and interpretations are effective from periods beginning after 1 January 2020. The IASB has published the following new or amended standards that are assessed to have no significant impact on Valtech´s Financial Statement:
- Amendments to IAS39 and IFRS7: IBOR Reform - Amendments to IFRS3: Definition of a Business - Amendments to IAS1 and IAS8: Definition of Material - Amendments to References to the Conceptual Framework in IFRS Standards - Amendments to IFRS 16: Covid-19 related rent concessions
VALTECH
P a g e 10 | 59
1.2.2 New standards, amendments and interpretations not adopted early (or “not yet effective”)
New IFRS standards and Interpretations that have not yet been applied: the IASB has published the following new or amended standards that are assessed to have no significant impact on Valtech´s Financial Statement in the period of initial applications:
- Amendments to IAS 1: Classification of Liabilities as Current or Non-Current - - Amendments to IFRS 3: Reference to the Conceptual Framework - Amendments to IAS 16: Property, Plant and Equipment - Proceeds before Intended Use - - Amendments to IAS 37: Onerous Contracts - Cost of fulfilling a Contract - - Amendments to IFRS 1, IFRS 9, IFRS 16 and IAS 41: Annual Improvements to IFRS 2018-2020 - - Amendments to IFRS 9, IAS 39, IFRS 7, IFRS 4 and IFRS 16: Interest Rate Benchmark Reform - Phase 2
1.3 Presentation of the statements
The Group presents one income statement by function, highlighting the following:
- cost of sales (direct expenses necessary for project implementation), - commercial costs, and - administrative costs.
In addition, in accordance with IAS 1, expenses are provided by nature in Note 5. 1.4 Scope and methods of consolidation
The Consolidated Financial Statements include the statements of the parent company VALTECH and all its subsidiaries, controlled under IFRS 10 Consolidated Financial Statements. The income (loss) of subsidiaries acquired or sold during the year is included in the consolidated net income of the Group from the date the control is obtained or lost. The scope of consolidation is detailed in Note 1.26 to our consolidated financial statements.
Pursuant to IFRS 10 Consolidated Financial Statements, three criteria are assessed in order to determine the exercise of control by the parent company over its subsidiaries. An investor controls an investee if and only if the investor has the following elements:
- power over the investee, i.e. the investor has existing rights that give the ability to direct the relevant activities (the activities that significantly affect the investee’s returns);
- exposure, or rights, to variable returns from its involvement with the investee; and - the ability to use its power to affects the amount of the investor’s returns.
The Company reassesses whether or not it controls an investee if facts and circumstances indicate that there are changes to one or more of the three elements of control listed above.
Based on the above mentioned criteria, the Company controls Valtech Mobility GmbH which is owned 51% by Valtech GmbH and 49% by Audi Electronics Venture GmbH (AEV).
Profit or loss and each component of other comprehensive income are attributed to the owners of the Company and to the non‑controlling interests. Total comprehensive income (loss) of the subsidiaries is attributed to the owners of the Company and to the non‑controlling interests.
1.5 Critical accounting judgements and key sources of estimation uncertainty
In the application of the Company's accounting policies, the Company's management is required to make judgments, estimates and assumptions about the carrying amounts of assets and liabilities that are not readily apparent from
VALTECH
P a g e 11 | 59
other sources. The estimates and associated assumptions are based on historical experience and other factors that are considered to be relevant. Actual results may differ from these estimates.
The estimates and underlying assumptions are reviewed on an ongoing basis. Revisions to accounting estimates are recognized in the year in which the estimate is revised if the revision affects only that year or in the year of the revision and future years if the revision affects both current and future years.
The critical accounting estimates concerning the future and other key sources of estimation uncertainty at the end of the reporting year that have a significant risk of causing a material adjustment to the carrying amounts of assets and liabilities within the next year are the following:
- recognition of revenue regarding fixed price projects: see Notes 1.20 and 4, - goodwill, subject to impairment testing: see Notes 1.6, 1.7 and 13.3, - share-based payment: see Notes 1.18 and 26, - recognition of deferred tax assets related to tax loss carry forwards: see Notes 1.23 and 11
The Consolidated Financial Statements reflect the best estimates based on information available on the date such statements are issued. 1.6 Business combinations and accounting for goodwill
Business combinations
Business combinations are accounted for using the acquisition method when the acquired set of activities and assets meets the definition of a business and control is transferred to the Group. In determining whether a particular set of activities and assets is a business, the Group assesses whether the set of assets and activities acquired includes, at a minimum, an input and substantive process and whether the acquired set has the ability to produce outputs.
The assets acquired and the liabilities and contingent liabilities assumed are measured at their fair value on the acquisition date in accordance with the requirements of IFRS 3: “Business combination”.
The evaluation of the purchase price, including, where appropriate, the estimated fair value of contingent considerations, and the identifiable assets acquired and liabilities assumed are completed within twelve months following the acquisition. In accordance with IFRS 3, any adjustment of the purchase price and/or any adjustment of the acquired assets/liabilities beyond the twelve-months period are recognized in the consolidated statements of income (loss).
Contingent consideration or earn-outs are recorded in equity if the contingent payment is settled by delivery of a fixed number of the acquirer’s equity instruments (according to IAS 32). In all other cases, they are recognized in liabilities related to business combinations. Contingent consideration or earn-outs are measured at fair value at acquisition date. This initial measurement is subsequently adjusted through goodwill only when additional information is obtained after the acquisition date about facts and circumstances existing on that date. Such adjustments are made only during the 12-months measurement period that follows the acquisition date. Any other subsequent adjustments are recorded through the consolidated statement of income (loss).
On the acquisition date, the goodwill corresponds to the aggregate of the consideration transferred and the amount of any non-controlling interest in the acquired company, minus the net amounts (generally at fair value) of the identifiable assets acquired and the liabilities assumed at the acquisition date. Goodwill is subject to annual impairment tests or more frequently if events or changes in circumstances indicate that goodwill might be impaired.
Transaction costs directly attributable to an acquisition are recorded as expenses in the period during which the costs are incurred.
Accounting for goodwill
Goodwill is allocated and then monitored at the level of the cash generating unit "CGU” or group of cash generating units "CGUs”. These units correspond to entities whose economic activity generates cash flows that are largely independent of each other. These are primarily geographical areas.
Goodwill is recognized in the currency of the acquired company in accordance with IFRS 3.
VALTECH
P a g e 12 | 59
Goodwill is not amortized, but is subject to impairment testing whenever there is any indication that an asset may be impaired, and at least once a year in accordance with the methods and assumptions described in Note 1.7 to our consolidated financial statements.
1.7 Impairment tests (IAS 36)
The Group conducts regular impairment testing of assets (tangible assets, goodwill and other intangible assets). These tests consist in comparing the carrying value of assets to their recoverable amount, which is defined as the greater of the asset’s fair value less costs of disposal, and its value in use, estimated by the net present value of the future cash flows generated by the asset. The carrying amount of assets is compared with the recoverable amount, which most of the times corresponds to net present value of future cash flows excluding financial expenses.
For tangible and intangible assets with finite lives, this impairment test is performed whenever indicators of impairment are observable.
The method projects to perpetuity a normative amount with a perpetual growth rate. The discount rate applied to those cash flows corresponds to the average cost of capital of each CGU or group of CGUs.
In case the annual impairment test reveals a recoverable amount lower than the carrying amount, an impairment is recognized to reduce the book value of the asset or of the goodwill to its recoverable amount. If the recoverable amount of an intangible (excluding goodwill) or tangible asset appreciates in subsequent years and the recoverable amount exceeds the carrying amount, any impairment losses recognized during prior years is reversed in the consolidated statement of income (loss).
An impairment loss recognised for goodwill is not reversed in a subsequent period. 1.8 Intercompany transactions All intragroup assets and liabilities, equity, income, expenses and cash flows relating to transactions between the members of the Group are eliminated at consolidation level. 1.9 Transactions in foreign currencies Transactions concluded in currencies other than the functional currency of any Group’s entity are recorded based on the exchange rate on the date of the transaction. Assets and liabilities in foreign currencies are converted at the closing rate and the exchange differences resulting from this conversion are recognized in the consolidated statement of income. 1.10 Conversion of financial statements of foreign subsidiaries
The functional currency of the parent company is the euro.
Assets and liabilities of foreign subsidiaries are converted at the exchange rate at the closing date of each reporting period. The statement of income is converted at the average exchange rate for the period. The resulting conversion difference is recorded in the comprehensive income under ‘Foreign currency translation adjustment’. This difference impacts the consolidated statement of income if there is a subsequent sale of the entity. At such point in time, the related foreign currency translation adjustment is recycled through the statement of income (loss).
1.11 Other intangible assets
Software and user rights acquired under full ownership, software developed for internal use, as well as developments of new or enhanced services, which are expected to generate future cash flows, are capitalized and amortized on a straight line basis over their estimated lifetime (generally between 3 and 5 years).
Internally-generated intangible assets
The capitalized development costs of either a software developed for internal use or an internal project are those directly associated with their production, which primarily consists of expenses related to salary costs of personnel who developed the software or the internal project.
VALTECH
P a g e 13 | 59
An intangible asset that results from the development of an internal project is recorded if the Group can demonstrate that all of the following conditions have been met:
- The technical feasibility of completing the intangible asset so that it will be available for use or sale; - Its intention of completing the intangible asset to use or sell it; - Its ability to use or sell the intangible asset; - The capacity of the intangible asset to generate probable future economic benefits; - Among other things, the Group may demonstrate the existence of a market for the output of the intangible
asset or the intangible asset itself or, if it is to be used internally, its usefulness; - The availability of adequate technical, financial and other resources to complete the development, and to use
or sell the intangible asset; Its ability to reliably measure the expenditures attributable to the intangible asset during its development.
The amount initially recognised for internally‑generated intangible assets is the sum of the expenditure incurred from the date when the intangible asset first meets the recognition criteria listed above. Where no internally‑generated intangible asset can be recognised, development expenditure is recognised in profit or loss in the period in which it is incurred. Intangible assets acquired in a business combination Intangible assets acquired in a business combination and recognised separately from goodwill at their fair value at the acquisition date (which is regarded as their cost).
Subsequent to initial recognition, these assets are reported at cost less accumulated amortization and accumulated impairment losses, on the same basis as intangible assets that are acquired separately.
1.12 Tangible assets
The tangible assets are recorded under assets in the statement of financial position at historical amortized cost, minus any impairment. They are not subsequently revalued.
Depreciation is calculated using the straight line method over the estimated useful lives of the different assets. It is calculated on the basis of the purchase price. The assets are depreciated over their expected life, as follows:
- Fixtures, fitting, technical facilities which cannot be removed depend on the useful life or the term of the real estate lease agreement if shorter
- Hardware 3-5 years - Furniture 5-7 years
1.13 Leases
At inception of a contract, the Group assesses whether a contract contains a lease. A contract contains a lease if the contract conveys the right to control the use of an identified asset for a period of time in exchange for consideration. To assess whether a contract conveys the right to control the use of an identified asset, the Group assesses whether:
- the contract involves the use of an identified asset that is physically distinct, with no right of substitution by the
lessor - the Group has the right to obtain substantially all of the economic benefits from the asset during the period of
use - the Group has the right to direct the use of the asset (decision-making rights to changing how and for what
purpose the asset is used)
The Group recognises a right-of-use asset and a lease liability at the lease commencement date. The right-of-use asset is initially measured at the amount of the lease liability, adjusted for any lease prepayments made at or before the commencement date, plus any initial direct costs incurred and an estimate of costs to dismantle, remove or restore the underlying asset, less any lease incentive received.
VALTECH
P a g e 14 | 59
The right-of-use assets is depreciated using the straight-line method from the commencement date to the earlier of the end of the useful life or the end of the lease term.
The lease liability is initially measured at the present value of the lease payments that are not paid at the commencement date, discounted using the interest rate implicit in the lease or, if that rate cannot be readily determined, the Group’s incremental borrowing rates. Generally, the group uses the incremental borrowing rate as the discount rate.
The incremental borrowing rate is defined as the rate of interest that the lessee would have to pay to borrow a similar term and with a similar security of funds necessary to obtain an asset of a similar value to the right of use asset in a similar economic environment.
The lease liability is re-measured when there is a change in future lease payments arising from a change in an index or rate, change in the amount expected to be payable under a residual value guarantee or changes in extension or termination options. When the lease liability is re-measured, a corresponding adjustment is made to the carrying amount of the right-of-use asset. Rent concessions as a result of Covid-19 are treated in accordance with IASB’s “Covid-19-Related Rent Concessions (Amendment to IFRS 16)”, and instead of re-measuring the lease liability, the full effect of the rent concessions are recognized in the statements of income at the date of the change of consideration. Short-term leases and leases of low value assets
The Group has elected not to recognise right-of-use assets and lease liabilities for short-term leases with a lease term of 12 months or less and lease of low-value assets, including IT equipment. Lease payments associated with these leases are recognized as an expense on a straight-line basis over the lease term.
1.14. Investments and other financial assets The recognition and measurement of financial assets and liabilities is governed by IFRS 9—Financial Instruments. The Group classifies its financial assets in the following measurement categories:
- those to be measured subsequently at fair value (either through other comprehensive income (OCI), or through profit or loss), and
- those to be measured at amortized cost. The classification depends on the entity’s business model for managing the financial assets and the contractual terms of the cash flows. For assets measured at fair value, gains and losses will either be recorded in OCI or profit or loss. For investments in equity instruments that are not held for trading, the classification will depend on whether the Group has made an irrevocable election at the time of initial recognition to account for the equity investment at fair value through other comprehensive income (FVOCI). The Group did not hold any derivatives or employed any form of currency hedging during the periods ended December 31, 2020 and December 31, 2019. The Group determines the classification of its financial assets. In the consolidated statements of financial position, financial assets are primarily comprised of accounts receivable and related accounts, other current assets and cash and cash equivalents. These financial assets are carried at amortized cost if the business model involves holding the instrument in order to collect contractual cash flows which consist entirely of principal and interests. Measurement On initial recognition, a financial asset is classified as measured at: amortized cost, FVOCI (fair value with any changes in fair value reported in other comprehensive income) or FVTPL (fair value with all changes in fair value reported in consolidated statements of income). At initial recognition, the Group measures a financial asset at its fair value plus, in the case of a financial asset not at
VALTECH
P a g e 15 | 59
fair value through profit or loss (FVPL), transaction costs that are directly attributable to the acquisition of the financial asset. Transaction costs of financial assets carried at FVPL are expensed in the consolidated statements of income. A financial asset is measured at amortized cost if it meets both of the following conditions and is not designated as a FVTPL:
- it is held within a business model whose objective is to hold assets to correct contractual cash flows; and - its contractual terms give rise on specified dates to cash flows that are solely payments of principal and
interest on principal amount outstanding.
The Group’s financial assets (non-current financial assets (deposits and loans), accounts receivable and related accounts, other current assets and cash and cash equivalents) are measured at amortised cost, using the effective interest method. The amortised cost is reduced by impairment losses. Interest income, foreign exchange gains and losses and impairment are recognised in the profit or loss. Any gain or loss on derecognition is recognized in the consolidated statements of income.
Impairment
The Group assesses on a forward-looking basis for the expected credit losses associated with its debt instruments carried at amortized cost. The impairment methodology applied depends on whether there has been a significant increase in credit risk. For trade receivables, the Group applies the simplified approach permitted by IFRS 9, which requires expected lifetime losses to be recognized from initial recognition of the receivables. 1.15. Accounts receivable and de-recognition of financial assets
Accounts receivable are recorded at nominal value, which generally approximates their fair value.
The Company always recognizes lifetime expected credit losses ("ECL") for trade receivables, using a simplified approach. The expected credit losses on these financial assets are estimated based on the Company’s historical credit loss experience, adjusted for factors that are specific to debtors, general economic conditions and an assessment of both the current as well as the forecast direction of conditions at the reporting date. The amount of expected credit losses is updated at each reporting date to reflect changes in credit risk since initial recognition.
The Group enters into agreements to assign, sell or transfer receivables in certain countries:
- When the risks associated with trade receivables are not transferred in substance to third parties such as financing institutions, the trade receivables are retained on the consolidated statements of financial position under receivables, and a financial liability is recorded as short-term financial liability.
- When the risks associated with trade receivables are transferred to third parties such as financing institutions, cash received is recognized as cash and cash equivalents and the receivables assigned, sold or transferred are derecognized in the consolidated statements of financial position.
As of December 31, 2020, the Group’s only subsidiary with factoring is in France, where the sale of accounts receivable is with recourse. Valtech France has transferred the relevant receivables to the factor in exchange for cash and is prevented from selling or pledging the receivables. However, Valtech France has retained the credit risk, and the transferred assets are therefore recognized entirely in the balance sheet. The amount repayable under the factoring agreement is presented as short-term borrowing.
1.16. Cash and cash equivalents
In accordance with IAS 7 - Cash Flow Statements, cash and cash equivalents presented in the consolidated statements of cash flows include cash (cash on hand and demand deposits) and cash equivalents (short-term, highly liquid investments that are readily convertible to cash and which are subject to an insignificant risk of change in value).
Investments with initial maturity over three months without possibility of early termination as well as bank accounts subject to restrictions (escrow accounts) other than those related to regulations specific to individual countries or sectors (exchange controls, etc.) are excluded from cash and cash equivalents in the statements of cash flows.
VALTECH
P a g e 16 | 59
1.17. Retirement and termination benefit costs
Pension obligations
For defined contribution plans, the group pays contributions to publicly or privately administered pension insurance plans on a mandatory, contractual or voluntary basis. The group has no further payment obligations once the contributions have been paid. The contributions are recognised as employee benefit expense when they are due.
Obligations related to defined-benefit pension plans are provided in the consolidated statements of financial position for both current and former employees (people with deferred stock unit plans and pensioners). They are determined as per the projected unit credit method under IAS 19 - Employee Benefits (“IAS 19”) on the basis of actuarial assessments made at each year end. The actuarial assumptions used to determine the obligations vary, depending on the economic conditions of the country or on the monetary zone in which the plan is in force. The accounting for each plan is carried out separately. Under the provisions of IAS 19, for defined-benefit plans financed under external management (pension funds), the excess or deficiency of the fair value of assets compared to the present value of obligations is recognized under the assets or liabilities of the consolidated balance sheet. This recognition is subject to the capping rules of the assets and the minimum funding requirements set out by IFRIC 14. The expense recognized in the operating result during each period includes the cost of services rendered and the effects of any change, reduction or settlement. The impact of interest recognized on the actuarial debt and the interest income on plan assets is recognized under other financial income and expenses in the consolidated statements of income. Interest income on plan assets is calculated using the discount rate of the obligation for defined-benefit plans.
The revaluation impacts of the net liability related to defined-benefit pension plans (when appropriate, of the asset) are recognized in other comprehensive income. They include:
- Actuarial gains and losses on the commitment resulting from changes in actuarial assumptions and experience adjustments (differences between the retained actuarial assumptions and observed reality);
- Outperformance (underperformance) of the plan assets, i.e. the difference between the actual return on plan assets and their remuneration calculated based on the discount rate of actuarial debt; and
- The change in the effect of the asset ceiling. Termination benefits
Termination benefits are payable when employment is terminated by the Group before the normal retirement date, or when an employee accepts voluntary redundancy in exchange for these benefits. The Group recognises termination benefits at the earlier of the following dates: (a) when the group can no longer withdraw the offer of those benefits; and (b) when the entity recognises costs for a restructuring that is within the scope of IAS 37 and involves the payment of terminations benefits. In the case of an offer made to encourage voluntary redundancy, the termination benefits are measured based on the number of employees expected to accept the offer. Benefits falling due more than 12 months after the end of the reporting period are discounted to present value. 1.18. Share-based payment
Certain employees and board members of the Group can benefit from share warrants (redeemable equity warrants) and restricted share units.
Equity-settled share-based payments to employees are measured at fair value at grant date using financial valuation methods.
The fair value determined at the grant date of the equity‑settled share‑based payments is expensed on a straight‑line basis over the vesting period, based on the Group’s estimate of the number of equity instruments that will eventually vest, in accordance with IFRS 2: Share-based payment. At the end of each reporting period, the Group revises its estimates of the number of warrants/restricted share units that are expected to vest, and recognises the impact of the revision to original estimates, if any, in the income statement, with a corresponding adjustment to equity.
VALTECH
P a g e 17 | 59
The social security contributions payable in connection with the grant of restricted unit shares is considered an integral part of the grant itself, and the charge will be treated as a cash-settled transaction. The social security cost is recognised as an expense with a corresponding increase in liabilities, over the vesting period. The liability is re-measured at each reporting date and any changes in the liability are recognised in the income statement.
1.19. Provisions
Provisions are recognized when the Group has a present obligation (legal or constructive) as a result of a past event, it is probable that the Group will be required to settle the obligation, and a reliable estimate can be made of the amount of the obligation.
Measurement of the provisions is revised if the impact is considered significant.
In accordance with IAS 37 - Provisions, Contingent Liabilities and Contingent Assets (“IAS 37”), the recognition criteria for accounting for a restructuring reserve are (i) the company has an obligation towards a third party at the statement of financial position date, (ii) it is probable (more likely than not) that a liability (future outflow to settle the obligation) has been incurred, and (iii) this liability can be reasonably estimated.
To meet such criteria when reserving for restructuring actions, we consider that the appropriate level of management must approve the restructuring plan and must announce it by the date of the statement of financial position, specifically identifying the restructuring actions to be taken (for example, the number of employees concerned, their job classifications or functions and their locations). Before the statement of financial position date, detailed conditions of the plan must be communicated to employees, in such a manner as to allow an employee to estimate reasonably the type and amount of benefits he/she will receive. Also, the related restructuring actions that are required to be completed must be estimated to be achievable in a relatively short (generally less than 1 year) timeframe without likelihood of change.
Restructuring costs primarily refers to severance payments, early retirement, costs for notice periods not worked, training costs of terminated employees, costs linked to the closure of facilities or the discontinuance of product lines and any costs arising from plans that materially change the scope of the business undertaken by the Group or the manner in which such business is conducted.
Other costs (removal costs, training costs of transferred employees, etc.) and write-offs of fixed assets and other assets, directly linked to restructuring measures, are accounted for as incurred (as linked to ongoing activities), in restructuring costs in the statement of income.
1.20. Revenue recognition
The Company’s services are performed under both time-and-material and fixed-price contracts. For revenues generated under time-and-material contracts, revenues are recognized as a performance obligation satisfied over time, using an input method based on hours incurred. The majority of such revenues are billed on a monthly basis whereby actual time is charged directly to the client.
The Company recognizes revenues from fixed-price contracts applying the input or output methods depending on the nature of the project and the agreement with the customer, recognizing revenue on the basis of the Company’s efforts to the satisfaction of the performance obligation relative to the total expected inputs to the satisfaction of the performance obligation, or recognizing revenue on the basis of direct measurements of the value to the customer of the services transferred to date relative to the remaining services promised under the contract, respectively. Each method is applied according to the characteristics of each contract and client. The inputs and outputs are selected based on how faithfully they depict the Company's performance towards complete satisfaction of the performance obligation.
These methods are followed where reasonably dependable estimates of revenues and costs can be made. Fixed-price projects generally correspond to short-term contracts. Some fixed-price contracts are recurring contracts that establish a fixed amount per month and do not require the Company to apply significant judgment in accounting for those types of contracts. In consequence, the use of estimates is only applicable for those contracts that are on-going at the year end and that are not recurring.
VALTECH
P a g e 18 | 59
Reviews to these estimates may result in increases or decreases to revenues and income and are reflected in the consolidated financial statements in the periods in which they are first identified. If the estimates indicate that a contract loss will be incurred, a loss provision is recorded in the period in which the loss first becomes probable and reasonably estimable. Contract losses are determined to be the amount by which the estimated costs of the contract exceed the estimated total revenues that will be generated by the contract and are included in cost of revenues in the consolidated statement of comprehensive income. Contract losses for the periods presented in these consolidated financial statements were immaterial.
1.21. Accounting for government grants
Government grants relates primarily to business support and loans related to the economic effects on society as a result of the COVID-19 outbreak, research and development tax credits in France (Crédit d’Impôt Recherche) and in the Netherlands (Innovation box). Innovation box allows companies to benefit from an effective tax rate of only 7% for income from intangible assets, if certain criteria are met. The effect of Innovation box in the Netherlands and Crédit d’Impôt Recherche in France is reported in the line item “income tax expense” in the statement of income.
Government grants that compensate the expenses incurred by the Group are recorded under IAS 20 as deduction from the related expense for the period in which expenses were incurred. The grants are not recognised until there is reasonable assurance that the Group will comply with the conditions attaching to them and that the grants will be received, and are recognised in profit or loss on a systematic basis over the periods in which the Group recognises as expenses the related costs for which the grants are intended to compensate. Government grants that are receivable as compensation for expenses or losses already incurred or for the purpose of giving immediate financial support to the Group with no future related costs are recognised in profit or loss in the period in which they become receivable. 1.22. Other income and expenses
Other income and expenses include gains from disposal of tangible and intangible assets. It excludes income (loss) related to discontinued operations, impairment of assets and restructuring costs. 1.23. Taxes
The income tax expense represents the sum of the tax currently payable and deferred tax.
Current income tax
The tax currently payable is based on taxable profit for the year. Taxable profit differs from net profit as reported in profit or loss because it excludes items of income or expense that are taxable or deductible in other years and it further excludes items that are never taxable or deductible. The Group’s liability for current tax is calculated using tax rates that have been enacted or substantively enacted by the end of the reporting period.
Current income tax relating to items recognized directly in equity or in other comprehensive income is recognized respectively in equity or in other comprehensive income, and not in the statement of income.
A provision is recognised for those matters for which the tax determination is uncertain but it is considered probable that there will be a future outflow of funds to a tax authority. Management periodically evaluates positions taken in the
Group’s tax returns with respect to situations in which applicable tax regulations are subject to interpretation and establishes provisions where appropriate.
Deferred taxes
Deferred tax is the tax expected to be payable or recoverable on differences between the carrying amounts of assets and liabilities in the financial statements and the corresponding tax bases used in the computation of taxable profit, and is accounted for using the liability method. Deferred tax liabilities are generally recognised for all taxable temporary differences and deferred tax assets are recognised to the extent that it is probable that taxable profits will be available against which deductible temporary differences can be utilised. Such assets and liabilities are not recognised if the temporary difference arises from the initial recognition of goodwill or from the initial recognition (other
VALTECH
P a g e 19 | 59
than in a business combination) of other assets and liabilities in a transaction that affects neither the taxable profit nor the accounting profit.
Deferred tax is calculated at the tax rates that are expected to apply in the period when the liability is settled or the asset is realised based on tax laws and rates that have been enacted or substantively enacted at the reporting date.
Deferred tax assets are recorded in the consolidated statement of financial position when it is probable that the tax benefit will be realized in the future. Deferred tax assets and liabilities are not discounted. The carrying amount of deferred tax assets is reviewed at each reporting date and reduced to the extent that it is no longer probable that sufficient taxable profits will be available to allow all or part of the asset to be recovered.
To assess the ability of the Group to recover deferred tax assets, the following factors are taken into account:
- existence of deferred tax liabilities that are expected to generate taxable income, or limit tax deductions upon reversal;
- forecasts of future operating results; - the impact of non-recurring costs included in income or loss in recent years that are not expected to be
repeated in the future; - historical data concerning recent years’ tax results; and - if required, tax planning strategy, such as a planned disposal whose values are higher than their book values.
1.24. Earnings per share
In accordance with IAS 33 - Earnings per share, basic and diluted earnings per share are calculated using the weighted average number of outstanding shares during the period, less the average number of treasury shares.
The earnings per diluted share takes into account, if necessary, a dilutive effect under the ‘treasury stock method’. 1.25 Non-current assets held for sale and discontinued operations
IFRS 5 - Non-Current Assets Held for Sale and Discontinued Operations sets out the accounting treatment applicable to assets held for sale and presentation and disclosure requirements for discontinued operations. The assets and liabilities that are immediately available to be sold, and whose sale is highly probable, are classified as assets and liabilities held for sale. When multiple assets are held for sale during a single transaction, we consider the Group of assets as a whole, along with the associated liabilities.
Assets or Groups of assets held for sale are valued at the lowest amount between the net book value and the net fair value less costs to sell.
Non-current assets classified as held for sale are no longer amortized.
A discontinued operation is a component of the entity that has been disposed of or is classified as held for sale and that represents a separate major line of business or geographical area of operations. The results of discontinued operations are presented separately in the statement of profit or loss.
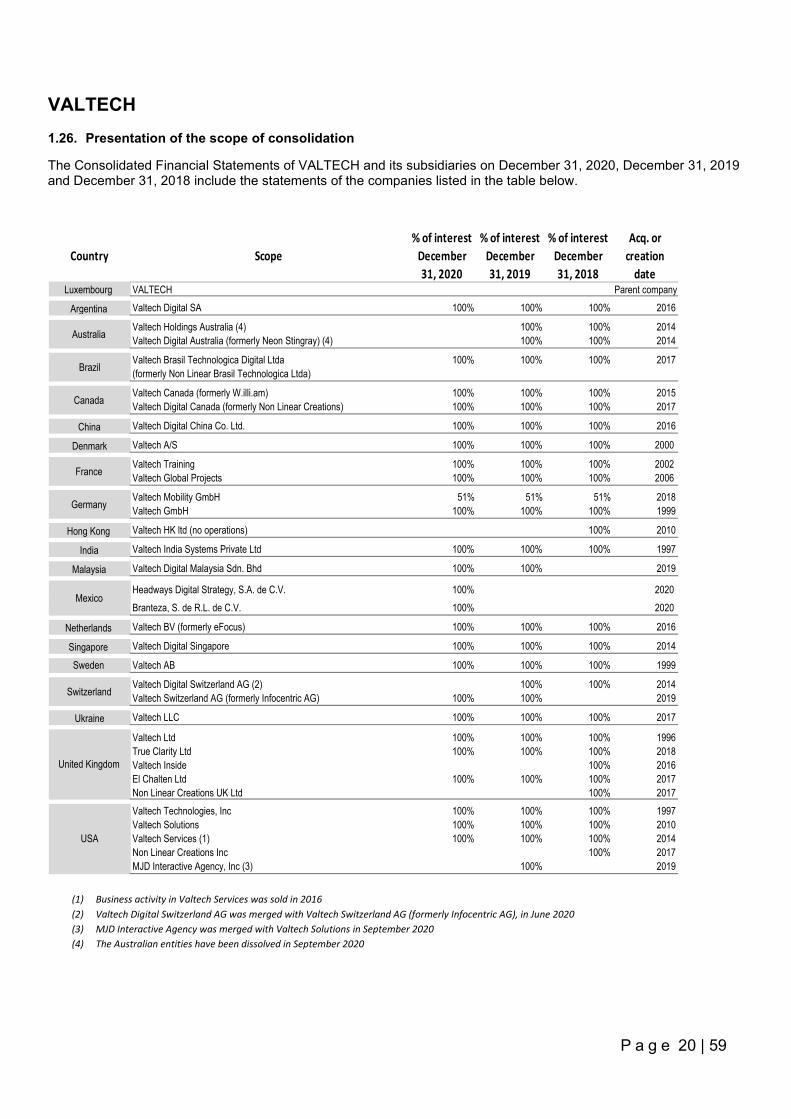
VALTECH
P a g e 20 | 59
1.26. Presentation of the scope of consolidation
The Consolidated Financial Statements of VALTECH and its subsidiaries on December 31, 2020, December 31, 2019 and December 31, 2018 include the statements of the companies listed in the table below.
Country Scope% of interest
December 31, 2020
% of interest December 31, 2019
% of interest December 31, 2018
Acq. or creation
dateLuxembourg VALTECH Parent company
Argentina Valtech Digital SA 100% 100% 100% 2016
Valtech Holdings Australia (4) 100% 100% 2014Valtech Digital Australia (formerly Neon Stingray) (4) 100% 100% 2014
Valtech Brasil Technologica Digital Ltda 100% 100% 100% 2017(formerly Non Linear Brasil Technologica Ltda)
Valtech Canada (formerly W.illi.am) 100% 100% 100% 2015Valtech Digital Canada (formerly Non Linear Creations) 100% 100% 100% 2017
China Valtech Digital China Co. Ltd. 100% 100% 100% 2016
Denmark Valtech A/S 100% 100% 100% 2000
Valtech Training 100% 100% 100% 2002Valtech Global Projects 100% 100% 100% 2006
Valtech Mobility GmbH 51% 51% 51% 2018Valtech GmbH 100% 100% 100% 1999
Hong Kong Valtech HK ltd (no operations) 100% 2010
India Valtech India Systems Private Ltd 100% 100% 100% 1997
Malaysia Valtech Digital Malaysia Sdn. Bhd 100% 100% 2019
Headways Digital Strategy, S.A. de C.V. 100% 2020Branteza, S. de R.L. de C.V. 100% 2020
Netherlands Valtech BV (formerly eFocus) 100% 100% 100% 2016
Singapore Valtech Digital Singapore 100% 100% 100% 2014
Valtech AB 100% 100% 100% 1999
Valtech Digital Switzerland AG (2) 100% 100% 2014Valtech Switzerland AG (formerly Infocentric AG) 100% 100% 2019
Ukraine Valtech LLC 100% 100% 100% 2017
Valtech Ltd 100% 100% 100% 1996True Clarity Ltd 100% 100% 100% 2018Valtech Inside 100% 2016El Chalten Ltd 100% 100% 100% 2017Non Linear Creations UK Ltd 100% 2017Valtech Technologies, Inc 100% 100% 100% 1997Valtech Solutions 100% 100% 100% 2010Valtech Services (1) 100% 100% 100% 2014Non Linear Creations Inc 100% 2017MJD Interactive Agency, Inc (3) 100% 2019
USA
Australia
Canada
France
Germany
Brazil
Sweden
United Kingdom
Switzerland
Mexico
(1) Business activity in Valtech Services was sold in 2016 (2) Valtech Digital Switzerland AG was merged with Valtech Switzerland AG (formerly Infocentric AG), in June 2020 (3) MJD Interactive Agency was merged with Valtech Solutions in September 2020 (4) The Australian entities have been dissolved in September 2020
VALTECH
P a g e 21 | 59
NOTE 2 – Major events of the period
2.1. Year 2019
2.1.1. Sale of business in Australia
In April 2019, the Group entered into a sale agreement to dispose of its business assets in the subsidiary Valtech Digital Australia PTY Ltd, which carried out all of the Group’s Australian operations. The disposal was completed on April 5, 2019, on which date the business assets were transferred to the seller (see Note 12 for details).
2.1.2. Acquisition of the company MJD Interactive Agency Inc (USA)
On June 7, 2019, Valtech acquired MJD Interactive Agency Inc, a Digital Innovation Agency with office in San Diego. MJD Interactive Agency is consolidated in the Valtech accounts as of June 1, 2019. Pursuant to the purchase agreement, Valtech paid the sellers €10.4 million upon closing with an additional €1.2 million holdback payment. An additional € 3.1 million was paid in cash in March 2020. Subject to certain exceptions and the achievement of certain targets, the sellers are also entitled to receive €4.6 million in shares of VALTECH (issued in March 2020) and €0.6 million in cash in year 2021. The total consideration is €19.9 million.. The determination of the fair value of assets acquired and liabilities assumed is finalized. The fair value of net assets acquired before exchange rate fluctuation amounts to minus €829 thousand, out of which €1,498 thousand relate to intangible assets identified when performing the purchase price allocation analysis, €1,476 thousand relate to financial assets, €59 thousand relate to tangible assets and €3,862 thousand relate to financial liabilities. The goodwill resulting from this transaction is €18.2 million (including bonuses paid to managers at the acquisition date) before exchange rate fluctuation. Valtech also agreed to issue restricted share units to certain key employees. In June 2019, 10,000 restricted unit shares were issued. MJD Interactive contributed € 3.9 million revenues and €0.8 million to the Group’s result for the period between the date of acquisition and December 31, 2019. If the acquisition of MJD Interactive had been completed on the first day of the financial year, Group revenues for the year 2019 would have been €296.1 million and Group loss would have been minus €13.9 million. 2.1.3. Acquisition of the company Infocentric Research AG (Switzerland)
On November 28, 2019, Valtech acquired Infocentric Research AG, a Digital Agency with office in Baden. Infocentric is consolidated in the Valtech accounts as of December 1, 2019. Pursuant to the purchase agreement, Valtech paid the sellers €20.2 million upon closing with an additional €2.0 million holdback payment and an additional €1.6 million escrow payment. In March 2020, an additional € 7.9 million has been paid in shares. Subject to certain exceptions and the achievement of certain targets in 2020 and 2021, the sellers are also entitled to receive €4.3 million in cash in 2021 and 2022. The total consideration is estimated to €35.9 million. The determination of the fair value of assets acquired and liabilities is completed. The final fair value of net assets acquired before exchange rate fluctuation amounts to €13,237 thousand, out of which €9,235 thousand relate to intangible assets identified when performing the purchase price allocation analysis, €8,697 thousand relate to financial assets, €380 thousand relate to tangible assets and €5,075 thousand relate to financial liabilities. The goodwill resulting from this transaction is €22.9 million before exchange rate fluctuation. Infocentric contributed € 2.1 million revenues and €0.0 million to the Group’s result for the period between the date of acquisition and December 31, 2019. If the acquisition of Infocentric had been completed on the first day of the financial year, Group revenues for the year 2019 would have been €322.7 million and Group loss would have been minus €9.7 million.
VALTECH
P a g e 22 | 59
2.1.4 Increase in capital
On May 23, 2019, the Board of Valtech, on behalf of the shareholders, decided to issue 298,972 new shares at €0.125347364 per share to Cosmoledo SPRL, leading to a capital increase of €37 thousand (out of which €37 thousand in share capital). Cosmoledo SPRL is a company owned by the executive committee members Mr Sebastian Lombardo, Mr Tomas Nores and Mr Olivier Padiou. The share-based cost related to the issue of the shares amounts to €5.2 million, based on the share price of €17.5. On December 18, 2019, the Board of Valtech, on behalf of the shareholders, decided to issue 571,428 new shares at €17.5 per share to SiegCo SA, leading to a capital increase of €10,000 thousand in cash (out of which €72 thousand in share capital). On December 18, 2019, the Board of Valtech, on behalf of the shareholders, decided to issue 203,528 new shares at €16 per share as payment for the acquisition of Non Linear, leading to a capital increase of €3,256 thousand (out of which €25 thousand in share capital). Total capital increase regarding issue of new shares amounts to €13,294 thousand, of which €135 thousand has increased the capital and €13,159 thousand increased additional paid in capital. Net increase in additional paid in capital amounts to €8,955 thousand and corresponds to €13,159 thousand minus the put options given in 2019 to the sellers of Non Linear at €3,256 thousand and put options given to the sellers of Codehouse A/S at €948 thousand. 2.1.5 Short-term loan from shareholder On November 26, 2019, Valtech obtained a €4.0 million short-term loan from the shareholder SiegCo SA. The loan was converted to equity as part of a capital increase in December 2019, see note 2.1.4. 2.1.6. Issue of new bonds On June 19, 2019, Valtech issued bonds in principal amount of €21 million. The bonds bear a fixed annual interest rate between 4.25% and 4.75% during the duration and mature in June 2025. The purpose of the issue is to support Valtech´s future growth.
2.1.7. Transfer of the registered office of the Company to Luxembourg
The Board of Directors, which met on June 27, 2019, approved the Company’s proposed transfer of headquarters from the United Kingdom to Luxembourg, and on September 17, 2019, the Combined General Meeting of Shareholders approved the same. The transfer took place on October 17, 2019. The transfer has no impact on the Consolidated Financial Statements, apart from calculation of company income tax. As a result of the transfer, VALTECH (UK) will lose the right to utilize the tax losses carry forward. The losses as of December 31, 2018 amounts to €7,918 thousands.
2.1.8. Hyperinflation in Argentina
Entities with a functional currency of the Argentine peso are required to apply IAS 29 in accounting periods ending on or after 1 July 2018. Valtech’s Argentinian business represented 1.4% of the total revenue in 2019.
Adoption of IAS 29 requires the non-monetary assets and liabilities and the income statement to be restated to reflect the changes in the general pricing power of its functional currency, leading to a gain or loss on the net monetary position included in the net income. Gain in net monetary position due to restatement amounts to less than €100 thousand as per December 31, 2019 and is deemed as immaterial.
VALTECH
P a g e 23 | 59
2.2. Year 2020
2.2.1. Increase in capital On March 6, 2020, the Board of Valtech, on behalf of the shareholders, decided to issue 264,209 new shares at €17.5 per share as payment for the acquisition of MJD Interactive, leading to a capital increase of €4,624 thousand (out of which €33 thousand in share capital). On March 6, 2020, the Board of Valtech, on behalf of the shareholders, decided to issue 453,348 new shares at €17.5 per share as payment for the acquisition of Infocentric Research AG, leading to a capital increase of €7,934 thousand (out of which €57 thousand in share capital). Total capital increase regarding issue of new shares amounts to €12,557 thousand, of which €89 thousand has increased the capital and €12,468 thousand increased additional paid in capital. Net increase in capital amounts to €0 thousand and corresponds to €12,557 thousand minus the put options given in 2020 to the sellers of MJD Interactive and Infocentric at €12,557 thousand. 2.2.2. Hyperinflation in Argentina
Entities with a functional currency of the Argentine peso are required to apply IAS 29 in accounting periods ending on or after 1 July 2018. Valtech’s Argentinian business represented 1.2% of the total revenue for the year 2020. Adoption of IAS 29 requires the non-monetary assets and liabilities and the income statement to be restated to reflect the changes in the general pricing power of its functional currency, leading to a gain or loss on the net monetary position included in the net income. Gain in net monetary position due to restatement amounts to less than €100 thousand as per December 31, 2020 and is deemed as immaterial.
2.2.3. Waiver of financial covenants
As a result of the impact of the Covid-19 outbreak on our financial performance and financial position, we assessed the situation in March 2020 and anticipated then that the Group would not comply with the financial covenants of its bonds, as of June 30 and December 31, 2020. We entered into discussions with the holders of the bonds, who in May 2020 agreed in writing to waive those covenants for June 30 and December 31, 2020, subject to a minimum amount of cash of €25 million to be available in the Group by June 30 and December 31, 2020. The written agreement to waive those covenants was reaffirmed in the resolutions passed by the general assembly of the bond holders on July 10, 2020, which included amendments of a technical nature to the terms and conditions of the bonds. The waiver of the covenants was conditioned by Valtech receiving a loan from the shareholders, for a maximum amount of €30 million. The loan agreement was approved by the General Meeting of Valtech’s shareholders on July 7, 2020 and was signed on September 22, 2020. 2.2.4. Loan from shareholders
To secure the Group’s financial position and to cover possible shortfall of cash caused by the Covid-19 pandemic, we have agreed with the shareholders on a loan of maximum €30 million on September 22, 2020. The loan can be drawn in one, two or three drawing(s), for an amount of €10 million each, between the effective date and at the latest on December 10, 2020. No drawing of the loan has been made in year 2020, and the opportunity to borrow has expired without being used.
2.2.5. Dispute with buyer of business in USA
Valtech Services (USA) sold its business assets on January 1, 2016. In August 2018, Valtech Services introduced claims against the buyer to recover payments due under the sale contract, plus legal expenses. In October 2020 the Appeal Court rendered a judgment, which awarded $3.1 million to Valtech Services in payment for the assets sold, plus interest, sanctions and legal fee and costs. In December 2020, the full amount was paid by the buyer to an escrow account, and in January 2021, Valtech received the full amount in cash.
VALTECH
P a g e 24 | 59
The total compensation, including release of withhold cash payments from the buyer’s clients, amount to $3.7 million. Received compensation and legal fees related to the litigation is recorded under discontinued operations. 2.2.6 Acquisition of the companies Headways Digital Strategy S.A. de C.V. and Branteza S. de R.L de C.V. (Mexico)
On December 1, 2020, Valtech acquired Headways Digital Strategy and Branteza, a Mexican Digital Agency with offices in Mexico City. Headways and Branteza are consolidated in the Valtech accounts as of December 1, 2020. Pursuant to the purchase agreement, Valtech paid the sellers €2.9 million upon closing with an additional €0.4 million to be paid before end of April 2021, and a €0.1 million holdback payment. In April 2021, an additional €0.5 million will be paid in shares, with an additional €0.9 million holdback amount in shares, to be released for payment between July 2023 and July 2026. Subject to certain exceptions and the achievement of certain targets in 2021 and 2022, the sellers are also entitled to receive €1.3 million in cash in 2022 and 2023. The total consideration is estimated at €6.1million. The determination of the fair value of assets acquired and liabilities assumed is ongoing. The preliminary fair value of net assets acquired before exchange rate fluctuation amounts to €796 thousand, out of which €2,457 thousand relate to financial assets, €40 thousand relate to tangible assets and €1,701 thousand relate to financial liabilities. The preliminary goodwill resulting from this transaction is €5.3 million before exchange rate fluctuation. Headways and Branteza contributed €771 thousand revenues and €17 thousand to the Group’s result for the period between the date of acquisition and December 31, 2020. If the acquisition of Headways and Branteza had been completed on the first day of the financial year, Group revenues for the year 2020 would have been €330,452 thousand (instead of €324,521 as reported) and Group profit would have been €11,951 thousand (instead of €11,890 thousand as reported).
NOTE 3 – Segment information
For each of the periods presented, the operational monitoring of the Group’s business by the executive committee was mainly based on geographic location. Business segments can incorporate several countries.
Each business segment has its own operational management and is homogeneous in terms of labour costs and type of clients.
A business segment combines all businesses of the concerned geographical area: the business of outsourcing towards other business lines of the Group (which is eliminated as intercompany transactions) as well as business provided to external third parties. The different business segments of the Group cover similar operations.
Exception to this principle is VALTECH (parent company) for which two segments exist: a business segment for the French activities and a corporate segment (management activities) for the Luxembourg activities. First-level segment reporting corresponds to the countries in which the Group operates, with the exception of the segment North America, which consists of USA and Canada:
VALTECH
P a g e 25 | 59
• Argentina (AR) • Brazil (BR) • China (CN) • Corporate headquarters activities (Corp.) • Denmark (DK) • France (FR) • Germany (GE) • India (IN) • Malaysia (MY) • Mexico (MX) • Netherlands (NL) • North America (NA) • Singapore (SG) • Sweden (SW) • Switzerland (CH) • Ukraine (UA) • United Kingdom (UK)
Given their low individual importance, the businesses in Argentina, Brazil, China, India, Malaysia, Mexico, Singapore and Ukraine, are grouped under the category "Others" in the table below. Intercompany transactions are eliminated and reported in the table below in the category “Interco elim.”The Group’s business segment information as of December 31, 2020, December 31, 2019 and December 31, 2018 are presented as follows:
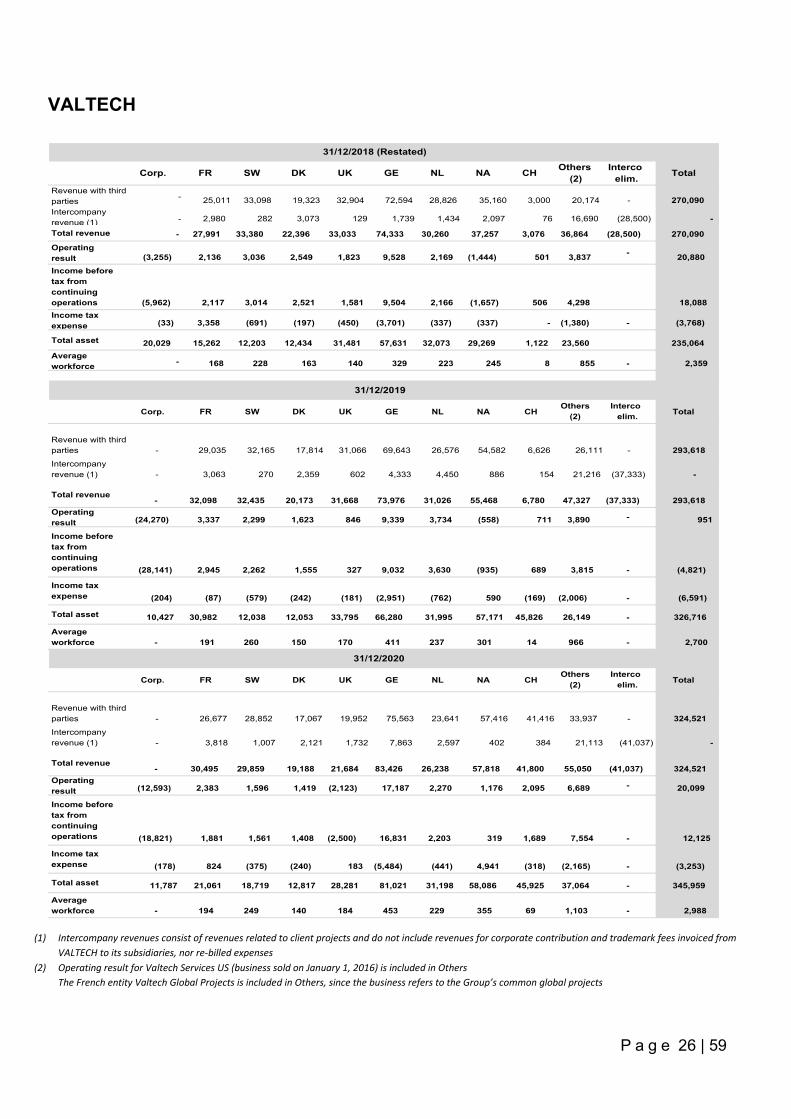
VALTECH
P a g e 26 | 59
Corp. FR SW DK UK GE NL NA CH Others (2)
Interco elim. Total
Revenue with third parties - 25,011 33,098 19,323 32,904 72,594 28,826 35,160 3,000 20,174 - 270,090Intercompany revenue (1) - 2,980 282 3,073 129 1,739 1,434 2,097 76 16,690 (28,500) -
Total revenue - 27,991 33,380 22,396 33,033 74,333 30,260 37,257 3,076 36,864 (28,500) 270,090Operating result (3,255) 2,136 3,036 2,549 1,823 9,528 2,169 (1,444) 501 3,837 - 20,880Income before tax from continuing operations (5,962) 2,117 3,014 2,521 1,581 9,504 2,166 (1,657) 506 4,298 18,088Income tax expense (33) 3,358 (691) (197) (450) (3,701) (337) (337) - (1,380) - (3,768)
Total asset 20,029 15,262 12,203 12,434 31,481 57,631 32,073 29,269 1,122 23,560 235,064Average workforce - 168 228 163 140 329 223 245 8 855 - 2,359
Corp. FR SW DK UK GE NL NA CHOthers
(2)Interco
elim. Total
Revenue with third parties - 29,035 32,165 17,814 31,066 69,643 26,576 54,582 6,626 26,111 - 293,618Intercompany revenue (1) - 3,063 270 2,359 602 4,333 4,450 886 154 21,216 (37,333) -
Total revenue- 32,098 32,435 20,173 31,668 73,976 31,026 55,468 6,780 47,327 (37,333) 293,618
Operating result (24,270) 3,337 2,299 1,623 846 9,339 3,734 (558) 711 3,890 - 951
Income before tax from continuing operations (28,141) 2,945 2,262 1,555 327 9,032 3,630 (935) 689 3,815 - (4,821)
Income tax expense (204) (87) (579) (242) (181) (2,951) (762) 590 (169) (2,006) - (6,591)
Total asset 10,427 30,982 12,038 12,053 33,795 66,280 31,995 57,171 45,826 26,149 - 326,716
Average workforce - 191 260 150 170 411 237 301 14 966 - 2,700
Corp. FR SW DK UK GE NL NA CHOthers
(2)Interco
elim. Total
Revenue with third parties - 26,677 28,852 17,067 19,952 75,563 23,641 57,416 41,416 33,937 - 324,521Intercompany revenue (1) - 3,818 1,007 2,121 1,732 7,863 2,597 402 384 21,113 (41,037) -
Total revenue- 30,495 29,859 19,188 21,684 83,426 26,238 57,818 41,800 55,050 (41,037) 324,521
Operating result (12,593) 2,383 1,596 1,419 (2,123) 17,187 2,270 1,176 2,095 6,689 - 20,099
Income before tax from continuing operations (18,821) 1,881 1,561 1,408 (2,500) 16,831 2,203 319 1,689 7,554 - 12,125
Income tax expense (178) 824 (375) (240) 183 (5,484) (441) 4,941 (318) (2,165) - (3,253)
Total asset 11,787 21,061 18,719 12,817 28,281 81,021 31,198 58,086 45,925 37,064 - 345,959
Average workforce - 194 249 140 184 453 229 355 69 1,103 - 2,988
31/12/2020
31/12/2018 (Restated)
31/12/2019
(1) Intercompany revenues consist of revenues related to client projects and do not include revenues for corporate contribution and trademark fees invoiced from
VALTECH to its subsidiaries, nor re-billed expenses (2) Operating result for Valtech Services US (business sold on January 1, 2016) is included in Others
The French entity Valtech Global Projects is included in Others, since the business refers to the Group’s common global projects
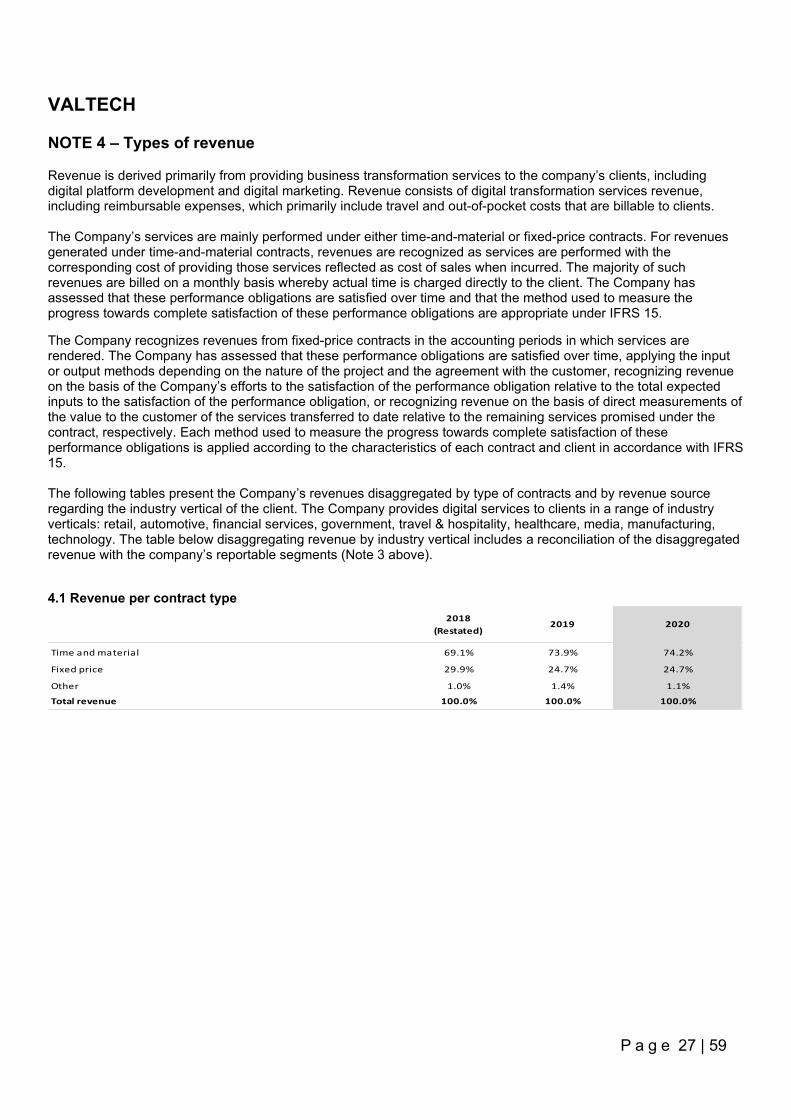
VALTECH
P a g e 27 | 59
NOTE 4 – Types of revenue
Revenue is derived primarily from providing business transformation services to the company’s clients, including digital platform development and digital marketing. Revenue consists of digital transformation services revenue, including reimbursable expenses, which primarily include travel and out-of-pocket costs that are billable to clients. The Company’s services are mainly performed under either time-and-material or fixed-price contracts. For revenues generated under time-and-material contracts, revenues are recognized as services are performed with the corresponding cost of providing those services reflected as cost of sales when incurred. The majority of such revenues are billed on a monthly basis whereby actual time is charged directly to the client. The Company has assessed that these performance obligations are satisfied over time and that the method used to measure the progress towards complete satisfaction of these performance obligations are appropriate under IFRS 15.
The Company recognizes revenues from fixed-price contracts in the accounting periods in which services are rendered. The Company has assessed that these performance obligations are satisfied over time, applying the input or output methods depending on the nature of the project and the agreement with the customer, recognizing revenue on the basis of the Company’s efforts to the satisfaction of the performance obligation relative to the total expected inputs to the satisfaction of the performance obligation, or recognizing revenue on the basis of direct measurements of the value to the customer of the services transferred to date relative to the remaining services promised under the contract, respectively. Each method used to measure the progress towards complete satisfaction of these performance obligations is applied according to the characteristics of each contract and client in accordance with IFRS 15. The following tables present the Company’s revenues disaggregated by type of contracts and by revenue source regarding the industry vertical of the client. The Company provides digital services to clients in a range of industry verticals: retail, automotive, financial services, government, travel & hospitality, healthcare, media, manufacturing, technology. The table below disaggregating revenue by industry vertical includes a reconciliation of the disaggregated revenue with the company’s reportable segments (Note 3 above).
4.1 Revenue per contract type 2018
(Restated)2019 2020
Time and material 69.1% 73.9% 74.2%
Fixed price 29.9% 24.7% 24.7%
Other 1.0% 1.4% 1.1%
Total revenue 100.0% 100.0% 100.0%
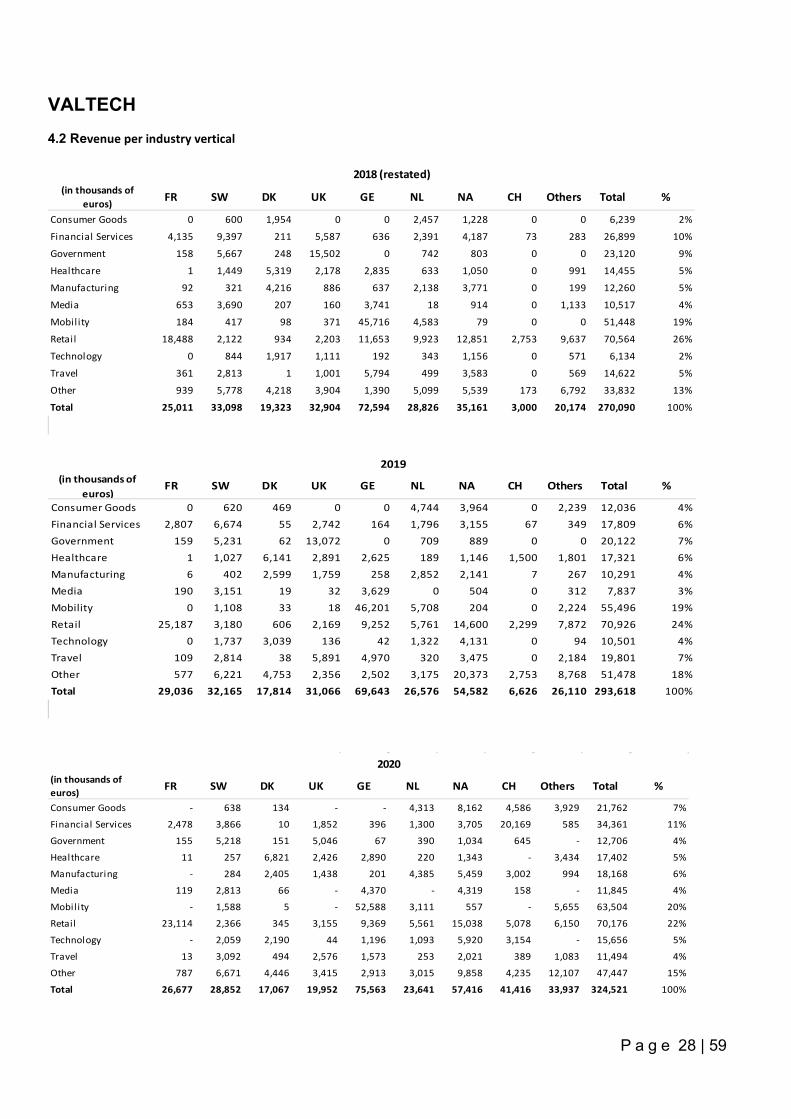
VALTECH
P a g e 28 | 59
4.2 Revenue per industry vertical
(in thousands of euros) FR SW DK UK GE NL NA CH Others Total %
Consumer Goods 0 600 1,954 0 0 2,457 1,228 0 0 6,239 2%
Financial Services 4,135 9,397 211 5,587 636 2,391 4,187 73 283 26,899 10%
Government 158 5,667 248 15,502 0 742 803 0 0 23,120 9%
Healthcare 1 1,449 5,319 2,178 2,835 633 1,050 0 991 14,455 5%
Manufacturing 92 321 4,216 886 637 2,138 3,771 0 199 12,260 5%
Media 653 3,690 207 160 3,741 18 914 0 1,133 10,517 4%
Mobility 184 417 98 371 45,716 4,583 79 0 0 51,448 19%
Retail 18,488 2,122 934 2,203 11,653 9,923 12,851 2,753 9,637 70,564 26%
Technology 0 844 1,917 1,111 192 343 1,156 0 571 6,134 2%
Travel 361 2,813 1 1,001 5,794 499 3,583 0 569 14,622 5%
Other 939 5,778 4,218 3,904 1,390 5,099 5,539 173 6,792 33,832 13%
Total 25,011 33,098 19,323 32,904 72,594 28,826 35,161 3,000 20,174 270,090 100%
2018 (restated)
(in thousands of euros)
FR SW DK UK GE NL NA CH Others Total %
Consumer Goods 0 620 469 0 0 4,744 3,964 0 2,239 12,036 4%Financial Services 2,807 6,674 55 2,742 164 1,796 3,155 67 349 17,809 6%Government 159 5,231 62 13,072 0 709 889 0 0 20,122 7%Healthcare 1 1,027 6,141 2,891 2,625 189 1,146 1,500 1,801 17,321 6%Manufacturing 6 402 2,599 1,759 258 2,852 2,141 7 267 10,291 4%Media 190 3,151 19 32 3,629 0 504 0 312 7,837 3%Mobility 0 1,108 33 18 46,201 5,708 204 0 2,224 55,496 19%Retail 25,187 3,180 606 2,169 9,252 5,761 14,600 2,299 7,872 70,926 24%Technology 0 1,737 3,039 136 42 1,322 4,131 0 94 10,501 4%Travel 109 2,814 38 5,891 4,970 320 3,475 0 2,184 19,801 7%Other 577 6,221 4,753 2,356 2,502 3,175 20,373 2,753 8,768 51,478 18%Total 29,036 32,165 17,814 31,066 69,643 26,576 54,582 6,626 26,110 293,618 100%
2019
(in thousands of euros) FR SW DK UK GE NL NA CH Others Total %
Consumer Goods - 638 134 - - 4,313 8,162 4,586 3,929 21,762 7%
Financial Services 2,478 3,866 10 1,852 396 1,300 3,705 20,169 585 34,361 11%
Government 155 5,218 151 5,046 67 390 1,034 645 - 12,706 4%
Healthcare 11 257 6,821 2,426 2,890 220 1,343 - 3,434 17,402 5%
Manufacturing - 284 2,405 1,438 201 4,385 5,459 3,002 994 18,168 6%
Media 119 2,813 66 - 4,370 - 4,319 158 - 11,845 4%
Mobility - 1,588 5 - 52,588 3,111 557 - 5,655 63,504 20%
Retail 23,114 2,366 345 3,155 9,369 5,561 15,038 5,078 6,150 70,176 22%
Technology - 2,059 2,190 44 1,196 1,093 5,920 3,154 - 15,656 5%
Travel 13 3,092 494 2,576 1,573 253 2,021 389 1,083 11,494 4%
Other 787 6,671 4,446 3,415 2,913 3,015 9,858 4,235 12,107 47,447 15%
Total 26,677 28,852 17,067 19,952 75,563 23,641 57,416 41,416 33,937 324,521 100%
2020
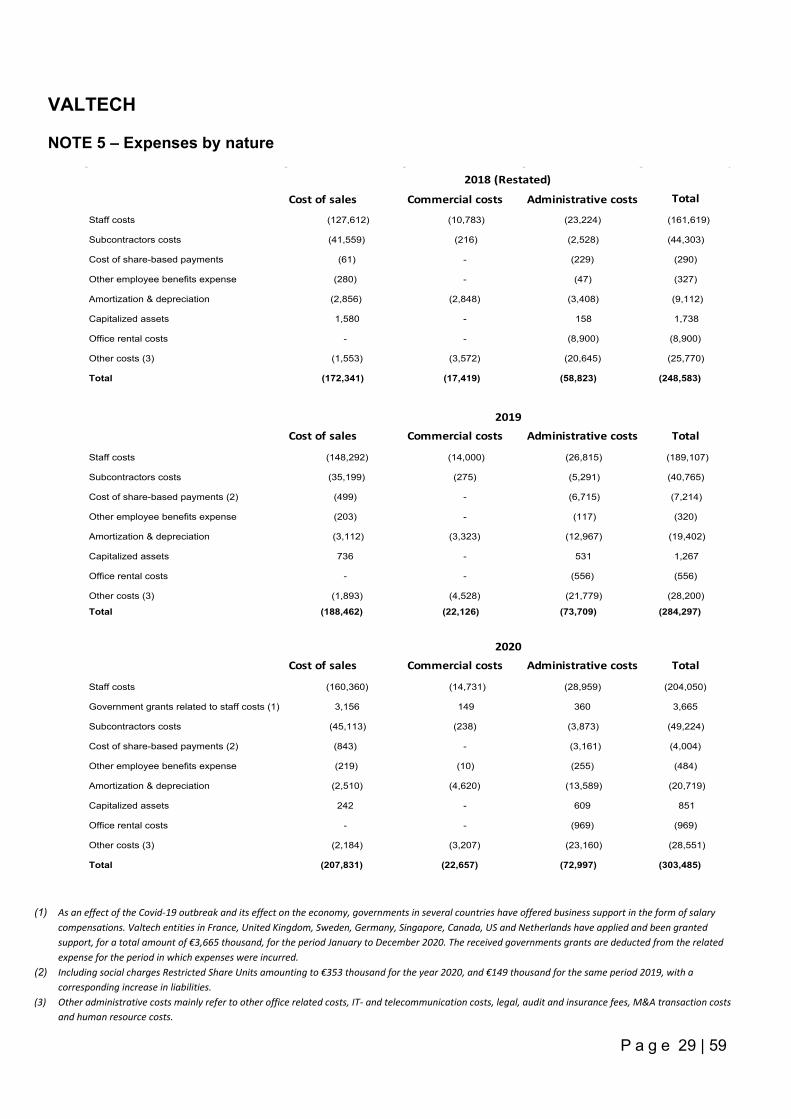
VALTECH
P a g e 29 | 59
NOTE 5 – Expenses by nature
Cost of sales Commercial costs Administrative costs Total
Staff costs (127,612) (10,783) (23,224) (161,619)
Subcontractors costs (41,559) (216) (2,528) (44,303)
Cost of share-based payments (61) - (229) (290)
Other employee benefits expense (280) - (47) (327)
Amortization & depreciation (2,856) (2,848) (3,408) (9,112)
Capitalized assets 1,580 - 158 1,738
Office rental costs - - (8,900) (8,900)
Other costs (3) (1,553) (3,572) (20,645) (25,770)
Total (172,341) (17,419) (58,823) (248,583)
Cost of sales Commercial costs Administrative costs Total
Staff costs (148,292) (14,000) (26,815) (189,107)
Subcontractors costs (35,199) (275) (5,291) (40,765)
Cost of share-based payments (2) (499) - (6,715) (7,214)
Other employee benefits expense (203) - (117) (320)
Amortization & depreciation (3,112) (3,323) (12,967) (19,402)
Capitalized assets 736 - 531 1,267
Office rental costs - - (556) (556)
Other costs (3) (1,893) (4,528) (21,779) (28,200)
Total (188,462) (22,126) (73,709) (284,297)
Cost of sales Commercial costs Administrative costs Total
Staff costs (160,360) (14,731) (28,959) (204,050)
Government grants related to staff costs (1) 3,156 149 360 3,665
Subcontractors costs (45,113) (238) (3,873) (49,224)
Cost of share-based payments (2) (843) - (3,161) (4,004)
Other employee benefits expense (219) (10) (255) (484)
Amortization & depreciation (2,510) (4,620) (13,589) (20,719)
Capitalized assets 242 - 609 851
Office rental costs - - (969) (969)
Other costs (3) (2,184) (3,207) (23,160) (28,551)
Total (207,831) (22,657) (72,997) (303,485)
2020
2019
2018 (Restated)
(1) As an effect of the Covid-19 outbreak and its effect on the economy, governments in several countries have offered business support in the form of salary
compensations. Valtech entities in France, United Kingdom, Sweden, Germany, Singapore, Canada, US and Netherlands have applied and been granted support, for a total amount of €3,665 thousand, for the period January to December 2020. The received governments grants are deducted from the related expense for the period in which expenses were incurred.
(2) Including social charges Restricted Share Units amounting to €353 thousand for the year 2020, and €149 thousand for the same period 2019, with a corresponding increase in liabilities.
(3) Other administrative costs mainly refer to other office related costs, IT- and telecommunication costs, legal, audit and insurance fees, M&A transaction costs and human resource costs.
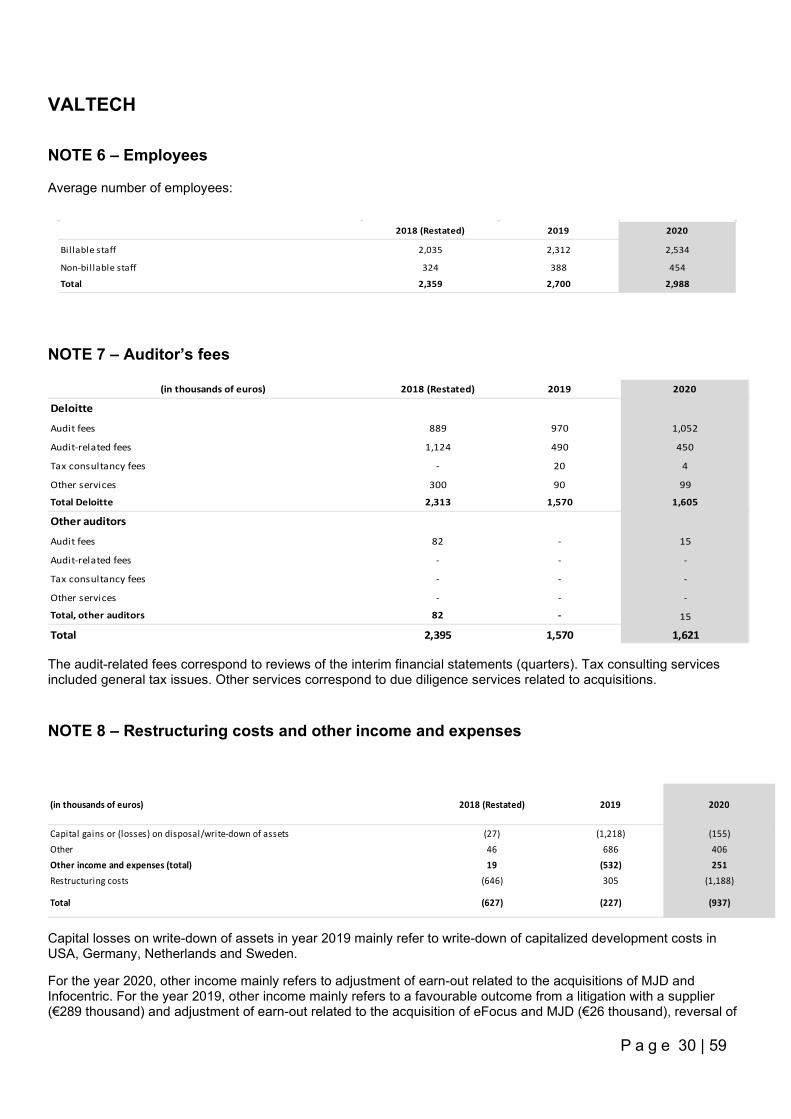
VALTECH
P a g e 30 | 59
NOTE 6 – Employees
Average number of employees:
2018 (Restated) 2019 2020
Billable staff 2,035 2,312 2,534
Non-bil lable staff 324 388 454
Total 2,359 2,700 2,988
NOTE 7 – Auditor’s fees
(in thousands of euros) 2018 (Restated) 2019 2020
Deloitte
Audit fees 889 970 1,052
Audit-related fees 1,124 490 450
Tax consultancy fees - 20 4
Other services 300 90 99
Total Deloitte 2,313 1,570 1,605
Other auditors
Audit fees 82 - 15
Audit-related fees - - -
Tax consultancy fees - - -
Other services - - -
Total, other auditors 82 - 15
Total 2,395 1,570 1,621
The audit-related fees correspond to reviews of the interim financial statements (quarters). Tax consulting services included general tax issues. Other services correspond to due diligence services related to acquisitions.
NOTE 8 – Restructuring costs and other income and expenses
(in thousands of euros) 2018 (Restated) 2019 2020
Capital gains or (losses) on disposal/write-down of assets (27) (1,218) (155)Other 46 686 406Other income and expenses (total) 19 (532) 251Restructuring costs (646) 305 (1,188)
Total (627) (227) (937)
Capital losses on write-down of assets in year 2019 mainly refer to write-down of capitalized development costs in USA, Germany, Netherlands and Sweden.
For the year 2020, other income mainly refers to adjustment of earn-out related to the acquisitions of MJD and Infocentric. For the year 2019, other income mainly refers to a favourable outcome from a litigation with a supplier (€289 thousand) and adjustment of earn-out related to the acquisition of eFocus and MJD (€26 thousand), reversal of
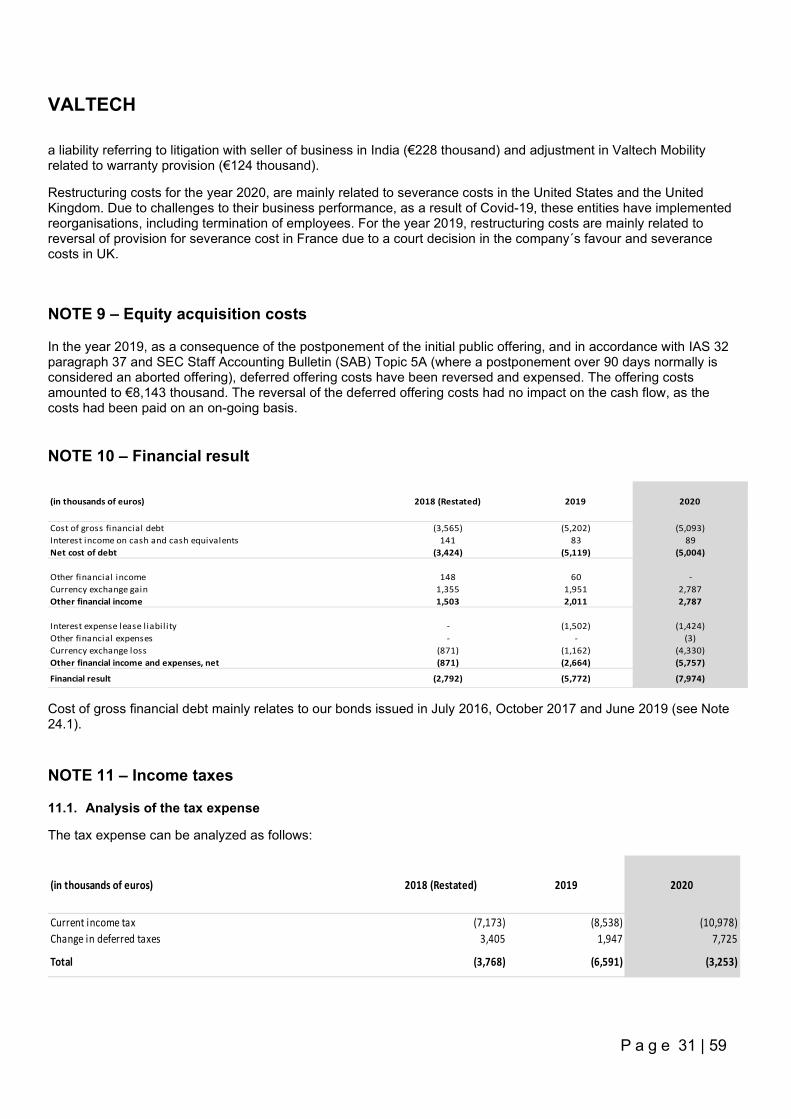
VALTECH
P a g e 31 | 59
a liability referring to litigation with seller of business in India (€228 thousand) and adjustment in Valtech Mobility related to warranty provision (€124 thousand).
Restructuring costs for the year 2020, are mainly related to severance costs in the United States and the United Kingdom. Due to challenges to their business performance, as a result of Covid-19, these entities have implemented reorganisations, including termination of employees. For the year 2019, restructuring costs are mainly related to reversal of provision for severance cost in France due to a court decision in the company´s favour and severance costs in UK.
NOTE 9 – Equity acquisition costs
In the year 2019, as a consequence of the postponement of the initial public offering, and in accordance with IAS 32 paragraph 37 and SEC Staff Accounting Bulletin (SAB) Topic 5A (where a postponement over 90 days normally is considered an aborted offering), deferred offering costs have been reversed and expensed. The offering costs amounted to €8,143 thousand. The reversal of the deferred offering costs had no impact on the cash flow, as the costs had been paid on an on-going basis.
NOTE 10 – Financial result
(in thousands of euros) 2018 (Restated) 2019 2020
Cost of gross financial debt (3,565) (5,202) (5,093)Interest income on cash and cash equivalents 141 83 89Net cost of debt (3,424) (5,119) (5,004)
Other financial income 148 60 -Currency exchange gain 1,355 1,951 2,787Other financial income 1,503 2,011 2,787
Interest expense lease l iabil ity - (1,502) (1,424)Other financial expenses - - (3)Currency exchange loss (871) (1,162) (4,330)Other financial income and expenses, net (871) (2,664) (5,757)
Financial result (2,792) (5,772) (7,974)
Cost of gross financial debt mainly relates to our bonds issued in July 2016, October 2017 and June 2019 (see Note 24.1).
NOTE 11 – Income taxes
11.1. Analysis of the tax expense
The tax expense can be analyzed as follows:
(in thousands of euros) 2018 (Restated) 2019 2020
Current income tax (7,173) (8,538) (10,978)Change in deferred taxes 3,405 1,947 7,725
Total (3,768) (6,591) (3,253)
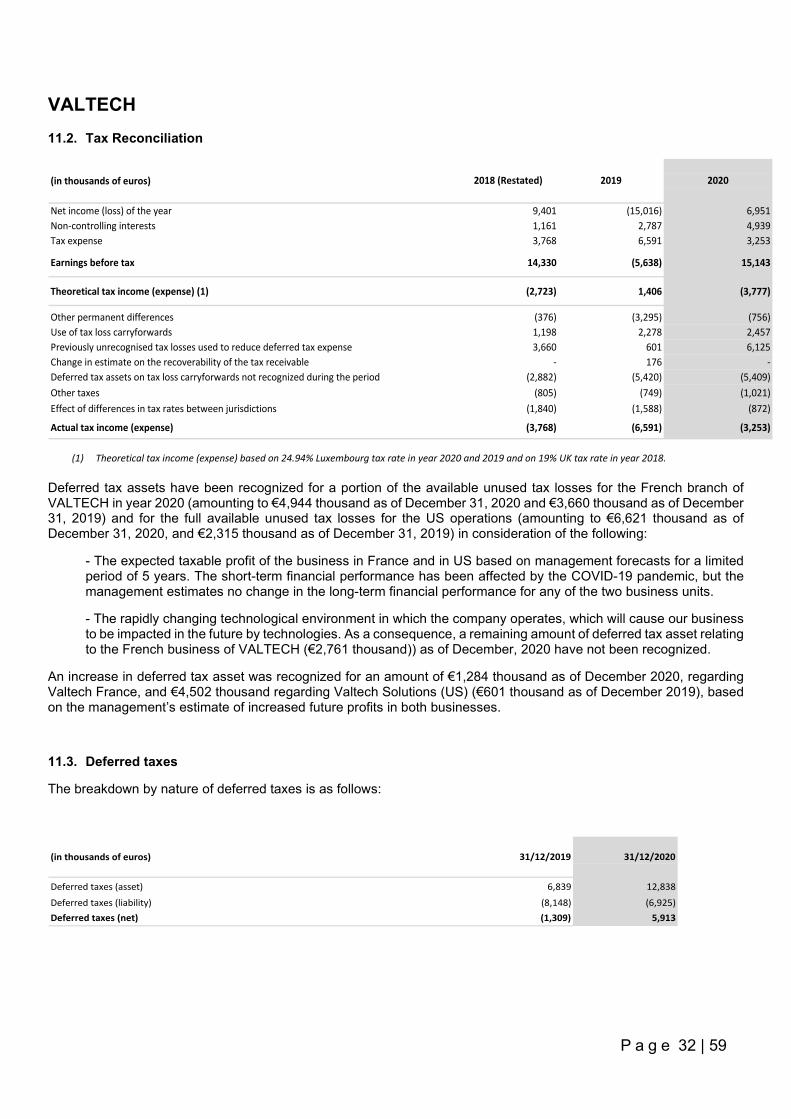
VALTECH
P a g e 32 | 59
11.2. Tax Reconciliation
(in thousands of euros) 2018 (Restated) 2019 2020
Net income (loss) of the year 9,401 (15,016) 6,951 Non-controlling interests 1,161 2,787 4,939 Tax expense 3,768 6,591 3,253
Earnings before tax 14,330 (5,638) 15,143
Theoretical tax income (expense) (1) (2,723) 1,406 (3,777)
Other permanent differences (376) (3,295) (756) Use of tax loss carryforwards 1,198 2,278 2,457 Previously unrecognised tax losses used to reduce deferred tax expense 3,660 601 6,125 Change in estimate on the recoverability of the tax receivable - 176 - Deferred tax assets on tax loss carryforwards not recognized during the period (2,882) (5,420) (5,409) Other taxes (805) (749) (1,021) Effect of differences in tax rates between jurisdictions (1,840) (1,588) (872)
Actual tax income (expense) (3,768) (6,591) (3,253) (1) Theoretical tax income (expense) based on 24.94% Luxembourg tax rate in year 2020 and 2019 and on 19% UK tax rate in year 2018.
Deferred tax assets have been recognized for a portion of the available unused tax losses for the French branch of VALTECH in year 2020 (amounting to €4,944 thousand as of December 31, 2020 and €3,660 thousand as of December 31, 2019) and for the full available unused tax losses for the US operations (amounting to €6,621 thousand as of December 31, 2020, and €2,315 thousand as of December 31, 2019) in consideration of the following:
- The expected taxable profit of the business in France and in US based on management forecasts for a limited period of 5 years. The short-term financial performance has been affected by the COVID-19 pandemic, but the management estimates no change in the long-term financial performance for any of the two business units.
- The rapidly changing technological environment in which the company operates, which will cause our business to be impacted in the future by technologies. As a consequence, a remaining amount of deferred tax asset relating to the French business of VALTECH (€2,761 thousand)) as of December, 2020 have not been recognized.
An increase in deferred tax asset was recognized for an amount of €1,284 thousand as of December 2020, regarding Valtech France, and €4,502 thousand regarding Valtech Solutions (US) (€601 thousand as of December 2019), based on the management’s estimate of increased future profits in both businesses.
11.3. Deferred taxes
The breakdown by nature of deferred taxes is as follows:
(in thousands of euros) 31/12/2019 31/12/2020
Deferred taxes (asset) 6,839 12,838
Deferred taxes (liability) (8,148) (6,925) Deferred taxes (net) (1,309) 5,913
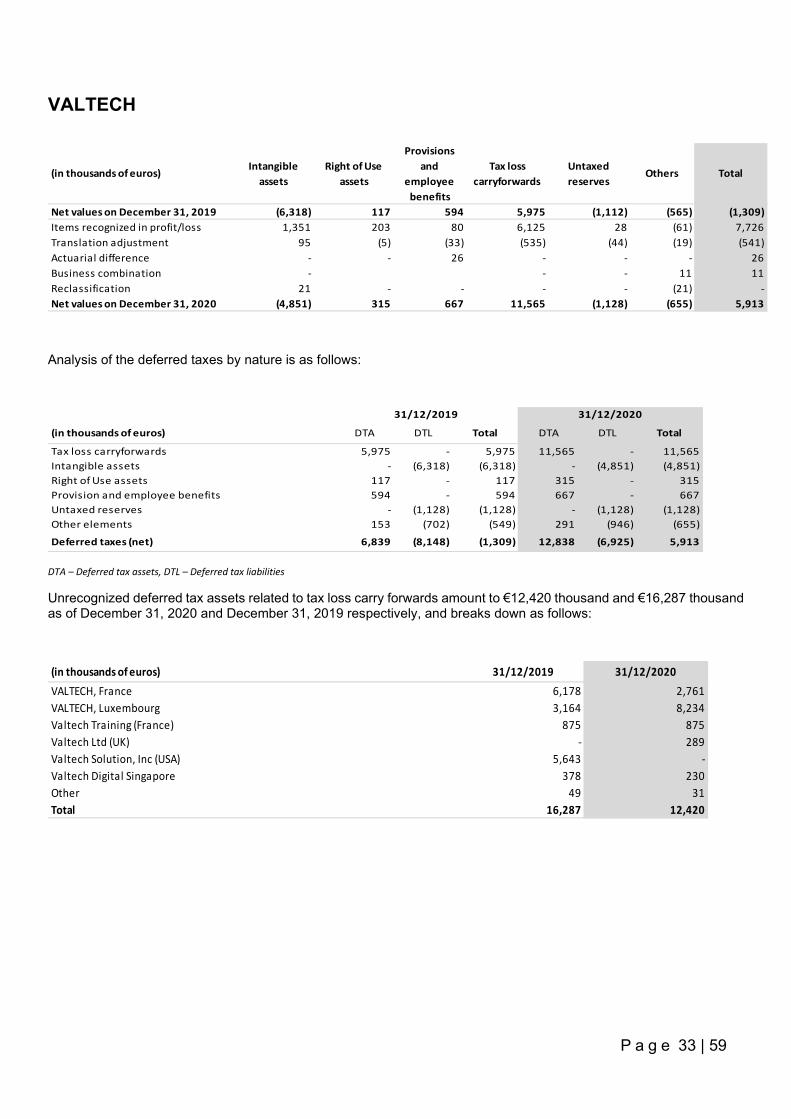
VALTECH
P a g e 33 | 59
(in thousands of euros)Intangible
assetsRight of Use
assets
Provisions and
employee benefits
Tax loss carryforwards
Untaxed reserves
Others Total
Net values on December 31, 2019 (6,318) 117 594 5,975 (1,112) (565) (1,309)Items recognized in profit/loss 1,351 203 80 6,125 28 (61) 7,726Translation adjustment 95 (5) (33) (535) (44) (19) (541)Actuarial difference - - 26 - - - 26Business combination - - - 11 11Reclassification 21 - - - - (21) -Net values on December 31, 2020 (4,851) 315 667 11,565 (1,128) (655) 5,913
Analysis of the deferred taxes by nature is as follows:
(in thousands of euros) DTA DTL Total DTA DTL Total
Tax loss carryforwards 5,975 - 5,975 11,565 - 11,565Intangible assets - (6,318) (6,318) - (4,851) (4,851)Right of Use assets 117 - 117 315 - 315Provision and employee benefits 594 - 594 667 - 667Untaxed reserves - (1,128) (1,128) - (1,128) (1,128)Other elements 153 (702) (549) 291 (946) (655)
Deferred taxes (net) 6,839 (8,148) (1,309) 12,838 (6,925) 5,913
31/12/2019 31/12/2020
DTA – Deferred tax assets, DTL – Deferred tax liabilities
Unrecognized deferred tax assets related to tax loss carry forwards amount to €12,420 thousand and €16,287 thousand as of December 31, 2020 and December 31, 2019 respectively, and breaks down as follows:
(in thousands of euros) 31/12/2019 31/12/2020VALTECH, France 6,178 2,761VALTECH, Luxembourg 3,164 8,234Valtech Training (France) 875 875Valtech Ltd (UK) - 289Valtech Solution, Inc (USA) 5,643 -Valtech Digital Singapore 378 230Other 49 31Total 16,287 12,420
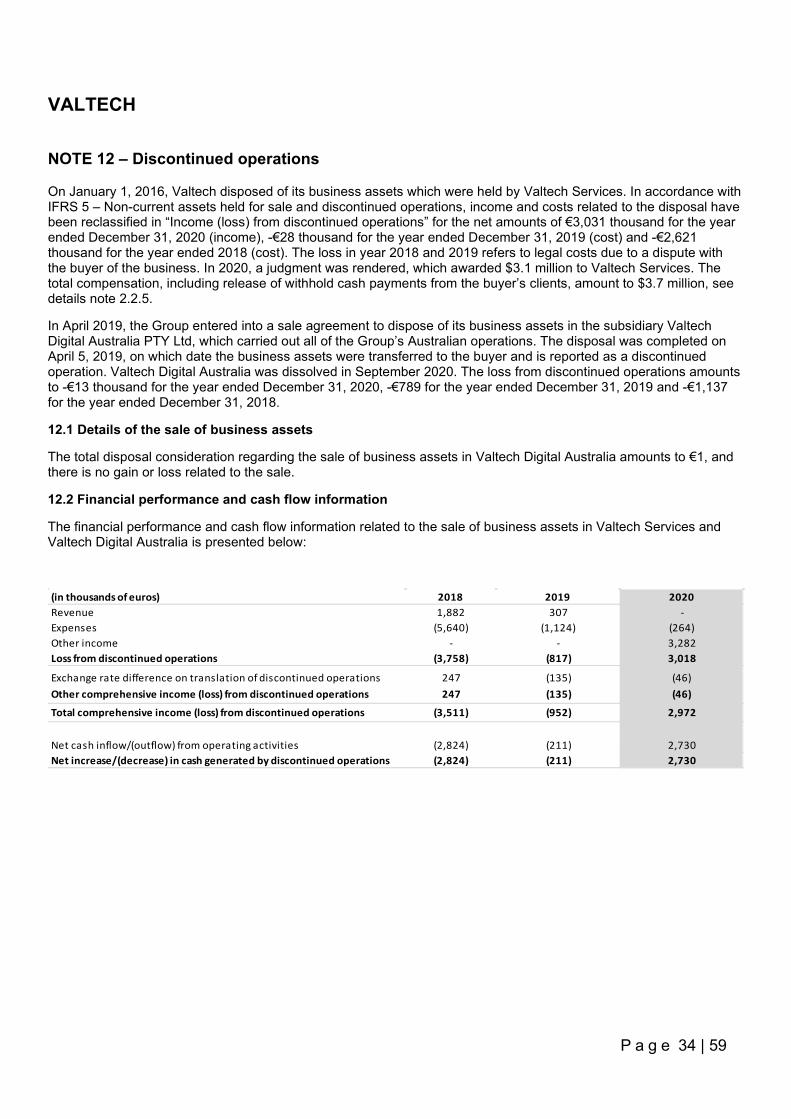
VALTECH
P a g e 34 | 59
NOTE 12 – Discontinued operations
On January 1, 2016, Valtech disposed of its business assets which were held by Valtech Services. In accordance with IFRS 5 – Non-current assets held for sale and discontinued operations, income and costs related to the disposal have been reclassified in “Income (loss) from discontinued operations” for the net amounts of €3,031 thousand for the year ended December 31, 2020 (income), -€28 thousand for the year ended December 31, 2019 (cost) and -€2,621 thousand for the year ended 2018 (cost). The loss in year 2018 and 2019 refers to legal costs due to a dispute with the buyer of the business. In 2020, a judgment was rendered, which awarded $3.1 million to Valtech Services. The total compensation, including release of withhold cash payments from the buyer’s clients, amount to $3.7 million, see details note 2.2.5.
In April 2019, the Group entered into a sale agreement to dispose of its business assets in the subsidiary Valtech Digital Australia PTY Ltd, which carried out all of the Group’s Australian operations. The disposal was completed on April 5, 2019, on which date the business assets were transferred to the buyer and is reported as a discontinued operation. Valtech Digital Australia was dissolved in September 2020. The loss from discontinued operations amounts to -€13 thousand for the year ended December 31, 2020, -€789 for the year ended December 31, 2019 and -€1,137 for the year ended December 31, 2018.
12.1 Details of the sale of business assets
The total disposal consideration regarding the sale of business assets in Valtech Digital Australia amounts to €1, and there is no gain or loss related to the sale.
12.2 Financial performance and cash flow information
The financial performance and cash flow information related to the sale of business assets in Valtech Services and Valtech Digital Australia is presented below:
(in thousands of euros) 2018 2019 2020Revenue 1,882 307 -Expenses (5,640) (1,124) (264)Other income - - 3,282Loss from discontinued operations (3,758) (817) 3,018
Exchange rate difference on translation of discontinued operations 247 (135) (46)Other comprehensive income (loss) from discontinued operations 247 (135) (46)
Total comprehensive income (loss) from discontinued operations (3,511) (952) 2,972
Net cash inflow/(outflow) from operating activities (2,824) (211) 2,730Net increase/(decrease) in cash generated by discontinued operations (2,824) (211) 2,730
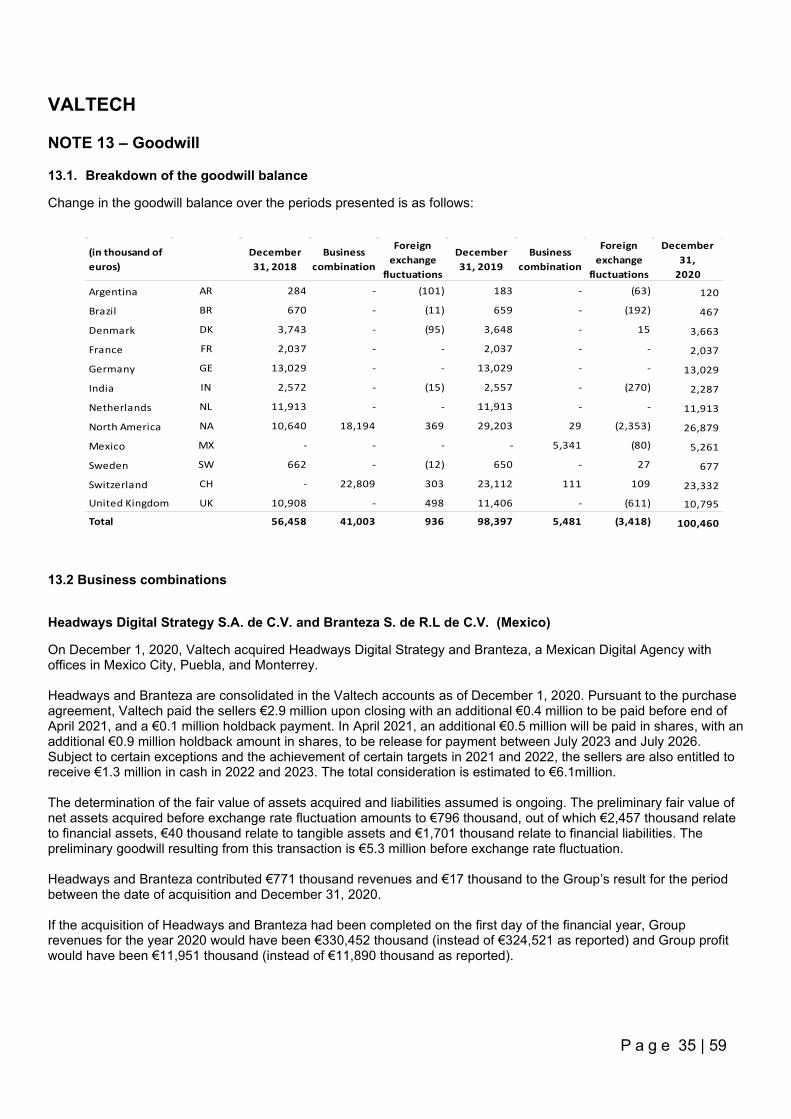
VALTECH
P a g e 35 | 59
NOTE 13 – Goodwill
13.1. Breakdown of the goodwill balance
Change in the goodwill balance over the periods presented is as follows:
(in thousand of euros)
December 31, 2018
Business combination
Foreign exchange
fluctuations
December 31, 2019
Business combination
Foreign exchange
fluctuations
December 31,
2020
Argentina AR 284 - (101) 183 - (63) 120
Brazil BR 670 - (11) 659 - (192) 467
Denmark DK 3,743 - (95) 3,648 - 15 3,663
France FR 2,037 - - 2,037 - - 2,037
Germany GE 13,029 - - 13,029 - - 13,029
India IN 2,572 - (15) 2,557 - (270) 2,287
Netherlands NL 11,913 - - 11,913 - - 11,913
North America NA 10,640 18,194 369 29,203 29 (2,353) 26,879
Mexico MX - - - - 5,341 (80) 5,261
Sweden SW 662 - (12) 650 - 27 677
Switzerland CH - 22,809 303 23,112 111 109 23,332
United Kingdom UK 10,908 - 498 11,406 - (611) 10,795
Total 56,458 41,003 936 98,397 5,481 (3,418) 100,460
13.2 Business combinations
Headways Digital Strategy S.A. de C.V. and Branteza S. de R.L de C.V. (Mexico)
On December 1, 2020, Valtech acquired Headways Digital Strategy and Branteza, a Mexican Digital Agency with offices in Mexico City, Puebla, and Monterrey. Headways and Branteza are consolidated in the Valtech accounts as of December 1, 2020. Pursuant to the purchase agreement, Valtech paid the sellers €2.9 million upon closing with an additional €0.4 million to be paid before end of April 2021, and a €0.1 million holdback payment. In April 2021, an additional €0.5 million will be paid in shares, with an additional €0.9 million holdback amount in shares, to be release for payment between July 2023 and July 2026. Subject to certain exceptions and the achievement of certain targets in 2021 and 2022, the sellers are also entitled to receive €1.3 million in cash in 2022 and 2023. The total consideration is estimated to €6.1million. The determination of the fair value of assets acquired and liabilities assumed is ongoing. The preliminary fair value of net assets acquired before exchange rate fluctuation amounts to €796 thousand, out of which €2,457 thousand relate to financial assets, €40 thousand relate to tangible assets and €1,701 thousand relate to financial liabilities. The preliminary goodwill resulting from this transaction is €5.3 million before exchange rate fluctuation. Headways and Branteza contributed €771 thousand revenues and €17 thousand to the Group’s result for the period between the date of acquisition and December 31, 2020. If the acquisition of Headways and Branteza had been completed on the first day of the financial year, Group revenues for the year 2020 would have been €330,452 thousand (instead of €324,521 as reported) and Group profit would have been €11,951 thousand (instead of €11,890 thousand as reported).
VALTECH
P a g e 36 | 59
13.3. Impairment tests In case of difference between the recoverable amount of a CGU and its book value, an impairment loss is recognized. It is allocated primarily to the goodwill.
The CGUs are determined in accordance with operational reporting and their recoverable amounts are mainly determined based on a calculation of value in use. The values in use are calculated by discounting, at a discount rate per country, the pre-tax operating cash-flow forecasts.
Cash-flow projections are made, generally for a period of 5 years based on the management forecasts. Terminal value generally corresponds to the projection of year 5.
Except for the UK goodwill, no reasonable changes in the discount rate, or in the perpetual growth rate or in key assumptions relating to the other business projections (revenue growth or gross margin rate) would have caused the recoverable amount of any goodwill to equal its carrying value.
The UK goodwill (amounting to €10.8 million as of December 31, 2020) has been tested based on a 5-year business plan with the following key assumptions:
- An increase in the gross margin rate of 500 basis points from 2020 to 2022 and an additional increase in gross margin rate of 200 basis points from 2023 and onwards
- An increase in the revenue by an average annual growth rate of 11% over the 2021-2025 period
The sensitivity of the test to variations of these key performance indicators has been calculated and shows that the recoverable amount would equal its carrying value if:
- the gross margin rate increases by 500 basis points from 2020 to 2022 and by an additional 200 basis points from 2023 and onwards as planned, but the average annual growth rate of the revenue is limited to 5%
- or the revenue increases by an average annual growth rate of 11% over the 2021-2025 period as planned, but the gross margin rate only increases by 300 basis points from 2020 to 2022 and by an additional 200 basic points from 2023 and onwards.
Goodwill was subject to annual impairment testing. No impairment expense was recognized during the years ended December 31, 2020 and December 31, 2019.
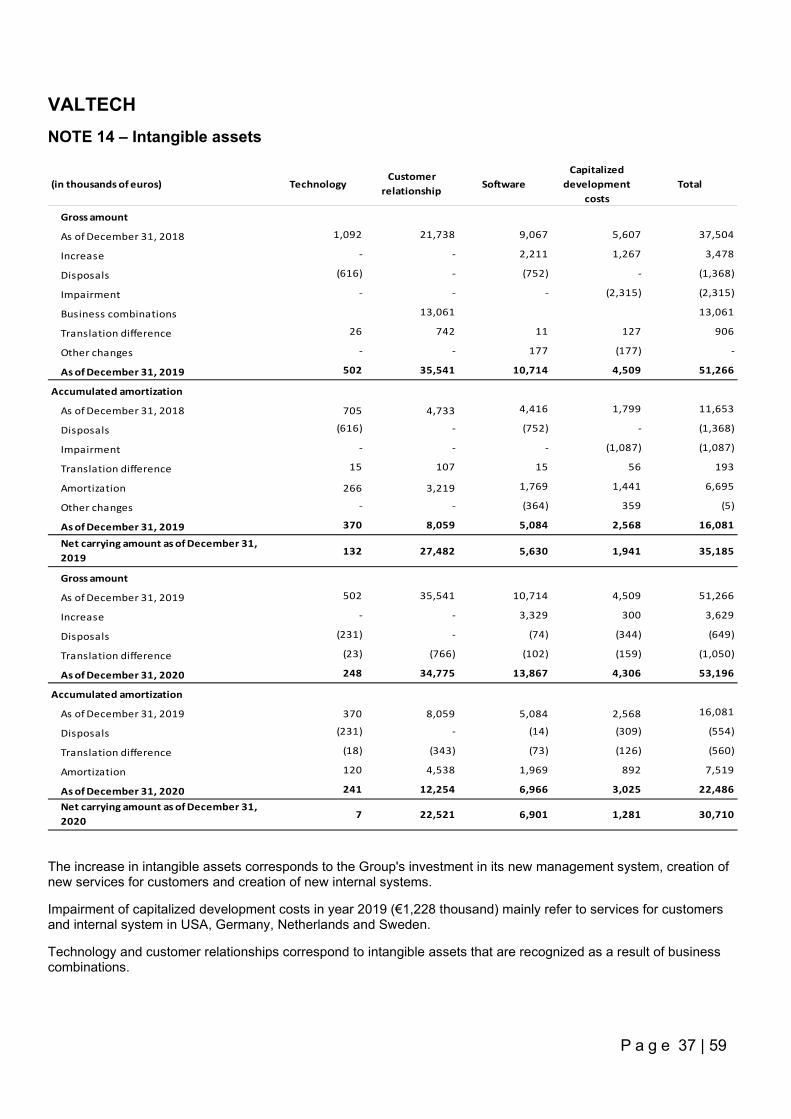
VALTECH
P a g e 37 | 59
NOTE 14 – Intangible assets
(in thousands of euros) TechnologyCustomer
relationshipSoftware
Capitalized development
costsTotal
Gross amount
As of December 31, 2018 1,092 21,738 9,067 5,607 37,504
Increase - - 2,211 1,267 3,478
Disposals (616) - (752) - (1,368)
Impairment - - - (2,315) (2,315)
Business combinations 13,061 13,061
Translation difference 26 742 11 127 906
Other changes - - 177 (177) -
As of December 31, 2019 502 35,541 10,714 4,509 51,266
Accumulated amortization
As of December 31, 2018 705 4,733 4,416 1,799 11,653
Disposals (616) - (752) - (1,368)
Impairment - - - (1,087) (1,087)
Translation difference 15 107 15 56 193
Amortization 266 3,219 1,769 1,441 6,695
Other changes - - (364) 359 (5)
As of December 31, 2019 370 8,059 5,084 2,568 16,081
Net carrying amount as of December 31, 2019
132 27,482 5,630 1,941 35,185
Gross amount
As of December 31, 2019 502 35,541 10,714 4,509 51,266
Increase - - 3,329 300 3,629
Disposals (231) - (74) (344) (649)
Translation difference (23) (766) (102) (159) (1,050)
As of December 31, 2020 248 34,775 13,867 4,306 53,196
Accumulated amortization
As of December 31, 2019 370 8,059 5,084 2,568 16,081
Disposals (231) - (14) (309) (554)
Translation difference (18) (343) (73) (126) (560)
Amortization 120 4,538 1,969 892 7,519
As of December 31, 2020 241 12,254 6,966 3,025 22,486
Net carrying amount as of December 31, 2020
7 22,521 6,901 1,281 30,710
The increase in intangible assets corresponds to the Group's investment in its new management system, creation of new services for customers and creation of new internal systems.
Impairment of capitalized development costs in year 2019 (€1,228 thousand) mainly refer to services for customers and internal system in USA, Germany, Netherlands and Sweden.
Technology and customer relationships correspond to intangible assets that are recognized as a result of business combinations.
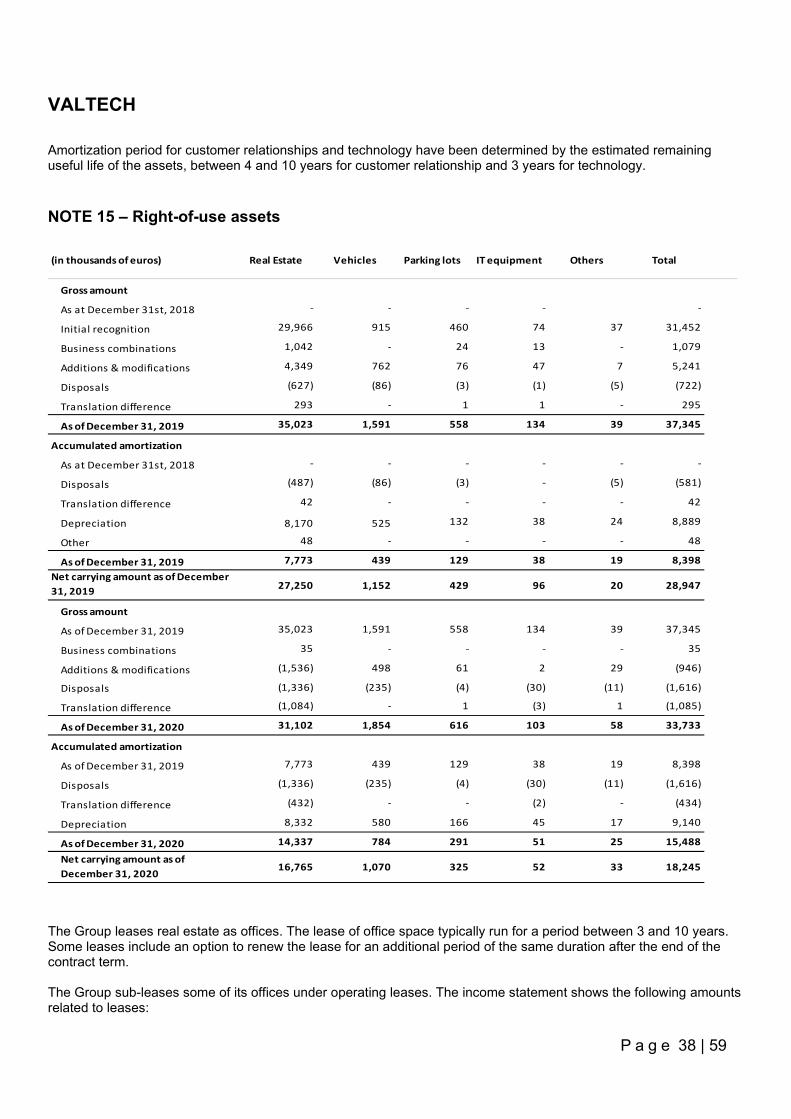
VALTECH
P a g e 38 | 59
Amortization period for customer relationships and technology have been determined by the estimated remaining useful life of the assets, between 4 and 10 years for customer relationship and 3 years for technology.
NOTE 15 – Right-of-use assets
(in thousands of euros) Real Estate Vehicles Parking lots IT equipment Others Total
Gross amount
As at December 31st, 2018 - - - - -
Initial recognition 29,966 915 460 74 37 31,452
Business combinations 1,042 - 24 13 - 1,079
Additions & modifications 4,349 762 76 47 7 5,241
Disposals (627) (86) (3) (1) (5) (722)
Translation difference 293 - 1 1 - 295
As of December 31, 2019 35,023 1,591 558 134 39 37,345
Accumulated amortization
As at December 31st, 2018 - - - - - -
Disposals (487) (86) (3) - (5) (581)
Translation difference 42 - - - - 42
Depreciation 8,170 525 132 38 24 8,889
Other 48 - - - - 48
As of December 31, 2019 7,773 439 129 38 19 8,398Net carrying amount as of December 31, 2019 27,250 1,152 429 96 20 28,947
Gross amount
As of December 31, 2019 35,023 1,591 558 134 39 37,345
Business combinations 35 - - - - 35
Additions & modifications (1,536) 498 61 2 29 (946)
Disposals (1,336) (235) (4) (30) (11) (1,616)
Translation difference (1,084) - 1 (3) 1 (1,085)
As of December 31, 2020 31,102 1,854 616 103 58 33,733
Accumulated amortization
As of December 31, 2019 7,773 439 129 38 19 8,398
Disposals (1,336) (235) (4) (30) (11) (1,616)
Translation difference (432) - - (2) - (434)
Depreciation 8,332 580 166 45 17 9,140
As of December 31, 2020 14,337 784 291 51 25 15,488
Net carrying amount as of December 31, 2020
16,765 1,070 325 52 33 18,245
The Group leases real estate as offices. The lease of office space typically run for a period between 3 and 10 years. Some leases include an option to renew the lease for an additional period of the same duration after the end of the contract term. The Group sub-leases some of its offices under operating leases. The income statement shows the following amounts related to leases:
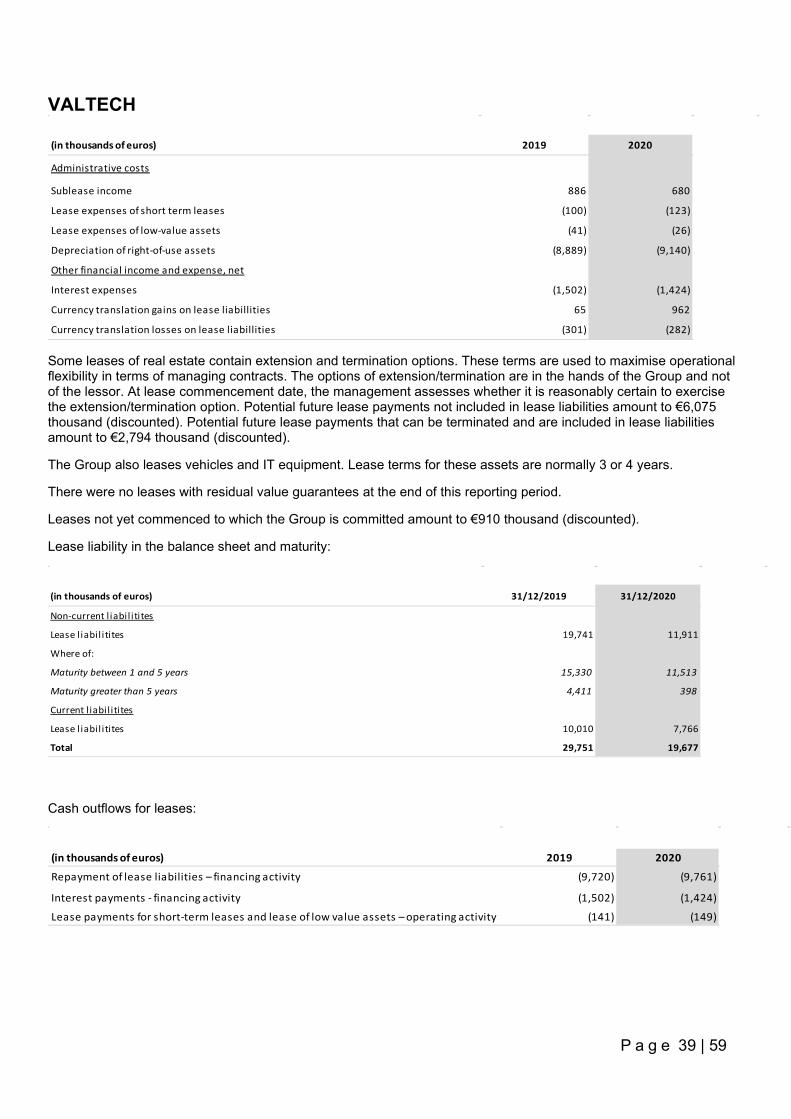
VALTECH
P a g e 39 | 59
(in thousands of euros) 2019 2020
Administrative costs
Sublease income 886 680
Lease expenses of short term leases (100) (123)
Lease expenses of low-value assets (41) (26)
Depreciation of right-of-use assets (8,889) (9,140)
Other financial income and expense, net
Interest expenses (1,502) (1,424)
Currency translation gains on lease liabillities 65 962
Currency translation losses on lease liabillities (301) (282)
Some leases of real estate contain extension and termination options. These terms are used to maximise operational flexibility in terms of managing contracts. The options of extension/termination are in the hands of the Group and not of the lessor. At lease commencement date, the management assesses whether it is reasonably certain to exercise the extension/termination option. Potential future lease payments not included in lease liabilities amount to €6,075 thousand (discounted). Potential future lease payments that can be terminated and are included in lease liabilities amount to €2,794 thousand (discounted).
The Group also leases vehicles and IT equipment. Lease terms for these assets are normally 3 or 4 years.
There were no leases with residual value guarantees at the end of this reporting period.
Leases not yet commenced to which the Group is committed amount to €910 thousand (discounted).
Lease liability in the balance sheet and maturity:
(in thousands of euros) 31/12/2019 31/12/2020
Non-current l iabil itites
Lease l iabil itites 19,741 11,911
Where of:
Maturity between 1 and 5 years 15,330 11,513
Maturity greater than 5 years 4,411 398
Current l iabil itites
Lease l iabil itites 10,010 7,766
Total 29,751 19,677
Cash outflows for leases:
(in thousands of euros) 2019 2020
Repayment of lease liabilities – financing activity (9,720) (9,761)
Interest payments - financing activity (1,502) (1,424)
Lease payments for short-term leases and lease of low value assets – operating activity (141) (149)
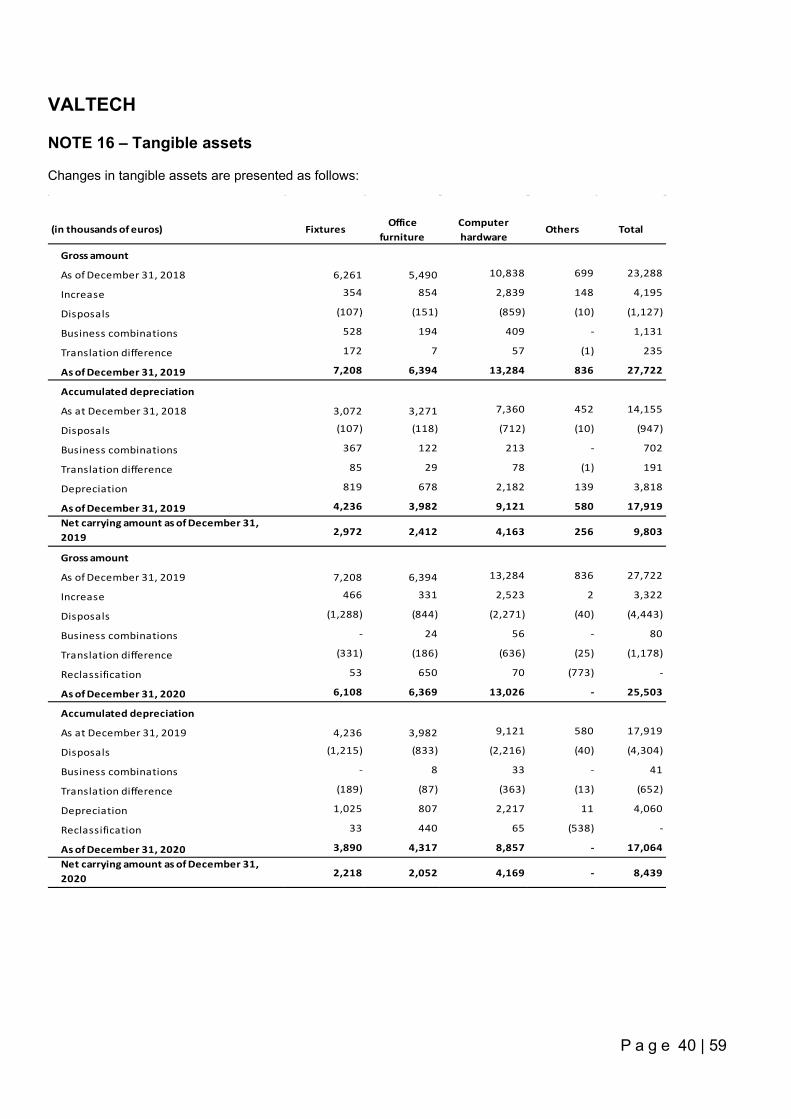
VALTECH
P a g e 40 | 59
NOTE 16 – Tangible assets
Changes in tangible assets are presented as follows:
(in thousands of euros) FixturesOffice
furnitureComputer hardware
Others Total
Gross amount
As of December 31, 2018 6,261 5,490 10,838 699 23,288
Increase 354 854 2,839 148 4,195
Disposals (107) (151) (859) (10) (1,127)
Business combinations 528 194 409 - 1,131
Translation difference 172 7 57 (1) 235
As of December 31, 2019 7,208 6,394 13,284 836 27,722
Accumulated depreciation
As at December 31, 2018 3,072 3,271 7,360 452 14,155
Disposals (107) (118) (712) (10) (947)
Business combinations 367 122 213 - 702
Translation difference 85 29 78 (1) 191
Depreciation 819 678 2,182 139 3,818
As of December 31, 2019 4,236 3,982 9,121 580 17,919Net carrying amount as of December 31, 2019 2,972 2,412 4,163 256 9,803
Gross amount
As of December 31, 2019 7,208 6,394 13,284 836 27,722
Increase 466 331 2,523 2 3,322
Disposals (1,288) (844) (2,271) (40) (4,443)
Business combinations - 24 56 - 80
Translation difference (331) (186) (636) (25) (1,178)
Reclassification 53 650 70 (773) -
As of December 31, 2020 6,108 6,369 13,026 - 25,503
Accumulated depreciation
As at December 31, 2019 4,236 3,982 9,121 580 17,919
Disposals (1,215) (833) (2,216) (40) (4,304)
Business combinations - 8 33 - 41
Translation difference (189) (87) (363) (13) (652)
Depreciation 1,025 807 2,217 11 4,060
Reclassification 33 440 65 (538) -
As of December 31, 2020 3,890 4,317 8,857 - 17,064Net carrying amount as of December 31, 2020 2,218 2,052 4,169 - 8,439
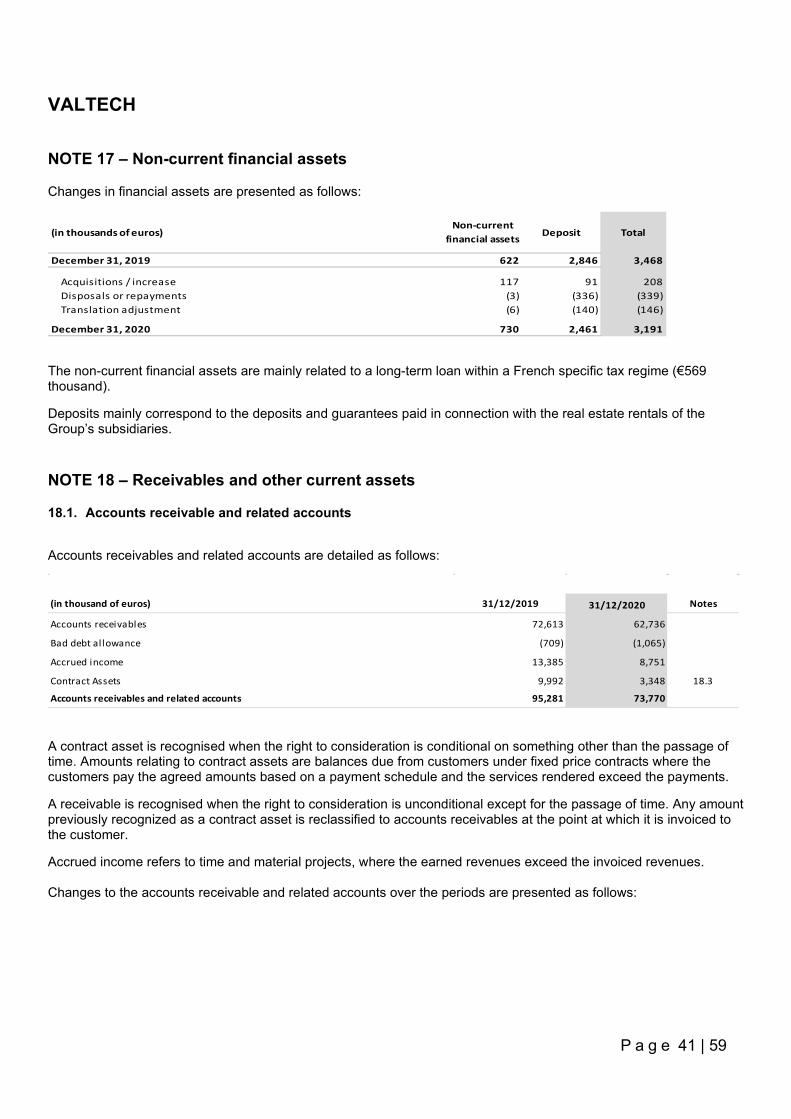
VALTECH
P a g e 41 | 59
NOTE 17 – Non-current financial assets
Changes in financial assets are presented as follows:
(in thousands of euros)Non-current
financial assetsDeposit Total
December 31, 2019 622 2,846 3,468
Acquisitions / increase 117 91 208Disposals or repayments (3) (336) (339)Translation adjustment (6) (140) (146)
December 31, 2020 730 2,461 3,191
The non-current financial assets are mainly related to a long-term loan within a French specific tax regime (€569 thousand).
Deposits mainly correspond to the deposits and guarantees paid in connection with the real estate rentals of the Group’s subsidiaries.
NOTE 18 – Receivables and other current assets
18.1. Accounts receivable and related accounts
Accounts receivables and related accounts are detailed as follows:
(in thousand of euros) 31/12/2019 31/12/2020 Notes
Accounts receivables 72,613 62,736
Bad debt allowance (709) (1,065)
Accrued income 13,385 8,751
Contract Assets 9,992 3,348 18.3
Accounts receivables and related accounts 95,281 73,770
A contract asset is recognised when the right to consideration is conditional on something other than the passage of time. Amounts relating to contract assets are balances due from customers under fixed price contracts where the customers pay the agreed amounts based on a payment schedule and the services rendered exceed the payments.
A receivable is recognised when the right to consideration is unconditional except for the passage of time. Any amount previously recognized as a contract asset is reclassified to accounts receivables at the point at which it is invoiced to the customer.
Accrued income refers to time and material projects, where the earned revenues exceed the invoiced revenues. Changes to the accounts receivable and related accounts over the periods are presented as follows:
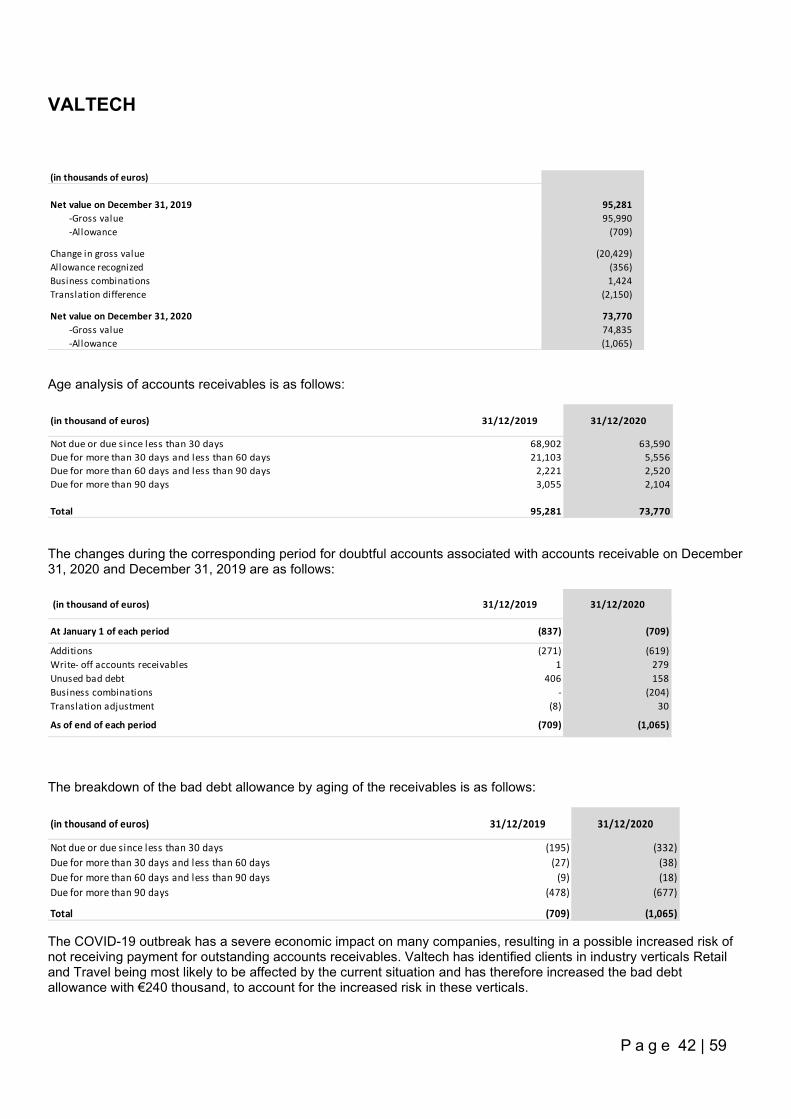
VALTECH
P a g e 42 | 59
(in thousands of euros)
Net value on December 31, 2019 95,281-Gross value 95,990-Allowance (709)
Change in gross value (20,429)Allowance recognized (356)Business combinations 1,424Translation difference (2,150)
Net value on December 31, 2020 73,770-Gross value 74,835-Allowance (1,065)
Age analysis of accounts receivables is as follows:
(in thousand of euros) 31/12/2019 31/12/2020
Not due or due since less than 30 days 68,902 63,590Due for more than 30 days and less than 60 days 21,103 5,556Due for more than 60 days and less than 90 days 2,221 2,520Due for more than 90 days 3,055 2,104
Total 95,281 73,770
The changes during the corresponding period for doubtful accounts associated with accounts receivable on December 31, 2020 and December 31, 2019 are as follows:
(in thousand of euros) 31/12/2019 31/12/2020
At January 1 of each period (837) (709)
Additions (271) (619)Write- off accounts receivables 1 279Unused bad debt 406 158Business combinations - (204)Translation adjustment (8) 30
As of end of each period (709) (1,065)
The breakdown of the bad debt allowance by aging of the receivables is as follows:
(in thousand of euros) 31/12/2019 31/12/2020
Not due or due since less than 30 days (195) (332)Due for more than 30 days and less than 60 days (27) (38)Due for more than 60 days and less than 90 days (9) (18)Due for more than 90 days (478) (677)
Total (709) (1,065)
The COVID-19 outbreak has a severe economic impact on many companies, resulting in a possible increased risk of not receiving payment for outstanding accounts receivables. Valtech has identified clients in industry verticals Retail and Travel being most likely to be affected by the current situation and has therefore increased the bad debt allowance with €240 thousand, to account for the increased risk in these verticals.
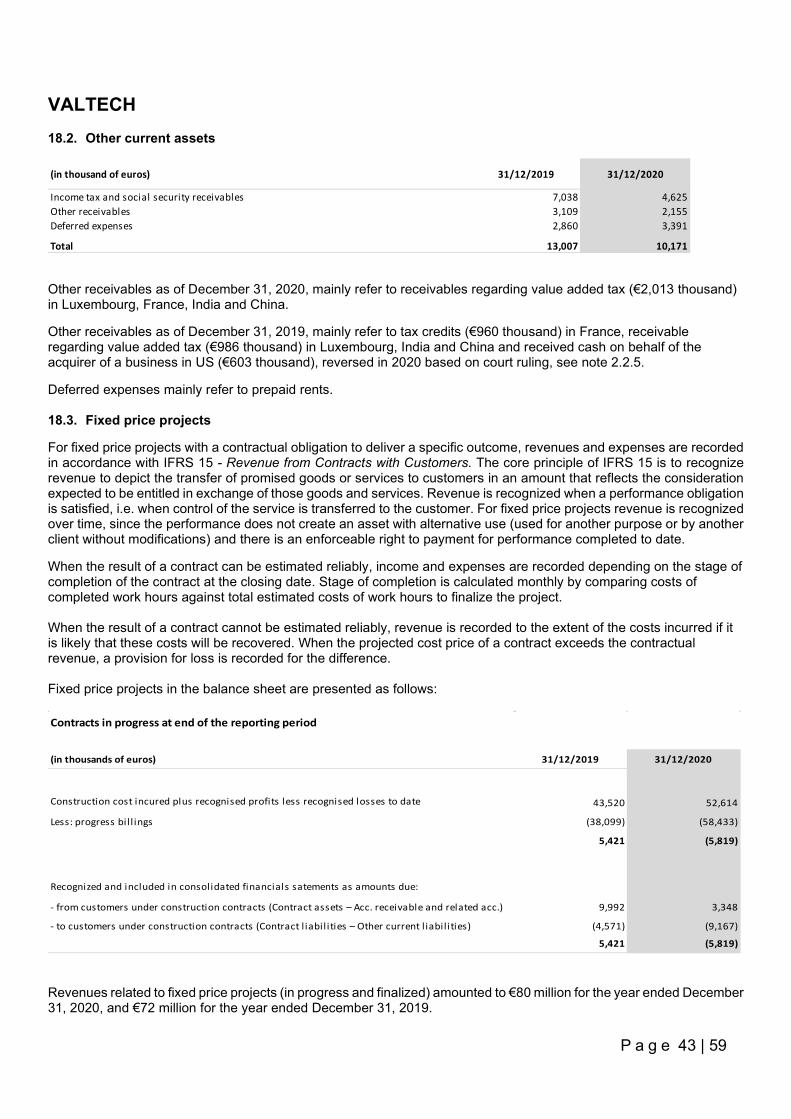
VALTECH
P a g e 43 | 59
18.2. Other current assets
(in thousand of euros) 31/12/2019 31/12/2020
Income tax and social security receivables 7,038 4,625Other receivables 3,109 2,155Deferred expenses 2,860 3,391
Total 13,007 10,171
Other receivables as of December 31, 2020, mainly refer to receivables regarding value added tax (€2,013 thousand) in Luxembourg, France, India and China.
Other receivables as of December 31, 2019, mainly refer to tax credits (€960 thousand) in France, receivable regarding value added tax (€986 thousand) in Luxembourg, India and China and received cash on behalf of the acquirer of a business in US (€603 thousand), reversed in 2020 based on court ruling, see note 2.2.5.
Deferred expenses mainly refer to prepaid rents. 18.3. Fixed price projects
For fixed price projects with a contractual obligation to deliver a specific outcome, revenues and expenses are recorded in accordance with IFRS 15 - Revenue from Contracts with Customers. The core principle of IFRS 15 is to recognize revenue to depict the transfer of promised goods or services to customers in an amount that reflects the consideration expected to be entitled in exchange of those goods and services. Revenue is recognized when a performance obligation is satisfied, i.e. when control of the service is transferred to the customer. For fixed price projects revenue is recognized over time, since the performance does not create an asset with alternative use (used for another purpose or by another client without modifications) and there is an enforceable right to payment for performance completed to date.
When the result of a contract can be estimated reliably, income and expenses are recorded depending on the stage of completion of the contract at the closing date. Stage of completion is calculated monthly by comparing costs of completed work hours against total estimated costs of work hours to finalize the project. When the result of a contract cannot be estimated reliably, revenue is recorded to the extent of the costs incurred if it is likely that these costs will be recovered. When the projected cost price of a contract exceeds the contractual revenue, a provision for loss is recorded for the difference. Fixed price projects in the balance sheet are presented as follows: Contracts in progress at end of the reporting period
(in thousands of euros) 31/12/2019 31/12/2020
Construction cost incured plus recognised profits less recognised losses to date 43,520 52,614
Less: progress bil l ings (38,099) (58,433)
5,421 (5,819)
Recognized and included in consolidated financials satements as amounts due:
- from customers under construction contracts (Contract assets – Acc. receivable and related acc.) 9,992 3,348
- to customers under construction contracts (Contract l iabil ities – Other current l iabil ities) (4,571) (9,167)
5,421 (5,819) Revenues related to fixed price projects (in progress and finalized) amounted to €80 million for the year ended December 31, 2020, and €72 million for the year ended December 31, 2019.
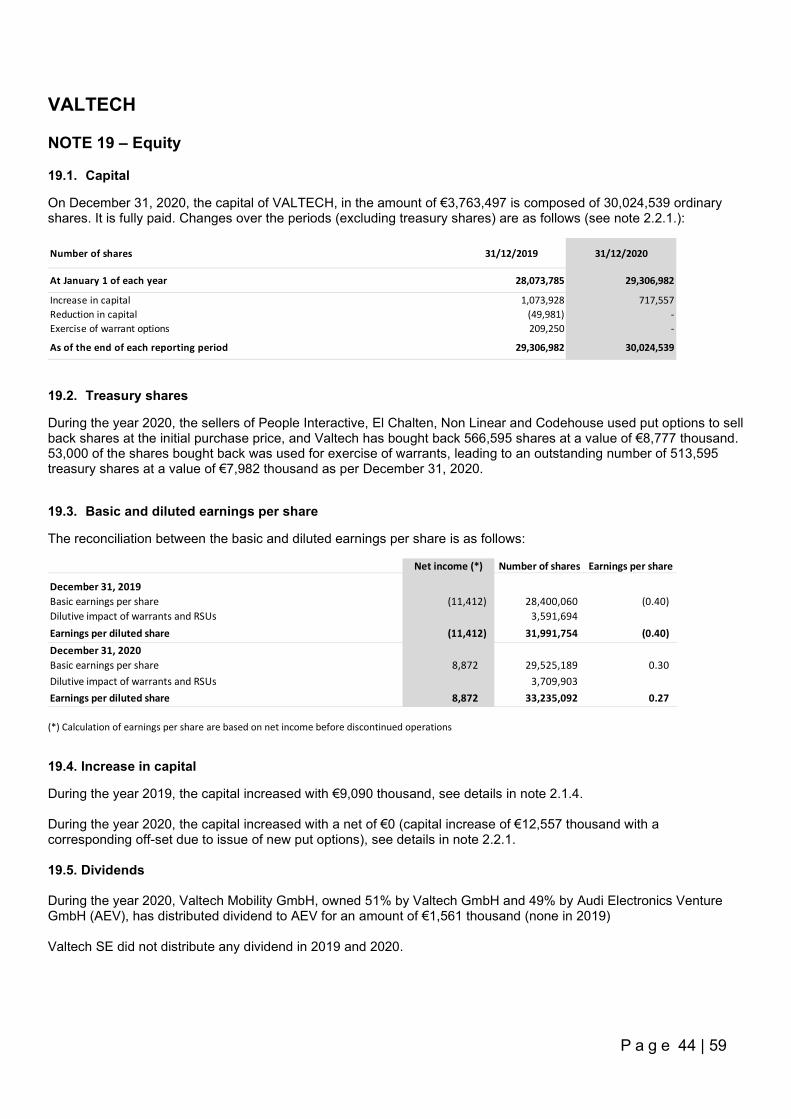
VALTECH
P a g e 44 | 59
NOTE 19 – Equity
19.1. Capital
On December 31, 2020, the capital of VALTECH, in the amount of €3,763,497 is composed of 30,024,539 ordinary shares. It is fully paid. Changes over the periods (excluding treasury shares) are as follows (see note 2.2.1.):
Number of shares 31/12/2019 31/12/2020
At January 1 of each year 28,073,785 29,306,982
Increase in capital 1,073,928 717,557Reduction in capital (49,981) -Exercise of warrant options 209,250 -
As of the end of each reporting period 29,306,982 30,024,539
19.2. Treasury shares
During the year 2020, the sellers of People Interactive, El Chalten, Non Linear and Codehouse used put options to sell back shares at the initial purchase price, and Valtech has bought back 566,595 shares at a value of €8,777 thousand. 53,000 of the shares bought back was used for exercise of warrants, leading to an outstanding number of 513,595 treasury shares at a value of €7,982 thousand as per December 31, 2020.
19.3. Basic and diluted earnings per share
The reconciliation between the basic and diluted earnings per share is as follows:
Net income (*) Number of shares Earnings per share
December 31, 2019Basic earnings per share (11,412) 28,400,060 (0.40)Dilutive impact of warrants and RSUs 3,591,694Earnings per diluted share (11,412) 31,991,754 (0.40)December 31, 2020Basic earnings per share 8,872 29,525,189 0.30Dilutive impact of warrants and RSUs 3,709,903Earnings per diluted share 8,872 33,235,092 0.27 (*) Calculation of earnings per share are based on net income before discontinued operations
19.4. Increase in capital
During the year 2019, the capital increased with €9,090 thousand, see details in note 2.1.4. During the year 2020, the capital increased with a net of €0 (capital increase of €12,557 thousand with a corresponding off-set due to issue of new put options), see details in note 2.2.1. 19.5. Dividends During the year 2020, Valtech Mobility GmbH, owned 51% by Valtech GmbH and 49% by Audi Electronics Venture GmbH (AEV), has distributed dividend to AEV for an amount of €1,561 thousand (none in 2019) Valtech SE did not distribute any dividend in 2019 and 2020.
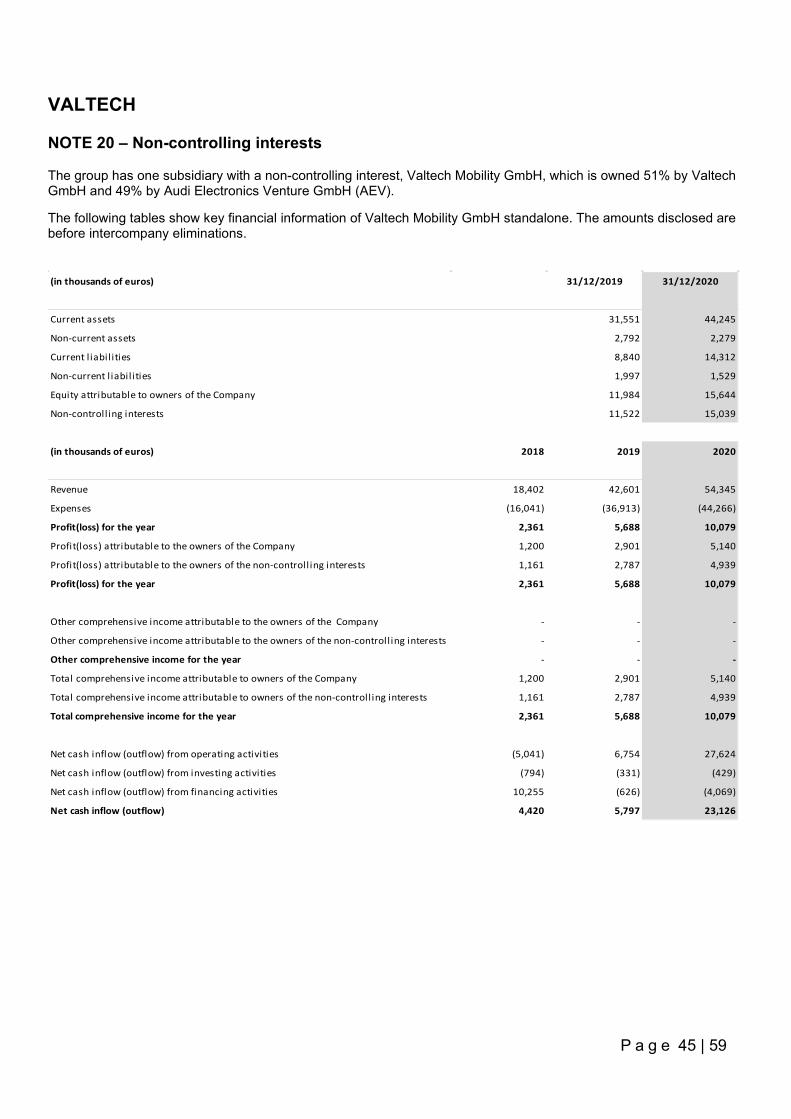
VALTECH
P a g e 45 | 59
NOTE 20 – Non-controlling interests
The group has one subsidiary with a non-controlling interest, Valtech Mobility GmbH, which is owned 51% by Valtech GmbH and 49% by Audi Electronics Venture GmbH (AEV).
The following tables show key financial information of Valtech Mobility GmbH standalone. The amounts disclosed are before intercompany eliminations. (in thousands of euros) 31/12/2019 31/12/2020
Current assets 31,551 44,245
Non-current assets 2,792 2,279
Current l iabil ities 8,840 14,312
Non-current l iabil ities 1,997 1,529
Equity attributable to owners of the Company 11,984 15,644
Non-controll ing interests 11,522 15,039
(in thousands of euros) 2018 2019 2020
Revenue 18,402 42,601 54,345
Expenses (16,041) (36,913) (44,266)
Profit(loss) for the year 2,361 5,688 10,079
Profit(loss) attributable to the owners of the Company 1,200 2,901 5,140
Profit(loss) attributable to the owners of the non-controll ing interests 1,161 2,787 4,939
Profit(loss) for the year 2,361 5,688 10,079
Other comprehensive income attributable to the owners of the Company - - -
Other comprehensive income attributable to the owners of the non-controll ing interests - - -
Other comprehensive income for the year - - -
Total comprehensive income attributable to owners of the Company 1,200 2,901 5,140
Total comprehensive income attributable to owners of the non-controll ing interests 1,161 2,787 4,939
Total comprehensive income for the year 2,361 5,688 10,079
Net cash inflow (outflow) from operating activities (5,041) 6,754 27,624
Net cash inflow (outflow) from investing activities (794) (331) (429)
Net cash inflow (outflow) from financing activities 10,255 (626) (4,069)
Net cash inflow (outflow) 4,420 5,797 23,126
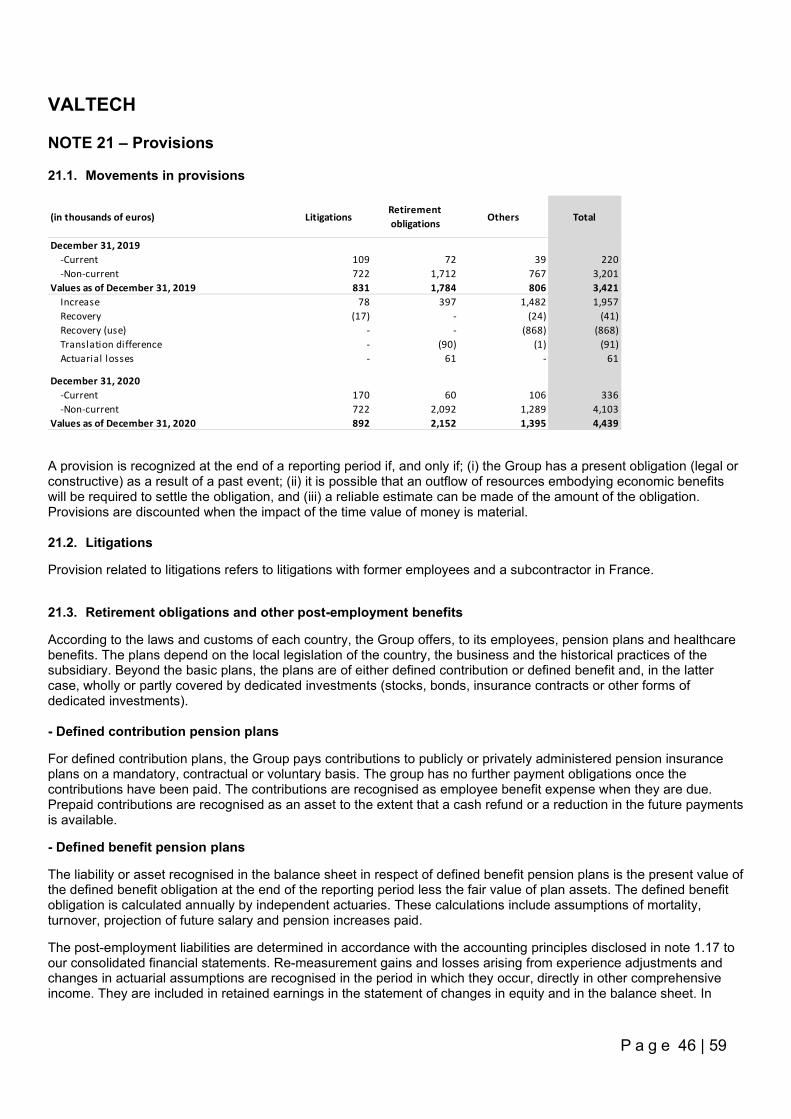
VALTECH
P a g e 46 | 59
NOTE 21 – Provisions
21.1. Movements in provisions
(in thousands of euros) LitigationsRetirement obligations Others Total
December 31, 2019-Current 109 72 39 220-Non-current 722 1,712 767 3,201
Values as of December 31, 2019 831 1,784 806 3,421Increase 78 397 1,482 1,957Recovery (17) - (24) (41)Recovery (use) - - (868) (868)Translation difference - (90) (1) (91)Actuarial losses - 61 - 61
December 31, 2020-Current 170 60 106 336-Non-current 722 2,092 1,289 4,103
Values as of December 31, 2020 892 2,152 1,395 4,439 A provision is recognized at the end of a reporting period if, and only if; (i) the Group has a present obligation (legal or constructive) as a result of a past event; (ii) it is possible that an outflow of resources embodying economic benefits will be required to settle the obligation, and (iii) a reliable estimate can be made of the amount of the obligation. Provisions are discounted when the impact of the time value of money is material. 21.2. Litigations
Provision related to litigations refers to litigations with former employees and a subcontractor in France.
21.3. Retirement obligations and other post-employment benefits
According to the laws and customs of each country, the Group offers, to its employees, pension plans and healthcare benefits. The plans depend on the local legislation of the country, the business and the historical practices of the subsidiary. Beyond the basic plans, the plans are of either defined contribution or defined benefit and, in the latter case, wholly or partly covered by dedicated investments (stocks, bonds, insurance contracts or other forms of dedicated investments). - Defined contribution pension plans
For defined contribution plans, the Group pays contributions to publicly or privately administered pension insurance plans on a mandatory, contractual or voluntary basis. The group has no further payment obligations once the contributions have been paid. The contributions are recognised as employee benefit expense when they are due. Prepaid contributions are recognised as an asset to the extent that a cash refund or a reduction in the future payments is available.
- Defined benefit pension plans
The liability or asset recognised in the balance sheet in respect of defined benefit pension plans is the present value of the defined benefit obligation at the end of the reporting period less the fair value of plan assets. The defined benefit obligation is calculated annually by independent actuaries. These calculations include assumptions of mortality, turnover, projection of future salary and pension increases paid.
The post-employment liabilities are determined in accordance with the accounting principles disclosed in note 1.17 to our consolidated financial statements. Re-measurement gains and losses arising from experience adjustments and changes in actuarial assumptions are recognised in the period in which they occur, directly in other comprehensive income. They are included in retained earnings in the statement of changes in equity and in the balance sheet. In
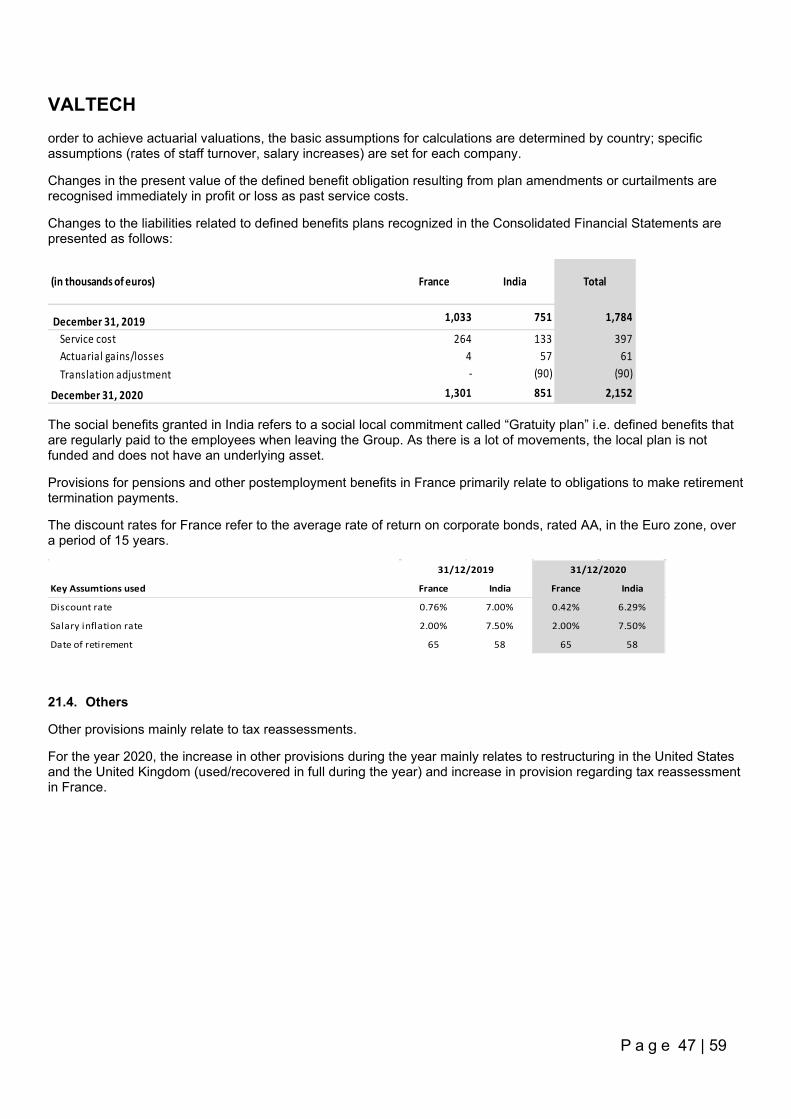
VALTECH
P a g e 47 | 59
order to achieve actuarial valuations, the basic assumptions for calculations are determined by country; specific assumptions (rates of staff turnover, salary increases) are set for each company.
Changes in the present value of the defined benefit obligation resulting from plan amendments or curtailments are recognised immediately in profit or loss as past service costs.
Changes to the liabilities related to defined benefits plans recognized in the Consolidated Financial Statements are presented as follows:
(in thousands of euros) France India Total
December 31, 2019 1,033 751 1,784
Service cost 264 133 397Actuarial gains/losses 4 57 61Translation adjustment - (90) (90)
December 31, 2020 1,301 851 2,152
The social benefits granted in India refers to a social local commitment called “Gratuity plan” i.e. defined benefits that are regularly paid to the employees when leaving the Group. As there is a lot of movements, the local plan is not funded and does not have an underlying asset.
Provisions for pensions and other postemployment benefits in France primarily relate to obligations to make retirement termination payments.
The discount rates for France refer to the average rate of return on corporate bonds, rated AA, in the Euro zone, over a period of 15 years.
Key Assumtions used France India France India
Discount rate 0.76% 7.00% 0.42% 6.29%
Salary inflation rate 2.00% 7.50% 2.00% 7.50%
Date of retirement 65 58 65 58
31/12/2019 31/12/2020
21.4. Others
Other provisions mainly relate to tax reassessments.
For the year 2020, the increase in other provisions during the year mainly relates to restructuring in the United States and the United Kingdom (used/recovered in full during the year) and increase in provision regarding tax reassessment in France.
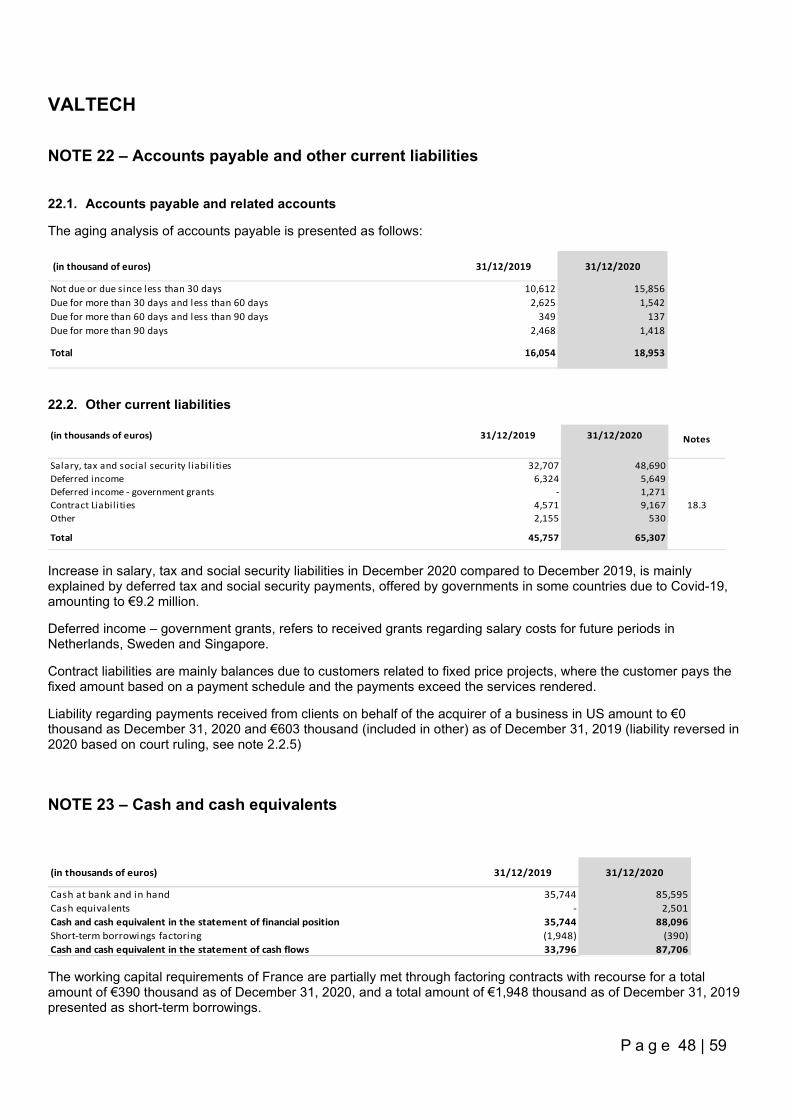
VALTECH
P a g e 48 | 59
NOTE 22 – Accounts payable and other current liabilities
22.1. Accounts payable and related accounts
The aging analysis of accounts payable is presented as follows:
(in thousand of euros) 31/12/2019 31/12/2020
Not due or due since less than 30 days 10,612 15,856Due for more than 30 days and less than 60 days 2,625 1,542Due for more than 60 days and less than 90 days 349 137Due for more than 90 days 2,468 1,418
Total 16,054 18,953
22.2. Other current liabilities
(in thousands of euros) 31/12/2019 31/12/2020 Notes
Salary, tax and social security l iabil ities 32,707 48,690Deferred income 6,324 5,649Deferred income - government grants - 1,271Contract Liabil ities 4,571 9,167 18.3Other 2,155 530
Total 45,757 65,307
Increase in salary, tax and social security liabilities in December 2020 compared to December 2019, is mainly explained by deferred tax and social security payments, offered by governments in some countries due to Covid-19, amounting to €9.2 million.
Deferred income – government grants, refers to received grants regarding salary costs for future periods in Netherlands, Sweden and Singapore.
Contract liabilities are mainly balances due to customers related to fixed price projects, where the customer pays the fixed amount based on a payment schedule and the payments exceed the services rendered.
Liability regarding payments received from clients on behalf of the acquirer of a business in US amount to €0 thousand as December 31, 2020 and €603 thousand (included in other) as of December 31, 2019 (liability reversed in 2020 based on court ruling, see note 2.2.5)
NOTE 23 – Cash and cash equivalents
(in thousands of euros) 31/12/2019 31/12/2020
Cash at bank and in hand 35,744 85,595Cash equivalents - 2,501Cash and cash equivalent in the statement of financial position 35,744 88,096Short-term borrowings factoring (1,948) (390)Cash and cash equivalent in the statement of cash flows 33,796 87,706
The working capital requirements of France are partially met through factoring contracts with recourse for a total amount of €390 thousand as of December 31, 2020, and a total amount of €1,948 thousand as of December 31, 2019 presented as short-term borrowings.
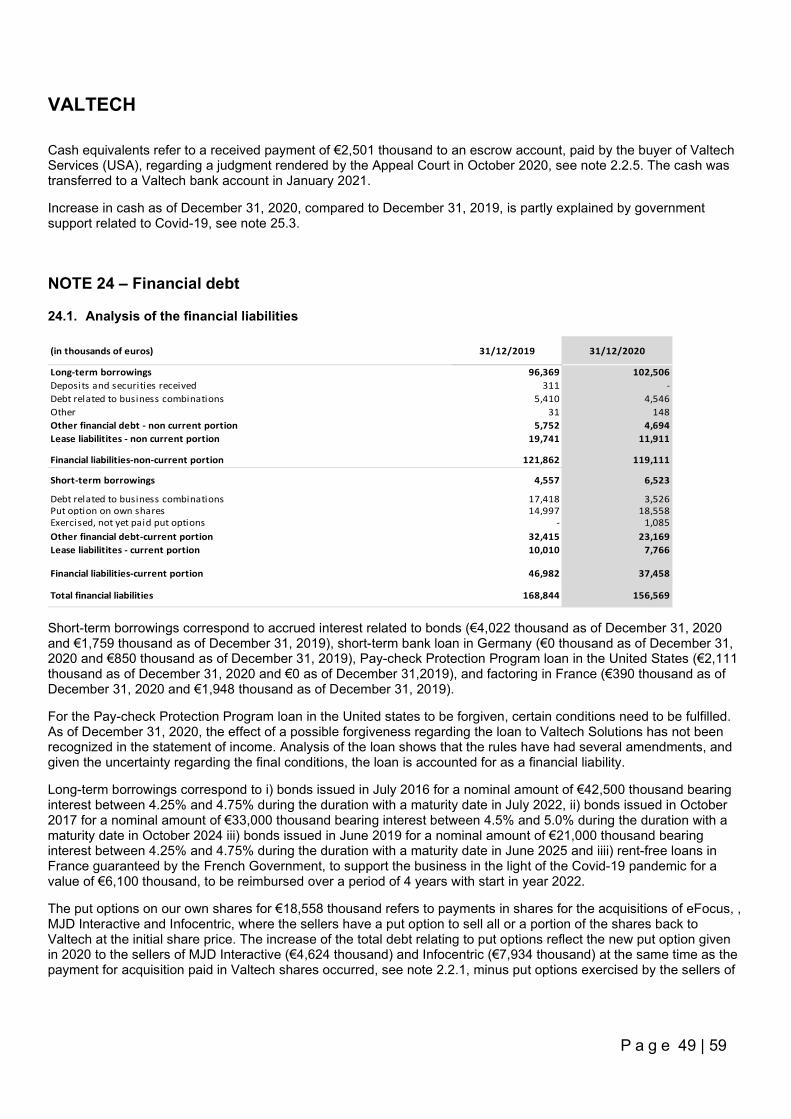
VALTECH
P a g e 49 | 59
Cash equivalents refer to a received payment of €2,501 thousand to an escrow account, paid by the buyer of Valtech Services (USA), regarding a judgment rendered by the Appeal Court in October 2020, see note 2.2.5. The cash was transferred to a Valtech bank account in January 2021.
Increase in cash as of December 31, 2020, compared to December 31, 2019, is partly explained by government support related to Covid-19, see note 25.3.
NOTE 24 – Financial debt
24.1. Analysis of the financial liabilities
(in thousands of euros) 31/12/2019 31/12/2020
Long-term borrowings 96,369 102,506Deposits and securities received 311 -Debt related to business combinations 5,410 4,546Other 31 148Other financial debt - non current portion 5,752 4,694Lease liabilitites - non current portion 19,741 11,911
Financial liabilities-non-current portion 121,862 119,111
Short-term borrowings 4,557 6,523
Debt related to business combinations 17,418 3,526Put option on own shares 14,997 18,558Exercised, not yet paid put options - 1,085Other financial debt-current portion 32,415 23,169Lease liabilitites - current portion 10,010 7,766
Financial liabilities-current portion 46,982 37,458
Total financial liabilities 168,844 156,569
Short-term borrowings correspond to accrued interest related to bonds (€4,022 thousand as of December 31, 2020 and €1,759 thousand as of December 31, 2019), short-term bank loan in Germany (€0 thousand as of December 31, 2020 and €850 thousand as of December 31, 2019), Pay-check Protection Program loan in the United States (€2,111 thousand as of December 31, 2020 and €0 as of December 31,2019), and factoring in France (€390 thousand as of December 31, 2020 and €1,948 thousand as of December 31, 2019).
For the Pay-check Protection Program loan in the United states to be forgiven, certain conditions need to be fulfilled. As of December 31, 2020, the effect of a possible forgiveness regarding the loan to Valtech Solutions has not been recognized in the statement of income. Analysis of the loan shows that the rules have had several amendments, and given the uncertainty regarding the final conditions, the loan is accounted for as a financial liability.
Long-term borrowings correspond to i) bonds issued in July 2016 for a nominal amount of €42,500 thousand bearing interest between 4.25% and 4.75% during the duration with a maturity date in July 2022, ii) bonds issued in October 2017 for a nominal amount of €33,000 thousand bearing interest between 4.5% and 5.0% during the duration with a maturity date in October 2024 iii) bonds issued in June 2019 for a nominal amount of €21,000 thousand bearing interest between 4.25% and 4.75% during the duration with a maturity date in June 2025 and iiii) rent-free loans in France guaranteed by the French Government, to support the business in the light of the Covid-19 pandemic for a value of €6,100 thousand, to be reimbursed over a period of 4 years with start in year 2022.
The put options on our own shares for €18,558 thousand refers to payments in shares for the acquisitions of eFocus, , MJD Interactive and Infocentric, where the sellers have a put option to sell all or a portion of the shares back to Valtech at the initial share price. The increase of the total debt relating to put options reflect the new put option given in 2020 to the sellers of MJD Interactive (€4,624 thousand) and Infocentric (€7,934 thousand) at the same time as the payment for acquisition paid in Valtech shares occurred, see note 2.2.1, minus put options exercised by the sellers of
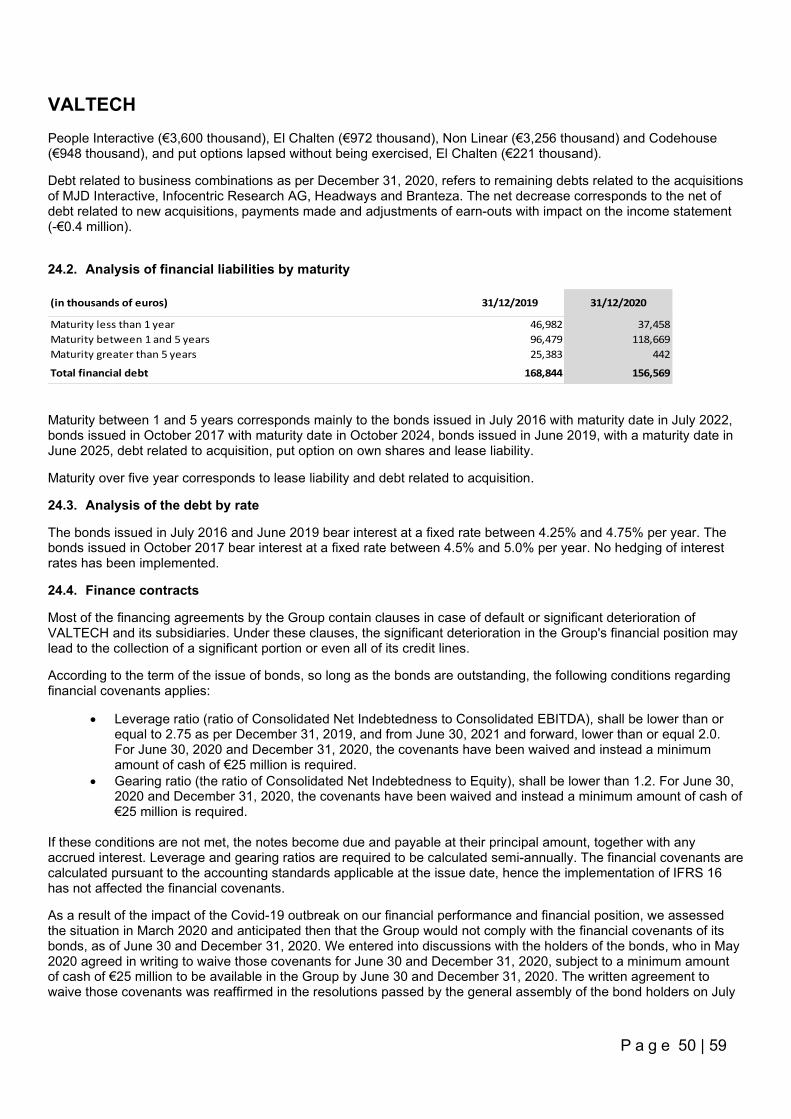
VALTECH
P a g e 50 | 59
People Interactive (€3,600 thousand), El Chalten (€972 thousand), Non Linear (€3,256 thousand) and Codehouse (€948 thousand), and put options lapsed without being exercised, El Chalten (€221 thousand).
Debt related to business combinations as per December 31, 2020, refers to remaining debts related to the acquisitions of MJD Interactive, Infocentric Research AG, Headways and Branteza. The net decrease corresponds to the net of debt related to new acquisitions, payments made and adjustments of earn-outs with impact on the income statement (-€0.4 million).
24.2. Analysis of financial liabilities by maturity
(in thousands of euros) 31/12/2019 31/12/2020
Maturity less than 1 year 46,982 37,458Maturity between 1 and 5 years 96,479 118,669Maturity greater than 5 years 25,383 442
Total financial debt 168,844 156,569
Maturity between 1 and 5 years corresponds mainly to the bonds issued in July 2016 with maturity date in July 2022, bonds issued in October 2017 with maturity date in October 2024, bonds issued in June 2019, with a maturity date in June 2025, debt related to acquisition, put option on own shares and lease liability.
Maturity over five year corresponds to lease liability and debt related to acquisition.
24.3. Analysis of the debt by rate
The bonds issued in July 2016 and June 2019 bear interest at a fixed rate between 4.25% and 4.75% per year. The bonds issued in October 2017 bear interest at a fixed rate between 4.5% and 5.0% per year. No hedging of interest rates has been implemented.
24.4. Finance contracts
Most of the financing agreements by the Group contain clauses in case of default or significant deterioration of VALTECH and its subsidiaries. Under these clauses, the significant deterioration in the Group's financial position may lead to the collection of a significant portion or even all of its credit lines.
According to the term of the issue of bonds, so long as the bonds are outstanding, the following conditions regarding financial covenants applies:
• Leverage ratio (ratio of Consolidated Net Indebtedness to Consolidated EBITDA), shall be lower than or equal to 2.75 as per December 31, 2019, and from June 30, 2021 and forward, lower than or equal 2.0. For June 30, 2020 and December 31, 2020, the covenants have been waived and instead a minimum amount of cash of €25 million is required.
• Gearing ratio (the ratio of Consolidated Net Indebtedness to Equity), shall be lower than 1.2. For June 30, 2020 and December 31, 2020, the covenants have been waived and instead a minimum amount of cash of €25 million is required.
If these conditions are not met, the notes become due and payable at their principal amount, together with any accrued interest. Leverage and gearing ratios are required to be calculated semi-annually. The financial covenants are calculated pursuant to the accounting standards applicable at the issue date, hence the implementation of IFRS 16 has not affected the financial covenants.
As a result of the impact of the Covid-19 outbreak on our financial performance and financial position, we assessed the situation in March 2020 and anticipated then that the Group would not comply with the financial covenants of its bonds, as of June 30 and December 31, 2020. We entered into discussions with the holders of the bonds, who in May 2020 agreed in writing to waive those covenants for June 30 and December 31, 2020, subject to a minimum amount of cash of €25 million to be available in the Group by June 30 and December 31, 2020. The written agreement to waive those covenants was reaffirmed in the resolutions passed by the general assembly of the bond holders on July
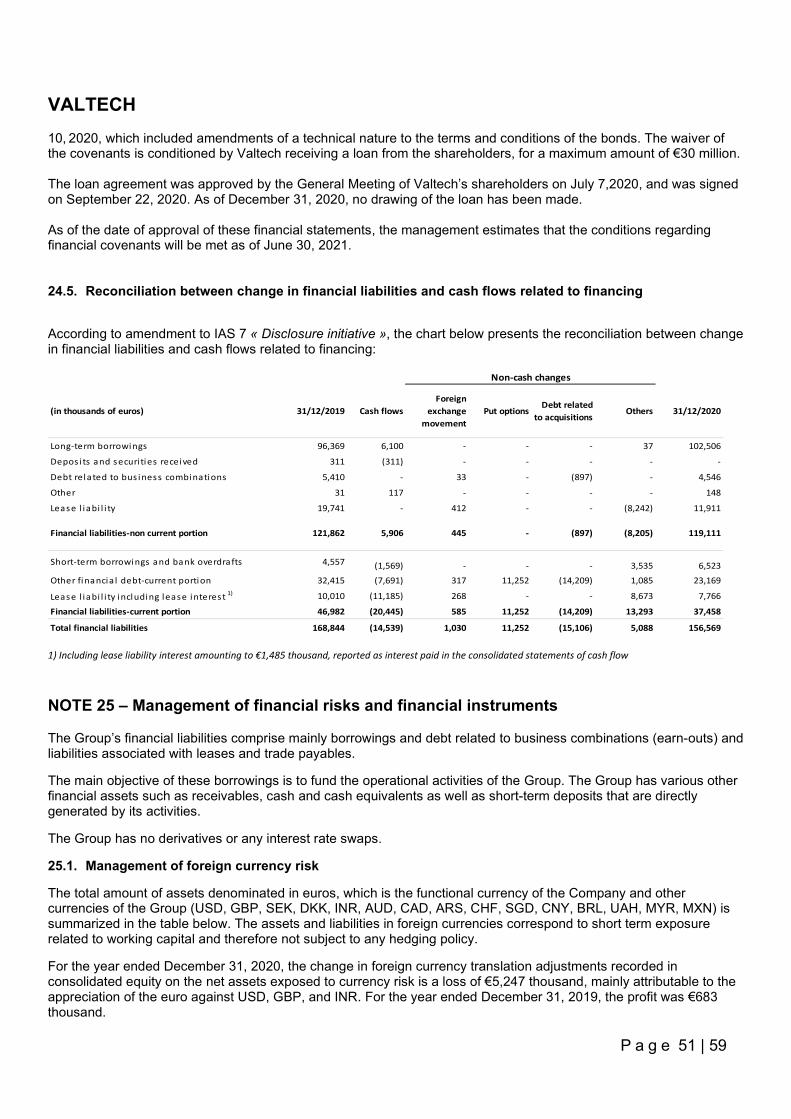
VALTECH
P a g e 51 | 59
10, 2020, which included amendments of a technical nature to the terms and conditions of the bonds. The waiver of the covenants is conditioned by Valtech receiving a loan from the shareholders, for a maximum amount of €30 million. The loan agreement was approved by the General Meeting of Valtech’s shareholders on July 7,2020, and was signed on September 22, 2020. As of December 31, 2020, no drawing of the loan has been made. As of the date of approval of these financial statements, the management estimates that the conditions regarding financial covenants will be met as of June 30, 2021. 24.5. Reconciliation between change in financial liabilities and cash flows related to financing
According to amendment to IAS 7 « Disclosure initiative », the chart below presents the reconciliation between change in financial liabilities and cash flows related to financing:
(in thousands of euros) 31/12/2019 Cash flowsForeign
exchange movement
Put optionsDebt related
to acquisitionsOthers 31/12/2020
Long-term borrowings 96,369 6,100 - - - 37 102,506
Depos i ts and securi ties received 311 (311) - - - - -
Debt related to bus iness combinations 5,410 - 33 - (897) - 4,546
Other 31 117 - - - - 148
Lease l iabi l i ty 19,741 - 412 - - (8,242) 11,911
Financial liabilities-non current portion 121,862 5,906 445 - (897) (8,205) 119,111
Short-term borrowings and bank overdrafts 4,557 (1,569) - - - 3,535 6,523
Other financia l debt-current portion 32,415 (7,691) 317 11,252 (14,209) 1,085 23,169
Lease l iabi l i ty including lease interest 1) 10,010 (11,185) 268 - - 8,673 7,766
Financial liabilities-current portion 46,982 (20,445) 585 11,252 (14,209) 13,293 37,458
Total financial liabilities 168,844 (14,539) 1,030 11,252 (15,106) 5,088 156,569
Non-cash changes
1) Including lease liability interest amounting to €1,485 thousand, reported as interest paid in the consolidated statements of cash flow
NOTE 25 – Management of financial risks and financial instruments
The Group’s financial liabilities comprise mainly borrowings and debt related to business combinations (earn-outs) and liabilities associated with leases and trade payables.
The main objective of these borrowings is to fund the operational activities of the Group. The Group has various other financial assets such as receivables, cash and cash equivalents as well as short-term deposits that are directly generated by its activities.
The Group has no derivatives or any interest rate swaps.
25.1. Management of foreign currency risk
The total amount of assets denominated in euros, which is the functional currency of the Company and other currencies of the Group (USD, GBP, SEK, DKK, INR, AUD, CAD, ARS, CHF, SGD, CNY, BRL, UAH, MYR, MXN) is summarized in the table below. The assets and liabilities in foreign currencies correspond to short term exposure related to working capital and therefore not subject to any hedging policy.
For the year ended December 31, 2020, the change in foreign currency translation adjustments recorded in consolidated equity on the net assets exposed to currency risk is a loss of €5,247 thousand, mainly attributable to the appreciation of the euro against USD, GBP, and INR. For the year ended December 31, 2019, the profit was €683 thousand.
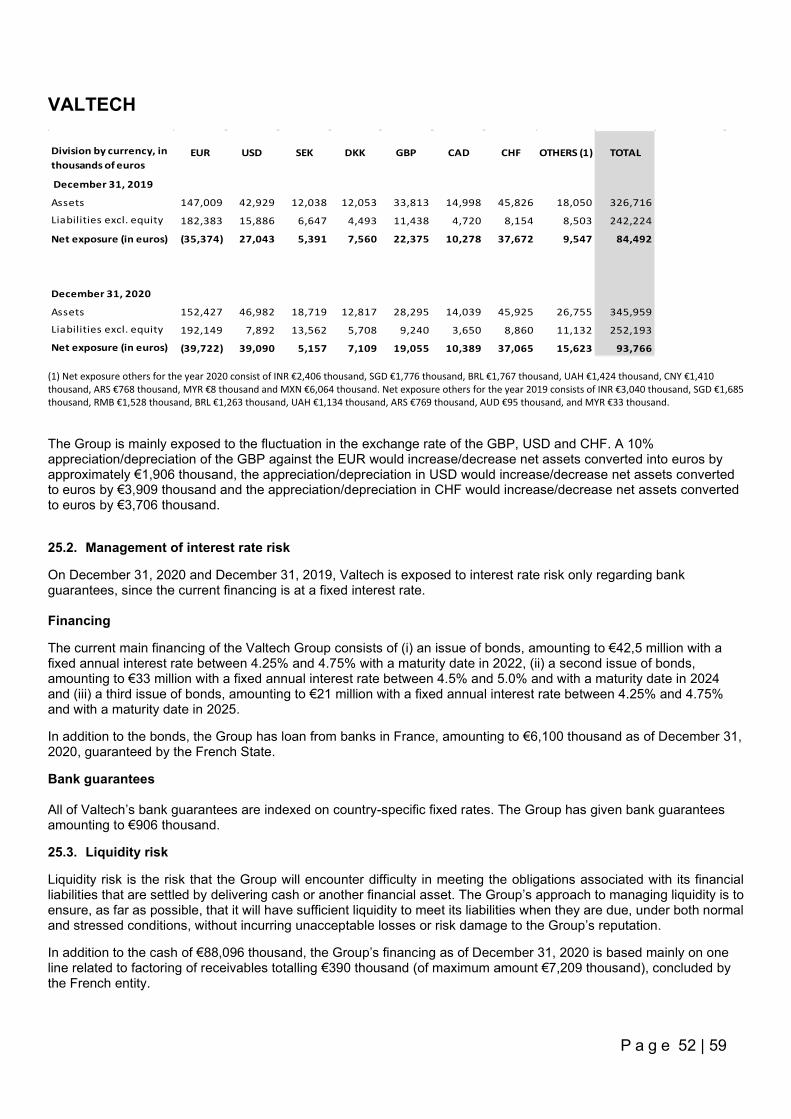
VALTECH
P a g e 52 | 59
Division by currency, in thousands of euros
EUR USD SEK DKK GBP CAD CHF OTHERS (1) TOTAL
December 31, 2019
Assets 147,009 42,929 12,038 12,053 33,813 14,998 45,826 18,050 326,716
Liabilities excl. equity 182,383 15,886 6,647 4,493 11,438 4,720 8,154 8,503 242,224
Net exposure (in euros) (35,374) 27,043 5,391 7,560 22,375 10,278 37,672 9,547 84,492
December 31, 2020
Assets 152,427 46,982 18,719 12,817 28,295 14,039 45,925 26,755 345,959
Liabilities excl. equity 192,149 7,892 13,562 5,708 9,240 3,650 8,860 11,132 252,193
Net exposure (in euros) (39,722) 39,090 5,157 7,109 19,055 10,389 37,065 15,623 93,766 (1) Net exposure others for the year 2020 consist of INR €2,406 thousand, SGD €1,776 thousand, BRL €1,767 thousand, UAH €1,424 thousand, CNY €1,410 thousand, ARS €768 thousand, MYR €8 thousand and MXN €6,064 thousand. Net exposure others for the year 2019 consists of INR €3,040 thousand, SGD €1,685 thousand, RMB €1,528 thousand, BRL €1,263 thousand, UAH €1,134 thousand, ARS €769 thousand, AUD €95 thousand, and MYR €33 thousand.
The Group is mainly exposed to the fluctuation in the exchange rate of the GBP, USD and CHF. A 10% appreciation/depreciation of the GBP against the EUR would increase/decrease net assets converted into euros by approximately €1,906 thousand, the appreciation/depreciation in USD would increase/decrease net assets converted to euros by €3,909 thousand and the appreciation/depreciation in CHF would increase/decrease net assets converted to euros by €3,706 thousand.
25.2. Management of interest rate risk
On December 31, 2020 and December 31, 2019, Valtech is exposed to interest rate risk only regarding bank guarantees, since the current financing is at a fixed interest rate. Financing
The current main financing of the Valtech Group consists of (i) an issue of bonds, amounting to €42,5 million with a fixed annual interest rate between 4.25% and 4.75% with a maturity date in 2022, (ii) a second issue of bonds, amounting to €33 million with a fixed annual interest rate between 4.5% and 5.0% and with a maturity date in 2024 and (iii) a third issue of bonds, amounting to €21 million with a fixed annual interest rate between 4.25% and 4.75% and with a maturity date in 2025.
In addition to the bonds, the Group has loan from banks in France, amounting to €6,100 thousand as of December 31, 2020, guaranteed by the French State.
Bank guarantees All of Valtech’s bank guarantees are indexed on country-specific fixed rates. The Group has given bank guarantees amounting to €906 thousand.
25.3. Liquidity risk
Liquidity risk is the risk that the Group will encounter difficulty in meeting the obligations associated with its financial liabilities that are settled by delivering cash or another financial asset. The Group’s approach to managing liquidity is to ensure, as far as possible, that it will have sufficient liquidity to meet its liabilities when they are due, under both normal and stressed conditions, without incurring unacceptable losses or risk damage to the Group’s reputation.
In addition to the cash of €88,096 thousand, the Group’s financing as of December 31, 2020 is based mainly on one line related to factoring of receivables totalling €390 thousand (of maximum amount €7,209 thousand), concluded by the French entity.
VALTECH
P a g e 53 | 59
As of December 31, 2020, the cash and cash equivalents has increased by €53.9 million compared to December 31, 2019. Increase in cash related to Covid-19 government supports amounts to €22.2 million, and refer to delayed payments of taxes €9.2 million, received loans granted by governments €8.2 million and received government grants related to salary costs €4.8 million.
25.4. Risk on shares and other financial investments
Valtech does not hold any marketable securities, and the Group is not exposed to the risk of share price fluctuation.
25.5 Risk related to COVID-19 pandemic
Valtech’s risk are affected by the ongoing COVID-19 pandemic and its effect on society and the economy. The risks related to Covid-19 are unpredictable and difficult to assess, but will affect the demand for our services. Actions have been taken as soon as March 2020 to mitigate the impact of the economic crisis including: applying to all government supports that are available and to which we are eligible, increasing the resources allocated to cash collections, negotiating more favourable payment terms with our largest vendors, negotiating additional credit lines and reducing costs.
As of the date of approval of these financial statements, Valtech continues to apply to existing government supports and to take a cautious approach about the preservation of a strong cash position.
Valtech continues to monitor costs very closely. Valtech initiated and took actions to permanently adjust some cost items to the consequences of COVID-19.
Valtech has set up processes to monitor the consequences of the COVID-19 pandemic on our employees, specifically where our offices have been closed for several months to comply with government regulations or to protect the health of our employees.
NOTE 26 – Share-based payments
26.1 Warrants
A policy has been implemented for the issuance of redeemable equity warrants (“warrants”) to certain employees within the Group, which, subject to the recipient paying a subscription price, represent a right to receive ordinary shares upon the payment of an exercise price. Recipients of warrants are determined in the discretion of the Board and, once a recipient is issued a warrant, he or she must pay the subscription price associated with such warrant or such warrant is forfeited.
As of December 31, 2020, the Board of Directors has authorized the issuance of warrants, which has not yet been fully exercised, as follows:
- July 12, 2013: 23,153,666 warrants
- December 5, 2014: 6,485,155 warrants
- April 21, 2015: 422,625 warrants
- April 7, 2017: 120,400 warrants
- August 23, 2018: 114,752 warrants
26.1.1. Main features of the warrants
The main features of the warrants plan existing as of December 31, 2020 are described in the table below:
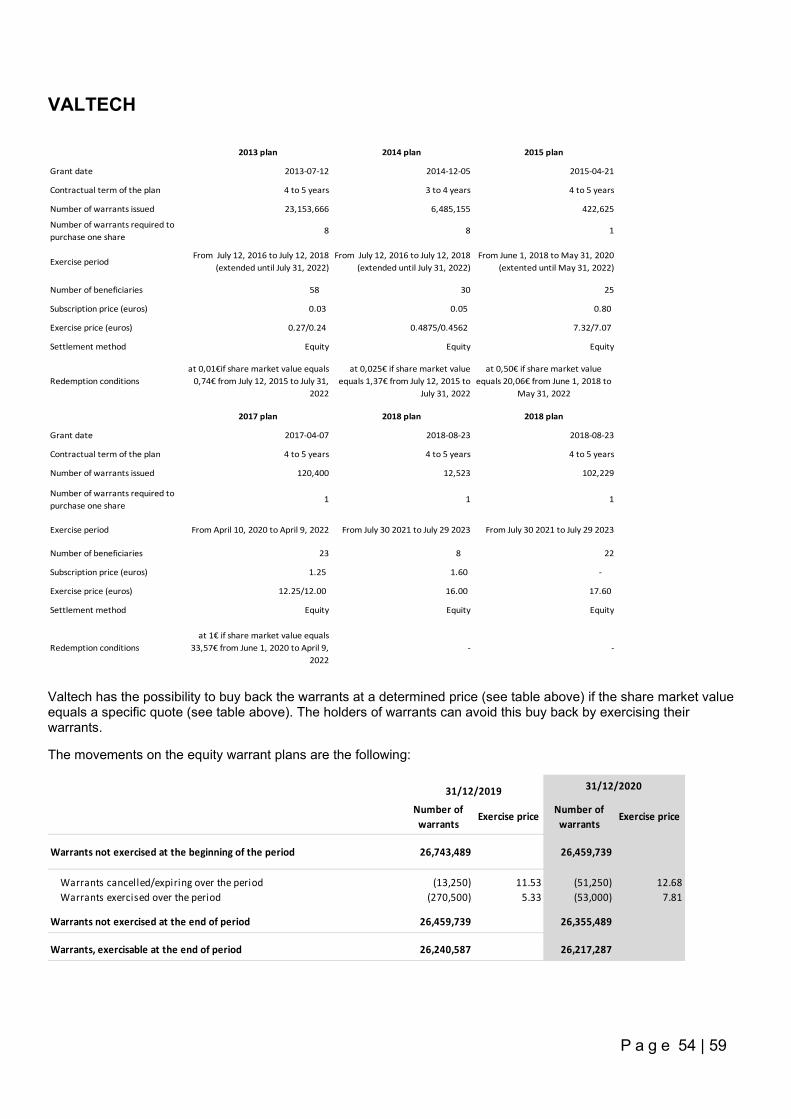
VALTECH
P a g e 54 | 59
2013 plan 2014 plan 2015 plan
Grant date 2013-07-12 2014-12-05 2015-04-21
Contractual term of the plan 4 to 5 years 3 to 4 years 4 to 5 years
Number of warrants issued 23,153,666 6,485,155 422,625
Number of warrants required to purchase one share
8 8 1
Exercise periodFrom July 12, 2016 to July 12, 2018
(extended until July 31, 2022)From July 12, 2016 to July 12, 2018
(extended until July 31, 2022)From June 1, 2018 to May 31, 2020
(extented until May 31, 2022)
Number of beneficiaries 58 30 25
Subscription price (euros) 0.03 0.05 0.80
Exercise price (euros) 0.27/0.24 0.4875/0.4562 7.32/7.07
Settlement method Equity Equity Equity
Redemption conditions at 0,01€if share market value equals
0,74€ from July 12, 2015 to July 31, 2022
at 0,025€ if share market value equals 1,37€ from July 12, 2015 to
July 31, 2022
2017 plan 2018 plan 2018 plan
Grant date 2017-04-07 2018-08-23 2018-08-23
Contractual term of the plan 4 to 5 years 4 to 5 years 4 to 5 years
Number of warrants issued 120,400 12,523 102,229
Number of warrants required to purchase one share
1 1 1
Exercise period From April 10, 2020 to April 9, 2022 From July 30 2021 to July 29 2023 From July 30 2021 to July 29 2023
Number of beneficiaries 23 8 22
Subscription price (euros) 1.25 1.60 -
Exercise price (euros) 12.25/12.00 16.00 17.60
Settlement method Equity Equity Equity
Redemption conditions at 1€ if share market value equals
33,57€ from June 1, 2020 to April 9, 2022
- -
at 0,50€ if share market value equals 20,06€ from June 1, 2018 to
May 31, 2022
Valtech has the possibility to buy back the warrants at a determined price (see table above) if the share market value equals a specific quote (see table above). The holders of warrants can avoid this buy back by exercising their warrants.
The movements on the equity warrant plans are the following:
Number of warrants
Exercise price Number of warrants
Exercise price
Warrants not exercised at the beginning of the period 26,743,489 26,459,739
Warrants cancelled/expiring over the period (13,250) 11.53 (51,250) 12.68Warrants exercised over the period (270,500) 5.33 (53,000) 7.81
Warrants not exercised at the end of period 26,459,739 26,355,489
Warrants, exercisable at the end of period 26,240,587 26,217,287
31/12/2019 31/12/2020
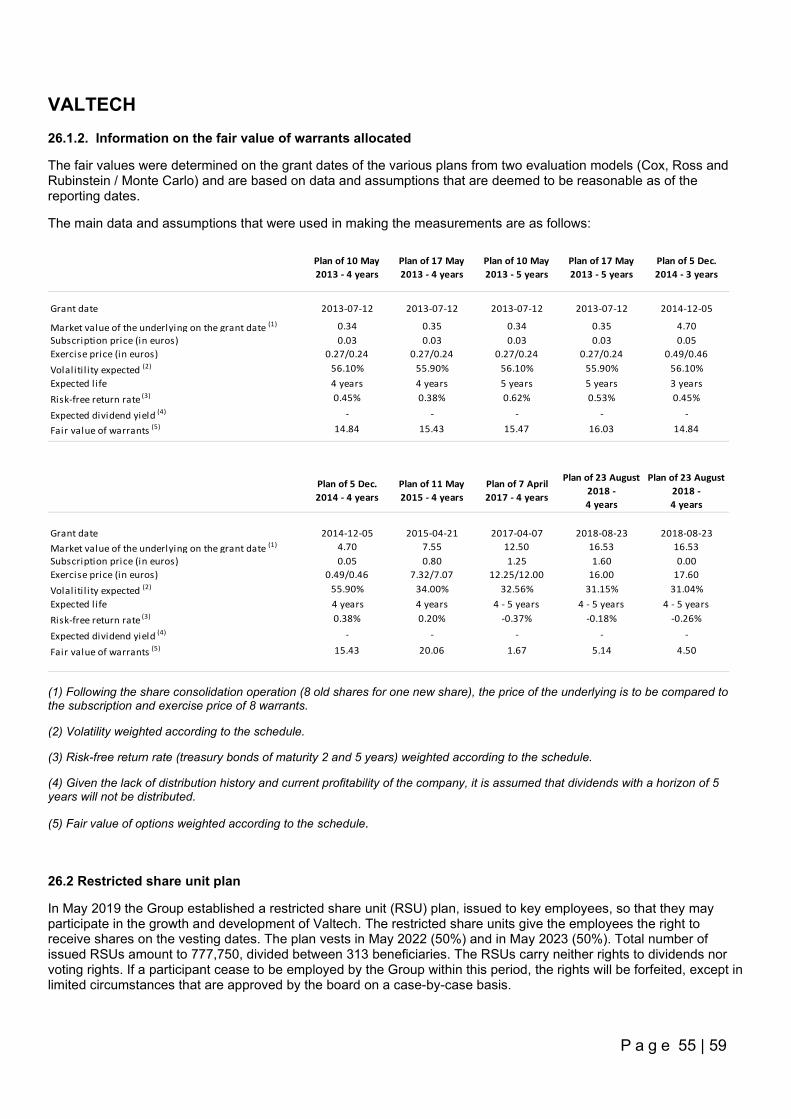
VALTECH
P a g e 55 | 59
26.1.2. Information on the fair value of warrants allocated
The fair values were determined on the grant dates of the various plans from two evaluation models (Cox, Ross and Rubinstein / Monte Carlo) and are based on data and assumptions that are deemed to be reasonable as of the reporting dates.
The main data and assumptions that were used in making the measurements are as follows:
Plan of 10 May 2013 - 4 years
Plan of 17 May 2013 - 4 years
Plan of 10 May 2013 - 5 years
Plan of 17 May 2013 - 5 years
Plan of 5 Dec. 2014 - 3 years
Grant date 2013-07-12 2013-07-12 2013-07-12 2013-07-12 2014-12-05
Market value of the underlying on the grant date (1) 0.34 0.35 0.34 0.35 4.70Subscription price (in euros) 0.03 0.03 0.03 0.03 0.05Exercise price (in euros) 0.27/0.24 0.27/0.24 0.27/0.24 0.27/0.24 0.49/0.46Volaliti l ity expected (2) 56.10% 55.90% 56.10% 55.90% 56.10%Expected l ife 4 years 4 years 5 years 5 years 3 yearsRisk-free return rate (3) 0.45% 0.38% 0.62% 0.53% 0.45%
Expected dividend yield (4) - - - - -
Fair value of warrants (5) 14.84 15.43 15.47 16.03 14.84
Plan of 5 Dec. 2014 - 4 years
Plan of 11 May 2015 - 4 years
Plan of 7 April 2017 - 4 years
Plan of 23 August 2018 - 4 years
Plan of 23 August 2018 - 4 years
Grant date 2014-12-05 2015-04-21 2017-04-07 2018-08-23 2018-08-23Market value of the underlying on the grant date (1) 4.70 7.55 12.50 16.53 16.53Subscription price (in euros) 0.05 0.80 1.25 1.60 0.00Exercise price (in euros) 0.49/0.46 7.32/7.07 12.25/12.00 16.00 17.60Volaliti l ity expected (2) 55.90% 34.00% 32.56% 31.15% 31.04%Expected l ife 4 years 4 years 4 - 5 years 4 - 5 years 4 - 5 yearsRisk-free return rate (3) 0.38% 0.20% -0.37% -0.18% -0.26%
Expected dividend yield (4) - - - - -
Fair value of warrants (5) 15.43 20.06 1.67 5.14 4.50
(1) Following the share consolidation operation (8 old shares for one new share), the price of the underlying is to be compared to the subscription and exercise price of 8 warrants.
(2) Volatility weighted according to the schedule.
(3) Risk-free return rate (treasury bonds of maturity 2 and 5 years) weighted according to the schedule.
(4) Given the lack of distribution history and current profitability of the company, it is assumed that dividends with a horizon of 5 years will not be distributed.
(5) Fair value of options weighted according to the schedule.
26.2 Restricted share unit plan
In May 2019 the Group established a restricted share unit (RSU) plan, issued to key employees, so that they may participate in the growth and development of Valtech. The restricted share units give the employees the right to receive shares on the vesting dates. The plan vests in May 2022 (50%) and in May 2023 (50%). Total number of issued RSUs amount to 777,750, divided between 313 beneficiaries. The RSUs carry neither rights to dividends nor voting rights. If a participant cease to be employed by the Group within this period, the rights will be forfeited, except in limited circumstances that are approved by the board on a case-by-case basis.
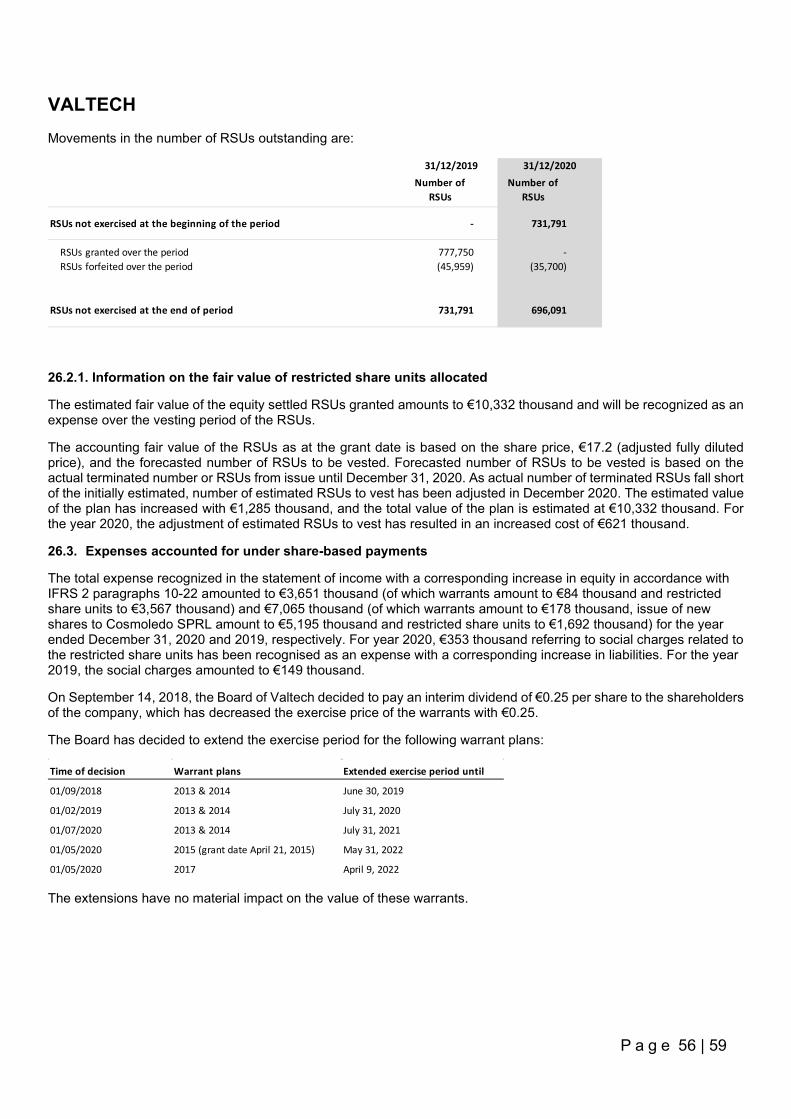
VALTECH
P a g e 56 | 59
Movements in the number of RSUs outstanding are:
Number of RSUs
Number of RSUs
RSUs not exercised at the beginning of the period - 731,791
RSUs granted over the period 777,750 -RSUs forfeited over the period (45,959) (35,700)
RSUs not exercised at the end of period 731,791 696,091
31/12/2019 31/12/2020
26.2.1. Information on the fair value of restricted share units allocated
The estimated fair value of the equity settled RSUs granted amounts to €10,332 thousand and will be recognized as an expense over the vesting period of the RSUs.
The accounting fair value of the RSUs as at the grant date is based on the share price, €17.2 (adjusted fully diluted price), and the forecasted number of RSUs to be vested. Forecasted number of RSUs to be vested is based on the actual terminated number or RSUs from issue until December 31, 2020. As actual number of terminated RSUs fall short of the initially estimated, number of estimated RSUs to vest has been adjusted in December 2020. The estimated value of the plan has increased with €1,285 thousand, and the total value of the plan is estimated at €10,332 thousand. For the year 2020, the adjustment of estimated RSUs to vest has resulted in an increased cost of €621 thousand.
26.3. Expenses accounted for under share-based payments
The total expense recognized in the statement of income with a corresponding increase in equity in accordance with IFRS 2 paragraphs 10-22 amounted to €3,651 thousand (of which warrants amount to €84 thousand and restricted share units to €3,567 thousand) and €7,065 thousand (of which warrants amount to €178 thousand, issue of new shares to Cosmoledo SPRL amount to €5,195 thousand and restricted share units to €1,692 thousand) for the year ended December 31, 2020 and 2019, respectively. For year 2020, €353 thousand referring to social charges related to the restricted share units has been recognised as an expense with a corresponding increase in liabilities. For the year 2019, the social charges amounted to €149 thousand.
On September 14, 2018, the Board of Valtech decided to pay an interim dividend of €0.25 per share to the shareholders of the company, which has decreased the exercise price of the warrants with €0.25.
The Board has decided to extend the exercise period for the following warrant plans:
Time of decision Warrant plans Extended exercise period until
01/09/2018 2013 & 2014 June 30, 2019
01/02/2019 2013 & 2014 July 31, 2020
01/07/2020 2013 & 2014 July 31, 2021
01/05/2020 2015 (grant date April 21, 2015) May 31, 2022
01/05/2020 2017 April 9, 2022
The extensions have no material impact on the value of these warrants.
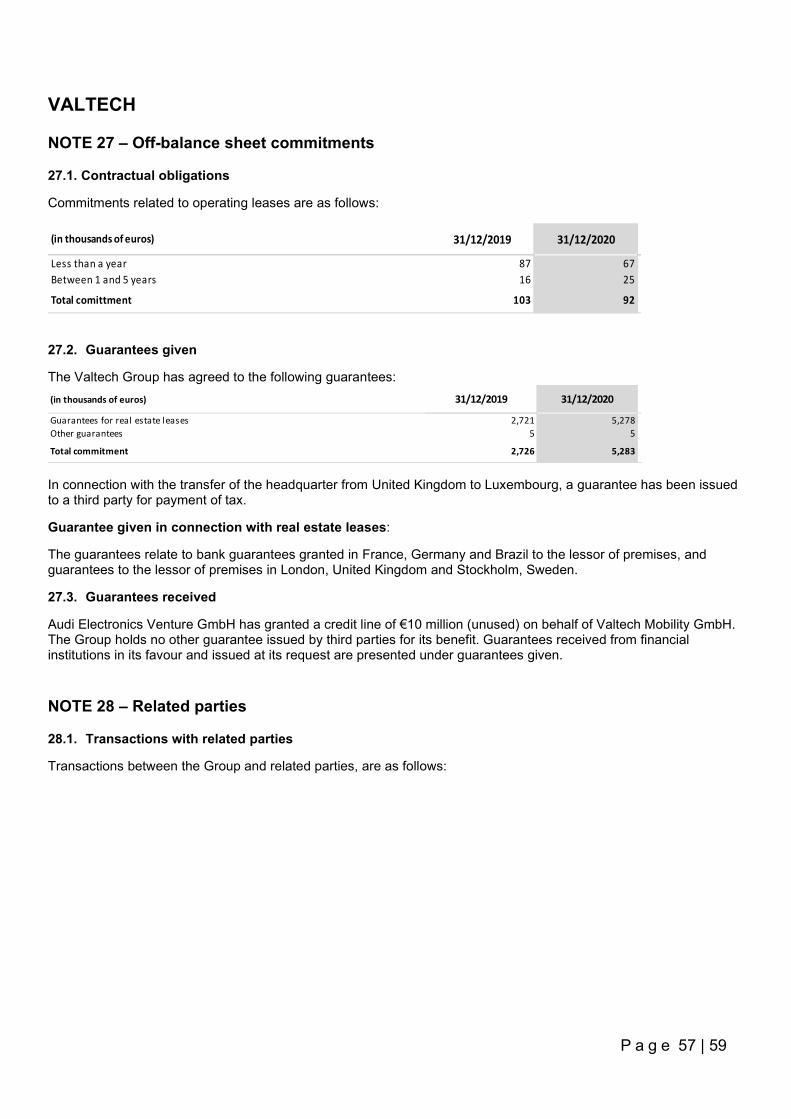
VALTECH
P a g e 57 | 59
NOTE 27 – Off-balance sheet commitments
27.1. Contractual obligations
Commitments related to operating leases are as follows:
(in thousands of euros) 31/12/2019 31/12/2020
Less than a year 87 67Between 1 and 5 years 16 25
Total comittment 103 92
27.2. Guarantees given
The Valtech Group has agreed to the following guarantees: (in thousands of euros) 31/12/2019 31/12/2020
Guarantees for real estate leases 2,721 5,278Other guarantees 5 5
Total commitment 2,726 5,283
In connection with the transfer of the headquarter from United Kingdom to Luxembourg, a guarantee has been issued to a third party for payment of tax.
Guarantee given in connection with real estate leases:
The guarantees relate to bank guarantees granted in France, Germany and Brazil to the lessor of premises, and guarantees to the lessor of premises in London, United Kingdom and Stockholm, Sweden.
27.3. Guarantees received
Audi Electronics Venture GmbH has granted a credit line of €10 million (unused) on behalf of Valtech Mobility GmbH. The Group holds no other guarantee issued by third parties for its benefit. Guarantees received from financial institutions in its favour and issued at its request are presented under guarantees given.
NOTE 28 – Related parties
28.1. Transactions with related parties
Transactions between the Group and related parties, are as follows:
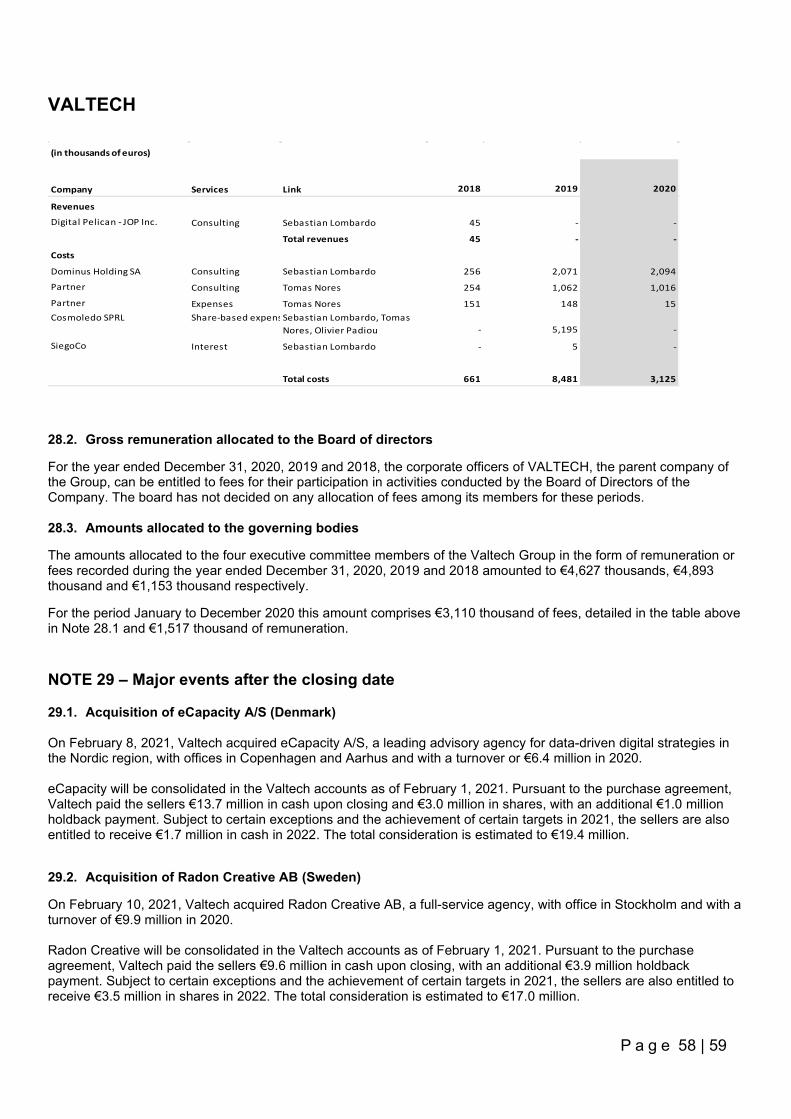
VALTECH
P a g e 58 | 59
(in thousands of euros)
Company Services Link 2018 2019 2020
Revenues
Digital Pelican - JOP Inc. Consulting Sebastian Lombardo 45 - -
Total revenues 45 - -
Costs
Dominus Holding SA Consulting Sebastian Lombardo 256 2,071 2,094 Partner Consulting Tomas Nores 254 1,062 1,016 g Partner Expenses Tomas Nores 151 148 15Cosmoledo SPRL Share-based expensSebastian Lombardo, Tomas
Nores, Olivier Padiou - 5,195 -
SiegoCo Interest Sebastian Lombardo - 5 -
Total costs 661 8,481 3,125
28.2. Gross remuneration allocated to the Board of directors
For the year ended December 31, 2020, 2019 and 2018, the corporate officers of VALTECH, the parent company of the Group, can be entitled to fees for their participation in activities conducted by the Board of Directors of the Company. The board has not decided on any allocation of fees among its members for these periods. 28.3. Amounts allocated to the governing bodies
The amounts allocated to the four executive committee members of the Valtech Group in the form of remuneration or fees recorded during the year ended December 31, 2020, 2019 and 2018 amounted to €4,627 thousands, €4,893 thousand and €1,153 thousand respectively.
For the period January to December 2020 this amount comprises €3,110 thousand of fees, detailed in the table above in Note 28.1 and €1,517 thousand of remuneration.
NOTE 29 – Major events after the closing date
29.1. Acquisition of eCapacity A/S (Denmark) On February 8, 2021, Valtech acquired eCapacity A/S, a leading advisory agency for data-driven digital strategies in the Nordic region, with offices in Copenhagen and Aarhus and with a turnover or €6.4 million in 2020. eCapacity will be consolidated in the Valtech accounts as of February 1, 2021. Pursuant to the purchase agreement, Valtech paid the sellers €13.7 million in cash upon closing and €3.0 million in shares, with an additional €1.0 million holdback payment. Subject to certain exceptions and the achievement of certain targets in 2021, the sellers are also entitled to receive €1.7 million in cash in 2022. The total consideration is estimated to €19.4 million.
29.2. Acquisition of Radon Creative AB (Sweden)
On February 10, 2021, Valtech acquired Radon Creative AB, a full-service agency, with office in Stockholm and with a turnover of €9.9 million in 2020. Radon Creative will be consolidated in the Valtech accounts as of February 1, 2021. Pursuant to the purchase agreement, Valtech paid the sellers €9.6 million in cash upon closing, with an additional €3.9 million holdback payment. Subject to certain exceptions and the achievement of certain targets in 2021, the sellers are also entitled to receive €3.5 million in shares in 2022. The total consideration is estimated to €17.0 million.
VALTECH
P a g e 59 | 59
29.3. Acquisition of Codeflair Group (Switzerland and North Macedonia)
On March 30, 2021, Valtech acquired Codeflair Group, a Swiss company with a subsidiary in North Macedonia and with a turnover of €1.9 million in 2020. Codeflair will be consolidated in the Valtech accounts as of April 1, 2021. Pursuant to the purchase agreement, Valtech paid the sellers €2.2 million in cash upon closing, with an additional €0.8 million payment in shares to be paid in April 2021. 29.4. Approval of restricted share unit plan
On March 25, 2021, the Board of Valtech, on behalf on the shareholders, approved a restricted share unit (RSU) plan, issued to key employees. Total number of issued RSUs amount to 268.334, divided between 7 beneficiaries. The restricted share units give the employees the right to receive shares on the vesting dates. The plan vests between June 30, 2021 and June 30, 2022.