biology - gce guide
TRANSCRIPT
Cambridge International General Certificate of Secondary Education 0610 Biology June 2010
Principal Examiner Report for Teachers
© UCLES 2010
BIOLOGY
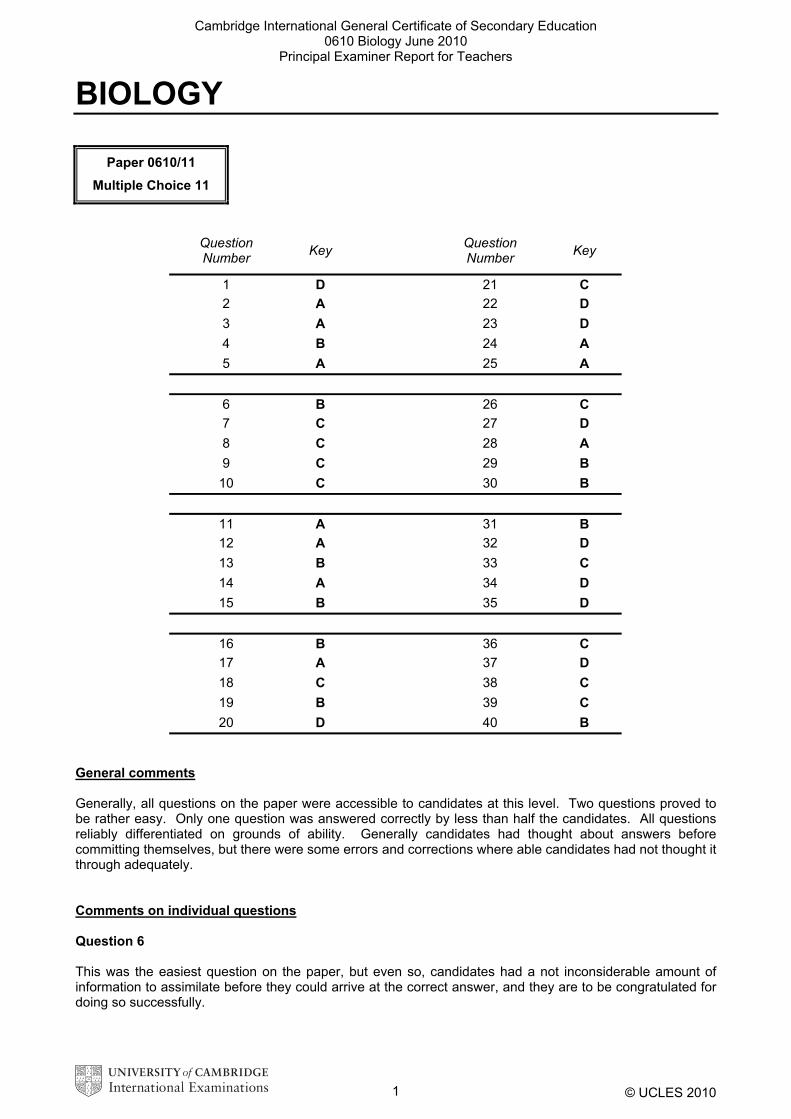
Paper 0610/11 Multiple Choice 11
Question Number Key Question
Number Key
1 D 21 C 2 A 22 D 3 A 23 D 4 B 24 A 5 A 25 A
6 B 26 C 7 C 27 D 8 C 28 A 9 C 29 B 10 C 30 B
11 A 31 B 12 A 32 D 13 B 33 C 14 A 34 D 15 B 35 D
16 B 36 C 17 A 37 D 18 C 38 C 19 B 39 C 20 D 40 B
General comments Generally, all questions on the paper were accessible to candidates at this level. Two questions proved to be rather easy. Only one question was answered correctly by less than half the candidates. All questions reliably differentiated on grounds of ability. Generally candidates had thought about answers before committing themselves, but there were some errors and corrections where able candidates had not thought it through adequately. Comments on individual questions Question 6 This was the easiest question on the paper, but even so, candidates had a not inconsiderable amount of information to assimilate before they could arrive at the correct answer, and they are to be congratulated for doing so successfully.
1
Cambridge International General Certificate of Secondary Education 0610 Biology June 2010
Principal Examiner Report for Teachers
© UCLES 2010
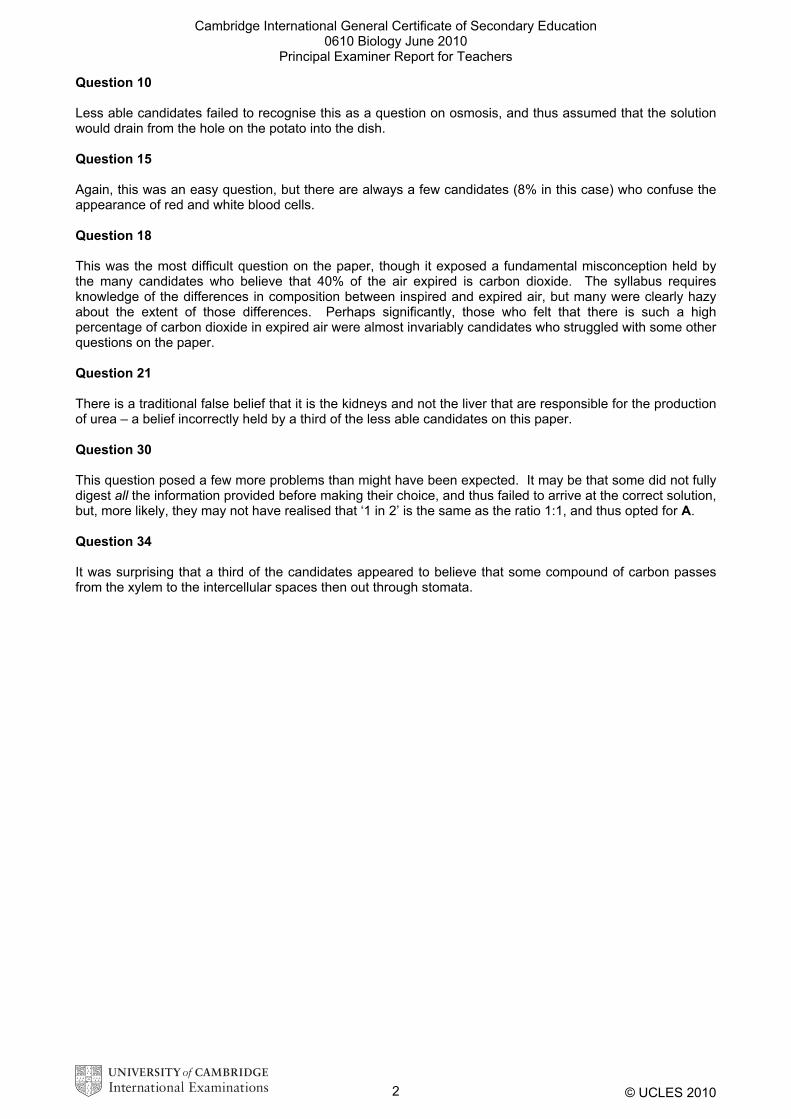
Question 10 Less able candidates failed to recognise this as a question on osmosis, and thus assumed that the solution would drain from the hole on the potato into the dish. Question 15 Again, this was an easy question, but there are always a few candidates (8% in this case) who confuse the appearance of red and white blood cells. Question 18 This was the most difficult question on the paper, though it exposed a fundamental misconception held by the many candidates who believe that 40% of the air expired is carbon dioxide. The syllabus requires knowledge of the differences in composition between inspired and expired air, but many were clearly hazy about the extent of those differences. Perhaps significantly, those who felt that there is such a high percentage of carbon dioxide in expired air were almost invariably candidates who struggled with some other questions on the paper. Question 21 There is a traditional false belief that it is the kidneys and not the liver that are responsible for the production of urea – a belief incorrectly held by a third of the less able candidates on this paper. Question 30 This question posed a few more problems than might have been expected. It may be that some did not fully digest all the information provided before making their choice, and thus failed to arrive at the correct solution, but, more likely, they may not have realised that ‘1 in 2’ is the same as the ratio 1:1, and thus opted for A. Question 34 It was surprising that a third of the candidates appeared to believe that some compound of carbon passes from the xylem to the intercellular spaces then out through stomata.
2

Cambridge International General Certificate of Secondary Education 0610 Biology June 2010
Principal Examiner Report for Teachers
© UCLES 2010
BIOLOGY
Paper 0610/12 Multiple Choice 12
Question Number Key Question
Number Key
1 A 21 D 2 B 22 D 3 B 23 A 4 C 24 C 5 D 25 B
6 A 26 A 7 C 27 A 8 A 28 C 9 B 29 D 10 C 30 D
11 C 31 C 12 A 32 C 13 A 33 B 14 A 34 C 15 A 35 C
16 B 36 D 17 D 37 D 18 B 38 B 19 C 39 B 20 B 40 D
General comments Generally, all questions on the paper were accessible to candidates at this level. Two questions proved to be rather easy. Only one question was answered correctly by less than half the candidates. All questions reliably differentiated on grounds of ability. Generally candidates had thought about answers before committing themselves, but there were some errors and corrections where able candidates had not thought it through adequately. Comments on individual questions Question 3 This was the easiest question on the paper, but even so, candidates had a not inconsiderable amount of information to assimilate before they could arrive at the correct answer, and they are to be congratulated for doing so successfully.
3
Cambridge International General Certificate of Secondary Education 0610 Biology June 2010
Principal Examiner Report for Teachers
© UCLES 2010
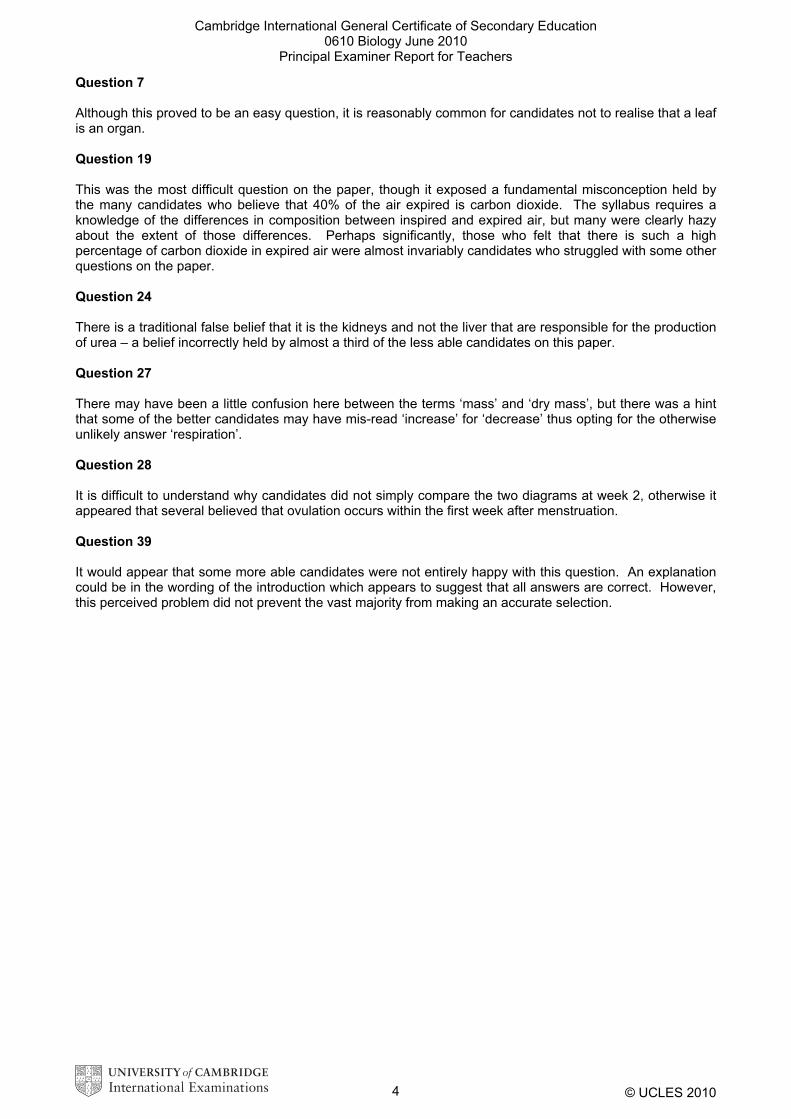
Question 7 Although this proved to be an easy question, it is reasonably common for candidates not to realise that a leaf is an organ. Question 19 This was the most difficult question on the paper, though it exposed a fundamental misconception held by the many candidates who believe that 40% of the air expired is carbon dioxide. The syllabus requires a knowledge of the differences in composition between inspired and expired air, but many were clearly hazy about the extent of those differences. Perhaps significantly, those who felt that there is such a high percentage of carbon dioxide in expired air were almost invariably candidates who struggled with some other questions on the paper. Question 24 There is a traditional false belief that it is the kidneys and not the liver that are responsible for the production of urea – a belief incorrectly held by almost a third of the less able candidates on this paper. Question 27 There may have been a little confusion here between the terms ‘mass’ and ‘dry mass’, but there was a hint that some of the better candidates may have mis-read ‘increase’ for ‘decrease’ thus opting for the otherwise unlikely answer ‘respiration’. Question 28 It is difficult to understand why candidates did not simply compare the two diagrams at week 2, otherwise it appeared that several believed that ovulation occurs within the first week after menstruation. Question 39 It would appear that some more able candidates were not entirely happy with this question. An explanation could be in the wording of the introduction which appears to suggest that all answers are correct. However, this perceived problem did not prevent the vast majority from making an accurate selection.
4
Cambridge International General Certificate of Secondary Education 0610 Biology June 2010
Principal Examiner Report for Teachers
© UCLES 2010
BIOLOGY
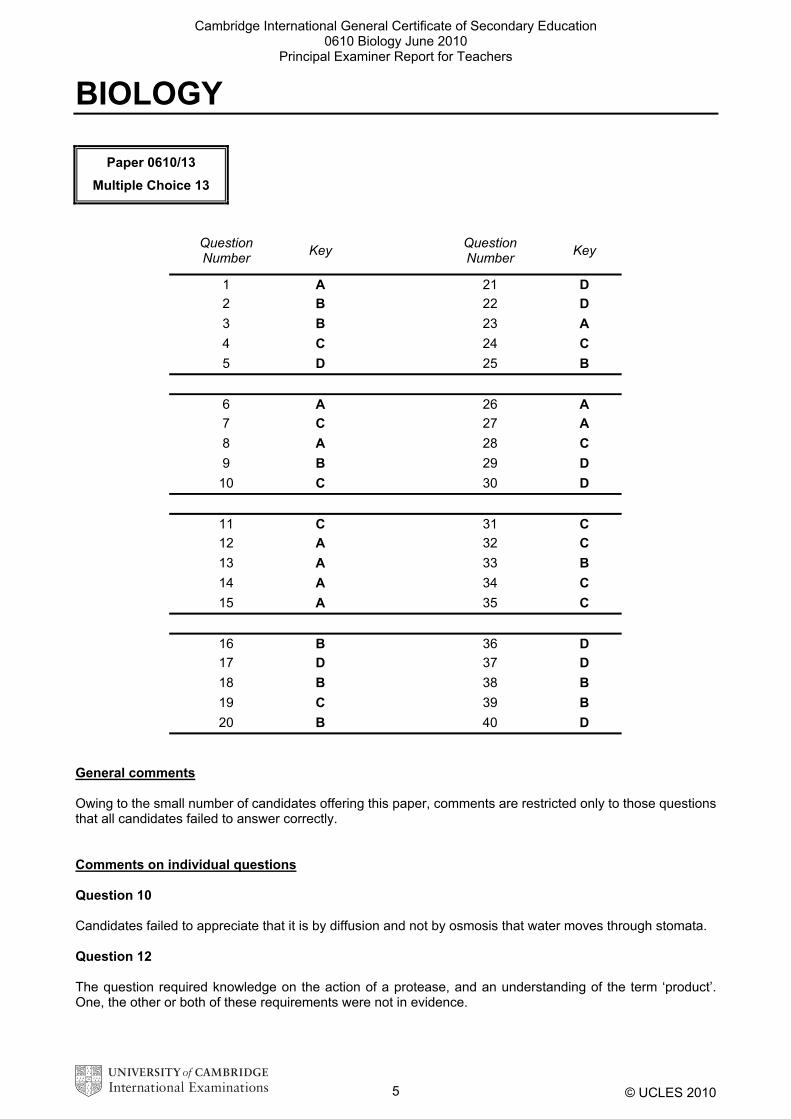
Paper 0610/13 Multiple Choice 13
Question Number Key Question
Number Key
1 A 21 D 2 B 22 D 3 B 23 A 4 C 24 C 5 D 25 B
6 A 26 A 7 C 27 A 8 A 28 C 9 B 29 D 10 C 30 D
11 C 31 C 12 A 32 C 13 A 33 B 14 A 34 C 15 A 35 C
16 B 36 D 17 D 37 D 18 B 38 B 19 C 39 B 20 B 40 D
General comments Owing to the small number of candidates offering this paper, comments are restricted only to those questions that all candidates failed to answer correctly. Comments on individual questions Question 10 Candidates failed to appreciate that it is by diffusion and not by osmosis that water moves through stomata. Question 12 The question required knowledge on the action of a protease, and an understanding of the term ‘product’. One, the other or both of these requirements were not in evidence.
5
Cambridge International General Certificate of Secondary Education 0610 Biology June 2010
Principal Examiner Report for Teachers
© UCLES 2010
Question 13 Candidates often fail accurately to learn the details surrounding the two vitamins named in the syllabus. Such was the case with this relatively straightforward question. Question 15 Although slightly complicated at first sight, this question required knowledge of the function of phloem which candidates confused with that of xylem. Question 19 This question became largely a matter of guesswork if the candidates’ knowledge of the difference in composition between inspired and expired air did not include any quantitative detail. Question 32 Osmosis was already identified as a hazy area (Question 10) but candidates showed consistency in believing that it is involved in water loss rather than in water uptake.
6
Cambridge International General Certificate of Secondary Education 0610 Biology June 2010
Principal Examiner Report for Teachers
© UCLES 2010
BIOLOGY
Paper 0610/21 Core Theory 21
General comments As commented upon in previous years there were a significant number of candidates who failed to attempt all parts of all questions. As in the preceding sessions, this did not appear to be linked to insufficient time to complete the paper but to candidates who appeared inadequately prepared for the demands of the questions. As is usual, there were some candidates who showed very limited knowledge and understanding of some or all topics from the syllabus. The paper proved appropriately demanding for all other candidates, although there remain a small minority of candidates entered for this paper who would clearly have gained a higher grade had they been appropriately entered for the extended paper. Responses to various sections of questions revealed again this year a variety of misconceptions and misunderstandings, which are commented on in the material on specific questions. There was evidence in a number of places, indicated in the comments below, that candidates had not read the questions carefully or thoroughly enough and thus their responses were inadequate or off the point. This was especially evident in Question 4bi, Question 6bii, Question 6c, Question 6di and ii, Question 8bi and Question 9bii. Candidates should be made aware of the need to read the questions carefully and to take note of each question’s demands. Comments on specific questions Question 1 The main error in the responses to part (a) was that candidates identified, often erroneously, cells A and B instead of stating where they would normally be found. This suggests that the question was not read carefully enough. Those candidates who attempted the question correctly often just stated that they were present in humans and plants, this information being part of the question itself. Many named organs of the body for cell A, and although blood does occur in all organs this was an inadequate answer. Similarly offering the stem as a response for cell B was also considered inadequate as most stems are woody and lack such cells. In part (b) many candidates were able to assign the correct words to the sentences but common errors were to suggest that the vacuole was either full of air or full of starch. A significant number of candidates did not label an organ on Fig. 1.2 in part (c) but very many did appreciate the differences in form and function of organs and organ systems. Although it was not a requirement of the question a number of candidates illustrated their responses by reference to the structures shown in Fig. 1.2. Question 2 Many candidates seemed to have little knowledge of the external features of the various vertebrate classes. Very many suggested that amphibians had a scaly skin or indicated incorrectly that reptiles and birds had external ear flaps. Many responses limited themselves to a single tick in each row when a complete response for birds, mammals and reptiles required more than one tick to gain credit. A significant number of responses did not recognise the presence of two pairs of limbs in birds, failing to recognise that wings are limbs.
7
Cambridge International General Certificate of Secondary Education 0610 Biology June 2010
Principal Examiner Report for Teachers
© UCLES 2010
Question 3 It was clear that many candidates were able to extract the relevant information about changes in yields from the table but most were not able to suggest biological reasons for the change in (a)(ii). Those who offered a logical suggestion why excess amounts of fertiliser should not be added to the soil generally recognised the risk of leaching and the possibility of eutrophication occurring in bodies of water. Not a single candidate realised that the loss of the fertiliser would be a waste of money. A very common erroneous response was that the fertilisers are toxic and would poison plants, animals, the soil, ponds and rivers or even the atmosphere. Many candidates seemed to think that the addition of the cut grass would lead to the growth of a grass crop rather than realising that it would add organic material to the soil that would eventually decay and release minerals and thus enhance crop growth. Question 4 There were a number of candidates who simply labelled the two trophic levels as ‘trophic Level 1 and trophic Level 3’ and others who wrote in the names of organisms from the food web. Most commonly Level 1 was identified correctly but Level 3 less frequently. Too often in part (b)(i) candidates entered only one letter in each of the two levels when they should have entered three letters in each case to gain credit, suggesting that candidates overlooked the word ‘all’ in the question. In part (b)(ii) many responses displayed a misunderstanding about the nature of the feeding relationships in food chains and webs. It was common for candidates to give answers that depended on carnivores being eaten by herbivores or herbivores being eaten by the producers. Too many responses left intermediate steps out of the explanations. Examiners can only mark the parts of the response that are actually present, and are not permitted to insert missing steps. Question 5 Candidates were expected to recognise that the investigation was examining the effects of factors such as temperature, light, water and oxygen. Too many simply listed conditions in the various tubes and thus gave responses with two versions of the same factor such as hot and cold rather than temperature, or moist and dry rather than water. However the predictions in (b) were frequently correct and this illustrated an understanding of the effects these factors have on germination. In part (c) there were nearly as many responses naming meiosis as those naming mitosis and a large number where the word offered was a hybrid of these two responses. In many parts of these papers, phonetic spellings are accepted, but where two words are often confused, hybrid forms of words are unacceptable. All candidates should know how to spell mitosis. Even when mitosis was correctly identified only a small proportion realised that the chromosome number remains the same in the new cells as in the original cell. The retention of the same chromosome number is one of the key features of mitosis and should be known by all candidates. In part (d) virtually all candidates recognised that the dry mass decreased with time but very few candidates realised that this was due to the use of food reserves for respiration by the seedling and that it was not due to the inflow or loss of water from the seedling. Candidates should know that dry mass is not affected by water content, gain or loss since any water is removed before weighing. Question 6 A significant number of candidates failed to place a cross anywhere on Fig. 6.1. Candidates should be encouraged not to leave questions blank, and not to rush through the paper so that they miss out this kind of question. Of those who did many placed it beyond the outer end of the oviducts (fallopian tubes) or within the uterus. Structures M and N were often identified correctly in part (b) but only a limited number of candidates were able to relate M to gaseous exchange. Some responses simply repeated the question while others dealt with the placenta’s role in feeding or protection of the fetus. A significant number of answers indicated that candidates wrongly believed that maternal and fetal blood were interchanged at the villi rather than correctly giving the diffusion of gases down concentration gradients, occurring between the two separate blood systems.
8
Cambridge International General Certificate of Secondary Education 0610 Biology June 2010
Principal Examiner Report for Teachers
© UCLES 2010
The responses to parts (c) and (d) often gave evidence of candidates not reading the question with sufficient care. In (c) the role of O and P were often quoted for functions other than the birth process such as nutrition and protection despite the wording of the question. In part (d)(i) many responses gave suggestions about how the woman became infected with HIV before she became pregnant or how the baby could become infected after it was born rather than how the baby became infected during her pregnancy. A common misconception seemed to be that HIV was a genetically inherited condition. Candidates should be aware that direct infection by the mixing of the maternal and fetal blood only occurs because of accidental leakage of blood across the placenta or during the birth process. Many candidates incorrectly believe that the exchange of blood between mother and fetus is a normal and regular occurrence. In part (d)(ii) the question required responses about actions a woman could take during pregnancy to ensure the baby’s healthy development and not actions she could take after the birth of the baby. Question 7 Very many candidates correctly identified the two teeth and also knew where tooth C could be found. In part (b), unfortunately the majority of candidates ignored the effect of brushing itself and concentrated on the action of toothpastes. The toothpastes were credited with a wide variety of health improving processes but this did not gain credit as it was off the theme of the question. The responses were expected to comment on the ability of brushing to remove from the teeth food remains, plaque and bacteria and also to stimulate blood flow to the gums. Brushing itself does not kill bacteria or reduce acidity in the mouth. The roles of chewing and enzymes, in part (c) were too often dealt with as if they were the same thing. Candidates should realise that chewing decreases the size of pieces of food as well as increasing the surface area exposed to enzymes while the enzymes act directly on large and insoluble molecules forming smaller soluble ones. Question 8 Although many responses correctly identified A as an atrium and B as a ventricle many erroneously thought that they were the right hand chambers. Many candidates identified C as a vein and some named it as the vena cava taking their response beyond the demands of the question, but too many offered as their reason the fact that it carried deoxygenated blood. It is the direction of flow, shown in Fig. 8.1, which determines the type of blood vessel. In part (b)(i) candidates frequently stated clear differences between the contents of the blood in vessels C and E but did not explain the reason for the differences and thus gained no credit. Also there were responses that dealt with the structure of the vessels that are not differences in the blood contents. In (ii) many responses commented on the chambers with the highest pressure without naming one of the blood vessels. Those candidates who did identify vessel F failed to explain how this vessel, the aorta, had the highest pressure but concentrated instead as to why it needed the highest pressure. Question 9 In part (a) it was common for candidates to name two sense organs but often their action was then described rather than the stimulus to which they responded. Very few candidates were able to state the meaning of the term tropism. They should realise a tropism is a growth response to a directional stimulus. Although there was a statement in the question that tropisms occur in plants, in (b)(i) a significant number of candidates responded in terms of animals. In completing the table many named the two types of tropism but very often suggested that the effect is the bending of the plant shoot rather than its specific directional growth pattern. The effect of the stimulus of gravity was often answered as if the table was dealing with a root rather than a plant shoot. Candidates should be encouraged to read the question carefully to ensure that they are talking about the correct structure.
9
Cambridge International General Certificate of Secondary Education 0610 Biology June 2010
Principal Examiner Report for Teachers
© UCLES 2010
BIOLOGY
Paper 0610/22 Core Theory 22
General comments There was ample evidence that candidates had sufficient time to complete the paper and few responses were left blank. Some candidates showed very limited knowledge and understanding of some topics from the syllabus, especially genetics and homeostasis. The paper proved appropriately demanding for all other candidates, although there remain a small minority of candidates entered for this paper who would clearly have gained a higher grade had they been appropriately entered for the extended paper. Responses to various sections of questions revealed again this year a variety of misconceptions and misunderstandings, elaborated below. There was also evidence that some candidates had not read the questions carefully or thoroughly enough and thus their responses were inadequate or off the point. Candidates should be made aware of the need to read the questions carefully and to take note of each question’s demands before they begin their response to that question. Comments on specific questions Question 1 The majority of candidates scored at least 3 marks on this question and clearly understood what was required of them. Buccinum and Turritella were the most commonly misidentified organisms and frequently these two were reversed within the table. A minority of candidates either failed to complete the tick boxes at all or filled in every box with a tick. A few also only filled in the last box for each of the identifications as if they thought this was the critical one and only this needed to be completed. Question 2 Most candidates had some idea of the role of the two minerals in the human body but all too often their responses were too vague to gain credit. Most associated calcium ions with the bones but responses such as ‘for bones’ unqualified were considered inadequate. Reference to haemoglobin was required to gain credit for the role of iron. The roles of magnesium and nitrate ions in plants were not well known. The commonest response for both was ‘for growth’ which was inadequate. The core syllabus makes quite clear that candidates are supposed to know that magnesium ions are needed for chlorophyll synthesis and that nitrate ions are needed for protein synthesis. In (c), those who realised that the problem would be eutrophication usually scored well, giving a detailed account, but about 50% of candidates incorrectly concentrated on the likelihood of the fertilisers being poisonous. Question 3 Candidates usually selected the correct colour for the dominant allele but were often unable to offer an adequate explanation for their choice, leaving it blank or writing vague answers such as ‘they were blue’. An adequate explanation needed to point out that ‘all the offspring of the cross were blue flowered’ or that ‘none of the offspring had white flowers’. Many stated that the seeds were blue or blue flowered, rather than the offspring grown from the seeds.
10
Cambridge International General Certificate of Secondary Education 0610 Biology June 2010
Principal Examiner Report for Teachers
© UCLES 2010
The genetic cross in part (b)(iii) was poorly done even by candidates who completed (b)(i) and (ii) successfully. A small number chose to use different symbols to the ones in the question which made life very difficult for them. Few candidates realised that they had to cross the heterozygote with the homozygous recessive. This emphasises the importance of careful, thoughtful, reading of the question. The whole concept of continuous and discontinuous variation, very clearly stated in the core syllabus, seemed unfamiliar to most candidates, who were unable to provide meaningful responses to (c) (i) and (iii). However most candidates correctly suggested suitable environmental factors that could affect the size of the cobs in (c)(ii). Question 4 The ecology question produced some of the strongest responses on the paper. Most candidates completed the food chain successfully and were able to offer sensible explanations for each of the changes mentioned in part (b). However there were a small but significant number of candidates who orientated the arrows in the food chain to suggest that the snowy owls were eaten by lemmings who in turn were eaten by arctic plants. Candidates should be made aware that the arrows point in the direction of the flow of energy and organic materials along a food chain or through a food web. Part (c) was the only part of this question to present difficulty to most candidates. Many thought that the source of energy for this ecosystem was the arctic plants, failing to realise that these plant absorb light energy the source of which is energy from the Sun. A significant number of candidates failed to identify photosynthesis in (c) (ii). Question 5 Knowledge of alcohol and the effects it has on the body were very vague throughout this question. In part (a)(i) the reading of the graph was very poor with many quoting 180 or 182 mg per cm3 of blood when the peak was clearly at 184. A significant minority incorrectly think that the kidney is responsible for the breakdown of alcohol in the body. The extension of the line on the graph was often inaccurately drawn and some candidates even failed to use a ruler for this. In (b) (i) most candidates realised that ability to drive a vehicle would be impaired but the reasons given for this were usually vague. Responses were expected to deal with biological effects such as slowing down of nerve impulses or reactions taking longer. Comments on attitude or being drunk are not worthy of credit at this level. In (b)(ii) most candidates identified suitable organs that would be affected but the effect was usually vaguely expressed. Lung cancer is not usually the result of alcohol abuse. Candidates usually identified at least one social problem caused by alcohol addiction. Question 6 The majority of candidates gained at least one mark for the definition of asexual reproduction. In (b)(i) only about half of the candidates identified meiosis as the type of cell division that occurs only in sexual reproduction. In (b)(ii) many candidates realised that using asexual reproduction of the plant would lead to a more rapid increase in numbers than sexual reproduction and some also suggested that the farmer might want to continue to produce fruit of the same variety. Many candidates correctly associated the large white petals with the need to attract insects for pollination, but in (d) there was some confusion, with many candidates describing how insects could disperse the fleshy fruit. Many responses suggested that candidates had confused seed dispersal with pollination. Question 7 The content matter of this question proved very difficult for many of the candidates who took this paper. Most candidates did not seem familiar with the term homeostasis and some tried to use the term vasodilation instead. The value of a constant body temperature was not usually well explained, although some did relate
11
Cambridge International General Certificate of Secondary Education 0610 Biology June 2010
Principal Examiner Report for Teachers
© UCLES 2010
it to enzyme activity. Most read the normal body temperature of the person correctly but were unable to indicate on the graph where vasodilation was having an effect. In part (b)(iv) very many candidates confused vasodilation with sweating and consequently described the latter process, gaining little or no credit. Those who did appreciate that the blood vessels below the surface of the skin allowed more blood to pass through could rarely explain the value of this. Question 8 This was a very straightforward question, requiring only basic knowledge of parts of the digestive system but was very poorly answered. Many candidates did not know where bile or lipase were made and most suggested the bile duct rather than the gall bladder as the storage organ for bile. Fat digestion was not known and many seemed to think the end products of fat digestion included amino acids or glucose, many responses were vague in that candidates attributed all the digestive actions to both bile and lipase and did not distinguish between the digestive functions of the two. Question 9 Most candidates knew that inhaled air contained more oxygen than exhaled air and that the concentration of carbon dioxide was higher in exhaled air than in inhaled air but few mentioned water vapour. The test, using limewater, was correctly described by many candidates but some incorrect responses talked about breathing through water instead of through lime water. In (c) many candidates gave perfect definitions of diffusion although some failed to gain full credit by referring to the movement of ‘substances’ which is too vague a term. Terms such as molecules, ions or particles were acceptable.
12
Cambridge International General Certificate of Secondary Education 0610 Biology June 2010
Principal Examiner Report for Teachers
© UCLES 2010
BIOLOGY
Paper 0610/31 Extended Theory 31
General Comments Some Centres clearly prepared their candidates very well for this examination as they were well equipped both in terms of their knowledge and also what was required of them in each question. There were some candidates who barely attempted the examination paper and it is clear that they would be more suited to taking the Core paper (0610 Paper 2). It is very important for Centres to ensure that candidates take the option that is suited to the level of attainment that they have reached. Standards of English expression and handwriting were very variable. Some candidates write very clearly indeed; however, answers from others were barely legible and were hard for the Examiners to decipher. These candidates would have benefited from having amanuenses to write their scripts or should have typed their responses. There were occasions when answers were completely illegible. This was particularly a problem in Question 5(b) where candidates wrote about the stages of population growth and in Question 6(b) where they used data from a graph and six pie charts to describe changes over time. Questions in this paper concentrated on several aspects of the supplementary sections of the syllabus. Question 2(d) referred to the control of factors within commercial glasshouses (section II 6.2.1). Question 3(d) referred to artificial insemination (section III 1.4). Many candidates thought that this question asked about in vitro fertilisation rather than artificial insemination. Question 4 dealt with acid rain from section IV 5.2. Question 5 dealt with population growth from section IV 4 in the context of yoghurt production from section II 6.1. The problem of world food supply was the basis of Question 6 and this is based on section II 6.3.1.1. Candidates should be aware that three quarters of the marks on this paper are based on topics from the supplementary sections of the syllabus. The Examiners saw a wide range of responses to the questions. At the top of the range there were some very sophisticated answers that were well expressed. Most candidates coped adequately with the less challenging questions, such as labelling the eye (Question 1 (b)(i)) and reading from the graph in Fig. 2.1. However, they often found it difficult to describe changes from a graph (Question 6(b)) and to explain the population growth curve in Question 5. The detail expected in some of the answers was clearly very challenging for many candidates. This was particularly noticeable in the part questions requiring longer answers in Questions 4, 5 and 6. However, Question 2(b)(ii) was generally well answered. The better candidates separated out the effect of increase in height from that of increase in number of leaves. Many candidates covered six points in a concise answer. Question 2(c) proved challenging even to the very best candidates. Throughout the paper candidates must take note of the mark allocation and make sure they give separate points without repeating themselves. Some answer in bullet points, often giving one more bullet point than the mark allocation. This is not always successful as the information given in each bullet point is not sufficiently detailed to match the relevant marking point. Repetition was obvious in Question 4(a)(ii) as candidates gave two versions of the same effect of acid rain. The syllabus now contains definitions of many terms. Candidates are expected to know these definitions and the answers expected by the Examiners will be those given in the syllabus. Candidates from many Centres routinely use the term marine to describe aquatic organisms that live in freshwater. Marine refers only to organisms living in salt water, in the sea. In longer questions some candidates used up the space for the answers. Candidates who continue their answers elsewhere on the examination paper are advised to indicate this clearly as continuation answers are not always obvious to the Examiners.
13
Cambridge International General Certificate of Secondary Education 0610 Biology June 2010
Principal Examiner Report for Teachers
© UCLES 2010
Comments on specific questions Question 1 (a) There were two marks for this question. Many candidates stated that sensitivity is the response to
a stimulus, but missed the point that stimuli are detected first. Many interpreted sensitivity as the degree of sensitivity to surrounding changes. Changes in the environment were often omitted, hence ‘sensing/responding to the environment’ did not gain any marks. Many candidates only gave specific examples so did not gain the mark. There were many circular answers, such as ‘sensitivity is when you are sensitive’. Some referred to the sensitivity of scientific apparatus which was not accepted.
(b) (i) Many candidates labelled three or four of the parts of the eye correctly. Common mistakes were to
identify the cornea (A) as the conjunctiva or sclera and the suspensory ligaments (D) as the ciliary muscles, sensory ligaments or just ligaments. There was also some confusion between the iris (B) and the candidate. Some gave the same feature for more than one label in the hope that at least one would be correct. Candidates are not penalised for this.
(ii) The Examiners did not allow any errors carried forward from (b)(i). They only allowed functions of
the iris in the first part of this question even if the iris had been misidentified in (i). Candidates were more successful at describing the function of the iris than they were describing the function of the ciliary muscles (E on Fig. 1.1). Most of the successful answers described the iris as controlling the amount of light entering the eye. Answers for the ciliary muscle concentrated on changing the thickness or shape of the lens or to the effect on the suspensory ligaments. The Examiners did not accept ‘change the size of the lens’. Few offered the term accommodation in their answers. There were several incorrect references to contraction of suspensory ligament and many references to allowing the lens to focus without explaining how this is done. There were examples of poor use of terminology with muscle ‘constricting’ and suspensory ligaments ‘relaxing’. A few wrote about changing the position of the lens to achieve focusing as happens in cameras, fish and amphibians.
(c) (i) Many candidates identified G and H from Fig. 1.1 as the yellow spot or fovea and the blind spot.
They realised that H being closest to Y on Fig. 1.1 must be the blind spot. The Examiners accepted ‘optic nerve’ and ‘optic disc’ as alternatives to the blind spot. Some candidates identified these the wrong way round in which case the Examiners did not award any marks but carried the error forward into (c)(iii). The most common error was to refer to these parts of the retina as rods and cones. Poorer answers gave the same answer for G and H.
(ii) Candidates were asked to describe the function of the rods in the eye. Most were able to gain a
mark for an appropriate comment about detecting light of low intensity or giving night vision or something equivalent. Many also knew that rods do not give colour vision and described their function as providing ‘black and white’ vision which was accepted. Some wrote that they detect ‘black and white colours’ which was not accepted. Errors included identifying the rods as structures that moved the lens or supported the eye. Clearly candidates were guessing at the function of rods from their name. A surprising number of candidates thought rods were responsible for colour vision. Marking points 2, 4, 5 and 6 were rarely given. Candidates also had the impression that rods only work in dim light. Very few made reference to converting light to impulses and, of those who did, several tended to refer to ‘signals’ or ‘messages’. Many candidates wrote of ‘pictures being sent’ and ‘messages being picked up’. Candidates will never receive credit for answers on the nervous system that refer to ‘messages’ or ‘signals’.
(iii) Fig. 1.2 showed the distribution of rods in the retina. Candidates had to indicate on this figure the
distribution of cones. Many candidates did not attempt this question. Most of the cones are concentrated in the fovea so one mark was available for putting a peak coinciding with G. Curves often dipped to the left and right of G and they should have reached the horizontal axis at the edge of region H (the blind spot). There are no sensory cells in the blind spot so the second mark was awarded for nothing drawn within H. The Examiners gave this mark if lines just entered H at either side. A number of candidates clearly did not know the answer and drew a straight line across the figure with an increasing gradient. Candidates who did not draw anything on Fig. 1.2 were not awarded any marks. If there was anything drawn on the figure, but H was left blank then a mark was awarded. Candidates who gave the blind spot for G and fovea or yellow spot for H were awarded two marks if they followed their error into this question showing a peak for cones at H and nothing at G.
14
Cambridge International General Certificate of Secondary Education 0610 Biology June 2010
Principal Examiner Report for Teachers
© UCLES 2010
Question 2 (a) (i) Fig. 2.1 showed the uptake and release of carbon dioxide from a plant over a 24 hour period.
Candidates had to identify from the graph the time of sunrise. Most candidates gave a time between 06.00 and 06.30. Some gave a time that was obviously sunrise in their part of the world -between 07.00 and 08.00 were popular times. Many candidates had difficulty with reading the scale accurately as there were answers expressed as 6 hours, 600 and 06. Many candidates thought the correct time was the point at which carbon dioxide uptake was the same as carbon dioxide evolved.
(ii) Candidates had to read two intercepts from the graph to indicate the times when there was no
uptake or release of carbon dioxide. Many managed this successfully giving 08.00 and 19.00 or equivalent times. Some gave ranges for the first of these intercepts and this was not accepted. The range 18.45 to 19.00 was accepted for the second intercept. Some answers were just outside the accepted range for 19.00. Ranges were a common error perhaps because of misinterpretation of the dotted line. So some candidates wrote ‘(between) 0000 to 0800 and (between) 19.00 and 2400’. A surprising number of candidates could not read a 24 hour time scale and 19.00 was interpreted as 9 pm. Many candidates misinterpreted this question and gave ranges covering the whole of the lowest level of the graph, suggesting they did not understand what the dashed lines meant.
(iii) The candidates had to identify respiration as the reason for the release of carbon dioxide at night.
Most managed this successfully although some stated that ‘plants do not carry out photosynthesis’ which was not enough to gain the mark. Some gave full answers and stated that ‘since there is no photosynthesis only respiration occurs’. Often Examiners gave candidates the benefit of the doubt as many wrote statements such as ‘respiration only occurs at night’ which is ambiguous as it could be implied that respiration does not happen during the day time. A minority gave the response ‘respiration instead of photosynthesis’ and did not gain the mark.
(iv) Explaining why the uptake of carbon dioxide during the day must be greater than the release at
night proved to be a challenging question for many. Most candidates stated that carbon dioxide is a requirement or raw material for photosynthesis, but they struggled to gain the second mark. To gain this second mark they had to state that photosynthesis or food production is greater in the day than at night and/or that this means that surplus food is available or that growth is possible. Many candidates did not put across these ideas. There were many references to photosynthesis having to provide sufficient food or starch or energy to enable plants to respire at night. Again the Examiners were left in some doubt as to whether candidates were aware that respiration occurs all the time. There were not many references to other functions, such as growth, protein synthesis or metabolism which is what the Examiners intended candidates to express. Many candidates described this in terms of carbon dioxide uptake or even storage needing to be greater than carbon dioxide loss for the plant to survive. A common misconception was that photosynthesis only supplies sufficient for respiration at night. Answers that referred to maintaining the balance of oxygen and carbon dioxide in the atmosphere did not gain any credit.
(b) (i) Most candidates followed the instruction to show their working for the percentage calculation. It
was clear that many candidates did not know how to calculate a percentage. The Examiners accepted 12.56, 12.6 or 13 as the correct answer. Candidates who gave other answers could gain one mark for showing the correct working. It was clear that some candidates did not have a calculator and could not work out the percentage without one. Several candidates did the calculation correctly and then incorrectly rounded 12.55 down to 12.5.
(ii) This question asked candidates to suggest how increase in height and number of leaves on each
plant affects the yield of tomatoes. Many candidates made the obvious point that these increase the yield of tomatoes and then explained this in terms of more leaves giving a larger surface area for absorption of light or more chlorophyll for more photosynthesises. Others made the point that an increase in height allows for the growth of more leaves and tomatoes. There were many lines of argument and candidates explored all of them including the increased chance of pollination. Sometimes the failure to repeat ‘more’ in the answers deprived candidates of marks; for example, ‘more [leaf] area allows greater light absorption for photosynthesis and food production by the chloroplasts’ gained one mark. Very few linked ‘more stomata’ to increased uptake of carbon dioxide in spite of the previous question.
15
Cambridge International General Certificate of Secondary Education 0610 Biology June 2010
Principal Examiner Report for Teachers
© UCLES 2010
There were some answers where the height and increased number of leaves were thought to hinder the growth of the fruits by shielding them from the sun and reducing the water available for their growth. The most common error was to state a decrease in yield because of additional transpiration or the difficulties in transporting water and nutrient to a larger plant. More than one answer suggested that larger size would lead to crowding and reduced yield. This may be true depending on the planting density, but does not explain the data which shows the opposite.
(c) In order to make valid comparisons between the two groups of tomatoes various factors were kept
the same. Candidates had to suggest what these were. Many thought of factors that the scientists carrying out the study would not have been able to control, such as light intensity and temperature. There were many other factors that candidates could choose from, such as aspects of the soil and the provision of water and fertilisers. The Examiners looked through each answer for three appropriate factors ignoring any that could not be controlled. Most candidates, even the most able, suggested the factors which could not be controlled. Many forgot that one group of tomato plants was under cover. Many were keen to plant the same number of seeds but did not recognise the significance of the planting density. Better answers suggested using the same variety of tomatoes although they often wrote ‘use the same seeds’ which was ambiguous.
(d) Many candidates showed an impressive knowledge of the control of factors within commercial
glasshouses. Some said that the factors involved are limiting factors of photosynthesis and explained that artificial lighting, heaters, fans, humidifiers and sprinkler systems maintain optimum conditions for light intensity, temperature, humidity and water supply respectively. Many also explained that carbon dioxide is provided by pumping it into glasshouses or by burning gas.
Not many referred to the use of sensors, computer control or negative feedback in the control of
glasshouses although these points were seen on some scripts. Answers given as brief bullet points often did not give sufficient detail. One mark was available for protection against bad weather, insect pests, grazers and disease. Poorer answers tended to concentrate on this protection aspect often giving extensive accounts of the various environmental factors from which a glasshouse crop is protected.
Question 3 (a) (i) Many candidates gave the term ovulation. Incorrect answers included fertilisation and
menstruation. (ii) Definitions of the term haploid were often incomplete or simply based on the number of
chromosomes in human gametes. The Examiners looked for one of the following often applied to cells or nuclei:
● one set of chromosomes ● one of each pair of chromosomes ● half the number of chromosomes found in a body cell.
Candidates who stated that haploid means 23 chromosomes did not gain a mark. This was a
common incorrect answer. Another was to state that haploid means ‘half the number of chromosomes’ without making clear that it is half the number found in a body cell. Candidates also referred to ‘parent’, ‘normal’ and ‘somatic’ cells all of which were accepted as alternatives. The Examiners also accepted answers that stated that haploid cells are the products of meiosis.
(b) Answers to the table comparing human eggs and sperm were sometimes very detailed and easily
gained full marks. Most candidates gave the sites of production as ovaries and testes and compared the size of the gametes correctly. Many gave the size of the scale bars in Fig. 3.1 (100 µm and 10 µm) without noticing that the sperm is much longer than the scale bar. There were a variety of ways to answer the numbers produced. The best answers given were ‘one a month’ and ‘millions all the time’. Candidates who simply wrote ‘one’ for the egg did not gain the mark. Most candidates stated that sperm cells can swim or have a tail for swimming. Some candidates thought that eggs are mobile so wrote ‘a little movement’ and ‘can move a lot’. Better answers stated that egg cells are moved by cilia in oviducts or that they are immobile.
16
Cambridge International General Certificate of Secondary Education 0610 Biology June 2010
Principal Examiner Report for Teachers
© UCLES 2010
The spelling was important here as ‘testas’ and ‘tests’ were rejected because, although they were
spelling errors, the words had other meanings. Numbers were often too vague, for example ‘not many’ for eggs and ‘many’ for sperm, giving no idea of the vast difference between the two. Some candidates misread ‘mobility’ as ‘mortality’ hence gave the answer ‘a week’ and ‘a couple of days’. Some candidates gave the epididymis as the site of sperm production. The Examiners decided to ignore this and award a mark if testis was also given in the same answer box.
(c) (i) Most candidates knew that oestrogen is produced and released from the ovaries. Some stated that
oestrogen is released from follicles and that was accepted since the question did not ask for the organ involved. Corpus luteum, brain and pituitary gland were common errors. A number thought that they had to give two answers, one for the site of production and another for the site of release. In a small number of cases it was suggested that the oestrogen is released into the oviduct or the uterus. The Examiners were surprised at how many times they saw ‘ovules’ on the scripts. This is a term that candidates seem to like very much as they use it at every opportunity in questions on human reproduction.
(ii) Answers to this question on the role of oestrogen in the menstrual cycle were often imprecise.
Many candidates stated oestrogen stimulates the wall of the uterus. The Examiners looked for answers that referred to the lining of the uterus or to the endometrium. They also accepted references to the blood vessels and glands in the lining of the uterus. Many stated that oestrogen’s role is to prepare the uterine lining for implantation and this gained the two marks. Good answers also referred to its role in inhibiting the release of FSH and thereby preventing the release of more eggs. There were quite a few answers which included both inhibition of FSH and stimulation of LH production.
Common errors were: ● oestrogen stimulates egg production; ● oestrogen and/or FSH cause ovulation; ● oestrogen maintains the endometrium; ● LH stimulates the development of eggs; ● oestrogen stimulates the uterus wall rather than uterus lining or endometrium;
(d) Most candidates answered this question on artificial insemination (AI) as if it were about in vitro
fertilisation. If this was the case, then one mark was given to statements about collection of sperm or semen from the male as this is common to both processes. The second mark for AI was awarded for insertion of the sample of sperm into the female reproductive tract. A further marking point was available for stating that this occurs around the time of ovulation. However, many candidates thought that eggs would also be collected and fertilisation would happen in a dish with the resulting embryo or embryos inserted into the uterus. Section III 1.4 states that candidates should know about artificial insemination and not in vitro fertilisation which is not mentioned anywhere in the syllabus.
Many thought that only one sperm cell was involved in the whole process by stating that ‘a sperm’
would be collected or injected straight into the egg or even into the ovary. Some candidates referred to methods of contraception.
Question 4 (a) (i) Many candidates gave a source of sulfur dioxide other than that shown in Fig. 4.1. A number of
candidates misread the question and gave ‘factories and power stations’ as their answer. ‘Car exhausts’ was the most common answer. A pleasing number of candidates gave nitrogen oxides, which were also accepted. ‘Burning of fossil fuels’ was not credited unless another place other than in power stations and factories was given. This answer implied that candidates were not aware of the burning of fossil fuels in power stations. Many referred to carbon dioxide and monoxide; some misread the question and gave consequences of acid rain such as the effects on limestone buildings and statues.
17
Cambridge International General Certificate of Secondary Education 0610 Biology June 2010
Principal Examiner Report for Teachers
© UCLES 2010
(ii) Some candidates showed impressive knowledge of the effects of acid rain on the environment and
gained the two marks. The Examiners accepted the effects of acid rain on trees and other vegetation. They also accepted that candidates often interpreted ‘ecosystem’ in its widest sense to include aquatic habitats in forests so marks were available to acknowledge this. Some answers concentrated on plants and animals, others on the disruption to food chains and others on effects on the soil. Some candidates confused increased acidity with increase in pH. Some candidates were confused between acidity of water and eutrophication: ‘acidity uses up oxygen and the animals cannot breathe’ being a typical example.
Poorer answers included imprecise references to ‘effects’ on the organisms and lacked sufficient
detail to gain marks. A common misconception was that animals drinking water formed from acid rain would be poisoned. A significant number of candidates when writing about these effects wrote about the marine environment when they meant the aquatic environment.
(b) Many candidates gave ways to reduce pollution so that there is less acid rain. Some saw this as a
general question about pollution reduction or reduction in carbon dioxide emissions. Common answers were use of alternative or renewable sources of energy and many of these were listed. Some candidates showed impressive knowledge of ways to reduce sulfur dioxide emissions from chimneys such as using flue gas desulfurisation; ‘catalytic converts’ on motor vehicles was commonly given although some suggested that these are used to remove sulphur dioxide rather than nitrogen oxides. Other ideas included reducing private transport and encouraging people to use public transport. Reducing the quantity of coal burnt was often given and some candidates mentioned use of fluidised bed combustion to reduce the sulfur dioxide emitted from power stations.
Many candidates wrote of building power plants or factories away from towns and cities in the
countryside and stopping totally all uses of electricity. The first would not reduce the problem of acid rain and the latter is totally unfeasible. There were a lot of vague answers about filtering waste gases in factory chimneys and having fewer factories.
(c) Most candidates named features shown by molluscs that are not shared with crustaceans; ‘shell’
and ‘muscular foot’ were the two most commonly given. The Examiners accepted unsegmented, but did not award a mark for ‘soft body’ unless it was further qualified. ‘No legs’, ‘no exoskeleton’ and ‘have feet’ were not accepted. A surprising number wrote about eyes on tentacles being the feature.
(d) (i) Almost all candidates gave frogs or blackfly larvae. (ii) Similarly almost all candidates gave clams and snails or molluscs. Some misread Fig. 4.2 and
gave blackfly larvae. A few candidates hedged their bets by making a list of several organisms from the table; these were not accepted.
(iii) Suggestions for the inability of animals to tolerate water with low pH tended to be very general.
The Examiners gave a mark for answers that dealt with enzymes not functioning, or not functioning well, at low pH. Many candidates also suggested that acid damages or dissolves shells. There were fewer answers that dealt with the effects of aluminium on fish, a common problem in acidified waters. This question attracted lots of vague answers, such as ‘upsetting metabolism’ with many answers couched in terms of ‘affects’ or ‘effects’. Answers that referred to increase in acidity ‘burning’ or ‘poisoning’ animals were not accepted. Some candidates wrote that oxygen cannot dissolve as well in water of pH4 as it does in water at higher values of pH. They went to say that this would lead to problems with respiration. Increases in temperature and salinity decrease the solubility of oxygen, but not changes in pH.
18
Cambridge International General Certificate of Secondary Education 0610 Biology June 2010
Principal Examiner Report for Teachers
© UCLES 2010
Question 5 (a) (i) Many candidates stated that milk has to be cooled so that enzymes are not denatured leading to
the death of bacteria that make them. Some candidates referred to the enzymes secreted by the bacteria into the milk. Another popular answer was that the milk is cooled so that an optimum temperature is provided for the bacteria.
Some candidates gave ‘to kill the bacteria’ in isolation and with no reference to the high
temperature doing this. Answers that incorrectly referred to the killing of enzymes and the denaturing of bacteria were found on some scripts. There was some confusion with pasteurisation and sterilisation as some answers implied that the heating was to remove pathogenic bacteria.
(ii) Fig. 5.1 shows that the pH of the milk decreases. Candidates were not always very sure what
caused this. Many stated that the carbon dioxide released in respiration was responsible. Answers like this did not gain any marks. The Examiners were looking for anaerobic respiration with the production of lactic acid. If candidates gave both carbon dioxide and lactic acid they gained the mark. A common misconception was that removal of oxygen would reduce pH as oxygen is alkaline. Some candidates who struggled with other parts of the paper answered this question surprisingly well.
(iii) The term food additive was often interpreted as any addition to yoghurt hence the Examiners found
the following: fruit, strawberries, sugar, cream, honey, cheese, cake, soya and even pickles! However, most candidates gave a correct answer: colouring and flavouring were the most common. Correctly named examples of additives were also given credit.
(b) This question addressed Assessment Objectives B2 and B5 (translating information from one form
to another and presenting reasoned explanations of phenomena, patterns and relationships). Some candidates gave most effective descriptions and explanations of the growth of Streptococcus thermophilus from Fig. 5.2. They identified the three growth phases and explained them in terms of limiting factors. Other candidates found this to be a much more demanding task as they did not divide the graph into sections (lag, log and stationary) and did not describe and explain each part. A common answer to this type of question is to refer to bacteria ‘adapting’ to the environment and this did not gain credit. A significant minority referred to the stationary phase as the ‘stabilising’ or ‘stabilisation’ phase.
Some candidates described the growth of both species of bacteria (S. thermophilus and
Lactobacillus bulgaricus) plus their effects on one another in spite of the question referring to S. thermophilus alone. Often the excess of resources (no limiting factors) was not of significance until the log phase; the lag phase sometimes being attributed to a lack of them. A few candidates did not understand the question at all and described the human population growth.
A number of candidates took the words ‘mixture incubated at 37 to 44 oC ’ to mean that the
temperature rose as the incubation progressed and they then proceeded to answer in terms of temperature and enzyme relationships. Some tried to explain the difference in the two growth curves in this part of the question. While describing the changes the horizontal axis was often given in terms of minutes or years rather than hours. Many tried to answer part (c) here
(c) This question asked candidates to suggest reasons for the growth pattern of the other bacterium,
Lactobacillus bulgaricus. Candidates gave a variety of acceptable reasons such as the smaller number of this type of bacterium at the beginning of incubation and its inability to compete with S. thermophilus. Many suggested that the conditions were not favourable for L. bulgaricus until later in the fermentation. However, a common error was to suggest that one species of bacterium preyed on the other – often L. bulgaricus on S. thermophilus. Candidates stated that numbers of the predator species could not increase until there were sufficient numbers of the prey species. This idea did not gain any marks.
19
Cambridge International General Certificate of Secondary Education 0610 Biology June 2010
Principal Examiner Report for Teachers
© UCLES 2010
Question 6 (a) (i) Almost all candidates identified two types of natural disaster that occur suddenly and lead to food
shortages. Hurricanes, tsunamis, floods, earthquakes and droughts were common. Candidates who gave ‘disease’ as their answer rarely related this to the food supply with
references to crop plants or livestock. A surprising number of man-made disasters were given with information from Fig. 6.2 frequently being included. Some candidates gave ‘slow onset’ and ‘sudden onset’ as examples here.
(ii) Candidates were also successful at identifying natural disasters that take several years to develop.
Droughts were also popular in this category as well. Soil erosion, desertification and global warming were other acceptable answers. The Examiners did not accept ‘volcanoes’ or ‘earthquakes’ or man-made disasters such as deforestation and the effects of overpopulation. Obviously famine was not acceptable.
(b) Descriptions of the changes shown in Fig. 6.1 and Fig. 6.2 were often difficult to follow. This
question proved challenging for many candidates. They tended not to include accurate references to the data given or use it in comparative manner. Frequently the candidates tried to use the pie charts to explain the graphs at precise points in time instead of describing the changes over time. Often candidates did not give simple descriptions of how the food shortages had changed over the time period illustrating these with suitable data taken from the graph and from the pie charts. Paragraphs just describing the total food shortages line on the graph were easiest to follow and gained marking points 1 and 4. Commonly candidates gave a year by year description of the increase and decrease of food shortages without actually giving an overall trend. A common error was to quote figures without linking them to particular years, or to quote a range of years and figures that did not match.
(c) In this question candidates were asked to consider how an increase in the human population may
contribute to food shortages. Many explained how land is required for building and therefore is not available for growing crops. Some referred to the increase in domesticated animals and overgrazing, soil erosion and desertification. Many also stated that food production will not be able to keep up with the growth of the human population and that increased pollution will harm agriculture. There was a tendency to repeat the question, e.g. ‘increase in population results in less food to go around’. Very few candidates mentioned the economic effects of food shortages.
(d) Some candidates did not recognise this question about artificial selection and wrote about methods
of intensive agriculture, genetic engineering or the use of hormones to produce seedless fruits instead. No marks were awarded for these answers. Candidates who named a suitable crop plant or domesticated animal and gave an appropriate feature, such as increased yield or disease resistance, gained two marks. Often candidates did not make it clear that the plants and animals showing the desired features are bred together. They also did not make it clear that selection is applied to the offspring and that the selected offspring are used for future breeding. Some candidates carried out numerous crosses between individuals showing different features without continuing the breeding into a second and further generations. A common error was for candidates to breed cows together to increase the yield of milk.
Candidates should appreciate that this topic is best considered by choosing to improve one feature
by breeding the best individuals available and then continuing to choose the best offspring and breeding them until the desired degree of improvement had been attained. There were lots of answers combining two desirable qualities by crossing organisms with one of each but here the best of each was not emphasised. Another common error was that a plant or animal that had a ‘poor quality’ e.g. small but tasty fruits would be bred with one that had a ‘good quality’ e.g. large but not tasty fruits, resulting in all ‘good quality’ offspring e.g. all large and tasty. Some Examiners thought that candidates were running out of time and wrote quickly without considering the detail that they should give.
(e) A common error when defining the term genetic engineering was to refer to the transfer of a gene
or genes from one organism to another. The Examiners only awarded the mark if candidates made it clear that genes are transferred from one species to another. There were many brief descriptions of the transfer of genes into bacteria to produce human insulin rather than definitions of the term.
20
Cambridge International General Certificate of Secondary Education 0610 Biology June 2010
Principal Examiner Report for Teachers
© UCLES 2010
BIOLOGY
Paper 0610/32 Extended Theory 32
General Comments Some Centres clearly prepared the candidates well for this paper and the students were well equipped both in terms of their knowledge and also what was required of them in each question. There continue to be some candidates who barely attempted the examination paper and it is clear that they would be more suited to taking the Core paper (0610 Paper 2). It is very important for Centres to ensure that candidates take the option that is suited to the level of attainment that they have reached. Standards of handwriting and English expression were very variable. Some candidates write very clearly indeed; however, answers from some candidates were barely legible and were hard for the Examiners to decipher. Some of these candidates would have benefited from having amanuenses to write their scripts or they should have typed their responses. There were occasions when answers were completely illegible which makes it impossible to credit the response. Questions in this paper concentrated on several aspects of the supplementary sections of the syllabus. Candidates should be aware that three quarters of the marks on this paper are based on topics from the supplementary section of the syllabus. The Examiners saw a wide range of responses to the questions. At the top of the range there were some very sophisticated answers that were very well expressed. Most candidates coped adequately with the less challenging questions, such as labelling the reflex arc (Question 1(b)(i)) and calculating the difference in yield as a percentage in Question 3(a)(i). However, they often found it difficult to describe effects on yield using data from Table 3.1 in Question 3 (a)(iii) and explain the reasons for trends in concentrations of carbon dioxide and methane in the atmosphere in Question 6. Candidates who understood the demands of questions found most parts of Questions 1, 2, 4 and 5 fairly straightforward, although many found Question 5(c)(i) and (ii) on the lymphatic system difficult to answer. Some gave the answer to Question 3(b) as the answer to 3(a)(iii), which some misinterpreted. These are explored in depth in the sections on individual questions below. The detail expected in some of the answers was clearly very challenging for many candidates. This was particularly noticeable in the part questions requiring longer answers in Questions 4, 5 and 6. The syllabus now contains definitions of many terms. Candidates are expected to know these definitions and the answers expected by the Examiners will be those definitions given in the syllabus. Candidates are expected to translate information from one form to another (Assessment Objective B2). This means that they should give quantitative statements and support these statements with data from the table or graph provided. In Question 3(a)(iii), candidates tended to write out the data from Table 3.1. For example, they stated that when chemical fertilisers were used the yield was 21.2 tonnes per hectare; adding manure the yield was 19.3 tonnes per hectare and adding both chemical fertilisers and manure the yield was 24.3 tonnes per hectare. The Examiners are not permitted to insert words such as ‘greater’ and ‘less than’ to make answers which would gain marks; that is the candidate’s role, so although the data is quoted it is not used in support of relevant statements. Questions 2(b) and 5(b) asked candidates to describe and explain ways in which leaves of xerophytes and capillaries are adapted to their functions. Some candidates did not seem familiar with this type of question and failed to give clear structural features first. This is clearly a question style that needs practice for many. In longer questions some candidates used up the space for the answers. Candidates who continue their answers elsewhere on the examination paper are advised to indicate this clearly as continuation answers are not always obvious to the Examiners.
21
Cambridge International General Certificate of Secondary Education 0610 Biology June 2010
Principal Examiner Report for Teachers
© UCLES 2010
Candidates from many Centres routinely use the term marine to describe aquatic organisms that live in freshwater. Marine refers only to organisms living in salt water, in the sea. Comments on specific questions Question 1 (a) There were three marks for this question. Many candidates stated that sensitivity is a response to
a stimulus, but missed the point that stimuli are detected. Involuntary action was often described in vague terms and frequent references to ‘no involvement of the brain’ or ‘no control’ were seen and not credited. It should be noted that sensitivity is neither the effectiveness of the receptors nor the density of receptors in an area as stated by some candidates.
(b) (i) Most candidates labelled three or four of the parts of the reflex arc correctly. Common mistakes
were to identify the receptor (C) as a sensory neurone and the motor neurone (B) as the sensory neurone. The muscle was sometimes referred to as the biceps. Sensory was often written incorrectly as ‘sensoric’ and motor as ‘motoric’
(ii) The Examiners did not allow credit for descriptions that did not include use of the terms ions or
molecules. Many candidates referred to ‘particles’ or ‘substances’ which the Examiners consider inappropriate at this level. Section II 4.2 of the syllabus defines active transport as the movement of ions. Most candidates knew that energy was required and often referred to ATP. Various contradictory statements related to concentration gradients were seen in which the movement was described as ‘against a concentration gradient, e.g. from high concentration to low concentration’. Candidates were more successful when descriptions were structured in a simple way. These is sufficient time to allow candidates to plan answers before commitment to the paper.
(c) There were some accurate and well written answers to this question on the consequence of a
lesion across the ventral root of a spinal nerve. Candidates identified that the tap of the hammer would still be felt, or alternatively that impulses would be carried in the sensory neurone. Unfortunately, some candidates used ‘message’ or ‘signal’ to describe the impulse and Examiners did not credit these terms. Many candidates did not clarify their ideas in this explanation, with references to the brain, slowing down of the reaction and description of the cut as a synapse being common errors. Some candidates also confused the sensory and motor neurones which made it impossible to apply some of the marking points to their answers. They did this even though they often identified these neurones correctly in (b)(i). Many thought that the impulse or ‘message’ came from the brain along the motor neurone to the muscle. Answers to this question were often quite convoluted and it was sometimes difficult for the Examiners to tease out the marking points.
(d) Many candidates did not achieve the mark. The Examiners accepted statements that correctly
referred to the working of the nervous system or even that ‘nerves worked correctly’, but frequently rejected answers based on ‘testing for life’ or ‘to see if reflexes work’. As the term reflex was mentioned twice in the question stem and Fig. 1.2 provided additional information candidates should be advised that repetition of the stem cannot be credited.
Question 2 (a) Fig. 2.1 showed the root systems of two desert plants. Candidates had to describe and explain
how each is adapted for survival. Most candidates gave a description of root ‘depth’ for plant A and recognised the function as absorption of water. Descriptions for plant B were less precise and were explained in terms of increased surface area rather than to gather available water near to the surface. The mark available for large surface area was linked to both plants and was relatively infrequently observed in responses. Many candidates stated that the roots were long but did not qualify this, as many others did, with terms such as vertical and horizontal; ‘long’ on its own did not gain credit. Some candidates interpreted the question to mean which of the two plants would survive in a dry desert habitat thinking that B was not a desert plant and would soon die. They often favoured plant A which meant that their answers did not gain more than two marks. Some candidates answered in terms of anchorage and preventing plants being uprooted in high winds and by animals. Some referred to roots ‘digging’ for water. Neither of these ideas gained any credit. No root hairs are visible in the diagram even though candidates often described them as if they were. Some candidates missed the obvious cue in the question and wrote about mineral and nutrient uptake rather than water absorption.
22

Cambridge International General Certificate of Secondary Education 0610 Biology June 2010
Principal Examiner Report for Teachers
© UCLES 2010
(b) Candidates were required to describe and explain two ways in which the leaves of desert plants
reduce water loss. Many described the features but could go no further with the explanations that ‘to reduce water loss’ which is in the question. Many responses referred to the leaf cuticle but as this was not linked to ‘thick’ the mark was not awarded. Few could explain successfully how the thick cuticle helps to reduce water loss. Many stated that it prevents water loss which is not the case. Candidates could say that the thicker cuticle increases the distance for diffusion or that the wax makes the cuticle less permeable to water. Similarly ‘stomatal closure’ was left unqualified and Examiners were not informed about when this closure occurred to secure the mark. Each explanation needed to be clearly linked to a description to gain two marks. If the description was not made clear, then no marks were awarded for explanations as they were not linked to the correct adaptation. Very good examples were seen that covered all the alternatives in the mark scheme; these were often very well written answers.
(c) The candidates had to complete the table on sources and sinks in translocation for six marks.
Most managed this successfully although some did not gain the mark for substances transported in phloem as glucose and starch were frequently given and did not gain the mark. Some were less secure on the source and sink for the phloem, but the majority gave the source as roots and the sink as leaves for the xylem. Some candidates did not follow the instruction to name organs. Incorrect answers included the names of cells, such as root hair cells and mesophyll cells, the term ‘shoot’ and ‘the rest of the plant’.
Question 3 (a) (i) Many candidates gave the correct percentage as 92.86 or 92.9 or 93. Most candidates included
their working. Incorrect answers included 92.8% but with correct working one point was awarded. Candidates should always be advised to include working as one mark is available for the correct working in calculations like this if the answer is missing or incorrect. Candidates should also follow any instructions given about how to express their answers. In this case there were none, so most candidates expressed their answer to one or two decimal places or stated that they were giving their answer to two or three significant figures. Candidates should be advised that they need a calculator in their Biology examinations and that they should round up their answers correctly. Some candidates tried calculating the answer by long division which wasted time and often failed to give the right answer.
(ii) The Examiners looked for use of the figures from Table 3.1 but this was not often observed. Many
candidates were not sure how to approach this question. Candidates who stated that taller plants have more leaves and that this leads to increased photosynthesis gained two marks with apparent ease. The Examiners did not accept answers that linked height to ‘reaching light’ without reference to the number of leaves. Some candidates appeared to think that potato tubers were borne on aerial parts of the plant and not underground; they did not apply their knowledge of the syllabus from section III 1.1.1 about asexual reproduction in potatoes. Candidates could have referred to the ‘earthing up’ that is done to encourage tuber production.
(iii) Descriptions were sometimes very detailed, used data from the table in support and easily gained
full marks. Most candidates gave ‘increased yield’ for one mark and compared the effects of manure and chemical fertilisers together with ‘none’ for their second mark. Without clear identification of the results obtained when manure or chemical fertilisers were used alone the third mark was not available. Weaker responses attempted to describe components of manure or specify chemical elements in fertiliser without success.
(iv) The Examiners were looking for specific references to nitrate ions and expected to see a clear link
between incorporation of nitrate in amino acids or proteins followed by the importance of protein in growth. These two marks were frequently achieved. References to enzymes and manufacture of chlorophyll were credited, but less often observed. Some candidates answered this question in terms of events in the nitrogen cycle that occur outside plants and are mediated by microorganisms. There were a few descriptions of nitrification making nitrate ions available to plants. Some wrote about the role of Rhizobium. Neither approach answered the question.
(v) The concept of control was well known and well answered. Some candidates, however, did not
appreciate the difference between a control experiment, as in Plot E, and a controlled experiment in which variables are controlled.
23
Cambridge International General Certificate of Secondary Education 0610 Biology June 2010
Principal Examiner Report for Teachers
© UCLES 2010
(b) Most candidates made the obvious point that fertilisers increase crop yields. However, candidate found it more difficult to give other advantages of applying fertilisers to crops. Many responses appeared to be written without a planned approach and in many cases quality suffered and contradictory statements were made. Some candidates chose to tabulate their answers which did help.
The majority of answers did not achieve more than one mark for an advantage, but many achieved
marks for listing disadvantages. These often included references to lowering the water potential of soil water, providing ions for the growth of weeds and possible effects on humans. It was surprising that the benefits of chemical fertilisers are not better known and this is obviously something that candidates have not appreciated; instead, they have a very clear understanding of the consequences of misuse of fertilisers which in many parts of the world is a thing of the past.
Candidates should know that there are different forms of fertiliser that farmers choose to replenish
soils that naturally lack certain minerals and they choose those that provide the minerals required in larger quantities by the crops they grow. Some candidates confused fertilisers with pesticides and wrote about the health hazards of the latter.
Question 4 (a) Most candidates knew what is meant by the term antibiotic. Vague descriptions of ‘substances’
and ‘effects on bacteria’ did not achieve any marks; suggestions that antibiotics are effective against viruses were rejected. Better candidates tended to discuss how antibiotics function without stating what they are and what they do. Some candidates confused antibiotics with either antibodies or antigens.
(b) (i) Some candidates did not follow the process shown in Fig. 4.1 to gain what should have been an
‘easy’ mark following their response in (a). The most common error was to re-state the fact the bacteria were lower in number because ‘the antibiotic was present in dish B and not in A’.
(ii) Confusion over terminology often meant that the mark for this question was not awarded. The
Examiners expected candidates to state that the bacteria removed from dish B were resistant and had grown in the liquid culture before being added to dish C. Common misconceptions were that the bacteria developed resistance in the liquid medium or that the antibiotic became weaker. Many candidates stated that the bacteria had ‘developing immunity’ or that the ‘immune systems’ in bacteria were responsible. Comments about immunity were very common throughout the whole of Question 4. It is worth pointing out that immunity in humans is a function of the complex interactions between molecules, cells, tissues and organs. A bacterium is one cell so cannot have ‘an immune system’ let alone gain ‘immunity’.
(c) Most successful candidates quoted survival of resistant strains for one mark but did not support this
fully with statements linked to increasing numbers of resistant bacteria. The consequences were infrequently observed and tended to be limited to ‘antibiotic no longer effective’. Ideas about antibiotics acting as selective agents were seen infrequently. Candidates could have used information from Section III 3.6 of the syllabus in this question.
(d) Some candidates discussed the lethal effects of X-rays on bacteria and consequently failed to
score marks. Other answers showed impressive knowledge of mutation, with references to changes in DNA or genes and a link to antibiotic resistance. Several thought that radiation made bacteria more susceptible to antibiotics although this was occasionally linked to a disadvantageous mutation. The link to Section III 3.5 was made by many candidates.
(e) This question asked about differences between the structure of bacteria and viruses. References
to the shapes, relative sizes and infectivity of viruses and bacteria were ignored by the Examiners. Answers that appeared frequently were to do with cell walls, cell membranes, cytoplasm and flagella in bacteria and the protein coat in viruses. If candidates made it clear they were giving a viral feature then they gained a mark. If no organisms were mentioned in the answers then the Examiners assumed that candidates were referring to bacteria given the phraseology of the question. Many candidates thought that bacteria had eukaryotic features such as nuclei and mitochondria.
24
Cambridge International General Certificate of Secondary Education 0610 Biology June 2010
Principal Examiner Report for Teachers
© UCLES 2010
(f) The Examiners noted a mixture of responses and quality of answer in this section. Good candidates were able to specify infection of lymphocytes and the consequential reduction in production of antibodies and loss of effectiveness of phagocytes. Unfortunately, a high proportion of candidates generalised about ‘white blood cells’, ’killing white cells’ or ‘killing phagocytes’. Such comments were not credited. Many stated that lymphocytes produce fewer antibodies, but comments on the role of phagocytes were less precise. Surprisingly few candidates referred correctly to AIDS. Generally the standard of answers was much better than in the past and good candidates gained three or four marks relatively easily. All points given in the mark scheme were seen by the Examiners.
Question 5 (a) (i) Many candidates stated diffusion and respiration. This question was generally well answered.
Some apparent attempts to link back to Question 1(b)(ii) on active transport were detected. Fewer candidates gained a single mark for respiration than for diffusion.
(ii) The mark scheme provided good scope for candidates to achieve this mark. Many combinations of
appropriate substances were seen. A few candidates could only name one substance and did not gain this relatively easy mark.
(iii) As with (i), there were plenty of substances for candidates to choose from. Many lost this mark by
failing to state the name of a ‘waste’ or of a ‘nitrogenous waste substance’. These general terms did not gain credit.
(b) This question asked candidates to describe and explain two adaptations of capillaries. The
Examiners were looking for references to size, thickness of walls, gaps between cells and the concept of a ‘capillary bed’ or ‘network of capillaries’ together with a valid explanation. Good examples were seen from all marking points and the Examiners were impressed with the level of knowledge and description. Common misconceptions included statements such as ‘capillaries are one cell thick’ and ‘thin walls make diffusion faster’. A small number of candidates attempted to gain marks by referring specifically to ‘moist layers’ as in alveoli. These ideas did not gain any marks. Some candidates seemed unfamiliar with this type of question and just gave an explanation without giving a structural feature first.
(c) (i) This caused more confusion for candidates than was anticipated by the Examiners. Many
candidates did not recognise the lymph vessel and others incorrectly described it as a ‘lacteal’. If candidates wrote ‘lacteal – a lymph vessel’ then the Examiners ignored ‘lacteal’ and gave the mark. Common errors were ‘vein’ and ‘artery’. Many left this blank.
(ii) Various responses were given by candidates and not credited. These included active transport,
osmosis, diffusion and peristalsis. The effects of valves were seen occasionally and given credit. Candidates who wrote about the action of muscle contraction in squeezing lymph along lymphatic vessels often implied that muscle in the wall of the lymphatic vessels was responsible. Only the best candidates made it clear that it is the contraction of surrounding muscles that is responsible for the movement of lymph.
Question 6 (a) Almost all candidates were able to achieve at least one mark in this section, but many encountered
problems and failed to separate methane from carbon dioxide. This trend unfortunately continued throughout Question 6. Candidates often did not include any data from Fig. 6.1 in support of their answers. Many who did quote the data failed to give the units or failed to give them in full. It is quite acceptable to write ppm for parts per million. Figures should always be followed by units.
(b) Candidates were not always successful in identifying the different sources of the two gases.
Candidates who did not plan their response and referred to release of both gases when burning fossil fuels were penalised. Good candidates achieved all the available marks with apparent ease. Fewer candidates were familiar with sources of methane production and some linked methane to use as a fuel. The Examiners were surprised by how few candidates referred to rice fields as a source of methane. Waste gases from cattle were described in a variety of different ways and were given as a source of methane on some scripts.
25

Cambridge International General Certificate of Secondary Education 0610 Biology June 2010
Principal Examiner Report for Teachers
© UCLES 2010
(c) Explanations for the greenhouse effect varied widely. Depletion of the ozone layer and increased penetrance of ultra-violet light were common misconceptions. References to wavelengths and to infra-red radiation were seen very rarely but were impressive when used. Weak responses appeared to be written in haste with contradictions and repetition within the six lines available. Many candidates stated that the greenhouse gases retained heat from the sun rather than absorbed heat reflected from the Earth’s surface. They also stated that the ‘Earth warms up’ rather than the atmosphere. The effects of the gases on plants in greenhouses were also seen on several scripts.
This answer revealed some common misconceptions in some candidate’s minds. Carbon dioxide
and methane do not cause acid rain and acid rain is not involved in the greenhouse effect. Carbon dioxide and methane do not break down ozone in the upper atmosphere, leaving holes in it that let in more ultraviolet radiation from the Sun. This ozone depletion does not cause the melting of the Antarctica and global warming.
It is clear that students need guidance on the various gaseous pollutants, their sources, the effects
that they have on the atmosphere and the consequences of these effects. This information could be given to candidates in the form of a table or they could make such a table for themselves using information from various sources. Factsheets suitable for this level are available at http://www.ypte.org.uk/environmental-facts.php for example.
(d) Knowledge of recycling was good in many cases. The most common errors were repetition of the
same point, references to both paper and plastic as biodegradable or non-biodegradable. Vague references to environmental issues such as ‘less pollution’ and ‘animals can be injured’ were not credited, although ‘less deforestation’ and ‘reduction in habitat loss’ were good ideas that gained marks. It was good to see candidates making references to attempts to decrease waste, conserve resources and fossil fuels, and send less garbage to landfill sites.
26

Cambridge International General Certificate of Secondary Education 0610 Biology June 2010
Principal Examiner Report for Teachers
© UCLES 2010
BIOLOGY
Paper 0610/33 Extended Theory 33
General Comments Some Centres clearly prepared the candidates well for this paper and the students were well equipped both in terms of their knowledge and also what was required of them in each question. There continue to be some candidates who barely attempted the examination paper and it is clear that they would be more suited to taking the Core paper (0610 Paper 2). It is very important for Centres to ensure that candidates take the option that is suited to the level of attainment that they have reached. Standards of handwriting and English expression were very variable. Some candidates write very clearly indeed; however, answers from some candidates were barely legible and were hard for the Examiners to decipher. Some of these candidates would have benefited from having amanuenses to write their scripts or they should have typed their responses. There were occasions when answers were completely illegible which makes it impossible to credit the response. Questions in this paper concentrated on several aspects of the supplementary sections of the syllabus. Candidates should be aware that three quarters of the marks on this paper are based on topics from the supplementary section of the syllabus. The Examiners saw a wide range of responses to the questions. At the top of the range there were some very sophisticated answers that were very well expressed. Most candidates coped adequately with the less challenging questions, such as labelling the reflex arc (Question 1(b)(i)) and calculating the difference in yield as a percentage in Question 3(a)(i). However, they often found it difficult to describe effects on yield using data from Table 3.1 in Question 3 (a)(iii) and explain the reasons for trends in concentrations of carbon dioxide and methane in the atmosphere in Question 6. Candidates who understood the demands of questions found most parts of Questions 1, 2, 4 and 5 fairly straightforward, although many found Question 5(c)(i) and (ii) on the lymphatic system difficult to answer. Some gave the answer to Question 3(b) as the answer to 3(a)(iii), which some misinterpreted. These are explored in depth in the sections on individual questions below. The detail expected in some of the answers was clearly very challenging for many candidates. This was particularly noticeable in the part questions requiring longer answers in Questions 4, 5 and 6. The syllabus now contains definitions of many terms. Candidates are expected to know these definitions and the answers expected by the Examiners will be those definitions given in the syllabus. Candidates are expected to translate information from one form to another (Assessment Objective B2). This means that they should give quantitative statements and support these statements with data from the table or graph provided. In Question 3(a)(iii), candidates tended to write out the data from Table 3.1. For example, they stated that when chemical fertilisers were used the yield was 21.2 tonnes per hectare; adding manure the yield was 19.3 tonnes per hectare and adding both chemical fertilisers and manure the yield was 24.3 tonnes per hectare. The Examiners are not permitted to insert words such as ‘greater’ and ‘less than’ to make answers which would gain marks; that is the candidate’s role, so although the data is quoted it is not used in support of relevant statements. Questions 2(b) and 5(b) asked candidates to describe and explain ways in which leaves of xerophytes and capillaries are adapted to their functions. Some candidates did not seem familiar with this type of question and failed to give clear structural features first. This is clearly a question style that needs practice for many. In longer questions some candidates used up the space for the answers. Candidates who continue their answers elsewhere on the examination paper are advised to indicate this clearly as continuation answers are not always obvious to the Examiners.
27

Cambridge International General Certificate of Secondary Education 0610 Biology June 2010
Principal Examiner Report for Teachers
© UCLES 2010
Candidates from many Centres routinely use the term marine to describe aquatic organisms that live in freshwater. Marine refers only to organisms living in salt water, in the sea. Comments on specific questions Question 1 (a) There were three marks for this question. Many candidates stated that sensitivity is a response to
a stimulus, but missed the point that stimuli are detected. Involuntary action was often described in vague terms and frequent references to ‘no involvement of the brain’ or ‘no control’ were seen and not credited. It should be noted that sensitivity is neither the effectiveness of the receptors nor the density of receptors in an area as stated by some candidates.
(b) (i) Most candidates labelled three or four of the parts of the reflex arc correctly. Common mistakes
were to identify the receptor (C) as a sensory neurone and the motor neurone (B) as the sensory neurone. The muscle was sometimes referred to as the biceps. Sensory was often written incorrectly as ‘sensoric’ and motor as ‘motoric’
(ii) The Examiners did not allow credit for descriptions that did not include use of the terms ions or
molecules. Many candidates referred to ‘particles’ or ‘substances’ which the Examiners consider inappropriate at this level. Section II 4.2 of the syllabus defines active transport as the movement of ions. Most candidates knew that energy was required and often referred to ATP. Various contradictory statements related to concentration gradients were seen in which the movement was described as ‘against a concentration gradient, e.g. from high concentration to low concentration’. Candidates were more successful when descriptions were structured in a simple way. These is sufficient time to allow candidates to plan answers before commitment to the paper.
(c) There were some accurate and well written answers to this question on the consequence of a
lesion across the ventral root of a spinal nerve. Candidates identified that the tap of the hammer would still be felt, or alternatively that impulses would be carried in the sensory neurone. Unfortunately, some candidates used ‘message’ or ‘signal’ to describe the impulse and Examiners did not credit these terms. Many candidates did not clarify their ideas in this explanation, with references to the brain, slowing down of the reaction and description of the cut as a synapse being common errors. Some candidates also confused the sensory and motor neurones which made it impossible to apply some of the marking points to their answers. They did this even though they often identified these neurones correctly in (b)(i). Many thought that the impulse or ‘message’ came from the brain along the motor neurone to the muscle. Answers to this question were often quite convoluted and it was sometimes difficult for the Examiners to tease out the marking points.
(d) Many candidates did not achieve the mark. The Examiners accepted statements that correctly
referred to the working of the nervous system or even that ‘nerves worked correctly’, but frequently rejected answers based on ‘testing for life’ or ‘to see if reflexes work’. As the term reflex was mentioned twice in the question stem and Fig. 1.2 provided additional information candidates should be advised that repetition of the stem cannot be credited.
Question 2 (a) Fig. 2.1 showed the root systems of two desert plants. Candidates had to describe and explain
how each is adapted for survival. Most candidates gave a description of root ‘depth’ for plant A and recognised the function as absorption of water. Descriptions for plant B were less precise and were explained in terms of increased surface area rather than to gather available water near to the surface. The mark available for large surface area was linked to both plants and was relatively infrequently observed in responses. Many candidates stated that the roots were long but did not qualify this, as many others did, with terms such as vertical and horizontal; ‘long’ on its own did not gain credit. Some candidates interpreted the question to mean which of the two plants would survive in a dry desert habitat thinking that B was not a desert plant and would soon die. They often favoured plant A which meant that their answers did not gain more than two marks. Some candidates answered in terms of anchorage and preventing plants being uprooted in high winds and by animals. Some referred to roots ‘digging’ for water. Neither of these ideas gained any credit. No root hairs are visible in the diagram even though candidates often described them as if they were. Some candidates missed the obvious cue in the question and wrote about mineral and nutrient uptake rather than water absorption.
28
Cambridge International General Certificate of Secondary Education 0610 Biology June 2010
Principal Examiner Report for Teachers
© UCLES 2010
(b) Candidates were required to describe and explain two ways in which the leaves of desert plants
reduce water loss. Many described the features but could go no further with the explanations that ‘to reduce water loss’ which is in the question. Many responses referred to the leaf cuticle but as this was not linked to ‘thick’ the mark was not awarded. Few could explain successfully how the thick cuticle helps to reduce water loss. Many stated that it prevents water loss which is not the case. Candidates could say that the thicker cuticle increases the distance for diffusion or that the wax makes the cuticle less permeable to water. Similarly ‘stomatal closure’ was left unqualified and Examiners were not informed about when this closure occurred to secure the mark. Each explanation needed to be clearly linked to a description to gain two marks. If the description was not made clear, then no marks were awarded for explanations as they were not linked to the correct adaptation. Very good examples were seen that covered all the alternatives in the mark scheme; these were often very well written answers.
(c) The candidates had to complete the table on sources and sinks in translocation for six marks.
Most managed this successfully although some did not gain the mark for substances transported in phloem as glucose and starch were frequently given and did not gain the mark. Some were less secure on the source and sink for the phloem, but the majority gave the source as roots and the sink as leaves for the xylem. Some candidates did not follow the instruction to name organs. Incorrect answers included the names of cells, such as root hair cells and mesophyll cells, the term ‘shoot’ and ‘the rest of the plant’.
Question 3 (a) (i) Many candidates gave the correct percentage as 92.86 or 92.9 or 93. Most candidates included
their working. Incorrect answers included 92.8% but with correct working one point was awarded. Candidates should always be advised to include working as one mark is available for the correct working in calculations like this if the answer is missing or incorrect. Candidates should also follow any instructions given about how to express their answers. In this case there were none, so most candidates expressed their answer to one or two decimal places or stated that they were giving their answer to two or three significant figures. Candidates should be advised that they need a calculator in their Biology examinations and that they should round up their answers correctly. Some candidates tried calculating the answer by long division which wasted time and often failed to give the right answer.
(ii) The Examiners looked for use of the figures from Table 3.1 but this was not often observed. Many
candidates were not sure how to approach this question. Candidates who stated that taller plants have more leaves and that this leads to increased photosynthesis gained two marks with apparent ease. The Examiners did not accept answers that linked height to ‘reaching light’ without reference to the number of leaves. Some candidates appeared to think that potato tubers were borne on aerial parts of the plant and not underground; they did not apply their knowledge of the syllabus from section III 1.1.1 about asexual reproduction in potatoes. Candidates could have referred to the ‘earthing up’ that is done to encourage tuber production.
(iii) Descriptions were sometimes very detailed, used data from the table in support and easily gained
full marks. Most candidates gave ‘increased yield’ for one mark and compared the effects of manure and chemical fertilisers together with ‘none’ for their second mark. Without clear identification of the results obtained when manure or chemical fertilisers were used alone the third mark was not available. Weaker responses attempted to describe components of manure or specify chemical elements in fertiliser without success.
(iv) The Examiners were looking for specific references to nitrate ions and expected to see a clear link
between incorporation of nitrate in amino acids or proteins followed by the importance of protein in growth. These two marks were frequently achieved. References to enzymes and manufacture of chlorophyll were credited, but less often observed. Some candidates answered this question in terms of events in the nitrogen cycle that occur outside plants and are mediated by microorganisms. There were a few descriptions of nitrification making nitrate ions available to plants. Some wrote about the role of Rhizobium. Neither approach answered the question.
(v) The concept of control was well known and well answered. Some candidates, however, did not
appreciate the difference between a control experiment, as in Plot E, and a controlled experiment in which variables are controlled.
29

Cambridge International General Certificate of Secondary Education 0610 Biology June 2010
Principal Examiner Report for Teachers
© UCLES 2010
(b) Most candidates made the obvious point that fertilisers increase crop yields. However, candidate found it more difficult to give other advantages of applying fertilisers to crops. Many responses appeared to be written without a planned approach and in many cases quality suffered and contradictory statements were made. Some candidates chose to tabulate their answers which did help.
The majority of answers did not achieve more than one mark for an advantage, but many achieved
marks for listing disadvantages. These often included references to lowering the water potential of soil water, providing ions for the growth of weeds and possible effects on humans. It was surprising that the benefits of chemical fertilisers are not better known and this is obviously something that candidates have not appreciated; instead, they have a very clear understanding of the consequences of misuse of fertilisers which in many parts of the world is a thing of the past.
Candidates should know that there are different forms of fertiliser that farmers choose to replenish
soils that naturally lack certain minerals and they choose those that provide the minerals required in larger quantities by the crops they grow. Some candidates confused fertilisers with pesticides and wrote about the health hazards of the latter.
Question 4 (a) Most candidates knew what is meant by the term antibiotic. Vague descriptions of ‘substances’
and ‘effects on bacteria’ did not achieve any marks; suggestions that antibiotics are effective against viruses were rejected. Better candidates tended to discuss how antibiotics function without stating what they are and what they do. Some candidates confused antibiotics with either antibodies or antigens.
(b) (i) Some candidates did not follow the process shown in Fig. 4.1 to gain what should have been an
‘easy’ mark following their response in (a). The most common error was to re-state the fact the bacteria were lower in number because ‘the antibiotic was present in dish B and not in A’.
(ii) Confusion over terminology often meant that the mark for this question was not awarded. The
Examiners expected candidates to state that the bacteria removed from dish B were resistant and had grown in the liquid culture before being added to dish C. Common misconceptions were that the bacteria developed resistance in the liquid medium or that the antibiotic became weaker. Many candidates stated that the bacteria had ‘developing immunity’ or that the ‘immune systems’ in bacteria were responsible. Comments about immunity were very common throughout the whole of Question 4. It is worth pointing out that immunity in humans is a function of the complex interactions between molecules, cells, tissues and organs. A bacterium is one cell so cannot have ‘an immune system’ let alone gain ‘immunity’.
(c) Most successful candidates quoted survival of resistant strains for one mark but did not support this
fully with statements linked to increasing numbers of resistant bacteria. The consequences were infrequently observed and tended to be limited to ‘antibiotic no longer effective’. Ideas about antibiotics acting as selective agents were seen infrequently. Candidates could have used information from Section III 3.6 of the syllabus in this question.
(d) Some candidates discussed the lethal effects of X-rays on bacteria and consequently failed to
score marks. Other answers showed impressive knowledge of mutation, with references to changes in DNA or genes and a link to antibiotic resistance. Several thought that radiation made bacteria more susceptible to antibiotics although this was occasionally linked to a disadvantageous mutation. The link to Section III 3.5 was made by many candidates.
(e) This question asked about differences between the structure of bacteria and viruses. References
to the shapes, relative sizes and infectivity of viruses and bacteria were ignored by the Examiners. Answers that appeared frequently were to do with cell walls, cell membranes, cytoplasm and flagella in bacteria and the protein coat in viruses. If candidates made it clear they were giving a viral feature then they gained a mark. If no organisms were mentioned in the answers then the Examiners assumed that candidates were referring to bacteria given the phraseology of the question. Many candidates thought that bacteria had eukaryotic features such as nuclei and mitochondria.
30
Cambridge International General Certificate of Secondary Education 0610 Biology June 2010
Principal Examiner Report for Teachers
© UCLES 2010
(f) The Examiners noted a mixture of responses and quality of answer in this section. Good candidates were able to specify infection of lymphocytes and the consequential reduction in production of antibodies and loss of effectiveness of phagocytes. Unfortunately, a high proportion of candidates generalised about ‘white blood cells’, ’killing white cells’ or ‘killing phagocytes’. Such comments were not credited. Many stated that lymphocytes produce fewer antibodies, but comments on the role of phagocytes were less precise. Surprisingly few candidates referred correctly to AIDS. Generally the standard of answers was much better than in the past and good candidates gained three or four marks relatively easily. All points given in the mark scheme were seen by the Examiners.
Question 5 (a) (i) Many candidates stated diffusion and respiration. This question was generally well answered.
Some apparent attempts to link back to Question 1(b)(ii) on active transport were detected. Fewer candidates gained a single mark for respiration than for diffusion.
(ii) The mark scheme provided good scope for candidates to achieve this mark. Many combinations of
appropriate substances were seen. A few candidates could only name one substance and did not gain this relatively easy mark.
(iii) As with (i), there were plenty of substances for candidates to choose from. Many lost this mark by
failing to state the name of a ‘waste’ or of a ‘nitrogenous waste substance’. These general terms did not gain credit.
(b) This question asked candidates to describe and explain two adaptations of capillaries. The
Examiners were looking for references to size, thickness of walls, gaps between cells and the concept of a ‘capillary bed’ or ‘network of capillaries’ together with a valid explanation. Good examples were seen from all marking points and the Examiners were impressed with the level of knowledge and description. Common misconceptions included statements such as ‘capillaries are one cell thick’ and ‘thin walls make diffusion faster’. A small number of candidates attempted to gain marks by referring specifically to ‘moist layers’ as in alveoli. These ideas did not gain any marks. Some candidates seemed unfamiliar with this type of question and just gave an explanation without giving a structural feature first.
(c) (i) This caused more confusion for candidates than was anticipated by the Examiners. Many
candidates did not recognise the lymph vessel and others incorrectly described it as a ‘lacteal’. If candidates wrote ‘lacteal – a lymph vessel’ then the Examiners ignored ‘lacteal’ and gave the mark. Common errors were ‘vein’ and ‘artery’. Many left this blank.
(ii) Various responses were given by candidates and not credited. These included active transport,
osmosis, diffusion and peristalsis. The effects of valves were seen occasionally and given credit. Candidates who wrote about the action of muscle contraction in squeezing lymph along lymphatic vessels often implied that muscle in the wall of the lymphatic vessels was responsible. Only the best candidates made it clear that it is the contraction of surrounding muscles that is responsible for the movement of lymph.
Question 6 (a) Almost all candidates were able to achieve at least one mark in this section, but many encountered
problems and failed to separate methane from carbon dioxide. This trend unfortunately continued throughout Question 6. Candidates often did not include any data from Fig. 6.1 in support of their answers. Many who did quote the data failed to give the units or failed to give them in full. It is quite acceptable to write ppm for parts per million. Figures should always be followed by units.
(b) Candidates were not always successful in identifying the different sources of the two gases.
Candidates who did not plan their response and referred to release of both gases when burning fossil fuels were penalised. Good candidates achieved all the available marks with apparent ease. Fewer candidates were familiar with sources of methane production and some linked methane to use as a fuel. The Examiners were surprised by how few candidates referred to rice fields as a source of methane. Waste gases from cattle were described in a variety of different ways and were given as a source of methane on some scripts.
31
Cambridge International General Certificate of Secondary Education 0610 Biology June 2010
Principal Examiner Report for Teachers
© UCLES 2010
(c) Explanations for the greenhouse effect varied widely. Depletion of the ozone layer and increased penetrance of ultra-violet light were common misconceptions. References to wavelengths and to infra-red radiation were seen very rarely but were impressive when used. Weak responses appeared to be written in haste with contradictions and repetition within the six lines available. Many candidates stated that the greenhouse gases retained heat from the sun rather than absorbed heat reflected from the Earth’s surface. They also stated that the ‘Earth warms up’ rather than the atmosphere. The effects of the gases on plants in greenhouses were also seen on several scripts.
This answer revealed some common misconceptions in some candidate’s minds. Carbon dioxide
and methane do not cause acid rain and acid rain is not involved in the greenhouse effect. Carbon dioxide and methane do not break down ozone in the upper atmosphere, leaving holes in it that let in more ultraviolet radiation from the Sun. This ozone depletion does not cause the melting of the Antarctica and global warming.
It is clear that students need guidance on the various gaseous pollutants, their sources, the effects
that they have on the atmosphere and the consequences of these effects. This information could be given to candidates in the form of a table or they could make such a table for themselves using information from various sources. Factsheets suitable for this level are available at http://www.ypte.org.uk/environmental-facts.php for example.
(d) Knowledge of recycling was good in many cases. The most common errors were repetition of the
same point, references to both paper and plastic as biodegradable or non-biodegradable. Vague references to environmental issues such as ‘less pollution’ and ‘animals can be injured’ were not credited, although ‘less deforestation’ and ‘reduction in habitat loss’ were good ideas that gained marks. It was good to see candidates making references to attempts to decrease waste, conserve resources and fossil fuels, and send less garbage to landfill sites.
32
Cambridge International General Certificate of Secondary Education 0610 Biology June 2010
Principal Examiner Report for Teachers
© UCLES 2010
BIOLOGY
Paper 0610/04 Coursework
General comments It is pleasing to see many new Centres entering their candidates for this Paper. There is no doubt that a great deal of work is involved in the initial construction of tasks and mark schemes, and in the organisation of assessments throughout the course, but the benefits are considerable. Teachers remain fully in charge of the assessment process, and the feedback given to the candidates throughout the year is invaluable in helping them to improve their practical skills. Many Centres like to use essentially the same tasks each year, but others make changes, introducing new tasks from time to time. It is pleasing to see several Centres taking candidates outside the laboratory, for example to investigate the relationship between leaf size and aspect. C2 tasks often include an observation and drawing exercise, as well as 'wet' practicals involving the measurement and recording of numerical results in tables. Osmosis, enzymes, transpiration, photosynthesis, energy content of foods, respiration and germination all appear frequently in tasks designed to assess C2, C3, and C4. For skill C1, most Centres correctly use and submit tick lists or summaries of each candidate's performance on a particular task, linked clearly to the mark scheme. Some Centres failed to supply adequate evidence for their C1 assessments. The skills assessed are ephemeral, and so there is nothing written by candidates that the Moderators can see. The external Moderators cannot check on assessment of candidate’s performance without the records kept and submitted by the teacher, and unable to sustain high marks in the absence of such evidence. Task-specific mark schemes are also correctly used by most Centres. However a minority of Centres fail to provide such task-specific mark schemes. Generic criteria for each level of each skill are provided in the syllabus. The teacher's uses these generic criteria to construct a set of task-specific criteria that link directly to the assessment of the particular task. This is essential in allowing the teacher or teachers to seek and identify particular points in the work of individual candidates so that the correct level can be awarded. The external Moderators depend upon these task-specific schemes for verifying teacher judgements. Again, it is not possible to sustain high marks in their absence or if they are too brief. It is very pleasing to see the continued excellent use of IT by Centres in administering the coursework assessments. Many Centres produce very clear and professional worksheets and mark schemes as well as keeping meticulous and very well organised records. Care needs to be taken in the use of graph-drawing programs by candidates. For C3, candidates must be able to process and display their results appropriately. This can certainly be done on a computer, but the candidate must remain in charge of the process and not allow the software to make all the decisions. Numerous examples are seen of poorly constructed graphs produced in this way. Scales and axis labels should be decided on by the candidate, and all plotted points should be clearly visible, for example by using crosses, rather than large, solid shapes. The type of line drawn should be also be the candidate's decision, not that of the software. Centres are reminded that the external moderator needs to see the candidates' original work, not a fair copy that has been made after the assessment. This work should be clearly marked by the teacher. This is generally done very well, but there are occasions where the marking of the work is non-existent or minimal, making it very difficult to see if major errors have been noticed, and how the marks have been awarded. C4 involves planning, carrying out and evaluating an experiment. There are some excellent examples of this amongst the coursework samples, and it is very encouraging to see many candidates developing considerable confidence and abilities in this area. Most of them give every appearance of enjoying the responsibility of doing their own experiment. It is usually helpful if they begin with a clearly focused problem or hypothesis, and then think very clearly about variables, making a list of which variable they are going to
33

Cambridge International General Certificate of Secondary Education 0610 Biology June 2010
Principal Examiner Report for Teachers
© UCLES 2010
change, which they will measure and which they will try to keep constant. The results of their experiment should always be included. These are not part of the assessment of C4, but it helps to put the evaluation of their plan into perspective.
34
Cambridge International General Certificate of Secondary Education 0610 Biology June 2010
Principal Examiner Report for Teachers
© UCLES 2010
BIOLOGY
Paper 0610/51 Practical Test 51
General comments The paper produced a wide range of marks, similar to that in previous years. There were some candidates performing very well compared to others who were ill prepared to deal with the required tasks. Candidates attempted all questions and most showed that they had adequate time to finish the paper. There were a number of scripts where 2(d) had been left entirely blank though there was no mention of insufficient time in the Supervisor Reports. The Supervisor’s Reports are an invaluable resource to Examiners in assessing candidates’ work. It could be that a material behaved in a way not anticipated or that candidates were supplied with a specimen that had different features. This can then be considered in the approach to the mark scheme and under these circumstances, candidates can gain credit for what they observe and report even if not as expected. Any additional information can be helpful, so Centres should include information that they consider being of assistance, even if not specifically requested. If any difficulty is experienced in supplying suitable material or if any queries concerning how material should be presented, Centres should contact CIE for advice, well in advance of the examination date. The standard of English was generally good and the presentation of answers showed a clear understanding of most questions. Many candidates were well prepared for the Practical Test and did gain marks and yet there were discerning questions or parts of questions for the more able candidate to stretch their abilities. Candidates’ drawings were generally good but the use of a medium or HB pencil is essential and this was requested in the materials list for Question 1 [see Confidential Instructions]. Some Centres still need to advise candidates not to use ink pens whether ballpoint or otherwise. Outlines for drawings must always be with the use of a clear, single unbroken line in pencil which can be erased if alterations are necessary. Quite a number of candidates do not label diagrams when asked for a labelled diagram. Label lines should be ruled and make contact with the relevant structure. On graphs, points should be clearly and carefully positioned using a small cross. Smooth single lines should be drawn in pencil with a ruler if appropriate Comments on specific questions Question 1 This question was based on the histology and functioning of blood vessels and in the practical component, the extension of an artery with added masses and the subsequent recoil of the vessel when the mass of weight was removed. (a) (i) A photomicrograph was printed showing the transverse section of three blood vessels; an artery, a
vein and a capillary. No scale was given. Many textbooks include similar photomicrographs though not all. It appears that some candidates did not recognise these structures even though the question clearly states what was shown and then later went on to identify these structures incorrectly as blood cells or plant stems / roots.
The drawings needed to be of an equal or larger size than the actual section. This was possible if
one blood vessel namely section of the artery, X, was drawn in the view shown. Unfortunately, several candidates attempted to draw both vessels and others drew a longitudinal view often in three dimensions, [3D], with a small cross section at one end.
35
Cambridge International General Certificate of Secondary Education 0610 Biology June 2010
Principal Examiner Report for Teachers
© UCLES 2010
The outline mark required clear unbroken lines with no shading to show cellular detail as in a plan
drawing. Some candidates incorrectly used a compass to construct the lines which shows ingenuity but not accuracy and the section does not show concentric circles. Most candidates showed more than the inner and outer lines representing the other layers of different tissues. The detail mark was awarded for either the close observation of the inner surface showing minute ‘infolding’ of the endothelium or the asymmetric area of a bulge by the stained area of the lumen.
Many labels indicated the thickness of the wall and the lumen. Others referred to the muscle or
elastic layers and a few candidates used the histological terms for the layers expected at more advanced levels. There were unfortunately a number of drawings where no labels were given.
(ii) Most candidates could identify the type of blood vessel correctly as an artery. Errors were noted
amongst the less able candidates where the structure was mis-identified as a blood cell or a plant cell.
(iii) This part of the question was well answered. Two features were described by most candidates to
support their identification of blood vessel X as an artery. These features were usually the size of the lumen and the thickness of the wall. Some candidates described the features which were present for a vein and how the artery differed and yet others compared all three types of blood vessel.
(b) (i) It was evident from the completed columns in Table 1.1 that candidates were able to carry out the
practical procedure adding the mass of weights to stretch the 5 mm section of a blood vessel, an artery and to measure the increase in diameter as the blood vessel extended. In most cases the blood vessel extended significantly with the addition of each increase in mass of weight.
However, some candidates did not use millimetres as the unit of measurement. Some used
centimetres and a few inappropriately used inches. It was the calculation for the third column – the increase in diameter that caused difficulties.
The wording in the stem of the question was intended to aid the determination of a cumulative
series of values by subtracting each increment from the original starting diameter not from the previous measurement. About half of the candidates did not record a cumulative increase and so the value appeared to decrease as more masses of weights were added. This was taken into consideration when marking the plotting for 1(b)(ii).
From the uniform measurements recorded by a few candidates it appeared that sometimes the
blood vessels provided had dried out and were not able to extend as increasing masses of weights were added.
(ii) The quality of the graphs was variable. There were some Centres whose candidates had been
well prepared and presented excellent line graphs with correctly orientated and labelled axes. The controlled variable in the first column of the table should be on the x-axis and the measured variable on the y-axis, which in this case was the increase in diameter. There were a significant number of candidates who incorrectly plotted the actual measurements from the second column in the table.
Candidates are expected to make good use of the printed graph paper available. Many used a
suitable scale to fill more than half of the printed area even when the increase in diameter was not calculated cumulatively. The increments should be evenly spaced out to cover the whole range of values.
Most candidates plotted the data points accurately but not all used a cross to indicate the position
of the point. A common error was to omit the zero point at the origin. A line graph was expected as there were two continuous variables to be plotted. A few candidates
presented the data as a histogram. Lines joining the plotted points were often neat and ruled carefully or drawn passing through the
points in a smooth curve. There were still a number of unacceptable lines where the actual line was drawn freehand, sketched and inaccurate or too thick obscuring the points. The line should
36
Cambridge International General Certificate of Secondary Education 0610 Biology June 2010
Principal Examiner Report for Teachers
© UCLES 2010
not extend beyond the last plotted point for the mass of weights, 50 g, though many candidates incorrectly extrapolated this line.
(iii) In most investigations, the piece of artery did decrease in diameter when the mass of weights was
removed even if the diameter failed to return to the original size. If the size was not the same as the original, some candidates referred to this as ‘an increase’ and failed to report the decrease.
It appeared that sometimes the blood vessels provided had dried out and were not able to recoil
when masses of weights were removed. A few candidates did not understand what was expected and left this question and the next blank. Candidates should be encouraged not to leave any questions blank, but to go back at the end of the examination and write whatever seems appropriate.
(iv) Candidates were expected to give an explanation for the decrease in diameter of the blood vessel
when the mass of weights was removed. This required some knowledge about the nature of the tissues to be found in the wall, namely elastic fibres and their ability to recoil after being stretched. These elastic fibres are to be found in the connective tissue not in the muscles. Explanations involving the elastic limit of the walls and overstretching were considered when no decrease in diameter was observed in the previous question (b) (iii).
Question 2 This question was based on the comparison of the structure and nutrient content of two tubers, sweet potato Ipomoea batanus S2 and the Irish potato Solanum tuberosum S3. Candidates were provided with two slices each 1 cm thick of each tuber, with the outer skin intact. (a) (i) Candidates were expected to observe the specimens provided and to identify and describe two
similar features. The similarities considered might include reference to: colour; texture of the outer layer; the presence of what was described as second layer around the interior or the tissue inside. There were a surprising number of candidates who reiterated the points given in the stem such as they were both tubers and they were storage organs for carbohydrates.
(ii) A table was printed for candidates to record two observable differences between S2 and S3 so that
one difference was compared for both specimens per row. This rubric was exactly what most candidates followed giving differences ranging from the shape or size of the slices of tissue provided to the details of colour or texture of the outer layers, the presence of a second layer or comparing the inner tissue.
Some candidates tried to list more than one difference per row and added extra boxes below the
table. It was not unusual to have features in one row matching with a feature in the second row. It is important to compare the same feature.
It was noted, however, that some candidates appeared to have muddled the two specimens. One
Centre reported that the specimens had been mislabelled but here a number of candidates had realised this and swapped over the specimens.
(b) This question was based on the starch – iodine test. The candidates were given a series of
instructions and the iodine solution was provided in a dish to enable the specimens to be dipped into the solution and observed quickly. A table was given for candidates to record their observations.
Most candidates followed the excepted procedure and recorded the colour change. The colours
noted varied from blue, to blue – black, purple or black and these depended on the concentration of the iodine solution provided. Sometimes a negative response was noted. No explanation was required.
(c) (i) Most candidates answered this part of the question well giving details of the procedure for the
reducing sugar test. A few candidates correctly specified the quantities of water or reagent needed for the test to compare the reducing sugar content of the two specimens. Many candidates failed to include any safety factors. Although the comparative final colouration point was made, many candidates failed to explain the expected colour change by omitting the original colour prior to heating the reagent with the prepared sample of tissue or extract from the tissue.
37
Cambridge International General Certificate of Secondary Education 0610 Biology June 2010
Principal Examiner Report for Teachers
© UCLES 2010
(ii) After following the outlined procedure of extracting the reducing sugars from the tissues, the candidates were expected to report on their observations by describing the observed colour changes and to draw a brief comparison as to whether S2 or S3 contained more reducing sugar.
Candidates do need to record the observed colours rather than reporting that ‘the colour changed’.
The Benedict’s test is semi-quantitative and the actual colours are important. Green or turquoise indicates there is a small quantity of reducing sugar present and as the colour changes through to yellow, orange to red or reddish brown, there is an increase in the quantity of reducing sugar. No change from the original blue indicates an absence of reducing sugar and this blue colour needs to be mentioned.
(d) (i) The biuret test for proteins was well described by some candidates with similar ideas for specifying
equal quantities of tissue and reagents for comparison of the final expected colours as mentioned above in (c)(i) for reducing sugars. Again the original colour of the reagent was not given by most candidates when describing the expected colour change.
(ii) It was expected that the Irish potato would show the presence of some protein and the sweet
potato less or no protein however many Supervisor’s reports recoded none present in either tissue. Candidates needed to record the actual colour and to state no protein present if that was the case.
Some specimens did give a colour change from blue to mauve / purple / lilac for the presence of protein in the S3 – Irish potato.
Unfortunately, a number of candidates did not describe the correct test and placed the test-tubes
containing the sample of potato and reagents into a heated water bath and obtained a colour change from blue to yellow for the Irish potato – unfortunately repeating the reducing sugar test. There were a number of scripts seen where the whole of 2d was left blank. Candidates should be encouraged to write something in all parts of the examination paper even if they are not sure that it is correct.
38
Cambridge International General Certificate of Secondary Education 0610 Biology June 2010
Principal Examiner Report for Teachers
© UCLES 2010
BIOLOGY
Paper 0610/52 Practical Test 52
General comments Candidates from many Centres were able to plan and carry out practical work safely and effectively. Those from some other Centres seemed not to have had the necessary laboratory practice to develop these skills. Consequently there was a wide range of marks. The candidate’s observations of the tests for reducing sugar and starch varied from Centre to Centre. The Examiners were grateful to those Supervisors who wrote careful accounts of their own results using the same shredded leaves and reagents supplied to the candidates. The Examiners were greatly helped by the photographs sent in by some Centres to identify the species provided to their candidates. Candidates are advised to provide themselves with well sharpened medium or HB pencils and good erasers. Some drawings looked as if the candidates had tried to change lines but could not get rid of their first attempts. Comments on specific questions Question 1 Parts (a) and (b) depended on careful observation of photographs of a sheep’s and a dog’s skull. Part (c) was based on food tests which candidates were expected to have performed during their courses. (a) (i) Some candidates commented as expected on the possession of different kinds of teeth or that
teeth were present on both jaws. By far the greater majority of candidates pointed out, correctly, that both skulls had molars, or premolars, or teeth for chewing or grinding food.
Other candidates described features of the skulls other than teeth or features which could not have
been seen from the photographs, like chemical composition or sharpness. (ii) Candidates were directed to compare similar features using the table 1.1. Some candidates did
not match comments for the same feature. It was surprising that very few candidates noticed the complete absence of teeth in the upper jaw of
the sheep. Good candidates noticed the presence or absence of canines, or correctly described the space between the front and back teeth of the sheep or used the term diastema. Some candidates also noticed the small gaps between the dog’s teeth. A few candidates described the protruding or overlapping teeth in the dog’s skull which were not shown in the sheep.
Most candidates observed one difference and only a few correctly described two differences. (b) (i) Almost all the candidates correctly identified their own teeth to complete the table. Common errors
were confusing C (canines) with I (incisors) or recording two canines in each half jaw.
39
Cambridge International General Certificate of Secondary Education 0610 Biology June 2010
Principal Examiner Report for Teachers
© UCLES 2010
(ii) Many candidates were able to describe one difference between their own and the dog’s teeth. Not many candidates could find two correct differences.
Again many candidates cited the small gaps between some of the dog’s teeth which could clearly
be seen in the photograph and which were absent from their own close fitting teeth. Good candidates recognised the differences in proportions between the dog’s teeth and their own but found them hard to describe. Often ‘sharp’ was used instead of ‘pointed’ for differences in shape.
Difference in the number of teeth was not a valid point because it was not possible to see all the
dog’s teeth in the photograph. (c) (i) Generally candidates were able to describe the procedure for testing for reducing sugars but many
spoiled their accounts with imprecise phrases. There was a mark for describing putting S1 and S2 into test tubes but some candidates did not make it clear that the raw leaves and cooked leaves would be in separate test-tubes.
The large majority of candidates forgot to mention stirring the sample with water to dissolve soluble
reducing sugar. The question asked how the reducing sugar content of S1 and S2 could be compared. This
necessitates heating the same quantities of S1 and S2 and of reagents to the same temperature for the same length of time. Again, there were imprecise statements. “A few minutes” was too vague. The word ‘amount’ was not an alternative for ‘volume’ or ‘mass’. Candidates should be encouraged to write exactly what they mean. vague
Most candidates were clear about the safety precautions and described them well. Quite a lot
forgot to mention that the water in the water would have to be hot although some gave the actual temperature. The tubes would have to be heated. Warming would not be sufficient.
A common mistake was to describe the colour change without stating the initial colour. The final
colour in the sequence from blue to green, yellow, red, was the basis of the comparison of reducing sugar content if the tubes had been treated in exactly the same way.
(ii) The iodine test for starch was well known. (The iodine used is dissolved in potassium iodide
solution. Candidates are not expected to know this but they are expected to know that the iodine reagent is a solution.) Common errors were referring to the iodine solution as ‘iodine’, stating that the test would be performed in a test tube, heating the mixture and not making any comparison between S1 and S2.
Parts (c) (iii), (iv) and (v) All three sections depended on the results of the tests for reducing sugar and starch carried out by the candidates on the raw and cooked leaves, S1 and S2 respectively. Many candidates had difficulty in placing their answers. (iii) Candidates should have written their observations here. All that was wanted was the final colour of
the reagent for each food tested. “No change” was accepted or “remained blue”, but not comments about the presence or absence of reducing sugar or starch.
(iv) Conclusions about the presence or absence of reducing sugar and starch in the shredded leaves
before and after cooking, based on the candidates reported colour changes, should have been written here. Generalised comments about carbohydrates which includes both starch and reducing sugar were not precise enough. Many candidates used ‘carbohydrates’ and ‘starch’ as synonyms and some candidates wrote ‘glucose’ instead of ‘reducing sugar’.
40
Cambridge International General Certificate of Secondary Education 0610 Biology June 2010
Principal Examiner Report for Teachers
© UCLES 2010
(v) The Examiners were pleased that some candidates made connections between different parts of the syllabus to answer this question; they referred to the denaturing of enzymes and whether the leaves stored starch or had recently photosynthesised reducing sugar. As well as the removal of soluble reducing sugar by the cooking water, able candidates suggested that damage to cell structure released foods or let reagents penetrate. Plausible explanations which were compatible with the candidates own results, such as the leaves being destarched by being kept in the dark before they were cooked, were credited.
Reference to starch, reducing sugar or carbohydrates, being’ killed’, ‘dying’ or being ‘denatured’
during cooking were incorrect. Question 2 Candidates were supplied with a branch from a plant bearing 10 attached leaves. (a) (i) Many candidates found it difficult to describe the order of attachment of leaves to the branch, in
pairs, randomly, alternately and so on. A few candidates overcame their language difficulties by drawing the arrangement in the space for the next answer, or made thumbnail sketches in the left hand margin.
For another mark they could have described the resulting spacing of leaves as a layer and whether
they were overlapping or not. Some candidates gained credit for descriptions of the idea of a leaf mosaic without necessarily using the term.
(ii) There were very many excellent clear drawings of suitable size. They were in proportion and
showed the particular features so that the leaves were easily recognisable as the species in the Supervisor’s report. Others made incompletely joined faint or rough lines and shaded some areas which obscured the leaf structure.
Candidates were expected to label two parts of the leaf. Candidates sometimes also knew the
term ‘node’ and the position of the bud in the leaf axil. Labelling lines should have been ruled and should have ended exactly on the structure they
labelled. Some candidates drew arrow heads on the ends of their labelling lines but these tended to obscure parts of the drawings.
(iii) The size of leaves outlined on the printed grid varied from less than 4 cm2 to more than 50 cm2.
Very nearly all candidates drew a clear outline round the leaf. Most gained a mark for counting the whole squares inside the leaf shape and adding the half squares. Another good method was to count the squares which were not covered by the leaf and subtract them from 100 and some candidates did that.
A small proportion of candidates tried to calculate the area mathematically as a rectangle and
multiplied the length and breadth of the leaf, so erroneously included a lot of part squares and whole squares outside the leaf area. Rather more candidates embarked on complicated calculations of fractions of squares which often ended in arithmetical disaster. Answers without units were not uncommon. This was a pity because it made the answer meaningless.
(b) (i) Almost all candidates completed the ten measurements, in mm and included the leaf measured in
(a)(iii) to gain three marks. A small number of candidates used cm. (ii) Few candidates realised that the numbers given to represent the position of the leaves on the
branch were ordinal numbers with little arithmetical meaning. Therefore a bar chart with spaces between the columns was the appropriate graph. Accurate plotting was credited. Most of the graphs were neat with ruled lines.
Line graphs were most frequently drawn, often of small scale and without units on the y axis. The x
axis for the order of the leaves needed no units. Occasionally the axes had no labelling so the graphs conveyed little information
41
Cambridge International General Certificate of Secondary Education 0610 Biology June 2010
Principal Examiner Report for Teachers
© UCLES 2010
(iii) This question was poorly answered. The best answers identified the position of the largest or smallest leaves, described any trend or pattern in leaf size shown by the graph and related leaf size to the age of the leaf, availability of light or water supply. Often it was a candidate who made the connection between the leaf’s materials for growth and its length, who did not describe the trend between the length of the leaf and its position on the branch.
Some candidates pointed out in a valid conclusion, that there was no easily recognisable
relationship shown in their graphs between the leaf size and the leaf’s position on the branch.
42
Cambridge International General Certificate of Secondary Education 0610 Biology June 2010
Principal Examiner Report for Teachers
© UCLES 2010
BIOLOGY
Paper 0610/61 Alternative to Practical 61
General comments The paper produced a wide range of marks, similar to that in previous years. There were some candidates performing very well to others who were ill prepared to deal with the required tasks. Candidates attempted all questions and most showed that they had adequate time to finish the paper. The standard of English was generally good and the presentation of answers showed a clear understanding of most questions. Many candidates were well prepared for the Alternative to Practical Paper and did gain high marks and yet there were discerning parts of questions for the more able candidate to stretch their abilities. Candidates do need to be advised to read the questions carefully before starting to answer the questions. Candidates’ drawings were generally good but the use of a medium or HB pencil is essential. Some Centres still need to advise candidates not to use ink pens whether ballpoint or otherwise. Outlines for drawings must always be with the use of a clear, single unbroken line in pencil which can be erased thoroughly if alterations are necessary. Quite a number of candidates do not label diagrams when asked for a labelled diagram. Label lines should be ruled and make contact with the relevant structure. On graphs, points should be clearly and carefully positioned using a small cross. Smooth single lines should be drawn in pencil with a ruler if appropriate. Comments on specific questions Question 1 This question was based on blood vessels. The investigation described was on the measured extension of an artery with added masses of weights and the subsequent recoil of the vessel when the mass of weight was removed. (a) (i) The structure of three blood vessels was shown in a photomicrograph. This showed the transverse
section of an artery, a vein and a capillary. No scale was given. Although a similar illustration can be found in textbooks it appears that some candidates did not recognise these structures even though the question clearly states what was shown. These candidates misidentified these blood vessels as blood cells or plant structures.
The drawings were generally good and to a high standard. They needed to be of an equal or larger
size than the actual section. This was possible if one blood vessel namely the section of the artery, X, was drawn in transverse section. Unfortunately, several candidates attempted to draw both vessels X and Y and other candidates drew a longitudinal view of one vessel in three dimensions, [3D], with only a small cross section at one end.
The outline mark required clear unbroken lines, with no shading, to show tissue detail as in a plan
drawing. Some candidates incorrectly used a compass to construct the lines which shows ingenuity but not accuracy as the section does not have regular concentric layers of tissues. Most candidates showed that the wall was composed of different layers of tissues. The detail mark was awarded for either the close observation of the inner surface showing minute ‘infolding’ of the endothelium or the asymmetric area of a bulge by the area of stain in the lumen.
43
Cambridge International General Certificate of Secondary Education 0610 Biology June 2010
Principal Examiner Report for Teachers
© UCLES 2010
Many labels indicated the thickness of the wall and the lumen. Others referred to the muscle or elastic layers and a few candidates used the histological terms for the layers e.g. tunica intima, media and adventitia expected only at more advanced levels. The folding of the endothelium was incorrectly labelled as ‘hairs’, ‘cilia’ or ‘villi’ but this showed good observation of detail. Label lines should be ruled and make contact with the relevant structure.
There were still unfortunately a number of drawings where no labels were given. (ii) Most candidates correctly identified X as an artery. Repeated errors occurred when the blood
vessels were identified incorrectly as blood cells or plant structures. (iii) Two features were described by most candidates to support their identification of blood vessel X as
an artery. These features were usually based on the size of the lumen, the thickness of the wall or the muscular composition of the wall.
Some candidates described the features which were present for a vein and how the artery differed
and yet others compared all three types of blood vessel. (b) (i) The third last column in Table 1.1 was completed correctly by most candidates following the
examples set in the first 5 rows. A few candidates did not read the question carefully and did not record the cumulative increase in diameter but incorrectly subtracted the values in the second column – internal diameter in millimetres from value recorded in the first column – masses of weights in grams.
(ii) The quality of the graphs was variable. There were some Centres whose candidates had been
well prepared and presented excellent line graphs with correctly orientated and labelled axes. The controlled variable in the first column of the table should be on the x-axis and the measured variable on the y-axis, which in this case was the increase in diameter. There were a significant number of candidates who incorrectly plotted the actual measurements from the second column in the table.
Candidates are expected to make good use of the printed graph paper available. The increments
should be evenly spaced out to cover the whole range of values. Most candidates plotted the data points accurately but not all used a cross to indicate the position
of the point. A common error was to omit the zero point at the origin. A line graph was expected as there were two continuous variables to be plotted. A few candidates
presented the data as a histogram. On many of the graphs the lines joining the plotted points were clear, neat and ruled carefully or
drawn passing through the points in a smooth curve. There were only a few unacceptable lines where the actual line was drawn freehand, sketched and inaccurate or too thick obscuring the points. The line should not extend beyond the last plotted point for the mass of weights, 50 g, though many candidates incorrectly extrapolated this line.
(iii) Many candidates predicted correctly that the piece of artery would decrease in diameter when the
mass of weights was removed. The elastic fibres within the wall permit recoil so the diameter of the blood vessel returns to the original diameter providing the tissues are fresh. This extension and recoil in the isolated section is not based on muscle action. Some candidates included explanations involving overstretching because the last measurements for masses of weights 80 g and above were almost the same.
44
Cambridge International General Certificate of Secondary Education 0610 Biology June 2010
Principal Examiner Report for Teachers
© UCLES 2010
Question 2 This question was based on the comparison of the structure and nutrient content of two tubers, sweet potato Ipomoea batanus and the Irish potato Solanum tuberosum. (a) (i) Candidates were expected to observe the photographs of the whole tubers and the cross sections
and to identify and describe one similar feature and most correctly described a similarity. This might include reference to the presence of an outer layer or ‘skin’. Colour could only refer to shades of black and white or lighter or darker. There were a surprising number of candidates who reiterated the points given in the stem such as the specimens were both tubers and that they were storage organs for carbohydrates. No seeds were present though this point was often incorrectly mentioned.
(ii) A table was printed for candidates to record two observable differences between the sweet potato
and the Irish potato so that one difference was compared for both specimens per row. This rubric was followed exactly with most candidates giving differences ranging from the shape or size of the whole tuber or the cross section of tissue. At times it was not clear whether the candidate referred to the whole tuber or the cross section. The outer layer of the tuber is not called a testa or a pericarp. Some candidates tried to list more than one difference per row and added extra boxes below the table. It is important to compare the same feature in each row.
(b) Most candidates correctly described the outline procedure for the starch and reducing sugar tests
but only some descriptions covered the comparative aspect of these tests or the safety aspects which should be considered.
For starch – this should be based on the iodine solution test. The iodine solution could be added to
the surface of the tissue directly there was on need to prepare a solution. A common error was to omit the initial colour of the iodine solution. The expected colour at the end of the test varied from blue, to blue – black, purple or black and these end colours would depend on the concentration of the iodine solution used.
For reducing sugar test - it was necessary to prepare a solution as the sugar was soluble in water. Only a few candidates specified the quantities of water, reagent or tissue sample needed for the
test to compare the reducing sugar content of the two specimens. Many candidates failed to include any safety factor. Although the comparative final colouration point was made, many candidates failed to explain the expected colour change by omitting the original colour prior to heating the reagent with the prepared sample of tissue or extract from the tissue.
Question 3 Germination of seeds was the topic of this third and final question. Details of an investigation were given in the introduction, based on tomato seeds. Three dishes containing germinated seeds were shown. (a) (i) Candidates completed the numbers of germinated seeds correctly in the table. A common error
was to miss the seed which failed to germinate in dish A. (ii) Although many candidates noticed the difference in seed number involved between the two dishes
when calculating this answer, many did not carry forward this factor into at the final stage. Most answers seen gave 80%.
(iii) This was a suggest question and some candidates did include ideas for reasons why the
germination rate was lower in dish C. Among acceptable suggestions was: the presence of chemicals inhibiting the germination process; the presence of solutes such as acids to halt enzyme activity; the presence of solutes such as sugars which blocked the uptake of water during the imbibition process or preventing osmosis taking place; the presence of bacteria which caused disease. A few candidates commented that the pH was the same as dish C. Commonly candidates repeated the information given earlier in the question without adding further thoughts.
45
Cambridge International General Certificate of Secondary Education 0610 Biology June 2010
Principal Examiner Report for Teachers
© UCLES 2010
(b) It was in this question that candidates had the opportunity to use their planning skills to outline an experiment to show the effect of pH on seed germination. Many candidates described procedural details carefully and not only controlled the variables but explained how the pH used in the solutions might be managed with the use of buffer solutions. Specified time periods were suggested rather than vague periods of ‘a few days’. While it was pleasing to note that far more candidates had experience of experimental planning, there are still some candidates who need to practise these experimental design type questions.
46

Cambridge International General Certificate of Secondary Education 0610 Biology June 2010
Principal Examiner Report for Teachers
© UCLES 2010
BIOLOGY
Paper 0610/62 Alternative to Practical 62
General comments The standard of English was good and the presentation of answers showed a clear understanding of the questions. Most candidates did gain marks and yet there were discerning questions or parts of questions for the more able candidate to stretch their abilities. Misunderstandings and errors arose from candidates not taking time to read questions carefully and answering what they thought the question asked rather than what was actually required When asked to complete a table of differences it is important that the answers given for each difference are matched and not independent of each other. Candidates’ diagrams were generally good but they must always use clear, single outlines and a medium or HB pencil. Quite a number of candidates do not label diagrams when asked for a labelled diagram. Overall, the paper produced a wide range of marks. Candidates attempted all questions and most showed that they had adequate time to finish the paper. Comments on specific questions Section A Question 1 Photographs of the skulls with teeth of a sheep and a dog were shown and candidates were asked to make observations of one similarity and two differences, related to nutrition, between the teeth of the two skulls. (a) (i) Although not familiar with the dentition of the sheep and the dog, most candidates were able to
apply their knowledge of teeth and correctly identify one similarity between the teeth. Examples of named teeth e.g. molars or a common function e.g. teeth for grinding were usually seen. A number of candidates described similarities which did not relate to teeth, e.g. the shape of the jaws or similarities which could not have been observed from the photographs e.g. being hard or containing calcium.
(ii) Candidates were provided with Table 1.1 to complete to give two differences. To answer this
question successfully each difference should relate to the same observation for the sheep and the dog; that is matched features. Comparative answers were acceptable. Too often the four boxes contained four unrelated points and observations could not be credited.
Most candidates were able to gain one mark here. The common difference given was the sheep
and dog’s canines being absent v present or small v large. Only the more able candidates correctly identified the presence and absence of the diastema, a key difference between the arrangement of teeth in herbivores and carnivores. A description was acceptable and occasionally the observation had been made but candidates described the gap as between the teeth rather than a gap specifically between the front and back teeth. Very few candidates noticed that the sheep skull had no teeth in the front, upper jaw or observed the ridges which were present on the sheep’s teeth and absent in the dog’s teeth. Some candidates did not give differences about the teeth but described skull differences. Differences in size were not acceptable as there was no indication of scale given on the photographs.
47
Cambridge International General Certificate of Secondary Education 0610 Biology June 2010
Principal Examiner Report for Teachers
© UCLES 2010
(b) (i) Photographs of the ‘back’ tooth of a sheep and dog were given and candidates were asked to make a large labelled drawing of the sheep tooth.
Overall the standard of drawings was good. There were many large, clear diagrams and many
were of a high quality with single lines detailing the most important features. The candidates were expected to represent the ridges and exposed dentine with minimal shading. A relatively small number of candidates used excessive shading which covers up the drawn details. Extra sketchy lines detailing markings on the roots or artistic interpretations were not acceptable. Many candidates did attempt to label the tooth usually with the root, crown or enamel. The exposed dentine was not recognised by many candidates and often labelled as decay. A small number of candidates did not include any labels at all.
(ii) Candidates were provided with Table 1.2 to complete to give two differences between the ‘contact’
surfaces of the teeth. It was the two teeth shown in Fig. 1.2 that were to be compared but a number of candidates continued to compare the sets of teeth as in Table 1.1. Again, the differences for the sheep and dog should have related to the same feature for each answer. The majority of candidates were only able to gain one mark for observing ridges v absence of ridges for sheep and dog. Only a small number of more able candidates realised that the enamel had worn away to reveal the dentine on the sheep’s tooth. Most candidates incorrectly referred to it as decay, plaque or food on the tooth. Some answers included features which could not be seen such as sharp v blunt.
(c) Candidates were given data comparing the nutrient content of green leaves and animal flesh. They
were asked to suggest why herbivores spend more time eating than carnivores. The majority of candidates were able to gain one mark for the idea of leaves having less fat or less protein. A comparative answer stating that the % of fat or protein was lower or less that that of the carnivore’s meat diet was preferred although credit was given for an accurate figure quoted from the table. The idea that herbivores took in carbohydrate rather than fat and that this was their energy source was realised by only a small number of the most able candidates. These candidates did also often give answers explaining that fat provided more energy than carbohydrates. Common mistakes were that fibre or cellulose in grass needed more chewing or incorrect references to amylase.
(d) The majority of candidates described the correct procedures to test for the comparative fat content
of leaves and meat. It was clear that this test had been carried out and many relevant practical details were given. The idea of using equal samples and /or using equal volumes of reagents was mentioned as a matter of routine for many candidates. The foods did need grinding before the test but a common mistake was to grind the samples in water which is not appropriate for the ethanol test. A large number of candidates did gain the comparative mark but a common error here was to compare the amount of time taken to go cloudy rather than the cloudiness of the two results. A small number of candidates did not compare the results but simply stated the expected results for presence and absence of fats. Safety precautions were not always mentioned and they are especially important in this test using ethanol. A small number of candidates incorrectly described heating their ethanol test. Eye protection and the use of a laboratory coat were often seen but most important would be ensuring there were no naked flames. The grease spot test (not prescribed on the syllabus) was only occasionally seen.
Some candidates described how to remove the chlorophyll from a leaf with alcohol. Only a small
number used the incorrect reagents. Question 2 (a) (i) Most candidates were able to correctly describe a difference between the two surfaces of the leaf.
The common mistakes were to refer to the upper surface being ‘waxy’ or giving a difference about veins or stomata, which could not be clearly identified from the photographs.
(ii) Candidates were asked to calculate the area of the lower surface of this leaf and as a guideline
were asked to measure the size of the grid squares. It was expected that they would attempt to count the number of squares and parts of the squares occupied by the leaf on the grid and multiply by the area of the grid square. Only a small number of candidates showed that they had used this method by either marking the squares on the leaf or counting up squares and parts of squares in their working. These candidates were given credit for this. It was obvious that this method had been used by the more able candidates who were able to get a reasonably accurate area but they did not gain the working mark. The most common mistake was to measure the length x breadth of
48
Cambridge International General Certificate of Secondary Education 0610 Biology June 2010
Principal Examiner Report for Teachers
© UCLES 2010
the approximate leaf area and this usually resulted in too large an area. A small number did not attempt this question thus gaining no marks at all.
(b) (i) Most candidates were able to correctly count the number of spines on each leaf, show their tally
and fill in the table correctly. Discrepancies arose with those leaves having 9 to 12 spines. A small number of candidates correctly recorded their tally and used the ‘total number of leaves‘ column for a cumulative total. The correct tally was credited. Some of these candidates went on to plot this data for Question (b)(ii).
(ii) The candidates were asked to plot their data to show the variation in the number of spines per leaf.
It was not specified which type of graph to use. A bar chart would have been the most appropriate but a histogram was credited. A large number of candidates constructed a line graph which was not suitable for these results because the ‘number of spines per leaf’ is an example of discrete, not continuous data.
Most candidates correctly orientated the graph and labelled their axes appropriately. ‘Tally’ was
not considered a suitable label for the y axis. Candidates were required to use more than half of the available grid to present their graph; the
majority of candidates did this. The axes should be evenly spaced out and make full use of the grid. It is not always necessary to start the axis at zero or to label the start of axis. If zero is indicated and the distance between zero and the first column / point is not the same as the distance between the other columns / points, then candidates need to annotate and show that the distance is not the same. Too often the inaccurate use of zero on the x axis resulted in an uneven scale. The labels on the x axis for a bar chart or histogram should be centrally placed under each column. A common error was to label to one side of the column.
The plotting of the columns was accurate and only a few errors were seen. The majority of
candidates used a ruler and the columns were of equal width. A small number of candidates used wider columns for plotting’ 6 or fewer’ and ‘14 or more’, this was incorrect. Similarly some of the shading was untidy and unnecessary.
(b) (iii) Only the some candidates were able to gain all 3 marks for this question, these candidates often
recognising the importance of using trees of the same species. Some candidates recognised that there are many other different species which look like this particular holly and that it is important to get the correct species. Many were able to gain 2 marks, usually for a larger sample of leaves of the same size or age. The majority, however, only gained a mark for a larger sample. The common mistakes were either to state ‘from the same tree’, even though it was mentioned in the question, or to state that more leaves should be taken from different tree species.
Question 3 This was a more theoretical based question consisting of short answers involving completion of a line on a population graph and covered different sections of the syllabus from asexual reproduction to antibiotics. (a) (i) The majority of candidates correctly extended the curve to show a decrease, often decreasing to
zero. (ii) This was not well understood. Only a minority of candidates correctly identified a shortage of food
or space. The build up of toxins was rarely seen. Competition is a consequence of the shortage of resources and thus ignored. A common misconception was that the individual bacteria were ageing and consequently dying so the numbers would decrease. Ageing was in the stem of the question.
(b) (i) Most candidates correctly labelled the hypha. (ii) Most candidates correctly labelled the spore. A small number of candidates reversed the labels. (c) A difference and similarity between the fungus and the green plant cell was well known. The
difference between a fungal and animal cell was less well known. A number of candidates did identify the vacuole as a difference but did not make it clear that animal cells have smaller / temporary vacuoles. A small number of candidates were giving differences involving structures not visible in the diagram, e.g. mitochondria or cell membrane. A common mistake was to not make it
49
Cambridge International General Certificate of Secondary Education 0610 Biology June 2010
Principal Examiner Report for Teachers
© UCLES 2010
clear which cell they were describing in their answer. Unless stated otherwise, it is assumed that an answer relates to the cell or subject mentioned in the question, in this case the fungal cell. It is better if candidates state which cell they are describing.
(d) Many candidates were able to gain one mark for the idea of bacteria being killed or unable to grow.
A common mistake, however, was to state that because the bacteria had no walls, they would be more easily destroyed by white blood cells or antibodies rather than realise that they would die as a consequence of having no walls. Only the a few candidates included references to human cells in their answers.
(e) (i) The majority of candidates correctly chose E. Just a few candidates gave the reverse idea of the
disc surrounded by the smallest clear area or listed all of the discs with large clear areas. (ii) Most were able to give a correct explanation. The common mistakes were either to identify E as a
large clear area or killing many bacteria rather than the largest clear area or killing most bacteria. A small number of candidates simply stated that it had the largest area but did not explain what the area represented.
50
Cambridge International General Certificate of Secondary Education 0610 Biology June 2010
Principal Examiner Report for Teachers
© UCLES 2010
BIOLOGY
Paper 0610/63 Alternative to Practical 63
General comments The standard of English was good and the presentation of answers showed a clear understanding of the questions. Most candidates did gain marks and yet there were discerning questions or parts of questions for the more able candidate to stretch their abilities. Misunderstandings and errors arose from candidates not taking time to read questions carefully and answering what they thought the question asked rather than what was actually required When asked to complete a table of differences it is important that the answers given for each difference are matched and not independent of each other. Candidates’ diagrams were generally good but they must always use clear, single outlines and a medium or HB pencil. Quite a number of candidates do not label diagrams when asked for a labelled diagram. Overall, the paper produced a wide range of marks. Candidates attempted all questions and most showed that they had adequate time to finish the paper. Comments on specific questions Section A Question 1 Photographs of the skulls with teeth of a sheep and a dog were shown and candidates were asked to make observations of one similarity and two differences, related to nutrition, between the teeth of the two skulls. (a) (i) Although not familiar with the dentition of the sheep and the dog, most candidates were able to
apply their knowledge of teeth and correctly identify one similarity between the teeth. Examples of named teeth e.g. molars or a common function e.g. teeth for grinding were usually seen. A number of candidates described similarities which did not relate to teeth, e.g. the shape of the jaws or similarities which could not have been observed from the photographs e.g. being hard or containing calcium.
(ii) Candidates were provided with Table 1.1 to complete to give two differences. To answer this
question successfully each difference should relate to the same observation for the sheep and the dog; that is matched features. Comparative answers were acceptable. Too often the four boxes contained four unrelated points and observations could not be credited.
Most candidates were able to gain one mark here. The common difference given was the sheep
and dog’s canines being absent v present or small v large. Only the more able candidates correctly identified the presence and absence of the diastema, a key difference between the arrangement of teeth in herbivores and carnivores. A description was acceptable and occasionally the observation had been made but candidates described the gap as between the teeth rather than a gap specifically between the front and back teeth. Very few candidates noticed that the sheep skull had no teeth in the front, upper jaw or observed the ridges which were present on the sheep’s teeth and absent in the dog’s teeth. Some candidates did not give differences about the teeth but described skull differences. Differences in size were not acceptable as there was no indication of scale given on the photographs.
51

Cambridge International General Certificate of Secondary Education 0610 Biology June 2010
Principal Examiner Report for Teachers
© UCLES 2010
(b) (i) Photographs of the ‘back’ tooth of a sheep and dog were given and candidates were asked to make a large labelled drawing of the sheep tooth.
Overall the standard of drawings was good. There were many large, clear diagrams and many
were of a high quality with single lines detailing the most important features. The candidates were expected to represent the ridges and exposed dentine with minimal shading. A relatively small number of candidates used excessive shading which covers up the drawn details. Extra sketchy lines detailing markings on the roots or artistic interpretations were not acceptable. Many candidates did attempt to label the tooth usually with the root, crown or enamel. The exposed dentine was not recognised by many candidates and often labelled as decay. A small number of candidates did not include any labels at all.
(ii) Candidates were provided with Table 1.2 to complete to give two differences between the ‘contact’
surfaces of the teeth. It was the two teeth shown in Fig. 1.2 that were to be compared but a number of candidates continued to compare the sets of teeth as in Table 1.1. Again, the differences for the sheep and dog should have related to the same feature for each answer. The majority of candidates were only able to gain one mark for observing ridges v absence of ridges for sheep and dog. Only a small number of more able candidates realised that the enamel had worn away to reveal the dentine on the sheep’s tooth. Most candidates incorrectly referred to it as decay, plaque or food on the tooth. Some answers included features which could not be seen such as sharp v blunt.
(c) Candidates were given data comparing the nutrient content of green leaves and animal flesh. They
were asked to suggest why herbivores spend more time eating than carnivores. The majority of candidates were able to gain one mark for the idea of leaves having less fat or less protein. A comparative answer stating that the % of fat or protein was lower or less that that of the carnivore’s meat diet was preferred although credit was given for an accurate figure quoted from the table. The idea that herbivores took in carbohydrate rather than fat and that this was their energy source was realised by only a small number of the most able candidates. These candidates did also often give answers explaining that fat provided more energy than carbohydrates. Common mistakes were that fibre or cellulose in grass needed more chewing or incorrect references to amylase.
(d) The majority of candidates described the correct procedures to test for the comparative fat content
of leaves and meat. It was clear that this test had been carried out and many relevant practical details were given. The idea of using equal samples and /or using equal volumes of reagents was mentioned as a matter of routine for many candidates. The foods did need grinding before the test but a common mistake was to grind the samples in water which is not appropriate for the ethanol test. A large number of candidates did gain the comparative mark but a common error here was to compare the amount of time taken to go cloudy rather than the cloudiness of the two results. A small number of candidates did not compare the results but simply stated the expected results for presence and absence of fats. Safety precautions were not always mentioned and they are especially important in this test using ethanol. A small number of candidates incorrectly described heating their ethanol test. Eye protection and the use of a laboratory coat were often seen but most important would be ensuring there were no naked flames. The grease spot test (not prescribed on the syllabus) was only occasionally seen.
Some candidates described how to remove the chlorophyll from a leaf with alcohol. Only a small
number used the incorrect reagents. Question 2 (a) (i) Most candidates were able to correctly describe a difference between the two surfaces of the leaf.
The common mistakes were to refer to the upper surface being ‘waxy’ or giving a difference about veins or stomata, which could not be clearly identified from the photographs.
(ii) Candidates were asked to calculate the area of the lower surface of this leaf and as a guideline
were asked to measure the size of the grid squares. It was expected that they would attempt to count the number of squares and parts of the squares occupied by the leaf on the grid and multiply by the area of the grid square. Only a small number of candidates showed that they had used this method by either marking the squares on the leaf or counting up squares and parts of squares in their working. These candidates were given credit for this. It was obvious that this method had been used by the more able candidates who were able to get a reasonably accurate area but they did not gain the working mark. The most common mistake was to measure the length x breadth of
52

Cambridge International General Certificate of Secondary Education 0610 Biology June 2010
Principal Examiner Report for Teachers
© UCLES 2010
the approximate leaf area and this usually resulted in too large an area. A small number did not attempt this question thus gaining no marks at all.
(b) (i) Most candidates were able to correctly count the number of spines on each leaf, show their tally
and fill in the table correctly. Discrepancies arose with those leaves having 9 to 12 spines. A small number of candidates correctly recorded their tally and used the ‘total number of leaves‘ column for a cumulative total. The correct tally was credited. Some of these candidates went on to plot this data for Question (b)(ii).
(ii) The candidates were asked to plot their data to show the variation in the number of spines per leaf.
It was not specified which type of graph to use. A bar chart would have been the most appropriate but a histogram was credited. A large number of candidates constructed a line graph which was not suitable for these results because the ‘number of spines per leaf’ is an example of discrete, not continuous data.
Most candidates correctly orientated the graph and labelled their axes appropriately. ‘Tally’ was
not considered a suitable label for the y axis. Candidates were required to use more than half of the available grid to present their graph; the
majority of candidates did this. The axes should be evenly spaced out and make full use of the grid. It is not always necessary to start the axis at zero or to label the start of axis. If zero is indicated and the distance between zero and the first column / point is not the same as the distance between the other columns / points, then candidates need to annotate and show that the distance is not the same. Too often the inaccurate use of zero on the x axis resulted in an uneven scale. The labels on the x axis for a bar chart or histogram should be centrally placed under each column. A common error was to label to one side of the column.
The plotting of the columns was accurate and only a few errors were seen. The majority of
candidates used a ruler and the columns were of equal width. A small number of candidates used wider columns for plotting’ 6 or fewer’ and ‘14 or more’, this was incorrect. Similarly some of the shading was untidy and unnecessary.
(b) (iii) Only the some candidates were able to gain all 3 marks for this question, these candidates often
recognising the importance of using trees of the same species. Some candidates recognised that there are many other different species which look like this particular holly and that it is important to get the correct species. Many were able to gain 2 marks, usually for a larger sample of leaves of the same size or age. The majority, however, only gained a mark for a larger sample. The common mistakes were either to state ‘from the same tree’, even though it was mentioned in the question, or to state that more leaves should be taken from different tree species.
Question 3 This was a more theoretical based question consisting of short answers involving completion of a line on a population graph and covered different sections of the syllabus from asexual reproduction to antibiotics. (a) (i) The majority of candidates correctly extended the curve to show a decrease, often decreasing to
zero. (ii) This was not well understood. Only a minority of candidates correctly identified a shortage of food
or space. The build up of toxins was rarely seen. Competition is a consequence of the shortage of resources and thus ignored. A common misconception was that the individual bacteria were ageing and consequently dying so the numbers would decrease. Ageing was in the stem of the question.
(b) (i) Most candidates correctly labelled the hypha. (ii) Most candidates correctly labelled the spore. A small number of candidates reversed the labels. (c) A difference and similarity between the fungus and the green plant cell was well known. The
difference between a fungal and animal cell was less well known. A number of candidates did identify the vacuole as a difference but did not make it clear that animal cells have smaller / temporary vacuoles. A small number of candidates were giving differences involving structures not visible in the diagram, e.g. mitochondria or cell membrane. A common mistake was to not make it
53

Cambridge International General Certificate of Secondary Education 0610 Biology June 2010
Principal Examiner Report for Teachers
© UCLES 2010
clear which cell they were describing in their answer. Unless stated otherwise, it is assumed that an answer relates to the cell or subject mentioned in the question, in this case the fungal cell. It is better if candidates state which cell they are describing.
(d) Many candidates were able to gain one mark for the idea of bacteria being killed or unable to grow.
A common mistake, however, was to state that because the bacteria had no walls, they would be more easily destroyed by white blood cells or antibodies rather than realise that they would die as a consequence of having no walls. Only the a few candidates included references to human cells in their answers.
(e) (i) The majority of candidates correctly chose E. Just a few candidates gave the reverse idea of the
disc surrounded by the smallest clear area or listed all of the discs with large clear areas. (ii) Most were able to give a correct explanation. The common mistakes were either to identify E as a
large clear area or killing many bacteria rather than the largest clear area or killing most bacteria. A small number of candidates simply stated that it had the largest area but did not explain what the area represented.
54