bioconversion of orange peels for ethanol production using
TRANSCRIPT
Vol. 7(14), pp. 1266-1277, 2 April, 2013
DOI: 10.5897/AJMR12.2160
ISSN 1996-0808 © 2013 Academic Journals
http://www.academicjournals.org/AJMR
African Journal of Microbiology Research
Full Length Research Paper
Bioconversion of orange peels for ethanol production using Bacillus subtilis and Pseudomonas aeruginosa
Eman Zakaria Gomaa
Department of Biological and Geological Sciences, Faculty of Education, Ain Shams University, Cairo, Egypt.
Accepted 25 February, 2013
Fruit processing industries produce large amount of waste material, which poses considerable disposal problems leading to pollution. The potentiality of Bacillus subtilis and Pseudomonas aeruginosa to produce ethanol from orange peels was investigated in the present study. Optimization of parameters to improve ethanol production was done. Maximum amounts of ethanol were produced using 8% orange peels. With the addition of 2% sucrose, ethanol production reached 67.20 g/l by B. subtilis whereas, in P. aeruginosa addition of lactose at a concentration of 2.5%, increased ethanol production till 55.20 g/l. B. subtilis produced maximum ethanol (75.20 g/l) when ammonium chloride was added to the medium at 4 g/l whereas, corn steep liquor at 5 g/l caused maximum ethanol production (69.50 g/l) by P. aeruginosa. The optimum environmental conditions that influence ethanol production in B. subtilis include inoculum concentration, pH, temperature and incubation time; 10%, pH: 7, 35°C for 72 h and in P. aeruginosa; 10%, pH: 8, 35°C for 72 h respectively. At these optimal conditions, the maximum ethanol production reached 92.25 and 82.70 g/l for B. subtilis and P. aeruginosa, respectively was recorded. Key words: Orange peel, fermentation, bioethanol, total sugar, reducing sugars, optimization, Bacillus subtilus and Pseudomonas aeruginosa.
INTRODUCTION The rapid depleting non-renewable resources has already reached pinnacle. Now there has been an urgent need for a renewable, sustainable energy sources. Ethanol had been a promising renewable source (Farrell et al., 2006). The increasing demand for ethanol for various chemical and motor-fuel industrial purposes such as alternative source of energy, industrial solvents, clean-sing agents, preservatives and its important role in reduction of green house gas emissions has necessitated in-creased production of this alcohol (Edgardo et al., 2008).
Ethanol production is usually accomplished by chemi-cal synthesis of petrochemical substrates and microbial conversion of carbohydrates present in agricultural pro-ducts. Owing to depleting reserves and competing Indus-trial needs of petrochemical feed stocks, there is global
emphasis on ethanol production by microbial fermenta-tion process. Increased yield of ethanol production by microbial fermentation depends on the use of ideal microbial strain, appropriate fermentation substrate and suitable process technology (Brooks, 2008).
Enormous quantities of agro-industrial waste residues are generated throughout the world from processing raw agriculture materials for foods. These wastes and their disposal have become an environmental concern espe-cially when they are biodegradable to useful goods and services (Shide et al., 2004). Cellulolytic wastes from agricultural practices can be used to produce important compounds such as alcohol thereby assisting in control-ling environmental pollution (Omojasola and Jilani, 2008).
Orange peels belong to this group of valuable biomass
E-mail: [email protected].
wastes (Mrudula and Anitharaj, 2011). The peel contains various carbohydrate polymers, which make it an interes-ting choice for production of metabolites such as ethanol by appropriate microorganisms. An individual or combina-tion of mechanical, chemical, and biological pretreatments, however, is required to break down cellulose, hemicellulose and pectin polymers present in the cell walls of orange peels and convert them into their sugars’ monomers which can further be fermented to ethanol (Grohmann et al., 1995).
The present study was carried out to investigate the production of ethanol by B. subtilus and P. aeruginosa utilizing orange peels waste and to optimize medium components and culture conditions to improve ethanol production.
MATERIALS AND METHODS Pretreatment of orange peels
Orange peels, an agro-industrial waste, were used in this study as a substrate for bio-ethanol production. The oranges samples were procured from the local market. The peels were separated and stored frozen at -20°C. The dry content of orange peel was 18.7% and determined by drying the peels at 110°C for 48 h. Before hy-drolysis, the peels were thawed and ground with a food homoge-nizer to less than 2 mm in diameter.
The removal of the limonene was carried out by distillation accor-
ding to the procedure described by Wilkins et al. (2007). Briefly, the peels were crushed to juice by the addition of little amount of water. This juice had been transferred into a round bottomed flask, which was connected to the distillation unit later. The heating mantel was placed below the round bottomed flask and a heat of 100°C was provided for approximately an hour. This resulted in the removal of the limonene from the orange peels.
Dilute acid hydrolysis of orange peels
The orange peels was degraded to convert cellulose content into more available sugars by chemical treatments with little modification to the procedure described by Lenihan et al. (2010). Fifty milliliters of 10% (w/v) hydrochloric acid was added to the orange peels (40 g) in a 250 ml conical flask. The solution was placed in water bath at 100°C for one hour. After hydrolysis, the pH of the hydrolysate was neutralized with 10 M NaOH until the pH was around 7. The solid particles in the hydrolyzate were separated from the liquid by centrifugation and heated in an oven at 105°C for 15 min to inactivate enzymes, and then stored at 4°C.
Microorganisms
The bacterial strains B. subtilis and P. aeruginosa were kindly
obtained from the Fermentation Biotechnology and Applied Microbiology (FERM-BAM) Center, Al-Azhar University, Cairo, Egypt. Stock cultures were grown on nutrient agar slopes at pH 6.8. Inoculated slopes were incubated for 24 h at 30°C and stored subsequently at 4°C in sealed universals. They were periodically sub-cultured by transfer onto fresh agar medium.
Fermentation process and ethanol production
One loop of cells of the bacterial strains was transferred to 50 ml of nutrient broth medium prepared with distilled water in 250 ml flask
Gomaa 1267 and aerobically cultivated for 24 h. The cell culture was centrifuged at 10000 x g for 10 min and washed three times with sterile physio-logical saline (NaCl 8.5 g/l). Then, cells were suspended in the same solution to give a concentration of 0.01 g/ml. The cells were transferred to 50 ml of minimal medium (MM) in 250 ml Erlenmeyer flask containing: ammonium sulfate, 2 (g/l) ; magnesium sulfate, 0.2 (g/l); dibasic potassium phosphate, 0.7(g/l); monosodium phos-phate, 0.3 (g/l), 5 ml of a micronutrient solution (per liter: 5 g diso-dium EDTA, 0.22 g zinc sulfate. 7H2O, 0.5 g calcium chloride, 0.5 g ferrous sulfate.7H2O, 0.1 g ammonium molybdate. 4H2O, 0.16 g cupric chloride, 0.16 g cobalt chloride and 0.5 g manganese sulfate) and 1 ml thiamine solution (Guimaraes et al.,1992). Thiamine stock solution (0.1% w/v) was filter sterilized. Carbon energy source
(dried orange peels extracts) were added at a final concentration of 2%. The pH was adjusted using 2 M NaOH to pH 6.8. Batch fer-mentation was carried out in duplicate and under continuous stirring at 100 rpm using a magnetic stirrer. Fermentation was allowed for 72 h at 35°C and samples from the medium were withdrawn perio-dically from the replicated fermented flasks to determine bacterial cell growth, ethanol productivity, final pH value and residual sugar content.
Analysis
Bacterial growth and pH value
Optical density (OD) was measured at 600 nm to estimate the cell growth. The pH of the supernatant was measured with a pH meter.
Ethanol assay
Ethanol was analyzed using a gas chromatography GC-17A (Shi-madzu, Japan) equipped with a flame ionization detector and a BP21 capillary column (25-m length x 0.53-mm internal diameter x 0.5-µm film thickness). The temperature of the injector and detector were set at 150 and 200°C, respectively. The oven temperature was initially maintained at 40°C for 1 min and then increased to 130°C at a gradient of 20°C per minute. Helium was used as carrier
gas with 1-propanol as the internal standard (Suhaimi et al., 2012). All tests were run in duplicate with two or more repetitions, and results were expressed as the average of all repetitions.
Total and reduced sugar concentrations
Total sugars were analyzed by the method of Dubois et al. (1956) which is based on the phenol sulfuric acid reaction. Glucose, from Sigma Co. was used as a standard.
The reducing sugar was determined using the 3, 5- dinitrosalicylic acid (DNS) method (Miller, 1959) using D-galacturonic acid as a standard sugar.
Optimization of fermentation process's parameters
In a sequential order, the various process parameters optimized for maximal ethanol production were as follows:
Effect of orange peels concentration
A set of flasks with different substrate concentrations ranged from (1-10 %) were inoculated and incubated at 35°C for 72 h. After incubation, samples were withdrawn and tested for all parameters described above.
Effect of additional carbon source
To find a suitable additional carbon source for ethanol production
1268 Afr. J. Microbiol. Res. by B. subtilis and P. aeruginosa, carbon sources; glucose, galactose, sucrose, maltose, xylose, raffinose, arabinose, cellulose, lactose, starch, mannitol, ramnose, fructose, mannose and molasses were added at 1% to minimal medium, fortified with orange peels. Also, the effect of sucrose and lactose at concentrations of 0.5, 1, 1.5, 2, 2.5 and 3% were studied on ethanol production. Effect of nitrogen sources The selected nitrogen sources for optimization process were yeast extract, peptone, malt extract, beef extract, casein, protease pep-tone, soybean meal, corn steep liquor, urea, ammonium sulphate, ammonium nitrate, ammonium chloride, ammonium oxalate, di-
ammonium hydrogen phosphate, ammonium molybidate, sodium nitrate, potassium nitrate, asparagin, cystein and glycine. The nitro-gen sources were used at 2 g/l in basal minimal medium. The effect of ammonium chloride and corn steep liquor at concentrations of 1, 2, 3, 4, 5 and 6 g/l were studied on ethanol production. Effect of inoculum concentration Effects of inoculum concentrations were studied by inoculating a set
of flasks containing minimal media with different volumes of inocu-lum (approximately 10
8 CFU/ml), viz. 2, 4, 6, 8, 10 and 12% (v/v).
The flasks were incubated at 35°C for 72 h. Effect of initial pH The pH of the production medium was adjusted to 5, 6, 7, 8 and 9 with 1N NaOH and 1N HCl. The production was carried out at 35°C to study their effect on ethanol production.
Effect of temperature The fermentation was carried out at different temperatures such as 20, 25, 30, 35 and 40°C to study their effect on ethanol production. The culture filtrates were then collected and assayed. Effect of incubation time
Different incubation times (24, 48, 72, 96 and 120 h) were emplo-yed to study their effect on ethanol production. The culture filtrates were collected at respective time interval (24 h) and assayed. RESULTS AND DISCUSSION Production of ethanol and other valuable products from fermentable sugars in orange peels is an alternative to utilize industrial citrus processing waste and avoids dis-posal-associated problems. However, the main obstacle to fermentation of orange peel is the presence of peel oil (more than 95% D-limonene, hereafter called limonene), a component that is extremely toxic to fermenting mic-roorganisms. The antimicrobial effect of limonene was reported even at very low concentrations such as 0.01% (w/v), and resulted in complete failure of fermentations at higher concentrations (Winniczuk and Parish, 1997). There-fore, a successful fermentation usually requires prior se-paration of limonene from the medium (Grohmann et al., 1994). The removal of the limonene can be done in many ways. One is the heat treatment, where the orange peels are treated at 150°C (70 psi) by injecting high pressure steam.
Taking into account that in the bioconversion of agro-industrial wastes such as orange peels, hydrolysis of polymers is essential. Hydrolysis can be carried out either chemically, where acid hydrolysis dominates, or enzyma-tically (Taherzadeh and Karimi, 2007). Regardless of the method, the desired effect of the hydrolytic reaction is always the release of sugar monomers from the cellulose and hemicellulose. Enzymatic hydrolysis is an efficient method to release almost all carbohydrates present in the orange peels which can further be fermented to ethanol, but its application is hampered by high cost of enzymes and the slow rate of the de-polymerization reaction. Thus, development of a cost-effective method in which all or a high proportion of carbohydrates could be released will help to commercialize the processes using orange peels as raw materials (Galbe and Zacchi, 2002).
Dilute-acid hydrolysis is a fast and economically feasi-ble approach that is widely used. Despite low acid con-sumption and short reaction time in dilute-acid hydrolysis, application of high temperatures in this method accele-rates the rate of sugar decomposition and increases equipment corrosion (Taherzadeh and Karimi, 2007). However, decomposition of sugars not only lowers the ultimate yield of sugars in dilute-acid process, but also produces a number of by-products that show severe inhi-biting effects on subsequent fermentation step (Luo et al., 2002; Klinke et al., 2004).
Various process parameters influencing fermentation rate and ethanol production were optimized. The strategy followed was to optimize each parameter, independent of the others and subsequently optimal conditions were employed in all experiments.
Nutritional requirements
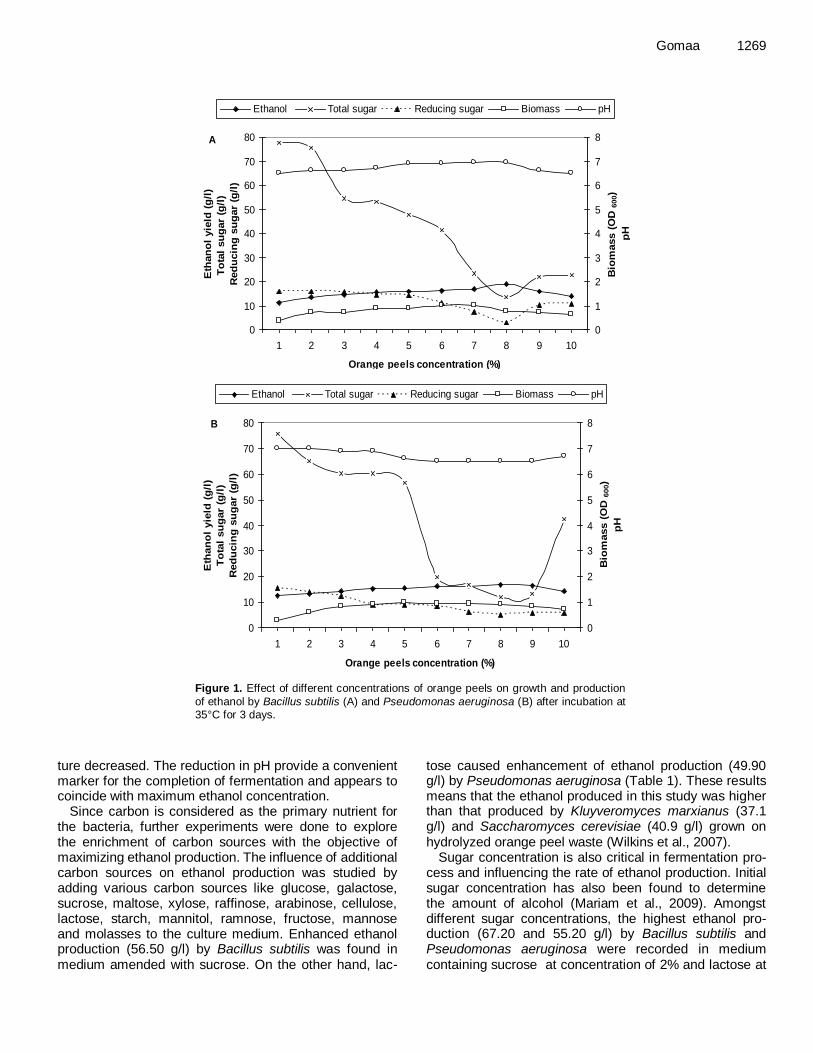
Nutrient sources were found to be one of the important factors for ethanol production. On studying the ability of B. subtilis and P. aeruginosa to utilize hydrolyzed orange peel wastes with no need of supplying any additional nu-trient to produce ethanol, it was found that a concen-tration of 8% (w/v) optimum for ethanol production was reached at 18.90 and 16.90 g/l by B. subtilus and P. aeruginosa, respectively (Figure 1A and B). Beyond 8%, the substrate concentrations decreased the ethanol pro-duction.
With the aim of evaluating the possible solubilization and hydrolysis of orange peel cultures and bioconversion into ethanol, the concentration of total sugars and redu-cing sugar was followed throughout the fermentation process by the phenol-sulfuric and DNS methods, res-pectively. Results illustrated in Figure 1A and B showed that by using orange peels with a concentration of 8%, the lowest total and reducing sugars reached 13.56 and 2.98, respectively for Bacillus subtilus, 12.08 and 5.16, respectively for Pseudomonas aeruginosa were recorded.
It is evident from results represented in Figure 1A and B that by increasing ethanol production, the pH of the cul-
Gomaa 1269
Figure 1. Effect of different concentrations of orange peels on growth and production
of ethanol by Bacillus subtilis (A) and Pseudomonas aeruginosa (B) after incubation at 35°C for 3 days.
ture decreased. The reduction in pH provide a convenient marker for the completion of fermentation and appears to coincide with maximum ethanol concentration.
Since carbon is considered as the primary nutrient for the bacteria, further experiments were done to explore the enrichment of carbon sources with the objective of maximizing ethanol production. The influence of additional carbon sources on ethanol production was studied by
adding various carbon sources like glucose, galactose, sucrose, maltose, xylose, raffinose, arabinose, cellulose, lactose, starch, mannitol, ramnose, fructose, mannose and molasses to the culture medium. Enhanced ethanol production (56.50 g/l) by Bacillus subtilis was found in medium amended with sucrose. On the other hand, lac-
tose caused enhancement of ethanol production (49.90 g/l) by Pseudomonas aeruginosa (Table 1). These results means that the ethanol produced in this study was higher than that produced by Kluyveromyces marxianus (37.1 g/l) and Saccharomyces cerevisiae (40.9 g/l) grown on hydrolyzed orange peel waste (Wilkins et al., 2007).
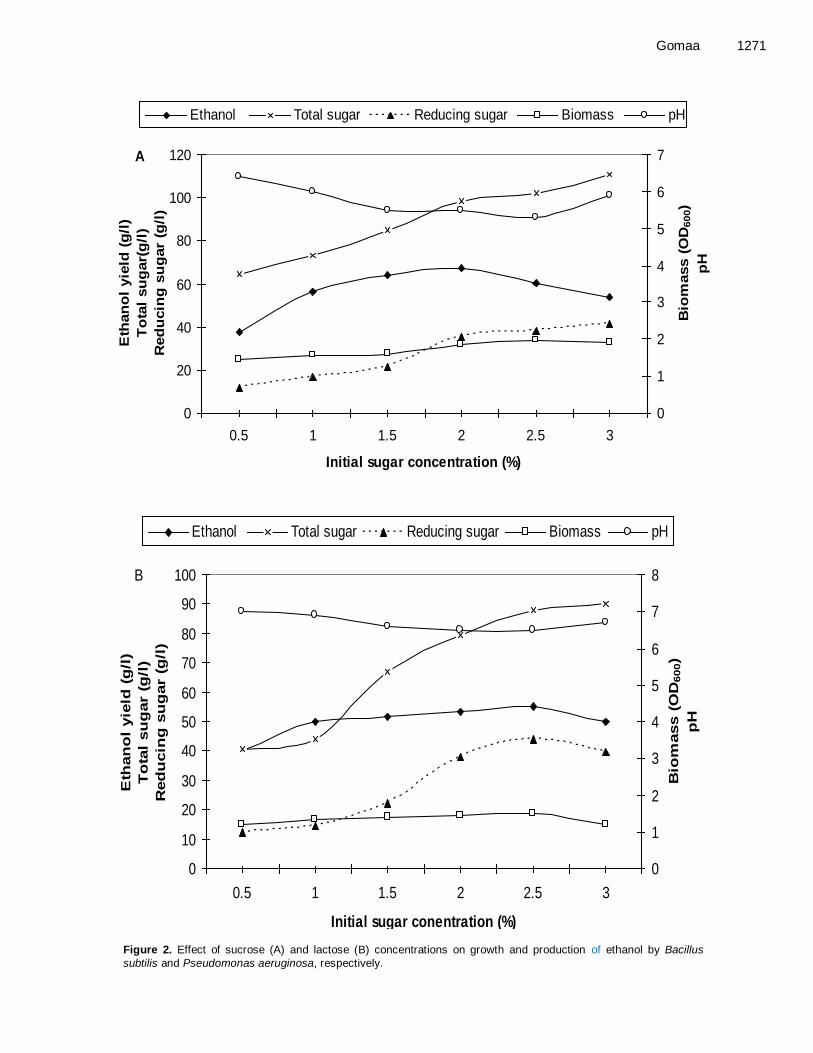
Sugar concentration is also critical in fermentation pro-cess and influencing the rate of ethanol production. Initial sugar concentration has also been found to determine the amount of alcohol (Mariam et al., 2009). Amongst different sugar concentrations, the highest ethanol pro-duction (67.20 and 55.20 g/l) by Bacillus subtilis and Pseudomonas aeruginosa were recorded in medium containing sucrose at concentration of 2% and lactose at
0
10
20
30
40
50
60
70
80
1 2 3 4 5 6 7 8 9 10
Orange peels concentration (%)
Eth
an
ol
yie
ld (
g/l
)
To
tal
su
gar
(g/l
)
Red
ucin
g s
ug
ar
(g/l
)
0
1
2
3
4
5
6
7
8
Bio
mass (
OD
600)
pH
Ethanol Total sugar Reducing sugar Biomass pH
A
0
10
20
30
40
50
60
70
80
1 2 3 4 5 6 7 8 9 10
Orange peels concentration (%)
Eth
an
ol
yie
ld (
g/l
)
To
tal
su
gar
(g/l
)
Red
ucin
g s
ug
ar
(g/l
)
0
1
2
3
4
5
6
7
8
Bio
mass (
OD
600)
pH
Ethanol Total sugar Reducing sugar Biomass pH
B
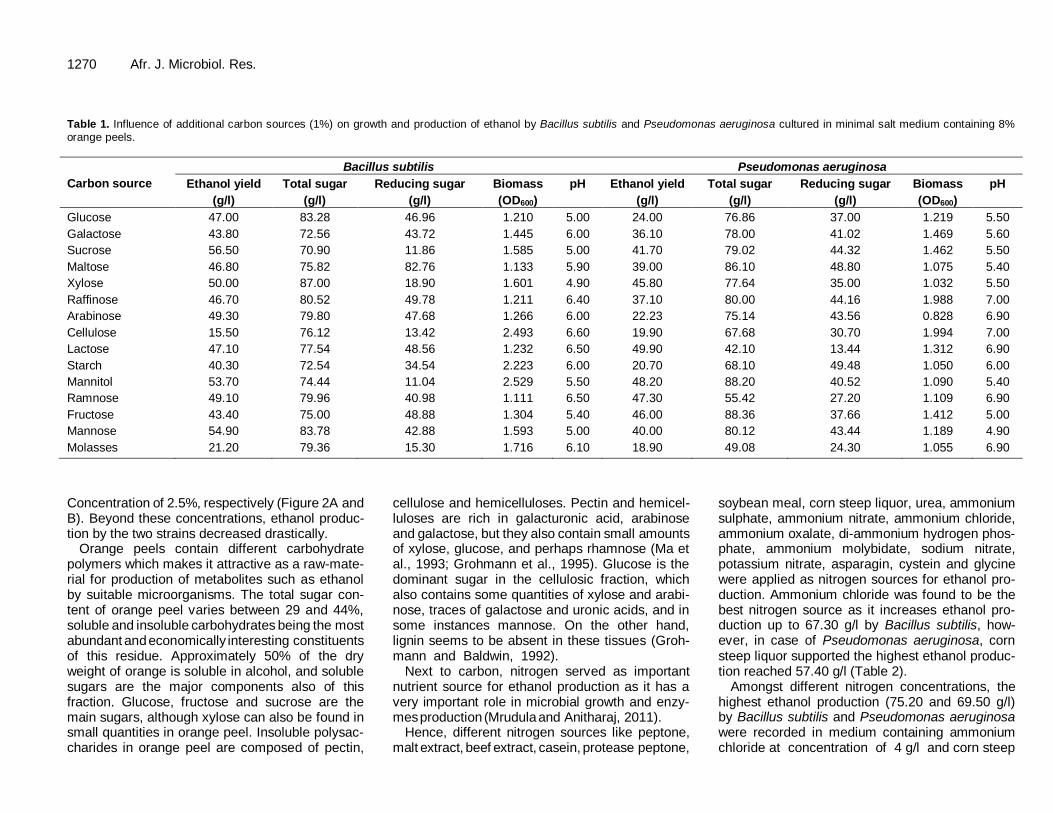
1270 Afr. J. Microbiol. Res. Table 1. Influence of additional carbon sources (1%) on growth and production of ethanol by Bacillus subtilis and Pseudomonas aeruginosa cultured in minimal salt medium containing 8%
orange peels.
Carbon source
Bacillus subtilis Pseudomonas aeruginosa
Ethanol yield
(g/l)
Total sugar
(g/l)
Reducing sugar
(g/l)
Biomass
(OD600)
pH Ethanol yield
(g/l)
Total sugar
(g/l)
Reducing sugar
(g/l)
Biomass
(OD600)
pH
Glucose 47.00 83.28 46.96 1.210 5.00 24.00 76.86 37.00 1.219 5.50
Galactose 43.80 72.56 43.72 1.445 6.00 36.10 78.00 41.02 1.469 5.60
Sucrose 56.50 70.90 11.86 1.585 5.00 41.70 79.02 44.32 1.462 5.50
Maltose 46.80 75.82 82.76 1.133 5.90 39.00 86.10 48.80 1.075 5.40
Xylose 50.00 87.00 18.90 1.601 4.90 45.80 77.64 35.00 1.032 5.50
Raffinose 46.70 80.52 49.78 1.211 6.40 37.10 80.00 44.16 1.988 7.00
Arabinose 49.30 79.80 47.68 1.266 6.00 22.23 75.14 43.56 0.828 6.90
Cellulose 15.50 76.12 13.42 2.493 6.60 19.90 67.68 30.70 1.994 7.00
Lactose 47.10 77.54 48.56 1.232 6.50 49.90 42.10 13.44 1.312 6.90
Starch 40.30 72.54 34.54 2.223 6.00 20.70 68.10 49.48 1.050 6.00
Mannitol 53.70 74.44 11.04 2.529 5.50 48.20 88.20 40.52 1.090 5.40
Ramnose 49.10 79.96 40.98 1.111 6.50 47.30 55.42 27.20 1.109 6.90
Fructose 43.40 75.00 48.88 1.304 5.40 46.00 88.36 37.66 1.412 5.00
Mannose 54.90 83.78 42.88 1.593 5.00 40.00 80.12 43.44 1.189 4.90
Molasses 21.20 79.36 15.30 1.716 6.10 18.90 49.08 24.30 1.055 6.90
Concentration of 2.5%, respectively (Figure 2A and B). Beyond these concentrations, ethanol produc-tion by the two strains decreased drastically.
Orange peels contain different carbohydrate polymers which makes it attractive as a raw-mate-rial for production of metabolites such as ethanol by suitable microorganisms. The total sugar con-tent of orange peel varies between 29 and 44%, soluble and insoluble carbohydrates being the most abundant and economically interesting constituents of this residue. Approximately 50% of the dry weight of orange is soluble in alcohol, and soluble sugars are the major components also of this fraction. Glucose, fructose and sucrose are the main sugars, although xylose can also be found in small quantities in orange peel. Insoluble polysac-charides in orange peel are composed of pectin,
cellulose and hemicelluloses. Pectin and hemicel-luloses are rich in galacturonic acid, arabinose and galactose, but they also contain small amounts of xylose, glucose, and perhaps rhamnose (Ma et al., 1993; Grohmann et al., 1995). Glucose is the dominant sugar in the cellulosic fraction, which also contains some quantities of xylose and arabi-nose, traces of galactose and uronic acids, and in some instances mannose. On the other hand, lignin seems to be absent in these tissues (Groh-mann and Baldwin, 1992).
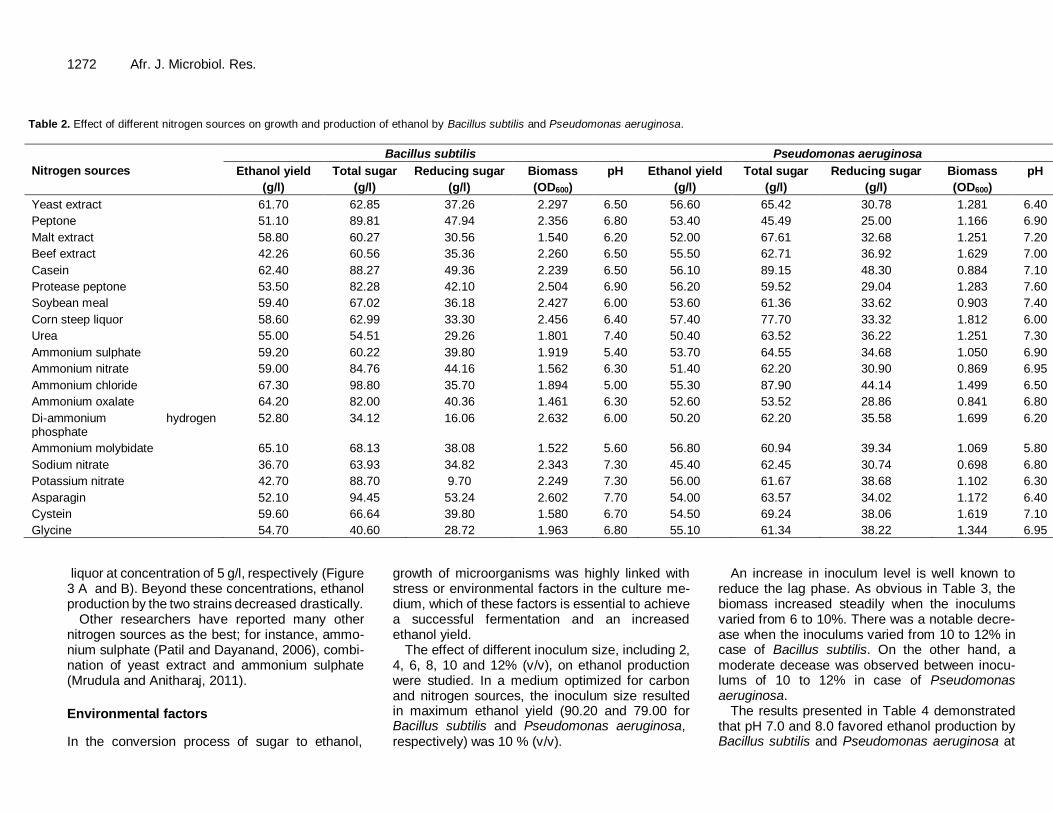
Next to carbon, nitrogen served as important nutrient source for ethanol production as it has a very important role in microbial growth and enzy-mes production (Mrudula and Anitharaj, 2011).
Hence, different nitrogen sources like peptone, malt extract, beef extract, casein, protease peptone,
soybean meal, corn steep liquor, urea, ammonium sulphate, ammonium nitrate, ammonium chloride, ammonium oxalate, di-ammonium hydrogen phos-phate, ammonium molybidate, sodium nitrate, potassium nitrate, asparagin, cystein and glycine were applied as nitrogen sources for ethanol pro-duction. Ammonium chloride was found to be the best nitrogen source as it increases ethanol pro-duction up to 67.30 g/l by Bacillus subtilis, how-ever, in case of Pseudomonas aeruginosa, corn steep liquor supported the highest ethanol produc-tion reached 57.40 g/l (Table 2).
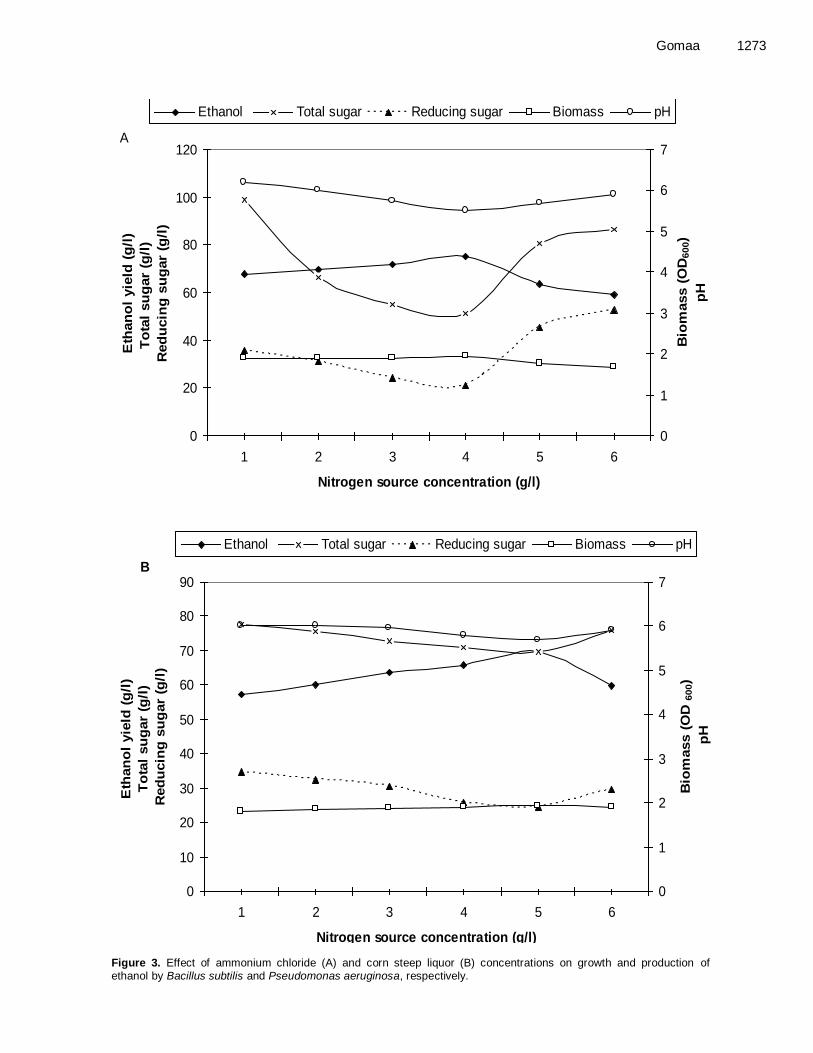
Amongst different nitrogen concentrations, the highest ethanol production (75.20 and 69.50 g/l) by Bacillus subtilis and Pseudomonas aeruginosa were recorded in medium containing ammonium chloride at concentration of 4 g/l and corn steep
Gomaa 1271
Figure 2. Effect of sucrose (A) and lactose (B) concentrations on growth and production of ethanol by Bacillus
subtilis and Pseudomonas aeruginosa, respectively.
0
20
40
60
80
100
120
0.5 1 1.5 2 2.5 3
Initial sugar concentration (%)
Eth
an
ol
yie
ld (
g/l
)
To
tal
su
gar(
g/l
)
Red
ucin
g s
ug
ar
(g/l
)
0
1
2
3
4
5
6
7
Bio
mass (
OD
600)
pH
Ethanol Total sugar Reducing sugar Biomass pH
A
0
10
20
30
40
50
60
70
80
90
100
0.5 1 1.5 2 2.5 3
Initial sugar conentration (%)
Eth
an
ol
yie
ld (
g/l
)
To
tal
su
gar (
g/l
)
Red
ucin
g s
ug
ar (
g/l
)
0
1
2
3
4
5
6
7
8
Bio
mass (
OD
600)
pH
Ethanol Total sugar Reducing sugar Biomass pH
B
1272 Afr. J. Microbiol. Res.
Table 2. Effect of different nitrogen sources on growth and production of ethanol by Bacillus subtilis and Pseudomonas aeruginosa.
Nitrogen sources
Bacillus subtilis Pseudomonas aeruginosa
Ethanol yield
(g/l)
Total sugar
(g/l)
Reducing sugar
(g/l)
Biomass
(OD600)
pH Ethanol yield
(g/l)
Total sugar
(g/l)
Reducing sugar
(g/l)
Biomass
(OD600)
pH
Yeast extract 61.70 62.85 37.26 2.297 6.50 56.60 65.42 30.78 1.281 6.40
Peptone 51.10 89.81 47.94 2.356 6.80 53.40 45.49 25.00 1.166 6.90
Malt extract 58.80 60.27 30.56 1.540 6.20 52.00 67.61 32.68 1.251 7.20
Beef extract 42.26 60.56 35.36 2.260 6.50 55.50 62.71 36.92 1.629 7.00
Casein 62.40 88.27 49.36 2.239 6.50 56.10 89.15 48.30 0.884 7.10
Protease peptone 53.50 82.28 42.10 2.504 6.90 56.20 59.52 29.04 1.283 7.60
Soybean meal 59.40 67.02 36.18 2.427 6.00 53.60 61.36 33.62 0.903 7.40
Corn steep liquor 58.60 62.99 33.30 2.456 6.40 57.40 77.70 33.32 1.812 6.00
Urea 55.00 54.51 29.26 1.801 7.40 50.40 63.52 36.22 1.251 7.30
Ammonium sulphate 59.20 60.22 39.80 1.919 5.40 53.70 64.55 34.68 1.050 6.90
Ammonium nitrate 59.00 84.76 44.16 1.562 6.30 51.40 62.20 30.90 0.869 6.95
Ammonium chloride 67.30 98.80 35.70 1.894 5.00 55.30 87.90 44.14 1.499 6.50
Ammonium oxalate 64.20 82.00 40.36 1.461 6.30 52.60 53.52 28.86 0.841 6.80
Di-ammonium hydrogen phosphate
52.80 34.12 16.06 2.632 6.00 50.20 62.20 35.58 1.699 6.20
Ammonium molybidate 65.10 68.13 38.08 1.522 5.60 56.80 60.94 39.34 1.069 5.80
Sodium nitrate 36.70 63.93 34.82 2.343 7.30 45.40 62.45 30.74 0.698 6.80
Potassium nitrate 42.70 88.70 9.70 2.249 7.30 56.00 61.67 38.68 1.102 6.30
Asparagin 52.10 94.45 53.24 2.602 7.70 54.00 63.57 34.02 1.172 6.40
Cystein 59.60 66.64 39.80 1.580 6.70 54.50 69.24 38.06 1.619 7.10
Glycine 54.70 40.60 28.72 1.963 6.80 55.10 61.34 38.22 1.344 6.95
liquor at concentration of 5 g/l, respectively (Figure 3 A and B). Beyond these concentrations, ethanol production by the two strains decreased drastically.
Other researchers have reported many other nitrogen sources as the best; for instance, ammo-nium sulphate (Patil and Dayanand, 2006), combi-nation of yeast extract and ammonium sulphate (Mrudula and Anitharaj, 2011).
Environmental factors
In the conversion process of sugar to ethanol,
growth of microorganisms was highly linked with stress or environmental factors in the culture me-dium, which of these factors is essential to achieve a successful fermentation and an increased ethanol yield.
The effect of different inoculum size, including 2, 4, 6, 8, 10 and 12% (v/v), on ethanol production were studied. In a medium optimized for carbon and nitrogen sources, the inoculum size resulted in maximum ethanol yield (90.20 and 79.00 for Bacillus subtilis and Pseudomonas aeruginosa, respectively) was 10 % (v/v).
An increase in inoculum level is well known to reduce the lag phase. As obvious in Table 3, the biomass increased steadily when the inoculums varied from 6 to 10%. There was a notable decre-ase when the inoculums varied from 10 to 12% in case of Bacillus subtilis. On the other hand, a moderate decease was observed between inocu-lums of 10 to 12% in case of Pseudomonas aeruginosa.
The results presented in Table 4 demonstrated that pH 7.0 and 8.0 favored ethanol production by Bacillus subtilis and Pseudomonas aeruginosa at
Gomaa 1273
Figure 3. Effect of ammonium chloride (A) and corn steep liquor (B) concentrations on growth and production of ethanol by Bacillus subtilis and Pseudomonas aeruginosa, respectively.
0
20
40
60
80
100
120
1 2 3 4 5 6
Nitrogen source concentration (g/l)
Eth
an
ol
yie
ld (
g/l
)
To
tal
su
gar
(g/l
)
Red
ucin
g s
ug
ar
(g/l
)
0
1
2
3
4
5
6
7
Bio
mass (
OD
600)
pH
Ethanol Total sugar Reducing sugar Biomass pH
A
0
10
20
30
40
50
60
70
80
90
1 2 3 4 5 6
Nitrogen source concentration (g/l)
Eth
an
ol
yie
ld (
g/l
)
To
tal
su
gar
(g/l
)
Red
ucin
g s
ug
ar
(g/l
)
0
1
2
3
4
5
6
7
Bio
mass (
OD
600)
pH
Ethanol Total sugar Reducing sugar Biomass pH
B
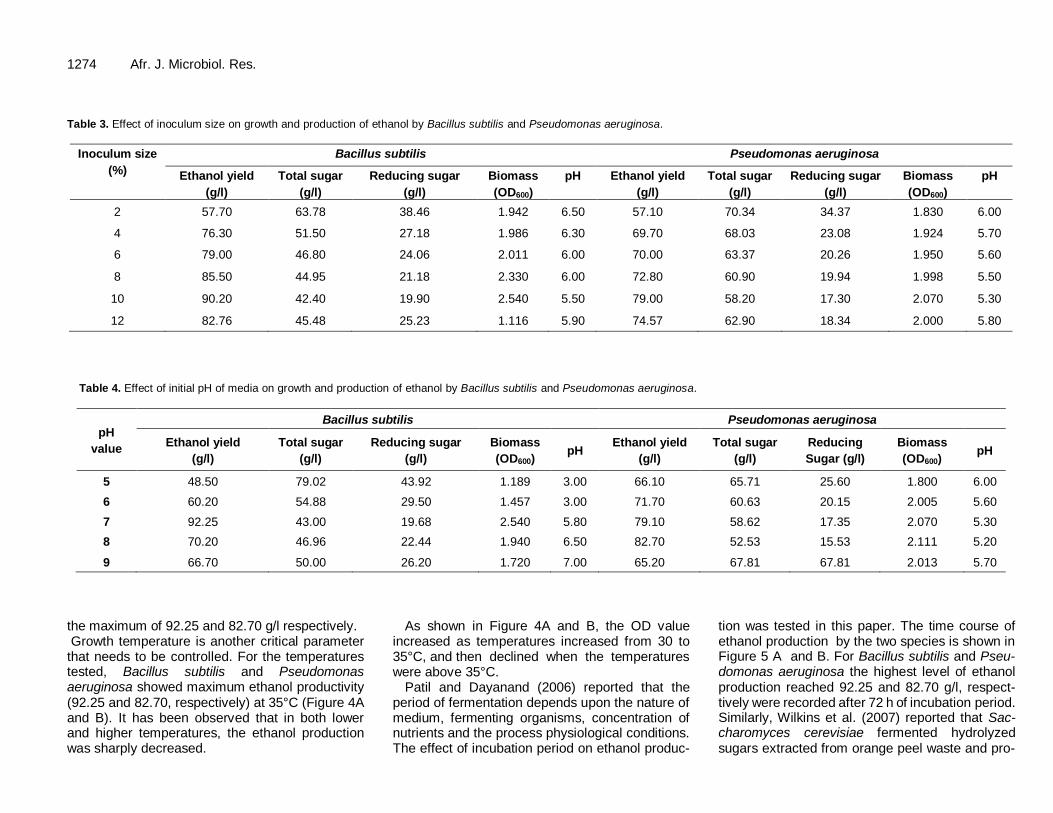
1274 Afr. J. Microbiol. Res. Table 3. Effect of inoculum size on growth and production of ethanol by Bacillus subtilis and Pseudomonas aeruginosa.
Inoculum size
(%)
Bacillus subtilis Pseudomonas aeruginosa
Ethanol yield
(g/l)
Total sugar
(g/l)
Reducing sugar
(g/l)
Biomass
(OD600)
pH Ethanol yield
(g/l)
Total sugar
(g/l)
Reducing sugar
(g/l)
Biomass
(OD600)
pH
2 57.70 63.78 38.46 1.942 6.50 57.10 70.34 34.37 1.830 6.00
4 76.30 51.50 27.18 1.986 6.30 69.70 68.03 23.08 1.924 5.70
6 79.00 46.80 24.06 2.011 6.00 70.00 63.37 20.26 1.950 5.60
8 85.50 44.95 21.18 2.330 6.00 72.80 60.90 19.94 1.998 5.50
10 90.20 42.40 19.90 2.540 5.50 79.00 58.20 17.30 2.070 5.30
12 82.76 45.48 25.23 1.116 5.90 74.57 62.90 18.34 2.000 5.80
Table 4. Effect of initial pH of media on growth and production of ethanol by Bacillus subtilis and Pseudomonas aeruginosa.
pH
value
Bacillus subtilis Pseudomonas aeruginosa
Ethanol yield
(g/l)
Total sugar
(g/l)
Reducing sugar
(g/l)
Biomass
(OD600) pH
Ethanol yield
(g/l)
Total sugar
(g/l)
Reducing
Sugar (g/l)
Biomass
(OD600) pH
5 48.50 79.02 43.92 1.189 3.00 66.10 65.71 25.60 1.800 6.00
6 60.20 54.88 29.50 1.457 3.00 71.70 60.63 20.15 2.005 5.60
7 92.25 43.00 19.68 2.540 5.80 79.10 58.62 17.35 2.070 5.30
8 70.20 46.96 22.44 1.940 6.50 82.70 52.53 15.53 2.111 5.20
9 66.70 50.00 26.20 1.720 7.00 65.20 67.81 67.81 2.013 5.70
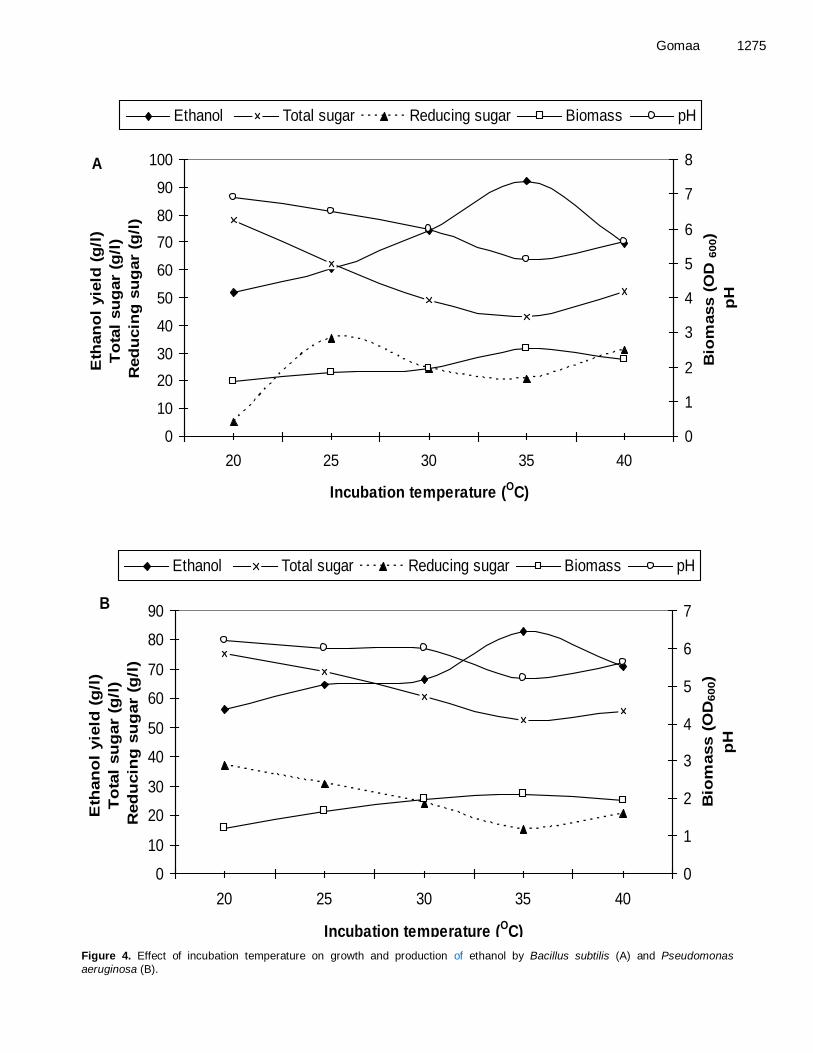
the maximum of 92.25 and 82.70 g/l respectively. Growth temperature is another critical parameter that needs to be controlled. For the temperatures tested, Bacillus subtilis and Pseudomonas aeruginosa showed maximum ethanol productivity (92.25 and 82.70, respectively) at 35°C (Figure 4A and B). It has been observed that in both lower and higher temperatures, the ethanol production was sharply decreased.
As shown in Figure 4A and B, the OD value increased as temperatures increased from 30 to 35°C, and then declined when the temperatures were above 35°C.
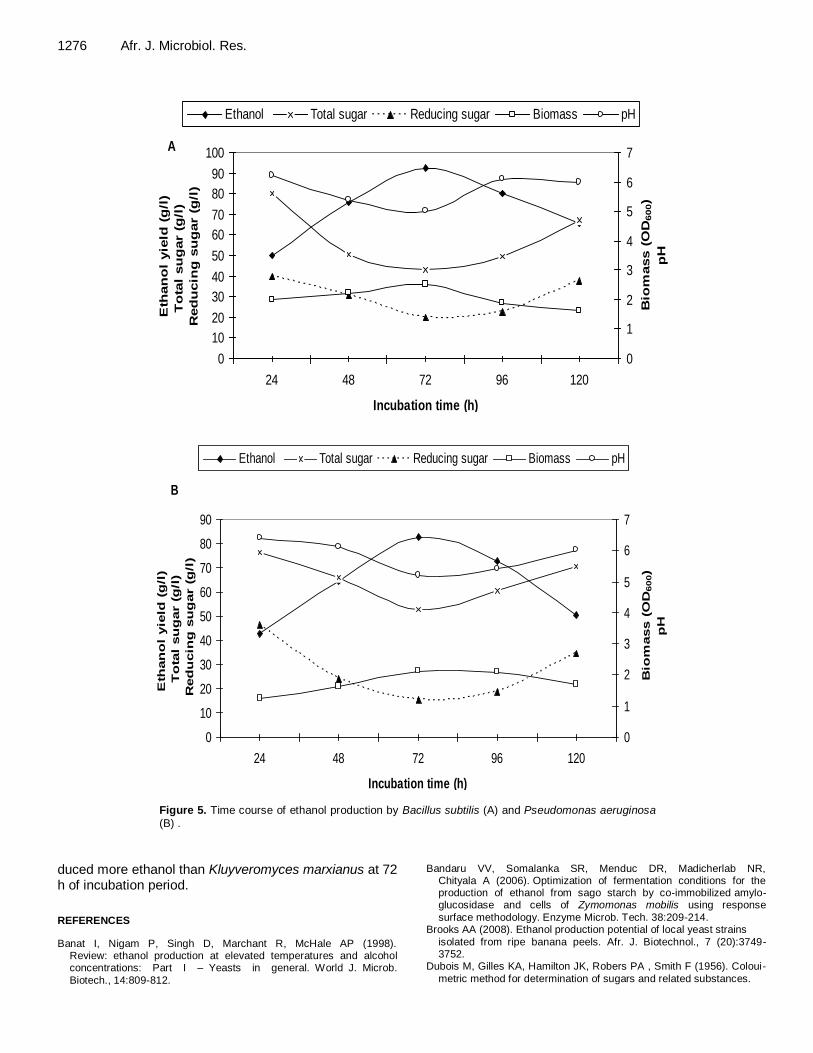
Patil and Dayanand (2006) reported that the period of fermentation depends upon the nature of medium, fermenting organisms, concentration of nutrients and the process physiological conditions. The effect of incubation period on ethanol produc-
tion was tested in this paper. The time course of ethanol production by the two species is shown in Figure 5 A and B. For Bacillus subtilis and Pseu-domonas aeruginosa the highest level of ethanol production reached 92.25 and 82.70 g/l, respect-tively were recorded after 72 h of incubation period. Similarly, Wilkins et al. (2007) reported that Sac-charomyces cerevisiae fermented hydrolyzed sugars extracted from orange peel waste and pro-
Gomaa 1275
Figure 4. Effect of incubation temperature on growth and production of ethanol by Bacillus subtilis (A) and Pseudomonas
aeruginosa (B).
0
10
20
30
40
50
60
70
80
90
100
20 25 30 35 40
Incubation temperature (OC)
Eth
an
ol
yie
ld (
g/l
)
To
tal
su
gar
(g/l
)
Red
ucin
g s
ug
ar
(g/l
)
0
1
2
3
4
5
6
7
8
Bio
mass (
OD
600)
pH
Ethanol Total sugar Reducing sugar Biomass pH
A
0
10
20
30
40
50
60
70
80
90
20 25 30 35 40
Incubation temperature (OC)
Eth
an
ol
yie
ld (
g/l
)
To
tal
su
gar
(g/l
)
Red
ucin
g s
ug
ar
(g/l
)
0
1
2
3
4
5
6
7
Bio
mass (
OD
600)
pH
Ethanol Total sugar Reducing sugar Biomass pH
B
1276 Afr. J. Microbiol. Res.
Figure 5. Time course of ethanol production by Bacillus subtilis (A) and Pseudomonas aeruginosa (B) .
duced more ethanol than Kluyveromyces marxianus at 72 h of incubation period.
REFERENCES
Banat I, Nigam P, Singh D, Marchant R, McHale AP (1998). Review: ethanol production at elevated temperatures and alcohol concentrations: Part I – Yeasts in general. World J. Microb.
Biotech., 14:809-812.
Bandaru VV, Somalanka SR, Menduc DR, Madicherlab NR, Chityala A (2006). Optimization of fermentation conditions for the production of ethanol from sago starch by co-immobilized amylo-glucosidase and cells of Zymomonas mobilis using response
surface methodology. Enzyme Microb. Tech. 38:209-214. Brooks AA (2008). Ethanol production potential of local yeast strains
isolated from ripe banana peels. Afr. J. Biotechnol., 7 (20):3749-3752.
Dubois M, Gilles KA, Hamilton JK, Robers PA , Smith F (1956). Coloui-
metric method for determination of sugars and related substances.
0
10
20
30
40
50
60
70
80
90
100
24 48 72 96 120
Incubation time (h)
Eth
an
ol
yie
ld (
g/l
)
To
tal
su
gar (
g/l
)
Red
ucin
g s
ug
ar (
g/l
)
0
1
2
3
4
5
6
7
Bio
mass (
OD
600)
pH
Ethanol Total sugar Reducing sugar Biomass pH
A
0
10
20
30
40
50
60
70
80
90
24 48 72 96 120
Incubation time (h)
Eth
an
ol
yie
ld (
g/l
)
To
tal
su
gar (
g/l
)
Red
ucin
g s
ug
ar (
g/l
)
0
1
2
3
4
5
6
7
Bio
mass (
OD
600)
pH
Ethanol Total sugar Reducing sugar Biomass pH
B
Annals Chem., 28(3):350-356. Edgardo A, Parra C, Manuel R, Juanita F, Baeza J (2008). Selec-
tion of thermotolerant yeast strains Saccharomyces cerevisiae
for bioethanol production. Enzyme Microb. Tech. 43:120-123. Farrell AE, Plevin RJ, Turner BT, Jones AD, O' Hare M, Kammen
DM (2006). Ethanol can contribute to energy and environmental
goals. Science, 311:506-508. Galbe M, Zacchi G ( 2002). A review of the production of ethanol from
soft wood. Appl. Microbiol. Biotechnol. 59: 618–628.
Grohmann K, Baldwin EA (1992). Hydrolysis of orange peel with pectinase and cellulase enzymes. Biotechnol. Lett., 14:1169-1174.
Grohmann K, Baldwin EA, Buslig BS (1994). Production of ethanol from enzymatically hydrolyzed orange peel by the yeast Saccharomyces Cerevisiae. Appl. Biochem. Biotechnol., 45-46:315-327.
Grohmann K, Cameron RG, Buslig BS (1995). Fractionation and
pretreatment of orange peel by dilute acid hydrolysis. Bioresour. Technol. 54:129-141.
Guimaraes WV, Dudey GD, Ingram LO (1992). Fermentation of sweet whey by ethanologenic Escherichia coli. Biotechnol. Bioeng. 40:41-
45. Klinke HB, Thomsen AB , Ahring BK (2004). Inhibition of ethanol
producing yeast and bacteria by degradation products produced during pretreatment of biomass. Appl. Microbiol. Biotch. 66:10-26.
Lenihan P, Orozco A, Neill EO, Ahmad M N, Rooney DW, Walker GM
(2010). Dilute acid hydrolysis of lignocellulosic biomass. Chem. Engr. J. 156(2):395-403.
Luo C, Brink DL, Blanch H W. 2002. Identification of potential
fermentation inhibitors in conversion of hybrid poplar hydrolyzate to ethanol. Biomass Bioenerg., 22:125-138.
Ma E, Cervera Q, Mejía Sánchez GM (1993). Integrated utilization of
orange peel. Bioresour. Technol. 44:61-63. Mariam I, Manzoor K, Sikander A (2009). Enhanced production of
ethanol from free and immobilized Saccharomyces cerevisiae under
stationary culture. Pak. J. Bot. 41(2):21-833. Miller GL (1959). Use of dinitrosalicylic acid reagent for determination of
reducing sugar. Anal. Chem. 31:426-428
Mrudula S, Anitharaj R (2011). Pectinase production in solid state fermentation by Aspergillus niger using orange peel as substrate.
Global J. Biotech. Biochem. 6(2):64-71.
Gomaa 1277 Omojasola PF , Jilani OP (2008). Cellulase production by Trichoderma
longi, Aspergillus niger and Saccharomyces cerevisiae cultured on
waste materials from orange. Pak. J. Biol. Sci. 11(20):2382-2388.
Patil SR , Dayanand A (2006). Exploration of regional agrowastes for the production of pectinase by Aspergillus niger. Food Technol.
Biotechnol., 44(2):289-292.
Shide EG, Wuyep PA , Nok AJ (2004). Studies on the degradation of wood sawdust by Lentinus squarrosulus. Afr. J. Biotechnol 3:395-
398.
Suhaimi SN, Phang LY, Maeda T, Abd-Aziz S, Wakisaka M, Shirai Y, Hassan MA (2012). Bioconversion of glycerol for bioethanol production using isolated Escherichia coli SS1. Braz. J. Microbiol.
506-516. Taherzadeh MJ , Karimi K (2007). Acid-based hydrolysis processes gor
ethanol from lignocellulosic materials: A review. BioResources,
2(3):472-499. Tomلs- e E, Oliva JM, Gonzalez A, Ballesteros I, Ballesteros M
(2009). Bioethanol production from wheat straw by the thermotolerant yeast Kluyveromyces marxianus CECT 10875 in a simultaneous
saccharification and fermentation fed-batch process. Fuel 88:2142-2147.
Wilkins MR, Suryawati L, Maness N , Chrz D (2007). Ethanol production by Saccharomyces cerevisiae and Kluyveromyces marxianus in the
presence of orange-peel oil. World J. Microb. Biot 23(8):1161-1168.
Winniczuk PP, Parish ME (1997). Minimum inhibitory concentrations of antimicrobials against micro-organisms related to citrus juice. Food Microbiol. 14:373-381.